UNITED STATES
SECURITIES AND EXCHANGE COMMISSION
Washington, D.C. 20549
FORM N-CSR
CERTIFIED SHAREHOLDER REPORT OF REGISTERED
MANAGEMENT INVESTMENT COMPANIES
Investment Company Act file number: 811-04920
WASATCH FUNDS TRUST
(Exact name of registrant as specified in charter)
505 Wakara Way, 3rd Floor
Salt Lake City, UT 84108
(Address of principal executive offices)(Zip code)
| | |
| (Name and Address of Agent for Service) | | Copy to: |
| |
Samuel S. Stewart, Jr. Wasatch Advisors, Inc. 505 Wakara Way, 3rd Floor Salt Lake City, UT 84108 | | Eric F. Fess, Esq. Chapman & Cutler LLP 111 West Monroe Street Chicago, IL 60603 |
��
Registrant’s telephone number, including area code: (801) 533-0777
Date of fiscal year end: September 30
Date of reporting period: March 31, 2017
| Item 1. | Report to Shareholders. |

2017 SEMI-ANNUAL REPORT AND QUARTERLY COMMENTARIES March 31, 2017 EQUITY FUNDS / Wasatch Core Growth Fund Wasatch Emerging India Fund Wasatch Emerging markets Select Fund Wasatch Emerging Markets Small Cap Fund Wasatch Frontier Emerging Small Countries Fund Wasatch Global Opportunities Fund Wasatch international Growth Fund Wasatch International Opportunities Fund Wasatch large Cap Value Fund Wasatch Long/Short Fund Wasatch Micro Cap Fund Wasatch Micro Cap Value Fund Wasatch Small Cap growth Fund Wasatch Small Cap Value Fund Wasatch Strategic Income Fund Wasatch Ultra Growth Fund Wasatch World Innovators Fund BOND FUND / Wasatch-1ST Source Income Fund Wasatch Hoisington U.S. Treasury Fund
WASATCH FUNDS
Salt Lake City, Utah
www.WasatchFunds.com
800.551.1700
This material must be accompanied or preceded by a prospectus.
Please read the prospectus carefully before you invest.
Wasatch Funds are distributed by ALPS Distributors, Inc.
1
| | |
| LETTERTO SHAREHOLDERS — STILL STEADYAS SHE GOES | | |
|
|
|
| | |

Samuel S. Stewart, Jr. PhD, CFA President of
Wasatch Funds | | DEAR FELLOW SHAREHOLDERS: The dramatic post-election rally in U.S. stocks presumed large and lasting changes for the economy. But, toward the end of 2017’s first quarter, the “animal spirits” that propelled several stock indices to all-time highs quivered. The cooling of enthusiasm was reflected in a slowdown of cash movements into some exchange-traded funds (ETFs). Although I see pro-growth potential in Donald Trump’s policies, I maintain my belief that U.S. presidents are constrained in their abilities to effect dramatic economic changes. Global anti-inflationary pressures, such as aging populations in developed countries are far greater forces than the policy tools available to any president. Furthermore, U.S. stocks are already priced at levels that anticipate meaningful economic improvements from tax cuts, regulatory reforms and increased government spending. That’s why I think it’s wise to maintain a skeptical view of investments that may have gotten ahead of themselves. While I’m cautiously optimistic regarding U.S. stocks over the long term, my outlook doesn’t rest on whether a particular initiative will pass Congress, be signed into law, and be proven to have the desired pro-growth effects. Of course, politics do impact markets — but not always in ways that are easy to predict. |
At Wasatch, rather than trying to make predictions, we base our investment decisions on the business trends and growth prospects of individual companies. We believe market environments that are driven by company fundamentals play to Wasatch’s strengths. I’m optimistic that as investors’ animal spirits subside, we’ll see further evidence of the long-term benefits delivered by a disciplined investment process that includes in-depth, company-specific research.
ECONOMY
The economic backdrop has improved compared to several months ago. The unemployment rate is down and average hourly wages are up. The Purchasing Managers Index, a measure of health in manufacturing, has been moving higher and improving sentiment among small-business owners and corporate-management teams suggests increased capital investment. Signs of economic strength prompted the Federal Reserve (Fed) to raise interest rates — with more increases likely in 2017.
The signs of an improving economy reflect progress made over years, rather than changes sparked on Election Day or since President Trump took office. That’s why I continue to see the U.S. economy as still “steady as she goes.” To explore this stance and to gauge whether anything substantial has changed under President Trump, I’d like to discuss five constraints on the U.S. economy.
First is the employment situation. The limiting factor here is that the economy was already at or near “full employment” prior to the election. The March report from the Bureau of Labor Statistics showed little change in the unemployment rate, which stood at 4.5%. To boost the economy meaningfully through workforce conditions, pro-growth policies would need to go beyond job rotation and better pay for those currently employed. A bigger problem is slower growth in the working-age population due to shifting demographics, which will likely overwhelm any traditional pro-growth policies from Washington.
Second is the U.S. debt burden. The current U.S. debt limit of about $19.9 trillion could, in theory, prompt default on governmental obligations later this year if the limit isn’t raised. While that level of drama seems unlikely, it does seem possible that conservative Republicans’ concerns about the debt limit could end up holding back infrastructure projects and other initiatives that would increase government spending.
Third is the relationship between demographics and inflation. Aging populations, including the many baby boomers now in retirement, are likely to resist inflationary policies because inflation hurts those living on fixed incomes. Unfortunately, although a lack of inflation benefits retirees, it tends to hurt younger people and those individuals, businesses and governments that are carrying debt.
Fourth is the trend in interest rates during Donald Trump’s presidency. While the Fed has raised short-term interest rates, intermediate- and long-term rates were relatively flat in the first three months of 2017. Given the global savings glut, significant rate increases in the U.S. would likely boost the value of the dollar and draw in foreign capital seeking higher returns. Such a situation would probably not be sustainable because a strong dollar is already hurting the competitiveness of U.S. exports, and because a flood of foreign capital would drive interest rates back down.
Fifth and last is the issue of political control, namely whether Republican majorities in Congress and a Republican president mean smooth sailing for legislative priorities. With the failure of the American Health Care Act, we have quick proof that Republicans aren’t immune to gridlock. So it’s not at all clear how much of President Trump’s proposed agenda will be enacted into law.
These five constraints support my view that economic growth is likely to be modest, say in the 2% to 2.5% range. This is in contrast to the 4% to 5% range that the Trump administration has been forecasting. If I’m correct about much slower growth, investors should ratchet down their expectations for returns in the financial markets.
MARKETS
As I said earlier, “steady as she goes” is a much better description of the economy than of the financial markets. The “Trump rally” in equities has been predicated on the thesis that the president’s pro-growth agenda will lift the U.S. economy out of its post-crisis doldrums and provide businesses with tax and regulatory relief. I think there’s significant room for disappointment embedded in that view.
2
| | |
| | MARCH 31, 2017 (UNAUDITED) |
|
|
|
One indication of increased investor wariness during the first quarter was the divergence between the performance of large-cap stocks and that of small-cap stocks — reflecting a lack of conviction in the market and potentially showing a diminishing appetite for risk. Among smaller companies, the first quarter saw something of a reversal in the value-over-growth trend evident in 2016 — especially in the initial stage of the post-election rally during which investors perceived value stocks as greater beneficiaries of Mr. Trump’s economic policies.
As I mentioned earlier, short-term interest rates moved marginally higher in response to the Fed’s rate hike in March. Meanwhile, intermediate- and longer-term rates — and therefore bond prices — were fairly stable during the quarter. That’s in contrast to the previous quarter, when one of the biggest surprises was the dramatic fall of more than 12% in the value of the Bloomberg Barclays US 20+ Year Treasury Bond Index.
WASATCH
I’d like to take this opportunity to note some recent trends in the ETF space, where investors appeared to be chasing the performance of certain indices and sectors. For the month of November 2016, which of course included President Trump’s election, the net cash movement into the iShares Russell 2000 ETF amounted to 23% of the ETF’s net assets as of October 31, 2016. An inflow of this scale relative to the ETF’s overall size reflected enormously increased optimism about small-cap stocks. That was especially evident compared to the SPDR® S&P 500 ETF, which also experienced a high absolute level of inflows during November — but only 4% of its net assets as of October 31st. Aside from small caps, another area of intense investor optimism in the immediate post-election rally was the financial sector. In November, the Financial Select Sector SPDR® Fund took in a whopping 47% of its net assets as of October 31st.
To the extent that the index and sector ETFs contain stocks with particularly small market capitalizations and low trading volumes under normal circumstances, the recent ETF inflows may have overwhelmed the normal liquidity dynamics and put especially strong upward pressure on the underlying stock prices. As mentioned above, some of these dynamics seemed to reverse course during the first quarter of 2017.
Regardless of fads in the markets, at Wasatch we take the long view. Although I wouldn’t be surprised to see additional near-term turbulence as political headlines continue to distract investors, I believe earnings drive stock prices over the long term. We continue to pursue our bottom-up process one company at a time, with the goal of finding businesses that aren’t overly dependent on the political and economic headlines of the day.
With sincere thanks for your continued investment and for your trust,

Sam Stewart
Information in this report regarding market or economic trends, or the factors influencing historical or future performance, reflects the opinions of management as of the date of this report. These statements should not be relied upon for any other purpose. Past performance is no guarantee of future results, and there is no guarantee that the market forecasts discussed will be realized.
CFA® is a trademark owned by CFA Institute.
Wasatch Advisors is the investment advisor to Wasatch Funds.
Wasatch Funds are distributed by ALPS Distributors, Inc. (ADI). Select Sector SPDR ETFs and SPDR S&P 500 ETF are distributed by ADI. ADI is not affiliated with Wasatch Advisors or Wasatch Funds.
The American Health Care Act is the Republican-sponsored bill intended to repeal and replace the Obama-era Affordable Care Act. The Patient Protection and Affordable Care Act (PPACA), commonly called the Affordable Care Act (ACA) or “ObamaCare,” is a United States federal statute signed into law by President Barack Obama on March 23, 2010.
An Exchange-Traded Fund (ETF) is a security that tracks an index, a commodity or a basket of assets like an index fund, but trades like a stock on a securities exchange. ETFs experience price changes throughout the day as they are bought and sold.
The Purchasing Managers Index (PMI) is an indicator of the economic health of the manufacturing sector. The PMI is based on five major indicators — new orders, inventory levels, production, supplier deliveries and the employment environment.
The iShares Russell 2000 ETF seeks to track the investment results of an index composed of small-capitalization U.S. equities.
The SPDR S&P 500 ETF seeks to provide investment results that, before expenses, correspond generally to the price and yield performance of the S&P 500 Index. The S&P 500 Index includes 500 of the United States’ largest stocks from a broad variety of industries. The Index is unmanaged and is a commonly used measure of common stock total return performance. You cannot invest directly in an index.
Select Sector SPDRs, including the Financial Select Sector SPDR Fund, are ETFs that divide the S&P 500 into 10 sector index funds that represent the S&P 500 as a whole. Each Select Sector SPDR can be bought individually, providing exposure to a particular sector or industry group.
The Bloomberg Barclays US 20+ Year Treasury Bond Index measures the performance of U.S. Treasury securities that have remaining maturities of 20 or more years. You cannot invest directly in this or any index.
3
| | |
| WASATCH CORE GROWTH FUND (WGROX / WIGRX) | | MARCH 31, 2017 (UNAUDITED) |
|
|
|
Management Discussion
The Wasatch Core Growth Fund is managed by a team of Wasatch portfolio managers led by JB Taylor and Paul Lambert.
| | | | |

JB Taylor Lead Portfolio Manager | | 
Paul Lambert Portfolio Manager | | OVERVIEW Strong movers in the information-technology, consumer-discretionary and health-care sectors enabled the Wasatch Core Growth Fund — Investor Class to gain 4.21% during |
the first quarter of 2017. The Fund outperformed the 2.47% return of the Russell 2000 Index, but trailed the 5.35% return of the Russell 2000 Growth Index.
For much of the quarter, the rally ignited by the election of Donald Trump continued as investors focused on the benefits promised by his administration: less regulation, lower taxes, increased infrastructure spending and revamped international trade agreements. That said, the specific winners and losers during the first quarter were notably different from those of the previous quarter.
In the closing weeks of last year, investors keyed on value-oriented cyclical companies such as those in the energy and industrials sectors — companies perceived to be prime beneficiaries of promised Trump administration policies. These companies could be counted on to profit from increased infrastructure spending and continued strengthening of the economy. Similarly, financial-services companies did well during the fourth quarter of 2016, gaining on the promise of lighter regulation.
Overlooked during the fourth quarter of 2016 were many of the high-quality, growth-oriented stocks that we favor. But this changed in 2017 as technology companies that lagged during the opening months of the rally turned around in the first quarter and posted significant gains.
Our holdings in international companies were strong contributors during the quarter. Of note was our exposure to India, our single-largest allocation outside the U.S. and the Fund’s top-performing country during the quarter.
DETAILSOFTHE QUARTER
Global biotech company Seattle Genetics, Inc. was the leading contributor to performance during the quarter. The main news driving the performance of the stock was management’s announcement of an agreement with Immunomedics* to gain exclusive world-wide rights to develop and sell sacituzumab govitecan, an antibody-drug conjugate used to treat solid cancer tumors. However, not all of Immunomedics’ investors are enamored of the deal and a battle to stop the agreement has ensued. We’re closely monitoring developments in the case.
India’s online travel agency MakeMyTrip Ltd. was another contributor to performance during the first quarter. MakeMyTrip is the leading online travel agency (OTA) in India. The company’s stock price has been volatile in recent years,
as intense competition negatively affected the profits of Indian OTAs. Based on its recent merger with the ibibo Group, however, MakeMyTrip appears to have emerged as the winner of that competition and is well-positioned in our view to benefit from increased online travel booking.
The leading detractor from Fund performance during the first quarter was Ensign Group, Inc. The company operates facilities providing skilled nursing and rehabilitative care services and offers home health and hospice services in the U.S. Shares of Ensign declined after quarterly earnings missed expectations and management lowered earnings guidance for 2017.
Credit Acceptance Corp., a provider of financing programs to automobile dealers, was another detractor from performance during the quarter. Shares dropped sharply when the Federal Trade Commission (FTC) disclosed it was investigating the company’s use of ignition kill switches and GPS systems in debt-collection efforts. The FTC is concerned that the company may be employing these technologies — used both for disabling and locating vehicles — to apply undue pressure on borrowers.
OUTLOOK
During the past several months, the market has generally rallied on the hope that President Trump’s agenda will accelerate economic growth. At the same time, there’s evidence that regardless of what happens with the president’s agenda, the economy has been doing better for quite some time. Macro indicators have continued to look encouraging. Unemployment has been down, while jobs data and average hourly earnings have been rising. Even inflation — for the time being — has been ticking up. And the Institute for Supply Management’s manufacturing index showed further expansion in March.
Having said all this, there’s a historical context to consider. Namely, with disruptive political events — including the presidential impeachments in Brazil and South Korea, the harsh political rhetoric regarding Mexico, the continuing progression of Brexit, and the tumultuous debut of Donald Trump — dominating news coverage during the quarter, many investors are considering whether or not to maintain exposure to the financial markets.
When we look at the markets in the wake of these events, we see that the actual performance has generally been strong — possibly to the contrary of what we would have predicted ahead of time. In other words, even if we had had a crystal ball we might not have been able to time the markets very well.
For our part, we intend to stay invested while maintaining our vigilance — focusing on what we can control. That means searching for reasonably priced, high-quality companies that can grow their revenues and earnings for long durations.
Thank you for the opportunity to manage your very important assets.
| * | As of March 31, 2017, the Wasatch Core Growth Fund was not invested in Immunomedics, Inc. |
Current and future holdings are subject to risk.
4
| | |
| WASATCH CORE GROWTH FUND (WGROX / WIGRX) | | MARCH 31, 2017 (UNAUDITED) |
|
|
|
Portfolio Summary
AVERAGE ANNUAL TOTAL RETURNS
| | | | | | | | | | | | | | | | | | | | |
| | | SIX MONTHS* | | 1 YEAR | | 5 YEARS | | 10 YEARS |
Core Growth (WGROX) — Investor | | | | 7.14% | | | | | 19.00% | | | | | 12.17% | | | | | 7.84% | |
Core Growth (WIGRX) — Institutional | | | | 7.23% | | | | | 19.18% | | | | | 12.27% | | | | | 7.89% | |
Russell 2000® Index | | | | 11.52% | | | | | 26.22% | | | | | 12.35% | | | | | 7.12% | |
Russell 2000® Growth Index | | | | 9.11% | | | | | 23.03% | | | | | 12.10% | | | | | 8.06% | |
Data shows past performance, which is not indicative of future performance. Current performance may be lower or higher than the performance quoted. To obtain the most recent month-end performance data available, please visit www.WasatchFunds.com. The Advisor may absorb certain Fund expenses, without which total return would have been lower. Investment returns and principal value will fluctuate and shares, when redeemed, may be worth more or less than their original cost.
As of the January 31, 2017 prospectus, the Total Annual Fund Operating Expenses for the Wasatch Core Growth Fund are Investor Class: 1.21% / Institutional Class — Gross: 1.09%, Net: 1.05%. The expense ratio shown elsewhere in this report may be different. Net expenses are based on Fund expenses, net of waivers and reimbursements. See the prospectus for additional information regarding Fund expenses.
Wasatch Funds will deduct a 2.00% redemption proceeds fee on Fund shares held 60 days or less. Performance data does not reflect the deduction of fees, including sales charges, or the taxes you would pay on fund distributions or the redemption of fund shares. Fees and taxes, if reflected, would reduce the performance quoted. Wasatch does not charge any sales fees. For more complete information including charges, risks and expenses, read the prospectus carefully.
Performance for the Institutional Class prior to 1/31/2012 is based on the performance of the Investor Class. Performance of the Fund’s Institutional Class prior to 1/31/2012 uses the actual expenses of the Fund’s Investor Class without any adjustments. For any such period of time, the performance of the Fund’s Institutional Class would have been substantially similar to, yet higher than, the performance of the Fund’s Investor Class, because the shares of both classes are invested in the same portfolio of securities, but the classes bear different expenses.
Investing in small cap funds will be more volatile and loss of principal could be greater than investing in large cap or more diversified funds. Investing in foreign securities, especially in emerging markets, entails special risks, such as currency fluctuations and political uncertainties, which are described in more detail in the prospectus.
TOP 10 EQUITY HOLDINGS**
| | | | |
| Company | | % of Net
Assets | |
| Copart, Inc. | | | 3.1% | |
| Cornerstone OnDemand, Inc. | | | 3.0% | |
| Cimpress N.V. | | | 2.7% | |
| Credit Acceptance Corp. | | | 2.7% | |
| Balchem Corp. | | | 2.6% | |
| | | | |
| Company | | % of Net
Assets | |
| Cavium, Inc. | | | 2.6% | |
| Spirit Airlines, Inc. | | | 2.5% | |
| Texas Capital Bancshares, Inc. | | | 2.5% | |
| MEDNAX, Inc. | | | 2.5% | |
| ICON plc (Ireland) | | | 2.5% | |
| ** | As of March 31, 2017, there were 59 holdings in the Fund. Foreign currency contracts, written options and repurchase agreements, if any, are not included in the number of holdings. Portfolio holdings are subject to change at any time. References to specific securities should not be construed as recommendations by the Funds or their Advisor. Current and future holdings are subject to risk. |
SECTOR BREAKDOWN†
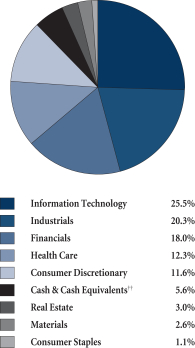
| † | Excludes securities sold short and options written, if any. |
| †† | Also includes Other Assets & Liabilities. |
GROWTHOFA HYPOTHETICAL $10,000 INVESTMENT
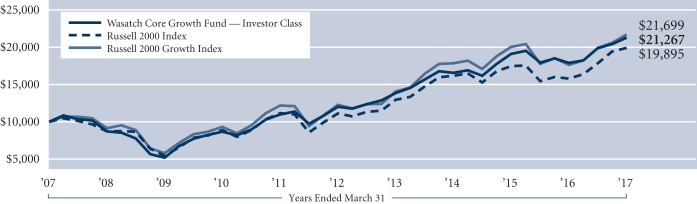
Past performance does not predict future performance. The graph above does not reflect the deduction of fees, sales charges, or taxes that you would pay on fund distributions or the redemption of fund shares. Wasatch does not charge any sales fees. The Russell 2000 Index is an unmanaged total return index of the smallest 2,000 companies in the Russell 3000 Index, as ranked by total market capitalization. The Russell 2000 Index is widely regarded in the industry as accurately capturing the universe of small company stocks. The Russell 2000 Growth Index is an unmanaged total return index that measures the performance of those Russell 2000 Index companies with higher price-to-book ratios and higher forecasted growth values. You cannot invest directly in these or any indices.
5
| | |
| WASATCH EMERGING INDIA FUND (WAINX / WIINX) | | MARCH 31, 2017 (UNAUDITED) |
|
|
|
Management Discussion
The Wasatch Emerging India Fund is managed by a team of Wasatch portfolio managers led by Ajay Krishnan and Matthew Dreith.
| | | | |

Ajay Krishnan, CFA Lead Portfolio Manager | | 
Matthew Dreith, CFA Associate Portfolio Manager | | OVERVIEW The Wasatch Emerging India Fund — Investor Class returned 22.67% in what was an exceptionally strong first quarter for Indian equities. The Fund outgained the benchmark MSCI India |
Investable Market Index, which rose 18.85%.
India’s stock market came roaring back during the first quarter after having been roiled late last year when the government abruptly banned large-denomination banknotes from circulation. Designed to root out unaccounted wealth, the program created shortages of cash, crimping demand for goods and services and rattling investors.
In late February, the Statistics Ministry said it expected India’s gross domestic product (GDP) to grow 7.1% in the fiscal year ended March 31, 2017. While that was below the previous year’s 7.9% expansion, it exceeded the forecasts of private economists and reflected a faster-than-expected recovery from the disruptions of demonetization.
Politically, demonetization came to be viewed by many Indians as a victory for the common citizen over corrupt interests. Prime Minister Narendra Modi’s Bharatiya Janata Party (BJP) reaped the benefits of that assessment in March when it scored landslide gains in elections to the state assembly of Uttar Pradesh, India’s most-populous province. The decisive win left Mr. Modi unchallenged as a national leader and boosted prospects for additional reforms aimed at furthering the country’s growth and development. Encouraged by the results of the election, local and foreign investors helped push India’s major stock averages to record highs.
DETAILSOFTHE QUARTER
The strongest contributor to Fund performance for the quarter was MakeMyTrip Ltd., the leading online travel agency (OTA) in India. The company’s focus on hotel bookings and customized holiday packages — both of which command higher margins than air ticketing — appears to be paying off.
Avenue Supermarts Ltd. was the second-largest contributor. The company operates 118 supermarkets across 45 cities under the D-Mart brand. Its stores, most of which are company-owned, sell items that range from food to apparel and general merchandise. Shares of Avenue rose sharply in their first day of trading after the company’s initial public offering. With retail distribution in India still largely dominated by small neighborhood stores called kiranas, we think opportunities abound for well-managed operators such as Avenue to gain market share by formalizing their industries.
With cyclical stocks in industrials and materials leading the rally in equities, defensive companies in the health-care sector became less appealing to investors and underperformed. Health care accounted for several of the Fund’s greatest detractors. Dr. Lal PathLabs Ltd. is one of the largest chains of diagnostic pathology labs in India. Sales at the company are recovering from demonetization more gradually than investors had hoped, as some otherwise-healthy individuals appear to be postponing non-essential tests in an effort to conserve cash.
Divi’s Laboratories Ltd. is a pharmaceutical company focused on the production of active pharmaceutical ingredients and intermediates. Shares of Divi’s tumbled in late March after it announced that the U.S. Food and Drug Administration had issued an import alert for products manufactured at its Unit II facility in Visakhapatnam, Andhra Pradesh. The regulator has exempted 10 of Divi’s products from the alert, and we’re assessing the situation to determine the likely impact on the company’s long-term prospects.
OUTLOOK
The speedy recoveries from demonetization currently underway among most of the companies owned in the Fund reflect both the solid fundamentals of the companies and the underlying strength of the Indian economy. They also illustrate the extent to which secular forces can overwhelm short-term volatility arising from government-policy decisions.
While the BJP’s electoral gains in Uttar Pradesh arguably represent demonetization’s most-durable impact thus far, there are likely to be other long-term economic effects as well. The rivers of cash that demonetization sent pouring into Indian banks will only accelerate the formalization of India’s economy and financial system. Much of that money is already being channeled into financial products such as mutual funds and insurance, where it can be put to productive use for capital investment.
A trend throughout most emerging markets, formalization is of particular importance in India, where Mr. Modi appears to recognize its key role in moving his country forward. Approximately 70% of India’s population currently resides in the “self-employed” informal economy, unreachable by a traditional financial sector that lacks the cost structure or risk framework to lend to this segment. As a result, financial services are among the most underpenetrated categories in India as a percentage of GDP.
Accordingly, financial companies rank among our most-favored areas for investment in India. With about 70% of the country’s banking sector consisting of undercapitalized state-owned banks struggling with bad loans, private banks and non-bank financial companies enjoy substantial room for growth. In fact, what appears to be occurring is a “stealth privatization” in which private banks are stepping in to take market share from India’s public-sector undertakings (commonly referred to as “PSU banks”). We believe this process should lead to more-efficient allocation of credit and higher-quality economic growth over time.
Thank you for the opportunity to manage your assets.
Current and future holdings are subject to risk.
6
| | |
| WASATCH EMERGING INDIA FUND (WAINX / WIINX) | | MARCH 31, 2017 (UNAUDITED) |
|
|
|
Portfolio Summary
AVERAGE ANNUAL TOTAL RETURNS
| | | | | | | | | | | | | | | | | | | | |
| | | SIX MONTHS* | | 1 YEAR | | 5 YEARS | | SINCE INCEPTION
4/26/11 |
Emerging India (WAINX) — Investor | | | | 9.73% | | | | | 30.52% | | | | | 15.08% | | | | | 11.47% | |
Emerging India (WIINX) — Institutional | | | | 10.00% | | | | | 31.22% | | | | | 15.20% | | | | | 11.57% | |
MSCI India IMI | | | | 9.33% | | | | | 22.12% | | | | | 7.25% | | | | | 1.77% | |
Data shows past performance, which is not indicative of future performance. Current performance may be lower or higher than the performance quoted. To obtain the most recent month-end performance data available, please visit www.WasatchFunds.com. The Advisor may absorb certain Fund expenses, without which total return would have been lower. Investment returns and principal value will fluctuate and shares, when redeemed, may be worth more or less than their original cost.
As of the January 31, 2017 prospectus, the Total Annual Fund Operating Expenses for the Wasatch Emerging India Fund are Investor Class — Gross: 1.87%, Net: 1.75% / Institutional Class — Gross: 2.00%, Net: 1.50%. The expense ratio shown elsewhere in this report may be different. Net expenses are based on Fund expenses, net of waivers and reimbursements. See the prospectus for additional information regarding Fund expenses.
Wasatch Funds will deduct a 2.00% redemption proceeds fee on Fund shares held 60 days or less. Performance data does not reflect the deduction of fees, including sales charges, or the taxes you would pay on fund distributions or the redemption of fund shares. Fees and taxes, if reflected, would reduce the performance quoted. Wasatch does not charge any sales fees. For more complete information including charges, risks and expenses, read the prospectus carefully.
Performance for the Institutional Class prior to 2/1/2016 is based on the performance of the Investor Class. Performance of the Fund’s Institutional Class prior to 2/1/2016 uses the actual expenses of the Fund’s Investor Class without any adjustments. For any such period of time, the performance of the Fund’s Institutional Class would have been substantially similar to, yet higher than, the performance of the Fund’s Investor Class, because the shares of both classes are invested in the same portfolio of securities, but the classes bear different expenses.
Investing in small cap funds will be more volatile and loss of principal could be greater than investing in large cap or more diversified funds. Investing in foreign securities, especially in emerging markets, entails special risks, such as unstable currencies, highly volatile securities markets and political and social instability, which are described in more detail in the prospectus.
TOP 10 EQUITY HOLDINGS**
| | | | |
| Company | | % of Net
Assets | |
| Housing Development Finance Corp. Ltd. (India) | | | 4.5% | |
| MakeMyTrip Ltd. (India) | | | 4.5% | |
| Avenue Supermarts Ltd. (India) | | | 4.4% | |
| Bajaj Finance Ltd. (India) | | | 3.7% | |
| Natco Pharma Ltd. (India) | | | 3.5% | |
| | | | |
| Company | | % of Net
Assets | |
| PNB Housing Finance Ltd. (India) | | | 3.3% | |
| HDFC Bank Ltd. ADR (India) | | | 3.0% | |
| Gulf Oil Lubricants India Ltd. (India) | | | 2.9% | |
| Quess Corp. Ltd. (India) | | | 2.9% | |
| Endurance Technologies Ltd. (India) | | | 2.6% | |
| ** | As of March 31, 2017, there were 56 holdings in the Fund. Foreign currency contracts, written options and repurchase agreements, if any, are not included in the number of holdings. Portfolio holdings are subject to change at any time. References to specific securities should not be construed as recommendations by the Funds or their Advisor. Current and future holdings are subject to risk. |
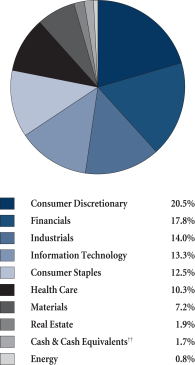
SECTOR BREAKDOWN†

| † | Excludes securities sold short and options written, if any. |
| †† | Also includes Other Assets & Liabilities. |
GROWTHOFA HYPOTHETICAL $10,000 INVESTMENT
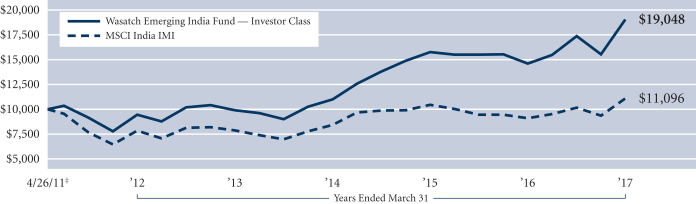
Past performance does not predict future performance. The graph above does not reflect the deduction of fees, sales charges, or taxes that you would pay on fund distributions or the redemption of fund shares. Wasatch does not charge any sales fees. ‡Inception: April 26, 2011. The MSCI India IMI (Investable Market Index) is designed to measure the performance of the large-, mid- and small-cap segments of the Indian market. The Index covers approximately 99% of the free-float adjusted market capitalization of the Indian equity universe. You cannot invest directly in this or any index.
7
| | |
| WASATCH EMERGING MARKETS SELECT FUND (WAESX / WIESX) | | MARCH 31, 2017 (UNAUDITED) |
|
|
|
Management Discussion
The Wasatch Emerging Markets Select Fund is managed by a team of Wasatch portfolio managers led by Ajay Krishnan, Roger Edgley and Scott Thomas.
| | | | |
Ajay Krishnan, CFA Lead Portfolio Manager | | 
Roger Edgley, CFA Portfolio Manager | | 
Scott Thomas, CFA Associate Portfolio
Manager |
OVERVIEW
The Wasatch Emerging Markets Select Fund — Investor Class returned 14.71% outperforming its benchmark, the MSCI Emerging Markets Index, which increased 11.44% for the quarter ended March 31, 2017.
Positive economic news from China was beneficial for emerging markets as a whole because China is a significant importer of raw materials and finished goods. China’s National Bureau of Statistics said the country’s industrial production rose 6.3% from a year earlier during January and February combined. Fixed-asset investment climbed 8.9%, while retail sales advanced 9.5% over the same period.
Worries that U.S. President Donald Trump’s protectionist proposals might dampen global trade had unnerved emerging-market investors. Those concerns have largely dissipated as the president’s trade agenda appeared to take a backseat to immigration issues and health-care reform.
The dollar fell on world currency markets. As measured by the U.S. Dollar Index, the greenback slipped about 2% against a basket of foreign currencies. According to the J.P. Morgan Emerging Market Currency Index, emerging market currencies gained 3.7% in the first quarter. Although the U.S. Federal Reserve (Fed) raised interest rates in March, it calmed investors’ fear that tightening would accelerate. Higher U.S. interest rates make riskier investments in developing countries less attractive compared to dollar-denominated assets.
India was the Fund’s top-contributing country and its greatest source of outperformance. Major stock averages in India surged to record highs following the landslide victory of Prime Minister Narendra Modi’s Bharatiya Janata Party (BJP) in elections to the state assembly of Uttar Pradesh. The victory left Mr. Modi unchallenged as a national leader and boosted prospects for additional reforms aimed at furthering India’s growth and development.
DETAILSOFTHE QUARTER
Indian non-bank financial companies Bajaj Finance Ltd. and PNB Housing Finance Ltd. were two of the strongest contributors in the quarter. Late last year, fear of a hit to the value of collateral for loans and underlying demand for loans sent their shares sharply lower after the Indian
government invalidated large-denomination bank notes in a surprise move aimed at the country’s gray economy. Shares of both companies rebounded in the quarter as shortages of cash eased and business activity returned to normal.
MercadoLibre, Inc., another top contributor, hosts online-commerce platforms in Latin America. Other products include MercadoPago, an integrated online-payments solution to facilitate transactions on and off the company’s platforms. Earnings at MercadoLibre soared 31.8% in its most-recently reported quarter on 41.8% revenue growth versus the same period a year ago.
Lenta Ltd., which operates Russia’s second-largest hypermarket chain, was the largest detractor from the Fund’s performance. Lenta’s stock price fell on continued weakness in Russian personal consumption, as well as concerns that the company’s planned expansion might cannibalize sales at its existing stores. After discussing these issues with company management, we believe the worries are overdone.
GT Capital Holdings, Inc., an investment holding company based in the Philippines, was the second-largest detractor. GT Capital’s interests include lending, car distribution, insurance and power generation. GT Capital’s stock price dropped over 10% in the first quarter on fears that the Duterte government’s proposed overhaul of the country’s vehicle excise tax would depress automobile sales. While there’s some validity to this concern, we believe the likely effect outside of the high end of the automobile market is minimal.
OUTLOOK
The investment theme of financialization, particularly with respect to insurance and lending, is one that we expect will continue. As an economy matures and its components become more interdependent, insurance products play an increasing role in rationally distributing the various risks posed to human and investment capital. Likewise, lending is instrumental in allocating capital to its most-productive uses. When analyzing potential investments in emerging markets, we find that companies tied to insurance and lending often possess the secular growth characteristics we seek.
Formalization has been another important theme at Wasatch. Strictly speaking, the formal sector of an economy — as opposed to barter and other informal arrangements — includes all jobs with normal hours and regular wages on which taxes must be paid. In emerging markets, we also consider formalization to encompass the gradual shift toward obtaining goods and services from professionally managed businesses that are more specialized, more reliable and more efficient than their informal competitors.
The rivers of cash that India’s demonetization program sent pouring into its banks will only accelerate formalization of the country’s economy and financial system. Much of that money is already being channeled into financial products such as mutual funds and insurance, where it can be put to use as investment capital.
We’re excited about the future of emerging markets and their expanding role in the global economy.
Thank you for the opportunity to manage your assets.
Current and future holdings are subject to risk.
8
| | |
| WASATCH EMERGING MARKETS SELECT FUND (WAESX / WIESX) | | MARCH 31, 2017 (UNAUDITED) |
|
|
|
Portfolio Summary
AVERAGE ANNUAL TOTAL RETURNS
| | | | | | | | | | | | | | | | | | | | |
| | | SIX MONTHS* | | 1 YEAR | | 5 YEARS | | SINCE INCEPTION 12/13/12 |
Emerging Markets Select (WAESX) — Investor | | | | -0.32% | | | | | 6.60% | | | N/A | | | | -1.83% | |
Emerging Markets Select (WIESX) — Institutional | | | | -0.21% | | | | | 6.77% | | | N/A | | | | -1.52% | |
MSCI Emerging Markets Index | | | | 6.80% | | | | | 17.21% | | | N/A | | | | 0.43% | |
Data shows past performance, which is not indicative of future performance. Current performance may be lower or higher than the performance quoted. To obtain the most recent month-end performance data available, please visit www.WasatchFunds.com. The Advisor may absorb certain Fund expenses, without which total return would have been lower. Investment returns and principal value will fluctuate and shares, when redeemed, may be worth more or less than their original cost.
As of the January 31, 2017 prospectus, the Total Annual Fund Operating Expenses for the Wasatch Emerging Markets Select Fund are Investor Class — Gross: 1.88%, Net: 1.51% / Institutional Class — Gross: 1.52%, Net: 1.21%. The expense ratio shown elsewhere in this report may be different. Net expenses are based on Fund expenses, net of waivers and reimbursements. See the prospectus for additional information regarding Fund expenses.
Wasatch Funds will deduct a 2.00% redemption proceeds fee on Fund shares held 60 days or less. Performance data does not reflect the deduction of fees, including sales charges, or the taxes you would pay on fund distributions or the redemption of fund shares. Fees and taxes, if reflected, would reduce the performance quoted. Wasatch does not charge any sales fees. For more complete information including charges, risks and expenses, read the prospectus carefully.
Investing in foreign securities, especially in emerging markets, entails special risks, such as currency fluctuations and political uncertainties, which are described in more detail in the prospectus. Investing in small cap funds will be more volatile and loss of principal could be greater than investing in large cap or more diversified funds.
TOP 10 EQUITY HOLDINGS**
| | | | |
| Company | | % of Net
Assets | |
| MercadoLibre, Inc. (Brazil) | | | 5.7% | |
| Bajaj Finance Ltd. (India) | | | 4.5% | |
| Medytox, Inc. (Korea) | | | 4.3% | |
| Ctrip.com International Ltd. ADR (China) | | | 3.9% | |
| Naspers Ltd., Class N (South Africa) | | | 3.9% | |
| | | | |
| Company | | % of Net
Assets | |
| BGF Retail Co. Ltd. (Korea) | | | 3.6% | |
| Raia Drogasil S.A. (Brazil) | | | 3.5% | |
| Kasikornbank Public Co. Ltd. (Thailand) | | | 3.1% | |
| PNB Housing Finance Ltd. (India) | | | 3.1% | |
| ICICI Prudential Life Insurance Co. Ltd. (India) | | | 3.0% | |
| ** | As of March 31, 2017, there were 40 holdings in the Fund. Foreign currency contracts, written options and repurchase agreements, if any, are not included in the number of holdings. Portfolio holdings are subject to change at any time. References to specific securities should not be construed as recommendations by the Funds or their Advisor. Current and future holdings are subject to risk. |
SECTOR BREAKDOWN†

| † | Excludes securities sold short and options written, if any. |
| †† | Also includes Other Assets & Liabilities.. |
GROWTHOFA HYPOTHETICAL $10,000 INVESTMENT

Past performance does not predict future performance. The graph above does not reflect the deduction of fees, sales charges, or taxes that you would pay on fund distributions or the redemption of fund shares. Wasatch does not charge any sales fees. ‡Inception: December 13, 2012. The MSCI Emerging Markets Index is a free float-adjusted market capitalization index designed to measure the equity market performance of emerging markets. You cannot invest directly in this or any index.
9
| | |
| WASATCH EMERGING MARKETS SMALL CAP FUND (WAEMX / WIEMX) | | MARCH 31, 2017 (UNAUDITED) |
|
|
|
Management Discussion
The Wasatch Emerging Markets Small Cap Fund is managed by a team of Wasatch portfolio managers led by Roger Edgley, Andrey Kutuzov and Scott Thomas.
| | | | |
Roger Edgley, CFA Lead Portfolio Manager | | 
Andrey Kutuzov, CFA Associate Portfolio Manager | |
Scott Thomas, CFA Associate Portfolio Manager |
OVERVIEW
Emerging markets produced strong results during the first quarter of 2017 based on optimism over growth and returning investment into the category. The strength was broad based across sectors and geographies. Further, emerging market currencies appear to have stabilized and are more competitive. Wasatch has been seeing strength from the bottom-up — earnings are coming through at the company level. The Wasatch Emerging Markets Small Cap Fund — Investor Class returned 10.30% for the first quarter while the benchmark, the MSCI Emerging Markets Small Cap Index, increased 13.02%.
Worries that U.S. President Donald Trump’s protectionist proposals might dampen global trade had unnerved emerging-market investors, but those concerns have largely dissipated, as the president’s trade agenda appeared to take a backseat to immigration issues and health-care reform. Investors also speculated that drastic changes in U.S. trade policy could prove extremely difficult to implement.
The dollar fell on world currency markets. Although the U.S. Federal Reserve (Fed) raised interest rates as expected in March, it calmed investors’ fear that tightening would accelerate, touching off an additional surge in emerging-market stocks. Higher interest rates in the U.S. make riskier investments in developing countries less attractive compared to dollar-denominated assets.
Further, stronger Chinese economic data and the improved outlook for certain emerging markets helped boost global growth prospects and underpinned broad-based equity market gains in the first quarter. Because China is a significant importer of raw materials and finished goods, better economic news lent a positive tone to emerging markets as a whole.
India was the Fund’s top-performing country and its greatest source of outperformance relative to the benchmark. Major stock averages in India surged to record highs following the landslide victory of Prime Minister Narendra Modi’s Bharatiya Janata Party in elections to the state assembly of Uttar Pradesh. The victory left Mr. Modi unchallenged as a national leader and boosted prospects for additional reforms aimed at furthering India’s growth and development.
DETAILSOFTHE QUARTER
The Indian market rebounded sharply as the short-term disruption caused by the government’s demonetization program played through. The Fund continues to be substantially overweight relative to the benchmark in India. The speed at which our portfolio companies recovered from the effects of demonetization speaks to their strong fundamentals. Six of the portfolio’s top 10 contributors to performance were from India.
Indian non-bank financial company Bajaj Finance Ltd. was one of the strongest contributors to performance for the quarter. Fear of a hit to the value of collateral for loans and underlying demand for loans sent shares of Bajaj Finance sharply lower last year after India invalidated large-denomination bank notes in a surprise move aimed at the country’s gray economy. The company saw its stock price rebound during the first quarter as shortages of cash became less acute and business activity returned to normal.
The Fund’s stocks in Taiwan were up but underperformed those in the benchmark. Two of the Fund’s top contributors were Silergy Corp. and ASPEED Technology, Inc. Both of these Taiwan-based companies are semiconductor manufacturers of analog integrated circuits with well-diversified end markets. Silergy designs and manufactures a broad range of high performance analog integrated circuits and ASPEED is involved in the system-on-a-chip and remote server management business.
Sunny Optical Technology Group Co. Ltd., listed in Hong Kong, was the Fund’s largest contributor. The company designs and manufactures optical-related products for cameras, mobile phones and analytical instruments. Sunny Optical put forth strong earnings, which are expected to continue given favorable industry trends. The company continues to gain business in high-end product lines, like multi-cameras in smartphones and cars.
The greatest detractor from performance for the quarter was Lenta Ltd. The company operates Russia’s second-largest hypermarket chain. Lenta’s stock price fell due to continued weakness in Russian personal consumption, as well as concerns that the company’s planned expansion might cannibalize sales at its existing stores. After discussing these issues with company management, we believe the worries are overdone.
OUTLOOK
Wasatch is confident in the outlook for emerging markets. In many markets we see an improving macro backdrop. The rhetoric on protectionist trade policies by the U.S. government has been more aggressive than any action thus far. Most importantly, we see significant improvement in the outlook of our portfolio companies and are starting to see a rebound in earnings growth. We also see emerging market stocks as trading at attractive valuations.
We’re excited about the future of emerging markets and their expanding role in the global economy.
Thank you for the opportunity to manage your assets.
Current and future holdings are subject to risk.
10
| | |
| WASATCH EMERGING MARKETS SMALL CAP FUND (WAEMX / WIEMX) | | MARCH 31, 2017 (UNAUDITED) |
|
|
|
Portfolio Summary
AVERAGE ANNUAL TOTAL RETURNS
| | | | | | | | | | | | | | | | | | | | |
| | | SIX MONTHS* | | 1 YEAR | | 5 YEARS | | SINCE INCEPTION 10/1/07 |
Emerging Markets Small Cap (WAEMX) — Investor | | | | -3.75% | | | | | 6.20% | | | | | 0.10% | | | | | 3.07% | |
Emerging Markets Small Cap (WIEMX) — Institutional | | | | -3.75% | | | | | 6.20% | | | | | 0.10% | | | | | 3.07% | |
MSCI Emerging Markets Small Cap Index | | | | 5.98% | | | | | 14.49% | | | | | 2.87% | | | | | 0.97% | |
MSCI Emerging Markets Index | | | | 6.80% | | | | | 17.21% | | | | | 0.81% | | | | | -0.06% | |
Data shows past performance, which is not indicative of future performance. Current performance may be lower or higher than the performance quoted. To obtain the most recent month-end performance data available, please visit www.WasatchFunds.com. The Advisor may absorb certain Fund expenses, without which total return would have been lower. Investment returns and principal value will fluctuate and shares, when redeemed, may be worth more or less than their original cost.
As of the January 31, 2017 prospectus, the Total Annual Fund Operating Expenses for the Wasatch Emerging Markets Small Cap Fund are Investor Class: 1.96% / Institutional Class: 1.81%. The expense ratio shown elsewhere in this report may be different. See the prospectus for additional information regarding Fund expenses.
Wasatch Funds will deduct a 2.00% redemption proceeds fee on Fund shares held 60 days or less. Performance data does not reflect the deduction of fees, including sales charges, or the taxes you would pay on fund distributions or the redemption of fund shares. Fees and taxes, if reflected, would reduce the performance quoted. Wasatch does not charge any sales fees. For more complete information including charges, risks and expenses, read the prospectus carefully.
Performance for the Institutional Class prior to 2/1/2016 is based on the performance of the Investor Class. Performance of the Fund’s Institutional Class prior to 2/1/2016 uses the actual expenses of the Fund’s Investor Class without any adjustments. For any such period of time, the performance of the Fund’s Institutional Class would have been substantially similar to, yet higher than, the performance of the Fund’s Investor Class, because the shares of both classes are invested in the same portfolio of securities, but the classes bear different expenses.
Investing in foreign securities, especially in emerging markets, entails special risks, such as currency fluctuations and political uncertainties, which are described in more detail in the prospectus. Investing in small cap funds will be more volatile and loss of principal could be greater than investing in large cap or more diversified funds.
TOP 10 EQUITY HOLDINGS**
| | | | |
| Company | | % of Net
Assets | |
| Clicks Group Ltd. (South Africa) | | | 2.1% | |
| Raia Drogasil S.A. (Brazil) | | | 2.0% | |
| ASPEED Technology, Inc. (Taiwan) | | | 1.9% | |
| Sunny Optical Technology Group Co. Ltd. (China) | | | 1.9% | |
| Ennoconn Corp. (Taiwan) | | | 1.8% | |
| | | | |
| Company | | % of Net
Assets | |
| Silergy Corp. (Taiwan) | | | 1.7% | |
| Medytox, Inc. (Korea) | | | 1.7% | |
| Bajaj Finance Ltd. (India) | | | 1.7% | |
| Poya Co. Ltd. (Taiwan) | | | 1.6% | |
| BGF Retail Co. Ltd. (Korea) | | | 1.6% | |
| ** | As of March 31, 2017, there were 107 holdings in the Fund. Foreign currency contracts, written options and repurchase agreements, if any, are not included in the number of holdings. Portfolio holdings are subject to change at any time. References to specific securities should not be construed as recommendations by the Funds or their Advisor. Current and future holdings are subject to risk. |
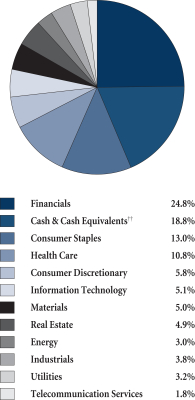
SECTOR BREAKDOWN†
| † | Excludes securities sold short and options written, if any. |
| †† | Also includes Other Assets & Liabilities. |
GROWTHOFA HYPOTHETICAL $10,000 INVESTMENT
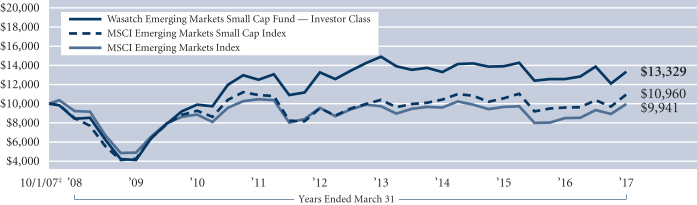
Past performance does not predict future performance. The graph above does not reflect the deduction of fees, sales charges, or taxes that you would pay on fund distributions or the redemption of fund shares. Wasatch does not charge any sales fees. ‡Inception: October 1, 2007. The MSCI Emerging Markets and Emerging Markets Small Cap indices are free float-adjusted market capitalization indices designed to measure the equity market performance of emerging markets. You cannot invest directly in these or any indices.
11
| | |
| WASATCH FRONTIER EMERGING SMALL COUNTRIES FUND (WAFMX / WIFMX) | | MARCH 31, 2017 (UNAUDITED) |
|
|
|
Management Discussion
The Wasatch Frontier Emerging Small Countries Fund is managed by a team of Wasatch portfolio managers led by Roger Edgley, Jared Whatcott and Scott Thomas.
| | | | |
Roger Edgley, CFA Lead Portfolio Manager | | 
Jared Whatcott, CFA Portfolio Manager | |
Scott Thomas, CFA Portfolio Manager |
OVERVIEW
Frontier and small emerging markets produced strong results during the first quarter of 2017 largely due to optimism over growth and stability in a number of key currencies. Wasatch is seeing strength from the bottom- up — earnings are coming through at the company level. The Wasatch Frontier Emerging Small Countries Fund — Investor Class returned 3.73% during the quarter while the benchmark, the MSCI Frontier Emerging Markets Index, increased 7.41%.
The investment case for frontier markets and emerging small countries historically has been driven by faster-than-expected economic growth and better demographics than those found in larger emerging and developed markets. Yet, over the past few years, frontier markets have disappointingly not delivered on their promise.
Now, the macro headwinds that had curtailed growth in these markets are increasingly turning into tailwinds. Starting this year, gross domestic product (GDP) growth is expected to pick up across frontier markets. Further, frontier market currencies are the least expensive they have been over the past four years, including real effective exchange rates. From a valuation perspective, frontier market stocks are now trading at a discount near all-time lows relative to emerging and developed market stocks. In addition, the correlation between frontier and emerging markets is the lowest it has been since 2009, despite the fact that trading volume has increased. After a period of adjustment to lower commodity prices and a stronger U.S. dollar, frontier market fundamentals appear to have troughed and growth is now expected to pick up.
The Fund’s overweight positions in the United Arab Emirates and Argentina (including MercadoLibre) added to performance relative to the benchmark, while our underweight position in Kuwait, a strong-performing market, detracted. Our Nigerian stocks continued to struggle with ongoing economic and currency issues and we sold our remaining holdings during the quarter.
DETAILSOFTHE QUARTER
Argentina was the Fund’s best performing frontier market for the quarter. Early in 2017, we visited a number of
Argentine companies. We are increasingly positive on the trajectory of reforms taking place in Argentina and efforts being made by the current government to improve the economic structure of the country. What’s more, Argentina’s equity market is set to regain emerging market status almost seven years after the government implemented capital controls. MSCI is considering including Argentina in its emerging market indices, with the decision expected in June this year. Inclusion would ultimately lead to a significant flow from passive funds relative to the daily traded volume.
MercadoLibre, Inc. was the Fund’s top contributor to performance in the first quarter. The company is based in Argentina and hosts online-commerce platforms in Latin America. Other products include MercadoPago, an integrated online-payments solution to facilitate transactions on and off the company’s platforms. Earnings at MercadoLibre soared 31.8% in its most-recently reported quarter on 41.8% revenue growth versus the same period a year ago.
Transportadora de Gas del Sur S.A., a recent addition to the Fund, is the exclusive pipeline company for Southern Argentina (until 2037). It is currently the largest pipeline operator in the country. We believe that the government’s proposed tariff reforms will provide a boost to the company’s revenues and profits. With the stock trading at an approximately 50% discount to those of the company’s global peers, we see significant room for re-rating as new tariffs are fully phased in.
Pakistan, our largest portfolio weight, took a breather this quarter after strong performance in 2016. As a team, we met with executives of a number of our holdings and companies in Pakistan early in the quarter, and came away confident about our positioning and large overweight.
On a country basis, Nigeria was the Fund’s largest detractor for the three-month period. As mentioned earlier, we sold our remaining Nigerian holdings during the quarter and will continue to monitor the situation in Nigeria from the sidelines.
OUTLOOK
Wasatch is confident regarding the outlook for many of the frontier and small emerging markets where we see improving macro backdrops. The rhetoric on protectionist trade policies by the U.S. government has been more aggressive than any action thus far. Most importantly, we see significant improvement in the outlook of our portfolio companies, and are starting to see a rebound in earnings growth. In addition, we see frontier markets as trading at attractive valuations.
We believe that bottom-up analysis and travel to these regions is critical as economic growth, political structures and willingness to reform varies widely in developing markets. We continue to travel extensively and are excited about the future of frontier and small emerging markets and their expanding role in the global economy.
Thank you for the opportunity to manage your assets.
Current and future holdings are subject to risk.
12
| | |
| WASATCH FRONTIER EMERGING SMALL COUNTRIES FUND (WAFMX / WIFMX) | | MARCH 31, 2017 (UNAUDITED) |
|
|
|
Portfolio Summary
AVERAGE ANNUAL TOTAL RETURNS
| | | | | | | | | | | | | | | | | | | | |
| | | SIX MONTHS* | | 1 YEAR | | 5 YEARS | | SINCE INCEPTION 1/31/12 |
Frontier Emerging Small Countries (WAFMX) — Investor | | | | -4.94% | | | | | -5.66% | | | | | 4.56% | | | | | 4.91% | |
Frontier Emerging Small Countries (WIFMX) — Institutional | | | | -4.92% | | | | | -5.64% | | | | | 4.65% | | | | | 4.99% | |
MSCI Frontier Emerging Markets Index | | | | 2.81% | | | | | 7.38% | | | | | 2.15% | | | | | 3.40% | |
MSCI Frontier Markets Index | | | | 9.43% | | | | | 12.86% | | | | | 5.82% | | | | | 6.70% | |
Data shows past performance, which is not indicative of future performance. Current performance may be lower or higher than the performance quoted. To obtain the most recent month-end performance data available, please visit www.WasatchFunds.com. The Advisor may absorb certain Fund expenses, without which total return would have been lower. Investment returns and principal value will fluctuate and shares, when redeemed, may be worth more or less than their original cost.
As of the January 31, 2017 prospectus, the Total Annual Fund Operating Expenses for the Wasatch Frontier Emerging Small Countries Fund are Investor Class — Gross: 2.39%, Net: 2.25% / Institutional Class: 2.06%. The expense ratio shown elsewhere in this report may be different. Net expenses are based on Fund expenses, net of waivers and reimbursements. See the prospectus for additional information regarding Fund expenses.
Wasatch Funds will deduct a 2.00% redemption proceeds fee on Fund shares held 60 days or less. Performance data does not reflect the deduction of fees, including sales charges, or the taxes you would pay on fund distributions or the redemption of fund shares. Fees and taxes, if reflected, would reduce the performance quoted. Wasatch does not charge any sales fees. For more complete information including charges, risks and expenses, read the prospectus carefully.
Performance for the Institutional Class prior to 2/1/2016 is based on the performance of the Investor Class. Performance of the Fund’s Institutional Class prior to 2/1/2016 uses the actual expenses of the Fund’s Investor Class without any adjustments. For any such period of time, the performance of the Fund’s Institutional Class would have been substantially similar to, yet higher than, the performance of the Fund’s Investor Class, because the shares of both classes are invested in the same portfolio of securities, but the classes bear different expenses.
Investing in small cap funds will be more volatile and loss of principal could be greater than investing in large cap or more diversified funds. Investing in foreign securities, especially in frontier and emerging markets, entails special risks, such as currency fluctuations and political uncertainties, which are described in more detail in the prospectus.
TOP 10 EQUITY HOLDINGS**
| | | | |
| Company | | % of Net
Assets | |
| Vietnam Dairy Products JSC (Vietnam) | | | 3.5% | |
| United Bank Ltd. (Pakistan) | | | 3.3% | |
| Habib Bank Ltd. (Pakistan) | | | 3.2% | |
| Lucky Cement Ltd. (Pakistan) | | | 3.2% | |
| Pampa Energia S.A. ADR (Argentina) | | | 3.2% | |
| | | | |
| Company | | % of Net
Assets | |
| Philippine Seven Corp. (Philippines) | | | 3.2% | |
| MercadoLibre, Inc. (Brazil) | | | 3.2% | |
| Honda Atlas Cars Pakistan Ltd. (Pakistan) | | | 2.8% | |
| NMC Health plc (United Arab Emirates) | | | 2.7% | |
| Square Pharmaceuticals Ltd. (Bangladesh) | | | 2.7% | |
| ** | As of March 31, 2017, there were 54 holdings in the Fund. Foreign currency contracts, written options and repurchase agreements, if any, are not included in the number of holdings. Portfolio holdings are subject to change at any time. References to specific securities should not be construed as recommendations by the Funds or their Advisor. Current and future holdings are subject to risk. |
SECTOR BREAKDOWN†
| † | Excludes securities sold short and options written, if any. |
| †† | Also includes Other Assets & Liabilities. |
GROWTHOFA HYPOTHETICAL $10,000 INVESTMENT
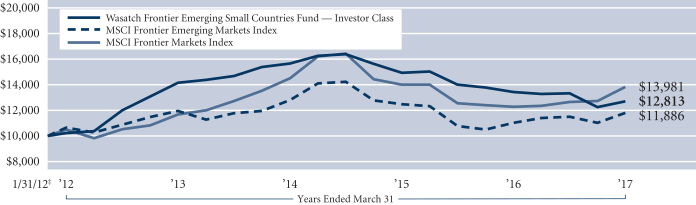
Past performance does not predict future performance. The graph above does not reflect the deduction of fees, sales charges, or taxes that you would pay on fund distributions or the redemption of fund shares. Wasatch does not charge any sales fees. ‡Inception: January 31, 2012. The MSCI Frontier Emerging Markets and MSCI Frontier Markets indices are free float-adjusted market capitalization indices designed to measure the equity market performance of the global frontier and emerging markets. You cannot invest directly in these or any indices.
13
| | |
| WASATCH GLOBAL OPPORTUNITIES FUND (WAGOX / WIGOX) | | MARCH 31, 2017 (UNAUDITED) |
|
|
|
Management Discussion
The Wasatch Global Opportunities Fund is managed by a team of Wasatch portfolio managers led by JB Taylor and Ajay Krishnan.
| | | | |
JB Taylor Lead Portfolio Manager | |
Ajay Krishnan, CFA Lead Portfolio Manager | | OVERVIEW Exceptionally strong performance in India accompanied by solid gains in Europe and renewed strength in Japan enabled the Wasatch Global Opportunities Fund — |
Investor Class to return 11.82% for the first quarter of 2017. The Fund outperformed its benchmark, the MSCI All Country (AC) World Small Cap Index, which increased 6.03%.
Our investments in the United States performed well over the course of the quarter, outpacing those in the benchmark largely on the strength of our stock selection. We noted that in the closing weeks of the period investors began to question whether the post-election rally had run its course. Judicial resistance to President Trump’s executive orders limiting entry into the U.S., confirmation that the Trump campaign is the subject of a counterintelligence investigation, and failure of the Republican-sponsored health-care bill to garner enough support for a vote have called into question President Trump’s ability to fully enact his economic agenda, including revamping the tax code and implementing large-scale infrastructure projects.
On a more positive note, the quarter marked a comeback for U.S. growth stocks, which had significantly lagged their value counterparts for much of 2016. For all of last year, the Russell 2000 Growth Index underperformed the Russell 2000 Value Index by over 20 percentage points. So far this year, the reverse is true, with growth stocks outperforming by more than five percentage points. Given our focus on high-quality growth companies, this was an encouraging development.
India was the Fund’s top-contributing country and greatest source of outperformance relative to its benchmark. Major stock averages in India surged to record highs in March following the landslide victory of Prime Minister Narendra Modi’s Bharatiya Janata Party in elections to the state assembly of Uttar Pradesh, the country’s most-populous province. The decisive victory left Mr. Modi unchallenged as a national leader and boosted prospects for additional reforms aimed at furthering India’s growth and development. The quarter’s strong showing also indicates that investors have chosen to disregard any lingering effect from Modi’s demonetization program, implemented last November in an effort to curb graft and corruption.
DETAILSOFTHE QUARTER
India’s online travel agency MakeMyTrip Ltd. was the top contributor to the Fund’s performance for the first quarter of 2017. The company’s focus on hotel bookings and
customized holiday packages — both of which command higher margins than air ticketing — appears to be paying off. In addition, its recently completed merger with the ibibo Group leaves the company well-positioned in our view to benefit from increased usage of online travel planning, which currently represents only about 20% of total travel arrangements in India.
MercadoLibre, Inc., the second-largest contributor, hosts online-commerce platforms in Latin America. Other products include MercadoPago, an integrated online-payments solution to facilitate transactions on and off the company’s platforms. Earnings at MercadoLibre soared 31.8% in its most-recently reported quarter on 41.8% revenue growth versus the same period a year ago.
The leading detractor from first quarter performance was the Ensign Group, Inc. The company operates facilities providing skilled nursing and rehabilitative care services and provides home health and hospice services in the U.S. Ensign Group has generally outperformed its peers. Recently, however, efforts to repeal and replace the Affordable Care Act created uncertainty for the health care facilities industry, which has largely benefited from the increase in the number of people with insurance.
Fiesta Restaurant Group, Inc. was also a large detractor. Fiesta’s share price plunged more than 20% at the end of February following the release of disappointing fourth-quarter 2016 results. At the same time, management suspended efforts to sell the company and appointed a new CEO, Richard Stockinger, former chief of Japanese restaurant chain Benihana. Three team members met with Fiesta executives in March and came away with the impression that management is effectively addressing the issues the company had stumbled over. The Fund is continuing to hold the stock as we monitor the company’s progress.
OUTLOOK
With disruptive political events — including the aftermath of the impeachment of President Dilma Rousseff in Brazil, the continuing fallout from Brexit, and the tumultuous debut of Donald Trump — dominating news coverage this quarter, many investors are considering whether or not to maintain their exposure to the markets.
When we look at the markets, however, we can’t help but notice that Brazil post impeachment has done well, Mexican stocks have begun to bounce back from their post-U.S. election sell off, the economic prospects of Europe and especially of the United Kingdom have been improving, and that the U.S. equity markets have done well since the election, despite early fears to the contrary.
For our part, while maintaining our vigilance, we intend to stay fully invested, focusing on what we can control. While we’re always aware of economic developments, and keeping an eye on political events along with everyone else, our main focus is to invest in high-quality companies that we believe have significant long-term growth potential.
Thank you for the opportunity to manage your assets.
Current and future holdings are subject to risk.
14
| | |
| WASATCH GLOBAL OPPORTUNITIES FUND (WAGOX / WIGOX) | | MARCH 31, 2017 (UNAUDITED) |
|
|
|
Portfolio Summary
AVERAGE ANNUAL TOTAL RETURNS
| | | | | | | | | | | | | | | | | | | | |
| | | SIX MONTHS* | | 1 YEAR | | 5 YEARS | | SINCE INCEPTION 11/17/08 |
Global Opportunities (WAGOX) — Investor | | | | 2.65% | | | | | 12.92% | | | | | 8.77% | | | | | 16.45% | |
Global Opportunities (WIGOX) — Institutional | | | | 2.62% | | | | | 12.88% | | | | | 8.76% | | | | | 16.45% | |
MSCI AC World Small Cap Index | | | | 7.90% | | | | | 17.50% | | | | | 9.72% | | | | | 15.29% | |
Data shows past performance, which is not indicative of future performance. Current performance may be lower or higher than the performance quoted. To obtain the most recent month-end performance data available, please visit www.WasatchFunds.com. The Advisor may absorb certain Fund expenses, without which total return would have been lower. Investment returns and principal value will fluctuate and shares, when redeemed, may be worth more or less than their original cost.
As of the January 31, 2017 prospectus, the Total Annual Fund Operating Expenses for the Wasatch Global Opportunities Fund are Investor Class: 1.53% / Institutional Class — Gross: 2.32%, Net: 1.35%. The expense ratio shown elsewhere in this report may be different. Net expenses are based on Fund expenses, net of waivers and reimbursements. See the prospectus for additional information regarding Fund expenses.
Wasatch Funds will deduct a 2.00% redemption proceeds fee on Fund shares held 60 days or less. Performance data does not reflect the deduction of fees, including sales charges, or the taxes you would pay on fund distributions or the redemption of fund shares. Fees and taxes, if reflected, would reduce the performance quoted. Wasatch does not charge any sales fees. For more complete information including charges, risks and expenses, read the prospectus carefully.
Performance for the Institutional Class prior to 2/1/2016 is based on the performance of the Investor Class. Performance of the Fund’s Institutional Class prior to 2/1/2016 uses the actual expenses of the Fund’s Investor Class without any adjustments. For any such period of time, the performance of the Fund’s Institutional Class would have been substantially similar to, yet higher than, the performance of the Fund’s Investor Class, because the shares of both classes are invested in the same portfolio of securities, but the classes bear different expenses.
Investing in small and micro cap funds will be more volatile and loss of principal could be greater than investing in large cap or more diversified funds. Investing in foreign securities, especially in emerging markets, entails special risks, such as currency fluctuations and political uncertainties, which are described in more detail in the prospectus.
TOP 10 EQUITY HOLDINGS**
| | | | |
| Company | | % of Net
Assets | |
| Cavium, Inc. | | | 3.4% | |
| Medytox, Inc. (Korea) | | | 3.2% | |
| MakeMyTrip Ltd. (India) | | | 3.1% | |
| MercadoLibre, Inc. (Brazil) | | | 2.8% | |
| HealthEquity, Inc. | | | 2.5% | |
| | | | |
| Company | | % of Net
Assets | |
| Trex Co., Inc. | | | 2.3% | |
| ICICI Prudential Life Insurance Co. Ltd. (India) | | | 2.3% | |
| Seattle Genetics, Inc. | | | 2.1% | |
| Copart, Inc. | | | 2.0% | |
| Ultimate Software Group, Inc. (The) | | | 2.0% | |
| ** | As of March 31, 2017, there were 80 holdings in the Fund. Foreign currency contracts, written options and repurchase agreements, if any, are not included in the number of holdings. Portfolio holdings are subject to change at any time. References to specific securities should not be construed as recommendations by the Funds or their Advisor. Current and future holdings are subject to risk. |
SECTOR BREAKDOWN†

| † | Excludes securities sold short and options written, if any. |
| †† | Also includes Other Assets & Liabilities. |
GROWTHOFA HYPOTHETICAL $10,000 INVESTMENT
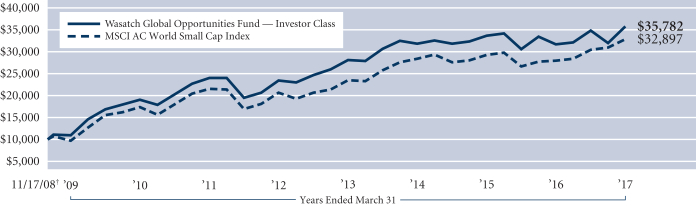
Past performance does not predict future performance. The graph above does not reflect the deduction of fees, sales charges, or taxes that you would pay on fund distributions or the redemption of fund shares. Wasatch does not charge any sales fees. ‡Inception: November 17, 2008. The MSCI AC (All Country) World Small Cap Index is a free float-adjusted market capitalization index designed to measure the performance of small capitalization securities in developed and emerging markets. You cannot invest directly in this or any index.
15
| | |
| WASATCH INTERNATIONAL GROWTH FUND (WAIGX / WIIGX) | | MARCH 31, 2017 (UNAUDITED) |
|
|
|
Management Discussion
The Wasatch International Growth Fund is managed by a team of Wasatch portfolio managers led by Roger Edgley, Ken Applegate, Linda Lasater and Kabir Goyal.
| | | | |
Roger Edgley, CFA Lead Portfolio Manager | | 
Ken Applegate, CFA Portfolio Manager | | OVERVIEW The Wasatch International Growth Fund — Investor Class gained 9.63% and outperformed its benchmark, the MSCI AC World Ex-U.S.A. Small Cap Index, which was up 8.78% for the three months ended March 31, 2017. The quarter was marked by a broad recovery across international markets. The expectation of pro-growth policies to reinvigorate the economy in the U.S., stabilization of the Chinese economy, and |

Linda Lasater, CFA Associate Portfolio Manager | | 
Kabir Goyal, CFA Associate Portfolio Manager | |
reflationary trends across Europe and Japan helped boost markets across the globe. Sector performance was mixed with more defensive sectors such as health care outperforming as did more cyclical sectors like industrials and information technology. Energy reversed course and underperformed following strong fourth quarter performance.
DETAILSOFTHE QUARTER
During the first quarter of 2017, health care and information technology were the strongest-contributing sectors for the Fund. We are overweight relative to the benchmark in health care. Ipsen S.A. (France) was the Fund’s top contributor in the quarter. Ipsen is a pharmaceutical company with 75% of sales generated from specialty drugs. In the quarter, Ipsen announced that it would acquire the rights to Merrimack Pharmaceuticals’ pancreatic cancer treatment. In our view, this acquisition would expand Ipsen’s oncology assets, bolster its geographic reach and provide significant growth potential. Medytox, Inc., a South Korean producer of botulinum toxin and dermal fillers, and Abcam plc, a leading online supplier of antibodies for life science research based in the United Kingdom (U.K.), were also among the Fund’s top contributors to first quarter performance.
The Fund is also overweight in the information-technology sector. Silergy Corp. (Taiwan), a producer of high performance analog integrated circuits, and Melexis N.V., a Belgian manufacturer of advanced integrated semiconductors and sensors, were the Fund’s top performers in the sector after both companies reported strong earnings growth.
The biggest detractor from the Fund’s performance in the first quarter was NCC Group plc. The U.K.-based company, which provides security software and consulting services, issued a second profit warning and the CEO stepped down. Our conviction regarding the company’s long-term prospects waned and we sold our shares. Domino’s Pizza Enterprises Ltd., a strong contributor to performance over the last several years, saw negative news headlines regarding franchise labor practices and profitability in Australia. We believe management has been forthright in discussing and addressing the issues and we remain positive on the long-term opportunity of the company.
Several of our emerging-market companies also detracted from performance during the first quarter. The looming increase in excise taxes on automobiles in the Philippines weighed heavily on the stock of GT Capital Holdings, Inc. The company owns 51% of Toyota Motor Philippines and this subsidiary contributes 46% to GT Capital’s earnings. However, for a typical auto loan, the proposed tax increase would only modestly raise a buyer’s monthly payment and in our opinion does not appreciably alter GT Capital’s long-term growth prospects. Nien Made Enterprise Co. Ltd., the world’s largest manufacturer of window coverings based in Taiwan, saw strong earnings but investors were concerned over price increases for raw materials and headlines highlighting growing protectionism around the globe. We remain positive on emerging markets.
OUTLOOK
Economic trends across the globe appear to be strengthening, but the political environment in some countries adds uncertainty regarding policies, which will result in volatile equity markets. We have been finding investment opportunities across sectors and geographies. Within our investment universe, we believe we can find high-quality companies that can grow despite difficult political or economic environments. Periodic volatility often provides opportunities to invest in companies that meet our stringent criteria at more reasonable prices thus improving the upside potential of the Fund.
In Europe, indicators like business and consumer confidence, consumer spending, inflation and industrial activity have strengthened, but we remain cautious with upcoming elections in several core European Union countries. Like the U.K.’s vote to exit the European Union last year, if populist parties take power, the impact of election outcomes will remain uncertain for a long period of time. The Fund’s investments remain focused on core and northern European countries.
In addition, Japan provides a wealth of opportunities given the deep and broad universe of small companies. Improving trends in corporate governance also result in more companies meeting our strict quality standards. We continue to find innovative and disruptive Japanese companies that are shaking up their industries.
Thank you for the opportunity to manage your assets.
Current and future holdings are subject to risk.
16
| | |
| WASATCH INTERNATIONAL GROWTH FUND (WAIGX / WIIGX) | | MARCH 31, 2017 (UNAUDITED) |
|
|
|
Portfolio Summary
AVERAGE ANNUAL TOTAL RETURNS
| | | | | | | | | | | | | | | | | | | | |
| | | SIX MONTHS* | | 1 YEAR | | 5 YEARS | | 10 YEARS |
International Growth (WAIGX) — Investor | | | | -3.52% | | | | | 3.21% | | | | | 8.58% | | | | | 4.94% | |
International Growth (WIIGX) — Institutional | | | | -3.46% | | | | | 3.34% | | | | | 8.61% | | | | | 4.96% | |
MSCI AC World Ex-U.S.A. Small Cap Index | | | | 4.95% | | | | | 12.26% | | | | | 6.68% | | | | | 3.04% | |
MSCI World Ex-U.S.A. Small Cap Index | | | | 4.66% | | | | | 11.58% | | | | | 7.78% | | | | | 2.72% | |
Data shows past performance, which is not indicative of future performance. Current performance may be lower or higher than the performance quoted. To obtain the most recent month-end performance data available, please visit www.WasatchFunds.com. The Advisor may absorb certain Fund expenses, without which total return would have been lower. Investment returns and principal value will fluctuate and shares, when redeemed, may be worth more or less than their original cost.
As of the January 31, 2017 prospectus, the Total Annual Fund Operating Expenses for the Wasatch International Growth Fund are Investor Class: 1.48% / Institutional Class — Gross: 1.36%, Net: 1.35%. The expense ratio shown elsewhere in this report may be different. Net expenses are based on Fund expenses, net of waivers and reimbursements. See the prospectus for additional information regarding Fund expenses.
Wasatch Funds will deduct a 2.00% redemption proceeds fee on Fund shares held 60 days or less. Performance data does not reflect the deduction of fees, including sales charges, or the taxes you would pay on fund distributions or the redemption of fund shares. Fees and taxes, if reflected, would reduce the performance quoted. Wasatch does not charge any sales fees. For more complete information including charges, risks and expenses, read the prospectus carefully.
Performance for the Institutional Class prior to 2/1/2016 is based on the performance of the Investor Class. Performance of the Fund’s Institutional Class prior to 2/1/2016 uses the actual expenses of the Fund’s Investor Class without any adjustments. For any such period of time, the performance of the Fund’s Institutional Class would have been substantially similar to, yet higher than, the performance of the Fund’s Investor Class, because the shares of both classes are invested in the same portfolio of securities, but the classes bear different expenses.
Investing in foreign securities, especially in frontier and emerging markets, entails special risks, such as currency fluctuations and political uncertainties, which are described in more detail in the prospectus. Investing in small cap funds will be more volatile and loss of principal could be greater than investing in large cap or more diversified funds.
TOP 10 EQUITY HOLDINGS**
| | | | |
| Company | | % of Net
Assets | |
| Seria Co. Ltd. (Japan) | | | 2.9% | |
| Ipsen S.A. (France) | | | 2.9% | |
| Vitasoy International Holdings Ltd. (China) | | | 2.4% | |
| Abcam plc (United Kingdom) | | | 2.3% | |
| Cosmos Pharmaceutical Corp. (Japan) | | | 2.1% | |
| | | | |
| Company | | % of Net
Assets | |
| MISUMI Group, Inc. (Japan) | | | 2.0% | |
| Cochlear Ltd. (Australia) | | | 2.0% | |
| MonotaRO Co. Ltd. (Japan) | | | 1.8% | |
| Nihon M&A Center, Inc. (Japan) | | | 1.8% | |
| Medytox, Inc. (Korea) | | | 1.8% | |
| ** | As of March 31, 2017, there were 84 holdings in the Fund. Foreign currency contracts, written options and repurchase agreements, if any, are not included in the number of holdings. Portfolio holdings are subject to change at any time. References to specific securities should not be construed as recommendations by the Funds or their Advisor. Current and future holdings are subject to risk. |
SECTOR BREAKDOWN†
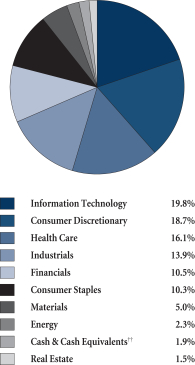
| † | Excludes securities sold short and options written, if any. |
| †† | Also includes Other Assets & Liabilities. |
GROWTHOFA HYPOTHETICAL $10,000 INVESTMENT
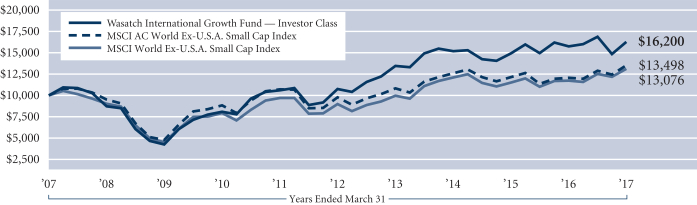
Past performance does not predict future performance. The graph above does not reflect the deduction of fees, sales charges, or taxes that you would pay on fund distributions or the redemption of fund shares. Wasatch does not charge any sales fees. The MSCI AC (All Country) World Ex-U.S.A. Small Cap Index is a free float-adjusted market capitalization index designed to measure the performance of small capitalization securities in developed markets, excluding the United States, and in emerging markets. The MSCI World Ex-U.S.A. Small Cap Index is a free float-adjusted market capitalization index designed to measure the performance of small capitalization securities in developed markets, excluding the United States. You cannot invest directly in these or any indices.
17
| | |
| WASATCH INTERNATIONAL OPPORTUNITIES FUND (WAIOX / WIIOX) | | MARCH 31, 2017 (UNAUDITED) |
|
|
|
Management Discussion
The Wasatch International Opportunities Fund is managed by a team of Wasatch portfolio managers led by Jared Whatcott and Linda Lasater.
| | | | |
Jared Whatcott, CFA Portfolio Manager | |
Linda Lasater, CFA Portfolio Manager | | OVERVIEW The Wasatch International Opportunities Fund — Investor Class returned 7.19% during the first quarter of 2017, underperforming its benchmark, the MSCI All Country (AC) |
World Ex-U.S.A Small Cap Index, which returned 8.78%.
The first three months of 2017 were dominated by U.S. political headlines as the Trump administration took the reins. Financial markets were buoyed by the prospect of increased fiscal stimulus in the U.S., but despite all the political racket, the S&P 500® Index had only two days during the quarter where it closed up or down more than 1%, one of the most tranquil starts to a year in half a century. Just what the new administration’s impact on global markets will be, however, is not yet clear.
Nevertheless, economic data has generally remained robust, kicking off global equity markets with a strong start. For example, purchasing managers indices for manufacturing in Europe hit new highs in the quarter, and job creation has been strong on both sides of the Atlantic. In Continental Europe, despite controversial upcoming elections in several core European countries this year, positive economic data lifted markets. The confidence of United Kingdom (U.K.) investors following the Brexit vote seems to be slowly improving as the divorce countdown is now officially underway. India’s gross domestic product (GDP) growth came in higher than expected at 7.1%, making it the world’s fastest-growing large economy. China’s GDP release for the fourth quarter of 2016 showed that the economy grew by 6.8% over the same quarter in 2015, slightly faster than expectations, as industrial production and retail sales continued to show signs of stability.
In general, the positive global macroeconomic environment at the start of 2017 seems to have provided a bit of a tailwind for the equity markets, despite ongoing concerns on numerous political fronts.
DETAILSOFTHE QUARTER
Reversing losses sustained in the prior quarter, our Japanese stocks returned 14.4% in first quarter, over 7.5 percentage points higher than the Index’s return in Japan. The Fund’s top-performing stock for the quarter was M&A Capital Partners Co. Ltd., an advisory firm poised to benefit from increasing consolidation of small and medium-size enterprises in Japan over the next decade. Stocks that rebounded strongly from fourth quarter losses included en-Japan, Inc., an online job site with growing overseas business, Prestige International, Inc., a unique company offering
call outsourcing in an underpenetrated market, and Seria Co. Ltd., operator of 100-yen stores (similar to dollar stores in the U.S.) whose stock had appreciated over 600% since we first bought it back in 2012 through March 31, 2017.
The Fund’s holdings in emerging markets provided a nice tailwind to performance in the quarter. Among the stocks that contributed favorably were Philippine Seven Corp. and BRAC Bank Ltd. Philippine Seven operates 7-11 convenience stores in the Philippines. It is now one of the Fund’s largest positions given what we regard as the high quality of its business model, well-respected management team, and vast headroom for convenience store growth in the country of 100 million people. BRAC Bank is a full-service bank in Bangladesh where the broader macroeconomic and political climate remains quite supportive of its rapidly growing retail and small and medium-size enterprise loan book.
Our structural overweighting of Indian stocks at nearly twice the benchmark’s weight was beneficial, as the India component of the Index gained 26.9%. Nevertheless, two of the Fund’s Indian stocks failed to keep up with broader market dynamics during the quarter. These were FIEM Industries Ltd., a motorcycle lighting manufacturer developing an LED lighting business, and Allcargo Global Logistics Ltd., a full-service multimodal logistics company.
PT Kimia Farma Persero Tbk, an Indonesian health-care company expanding into manufacturing as well as overseas retail distribution, was the primary factor in the Fund’s underperformance versus the Index in Indonesia. Even with this pullback, however, Kimia Farma’s stock has compounded at roughly 25% per year since we bought our first shares back in 2014.
OUTLOOK
Global equity markets started off 2017 with less overall volatility than might have been expected given the significant political noise we have been seeing in headlines around the world. Nevertheless, it is worth pointing out that there still can be significant dislocations of individual stocks even in seemingly low-volatility markets. As an example, the average stock-to-stock correlation of U.S. equities fell to its lowest level in nearly two decades, despite the Chicago Board Options Exchange Volatility Index (VIX) spending most of the quarter near all-time lows.
Conditions like these can present a favorable environment for active stock-pickers like us. Our process is to get to know individual companies at a deeper level in an effort to ensure that the Fund is well prepared for whatever uncertainties might lie ahead. Historically, the Fund has consistently had higher margins, higher returns on equity, and less debt than its benchmark. We believe companies with outstanding characteristics like these have the potential to drive the Fund’s long-term results.
Thank you for the opportunity to manage your assets.
Current and future holdings are subject to risk.
18
| | |
| WASATCH INTERNATIONAL OPPORTUNITIES FUND (WAIOX / WIIOX) | | MARCH 31, 2017 (UNAUDITED) |
|
|
|
Portfolio Summary
AVERAGE ANNUAL TOTAL RETURNS
| | | | | | | | | | | | | | | | | | | | |
| | | SIX MONTHS* | | 1 YEAR | | 5 YEARS | | 10 YEARS |
International Opportunities (WAIOX) — Investor | | | | -2.49% | | | | | 9.44% | | | | | 11.15% | | | | | 5.48% | |
International Opportunities (WIIOX) — Institutional | | | | -2.48% | | | | | 9.76% | | | | | 11.29% | | | | | 5.54% | |
MSCI AC World Ex-U.S.A. Small Cap Index | | | | 4.95% | | | | | 12.26% | | | | | 6.68% | | | | | 3.04% | |
MSCI World Ex-U.S.A. Small Cap Index | | | | 4.66% | | | | | 11.58% | | | | | 7.78% | | | | | 2.72% | |
Data shows past performance, which is not indicative of future performance. Current performance may be lower or higher than the performance quoted. To obtain the most recent month-end performance data available, please visit www.WasatchFunds.com. The Advisor may absorb certain Fund expenses, without which total return would have been lower. Investment returns and principal value will fluctuate and shares, when redeemed, may be worth more or less than their original cost.
As of the January 31, 2017 prospectus, the Total Annual Fund Operating Expenses for the Wasatch International Opportunities Fund are Investor Class: 2.22% / Institutional Class — Gross: 2.04%, Net: 1.95%. The expense ratio shown elsewhere in this report may be different. Net expenses are based on Fund expenses, net of waivers and reimbursements. See the prospectus for additional information regarding Fund expenses.
Wasatch Funds will deduct a 2.00% redemption proceeds fee on Fund shares held 60 days or less. Performance data does not reflect the deduction of fees, including sales charges, or the taxes you would pay on fund distributions or the redemption of fund shares. Fees and taxes, if reflected, would reduce the performance quoted. Wasatch does not charge any sales fees. For more complete information including charges, risks and expenses, read the prospectus carefully.
Performance for the Institutional Class prior to 2/1/2016 is based on the performance of the Investor Class. Performance of the Fund’s Institutional Class prior to 2/1/2016 uses the actual expenses of the Fund’s Investor Class without any adjustments. For any such period of time, the performance of the Fund’s Institutional Class would have been substantially similar to, yet higher than, the performance of the Fund’s Investor Class, because the shares of both classes are invested in the same portfolio of securities, but the classes bear different expenses.
Investing in foreign securities, especially in frontier and emerging markets, entails special risks, such as currency fluctuations and political uncertainties, which are described in more detail in the prospectus. Investing in micro cap funds will be more volatile and loss of principal could be greater than investing in large cap or more diversified funds.
TOP 10 EQUITY HOLDINGS**
| | | | |
| Company | | % of Net
Assets | |
| M&A Capital Partners Co. Ltd. (Japan) | | | 4.1% | |
| Dip Corp. (Japan) | | | 3.6% | |
| en-japan, Inc. (Japan) | | | 2.5% | |
| Seria Co. Ltd. (Japan) | | | 2.3% | |
| Webjet Ltd. (Australia) | | | 1.9% | |
| | | | |
| Company | | % of Net
Assets | |
| Philippine Seven Corp. (Philippines) | | | 1.9% | |
| AmRest Holdings SE (Poland) | | | 1.9% | |
| Gurunavi, Inc. (Japan) | | | 1.8% | |
| Infomart Corp. (Japan) | | | 1.5% | |
| Open Door, Inc. (Japan) | | | 1.5% | |
| ** | As of March 31, 2017, there were 107 holdings in the Fund. Foreign currency contracts, written options and repurchase agreements, if any, are not included in the number of holdings. Portfolio holdings are subject to change at any time. References to specific securities should not be construed as recommendations by the Funds or their Advisor. Current and future holdings are subject to risk. |
SECTOR BREAKDOWN†
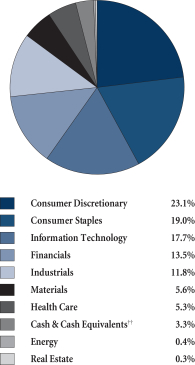
| † | Excludes securities sold short and options written, if any. |
| †† | Also includes Other Assets & Liabilities. |
GROWTHOFA HYPOTHETICAL $10,000 INVESTMENT
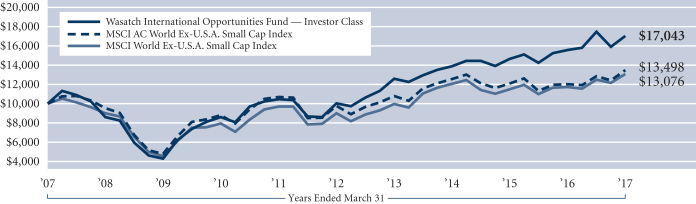
Past performance does not predict future performance. The graph above does not reflect the deduction of fees, sales charges, or taxes that you would pay on fund distributions or the redemption of fund shares. Wasatch does not charge any sales fees. The MSCI AC (All Country) World Ex-U.S.A. Small Cap Index is a free float-adjusted market capitalization index designed to measure the performance of small capitalization securities in developed markets, excluding the United States, and in emerging markets. The MSCI World Ex-U.S.A. Small Cap Index is a free float-adjusted market capitalization index designed to measure the performance of small capitalization securities in developed markets, excluding the United States. You cannot invest directly in these or any indices.
19
| | |
| WASATCH LARGE CAP VALUE FUND (FMIEX / WILCX) | | MARCH 31, 2017 (UNAUDITED) |
|
|
|
Management Discussion
The Wasatch Large Cap Value Fund is managed by a team of Wasatch portfolio managers led by David Powers.
| | |

David Powers, CFA Lead Portfolio Manager | | OVERVIEW The Wasatch Large Cap Value Fund — Investor Class gained 3.10% for the quarter ended March 31, 2017 and roughly kept pace with its benchmark, the Russell 1000 Value Index, which returned 3.27%. For much of the quarter, stock prices trended higher as investors continued to anticipate growth-oriented policies from the new Trump administration and Republican-held Congress, |
including those that would lower taxes and reduce regulation. More fundamentally, ongoing improvement in the economy underpinned investor sentiment, with strong data in key areas such as employment and corporate earnings. March saw equities give back some of their gains. The U.S. Federal Reserve raised the federal-funds target rate by 0.25 of a percentage point to a range of 0.75% to 1.00%. In addition, the failed effort to repeal and replace the Affordable Care Act dampened optimism with respect to the administration’s ability to implement the rest of its economic agenda.
The Fund’s performance benefited from holdings within the information-technology and health-care sectors, while our holdings in financials and industrials detracted from performance relative to the benchmark.
DETAILSOFTHE QUARTER
Leading contributors to the Fund’s performance in the quarter included consumer electronics icon Apple, Inc. Despite being in-between product cycles, Apple has continued to see solid iPhone sales. A 10th anniversary edition of the iPhone is expected later this year, and the upgrade rate from Apple’s huge base of installed users is anticipated to be high given advances in areas such as screen resolution and battery life. Finally, Apple’s revenue from recurring service fees is expected to double over the next four years. We have maintained the position as the stock does not appear overvalued to us. Apple not only has a huge stockpile of cash but also features rising free cash flow.
Database software and business systems giant Oracle Corp. saw its share price rise as the company’s operating results beat expectations. Investors had been concerned that Oracle would be vulnerable as enterprise-level software and services increasingly are delivered over the internet. However, growth in Oracle’s revenues from cloud-based delivery of software applications now more than offsets declining licensing fees from legacy software and technology. In addition, support revenue from Oracle’s user base con- tinues to grow. We continue to like the stock and expect it to be re-rated by the market in view of Oracle’s rising top-line growth.
Outside of information technology, Duke Energy Corp. was a significant contributor, on the back of solid earnings and improved guidance. Duke is a supplier of electric power
in several states and has taken steps in recent years to simplify operations and become more of a pure regulated utility.
On the downside, shares of Verizon Communications, Inc. declined on the back of soft results for the fourth quarter of 2016 and a weakened outlook for 2017. While Verizon still has an industry-leading network, operating results have suffered from heightened competition, which has forced the company to give away handsets and advertise heavily in an effort to maintain market share. More recently, Verizon began to offer unlimited data plans in order to match Sprint and T-Mobile.* This move further strained earnings. We have maintained our position, as we believe the challenges faced by Verizon have been largely discounted given the current valuation, and the stock pays the highest dividend among Dow Jones Industrial Average constituents.
Industrial conglomerate General Electric Co. also saw its share price decline in the quarter. While GE’s most recent report met expectations, investors were unimpressed with the quality of earnings. Revenues and margins have softened, in part due to continued weakness in sales of oil and gas drilling equipment given the uncertain outlook for energy prices. We added to the position on weakness. We view GE as an ongoing turnaround story, with the company having taken strong steps to tighten its industrial focus and shed low-margin businesses.
OUTLOOK
Our stance in the Fund remains relatively cautious. Given the current level of stock prices, we believe investors continue to rather optimistically price in the ability of the Trump administration and Congress to achieve their policy initiatives. As seen with respect to health care, implementation of stated policy goals is hardly assured even with the Republicans holding the White House and both houses of Congress. Reducing the regulatory burden on businesses is likely achievable and could have a positive impact on growth. However, plans for tax reform and infrastructure spending will be more challenging to put through.
While the economy appears to remain on a positive track, the question is: What will the growth rate be from here on out and will it be sufficient to support further stock price gains? With valuations high across sectors, U.S. growth potentially having peaked given the length of the current business cycle, and heightened event risk from political developments, we are maintaining the Fund’s strong focus on the quality of our investments. In this vein, we are tilted toward larger companies with lower market sensitivity, lower valuations, higher dividends, and higher returns on equity or assets than the broader value universe.
We believe the Fund is well-positioned for the current climate as well as for the longer term, and thank you for your continued investment.
| * | As of March 31, 2017, the Wasatch Large Cap Value Fund was not invested in Sprint or T-Mobile. |
| | Current and future holdings are subject to risk. |
20
| | |
| WASATCH LARGE CAP VALUE FUND (FMIEX / WILCX) | | MARCH 31, 2017 (UNAUDITED) |
|
|
|
Portfolio Summary
AVERAGE ANNUAL TOTAL RETURNS
| | | | | | | | | | | | | | | | | | | | |
| | | SIX MONTHS* | | 1 YEAR | | 5 YEARS | | 10 YEARS |
Large Cap Value (FMIEX) — Investor | | | | 10.96% | | | | | 17.98% | | | | | 9.41% | | | | | 5.52% | |
Large Cap Value (WILCX) — Institutional | | | | 10.95% | | | | | 18.05% | | | | | 9.51% | | | | | 5.57% | |
Russell 1000® Value Index | | | | 10.16% | | | | | 19.22% | | | | | 13.13% | | | | | 5.93% | |
Data shows past performance, which is not indicative of future performance. Current performance may be lower or higher than the performance quoted. To obtain the most recent month-end performance data available, please visit www.WasatchFunds.com. The Advisor may absorb certain Fund expenses, without which total return would have been lower. Investment returns and principal value will fluctuate and shares, when redeemed, may be worth more or less than their original cost.
As of the January 31, 2017 prospectus, the Total Annual Fund Operating Expenses for the Wasatch Large Cap Value Fund are Investor Class — Gross: 1.17%, Net: 1.10% / Institutional Class — Gross: 1.72%, Net: 0.95%. The expense ratio shown elsewhere in this report may be different. Net expenses are based on Fund expenses, net of waivers and reimbursements. See the prospectus for additional information regarding Fund expenses.
Wasatch Funds will deduct a 2.00% redemption proceeds fee on Fund shares held 60 days or less. Performance data does not reflect the deduction of fees, including sales charges, or the taxes you would pay on fund distributions or the redemption of fund shares. Fees and taxes, if reflected, would reduce the performance quoted. Wasatch does not charge any sales fees. For more complete information including charges, risks and expenses, read the prospectus carefully.
Performance for the Institutional Class prior to 1/31/2012 is based on the performance of the Investor Class. Performance of the Fund’s Institutional Class prior to 1/31/2012 uses the actual expenses of the Fund’s Investor Class without any adjustments. For any such period of time, the performance of the Fund’s Institutional Class would have been substantially similar to, yet higher than, the performance of the Fund’s Investor Class, because the shares of both classes are invested in the same portfolio of securities, but the classes bear different expenses.
Investments in value stocks can perform differently from the market as a whole and from other types of stocks and can continue to be undervalued by the market for long periods of time. Loss of principal is a risk of investing.
TOP 10 EQUITY HOLDINGS**
| | | | |
| Company | | % of Net
Assets | |
Johnson & Johnson | | | 4.8% | |
Duke Energy Corp. | | | 4.5% | |
Pfizer, Inc. | | | 4.4% | |
Wal-Mart Stores, Inc. | | | 4.3% | |
Chevron Corp. | | | 4.2% | |
| | | | |
| Company | | % of Net
Assets | |
Exelon Corp. | | | 4.0% | |
JPMorgan Chase & Co. | | | 3.9% | |
General Electric Co. | | | 3.8% | |
Cisco Systems, Inc. | | | 3.8% | |
Oracle Corp. | | | 3.7% | |
| ** | As of March 31, 2017, there were 35 holdings in the Fund. Foreign currency contracts, written options and repurchase agreements, if any, are not included in the number of holdings. Portfolio holdings are subject to change at any time. References to specific securities should not be construed as recommendations by the Funds or their Advisor. Current and future holdings are subject to risk. |
SECTOR BREAKDOWN†
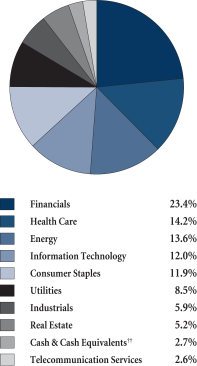
| † | Excludes securities sold short and options written, if any. |
| †† | Also includes Other Assets & Liabilities. |
GROWTHOFA HYPOTHETICAL $10,000 INVESTMENT

Past performance does not predict future performance. The graph above does not reflect the deduction of fees, sales charges, or taxes that you would pay on fund distributions or the redemption of fund shares. Wasatch does not charge any sales fees. The Russell 1000 Value Index measures the performance of Russell 1000 Index companies with lower price-to-book ratios and lower forecasted growth values. You cannot invest directly in these or any indices.
21
| | |
| WASATCH LONG/SHORT FUND (FMLSX / WILSX) | | MARCH 31, 2017 (UNAUDITED) |
|
|
|
Management Discussion
The Wasatch Long Short Fund is managed by a team of Wasatch portfolio managers led by Terry Lally.
| | |

Terry Lally, CFA Lead Portfolio Manager | | OVERVIEW Major U.S. stock markets posted strong positive returns in the first quarter, as investors continued to anticipate that the growth-oriented policies of the Trump administration and Republican-held Congress would accelerate economic growth. Sentiment was also underpinned by ongoing improvement in the economy, reflected in strong employment and corporate earnings data, as well as rising consumer and business confidence. |
The rally stalled in March, however, due to data points that called into question some of the key assumptions in the “Trump reflation” trade, shorthand for an increase in both growth and inflation. In March, the Federal Open Market Committee raised the federal-funds target rate 0.25 of a percentage point to a range of 0.75% to 1.00%. In addition, the failure to repeal and replace the Affordable Care Act dampened optimism that the administration would be able to implement the rest of its economic agenda.
For the first quarter of 2017, the Wasatch Long/Short Fund — Investor Class lost -2.26%, lagging the 6.07% return of the S&P 500 Index. After the Fund’s strong performance in 2016, the first-quarter results were disappointing. Our overall positioning and strategy remained relatively unchanged from last year. In a period of rising stock prices, the Fund’s relatively low net-long exposure and negative performance from the Fund’s short positions constrained its return.
Given the high expectations embedded in valuations from the strong run in equities over the last few years and the late stage of the business cycle, we believe our positioning continues to make sense. We continue to find select opportunities in long positions that we believe have upside potential. Short opportunities appear to be abundant as many stocks seem overpriced to us. The Fund’s positioning is intended to enable shareholders to participate in an up market while also helping to mitigate the downside.
DETAILSOFTHE QUARTER
On the positive side of the ledger, the Fund’s position in Apple, Inc. was the leading individual contributor. We had re-established a position in Apple early in 2016. At the time, Apple was experiencing a soft product cycle for the iPhone and analysts were questioning whether the company’s earnings power was sustainable. We believed an asymmetric risk/reward opportunity existed with the stock’s potential downside supported by valuation and the company’s share buybacks, and that upside could potentially be driven by new products, recurring services and capital structure opportunities. The Fund benefited in the quarter as Apple’s stock rose, in large part due to the successful iPhone 7 series and anticipation that the 10th anniversary edition of the iPhone would boost earnings.
As always, we will seek to benefit by shorting stocks we believe are trading at unsustainably high premiums to their intrinsic value. Despite the rising market, there were a handful of short positions that contributed positively. Among them was oil field services provider Helmerich & Payne, Inc. Shares of the company fell on the deteriorating outlook for utilization and day rates as the price of oil declined in March.
The biggest detractors on the long side of the portfolio were in energy and retail. Oil and gas exploration and production company Bill Barrett Corp. missed expectations by pushing out its timeline to 2018 for 30% to 50% production growth. We maintain a favorable view of Bill Barrett’s prospects in part due to its reserves in Colorado’s DJ Basin, which should support profitable extraction as long as oil remains above the $40-per-barrel range. Retailer Macy’s, Inc. lagged in the wake of weak holiday season results. Nevertheless, we like the company for its strong free cash flow, valuable franchise and share-buyback program.
Event risk is one of the most significant risks when shorting companies. Zeltiq Aesthetics, Inc., a medical-technology company focused on non-invasive fat reduction, was acquired by drug company giant Allergan plc, which is a long position held in the Fund, at an incredibly expensive price-to-earnings (P/E) ratio of 202. We had discounted the potential of an acquisition for Zeltiq given its already rich pre-acquisition P/E of 155.
OUTLOOKAND POSITIONING
The Fund ended the period with a historically low net long exposure of 38%. While this stance did not aid performance in the first quarter, optimism over the “Trump effect” showed signs of fading as the period drew to a close. If the Trump administration’s effort at tax reform fails, the market could respond quite negatively. Analysts estimate the earnings impact from lower taxes as responsible for one to two points of the recent multiple expansion. Given the elevated earnings expectations reflected in current valuations and the downside risk from expectations, execution and event risk, we remain comfortable with net long exposure in this range.
With respect to opportunities we are evaluating for the long portfolio, we believe the sell-off in retailers in the first quarter is similar to last year’s first-quarter selloff in energy. The demise of traditional retail due to online competition is now priced into these stocks. In select retailers that have franchises that can win online, there is significant upside from a modest change in expectations and P/E multiples.
We remain confident that the Fund is well-positioned to play a valuable role in our shareholders’ investment portfolios over time.
Thank you for your continued investment and confidence.
| | Current and future holdings are subject to risk. |
22
| | |
| WASATCH LONG/SHORT FUND (FMLSX / WILSX) | | MARCH 31, 2017 (UNAUDITED) |
|
|
|
Portfolio Summary
AVERAGE ANNUAL TOTAL RETURNS
| | | | | | | | | | | | | | | | | | | | |
| | | SIX MONTHS* | | 1 YEAR | | 5 YEARS | | 10 YEARS |
Long/Short (FMLSX) — Investor | | | | 2.96% | | | | | 8.45% | | | | | 2.78% | | | | | 3.91% | |
Long/Short (WILSX) — Institutional | | | | 3.11% | | | | | 8.68% | | | | | 2.94% | | | | | 3.99% | |
S&P 500® Index | | | | 10.12% | | | | | 17.17% | | | | | 13.30% | | | | | 7.51% | |
Citigroup U.S. Domestic 3-Month Treasury Bills Index | | | | 0.20% | | | | | 0.34% | | | | | 0.11% | | | | | 0.61% | |
Data shows past performance, which is not indicative of future performance. Current performance may be lower or higher than the performance quoted. To obtain the most recent month-end performance data available, please visit www.WasatchFunds.com. The Advisor may absorb certain Fund expenses, without which total return would have been lower. Investment returns and principal value will fluctuate and shares, when redeemed, may be worth more or less than their original cost.
As of the January 31, 2017 prospectus, the Total Annual Fund Operating Expenses for the Wasatch Long/Short Fund are — Investor Class: 1.83% / Institutional Class — Gross: 1.57%, Net: 1.50%. The expense ratio shown elsewhere in this report may be different. Net expenses are based on Fund expenses, net of waivers and reimbursements. Expenses include dividend expense on short sales and interest expense. See the prospectus for additional information regarding Fund expenses.
Wasatch Funds will deduct a 2.00% redemption proceeds fee on Fund shares held 60 days or less. Performance data does not reflect the deduction of fees, including sales charges, or the taxes you would pay on fund distributions or the redemption of fund shares. Fees and taxes, if reflected, would reduce the performance quoted. Wasatch does not charge any sales fees. For more complete information including charges, risks and expenses, read the prospectus carefully.
Performance for the Institutional Class prior to 12/13/2012 is based on the performance of the Investor Class. Performance of the Fund’s Institutional Class prior to 12/13/2012 uses the actual expenses of the Fund’s Investor Class without any adjustments. For any such period of time, the performance of the Fund’s Institutional Class would have been substantially similar to, yet higher than, the performance of the Fund’s Investor Class, because the shares of both classes are invested in the same portfolio of securities, but the classes bear different expenses.
The Fund makes short sales of securities, which involve the risk that losses may exceed the original amount invested. Equity investing involves risks, including potential loss of the principal amount invested.
TOP 10 EQUITY HOLDINGS**
| | | | |
| Company | | % of Net
Assets | |
| Apple, Inc. | | | 5.5% | |
| Michael Kors Holdings Ltd. | | | 4.3% | |
| McKesson Corp. | | | 4.0% | |
| Amgen, Inc. | | | 4.0% | |
| Mellanox Technologies Ltd. | | | 3.9% | |
| | | | |
| Company | | % of Net
Assets | |
| QUALCOMM, Inc. | | | 3.9% | |
| Medtronic plc | | | 3.6% | |
| Citigroup, Inc. | | | 3.2% | |
| Allergan plc | | | 3.0% | |
| Mosaic Co. (The) | | | 3.0% | |
| ** | As of March 31, 2017, there were 37 long and 24 short holdings in the Fund. Foreign currency contracts, written options and repurchase agreements, if any, are not included in the number of holdings. Portfolio holdings are subject to change at any time. References to specific securities should not be construed as recommendations by the Funds or their Advisor. Current and future holdings are subject to risk. |
SECTOR BREAKDOWN†
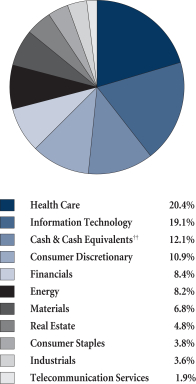
| † | Excludes securities sold short and options written, if any. |
| †† | Also includes Other Assets & Liabilities. |
GROWTHOFA HYPOTHETICAL $10,000 INVESTMENT

Past performance does not predict future performance. The graph above does not reflect the deduction of fees, sales charges, or taxes that you would pay on fund distributions or the redemption of fund shares. Wasatch does not charge any sales fees. The S&P 500 Index includes 500 of the United States’ largest stocks from a broad variety of industries. The Index is unmanaged and is a commonly used measure of common stock total return performance. The Citigroup U.S. Domestic 3-Month Treasury Bills Index tracks the performance of U.S. Treasury bills with a remaining maturity of three months. U.S. Treasury bills, which are short-term loans to the U.S. government, are full-faith-and-credit obligations of the U.S. Treasury and are generally regarded as being free of any risk of default. You cannot invest directly in these or any indices.
23
| | |
| WASATCH MICRO CAP FUND (WMICX) | | MARCH 31, 2017 (UNAUDITED) |
|
|
|
Management Discussion
The Wasatch Micro Cap Fund is managed by a team of Wasatch portfolio managers led by Dan Chace.
| | |

Dan Chace, CFA Lead Portfolio Manager | | OVERVIEW The Wasatch Micro Cap Fund gained 7.26% during the first quarter of 2017 and outperformed the Russell Microcap Index. Though the post-election rally that pushed stocks higher late last year continued, this quarter’s gains were confined mainly to large-cap issues. While the large-cap S&P 500® Index, for example, rose 6.07% during the quarter, the Fund’s benchmark, the Russell Microcap Index, rose just 0.38%. |
After underperforming our benchmark during the final quarter of 2016, we evaluated whether or not to add to some of the areas that had driven the benchmark’s performance. With higher interest rates improving the net-interest margins of banks and other lenders, the financial sector seemed a logical place to start. Financial-services firms also stood to benefit from potential easing of regulatory burdens under the Trump administration.
With growth among micro-cap banks still sluggish, however, we found the recent sharp increases in their stock prices very difficult to justify. Instead, we maintained our existing bank holdings — and even trimmed one based on valuation concerns. That approach served us well. Micro-cap financial stocks performed poorly during the first quarter, and our underweight ownership of those types of companies was a source of Fund outperformance relative to the benchmark.
Similarly, the Wasatch team analyzed industrial companies in search of stocks likely to hold up well if the so-called “Trump rally” were to reverse. Ultimately, we did not add positions to the Fund from the industrials sector either. As disciplined, long-term investors, we caution against investing on political considerations.
Our companies performed well as the previous quarter’s unbridled optimism gave way to investors’ renewed focus on fundamentals. Because we base our investment decisions on the business trends and growth prospects of individual companies, we believe a market driven by company fundamentals plays to Wasatch’s strengths.
The cooling of enthusiasm was evident in the slowdown of asset flows into exchange-traded funds (ETFs). Net purchases of ETFs — especially sector ETFs in areas such as financials and materials — had spiked dramatically after the election last year.
DETAILSOFTHE QUARTER
One theme we’ve been following in recent years is the steady improvement in new-home construction since the last recession. Home prices have been growing faster than supply, an advantageous situation for companies operating in the space. Installed Building Products, Inc. fits neatly into that theme. The company installs insulation during the construction of new homes. Through a combination of organic growth and sensible acquisitions that have broadened its
footprint, the company has logged impressive growth with improving margins. Its stock price has followed, and Installed Building Products was a top contributor in the first quarter. LGI Homes, Inc. and Trex Co., Inc. are other holdings taking advantage of the growth in housing.
The strongest contributor to Fund performance was MakeMyTrip, the leading online travel agency (OTA) in India. The company’s stock price has been volatile in recent years, as intense competition impacted the profits of Indian OTAs. With its acquisition of competing firm the ibibo Group, MakeMyTrip appears to have emerged the winner. In major economies such as the U.S. and China, one or two OTAs have come to dominate the market. In our view, MakeMyTrip is that company in India.
The greatest detractor from Fund performance for the quarter was Ensign Group, Inc. The company provides health-care services in the post-acute care continuum. Shares of Ensign declined after quarterly earnings missed expectations and management lowered its earnings guidance for 2017. The Wasatch team continues to evaluate Ensign and we are in the process of finalizing our next steps.
Negative news affected shares of Argos Therapeutics, Inc., which develops personalized immunotherapies based on its proprietary platform. Argos saw its stock price tumble in February after an independent data monitoring committee recommended it discontinue a Phase-3 clinical trial of its lead drug candidate for the treatment of kidney cancer. In March, we sold the stock at a loss.
OUTLOOK
As the first quarter drew to a close, signs emerged that the recent optimism driving financial markets was beginning to show some cracks. The quarter’s significant divergence in the performance of large-cap and small-cap stocks indicated a lack of conviction in the market and potentially diminishing investor appetite for risk. Late strength in the prices of Treasury bonds, meanwhile, came amid safe-haven buying triggered by concerns about President Trump’s ability to make good on his campaign promises.
The “Trump rally” in equities has been predicated on the thesis that the president’s pro-growth agenda will lift the U.S. economy out of its post-crisis doldrums and provide businesses with tax and regulatory relief. Since markets appear to have already priced in accelerated growth rates, we think there is significant room for disappointment embedded in that view.
Though we would not be surprised to see additional near-term turbulence as political headlines continue to distract investors, we believe earnings drive stock prices over the long run. To the extent that price discovery in the equity market is guided by company fundamentals, we expect our investment approach to stand out. We continue to pursue our bottom-up process one company at a time, with the goal of finding businesses that are as insulated as possible from broader political and economic trends.
Thank you for the opportunity to manage your assets.
| | Current and future holdings are subject to risk. |
24
| | |
| WASATCH MICRO CAP FUND (WMICX) | | MARCH 31, 2017 (UNAUDITED) |
|
|
|
Portfolio Summary
AVERAGE ANNUAL TOTAL RETURNS
| | | | | | | | | | | | | | | | | | | | |
| | | SIX MONTHS* | | 1 YEAR | | 5 YEARS | | 10 YEARS |
Micro Cap | | | | 5.49% | | | | | 21.74% | | | | | 10.24% | | | | | 5.04% | |
Russell Microcap® Index | | | | 10.47% | | | | | 27.77% | | | | | 12.43% | | | | | 5.42% | |
Data shows past performance, which is not indicative of future performance. Current performance may be lower or higher than the performance quoted. To obtain the most recent month-end performance data available, please visit www.WasatchFunds.com. The Advisor may absorb certain Fund expenses, without which total return would have been lower. Investment returns and principal value will fluctuate and shares, when redeemed, may be worth more or less than their original cost.
As of the January 31, 2017 prospectus, the Total Annual Fund Operating Expenses for the Wasatch Micro Cap Fund are 1.67%. The expense ratio shown elsewhere in this report may be different. See the prospectus for additional information regarding Fund expenses.
Wasatch Funds will deduct a 2.00% redemption proceeds fee on Fund shares held 60 days or less. Performance data does not reflect the deduction of fees, including sales charges, or the taxes you would pay on fund distributions or the redemption of fund shares. Fees and taxes, if reflected, would reduce the performance quoted. Wasatch does not charge any sales fees. For more complete information including charges, risks and expenses, read the prospectus carefully.
Investing in micro cap funds will be more volatile and loss of principal could be greater than investing in large cap or more diversified funds. Investing in foreign securities, especially in emerging markets, entails special risks, such as currency fluctuations and political uncertainties, which are described in more detail in the prospectus.
TOP 10 EQUITY HOLDINGS**
| | | | |
| Company | | % of Net
Assets | |
| MakeMyTrip Ltd. (India) | | | 3.3% | |
| Natco Pharma Ltd. (India) | | | 2.9% | |
| LGI Homes, Inc. | | | 2.6% | |
| Installed Building Products, Inc. | | | 2.6% | |
| Superior Uniform Group, Inc. | | | 2.5% | |
| | | | |
| Company | | % of Net
Assets | |
| HealthEquity, Inc. | | | 2.5% | |
| Gruh Finance Ltd. (India) | | | 2.3% | |
| PDF Solutions, Inc. | | | 2.3% | |
| Ensign Group, Inc. (The) | | | 1.9% | |
| Tyler Technologies, Inc. | | | 1.9% | |
| ** | As of March 31, 2017, there were 86 holdings in the Fund. Foreign currency contracts, written options and repurchase agreements, if any, are not included in the number of holdings. Portfolio holdings are subject to change at any time. References to specific securities should not be construed as recommendations by the Funds or their Advisor. Current and future holdings are subject to risk. |
SECTOR BREAKDOWN†
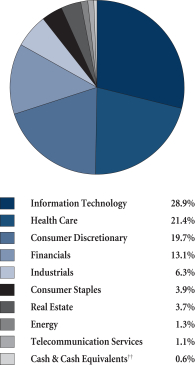
| † | Excludes securities sold short and options written, if any. |
| †† | Also includes Other Assets & Liabilities. |
GROWTHOFA HYPOTHETICAL $10,000 INVESTMENT
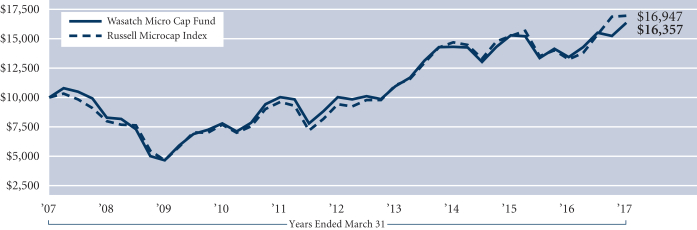
Past performance does not predict future performance. The graph above does not reflect the deduction of fees, sales charges, or taxes that you would pay on fund distributions or the redemption of fund shares. Wasatch does not charge any sales fees. The Russell Microcap Index is an unmanaged total return index of the smallest 1,000 securities in the small-cap Russell 2000 Index along with the next smallest 1,000 companies, based on a ranking of all U.S. equities by market capitalization. The Russell 2000 Index is an unmanaged total return index of the smallest 2,000 companies in the Russell 3000 Index, as ranked by total market capitalization. You cannot invest directly in these or any indices.
25
| | |
| WASATCH MICRO CAP VALUE FUND (WAMVX) | | MARCH 31, 2017 (UNAUDITED) |
|
|
|
Management Discussion
The Wasatch Micro Cap Value Fund is managed by a team of Wasatch portfolio managers led by Brian Bythrow.
| | |

Brian Bythrow, CFA Lead Portfolio Manager | | OVERVIEW Reversing the trend of the previous quarter, stocks of small companies underperformed large-cap stocks during the first three months of 2017. The benchmark Russell Microcap Index, which consists almost exclusively of U.S. stocks, rose 0.38%. Significant investments in international companies helped the Wasatch Micro Cap Value Fund outpace its benchmark with a return of 4.44%. |
International micro caps outgained their U.S. peers after lagging significantly during the prior quarter. With last year’s post-election rally having driven U.S. equity valuations to wide premiums over international stocks, the Fund benefited during the first quarter as international stocks narrowed the gap somewhat.
Financials were the Fund’s greatest source of outperformance, with the Fund posting a gain in the sector compared to the benchmark’s modest loss. A number of small banks in the Fund that had gotten left behind in previous periods performed well during the first quarter.
The information-technology (IT) sector was another source of Fund outperformance in what again appeared to be something of a “catch-up” move. Because IT companies tend to have lower tax rates than other companies, their stocks did not benefit as much from the enthusiasm investors showed last year for President Trump’s proposed tax cuts. With the delay of health-care legislation now making tax reform appear less certain, the appeal of IT relative to other sectors increased.
Health care was the top-performing sector of the benchmark. While the Fund’s health-care stocks performed nearly as well, its below-benchmark weighting in health care was a headwind to relative performance. This was especially evident in the biotechnology industry, as our value mandate and other investment criteria largely prevent us from owning biotechnology companies in the Fund.
Although rising interest rates typically are not good for stocks, financial markets reacted favorably when the U.S. Federal Reserve (Fed) voted to increase its overnight lending rate in March. The Fed’s statement averted fears of an acceleration in tightening and sent U.S. stocks higher. Though the market as a whole failed to hold those gains, the Fed’s less-aggressive outlook for raising short-term interest rates appeared to help some of our small-bank stocks. Lower short-term rates reduce the interest banks must pay to attract deposits, while the banks continue lending at higher, long-term rates.
DETAILSOFTHE QUARTER
The Fund’s strongest contributor to performance for the first quarter was Tucows, Inc. The company provides network access, domain names and other internet services. Shares of Tucows soared in January on news that it had
agreed to acquire another domain-name registrar. Its share price received an additional boost in March after the board of directors approved a $40 share buyback program. We trimmed the position to control its weighting in the Fund.
SiteOne Landscape Supply, Inc. was the second-largest contributor. The company is the largest and only national wholesale distributor of landscaping supplies in what is a highly fragmented U.S. market. Driven in part by an ongoing series of acquisitions, SiteOne’s growth has increased its purchasing power and generated economies of scale. The company saw its stock price rise in March when it released financial results and guidance that pleased investors.
The Fund’s greatest detractor from performance for the quarter was Horizon Global Corp. The company offers a range of towing and trailering equipment. We attribute an earnings shortfall primarily to integration costs stemming from its recent acquisition of the German company, Westfalia Mobil. Once Westfalia has been fully integrated, we expect higher margins and recent market-share gains to drive a significant increase in earnings for Horizon. We used first-quarter weakness in the stock as an opportunity to increase the Fund’s position.
Hudson Technologies, Inc. was the second-largest detractor. Hudson is a leading provider of innovative solutions to recurring problems within the refrigeration industry. Following Hudson’s secondary offering of stock last December, some investors speculated that the company would use the proceeds to fund an acquisition. Disappointed investors sold the stock during the first quarter when no such plans were announced.
OUTLOOK
The role of financials as the Fund’s greatest source of first-quarter outperformance relative to its benchmark was a welcome development. Financials not only account for a significant portion of the micro-cap universe, but micro-cap financial companies, especially small banks, are also an area of the market we consider highly compatible with Wasatch’s bottom-up investment approach.
During the nearly 14 years since the Fund’s inception on July 28, 2003 through March 31, 2017, financials contributed more to the Fund’s return than any other sector of the market. More recently, however, small banks have struggled as sluggish loan demand limited their growth and low long-term interest rates impacted their revenues and profitability.
With the housing market picking up and long-term interest rates on the rise in recent months, the outlook for small banks appears to be brightening. Based on long-term averages dating back to the 1950s, we believe there remains a deficit in the inventory of new homes, particularly as younger Americans cease living with their parents and form new households of their own. To the extent the spread between short-term and long-term interest rates continues to normalize, we expect to find more small banks that meet our criteria, which would allow us to invest in them.
Thank you for the opportunity to manage your assets.
| | Current and future holdings are subject to risk. |
26
| | |
| WASATCH MICRO CAP VALUE FUND (WAMVX) | | MARCH 31, 2017 (UNAUDITED) |
|
|
|
Portfolio Summary
AVERAGE ANNUAL TOTAL RETURNS
| | | | | | | | | | | | | | | | | | | | |
| | | SIX MONTHS* | | 1 YEAR | | 5 YEARS | | 10 YEARS |
Micro Cap Value | | | | 8.41% | | | | | 20.13% | | | | | 13.87% | | | | | 8.08% | |
Russell Microcap® Index | | | | 10.47% | | | | | 27.77% | | | | | 12.43% | | | | | 5.42% | |
Data shows past performance, which is not indicative of future performance. Current performance may be lower or higher than the performance quoted. To obtain the most recent month-end performance data available, please visit www.WasatchFunds.com. The Advisor may absorb certain Fund expenses, without which total return would have been lower. Investment returns and principal value will fluctuate and shares, when redeemed, may be worth more or less than their original cost.
As of the January 31, 2017 prospectus, the Total Annual Fund Operating Expenses for the Wasatch Micro Cap Value Fund are 1.84%. The expense ratio shown elsewhere in this report may be different. Expenses include direct expenses paid to the Advisor as well as indirect expenses incurred by the Fund as a result of its investments in other investment companies (each an “Acquired Fund”), before any expense reimbursements by the Advisor. See the prospectus for additional information regarding Fund expenses.
Wasatch Funds will deduct a 2.00% redemption proceeds fee on Fund shares held 60 days or less. Performance data does not reflect the deduction of fees, including sales charges, or the taxes you would pay on fund distributions or the redemption of fund shares. Fees and taxes, if reflected, would reduce the performance quoted. Wasatch does not charge any sales fees. For more complete information including charges, risks and expenses, read the prospectus carefully.
Investing in micro cap funds will be more volatile and loss of principal could be greater than investing in large cap or more diversified funds. Investments in value stocks can perform differently from the market as a whole and from other types of stocks and can continue to be undervalued by the market for long periods of time. Investing in foreign securities, especially in emerging markets, entails special risks, such as currency fluctuations and political uncertainties, which are described in more detail in the prospectus.
TOP 10 EQUITY HOLDINGS**
| | | | |
| Company | | % of Net
Assets | |
| Tower Semiconductor Ltd. (Israel) | | | 2.5% | |
| SiteOne Landscape Supply, Inc. | | | 1.6% | |
| Kingstone Cos., Inc. | | | 1.6% | |
| Investar Holding Corp. | | | 1.6% | |
| Tucows, Inc., Class A | | | 1.5% | |
| | | | |
| Company | | % of Net
Assets | |
| NV5 Global, Inc. | | | 1.4% | |
| Installed Building Products, Inc. | | | 1.4% | |
| Sunshine Bancorp, Inc. | | | 1.3% | |
| LGI Homes, Inc. | | | 1.3% | |
| Bombay Burmah Trading Co. (India) | | | 1.3% | |
| ** | As of March 31, 2017, there were 106 holdings in the Fund. Foreign currency contracts, written options and repurchase agreements, if any, are not included in the number of holdings. Portfolio holdings are subject to change at any time. References to specific securities should not be construed as recommendations by the Funds or their Advisor. Current and future holdings are subject to risk. |
SECTOR BREAKDOWN†
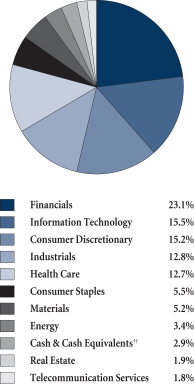
| † | Excludes securities sold short and options written, if any. |
| †† | Also includes Other Assets & Liabilities. |
GROWTHOFA HYPOTHETICAL $10,000 INVESTMENT
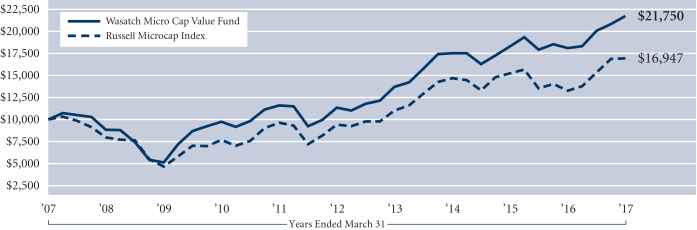
Past performance does not predict future performance. The graph above does not reflect the deduction of fees, sales charges, or taxes that you would pay on fund distributions or the redemption of fund shares. Wasatch does not charge any sales fees. The Russell Microcap Index is an unmanaged total return index of the smallest 1,000 securities in the small-cap Russell 2000 Index along with the next smallest 1,000 companies, based on a ranking of all U.S. equities by market capitalization. The Russell 2000 Index is an unmanaged total return index of the smallest 2,000 companies in the Russell 3000 Index, as ranked by total market capitalization. You cannot invest directly in these or any indices.
27
| | |
| WASATCH SMALL CAP GROWTH FUND (WAAEX / WIAEX) | | MARCH 31, 2017 (UNAUDITED) |
|
|
|
Management Discussion
The Wasatch Small Cap Growth Fund is managed by a team of Wasatch portfolio managers led by JB Taylor and Jeff Cardon.
| | | | |
JB Taylor Lead Portfolio Manager | | 
Jeff Cardon, CFA Portfolio Manager | | OVERVIEW The Wasatch Small Cap Growth Fund — Investor Class produced a gain of 5.35% during the first quarter of 2017 and matched the performance of its benchmark, the Russell 2000 |
Growth Index. The Fund outperformed the Russell 2000 Index, which gained 2.47%.
For much of the quarter, the rally ignited by the election of Donald Trump continued as investors focused on the benefits promised by his administration: less regulation, lower taxes, increased infrastructure spending and revamped international trade agreements. That said, the specific winners and losers during the first quarter were notably different from those of the previous quarter.
In the closing weeks of last year, investors keyed on value-oriented cyclical companies such as those in the energy and industrials sectors — companies that were perceived to be prime beneficiaries of promised Trump administration policies. These companies could be counted on to profit from increased infrastructure spending and continued strengthening of the economy. Similarly, financial-services companies did well during the fourth quarter of 2016, gaining on the promise of lighter regulation.
Overlooked during the fourth quarter of 2016 were many of the high-quality, growth-oriented stocks that we favor. But this changed in 2017 as information-technology companies that lagged during the opening months of the rally turned around in the first quarter and posted significant gains.
Our holdings in international companies were strong contributors during the quarter. Of note was our exposure to India, our largest country weight outside the U.S. and the Fund’s top-performing country during the quarter.
DETAILSOFTHE QUARTER
India’s online travel agency MakeMyTrip Ltd. was the top contributor to Fund performance during the first quarter. MakeMyTrip is the leading online travel agency (OTA) in India. The company’s stock price has been volatile in recent years, as intense competition negatively affected the profits of Indian OTAs. Based on its recent merger with the ibibo Group, however, MakeMyTrip appears to have emerged as the winner of that competition and is well-positioned in our view to benefit from increased usage of online travel booking — which currently represents only about 20% of the massive $60 billion Indian travel market.
Global biotech company Seattle Genetics, Inc. was another top contributor for the three-month period. The main news driving the performance of the stock was management’s announcement of an agreement with Immunomedics* to
gain exclusive world-wide rights to develop and sell sacituzumab govitecan, an antibody-drug conjugate used to treat solid cancer tumors. However, not all of Immunomedics’ investors are enamored of the deal and a battle to stop the agreement has ensued. We’re closely monitoring developments in the case.
A leading detractor from Fund performance during the first quarter was Ensign Group, Inc. The company operates facilities providing skilled nursing and rehabilitative care services and offers home health and hospice services in the U.S. Shares of Ensign declined after quarterly earnings missed expectations and management lowered earnings guidance for 2017.
Shares of air carriers Spirit Airlines, Inc. and Allegiant Travel Co. have continued to bounce around, ending the first quarter on the downside. During the period, President Trump’s travel ban sent shockwaves throughout the travel industry. Investors may also have been expressing concern that the addition of capacity at larger airlines could have a negative effect on fares. Nonetheless, we continue to be impressed that these air carriers have created successful, long-duration businesses by serving value-conscious flyers.
OUTLOOK
During the past several months, the market has generally rallied on the hope that President Trump’s agenda will accelerate economic growth. At the same time, there’s evidence that regardless of what happens with the president’s agenda, the economy has been doing better for quite some time. Macro indicators have continued to look encouraging. Unemployment has been down, while jobs data and average hourly earnings have been rising. Even inflation — for the time being — has been ticking up. And the Institute for Supply Management’s manufacturing index showed further expansion in March.
Having said all this, there’s a historical context to consider. Namely, with disruptive political events — including the presidential impeachments in Brazil and South Korea, the harsh political rhetoric regarding Mexico, the continuing progression of Brexit, and the tumultuous debut of Donald Trump — dominating news coverage during the quarter, many investors are considering whether or not to maintain exposure to the financial markets.
When we look at the markets in the wake of these events, however, we see that the actual performance has generally been strong — possibly to the contrary of what we would have predicted ahead of time. In other words, even if we had had a crystal ball we might not have been able to time the markets very well.
For our part, we intend to stay invested while maintaining our vigilance — focusing on what we can control. That means searching for reasonably priced, high-quality companies that can grow their revenues and earnings for long durations.
Thank you for the opportunity to manage your assets.
| * | As of March 31, 2017, the Wasatch Small Cap Growth Fund was not invested in Immunomedics, Inc. |
| | Current and future holdings are subject to risk. |
28
| | |
| WASATCH SMALL CAP GROWTH FUND (WAAEX / WIAEX) | | MARCH 31, 2017 (UNAUDITED) |
|
|
|
Portfolio Summary
AVERAGE ANNUAL TOTAL RETURNS
| | | | | | | | | | | | | | | | | | | | |
| | | SIX MONTHS* | | 1 YEAR | | 5 YEARS | | 10 YEARS |
Small Cap Growth (WAAEX) — Investor | | | | 4.77% | | | | | 15.46% | | | | | 8.64% | | | | | 7.53% | |
Small Cap Growth (WIAEX) — Institutional | | | | 4.91% | | | | | 15.77% | | | | | 8.70% | | | | | 7.56% | |
Russell 2000® Growth Index | | | | 9.11% | | | | | 23.03% | | | | | 12.10% | | | | | 8.06% | |
Russell 2000® Index | | | | 11.52% | | | | | 26.22% | | | | | 12.35% | | | | | 7.12% | |
Data shows past performance, which is not indicative of future performance. Current performance may be lower or higher than the performance quoted. To obtain the most recent month-end performance data available, please visit www.WasatchFunds.com. The Advisor may absorb certain Fund expenses, without which total return would have been lower. Investment returns and principal value will fluctuate and shares, when redeemed, may be worth more or less than their original cost.
As of the January 31, 2017 prospectus, the Total Annual Fund Operating Expenses for the Wasatch Small Cap Growth Fund are Investor Class: 1.30% / Institutional Class — Gross: 1.12%, Net: 1.06%. The expense ratio shown elsewhere in this report may be different. Expenses include direct expenses paid to the Advisor as well as indirect expenses incurred by the Fund as a result of its investments in other investment companies (each an “Acquired Fund”), before any expense reimbursements by the Advisor. Net expenses are based on Fund expenses, net of waivers and reimbursements. See the prospectus for additional information regarding Fund expenses.
Wasatch Funds will deduct a 2.00% redemption proceeds fee on Fund shares held 60 days or less. Performance data does not reflect the deduction of fees, including sales charges, or the taxes you would pay on fund distributions or the redemption of fund shares. Fees and taxes, if reflected, would reduce the performance quoted. Wasatch does not charge any sales fees. For more complete information including charges, risks and expenses, read the prospectus carefully.
Performance for the Institutional Class prior to 2/1/2016 is based on the performance of the Investor Class. Performance of the Fund’s Institutional Class prior to 2/1/2016 uses the actual expenses of the Fund’s Investor Class without any adjustments. For any such period of time, the performance of the Fund’s Institutional Class would have been substantially similar to, yet higher than, the performance of the Fund’s Investor Class, because the shares of both classes are invested in the same portfolio of securities, but the classes bear different expenses.
Investing in small cap funds will be more volatile and loss of principal could be greater than investing in large cap or more diversified funds. Investing in foreign securities, especially in emerging markets, entails special risks, such as currency fluctuations and political uncertainties, which are described in more detail in the prospectus.
TOP 10 EQUITY HOLDINGS**
| | | | |
| Company | | % of Net
Assets | |
Copart, Inc. | | | 3.7% | |
Ultimate Software Group, Inc. (The) | | | 3.6% | |
Knight Transportation, Inc. | | | 3.6% | |
Cavium, Inc. | | | 3.1% | |
Aramex PJSC (United Arab Emirates) | | | 2.8% | |
| | | | |
| Company | | % of Net
Assets | |
Cornerstone OnDemand, Inc. | | | 2.8% | |
ICON plc (Ireland) | | | 2.7% | |
Spirit Airlines, Inc. | | | 2.6% | |
WESCO International, Inc. | | | 2.4% | |
HEICO Corp., Class A | | | 2.3% | |
| ** | As of March 31, 2017, there were 94 holdings in the Fund. Foreign currency contracts, written options and repurchase agreements, if any, are not included in the number of holdings. Portfolio holdings are subject to change at any time. References to specific securities should not be construed as recommendations by the Funds or their Advisor. Current and future holdings are subject to risk. |
SECTOR BREAKDOWN†
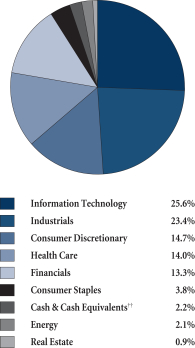
| † | Excludes securities sold short and options written, if any. |
| †† | Also includes Other Assets & Liabilities. |
GROWTHOFA HYPOTHETICAL $10,000 INVESTMENT
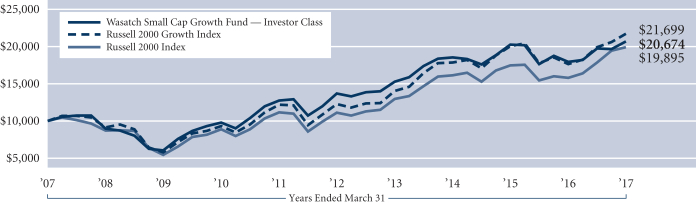
Past performance does not predict future performance. The graph above does not reflect the deduction of fees, sales charges, or taxes that you would pay on fund distributions or the redemption of fund shares. Wasatch does not charge any sales fees. The Russell 2000 Growth Index is an unmanaged total return index that measures the performance of those Russell 2000 Index companies with higher price-to-book ratios and higher forecasted growth values. The Russell 2000 Index is an unmanaged total return index of the smallest 2,000 companies in the Russell 3000 Index, as ranked by total market capitalization. The Russell 2000 Index is widely regarded in the industry as accurately capturing the universe of small company stocks. You cannot invest directly in these or any indices.
29
| | |
| WASATCH SMALL CAP VALUE FUND (WMCVX / WICVX) | | MARCH 31, 2017 (UNAUDITED) |
|
|
|
Management Discussion
The Wasatch Small Cap Value Fund is managed by a team of Wasatch portfolio managers led by Jim Larkins.
| | |

Jim Larkins Lead Portfolio Manager | | OVERVIEW Small-cap value stocks experienced uneven performance to start the year. The Russell 2000 Value Index finished in the red with a small loss of -0.13%. The Wasatch Small Cap Value Fund — Investor Class fared better and finished the quarter up 2.40%. As the quarter progressed, the “Trump rally” that dominated performance in late 2016 and early this year began to wane as investors grew less optimistic about the |
prospects for meaningful policy changes. One result of this shift was that many of the deeper value stocks that surged in the immediate aftermath of the election gave back some of their gains, while higher quality value stocks showed more resilience. Although this trend was a headwind for the small-cap value group as a whole, it proved helpful for the Fund given our tilt toward faster-growing companies within the value category. Over time, we have found that a focus on such companies can contribute to outstanding long-term returns by improving the quality profile of the Fund.
DETAILSOFTHE QUARTER
Our emphasis on “growthier” value stocks has been visible in our overweight positions in the information-technology and health-care sectors, the two best-performing segments of the benchmark in the quarter. We find both areas to be home to many of the Fallen Angels — growth stocks that have temporarily stumbled and fallen into the value category — we typically seek.
Health care and information technology were also home to a number of our top individual stock performers in the period. Exact Sciences Corp. surged on the strength of the rapid adoption — and growing insurance coverage — for its non-invasive test for detecting colon cancer. Air Methods Corp., a provider of medical air transportation, also added substantial value after being acquired by a private equity fund at a healthy premium.
A notable winner in information technology in the quarter was Virtusa Corp., an outsourcing company whose shares weakened in 2016 due to an acquisition that was poorly received by the markets. Seeing this as a classic “Fallen Angel” opportunity, we established a position at discounted levels. After some initial weakness following our purchase, the stock rebounded nicely as the company’s profit margins began to recover.
Real estate investment trusts (REITs) Sabra Health Care REIT, Inc. and Arbor Realty Trust, Inc. made healthy contributions to the Fund’s three-month return. Our approach to investing in REITs is to focus on companies that we believe have exceptional management teams or misunderstood opportunities. This approach paid off during the first quarter.
The Fund’s Indian holdings also performed well. Our Indian weight is focused in two well-run and fast-growing banks, Yes Bank Ltd. and City Union Bank Ltd. We believe these companies give us high quality exposure to the significant growth being generated by the emergence of India’s middle class.
On the negative side, we lost some performance from our investment in Ensign Group, Inc., whose results have been pressured by an unfavorable acquisition. Our extensive due diligence has given us confidence that Ensign’s management team has a plan to fix the issue and get the company back on track. We elected to maintain the position. Other notable detractors were Atlas Financial Holdings, Inc., an insurance company hurt by an unexpected loss, and World Fuel Services Corp., which has above-average sensitivity to energy prices.
OUTLOOKAND POSITIONING
We’re pleased to see that the unusual divergences in style and sector returns that accompanied the post-election rally have begun to wane as investors have demonstrated renewed focus on individual company fundamentals. Many stocks experienced unusually large moves in late 2016, and the softer market performance during the first three months of 2017 provided us with the opportunity to adjust the Fund’s emphasis. While we continue to search for faster-growing stocks in the value asset class, we also recognize that growth has outpaced value by a comfortable margin on a rolling five- and 10-year basis. This was reflected in our recent decisions to trim positions in growth areas that may have less upside, such as software and biotechnology.
At the same time, we have begun to identify a compelling opportunity set among more value-oriented companies, and the industrials sector as a particular source of investment ideas. Although the U.S. economy as a whole has been experiencing improving growth, capital expenditures and industrial production have remained below the long-term trend. We think this divergence is set to reverse, as the downtrend in both areas has moved well beyond the historical average in terms of duration. Additionally, our bottom-up research has shown a pick-up in orders among industrial companies. In our view, this indicates the potential for increased earnings across the sector — a shift that has yet to be fully reflected in the prices of many individual stocks.
Our modest shift from more fully valued information-technology and health-care stocks toward industrials helps illustrate the potential benefit of our diversified method of small-cap investing. Please keep in mind that diversification does not eliminate the risk of experiencing investment losses. We believe our broad-based approach, together with our emphasis on owning higher-quality companies and managing downside risk, provides us with the flexibility to capitalize on the full range of opportunities across the small-cap value category.
Thank you for the opportunity to manage your assets.
| | Current and future holdings are subject to risk. |
30
| | |
| WASATCH SMALL CAP VALUE FUND (WMCVX / WICVX) | | MARCH 31, 2017 (UNAUDITED) |
|
|
|
Portfolio Summary
AVERAGE ANNUAL TOTAL RETURNS
| | | | | | | | | | | | | | | | | | | | |
| | | SIX MONTHS* | | 1 YEAR | | 5 YEARS | | 10 YEARS |
Small Cap Value (WMCVX) — Investor | | | | 9.91% | | | | | 25.69% | | | | | 13.72% | | | | | 6.66% | |
Small Cap Value (WICVX) — Institutional | | | | 9.88% | | | | | 25.76% | | | | | 13.80% | | | | | 6.73% | |
Russell 2000® Value Index | | | | 13.93% | | | | | 29.37% | | | | | 12.54% | | | | | 6.09% | |
Russell 2000® Index | | | | 11.52% | | | | | 26.22% | | | | | 12.35% | | | | | 7.12% | |
Data shows past performance, which is not indicative of future performance. Current performance may be lower or higher than the performance quoted. To obtain the most recent month-end performance data available, please visit www.WasatchFunds.com. The Advisor may absorb certain Fund expenses, without which total return would have been lower. Investment returns and principal value will fluctuate and shares, when redeemed, may be worth more or less than their original cost.
As of the January 31, 2017 prospectus, the Total Annual Fund Operating Expenses for the Wasatch Small Cap Value Fund are Investor Class: 1.45% / Institutional Class — Gross: 1.41%, Net: 1.26%. The expense ratio shown elsewhere in this report may be different. Expenses include direct expenses paid to the Advisor as well as indirect expenses incurred by the Fund as a result of its investments in other investment companies (each an “Acquired Fund”), before any expense reimbursements by the Advisor. Net expenses are based on Fund expenses, net of waivers and reimbursements. See the prospectus for additional information regarding Fund expenses.
Wasatch Funds will deduct a 2.00% redemption proceeds fee on Fund shares held 60 days or less. Performance data does not reflect the deduction of fees, including sales charges, or the taxes you would pay on fund distributions or the redemption of fund shares. Fees and taxes, if reflected, would reduce the performance quoted. Wasatch does not charge any sales fees. For more complete information including charges, risks and expenses, read the prospectus carefully.
Performance for the Institutional Class prior to 1/31/2012 is based on the performance of the Investor Class. Performance of the Fund’s Institutional Class prior to 1/31/2012 uses the actual expenses of the Fund’s Investor Class without any adjustments. For any such period of time, the performance of the Fund’s Institutional Class would have been substantially similar to, yet higher than, the performance of the Fund’s Investor Class, because the shares of both classes are invested in the same portfolio of securities, but the classes bear different expenses.
Investing in small cap funds will be more volatile and loss of principal could be greater than investing in large cap or more diversified funds. Investments in value stocks can perform differently from the market as a whole and from other types of stocks and can continue to be undervalued by the market for long periods of time. Investing in foreign securities, especially in emerging markets, entails special risks, such as currency fluctuations and political uncertainties, which are described in more detail in the prospectus.
TOP 10 EQUITY HOLDINGS**
| | | | |
| Company | | % of Net
Assets | |
| Arbor Realty Trust, Inc. | | | 3.1% | |
| HEICO Corp., Class A | | | 3.1% | |
| LGI Homes, Inc. | | | 2.7% | |
| Ensign Group, Inc. (The) | | | 2.7% | |
| Sabra Health Care REIT, Inc. | | | 2.5% | |
| | | | |
| Company | | % of Net
Assets | |
Pinnacle Financial Partners, Inc. | | | 2.5% | |
Solar Capital Ltd. | | | 2.4% | |
Tower Semiconductor Ltd. (Israel) | | | 2.4% | |
Webster Financial Corp. | | | 2.4% | |
Ebix, Inc. | | | 2.3% | |
| ** | As of March 31, 2017, there were 58 holdings in the Fund. Foreign currency contracts, written options and repurchase agreements, if any, are not included in the number of holdings. Portfolio holdings are subject to change at any time. References to specific securities should not be construed as recommendations by the Funds or their Advisor. Current and future holdings are subject to risk. |
SECTOR BREAKDOWN†
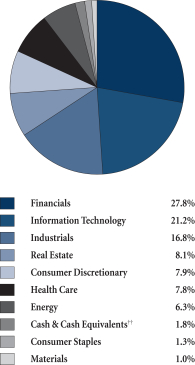
| † | Excludes securities sold short and options written, if any. |
| †† | Also includes Other Assets & Liabilities. |
GROWTHOFA HYPOTHETICAL $10,000 INVESTMENT
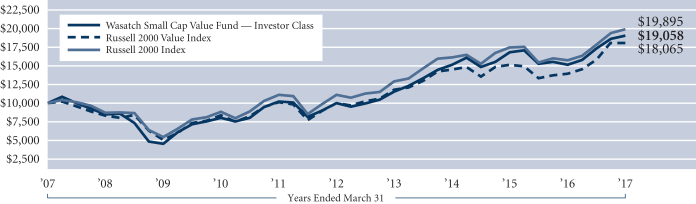
Past performance does not predict future performance. The graph above does not reflect the deduction of fees, sales charges, or taxes that you would pay on fund distributions or the redemption of fund shares. Wasatch does not charge any sales fees. The Russell 2000 Value Index measures the performance of those Russell 2000 Index companies with lower price-to-book ratios and lower forecasted growth values. The Russell 2000 Index is an unmanaged total return index of the smallest 2,000 companies in the Russell 3000 Index, as ranked by total market capitalization. The Russell 2000 Index is widely regarded in the industry as accurately capturing the universe of small company stocks. You cannot invest directly in these or any indices.
31
| | |
| WASATCH STRATEGIC INCOME FUND (WASIX) | | MARCH 31, 2017 (UNAUDITED) |
|
|
|
Management Discussion
The Wasatch Strategic Income Fund is managed by a team of Wasatch portfolio managers led by Sam Stewart.
| | |
Samuel S. Stewart, Jr. PhD, CFA Lead Portfolio Manager | | OVERVIEW During the first quarter of 2017, the Wasatch Strategic Income Fund put further distance between the present and 2015’s disastrous third quarter. The Fund experienced a boring 4.63% return this quarter, which was on target in all ways. The Fund’s first quarter return was between the 6.07% return of the S&P 500 Index (the Fund’s stock benchmark) and the 0.82% return of the Bloomberg Barclays US Aggregate Bond Index (the |
Fund’s bond benchmark). The Fund’s one-year return was well above our high single-digit target.
DETAILSOFTHE PERIOD
For the quarter, Comcast Corp. and Herbalife Ltd. each contributed about 0.6 of a percentage point to performance, while no stock subtracted as much as 0.4 of a percentage point. These days Comcast has been experiencing success after success with strength in both its data and cable subscriptions as well as positive results in its NBC television, movie and theme park businesses. Herbalife’s performance during the quarter was a rebound from the prior quarter as investors became more convinced that the company has a viable business model.
The Fund’s performance over the trailing 12 months was as successful as its performance over the most recent quarter, with a return of 11.53%. This return was also between its stock benchmark’s return of 17.17% and its bond benchmark’s return of 0.44% and was ahead of our high single-digit return goal. Comcast contributed over 1.6 percentage points to this performance for many of the same reasons it was a strong contributor to performance in the first quarter. CBS Corp. added just over one percentage point to the Fund’s return as its programming continues to garner top ratings and advertising sales strengthened. Unfortunately, Medallion Financial Corp. was a significant black mark that cost the Fund nearly two percentage points over the past year. The driver of these poor returns was ever weaker taxi medallion values. Although I pared the holding by 80% during the year, I did not sell it soon enough or fast enough. We continue to hold a small weight in the Fund because Medallion Financial’s stock sells for less than 20% of its book value, which should leave ample room for further markdowns on its taxi medallion loans.
I always think it is useful to consider the Fund’s performance over the trailing three years because this period is long enough to smooth out some of the market’s periodic ups and downs. Our results over the past three years were not as strong as those for the more recent periods, which were detailed above. While the Fund’s trailing three-year return of 2.91% was between the 10.37% return of its stock benchmark and the 2.68% return of its bond benchmark, it
fell well short of our high single-digit return goal. As discussed in past commentaries, the culprit continued to be the weak performance during the third quarter of 2015. Out of curiosity, I examined the Fund’s performance over the past three years excluding that weak quarter. It was an almost spot on perfect 7.9%, which was right between our stock and bond benchmarks, and squarely within on our high single-digit return target.
The main reason I continue to comment on the poor 2015 third quarter is because it may represent a preview of the next downturn. If so, I did not like what I saw and I expect you, as a shareholder, did not either. For this reason, I’ve taken two actions to avoid a repeat of that quarter. The first (as discussed in prior reports) was to increase the Fund’s cash holdings to nearly 20%. The second was to increase the number of holdings demonstrating both the ability and willingness to pay a growing stream of dividends. Our modified portfolio has exhibited a much lower beta (defined as sensitivity to market volatility) of just over 0.5, which is just about half of what it was in 2015.
As a reminder, the Fund’s near 20% cash position is not an attempt to time the market by getting out ahead of a decline. Instead, the heavy cash weighting is intended to add ballast so that the Fund may travel a steadier path in volatile markets.
While both our heavy cash and shift toward emphasizing dividend growth have pared the dividend yield of the Fund, it still continues to provide a 30-day SEC yield of near 2%.*
OUTLOOK
I continue to structure the Fund for a “steady as she goes” economic environment. The enthusiasm the market exhibited for President Trump’s proposed economic policies has begun to fade as the difficulty of successfully implementing them has become apparent. However, the economy continues to show signs of health, if not vigor. While many stock prices are extended, I believe that it will take a more substantial increase in interest rates than we have experienced to date to knock those high stock prices down. I don’t see enough strength in the economy to support materially higher rates…yet. The conservatism of the Fund should stand it in good stead as we navigate future economic waves.
Thank you for the opportunity to manage your assets.
| * | The Fund’s 30-day SEC Yield was 1.78% as of March 31, 2017. |
| | Current and future holdings are subject to risk. |
32
| | |
| WASATCH STRATEGIC INCOME FUND (WASIX) | | MARCH 31, 2017 (UNAUDITED) |
|
|
|
Portfolio Summary
AVERAGE ANNUAL TOTAL RETURNS
| | | | | | | | | | | | | | | | | | | | |
| | | SIX MONTHS* | | 1 YEAR | | 5 YEARS | | 10 YEARS |
Strategic Income | | | | 6.00% | | | | | 11.53% | | | | | 8.94% | | | | | 5.50% | |
S&P 500® Index | | | | 10.12% | | | | | 17.17% | | | | | 13.30% | | | | | 7.51% | |
Bloomberg Barclays US Aggregate Bond Index | | | | -2.18% | | | | | 0.44% | | | | | 2.34% | | | | | 4.27% | |
Data shows past performance, which is not indicative of future performance. Current performance may be lower or higher than the performance quoted. To obtain the most recent month-end performance data available, please visit www.WasatchFunds.com. The Advisor may absorb certain Fund expenses, without which total return would have been lower. Investment returns and principal value will fluctuate and shares, when redeemed, may be worth more or less than their original cost.
As of the January 31, 2017 prospectus, the Total Annual Fund Operating Expenses for the Wasatch Strategic Income Fund are Gross: 1.76%, Net: 1.67%. The expense ratio shown elsewhere in this report may be different. Expenses include direct expenses paid to the Advisor as well as indirect expenses incurred by the Fund as a result of its investments in other investment companies (each an “Acquired Fund”), before any expense reimbursements by the Advisor. Net expenses are based on Fund expenses, net of waivers and reimbursements. See the prospectus for additional information regarding Fund expenses.
Wasatch Funds will deduct a 2.00% redemption proceeds fee on Fund shares held 60 days or less. Performance data does not reflect the deduction of fees, including sales charges, or the taxes you would pay on fund distributions or the redemption of fund shares. Fees and taxes, if reflected, would reduce the performance quoted. Wasatch does not charge any sales fees. For more complete information including charges, risks and expenses, read the prospectus carefully.
The Fund has a concentration in the financials sector. Investing in concentrated funds can be more volatile and loss of principal could be greater than investing in more diversified funds. The financials sector can be significantly affected by various market factors, which are described in more detail in the prospectus.
With respect to the Fund’s assets invested in fixed income securities, you are subject, but not limited to, the same interest rate, inflation and credit risk associated with the underlying fixed-income securities owned by the Fund. Return of principal is not guaranteed. Investing in small cap funds will be more volatile and loss of principal could be greater than investing in large cap or more diversified funds. Investing in foreign securities, especially in emerging markets, entails special risks, such as currency fluctuations and political uncertainties, which are described in more detail in the prospectus.
TOP 10 EQUITY HOLDINGS**
| | | | |
| Company | | % of Net
Assets | |
| Comcast Corp., Class A | | | 6.8% | |
| CBS Corp., Class B | | | 4.0% | |
| MasterCard, Inc., Class A | | | 3.7% | |
| Visa, Inc., Class A | | | 3.6% | |
| Walgreens Boots Alliance, Inc. | | | 3.6% | |
| | | | |
| Company | | % of Net
Assets | |
| Herbalife Ltd. | | | 3.5% | |
| Suncor Energy, Inc. (Canada) | | | 3.5% | |
| Magellan Midstream Partners L.P. | | | 3.4% | |
| Canadian National Railway Co. (Canada) | | | 3.0% | |
| CVS Health Corp. | | | 3.0% | |
| ** | As of March 31, 2017, there were 52 holdings in the Fund. Foreign currency contracts, written options and repurchase agreements, if any, are not included in the number of holdings. Portfolio holdings are subject to change at any time. References to specific securities should not be construed as recommendations by the Funds or their Advisor. Current and future holdings are subject to risk. |
SECTOR BREAKDOWN†

| † | Excludes securities sold short and options written, if any. |
| †† | Also includes Other Assets & Liabilities. |
GROWTHOFA HYPOTHETICAL $10,000 INVESTMENT
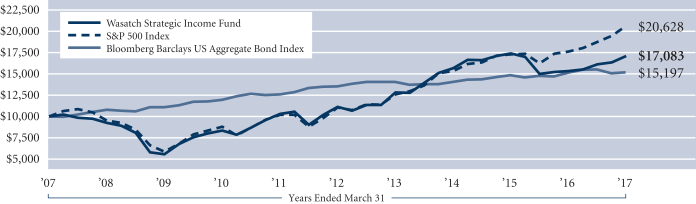
Past performance does not predict future performance. The graph above does not reflect the deduction of fees, sales charges, or taxes that you would pay on fund distributions or the redemption of fund shares. Wasatch does not charge any sales fees. The S&P 500 Index represents 500 of the United States’ largest stocks from a broad variety of industries. The Index is unmanaged and is a commonly used measure of common stock total return performance. The Bloomberg Barclays US Aggregate Bond Index is a broad-based flagship benchmark that measures the investment grade, US dollar denominated, fixed-rate taxable bond market. The index includes Treasuries, government-related and corporate securities, MBS (agency fixed-rate and hybrid ARM pass-throughs), ABS and CMBS (agency and non-agency). You cannot invest directly in these or any indices.
33
| | |
| WASATCH ULTRA GROWTH FUND (WAMCX) | | MARCH 31, 2017 (UNAUDITED) |
|
|
|
Management Discussion
The Wasatch Ultra Growth Fund is managed by a team of Wasatch portfolio managers led by John Malooly.
| | |

John Malooly, CFA Lead Portfolio Manager | | OVERVIEW In what was a positive first quarter for small-cap stocks, the Wasatch Ultra Growth Fund gained 7.68% and outpaced its benchmark, the Russell 2000 Growth Index, which rose 5.35%. Equity prices during the first three months of 2017 were driven more by fundamentals and less by the sharp swings in sentiment that had dominated the prior quarter. Our investment discipline gained traction as the |
realities of Washington politics tempered earlier optimism. In a reversal from the previous quarter, growth stocks outperformed value stocks by a significant margin, which benefited our style of investing in fast-growing companies. Health care and information technology, which had been fourth-quarter underperformers, were among the strongest sectors of the Index. In yet another about-face, stocks of small companies lagged large-cap issues. Even so, our stocks performed well and the Fund surpassed the benchmark’s return.
Stocks advanced amid signs of improving global economic conditions. Favorable economic data from Europe and China provided a positive backdrop for equities, both at home and abroad. U.S. job growth was steady, while inflation remained subdued.
Bolstered by expectations that President Trump’s policies would lead to faster growth in the U.S., measures of consumer and business confidence rose. In March, both the Conference Board’s index of consumer sentiment and the University of Michigan’s Consumer Sentiment Index surged to their highest readings in over 16 years. Small-business optimism, meanwhile, hovered near its highest level in 43 years according to an index maintained by the National Federation of Independent Business.
DETAILSOFTHE QUARTER
Exact Sciences Corp., a biotechnology company with an innovative test for colon cancer, was the Fund’s top contributor to performance for the quarter. The test, named Cologuard,® utilizes a stool sample instead of a colonoscopy. Citing accelerating demand for Cologuard, the company reported a 144% jump in revenue and a narrower-than-expected loss in its most-recent quarter. Shares of Exact Sciences got an additional boost in late March after a large health insurer added Cologuard to a list of covered tests.
Another strong contributor was MakeMyTrip Ltd., the leading online travel agency in India. The company’s focus on hotel bookings and customized holiday packages — both of which command higher margins than air ticketing — appears to be paying off.
A string of negative news impacted shares of Argos Therapeutics, Inc., which develops personalized immunotherapies based on its proprietary platform. Argos saw its stock price tumble in February after an independent data monitoring
committee recommended it discontinue a Phase-3 clinical trial of its lead drug candidate for the treatment of kidney cancer. We sold the stock in March after the company disclosed in its annual report that it needs to raise additional capital to continue operations, and that filing for bankruptcy might be an option.
Medical-technology company ConforMIS, Inc. was also a significant first-quarter detractor. ConforMIS uses its proprietary platform to customize joint-replacement implants to fit each patient’s unique anatomy. Although revenues at ConforMIS topped Wall Street forecasts in its most-recently reported quarter, the company’s loss was wider than expected. Nonetheless, we think the company’s differentiated product and strong clinical results continue to make ConforMIS a worthwhile holding for the Fund.
OUTLOOK
While accurately forecasting future economic and political events is challenging enough under even the best of circumstances, we believe the current situation makes such predictions even more uncertain. Although the U.S. stock market appears to be pricing in a significant pickup in economic growth, leading economists think otherwise. According to a summary contained in the minutes of the Federal Open Market Committee’s March meeting, the Fed expects real gross domestic product (GDP) to expand around 2.1% in 2017. Compare that to the most-recent forecast maintained by the Atlanta Federal Reserve — which as of March 31st predicted that the economy grew at just 0.9% during the first quarter. Those rather tepid forecasts appear to be at odds with recent record highs in consumer and business confidence.
Predictions within the political realm are not any easier. It was, in fact, the inability of investors to foresee President Trump’s victory that led to the post-election “Trump rally” in equities. Similarly, it’s highly uncertain whether the GOP’s recent failure to secure passage of the American Health Care Act will serve as a wake-up call to unify, or instead signifies future difficulties in enacting a coherent political agenda.
Suffice it to say, we don’t view financial markets through the lens of macroeconomics or politics. Instead, we focus on the fundamental business trends and growth prospects of individual companies. We’re economically and politically aware, and we incorporate relevant external factors into our company models. But we don’t allow politics or macroeconomics to drive our investment process. They’re just too unpredictable in our opinion to invest our shareholders’ money that way.
The rapid pace of technological change is allowing small, innovative companies to disrupt the businesses of older and often larger competitors. The focus of our bottom-up investment approach is to invest in the companies doing the disrupting, while avoiding those that are getting disrupted. By identifying companies that are gaining market share, we aim to keep the Fund filled with high-quality businesses that have the potential to grow regardless of political and economic outcomes.
Thank you for the opportunity to manage your assets.
| | Current and future holdings are subject to risk. |
34
| | |
| WASATCH ULTRA GROWTH FUND (WAMCX) | | MARCH 31, 2017 (UNAUDITED) |
|
|
|
Portfolio Summary
AVERAGE ANNUAL TOTAL RETURNS
| | | | | | | | | | | | | | | | | | | | |
| | | SIX MONTHS* | | 1 YEAR | | 5 YEARS | | 10 YEARS |
Ultra Growth | | | | 5.16% | | | | | 26.00% | | | | | 10.62% | | | | | 6.69% | |
Russell 2000® Growth Index | | | | 9.11% | | | | | 23.03% | | | | | 12.10% | | | | | 8.06% | |
Data shows past performance, which is not indicative of future performance. Current performance may be lower or higher than the performance quoted. To obtain the most recent month-end performance data available, please visit www.WasatchFunds.com. The Advisor may absorb certain Fund expenses, without which total return would have been lower. Investment returns and principal value will fluctuate and shares, when redeemed, may be worth more or less than their original cost.
As of the January 31, 2017 prospectus, the Total Annual Fund Operating Expenses for the Wasatch Ultra Growth Fund are 1.43%. The expense ratio shown elsewhere in this report may be different. Expenses include direct expenses paid to the Advisor as well as indirect expenses incurred by the Fund as a result of its investments in other investment companies (each an “Acquired Fund”), before any expense reimbursements by the Advisor. See the prospectus for additional information regarding Fund expenses.
Wasatch Funds will deduct a 2.00% redemption proceeds fee on Fund shares held 60 days or less. Performance data does not reflect the deduction of fees, including sales charges, or the taxes you would pay on fund distributions or the redemption of fund shares. Fees and taxes, if reflected, would reduce the performance quoted. Wasatch does not charge any sales fees. For more complete information including charges, risks and expenses, read the prospectus carefully.
Investing in small cap funds will be more volatile and loss of principal could be greater than investing in large cap or more diversified funds. Investing in foreign securities, especially in emerging markets, entails special risks, such as currency fluctuations and political uncertainties, which are described in more detail in the prospectus.
TOP 10 EQUITY HOLDINGS**
| | | | |
| Company | | % of Net
Assets | |
| Ultimate Software Group, Inc. (The) | | | 3.1% | |
| Exact Sciences Corp. | | | 2.8% | |
| MakeMyTrip Ltd. (India) | | | 2.5% | |
| PDF Solutions, Inc. | | | 2.4% | |
| AtriCure, Inc. | | | 2.4% | |
| | | | |
| Company | | % of Net
Assets | |
| Waste Connections, Inc. (Canada) | | | 2.4% | |
| Freshpet, Inc. | | | 2.3% | |
| Sangamo BioSciences, Inc. | | | 2.2% | |
| Oxford Immunotec Global plc | | | 2.2% | |
| Paylocity Holding Corp. | | | 2.2% | |
| ** | As of March 31, 2017, there were 84 holdings in the Fund. Foreign currency contracts, written options and repurchase agreements, if any, are not included in the number of holdings. Portfolio holdings are subject to change at any time. References to specific securities should not be construed as recommendations by the Funds or their Advisor. Current and future holdings are subject to risk. |
SECTOR BREAKDOWN†

| † | Excludes securities sold short and options written, if any. |
| †† | Also includes Other Assets & Liabilities. |
GROWTHOFA HYPOTHETICAL $10,000 INVESTMENT
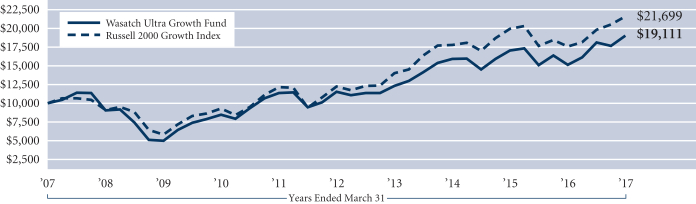
Past performance does not predict future performance. The graph above does not reflect the deduction of fees, sales charges, or taxes that you would pay on fund distributions or the redemption of fund shares. Wasatch does not charge any sales fees. The Russell 2000 Growth Index is an unmanaged total return index that measures the performance of those Russell 2000 Index companies with higher price-to-book ratios and higher forecasted growth values. The Russell 2000 Index is an unmanaged total return index of the smallest 2,000 companies in the Russell 3000 Index, as ranked by total market capitalization. You cannot invest directly in these or any indices.
35
| | |
| WASATCH WORLD INNOVATORS FUND (WAGTX / WIGTX) | | MARCH 31, 2017 (UNAUDITED) |
|
|
|
Management Discussion
The Wasatch World Innovators Fund is managed by a team of Wasatch portfolio managers led by Josh Stewart and Sam Stewart.
| | | | |

Josh Stewart Lead Portfolio Manager | |
Samuel S. Stewart, Jr. PhD, CFA Portfolio Manager | | OVERVIEW Global equity markets generated generally strong returns during the first three months of 2017. U.S. stocks advanced, but less so than international markets as a whole. Major economies in both |
the developed and emerging categories experienced positive stock market performance. The benchmark MSCI All Country (AC) World Investable Markets Index rose 6.79% for the quarter. The Wasatch World Innovators Fund — Investor Class gained 6.36%.
During the final months of 2016, one of the big market stories was the soaring U.S. dollar, in part propelled by investor optimism about pro-growth policies from the incoming Trump administration. The first months of 2017 tempered some of that optimism, and the dollar gave up some of its gains against a basket of foreign currencies. Given the Fund’s tilt toward international stocks, this change in the dollar’s direction benefited returns relative to the benchmark.
The Fund’s performance was weighed down by a handful of individual investments, mostly in the U.S. and the United Kingdom (U.K.). Despite these laggards, the Fund’s overall performance in the U.S. outpaced the benchmark, and returns in the U.K. were only slightly lower.
DETAILSOFTHE QUARTER
Among specific stocks, WANdisco plc was our top contributor. This British technology company specializes in providing enterprise customers with real-time access to their computer data anytime and anywhere. WANdisco’s stock soared in January when management reported that total bookings had risen 72% for the year ended December 31, 2016 driven by big data and cloud-computing.
Sony Corp., of Japan, was our second-largest contributor. Sony’s stock rose in the first quarter bolstered by strong holiday sales of the PlayStation 4 and rumors that the company is considering selling its film and television business.
Accuray, Inc., a recent addition to the Fund, develops radiosurgery and radiation therapy systems for the precise treatment of tumors. The company has turned around its brand reputation by improving the reliability of its radiation therapy devices. Accuray was the Fund’s second-largest detractor in the first quarter, we think because the company’s turnaround is still in midstream. Although new orders and the order backlog have started to increase, installation of new devices happens with a time lag. As a result, recent sales
results have looked weak. We believed Accuray’s valuation offered an exceptional entry point for this investment.
The greatest detractor from Fund performance for the quarter was AO World plc, a U.K.-based online retailer of appliances such as washing machines, refrigerators and ovens. The company’s holiday sales were weaker than investors had been expecting and management provided a cautious outlook citing economic and political uncertainty in the U.K. and the decline in the pound. We continue to like AO World’s business model. The company not only provides a large selection of products through an online retail “store front,” it also offers incredible customer service. AO World has gone from zero to over 30% market share in U.K. white goods in 10 years. We think it can replicate this performance only faster in European Union countries.
We track several key metrics versus our benchmark each quarter that we think reflect the financial characteristics of a portfolio of World Innovators. To start off, we look at sales growth. We expect this figure to be significantly faster than peers, as our companies should clearly be gaining market share. As of March 31st, the Fund’s trailing 12-month sales growth rate was 16% compared to the benchmark’s 6%. Next, we look at profit growth using trailing 12-month EBITDA (earnings before interest, taxes, depreciation and amortization) growth. The current figure as of March 31, 2017 for the Fund and the benchmark was 10%.
Then, we look at investment efficiency to ensure growth is self-sustaining using ROA (return on assets). On this metric, the Fund’s companies reported 8% versus 6% for companies in the benchmark. Finally, we look at balance-sheet strength. Here our companies really stood out with a weighted-average net debt-to-equity ratio of 7% versus 106% for the benchmark.
OUTLOOK
The economic backdrop has improved compared to several months ago. Equities in Europe, Asia and the Americas all benefited from countries’ improved economic outlooks. With a positive economic backdrop in the U.S., investor optimism may be sustainable even as the outlook for pro-growth policies — or at least their near-term impacts on the economy — may remain unclear or even waver. However, high valuations remain the standout feature of the U.S. equity market, where stocks already reflect assumptions that meaningful economic improvements from tax cuts, regulatory reforms and increased government spending can be achieved.
We believe companies that relentlessly push for innovation have the potential to disrupt their industries and grow during both favorable and unfavorable economic environments. So, while we are cautiously optimistic about stock market returns in the coming months, we hold strongly our belief that the Fund’s focus on innovative companies is a wise way to position for long-term investment success.
Thank you for the opportunity to manage your assets.
| | Current and future holdings are subject to risk. |
36
| | |
| WASATCH WORLD INNOVATORS FUND (WAGTX / WIGTX) | | MARCH 31, 2017 (UNAUDITED) |
|
|
|
Portfolio Summary
AVERAGE ANNUAL TOTAL RETURNS
| | | | | | | | | | | | | | | | | | | | |
| | | SIX MONTHS* | | 1 YEAR | | 5 YEARS | | 10 YEARS |
World Innovators (WAGTX) — Investor | | | | 6.06% | | | | | 12.21% | | | | | 8.81% | | | | | 7.15% | |
World Innovators (WIGTX) — Institutional | | | | 6.20% | | | | | 12.54% | | | | | 8.89% | | | | | 7.18% | |
MSCI AC World IMI | | | | 8.14% | | | | | 15.37% | | | | | 8.55% | | | | | 4.23% | |
Data shows past performance, which is not indicative of future performance. Current performance may be lower or higher than the performance quoted. To obtain the most recent month-end performance data available, please visit www.WasatchFunds.com. The Advisor may absorb certain Fund expenses, without which total return would have been lower. Investment returns and principal value will fluctuate and shares, when redeemed, may be worth more or less than their original cost.
As of the January 31, 2017 prospectus, the Total Annual Fund Operating Expenses for the Wasatch World Innovators Fund are Investor Class: 1.78% / Institutional Class — Gross: 3.69%, Net: 1.55%. The expense ratio shown elsewhere in this report may be different. Net expenses are based on Fund expenses, net of waivers and reimbursements. See the prospectus for additional information regarding Fund expenses.
Wasatch Funds will deduct a 2.00% redemption proceeds fee on Fund shares held 60 days or less. Performance data does not reflect the deduction of fees, including sales charges, or the taxes you would pay on fund distributions or the redemption of fund shares. Fees and taxes, if reflected, would reduce the performance quoted. Wasatch does not charge any sales fees. For more complete information including charges, risks and expenses, read the prospectus carefully.
Performance for the Institutional Class prior to 2/1/2016 is based on the performance of the Investor Class. Performance of the Fund’s Institutional Class prior to 2/1/2016 uses the actual expenses of the Fund’s Investor Class without any adjustments. For any such period of time, the performance of the Fund’s Institutional Class would have been substantially similar to, yet higher than, the performance of the Fund’s Investor Class, because the shares of both classes are invested in the same portfolio of securities, but the classes bear different expenses.
Investing in small cap funds will be more volatile and loss of principal could be greater than investing in large cap or more diversified funds. Investing in foreign securities, especially in emerging markets, entails special risks, such as currency fluctuations and political uncertainties, which are described in more detail in the prospectus.
TOP 10 EQUITY HOLDINGS**
| | | | |
| Company | | % of Net
Assets | |
Majestic Wine plc (United Kingdom) | | | 3.5% | |
Costco Wholesale Corp. | | | 3.0% | |
Alphabet, Inc., Class A | | | 3.0% | |
PayPal Holdings, Inc. | | | 2.6% | |
Gamma Communications plc (United Kingdom) | | | 2.4% | |
| | | | |
| Company | | % of Net
Assets | |
DiaSorin S.p.A. (Italy) | | | 2.3% | |
Advanced Medical Solutions Group plc (United Kingdom) | | | 2.2% | |
Amazon.com, Inc. | | | 2.1% | |
Comcast Corp., Class A | | | 2.1% | |
bioMérieux (France) | | | 2.0% | |
| ** | As of March 31, 2017, there were 109 holdings in the Fund. Foreign currency contracts, written options and repurchase agreements, if any, are not included in the number of holdings. Portfolio holdings are subject to change at any time. References to specific securities should not be construed as recommendations by the Funds or their Advisor. Current and future holdings are subject to risk. |
SECTOR BREAKDOWN†
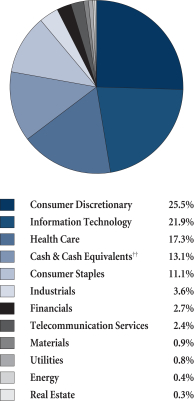
| † | Excludes securities sold short and options written, if any. |
| †† | Also includes Other Assets & Liabilities. |
GROWTHOFA HYPOTHETICAL $10,000 INVESTMENT
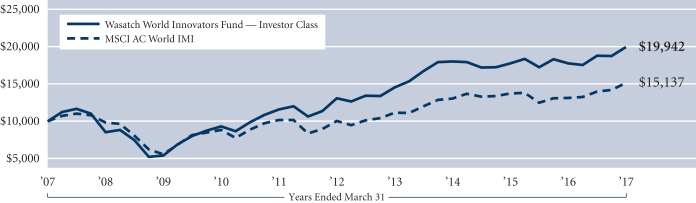
Past performance does not predict future performance. The graph above does not reflect the deduction of fees, sales charges, or taxes that you would pay on fund distributions or the redemption of fund shares. Wasatch does not charge any sales fees. The MSCI AC World IMI (All Country World Investable Market Index) is designed to measure the equity market performance of large, mid, and small cap securities across developed and emerging markets throughout the world. You cannot invest directly in this or any index.
37
| | |
| WASATCH-1ST SOURCE INCOME FUND (FMEQX) | | MARCH 31, 2017 (UNAUDITED) |
|
|
|
Management Discussion
| | | | |

Paul Gifford, CFA Lead Portfolio Manager | | 
Erik Clapsaddle, CFA Associate Portfolio Manager | | OVERVIEW The Wasatch-1st Source Income Fund gained 0.73% for the first quarter of 2017. The Fund’s benchmark, the Bloomberg Barclays US Intermediate Government/Credit Index, gained |
0.78%. The Federal Reserve (Fed) increased the federal-funds target rate (target rate) by 0.25 of a percentage point effective March 16th, moving the target rate to a range of 0.75% to 1.00%.
ECONOMIC ACTIVITY
Labor markets continued to tighten in the first quarter as the unemployment rate declined to 4.5% in March from 4.7% in February, and the underemployment rate, which includes those who have given up looking for work and those who are employed part time but would like full time work, dropped to 8.9% — its lowest level in approximately nine years. The U.S. added 28,000 manufacturing jobs in February, the largest increase since August 2013. This was driven by a surge in jobs for non-durable manufactured goods.
From the same periods a year ago, average hourly earnings increased 2.9% in December 2016, the largest annual increase since early 2009, and 2.8% in February 2017. We believe wages may increase faster given tight domestic labor markets, a possible national infrastructure bill that would compete for workers, and a crackdown on illegal immigration. Personal consumption continued to be the largest driver of domestic gross domestic product (GDP) growth. Based on the third estimate from the Bureau of Economic Analysis, GDP increased at an annual rate of 2.1% in the fourth quarter of 2016 compared to 3.5% growth in the third quarter. In four of the last five quarterly results, GDP would have been negative without the contribution from personal consumption.
In March, the Conference Board’s Leading Economic Index, an index of 10 components used to measure future economic growth, was at its highest level in over a decade and had registered six consecutive monthly gains. Also in March, the National Federation of Independent Business (NFIB) Small Business Optimism Index had one of its highest readings in 43 years as small business owners awaited several policy initiatives from the Trump administration that they hope will improve their business prospects.
INTEREST RATES
Fed officials must consider many variables before raising the target interest rate, including much lower global interest rates (i.e., Germany, Japan and France), the possibility of a stronger U.S. dollar amidst higher rates, an economy that is
currently considered to be at or near full employment, and asset prices that have been driven higher by years of easy money. The Fed appears to be on course to raise interest rates three more times this year.
The first quarter of 2017 was a favorable period for returns on fixed-income investments, as interest rates remained relatively flat from the beginning of the year. Although the movement in bond yields was fairly tame from the beginning of the first quarter through quarter-end, there was still much daily volatility coming on the heels of the significant yield increase in late 2016. The 10-year U.S. Treasury note was as high as 2.63% and as low as 2.30% during the first quarter. The market for U.S. Treasury securities appears to have moved back to being driven by economic data focusing most importantly on inflation and labor market data. High yield bonds continued their upward movement despite being fairly priced as an asset class in our opinion and given recently increased uncertainty in the energy sector.
STRATEGY
We reduced the Fund’s effective duration from 3.24 on December 31, 2016 to 2.73 as of March 31, 2017, as we believe bond yields should continue to move higher. For the same period, the benchmark’s duration was 4.06 years. We accomplished the reduction in the Fund’s duration by investing in corporate floating-rate senior unsecured debt, securities with approximate durations of 0.05 to 0.25, and fixed-to-floating rate securities that are currently floating or are within one year of floating. These additions to the Fund increased our allocation to corporate bonds. The floating-rate additions provide a strong spread to the three-month LIBOR and a positive correlation to rising interest rates. Since the start of 2016’s fourth quarter, the three-month LIBOR had increased 0.30 of a percentage point to 1.15% as of March 31, 2017.
During the first quarter, we decreased the Fund’s allocation to mortgage-backed securities (MBS) by approximately 11% by selling MBS and by not reinvesting prepayments back into MBS. At this point we are comfortable with the Fund’s allocation to residential MBS. We also added inflation-protected securities in late 2016.
The core of the Fund is currently focused on bonds with durations of less than five years. Ninety-nine percent of the Fund’s positions have effective durations of less than seven years. To offset the interest rate risk of bonds with longer maturities, we have overweighted the Fund in bonds with durations of less than three years. We believe the Fund is well positioned whether or not the Fed increases the target rate one, two or three more times in 2017.
Thank you for the opportunity to manage a portion of your assets.
38
| | |
| WASATCH-1ST SOURCE INCOME FUND (FMEQX) | | MARCH 31, 2017 (UNAUDITED) |
|
|
|
Portfolio Summary
AVERAGE ANNUAL TOTAL RETURNS
| | | | | | | | | | | | | | | | | | | | |
| | | SIX MONTHS* | | 1 YEAR | | 5 YEARS | | 10 YEARS |
Income | | | | -0.76% | | | | | 0.52% | | | | | 1.29% | | | | | 2.87% | |
Bloomberg Barclays US Intermediate Government/Credit Index | | | | -1.30% | | | | | 0.42% | | | | | 1.88% | | | | | 3.76% | |
Data shows past performance, which is not indicative of future performance. Current performance may be lower or higher than the performance quoted. To obtain the most recent month-end performance data available, please visit www.WasatchFunds.com. The Advisor may absorb certain Fund expenses, without which total return would have been lower. Investment returns and principal value will fluctuate and shares, when redeemed, may be worth more or less than their original cost.
As of the January 31, 2017 prospectus, the Total Annual Fund Operating Expenses for the Wasatch-1st Source Income Fund are 0.73%. The expense ratio shown elsewhere in this report may be different. Expenses include direct expenses paid to the Advisor as well as indirect expenses incurred by the Fund as a result of its investments in other investment companies (each an “Acquired Fund”). See the prospectus for additional information regarding Fund expenses.
Wasatch Funds will deduct a 2.00% redemption proceeds fee on Fund shares held 60 days or less. Performance data does not reflect the deduction of fees, including sales charges, or the taxes you would pay on fund distributions or the redemption of fund shares. Fees and taxes, if reflected, would reduce the performance quoted. Wasatch does not charge any sales fees. For more complete information including charges, risks and expenses, read the prospectus carefully.
Investments in fixed income funds are subject to the same interest rate, inflation, credit and other risks associated with the underlying bonds. Return of principal is not guaranteed.
TOP 10 FIXED INCOME HOLDINGS**
| | | | | | | | |
| Holding | | Maturity
Date | | | % of Net
Assets | |
U.S. Treasury Note, 3.625% | | | 8/15/19 | | | | 3.2% | |
Hewlett Packard Enterprise Co., 3.600% | | | 10/15/20 | | | | 2.1% | |
Federal National Mortgage Assoc., Series AL4936, 3.000% | | | 3/1/29 | | | | 2.0% | |
Goldman Sachs Group, Inc. (The), MTN, 2.789% | | | 10/28/27 | | | | 1.8% | |
World Financial Network Credit Card Master Trust, Series 2012-A, Class A, 3.140% | | | 1/17/23 | | | | 1.7% | |
| | | | | | | | |
| Holding | | Maturity
Date | | | % of Net
Assets | |
U.S. Treasury Note, 3.625% | | | 2/15/20 | | | | 1.6% | |
Federal Home Loan Mortgage Corp., Series G18637, 3.500% | | | 2/1/32 | | | | 1.6% | |
Wendys Funding LLC, Series 2015-1A, Class A2I, 3.371% | | | 6/15/45 | | | | 1.6% | |
BP Capital Markets plc, 3.245% | | | 5/6/22 | | | | 1.6% | |
Citibank Credit Card Issuance Trust, Series 2007-A8, Class A8, 5.650% | | | 9/20/19 | | | | 1.5% | |
| ** | As of March 31, 2017, there were 106 holdings in the Fund. Repurchase agreements, if any, are not included in the number of holdings. Portfolio holdings are subject to change at any time. References to specific securities should not be construed as recommendations by the Funds or their Advisor. Current and future holdings are subject to risk. |
INVESTMENTS & CASH†

| † | Excludes options written, if any. |
| †† | Also includes Other Assets & Liabilities. |
GROWTHOFA HYPOTHETICAL $10,000 INVESTMENT
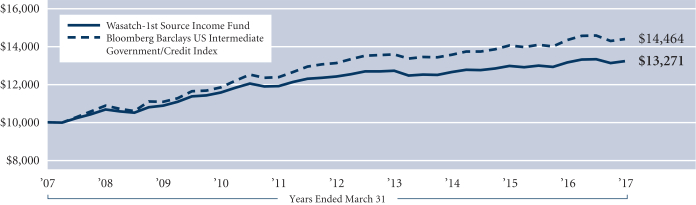
Past performance does not predict future performance. The graph above does not reflect the deduction of fees, sales charges, or taxes that you would pay on fund distributions or the redemption of fund shares. Wasatch does not charge any sales fees. The Bloomberg Barclays US Intermediate Government/Credit Index is a broad-based flagship benchmark that measures the non-securitized component of the US Aggregate Index. It includes investment grade, U.S. dollar-denominated, fixed-rate Treasuries, government-related and corporate securities. You cannot invest directly in this or any index.
39
| | |
| WASATCH-HOISINGTON U.S. TREASURY FUND (WHOSX) | | MARCH 31, 2017 (UNAUDITED) |
|
|
|
Management Discussion
| | | | |

Van Hoisington Lead Portfolio Manager | | 
Van R. Hoisington, Jr. Portfolio Manager | | 
David Hoisington Portfolio Manager |
OVERVIEW
The Wasatch-Hoisington U.S. Treasury Fund returned 1.20% for the first three months of 2017, while the benchmark Bloomberg Barclays US Aggregate Bond Index returned 0.82%. The Fund maintained its substantial longer-term outperformance over the Index. For the three-, five- and 10-year periods ended March 31, 2017, the Fund’s average annual returns were 6.31%, 4.04% and 7.40%, respectively, versus the benchmark’s returns of 2.68%, 2.34% and 4.27% over the same time periods.
DETAILSOFTHE PERIOD
In the first calendar quarter of 2017, the U.S. Treasury bond market experienced range-bound trading, following a sharp sell off that followed the end of last year’s presidential election. Thirty-year Treasury bond yields fell 0.05 of a percentage point to a closing level of 3.02% on March 31, 2017. Nevertheless, for the six months ended March 31st, bond yields increased 0.71 of a percentage point. This large rise in yields is a dramatic example of widely positive expectations for future economic growth overcoming deterioration in current economic growth.
OUTLOOKFORTHE YEAR
The Federal Reserve (Fed) initiated the 15th tightening cycle since 1945 by increasing the federal-funds rate 0.25 of a percentage point three times since December 2015. The latest increase, effective March 16th, brought the fed-funds rate to a range of 0.75% to 1.00%. Conspicuously, in 80% of the prior 14 episodes, recessions followed, with outright business contractions being avoided in just three cases. What is notable today is that the economy is in the 93rd month of this expansion, a length of time that is well beyond periods in prior expansions where soft landings occurred (1968, 1984 and 1995). This is relevant because the pent-up demand from the prior downturn has been exhausted, thus the economy is extremely vulnerable to shock, which could lead to recession. Regardless of whether there was an associated recession, the last 10 cycles of tightening all triggered financial crises. In conjunction with the non-monetary determinants of economic activity (referred to as initial conditions) monetary restraint served to expose over-indebted parties and, in turn, financial crises ensued.
Four important current considerations that were not present in the past may magnify the current restraining
actions of the Federal Reserve. First, the Fed is tightening into a deteriorating economy with last year’s growth in real gross domestic product (GDP) worse than any of the prior 14 cases. Second, business and government balance sheets are burdened with record amounts of debt. This means small changes in interest rates may have an outsized impact on investment and spending decisions. Third, previous Fed experiments, primarily quantitative easing, have led to an unprecedented balance sheet to which the economy has grown accustomed. The resulting reduction in that balance sheet (reduction in the monetary base) may have a more profound impact on growth than anticipated. Fourth, the changing regulatory landscape, both in the U.S. and globally, has meant a significant shift in the amount of liquid reserves that banks are required to hold suggesting that liquidity has already been restrained more severely than the $3.8 trillion monetary base would suggest. This is evident as the monetary and credit aggregates are following the expected deteriorating pattern resulting from monetary restraint suggesting recessionary conditions may lie ahead.
A century of Fed tightening cycles has left an indelible mark on the U.S. business cycle. Looking at the period from 1915 through the present, the Fed has typically tightened too much and/or for too long. From this long history, a well-established pattern is identifiable. The economic growth rate along with inflation receded. A financial crisis was more likely than not. With different lags, which were influenced by the initial conditions, bond yields dropped along with falling inflationary expectations. The cyclical trough in Treasury bond yields typically occurred several years after the end of the economic contraction. This long empirical record as well as economic theory indicates that the current Fed tightening cycle will not end any differently.
Our economic view for 2017 remains unchanged. We continue to anticipate no more than 2% growth in nominal GDP for the full calendar year. This is in line with the recent trends in M2 growth coupled with an anticipated decline in M2 velocity of 3.6%. The risks, however, are to the downside. M2 was probably boosted by what will eventually be a transitory drop in Treasury balances at the Fed. A negative influence on velocity is the rise in short-term rates, even though they are not its main determinant. The downturn in nominal GDP growth suggests that a rise in inflation to above 2% will be rejected and that by year end the inflation rate will be considerably slower. Such an economic environment would bode well for the Fund, as long-term Treasury yields should continue to work irregularly lower over the balance of the year.
Thank you for the opportunity to manage your assets.
40
| | |
| WASATCH-HOISINGTON U.S. TREASURY FUND (WHOSX) | | MARCH 31, 2017 (UNAUDITED) |
|
|
|
Portfolio Summary
AVERAGE ANNUAL TOTAL RETURNS
| | | | | | | | | | | | | | | | | | | | |
| | | SIX MONTHS* | | 1 YEAR | | 5 YEARS | | 10 YEARS |
U.S. Treasury | | | | -13.60% | | | | | -6.88% | | | | | 4.04% | | | | | 7.40% | |
Bloomberg Barclays US Aggregate Bond Index | | | | -2.18% | | | | | 0.44% | | | | | 2.34% | | | | | 4.27% | |
Data shows past performance, which is not indicative of future performance. Current performance may be lower or higher than the performance quoted. To obtain the most recent month-end performance data available, please visit www.WasatchFunds.com. The Advisor may absorb certain Fund expenses, without which total return would have been lower. Investment returns and principal value will fluctuate and shares, when redeemed, may be worth more or less than their original cost.
As of the January 31, 2017 prospectus, the Total Annual Fund Operating Expenses for the Wasatch-Hoisington U.S. Treasury Fund are 0.69%. The expense ratio shown elsewhere in this report may be different. See the prospectus for additional information regarding Fund expenses.
Wasatch Funds will deduct a 2.00% redemption proceeds fee on Fund shares held 60 days or less. Performance data does not reflect the deduction of fees, including sales charges, or the taxes you would pay on fund distributions or the redemption of fund shares. Fees and taxes, if reflected, would reduce the performance quoted. Wasatch does not charge any sales fees. For more complete information including charges, risks and expenses, read the prospectus carefully.
Investments in fixed income funds are subject to the same interest rate, inflation, credit and other risks associated with the underlying bonds. Return of principal is not guaranteed.
TOP U.S. TREASURY HOLDINGS**
| | | | | | | | |
| Holding | | Maturity
Date | | | % of Net
Assets | |
| U.S. Treasury Bond, 2.250% | | | 8/15/46 | | | | 33.2% | |
| U.S. Treasury Strip, principal only | | | 8/15/45 | | | | 24.0% | |
| U.S. Treasury Bond, 2.500% | | | 2/15/45 | | | | 15.9% | |
| U.S. Treasury Strip, principal only | | | 5/15/44 | | | | 11.6% | |
| U.S. Treasury Principal Strip | | | 8/15/40 | | | | 6.3% | |
| | | | | | | | |
| Holding | | Maturity
Date | | | % of Net
Assets | |
| U.S. Treasury Bond, 3.750% | | | 11/15/43 | | | | 5.3% | |
| U.S. Treasury Bond, 3.125% | | | 8/15/44 | | | | 2.7% | |
| U.S. Treasury Bond, 2.875% | | | 5/15/43 | | | | 0.3% | |
| U.S. Treasury Bond, 2.875% | | | 8/15/45 | | | | 0.2% | |
| ** | As of March 31, 2017, there were 9 holdings in the Fund. Repurchase agreements, if any, are not included in the number of holdings. Portfolio holdings are subject to change at any time. References to specific securities should not be construed as recommendations by the Funds or their Advisor. Current and future holdings are subject to risk. |
INVESTMENTS & CASH
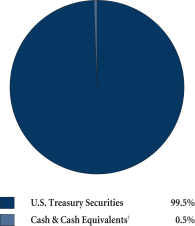
| † | Also includes Other Assets & Liabilities. |
GROWTHOFA HYPOTHETICAL $10,000 INVESTMENT
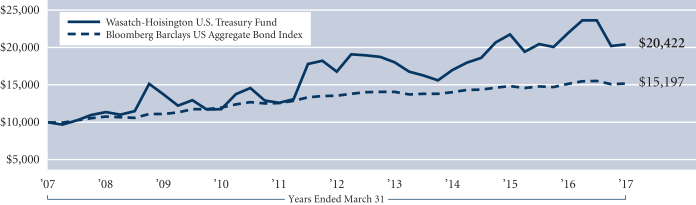
Past performance does not predict future performance. The graph above does not reflect the deduction of fees, sales charges, or taxes that you would pay on fund distributions or the redemption of fund shares. Wasatch does not charge any sales fees. The Bloomberg Barclays US Aggregate Bond Index is a broad-based flagship benchmark that measures the investment grade, US dollar denominated, fixed-rate taxable bond market. The index includes Treasuries, government-related and corporate securities, MBS (agency fixed-rate and hybrid ARM pass-throughs), ABS and CMBS (agency and non-agency). You cannot invest directly in this or any index.
41
| | |
| WASATCH FUNDS MANAGEMENT DISCUSSIONS | | |
|
|
|
Definitions of Financial Terms
The American Health Care Act is the Republican-sponsored bill intended to repeal and replace the Obama-era Affordable Care Act. The Patient Protection and Affordable Care Act (PPACA), commonly called the Affordable Care Act (ACA) or “ObamaCare,” is a United States federal statute signed into law by President Barack Obama on March 23, 2010.
Beta is a measurement of a fund’s trailing return in relation to the overall market (or appropriate market index). A beta of 1 indicates the share price will typically move with the market. A beta of more than 1 indicates the share price will typically be more volatile than the market. A beta of less than 1 indicates the share price will typically be less volatile than the market.
Book value is the value of a security or asset as entered in a company’s books.
Brexit is an abbreviation for “British exit,” which refers to the June 23, 2016 referendum whereby British citizens voted to exit the European Union. The referendum roiled global markets, including currencies, causing the British pound to fall to its lowest level in decades.
The Bureau of Economic Analysis (BEA) is an agency in the United States Department of Commerce that provides important economic statistics including the gross domestic product of the United States. BEA is a principal agency of the U.S. Federal Statistical System. The U.S. Department of Commerce works with businesses, universities, communities, and the Nation’s workers to promote job creation, economic growth, sustainable development, and improved standards of living for Americans.
The “cloud” is the internet. Cloud-computing is a model for delivering information-technology services in which resources are retrieved from the internet through web-based tools and applications, rather than from a direct connection to a server.
The Conference Board is a global, independent business-membership and research association working in the public interest. It counts approximately 1,200 public and private corporations and other organizations as members, encompassing 60 countries. The Conference Board convenes conferences and peer-learning groups, conducts economic and business management research, and publishes several widely tracked economic indicators.
A corporate bond is a debt security issued by a corporation for the purpose of raising money to expand its business. Floating rate notes (FRNs) are bonds that have a variable coupon, equal to a money market reference rate, like LIBOR or the federal-funds rate, plus a quoted spread (also known as a quoted margin). The spread is a rate that remains constant. A corporation can borrow money by issuing bonds or getting a bank loan. Both are different forms of debt. “Senior” means that the debt has priority over other types of debt in bankruptcy. “Unsecured” means the debt is not secured by any specific collateral.
Correlation, in the financial world, is a statistical measure of how asset classes, securities, markets, or countries move in relation to each other.
A credit aggregate measures the stock of bank loans outstanding at a point in time.
Dividend yield is a company’s annual dividend payment divided by its market capitalization, or the dividend per share divided by the price per share. For example, a company whose stock sells for $30 per share that pays an annual dividend of $3 per share has a dividend yield of 10%.
The Dow Jones Industrial Average (DJIA) is a price-weighted average of 30 significant stocks traded on the New York Stock Exchange (NYSE) and the NASDAQ. Charles Dow invented the DJIA in 1896.
Earnings growth is a measure of growth in a company’s net income over a specific period, often one year.
Effective duration is a measure of the responsiveness of a bond’s price to market interest rate changes. For example, if the interest rate increased 1%, a bond with an effective duration of five years would experience a decline in price of 5%.
An Exchange-Traded Fund (ETF) is a security that tracks an index, a commodity or a basket of assets like an index fund, but trades like a stock on a securities exchange. ETFs experience price changes throughout the day as they are bought and sold.
The federal-funds rate is the interest rate at which private depository institutions (mostly banks) lend balances (federal funds) at the Federal Reserve to other depository institutions, usually overnight. It is the interest rate banks charge each other for loans.
The federal-funds target rate (also known as the fed-funds target rate) is set by a committee within the Federal Reserve System called the Federal Open Market Committee (FOMC). The FOMC usually meets every six weeks, and it is at these meetings that the FOMC votes on whether or not to make changes to the federal-funds target rate.
The Federal Open Market Committee (FOMC), a component of the Federal Reserve System, is charged under United States law with overseeing the nation’s open market operations. Open market operations are the means of implementing monetary policy by which a central bank controls the short-term interest rate and the supply of base money in an economy, and thus indirectly the total money supply.
Fixed-to-floating preferred shares and bonds offer a steady yield for several years, then switch to a floating rate that keeps pace with market interest rates.
Gross domestic product (GDP) is a basic measure of a country’s economic performance and is the market value of all final goods and services made within the borders of a country in a year.
High-yield bonds are those rated below investment grade by the primary rating agencies (e.g., below BB/Ba by S&P/Moody’s). Such securities tend to have more volatile prices and increased price sensitivity to changing interest rates and adverse economic and business developments than investment grade securities.
An initial public offering (IPO) is a company’s first sale of stock to the public.
LIBOR or ICE LIBOR stands for IntercontinentalExchange London Interbank Offered Rate. It is a benchmark interest rate that some of the world’s leading banks charge each other for short-term loans. LIBOR serves as the first step to calculating interest rates on various loans throughout the world.
42
| | |
| | MARCH 31, 2017 (UNAUDITED) |
|
|
|
M2 money supply consists of currency and checking accounts, consumer-type time and savings accounts and equivalent near monies, while M3 money supply consists of M2 plus business-type time deposits and less liquid near monies. Both M2 and M3 exclude monies and near monies owned by the Treasury, depository institutions and foreign banks and official institutions and IRA and Keogh balances owned by consumers.
A monetary aggregate measures the stock of money outstanding within an economy at a point in time.
Mortgage-backed securities are debt issues backed by a pool of mortgages. Investors receive payments from the interest and principal payments made on the underlying mortgages. Agency mortgage-backed securities are issued by government-sponsored enterprises such as Ginnie Mae, Fannie Mae or Freddie Mac. Commercial mortgage-backed securities are mortgages backed by commercial rather than residential real estate.
The National Federation of Independent Business (NFIB) research center has collected small business economic trends data with quarterly surveys since the fourth quarter of 1973 and monthly surveys since 1986. Survey respondents are drawn from NFIB’s membership. The Small Business Optimism Index report is released on the second Tuesday of each month.
The price-to-earnings (P/E) multiple, also known as the P/E ratio, is the price of a stock divided by its earnings per share.
A Purchasing Managers Index (PMI) is an indicator of the economic health of a country’s manufacturing sector. The PMI is based on five major indicators — new orders, inventory levels, production, supplier deliveries, and the employment environment.
Quantitative easing is a government monetary policy used to increase the money supply by buying government securities or other securities from the market. Quantitative easing increases the money supply by flooding financial institutions with capital in an effort to promote increased lending and liquidity.
Real gross domestic product (GDP) is a macroeconomic measure of the value of economic output adjusted for price changes (i.e., inflation or deflation). This adjustment transforms the money-value measure, nominal GDP, into an index for quantity of total output.
Return on assets (ROA) measures a company’s profitability by showing how many dollars of earnings a company derives from each dollar of assets it controls.
Return on equity (ROE) measures a company’s efficiency at generating profits from shareholders’ equity.
The Russell 2000 Growth Index measures the performance of Russell 2000 Index companies with higher price-to-book ratios and higher forecasted growth values. The Russell 2000 Index is an unmanaged total return index of the smallest 2,000 companies in the Russell 3000 Index. The Russell 2000 is widely used in the industry to measure the performance of small company stocks. The Russell 3000 Index is an unmanaged total return index of the largest 3,000 U.S. companies based on total market capitalization. You cannot invest directly in this or any index.
The Russell 2000 Value Index measures the performance of Russell 2000 Index companies with lower price-to-book ratios and lower forecasted growth values. You cannot invest directly in this or any index.
The S&P 500 Index includes 500 of the United States’ largest stocks from a broad variety of industries. The Index is unmanaged and is a commonly used measure of common stock total return performance. You cannot invest directly in this or any index.
The 30-day current net (“SEC”) yield is calculated by dividing the net investment income per share for the 30 days ended on the date of calculation by the maximum offering price per share on that date. The figure is compounded and annualized.
Valuation is the process of determining the current worth of an asset or company.
The velocity of money (V) is defined as the rate at which money circulates, changes hands or turns over in an economy.
VIX is the ticker symbol for the Chicago Board Options Exchange (CBOE) Volatility Index, which shows the market’s expectations of 30-day volatility. It is constructed using the implied volatilities of a wide range of S&P 500 Index options. This volatility is meant to be forward looking and is calculated from both calls and puts. The VIX is a widely used measure of market risk and is often referred to as the “investor fear gauge.”
Pertaining to the use of MSCI information. MSCI makes no express or implied warranties or representations and shall have no liability whatsoever with respect to any MSCI data contained herein. The MSCI data may not be further redistributed or used to create indices or financial products. This report is not approved or produced by MSCI.
Pertaining to the use of Russell information. Russell Investment Group is the source and owner of the trademarks, service marks and copyrights related to the Russell Indexes. Russell® is a trademark of Russell Investment Group.
43
Operating Expenses (UNAUDITED)
EXPENSE EXAMPLE
As a shareholder of Wasatch Funds, you incur two types of costs: (1) transaction costs, including redemption fees and (2) ongoing costs, including management fees and other fund expenses. This example is intended to help you understand your ongoing costs (in dollars) of investing in a Wasatch Fund and to compare these costs with the ongoing costs of investing in other mutual funds.
The example is based on an investment of $1,000.00 invested at the beginning of the period and held for the entire six-month period ended March 31, 2017.
ACTUAL EXPENSES
The first line of the table on the next page provides information about actual account values and actual expenses, based upon the actual total return of the fund during the most recent six-month period ended March 31, 2017. You may use the information in this line, together with the amount you invested, to estimate the expenses you paid over the period. Simply divide your account value by $1,000.00 (for example, an $8,600.00 account value divided by $1,000.00 = 8.6), then multiply the result by the number in the first line under the heading entitled “Expenses Paid During Period” to estimate the expenses you paid on your account during this period.
In addition, the Funds charge a $12.50 IRA annual maintenance fee and a $15.00 fee for redemptions paid by wire. To the extent these fees apply to your account, your expenses paid during the period would be higher and your ending account value would be lower than the amounts shown in the table below.
HYPOTHETICAL EXAMPLEFOR COMPARISON PURPOSES
The second line of the table on the next page provides information about hypothetical account values and hypothetical expenses based on a fund’s actual expense ratio
and an assumed rate of return of 5% per year before expenses, which is not the fund’s actual return. The hypothetical account values and expenses may not be used to estimate the actual ending account balance or expenses you paid for the period. You may use this information to compare the ongoing costs of investing in a Wasatch Fund and other funds. To do so, compare this 5% hypothetical example with the 5% hypothetical examples that appear in the shareholder reports of other funds.
In addition, the Funds charge a $12.50 IRA annual maintenance fee and a $15.00 fee for redemptions paid by wire. To the extent these fees apply to your account, your expenses paid during the period would be higher and your ending account value would be lower than the amounts shown in the table on the next page. If another fund’s fees differ from those listed above, your expenses paid and your ending account value could be higher or lower than those of other funds.
Please note that the expenses shown in the table are meant to highlight your ongoing costs only and do not reflect any transactional costs, such as redemption fees. Therefore, the second line of the table is useful in comparing ongoing costs only, and will not help you determine the relative total costs of owning different funds. In addition, if these transactional costs were included, your costs would have been higher.
A Fund’s annualized expense ratio may vary as a result of various factors including expenses that are not reimbursable under the contractual agreement between the Fund and the Advisor such as interest, taxes, brokerage commissions, other investment related costs, dividend expense on short sales, and extraordinary expenses. The Long/Short Fund — Investor Class and the Income Fund have no contractual limitation on expenses.
44
| | |
| | MARCH 31, 2017 (UNAUDITED) |
|
|
|
| | | | | | | | | | | | | | | | |
| | | Account Value | | | Expenses
Paid
During Period* | | | Annualized
Expense
Ratio* | |
| Fund/Class and Return | | Beginning of Period
October 1, 2016 | | | End of Period
March 31, 2017 | | | |
Core Growth Fund — Investor Class | |
Actual | | | $1,000.00 | | | | $1,071.40 | | | | $6.25 | | | | 1.21% | |
Hypothetical (5% before expenses) | | | $1,000.00 | | | | $1,018.90 | | | | $6.09 | | | | 1.21% | |
Core Growth Fund — Institutional Class | |
Actual | | | $1,000.00 | | | | $1,072.30 | | | | $5.42 | | | | 1.05% | |
Hypothetical (5% before expenses) | | | $1,000.00 | | | | $1,019.70 | | | | $5.29 | | | | 1.05% | |
Emerging India Fund — Investor Class | |
Actual | | | $1,000.00 | | | | $1,097.30 | | | | $9.15 | | | | 1.75% | |
Hypothetical (5% before expenses) | | | $1,000.00 | | | | $1,016.21 | | | | $8.80 | | | | 1.75% | |
Emerging India Fund — Institutional Class | |
Actual | | | $1,000.00 | | | | $1,100.00 | | | | $7.85 | | | | 1.50% | |
Hypothetical (5% before expenses) | | | $1,000.00 | | | | $1,017.45 | | | | $7.54 | | | | 1.50% | |
Emerging Markets Select Fund — Investor Class | |
Actual | | | $1,000.00 | | | | $996.80 | | | | $7.57 | | | | 1.52% | |
Hypothetical (5% before expenses) | | | $1,000.00 | | | | $1,017.35 | | | | $7.64 | | | | 1.52% | |
Emerging Markets Select Fund — Institutional Class | |
Actual | | | $1,000.00 | | | | $997.90 | | | | $6.08 | | | | 1.22% | |
Hypothetical (5% before expenses) | | | $1,000.00 | | | | $1,018.85 | | | | $6.14 | | | | 1.22% | |
Emerging Markets Small Cap Fund — Investor Class | |
Actual | | | $1,000.00 | | | | $962.50 | | | | $9.59 | | | | 1.96% | |
Hypothetical (5% before expenses) | | | $1,000.00 | | | | $1,015.16 | | | | $9.85 | | | | 1.96% | |
Emerging Markets Small Cap Fund — Institutional Class | |
Actual | | | $1,000.00 | | | | $962.50 | | | | $8.86 | | | | 1.81% | |
Hypothetical (5% before expenses) | | | $1,000.00 | | | | $1,015.91 | | | | $9.10 | | | | 1.81% | |
Frontier Emerging Small Countries Fund — Investor Class | |
Actual | | | $1,000.00 | | | | $950.60 | | | | $11.09 | | | | 2.28% | |
Hypothetical (5% before expenses) | | | $1,000.00 | | | | $1,013.56 | | | | $11.45 | | | | 2.28% | |
Frontier Emerging Small Countries
Fund — Institutional Class | | | | | | | | | | | | | | | | |
Actual | | | $1,000.00 | | | | $950.80 | | | | $10.12 | | | | 2.08% | |
Hypothetical (5% before expenses) | | | $1,000.00 | | | | $1,014.56 | | | | $10.45 | | | | 2.08% | |
Global Opportunities Fund — Investor Class | |
Actual | | | $1,000.00 | | | | $1,026.50 | | | | $8.24 | | | | 1.63% | |
Hypothetical (5% before expenses) | | | $1,000.00 | | | | $1,016.80 | | | | $8.20 | | | | 1.63% | |
Global Opportunities Fund — Institutional Class | |
Actual | | | $1,000.00 | | | | $1,026.20 | | | | $6.92 | | | | 1.37% | |
Hypothetical (5% before expenses) | | | $1,000.00 | | | | $1,018.10 | | | | $6.89 | | | | 1.37% | |
International Growth Fund — Investor Class | |
Actual | | | $1,000.00 | | | | $964.80 | | | | $7.25 | | | | 1.48% | |
Hypothetical (5% before expenses) | | | $1,000.00 | | | | $1,017.55 | | | | $7.44 | | | | 1.48% | |
International Growth Fund — Institutional Class | |
Actual | | | $1,000.00 | | | | $965.40 | | | | $6.62 | | | | 1.35% | |
Hypothetical (5% before expenses) | | | $1,000.00 | | | | $1,018.20 | | | | $6.79 | | | | 1.35% | |
International Opportunities Fund — Investor Class | |
Actual | | | $1,000.00 | | | | $975.10 | | | | $11.13 | | | | 2.26% | |
Hypothetical (5% before expenses) | | | $1,000.00 | | | | $1,013.66 | | | | $11.35 | | | | 2.26% | |
International Opportunities Fund — Institutional Class | |
Actual | | | $1,000.00 | | | | $975.20 | | | | $9.65 | | | | 1.96% | |
Hypothetical (5% before expenses) | | | $1,000.00 | | | | $1,015.16 | | | | $9.85 | | | | 1.96% | |
Large Cap Value Fund — Investor Class | |
Actual | | | $1,000.00 | | | | $1,109.60 | | | | $5.79 | | | | 1.10% | |
Hypothetical (5% before expenses) | | | $1,000.00 | | | | $1,019.45 | | | | $5.54 | | | | 1.10% | |
Large Cap Value Fund — Institutional Class | |
Actual | | | $1,000.00 | | | | $1,109.50 | | | | $5.00 | | | | 0.95% | |
Hypothetical (5% before expenses) | | | $1,000.00 | | | | $1,020.20 | | | | $4.78 | | | | 0.95% | |
45
| | |
| WASATCH FUNDS | | MARCH 31, 2017 (UNAUDITED) |
|
|
|
Operating Expenses (continued)
| | | | | | | | | | | | | | | | |
| | | Account Value | | | Expenses
Paid
During Period* | | | Annualized
Expense
Ratio* | |
| Fund/Class and Return | | Beginning of Period
October 1, 2016 | | | End of Period
March 31, 2017 | | | |
Long/Short Fund — Investor Class | |
Actual | | | $1,000.00 | | | | $1,029.60 | | | | $11.49 | | | | 2.27% | |
Hypothetical (5% before expenses) | | | $1,000.00 | | | | $1,013.61 | | | | $11.40 | | | | 2.27% | |
Long/Short Fund — Institutional Class | |
Actual | | | $1,000.00 | | | | $1,031.10 | | | | $9.87 | | | | 1.95% | |
Hypothetical (5% before expenses) | | | $1,000.00 | | | | $1,015.21 | | | | $9.80 | | | | 1.95% | |
Micro Cap Fund | |
Actual | | | $1,000.00 | | | | $1,054.90 | | | | $9.38 | | | | 1.83% | |
Hypothetical (5% before expenses) | | | $1,000.00 | | | | $1,015.81 | | | | $9.20 | | | | 1.83% | |
Micro Cap Value Fund | |
Actual | | | $1,000.00 | | | | $1,084.10 | | | | $9.98 | | | | 1.92% | |
Hypothetical (5% before expenses) | | | $1,000.00 | | | | $1,015.36 | | | | $9.65 | | | | 1.92% | |
Small Cap Growth Fund — Investor Class | |
Actual | | | $1,000.00 | | | | $1,047.70 | | | | $6.69 | | | | 1.31% | |
Hypothetical (5% before expenses) | | | $1,000.00 | | | | $1,018.40 | | | | $6.59 | | | | 1.31% | |
Small Cap Growth Fund — Institutional Class | |
Actual | | | $1,000.00 | | | | $1,049.10 | | | | $5.42 | | | | 1.06% | |
Hypothetical (5% before expenses) | | | $1,000.00 | | | | $1,019.65 | | | | $5.34 | | | | 1.06% | |
Small Cap Value Fund — Investor Class | |
Actual | | | $1,000.00 | | | | $1,099.10 | | | | $6.38 | | | | 1.22% | |
Hypothetical (5% before expenses) | | | $1,000.00 | | | | $1,018.85 | | | | $6.14 | | | | 1.22% | |
Small Cap Value Fund — Institutional Class | |
Actual | | | $1,000.00 | | | | $1,098.80 | | | | $5.49 | | | | 1.05% | |
Hypothetical (5% before expenses) | | | $1,000.00 | | | | $1,019.70 | | | | $5.29 | | | | 1.05% | |
Strategic Income Fund | |
Actual | | | $1,000.00 | | | | $1,060.00 | | | | $4.88 | | | | 0.95% | |
Hypothetical (5% before expenses) | | | $1,000.00 | | | | $1,020.19 | | | | $4.78 | | | | 0.95% | |
Ultra Growth Fund | |
Actual | | | $1,000.00 | | | | $1,051.60 | | | | $6.70 | | | | 1.31% | |
Hypothetical (5% before expenses) | | | $1,000.00 | | | | $1,018.40 | | | | $6.59 | | | | 1.31% | |
World Innovators Fund — Investor Class | |
Actual | | | $1,000.00 | | | | $1,060.60 | | | | $9.40 | | | | 1.83% | |
Hypothetical (5% before expenses) | | | $1,000.00 | | | | $1,015.81 | | | | $9.20 | | | | 1.83% | |
World Innovators Fund — Institutional Class | |
Actual | | | $1,000.00 | | | | $1,062.00 | | | | $7.97 | | | | 1.55% | |
Hypothetical (5% before expenses) | | | $1,000.00 | | | | $1,017.20 | | | | $7.80 | | | | 1.55% | |
Income Fund | |
Actual | | | $1,000.00 | | | | $992.40 | | | | $3.68 | | | | 0.74% | |
Hypothetical (5% before expenses) | | | $1,000.00 | | | | $1,021.24 | | | | $3.73 | | | | 0.74% | |
U.S. Treasury Fund | |
Actual | | | $1,000.00 | | | | $864.00 | | | | $3.49 | | | | 0.75% | |
Hypothetical (5% before expenses) | | | $1,000.00 | | | | $1,021.19 | | | | $3.78 | | | | 0.75% | |
*Expenses are equal to a fund’s annualized expense ratio as indicated above multiplied by the average account value over the period, multiplied by the number of days in the most recent fiscal half-year divided by the number of days in the full fiscal year (182/365).
46
| | |
| WASATCH CORE GROWTH FUND (WGROX / WIGRX) | | MARCH 31, 2017 (UNAUDITED) |
|
|
|
Schedule of Investments
| | | | | | | | |
| Shares | | | | | Value | |
| | | | | | | |
| | | | COMMON STOCKS 94.2% | | | | |
| | |
| | | | Airlines 4.7% | | | | |
| | 202,400 | | | Allegiant Travel Co. | | $ | 32,434,600 | |
| | 694,245 | | | Spirit Airlines, Inc.* | | | 36,843,582 | |
| | | | | | | | |
| | | | | | | 69,278,182 | |
| | | | | | | | |
| | | | Apparel Retail 0.6% | | | | |
| | 485,770 | | | Zumiez, Inc.* | | | 8,889,591 | |
| | | | | | | | |
| | | | Application Software 6.3% | | | | |
| | 296,505 | | | Globant S.A.* (Argentina) | | | 10,792,782 | |
| | 215,318 | | | Tyler Technologies, Inc.* | | | 33,279,550 | |
| | 126,501 | | | Ultimate Software Group, Inc. (The)* | | | 24,694,260 | |
| | 829,560 | | | Zendesk, Inc.* | | | 23,260,863 | |
| | | | | | | | |
| | | | | | | 92,027,455 | |
| | | | | | | | |
| | | | Asset Management & Custody Banks 1.3% | | | | |
| | 368,969 | | | SEI Investments Co. | | | 18,610,796 | |
| | | | | | | | |
| | | | Automotive Retail 1.0% | | | | |
| | 273,758 | | | Monro Muffler Brake, Inc. | | | 14,262,792 | |
| | | | | | | | |
| | | | Biotechnology 4.2% | | | | |
| | 1,908,420 | | | Abcam plc (United Kingdom) | | | 19,738,203 | |
| | 1,582,827 | | | Sangamo Therapeutics, Inc.* | | | 8,230,700 | |
| | 526,486 | | | Seattle Genetics, Inc.* | | | 33,094,910 | |
| | | | | | | | |
| | | | | | | 61,063,813 | |
| | | | | | | | |
| | | | Building Products 2.0% | | | | |
| | 424,029 | | | Trex Co., Inc.* | | | 29,423,372 | |
| | | | | | | | |
| | | | Consumer Finance 4.1% | | | | |
| | 199,907 | | | Credit Acceptance Corp.* | | | 39,863,455 | |
| | 606,526 | | | PRA Group, Inc.* | | | 20,106,337 | |
| | | | | | | | |
| | | | | | | 59,969,792 | |
| | | | | | | | |
| | | | Data Processing & Outsourced Services 2.1% | | | | |
| | 350,214 | | | Euronet Worldwide, Inc.* | | | 29,950,301 | |
| | | | | | | | |
| | | | Distributors 1.3% | | | | |
| | 163,176 | | | Pool Corp. | | | 19,471,792 | |
| | | | | | | | |
| | | | Diversified Banks 2.2% | | | | |
| | 6,656,038 | | | City Union Bank Ltd. (India) | | | 15,529,218 | |
| | 717,994 | | | Yes Bank Ltd. (India) | | | 17,092,094 | |
| | | | | | | | |
| | | | | | | 32,621,312 | |
| | | | | | | | |
| | | | Diversified Support Services 4.9% | | | | |
| | 726,462 | | | Copart, Inc.* | | | 44,989,792 | |
| | 606,047 | | | Healthcare Services Group, Inc. | | | 26,114,565 | |
| | | | | | | | |
| | | | | | | 71,104,357 | |
| | | | | | | | |
| | | | Environmental & Facilities Services 2.1% | | | | |
| | 353,755 | | | Waste Connections, Inc. (Canada) | | | 31,208,266 | |
| | | | | | | | |
| | | | General Merchandise Stores 1.3% | | | | |
| | 581,194 | | | Ollie’s Bargain Outlet Holdings, Inc.* | | | 19,469,999 | |
| | | | | | | | |
| | | | Health Care Facilities 1.9% | | | | |
| | 1,489,903 | | | Ensign Group, Inc. (The) | | | 28,010,176 | |
| | | | | | | | |
| | | | Health Care REITs 1.8% | | | | |
| | 1,536,988 | | | CareTrust REIT, Inc. | | | 25,852,138 | |
| | | | | | | | |
| | | | Health Care Services 2.5% | | | | |
| | 521,941 | | | MEDNAX, Inc.* | | | 36,212,267 | |
| | | | | | | | |
| | | | Homebuilding 1.8% | | | | |
| | 492,810 | | | Installed Building Products, Inc.* | | | 25,995,727 | |
| | | | | | | | |
| | | | Industrial Machinery 0.6% | | | | |
| | 95,187 | | | RBC Bearings, Inc.* | | | 9,241,706 | |
| | | | | | | | |
| | | | | | | | |
| Shares | | | | | Value | |
| | | | | | | |
| | | | Internet & Direct Marketing Retail 2.7% | | | | |
| | 508,640 | | | MakeMyTrip Ltd.* (India) | | $ | 17,598,944 | |
| | 531,541 | | | Wayfair, Inc., Class A* | | | 21,522,095 | |
| | | | | | | | |
| | | | | | | 39,121,039 | |
| | | | | | | | |
| | | | Internet Software & Services 6.6% | | | | |
| | 463,804 | | | Cimpress N.V.* | | | 39,975,267 | |
| | 1,111,166 | | | Cornerstone OnDemand, Inc.* | | | 43,213,246 | |
| | 429,592 | | | Envestnet, Inc.* | | | 13,875,821 | |
| | | | | | | | |
| | | | | | | 97,064,334 | |
| | | | | | | | |
| | | �� | IT Consulting & Other Services 3.0% | | | | |
| | 319,418 | | | EPAM Systems, Inc.* | | | 24,122,448 | |
| | 320,124 | | | Luxoft Holding, Inc.* (Switzerland) | | | 20,023,756 | |
| | | | | | | | |
| | | | | | | 44,146,204 | |
| | | | | | | | |
| | | | Life Sciences Tools & Services 2.5% | | | | |
| | 452,985 | | | ICON plc* (Ireland) | | | 36,111,964 | |
| | | | | | | | |
| | | | Managed Health Care 1.3% | | | | |
| | 439,385 | | | HealthEquity, Inc.* | | | 18,651,893 | |
| | | | | | | | |
| | | | Personal Products 1.1% | | | | |
| | 283,139 | | | Nu Skin Enterprises, Inc., Class A | | | 15,725,540 | |
| | | | | | | | |
| | | | Real Estate Services 1.3% | | | | |
| | 660,390 | | | HFF, Inc., Class A | | | 18,272,991 | |
| | | | | | | | |
| | | | Regional Banks 10.4% | | | | |
| | 458,021 | | | Eagle Bancorp, Inc.* | | | 27,343,854 | |
| | 340,636 | | | Independent Bank Corp. | | | 22,141,340 | |
| | 577,628 | | | Metro Bank plc* (United Kingdom) | | | 23,549,536 | |
| | 220,804 | | | South State Corp. | | | 19,728,837 | |
| | 436,026 | | | Texas Capital Bancshares, Inc.* | | | 36,386,370 | |
| | 444,763 | | | Webster Financial Corp. | | | 22,255,940 | |
| | | | | | | | |
| | | | | | | 151,405,877 | |
| | | | | | | | |
| | | | Restaurants 1.6% | | | | |
| | 681,753 | | | Fiesta Restaurant Group, Inc.* | | | 16,498,423 | |
| | 402,822 | | | Zoe’s Kitchen, Inc.* | | | 7,452,207 | |
| | | | | | | | |
| | | | | | | 23,950,630 | |
| | | | | | | | |
| | | | Semiconductors 4.1% | | | | |
| | 528,687 | | | Cavium, Inc.* | | | 37,885,711 | |
| | 237,314 | | | Monolithic Power Systems, Inc. | | | 21,856,619 | |
| | | | | | | | |
| | | | | | | 59,742,330 | |
| | | | | | | | |
| | | | Specialty Chemicals 2.6% | | | | |
| | 461,056 | | | Balchem Corp. | | | 38,000,236 | |
| | | | | | | | |
| | | | Specialty Stores 1.2% | | | | |
| | 406,157 | | | Five Below, Inc.* | | | 17,590,660 | |
| | | | | | | | |
| | | | Systems Software 3.2% | | | | |
| | 253,394 | | | CyberArk Software Ltd.* (Israel) | | | 12,890,153 | |
| | 642,523 | | | Fortinet, Inc.* | | | 24,640,757 | |
| | 117,211 | | | Proofpoint, Inc.* | | | 8,715,810 | |
| | | | | | | | |
| | | | | | | 46,246,720 | |
| | | | | | | | |
| | | | Trading Companies & Distributors 2.4% | | | | |
| | 505,218 | | | WESCO International, Inc.* | | | 35,137,912 | |
| | | | | | | | |
| | | | Trucking 3.5% | | | | |
| | 627,240 | | | Knight Transportation, Inc. | | | 19,663,974 | |
| | 375,268 | | | Old Dominion Freight Line, Inc. | | | 32,111,683 | |
| | | | | | | | |
| | | | | | | 51,775,657 | |
| | | | | | | | |
| | |
| | | | Total Common Stocks
(cost $912,295,087) | | | 1,375,607,821 | |
| | | | | | | | |
47
| | |
| WASATCH CORE GROWTH FUND (WGROX / WIGRX) | | MARCH 31, 2017 (UNAUDITED) |
|
|
|
Schedule of Investments (continued)
| | | | | | | | |
| Shares | | | | | Value | |
| | | | | | | |
| | | | PREFERRED STOCKS 0.2% | | | | |
| | |
| | | | Systems Software 0.2% | | | | |
| | 209,500 | | | DocuSign, Inc., Series F Pfd.* *** † | | $ | 3,469,320 | |
| | | | | | | | |
| | |
| | | | Total Preferred Stocks
(cost $4,000,004) | | | 3,469,320 | |
| | | | | | | | |
| | |
| | | | WARRANTS 0.0% | | | | |
| | |
| | | | Biotechnology 0.0% | | | | |
| | 146,337 | | | Argos Therapeutics, Inc., expiring 8/2/2021* *** † | | | 17,560 | |
| | | | | | | | |
| | |
| | | | Total Warrants
(cost $0) | | | 17,560 | |
| | | | | | | | |
| | |
Principal
Amount | | | | | Value | |
| | | | | | | |
| | | | SHORT-TERM INVESTMENTS 5.8% | | | | |
| | |
| | | | Repurchase Agreement 5.8% | | | | |
| | $84,063,501 | | | Repurchase Agreement dated 3/31/17,
0.09% due 4/3/17 with State Street Bank
and Trust Co. collateralized by $83,685,000
of United States Treasury Notes 0.375%
due 7/15/25; value $85,748,254; repurchase
proceeds: $84,064,131 (cost $84,063,501) | | $ | 84,063,501 | |
| | | | | | | | |
| | |
| | | | Total Short-Term Investments
(cost $84,063,501) | | | 84,063,501 | |
| | | | | | | | |
| | |
| | | | Total Investments
(cost $1,000,358,592) 100.2% | | | 1,463,158,202 | |
| | |
| | | | Liabilities less Other Assets (0.2%) | | | (3,447,685 | ) |
| | | | | | | | |
| | |
| | | | NET ASSETS 100.0% | | $ | 1,459,710,517 | |
| | | | | | | | |
| |
| | | | *Non-income producing. ***Security was fair valued under procedures adopted by the Board of Trustees (see Note 13). †Security purchased in a private placement transaction or under Rule 144A of the Securities Act of 1933 (see Note 9). REIT Real Estate Investment Trust. See Notes to Financial Statements. | |
At March 31, 2017, Wasatch Core Growth Fund’s investments, excluding short-term investments, were in the following countries:
| | | | |
| Country | | % | |
Argentina | | | 0.8 | |
Canada | | | 2.3 | |
India | | | 3.6 | |
Ireland | | | 2.6 | |
Israel | | | 0.9 | |
Switzerland | | | 1.5 | |
United Kingdom | | | 3.1 | |
United States | | | 85.2 | |
| | | | |
TOTAL | | | 100.0 | % |
| | | | |
48
| | |
| WASATCH EMERGING INDIA FUND (WAINX / WIINX) | | MARCH 31, 2017 (UNAUDITED) |
|
|
|
Schedule of Investments
| | | | | | | | |
| Shares | | | | | Value | |
| | | | | | | |
| | | | COMMON STOCKS 95.3% | | | | |
| | |
| | | | Apparel, Accessories & Luxury Goods 1.4% | | | | |
| | 7,531 | | | Page Industries Ltd. (India) | | $ | 1,690,633 | |
| | | | | | | | |
| | | | Auto Parts & Equipment 4.9% | | | | |
| | 2,481 | | | Bosch Ltd. (India) | | | 866,585 | |
| | 20,717 | | | Dynamatic Technologies Ltd.* (India) | | | 864,365 | |
| | 275,064 | | | Endurance Technologies Ltd.* (India) | | | 3,242,227 | |
| | 12,926 | | | WABCO India Ltd. (India) | | | 1,154,352 | |
| | | | | | | | |
| | | | | | | 6,127,529 | |
| | | | | | | | |
| | | | Building Products 3.7% | | | | |
| | 214,165 | | | Kajaria Ceramics Ltd. (India) | | | 1,926,116 | |
| | 248,991 | | | Somany Ceramics Ltd. (India) | | | 2,637,729 | |
| | | | | | | | |
| | | | | | | 4,563,845 | |
| | | | | | | | |
| | | | Commodity Chemicals 5.0% | | | | |
| | 701,301 | | | Berger Paints India Ltd. (India) | | | 2,617,931 | |
| | 336,103 | | | Gulf Oil Lubricants India Ltd. (India) | | | 3,649,074 | |
| | | | | | | | |
| | | | | | | 6,267,005 | |
| | | | | | | | |
| | | | Construction Machinery & Heavy Trucks 0.6% | | | | |
| | 1,908 | | | Eicher Motors Ltd.* (India) | | | 748,391 | |
| | | | | | | | |
| | | | Consumer Finance 6.6% | | | | |
| | 251,555 | | | Bajaj Finance Ltd. (India) | | | 4,547,825 | |
| | 113,922 | | | Cholamandalam Investment and Finance Co. Ltd. (India) | | | 1,692,733 | |
| | 184,871 | | | Repco Home Finance Ltd. (India) | | | 1,978,819 | |
| | | | | | | | |
| | | | | | | 8,219,377 | |
| | | | | | | | |
| | | | Department Stores 2.0% | | | | |
| | 193,022 | | | V-Mart Retail Ltd. (India) | | | 2,437,781 | |
| | | | | | | | |
| | | | Diversified Banks 4.6% | | | | |
| | 50,146 | | | HDFC Bank Ltd. ADR (India) | | | 3,771,982 | |
| | 90,102 | | | IndusInd Bank Ltd. (India) | | | 1,978,331 | |
| | | | | | | | |
| | | | | | | 5,750,313 | |
| | | | | | | | |
| | | | Diversified Chemicals 1.9% | | | | |
| | 216,104 | | | Pidilite Industries Ltd. (India) | | | 2,319,952 | |
| | | | | | | | |
| | | | Electrical Components & Equipment 1.8% | | | | |
| | 160,580 | | | Amara Raja Batteries Ltd.* (India) | | | 2,210,803 | |
| | | | | | | | |
| | | | Fertilizers & Agricultural Chemicals 3.2% | | | | |
| | 19,929 | | | Bayer CropScience Ltd. (India) | | | 1,160,108 | |
| | 249,500 | | | UPL Ltd. (India) | | | 2,799,118 | |
| | | | | | | | |
| | | | | | | 3,959,226 | |
| | | | | | | | |
| | | | Financial Exchanges & Data 1.2% | | | | |
| | 49,174 | | | CRISIL Ltd. (India) | | | 1,442,619 | |
| | | | | | | | |
| | | | Food Retail 4.4% | | | | |
| | 7,627 | | | Avenue Supermarts Ltd.* (India) | | | 74,855 | |
| | 569,550 | | | Avenue Supermarts Ltd.* *** † (India) | | | 5,458,763 | |
| | | | | | | | |
| | | | | | | 5,533,618 | |
| | | | | | | | |
| | | | Health Care Facilities 0.8% | | | | |
| | 55,619 | | | Apollo Hospitals Enterprise Ltd.* (India) | | | 998,118 | |
| | | | | | | | |
| | | | Health Care Services 2.3% | | | | |
| | 190,207 | | | Dr. Lal PathLabs Ltd. (India) | | | 2,820,811 | |
| | | | | | | | |
| | | | Housewares & Specialties 0.9% | | | | |
| | 140,077 | | | LA Opala RG Ltd. (India) | | | 1,162,077 | |
| | | | | | | | |
| | | | Human Resource & Employment Services 2.8% | | | | |
| | 335,495 | | | Quess Corp. Ltd.* (India) | | | 3,539,140 | |
| | | | | | | | |
| | | | | | | | |
| Shares | | | | | Value | |
| | | | | | | |
| | | | Industrial Machinery 2.8% | | | | |
| | 52,156 | | | AIA Engineering Ltd. (India) | | $ | 1,244,965 | |
| | 310,529 | | | Elgi Equipments Ltd. (India) | | | 1,020,989 | |
| | 61,465 | | | Vesuvius India Ltd. (India) | | | 1,171,844 | |
| | | | | | | | |
| | | | | | | 3,437,798 | |
| | | | | | | | |
| | | | Internet & Direct Marketing Retail 4.5% | | | | |
| | 162,273 | | | MakeMyTrip Ltd.* (India) | | | 5,614,646 | |
| | | | | | | | |
| | | | Life & Health Insurance 3.6% | | | | |
| | 480,863 | | | ICICI Prudential Life Insurance Co. Ltd. (India) | | | 2,844,375 | |
| | 185,788 | | | Max Financial Services Ltd. (India) | | | 1,656,170 | |
| | | | | | | | |
| | | | | | | 4,500,545 | |
| | | | | | | | |
| | | | Life Sciences Tools & Services 1.2% | | | | |
| | 158,337 | | | Divi’s Laboratories Ltd.* (India) | | | 1,519,362 | |
| | | | | | | | |
| | | | Office Services & Supplies 2.2% | | | | |
| | 15,420 | | | 3M India Ltd.* (India) | | | 2,721,445 | |
| | | | | | | | |
| | | | Packaged Foods & Meats 3.6% | | | | |
| | 31,438 | | | Britannia Industries Ltd. (India) | | | 1,626,729 | |
| | 131,717 | | | Manpasand Beverages Ltd.* (India) | | | 1,430,053 | |
| | 771,838 | | | Prabhat Dairy Ltd. (India) | | | 1,440,622 | |
| | | | | | | | |
| | | | | | | 4,497,404 | |
| | | | | | | | |
| | | | Personal Products 5.6% | | | | |
| | 128,683 | | | Colgate-Palmolive India Ltd. (India) | | | 1,966,857 | |
| | 205,711 | | | Dabur India Ltd. (India) | | | 878,632 | |
| | 87,625 | | | Godrej Consumer Products Ltd. (India) | | | 2,267,036 | |
| | 15,794 | | | Procter & Gamble Hygiene & Health Care Ltd. (India) | | | 1,854,612 | |
| | | | | | | | |
| | | | | | | 6,967,137 | |
| | | | | | | | |
| | | | Pharmaceuticals 6.7% | | | | |
| | 35,035 | | | Amrutanjan Health Care Ltd. (India) | | | 319,138 | |
| | 149,602 | | | Aurobindo Pharma Ltd. (India) | | | 1,555,114 | |
| | 169,011 | | | Glenmark Pharmaceuticals Ltd. (India) | | | 2,186,979 | |
| | 329,344 | | | Natco Pharma Ltd. (India) | | | 4,306,046 | |
| | | | | | | | |
| | | | | | | 8,367,277 | |
| | | | | | | | |
| | | | Restaurants 0.3% | | | | |
| | 22,867 | | | Jubilant Foodworks Ltd. (India) | | | 389,815 | |
| | | | | | | | |
| | | | Soft Drinks 1.4% | | | | |
| | 269,472 | | | Varun Beverages Ltd.* (India) | | | 1,688,998 | |
| | | | | | | | |
| | | | Specialty Chemicals 1.9% | | | | |
| | 46,526 | | | Asian Paints Ltd. (India) | | | 766,656 | |
| | 340,104 | | | SH Kelkar & Co. Ltd.* (India) | | | 1,550,856 | |
| | | | | | | | |
| | | | | | | 2,317,512 | |
| | | | | | | | |
| | | | Textiles 2.5% | | | | |
| | 2,320,367 | | | Welspun India Ltd. (India) | | | 3,114,191 | |
| | | | | | | | |
| | | | Thrifts & Mortgage Finance 10.9% | | | | |
| | 207,064 | | | Gruh Finance Ltd. (India) | | | 1,253,194 | |
| | 243,728 | | | Housing Development Finance Corp. Ltd. (India) | | | 5,629,559 | |
| | 131,955 | | | Indiabulls Housing Finance Ltd. (India) | | | 2,028,858 | |
| | 56,349 | | | LIC Housing Finance Ltd. (India) | | | 535,461 | |
| | 221,275 | | | PNB Housing Finance Ltd.* (India) | | | 4,055,090 | |
| | | | | | | | |
| | | | | | | 13,502,162 | |
| | | | | | | | |
| | |
| | | | Total Common Stocks
(cost $82,031,947) | | | 118,429,530 | |
| | | | | | | | |
49
| | |
| WASATCH EMERGING INDIA FUND (WAINX / WIINX) | | MARCH 31, 2017 (UNAUDITED) |
|
|
|
Schedule of Investments (continued)
| | | | | | | | |
Principal
Amount | | | | | Value | |
| | | | | | | |
| | | | SHORT-TERM INVESTMENTS 5.4% | | | | |
| | |
| | | | Repurchase Agreement 5.4% | | | | |
| | $6,732,462 | | | Repurchase Agreement dated 3/31/17,
0.09% due 4/3/17 with State Street Bank
and Trust Co. collateralized by $6,705,000
of United States Treasury Notes 0.375%
due 7/15/25; value: $6,870,312; repurchase
proceeds: $6,732,512 (cost $6,732,462) | | $ | 6,732,462 | |
| | | | | | | | |
| | |
| | | | Total Short-Term Investments
(cost $6,732,462) | | | 6,732,462 | |
| | | | | | | | |
| | |
| | | | Total Investments
(cost $88,764,409) 100.7% | | | 125,161,992 | |
| | |
| | | | Liabilities less Other Assets (0.7%) | | | (883,878 | ) |
| | | | | | | | |
| | |
| | | | NET ASSETS 100.0% | | $ | 124,278,114 | |
| | | | | | | | |
| |
| | | | *Non-income producing. ***Security was fair valued under procedures adopted by the Board of Trustees (see Note 13). †Security purchased in a private placement transaction or under Rule 144A of the Securities Act of 1933 (see Note 9). ADR American Depositary Receipt. See Notes to Financial Statements. | |
At March 31, 2017, Wasatch Emerging India Fund’s investments, excluding short-term investments, were in the following country:
| | | | |
| Country | | % | |
India | | | 100.0 | |
| | | | |
TOTAL | | | 100.0 | % |
| | | | |
50
| | |
| WASATCH EMERGING MARKETS SELECT FUND (WAESX / WIESX) | | MARCH 31, 2017 (UNAUDITED) |
|
|
|
Schedule of Investments
| | | | | | | | |
| Shares | | | | | Value | |
| | | | | | | |
| | | | COMMON STOCKS 96.1% | | | | |
| | |
| | | | Airport Services 4.2% | | | | |
| | 79,649 | | | Grupo Aeroportuario del Pacifico S.A.B. de C.V., Class B (Mexico) | | $ | 773,506 | |
| | 45,156 | | | Grupo Aeroportuario del Sureste S.A.B. de C.V., Class B (Mexico) | | | 782,321 | |
| | | | | | | | |
| | | | 1,555,827 | |
| | | | | | | | |
| | | | Biotechnology 4.3% | | | | |
| | 3,880 | | | Medytox, Inc. (Korea) | | | 1,606,403 | |
| | | | | | | | |
| | | | Cable & Satellite 3.9% | | | | |
| | 8,334 | | | Naspers Ltd., Class N (South Africa) | | | 1,438,048 | |
| | | | | | | | |
| | | | Commodity Chemicals 1.8% | | | | |
| | 179,295 | | | Berger Paints India Ltd. (India) | | | 669,302 | |
| | | | | | | | |
| | | | Consumer Finance 4.5% | | | | |
| | 91,796 | | | Bajaj Finance Ltd. (India) | | | 1,659,566 | |
| | | | | | | | |
| | | | Diversified Banks 8.3% | | | | |
| | 49,280 | | | HDFC Bank Ltd. (India) | | | 1,092,834 | |
| | 209,076 | | | Kasikornbank Public Co. Ltd. (Thailand) | | | 1,149,956 | |
| | 657,989 | | | PT Bank Central Asia Tbk (Indonesia) | | | 817,209 | |
| | | | | | | | |
| | | | 3,059,999 | |
| | | | | | | | |
| | | | Drug Retail 3.5% | | | | |
| | 68,943 | | | Raia Drogasil S.A. (Brazil) | | | 1,292,048 | |
| | | | | | | | |
| | | | Fertilizers & Agricultural Chemicals 2.1% | | | | |
| | 70,892 | | | UPL Ltd. (India) | | | 795,331 | |
| | | | | | | | |
| | | | Food Retail 4.9% | | | | |
| | 14,259 | | | BGF Retail Co. Ltd. (Korea) | | | 1,338,814 | |
| | 56,665 | | | President Chain Store Corp. (Taiwan) | | | 466,878 | |
| | | | | | | | |
| | | | 1,805,692 | |
| | | | | | | | |
| | | | Health Care Facilities 4.4% | | | | |
| | 1,508,937 | | | Bangkok Dusit Medical Services Public Co. Ltd., Class F (Thailand) | | | 930,941 | |
| | 32,010 | | | NMC Health plc (United Arab Emirates) | | | 709,464 | |
| | | | | | | | |
| | | | 1,640,405 | |
| | | | | | | | |
| | | | Highways & Railtracks 2.1% | | | | |
| | 72,292 | | | Promotora y Operadora de Infraestructura S.A.B. de C.V. (Mexico) | | | 780,521 | |
| | | | | | | | |
| | | | Home Furnishings 1.9% | | | | |
| | 74,000 | | | Nien Made Enterprise Co. Ltd. (Taiwan) | | | 690,187 | |
| | | | | | | | |
| | | | Hypermarkets & Super Centers 2.1% | | | | |
| | 114,154 | | | Lenta Ltd.-REG S GDR* (Russia) | | | 776,247 | |
| | | | | | | | |
| | | | Industrial Machinery 1.6% | | | | |
| | 106,015 | | | Weg S.A. (Brazil) | | | 589,236 | |
| | | | | | | | |
| | | | Internet & Direct Marketing Retail 6.8% | | | | |
| | 29,728 | | | Ctrip.com International Ltd. ADR* (China) | | | 1,461,131 | |
| | 30,898 | | | MakeMyTrip Ltd.* (India) | | | 1,069,071 | |
| | | | | | | | |
| | | | 2,530,202 | |
| | | | | | | | |
| | | | | | | | |
| Shares | | | | | Value | |
| | | | | | | |
| | | | Internet Software & Services 7.3% | | | | |
| | 10,039 | | | MercadoLibre, Inc. (Brazil) | | $ | 2,122,947 | |
| | 20,000 | | | Tencent Holdings Ltd. (China) | | | 573,377 | |
| | | | | | | | |
| | | | 2,696,324 | |
| | | | | | | | |
| | | | Life & Health Insurance 5.1% | | | | |
| | 82,653 | | | Discovery Ltd. (South Africa) | | | 792,939 | |
| | 188,164 | | | ICICI Prudential Life Insurance Co. Ltd. (India) | | | 1,113,017 | |
| | | | | | | | |
| | | | 1,905,956 | |
| | | | | | | | |
| | | | Marine Ports & Services 2.1% | | | | |
| | 434,240 | | | International Container Terminal Services, Inc. (Philippines) | | | 778,040 | |
| | | | | | | | |
| | | | Multi-Line Insurance 1.9% | | | | |
| | 76,222 | | | BB Seguridade Participacoes S.A. (Brazil) | | | 710,944 | |
| | | | | | | | |
| | | | Multi-Sector Holdings 2.9% | | | | |
| | 46,851 | | | GT Capital Holdings, Inc. (Philippines) | | | 1,069,146 | |
| | | | | | | | |
| | | | Packaged Foods & Meats 4.7% | | | | |
| | 12,307 | | | Britannia Industries Ltd. (India) | | | 636,814 | |
| | 151,486 | | | Universal Robina Corp. (Philippines) | | | 493,632 | |
| | 313,651 | | | Vitasoy International Holdings Ltd. (China) | | | 623,145 | |
| | | | | | | | |
| | | | 1,753,591 | |
| | | | | | | | |
| | | | Personal Products 3.2% | | | | |
| | 21,448 | | | Godrej Consumer Products Ltd. (India) | | | 554,903 | |
| | 878 | | | LG Household & Health Care Ltd. (Korea) | | | 636,733 | |
| | | | | | | | |
| | | | 1,191,636 | |
| | | | | | | | |
| | | | Pharmaceuticals 2.0% | | | | |
| | 57,750 | | | Glenmark Pharmaceuticals Ltd. (India) | | | 747,277 | |
| | | | | | | | |
| | | | Regional Banks 2.1% | | | | |
| | 164,828 | | | Grupo Financiero Interacciones S.A. de C.V., Class O (Mexico) | | | 765,935 | |
| | | | | | | | |
| | | | Restaurants 2.0% | | | | |
| | 217,225 | | | Alsea S.A.B. de C.V. (Mexico) | | | 725,737 | |
| | | | | | | | |
| | | | Specialty Chemicals 1.4% | | | | |
| | 30,484 | | | Asian Paints Ltd. (India) | | | 502,316 | |
| | | | | | | | |
| | | | Textiles 1.9% | | | | |
| | 533,321 | | | Welspun India Ltd. (India) | | | 715,776 | |
| | | | | | | | |
| | | | Thrifts & Mortgage Finance 3.1% | | | | |
| | 62,749 | | | PNB Housing Finance Ltd.* (India) | | | 1,149,939 | |
| | | | | | | | |
| | |
| | | | Total Common Stocks
(cost $30,238,180) | | | 35,601,631 | |
| | | | | | | | |
| | |
| | | | PREFERRED STOCKS 2.5% | | | | |
| | |
| | | | Diversified Banks 2.5% | | | | |
| | 89,371 | | | Banco Davivienda S.A. (Colombia) | | | 930,086 | |
| | | | | | | | |
| | |
| | | | Total Preferred Stocks
(cost $825,419) | | | 930,086 | |
| | | | | | | | |
51
| | |
| WASATCH EMERGING MARKETS SELECT FUND (WAESX / WIESX) | | MARCH 31, 2017 (UNAUDITED) |
|
|
|
Schedule of Investments (continued)
| | | | | | | | |
Principal
Amount | | | | | Value | |
| | | | | | | |
| | | | SHORT-TERM INVESTMENTS 2.2% | | | | |
| | |
| | | | Repurchase Agreement 2.2% | | | | |
| | $823,425 | | | Repurchase Agreement dated 3/31/17, 0.09% due 4/3/17 with State Street Bank and Trust Co. collateralized by $880,000 of United States Treasury Bonds 2.750% due 8/15/42; value: $840,657; repurchase proceeds: $823,431 (cost $823,425) | | $ | 823,425 | |
| | | | | | | | |
| | |
| | | | Total Short-Term Investments
(cost $823,425) | | | 823,425 | |
| | | | | | | | |
| | |
| | | | Total Investments
(cost $31,887,024) 100.8% | | | 37,355,142 | |
| | |
| | | | Liabilities less Other Assets (0.8%) | | | (284,983 | ) |
| | | | | | | | |
| | |
| | | | NET ASSETS 100.0% | | $ | 37,070,159 | |
| | | | | | | | |
| |
| | | | *Non-income producing. ADR American Depositary Receipt. GDR Global Depositary Receipt. See Notes to Financial Statements. | |
At March 31, 2017, Wasatch Emerging Markets Select Fund’s investments, excluding short-term investments, were in the following countries:
| | | | |
| Country | | % | |
Brazil | | | 12.9 | |
China | | | 7.3 | |
Colombia | | | 2.6 | |
India | | | 29.3 | |
Indonesia | | | 2.2 | |
Korea | | | 9.8 | |
Mexico | | | 10.5 | |
Philippines | | | 6.4 | |
Russia | | | 2.1 | |
South Africa | | | 6.1 | |
Taiwan | | | 3.2 | |
Thailand | | | 5.7 | |
United Arab Emirates | | | 1.9 | |
| | | | |
TOTAL | | | 100.0 | % |
| | | | |
52
| | |
| WASATCH EMERGING MARKETS SMALL CAP FUND (WAEMX / WIEMX) | | MARCH 31, 2017 (UNAUDITED) |
|
|
|
Schedule of Investments
| | | | | | | | |
| Shares | | | | | Value | |
| | | | | | | |
| | | | COMMON STOCKS 96.9% | | | | |
| | |
| | | | Aerospace & Defense 0.5% | | | | |
| | 44,350 | | | LIG Nex1 Co. Ltd. (Korea) | | $ | 3,113,185 | |
| | | | | | | | |
| | | | Airport Services 1.7% | | | | |
| | 1,371,402 | | | Grupo Aeroportuario del Centro Norte S.A.B. de C.V. (Mexico) | | | 7,428,267 | |
| | 198,672 | | | Grupo Aeroportuario del Sureste S.A.B. de C.V., Class B (Mexico) | | | 3,441,961 | |
| | | | | | | | |
| | | | | | | 10,870,228 | |
| | | | | | | | |
| | | | Asset Management & Custody Banks 0.7% | | | | |
| | 2,076,383 | | | Peregrine Holdings Ltd. (South Africa) | | | 4,249,882 | |
| | | | | | | | |
| | | | Auto Parts & Equipment 2.9% | | | | |
| | 371,894 | | | Cub Elecparts, Inc. (Taiwan) | | | 3,192,828 | |
| | 762,615 | | | Hu Lane Associate, Inc. (Taiwan) | | | 3,795,168 | |
| | 2,112,803 | | | Minth Group Ltd. (China) | | | 8,509,391 | |
| | 323,989 | | | Tung Thih Electronic Co. Ltd. (Taiwan) | | | 2,792,226 | |
| | | | | | | | |
| | | | | | | 18,289,613 | |
| | | | | | | | |
| | | | Automobile Manufacturers 0.4% | | | | |
| | 169,255 | | | Indus Motor Co. Ltd. (Pakistan) | | | 2,576,832 | |
| | | | | | | | |
| | | | Biotechnology 3.8% | | | | |
| | 9,174 | | | Cell Biotech Co. Ltd. (Korea) | | | 282,201 | |
| | 47,740 | | | China Biologic Products, Inc.* (China) | | | 4,780,206 | |
| | 25,187 | | | Hugel, Inc.* (Korea) | | | 8,313,084 | |
| | 26,213 | | | Medytox, Inc. (Korea) | | | 10,852,740 | |
| | | | | | | | |
| | | | | | | 24,228,231 | |
| | | | | | | | |
| | | | Building Products 1.3% | | | | |
| | 905,637 | | | Kajaria Ceramics Ltd. (India) | | | 8,144,945 | |
| | | | | | | | |
| | | | Commodity Chemicals 1.5% | | | | |
| | 2,495,664 | | | Berger Paints India Ltd. (India) | | | 9,316,223 | |
| | | | | | | | |
| | | | Communications Equipment 0.6% | | | | |
| | 410,237 | | | Advanced Ceramic X Corp. (Taiwan) | | | 4,029,023 | |
| | | | | | | | |
| | | | Consumer Finance 7.7% | | | | |
| | 594,685 | | | Bajaj Finance Ltd. (India) | | | 10,751,220 | |
| | 338,581 | | | Cholamandalam Investment and Finance Co. Ltd. (India) | | | 5,030,875 | |
| | 1,833,576 | | | Credito Real S.A.B. de C.V. (Mexico) | | | 2,572,770 | |
| | 138,217 | | | KRUK S.A. (Poland) | | | 8,385,660 | |
| | 3,644,700 | | | Muangthai Leasing Public Co. Ltd. (Thailand) | | | 3,288,052 | |
| | 547,173 | | | Repco Home Finance Ltd. (India) | | | 5,856,820 | |
| | 6,710,523 | | | Srisawad Power 1979 Public Co. Ltd. (Thailand) | | | 8,446,129 | |
| | 2,074,874 | | | Unifin Financiera SAPI de C.V. SOFOM (Mexico) | | | 5,308,468 | |
| | | | | | | | |
| | | | | | | 49,639,994 | |
| | | | | | | | |
| | | | Department Stores 2.1% | | | | |
| | 892,026 | | | Poya Co. Ltd. (Taiwan) | | | 10,495,288 | |
| | 3,009,657 | | | PT Matahari Department Store Tbk (Indonesia) | | | 2,975,666 | |
| | | | | | | | |
| | | | | | | 13,470,954 | |
| | | | | | | | |
| | | | Diversified Banks 3.7% | | | | |
| | 1,305,550 | | | Moneta Money Bank AS* (Czech Republic) | | | 4,422,282 | |
| | 1,729,984 | | | Security Bank Corp. (Philippines) | | | 6,964,759 | |
| | 619,991 | | | TCS Group Holding plc GDR (Russia) | | | 6,540,905 | |
| | 2,629,520 | | | United Bank Ltd. (Pakistan) | | | 5,769,242 | |
| | | | | | | | |
| | | | | | | 23,697,188 | |
| | | | | | | | |
| | | | Diversified Chemicals 1.2% | | | | |
| | 702,648 | | | Pidilite Industries Ltd. (India) | | | 7,543,173 | |
| | | | | | | | |
| | | | | | | | |
| Shares | | | | | Value | |
| | | | | | | |
| | | | Drug Retail 4.1% | | | | |
| | 1,430,178 | | | Clicks Group Ltd. (South Africa) | | $ | 13,655,515 | |
| | 679,522 | | | Raia Drogasil S.A. (Brazil) | | | 12,734,797 | |
| | | | | | | | |
| | | | 26,390,312 | |
| | | | | | | | |
| | | | Electrical Components & Equipment 2.7% | | | | |
| | 499,241 | | | Amara Raja Batteries Ltd.* (India) | | | 6,873,357 | |
| | 595,580 | | | Bizlink Holding, Inc. (Taiwan) | | | 3,385,929 | |
| | 520,110 | | | Voltronic Power Technology Corp. (Taiwan) | | | 6,942,228 | |
| | | | | | | | |
| | | | 17,201,514 | |
| | | | | | | | |
| | | | Electronic Components 3.7% | | | | |
| | 82,340 | | | Chunghwa Precision Test Tech Co. Ltd. (Taiwan) | | | 3,690,612 | |
| | 1,635,680 | | | KCE Electronics Public Co. Ltd. (Thailand) | | | 4,974,276 | |
| | 1,618,046 | | | Sunny Optical Technology Group Co. Ltd. (China) | | | 11,825,904 | |
| | 9,160,657 | | | Tongda Group Holdings Ltd. (China) | | | 3,241,563 | |
| | | | | | | | |
| | | | 23,732,355 | |
| | | | | | | | |
| | | | Electronic Equipment & Instruments 0.4% | | | | |
| | 902,241 | | | Chroma ATE, Inc.* (Taiwan) | | | 2,732,667 | |
| | | | | | | | |
| | | | Fertilizers & Agricultural Chemicals 2.3% | | | | |
| | 108,726 | | | Bayer CropScience Ltd. (India) | | | 6,329,164 | |
| | 767,955 | | | UPL Ltd. (India) | | | 8,615,619 | |
| | | | | | | | |
| | | | 14,944,783 | |
| | | | | | | | |
| | | | Financial Exchanges & Data 0.2% | | | | |
| | 126,476 | | | JSE Ltd. (South Africa) | | | 1,214,773 | |
| | | | | | | | |
| | | | Food Retail 1.6% | | | | |
| | 7,054 | | | Avenue Supermarts Ltd.* (India) | | | 69,231 | |
| | 107,976 | | | BGF Retail Co. Ltd. (Korea) | | | 10,138,138 | |
| | | | | | | | |
| | | | 10,207,369 | |
| | | | | | | | |
| | | | Footwear 0.9% | | | | |
| | 98,536 | | | CCC S.A. (Poland) | | | 5,913,601 | |
| | | | | | | | |
| | | | General Merchandise Stores 1.1% | | | | |
| | 120,139 | | | Magazine Luiza S.A.* (Brazil) | | | 6,796,338 | |
| | | | | | | | |
| | | | Health Care Equipment 1.4% | | | | |
| | 159,780 | | | DIO Corp.* (Korea) | | | 4,586,371 | |
| | 90,688 | | | InBody Co. Ltd. (Korea) | | | 1,861,119 | |
| | 101,485 | | | Value Added Technologies Co. Ltd. (Korea) | | | 2,545,519 | |
| | | | | | | | |
| | | | 8,993,009 | |
| | | | | | | | |
| | | | Health Care Facilities 1.2% | | | | |
| | 359,288 | | | NMC Health plc (United Arab Emirates) | | | 7,963,191 | |
| | | | | | | | |
| | | | Health Care Services 0.7% | | | | |
| | 297,325 | | | Dr. Lal PathLabs Ltd. (India) | | | 4,409,394 | |
| | | | | | | | |
| | | | Health Care Supplies 1.5% | | | | |
| | 18,540,589 | | | Yestar Healthcare Holdings Co. (China) | | | 9,614,434 | |
| | | | | | | | |
| | | | Highways & Railtracks 2.8% | | | | |
| | 2,895,650 | | | EcoRodovias Infraestrutura e Logistica S.A. (Brazil) | | | 8,361,552 | |
| | 12,826,196 | | | Yuexiu Transport Infrastructure Ltd. (China) | | | 9,885,983 | |
| | | | | | | | |
| | | | 18,247,535 | |
| | | | | | | | |
| | | | Home Furnishings 3.4% | | | | |
| | 39,292 | | | Hanssem Co. Ltd. (Korea) | | | 7,729,804 | |
| | 11,657,581 | | | Man Wah Holdings Ltd. (China) | | | 9,255,263 | |
| | 520,878 | | | Nien Made Enterprise Co. Ltd. (Taiwan) | | | 4,858,152 | |
| | | | | | | | |
| | | | 21,843,219 | |
| | | | | | | | |
53
| | |
| WASATCH EMERGING MARKETS SMALL CAP FUND (WAEMX / WIEMX) | | |
|
|
|
Schedule of Investments (continued)
| | | | | | | | |
| Shares | | | | | Value | |
| | | | | | | |
| | | | Home Improvement Retail 1.2% | | | | |
| | 26,834,471 | | | Home Product Center Public Co. Ltd. (Thailand) | | $ | 7,535,908 | |
| | | | | | | | |
| | | | Hotels, Resorts & Cruise Lines 1.3% | | | | |
| | 7,633,635 | | | Minor International Public Co. Ltd. (Thailand) | | | 8,164,018 | |
| | | | | | | | |
| | | | Human Resource & Employment Services 1.1% | | | | |
| | 195,556 | | | 51job, Inc. ADR* (China) | | | 7,169,083 | |
| | | | | | | | |
| | | | Hypermarkets & Super Centers 0.8% | | | | |
| | 776,545 | | | Lenta Ltd.-REG S GDR* (Russia) | | | 5,280,506 | |
| | | | | | | | |
| | | | Industrial Conglomerates 0.9% | | | | |
| | 8,458,539 | | | KAP Industrial Holdings Ltd. (South Africa) | | | 5,636,399 | |
| | | | | | | | |
| | | | Industrial Machinery 0.0% | | | | |
| | 30,808 | | | Airtac International Group (Taiwan) | | | 303,079 | |
| | | | | | | | |
| | | | Internet & Direct Marketing Retail 1.4% | | | | |
| | 264,370 | | | MakeMyTrip Ltd.* (India) | | | 9,147,202 | |
| | | | | | | | |
| | | | IT Consulting & Other Services 0.7% | | | | |
| | 449,972 | | | EOH Holdings Ltd. (South Africa) | | | 4,649,892 | |
| | | | | | | | |
| | | | Life & Health Insurance 0.8% | | | | |
| | 571,765 | | | Max Financial Services Ltd. (India) | | | 5,096,884 | |
| | | | | | | | |
| | | | Marine Ports & Services 1.2% | | | | |
| | 4,178,310 | | | International Container Terminal Services, Inc. (Philippines) | | | 7,486,399 | |
| | | | | | | | |
| | | | Movies & Entertainment 1.6% | | | | |
| | 760,457 | | | IMAX China Holding, Inc.* (China) | | | 3,914,081 | |
| | 80,798 | | | Loen Entertainment, Inc. (Korea) | | | 6,502,566 | |
| | | | | | | | |
| | | | 10,416,647 | |
| | | | | | | | |
| | | | Multi-Sector Holdings 0.8% | | | | |
| | 220,247 | | | GT Capital Holdings, Inc. (Philippines) | | | 5,026,065 | |
| | | | | | | | |
| | | | Office Services & Supplies 1.2% | | | | |
| | 43,546 | | | 3M India Ltd.* (India) | | | 7,685,348 | |
| | | | | | | | |
| | | | Oil & Gas Exploration & Production 0.8% | | | | |
| | 382,479 | | | Parex Resources, Inc.* (Colombia) | | | 4,875,000 | |
| | | | | | | | |
| | | | Other Diversified Financial Services 0.5% | | | | |
| | 157,177 | | | PSG Group Ltd. (South Africa) | | | 2,893,709 | |
| | | �� | | | | | |
| | | | Packaged Foods & Meats 4.6% | | | | |
| | 146,162 | | | Britannia Industries Ltd. (India) | | | 7,563,014 | |
| | 403,522 | | | Manpasand Beverages Ltd.* (India) | | | 4,381,043 | |
| | 705,542 | | | Namchow Chemical Industrial Co. Ltd. (Taiwan) | | | 1,439,336 | |
| | 491,422 | | | Standard Foods Corp. (Taiwan) | | | 1,221,166 | |
| | 1,399,294 | | | Ulker Biskuvi Sanayi A.S. (Turkey) | | | 7,107,256 | |
| | 3,895,243 | | | Vitasoy International Holdings Ltd. (China) | | | 7,738,860 | |
| | | | | | | | |
| | | | 29,450,675 | |
| | | | | | | | |
| | | | Pharmaceuticals 1.7% | | | | |
| | 13,017,213 | | | China Animal Healthcare Ltd.* *** (China) | | | 16,750 | |
| | 263,308 | | | Glenmark Pharmaceuticals Ltd. (India) | | | 3,407,169 | |
| | 578,980 | | | Natco Pharma Ltd. (India) | | | 7,569,940 | |
| | | | | | | | |
| | | | 10,993,859 | |
| | | | | | | | |
| | | | Property & Casualty Insurance 0.3% | | | | |
| | 1,376,540 | | | Qualitas Controladora S.A.B. de C.V.** (Mexico) | | | 2,252,049 | |
| | | | | | | | |
| | | | | | | | |
| Shares | | | | | Value | |
| | | | | | | |
| | | | Real Estate Operating Companies 1.9% | | | | |
| | 474,100 | | | Iguatemi Empresa de Shopping Centers S.A. (Brazil) | | $ | 4,967,252 | |
| | 2,757,148 | | | Parque Arauco S.A. (Chile) | | | 7,353,788 | |
| | | | | | | | |
| | | | 12,321,040 | |
| | | | | | | | |
| | | | Regional Banks 1.9% | | | | |
| | 756,168 | | | Banregio Grupo Financiero S.A.B. de C.V. (Mexico) | | | 4,515,057 | |
| | 440,826 | | | Grupo Financiero Interacciones S.A. de C.V., Class O (Mexico) | | | 2,048,464 | |
| | 32,295,660 | | | PT Bank Tabungan Negara Tbk (Indonesia) | | | 5,501,568 | |
| | | | | | | | |
| | | | 12,065,089 | |
| | | | | | | | |
| | | | Research & Consulting Services 0.6% | | | | |
| | 663,410 | | | Sporton International, Inc. (Taiwan) | | | 3,902,733 | |
| | | | | | | | |
| | | | Restaurants 2.9% | | | | |
| | 1,921,808 | | | Alsea S.A.B. de C.V. (Mexico) | | | 6,420,654 | |
| | 402,303 | | | Famous Brands Ltd.* (South Africa) | | | 4,672,157 | |
| | 768,531 | | | Gourmet Master Co. Ltd. (Taiwan) | | | 7,269,289 | |
| | | | | | | | |
| | | | 18,362,100 | |
| | | | | | | | |
| | | | Semiconductor Equipment 1.2% | | | | |
| | 169,239 | | | Koh Young Technology, Inc. (Korea) | | | 7,763,535 | |
| | | | | | | | |
| | | | Semiconductors 4.8% | | | | |
| | 656,645 | | | ASPEED Technology, Inc. (Taiwan) | | | 12,335,426 | |
| | 313,982 | | | eMemory Technology, Inc.* (Taiwan) | | | 4,444,435 | |
| | 590,352 | | | Silergy Corp. (Taiwan) | | | 10,895,514 | |
| | 659,760 | | | Win Semiconductors Corp. (Taiwan) | | | 2,935,407 | |
| | | | | | | | |
| | | | 30,610,782 | |
| | | | | | | | |
| | | | Specialty Chemicals 2.2% | | | | |
| | 24,123,079 | | | D&L Industries, Inc. (Philippines) | | | 6,115,507 | |
| | 146,219 | | | Frutarom Industries Ltd. (Israel) | | | 8,172,057 | |
| | | | | | | | |
| | | | 14,287,564 | |
| | | | | | | | |
| | | | Technology Hardware, Storage & Peripherals 1.8% | | | | |
| | 879,158 | | | Ennoconn Corp. (Taiwan) | | | 11,488,379 | |
| | | | | | | | |
| | | | Textiles 1.4% | | | | |
| | 6,776,773 | | | Welspun India Ltd. (India) | | | 9,095,184 | |
| | | | | | | | |
| | | | Thrifts & Mortgage Finance 1.2% | | | | |
| | 421,926 | | | PNB Housing Finance Ltd.* (India) | | | 7,732,224 | |
| | | | | | | | |
| | |
| | | | Total Common Stocks
(cost $475,494,734) | | | 621,065,317 | |
| | | | | | | | |
| | |
| | | | PREFERRED STOCKS 1.4% | | | | |
| | |
| | | | Personal Products 1.4% | | | | |
| | 19,648 | | | LG Household & Health Care Ltd. (Korea) | | | 8,960,458 | |
| | | | | | | | |
| | |
| | | | Total Preferred Stocks
(cost $9,212,136) | | | 8,960,458 | |
| | | | | | | | |
| | |
| | | | WARRANTS 0.0% | | | | |
| | |
| | | | Consumer Finance 0.0% | | | | |
| | 475,530 | | | Srisawad Power 1979 Public Co. Ltd., expiring 05/29/20* (Thailand) | | | 94,103 | |
| | | | | | | | |
| | | | Hotels, Resorts & Cruise Lines 0.0% | | | | |
| | 783,783 | | | Minor International Public Co. Ltd., expiring 11/3/17* (Thailand) | | | 70,252 | |
| | | | | | | | |
| | |
| | | | Total Warrants
(cost $0) | | | 164,355 | |
| | | | | | | | |
54
| | |
| | MARCH 31, 2017 (UNAUDITED) |
|
|
|
| | | | | | | | |
Principal
Amount | | | | | Value | |
| | | | | | | |
| | | | SHORT-TERM INVESTMENTS 1.1% | | | | |
| | |
| | | | Repurchase Agreement 1.1% | | | | |
| | $7,011,989 | | | Repurchase Agreement dated 3/31/17,
0.09% due 4/3/17 with State Street Bank
and Trust Co. collateralized by $7,490,000
of United States Treasury Bonds 2.750%
due 8/15/42; value $7,155,137; repurchase
proceeds: $7,012,041 (cost $7,011,989) | | $ | 7,011,989 | |
| | | | | | | | |
| | |
| | | | Total Short-Term Investments
(cost $7,011,989) | | | 7,011,989 | |
| | | | | | | | |
| | |
| | | | Total Investments
(cost $491,718,859) 99.4%§ | | | 637,202,119 | |
| | |
| | | | Other Assets less Liabilities 0.6% | | | 3,875,613 | |
| | | | | | | | |
| | |
| | | | NET ASSETS 100.0% | | $ | 641,077,732 | |
| | | | | | | | |
| |
| | | | *Non-income producing. **Common units. ***Security was fair valued under procedures adopted by the Board of Trustees (see Note 13). §The aggregate amount of foreign securities fair valued pursuant to a systematic valuation model as a percent of net assets was 1.27%. ADR American Depositary Receipt. GDR Global Depositary Receipt. See Notes to Financial Statements. | |
At March 31, 2017, Wasatch Emerging Markets Small Cap Fund’s investments, excluding short-term investments, were in the following countries:
| | | | |
| Country | | % | |
Brazil | | | 5.2 | |
Chile | | | 1.2 | |
China | | | 12.0 | |
Colombia | | | 0.8 | |
Czech Republic | | | 0.7 | |
India | | | 21.4 | |
Indonesia | | | 1.3 | |
Israel | | | 1.3 | |
Korea | | | 11.5 | |
Mexico | | | 5.4 | |
Pakistan | | | 1.3 | |
Philippines | | | 4.0 | |
Poland | | | 2.3 | |
Russia | | | 1.9 | |
South Africa | | | 5.9 | |
Taiwan | | | 16.2 | |
Thailand | | | 5.2 | |
Turkey | | | 1.1 | |
United Arab Emirates | | | 1.3 | |
| | | | |
TOTAL | | | 100.0 | % |
| | | | |
55
| | |
| WASATCH FRONTIER EMERGING SMALL COUNTRIES FUND (WAFMX / WIFMX) | | |
|
|
|
Schedule of Investments
| | | | | | | | |
| Shares | | | | | Value | |
| | | | | | | |
| | | | COMMON STOCKS 78.6% | | | | |
| | |
| | | | Aerospace & Defense 0.7% | | | | |
| | 484,905 | | | Aselsan Elektronik Sanayi Ve Ticaret A.S. (Turkey) | | $ | 2,266,790 | |
| | | | | | | | |
| | | | Air Freight & Logistics 1.7% | | | | |
| | 4,065,527 | | | Aramex PJSC (United Arab Emirates) | | | 5,479,147 | |
| | | | | | | | |
| | | | Automobile Manufacturers 4.7% | | | | |
| | 1,236,704 | | | Honda Atlas Cars Pakistan Ltd. (Pakistan) | | | 8,824,331 | |
| | 405,261 | | | Indus Motor Co. Ltd. (Pakistan) | | | 6,169,918 | |
| | | | | | | | |
| | | | 14,994,249 | |
| | | | | | | | |
| | | | Commodity Chemicals 0.9% | | | | |
| | 113,276 | | | Berger Paints Bangladesh Ltd. (Bangladesh) | | | 3,007,890 | |
| | | | | | | | |
| | | | Construction Materials 4.1% | | | | |
| | 1,278,100 | | | DG Khan Cement Co. Ltd. (Pakistan) | | | 2,831,620 | |
| | 1,281,342 | | | Lucky Cement Ltd. (Pakistan) | | | 10,206,489 | |
| | | | | | | | |
| | | | 13,038,109 | |
| | | | | | | | |
| | | | Diversified Banks 17.9% | | | | |
| | 5,077,162 | | | Banca Transilvania S.A. (Romania) | | | 3,163,785 | |
| | 63,941 | | | Banco Macro S.A. ADR (Argentina) | | | 5,543,685 | |
| | 1,459,484 | | | Bank for Foreign Trade of Vietnam JSC (Vietnam) | | | 2,366,731 | |
| | 846,650 | | | Commercial International Bank S.A.E (Egypt) | | | 3,523,846 | |
| | 17,964 | | | Credicorp Ltd. (Peru) | | | 2,933,521 | |
| | 135,399 | | | Grupo Financiero Galicia S.A. ADR (Argentina) | | | 5,126,206 | |
| | 117,705 | | | Grupo Supervielle S.A. ADR* (Argentina) | | | 2,000,985 | |
| | 4,013,500 | | | Habib Bank Ltd. (Pakistan) | | | 10,335,251 | |
| | 62,845 | | | Intergroup Financial Services Corp. (Peru) | | | 2,073,885 | |
| | 758 | | | Military Commercial Joint Stock Bank (Vietnam) | | | 511 | |
| | 2,422,349 | | | National Bank of Kuwait SAK (Kuwait) | | | 5,229,812 | |
| | 222,891 | | | TBC Bank Group plc* (Georgia) | | | 4,180,526 | |
| | 4,781,670 | | | United Bank Ltd. (Pakistan) | | | 10,491,120 | |
| | | | | | | | |
| | | | 56,969,864 | |
| | | | | | | | |
| | | | Diversified Real Estate Activities 2.8% | | | | |
| | 10,308,926 | | | Ayala Land, Inc. (Philippines) | | | 6,790,434 | |
| | 824,787 | | | Consultatio S.A. (Argentina) | | | 2,197,645 | |
| | | | | | | | |
| | | | 8,988,079 | |
| | | | | | | | |
| | | | Electric Utilities 3.2% | | | | |
| | 186,698 | | | Pampa Energia S.A. ADR* (Argentina) | | | 10,122,766 | |
| | | | | | | | |
| | | | Food Retail 6.1% | | | | |
| | 206,344 | | | BIM Birlesik Magazalar A.S. (Turkey) | | | 3,173,693 | |
| | 3,494,889 | | | CP ALL Public Co. Ltd. (Thailand) | | | 6,000,683 | |
| | 2,983,976 | | | Philippine Seven Corp. (Philippines) | | | 10,110,133 | |
| | | | | | | | |
| | | | 19,284,509 | |
| | | | | | | | |
| | | | Health Care Facilities 2.7% | | | | |
| | 392,147 | | | NMC Health plc (United Arab Emirates) | | | 8,691,471 | |
| | | | | | | | |
| | | | Industrial Conglomerates 1.2% | | | | |
| | 270,765 | | | SM Investments Corp. (Philippines) | | | 3,761,299 | |
| | | | | | | | |
| | | | Internet Software & Services 3.2% | | | | |
| | 47,689 | | | MercadoLibre, Inc. (Brazil) | | | 10,084,793 | |
| | | | | | | | |
| | | | Marine Ports & Services 0.2% | | | | |
| | 29,225 | | | DP World Ltd. (United Arab Emirates) | | | 628,337 | |
| | | | | | | | |
| | | | Multi-Line Insurance 0.3% | | | | |
| | 387,000 | | | Bao Viet Holdings (Vietnam) | | | 1,006,829 | |
| | | | | | | | |
| | | | Multi-Sector Holdings 3.9% | | | | |
| | 329,460 | | | Ayala Corp. (Philippines) | | | 5,548,454 | |
| | 306,017 | | | GT Capital Holdings, Inc. (Philippines) | | | 6,983,348 | |
| | | | | | | | |
| | | | | | | 12,531,802 | |
| | | | | | | | |
| | | | | | | | |
| Shares | | | | | Value | |
| | | | | | | |
| | | | Oil & Gas Refining & Marketing 0.9% | | | | |
| | 1,917,741 | | | Pilipinas Shell Petroleum Corp.* (Philippines) | | $ | 2,751,915 | |
| | | | | | | | |
| | | | Oil & Gas Storage & Transportation 2.1% | | | | |
| | 468,693 | | | Transportadora de Gas del Sur S.A. ADR* (Argentina) | | | 6,664,814 | |
| | | | | | | | |
| | | | Other Diversified Financial Services 0.5% | | | | |
| | 505,052 | | | FirstRand Ltd. (South Africa) | | | 1,745,213 | |
| | | | | | | | |
| | | | Packaged Foods & Meats 5.7% | | | | |
| | 4,492,712 | | | Century Pacific Food, Inc. (Philippines) | | | 1,513,240 | |
| | 1,574,862 | | | Olympic Industries Ltd. (Bangladesh) | | | 5,633,143 | |
| | 1,772,815 | | | Vietnam Dairy Products JSC (Vietnam) | | | 11,164,333 | |
| | | | | | | | |
| | | | | | | 18,310,716 | |
| | | | | | | | |
| | | | Pharmaceuticals 8.1% | | | | |
| | 414,821 | | | Abbott Laboratories Pakistan Ltd. (Pakistan) | | | 3,699,873 | |
| | 1,576,262 | | | Beximco Pharmaceuticals Ltd. (Bangladesh) | | | 2,166,642 | |
| | 566,893 | | | DHG Pharmaceutical JSC (Vietnam) | | | 3,447,945 | |
| | 556,215 | | | GlaxoSmithKline Consumer Healthcare Pakistan Ltd.* (Pakistan) | | | 461,771 | |
| | 1,236,831 | | | Searle Company Ltd. (The) (Pakistan) | | | 7,456,617 | |
| | 2,460,462 | | | Square Pharmaceuticals Ltd. (Bangladesh) | | | 8,519,656 | |
| | | | | | | | |
| | | | | | | 25,752,504 | |
| | | | | | | | |
| | | | Real Estate Operating Companies 2.1% | | | | |
| | 11,696,783 | | | SM Prime Holdings, Inc. (Philippines) | | | 6,597,289 | |
| | | | | | | | |
| | | | Restaurants 1.2% | | | | |
| | 41,998 | | | AmRest Holdings SE* (Poland) | | | 3,674,838 | |
| | 3,302,616 | | | Gulf National Holding Company* *** †† (Kuwait) | | | — | |
| | | | | | | | |
| | | | | | | 3,674,838 | |
| | | | | | | | |
| | | | Steel 0.0% | | | | |
| | 6 | | | Hoa Phat Group JSC (Vietnam) | | | 8 | |
| | | | | | | | |
| | | | Technology Distributors 1.9% | | | | |
| | 2,935,200 | | | FPT Corp. (Vietnam) | | | 6,101,295 | |
| | | | | | | | |
| | | | Tobacco 0.7% | | | | |
| | 76,935 | | | British American Tobacco Bangladesh Co. Ltd. (Bangladesh) | | | 2,349,819 | |
| | | | | | | | |
| | | | Wireless Telecommunication Services 1.8% | | | | |
| | 31,732,738 | | | Safaricom Ltd. (Kenya) | | | 5,632,484 | |
| | | | | | | | |
| | |
| | | | Total Common Stocks
(cost $186,072,614) | | | 250,436,829 | |
| | | | | | | | |
| | |
| | | | PARTICIPATION NOTES 0.4% | | | | |
| | |
| | | | Packaged Foods & Meats 0.4% | | | | |
| | 39,556 | | | Saudi Dairy & Foodstuff Co., HSBC Bank plc, expiring 6/04/18* (Saudi Arabia) | | | 1,394,915 | |
| | | | | | | | |
| | |
| | | | Total Participation Notes
(cost $1,232,471) | | | 1,394,915 | |
| | | | | | | | |
56
| | |
| | MARCH 31, 2017 (UNAUDITED) |
|
|
|
| | | | | | | | |
| Shares | | | | | Value | |
| | | | | | | |
| | | | PREFERRED STOCKS 2.2% | | | | |
| | |
| | | | Diversified Banks 2.2% | | | | |
| | 665,528 | | | Banco Davivienda S.A. (Colombia) | | $ | 6,926,169 | |
| | | | | | | | |
| | |
| | | | Total Preferred Stocks
(cost $6,693,722) | | | 6,926,169 | |
| | | | | | | | |
| | |
Principal
Amount | | | | | Value | |
| | | | | | | |
| | | | SHORT-TERM INVESTMENTS 2.2% | | | | |
| | |
| | | | Repurchase Agreement 2.2% | | | | |
| | $6,939,547 | | | Repurchase Agreement dated 3/31/17,
0.09% due 4/3/17 with State Street Bank
and Trust Co. collateralized by $6,910,000
of United States Treasury Notes 0.375%
due 7/15/25; value: $7,080,366; repurchase
proceeds: $6,939,599 (cost $6,939,547) | | $ | 6,939,547 | |
| | | | | | | | |
| | |
| | | | Total Short-Term Investments
(cost $6,939,547) | | | 6,939,547 | |
| | | | | | | | |
| | |
| | | | Total Investments
(cost $200,938,354) 83.4%§ | | | 265,697,460 | |
| | |
| | | | Other Assets less Liabilities 16.6%§§ | | | 53,055,369 | |
| | | | | | | | |
| | |
| | | | NET ASSETS 100.0% | | $ | 318,752,829 | |
| | | | | | | | |
| |
| | | | *Non-income producing. ***Security was fair valued under procedures adopted by the Board of Trustees (see Note 13). ††Shares were received in a spinoff of Kuwait Foods Americana. The shares are not listed for trading. §The aggregate amount of foreign securities fair valued pursuant to a systematic valuation model as a percent of net assets was 7.87%. §§Other Assets less Liabilities included naira, the Nigerian currency, which was fair valued during the period (see Note 13). ADR American Depositary Receipt. See Notes to Financial Statements. | |
At March 31, 2017, Wasatch Frontier Emerging Small Countries Fund’s investments, excluding short-term investments, were in the following countries:
| | | | |
| Country | | % | |
Argentina | | | 12.2 | |
Bangladesh | | | 8.4 | |
Brazil | | | 3.9 | |
Colombia | | | 2.7 | |
Egypt | | | 1.4 | |
Georgia | | | 1.6 | |
Kenya | | | 2.2 | |
Kuwait | | | 2.0 | |
Pakistan | | | 23.4 | |
Peru | | | 1.9 | |
Philippines | | | 17.0 | |
Poland | | | 1.4 | |
Romania | | | 1.2 | |
Saudi Arabia | | | 0.6 | |
South Africa | | | 0.7 | |
Thailand | | | 2.3 | |
Turkey | | | 2.1 | |
United Arab Emirates | | | 5.7 | |
Vietnam | | | 9.3 | |
| | | | |
TOTAL | | | 100.0 | % |
| | | | |
57
| | |
| WASATCH GLOBAL OPPORTUNITIES FUND (WAGOX / WIGOX) | | |
|
|
|
Schedule of Investments
| | | | | | | | |
| Shares | | | | | Value | |
| | | | | | | |
| | | | COMMON STOCKS 99.1% | | | | |
| | |
| | | | Airlines 3.1% | | | | |
| | 10,787 | | | Allegiant Travel Co. | | $ | 1,728,616 | |
| | 27,069 | | | Spirit Airlines, Inc.* | | | 1,436,552 | |
| | | | | | | | |
| | | | | | | 3,165,168 | |
| | | | | | | | |
| | | | Application Software 8.0% | | | | |
| | 17,559 | | | Aveva Group plc (United Kingdom) | | | 428,994 | |
| | 50,520 | | | Callidus Software, Inc.* | | | 1,078,602 | |
| | 19,339 | | | Globant S.A.* (Argentina) | | | 703,939 | |
| | 26,071 | | | HubSpot, Inc.* | | | 1,578,599 | |
| | 6,391 | | | Tyler Technologies, Inc.* | | | 987,793 | |
| | 10,256 | | | Ultimate Software Group, Inc. (The)* | | | 2,002,074 | |
| | 44,863 | | | Zendesk, Inc.* | | | 1,257,958 | |
| | | | | | | | |
| | | | | | | 8,037,959 | |
| | | | | | | | |
| | | | Auto Parts & Equipment 0.7% | | | | |
| | 15,349 | | | Linamar Corp. (Canada) | | | 698,170 | |
| | | | | | | | |
| | | | Biotechnology 7.5% | | | | |
| | 78,444 | | | Abcam plc (United Kingdom) | | | 811,322 | |
| | 41,099 | | | Exact Sciences Corp.* | | | 970,758 | |
| | 7,834 | | | Medytox, Inc. (Korea) | | | 3,243,443 | |
| | 89,818 | | | Sangamo Therapeutics, Inc.* | | | 467,054 | |
| | 33,129 | | | Seattle Genetics, Inc.* | | | 2,082,489 | |
| | | | | | | | |
| | | | | | | 7,575,066 | |
| | | | | | | | |
| | | | Building Products 4.2% | | | | |
| | 179,001 | | | Somany Ceramics Ltd. (India) | | | 1,896,278 | |
| | 33,626 | | | Trex Co., Inc.* | | | 2,333,308 | |
| | | | | | | | |
| | | | | | | 4,229,586 | |
| | | | | | | | |
| | | | Consumer Finance 4.3% | | | | |
| | 43,767 | | | Bajaj Finance Ltd. (India) | | | 791,257 | |
| | 63,537 | | | Cholamandalam Investment and Finance Co. Ltd. (India) | | | 944,078 | |
| | 7,714 | | | Credit Acceptance Corp.* | | | 1,538,249 | |
| | 845,561 | | | Srisawad Power 1979 Public Co. Ltd. (Thailand) | | | 1,064,256 | |
| | | | | | | | |
| | | | | | | 4,337,840 | |
| | | | | | | | |
| | | | Diversified Chemicals 1.0% | | | | |
| | 95,598 | | | Pidilite Industries Ltd. (India) | | | 1,026,278 | |
| | | | | | | | |
| | | | Diversified Real Estate Activities 0.9% | | | | |
| | 51,222 | | | Patrizia Immobilien AG* (Germany) | | | 907,084 | |
| | | | | | | | |
| | | | Diversified Support Services 2.0% | | | | |
| | 32,875 | | | Copart, Inc.* | | | 2,035,949 | |
| | | | | | | | |
| | | | Drug Retail 1.1% | | | | |
| | 7,090 | | | Ain Holdings, Inc. (Japan) | | | 478,271 | |
| | 3,370 | | | Cosmos Pharmaceutical Corp. (Japan) | | | 658,078 | |
| | | | | | | | |
| | | | | | | 1,136,349 | |
| | | | | | | | |
| | | | Electrical Components & Equipment 0.9% | | | | |
| | 68,841 | | | Voltronic Power Technology Corp. (Taiwan) | | | 918,863 | |
| | | | | | | | |
| | | | Fertilizers & Agricultural Chemicals 0.8% | | | | |
| | 72,192 | | | UPL Ltd. (India) | | | 809,916 | |
| | | | | | | | |
| | | | Food Retail 0.0% | | | | |
| | 2,868 | | | Avenue Supermarts Ltd.* (India) | | | 28,148 | |
| | | | | | | | |
| | | | General Merchandise Stores 2.8% | | | | |
| | 47,800 | | | Ollie’s Bargain Outlet Holdings, Inc.* | | | 1,601,300 | |
| | 28,784 | | | Seria Co. Ltd. (Japan) | | | 1,241,024 | |
| | | | | | | | |
| | | | | | | 2,842,324 | |
| | | | | | | | |
| | | | | | | | |
| Shares | | | | | Value | |
| | | | | | | |
| | | | Health Care Equipment 2.2% | | | | |
| | 12,869 | | | Cochlear Ltd. (Australia) | | $ | 1,329,570 | |
| | 31,620 | | | DIO Corp.* (Korea) | | | 907,629 | |
| | | | | | | | |
| | | | | | | 2,237,199 | |
| | | | | | | | |
| | | | Health Care Facilities 1.8% | | | | |
| | 95,647 | | | Ensign Group, Inc. (The) | | | 1,798,163 | |
| | | | | | | | |
| | | | Health Care Services 1.0% | | | | |
| | 64,377 | | | Dr. Lal PathLabs Ltd. (India) | | | 954,725 | |
| | | | | | | | |
| | | | Health Care Supplies 1.1% | | | | |
| | 15,620 | | | Sartorius Stedim Biotech (France) | | | 1,052,294 | |
| | | | | | | | |
| | | | Health Care Technology 0.5% | | | | |
| | 21,480 | | | M3, Inc. (Japan) | | | 533,093 | |
| | | | | | | | |
| | | | Highways & Railtracks 1.5% | | | | |
| | 504,700 | | | EcoRodovias Infraestrutura e Logistica S.A. (Brazil) | | | 1,457,384 | |
| | | | | | | | |
| | | | Homebuilding 2.8% | | | | |
| | 28,113 | | | Installed Building Products, Inc.* | | | 1,482,961 | |
| | 39,666 | | | LGI Homes, Inc.* | | | 1,345,074 | |
| | | | | | | | |
| | | | | | | 2,828,035 | |
| | | | | | | | |
| | | | Industrial Machinery 1.3% | | | | |
| | 440,543 | | | Rotork plc (United Kingdom) | | | 1,342,910 | |
| | | | | | | | |
| | | | Internet & Direct Marketing Retail 4.4% | | | | |
| | 91,309 | | | MakeMyTrip Ltd.* (India) | | | 3,159,291 | |
| | 31,350 | | | Wayfair, Inc., Class A* | | | 1,269,362 | |
| | | | | | | | |
| | | | | | | 4,428,653 | |
| | | | | | | | |
| | | | Internet Software & Services 9.9% | | | | |
| | 14,557 | | | Cimpress N.V.* | | | 1,254,668 | |
| | 46,886 | | | Cornerstone OnDemand, Inc.* | | | 1,823,396 | |
| | 22,270 | | | Dip Corp. (Japan) | | | 485,887 | |
| | 43,282 | | | Envestnet, Inc.* | | | 1,398,009 | |
| | 44,698 | | | Gurunavi, Inc. (Japan) | | | 935,474 | |
| | 13,247 | | | MercadoLibre, Inc. (Brazil) | | | 2,801,343 | |
| | 9,951 | | | Rightmove plc (United Kingdom) | | | 497,208 | |
| | 30,415 | | | SMS Co. Ltd. (Japan) | | | 771,235 | |
| | | | | | | | |
| | | | | | | 9,967,220 | |
| | | | | | | | |
| | | | IT Consulting & Other Services 1.4% | | | | |
| | 21,958 | | | Luxoft Holding, Inc.* (Switzerland) | | | 1,373,473 | |
| | | | | | | | |
| | | | Life & Health Insurance 2.3% | | | | |
| | 392,191 | | | ICICI Prudential Life Insurance Co. Ltd. (India) | | | 2,319,867 | |
| | | | | | | | |
| | | | Managed Health Care 2.5% | | | | |
| | 60,162 | | | HealthEquity, Inc.* | | | 2,553,877 | |
| | | | | | | | |
| | | | Movies & Entertainment 1.1% | | | | |
| | 13,950 | | | Loen Entertainment, Inc. (Korea) | | | 1,122,686 | |
| | | | | | | | |
| | | | Office Services & Supplies 1.4% | | | | |
| | 5,495 | | | 3M India Ltd.* (India) | | | 969,802 | |
| | 116,680 | | | IWG plc (United Kingdom) | | | 466,341 | |
| | | | | | | | |
| | | | | | | 1,436,143 | |
| | | | | | | | |
| | | | Packaged Foods & Meats 1.3% | | | | |
| | 117,660 | | | Manpasand Beverages Ltd.* (India) | | | 1,277,436 | |
| | | | | | | | |
| | | | Pharmaceuticals 3.1% | | | | |
| | 14,891 | | | Intra-Cellular Therapies, Inc.* | | | 241,979 | |
| | 12,972 | | | Ipsen S.A. (France) | | | 1,297,500 | |
| | 117,017 | | | Natco Pharma Ltd. (India) | | | 1,529,952 | |
| | | | | | | | |
| | | | | | | 3,069,431 | |
| | | | | | | | |
58
| | |
| | MARCH 31, 2017 (UNAUDITED) |
|
|
|
| | | | | | | | |
| Shares | | | | | Value | |
| | | | | | | |
| | | | Regional Banks 5.1% | | | | |
| | 19,184 | | | Eagle Bancorp, Inc.* | | $ | 1,145,285 | |
| | 18,751 | | | Metro Bank plc* (United Kingdom) | | | 764,467 | |
| | 10,552 | | | Signature Bank* | | | 1,565,811 | |
| | 20,125 | | | Texas Capital Bancshares, Inc.* | | | 1,679,431 | |
| | | | | | | | |
| | | | | | | 5,154,994 | |
| | | | | | | | |
| | | | Research & Consulting Services 1.3% | | | | |
| | 41,000 | | | Nihon M&A Center, Inc. (Japan) | | | 1,333,154 | |
| | | | | | | | |
| | | | Restaurants 2.8% | | | | |
| | 23,692 | | | Chuy’s Holdings, Inc.* | | | 706,022 | |
| | 28,231 | | | Domino’s Pizza Enterprises Ltd. (Australia) | | | 1,253,560 | |
| | 36,072 | | | Fiesta Restaurant Group, Inc.* | | | 872,942 | |
| | | | | | | | |
| | | | | | | 2,832,524 | |
| | | | | | | | |
| | | | Semiconductors 4.6% | | | | |
| | 47,640 | | | Cavium, Inc.* | | | 3,413,883 | |
| | 13,518 | | | Melexis N.V. (Belgium) | | | 1,171,129 | |
| | | | | | | | |
| | | | | | | 4,585,012 | |
| | | | | | | | |
| | | | Specialized Finance 0.8% | | | | |
| | 21,474 | | | Banca IFIS S.p.A. (Italy) | | | 823,101 | |
| | | | | | | | |
| | | | Specialty Chemicals 1.1% | | | | |
| | 20,329 | | | Frutarom Industries Ltd. (Israel) | | | 1,136,171 | |
| | | | | | | | |
| | | | Specialty Stores 1.6% | | | | |
| | 21,338 | | | Five Below, Inc.* | | | 924,149 | |
| | 65,558 | | | XXL ASA (Norway) | | | 713,898 | |
| | | | | | | | |
| | | | | | | 1,638,047 | |
| | | | | | | | |
| | | | Systems Software 1.0% | | | | |
| | 19,531 | | | CyberArk Software Ltd.* (Israel) | | | 993,542 | |
| | | | | | | | |
| | | | Trading Companies & Distributors 2.0% | | | | |
| | 37,100 | | | MISUMI Group, Inc. (Japan) | | | 670,486 | |
| | 44,200 | | | MonotaRO Co. Ltd. (Japan) | | | 1,365,741 | |
| | | | | | | | |
| | | | | | | 2,036,227 | |
| | | | | | | | |
| | | | Trucking 1.9% | | | | |
| | 59,941 | | | Knight Transportation, Inc. | | | 1,879,150 | |
| | | | | | | | |
| | |
| | | | Total Common Stocks
(cost $71,944,911) | | | 99,913,211 | |
| | | | | | | | |
| | | | | | | | |
| Shares | | | | | Value | |
| | | | | | | |
| | | | WARRANTS 0.0% | | | | |
| | |
| | | | Consumer Finance 0.0% | | | | |
| | 89,968 | | | Srisawad Power 1979 Public Co. Ltd., expiring 05/29/20* (Thailand) | | $ | 17,804 | |
| | | | | | | | |
| | |
| | | | Total Warrants
(cost $0) | | | 17,804 | |
| | | | | | | | |
| | |
| | | | Total Investments
(cost $71,944,911) 99.1%§ | | | 99,931,015 | |
| | |
| | | | Other Assets less Liabilities 0.9% | | | 874,424 | |
| | | �� | | | | | |
| | |
| | | | NET ASSETS 100.0% | | $ | 100,805,439 | |
| | | | | | | | |
| |
| | | | *Non-income producing. §The aggregate amount of foreign securities fair valued pursuant to a systematic valuation model as a percent of net assets was 1.13%. See Notes to Financial Statements. | |
At March 31, 2017, Wasatch Global Opportunities Fund’s investments, were in the following countries:
| | | | |
| Country | | % | |
Argentina | | | 0.7 | |
Australia | | | 2.6 | |
Belgium | | | 1.2 | |
Brazil | | | 4.3 | |
Canada | | | 0.7 | |
France | | | 2.3 | |
Germany | | | 0.9 | |
India | | | 15.7 | |
Israel | | | 2.1 | |
Italy | | | 0.8 | |
Japan | | | 8.5 | |
Korea | | | 5.3 | |
Norway | | | 0.7 | |
Switzerland | | | 1.4 | |
Taiwan | | | 0.9 | |
Thailand | | | 1.1 | |
United Kingdom | | | 4.3 | |
United States | | | 46.5 | |
| | | | |
TOTAL | | | 100.0 | % |
| | | | |
59
| | |
| WASATCH INTERNATIONAL GROWTH FUND (WAIGX / WIIGX) | | |
|
|
|
Schedule of Investments
| | | | | | | | |
| Shares | | | | | Value | |
| | | | | | | |
| | | | COMMON STOCKS 98.1% | | | | |
| | |
| | | | Airport Services 0.6% | | | | |
| | 1,376,972 | | | Grupo Aeroportuario del Centro Norte S.A.B. de C.V. (Mexico) | | $ | 7,458,437 | |
| | | | | | | | |
| | | | Apparel, Accessories & Luxury Goods 2.6% | | | | |
| | 766,603 | | | Moncler S.p.A. (Italy) | | | 16,789,679 | |
| | 523,310 | | | Ted Baker plc (United Kingdom) | | | 18,096,087 | |
| | | | | | | | |
| | | | | | | 34,885,766 | |
| | | | | | | | |
| | | | Application Software 2.9% | | | | |
| | 603,115 | | | Aveva Group plc (United Kingdom) | | | 14,735,040 | |
| | 1,360,333 | | | Computer Modelling Group Ltd. (Canada) | | | 10,587,244 | |
| | 3,339,366 | | | Technology One Ltd. (Australia) | | | 13,088,039 | |
| | | | | | | | |
| | | | | | | 38,410,323 | |
| | | | | | | | |
| | | | Asset Management & Custody Banks 0.5% | | | | |
| | 671,002 | | | Burford Capital Ltd. (United Kingdom) | | | 6,473,380 | |
| | | | | | | | |
| | | | Auto Parts & Equipment 1.1% | | | | |
| | 323,722 | | | Linamar Corp. (Canada) | | | 14,724,927 | |
| | | | | | | | |
| | | | Biotechnology 4.1% | | | | |
| | 3,004,053 | | | Abcam plc (United Kingdom) | | | 31,069,999 | |
| | 56,600 | | | Medytox, Inc. (Korea) | | | 23,433,605 | |
| | | | | | | | |
| | | | | | | 54,503,604 | |
| | | | | | | | |
| | | | Construction & Engineering 0.7% | | | | |
| | 365,690 | | | Badger Daylighting Ltd. (Canada) | | | 9,610,757 | |
| | | | | | | | |
| | | | Consumer Finance 1.8% | | | | |
| | 774,373 | | | Cholamandalam Investment and Finance Co. Ltd. (India) | | | 11,506,180 | |
| | 7,926,290 | | | Gentera S.A.B. de C.V. (Mexico) | | | 13,090,354 | |
| | | | | | | | |
| | | | | | | 24,596,534 | |
| | | | | | | | |
| | | | Diversified Banks 0.4% | | | | |
| | 212,084 | | | Secure Trust Bank plc (United Kingdom) | | | 5,479,149 | |
| | | | | | | | |
| | | | Diversified Real Estate Activities 1.5% | | | | |
| | 1,148,833 | | | Patrizia Immobilien AG* (Germany) | | | 20,344,542 | |
| | | | | | | | |
| | | | Drug Retail 6.6% | | | | |
| | 229,248 | | | Ain Holdings, Inc. (Japan) | | | 15,464,407 | |
| | 2,296,976 | | | Clicks Group Ltd. (South Africa) | | | 21,931,809 | |
| | 140,987 | | | Cosmos Pharmaceutical Corp. (Japan) | | | 27,531,280 | |
| | 919,200 | | | Raia Drogasil S.A. (Brazil) | | | 17,226,558 | |
| | 134,971 | | | Sugi Holdings Co. Ltd. (Japan) | | | 6,195,112 | |
| | | | | | | | |
| | | | | | | 88,349,166 | |
| | | | | | | | |
| | | | Electrical Components & Equipment 1.9% | | | | |
| | 1,070,395 | | | Amara Raja Batteries Ltd.* (India) | | | 14,736,785 | |
| | 790,233 | | | Voltronic Power Technology Corp. (Taiwan) | | | 10,547,726 | |
| | | | | | | | |
| | | | | | | 25,284,511 | |
| | | | | | | | |
| | | | Electronic Equipment & Instruments 2.1% | | | | |
| | 632,454 | | | Ai Holdings Corp. (Japan) | | | 15,025,966 | |
| | 1,076,051 | | | Halma plc (United Kingdom) | | | 13,805,413 | |
| | | | | | | | |
| | | | | | | 28,831,379 | |
| | | | | | | | |
| | | | Fertilizers & Agricultural Chemicals 0.9% | | | | |
| | 1,119,361 | | | UPL Ltd. (India) | | | 12,558,012 | |
| | | | | | | | |
| | | | General Merchandise Stores 2.9% | | | | |
| | 913,526 | | | Seria Co. Ltd. (Japan) | | | 39,386,731 | |
| | | | | | | | |
| | | | Health Care Distributors 0.7% | | | | |
| | 464,800 | | | Japan Lifeline Co. Ltd. (Japan) | | | 8,917,747 | |
| | | | | | | | |
| | | | | | | | |
| Shares | | | | | Value | |
| | | | | | | |
| | | | Health Care Equipment 2.0% | | | | |
| | 261,310 | | | Cochlear Ltd. (Australia) | | $ | 26,997,421 | |
| | | | | | | | |
| | | | Health Care Services 0.7% | | | | |
| | 594,481 | | | Dr. Lal PathLabs Ltd. (India) | | | 8,816,281 | |
| | | | | | | | |
| | | | Health Care Supplies 2.2% | | | | |
| | 2,797,617 | | | Nanosonics Ltd.* (Australia) | | | 6,625,874 | |
| | 343,937 | | | Sartorius Stedim Biotech (France) | | | 23,170,488 | |
| | | | | | | | |
| | | | | | | 29,796,362 | |
| | | | | | | | |
| | | | Health Care Technology 0.9% | | | | |
| | 489,360 | | | M3, Inc. (Japan) | | | 12,144,990 | |
| | | | | | | | |
| | | | Home Furnishings 0.8% | | | | |
| | 1,222,774 | | | Nien Made Enterprise Co. Ltd. (Taiwan) | | | 11,404,632 | |
| | | | | | | | |
| | | | Home Improvement Retail 0.9% | | | | |
| | 43,645,500 | | | Home Product Center Public Co. Ltd. (Thailand) | | | 12,256,939 | |
| | | | | | | | |
| | | | Hotels, Resorts & Cruise Lines 2.6% | | | | |
| | 964,920 | | | Corporate Travel Management Ltd. (Australia) | | | 14,766,088 | |
| | 18,367,513 | | | Minor International Public Co. Ltd. (Thailand) | | | 19,643,685 | |
| | | | | | | | |
| | | | | | | 34,409,773 | |
| | | | | | | | |
| | | | Household Products 0.6% | | | | |
| | 272,284 | | | Pigeon Corp. (Japan) | | | 8,694,598 | |
| | | | | | | | |
| | | | Industrial Machinery 1.6% | | | | |
| | 6,828,139 | | | Rotork plc (United Kingdom) | | | 20,814,263 | |
| | | | | | | | |
| | | | Internet & Direct Marketing Retail 2.7% | | | | |
| | 252,221 | | | ASOS plc* (United Kingdom) | | | 19,102,672 | |
| | 1,757,020 | | | Trade Me Group Ltd. (New Zealand) | | | 6,318,470 | |
| | 75,019 | | | zooplus AG* (Germany) | | | 11,016,165 | |
| | | | | | | | |
| | | | | | | 36,437,307 | |
| | | | | | | | |
| | | | Internet Software & Services 8.1% | | | | |
| | 373,344 | | | Dip Corp. (Japan) | | | 8,145,626 | |
| | 1,030,307 | | | Gurunavi, Inc. (Japan) | | | 21,563,059 | |
| | 1,533,500 | | | Infomart Corp. (Japan) | | | 8,760,496 | |
| | 194,587 | | | Rightmove plc (United Kingdom) | | | 9,722,670 | |
| | 449,259 | | | Scout24 AG* (Germany) | | | 15,025,096 | |
| | 777,207 | | | SMS Co. Ltd. (Japan) | | | 19,707,674 | |
| | 74,655 | | | XING AG (Germany) | | | 15,442,572 | |
| | 2,220,122 | | | ZPG plc (United Kingdom) | | | 10,097,178 | |
| | | | | | | | |
| | | | | | | 108,464,371 | |
| | | | | | | | |
| | | | IT Consulting & Other Services 1.1% | | | | |
| | 842,049 | | | Altran Technologies S.A.* (France) | | | 14,175,138 | |
| | | | | | | | |
| | | | Leisure Products 0.4% | | | | |
| | 529,344 | | | Yonex Co. Ltd. (Japan) | | | 5,881,600 | |
| | | | | | | | |
| | | | Life & Health Insurance 1.3% | | | | |
| | 1,914,121 | | | Max Financial Services Ltd. (India) | | | 17,063,047 | |
| | | | | | | | |
| | | | Life Sciences Tools & Services 2.7% | | | | |
| | 2,312,152 | | | Clinigen Healthcare Ltd.* (United Kingdom) | | | 23,030,326 | |
| | 80,470 | | | Tecan Group AG (Switzerland) | | | 12,862,024 | |
| | | | | | | | |
| | | | | | | 35,892,350 | |
| | | | | | | | |
| | | | Movies & Entertainment 1.5% | | | | |
| | 509,753 | | | CTS Eventim AG & Co KGaA (Germany) | | | 19,729,224 | |
| | | | | | | | |
| | | | Multi-Sector Holdings 1.4% | | | | |
| | 847,156 | | | GT Capital Holdings, Inc. (Philippines) | | | 19,332,210 | |
| | | | | | | | |
| | | | Office Services & Supplies 1.5% | | | | |
| | 5,169,957 | | | IWG plc (United Kingdom) | | | 20,663,038 | |
| | | | | | | | |
60
| | |
| | MARCH 31, 2017 (UNAUDITED) |
|
|
|
| | | | | | | | |
Shares | | | | | Value | |
| | | | | | | |
| | | | Oil & Gas Equipment & Services 2.4% | | | | |
| | 302,261 | | | Pason Systems, Inc. (Canada) | | $ | 4,366,232 | |
| | 456,570 | | | ShawCor Ltd. (Canada) | | | 13,365,620 | |
| | 669,197 | | | TGS-NOPEC Geophysical Co. ASA (Norway) | | | 14,184,838 | |
| | | | | | | | |
| | | | | | | 31,916,690 | |
| | | | | | | | |
| | | | Packaged Foods & Meats 2.4% | | | | |
| | 16,385,449 | | | Vitasoy International Holdings Ltd. (China) | | | 32,553,733 | |
| | | | | | | | |
| | | | Pharmaceuticals 2.9% | | | | |
| | 391,255 | | | Ipsen S.A. (France) | | | 39,134,557 | |
| | | | | | | | |
| | | | Property & Casualty Insurance 0.7% | | | | |
| | 5,332,656 | | | Qualitas Controladora S.A.B. de C.V.** (Mexico) | | | 8,724,339 | |
| | | | | | | | |
| | | | Regional Banks 2.0% | | | | |
| | 604,053 | | | Canadian Western Bank (Canada) | | | 13,367,884 | |
| | 338,844 | | | Metro Bank plc* (United Kingdom) | | | 13,814,460 | |
| | | | | | | | |
| | | | | | | 27,182,344 | |
| | | | | | | | |
| | | | Research & Consulting Services 1.8% | | | | |
| | 750,600 | | | Nihon M&A Center, Inc. (Japan) | | | 24,406,467 | |
| | | | | | | | |
| | | | Restaurants 2.0% | | | | |
| | 726,300 | | | Create Restaurants Holdings, Inc. (Japan) | | | 6,445,562 | |
| | 474,653 | | | Domino’s Pizza Enterprises Ltd. (Australia) | | | 21,076,332 | |
| | | | | | | | |
| | | | | | | 27,521,894 | |
| | | | | | | | |
| | | | Semiconductor Equipment 0.5% | | | | |
| | 411,100 | | | Japan Material Co. Ltd. (Japan) | | | 6,823,972 | |
| | | | | | | | |
| | | | Semiconductors 2.8% | | | | |
| | 229,315 | | | Melexis N.V. (Belgium) | | | 19,866,662 | |
| | 985,999 | | | Silergy Corp. (Taiwan) | | | 18,197,559 | |
| | | | | | | | |
| | | | | | | 38,064,221 | |
| | | | | | | | |
| | | | Soft Drinks 0.6% | | | | |
| | 453,622 | | | Fevertree Drinks plc (United Kingdom) | | | 8,553,565 | |
| | | | | | | | |
| | | | Specialized Finance 1.0% | | | | |
| | 345,468 | | | Banca IFIS S.p.A. (Italy) | | | 13,241,829 | |
| | | | | | | | |
| | | | Specialty Chemicals 4.0% | | | | |
| | 322,220 | | | Chr. Hansen Holding A/S (Denmark) | | | 20,681,667 | |
| | 238,362 | | | Frutarom Industries Ltd. (Israel) | | | 13,321,852 | |
| | 1,975,105 | | | Hexpol AB (Sweden) | | | 20,256,583 | |
| | | | | | | | |
| | | | | | | 54,260,102 | |
| | | | | | | | |
| | | | Specialty Stores 1.1% | | | | |
| | 1,357,896 | | | XXL ASA (Norway) | | | 14,786,899 | |
| | | | | | | | |
| | | | Systems Software 1.4% | | | | |
| | 346,709 | | | Kinaxis, Inc.* (Canada) | | | 19,337,073 | |
| | | | | | | | |
| | | | Technology Hardware, Storage & Peripherals 0.9% | | | | |
| | 889,305 | | | Ennoconn Corp. (Taiwan) | | | 11,620,975 | |
| | | | | | | | |
| | | | Thrifts & Mortgage Finance 1.4% | | | | |
| | 1,036,827 | | | PNB Housing Finance Ltd.* (India) | | | 19,000,911 | |
| | | | | | | | |
| | | | Trading Companies & Distributors 5.9% | | | | |
| | 898,612 | | | Diploma plc (United Kingdom) | | | 11,922,978 | |
| | 1,506,315 | | | MISUMI Group, Inc. (Japan) | | | 27,222,723 | |
| | 793,012 | | | MonotaRO Co. Ltd. (Japan) | | | 24,503,380 | |
| | 745,323 | | | Richelieu Hardware Ltd. (Canada) | | | 15,412,552 | |
| | | | | | | | |
| | | | 79,061,633 | |
| | | | | | | | |
| | |
| | | | Total Common Stocks
(cost $1,012,699,509) | | | 1,318,979,713 | |
| | | | | | | | |
| | | | | | | | |
Principal
Amount | | | | | Value | |
| | | | | | | |
| | | | SHORT-TERM INVESTMENTS 0.7% | | | | |
| | |
| | | | Repurchase Agreement 0.7% | | | | |
| | $8,797,037 | | | Repurchase Agreement dated 3/31/17,
0.09% due 4/3/17 with State Street Bank
and Trust Co. collateralized by $8,760,000
of United States Treasury Notes 0.375%
due 7/15/25; value $8,975,978; repurchase
proceeds: $8,797,103 (cost $8,797,037) | | $ | 8,797,037 | |
| | | | | | | | |
| | |
| | | | Total Short-Term Investments
(cost $8,797,037) | | | 8,797,037 | |
| | | | | | | | |
| | |
| | | | Total Investments
(cost $1,021,496,546) 98.8%§ | | | 1,327,776,750 | |
| | |
| | | | Other Assets less Liabilities 1.2% | | | 15,569,175 | |
| | | | | | | | |
| | |
| | | | NET ASSETS 100.0% | | $ | 1,343,345,925 | |
| | | | | | | | |
| |
| | | | *Non-income producing. **Common units. §The aggregate amount of foreign securities fair valued pursuant to a systematic valuation model as a percent of net assets was 0.99%. See Notes to Financial Statements. | |
At March 31, 2017, Wasatch International Growth Fund’s investments, excluding short-term investments, were in the following countries:
| | | | |
| Country | | % | |
Australia | | | 6.3 | |
Belgium | | | 1.5 | |
Brazil | | | 1.3 | |
Canada | | | 7.6 | |
China | | | 2.5 | |
Denmark | | | 1.6 | |
France | | | 5.8 | |
Germany | | | 6.2 | |
India | | | 6.3 | |
Israel | | | 1.0 | |
Italy | | | 2.3 | |
Japan | | | 21.7 | |
Korea | | | 1.8 | |
Mexico | | | 2.2 | |
New Zealand | | | 0.5 | |
Norway | | | 2.2 | |
Philippines | | | 1.5 | |
South Africa | | | 1.7 | |
Sweden | | | 1.5 | |
Switzerland | | | 1.0 | |
Taiwan | | | 3.9 | |
Thailand | | | 2.4 | |
United Kingdom | | | 17.2 | |
| | | | |
TOTAL | | | 100.0 | % |
| | | | |
61
| | |
| WASATCH INTERNATIONAL OPPORTUNITIES FUND (WAIOX / WIIOX) | | |
|
|
|
Schedule of Investments
| | | | | | | | |
| Shares | | | | | Value | |
| | | | | | | |
| | | | COMMON STOCKS 96.7% | | | | |
| | |
| | | | Advertising 0.5% | | | | |
| | 20,000,000 | | | Plan B Media Public Co. Ltd. (Thailand) | | $ | 3,492,179 | |
| | | | | | | | |
| | | | Aerospace & Defense 0.5% | | | | |
| | 250,000 | | | Avon Rubber plc (United Kingdom) | | | 3,011,659 | |
| | | | | | | | |
| | | | Air Freight & Logistics 2.8% | | | | |
| | 1,865,216 | | | Allcargo Global Logistics Ltd. (India) | | | 4,796,967 | |
| | 1,453,468 | | | Freightways Ltd. (New Zealand) | | | 7,631,417 | |
| | 43,334 | | | ID Logistics Group* (France) | | | 6,157,663 | |
| | | | | | | | |
| | | | | | | 18,586,047 | |
| | | | | | | | |
| | | | Apparel, Accessories & Luxury Goods 0.2% | | | | |
| | 322,000 | | | Bon Fame Co. Ltd. (Taiwan) | | | 1,262,849 | |
| | | | | | | | |
| | | | Application Software 3.0% | | | | |
| | 670,000 | | | Computer Modelling Group Ltd. (Canada) | | | 5,214,498 | |
| | 884,970 | | | GB Group plc (United Kingdom) | | | 3,248,723 | |
| | 429,135 | | | Linx S.A. (Brazil) | | | 2,275,488 | |
| | 559,050 | | | Logo Yazilim Sanayi Ve Ticaret A.S.* (Turkey) | | | 8,590,830 | |
| | | | | | | | |
| | | | | | | 19,329,539 | |
| | | | | | | | |
| | | | Asset Management & Custody Banks 1.4% | | | | |
| | 2,897,180 | | | Peregrine Holdings Ltd. (South Africa) | | | 5,929,866 | |
| | 350,000 | | | Sanne Group plc (United Kingdom) | | | 3,027,947 | |
| | | | | | | | |
| | | | | | | 8,957,813 | |
| | | | | | | | |
| | | | Auto Parts & Equipment 2.3% | | | | |
| | 173,368 | | | FIEM Industries Ltd. (India) | | | 2,563,075 | |
| | 1,090,609 | | | Hu Lane Associate, Inc. (Taiwan) | | | 5,427,436 | |
| | 120,000 | | | UNIWHEELS AG (Poland) | | | 7,141,236 | |
| | | | | | | | |
| | | | | | | 15,131,747 | |
| | | | | | | | |
| | | | Automobile Manufacturers 0.9% | | | | |
| | 1,047,900 | | | PAK Suzuki Motor Co. Ltd. (Pakistan) | | | 6,187,638 | |
| | | | | | | | |
| | | | Automotive Retail 1.1% | | | | |
| | 2,584,000 | | | Hascol Petroleum Ltd. (Pakistan) | | | 7,336,411 | |
| | | | | | | | |
| | | | Brewers 3.2% | | | | |
| | 685,845 | | | Carlsberg Brewery Malaysia Berhad, Class B (Malaysia) | | | 2,324,636 | |
| | 250,000 | | | Kopparbergs Bryggeri AB, Class B (Sweden) | | | 5,872,900 | |
| | 197,574 | | | Olvi Oyj, Class A (Finland) | | | 5,695,057 | |
| | 160,100 | | | Royal UNIBREW A/S (Denmark) | | | 6,742,768 | |
| | | | | | | | |
| | | | | | | 20,635,361 | |
| | | | | | | | |
| | | | Building Products 0.6% | | | | |
| | 3,000,000 | | | Concepcion Industrial Corp. (Philippines) | | | 3,736,921 | |
| | | | | | | | |
| | | | Commodity Chemicals 3.7% | | | | |
| | 980,135 | | | Berger Paints India Ltd. (India) | | | 3,658,809 | |
| | 420,387 | | | Gulf Oil Lubricants India Ltd. (India) | | | 4,564,146 | |
| | 288,077 | | | Supreme Industries Ltd. (India) | | | 4,853,411 | |
| | 428,810 | | | Tikkurila Oyj (Finland) | | | 8,691,634 | |
| | 830,500 | | | Yung Chi Paint & Varnish Manufacturing Co. Ltd. (Taiwan) | | | 2,203,353 | |
| | | | | | | | |
| | | | | | | 23,971,353 | |
| | | | | | | | |
| | | | Communications Equipment 1.0% | | | | |
| | 699,000 | | | Advanced Ceramic X Corp. (Taiwan) | | | 6,865,024 | |
| | | | | | | | |
| | | | Construction & Engineering 1.5% | | | | |
| | 364,113 | | | Badger Daylighting Ltd. (Canada) | | | 9,569,312 | |
| | | | | | | | |
| | | | Consumer Finance 0.8% | | | | |
| | 1,958,162 | | | Unifin Financiera SAPI de C.V. SOFOM (Mexico) | | | 5,009,866 | |
| | | | | | | | |
| | | | | | | | |
| Shares | | | | | Value | |
| | | | | | | |
| | | | Department Stores 0.3% | | | | |
| | 183,078 | | | Poya Co. Ltd. (Taiwan) | | $ | 2,154,036 | |
| | | | | | | | |
| | | | Diversified Banks 1.2% | | | | |
| | 7,295,461 | | | BRAC Bank Ltd. (Bangladesh) | | | 7,894,359 | |
| | | | | | | | |
| | | | Diversified Support Services 1.8% | | | | |
| | 1,000,000 | | | Clipper Logistics plc (United Kingdom) | | | 4,754,757 | |
| | 800,000 | | | Prestige International, Inc. (Japan) | | | 7,207,402 | |
| | | | | | | | |
| | | | | | | 11,962,159 | |
| | | | | | | | |
| | | | Drug Retail 1.2% | | | | |
| | 2,486,917 | | | Green Cross Health Ltd. (New Zealand) | | | 3,870,189 | |
| | 90,000 | | | Kusuri no Aoki Holdings Co. Ltd. (Japan) | | | 4,013,743 | |
| | | | | | | | |
| | | | | | | 7,883,932 | |
| | | | | | | | |
| | | | Electrical Components & Equipment 1.2% | | | | |
| | 252,355 | | | Amara Raja Batteries Ltd.* (India) | | | 3,474,326 | |
| | 332,627 | | | Voltronic Power Technology Corp. (Taiwan) | | | 4,439,777 | |
| | | | | | | | |
| | | | | | | 7,914,103 | |
| | | | | | | | |
| | | | Electronic Equipment & Instruments 2.3% | | | | |
| | 59,680 | | | Isra Vision AG (Germany) | | | 7,767,327 | |
| | 1,015,769 | | | Smart Marketing Systems plc (United Kingdom) | | | 7,400,503 | |
| | | | | | | | |
| | | | | | | 15,167,830 | |
| | | | | | | | |
| | | | Financial Exchanges & Data 0.6% | | | | |
| | 1,246,129 | | | Morningstar Japan KK (Japan) | | | 3,727,306 | |
| | | | | | | | |
| | | | Food Retail 5.5% | | | | |
| | 22,925,008 | | | 7-Eleven Malaysia Holdings Berhad, Class B (Malaysia) | | | 8,288,332 | |
| | 177,544 | | | Axial Retailing, Inc. (Japan) | | | 6,761,758 | |
| | 3,659,043 | | | Philippine Seven Corp. (Philippines) | | | 12,397,356 | |
| | 122,973 | | | Rami Levi Chain Stores Hashikma Marketing 2006 Ltd. (Israel) | | | 5,224,528 | |
| | 5,000,000 | | | Sheng Siong Group Ltd. (Singapore) | | | 3,377,775 | |
| | | | | | | | |
| | | | | | | 36,049,749 | |
| | | | | | | | |
| | | | General Merchandise Stores 2.3% | | | | |
| | 349,544 | | | Seria Co. Ltd. (Japan) | | | 15,070,612 | |
| | | | | | | | |
| | | | Health Care Equipment 1.3% | | | | |
| | 70,000 | | | STRATEC Biomedical AG (Germany) | | | 4,200,524 | |
| | 75,000 | | | Vieworks Co. Ltd. (Korea) | | | 4,325,762 | |
| | | | | | | | |
| | | | | | | 8,526,286 | |
| | | | | | | | |
| | | | Health Care Facilities 0.7% | | | | |
| | 1,831,581 | | | Shifa International Hospitals Ltd. (Pakistan) | | | 4,613,285 | |
| | | | | | | | |
| | | | Health Care Services 0.5% | | | | |
| | 157,400 | | | BML, Inc. (Japan) | | | 3,465,260 | |
| | | | | | | | |
| | | | Health Care Supplies 1.3% | | | | |
| | 1,130,540 | | | Advanced Medical Solutions Group plc (United Kingdom) | | | 3,427,819 | |
| | 2,010,645 | | | Nanosonics Ltd.* (Australia) | | | 4,762,010 | |
| | | | | | | | |
| | | | | | | 8,189,829 | |
| | | | | | | | |
| | | | Health Care Technology 0.9% | | | | |
| | 109,300 | | | Nexus AG (Germany) | | | 2,355,928 | |
| | 139,831 | | | RaySearch Laboratories AB (Sweden) | | | 3,667,176 | |
| | | | | | | | |
| | | | | | | 6,023,104 | |
| | | | | | | | |
| | | | Home Improvement Retail 1.8% | | | | |
| | 515,000 | | | Byggmax Group AB (Sweden) | | | 3,534,621 | |
| | 4,650,000 | | | Italtile Ltd. (South Africa) | | | 4,776,074 | |
| | 56,127,000 | | | PT Ace Hardware Indonesia Tbk (Indonesia) | | | 3,474,899 | |
| | | | | | | | |
| | | | | | | 11,785,594 | |
| | | | | | | | |
62
| | |
| | MARCH 31, 2017 (UNAUDITED) |
|
|
|
| | | | | | | | |
| Shares | | | | | Value | |
| | | | | | | |
| | | | Human Resource & Employment Services 2.5% | | | | |
| | 737,600 | | | en-japan, Inc. (Japan) | | $ | 16,430,863 | |
| | | | | | | | |
| | | | Industrial Machinery 0.5% | | | | |
| | 976,000 | | | Sumeeko Industries Co. Ltd. (Taiwan) | | | 3,232,693 | |
| | | | | | | | |
| | | | Insurance Brokers 1.2% | | | | |
| | 1,330,366 | | | FPC Par Corretora de Seguros S.A. (Brazil) | | | 7,542,962 | |
| | | | | | | | |
| | | | Internet & Direct Marketing Retail 5.7% | | | | |
| | 350,000 | | | Open Door, Inc.* (Japan) | | | 9,604,330 | |
| | 2,252,425 | | | Trade Me Group Ltd. (New Zealand) | | | 8,100,010 | |
| | 1,429,208 | | | Webjet Ltd. (Australia) | | | 12,535,179 | |
| | 924,400 | | | Yume No Machi Souzou Iinkai Co. Ltd. (Japan) | | | 6,816,962 | |
| | | | | | | | |
| | | | | | | 37,056,481 | |
| | | | | | | | |
| | | | Internet Software & Services 9.4% | | | | |
| | 1,069,249 | | | Dip Corp. (Japan) | | | 23,328,894 | |
| | 551,399 | | | Gurunavi, Inc. (Japan) | | | 11,540,103 | |
| | 1,759,600 | | | Infomart Corp. (Japan) | | | 10,052,148 | |
| | 480,500 | | | Istyle, Inc. (Japan) | | | 3,953,454 | |
| | 281,300 | | | SMS Co. Ltd. (Japan) | | | 7,132,937 | |
| | 26,252 | | | XING AG (Germany) | | | 5,430,291 | |
| | | | | | | | |
| | | | | | | 61,437,827 | |
| | | | | | | | |
| | | | Investment Banking & Brokerage 4.1% | | | | |
| | 543,500 | | | M&A Capital Partners Co. Ltd.* (Japan) | | | 26,752,717 | |
| | | | | | | | |
| | | | IT Consulting & Other Services 1.4% | | | | |
| | 69,205 | | | CANCOM SE (Germany) | | | 3,907,709 | |
| | 506,371 | | | EOH Holdings Ltd. (South Africa) | | | 5,232,705 | |
| | | | | | | | |
| | | | | | | 9,140,414 | |
| | | | | | | | |
| | | | Office Services & Supplies 0.4% | | | | |
| | 4,603,600 | | | Riverstone Holdings Ltd. (Singapore) | | | 2,846,705 | |
| | | | | | | | |
| | | | Oil & Gas Refining & Marketing 0.3% | | | | |
| | 6,429 | | | Hankook Shell Oil Co. Ltd. (Korea) | | | 2,285,190 | |
| | | | | | | | |
| | | | Other Diversified Financial Services 0.7% | | | | |
| | 45,891 | | | Hypoport AG* (Germany) | | | 4,297,402 | |
| | | | | | | | |
| | | | Packaged Foods & Meats 5.9% | | | | |
| | 2,425,036 | | | Cloetta AB, Class B (Sweden) | | | 9,580,363 | |
| | 257,500 | | | Dutch Lady Milk Industries Berhad (Malaysia) | | | 3,341,012 | |
| | 271,600 | | | Kotobuki Spirits Co. Ltd. (Japan) | | | 6,677,169 | |
| | 29,364,454 | | | PT Nippon Indosari Corpindo Tbk (Indonesia) | | | 3,393,588 | |
| | 49,200,981 | | | RFM Corp. (Philippines) | | | 4,706,820 | |
| | 1,651,562 | | | TAT Gida Sanayi A.S. (Turkey) | | | 3,444,494 | |
| | 3,743,120 | | | Vitasoy International Holdings Ltd. (China) | | | 7,436,630 | |
| | | | | | | | |
| | | | | | | 38,580,076 | |
| | | | | | | | |
| | | | Personal Products 1.8% | | | | |
| | 7,539,825 | | | Karex Berhad (Malaysia) | | | 3,680,041 | |
| | 309,832 | | | Sarantis S.A. (Greece) | | | 3,824,217 | |
| | 800,000 | | | TCI Co. Ltd. (Taiwan) | | | 4,521,711 | |
| | | | | | | | |
| | | | | | | 12,025,969 | |
| | | | | | | | |
| | | | Pharmaceuticals 0.6% | | | | |
| | 28,885,100 | | | PT Kimia Farma Persero Tbk (Indonesia) | | | 3,890,942 | |
| | | | | | | | |
| | | | Real Estate Services 0.3% | | | | |
| | 618,593 | | | Purplebricks Group plc* (United Kingdom) | | | 2,201,101 | |
| | | | | | | | |
| | | | | | | | |
| Shares | | | | | Value | |
| | | | | | | |
| | | | Regional Banks 1.0% | | | | |
| | 1,129,226 | | | Banregio Grupo Financiero S.A.B. de C.V. (Mexico) | | $ | 6,742,575 | |
| | | | | | | | |
| | | | Reinsurance 0.9% | | | | |
| | 23,000,000 | | | Thaire Life Assurance Public Co. Ltd. (Thailand) | | | 5,789,742 | |
| | | | | | | | |
| | | | Restaurants 7.9% | | | | |
| | 138,048 | | | AmRest Holdings SE* (Poland) | | | 12,079,244 | |
| | 144,900 | | | Arcland Service Holdings Co. Ltd. (Japan) | | | 3,982,700 | |
| | 696,953 | | | Famous Brands Ltd.* (South Africa) | | | 8,094,083 | |
| | 182,400 | | | Hiday Hidaka Corp. (Japan) | | | 3,943,562 | |
| | 87,200 | | | Kura Corp. (Japan) | | | 3,642,145 | |
| | 128,185 | | | MTY Food Group, Inc. (Canada) | | | 4,809,890 | |
| | 906,508 | | | Patisserie Holdings plc (United Kingdom) | | | 3,546,424 | |
| | 2,410,957 | | | Restaurant Brands New Zealand Ltd. (New Zealand) | | | 9,210,938 | |
| | 643,059 | | | Retail Food Group Ltd. (Australia) | | | 2,618,612 | |
| | | | | | | | |
| | | | | | | 51,927,598 | |
| | | | | | | | |
| | | | Semiconductor Equipment 0.6% | | | | |
| | 246,000 | | | Japan Material Co. Ltd. (Japan) | | | 4,083,428 | |
| | | | | | | | |
| | | | Soft Drinks 1.4% | | | | |
| | 123,574,320 | | | Pepsi-Cola Products Philippines, Inc. (Philippines) | | | 9,161,863 | |
| | | | | | | | |
| | | | Specialty Chemicals 1.9% | | | | |
| | 973,719 | | | DuluxGroup Ltd. (Australia) | | | 4,857,804 | |
| | 703,599 | | | Scapa Group plc (United Kingdom) | | | 3,118,446 | |
| | 989,644 | | | SH Kelkar & Co. Ltd.* (India) | | | 4,512,722 | |
| | | | | | | | |
| | | | | | | 12,488,972 | |
| | | | | | | | |
| | | | Thrifts & Mortgage Finance 1.8% | | | | |
| | 174,187 | | | Can Fin Homes Ltd. (India) | | | 5,668,085 | |
| | 111,692 | | | Equitable Group, Inc. (Canada) | | | 5,826,277 | |
| | | | | | | | |
| | | | | | | 11,494,362 | |
| | | | | | | | |
| | |
| | | | Total Common Stocks
(cost $510,086,853) | | | 632,921,045 | |
| | | | | | | | |
| | |
Principal
Amount | | | | | Value | |
| | | | | | | |
| | | | SHORT-TERM INVESTMENTS 4.3% | | | | |
| | |
| | | | Repurchase Agreement 4.3% | | | | |
| | $28,312,542 | | | Repurchase Agreement dated 3/31/17, 0.09% due 4/3/17 with State Street Bank and Trust Co. collateralized by $30,655,000 of United States Treasury Notes 1.625% due 5/15/26; value: $28,881,762; repurchase proceeds: $28,312,754 (cost $28,312,542) | | $ | 28,312,542 | |
| | | | | | | | |
| | |
| | | | Total Short-Term Investments
(cost $28,312,542) | | | 28,312,542 | |
| | | | | | | | |
| | |
| | | | Total Investments
(cost $538,399,395) 101.0%§ | | | 661,233,587 | |
| | |
| | | | Liabilities less Other Assets (1.0%)§§ | | | (6,501,466 | ) |
| | | | | | | | |
| | |
| | | | NET ASSETS 100.0% | | $ | 654,732,121 | |
| | | | | | | | |
| |
| | | | *Non-income producing. §The aggregate amount of foreign securities fair valued pursuant to a systematic valuation model as a percent of net assets was 0.80%. §§Liabilities less Other Assets included naira, the Nigerian currency, which was fair valued during the period (see Note 13). See Notes to Financial Statements. | |
63
| | |
| WASATCH INTERNATIONAL OPPORTUNITIES FUND (WAIOX / WIIOX) | | MARCH 31, 2017 (UNAUDITED) |
|
|
|
Schedule of Investments (continued)
At March 31, 2017, Wasatch International Opportunities Fund’s investments, excluding short-term investments, were in the following countries:
| | | | |
| Country | | % | |
Australia | | | 3.9 | |
Bangladesh | | | 1.2 | |
Brazil | | | 1.5 | |
Canada | | | 4.0 | |
China | | | 1.2 | |
Denmark | | | 1.1 | |
Finland | | | 2.3 | |
France | | | 1.0 | |
Germany | | | 4.4 | |
Greece | | | 0.6 | |
India | | | 5.4 | |
Indonesia | | | 1.7 | |
Israel | | | 0.8 | |
Japan | | | 28.2 | |
Korea | | | 1.0 | |
Malaysia | | | 2.8 | |
Mexico | | | 1.9 | |
New Zealand | | | 4.5 | |
Pakistan | | | 2.9 | |
Philippines | | | 4.7 | |
Poland | | | 3.0 | |
Singapore | | | 1.0 | |
South Africa | | | 3.8 | |
Sweden | | | 3.6 | |
Taiwan | | | 4.8 | |
Thailand | | | 1.5 | |
Turkey | | | 1.9 | |
United Kingdom | | | 5.3 | |
| | | | |
TOTAL | | | 100.0 | % |
| | | | |
64
| | |
| WASATCH LARGE CAP VALUE FUND (FMIEX / WILCX) | | MARCH 31, 2017 (UNAUDITED) |
|
|
|
Schedule of Investments
| | | | | | | | |
| Shares | | | | | Value | |
| | | | | | | |
| | | | COMMON STOCKS 97.3% | | | | |
| | |
| | | | Communications Equipment 3.8% | | | | |
| | 211,861 | | | Cisco Systems, Inc. | | $ | 7,160,902 | |
| | | | | | | | |
| | | | Diversified Banks 13.8% | | | | |
| | 110,390 | | | Citigroup, Inc. | | | 6,603,530 | |
| | 211,010 | | | ING Groep N.V. ADR (Netherlands) | | | 3,184,141 | |
| | 84,129 | | | JPMorgan Chase & Co. | | | 7,389,891 | |
| | 56,317 | | | US Bancorp | | | 2,900,326 | |
| | 104,326 | | | Wells Fargo & Co. | | | 5,806,785 | |
| | | | | | | | |
| | | | 25,884,673 | |
| | | | | | | | |
| | | | Diversified REITs 1.6% | | | | |
| | 114,512 | | | Select Income REIT | | | 2,953,264 | |
| | | | | | | | |
| | | | Drug Retail 2.7% | | | | |
| | 65,148 | | | CVS Health Corp. | | | 5,114,118 | |
| | | | | | | | |
| | | | Electric Utilities 8.5% | | | | |
| | 103,340 | | | Duke Energy Corp. | | | 8,474,913 | |
| | 208,695 | | | Exelon Corp. | | | 7,508,846 | |
| | | | | | | | |
| | | | 15,983,759 | |
| | | | | | | | |
| | | | Electrical Components & Equipment 2.0% | | | | |
| | 51,843 | | | Eaton Corp. plc | | | 3,844,158 | |
| | | | | | | | |
| | | | Health Care Distributors 1.5% | | | | |
| | 35,558 | | | Cardinal Health, Inc. | | | 2,899,755 | |
| | | | | | | | |
| | | | Health Care Equipment 2.2% | | | | |
| | 50,869 | | | Medtronic plc | | | 4,098,007 | |
| | | | | | | | |
| | | | Health Care REITs 1.4% | | | | |
| | 95,598 | | | Care Capital Properties, Inc. | | | 2,568,718 | |
| | | | | | | | |
| | | | Household Products 3.6% | | | | |
| | 75,380 | | | Procter & Gamble Co. (The) | | | 6,772,893 | |
| | | | | | | | |
| | | | Hypermarkets & Super Centers 4.3% | | | | |
| | 112,917 | | | Wal-Mart Stores, Inc. | | | 8,139,057 | |
| | | | | | | | |
| | | | Industrial Conglomerates 3.8% | | | | |
| | 241,389 | | | General Electric Co.†† | | | 7,193,392 | |
| | | | | | | | |
| | | | Integrated Oil & Gas 10.1% | | | | |
| | 73,196 | | | Chevron Corp. | | | 7,859,055 | |
| | 106,695 | | | Royal Dutch Shell plc ADR (Netherlands) | | | 5,626,027 | |
| | 179,250 | | | Suncor Energy, Inc. (Canada) | | | 5,511,937 | |
| | | | | | | | |
| | | | 18,997,019 | |
| | | | | | | | |
| | | | Integrated Telecommunication Services 2.7% | | | | |
| | 102,270 | | | Verizon Communications, Inc. | | | 4,985,663 | |
| | | | | | | | |
| | | | Investment Banking & Brokerage 2.5% | | | | |
| | 20,758 | | | Goldman Sachs Group, Inc. (The) | | | 4,768,528 | |
| | | | | | | | |
| | | | Multi-Line Insurance 2.5% | | | | |
| | 75,511 | | | American International Group, Inc. | | | 4,714,152 | |
| | | | | | | | |
| | | | Oil & Gas Equipment & Services 3.5% | | | | |
| | 29,820 | | | Halliburton Co. | | | 1,467,442 | |
| | 65,467 | | | Schlumberger Ltd. | | | 5,112,973 | |
| | | | | | | | |
| | | | 6,580,415 | |
| | | | | | | | |
| | | | Pharmaceuticals 10.5% | | | | |
| | 179,500 | | | Astellas Pharma, Inc. (Japan) | | | 2,363,667 | |
| | 72,771 | | | Johnson & Johnson | | | 9,063,628 | |
| | 241,107 | | | Pfizer, Inc. | | | 8,248,270 | |
| | | | | | | | |
| | | | 19,675,565 | |
| | | | | | | | |
| | | | | | | | |
| Shares | | | | | Value | |
| | | | | | | |
| | | | Property & Casualty Insurance 1.6% | | | | |
| | 44,489 | | | Axis Capital Holdings Ltd. | | $ | 2,982,098 | |
| | | | | | | | |
| | | | Regional Banks 3.0% | | | | |
| | 47,314 | | | PNC Financial Services Group, Inc. | | | 5,689,035 | |
| | | | | | | | |
| | | | Specialized REITs 2.3% | | | | |
| | 58,428 | | | EPR Properties | | | 4,302,054 | |
| | | | | | | | |
| | | | Systems Software 5.7% | | | | |
| | 58,023 | | | Microsoft Corp. | | | 3,821,395 | |
| | 153,664 | | | Oracle Corp. | | | 6,854,951 | |
| | | | | | | | |
| | | | 10,676,346 | |
| | | | | | | | |
| | | | Technology Hardware, Storage & Peripherals 2.5% | | | | |
| | 32,409 | | | Apple, Inc. | | | 4,655,877 | |
| | | | | | | | |
| | | | Tobacco 1.2% | | | | |
| | 26,102 | | | KT & G Corp. (Korea) | | | 2,275,727 | |
| | | | | | | | |
| | |
| | | | Total Common Stocks
(cost $146,994,166) | | | 182,915,175 | |
| | | | | | | | |
| | |
Principal
Amount | | | | | Value | |
| | | | SHORT-TERM INVESTMENTS 0.7% | | | | |
| | |
| | | | Repurchase Agreement 0.7% | | | | |
| | $1,373,298 | | | Repurchase Agreement dated 3/31/17, 0.09% due 4/3/17 with State Street Bank and Trust Co. collateralized by $1,470,000 of United States Treasury Bonds 2.750% due 8/15/42; value: $1,404,279; repurchase proceeds: $1,373,309†† (cost $1,373,298) | | $ | 1,373,298 | |
| | | | | | | | |
| | |
| | | | Total Short-Term Investments
(cost $1,373,298) | | | 1,373,298 | |
| | | | | | | | |
| | |
| | | | Total Investments
(cost $148,367,464) 98.0% | | | 184,288,473 | |
| | |
| | | | Other Assets less Liabilities 2.0% | | | 3,672,174 | |
| | | | | | | | |
| | |
| | | | NET ASSETS 100.0% | | $ | 187,960,647 | |
| | | | | | | | |
| |
| | | | ††All or a portion of this security has been designated as collateral for call options written. As of March 31, 2017, the call options written were no longer held; therefore, the collateral will be subsequently released. ADR American Depositary Receipt. REIT Real Estate Investment Trust. See Notes to Financial Statements. | |
At March 31, 2017, Wasatch Large Cap Value Fund’s investments, excluding short-term investments, were in the following countries:
| | | | |
| Country | | % | |
Canada | | | 3.0 | |
Japan | | | 1.3 | |
Korea | | | 1.3 | |
Netherlands | | | 4.8 | |
United States | | | 89.6 | |
| | | | |
TOTAL | | | 100.0 | % |
| | | | |
65
| | |
| WASATCH LONG/SHORT FUND (FMLSX / WILSX) | | |
|
|
|
Schedule of Investments
| | | | | | | | |
| Shares | | | | | Value | |
| | | | | | | |
| | | | COMMON STOCKS 86.3% | | | | |
| | |
| | | | Airlines 2.1% | | | | |
| | 52,085 | | | United Continental Holdings, Inc.* †† | | $ | 3,679,284 | |
| | | | | | | | |
| | | | Apparel, Accessories & Luxury Goods 4.3% | | | | |
| | 196,826 | | | Michael Kors Holdings Ltd.* | | | 7,501,039 | |
| | | | | | | | |
| | | | Automobile Manufacturers 2.8% | | | | |
| | 137,740 | | | General Motors Co.†† | | | 4,870,486 | |
| | | | | | | | |
| | | | Biotechnology 4.0% | | | | |
| | 42,218 | | | Amgen, Inc.†† | | | 6,926,707 | |
| | | | | | | | |
| | | | Communications Equipment 2.3% | | | | |
| | 119,213 | | | Cisco Systems, Inc.†† | | | 4,029,399 | |
| | | | | | | | |
| | | | Department Stores 2.8% | | | | |
| | 162,578 | | | Macy’s, Inc.†† | | | 4,818,812 | |
| | | | | | | | |
| | | | Diversified Banks 3.2% | | | | |
| | 92,490 | | | Citigroup, Inc.†† | | | 5,532,752 | |
| | | | | | | | |
| | | | Electrical Components & Equipment 1.4% | | | | |
| | 41,950 | | | Emerson Electric Co.†† | | | 2,511,127 | |
| | | | | | | | |
| | | | Fertilizers & Agricultural Chemicals 4.7% | | | | |
| | 27,073 | | | Monsanto Co.†† | | | 3,064,664 | |
| | 178,000 | | | Mosaic Co. (The)†† | | | 5,194,040 | |
| | | | | | | | |
| | | | 8,258,704 | |
| | | | | | | | |
| | | | Food Retail 2.0% | | | | |
| | 117,861 | | | Whole Foods Market, Inc.†† | | | 3,502,829 | |
| | | | | | | | |
| | | | Health Care Distributors 4.0% | | | | |
| | 47,341 | | | McKesson Corp.†† | | | 7,018,777 | |
| | | | | | | | |
| | | | Health Care Equipment 3.6% | | | | |
| | 76,880 | | | Medtronic plc | | | 6,193,453 | |
| | | | | | | | |
| | | | Hotels, Resorts & Cruise Lines 1.0% | | | | |
| | 114,500 | | | Extended Stay America, Inc. | | | 1,825,130 | |
| | | | | | | | |
| | | | Hypermarkets & Super Centers 1.8% | | | | |
| | 43,205 | | | Wal-Mart Stores, Inc.†† | | | 3,114,216 | |
| | | | | | | | |
| | | | Integrated Telecommunication Services 1.9% | | | | |
| | 68,920 | | | Verizon Communications, Inc.†† | | | 3,359,850 | |
| | | | | | | | |
| | | | Internet Software & Services 1.6% | | | | |
| | 46,830 | | | Akamai Technologies, Inc.* †† | | | 2,795,751 | |
| | | | | | | | |
| | | | Oil & Gas Exploration & Production 6.6% | | | | |
| | 81,242 | | | Anadarko Petroleum Corp.†† | | | 5,037,004 | |
| | 692,029 | | | Bill Barrett Corp.* †† | | | 3,148,732 | |
| | 30,605 | | | Range Resources Corp. | | | 890,606 | |
| | 307,766 | | | Southwestern Energy Co.* †† | | | 2,514,448 | |
| | | | | | | | |
| | | | 11,590,790 | |
| | | | | | | | |
| | | | Oil & Gas Refining & Marketing 1.6% | | | | |
| | 40,880 | | | Valero Energy Corp. | | | 2,709,935 | |
| | | | | | | | |
| | | | Pharmaceuticals 8.9% | | | | |
| | 22,185 | | | Allergan plc†† | | | 5,300,440 | |
| | 30,040 | | | Johnson & Johnson†† | | | 3,741,482 | |
| | 45,364 | | | Novartis AG ADR (Switzerland) | | | 3,369,184 | |
| | 57,996 | | | Zoetis, Inc.†† | | | 3,095,247 | |
| | | | | | | | |
| | | | 15,506,353 | |
| | | | | | | | |
| | | | | | | | |
| Shares | | | | | Value | |
| | | | | | | |
| | | | Regional Banks 3.6% | | | | |
| | 176,465 | | | KeyCorp†† | | $ | 3,137,548 | |
| | 26,170 | | | PNC Financial Services Group, Inc. | | | 3,146,681 | |
| | | | | | | | |
| | | | 6,284,229 | |
| | | | | | | | |
| | | | Semiconductors 7.7% | | | | |
| | 132,568 | | | Mellanox Technologies Ltd.* | | | 6,754,340 | |
| | 117,677 | | | QUALCOMM, Inc. | | | 6,747,599 | |
| | | | | | | | |
| | | | 13,501,939 | |
| | | | | | | | |
| | | | Specialized REITs 4.8% | | | | |
| | 104,041 | | | Iron Mountain, Inc.†† | | | 3,711,142 | |
| | 178,143 | | | Outfront Media, Inc.†† | | | 4,729,697 | |
| | | | | | | | |
| | | | 8,440,839 | |
| | | | | | | | |
| | | | Steel 2.1% | | | | |
| | 104,519 | | | Steel Dynamics, Inc.†† | | | 3,633,080 | |
| | | | | | | | |
| | | | Systems Software 2.0% | | | | |
| | 44,139 | | | Oracle Corp.†† | | | 1,969,041 | |
| | 15,552 | | | VMware, Inc., Class A* †† | | | 1,432,961 | |
| | | | | | | | |
| | | | 3,402,002 | |
| | | | | | | | |
| | | | Technology Hardware, Storage & Peripherals 5.5% | | | | |
| | 66,242 | | | Apple, Inc.†† | | | 9,516,326 | |
| | | | | | | | |
| | |
| | | | Total Common Stocks
(cost $138,856,993) | | | 150,523,809 | |
| | | | | | | | |
| | |
| | | | LIMITED PARTNERSHIP INTEREST 1.6% | | | | |
| | | | Asset Management & Custody Banks 1.6% | | | | |
| | 92,819 | | | Blackstone Group L.P.†† | | | 2,756,724 | |
| | | | | | | | |
| | |
| | | | Total Limited Partnership Interest
(cost $2,803,666) | | | 2,756,724 | |
| | | | | | | | |
| | |
Principal
Amount | | | | | Value | |
| | | | | | | |
| | | | SHORT-TERM INVESTMENTS 28.6% | | | | |
| | | | Repurchase Agreement 28.6% | | | | |
| | $49,827,125 | | | Repurchase Agreement dated 3/31/17,
0.09% due 4/3/17 with State Street Bank
and Trust Co. collateralized by $51,160,000
of United States Treasury Notes 0.125%
due 7/15/26; value: $2,311,628;
United States Treasury Notes 0.375%
due 7/15/25; value: $29,627,899;
United States Treasury Notes 1.625%
due 5/15/26; value: $8,710,223;
United States Treasury Bonds 2.750%
due 8/15/42; value: $10,178,636; repurchase
proceeds: $49,827,499 (cost $49,827,125) | | $ | 49,827,125 | |
| | | | | | | | |
| | |
| | | | Total Short-Term Investments
(cost $49,827,125) | | | 49,827,125 | |
| | | | | | | | |
| | |
| | | | Total Investments
(cost $191,487,784) 116.5% | | | 203,107,658 | |
| | |
| | | | Liabilities less Other Assets (16.5%) | | | (28,715,658 | ) |
| | | | | | | | |
| | |
| | | | NET ASSETS 100.0% | | $ | 174,392,000 | |
| | | | | | | | |
66
| | |
| | MARCH 31, 2017 (UNAUDITED) |
|
|
|
| | | | | | | | |
| Shares | | | | | Value | |
| | | | | | | |
| | | | SECURITIES SOLD SHORT 49.6% | | | | |
| | |
| | | | Airlines 1.4% | | | | |
| | 26,599 | | | Alaska Air Group, Inc. | | $ | 2,452,960 | |
| | | | | | | | |
| | | | Apparel, Accessories & Luxury Goods 2.7% | | | | |
| | 112,423 | | | Coach, Inc. | | | 4,646,443 | |
| | | | | | | | |
| | | | Application Software 2.4% | | | | |
| | 71,841 | | | Paycom Software, Inc.* | | | 4,131,576 | |
| | | | | | | | |
| | | | Automotive Retail 1.4% | | | | |
| | 41,043 | | | CarMax, Inc.* | | | 2,430,566 | |
| | | | | | | | |
| | | | Construction Machinery & Heavy Trucks 2.8% | | | | |
| | 52,811 | | | Caterpillar, Inc. | | | 4,898,748 | |
| | | | | | | | |
| | | | Copper 2.0% | | | | |
| | 256,385 | | | Freeport-McMoRan, Inc.* | | | 3,425,304 | |
| | | | | | | | |
| | | | Diversified Support Services 2.2% | | | | |
| | 90,412 | | | Healthcare Services Group, Inc. | | | 3,895,853 | |
| | | | | | | | |
| | | | Electronic Equipment & Instruments 2.8% | | | | |
| | 58,189 | | | Cognex Corp. | | | 4,884,967 | |
| | | | | | | | |
| | | | Food Distributors 1.7% | | | | |
| | 58,569 | | | Sysco Corp. | | | 3,040,902 | |
| | | | | | | | |
| | | | Health Care Equipment 2.8% | | | | |
| | 62,162 | | | Inogen, Inc.* | | | 4,821,285 | |
| | | | | | | | |
| | | | Health Care Technology 2.8% | | | | |
| | 94,600 | | | Veeva Systems, Inc., Class A* | | | 4,851,088 | |
| | | | | | | | |
| | | | Home Entertainment Software 1.7% | | | | |
| | 32,652 | | | Electronic Arts, Inc.* | | | 2,923,007 | |
| | | | | | | | |
| | | | Housewares & Specialties 2.6% | | | | |
| | 95,716 | | | Newell Brands, Inc. | | | 4,514,924 | |
| | | | | | | | |
| | | | Integrated Oil & Gas 1.1% | | | | |
| | 23,834 | | | Exxon Mobil Corp. | | | 1,954,626 | |
| | | | | | | | |
| | | | Lodging 1.1% | | | | |
| | 29,517 | | | Choice Hotels International, Inc. | | | 1,847,764 | |
| | | | | | | | |
| | | | Oil & Gas Drilling 2.0% | | | | |
| | 52,385 | | | Helmerich & Payne, Inc. | | | 3,487,269 | |
| | | | | | | | |
| | | | Packaged Foods & Meats 1.8% | | | | |
| | 138,168 | | | Blue Buffalo Pet Products, Inc.* | | | 3,177,864 | |
| | | | | | | | |
| | | | Personal Products 1.9% | | | | |
| | 39,497 | | | Estee Lauder Cos., Inc. (The), Class A | | | 3,348,951 | |
| | | | | | | | |
| | | | Pharmaceuticals 2.8% | | | | |
| | 87,536 | | | Prestige Brands Holdings, Inc.* | | | 4,863,500 | |
| | | | | | | | |
| | | | Property & Casualty Insurance 2.9% | | | | |
| | 127,870 | | | First American Financial Corp. | | | 5,022,734 | |
| | | | | | | | |
| | | | Restaurants 2.2% | | | | |
| | 69,589 | | | Restaurant Brands International, Inc. (Canada) | | | 3,878,891 | |
| | | | | | | | |
| | | | Semiconductors 1.1% | | | | |
| | 38,130 | | | Synaptics, Inc.* | | | 1,887,816 | |
| | | | | | | | |
| | | | | | | | |
| Shares | | | | | Value | |
| | | | | | | |
| | | | Specialty Stores 3.5% | | | | |
| | 35,000 | | | Tractor Supply Co. | | $ | 2,413,950 | |
| | 13,164 | | | Ulta Beauty, Inc.* | | | 3,754,768 | |
| | | | | | | | |
| | | | | | | 6,168,718 | |
| | | | | | | | |
| | |
| | | | Total Securities Sold Short
(proceeds $71,174,575) | | | 86,555,756 | |
| | | | | | | | |
| |
| | | | *Non-income producing. ††All or a portion of this security has been designated as collateral for short sales (see Note 3). ADR American Depositary Receipt. REIT Real Estate Investment Trust. See Notes to Financial Statements. | |
At March 31, 2017, Wasatch Long/Short Fund’s investments, excluding short-term investments and securities sold short, were in the following countries:
| | | | |
| Country | | % | |
Switzerland | | | 2.2 | |
United States | | | 97.8 | |
| | | | |
TOTAL | | | 100.0 | % |
| | | | |
67
| | |
| WASATCH MICRO CAP FUND (WMICX) | | |
|
|
|
Schedule of Investments
| | | | | | | | |
| Shares | | | | | Value | |
| | | | | | | |
| | | | COMMON STOCKS 99.4% | | | | |
| | |
| | | | Air Freight & Logistics 0.9% | | | | |
| | 117,168 | | | Echo Global Logistics, Inc.* | | $ | 2,501,537 | |
| | | | | | | | |
| | | | Apparel Retail 1.1% | | | | |
| | 167,365 | | | Zumiez, Inc.* | | | 3,062,779 | |
| | | | | | | | |
| | | | Apparel, Accessories & Luxury Goods 2.5% | | | | |
| | 368,245 | | | Superior Uniform Group, Inc. | | | 6,849,357 | |
| | | | | | | | |
| | | | Application Software 9.7% | | | | |
| | 230,926 | | | Callidus Software, Inc.* | | | 4,930,270 | |
| | 26,063 | | | Ellie Mae, Inc.* | | | 2,613,337 | |
| | 249,716 | | | Exa Corp.* | | | 3,171,393 | |
| | 116,940 | | | Globant S.A.* (Argentina) | | | 4,256,616 | |
| | 39,549 | | | HubSpot, Inc.* | | | 2,394,692 | |
| | 32,840 | | | Tyler Technologies, Inc.* | | | 5,075,750 | |
| | 20,850 | | | Ultimate Software Group, Inc. (The)* | | | 4,070,129 | |
| | | | | | | | |
| | | | 26,512,187 | |
| | | | | | | | |
| | | | Asset Management & Custody Banks 1.1% | | | | |
| | 15,534 | | | Diamond Hill Investment Group, Inc. | | | 3,022,140 | |
| | | | | | | | |
| | | | Automotive Retail 0.8% | | | | |
| | 41,597 | | | Monro Muffler Brake, Inc. | | | 2,167,204 | |
| | | | | | | | |
| | | | Biotechnology 7.1% | | | | |
| | 278,787 | | | Abcam plc (United Kingdom) | | | 2,883,408 | |
| | 15,000 | | | Argos Therapeutics, Inc. PIPE* *** † | | | 6,779 | |
| | 22,500 | | | Argos Therapeutics, Inc. PIPE* *** † | | | 10,168 | |
| | 176,227 | | | ChemoCentryx, Inc.* | | | 1,282,933 | |
| | 250,157 | | | Cytokinetics, Inc.* | | | 3,214,517 | |
| | 62,154 | | | Esperion Therapeutics, Inc.* | | | 2,194,658 | |
| | 188,539 | | | Exact Sciences Corp.* | | | 4,453,291 | |
| | 61,686 | | | Flexion Therapeutics, Inc.* | | | 1,659,970 | |
| | 129,918 | | | Inovio Pharmaceuticals, Inc.* | | | 860,057 | |
| | 384,705 | | | Sangamo Therapeutics, Inc.* | | | 2,000,466 | |
| | 48,501 | | | Selecta Biosciences, Inc.* | | | 694,534 | |
| | | | | | | | |
| | | | 19,260,781 | |
| | | | | | | | |
| | | | Building Products 1.8% | | | | |
| | 68,903 | | | Trex Co., Inc.* | | | 4,781,179 | |
| | | | | | | | |
| | | | Construction & Engineering 0.9% | | | | |
| | 66,255 | | | NV5 Global, Inc.* | | | 2,491,188 | |
| | | | | | | | |
| | | | Consumer Electronics 0.8% | | | | |
| | 282,269 | | | ZAGG, Inc.* | | | 2,032,337 | |
| | | | | | | | |
| | | | Data Processing & Outsourced Services 0.9% | | | | |
| | 52,474 | | | ExlService Holdings, Inc.* | | | 2,485,169 | |
| | | | | | | | |
| | | | Department Stores 1.5% | | | | |
| | 317,634 | | | V-Mart Retail Ltd. (India) | | | 4,011,575 | |
| | | | | | | | |
| | | | Diversified Banks 1.1% | | | | |
| | 1,328,851 | | | City Union Bank Ltd. (India) | | | 3,100,345 | |
| | | | | | | | |
| | | | Electronic Equipment & Instruments 2.7% | | | | |
| | 34,211 | | | Mesa Laboratories, Inc. | | | 4,197,689 | |
| | 314,049 | | | Napco Security Technologies, Inc.* | | | 3,203,300 | |
| | | | | | | | |
| | | | 7,400,989 | |
| | | | | | | | |
| | | | Electronic Manufacturing Services 2.1% | | | | |
| | 74,006 | | | Fabrinet* | | | 3,110,472 | |
| | 21,759 | | | IPG Photonics Corp.* | | | 2,626,311 | |
| | | | | | | | |
| | | | 5,736,783 | |
| | | | | | | | |
| | | | | | | | |
| Shares | | | | | Value | |
| | | | | | | |
| | | | Environmental & Facilities Services 1.2% | | | | |
| | 241,406 | | | Heritage-Crystal Clean, Inc.* | | $ | 3,307,262 | |
| | | | | | | | |
| | | | Food Distributors 1.1% | | | | |
| | 217,154 | | | Chefs’ Warehouse, Inc. (The)* | | | 3,018,441 | |
| | | | | | | | |
| | | | General Merchandise Stores 1.3% | | | | |
| | 108,663 | | | Ollie’s Bargain Outlet Holdings, Inc.* | | | 3,640,210 | |
| | | | | | | | |
| | | | Health Care Equipment 4.1% | | | | |
| | 209,478 | | | AtriCure, Inc.* | | | 4,011,504 | |
| | 88,199 | | | Entellus Medical, Inc.* | | | 1,217,146 | |
| | 151,770 | | | Novadaq Technologies, Inc.* (Canada) | | | 1,182,288 | |
| | 169,241 | | | Obalon Therapeutics, Inc.* | | | 1,809,186 | |
| | 116,920 | | | Oxford Immunotec Global plc* | | | 1,811,091 | |
| | 1,017,822 | | | Tandem Diabetes Care, Inc.* | | | 1,221,387 | |
| | | | | | | | |
| | | | 11,252,602 | |
| | | | | | | | |
| | | | Health Care Facilities 1.9% | | | | |
| | 282,081 | | | Ensign Group, Inc. (The) | | | 5,303,123 | |
| | | | | | | | |
| | | | Health Care REITs 2.1% | | | | |
| | 191,240 | | | CareTrust REIT, Inc. | | | 3,216,657 | |
| | 213,551 | | | MedEquities Realty Trust, Inc. | | | 2,393,907 | |
| | | | | | | | |
| | | | 5,610,564 | |
| | | | | | | | |
| | | | Health Care Technology 1.1% | | | | |
| | 75,290 | | | Omnicell, Inc.* | | | 3,060,538 | |
| | | | | | | | |
| | | | Heavy Electrical Equipment 1.5% | | | | |
| | 216,292 | | | TPI Composites, Inc.* | | | 4,111,711 | |
| | | | | | | | |
| | | | Homebuilding 5.2% | | | | |
| | 133,988 | | | Installed Building Products, Inc.* | | | 7,067,867 | |
| | 210,367 | | | LGI Homes, Inc.* | | | 7,133,545 | |
| | | | | | | | |
| | | | 14,201,412 | |
| | | | | | | | |
| | | | Industrial REITs 1.0% | | | | |
| | 197,918 | | | Monmouth Real Estate Investment Corp. | | | 2,824,290 | |
| | | | | | | | |
| | | | Integrated Telecommunication Services 1.1% | | | | |
| | 287,433 | | | Ooma, Inc.* | | | 2,859,958 | |
| | | | | | | | |
| | | | Internet & Direct Marketing Retail 4.2% | | | | |
| | 120,832 | | | Duluth Holdings, Inc.* | | | 2,572,513 | |
| | 258,154 | | | MakeMyTrip Ltd.* (India) | | | 8,932,129 | |
| | | | | | | | |
| | | | 11,504,642 | |
| | | | | | | | |
| | | | Internet Software & Services 8.0% | | | | |
| | 55,331 | | | Cornerstone OnDemand, Inc.* | | | 2,151,823 | |
| | 3,390 | | | Coupa Software, Inc.* | | | 86,106 | |
| | 138,187 | | | Envestnet, Inc.* | | | 4,463,440 | |
| | 128,170 | | | Instructure, Inc.* | | | 2,999,178 | |
| | 149,313 | | | Reis, Inc. | | | 2,672,703 | |
| | 112,000 | | | SMS Co. Ltd. (Japan) | | | 2,839,989 | |
| | 55,267 | | | SPS Commerce, Inc.* | | | 3,232,567 | |
| | 66,788 | | | Tucows, Inc., Class A* | | | 3,409,527 | |
| | | | | | | | |
| | | | 21,855,333 | |
| | | | | | | | |
| | | | Leisure Products 1.1% | | | | |
| | 189,774 | | | MCBC Holdings, Inc. | | | 3,068,646 | |
| | | | | | | | |
| | | | Life Sciences Tools & Services 1.0% | | | | |
| | 33,049 | | | ICON plc* (Ireland) | | | 2,634,666 | |
| | | | | | | | |
| | | | Managed Health Care 2.5% | | | | |
| | 161,084 | | | HealthEquity, Inc.* | | | 6,838,016 | |
| | | | | | | | |
| | | | Oil & Gas Equipment & Services 0.8% | | | | |
| | 157,619 | | | Pason Systems, Inc. (Canada) | | | 2,276,844 | |
| | | | | | | | |
68
| | |
| | MARCH 31, 2017 (UNAUDITED) |
|
|
|
| | | | | | | | |
Shares | | | | | Value | |
| | | | | | | |
| | | | Oil & Gas Exploration & Production 0.5% | | | | |
| | 624,030 | | | Abraxas Petroleum Corp.* | | $ | 1,260,541 | |
| | | | | | | | |
| | | | Packaged Foods & Meats 2.7% | | | | |
| | 415,274 | | | Freshpet, Inc.* | | | 4,568,014 | |
| | 1,500,000 | | | Prabhat Dairy Ltd. (India) | | | 2,799,723 | |
| | | | | | | | |
| | | | 7,367,737 | |
| | | | | | | | |
| | | | Personal Products 0.1% | | | | |
| | 9,917 | | | elf Beauty, Inc.* | | | 285,610 | |
| | | | | | | | |
| | | | Pharmaceuticals 3.7% | | | | |
| | 170,645 | | | Egalet Corp.* | | | 870,289 | |
| | 76,571 | | | Intra-Cellular Therapies, Inc.* | | | 1,244,279 | |
| | 599,945 | | | Natco Pharma Ltd. (India) | | | 7,844,049 | |
| | | | | | | | |
| | | | 9,958,617 | |
| | | | | | | | |
| | | | Real Estate Services 0.7% | | | | |
| | 63,723 | | | HFF, Inc., Class A | | | 1,763,215 | |
| | | | | | | | |
| | | | Regional Banks 5.6% | | | | |
| | 104,846 | | | Cardinal Financial Corp. | | | 3,139,089 | |
| | 100,706 | | | Customers Bancorp, Inc.* | | | 3,175,260 | |
| | 161,075 | | | People’s Utah Bancorp | | | 4,260,434 | |
| | 71,874 | | | Pinnacle Financial Partners, Inc. | | | 4,776,027 | |
| | | | | | | | |
| | | | 15,350,810 | |
| | | | | | | | |
| | | | Semiconductor Equipment 2.3% | | | | |
| | 277,617 | | | PDF Solutions, Inc.* | | | 6,279,697 | |
| | | | | | | | |
| | | | Semiconductors 2.0% | | | | |
| | 42,129 | | | NVE Corp. | | | 3,487,860 | |
| | 28,212 | | | Power Integrations, Inc. | | | 1,854,939 | |
| | | | | | | | |
| | | | 5,342,799 | |
| | | | | | | | |
| | | | Technology Hardware, Storage & Peripherals 1.2% | | | | |
| | 742,732 | | | USA Technologies, Inc.* | | | 3,156,611 | |
| | | | | | | | |
| | | | Textiles 1.2% | | | | |
| | 2,460,000 | | | Welspun India Ltd. (India) | | | 3,301,594 | |
| | | | | | | | |
| | | | Thrifts & Mortgage Finance 5.2% | | | | |
| | 70,507 | | | Equitable Group, Inc. (Canada) | | | 3,677,911 | |
| | 1,050,006 | | | Gruh Finance Ltd. (India) | | | 6,354,853 | |
| | 34,059 | | | LendingTree, Inc.* | | | 4,269,296 | |
| | | | | | | | |
| | | | 14,302,060 | |
| | | | | | | | |
| | |
| | | | Total Common Stocks
(cost $169,460,447) | | | 271,153,099 | |
| | | | | | | | |
| | |
| | | | WARRANTS 0.0% | | | | |
| | |
| | | | Biotechnology 0.0% | | | | |
| | 16,875 | | | Argos Therapeutics, Inc., expiring 3/14/2021* *** † | | | 169 | |
| | | | | | | | |
| | |
| | | | Total Warrants
(cost $2,109) | | | 169 | |
| | | | | | | | |
| | | | | | | | |
Principal
Amount | | | | | Value | |
| | | | | | | |
| | | | SHORT-TERM INVESTMENTS 1.0% | | | | |
| | |
| | | | Repurchase Agreement 1.0% | | | | |
| | $2,819,067 | | | Repurchase Agreement dated 3/31/17,
0.09% due 4/3/17 with State Street Bank
and Trust Co. collateralized by $2,810,000
of United States Treasury Notes 0.375%
due 7/15/25; value: $2,879,281; repurchase
proceeds: $2,819,088 (cost $2,819,067) | | $ | 2,819,067 | |
| | | | | | | | |
| | |
| | | | Total Short-Term Investments
(cost $2,819,067) | | | 2,819,067 | |
| | | | | | | | |
| | |
| | | | Total Investments
(cost $172,281,623) 100.4% | | | 273,972,335 | |
| | |
| | | | Liabilities less Other Assets (0.4%) | | | (1,138,299 | ) |
| | | | | | | | |
| | |
| | | | NET ASSETS 100.0% | | $ | 272,834,036 | |
| | | | | | | | |
| | |
| | | | *Non-income producing. ***Security was fair valued under procedures adopted by the Board of Trustees (see Note 13). †Security purchased in a private placement transaction or under Rule 144A of the Securities Act of 1933 (see Note 9). PIPE Private Investment in a Public Equity. REIT Real Estate Investment Trust. See Notes to Financial Statements. | | | | |
At March 31, 2017, Wasatch Micro Cap Fund’s investments, excluding short-term investments, were in the following countries:
| | | | |
| Country | | % | |
Argentina | | | 1.6 | |
Canada | | | 2.6 | |
India | | | 13.4 | |
Ireland | | | 1.0 | |
Japan | | | 1.0 | |
United Kingdom | | | 1.1 | |
United States | | | 79.3 | |
| | | | |
TOTAL | | | 100.0 | % |
| | | | |
69
| | |
| WASATCH MICRO CAP VALUE FUND (WAMVX) | | |
|
|
|
Schedule of Investments
| | | | | | | | |
| Shares | | | | | Value | |
| | | | | | | |
| | | | COMMON STOCKS 96.1% | | | | |
| | |
| | | | Air Freight & Logistics 0.9% | | | | |
| | 350,000 | | | Radiant Logistics, Inc.* | | $ | 1,750,000 | |
| | | | | | | | |
| | | | Airlines 0.9% | | | | |
| | 10,000 | | | Allegiant Travel Co. | | | 1,602,500 | |
| | | | | | | | |
| | | | Alternative Carriers 0.9% | | | | |
| | 172,000 | | | ORBCOMM, Inc.* | | | 1,642,600 | |
| | | | | | | | |
| | | | Apparel, Accessories & Luxury Goods 1.0% | | | | |
| | 105,000 | | | Superior Uniform Group, Inc. | | | 1,953,000 | |
| | | | | | | | |
| | | | Application Software 4.2% | | | | |
| | 37,000 | | | Ebix, Inc. | | | 2,266,250 | |
| | 37,000 | | | ESI Group* (France) | | | 1,988,974 | |
| | 80,000 | | | Everbridge, Inc.* | | | 1,642,400 | |
| | 54,000 | | | Globant S.A.* (Argentina) | | | 1,965,600 | |
| | | | | | | | |
| | | | | | | 7,863,224 | |
| | | | | | | | |
| | | | Asset Management & Custody Banks 1.0% | | | | |
| | 87,000 | | | Solar Capital Ltd. | | | 1,967,070 | |
| | | | | | | | |
| | | | Auto Parts & Equipment 1.6% | | | | |
| | 109,000 | | | Horizon Global Corp.* | | | 1,512,920 | |
| | 127,700 | | | Unique Fabricating, Inc. | | | 1,536,231 | |
| | | | | | | | |
| | | | | | | 3,049,151 | |
| | | | | | | | |
| | | | Biotechnology 0.8% | | | | |
| | 65,000 | | | Exact Sciences Corp.* | | | 1,535,300 | |
| | | | | | | | |
| | | | Brewers 0.9% | | | | |
| | 700,000 | | | Turk Tuborg Bira ve Malt Sanayii A.S.* (Turkey) | | | 1,702,596 | |
| | | | | | | | |
| | | | Building Products 1.6% | | | | |
| | 24,000 | | | Patrick Industries, Inc.* | | | 1,701,600 | |
| | 20,000 | | | Trex Co., Inc.* | | | 1,387,800 | |
| | | | | | | | |
| | | | | | | 3,089,400 | |
| | | | | | | | |
| | | | Commodity Chemicals 2.0% | | | | |
| | 350,000 | | | Green Seal Holding Ltd. (Taiwan) | | | 1,909,038 | |
| | 90,000 | | | Tikkurila Oyj (Finland) | | | 1,824,228 | |
| | | | | | | | |
| | | | | | | 3,733,266 | |
| | | | | | | | |
| | | | Construction & Engineering 1.4% | | | | |
| | 72,000 | | | NV5 Global, Inc.* | | | 2,707,200 | |
| | | | | | | | |
| | | | Consumer Electronics 0.9% | | | | |
| | 225,000 | | | ZAGG, Inc.* | | | 1,620,000 | |
| | | | | | | | |
| | | | Diversified Banks 3.2% | | | | |
| | 800,000 | | | City Union Bank Ltd. (India) | | | 1,866,482 | |
| | 5,600,000 | | | EastWest Banking Corp. (Philippines) | | | 2,299,153 | |
| | 700,000 | | | Lakshmi Vilas Bank Ltd. (The) (India) | | | 1,793,794 | |
| | | | | | | | |
| | | | | | | 5,959,429 | |
| | | | | | | | |
| | | | Diversified Metals & Mining 1.2% | | | | |
| | 225,000 | | | Ferroglobe plc | | | 2,324,250 | |
| | | | | | | | |
| | | | Diversified Support Services 1.0% | | | | |
| | 1,226,000 | | | Johnson Service Group plc (United Kingdom) | | | 1,816,386 | |
| | | | | | | | |
| | | | Education Services 1.0% | | | | |
| | 300,000 | | | AcadeMedia AB* (Sweden) | | | 1,866,494 | |
| | | | | | | | |
| | | | Electronic Equipment & Instruments 2.6% | | | | |
| | 230,000 | | | CUI Global, Inc.* | | | 1,090,200 | |
| | 220,000 | | | Napco Security Technologies, Inc.* | | | 2,244,000 | |
| | 58,000 | | | OPTEX GROUP Co., Ltd. (Japan) | | | 1,581,155 | |
| | | | | | | | |
| | | | | | | 4,915,355 | |
| | | | | | | | |
| | | | | | | | |
| Shares | | | | | Value | |
| | | | | | | |
| | | | Electronic Manufacturing Services 1.2% | | | | |
| | 52,000 | | | Fabrinet* | | $ | 2,185,560 | |
| | | | | | | | |
| | | | Environmental & Facilities Services 1.3% | | | | |
| | 370,000 | | | Hudson Technologies, Inc.* | | | 2,442,000 | |
| | | | | | | | |
| | | | Food Retail 0.8% | | | | |
| | 355,000 | | | Majestic Wine plc (United Kingdom) | | | 1,437,750 | |
| | | | | | | | |
| | | | General Merchandise Stores 1.8% | | | | |
| | 56,000 | | | Ollie’s Bargain Outlet Holdings, Inc.* | | | 1,876,000 | |
| | 36,000 | | | Seria Co. Ltd. (Japan) | | | 1,552,142 | |
| | | | | | | | |
| | | | | | | 3,428,142 | |
| | | | | | | | |
| | | | Health Care Equipment 3.1% | | | | |
| | 100,000 | | | Accuray, Inc.* | | | 475,000 | |
| | 82,000 | | | AtriCure, Inc.* | | | 1,570,300 | |
| | 79,600 | | | IRIDEX Corp.* | | | 944,852 | |
| | 105,000 | | | Tactile Systems Technology, Inc.* | | | 1,989,750 | |
| | 782,646 | | | Tandem Diabetes Care, Inc.* | | | 939,175 | |
| | | | | | | | |
| | | | | | | 5,919,077 | |
| | | | | | | | |
| | | | Health Care Facilities 0.7% | | | | |
| | 70,000 | | | Ensign Group, Inc. (The) | | | 1,316,000 | |
| | | | | | | | |
| | | | Health Care Services 4.0% | | | | |
| | 57,000 | | | Air Methods Corp.* | | | 2,451,000 | |
| | 1,100,000 | | | GHP Specialty Care AB (Sweden) | | | 1,522,211 | |
| | 44,000 | | | LHC Group, Inc.* | | | 2,371,600 | |
| | 63,000 | | | National Research Corp., Class A | | | 1,241,100 | |
| | | | | | | | |
| | | | | | | 7,585,911 | |
| | | | | | | | |
| | | | Health Care Technology 2.3% | | | | |
| | 90,000 | | | Nexus AG (Germany) | | | 1,939,922 | |
| | 55,000 | | | Omnicell, Inc.* | | | 2,235,750 | |
| | 3,000 | | | Software Service, Inc. (Japan) | | | 132,579 | |
| | | | | | | | |
| | | | | | | 4,308,251 | |
| | | | | | | | |
| | | | Heavy Electrical Equipment 0.7% | | | | |
| | 70,000 | | | TPI Composites, Inc.* | | | 1,330,700 | |
| | | | | | | | |
| | | | Homebuilding 2.7% | | | | |
| | 49,000 | | | Installed Building Products, Inc.* | | | 2,584,750 | |
| | 74,000 | | | LGI Homes, Inc.* | | | 2,509,340 | |
| | | | | | | | |
| | | | | | | 5,094,090 | |
| | | | | | | | |
| | | | Hotels, Resorts & Cruise Lines 0.8% | | | | |
| | 210,000 | | | Red Lion Hotels Corp.* | | | 1,480,500 | |
| | | | | | | | |
| | | | Human Resource & Employment Services 0.9% | | | | |
| | 123,000 | | | BG Staffing, Inc. | | | 1,760,130 | |
| | | | | | | | |
| | | | Industrial Machinery 1.8% | | | | |
| | 24,000 | | | John Bean Technologies Corp. | | | 2,110,800 | |
| | 91,292 | | | Taylor Devices, Inc.* | | | 1,255,265 | |
| | | | | | | | |
| | | | | | | 3,366,065 | |
| | | | | | | | |
| | | | Industrial REITs 1.2% | | | | |
| | 154,000 | | | Monmouth Real Estate Investment Corp. | | | 2,197,580 | |
| | | | | | | | |
| | | | Integrated Telecommunication Services 1.0% | | | | |
| | 180,000 | | | Ooma, Inc.* | | | 1,791,000 | |
| | | | | | | | |
| | | | Internet & Direct Marketing Retail 1.7% | | | | |
| | 400,000 | | | ePrice S.p.A.* (Italy) | | | 1,777,715 | |
| | 69,000 | | | Oisix, Inc.* (Japan) | | | 1,447,804 | |
| | | | | | | | |
| | | | | | | 3,225,519 | |
| | | | | | | | |
70
| | |
| | MARCH 31, 2017 (UNAUDITED) |
|
|
|
| | | | | | | | |
| Shares | | | | | Value | |
| | | | | | | |
| | | | Internet Software & Services 2.1% | | | | |
| | 59,255 | | | Reis, Inc. | | $ | 1,060,665 | |
| | 55,000 | | | Tucows, Inc., Class A* | | | 2,807,750 | |
| | | | | | | | |
| | | | | | | 3,868,415 | |
| | | | | | | | |
| | | | IT Consulting & Other Services 0.9% | | | | |
| | 57,000 | | | Virtusa Corp.* | | | 1,722,540 | |
| | | | | | | | |
| | | | Leisure Products 1.0% | | | | |
| | 100,000 | | | Nautilus, Inc.* | | | 1,825,000 | |
| | | | | | | | |
| | | | Life & Health Insurance 1.0% | | | | |
| | 42,000 | | | Kansas City Life Insurance Co. | | | 1,925,700 | |
| | | | | | | | |
| | | | Life Sciences Tools & Services 0.7% | | | | |
| | 29,000 | | | INC Research Holdings, Inc., Class A* | | | 1,329,650 | |
| | | | | | | | |
| | | | Mortgage REITs 1.2% | | | | |
| | 260,000 | | | Arbor Realty Trust, Inc. | | | 2,178,800 | |
| | | | | | | | |
| | | | Oil & Gas Equipment & Services 0.2% | | | | |
| | 289,839 | | | Profire Energy, Inc.* | | | 408,673 | |
| | | | | | | | |
| | | | Oil & Gas Exploration & Production 2.4% | | | | |
| | 448,000 | | | Abraxas Petroleum Corp.* | | | 904,960 | |
| | 159,000 | | | Earthstone Energy, Inc.* | | | 2,028,840 | |
| | 200,000 | | | Evolution Petroleum Corp. | | | 1,600,000 | |
| | | | | | | | |
| | | | | | | 4,533,800 | |
| | | | | | | | |
| | | | Packaged Foods & Meats 3.0% | | | | |
| | 190,000 | | | Bombay Burmah Trading Co. (India) | | | 2,498,806 | |
| | 149,201 | | | Freshpet, Inc.* | | | 1,641,211 | |
| | 1,600,000 | | | Kawan Food BHD (Malaysia) | | | 1,511,242 | |
| | | | | | | | |
| | | | | | | 5,651,259 | |
| | | | | | | | |
| | | | Personal Products 0.8% | | | | |
| | 120,000 | | | Sarantis S.A. (Greece) | | | 1,481,145 | |
| | | | | | | | |
| | | | Pharmaceuticals 0.8% | | | | |
| | 90,000 | | | Intra-Cellular Therapies, Inc.* | | | 1,462,500 | |
| | | | | | | | |
| | | | Property & Casualty Insurance 2.4% | | | | |
| | 114,788 | | | Atlas Financial Holdings, Inc.* | | | 1,566,856 | |
| | 188,000 | | | Kingstone Cos., Inc. | | | 2,998,600 | |
| | | | | | | | |
| | | | | | | 4,565,456 | |
| | | | | | | | |
| | | | Regional Banks 11.4% | | | | |
| | 61,000 | | | Bankwell Financial Group, Inc. | | | 2,097,790 | |
| | 78,000 | | | Blue Hills Bancorp, Inc. | | | 1,392,300 | |
| | 100,000 | | | Capstar Financial Holdings, Inc.* | | | 1,907,000 | |
| | 54,000 | | | Customers Bancorp, Inc.* | | | 1,702,620 | |
| | 56,000 | | | First Internet Bancorp | | | 1,652,000 | |
| | 67,000 | | | First of Long Island Corp. (The) | | | 1,812,350 | |
| | 136,000 | | | Investar Holding Corp. | | | 2,978,400 | |
| | 76,000 | | | People’s Utah Bancorp | | | 2,010,200 | |
| | 53,839 | | | SmartFinancial, Inc.* | | | 1,132,773 | |
| | 71,713 | | | Sound Financial Bancorp, Inc. | | | 2,233,860 | |
| | 120,000 | | | Sunshine Bancorp, Inc.* | | | 2,512,800 | |
| | | | | | | | |
| | | | | | | 21,432,093 | |
| | | | | | | | |
| | | | Residential REITs 0.8% | | | | |
| | 115,000 | | | Bluerock Residential Growth REIT, Inc. | | | 1,415,650 | |
| | | | | | | | |
| | | | Restaurants 0.8% | | | | |
| | 400,000 | | | Collins Foods Ltd. (Australia) | | | 1,589,119 | |
| | | | | | | | |
| | | | Semiconductor Equipment 1.2% | | | | |
| | 103,000 | | | PDF Solutions, Inc.* | | | 2,329,860 | |
| | | | | | | | |
| | | | Semiconductors 2.5% | | | | |
| | 205,000 | | | Tower Semiconductor Ltd.* (Israel) | | | 4,725,250 | |
| | | | | | | | |
| | | | | | | | |
| Shares | | | | | Value | |
| | | | | | | |
| | | | Specialty Chemicals 1.9% | | | | |
| | 115,000 | | | Ferro Corp.* | | $ | 1,746,850 | |
| | 148,000 | | | Flotek Industries, Inc.* | | | 1,892,920 | |
| | | | | | | | |
| | | | | | | 3,639,770 | |
| | | | | | | | |
| | | | Technology Hardware, Storage & Peripherals 0.9% | | | | |
| | 380,000 | | | USA Technologies, Inc.* | | | 1,615,000 | |
| | | | | | | | |
| | | | Textiles 1.9% | | | | |
| | 2,100,000 | | | Best Pacific International Holdings Ltd. (China) | | | 1,678,054 | |
| | 1,400,000 | | | Welspun India Ltd. (India) | | | 1,878,956 | |
| | | | | | | | |
| | | | | | | 3,557,010 | |
| | | | | | | | |
| | | | Thrifts & Mortgage Finance 2.8% | | | | |
| | 97,000 | | | Beneficial Bancorp, Inc. | | | 1,552,000 | |
| | 79,000 | | | BofI Holding, Inc.* | | | 2,064,270 | |
| | 360,000 | | | Mortgage Advice Bureau Holdings Ltd. (United Kingdom) | | | 1,746,669 | |
| | | | | | | | |
| | | | | | | 5,362,939 | |
| | | | | | | | |
| | | | Trading Companies & Distributors 1.6% | | | | |
| | 62,000 | | | SiteOne Landscape Supply, Inc.* | | | 3,001,420 | |
| | | | | | | | |
| | | | Trucking 0.7% | | | | |
| | 200,000 | | | Celadon Group, Inc. | | | 1,310,000 | |
| | | | | | | | |
| | |
| | | | Total Common Stocks
(cost $129,234,255) | | | 180,896,545 | |
| | | | | | | | |
| | |
| | | | LIMITED LIABILITY COMPANY MEMBERSHIP INTEREST 0.0% | | | | |
| | |
| | | | Pharmaceuticals 0.0% | | | | |
| | 6,316 | | | Regenacy Pharmaceuticals, LLC* *** † | | | 51,475 | |
| | | | | | | | |
| | |
| | | | Total Limited Liability Company Membership Interest
(cost $30,001) | | | 51,475 | |
| | | | | | | | |
| | |
| | | | CONVERTIBLE PREFERRED STOCKS 0.8% | | | | |
| | |
| | | | Oil & Gas Refining & Marketing 0.8% | | | | |
| | 547,265 | | | Vertex Energy, Inc., Pfd., Series B*** † | | | 1,424,257 | |
| | | | | | | | |
| | |
| | | | Total Convertible Preferred Stocks
(cost $1,601,521) | | | 1,424,257 | |
| | | | | | | | |
| | |
| | | | WARRANTS 0.0% | | | | |
| | |
| | | | Oil & Gas Refining & Marketing 0.0% | | | | |
| | 250,000 | | | Vertex Energy, Inc., expiring 12/24/2021* *** † | | | 25,000 | |
| | | | | | | | |
| | |
| | | | Total Warrants
(cost $95,000) | | | 25,000 | |
| | | | | | | | |
| | |
| | | | RIGHTS 0.2% | | | | |
| | |
| | | | Health Care Supplies 0.0% | | | | |
| | 375,000 | | | Synergetics USA, Inc.* *** † | | | 18,750 | |
| | | | | | | | |
71
| | |
| WASATCH MICRO CAP VALUE FUND (WAMVX) | | MARCH 31, 2017 (UNAUDITED) |
|
|
|
Schedule of Investments (continued)
| | | | | | | | |
| Shares | | | | | Value | |
| | | | | | | |
| | | | Pharmaceuticals 0.2% | | | | |
| | 1 | | | Acetylon Pharmaceuticals, Inc.* *** † | | $ | 326,356 | |
| | 1 | | | Acetylon Pharmaceuticals, Inc.* *** † | | | — | |
| | | | | | | | |
| | | | | | | 326,356 | |
| | | | | | | | |
| | |
| | | | Total Rights
(cost $71,250) | | | 345,106 | |
| | | | | | | | |
| | |
Principal
Amount | | | | | Value | |
| | | | | | | |
| | | | SHORT-TERM INVESTMENTS 3.0% | | | | |
| | |
| | | | Repurchase Agreement 3.0% | | | | |
| | $5,707,476 | | | Repurchase Agreement dated 3/31/17,
0.09% due 4/3/17 with State Street Bank
and Trust Co. collateralized by $5,875,000
of United States Treasury Notes 2.125%
due 3/31/24; value $5,823,594; repurchase
proceeds: $5,707,519 (cost $5,707,476) | | $ | 5,707,476 | |
| | | | | | | | |
| | |
| | | | Total Short-Term Investments
(cost $5,707,476) | | | 5,707,476 | |
| | | | | | | | |
| | |
| | | | Total Investments
(cost $136,739,503) 100.1% | | | 188,449,859 | |
| | |
| | | | Liabilities less Other Assets (0.1%) | | | (133,836 | ) |
| | | | | | | | |
| | |
| | | | NET ASSETS 100.0% | | $ | 188,316,023 | |
| | | | | | | | |
| |
| | | | *Non-income producing. ***Security was fair valued under procedures adopted by the Board of Trustees (see Note 13). †Security purchased in a private placement transaction or under Rule 144A of the Securities Act of 1933 (see Note 9). REIT Real Estate Investment Trust. See Notes to Financial Statements. | |
At March 31, 2017, Wasatch Micro Cap Value Fund’s investments, excluding short-term investments, were in the following countries:
| | | | |
| Country | | % | |
Argentina | | | 1.1 | |
Australia | | | 0.9 | |
China | | | 0.9 | |
Finland | | | 1.0 | |
France | | | 1.1 | |
Germany | | | 1.1 | |
Greece | | | 0.8 | |
India | | | 4.4 | |
Israel | | | 2.6 | |
Italy | | | 1.0 | |
Japan | | | 2.6 | |
Malaysia | | | 0.8 | |
Philippines | | | 1.3 | |
Sweden | | | 1.8 | |
Taiwan | | | 1.0 | |
Turkey | | | 0.9 | |
United Kingdom | | | 2.7 | |
United States | | | 74.0 | |
| | | | |
TOTAL | | | 100.0 | % |
| | | | |
72
| | |
| WASATCH SMALL CAP GROWTH FUND (WAAEX / WIAEX) | | MARCH 31, 2017 (UNAUDITED) |
|
|
|
Schedule of Investments
| | | | | | | | |
| Shares | | | | | Value | |
| | | | | | | |
| | | | COMMON STOCKS 95.1% | | | | |
| | |
| | | | Aerospace & Defense 2.3% | | | | |
| | 537,468 | | | HEICO Corp., Class A | | $ | 40,310,100 | |
| | | | | | | | |
| | | | Air Freight & Logistics 4.2% | | | | |
| | 36,319,023 | | | Aramex PJSC (United Arab Emirates) | | | 48,947,471 | |
| | 1,114,375 | | | Echo Global Logistics, Inc.* | | | 23,791,906 | |
| | | | | | | | |
| | | | | | | 72,739,377 | |
| | | | | | | | |
| | | | Airlines 4.1% | | | | |
| | 159,384 | | | Allegiant Travel Co. | | | 25,541,286 | |
| | 854,926 | | | Spirit Airlines, Inc.* | | | 45,370,923 | |
| | | | | | | | |
| | | | | | | 70,912,209 | |
| | | | | | | | |
| | | | Apparel Retail 1.3% | | | | |
| | 1,265,079 | | | Zumiez, Inc.* ‡‡ | | | 23,150,946 | |
| | | | | | | | |
| | | | Application Software 10.0% | | | | |
| | 1,501,652 | | | Callidus Software, Inc.* | | | 32,060,270 | |
| | 344,774 | | | Globant S.A.* (Argentina) | | | 12,549,773 | |
| | 409,893 | | | HubSpot, Inc.* | | | 24,819,021 | |
| | 420,349 | | | Paylocity Holding Corp.* | | | 16,238,082 | |
| | 316,789 | | | Ultimate Software Group, Inc. (The)* | | | 61,840,381 | |
| | 878,024 | | | Zendesk, Inc.* | | | 24,619,793 | |
| | | | | | | | |
| | | | | | | 172,127,320 | |
| | | | | | | | |
| | | | Automotive Retail 2.3% | | | | |
| | 450,085 | | | Monro Muffler Brake, Inc. | | | 23,449,428 | |
| | 57,384 | | | O’Reilly Automotive, Inc.* | | | 15,484,499 | |
| | | | | | | | |
| | | | | | | 38,933,927 | |
| | | | | | | | |
| | | | Biotechnology 7.5% | | | | |
| | 2,124,073 | | | Abcam plc (United Kingdom) | | | 21,968,636 | |
| | 52,450 | | | Argos Therapeutics, Inc. PIPE* *** † | | | 23,702 | |
| | 78,700 | | | Argos Therapeutics, Inc. PIPE* *** † | | | 35,564 | |
| | 1,028,565 | | | ChemoCentryx, Inc.* | | | 7,487,953 | |
| | 601,849 | | | Cytokinetics, Inc.* | | | 7,733,760 | |
| | 372,734 | | | Esperion Therapeutics, Inc.* | | | 13,161,238 | |
| | 755,800 | | | Exact Sciences Corp.* | | | 17,851,996 | |
| | 298,754 | | | Flexion Therapeutics, Inc.* | | | 8,039,470 | |
| | 987,182 | | | Inovio Pharmaceuticals, Inc.* | | | 6,535,145 | |
| | 2,064,571 | | | Sangamo Therapeutics, Inc.* | | | 10,735,769 | |
| | 576,680 | | | Seattle Genetics, Inc.* | | | 36,250,105 | |
| | | | | | | | |
| | | | | | | 129,823,338 | |
| | | | | | | | |
| | | | Building Products 1.0% | | | | |
| | 478,226 | | | AAON, Inc. | | | 16,905,289 | |
| | | | | | | | |
| | | | Diversified Banks 1.4% | | | | |
| | 1,013,700 | | | Yes Bank Ltd. (India) | | | 24,131,477 | |
| | | | | | | | |
| | | | Diversified Support Services 3.7% | | | | |
| | 1,020,424 | | | Copart, Inc.* | | | 63,194,858 | |
| | | | | | | | |
| | | | Drug Retail 1.4% | | | | |
| | 119,229 | | | Cosmos Pharmaceutical Corp. (Japan) | | | 23,282,480 | |
| | | | | | | | |
| | | | Food Distributors 1.2% | | | | |
| | 1,503,435 | | | Chefs’ Warehouse, Inc. (The)* ‡‡ | | | 20,897,746 | |
| | | | | | | | |
| | | | General Merchandise Stores 1.8% | | | | |
| | 934,626 | | | Ollie’s Bargain Outlet Holdings, Inc.* | | | 31,309,971 | |
| | | | | | | | |
| | | | Health Care Equipment 0.0% | | | | |
| | 593,260 | | | Tandem Diabetes Care, Inc.* | | | 711,912 | |
| | | | | | | | |
| | | | Health Care Facilities 1.7% | | | | |
| | 1,533,765 | | | Ensign Group, Inc. (The) | | | 28,834,782 | |
| | | | | | | | |
| | | | Industrial Machinery 0.7% | | | | |
| | 119,888 | | | RBC Bearings, Inc.* | | | 11,639,926 | |
| | | | | | | | |
| | | | | | | | |
| Shares | | | | | Value | |
| | | | | | | |
| | | | Internet & Direct Marketing Retail 4.4% | | | | |
| | 1,086,770 | | | MakeMyTrip Ltd.* (India) | | $ | 37,602,242 | |
| | 599,871 | | | Wayfair, Inc., Class A* | | | 24,288,777 | |
| | 96,295 | | | zooplus AG* (Germany) | | | 14,140,438 | |
| | | | | | | | |
| | | | | | | 76,031,457 | |
| | | | | | | | |
| | | | Internet Software & Services 3.7% | | | | |
| | 1,231,189 | | | Cornerstone OnDemand, Inc.* | | | 47,880,940 | |
| | 514,655 | | | Envestnet, Inc.* | | | 16,623,357 | |
| | | | | | | | |
| | | | | | | 64,504,297 | |
| | | | | | | | |
| | | | IT Consulting & Other Services 1.7% | | | | |
| | 462,364 | | | Luxoft Holding, Inc.* (Switzerland) | | | 28,920,868 | |
| | | | | | | | |
| | | | Life Sciences Tools & Services 2.7% | | | | |
| | 265,234 | | | Fluidigm Corp.* | | | 1,509,181 | |
| | 576,523 | | | ICON plc* (Ireland) | | | 45,960,414 | |
| | | | | | | | |
| | | | | | | 47,469,595 | |
| | | | | | | | |
| | | | Managed Health Care 1.6% | | | | |
| | 654,195 | | | HealthEquity, Inc.* | | | 27,770,578 | |
| | | | | | | | |
| | | | Oil & Gas Drilling 0.2% | | | | |
| | 199,608 | | | Nabors Industries Ltd. | | | 2,608,877 | |
| | 343,142 | | | Seadrill Ltd.* | | | 566,184 | |
| | | | | | | | |
| | | | | | | 3,175,061 | |
| | | | | | | | |
| | | | Oil & Gas Equipment & Services 0.6% | | | | |
| | 110,894 | | | Archrock, Inc. | | | 1,375,086 | |
| | 88,407 | | | Dril-Quip, Inc.* | | | 4,822,602 | |
| | 88,632 | | | Frank’s International N.V. | | | 936,840 | |
| | 78,835 | | | Oceaneering International, Inc. | | | 2,134,852 | |
| | 81,694 | | | RPC, Inc. | | | 1,495,817 | |
| | | | | | | | |
| | | | | | | 10,765,197 | |
| | | | | | | | |
| | | | Oil & Gas Exploration & Production 0.2% | | | | |
| | 456,863 | | | EP Energy Corp., Class A* | | | 2,170,099 | |
| | 129,331 | | | WPX Energy, Inc.* | | | 1,731,742 | |
| | | | | | | | |
| | | | | | | 3,901,841 | |
| | | | | | | | |
| | | | Oil & Gas Refining & Marketing 0.3% | | | | |
| | 38,475 | | | CVR Energy, Inc. | | | 772,578 | |
| | 77,771 | | | Delek US Holdings, Inc. | | | 1,887,502 | |
| | 50,917 | | | Western Refining, Inc. | | | 1,785,659 | |
| | | | | | | | |
| | | | | | | 4,445,739 | |
| | | | | | | | |
| | | | Packaged Foods & Meats 0.8% | | | | |
| | 167,486 | | | GlaxoSmithKline Consumer Healthcare Ltd. (India) | | | 13,283,328 | |
| | | | | | | | |
| | | | Personal Products 0.5% | | | | |
| | 546,807 | | | Colgate-Palmolive India Ltd. (India) | | | 8,357,680 | |
| | | | | | | | |
| | | | Pharmaceuticals 0.3% | | | | |
| | 344,121 | | | Intra-Cellular Therapies, Inc.* | | | 5,591,966 | |
| | | | | | | | |
| | | | Real Estate Services 0.9% | | | | |
| | 581,081 | | | HFF, Inc., Class A | | | 16,078,511 | |
| | | | | | | | |
| | | | Regional Banks 11.7% | | | | |
| | 416,533 | | | Bank of Hawaii Corp. | | | 34,305,658 | |
| | 585,554 | | | Eagle Bancorp, Inc.* | | | 34,957,574 | |
| | 978,813 | | | Glacier Bancorp, Inc. | | | 33,211,125 | |
| | 887,886 | | | Metro Bank plc* (United Kingdom) | | | 36,198,563 | |
| | 512,849 | | | Pinnacle Financial Partners, Inc. | | | 34,078,816 | |
| | 357,628 | | | Texas Capital Bancshares, Inc.* | | | 29,844,056 | |
| | | | | | | | |
| | | | 202,595,792 | |
| | | | | | | | |
| | | | Research & Consulting Services 0.6% | | | | |
| | 412,649 | | | Stantec, Inc. (Canada) | | | 10,708,242 | |
| | | | | | | | |
73
| | |
| WASATCH SMALL CAP GROWTH FUND (WAAEX / WIAEX) | | MARCH 31, 2017 (UNAUDITED) |
|
|
|
Schedule of Investments (continued)
| | | | | | | | |
| Shares | | | | | Value | |
| | | | | | | |
| | | | Restaurants 3.4% | | | | |
| | 551,425 | | | Chuy’s Holdings, Inc.* | | $ | 16,432,465 | |
| | 986,342 | | | Fiesta Restaurant Group, Inc.* | | | 23,869,476 | |
| | 583,895 | | | Jubilant Foodworks Ltd. (India) | | | 9,953,686 | |
| | 465,282 | | | Zoe’s Kitchen, Inc.* | | | 8,607,717 | |
| | | | | | | | |
| | | | 58,863,344 | |
| | | | | | | | |
| | | | Semiconductors 4.7% | | | | |
| | 744,289 | | | Cavium, Inc.* | | | 53,335,750 | |
| | 307,942 | | | Monolithic Power Systems, Inc. | | | 28,361,458 | |
| | | | | | | | |
| | | | 81,697,208 | |
| | | | | | | | |
| | | | Specialty Stores 1.4% | | | | |
| | 571,541 | | | Five Below, Inc.* | | | 24,753,441 | |
| | | | | | | | |
| | | | Systems Software 3.9% | | | | |
| | 377,086 | | | CyberArk Software Ltd.* (Israel) | | | 19,182,365 | |
| | 659,966 | | | Fortinet, Inc.* | | | 25,309,696 | |
| | 156,924 | | | Proofpoint, Inc.* | | | 11,668,869 | |
| | 724,144 | | | Rapid7, Inc.* | | | 10,847,677 | |
| | | | | | | | |
| | | | 67,008,607 | |
| | | | | | | | |
| | | | Trading Companies & Distributors 3.3% | | | | |
| | 142,366 | | | MSC Industrial Direct Co., Inc., Class A | | | 14,629,530 | |
| | 601,775 | | | WESCO International, Inc.* | | | 41,853,451 | |
| | | | | | | | |
| | | | 56,482,981 | |
| | | | | | | | |
| | | | Trucking 3.6% | | | | |
| | 1,962,710 | | | Knight Transportation, Inc. | | | 61,530,958 | |
| | | | | | | | |
| | |
| | | | Total Common Stocks
(cost $1,102,669,755) | | | 1,642,842,349 | |
| | | | | | | | |
| | |
| | | | PREFERRED STOCKS 2.5% | | | | |
| | |
| | | | Biotechnology 0.1% | | | | |
| | 677,966 | | | Nanosys, Inc., Series D Pfd.* *** † | | | 568,814 | |
| | 161,519 | | | Nanosys, Inc., Series E Pfd.* *** † | | | 191,626 | |
| | | | | | | | |
| | | | 760,440 | |
| | | | | | | | |
| | | | Oil & Gas Equipment & Services 0.8% | | | | |
| | 5,818,582 | | | Drilling Info Holdings, Inc., Series B Pfd.* *** † | | | 14,386,444 | |
| | | | | | | | |
| | | | Systems Software 1.6% | | | | |
| | 1,114,610 | | | DataStax, Inc., Series E Pfd.* *** † | | | 6,397,861 | |
| | 33,296 | | | DocuSign, Inc., Series B Pfd.* *** † | | | 551,382 | |
| | 9,974 | | | DocuSign, Inc., Series B-1 Pfd.* *** † | | | 165,169 | |
| | 23,905 | | | DocuSign, Inc., Series D Pfd.* *** † | | | 395,867 | |
| | 618,152 | | | DocuSign, Inc., Series E Pfd.* *** † | | | 10,236,597 | |
| | 157,124 | | | DocuSign, Inc., Series F Pfd.* *** † | | | 2,601,974 | |
| | 505,604 | | | ForeScout Technologies, Inc., Series G* *** † | | | 8,008,767 | |
| | | | | | | | |
| | | | 28,357,617 | |
| | | | | | | | |
| | |
| | | | Total Preferred Stocks
(cost $43,534,917) | | | 43,504,501 | |
| | | | | | | | |
| | |
| | | | LIMITED PARTNERSHIP INTEREST 0.2% | | | | |
| | |
| | | | Asset Management & Custody Banks 0.2% | | | | |
| | | | Greenspring Global Partners II-B, L.P.* *** † | | | 2,346,596 | |
| | | | Greenspring Global Partners III-B, L.P.* *** † | | | 1,143,997 | |
| | | | | | | | |
| | | | 3,490,593 | |
| | | | | | | | |
| | |
| | | | Total Limited Partnership Interest
(cost $3,748,888) | | | 3,490,593 | |
| | | | | | | | |
| | | | | | | | |
| Shares | | | | | Value | |
| | | | | | | |
| | | | WARRANTS 0.0% | | | | |
| | |
| | | | Biotechnology 0.0% | | | | |
| | 59,025 | | | Argos Therapeutics, Inc., expiring 3/14/2021* *** † | | $ | 590 | |
| | 324,314 | | | Argos Therapeutics, Inc., expiring 8/8/2021* *** † | | | 38,918 | |
| | | | | | | | |
| | | | 39,508 | |
| | | | | | | | |
| | |
| | | | Total Warrants
(cost $7,378) | | | 39,508 | |
| | | | | | | | |
| | |
Principal
Amount | | | | | Value | |
| | | | SHORT-TERM INVESTMENTS 2.1% | | | | |
| | |
| | | | Repurchase Agreement 2.1% | | | | |
| | $36,988,153 | | | Repurchase Agreement dated 3/31/17, 0.09% due 4/3/17 with State Street Bank and Trust Co. collateralized by $36,935,000 of United States Treasury Notes 0.375% due 7/15/25; value: $1,736,790; United States Treasury Notes 2.125% due 3/31/24; value: $3,846,050; United States Treasury Notes 2.500% due 5/15/24; value: $32,148,453; repurchase proceeds: $36,988,431†† (cost $36,988,153) | | $ | 36,988,153 | |
| | | | | | | | |
| | |
| | | | Total Short-Term Investments
(cost $36,988,153) | | | 36,988,153 | |
| | | | | | | | |
| | |
| | | | Total Investments
(cost $1,186,949,091) 99.9% | | | 1,726,865,104 | |
| | |
| | | | Other Assets less Liabilities 0.1% | | | 1,825,558 | |
| | | | | | | | |
| | |
| | | | NET ASSETS 100.0% | | $ | 1,728,690,662 | |
| | | | | | | | |
| |
| | | | *Non-income producing. ***Security was fair valued under procedures adopted by the Board of Trustees (see Note 13). †Security purchased in a private placement transaction or under Rule 144A of the Securities Act of 1933 (see Note 9). ††All or a portion of this security has been designated as collateral for purchase commitments (see Note 10). ‡‡Affiliated company (see Note 8). PIPE Private Investment in a Public Equity. See Notes to Financial Statements. | |
At March 31, 2017, Wasatch Small Cap Growth Fund’s investments, excluding short-term investments, were in the following countries:
| | | | |
| Country | | % | |
Argentina | | | 0.8 | |
Canada | | | 0.6 | |
Germany | | | 0.8 | |
India | | | 5.5 | |
Ireland | | | 2.7 | |
Israel | | | 1.1 | |
Japan | | | 1.4 | |
Switzerland | | | 1.7 | |
United Arab Emirates | | | 2.9 | |
United Kingdom | | | 3.5 | |
United States | | | 79.0 | |
| | | | |
TOTAL | | | 100.0 | % |
| | | | |
74
| | |
| WASATCH SMALL CAP VALUE FUND (WMCVX/WICVX) | | MARCH 31, 2017 (UNAUDITED) |
|
|
|
Schedule of Investments
| | | | | | | | |
| Shares | | | | | Value | |
| | | | | | | |
| | | | COMMON STOCKS 96.6% | | | | |
| | |
| | | | Aerospace & Defense 3.1% | | | | |
| | 139,990 | | | HEICO Corp., Class A | | $ | 10,499,250 | |
| | | | | | | | |
| | | | Airlines 4.3% | | | | |
| | 45,167 | | | Allegiant Travel Co. | | | 7,238,012 | |
| | 142,467 | | | Spirit Airlines, Inc.* | | | 7,560,723 | |
| | | | | | | | |
| | | | | | | 14,798,735 | |
| | | | | | | | |
| | | | Application Software 3.1% | | | | |
| | 128,204 | | | Ebix, Inc. | | | 7,852,495 | |
| | 74,525 | | | Globant S.A.* (Argentina) | | | 2,712,710 | |
| | | | | | | | |
| | | | | | | 10,565,205 | |
| | | | | | | | |
| | | | Asset Management & Custody Banks 4.8% | | | | |
| | 190,750 | | | Ares Capital Corp. | | | 3,315,235 | |
| | 172,338 | | | Artisan Partners Asset Management, Inc., Class A | | | 4,756,529 | |
| | 368,528 | | | Solar Capital Ltd. | | | 8,332,418 | |
| | | | | | | | |
| | | | | | | 16,404,182 | |
| | | | | | | | |
| | | | Auto Parts & Equipment 1.2% | | | | |
| | 50,060 | | | Dorman Products, Inc.* | | | 4,111,428 | |
| | | | | | | | |
| | | | Biotechnology 1.0% | | | | |
| | 144,577 | | | Exact Sciences Corp.* | | | 3,414,909 | |
| | | | | | | | |
| | | | Consumer Electronics 0.9% | | | | |
| | 444,063 | | | ZAGG, Inc.* | | | 3,197,254 | |
| | | | | | | | |
| | | | Consumer Finance 3.3% | | | | |
| | 33,818 | | | Credit Acceptance Corp.* | | | 6,743,647 | |
| | 130,547 | | | PRA Group, Inc.* | | | 4,327,633 | |
| | | | | | | | |
| | | | | | | 11,071,280 | |
| | | | | | | | |
| | | | Data Processing & Outsourced Services 1.6% | | | | |
| | 65,509 | | | Euronet Worldwide, Inc.* | | | 5,602,330 | |
| | | | | | | | |
| | | | Diversified Banks 2.3% | | | | |
| | 1,752,492 | | | City Union Bank Ltd. (India) | | | 4,088,743 | |
| | 156,738 | | | Yes Bank Ltd. (India) | | | 3,731,202 | |
| | | | | | | | |
| | | | | | | 7,819,945 | |
| | | | | | | | |
| | | | Diversified Support Services 1.7% | | | | |
| | 92,294 | | | Copart, Inc.* | | | 5,715,767 | |
| | | | | | | | |
| | | | Electronic Manufacturing Services 1.9% | | | | |
| | 156,425 | | | Fabrinet* | | | 6,574,543 | |
| | | | | | | | |
| | | | Health Care Facilities 2.7% | | | | |
| | 480,203 | | | Ensign Group, Inc. (The) | | | 9,027,816 | |
| | | | | | | | |
| | | | Health Care REITs 4.5% | | | | |
| | 402,628 | | | CareTrust REIT, Inc. | | | 6,772,203 | |
| | 306,822 | | | Sabra Health Care REIT, Inc. | | | 8,569,538 | |
| | | | | | | | |
| | | | | | | 15,341,741 | |
| | | | | | | | |
| | | | Health Care Services 2.3% | | | | |
| | 143,082 | | | LHC Group, Inc.* | | | 7,712,120 | |
| | | | | | | | |
| | | | Homebuilding 2.7% | | | | |
| | 271,081 | | | LGI Homes, Inc.* | | | 9,192,357 | |
| | | | | | | | |
| | | | Homefurnishing Retail 1.6% | | | | |
| | 224,054 | | | Select Comfort Corp.* | | | 5,554,299 | |
| | | | | | | | |
| | | | Hotel & Resort REITs 1.7% | | | | |
| | 363,922 | | | Summit Hotel Properties, Inc. | | | 5,815,474 | |
| | | | | | | | |
| | | | | | | | |
| Shares | | | | | Value | |
| | | | | | | |
| | | | Industrial Machinery 1.6% | | | | |
| | 141,943 | | | Altra Industrial Motion Corp. | | $ | 5,528,680 | |
| | | | | | | | |
| | | | Industrial REITs 1.9% | | | | |
| | 454,227 | | | Monmouth Real Estate Investment Corp. | | | 6,481,819 | |
| | | | | | | | |
| | | | Internet Software & Services 4.3% | | | | |
| | 87,153 | | | Cimpress N.V.* | | | 7,511,717 | |
| | 59,432 | | | Stamps.com, Inc.* | | | 7,033,777 | |
| | | | | | | | |
| | | | | | | 14,545,494 | |
| | | | | | | | |
| | | | IT Consulting & Other Services 3.8% | | | | |
| | 92,196 | | | Luxoft Holding, Inc.* (Switzerland) | | | 5,766,860 | |
| | 242,295 | | | Virtusa Corp.* | | | 7,322,155 | |
| | | | | | | | |
| | | | | | | 13,089,015 | |
| | | | | | | | |
| | | | Life Sciences Tools & Services 1.4% | | | | |
| | 60,141 | | | ICON plc* (Ireland) | | | 4,794,440 | |
| | | | | | | | |
| | | | Mortgage REITs 4.2% | | | | |
| | 1,263,116 | | | Arbor Realty Trust, Inc. | | | 10,584,912 | |
| | 463,527 | | | MFA Financial, Inc. | | | 3,745,298 | |
| | | | | | | | |
| | | | | | | 14,330,210 | |
| | | | | | | | |
| | | | Oil & Gas Equipment & Services 0.3% | | | | |
| | 61,129 | | | Geospace Technologies Corp.* | | | 992,124 | |
| | | | | | | | |
| | | | Oil & Gas Exploration & Production 3.1% | | | | |
| | 414,117 | | | Earthstone Energy, Inc.* | | | 5,284,133 | |
| | 1,941,562 | | | Gran Tierra Energy, Inc.* (Colombia) | | | 5,125,724 | |
| | | | | | | | |
| | | | | | | 10,409,857 | |
| | | | | | | | |
| | | | Oil & Gas Refining & Marketing 1.4% | | | | |
| | 128,153 | | | World Fuel Services Corp. | | | 4,645,546 | |
| | | | | | | | |
| | | | Personal Products 1.3% | | | | |
| | 81,129 | | | Nu Skin Enterprises, Inc., Class A | | | 4,505,905 | |
| | | | | | | | |
| | | | Pharmaceuticals 0.5% | | | | |
| | 336,510 | | | Egalet Corp.* | | | 1,716,201 | |
| | | | | | | | |
| | | | Property & Casualty Insurance 1.4% | | | | |
| | 350,861 | | | Atlas Financial Holdings, Inc.* | | | 4,789,253 | |
| | | | | | | | |
| | | | Regional Banks 10.4% | | | | |
| | 198,180 | | | Customers Bancorp, Inc.* | | | 6,248,615 | |
| | 253,181 | | | First of Long Island Corp. (The) | | | 6,848,546 | |
| | 127,452 | | | Pinnacle Financial Partners, Inc. | | | 8,469,186 | |
| | 84,230 | | | Prosperity Bancshares, Inc. | | | 5,871,673 | |
| | 162,985 | | | Webster Financial Corp. | | | 8,155,770 | |
| | | | | | | | |
| | | | | | | 35,593,790 | |
| | | | | | | | |
| | | | Restaurants 1.4% | | | | |
| | 203,526 | | | Fiesta Restaurant Group, Inc.* | | | 4,925,329 | |
| | | | | | | | |
| | | | Semiconductor Equipment 1.9% | | | | |
| | 290,141 | | | PDF Solutions, Inc.* | | | 6,562,989 | |
| | | | | | | | |
| | | | Semiconductors 4.5% | | | | |
| | 96,118 | | | Cavium, Inc.* | | | 6,887,816 | |
| | 361,020 | | | Tower Semiconductor Ltd.* (Israel) | | | 8,321,511 | |
| | | | | | | | |
| | | | | | | 15,209,327 | |
| | | | | | | | |
| | | | Specialty Chemicals 1.0% | | | | |
| | 52,250 | | | Innospec, Inc. | | | 3,383,187 | |
| | | | | | | | |
| | | | Thrifts & Mortgage Finance 1.4% | | | | |
| | 180,358 | | | BofI Holding, Inc.* | | | 4,712,754 | |
| | | | | | | | |
| | | | Trading Companies & Distributors 2.1% | | | | |
| | 102,934 | | | WESCO International, Inc.* | | | 7,159,060 | |
| | | | | | | | |
75
| | |
| WASATCH SMALL CAP VALUE FUND (WMCVX / WICVX) | | MARCH 31, 2017 (UNAUDITED) |
|
|
|
Schedule of Investments (continued)
| | | | | | | | |
| Shares | | | | | Value | |
| | | | | | | |
| | | | Trucking 4.0% | | | | |
| | 98,807 | | | Knight Transportation, Inc. | | $ | 3,097,599 | |
| | 46,705 | | | Old Dominion Freight Line, Inc. | | | 3,996,547 | |
| | 319,688 | | | Swift Transportation Co.* | | | 6,566,392 | |
| | | | | | | | |
| | | | | | | 13,660,538 | |
| | | | | | | | |
| | |
| | | | Total Common Stocks
(cost $251,733,780) | | | 329,454,153 | |
| | | | | | | | |
| | |
| | | | LIMITED PARTNERSHIP INTEREST 1.6% | | | | |
| | |
| | | | Oil & Gas Storage & Transportation 1.6% | | | | |
| | 167,821 | | | Delek Logistics Partners L.P. | | | 5,588,439 | |
| | | | | | | | |
| | |
| | | | Total Limited Partnership Interest
(cost $5,983,651) | | | 5,588,439 | |
| | | | | | | | |
| | |
| | | | WARRANTS 0.0% | | | | |
| | |
| | | | Biotechnology 0.0% | | | | |
| | 81,921 | | | Argos Therapeutics, Inc., expiring 8/2/2021* *** † | | | 9,830 | |
| | | | | | | | |
| | |
| | | | Total Warrants
(cost $0) | | | 9,830 | |
| | | | | | | | |
| | |
Principal
Amount | | | | | Value | |
| | | | | | | |
| | | | SHORT-TERM INVESTMENTS 3.1% | | | | |
| | |
| | | | Repurchase Agreement 3.1% | | | | |
| | $10,563,263 | | | Repurchase Agreement dated 3/31/17,
0.09% due 4/3/17 with State Street Bank
and Trust Co. collateralized by $10,520,000
of United States Treasury Notes 0.375%
due 7/15/25; value $10,779,371; repurchase
proceeds: $10,563,342 (cost $10,563,263) | | $ | 10,563,263 | |
| | | | | | | | |
| | |
| | | | Total Short-Term Investments
(cost $10,563,263) | | | 10,563,263 | |
| | | | | | | | |
| | |
| | | | Total Investments
(cost $268,280,694) 101.3% | | | 345,615,685 | |
| | |
| | | | Liabilities less Other Assets (1.3%) | | | (4,414,310 | ) |
| | | | | | | | |
| | |
| | | | NET ASSETS 100.0% | | $ | 341,201,375 | |
| | | | | | | | |
| |
| | | | *Non-income producing. ***Security was fair valued under procedures adopted by the Board of Trustees (see Note 13). †Security purchased in a private placement transaction or under Rule 144A of the Securities Act of 1933 (see Note 9). REIT Real Estate Investment Trust. See Notes to Financial Statements. | |
At March 31, 2017, Wasatch Small Cap Value Fund’s investments, excluding short-term investments, were in the following countries:
| | | | |
| Country | | % | |
Argentina | | | 0.8 | |
Colombia | | | 1.5 | |
India | | | 2.4 | |
Ireland | | | 1.4 | |
Israel | | | 2.5 | |
Switzerland | | | 1.7 | |
United States | | | 89.7 | |
| | | | |
TOTAL | | | 100.0 | % |
| | | | |
76
| | |
| WASATCH STRATEGIC INCOME FUND (WASIX) | | MARCH 31, 2017 (UNAUDITED) |
|
|
|
Schedule of Investments
| | | | | | | | |
| Shares | | | | | Value | |
| | | | | | | |
| | | | COMMON STOCKS 73.1% | | | | |
| | |
| | | | Air Freight & Logistics 0.9% | | | | |
| | 2,200 | | | FedEx Corp. | | $ | 429,330 | |
| | | | | | | | |
| | | | Asset Management & Custody Banks 4.3% | | | | |
| | 32,620 | | | Alcentra Capital Corp. | | | 448,199 | |
| | 50 | | | Ameriprise Financial, Inc. | | | 6,484 | |
| | 69,852 | | | Ares Capital Corp. | | | 1,214,028 | |
| | 10,295 | | | Hercules Capital, Inc. | | | 155,763 | |
| | 112,913 | | | Medallion Financial Corp. | | | 223,568 | |
| | 2,700 | | | Triangle Capital Corp. | | | 51,543 | |
| | | | | | | | |
| | | | | | | 2,099,585 | |
| | | | | | | | |
| | | | Automotive Retail 1.8% | | | | |
| | 18,115 | | | Penske Automotive Group, Inc. | | | 847,963 | |
| | | | | | | | |
| | | | Broadcasting 4.0% | | | | |
| | 28,260 | | | CBS Corp., Class B | | | 1,960,114 | |
| | | | | | | | |
| | | | Cable & Satellite 6.8% | | | | |
| | 87,993 | | | Comcast Corp., Class A | | | 3,307,657 | |
| | | | | | | | |
| | | | Consumer Finance 2.0% | | | | |
| | 6,000 | | | American Express Co. | | | 474,660 | |
| | 80 | | | Capital One Financial Corp. | | | 6,933 | |
| | 7,089 | | | Discover Financial Services | | | 484,817 | |
| | | | | | | | |
| | | | | | | 966,410 | |
| | | | | | | | |
| | | | Data Processing & Outsourced Services 7.3% | | | | |
| | 15,950 | | | MasterCard, Inc., Class A | | | 1,793,897 | |
| | 19,890 | | | Visa, Inc., Class A | | | 1,767,624 | |
| | | | | | | | |
| | | | | | | 3,561,521 | |
| | | | | | | | |
| | | | Diversified REITs 3.1% | | | | |
| | 77,170 | | | Colony NorthStar, Inc., Class A | | | 996,265 | |
| | 355,714 | | | Star Asia Capital Corp Ltd.* *** † | | | 497,999 | |
| | | | | | | | |
| | | | | | | 1,494,264 | |
| | | | | | | | |
| | | | Drug Retail 6.6% | | | | |
| | 18,375 | | | CVS Health Corp. | | | 1,442,437 | |
| | 21,039 | | | Walgreens Boots Alliance, Inc. | | | 1,747,289 | |
| | | | | | | | |
| | | | | | | 3,189,726 | |
| | | | | | | | |
| | | | Fertilizers & Agricultural Chemicals 2.2% | | | | |
| | 9,571 | | | Monsanto Co. | | | 1,083,437 | |
| | | | | | | | |
| | | | Financial Exchanges & Data 0.0% | | | | |
| | 100 | | | MSCI, Inc., Class A | | | 9,719 | |
| | 300 | | | OTC Markets Group, Inc. | | | 6,450 | |
| | | | | | | | |
| | | | | | | 16,169 | |
| | | | | | | | |
| | | | Health Care Distributors 1.0% | | | | |
| | 3,347 | | | McKesson Corp. | | | 496,226 | |
| | | | | | | | |
| | | | Home Improvement Retail 1.8% | | | | |
| | 5,900 | | | Home Depot, Inc. (The) | | | 866,297 | |
| | | | | | | | |
| | | | Hotels, Resorts & Cruise Lines 0.7% | | | | |
| | 21,000 | | | Extended Stay America, Inc. | | | 334,740 | |
| | | | | | | | |
| | | | Integrated Oil & Gas 3.5% | | | | |
| | 54,466 | | | Suncor Energy, Inc. (Canada) | | | 1,672,254 | |
| | | | | | | | |
| | | | Integrated Telecommunication Services 2.0% | | | | |
| | 19,921 | | | Verizon Communications, Inc. | | | 971,149 | |
| | | | | | | | |
| | | | Internet Software & Services 0.0% | | | | |
| | 100 | | | Reis, Inc. | | | 1,790 | |
| | | | | | | | |
| | | | | | | | |
| Shares | | | | | Value | |
| | | | | | | |
| | | | IT Consulting & Other Services 0.2% | | | | |
| | 1,700 | | | Cognizant Technology Solutions Corp., Class A* | | $ | 101,184 | |
| | | | | | | | |
| | | | Mortgage REITs 9.8% | | | | |
| | 32,500 | | | Altisource Residential Corp. | | | 495,625 | |
| | 132,290 | | | Arbor Realty Trust, Inc. | | | 1,108,590 | |
| | 25,100 | | | Blackstone Mortgage Trust, Inc., Class A | | | 777,096 | |
| | 56,900 | | | Great Ajax Corp. | | | 742,545 | |
| | 18,400 | | | New Residential Investment Corp. | | | 312,432 | |
| | 49,692 | | | Resource Capital Corp. | | | 485,491 | |
| | 36,100 | | | Starwood Property Trust, Inc. | | | 815,138 | |
| | | | | | | | |
| | | | | | | 4,736,917 | |
| | | | | | | | |
| | | | Movies & Entertainment 0.2% | | | | |
| | 1,000 | | | Walt Disney Co. (The) | | | 113,390 | |
| | | | | | | | |
| | | | Personal Products 5.6% | | | | |
| | 28,783 | | | Herbalife Ltd.* | | | 1,673,444 | |
| | 18,838 | | | Nu Skin Enterprises, Inc., Class A | | | 1,046,262 | |
| | | | | | | | |
| | | | | | | 2,719,706 | |
| | | | | | | | |
| | | | Railroads 3.0% | | | | |
| | 19,831 | | | Canadian National Railway Co. (Canada) | | | 1,463,782 | |
| | | | | | | | |
| | | | Real Estate Services 0.6% | | | | |
| | 2,583 | | | Jones Lang LaSalle, Inc. | | | 287,875 | |
| | | | | | | | |
| | | | Semiconductors 2.0% | | | | |
| | 13,200 | | | Microchip Technology, Inc. | | | 973,896 | |
| | | | | | | | |
| | | | Soft Drinks 2.0% | | | | |
| | 10,092 | | | Dr Pepper Snapple Group, Inc. | | | 988,209 | |
| | | | | | | | |
| | | | Specialty Stores 0.8% | | | | |
| | 5,500 | | | Tractor Supply Co. | | | 379,335 | |
| | | | | | | | |
| | | | Technology Hardware, Storage & Peripherals 0.0% | | | | |
| | 81 | | | Apple, Inc. | | | 11,636 | |
| | | | | | | | |
| | | | Trading Companies & Distributors 0.9% | | | | |
| | 1,859 | | | W.W. Grainger, Inc. | | | 432,701 | |
| | | | | | | | |
| | |
| | | | Total Common Stocks
(cost $28,571,601) | | | 35,507,263 | |
| | | | | | | | |
| | |
| | | | EXCHANGE-TRADED FUNDS 0.1% | | | | |
| | |
| | | | Asset Management & Custody Banks 0.1% | | | | |
| | 800 | | | PowerShares Dynamic Pharmaceuticals Portfolio | | | 47,008 | |
| | | | | | | | |
| | |
| | | | Total Exchange-Traded Funds
(cost $45,280) | | | 47,008 | |
| | | | | | | | |
| | |
| | | | LIMITED LIABILITY COMPANY MEMBERSHIP INTEREST 1.0% | | | | |
| | |
| | | | Asset Management & Custody Banks 1.0% | | | | |
| | 31,100 | | | Ellington Financial, LLC | | | 492,313 | |
| | | | | | | | |
| | |
| | | | Total Limited Liability Company Membership Interest
(cost $509,651) | | | 492,313 | |
| | | | | | | | |
77
| | |
| WASATCH STRATEGIC INCOME FUND (WASIX) | | MARCH 31, 2017 (UNAUDITED) |
|
|
|
Schedule of Investments (continued)
| | | | | | | | |
| Shares | | | | | Value | |
| | | | | | | |
| | | | LIMITED PARTNERSHIP INTEREST 8.3% | | | | |
| | |
| | | | Asset Management & Custody Banks 4.0% | | | | |
| | 32,720 | | | Blackstone Group L.P. | | $ | 971,784 | |
| | 51,956 | | | KKR & Co. L.P. | | | 947,158 | |
| | | | | | | | |
| | | | | | | 1,918,942 | |
| | | | | | | | |
| | |
| | | | Oil & Gas Storage & Transportation 4.3% | | | | |
| | 21,500 | | | Golar LNG Partners L.P. | | | 480,310 | |
| | 21,200 | | | Magellan Midstream Partners L.P. | | | 1,630,492 | |
| | | | | | | | |
| | | | | | | 2,110,802 | |
| | | | | | | | |
| | |
| | | | Total Limited Partnership Interest
(cost $3,877,604) | | | 4,029,744 | |
| | | | | | | | |
| | |
Principal
Amount | | | | | Value | |
| | | | | | | |
| | | | SHORT-TERM INVESTMENTS 17.0% | | | | |
| | |
| | | | Repurchase Agreement 17.0% | | | | |
| | $8,231,817 | | | Repurchase Agreement dated 3/31/17, 0.09% due 4/3/17 with State Street Bank and Trust Co. collateralized by $8,790,000 of United States Treasury Bonds 2.750% due 8/15/42; value: $8,397,017; repurchase proceeds: $8,231,879 (cost $8,231,817) | | $ | 8,231,817 | |
| | | | | | | | |
| | |
| | | | Total Short-Term Investments
(cost $8,231,817) | | | 8,231,817 | |
| | | | | | | | |
| | |
| | | | Total Investments
(cost $41,235,953) 99.5% | | | 48,308,145 | |
| | |
| | | | Other Assets less Liabilities 0.5% | | | 221,154 | |
| | | | | | | | |
| | |
| | | | NET ASSETS 100.0% | | $ | 48,529,299 | |
| | | | | | | | |
| |
| | | | *Non-income producing. ***Security was fair valued under procedures adopted by the Board of Trustees (see Note 13). †Security purchased in a private placement transaction or under Rule 144A of the Securities Act of 1933 (see Note 9). REIT Real Estate Investment Trust. See Notes to Financial Statements. | |
At March 31, 2017, Wasatch Strategic Income Fund’s investments, excluding short-term investments, were in the following countries:
| | | | |
| Country | | % | |
Canada | | | 7.8 | |
United States | | | 92.2 | |
| | | | |
TOTAL | | | 100.0 | % |
| | | | |
78
| | |
| WASATCH ULTRA GROWTH FUND (WAMCX) | | MARCH 31, 2017 (UNAUDITED) |
|
|
|
Schedule of Investments
| | | | | | | | |
| Shares | | | | | Value | |
| | | | | | | |
| | | | COMMON STOCKS 93.7% | | | | |
| | |
| | | | Air Freight & Logistics 1.1% | | | | |
| | 52,068 | | | Echo Global Logistics, Inc.* | | $ | 1,111,652 | |
| | | | | | | | |
| | | | Apparel Retail 0.9% | | | | |
| | 47,345 | | | Zumiez, Inc.* | | | 866,414 | |
| | | | | | | | |
| | | | Application Software 11.2% | | | | |
| | 117,609 | | | Exa Corp.* †† | | | 1,493,634 | |
| | 13,915 | | | Globant S.A.* (Argentina) | | | 506,506 | |
| | 35,643 | | | HubSpot, Inc.* | | | 2,158,184 | |
| | 56,605 | | | Paylocity Holding Corp.* | | | 2,186,651 | |
| | 15,870 | | | Ultimate Software Group, Inc. (The)* | | | 3,097,983 | |
| | 60,096 | | | Zendesk, Inc.* | | | 1,685,092 | |
| | | | | | | | |
| | | | | | | 11,128,050 | |
| | | | | | | | |
| | | | Biotechnology 12.5% | | | | |
| | 7,300 | | | Argos Therapeutics, Inc. PIPE* *** † | | | 3,299 | |
| | 10,950 | | | Argos Therapeutics, Inc. PIPE* *** † | | | 4,948 | |
| | 22,805 | | | Bellicum Pharmaceuticals, Inc.* | | | 281,414 | |
| | 121,517 | | | ChemoCentryx, Inc.* | | | 884,644 | |
| | 79,677 | | | Cytokinetics, Inc.* | | | 1,023,849 | |
| | 21,527 | | | Esperion Therapeutics, Inc.* | | | 760,118 | |
| | 116,220 | | | Exact Sciences Corp.* | | | 2,745,116 | |
| | 23,588 | | | Flexion Therapeutics, Inc.* | | | 634,753 | |
| | 70,295 | | | Genocea Biosciences, Inc.* | | | 428,097 | |
| | 97,158 | | | Inovio Pharmaceuticals, Inc.* | | | 643,186 | |
| | 13,895 | | | MacroGenics, Inc.* | | | 258,447 | |
| | 185,224 | | | MEI Pharma, Inc.* | | | 300,063 | |
| | 426,504 | | | Sangamo Therapeutics, Inc.* | | | 2,217,821 | |
| | 30,709 | | | Seattle Genetics, Inc.* | | | 1,930,368 | |
| | 19,388 | | | Selecta Biosciences, Inc.* | | | 277,636 | |
| | | | | | | | |
| | | | | | | 12,393,759 | |
| | | | | | | | |
| | | | Building Products 1.6% | | | | |
| | 22,260 | | | Trex Co., Inc.* | | | 1,544,621 | |
| | | | | | | | |
| | | | Communications Equipment 1.0% | | | | |
| | 9,105 | | | Palo Alto Networks, Inc.* | | | 1,025,951 | |
| | | | | | | | |
| | | | Department Stores 1.0% | | | | |
| | 82,194 | | | V-Mart Retail Ltd. (India) | | | 1,038,073 | |
| | | | | | | | |
| | | | Diversified Banks 2.9% | | | | |
| | 544,784 | | | City Union Bank Ltd. (India) | | | 1,271,037 | |
| | 69,622 | | | Yes Bank Ltd. (India) | | | 1,657,375 | |
| | | | | | | | |
| | | | | | | 2,928,412 | |
| | | | | | | | |
| | | | Electronic Manufacturing Services 1.6% | | | | |
| | 12,755 | | | IPG Photonics Corp.* | | | 1,539,529 | |
| | | | | | | | |
| | | | Environmental & Facilities Services 2.4% | | | | |
| | 26,771 | | | Waste Connections, Inc. (Canada) | | | 2,361,738 | |
| | | | | | | | |
| | | | Food Distributors 0.6% | | | | |
| | 39,930 | | | Chefs’ Warehouse, Inc. (The)* | | | 555,027 | |
| | | | | | | | |
| | | | General Merchandise Stores 1.1% | | | | |
| | 31,733 | | | Ollie’s Bargain Outlet Holdings, Inc.* | | | 1,063,056 | |
| | | | | | | | |
| | | | Health Care Equipment 9.4% | | | | |
| | 123,934 | | | AtriCure, Inc.* | | | 2,373,336 | |
| | 137,845 | | | ConforMIS, Inc.* | | | 719,551 | |
| | 93,385 | | | Entellus Medical, Inc.* | | | 1,288,713 | |
| | 143,663 | | | Novadaq Technologies, Inc.* (Canada) | | | 1,119,135 | |
| | 72,201 | | | Obalon Therapeutics, Inc.* | | | 771,829 | |
| | 143,037 | | | Oxford Immunotec Global plc* | | | 2,215,643 | |
| | 713,015 | | | Tandem Diabetes Care, Inc.* | | | 855,618 | |
| | | | | | | | |
| | | | | | | 9,343,825 | |
| | | | | | | | |
| | | | | | | | |
| Shares | | | | | Value | |
| | | | | | | |
| | | | Health Care Services 0.6% | | | | |
| | 37,343 | | | Dr. Lal PathLabs Ltd. (India) | | $ | 553,805 | |
| | | | | | | | |
| | | | Health Care Technology 1.2% | | | | |
| | 20,007 | | | Medidata Solutions, Inc.* | | | 1,154,204 | |
| | | | | | | | |
| | | | Homebuilding 3.5% | | | | |
| | 26,776 | | | Installed Building Products, Inc.* | | | 1,412,434 | |
| | 60,927 | | | LGI Homes, Inc.* | | | 2,066,035 | |
| | | | | | | | |
| | | | | | | 3,478,469 | |
| | | | | | | | |
| | | | Industrial Machinery 1.5% | | | | |
| | 29,142 | | | Proto Labs, Inc.* | | | 1,489,156 | |
| | | | | | | | |
| | | | Industrial REITs 1.1% | | | | |
| | 78,961 | | | Monmouth Real Estate Investment Corp. | | | 1,126,773 | |
| | | | | | | | |
| | | | Internet & Direct Marketing Retail 3.8% | | | | |
| | 70,574 | | | MakeMyTrip Ltd.* (India) | | | 2,441,860 | |
| | 33,889 | | | Wayfair, Inc., Class A* | | | 1,372,166 | |
| | | | | | | | |
| | | | | | | 3,814,026 | |
| | | | | | | | |
| | | | Internet Software & Services 6.3% | | | | |
| | 47,450 | | | Cornerstone OnDemand, Inc.* | | | 1,845,330 | |
| | 62,560 | | | Instructure, Inc.* | | | 1,463,904 | |
| | 49,913 | | | Reis, Inc. | | | 893,443 | |
| | 17,802 | | | Shutterstock, Inc.* | | | 736,113 | |
| | 22,213 | | | SPS Commerce, Inc.* | | | 1,299,238 | �� |
| | | | | | | | |
| | | | | | | 6,238,028 | |
| | | | | | | | |
| | | | IT Consulting & Other Services 1.3% | | | | |
| | 20,068 | | | Luxoft Holding, Inc.* (Switzerland) | | | 1,255,253 | |
| | | | | | | | |
| | | | Managed Health Care 1.6% | | | | |
| | 38,383 | | | HealthEquity, Inc.* | | | 1,629,358 | |
| | | | | | | | |
| | | | Oil & Gas Equipment & Services 0.3% | | | | |
| | 2,258 | | | Core Laboratories N.V. | | | 260,844 | |
| | | | | | | | |
| | | | Packaged Foods & Meats 2.3% | | | | |
| | 205,393 | | | Freshpet, Inc.* | | | 2,259,323 | |
| | | | | | | | |
| | | | Pharmaceuticals 1.6% | | | | |
| | 87,835 | | | Auris Medical Holding AG* (Switzerland) | | | 80,799 | |
| | 107,381 | | | Egalet Corp.* | | | 547,643 | |
| | 61,510 | | | Intra-Cellular Therapies, Inc.* | | | 999,538 | |
| | | | | | | | |
| | | | | | | 1,627,980 | |
| | | | | | | | |
| | | | Regional Banks 4.7% | | | | |
| | 23,704 | | | Bank of the Ozarks, Inc. | | | 1,232,845 | |
| | 24,264 | | | Customers Bancorp, Inc.* | | | 765,044 | |
| | 22,023 | | | Metro Bank plc* (United Kingdom) | | | 897,864 | |
| | 27,338 | | | Pinnacle Financial Partners, Inc. | | | 1,816,610 | |
| | | | | | | | |
| | | | | | | 4,712,363 | |
| | | | | | | | |
| | | | Restaurants 3.1% | | | | |
| | 30,891 | | | Chuy’s Holdings, Inc.* | | | 920,552 | |
| | 63,743 | | | Habit Restaurants, Inc. (The)* | | | 1,128,251 | |
| | 55,210 | | | Zoe’s Kitchen, Inc.* | | | 1,021,385 | |
| | | | | | | | |
| | | | | | | 3,070,188 | |
| | | | | | | | |
| | | | Semiconductor Equipment 2.4% | | | | |
| | 106,135 | | | PDF Solutions, Inc.* | | | 2,400,774 | |
| | | | | | | | |
| | | | Semiconductors 5.7% | | | | |
| | 20,929 | | | Cavium, Inc.* | | | 1,499,772 | |
| | 19,142 | | | Monolithic Power Systems, Inc. | | | 1,762,978 | |
| | 13,668 | | | NVE Corp. | | | 1,131,574 | |
| | 19,993 | | | Power Integrations, Inc. | | | 1,314,540 | |
| | | | | | | | |
| | | | 5,708,864 | |
| | | | | | | | |
79
| | |
| WASATCH ULTRA GROWTH FUND (WAMCX) | | MARCH 31, 2017 (UNAUDITED) |
|
|
|
Schedule of Investments (continued)
| | | | | | | | |
Shares | | | | | Value | |
| | | | | | | |
| | | | Specialty Chemicals 2.3% | | | | |
| | 19,176 | | | Balchem Corp. | | $ | 1,580,486 | |
| | 411,433 | | | EcoSynthetix, Inc.* (Canada) | | | 727,050 | |
| | | | | | | | |
| | | | 2,307,536 | |
| | | | | | | | |
| | | | Specialty Stores 1.0% | | | | |
| | 22,232 | | | Five Below, Inc.* | | | 962,868 | �� |
| | | | | | | | |
| | | | Systems Software 1.1% | | | | |
| | 28,570 | | | Qualys, Inc.* | | | 1,082,803 | |
| | | | | | | | |
| | | | Trucking 1.0% | | | | |
| | 31,152 | | | Knight Transportation, Inc. | | | 976,615 | |
| | | | | | | | |
| | |
| | | | Total Common Stocks
(cost $68,861,279) | | | 93,009,337 | |
| | | | | | | | |
| | |
| | | | PREFERRED STOCKS 1.5% | | | | |
| | |
| | | | Biotechnology 0.2% | | | | |
| | 169,492 | | | Nanosys, Inc., Series D Pfd.* *** † | | | 142,204 | |
| | 40,380 | | | Nanosys, Inc., Series E Pfd.* *** † | | | 47,907 | |
| | | | | | | | |
| | | | 190,111 | |
| | | | | | | | |
| | | | Health Care Technology 0.2% | | | | |
| | 253,064 | | | Data Sciences International, Inc.,
Series B Pfd.*** † | | | 270,778 | |
| | | | | | | | |
| | | | Oil & Gas Equipment & Services 1.1% | | | | |
| | 435,920 | | | Drilling Info Holdings, Inc.,
Series B Pfd.* *** † | | | 1,077,812 | |
| | | | | | | | |
| | |
| | | | Total Preferred Stocks
(cost $2,096,048) | | | 1,538,701 | |
| | | | | | | | |
| | |
| | | | LIMITED PARTNERSHIP INTEREST 3.3% | | | | |
| | |
| | | | Asset Management & Custody
Banks 3.3% | | | | |
| | | | Greenspring Global Partners II-B, L.P.* *** † | | | 2,111,926 | |
| | | | Greenspring Global Partners III-B,
L.P.* *** † | | | 1,143,997 | |
| | | | | | | | |
| | | | 3,255,923 | |
| | | | | | | | |
| | |
| | | | Total Limited Partnership Interest
(cost $3,490,040) | | | 3,255,923 | |
| | | | | | | | |
| | |
| | | | WARRANTS 0.0% | | | | |
| | |
| | | | Biotechnology 0.0% | | | | |
| | 8,212 | | | Argos Therapeutics, Inc., expiring
3/14/2021* *** † | | | 82 | |
| | 9,926 | | | Argos Therapeutics, Inc., expiring
8/2/2021* *** † | | | 1,191 | |
| | | | | | | | |
| | | | 1,273 | |
| | | | | | | | |
| | |
| | | | Total Warrants
(cost $1,026) | | | 1,273 | |
| | | | | | | | |
| | | | | | | | |
Principal
Amount | | | | | Value | |
| | | | | | | |
| | | | SHORT-TERM INVESTMENTS 1.6% | | | | |
| | |
| | | | Repurchase Agreement 1.6% | | | | |
| | $1,573,073 | | | Repurchase Agreement dated 3/31/17, 0.09% due 4/3/17 with State Street Bank and Trust Co. collateralized by $1,620,000 of United States Treasury Notes 2.125% due 3/31/24; value: $1,605,825; repurchase proceeds: $1,573,085†† (cost $1,573,073) | | $ | 1,573,073 | |
| | | | | | | | |
| | |
| | | | Total Short-Term Investments
(cost $1,573,073) | | | 1,573,073 | |
| | | | | | | | |
| | |
| | | | Total Investments
(cost $76,021,466) 100.1% | | | 99,378,307 | |
| | |
| | | | Liabilities less Other Assets (0.1%) | | | (102,046 | ) |
| | | | | | | | |
| | |
| | | | NET ASSETS 100.0% | | $ | 99,276,261 | |
| | | | | | | | |
| |
| | | | *Non-income producing. ***Security was fair valued under procedures adopted by the Board of Trustees (see Note 13). †Security purchased in a private placement transaction or under Rule 144A of the Securities Act of 1933 (see Note 9). ††All or a portion of this security has been designated as collateral for purchase commitments (see Note 10). PIPE Private Investment in a Public Equity. See Notes to Financial Statements. | |
At March 31, 2017, Wasatch Ultra Growth Fund’s investments, excluding short-term investments, were in the following countries:
| | | | |
| Country | | % | |
Argentina | | | 0.5 | |
Canada | | | 4.3 | |
India | | | 7.1 | |
Switzerland | | | 1.4 | |
United Kingdom | | | 0.9 | |
United States | | | 85.8 | |
| | | | |
TOTAL | | | 100.0 | % |
| | | | |
80
| | |
| WASATCH WORLD INNOVATORS FUND (WAGTX / WIGTX) | | MARCH 31, 2017 (UNAUDITED) |
|
|
|
Schedule of Investments
| | | | | | | | |
| Shares | | | | | Value | |
| | | | | | | |
| | | | COMMON STOCKS 86.7% | | | | |
| | |
| | | | Aerospace & Defense 1.1% | | | | |
| | 158,399 | | | Avon Rubber plc (United Kingdom) | | $ | 1,908,175 | |
| | | | | | | | |
| | | | Air Freight & Logistics 0.6% | | | | |
| | 5,476 | | | FedEx Corp. | | | 1,068,641 | |
| | | | | | | | |
| | | | Alternative Carriers 2.4% | | | | |
| | 690,416 | | | Gamma Communications plc
(United Kingdom) | | | 4,247,261 | |
| | | | | | | | |
| | | | Application Software 0.5% | | | | |
| | 4,100 | | | Splunk, Inc.* | | | 255,389 | |
| | 110,000 | | | Tracsis plc (United Kingdom) | | | 589,176 | |
| | | | | | | | |
| | | | | | | 844,565 | |
| | | | | | | | |
| | | | Asset Management & Custody Banks 0.3% | | | | |
| | 100 | | | BlackRock, Inc. | | | 38,351 | |
| | 357,500 | | | Tarpon Investimentos S.A. (Brazil) | | | 548,138 | |
| | | | | | | | |
| | | | | | | 586,489 | |
| | | | | | | | |
| | | | Auto Parts & Equipment 0.5% | | | | |
| | 11,812 | | | Brembo S.p.A. (Italy) | | | 873,882 | |
| | | | | | | | |
| | | | Automotive Retail 1.7% | | | | |
| | 119,420 | | | Mekonomen AB (Sweden) | | | 2,352,243 | |
| | 15,258 | | | Penske Automotive Group, Inc. | | | 714,227 | |
| | | | | | | | |
| | | | | | | 3,066,470 | |
| | | | | | | | |
| | | | Biotechnology 2.5% | | | | |
| | 63,132 | | | Abcam plc (United Kingdom) | | | 652,955 | |
| | 101,244 | | | Bioventix plc (United Kingdom) | | | 2,283,276 | |
| | 217,228 | | | MDxHealth* (Belgium) | | | 1,228,215 | |
| | 12,100 | | | Myriad Genetics, Inc.* | | | 232,320 | |
| | 100 | | | OPKO Health, Inc.* | | | 800 | |
| | | | | | | | |
| | | | | | | 4,397,566 | |
| | | | | | | | |
| | | | Broadcasting 1.0% | | | | |
| | 26,410 | | | CBS Corp., Class B | | | 1,831,798 | |
| | 100 | | | Discovery Communications, Inc., Class A* | | | 2,909 | |
| | | | | | | | |
| | | | | | | 1,834,707 | |
| | | | | | | | |
| | | | Cable & Satellite 2.1% | | | | |
| | 97,770 | | | Comcast Corp., Class A | | | 3,675,174 | |
| | | | | | | | |
| | | | Consumer Electronics 2.2% | | | | |
| | 85,300 | | | Sony Corp. (Japan) | | | 2,885,474 | |
| | 496,318 | | | Sprue Aegis plc (United Kingdom) | | | 1,066,450 | |
| | | | | | | | |
| | | | | | | 3,951,924 | |
| | | | | | | | |
| | | | Consumer Finance 2.0% | | | | |
| | 5,263 | | | Discover Financial Services | | | 359,937 | |
| | 17,985 | | | Encore Capital Group, Inc.* | | | 553,938 | |
| | 41,860 | | | PRA Group, Inc.* | | | 1,387,659 | |
| | 107,700 | | | SLM Corp.* | | | 1,303,170 | |
| | | | | | | | |
| | | | | | | 3,604,704 | |
| | | | | | | | |
| | | | Data Processing & Outsourced Services 4.8% | | | | |
| | 15,000 | | | MasterCard, Inc., Class A | | | 1,687,050 | |
| | 16,409 | | | Net 1 UEPS Technologies, Inc.* | | | 200,682 | |
| | 107,276 | | | PayPal Holdings, Inc.* | | | 4,615,014 | |
| | 18,275 | | | Visa, Inc., Class A | | | 1,624,099 | |
| | 8,442 | | | Wirecard AG (Germany) | | | 467,407 | |
| | | | | | | | |
| | | | | | | 8,594,252 | |
| | | | | | | | |
| | | | Distillers & Vintners 0.9% | | | | |
| | 74,597 | | | Corby Spirit and Wine Ltd. (Canada) | | | 1,241,367 | |
| | 24,486 | | | Corby Spirit and Wine Ltd., Class B (Canada) | | | 390,715 | |
| | | | | | | | |
| | | | | | | 1,632,082 | |
| | | | | | | | |
| | | | | | | | |
| Shares | | | | | Value | |
| | | | | | | |
| | | | Diversified Metals & Mining 0.2% | | | | |
| | 1,251,258 | | | Galaxy Resources Ltd.* (Australia) | | $ | 434,962 | |
| | | | | | | | |
| | | | Drug Retail 1.0% | | | | |
| | 20,400 | | | Walgreens Boots Alliance, Inc. | | | 1,694,220 | |
| | | | | | | | |
| | | | Education Services 1.2% | | | | |
| | 212,100 | | | Kroton Educacional S.A. (Brazil) | | | 899,728 | |
| | 10,900 | | | TAL Education Group ADR* (China) | | | 1,161,613 | |
| | | | | | | | |
| | | | | | | 2,061,341 | |
| | | | | | | | |
| | | | Electrical Components & Equipment 0.3% | | | | |
| | 423,789 | | | Enphase Energy, Inc.* | | | 580,591 | |
| | | | | | | | |
| | | | Electronic Equipment & Instruments 3.8% | | | | |
| | 15,019 | | | Barco N.V. (Belgium) | | | 1,504,491 | |
| | 695,907 | | | Catapult Group International Ltd.* (Australia) | | | 1,196,264 | |
| | 285,000 | | | Eroad Ltd.* (New Zealand) | | | 423,544 | |
| | 110,767 | | | Evertz Technologies Ltd. (Canada) | | | 1,339,349 | |
| | 21,157 | | | Kapsch TrafficCom AG (Austria) | | | 947,952 | |
| | 3,600 | | | KEYENCE Corp. (Japan) | | | 1,441,552 | |
| | | | | | | | |
| | | | | | | 6,853,152 | |
| | | | | | | | |
| | | | Fertilizers & Agricultural Chemicals 0.6% | | | | |
| | 8,900 | | | Monsanto Co. | | | 1,007,480 | |
| | | | | | | | |
| | | | Food Retail 5.0% | | | | |
| | 1,526,831 | | | Majestic Wine plc (United Kingdom) | | | 6,183,667 | |
| | 93,029 | | | Whole Foods Market, Inc. | | | 2,764,822 | |
| | | | | | | | |
| | | | | | | 8,948,489 | |
| | | | | | | | |
| | | | Health Care Distributors 0.3% | | | | |
| | 3,573 | | | McKesson Corp. | | | 529,733 | |
| | | | | | | | |
| | | | Health Care Equipment 5.6% | | | | |
| | 390,000 | | | Accuray, Inc.* | | | 1,852,500 | |
| | 21,542 | | | bioMérieux (France) | | | 3,645,936 | |
| | 60,760 | | | DiaSorin S.p.A. (Italy) | | | 4,103,027 | |
| | 7,738 | | | LivaNova plc* | | | 379,239 | |
| | | | | | | | |
| | | | | | | 9,980,702 | |
| | | | | | | | |
| | | | Health Care Services 0.7% | | | | |
| | 59,216 | | | BML, Inc. (Japan) | | | 1,303,677 | |
| | | | | | | | |
| | | | Health Care Supplies 4.4% | | | | |
| | 1,269,279 | | | Advanced Medical Solutions Group plc (United Kingdom) | | | 3,848,478 | |
| | 30,860 | | | Guerbet (France) | | | 2,616,926 | |
| | 568,467 | | | Tristel plc (United Kingdom) | | | 1,474,321 | |
| | | | | | | | |
| | | | | | | 7,939,725 | |
| | | | | | | | |
| | | | Health Care Technology 2.0% | | | | |
| | 66,186 | | | Computer Programs and Systems, Inc. | | | 1,853,208 | |
| | 11,112 | | | Nexus AG (Germany) | | | 239,516 | |
| | 33,870 | | | Software Service, Inc. (Japan) | | | 1,496,815 | |
| | | | | | | | |
| | | | | | | 3,589,539 | |
| | | | | | | | |
| | | | Home Entertainment Software 2.9% | | | | |
| | 29,000 | | | Electronic Arts, Inc.* | | | 2,596,080 | |
| | 44,579 | | | Take-Two Interactive Software, Inc.* | | | 2,642,197 | |
| | | | | | | | |
| | | | | | | 5,238,277 | |
| | | | | | | | |
| | | | Home Improvement Retail 0.8% | | | | |
| | 118,573 | | | Byggmax Group AB (Sweden) | | | 813,807 | |
| | 3,925 | | | Home Depot, Inc. (The) | | | 576,308 | |
| | | | | | | | |
| | | | | | | 1,390,115 | |
| | | | | | | | |
| | | | Household Appliances 0.6% | | | | |
| | 22,500 | | | SodaStream International Ltd.* (Israel) | | | 1,089,675 | |
| | | | | | | | |
81
| | |
| WASATCH WORLD INNOVATORS FUND (WAGTX / WIGTX) | | |
|
|
|
Schedule of Investments (continued)
| | | | | | | | |
| Shares | | | | | Value | |
| | | | | | | |
| | | | Hypermarkets & Super Centers 3.0% | | | | |
| | 32,075 | | | Costco Wholesale Corp. | | $ | 5,378,657 | |
| | | | | | | | |
| | | | Industrial Machinery 1.6% | | | | |
| | 151,789 | | | Porvair plc (United Kingdom) | | | 988,918 | |
| | 1,205,392 | | | Skellerup Holdings Ltd. (New Zealand) | | | 1,267,469 | |
| | 17,000 | | | SLM Solutions Group AG* (Germany) | | | 675,551 | |
| | | | | | | | |
| | | | | | | 2,931,938 | |
| | | | | | | | |
| | | | Internet & Direct Marketing Retail 10.3% | | | | |
| | 4,182 | | | Amazon.com, Inc.* | | | 3,707,510 | |
| | 1,157,840 | | | AO World plc* (United Kingdom) | | | 1,958,389 | |
| | 577,582 | | | ePrice S.p.A.* (Italy) | | | 2,566,941 | |
| | 18,590 | | | Netflix, Inc.* | | | 2,747,788 | |
| | 620,226 | | | Ocado Group plc* (United Kingdom) | | | 1,872,766 | |
| | 125,332 | | | Oisix, Inc.* (Japan) | | | 2,629,799 | |
| | 780 | | | Priceline Group, Inc. (The)* | | | 1,388,377 | |
| | 112,399 | | | Sportamore AB* (Sweden) | | | 1,442,516 | |
| | | | | | | | |
| | | | | | | 18,314,086 | |
| | | | | | | | |
| | | | Internet Software & Services 4.6% | | | | |
| | 19,894 | | | Alibaba Group Holding Ltd. ADR* (China) | | | 2,145,170 | |
| | 6,235 | | | Alphabet, Inc., Class A* | | | 5,286,033 | |
| | 100 | | | Facebook, Inc.* | | | 14,205 | |
| | 817,699 | | | Freelancer Ltd.* (Australia) | | | 571,621 | |
| | 4,102 | | | Tucows, Inc., Class A* | | | 209,407 | |
| | | | | | | | |
| | | | | | | 8,226,436 | |
| | | | | | | | |
| | | | IT Consulting & Other Services 1.9% | | | | |
| | 55,747 | | | Cognizant Technology Solutions Corp., Class A* | | | 3,318,061 | |
| | | | | | | | |
| | | | Leisure Products 2.4% | | | | |
| | 120,000 | | | Black Diamond, Inc.* | | | 654,000 | |
| | 100,000 | | | KMC Kuei Meng International, Inc. (Taiwan) | | | 491,061 | |
| | 1,581,224 | | | Photo-Me International plc
(United Kingdom) | | | 3,120,258 | |
| | 100 | | | Polaris Industries, Inc. | | | 8,380 | |
| | | | | | | | |
| | | | | | | 4,273,699 | |
| | | | | | | | |
| | | | Life Sciences Tools & Services 1.3% | | | | |
| | 1,007,724 | | | Horizon Discovery Group plc*
(United Kingdom) | | | 2,266,327 | |
| | | | | | | | |
| | | | Movies & Entertainment 0.1% | | | | |
| | 800 | | | Walt Disney Co. (The) | | | 90,712 | |
| | | | | | | | |
| | | | Multi-Utilities 0.8% | | | | |
| | 100,052 | | | Telecom Plus plc (United Kingdom) | | | 1,500,502 | |
| | | | | | | | |
| | | | Oil & Gas Refining & Marketing 0.4% | | | | |
| | 19,591 | | | World Fuel Services Corp. | | | 710,174 | |
| | | | | | | | |
| | | | Personal Products 1.0% | | | | |
| | 1,030 | | | Amorepacific Corp. (Korea) | | | 258,352 | |
| | 26,290 | | | Herbalife Ltd.* | | | 1,528,501 | |
| | | | | | | | |
| | | | 1,786,853 | |
| | | | | | | | |
| | | | Pharmaceuticals 0.5% | | | | |
| | 12,747 | | | Novo Nordisk A/S, Class B (Denmark) | | | 437,780 | |
| | 1,705 | | | Roche Holding AG (Switzerland) | | | 435,421 | |
| | 100 | | | Valeant Pharmaceuticals International, Inc.* (Canada) | | | 1,103 | |
| | | | | | | | |
| | | | | | | 874,304 | |
| | | | | | | | |
| | | | | | | | |
| Shares | | | | | Value | |
| | | | | | | |
| | | | Publishing 2.0% | | | | |
| | 244,523 | | | New York Times Co. (The) | | $ | 3,521,131 | |
| | | | | | | | |
| | | | Real Estate Services 0.3% | | | | |
| | 4,128 | | | Jones Lang LaSalle, Inc. | | | 460,066 | |
| | | | | | | | |
| | | | Regional Banks 0.0% | | | | |
| | 100 | | | Metro Bank plc* (United Kingdom) | | | 4,077 | |
| | | | | | | | |
| | | | Semiconductors 1.3% | | | | |
| | 8,961 | | | Microchip Technology, Inc. | | | 661,143 | |
| | 269,000 | | | Taiwan Semiconductor Manufacturing Co. Ltd. (Taiwan) | | | 1,675,570 | |
| | | | | | | | |
| | | | | | | 2,336,713 | |
| | | | | | | | |
| | | | Soft Drinks 0.2% | | | | |
| | 89,000 | | | Reed’s, Inc.* | | | 369,350 | |
| | | | | | | | |
| | | | Specialized Finance 0.1% | | | | |
| | 7,500 | | | Zenkoku Hosho Co. Ltd. (Japan) | | | 255,322 | |
| | | | | | | | |
| | | | Specialty Chemicals 0.1% | | | | |
| | 65,000 | | | Polygiene AB* (Sweden) | | | 98,291 | |
| | | | | | | | |
| | | | Specialty Stores 0.8% | | | | |
| | 7,468 | | | Fenix Outdoor International AG (Switzerland) | | | 724,243 | |
| | 62,016 | | | Indigo Books & Music, Inc.* (Canada) | | | 736,815 | |
| | | | | | | | |
| | | | | | | 1,461,058 | |
| | | | | | | | |
| | | | Systems Software 1.4% | | | | |
| | 13,092 | | | Check Point Software Technologies Ltd.* (Israel) | | | 1,344,025 | |
| | 42,404 | | | Traffic Systems SE (Germany) | | | 653,895 | |
| | 110,000 | | | WANdisco plc* (United Kingdom) | | | 583,663 | |
| | | | | | | | |
| | | | | | | 2,581,583 | |
| | | | | | | | |
| | | | Technology Hardware, Storage & Peripherals 0.6% | | | | |
| | 247,594 | | | Xaar plc (United Kingdom) | | | 1,101,248 | |
| | | | | | | | |
| | |
| | | | Total Common Stocks
(cost $132,290,521) | | | 154,788,158 | |
| | | | | | | | |
| | |
| | | | EXCHANGE-TRADED FUNDS 0.1% | | | | |
| | |
| | | | Asset Management & Custody Banks 0.1% | | | | |
| | 1,500 | | | PowerShares Dynamic Pharmaceuticals Portfolio | | | 88,140 | |
| | | | | | | | |
| | |
| | | | Total Exchange-Traded Funds
(cost $89,935) | | | 88,140 | |
| | | | | | | | |
| | |
| | | | LIMITED PARTNERSHIP INTEREST 0.1% | | | | |
| | |
| | | | Asset Management & Custody Banks 0.1% | | | | |
| | | | Greenspring Global Partners II-B,
L.P.* *** † | | | 234,661 | |
| | | | | | | | |
| | |
| | | | Total Limited Partnership Interest
(cost $258,841) | | | 234,661 | |
| | | | | | | | |
82
| | |
| | MARCH 31, 2017 (UNAUDITED) |
|
|
|
| | | | | | | | |
Principal
Amount | | | | | Value | |
| | | | | | | |
| | | | SHORT-TERM INVESTMENTS 13.2% | | | | |
| | |
| | | | Repurchase Agreement 13.2% | | | | |
| | $23,669,945 | | | Repurchase Agreement dated 3/31/17, 0.09% due 4/3/17 with State Street Bank and Trust Co. collateralized by $25,630,000 of United States Treasury Notes 1.625% due 5/15/26; value: $24,147,433; repurchase proceeds: $23,670,123†† (cost $23,669,945) | | $ | 23,669,945 | |
| | | | | | | | |
| | |
| | | | Total Short-Term Investments
(cost $23,669,945) | | | 23,669,945 | |
| | | | | | | | |
| | |
| | | | Total Investments
(cost $156,309,242) 100.1% | | | 178,780,904 | |
| | |
| | | | Liabilities less Other Assets (0.1%) | | | (127,361 | ) |
| | | | | | | | |
| | |
| | | | NET ASSETS 100.0% | | $ | 178,653,543 | |
| | | | | | | | |
| | |
| Contracts | | | | | Net Unrealized
Appreciation
(Depreciation) | |
| | | | | | | |
| | | | FORWARD FOREIGN CURRENCY EXCHANGE CONTRACTS
SHORT 0.2% | | | | |
| | 5,530,056 EUR | | | USD, State Street Bank and Trust Co., settlement date 4/28/17,
(cost $6,000,000; value: $5,905,809) | | $ | 94,191 | |
| | 12,303,654 GBP | | | USD, State Street Bank and Trust Co., settlement date 4/18/17,
(cost $15,000,000; value: $15,420,260) | | | (420,260 | ) |
| | | | | | | | |
| | |
| | | | Total Forward Foreign Currency Exchange Contracts Short
(cost $21,000,000; value: $21,326,069) | | | (326,069 | ) |
| | | | | | | | |
| |
| | | | *Non-income producing. ***Security was fair valued under procedures adopted by the Board of Trustees (see Note 13). †Security purchased in a private placement transaction or under Rule 144A of the Securities Act of 1933 (see Note 9). ††All or a portion of this security has been designated as collateral for forward foreign currency exchange contracts (see Note 4). ADR American Depositary Receipt. See Notes to Financial Statements. | |
At March 31, 2017, Wasatch World Innovators Fund’s investments, excluding short-term investments and forward foreign currency exchange contracts, were in the following countries:
| | | | |
| Country | | % | |
Australia | | | 1.4 | |
Austria | | | 0.6 | |
Belgium | | | 1.8 | |
Brazil | | | 0.9 | |
Canada | | | 2.4 | |
China | | | 2.1 | |
Denmark | | | 0.3 | |
France | | | 4.0 | |
Germany | | | 1.3 | |
Israel | | | 1.6 | |
Italy | | | 4.9 | |
Japan | | | 6.5 | |
Korea | | | 0.2 | |
New Zealand | | | 1.1 | |
Sweden | | | 3.0 | |
Switzerland | | | 0.7 | |
Taiwan | | | 1.4 | |
United Kingdom | | | 23.0 | |
United States | | | 42.8 | |
| | | | |
TOTAL | | | 100.0 | % |
| | | | |
83
| | |
| WASATCH-1ST SOURCE INCOME FUND (FMEQX) | | |
|
|
|
Schedule of Investments
| | | | | | | | |
Principal Amount | | | | | Value | |
| | | | | | | |
| | | | ASSET-BACKED SECURITIES 13.1% | | | | |
| | |
| | $1,000,000 | | | Avis Budget Rental Car Funding AESOP, LLC, 2.50%, 7/20/21, Series 2015-1A, Class A† | | $ | 999,330 | |
| | 500,000 | | | Avis Budget Rental Car Funding AESOP, LLC, 2.63%, 12/20/21, Series 2015-2A, Class A† | | | 500,507 | |
| | 1,500,000 | | | Citibank Credit Card Issuance Trust, 5.65%, 9/20/19, Series 2007-A8, Class A8 | | | 1,530,223 | |
| | 370,370 | | | Cronos Containers Program I Ltd.,
3.27%, 11/18/29, Series 2014-2A, Class A (Bermuda)† | | | 361,584 | |
| | 759,500 | | | DB Master Finance, LLC 2015-1, 3.262%,
2/20/45, Series 2015-1A, Class A2I† | | | 763,489 | |
| | 1,000,000 | | | DT Auto Owner Trust 2016-2,
2.92%, 5/15/20, Series 2016-2A, Class B | | | 1,005,797 | |
| | 675,000 | | | Element Rail Leasing II, LLC, 3.585%, 2/19/45, Series 2015-1A, Class A2† | | | 649,179 | |
| | 825,000 | | | Exeter Automobile Receivables Trust, 3.59%, 8/16/21, Series 2015-3A, Class B† | | | 833,535 | |
| | 1,000,000 | | | Scala Funding Co., LLC Series 2016-1, 3.91%, 2/15/21, Series 2016-1, Class A*** † | | | 1,000,625 | |
| | 1,500,000 | | | Synchrony Credit Card Master Note Trust, 2.22%, 1/15/22, Series 2012-2, Class A | | | 1,512,360 | |
| | 1,526,750 | | | Wendys Funding LLC, 3.371%, 6/15/45, Series 2015-1A, Class A2I† | | | 1,533,840 | |
| | 585,000 | | | World Financial Network Credit Card Master Trust, 1.76%, 5/17/21,
Series 2012-B, Class A | | | 585,740 | |
| | 1,610,000 | | | World Financial Network Credit Card Master Trust, 3.14%, 1/17/23,
Series 2012-A, Class A | | | 1,649,901 | |
| | | | | | | | |
| | |
| | | | Total Asset-Backed Securities
(cost $13,002,705) | | | 12,926,110 | |
| | | | | | | | |
| | |
| | | | COLLATERALIZED MORTGAGE OBLIGATIONS 11.5% | | | | |
| | |
| | 1,174,626 | | | Federal Home Loan Mortgage Corp., 2.685%, 1/1/43, Series 840522††† | | | 1,210,987 | |
| | 1,489,934 | | | Federal Home Loan Mortgage Corp., 3.50%, 2/1/32, Series G18637 | | | 1,557,041 | |
| | 153,194 | | | Federal Home Loan Mortgage Corp., 9.642%, 8/15/43, Series 4238, Class SY††† | | | 173,663 | |
| | 1,378,510 | | | Federal National Mortgage Assoc., 2.004%, 7/1/44, Series AL9645††† | | | 1,430,186 | |
| | 1,345,020 | | | Federal National Mortgage Assoc., 2.271%, 4/1/44, Series AL9804††† | | | 1,402,104 | |
| | 1,000,000 | | | Federal National Mortgage Assoc., 2.42%, 4/1/22, Series AM8263 | | | 999,553 | |
| | 747,109 | | | Federal National Mortgage Assoc., 3.00%, 1/1/28, Series AB7546 | | | 768,741 | |
| | 1,964,848 | | | Federal National Mortgage Assoc., 3.00%, 3/1/29, Series AL4936 | | | 2,019,989 | |
| | 1,139,345 | | | Federal National Mortgage Assoc., 3.50%, 6/1/32, Series AL2525 | | | 1,189,958 | |
| | 233,829 | | | Federal National Mortgage Assoc., 4.00%, 2/1/42, Series MA0988 | | | 243,379 | |
| | 61,863 | | | Government National Mortgage Assoc., 2.625%, 7/20/34, Series 80987††† | | | 63,438 | |
| | 120,218 | | | Government National Mortgage Assoc., 3.00%, 8/20/38, Series 2010-47, Class CG | | | 122,016 | |
| | 214,200 | | | Government National Mortgage Assoc., 4.50%, 3/20/39, Series 2009-14, Class AG | | | 229,306 | |
| | | | | | | | |
| | |
| | | | Total Collateralized Mortgage Obligations
(cost $11,440,474) | | | 11,410,361 | |
| | | | | | | | |
| | | | | | | | |
Principal Amount | | | | | Value | |
| | | | | | | |
| | | | COMMERCIAL MORTGAGE-BACKED SECURITIES 0.1% | | | | |
| | |
| | $ 42,434 | | | WaMu Commercial Mortgage Securities Trust, 4.321%, 3/23/45, Series 2007-SL3, Class AJ† ††† | | $ | 42,163 | |
| | | | | | | | |
| | |
| | | | Total Commercial Mortgage-Backed Securities
(cost $43,265) | | | 42,163 | |
| | | | | | | | |
| | |
| | | | CORPORATE BONDS 53.4% | | | | |
| | |
| | | | Air Freight & Logistics 0.6% | | | | |
| | 620,000 | | | United Parcel Service, Inc., 5.50%, 1/15/18 | | | 640,099 | |
| | | | | | | | |
| | | | Application Software 0.5% | | | | |
| | 500,000 | | | Microsoft Corp., 2.375%, 2/12/22 | | | 501,350 | |
| | | | | | | | |
| | | | Automobile Manufacturers 1.9% | | | | |
| | 1,250,000 | | | Ford Motor Credit Co., LLC, 5.75%, 2/1/21 | | | 1,376,841 | |
| | 500,000 | | | Toyota Motor Credit Corp., 2.00%, 10/24/18 MTN | | | 502,472 | |
| | | | | | | | |
| | | | 1,879,313 | |
| | | | | | | | |
| | | | Beverages-Non-alcoholic 1.3% | | | | |
| | 500,000 | | | Pepsi-Cola Metropolitan Bottling Co., Inc., 5.00%, 5/15/17 | | | 501,797 | |
| | 750,000 | | | PepsiCo, Inc., 5.00%, 6/1/18 | | | 781,621 | |
| | | | | | | | |
| | | | 1,283,418 | |
| | | | | | | | |
| | | | Computer Services 2.5% | | | | |
| | 2,000,000 | | | Hewlett Packard Enterprise Co., 3.60%, 10/15/20 | | | 2,056,758 | |
| | 400,000 | | | Hewlett Packard Enterprise Co., 4.40%, 10/15/22 | | | 418,901 | |
| | | | | | | | |
| | | | 2,475,659 | |
| | | | | | | | |
| | | | Construction Machinery & Heavy Trucks 1.5% | | | | |
| | 500,000 | | | Caterpillar Financial Services Corp., 5.85%, 9/1/17 MTN | | | 509,033 | |
| | 1,000,000 | | | John Deere Capital Corp., 2.25%, 4/17/19 | | | 1,009,668 | |
| | | | | | | | |
| | | | 1,518,701 | |
| | | | | | | | |
| | | | Consumer Finance 1.0% | | | | |
| | 1,000,000 | | | American Express Credit Corp., 2.25%, 8/15/19 MTN | | | 1,007,884 | |
| | | | | | | | |
| | | | Cosmetics & Toiletries 0.3% | | | | |
| | 262,452 | | | Procter & Gamble — ESOP, 9.36%, 1/1/21, Series A | | | 302,482 | |
| | | | | | | | |
| | | | Diversified Banks 6.7% | | | | |
| | 500,000 | | | Bank of America Corp., 5.875%, 1/5/21 | | | 558,306 | |
| | 1,000,000 | | | Fulton Financial Corp., 3.60%, 3/16/22 | | | 1,009,354 | |
| | 500,000 | | | HSBC Holdings plc, 5.10%, 4/5/21
(United Kingdom) | | | 542,844 | |
| | 1,250,000 | | | PNC Bank NA, 3.80%, 7/25/23 | | | 1,307,376 | |
| | 600,000 | | | RBC USA Holdco Corp., 5.25%, 9/15/20 | | | 655,034 | |
| | 750,000 | | | Sumitomo Mitsui Financial Group, Inc., 2.133%, 7/14/21††† (Japan) | | | 758,126 | |
| | 1,125,000 | | | US Bancorp, 3.00%, 3/15/22 MTN | | | 1,146,108 | |
| | 700,000 | | | Wachovia Corp., 5.75%, 2/1/18 MTN | | | 721,998 | |
| | | | | | | | |
| | | | 6,699,146 | |
| | | | | | | | |
84
| | |
| | MARCH 31, 2017 (UNAUDITED) |
|
|
|
| | | | | | | | |
Principal Amount | | | | | Value | |
| | | | | | | |
| | | | CORPORATE BONDS (continued) | | | | |
| | |
| | | | Diversified Financial Services 3.1% | | | | |
| | $ 1,200,000 | | | General Electric Co., 4.65%, 10/17/21 MTN | | $ | 1,317,200 | |
| | 1,000,000 | | | General Electric Co., 5.625%, 5/1/18 MTN | | | 1,045,541 | |
| | 750,000 | | | New York Life Global Funding, 2.15%, 6/18/19† | | | 753,679 | |
| | | | | | | | |
| | | | 3,116,420 | |
| | | | | | | | |
| | | | E-Commerce/Products 1.3% | | | | |
| | 1,250,000 | | | Alibaba Group Holding Ltd., 3.125%, 11/28/21 (Cayman Islands) | | | 1,262,451 | |
| | | | | | | | |
| | | | Electric Utilities 1.1% | | | | |
| | 1,000,000 | | | Integrys Holding, Inc., 4.17%, 11/1/20 | | | 1,055,665 | |
| | | | | | | | |
| | | | Electric-Integrated 0.7% | | | | |
| | 700,000 | | | PSEG Power, LLC, 4.15%, 9/15/21 | | | 734,338 | |
| | | | | | | | |
| | | | Enterprise Software & Services 1.1% | | | | |
| | 1,100,000 | | | CA, Inc., 3.60%, 8/15/22 | | | 1,116,173 | |
| | | | | | | | |
| | | | Health Care Services 0.6% | | | | |
| | 500,000 | | | Cigna Corp., 7.65%, 3/1/23 | | | 619,094 | |
| | | | | | | | |
| | | | Insurance 4.2% | | | | |
| | 1,000,000 | | | Allstate Corp. (The), 6.125%, 5/15/67††† | | | 977,500 | |
| | 750,000 | | | Aspen Insurance Holdings Ltd., 4.65%, 11/15/23 (Bermuda) | | | 799,532 | |
| | 560,000 | | | Jackson National Life Global Funding, 4.70%, 6/1/18† | | | 578,377 | |
| | 1,175,000 | | | Lincoln National Corp., 3.399%, 5/17/66††† | | | 1,028,242 | |
| | 750,000 | | | Progressive Corp. (The), 6.70%, 6/15/67††† | | | 740,625 | |
| | | | | | | | |
| | | | 4,124,276 | |
| | | | | | | | |
| | | | Integrated Telecommunication Services 1.4% | | | | |
| | 1,250,000 | | | AT&T, Inc., 5.20%, 3/15/20 | | | 1,350,395 | |
| | | | | | | | |
| | | | Investment Banking & Brokerage 7.2% | | | | |
| | 1,700,000 | | | Goldman Sachs Group, Inc. (The), 2.789%, 10/28/27 MTN††† | | | 1,749,633 | |
| | 1,250,000 | | | JPMorgan Chase & Co., 2.273%, 10/24/23††† | | | 1,278,662 | |
| | 1,250,000 | | | JPMorgan Chase & Co., 3.25%, 9/23/22 | | | 1,272,814 | |
| | 750,000 | | | JPMorgan Chase & Co., 7.90%, 4/30/18, Series 1††† | | | 777,188 | |
| | 1,000,000 | | | Morgan Stanley, 2.443%, 10/24/23 MTN††† | | | 1,021,221 | |
| | 1,000,000 | | | Morgan Stanley, 5.50%, 7/24/20 MTN | | | 1,091,710 | |
| | | | | | | | |
| | | | | | | 7,191,228 | |
| | | | | | | | |
| | | | Movies & Entertainment 0.4% | | | | |
| | 350,000 | | | Walt Disney Co. (The), 6.00%, 7/17/17, Series C MTN | | | 354,535 | |
| | | | | | | | |
| | | | Multimedia 0.9% | | | | |
| | 800,000 | | | NBCUniversal Media, LLC, 5.15%, 4/30/20 | | | 873,174 | |
| | | | | | | | |
| | | | Office Furnishings 0.6% | | | | |
| | 500,000 | | | Steelcase, Inc., 6.375%, 2/15/21 | | | 557,006 | |
| | | | | | | | |
| | | | Oil Companies-Integrated 2.8% | | | | |
| | 1,500,000 | | | BP Capital Markets plc, 3.245%, 5/6/22 (United Kingdom) | | | 1,532,227 | |
| | 659,000 | | | Occidental Petroleum Corp., 3.125%, 2/15/22 | | | 672,635 | |
| | 500,000 | | | Phillips 66, 4.30%, 4/1/22 | | | 530,100 | |
| | | | | | | | |
| | | | | | | 2,734,962 | |
| | | | | | | | |
| | | | | | | | |
Principal Amount | | | | | Value | |
| | | | | | | |
| | | | CORPORATE BONDS (continued) | | | | |
| | |
| | | | Pharmaceuticals 2.3% | | | | |
| | $ 745,000 | | | AstraZeneca plc, 5.90%, 9/15/17 (United Kingdom) | | $ | 759,501 | |
| | 725,000 | | | Pharmacia LLC, 6.50%, 12/1/18 | | | 782,753 | |
| | 575,000 | | | Pharmacia LLC, 6.75%, 12/15/27 | | | 740,446 | |
| | | | | | | | |
| | | | | | | 2,282,700 | |
| | | | | | | | |
| | | | Pipelines 0.9% | | | | |
| | 1,000,000 | | | Enterprise Products Operating, LLC, 7.00%, 6/1/67††† | | | 925,000 | |
| | | | | | | | |
| | | | Property & Casualty Insurance 2.0% | | | | |
| | 1,000,000 | | | CNA Financial Corp., 7.35%, 11/15/19 | | | 1,127,903 | |
| | 1,000,000 | | | XLIT Ltd., 6.50%, 5/1/17, Series E††† (Cayman Islands) | | | 840,000 | |
| | | | | | | | |
| | | | | | | 1,967,903 | |
| | | | | | | | |
| | | | Railroads 1.1% | | | | |
| | 1,000,000 | | | Union Pacific Corp., 5.70%, 8/15/18 | | | 1,054,330 | |
| | | | | | | | |
| | | | Residential REITs 1.3% | | | | |
| | 1,200,000 | | | AvalonBay Communities, Inc., 4.20%, 12/15/23 MTN | | | 1,269,606 | |
| | | | | | | | |
| | | | Semiconductor Equipment 0.8% | | | | |
| | 700,000 | | | Applied Materials, Inc., 4.30%, 6/15/21 | | | 752,501 | |
| | | | | | | | |
| | | | Specialty Chemicals 1.3% | | | | |
| | 1,150,000 | | | Lubrizol Corp., 8.875%, 2/1/19 | | | 1,294,552 | |
| | | | | | | | |
| | | | Super-Regional Banks-U.S. 1.3% | | | | |
| | 1,250,000 | | | Wells Fargo & Co., 4.125%, 8/15/23 | | | 1,309,329 | |
| | | | | | | | |
| | | | Television 0.7% | | | | |
| | 600,000 | | | CBS Corp., 7.875%, 9/1/23 | | | 730,357 | |
| | | | | | | | |
| | |
| | | | Total Corporate Bonds
(cost $52,750,755) | | | 52,984,047 | |
| | | | | | | | |
| | |
| | | | MUNICIPAL BONDS 5.2% | | | | |
| | |
| | 730,000 | | | City of Dublin, Ohio,, 5.00%, 12/1/22, Series B | | | 809,519 | |
| | 695,000 | | | City of Westminster, Colorado, 2.415%, 12/1/19, Series B | | | 707,266 | |
| | 500,000 | | | Columbus-Franklin County Finance Authority, 3.00%, 8/15/21, Series B | | | 510,460 | |
| | 250,000 | | | Iowa Student Loan Liquidity Corp., 2.229%, 12/1/20, Series A-1 | | | 247,345 | |
| | 500,000 | | | Iowa Student Loan Liquidity Corp., 2.86%, 12/1/22, Series A-2 | | | 487,740 | |
| | 325,000 | | | Richmond Joint Powers Financing Authority, 8.25%, 7/1/19, Class B | | | 344,549 | |
| | 500,000 | | | State of Louisiana, 5.00%, 7/15/26, Series C | | | 585,145 | |
| | 1,100,000 | | | State of New York Mortgage Agency, 3.653%, 4/1/23, Series 172 | | | 1,117,468 | |
| | 310,000 | | | Township of Robbinsville, 4.00%, 7/15/23, Series B | | | 331,570 | |
| | | | | | | | |
| | |
| | | | Total Municipal Bonds
(cost $5,102,231) | | | 5,141,062 | |
| | | | | | | | |
85
| | |
| WASATCH-1ST SOURCE INCOME FUND (FMEQX) | | MARCH 31, 2017 (UNAUDITED) |
|
|
|
Schedule of Investments (continued)
| | | | | | | | |
Principal Amount | | | | | Value | |
| | | | | | | |
| | | | U.S. GOVERNMENT AGENCY SECURITIES 4.4% | | | | |
| | |
| | $ 1,050,000 | | | Federal Farm Credit Banks, 2.60%, 10/6/22 | | $ | 1,067,885 | |
| | 1,000,000 | | | Federal Farm Credit Banks, 4.95%, 12/16/19 | | | 1,088,114 | |
| | 300,803 | | | New Valley Generation IV, 4.687%, 1/15/22 | | | 321,137 | |
| | 800,000 | | | Tennessee Valley Authority, 3.875%, 2/15/21 | | | 859,970 | |
| | 1,000,000 | | | Tennessee Valley Authority, 6.25%, 12/15/17, Series E | | | 1,035,983 | |
| | | | | | | | |
| | |
| | | | Total U.S. Government Agency Securities
(cost $4,362,463) | | | 4,373,089 | |
| | | | | | | | |
| | |
| | | | U.S. TREASURY INFLATION-PROTECTED BONDS 2.0% | | | | |
| | |
| | 886,878 | | | Treasury Inflation-Protected Security, 2.00%, 1/15/26 | | | 1,006,195 | |
| | 961,223 | | | Treasury Inflation-Protected Security, 2.125%, 1/15/19 | | | 1,011,149 | |
| | | | | | | | |
| | |
| | | | Total U.S. Treasury Inflation- Protected Bonds
(cost $2,017,228) | | | 2,017,344 | |
| | | | | | | | |
| | |
| | | | U.S. TREASURY NOTES 8.5% | | | | |
| | |
| | 1,100,000 | | | U.S. Treasury Note, 2.625%, 8/15/20 | | | 1,135,363 | |
| | 1,250,000 | | | U.S. Treasury Note, 2.750%, 12/31/17 | | | 1,265,820 | |
| | 3,000,000 | | | U.S. Treasury Note, 3.625%, 8/15/19 | | | 3,159,492 | |
| | 1,500,000 | | | U.S. Treasury Note, 3.625%, 2/15/20 | | | 1,590,703 | |
| | 1,200,000 | | | U.S. Treasury Note, 3.625%, 2/15/21 | | | 1,284,750 | |
| | | | | | | | |
| | |
| | | | Total U.S. Treasury Notes
(cost $8,463,843) | | | 8,436,128 | |
| | | | | | | | |
| | | | | | | | |
Principal Amount | | | | | Value | |
| | | | | | | |
| | | | SHORT-TERM INVESTMENTS 0.5% | | | | |
| | |
| | | | Repurchase Agreement 0.5% | | | | |
| | $ 517,824 | | | Repurchase Agreement dated 3/31/17,
0.09% due 4/3/17 with State Street Bank
and Trust Co. collateralized by $555,000
of United States Treasury Bonds 2.750%
due 8/15/42; value $530,187; repurchase
proceeds: $517,828 (cost $517,824) | | $ | 517,824 | |
| | | | | | | | |
| | |
| | | | Total Short-Term Investments
(cost $517,824) | | | 517,824 | |
| | | | | | | | |
| | |
| | | | Total Investments
(cost $97,700,788) 98.7% | | | 97,848,128 | |
| | |
| | | | Other Assets less Liabilities 1.3% | | | 1,305,432 | |
| | | | | | | | |
| | |
| | | | NET ASSETS 100.0% | | $ | 99,153,560 | |
| | | | | | | | |
| |
| | | | †Liquid security purchased in a private placement transaction or under Rule 144A of the Securities Act of 1933. ***Security was fair valued under procedures adopted by the Board of Trustees (see Note 13). †††Variable rate securities. ESOP Employee Stock Ownership Plan. MTN Medium Term Note. See Notes to Financial Statements. | |
| | | | |
At March 31, 2017, Wasatch-1st Source Income Fund’s investments, excluding short-term investments, were in the following countries: | |
| Country | | % | |
Bermuda | | | 1.2 | |
Cayman Islands | | | 2.2 | |
Japan | | | 0.8 | |
United Kingdom | | | 2.9 | |
United States | | | 92.9 | |
| | | | |
TOTAL | | | 100.0 | % |
| | | | |
86
| | |
| WASATCH-HOISINGTON U.S. TREASURY FUND (WHOSX) | | MARCH 31, 2017 (UNAUDITED) |
|
|
|
Schedule of Investments
| | | | | | | | |
Principal
Amount | | | | | Value | |
| | | | | | | |
| | | | U.S. GOVERNMENT OBLIGATIONS 99.5% | |
| | |
| | $118,500,000 | | | U.S. Treasury Bond, 2.25%, 8/15/46 | | $ | 100,289,868 | |
| | 53,500,000 | | | U.S. Treasury Bond, 2.50%, 2/15/45 | | | 48,072,693 | |
| | 1,000,000 | | | U.S. Treasury Bond, 2.875%, 5/15/43 | | | 973,633 | |
| | 600,000 | | | U.S. Treasury Bond, 2.875%, 8/15/45 | | | 581,883 | |
| | 8,000,000 | | | U.S. Treasury Bond, 3.125%, 8/15/44 | | | 8,155,624 | |
| | 14,100,000 | | | U.S. Treasury Bond, 3.75%, 11/15/43 | | | 16,044,263 | |
| | 39,000,000 | | | U.S. Treasury Strip, principal only, 8/15/40 | | | 19,125,639 | |
| | 81,000,000 | | | U.S. Treasury Strip, principal only, 5/15/44 | | | 34,910,757 | |
| | 175,700,000 | | | U.S. Treasury Strip, principal only, 8/15/45 | | | 72,579,035 | |
| | | | | | | | |
| | |
| | | | Total U.S. Government Obligations
(cost $332,139,472) | | | 300,733,395 | |
| | | | | | | | |
| | | | | | | | |
Principal
Amount | | | | | Value | |
| | | | | | | |
| | | | SHORT-TERM INVESTMENTS 1.2% | |
| | |
| | | | Repurchase Agreement 1.2% | | | | |
| | $ 3,493,284 | | | Repurchase Agreement dated 3/31/17, 0.09% due 4/3/17 with State Street Bank and Trust Co. collateralized by $3,595,000 of United States Treasury Notes 2.125% due 3/31/24; value $3,563,544; repurchase proceeds: $3,493,311 (cost $3,493,284) | | $ | 3,493,284 | |
| | | | | | | | |
| | |
| | | | Total Short-Term Investments
(cost $3,493,284) | | | 3,493,284 | |
| | | | | | | | |
| | |
| | | | Total Investments
(cost $335,632,756) 100.7% | | | 304,226,679 | |
| | |
| | | | Liabilities less Other Assets (0.7%) | | | (2,033,107 | ) |
| | | | | | | | |
| | |
| | | | NET ASSETS 100.0% | | $ | 302,193,572 | |
| | | | | | | | |
| |
| | | | See Notes to Financial Statements. | |
87
Statements of Assets and Liabilities
| | | | | | | | | | | | |
| | | CORE
GROWTH
FUND | | | EMERGING
INDIA
FUND | | | EMERGING MARKETS
SELECT FUND | |
| | | | | | | | | | | | |
Assets: | | | | | | | | | | | | |
Investments, at cost | | | | | | | | | | | | |
Unaffiliated issuers | | $ | 916,295,091 | | | $ | 82,031,947 | | | $ | 31,063,599 | |
Repurchase agreements | | | 84,063,501 | | | | 6,732,462 | | | | 823,425 | |
| | | | | | | | | | | | |
| | $ | 1,000,358,592 | | | $ | 88,764,409 | | | $ | 31,887,024 | |
| | | | | | | | | | | | |
Investments, at market value | | | | | | | | | | | | |
Unaffiliated issuers | | $ | 1,379,094,701 | | | $ | 118,429,530 | | | $ | 36,531,717 | |
Repurchase agreements | | | 84,063,501 | | | | 6,732,462 | | | | 823,425 | |
| | | | | | | | | | | | |
| | | 1,463,158,202 | | | | 125,161,992 | | | | 37,355,142 | |
Cash | | | — | | | | — | | | | — | |
Foreign currency on deposit (cost of $0, $27,467, $66, $231,100, $13,597,330, $0, $1,874,802 and $802,355, respectively) | | | — | | | | 27,466 | | | | 68 | |
Receivable for investment securities sold | | | — | | | | 704,716 | | | | — | |
Capital shares receivable | | | 7,751,612 | | | | 823,693 | | | | 1,487 | |
Interest and dividends receivable | | | 571,887 | | | | 6,437 | | | | 52,949 | |
Prepaid expenses and other assets | | | 64,721 | | | | 51,445 | | | | 34,222 | |
| | | | | | | | | | | | |
Total Assets | | | 1,471,546,422 | | | | 126,775,749 | | | | 37,443,868 | |
| | | | | | | | | | | | |
Liabilities: | | | | | | | | | | | | |
Payable for securities purchased | | | 1,871,774 | | | | 581,388 | | | | — | |
Capital shares payable | | | 8,475,412 | | | | 6,105 | | | | 2,003 | |
Payable to Advisor | | | 1,217,043 | | | | 116,803 | | | | 16,478 | |
Accrued fund administration fees | | | 21,808 | | | | 1,302 | | | | 179 | |
Accrued expenses and other liabilities | | | 249,868 | | | | 68,102 | | | | 34,533 | |
Foreign capital gains taxes payable | | | — | | | | 1,723,935 | | | | 320,516 | |
Line of credit payable | | | — | | | | — | | | | — | |
| | | | | | | | | | | | |
Total Liabilities | | | 11,835,905 | | | | 2,497,635 | | | | 373,709 | |
| | | | | | | | | | | | |
Net Assets | | $ | 1,459,710,517 | | | $ | 124,278,114 | | | $ | 37,070,159 | |
| | | | | | | | | | | | |
Net Assets Consist of: | | | | | | | | | | | | |
Capital stock | | $ | 239,518 | | | $ | 337,095 | | | $ | 39,992 | |
Paid-in-capital in excess of par | | | 970,693,022 | | | | 92,163,472 | | | | 41,334,790 | |
Undistributed net investment income (loss) | | | (9,830,247 | ) | | | (2,259,013 | ) | | | (268,047 | ) |
Undistributed net realized gain (loss) on investments and foreign currency translations | | | 35,807,657 | | | | (637,014 | ) | | | (9,185,919 | ) |
Net unrealized appreciation on investments and foreign currency translations | | | 462,800,567 | | | | 34,673,574 | | | | 5,149,343 | |
| | | | | | | | | | | | |
Net Assets | | $ | 1,459,710,517 | | | $ | 124,278,114 | | | $ | 37,070,159 | |
| | | | | | | | | | | | |
Net Assets | | | | | | | | | | | | |
Investor Class | | | 1,120,588,852 | | | | 103,413,238 | | | | 11,207,026 | |
Institutional Class | | | 339,121,665 | | | | 20,864,876 | | | | 25,863,133 | |
| | | |
Capital Stock Issued and Outstanding (Unlimited number of shares authorized,
$.01 par value) | | | | | | | | | | | | |
Investor Class | | | 18,407,547 | | | | 28,067,603 | | | | 1,218,500 | |
Institutional Class | | | 5,544,211 | | | | 5,641,936 | | | | 2,780,655 | |
| | | |
NET ASSET VALUE, REDEMPTION PRICEAND OFFERING PRICE PER SHARE | | | | | | | | | | | | |
Investor Class | | $ | 60.88 | | | $ | 3.68 | | | $ | 9.20 | |
| | | | | | | | | | | | |
Institutional Class | | $ | 61.17 | | | $ | 3.70 | | | $ | 9.30 | |
| | | | | | | | | | | | |
| 1 | The Nigerian naira was fair valued during the period (see Note 13). |
See Notes to Financial Statements.
88
| | |
| | MARCH 31, 2017 (UNAUDITED) |
|
|
|
| | | | | | | | | | | | | | | | | | |
EMERGING
MARKETS
SMALL CAP
FUND | | | FRONTIER
EMERGING
SMALL COUNTRIES
FUND | | | GLOBAL
OPPORTUNITIES
FUND | | | INTERNATIONAL
GROWTH
FUND | | | INTERNATIONAL
OPPORTUNITIES
FUND | |
| | | | | | | | | | | | | | | | | | |
| | | | | | | | | | | | | | | | | | |
| | | | | | | | | | | | | | | | | | |
| $ | 484,706,870 | | | $ | 193,998,807 | | | $ | 71,944,911 | | | $ | 1,012,699,509 | | | $ | 510,086,853 | |
| | 7,011,989 | | | | 6,939,547 | | | | — | | | | 8,797,037 | | | | 28,312,542 | |
| | | | | | | | | | | | | | | | | | |
| $ | 491,718,859 | | | $ | 200,938,354 | | | $ | 71,944,911 | | | $ | 1,021,496,546 | | | $ | 538,399,395 | |
| | | | | | | | | | | | | | | | | | |
| | | | | | | | | | | | | | | | | | |
| $ | 630,190,130 | | | $ | 258,757,913 | | | $ | 99,931,015 | | | $ | 1,318,979,713 | | | $ | 632,921,045 | |
| | 7,011,989 | | | | 6,939,547 | | | | — | | | | 8,797,037 | | | | 28,312,542 | |
| | | | | | | | | | | | | | | | | | |
| | 637,202,119 | | | | 265,697,460 | | | | 99,931,015 | | | | 1,327,776,750 | | | | 661,233,587 | |
| | — | | | | 7,706,628 | | | | — | | | | — | | | | — | |
| | | | |
| | 231,090 | | | | 12,093,937 | 1 | | | — | | | | 1,873,761 | | | | 582,933 | 1 |
| | 8,551,929 | | | | 48,589,470 | | | | 1,157,446 | | | | 21,960,548 | | | | 8,067,004 | |
| | 294,673 | | | | 410,765 | | | | 6,873 | | | | 443,845 | | | | 585,318 | |
| | 1,035,700 | | | | 944,097 | | | | 142,049 | | | | 2,398,804 | | | | 1,396,306 | |
| | 143,292 | | | | 104,670 | | | | 52,181 | | | | 94,533 | | | | 98,291 | |
| | | | | | | | | | | | | | | | | | |
| | 647,458,803 | | | | 335,547,027 | | | | 101,289,564 | | | | 1,354,548,241 | | | | 671,963,439 | |
| | | | | | | | | | | | | | | | | | |
| | | | | | | | | | | | | | | | | | |
| | 2,432,961 | | | | 10,805,466 | | | | — | | | | 8,966,625 | | | | 13,878,635 | |
| | 867,351 | | | | 1,019,422 | | | | 13,705 | | | | 536,659 | | | | 798,748 | |
| | 856,212 | | | | 428,670 | | | | 102,491 | | | | 1,390,010 | | | | 927,694 | |
| | 12,126 | | | | 6,569 | | | | 1,351 | | | | 22,241 | | | | 9,438 | |
| | 253,069 | | | | 679,706 | | | | 65,025 | | | | 286,781 | | | | 254,652 | |
| | 1,959,352 | | | | 3,854,365 | | | | 231,240 | | | | — | | | | 1,362,151 | |
| | — | | | | — | | | | 70,313 | | | | — | | | | — | |
| | | | | | | | | | | | | | | | | | |
| | 6,381,071 | | | | 16,794,198 | | | | 484,125 | | | | 11,202,316 | | | | 17,231,318 | |
| | | | | | | | | | | | | | | | | | |
| $ | 641,077,732 | | | $ | 318,752,829 | | | $ | 100,805,439 | | | $ | 1,343,345,925 | | | $ | 654,732,121 | |
| | | | | | | | | | | | | | | | | | |
| | | | | | | | | | | | | | | | | | |
| $ | 2,492,729 | | | $ | 1,277,550 | | | $ | 304,821 | | | $ | 460,700 | | | $ | 2,087,517 | |
| | 557,155,356 | | | | 454,117,771 | | | | 69,573,738 | | | | 1,043,978,437 | | | | 522,252,170 | |
| | (11,229,854 | ) | | | (7,475,780 | ) | | | (2,262,805 | ) | | | (6,546,573 | ) | | | (4,258,690 | ) |
| | (50,913,528 | ) | | | (191,117,763 | ) | | | 5,434,004 | | | | (796,891 | ) | | | 12,976,492 | |
| | 143,573,029 | | | | 61,951,051 | | | | 27,755,681 | | | | 306,250,252 | | | | 121,674,632 | |
| | | | | | | | | | | | | | | | | | |
| $ | 641,077,732 | | | $ | 318,752,829 | | | $ | 100,805,439 | | | $ | 1,343,345,925 | | | $ | 654,732,121 | |
| | | | | | | | | | | | | | | | | | |
| | | | | | | | | | | | | | | | | | |
| | 488,852,515 | | | | 269,635,343 | | | | 94,790,334 | | | | 814,709,944 | | | | 459,212,140 | |
| | 152,225,217 | | | | 49,117,486 | | | | 6,015,105 | | | | 528,635,981 | | | | 195,519,981 | |
| | | | |
| | | | | | | | | | | | | | | | | | |
| | 190,140,284 | | | | 108,131,066 | | | | 28,661,730 | | | | 27,947,807 | | | | 146,729,232 | |
| | 59,132,582 | | | | 19,623,905 | | | | 1,820,320 | | | | 18,122,197 | | | | 62,022,465 | |
| | | | |
| | | | | | | | | | | | | | | | | | |
| $ | 2.57 | | | $ | 2.49 | | | $ | 3.31 | | | $ | 29.15 | | | $ | 3.13 | |
| | | | | | | | | | | | | | | | | | |
| $ | 2.57 | | | $ | 2.50 | | | $ | 3.30 | | | $ | 29.17 | | | $ | 3.15 | |
| | | | | | | | | | | | | | | | | | |
89
Statements of Assets and Liabilities (continued)
| | | | | | | | | | | | |
| | | LARGE CAP
VALUE
FUND | | | LONG/SHORT
FUND | | | MICRO
CAP FUND | |
| | | | | | | | | | | | |
Assets: | | | | | | | | | | | | |
Investments, at cost | | | | | | | | | | | | |
Unaffiliated issuers | | $ | 146,994,166 | | | $ | 141,660,659 | | | $ | 169,462,556 | |
Affiliated issuers1 | | | — | | | | — | | | | — | |
Repurchase agreements | | | 1,373,298 | | | | 49,827,125 | | | | 2,819,067 | |
| | | | | | | | | | | | |
| | $ | 148,367,464 | | | $ | 191,487,784 | | | $ | 172,281,623 | |
| | | | | | | | | | | | |
Investments, at market value | | | | | | | | | | | | |
Unaffiliated issuers | | $ | 182,915,175 | | | $ | 153,280,533 | | | $ | 271,153,268 | |
Affiliated issuers1 | | | — | | | | — | | | | — | |
Repurchase agreements | | | 1,373,298 | | | | 49,827,125 | | | | 2,819,067 | |
| | | | | | | | | | | | |
| | | 184,288,473 | | | | 203,107,658 | | | | 273,972,335 | |
Cash | | | — | | | | — | | | | — | |
Foreign currency on deposit (cost of $0, $0, $0, $9,049, $3,058,161, $423,765, $17 and $0, respectively) | | | — | | | | — | | | | — | |
Receivable for investment securities sold | | | 4,728,554 | | | | 3,298,012 | | | | 53,819 | |
Receivable from broker for securities sold short | | | — | | | | 55,735,741 | | | | — | |
Capital shares receivable | | | 8,495 | | | | 164,909 | | | | 6,425 | |
Interest and dividends receivable | | | 256,507 | | | | 898,812 | | | | 77,566 | |
Prepaid expenses and other assets | | | 25,901 | | | | 30,228 | | | | 19,431 | |
| | | | | | | | | | | | |
Total Assets | | | 189,307,930 | | | | 263,235,360 | | | | 274,129,576 | |
| | | | | | | | | | | | |
Liabilities: | | | | | | | | | | | | |
Securities sold short, at value (proceeds of $0, $71,174,575, $0, $0, $0, $0, $0 and $0, respectively) | | | — | | | | 86,555,756 | | | | — | |
Payable for securities purchased | | | 889,963 | | | | 1,654,909 | | | | 836,987 | |
Capital shares payable | | | 188,449 | | | | 266,542 | | | | 56,963 | |
Dividends payable to shareholders | | | 6,649 | | | | — | | | | — | |
Payable to Advisor | | | 134,723 | | | | 170,109 | | | | 342,011 | |
Accrued fund administration fees | | | 3,410 | | | | 8,275 | | | | 3,976 | |
Accrued expenses and other liabilities | | | 124,089 | | | | 135,358 | | | | 55,603 | |
Dividends payable on securities sold short | | | — | | | | 52,411 | | | | — | |
| | | | | | | | | | | | |
Total Liabilities | | | 1,347,283 | | | | 88,843,360 | | | | 1,295,540 | |
| | | | | | | | | | | | |
Net Assets | | $ | 187,960,647 | | | $ | 174,392,000 | | | $ | 272,834,036 | |
| | | | | | | | | | | | |
Net Assets Consist of: | | | | | | | | | | | | |
Capital stock | | $ | 196,069 | | | $ | 133,991 | | | $ | 392,863 | |
Paid-in-capital in excess of par | | | 142,308,575 | | | | 332,792,654 | | | | 170,820,310 | |
Undistributed net investment income (loss) | | | 137,843 | | | | (573,021 | ) | | | (3,775,231 | ) |
Undistributed net realized gain (loss) on investments and foreign currency translations | | | 9,398,176 | | | | (154,200,317 | ) | | | 3,705,113 | |
Net unrealized appreciation (depreciation) on investments and foreign currency translations | | | 35,919,984 | | | | (3,761,307 | ) | | | 101,690,981 | |
| | | | | | | | | | | | |
Net Assets | | $ | 187,960,647 | | | $ | 174,392,000 | | | $ | 272,834,036 | |
| | | | | | | | | | | | |
Net Assets | | | | | | | | | | | | |
Investor Class | | | 185,314,999 | | | | 120,053,732 | | | | 272,834,036 | |
Institutional Class | | | 2,645,648 | | | | 54,338,268 | | | | — | |
| | | |
Capital Stock Issued and Outstanding (Unlimited number of shares authorized,
$.01 par value) | | | | | | | | | | | | |
Investor Class | | | 19,330,564 | | | | 9,238,506 | | | | 39,286,261 | |
Institutional Class | | | 276,344 | | | | 4,160,607 | | | | — | |
| | | |
NET ASSET VALUE, REDEMPTION PRICEAND OFFERING PRICE PER SHARE | | | | | | | | | | | | |
Investor Class | | $ | 9.59 | | | $ | 12.99 | | | $ | 6.94 | |
| | | | | | | | | | | | |
Institutional Class | | $ | 9.57 | | | $ | 13.06 | | | $ | — | |
| | | | | | | | | | | | |
| 1 | See Note 8 for information on affiliated issuers. |
See Notes to Financial Statements.
90
| | |
| | MARCH 31, 2017 (UNAUDITED) |
|
|
|
| | | | | | | | | | | | | | | | | | |
MICRO CAP
VALUE
FUND | | | SMALL CAP
GROWTH
FUND | | | SMALL CAP
VALUE
FUND | | | STRATEGIC
INCOME
FUND | | | ULTRA
GROWTH
FUND | |
| | | | | | | | | | | | | | | | | | |
| | | | | | | | | | | | | | | | | | |
| | | | | | | | | | | | | | | | | | |
| $ | 131,032,027 | | | $ | 1,093,457,857 | | | $ | 257,717,431 | | | $ | 33,004,136 | | | $ | 74,448,393 | |
| | — | | | | 56,503,081 | | | | — | | | | — | | | | — | |
| | 5,707,476 | | | | 36,988,153 | | | | 10,563,263 | | | | 8,231,817 | | | | 1,573,073 | |
| | | | | | | | | | | | | | | | | | |
| $ | 136,739,503 | | | $ | 1,186,949,091 | | | $ | 268,280,694 | | | $ | 41,235,953 | | | $ | 76,021,466 | |
| | | | | | | | | | | | | | | | | | |
| | | | | | | | | | | | | | | | | | |
| $ | 182,742,383 | | | $ | 1,645,828,259 | | | $ | 335,052,422 | | | $ | 40,076,328 | | | $ | 97,805,234 | |
| | — | | | | 44,048,692 | | | | — | | | | — | | | | — | |
| | 5,707,476 | | | | 36,988,153 | | | | 10,563,263 | | | | 8,231,817 | | | | 1,573,073 | |
| | | | | | | | | | | | | | | | | | |
| | 188,449,859 | | | | 1,726,865,104 | | | | 345,615,685 | | | | 48,308,145 | | | | 99,378,307 | |
| | — | | | | — | | | | — | | | | 5,337 | | | | — | |
|
9,039 |
| | | 3,058,161 | | | | 423,765 | | | | 21 | | | | — | |
| | 450,140 | | | | 2,501,472 | | | | 2,018,920 | | | | 252,999 | | | | 38,824 | |
| | — | | | | — | | | | — | | | | — | | | | — | |
| | 66,183 | | | | 531,326 | | | | 412,081 | | | | 3,398 | | | | 1,748 | |
| | 100,354 | | | | 1,881,988 | | | | 404,834 | | | | 134,631 | | | | 3,832 | |
| | 156,725 | | | | 69,806 | | | | 37,837 | | | | 16,149 | | | | 18,863 | |
| | | | | | | | | | | | | | | | | | |
| | 189,232,300 | | | | 1,734,907,857 | | | | 348,913,122 | | | | 48,720,680 | | | | 99,441,574 | |
| | | | | | | | | | | | | | | | | | |
| | | | | | | | | | | | | | | | | | |
|
— |
| | | — | | | | — | | | | — | | | | — | |
| | 529,515 | | | | 2,001,227 | | | | 7,275,815 | | | | 96,115 | | | | — | |
| | 114,890 | | | | 2,010,672 | | | | 71,193 | | | | 39,724 | | | | 33,640 | |
| | — | | | | — | | | | — | | | | 355 | | | | — | |
| | 238,743 | | | | 1,444,008 | | | | 282,836 | | | | 23,101 | | | | 82,857 | |
| | 2,533 | | | | 28,502 | | | | 4,833 | | | | 334 | | | | 1,111 | |
| | 30,596 | | | | 732,786 | | | | 77,070 | | | | 31,752 | | | | 47,705 | |
| | — | | | | — | | | | — | | | | — | | | | — | |
| | | | | | | | | | | | | | | | | | |
| | 916,277 | | | | 6,217,195 | | | | 7,711,747 | | | | 191,381 | | | | 165,313 | |
| | | | | | | | | | | | | | | | | | |
| $ | 188,316,023 | | | $ | 1,728,690,662 | | | $ | 341,201,375 | | | $ | 48,529,299 | | | $ | 99,276,261 | |
| | | | | | | | | | | | | | | | | | |
| | | | | | | | | | | | | | | | | | |
| $ | 615,022 | | | $ | 412,142 | | | $ | 469,925 | | | $ | 43,362 | | | $ | 52,854 | |
| | 132,765,056 | | | | 1,127,138,973 | | | | 266,117,059 | | | | 49,406,074 | | | | 73,325,573 | |
| | (1,349,706 | ) | | | (16,835,766 | ) | | | 490,865 | | | | 51,827 | | | | (2,220,052 | ) |
| | 4,575,058 | | | | 80,184,245 | | | | (3,211,414 | ) | | | (8,044,196 | ) | | | 6,670,748 | |
|
51,710,593 |
| | | 537,791,068 | | | | 77,334,940 | | | | 7,072,232 | | | | 21,447,138 | |
| | | | | | | | | | | | | | | | | | |
| $ | 188,316,023 | | | $ | 1,728,690,662 | | | $ | 341,201,375 | | | $ | 48,529,299 | | | $ | 99,276,261 | |
| | | | | | | | | | | | | | | | | | |
| | | | | | | | | | | | | | | | | | |
| | 188,316,023 | | | | 1,283,699,924 | | | | 301,727,802 | | | | 48,529,299 | | | | 99,276,261 | |
| | — | | | | 444,990,738 | | | | 39,473,573 | | | | — | | | | — | |
| | | | |
| | | | | | | | | | | | | | | | | | |
| | 61,502,193 | | | | 30,627,586 | | | | 41,578,557 | | | | 4,336,204 | | | | 5,285,406 | |
| | — | | | | 10,586,644 | | | | 5,413,958 | | | | — | | | | — | |
| | | | |
| | | | | | | | | | | | | | | | | | |
| $ | 3.06 | | | $ | 41.91 | | | $ | 7.26 | | | $ | 11.19 | | | $ | 18.78 | |
| | | | | | | | | | | | | | | | | | |
| $ | — | | | $ | 42.03 | | | $ | 7.29 | | | $ | — | | | $ | — | |
| | | | | | | | | | | | | | | | | | |
91
| | |
| WASATCH FUNDS | | MARCH 31, 2017 (UNAUDITED) |
|
|
|
Statements of Assets and Liabilities (continued)
| | | | | | | | | | | | |
| | | WORLD
INNOVATORS
FUND | | | INCOME
FUND | | | U.S.
TREASURY
FUND | |
| | | | | | | | | | | | |
Assets: | | | | | | | | | | | | |
Investments, at cost | | | | | | | | | | | | |
Unaffiliated issuers | | $ | 132,639,297 | | | $ | 97,182,964 | | | $ | 332,139,472 | |
Repurchase agreements | | | 23,669,945 | | | | 517,824 | | | | 3,493,284 | |
| | | | | | | | | | | | |
| | $ | 156,309,242 | | | $ | 97,700,788 | | | $ | 335,632,756 | |
| | | | | | | | | | | | |
Investments, at market value | | | | | | | | | | | | |
Unaffiliated issuers | | $ | 155,110,959 | | | $ | 97,330,304 | | | $ | 300,733,395 | |
Repurchase agreements | | | 23,669,945 | | | | 517,824 | | | | 3,493,284 | |
| | | | | | | | | | | | |
| | | 178,780,904 | | | | 97,848,128 | | | | 304,226,679 | |
Cash | | | 18,323 | | | | — | | | | — | |
Foreign currency on deposit (cost of $41,450, $0 and $0, respectively) | | | 41,390 | | | | — | | | | — | |
Receivable for investment securities sold | | | 1,234,835 | | | | 1,300,903 | | | | — | |
Capital shares receivable | | | 34,534 | | | | 141,702 | | | | 209,324 | |
Interest and dividends receivable | | | 152,447 | | | | 804,183 | | | | 741,922 | |
Prepaid expenses and other assets | | | 43,914 | | | | 15,235 | | | | 37,789 | |
Unrealized appreciation on foreign currency contracts | | | 94,191 | | | | — | | | | — | |
| | | | | | | | | | | | |
Total Assets | | | 180,400,538 | | | | 100,110,151 | | | | 305,215,714 | |
| | | | | | | | | | | | |
Liabilities: | | | | | | | | | | | | |
Payable for securities purchased | | | 911,500 | | | | 712,047 | | | | — | |
Capital shares payable | | | 112,940 | | | | 110,443 | | | | 2,710,407 | |
Dividends payable to shareholders | | | — | | | | 51,620 | | | | 82,848 | |
Payable to Advisor | | | 223,243 | | | | 46,431 | | | | 120,288 | |
Accrued fund administration fees | | | 2,707 | | | | 1,156 | | | | 3,702 | |
Accrued expenses and other liabilities | | | 76,345 | | | | 34,565 | | | | 104,897 | |
Other payables | | | — | | | | 329 | | | | — | |
Unrealized depreciation on foreign currency contracts | | | 420,260 | | | | — | | | | — | |
| | | | | | | | | | | | |
Total Liabilities | | | 1,746,995 | | | | 956,591 | | | | 3,022,142 | |
| | | | | | | | | | | | |
Net Assets | | $ | 178,653,543 | | | $ | 99,153,560 | | | $ | 302,193,572 | |
| | | | | | | | | | | | |
Net Assets Consist of: | | | | | | | | | | | | |
Capital stock | | $ | 90,483 | | | $ | 98,426 | | | $ | 193,325 | |
Paid-in-capital in excess of par | | | 152,561,120 | | | | 99,151,439 | | | | 348,606,773 | |
Undistributed net investment income (loss) | | | (1,115,320 | ) | | | 12,891 | | | | 16,192 | |
Undistributed net realized gain (loss) on investments and foreign currency translations | | | 5,184,769 | | | | (256,536 | ) | | | (15,216,641 | ) |
Net unrealized appreciation (depreciation) on investments and foreign
currency translations | | | 21,932,491 | | | | 147,340 | | | | (31,406,077 | ) |
| | | | | | | | | | | | |
Net Assets | | $ | 178,653,543 | | | $ | 99,153,560 | | | $ | 302,193,572 | |
| | | | | | | | | | | | |
Net Assets | | | | | | | | | | | | |
Investor Class | | | 172,381,983 | | | | 99,153,560 | | | | 302,193,572 | |
Institutional Class | | | 6,271,560 | | | | — | | | | — | |
| | | |
Capital Stock Issued and Outstanding (Unlimited number of shares authorized,
$.01 par value) | | | | | | | | | | | | |
Investor Class | | | 8,731,741 | | | | 9,842,633 | | | | 19,332,468 | |
Institutional Class | | | 316,532 | | | | — | | | | — | |
| | | |
NET ASSET VALUE, REDEMPTION PRICEAND OFFERING PRICE PER SHARE | | | | | | | | | | | | |
Investor Class | | $ | 19.74 | | | $ | 10.07 | | | $ | 15.63 | |
| | | | | | | | | | | | |
Institutional Class | | $ | 19.81 | | | $ | — | | | $ | — | |
| | | | | | | | | | | | |
See Notes to Financial Statements.
92
(This page intentionally left blank.)
93
Statements of Operations
| | | | | | | | | | | | |
| | | CORE
GROWTH
FUND | | | EMERGING
INDIA
FUND | | | EMERGING MARKETS
SELECT FUND | |
| | | | | | | | | | | | |
Investment Income: | | | | | | | | | | | | |
Interest | | $ | 14,785 | | | $ | 2,737 | 1 | | $ | 71 | |
Dividends2 | | | | | | | | | | | | |
Unaffiliated issuers | | | 3,988,759 | | | | 148,934 | | | | 117,948 | |
| | | | | | | | | | | | |
Total investment income | | | 4,003,544 | | | | 151,671 | | | | 118,019 | |
| | | | | | | | | | | | |
Expenses: | | | | | | | | | | | | |
Investment advisory fees | | | 6,917,635 | | | | 555,085 | | | | 174,375 | |
Shareholder servicing fees — Investor Class | | | 705,884 | | | | 66,283 | | | | 19,378 | |
Shareholder servicing fees — Institutional Class | | | 3,299 | | | | 914 | | | | 1,827 | |
Fund administration fees | | | 117,208 | | | | 7,526 | | | | 2,950 | |
Fund accounting fees | | | 71,672 | | | | 15,751 | | | | 10,539 | |
Reports to shareholders — Investor Class | | | 54,544 | | | | 7,874 | | | | 2,447 | |
Reports to shareholders — Institutional Class | | | 6,484 | | | | 953 | | | | 1,756 | |
Custody fees | | | 44,667 | | | | 48,775 | | | | 27,891 | |
Federal and state registration fees — Investor Class | | | 28,019 | | | | 11,764 | | | | 6,833 | |
Federal and state registration fees — Institutional Class | | | 12,510 | | | | 9,419 | | | | 7,794 | |
Legal fees | | | 40,949 | | | | 2,491 | | | | 1,455 | |
Trustees’ fees | | | 96,438 | | | | 5,946 | | | | 2,652 | |
Interest | | | 21,029 | | | | 1,474 | | | | 2,901 | |
Audit fees | | | 16,064 | | | | 15,825 | | | | 16,001 | |
Other expenses | | | 32,617 | | | | 36,831 | | | | 11,728 | |
| | | | | | | | | | | | |
Total expenses before reimbursement | | | 8,169,019 | | | | 786,911 | | | | 290,527 | |
Reimbursement of expenses by Advisor | | | (42,060 | ) | | | (25,767 | ) | | | (62,338 | ) |
| | | | | | | | | | | | |
Net Expenses | | | 8,126,959 | | | | 761,144 | | | | 228,189 | |
| | | | | | | | | | | | |
Net Investment Loss | | | (4,123,415 | ) | | | (609,473 | ) | | | (110,170 | ) |
| | | | | | | | | | | | |
Realized and Unrealized Gain (Loss): | | | | | | | | | | | | |
Net realized gain (loss) on investments and foreign currency translations | | | | | | | | | | | | |
Unaffiliated issuers | | | 36,022,918 | | | | 210,763 | | | | (449,435 | ) |
Realized foreign capital gains taxes | | | — | | | | — | | | | — | |
Change in unrealized appreciation (depreciation) on
investments and foreign currency translations | | | 64,209,745 | | | | 11,735,739 | | | | 441,556 | |
Change in deferred foreign capital gains taxes | | | — | | | | (567,230 | ) | | | (97,541 | ) |
| | | | | | | | | | | | |
Net gain (loss) on investments | | | 100,232,663 | | | | 11,379,272 | | | | (105,420 | ) |
| | | | | | | | | | | | |
Net Increase (Decrease) in Net Assets Resulting from Operations | | $ | 96,109,248 | | | $ | 10,769,799 | | | $ | (215,590 | ) |
| | | | | | | | | | | | |
| 1 | Net of $35, $2, $1,298 and $1 in foreign withholding taxes, respectively. |
| 2 | Net of $23,472, $0, $14,556, $43,903, $391,929, $10,753, $528,819 and $342,073 in foreign withholding taxes, respectively. |
See Notes to Financial Statements.
94
| | |
| | MARCH 31, 2017 (UNAUDITED) |
|
|
|
| | | | | | | | | | | | | | | | | | |
EMERGING
MARKETS
SMALL CAP
FUND | | | FRONTIER
EMERGING
SMALL COUNTRIES
FUND | | | GLOBAL
OPPORTUNITIES
FUND | | | INTERNATIONAL
GROWTH
FUND | | | INTERNATIONAL
OPPORTUNITIES
FUND | |
| | | | | | | | | | | | | | | | | | |
| | | | | | | | | | | | | | | | | | |
| $ | 921 | 1 | | $ | 5,909 | 1 | | $ | 69 | | | $ | 838 | 1 | | $ | — | |
| | | | | | | | | | | | | | | | | | |
| | 2,702,083 | | | | 3,008,633 | | | | 281,121 | | | | 5,013,889 | | | | 2,891,599 | |
| | | | | | | | | | | | | | | | | | |
| | 2,703,004 | | | | 3,014,542 | | | | 281,190 | | | | 5,014,727 | | | | 2,891,599 | |
| | | | | | | | | | | | | | | | | | |
| | | | | | | | | | | | | | | | | | | |
| | 5,786,846 | | | | 3,566,335 | | | | 733,162 | | | | 8,180,371 | | | | 5,553,760 | |
| | 450,721 | | | | 659,907 | | | | 85,100 | | | | 502,953 | | | | 751,309 | |
| | 2,223 | | | | 1,346 | | | | 921 | | | | 1,273 | | | | 70,751 | |
| | 59,278 | | | | 34,376 | | | | 9,895 | | | | 110,720 | | | | 53,710 | |
| | 46,239 | | | | 32,158 | | | | 16,977 | | | | 73,411 | | | | 45,044 | |
| | 37,008 | | | | 74,404 | | | | 8,231 | | | | 54,180 | | | | 64,782 | |
| | 1,987 | | | | 2,977 | | | | 886 | | | | 33,563 | | | | 17,108 | |
| | 364,479 | | | | 708,162 | | | | 29,421 | | | | 218,480 | | | | 267,681 | |
| | 17,842 | | | | 30,256 | | | | 9,605 | | | | 20,570 | | | | 19,504 | |
| | 11,271 | | | | 15,865 | | | | 9,402 | | | | 16,560 | | | | 13,293 | |
| | 23,839 | | | | 16,019 | | | | 3,893 | | | | 45,859 | | | | 20,667 | |
| | 56,350 | | | | 37,313 | | | | 10,235 | | | | 99,304 | | | | 47,268 | |
| | 26,021 | | | | 60,965 | | | | 14,604 | | | | 21,883 | | | | 24,236 | |
| | 15,913 | | | | 16,540 | | | | 15,913 | | | | 15,961 | | | | 15,961 | |
| | 59,451 | | | | 49,728 | | | | 19,302 | | | | 40,976 | | | | 33,355 | |
| | | | | | | | | | | | | | | | | | |
| | 6,959,468 | | | | 5,306,351 | | | | 967,547 | | | | 9,436,064 | | | | 6,998,429 | |
| | (203,990 | ) | | | (742,838 | ) | | | (15,406 | ) | | | (39,664 | ) | | | (85,408 | ) |
| | | | | | | | | | | | | | | | | | |
| | 6,755,478 | | | | 4,563,513 | | | | 952,141 | | | | 9,396,400 | | | | 6,913,021 | |
| | | | | | | | | | | | | | | | | | |
| | (4,052,474 | ) | | | (1,548,971 | ) | | | (670,951 | ) | | | (4,381,673 | ) | | | (4,021,422 | ) |
| | | | | | | | | | | | | | | | | | |
| | | | | | | | | | | | | | | | | | |
| | | | | | | | | | | | | | | | | | |
| | 34,044,255 | | | | (40,973,648 | ) | | | 6,137,415 | | | | 7,692,318 | | | | 19,213,602 | |
| | (2,932 | ) | | | (1,514,617 | ) | | | — | | | | — | | | | (356,833 | ) |
| (69,562,377 | ) | | | 11,806,084 | | | | (6,484,217 | ) | | | (58,699,724 | ) | | | (32,455,073 | ) |
| | 241,004 | | | | 427,600 | | | | 280,340 | | | | 174,524 | | | | (14,844 | ) |
| | | | | | | | | | | | | | | | | | |
| | (35,280,050 | ) | | | (30,254,581 | ) | | | (66,462 | ) | | | (50,832,882 | ) | | | (13,613,148 | ) |
| | | | | | | | | | | | | | | | | | |
| $ | (39,332,524 | ) | | $ | (31,803,552 | ) | | $ | (737,413 | ) | | $ | (55,214,555 | ) | | $ | (17,634,570 | ) |
| | | | | | | | | | | | | | | | | | |
95
Statements of Operations (continued)
| | | | | | | | | | | | |
| | | LARGE CAP
VALUE
FUND | | | LONG/SHORT
FUND | | | MICRO
CAP
FUND | |
| | | | | | | | | | | | |
Investment Income: | | | | | | | | | | | | |
Interest | | $ | 691 | | | $ | — | | | $ | 1,243 | |
Dividends2 | | | | | | | | | | | | |
Unaffiliated issuers | | | 2,926,470 | | | | 1,872,123 | | | | 856,527 | |
| | | | | | | | | | | | |
Total investment income | | | 2,927,161 | | | | 1,872,123 | | | | 857,770 | |
| | | | | | | | | | | | |
Expenses: | | | | | | | | | | | | |
Investment advisory fees | | | 862,558 | | | | 1,164,025 | | | | 2,242,074 | |
Shareholder servicing fees — Investor Class | | | 151,870 | | | | 170,577 | | | | 85,932 | |
Shareholder servicing fees — Institutional Class | | | 844 | | | | 2,193 | | | | — | |
Fund administration fees | | | 16,231 | | | | 17,899 | | | | 22,768 | |
Fund accounting fees | | | 14,271 | | | | 16,196 | | | | 21,788 | |
Reports to shareholders — Investor Class | | | 13,112 | | | | 19,331 | | | | 8,854 | |
Reports to shareholders — Institutional Class | | | 790 | | | | 3,085 | | | | — | |
Custody fees | | | 3,401 | | | | 8,738 | | | | 15,694 | |
Federal and state registration fees — Investor Class | | | 10,622 | | | | 15,343 | | | | 10,613 | |
Federal and state registration fees — Institutional Class | | | 5,571 | | | | 9,826 | | | | — | |
Legal fees | | | 5,361 | | | | 12,011 | | | | 7,421 | |
Trustees’ fees | | | 13,827 | | | | 16,625 | | | | 19,606 | |
Dividends on securities sold short | | | — | | | | 600,596 | | | | — | |
Interest | | | 2,927 | | | | 247,804 | | | | 4,630 | |
Audit fees | | | 15,825 | | | | 15,825 | | | | 14,724 | |
Other expenses | | | 10,884 | | | | 10,390 | | | | 12,726 | |
| | | | | | | | | | | | |
Total expenses before reimbursement | | | 1,128,094 | | | | 2,330,464 | | | | 2,466,830 | |
Reimbursement of expenses by Advisor | | | (72,581 | ) | | | (30,688 | ) | | | — | |
| | | | | | | | | | | | |
Net Expenses | | | 1,055,513 | | | | 2,299,776 | | | | 2,466,830 | |
| | | | | | | | | | | | |
Net Investment Income (Loss) | | | 1,871,648 | | | | (427,653 | ) | | | (1,609,060 | ) |
| | | | | | | | | | | | |
Realized and Unrealized Gain (Loss): | | | | | | | | | | | | |
Net realized gain (loss) on investments and foreign currency translations | | | | | | | | | | | | |
Unaffiliated issuers | | | 12,395,987 | | | | 12,581,414 | | | | 8,990,361 | |
Affiliated issuers | | | — | | | | — | | | | — | |
Net realized gain on options written | | | 99,363 | | | | — | | | | — | |
Net realized loss on short positions | | | — | | | | (8,186,699 | ) | | | — | |
Change in unrealized appreciation (depreciation) on
investments and foreign currency translations | | | 5,465,632 | | | | 2,512,372 | | | | 7,047,763 | |
| | | | | | | | | | | | |
Net gain on investments | | | 17,960,982 | | | | 6,907,087 | | | | 16,038,124 | |
| | | | | | | | | | | | |
Net Increase in Net Assets Resulting from Operations | | $ | 19,832,630 | | | $ | 6,479,434 | | | $ | 14,429,064 | |
| | | | | | | | | | | | |
| 2 | Net of $44,662, $23,865, $10,241, $3,454, $16,649, $0, $5,848 and $1,818 in foreign withholding taxes, respectively. |
See Notes to Financial Statements.
96
| | |
| | MARCH 31, 2017 (UNAUDITED) |
|
|
|
| | | | | | | | | | | | | | | | | | |
MICRO CAP
VALUE
FUND | | | SMALL CAP
GROWTH
FUND | | | SMALL CAP
VALUE
FUND | | | STRATEGIC
INCOME
FUND | | | ULTRA
GROWTH
FUND | |
| | | | | | | | | | | | | | | | | | |
| | | | | | | | | | | | | | | | | | |
| $ | 14,474 | | | $ | 4,332 | | | $ | 2,581 | | | $ | 1,687 | | | $ | 12,830 | |
| | | | | | | | | | | | | | | | | | |
| | 1,194,074 | | | | 5,097,395 | | | | 2,475,094 | | | | 764,142 | | | | 122,378 | |
| | | | | | | | | | | | | | | | | | |
| | 1,208,548 | | | | 5,101,727 | | | | 2,477,675 | | | | 765,829 | | | | 135,208 | |
| | | | | | | | | | | | | | | | | | |
| | | | | | | | | | | | | | | | | | |
| | 1,517,996 | | | | 8,939,665 | | | | 1,601,092 | | | | 180,799 | | | | 483,731 | |
| | 108,952 | | | | 1,506,900 | | | | 168,485 | | | | 46,669 | | | | 72,171 | |
| | — | | | | 6,024 | | | | 1,333 | | | | — | | | | — | |
| | 15,441 | | | | 151,170 | | | | 27,143 | | | | 4,371 | | | | 8,190 | |
| | 19,904 | | | | 92,687 | | | | 22,345 | | | | 8,605 | | | | 14,132 | |
| | 12,274 | | | | 103,112 | | | | 15,436 | | | | 4,835 | | | | 6,886 | |
| | — | | | | 16,722 | | | | 1,248 | | | | — | | | | — | |
| | 16,185 | | | | 166,022 | | | | 11,292 | | | | 1,747 | | | | 5,334 | |
| | 11,021 | | | | 31,335 | | | | 15,536 | | | | 10,302 | | | | 9,305 | |
| | — | | | | 12,383 | | | | 6,758 | | | | — | | | | — | |
| | 4,928 | | | | 56,124 | | | | 8,775 | | | | 1,476 | | | | 2,690 | |
| | 12,884 | | | | 132,804 | | | | 21,679 | | | | 3,892 | | | | 7,067 | |
| | — | | | | — | | | | — | | | | — | | | | — | |
| | 2,811 | | | | 49,491 | | | | 5,200 | | | | 805 | | | | 1,557 | |
| | 17,454 | | | | 16,446 | | | | 15,935 | | | | 14,614 | | | | 14,834 | |
| | 9,718 | | | | 45,544 | | | | 12,521 | | | | 2,997 | | | | 8,776 | |
| | | | | | | | | | | | | | | | | | |
| | 1,749,568 | | | | 11,326,429 | | | | 1,934,778 | | | | 281,112 | | | | 634,673 | |
| | — | | | | (86,232 | ) | | | (15,570 | ) | | | (34,938 | ) | | | — | |
| | | | | | | | | | | | | | | | | | |
| | 1,749,568 | | | | 11,240,197 | | | | 1,919,208 | | | | 246,174 | | | | 634,673 | |
| | | | | | | | | | | | | | | | | | |
| | (541,020 | ) | | | (6,138,470 | ) | | | 558,467 | | | | 519,655 | | | | (499,465 | ) |
| | | | | | | | | | | | | | | | | | |
| | | | | | | | | | | | | | | | | | |
| | | | | | | | | | | | | | | | | | |
| | 8,880,622 | | | | 80,289,849 | | | | 10,501,314 | | | | 486,484 | | | | 6,547,781 | |
| | — | | | | (3,281,811 | ) | | | — | | | | — | | | | — | |
| | — | | | | — | | | | — | | | | — | | | | — | |
| | — | | | | — | | | | — | | | | — | | | | — | |
| 6,483,933 | | | | 12,259,457 | | | | 18,216,546 | | | | 1,967,795 | | | | (1,300,932 | ) |
| | | | | | | | | | | | | | | | | | |
| | 15,364,555 | | | | 89,267,495 | | | | 28,717,860 | | | | 2,454,279 | | | | 5,246,849 | |
| | | | | | | | | | | | | | | | | | |
| $ | 14,823,535 | | | $ | 83,129,025 | | | $ | 29,276,327 | | | $ | 2,973,934 | | | $ | 4,747,384 | |
| | | | | | | | | | | | | | | | | | |
97
| | |
| WASATCH FUNDS | | MARCH 31, 2017 (UNAUDITED) |
|
|
|
Statements of Operations (continued)
| | | | | | | | | | | | |
| | | WORLD
INNOVATORS
FUND | | | INCOME
FUND | | | U.S.
TREASURY
FUND | |
| | | | | | | | | | | | |
Investment Income: | | | | | | | | | | | | |
Interest | | $ | 3,992 | | | $ | 1,197,300 | 1 | | $ | 4,725,056 | |
Dividends2 | | | | | | | | | | | | |
Unaffiliated issuers | | | 990,524 | | | | 43,140 | | | | — | |
| | | | | | | | | | | | |
Total investment income | | | 994,516 | | | | 1,240,440 | | | | 4,725,056 | |
| | | | | | | | | | | | |
Expenses: | | | | | | | | | | | | |
Investment advisory fees | | | 1,360,557 | | | | 271,134 | | | | 858,377 | |
Shareholder servicing fees — Investor Class | | | 164,568 | | | | 17,577 | | | | 245,664 | |
Shareholder servicing fees — Institutional Class | | | 835 | | | | — | | | | — | |
Fund administration fees | | | 15,346 | | | | 8,347 | | | | 28,966 | |
Fund accounting fees | | | 20,854 | | | | 20,498 | | | | 19,240 | |
Reports to shareholders — Investor Class | | | 12,603 | | | | 2,913 | | | | 17,641 | |
Reports to shareholders — Institutional Class | | | 805 | | | | — | | | | — | |
Custody fees | | | 24,875 | | | | 5,883 | | | | 6,626 | |
Federal and state registration fees — Investor Class | | | 11,449 | | | | 9,735 | | | | 37,236 | |
Federal and state registration fees — Institutional Class | | | 9,381 | | | | — | | | | — | |
Legal fees | | | 5,346 | | | | 2,733 | | | | 11,371 | |
Trustees’ fees | | | 13,826 | | | | 7,168 | | | | 30,358 | |
Interest | | | 3,003 | | | | 1,551 | | | | 6,797 | |
Audit fees | | | 15,913 | | | | 14,614 | | | | 14,614 | |
Other expenses | | | 9,340 | | | | 3,786 | | | | 10,463 | |
| | | | | | | | | | | | |
Total expenses before reimbursement | | | 1,668,701 | | | | 365,939 | | | | 1,287,353 | |
Reimbursement of expenses by Advisor | | | (14,942 | ) | | | — | | | | — | |
| | | | | | | | | | | | |
Net Expenses | | | 1,653,759 | | | | 365,939 | | | | 1,287,353 | |
| | | | | | | | | | | | |
Net Investment Income (Loss) | | | (659,243 | ) | | | 874,501 | | | | 3,437,703 | |
| | | | | | | | | | | | |
Realized and Unrealized Gain (Loss): | | | | | | | | | | | | |
Net realized gain (loss) on investments and foreign currency translations | | | | | | | | | | | | |
Unaffiliated issuers | | | 8,333,248 | | | | (219,459 | ) | | | (15,216,627 | ) |
Change in unrealized appreciation (depreciation) on
investments and foreign currency translations | | | 2,063,689 | | | | (1,351,609 | ) | | | (53,306,634 | ) |
| | | | | | | | | | | | |
Net gain (loss) on investments | | | 10,396,937 | | | | (1,571,068 | ) | | | (68,523,261 | ) |
| | | | | | | | | | | | |
Net Increase (Decrease) in Net Assets Resulting from Operations | | $ | 9,737,694 | | | $ | (696,567 | ) | | $ | (65,085,558 | ) |
| | | | | | | | | | | | |
| 1 | Net of $329 in foreign withholding taxes. |
| 2 | Net of $60,723, $0 and $0 in foreign withholding taxes, respectively. |
See Notes to Financial Statements.
98
(This page intentionally left blank.)
99
Statements of Changes in Net Assets
| | | | | | | | | | | | | | | | |
| | |
CORE GROWTH
FUND | | | EMERGING INDIA
FUND | |
| | | Six Months
Ended
March 31, 2017
(Unaudited) | | | Year Ended
September 30, 2016 | | | Six Months
Ended
March 31, 2017
(Unaudited) | | | Year Ended
September 30, 20161 | |
| | | | | | | | | | | | | | | | |
Operations: | | | | | | | | | | | | | | | | |
Net investment income (loss) | | $ | (4,123,415 | ) | | $ | (7,219,134 | ) | | $ | (609,473 | ) | | $ | (780,023 | ) |
Net realized gain (loss) on investments, foreign
currency translations and foreign capital gains taxes | | | 36,022,918 | | | | 6,560,806 | | | | 210,763 | | | | 75,863 | |
Change in unrealized appreciation (depreciation) on investments, foreign currency translations and deferred capital gains taxes | | | 64,209,745 | | | | 127,845,697 | | | | 11,168,509 | | | | 9,007,373 | |
| | | | | | | | | | | | | | | | |
Net increase (decrease) in net assets resulting from operations | | | 96,109,248 | | | | 127,187,369 | | | | 10,769,799 | | | | 8,303,213 | |
| | | | |
Dividends paid from: | | | | | | | | | | | | | | | | |
Investor Class | | | | | | | | | | | | | | | | |
Net investment income | | | — | | | | — | | | | — | | | | — | |
Net realized gains | | | (1,693,023 | ) | | | (119,772,338 | ) | | | (681,183 | ) | | | (958,580 | ) |
| | | | | | | | | | | | | | | | |
| | | (1,693,023 | ) | | | (119,772,338 | ) | | | (681,183 | ) | | | (958,580 | ) |
Institutional Class | | | | | | | | | | | | | | | | |
Net investment income | | | (131,773 | ) | | | — | | | | — | | | | — | |
Net realized gains | | | (427,998 | ) | | | (18,740,216 | ) | | | (138,465 | ) | | | — | |
| | | | | | | | | | | | | | | | |
| | | (559,771 | ) | | | (18,740,216 | ) | | | (138,465 | ) | | | — | |
| | | | |
Capital share transactions: | | | | | | | | | | | | | | | | |
Investor Class | | | | | | | | | | | | | | | | |
Shares sold | | | 95,735,974 | | | | 235,595,333 | | | | 41,846,683 | | | | 29,211,166 | |
Shares issued to holders in reinvestment of dividends | | | 1,656,949 | | | | 117,452,918 | | | | 675,573 | | | | 881,647 | |
Shares redeemed | | | (133,500,748 | ) | | | (270,607,879 | ) | | | (18,666,984 | ) | | | (27,875,778 | ) |
Redemption fees | | | 10,795 | | | | 57,589 | | | | 30,218 | | | | 16,274 | |
| | | | | | | | | | | | | | | | |
Net increase (decrease) | | | (36,097,030 | ) | | | 82,497,961 | | | | 23,885,490 | | | | 2,233,309 | |
| | | | | | | | | | | | | | | | |
Institutional Class | | | | | | | | | | | | | | | | |
Shares sold | | | 86,171,770 | | | | 102,256,296 | | | | 8,752,571 | | | | 8,344,245 | |
Shares issued to holders in reinvestment of dividends | | | 533,314 | | | | 17,489,140 | | | | 63,166 | | | | — | |
Shares redeemed | | | (18,616,108 | ) | | | (22,196,227 | ) | | | (145,340 | ) | | | — | |
Redemption fees | | | 1,612 | | | | 9,043 | | | | — | | | | — | |
| | | | | | | | | | | | | | | | |
Net increase (decrease) | | | 68,090,588 | | | | 97,558,252 | | | | 8,670,397 | | | | 8,344,245 | |
| | | | | | | | | | | | | | | | |
Total increase (decrease) in net assets | | | 125,850,012 | | | | 168,731,028 | | | | 42,506,038 | | | | 17,922,187 | |
| | | | |
Net assets: | | | | | | | | | | | | | | | | |
Beginning of period | | | 1,333,860,505 | | | | 1,165,129,477 | | | | 81,772,076 | | | | 63,849,889 | |
| | | | | | | | | | | | | | | | |
End of period | | $ | 1,459,710,517 | | | $ | 1,333,860,505 | | | $ | 124,278,114 | | | $ | 81,772,076 | |
| | | | | | | | | | | | | | | | |
Undistributed net investment income (loss) included
in net assets at end of period | | $ | (9,830,247 | ) | | $ | (5,575,059 | ) | | $ | (2,259,013 | ) | | $ | (1,649,540 | ) |
| | | | | | | | | | | | | | | | |
| | | | |
Capital share transactions — shares: | | | | | | | | | | | | | | | | |
Investor Class | | | | | | | | | | | | | | | | |
Shares sold | | | 1,613,939 | | | | 4,389,841 | | | | 12,510,788 | | | | 9,619,706 | |
Shares issued to holders in reinvestment of dividends | | | 28,319 | | | | 2,179,898 | | | | 229,008 | | | | 291,936 | |
Shares redeemed | | | (2,261,117 | ) | | | (5,086,949 | ) | | | (5,891,446 | ) | | | (9,479,876 | ) |
| | | | | | | | | | | | | | | | |
Net increase (decrease) in shares outstanding | | | (618,859 | ) | | | 1,482,790 | | | | 6,848,350 | | | | 431,766 | |
| | | | | | | | | | | | | | | | |
Institutional Class | | | | | | | | | | | | | | | | |
Shares sold | | | 1,452,998 | | | | 1,883,923 | | | | 2,784,021 | | | | 2,879,575 | |
Shares issued to holders in reinvestment of dividends | | | 9,075 | | | | 323,513 | | | | 21,340 | | | | — | |
Shares redeemed | | | (312,165 | ) | | | (410,462 | ) | | | (43,000 | ) | | | — | |
| | | | | | | | | | | | | | | | |
Net increase (decrease) in shares outstanding | | | 1,149,908 | | | | 1,796,974 | | | | 2,762,361 | | | | 2,879,575 | |
| | | | | | | | | | | | | | | | |
| 1 | Institutional class inception date was February 1, 2016. |
See Notes to Financial Statements.
100
| | |
| | MARCH 31, 2017 (UNAUDITED) |
|
|
|
| | | | | | | | | | | | | | | | | | | | | | |
EMERGING MARKETS SELECT FUND | | | EMERGING MARKETS SMALL CAP FUND | | | FRONTIER EMERGING SMALL COUNTRIES FUND | |
Six Months
Ended
March 31, 2017
(Unaudited) | | | Year Ended
September 30, 2016 | | | Six Months
Ended
March 31, 2017
(Unaudited) | | | Year Ended
September 30, 20161 | | | Six Months
Ended
March 31, 2017
(Unaudited) | | | Year Ended
September 30, 20161 | |
| | | | | | | | | | | | | | | | | | | | | | |
| | | | | | | | | | | | | | | | | | | | | | |
| $ | (110,170 | ) | | $ | 39,611 | | | $ | (4,052,474 | ) | | $ | (5,703,812 | ) | | $ | (1,548,971 | ) | | $ | 3,750,574 | |
| (449,435 | ) | | | (1,295,442 | ) | | | 34,041,323 | | | | (57,152,827 | ) | | | (42,488,265 | ) | | | (122,596,395 | ) |
| 344,015 | | | | 5,180,985 | | | | (69,321,373 | ) | | | 150,259,510 | | | | 12,233,684 | | | | 71,170,573 | |
| | | | | | | | | | | | | | | | | | | | | | |
| (215,590 | ) | | | 3,925,154 | | | | (39,332,524 | ) | | | 87,402,871 | | | | (31,803,552 | ) | | | (47,675,248 | ) |
| | | | | |
| | | | | | | | | | | | | | | | | | | | | | |
| | | | | | | | | | | | | | | | | | | | | | |
| | — | | | | — | | | | — | | | | (132,483 | ) | | | — | | | | (1,618,755 | ) |
| | — | | | | — | | | | — | | | | — | | | | — | | | | — | |
| | | | | | | | | | | | | | | | | | | | | | |
| | — | | | | — | | | | — | | | | (132,483 | ) | | | — | | | | (1,618,755 | ) |
| | | | | | | | | | | | | | | | | | | | | | |
| | — | | | | — | | | | — | | | | — | | | | — | | | | — | |
| | — | | | | — | | | | — | | | | — | | | | — | | | | — | |
| | | | | | | | | | | | | | | | | | | | | | |
| | — | | | | — | | | | — | | | | — | | | | — | | | | — | |
| | | | | |
| | | | | | | | | | | | | | | | | | | | | | |
| | | | | | | | | | | | | | | | | | | | | | |
| | 1,099,891 | | | | 5,021,512 | | | | 41,750,189 | | | | 135,426,837 | | | | 38,003,089 | | | | 256,042,228 | |
| | — | | | | — | | | | — | | | | 117,400 | | | | — | | | | 1,545,813 | |
| | (1,683,849 | ) | | | (13,057,233 | ) | | | (193,952,628 | ) | | | (508,099,796 | ) | | | (182,486,920 | ) | | | (796,859,735 | ) |
| | 2,724 | | | | 1,244 | | | | 10,751 | | | | 6,249 | | | | 1,937 | | | | 47,252 | |
| | | | | | | | | | | | | | | | | | | | | | |
| | (581,234 | ) | | | (8,034,477 | ) | | | (152,191,688 | ) | | | (372,549,310 | ) | | | (144,481,894 | ) | | | (539,224,442 | ) |
| | | | | | | | | | | | | | | | | | | | | | |
| | | | | | | | | | | | | | | | | | | | | | |
| | 629,776 | | | | 6,298,780 | | | | 24,978,214 | | | | 163,579,317 | | | | 15,015,169 | | | | 156,914,661 | |
| | — | | | | — | | | | — | | | | — | | | | — | | | | — | |
| | (1,417,577 | ) | | | (1,330,793 | ) | | | (27,737,484 | ) | | | (24,306,522 | ) | | | (97,526,219 | ) | | | (18,521,165 | ) |
| | — | | | | — | | | | 372 | | | | 242 | | | | 375 | | | | 839 | |
| | | | | | | | | | | | | | | | | | | | | | |
| | (787,801 | ) | | | 4,967,987 | | | | (2,758,898 | ) | | | 139,273,037 | | | | (82,510,675 | ) | | | 138,394,335 | |
| | | | | | | | | | | | | | | | | | | | | | |
| | (1,584,625 | ) | | | 858,664 | | | | (194,283,110 | ) | | | (146,005,885 | ) | | | (258,796,121 | ) | | | (450,124,110 | ) |
| | | | | |
| | | | | | | | | | | | | | | | | | | | | | |
| | 38,654,784 | | | | 37,796,120 | | | | 835,360,842 | | | | 981,366,727 | | | | 577,548,950 | | | | 1,027,673,060 | |
| | | | | | | | | | | | | | | | | | | | | | |
| $ | 37,070,159 | | | $ | 38,654,784 | | | $ | 641,077,732 | | | $ | 835,360,842 | | | $ | 318,752,829 | | | $ | 577,548,950 | |
| | | | | | | | | | | | | | | | | | | | | | |
$ | (268,047 | ) | | $ | (157,877 | ) | | $ | (11,229,854 | ) | | $ | (7,177,380 | ) | | $ | (7,475,780 | ) | | $ | (5,926,809 | ) |
| | | | | | | | | | | | | | | | | | | | | | |
| | | | | |
| | | | | | | | | | | | | | | | | | | | | | |
| | | | | | | | | | | | | | | | | | | | | | |
| | 129,578 | | | | 607,896 | | | | 17,127,665 | | | | 55,771,862 | | | | 15,317,634 | | | | 96,401,830 | |
| | — | | | | — | | | | — | | | | 48,512 | | | | — | | | | 574,652 | |
| | (200,007 | ) | | | (1,537,017 | ) | | | (79,921,038 | ) | | | (213,187,447 | ) | | | (73,813,114 | ) | | | (300,906,259 | ) |
| | | | | | | | | | | | | | | | | | | | | | |
| | (70,429 | ) | | | (929,121 | ) | | | (62,793,373 | ) | | | (157,367,073 | ) | | | (58,495,480 | ) | | | (203,929,777 | ) |
| | | | | | | | | | | | | | | | | | | | | | |
| | | | | | | | | | | | | | | | | | | | | | |
| | 75,128 | | | | 735,711 | | | | 10,119,332 | | | | 69,868,540 | | | | 6,062,004 | | | | 60,003,922 | |
| | — | | | | — | | | | — | | | | — | | | | — | | | | — | |
| | (166,443 | ) | | | (154,025 | ) | | | (11,210,492 | ) | | | (9,644,798 | ) | | | (39,426,297 | ) | | | (7,015,724 | ) |
| | | | | | | | | | | | | | | | | | | | | | |
| | (91,315 | ) | | | 581,686 | | | | (1,091,160 | ) | | | 60,223,742 | | | | (33,364,293 | ) | | | 52,988,198 | |
| | | | | | | | | | | | | | | | | | | | | | |
101
Statements of Changes in Net Assets (continued)
| | | | | | | | | | | | | | | | |
| | | GLOBAL OPPORTUNITIES
FUND | | | INTERNATIONAL GROWTH
FUND | |
| | | Six Months
Ended
March 31, 2017
(Unaudited) | | | Year Ended
September 30, 20161 | | | Six Months
Ended
March 31, 2017
(Unaudited) | | | Year Ended
September 30, 20161 | |
| | | | | | | | | | | | | | | | |
Operations: | | | | | | | | | | | | | | | | |
Net investment income (loss) | | $ | (670,951 | ) | | $ | (1,517,910 | ) | | $ | (4,381,673 | ) | | $ | (4,748,463 | ) |
Net realized gain (loss) on investments, foreign
currency translations and foreign capital gains taxes | | | 6,137,415 | | | | 8,430,816 | | | | 7,692,318 | | | | 55,136,808 | |
Net realized gain on options written | | | — | | | | — | | | | — | | | | — | |
Net realized loss on short positions | | | — | | | | — | | | | — | | | | — | |
Change in unrealized appreciation (depreciation) on
investments, foreign currency translations
and deferred capital gains taxes | | | (6,203,877 | ) | | | 14,070,421 | | | | (58,525,200 | ) | | | 116,091,330 | |
| | | | | | | | | | | | | | | | |
Net increase (decrease) in net assets resulting from operations | | | (737,413 | ) | | | 20,983,327 | | | | (55,214,555 | ) | | | 166,479,675 | |
| | | | |
Dividends paid from: | | | | | | | | | | | | | | | | |
Investor Class | | | | | | | | | | | | | | | | |
Net investment income | | | (141,725 | ) | | | (427,375 | ) | | | — | | | | — | |
Net realized gains | | | (7,610,212 | ) | | | (19,259,921 | ) | | | (29,626,224 | ) | | | — | |
| | | | | | | | | | | | | | | | |
| | | (7,751,937 | ) | | | (19,687,296 | ) | | | (29,626,224 | ) | | | — | |
Institutional Class | | | | | | | | | | | | | | | | |
Net investment income | | | (20,477 | ) | | | — | | | | (393,058 | ) | | | — | |
Net realized gains | | | (396,985 | ) | | | — | | | | (17,283,293 | ) | | | — | |
| | | | | | | | | | | | | | | | |
| | | (417,462 | ) | | | — | | | | (17,676,351 | ) | | | — | |
| | | | |
Capital share transactions: | | | | | | | | | | | | | | | | |
Investor Class | | | | | | | | | | | | | | | | |
Shares sold | | | 5,347,706 | | | | 21,166,046 | | | | 62,926,638 | | | | 222,578,093 | |
Shares issued to holders in reinvestment of dividends | | | 7,688,279 | | | | 19,452,688 | | | | 28,617,516 | | | | — | |
Shares redeemed | | | (60,559,269 | ) | | | (46,667,870 | ) | | | (152,770,670 | ) | | | (726,095,437 | ) |
Redemption fees | | | 3,934 | | | | 12,452 | | | | 2,531 | | | | 11,556 | |
| | | | | | | | | | | | | | | | |
Net decrease | | | (47,519,350 | ) | | | (6,036,684 | ) | | | (61,223,985 | ) | | | (503,505,788 | ) |
| | | | | | | | | | | | | | | | |
Institutional Class | | | | | | | | | | | | | | | | |
Shares sold | | | 1,175,676 | | | | 5,065,715 | | | | 88,637,416 | | | | 483,795,090 | |
Shares issued to holders in reinvestment of dividends | | | 338,803 | | | | — | | | | 16,749,716 | | | | — | |
Shares redeemed | | | (575,832 | ) | | | — | | | | (52,484,206 | ) | | | (8,682,445 | ) |
Redemption fees | | | — | | | | — | | | | 2 | | | | 2,492 | |
| | | | | | | | | | | | | | | | |
Net increase (decrease) | | | 938,647 | | | | 5,065,715 | | | | 52,902,928 | | | | 475,115,137 | |
| | | | | | | | | | | | | | | | |
Total increase (decrease) in net assets | | | (55,487,515 | ) | | | 325,062 | | | | (110,838,187 | ) | | | 138,089,024 | |
| | | | |
Net assets: | | | | | | | | | | | | | | | | |
Beginning of period | | | 156,292,954 | | | | 155,967,892 | | | | 1,454,184,112 | | | | 1,316,095,088 | |
| | | | | | | | | | | | | | | | |
End of period | | $ | 100,805,439 | | | $ | 156,292,954 | | | $ | 1,343,345,925 | | | $ | 1,454,184,112 | |
| | | | | | | | | | | | | | | | |
Undistributed net investment income (loss) included
in net assets at end of period | | $ | (2,262,805 | ) | | $ | (1,429,652 | ) | | $ | (6,546,573 | ) | | $ | (1,771,842 | ) |
| | | | | | | | | | | | | | | | |
| | | | |
Capital share transactions — shares: | | | | | | | | | | | | | | | | |
Investor Class | | | | | | | | | | | | | | | | |
Shares sold | | | 1,642,471 | | | | 6,694,423 | | | | 2,239,971 | | | | 7,681,730 | |
Shares issued to holders in reinvestment of dividends | | | 2,606,196 | | | | 5,704,601 | | | | 1,081,948 | | | | — | |
Shares redeemed | | | (18,457,962 | ) | | | (13,949,592 | ) | | | (5,447,058 | ) | | | (24,818,248 | ) |
| | | | | | | | | | | | | | | | |
Net decrease in shares outstanding | | | (14,209,295 | ) | | | (1,550,568 | ) | | | (2,125,139 | ) | | | (17,136,518 | ) |
| | | | | | | | | | | | | | | | |
Institutional Class | | | | | | | | | | | | | | | | |
Shares sold | | | 360,899 | | | | 1,518,647 | | | | 3,185,903 | | | | 16,466,250 | |
Shares issued to holders in reinvestment of dividends | | | 114,849 | | | | — | | | | 633,020 | | | | — | |
Shares redeemed | | | (174,075 | ) | | | — | | | | (1,877,583 | ) | | | (285,393 | ) |
| | | | | | | | | | | | | | | | |
Net increase (decrease) in shares outstanding | | | 301,673 | | | | 1,518,647 | | | | 1,941,340 | | | | 16,180,857 | |
| | | | | | | | | | | | | | | | |
| 1 | Institutional class inception date was February 1, 2016. |
See Notes to Financial Statements.
102
| | |
| | MARCH 31, 2017 (UNAUDITED) |
|
|
|
| | | | | | | | | | | | | | | | | | | | | | |
INTERNATIONAL OPPORTUNITIES
FUND | | | LARGE CAP VALUE
FUND | | | LONG/SHORT
FUND | |
Six Months
Ended
March 31, 2017
(Unaudited) | | | Year Ended
September 30, 20161 | | | Six Months
Ended
March 31, 2017
(Unaudited) | | | Year Ended
September 30, 2016 | | | Six Months
Ended
March 31, 2017
(Unaudited) | | | Year Ended
September 30, 2016 | |
| | | | | | | | | | | | | | | | | | | | | | |
| | | | | | | | | | | | | | | | | | | | | | |
| $ | (4,021,422 | ) | | $ | (1,149,686 | ) | | $ | 1,871,648 | | | $ | 3,669,068 | | | $ | (427,653 | ) | | $ | 45,073 | |
| 18,856,769 | | | | (6,218,080 | ) | | | 12,395,987 | | | | 5,613,690 | | | | 12,581,414 | | | | (125,012,468 | ) |
| | — | | | | — | | | | 99,363 | | | | 132,873 | | | | — | | | | — | |
| | — | | | | — | | | | — | | | | — | | | | (8,186,699 | ) | | | (24,738,165 | ) |
| (32,469,917 | ) | | | 123,227,456 | | | | 5,465,632 | | | | 19,112,212 | | | | 2,512,372 | | | | 196,133,025 | |
| | | | | | | | | | | | | | | | | | | | | | |
| (17,634,570 | ) | | | 115,859,690 | | | | 19,832,630 | | | | 28,527,843 | | | | 6,479,434 | | | | 46,427,465 | |
| | | | | |
| | | | | | | | | | | | | | | | | | | | | | |
| | | | | | | | | | | | | | | | | | | | | | |
| | — | | | | — | | | | (1,708,081 | ) | | | (3,733,214 | ) | | | — | | | | (364,125 | ) |
| | — | | | | (22,512,072 | ) | | | (6,413,391 | ) | | | (20,730,247 | ) | | | (42,943 | ) | | | (49,332,592 | ) |
| | | | | | | | | | | | | | | | | | | | | | |
| | — | | | | (22,512,072 | ) | | | (8,121,472 | ) | | | (24,463,461 | ) | | | (42,943 | ) | | | (49,696,717 | ) |
| | | | | | | | | | | | | | | | | | | | | | |
| | — | | | | — | | | | (21,993 | ) | | | (60,085 | ) | | | — | | | | (479,596 | ) |
| | — | | | | — | | | | (63,659 | ) | | | (252,053 | ) | | | (18,132 | ) | | | (22,243,655 | ) |
| | | | | | | | | | | | | | | | | | | | | | |
| | — | | | | — | | | | (85,652 | ) | | | (312,138 | ) | | | (18,132 | ) | | | (22,723,251 | ) |
| | | | | |
| | | | | | | | | | | | | | | | | | | | | | |
| | | | | | | | | | | | | | | | | | | | | | |
| | 62,465,505 | | | | 151,939,973 | | | | 5,282,902 | | | | 9,656,161 | | | | 13,235,566 | | | | 64,920,986 | |
| | — | | | | 22,015,075 | | | | 8,034,698 | | | | 24,129,587 | | | | 42,349 | | | | 49,262,675 | |
| | (100,656,965 | ) | | | (184,742,350 | ) | | | (29,228,795 | ) | | | (91,876,593 | ) | | | (81,980,753 | ) | | | (527,803,631 | ) |
| | 12,325 | | | | 18,842 | | | | 511 | | | | 1,216 | | | | 2,876 | | | | 15,132 | |
| | | | | | | | | | | | | | | | | | | | | | |
| | (38,179,135 | ) | | | (10,768,460 | ) | | | (15,910,684 | ) | | | (58,089,629 | ) | | | (68,699,962 | ) | | | (413,604,838 | ) |
| | | | | | | | | | | | | | | | | | | | | | |
| | | | | | | | | | | | | | | | | | | | | | |
| | 50,191,179 | | | | 153,515,811 | | | | 1,601,673 | | | | 3,327,996 | | | | 27,479,268 | | | | 41,876,317 | |
| | — | | | | — | | | | 84,383 | | | | 309,072 | | | | 18,116 | | | | 22,325,848 | |
| | (20,036,532 | ) | | | (9,205,095 | ) | | | (2,721,425 | ) | | | (1,601,692 | ) | | | (39,005,700 | ) | | | (401,523,032 | ) |
| | 3,368 | | | | 2,811 | | | | 1,100 | | | | 1,120 | | | | 14,527 | | | | 101,712 | |
| | | | | | | | | | | | | | | | | | | | | | |
| | 30,158,015 | | | | 144,313,527 | | | | (1,034,269 | ) | | | 2,036,496 | | | | (11,493,789 | ) | | | (337,219,155 | ) |
| | | | | | | | | | | | | | | | | | | | | | |
| | (25,655,690 | ) | | | 226,892,685 | | | | (5,319,447 | ) | | | (52,300,889 | ) | | | (73,775,392 | ) | | | (776,816,496 | ) |
| | | | | |
| | | | | | | | | | | | | | | | | | | | | | |
| | 680,387,811 | | | | 453,495,126 | | | | 193,280,094 | | | | 245,580,983 | | | | 248,167,392 | | | | 1,024,983,888 | |
| | | | | | | | | | | | | | | | | | | | | | |
| $ | 654,732,121 | | | $ | 680,387,811 | | | $ | 187,960,647 | | | $ | 193,280,094 | | | $ | 174,392,000 | | | $ | 248,167,392 | |
| | | | | | | | | | | | | | | | | | | | | | |
$ | (4,258,690 | ) | | $ | (237,268 | ) | | $ | 137,843 | | | $ | (3,731 | ) | | $ | (573,021 | ) | | $ | (145,368 | ) |
| | | | | | | | | | | | | | | | | | | | | | |
| | | | | |
| | | | | | | | | | | | | | | | | | | | | | |
| | | | | | | | | | | | | | | | | | | | | | |
| | 20,928,536 | | | | 52,855,854 | | | | 562,203 | | | | 1,120,728 | | | | 1,008,055 | | | | 5,339,083 | |
| | — | | | | 7,862,527 | | | | 858,132 | | | | 2,807,480 | | | | 3,177 | | | | 4,332,689 | |
| | (33,858,941 | ) | | | (66,779,782 | ) | | | (3,111,036 | ) | | | (10,503,774 | ) | | | (6,350,881 | ) | | | (44,954,538 | ) |
| | | | | | | | | | | | | | | | | | | | | | |
| | (12,930,405 | ) | | | (6,061,401 | ) | | | (1,690,701 | ) | | | (6,575,566 | ) | | | (5,339,649 | ) | | | (35,282,766 | ) |
| | | | | | | | | | | | | | | | | | | | | | |
| | | | | | | | | | | | | | | | | | | | | | |
| | 16,667,705 | | | | 55,197,121 | | | | 168,053 | | | | 365,881 | | | | 2,065,859 | | | | 3,395,227 | |
| | — | | | | — | | | | 9,021 | | | | 35,987 | | | | 1,353 | | | | 1,961,850 | |
| | (6,748,575 | ) | | | (3,093,786 | ) | | | (298,947 | ) | | | (176,253 | ) | | | (2,956,902 | ) | | | (33,338,059 | ) |
| | | | | | | | | | | | | | | | | | | | | | |
| | 9,919,130 | | | | 52,103,335 | | | | (121,873 | ) | | | 225,615 | | | | (889,690 | ) | | | (27,980,982 | ) |
| | | | | | | | | | | | | | | | | | | | | | |
103
Statements of Changes in Net Assets (continued)
| | | | | | | | | | | | | | | | |
| | | MICRO CAP
FUND | | | MICRO CAP VALUE
FUND | |
| | | Six Months
Ended
March 31, 2017
(Unaudited) | | | Year Ended
September 30, 2016 | | | Six Months
Ended
March 31, 2017
(Unaudited) | | | Year Ended
September 30, 2016 | |
| | | | | | | | | | | | | | | | |
Operations: | |
Net investment income (loss) | | $ | (1,609,060 | ) | | $ | (3,020,820 | ) | | $ | (541,020 | ) | | $ | (987,743 | ) |
Net realized gain (loss) on investments, foreign
currency translations and foreign capital gains taxes | | | 8,990,361 | | | | 17,504,026 | | | | 8,880,622 | | | | 2,306,799 | |
Change in unrealized appreciation on investments, foreign currency translations and deferred foreign capital gains taxes | | | 7,047,763 | | | | 25,086,105 | | | | 6,483,933 | | | | 18,406,751 | |
| | | | | | | | | | | | | | | | |
Net increase in net assets resulting from operations | | | 14,429,064 | | | | 39,569,311 | | | | 14,823,535 | | | | 19,725,807 | |
| | | | |
Dividends paid from: | | | | | | | | | | | | | | | | |
Investor Class | | | | | | | | | | | | | | | | |
Net investment income | | | (194,392 | ) | | | — | | | | (119,575 | ) | | | — | |
Net realized gains | | | (22,635,465 | ) | | | (40,544,074 | ) | | | (2,945,428 | ) | | | (17,904,955 | ) |
Return of capital | | | — | | | | — | | | | — | | | | — | |
| | | | | | | | | | | | | | | | |
| | | (22,829,857 | ) | | | (40,544,074 | ) | | | (3,065,003 | ) | | | (17,904,955 | ) |
Institutional Class | | | | | | | | | | | | | | | | |
Net investment income | | | — | | | | — | | | | — | | | | — | |
Net realized gains | | | — | | | | — | | | | — | | | | — | |
| | | | | | | | | | | | | | | | |
| | | — | | | | — | | | | — | | | | — | |
| | | | |
Capital share transactions: | | | | | | | | | | | | | | | | |
Investor Class | | | | | | | | | | | | | | | | |
Shares sold | | | 4,183,059 | | | | 6,546,097 | | | | 12,251,147 | | | | 36,255,073 | |
Shares issued to holders in reinvestment of dividends | | | 21,444,591 | | | | 38,421,674 | | | | 3,005,231 | | | | 17,528,757 | |
Shares redeemed | | | (22,083,829 | ) | | | (39,615,512 | ) | | | (17,817,146 | ) | | | (30,678,179 | ) |
Redemption fees | | | 85 | | | | 2,584 | | | | 1,887 | | | | 21,005 | |
| | | | | | | | | | | | | | | | |
Net increase (decrease) | | | 3,543,906 | | | | 5,354,843 | | | | (2,558,881 | ) | | | 23,126,656 | |
| | | | | | | | | | | | | | | | |
Institutional Class | | | | | | | | | | | | | | | | |
Shares sold | | | — | | | | — | | | | — | | | | — | |
Shares issued to holders in reinvestment of dividends | | | — | | | | — | | | | — | | | | — | |
Shares redeemed | | | — | | | | — | | | | — | | | | — | |
Redemption fees | | | — | | | | — | | | | — | | | | — | |
| | | | | | | | | | | | | | | | |
Net increase | | | — | | | | — | | | | — | | | | — | |
| | | | | | | | | | | | | | | | |
Total increase (decrease) in net assets | | | (4,856,887 | ) | | | 4,380,080 | | | | 9,199,651 | | | | 24,947,508 | |
| | | | |
Net assets: | | | | | | | | | | | | | | | | |
Beginning of period | | | 277,690,923 | | | | 273,310,843 | | | | 179,116,372 | | | | 154,168,864 | |
| | | | | | | | | | | | | | | | |
End of period | | $ | 272,834,036 | | | $ | 277,690,923 | | | $ | 188,316,023 | | | $ | 179,116,372 | |
| | | | | | | | | | | | | | | | |
Undistributed net investment income (loss) included
in net assets at end of period | | $ | (3,775,231 | ) | | $ | (1,971,779 | ) | | $ | (1,349,706 | ) | | $ | (689,111 | ) |
| | | | | | | | | | | | | | | | |
| | | | |
Capital share transactions — shares: | | | | | | | | | | | | | | | | |
Investor Class | | | | | | | | | | | | | | | | |
Shares sold | | | 612,521 | | | | 973,225 | | | | 4,188,281 | | | | 13,603,287 | |
Shares issued to holders in reinvestment of dividends | | | 3,309,350 | | | | 5,777,695 | | | | 1,029,189 | | | | 6,565,078 | |
Shares redeemed | | | (3,255,987 | ) | | | (6,040,054 | ) | | | (6,079,871 | ) | | | (11,446,018 | ) |
| | | | | | | | | | | | | | | | |
Net increase (decrease) in shares outstanding | | | 665,884 | | | | 710,866 | | | | (862,401 | ) | | | 8,722,347 | |
| | | | | | | | | | | | | | | | |
Institutional Class | | | | | | | | | | | | | | | | |
Shares sold | | | — | | | | — | | | | — | | | | — | |
Shares issued to holders in reinvestment of dividends | | | — | | | | — | | | | — | | | | — | |
Shares redeemed | | | — | | | | — | | | | — | | | | — | |
| | | | | | | | | | | | | | | | |
Net increase in shares outstanding | | | — | | | | — | | | | — | | | | — | |
| | | | | | | | | | | | | | | | |
| 1 | Institutional class inception date was February 1, 2016. |
See Notes to Financial Statements.
104
| | |
| | MARCH 31, 2017 (UNAUDITED) |
|
|
|
| | | | | | | | | | | | | | | | | | | | | | |
SMALL CAP GROWTH
FUND | | | SMALL CAP VALUE
FUND | | | STRATEGIC INCOME
FUND | |
Six Months
Ended
March 31, 2017
(Unaudited) | | | Year Ended
September 30, 20161 | | | Six Months
Ended
March 31, 2017
(Unaudited) | | | Year Ended
September 30, 2016 | | | Six Months
Ended
March 31, 2017
(Unaudited) | | | Year Ended
September 30, 2016 | |
| | | | | | | | | | | | | | | | | | | | | | |
| | | | | | | | | | | | | | | | | | | | | | |
| $ | (6,138,470 | ) | | $ | (14,924,154 | ) | | $ | 558,467 | | | $ | 682,252 | | | $ | 519,655 | | | $ | 1,690,915 | |
| 77,008,038 | | | | 162,637,861 | | | | 10,501,314 | | | | 16,775,143 | | | | 486,484 | | | | (7,539,689 | ) |
| 12,259,457 | | | | 67,189,440 | | | | 18,216,546 | | | | 18,262,012 | | | | 1,967,795 | | | | 9,420,214 | |
| | | | | | | | | | | | | | | | | | | | | | |
| | 83,129,025 | | | | 214,903,147 | | | | 29,276,327 | | | | 35,719,407 | | | | 2,973,934 | | | | 3,571,440 | |
| | | | | |
| | | | | | | | | | | | | | | | | | | | | | |
| | | | | | | | | | | | | | | | | | | | | | |
| | — | | | | — | | | | (204,563 | ) | | | (1,366,134 | ) | | | (307,985 | ) | | | (1,501,048 | ) |
| | (114,348,061 | ) | | | (322,361,340 | ) | | | — | | | | — | | | | — | | | | (2,658,712 | ) |
| | — | | | | — | | | | — | | | | — | | | | — | | | | (287,336 | ) |
| | | | | | | | | | | | | | | | | | | | | | |
| | (114,348,061 | ) | | | (322,361,340 | ) | | | (204,563 | ) | | | (1,366,134 | ) | | | (307,985 | ) | | | (4,447,096 | ) |
| | | | | | | | | | | | | | | | | | | | | | |
| | — | | | | — | | | | (86,356 | ) | | | (98,715 | ) | | | — | | | | — | |
| | (29,795,156 | ) | | | — | | | | — | | | | — | | | | — | | | | — | |
| | | | | | | | | | | | | | | | | | | | | | |
| | (29,795,156 | ) | | | — | | | | (86,356 | ) | | | (98,715 | ) | | | — | | | | — | |
| | | | | |
| | | | | | | | | | | | | | | | | | | | | | |
| | | | | | | | | | | | | | | | | | | | | | |
| | 68,938,203 | | | | 209,117,699 | | | | 35,652,139 | | | | 35,656,524 | | | | 1,319,251 | | | | 5,689,341 | |
| | 111,807,878 | | | | 309,835,993 | | | | 197,943 | | | | 1,301,422 | | | | 303,752 | | | | 4,380,286 | |
| | (392,071,087 | ) | | | (844,914,263 | ) | | | (30,250,951 | ) | | | (56,085,285 | ) | | | (10,871,566 | ) | | | (42,746,118 | ) |
| | 16,797 | | | | 67,941 | | | | 6,108 | | | | 1,743 | | | | 81 | | | | 3,056 | |
| | | | | | | | | | | | | | | | | | | | | | |
| | (211,308,209 | ) | | | (325,892,630 | ) | | | 5,605,239 | | | | (19,125,596 | ) | | | (9,248,482 | ) | | | (32,673,435 | ) |
| | | | | | | | | | | | | | | | | | | | | | |
| | | | | | | | | | | | | | | | | | | | | | |
| | 158,118,911 | | | | 334,206,662 | | | | 17,469,367 | | | | 5,124,166 | | | | — | | | | — | |
| | 27,104,939 | | | | — | | | | 85,868 | | | | 98,258 | | | | — | | | | — | |
| | (66,613,279 | ) | | | (19,042,923 | ) | | | (4,493,929 | ) | | | (3,397,604 | ) | | | — | | | | — | |
| | 1,574 | | | | 369 | | | | 299 | | | | 79 | | | | — | | | | — | |
| | | | | | | | | | | | | | | | | | | | | | |
| | 118,612,145 | | | | 315,164,108 | | | | 13,061,605 | | | | 1,824,899 | | | | — | | | | — | |
| | | | | | | | | | | | | | | | | | | | | | |
| | (153,710,256 | ) | | | (118,186,715 | ) | | | 47,652,252 | | | | 16,953,861 | | | | (6,582,533 | ) | | | (33,549,091 | ) |
| | | | | |
| | | | | | | | | | | | | | | | | | | | | | |
| | 1,882,400,918 | | | | 2,000,587,633 | | | | 293,549,123 | | | | 276,595,262 | | | | 55,111,832 | | | | 88,660,923 | |
| | | | | | | | | | | | | | | | | | | | | | |
| $ | 1,728,690,662 | | | $ | 1,882,400,918 | | | $ | 341,201,375 | | | $ | 293,549,123 | | | $ | 48,529,299 | | | $ | 55,111,832 | |
| | | | | | | | | | | | | | | | | | | | | | |
$ | (16,835,766 | ) | | $ | (10,697,296 | ) | | $ | 490,865 | | | $ | 223,317 | | | $ | 51,827 | | | $ | (159,843 | ) |
| | | | | | | | | | | | | | | | | | | | | | |
| | | | | |
| | | | | | | | | | | | | | | | | | | | | | |
| | | | | | | | | | | | | | | | | | | | | | |
| | 1,632,700 | | | | 5,131,888 | | | | 5,098,651 | | | | 6,099,737 | | | | 121,456 | | | | 548,323 | |
| | 2,797,995 | | | | 7,380,562 | | | | 27,919 | | | | 216,904 | | | | 28,248 | | | | 425,080 | |
| | (9,301,086 | ) | | | (20,536,916 | ) | | | (4,330,802 | ) | | | (9,526,792 | ) | | | (1,000,747 | ) | | | (4,239,042 | ) |
| | | | | | | | | | | | | | | | | | | | | | |
| | (4,870,391 | ) | | | (8,024,466 | ) | | | 795,768 | | | | (3,210,151 | ) | | | (851,043 | ) | | | (3,265,639 | ) |
| | | | | | | | | | | | | | | | | | | | | | |
| | | | | | | | | | | | | | | | | | | | | | |
| | 3,726,328 | | | | 8,204,969 | | | | 2,446,485 | | | | 902,562 | | | | — | | | | — | |
| | 676,777 | | | | — | | | | 12,060 | | | | 16,322 | | | | — | | | | — | |
| | (1,563,506 | ) | | | (457,924 | ) | | | (628,804 | ) | | | (553,403 | ) | | | — | | | | — | |
| | | | | | | | | | | | | | | | | | | | | | |
| | 2,839,599 | | | | 7,747,045 | | | | 1,829,741 | | | | 365,481 | | | | — | | | | — | |
| | | | | | | | | | | | | | | | | | | | | | |
105
Statements of Changes in Net Assets (continued)
| | | | | | | | | | | | | | | | |
| | | ULTRA GROWTH
FUND | | | WORLD INNOVATORS
FUND | |
| | | Six Months
Ended
March 31, 2017
(Unaudited) | | | Year Ended
September 30, 2016 | | | Six Months
Ended
March 31, 2017
(Unaudited) | | | Year Ended
September 30, 20161 | |
| | | | | | | | | | | | | | | | |
Operations: | | | | | | | | | | | | | | | | |
Net investment income (loss) | | $ | (499,465 | ) | | $ | (982,316 | ) | | $ | (659,243 | ) | | $ | (1,240,640 | ) |
Net realized gain (loss) on investments, foreign
currency translations and foreign capital gains taxes | | | 6,547,781 | | | | 7,330,801 | | | | 8,333,248 | | | | 11,692,010 | |
Change in unrealized appreciation (depreciation) on investments, foreign currency translations and deferred capital gains taxes | | | (1,300,932 | ) | | | 11,054,954 | | | | 2,063,689 | | | | 6,110,487 | |
| | | | | | | | | | | | | | | | |
Net increase (decrease) in net assets resulting from operations | | | 4,747,384 | | | | 17,403,439 | | | | 9,737,694 | | | | 16,561,857 | |
| | | | |
Dividends paid from: | | | | | | | | | | | | | | | | |
Investor Class | | | | | | | | | | | | | | | | |
Net investment income | | | (520,867 | ) | | | — | | | | — | | | | — | |
Net realized gains | | | (9,189,783 | ) | | | (8,679,065 | ) | | | (6,256,560 | ) | | | (24,130,023 | ) |
| | | | | | | | | | | | | | | | |
| | | (9,710,650 | ) | | | (8,679,065 | ) | | | (6,256,560 | ) | | | (24,130,023 | ) |
Institutional Class | | | | | | | | | | | | | | | | |
Net investment income | | | — | | | | — | | | | — | | | | — | |
Net realized gains | | | — | | | | — | | | | (128,118 | ) | | | — | |
| | | | | | | | | | | | | | | | |
| | | — | | | | — | | | | (128,118 | ) | | | — | |
| | | | |
Capital share transactions: | | | | | | | | | | | | | | | | |
Investor Class | | | | | | | | | | | | | | | | |
Shares sold | | | 2,473,823 | | | | 4,877,275 | | | | 9,264,580 | | | | 59,829,188 | |
Shares issued to holders in reinvestment of dividends | | | 9,435,416 | | | | 8,403,349 | | | | 6,041,921 | | | | 22,861,112 | |
Shares redeemed | | | (9,071,664 | ) | | | (16,619,659 | ) | | | (40,081,498 | ) | | | (67,566,485 | ) |
Redemption fees | | | 48 | | | | 1,273 | | | | 871 | | | | 1,953 | |
| | | | | | | | | | | | | | | | |
Net increase (decrease) | | | 2,837,623 | | | | (3,337,762 | ) | | | (24,774,126 | ) | | | 15,125,768 | |
| | | | | | | | | | | | | | | | |
Institutional Class | | | | | | | | | | | | | | | | |
Shares sold | | | — | | | | — | | | | 5,138,816 | | | | 5,998,939 | |
Shares issued to holders in reinvestment of dividends | | | — | | | | — | | | | 128,118 | | | | — | |
Shares redeemed | | | — | | | | — | | | | (4,995,294 | ) | | | (25,551 | ) |
| | | | | | | | | | | | | | | | |
Net increase | | | — | | | | — | | | | 271,640 | | | | 5,973,388 | |
| | | | | | | | | | | | | | | | |
Total increase (decrease) in net assets | | | (2,125,643 | ) | | | 5,386,612 | | | | (21,149,470 | ) | | | 13,530,990 | |
| | | | |
Net assets: | | | | | | | | | | | | | | | | |
Beginning of period | | | 101,401,904 | | | | 96,015,292 | | | | 199,803,013 | | | | 186,272,023 | |
| | | | | | | | | | | | | | | | |
End of period | | $ | 99,276,261 | | | $ | 101,401,904 | | | $ | 178,653,543 | | | $ | 199,803,013 | |
| | | | | | | | | | | | | | | | |
Undistributed net investment income (loss) included
in net assets at end of period | | $ | (2,220,052 | ) | | $ | (1,199,720 | ) | | $ | (1,115,320 | ) | | $ | (456,077 | ) |
| | | | | | | | | | | | | | | | |
| | | | |
Capital share transactions — shares: | | | | | | | | | | | | | | | | |
Investor Class | | | | | | | | | | | | | | | | |
Shares sold | | | 131,345 | | | | 273,554 | | | | 483,182 | | | | 3,189,238 | |
Shares issued to holders in reinvestment of dividends | | | 538,244 | | | | 459,702 | | | | 326,414 | | | | 1,198,171 | |
Shares redeemed | | | (481,689 | ) | | | (952,369 | ) | | | (2,107,849 | ) | | | (3,591,062 | ) |
| | | | | | | | | | | | | | | | |
Net increase (decrease) in shares outstanding | | | 187,900 | | | | (219,113 | ) | | | (1,298,253 | ) | | | 796,347 | |
| | | | | | | | | | | | | | | | |
Institutional Class | | | | | | | | | | | | | | | | |
Shares sold | | | — | | | | — | | | | 266,176 | | | | 309,990 | |
Shares issued to holders in reinvestment of dividends | | | — | | | | — | | | | 6,903 | | | | — | |
Shares redeemed | | | — | | | | — | | | | (265,224 | ) | | | (1,313 | ) |
| | | | | | | | | | | | | | | | |
Net increase in shares outstanding | | | — | | | | — | | | | 7,855 | | | | 308,677 | |
| | | | | | | | | | | | | | | | |
| 1 | Institutional class inception date was February 1, 2016. |
See Notes to Financial Statements.
106
| | |
| | MARCH 31, 2017 (UNAUDITED) |
|
|
|
| | | | | | | | | | | | | | |
INCOME
FUND | | | U.S. TREASURY
FUND | |
Six Months
Ended
March 31, 2017
(Unaudited) | | | Year Ended
September 30, 2016 | | | Six Months
Ended
March 31, 2017
(Unaudited) | | | Year Ended
September 30, 2016 | |
| | | | | | | | | | | | | | |
| | | | | | | | | | | | | | |
| $ | 874,501 | | | $ | 1,951,379 | | | $ | 3,437,703 | | | $ | 7,963,623 | |
| (219,459 | ) | | | 125,294 | | | | (15,216,627 | ) | | | 23,928,544 | |
| (1,351,609 | ) | | | 544,033 | | | | (53,306,634 | ) | | | 24,193,265 | |
| | | | | | | | | | | | | | |
| (696,567 | ) | | | 2,620,706 | | | | (65,085,558 | ) | | | 56,085,432 | |
| | | |
| | | | | | | | | | | | | | |
| | | | | | | | | | | | | | |
| | (872,064 | ) | | | (1,963,364 | ) | | | (3,419,651 | ) | | | (7,944,602 | ) |
| | (124,947 | ) | | | — | | | | (23,928,558 | ) | | | (15,905,989 | ) |
| | | | | | | | | | | | | | |
| | (997,011 | ) | | | (1,963,364 | ) | | | (27,348,209 | ) | | | (23,850,591 | ) |
| | | | | | | | | | | | | | |
| | — | | | | — | | | | — | | | | — | |
| | — | | | | — | | | | — | | | | — | |
| | | | | | | | | | | | | | |
| | — | | | | — | | | | — | | | | — | |
| | | |
| | | | | | | | | | | | | | |
| | | | | | | | | | | | | | |
| | 13,080,075 | | | | 27,381,821 | | | | 87,105,595 | | | | 288,787,957 | |
| | 683,423 | | | | 1,491,903 | | | | 26,041,280 | | | | 22,804,737 | |
| | (12,623,361 | ) | | | (38,794,414 | ) | | | (207,632,767 | ) | | | (182,878,814 | ) |
| | 930 | | | | 10,533 | | | | 102,416 | | | | 201,177 | |
| | | | | | | | | | | | | | |
| | 1,141,067 | | | | (9,910,157 | ) | | | (94,383,476 | ) | | | 128,915,057 | |
| | | | | | | | | | | | | | |
| | | | | | | | | | | | | | | |
| | — | | | | — | | | | — | | | | — | |
| | — | | | | — | | | | — | | | | — | |
| | — | | | | — | | | | — | | | | — | |
| | | | | | | | | | | | | | |
| | — | | | | — | | | | — | | | | — | |
| | | | | | | | | | | | | | |
| | (552,511 | ) | | | (9,252,815 | ) | | | (186,817,243 | ) | | | 161,149,898 | |
| | | |
| | | | | | | | | | | | | | |
| | 99,706,071 | | | | 108,958,886 | | | | 489,010,815 | | | | 327,860,917 | |
| | | | | | | | | | | | | | |
| $ | 99,153,560 | | | $ | 99,706,071 | | | $ | 302,193,572 | | | $ | 489,010,815 | |
| | | | | | | | | | | | | | |
$ | 12,891 | | | $ | 10,454 | | | $ | 16,192 | | | $ | (1,860 | ) |
| | | | | | | | | | | | | | |
| | | |
| | | | | | | | | | | | | | |
| | | | | | | | | | | | | | |
| | 1,296,117 | | | | 2,685,166 | | | | 5,263,615 | | | | 15,149,367 | |
| | 67,827 | | | | 146,414 | | | | 1,689,658 | | | | 1,296,239 | |
| | (1,249,681 | ) | | | (3,804,979 | ) | | | (12,238,039 | ) | | | (9,625,892 | ) |
| | | | | | | | | | | | | | |
| | 114,263 | | | | (973,399 | ) | | | (5,284,766 | ) | | | 6,819,714 | |
| | | | | | | | | | | | | | |
| | | | | | | | | | | | | | |
| | — | | | | — | | | | — | | | | — | |
| | — | | | | — | | | | — | | | | — | |
| | — | | | | — | | | | — | | | | — | |
| | | | | | | | | | | | | | |
| | — | | | | — | | | | — | | | | — | |
| | | | | | | | | | | | | | |
107
Financial Highlights
| | | | | | | | | | | | | | | | | | | | | | | | | | | | | | | | |
| | | | | | Income (Loss) from
Investment Operations | | | | | | | | | Less Distributions | | | | |
| | | Net Asset
Value
Beginning
of Period | | | Net
Investment
Income (Loss) | | | Net Realized
and Unrealized
Gains (Losses)
on Investments | | | Total from
Investment
Operations | | | Redemption
Fees
(See Note 2) | | | Dividends
from Net
Investment
Income | | | Distributions
from Net
Realized
Gains | | | Total
Distributions | |
Core Growth Fund — Investor Class | | | | | | | | | | | | | | | | | | | | | | | | | | | | | | | | |
Six Months ended 3/31/17 (unaudited) | | $ | 56.90 | | | | (0.20 | ) | | | 4.27 | | | | 4.07 | | | | — | 4 | | | — | | | | (0.09 | ) | | | (0.09 | ) |
Year ended 9/30/1622 | | $ | 57.83 | | | | (0.30 | ) | | | 6.09 | | | | 5.79 | | | | — | 4 | | | — | | | | (6.72 | ) | | | (6.72 | ) |
Year ended 9/30/15 | | $ | 53.46 | | | | (0.14 | )14 | | | 5.95 | | | | 5.81 | | | | — | 4 | | | — | | | | (1.44 | ) | | | (1.44 | ) |
Year ended 9/30/14 | | $ | 52.49 | | | | (0.39 | ) | | | 2.12 | | | | 1.73 | | | | — | 4 | | | — | | | | (0.76 | ) | | | (0.76 | ) |
Year ended 9/30/13 | | $ | 41.41 | | | | (0.12 | ) | | | 11.19 | | | | 11.07 | | | | 0.01 | | | | — | | | | — | | | | — | |
Year ended 9/30/12 | | $ | 32.63 | | | | (0.26 | ) | | | 9.04 | | | | 8.78 | | | | — | 4 | | | — | | | | — | | | | — | |
Core Growth Fund — Institutional Class | | | | | | | | | | | | | | | | | | | | | | | | | | | | | | | | |
Six Months ended 3/31/17 (unaudited) | | $ | 57.16 | | | | (0.06 | ) | | | 4.19 | | | | 4.13 | | | | — | 4 | | | (0.03 | ) | | | (0.09 | ) | | | (0.12 | ) |
Year ended 9/30/1622 | | $ | 57.99 | | | | (0.14 | ) | | | 6.03 | | | | 5.89 | | | | — | 4 | | | — | | | | (6.72 | ) | | | (6.72 | ) |
Year ended 9/30/15 | | $ | 53.58 | | | | 0.06 | | | | 5.79 | | | | 5.85 | | | | — | 4 | | | — | | | | (1.44 | ) | | | (1.44 | ) |
Year ended 9/30/14 | | $ | 52.57 | | | | (0.23 | ) | | | 2.00 | | | | 1.77 | | | | — | 4 | | | — | | | | (0.76 | ) | | | (0.76 | ) |
Year ended 9/30/13 | | $ | 41.44 | | | | (0.07 | ) | | | 11.20 | | | | 11.13 | | | | — | 4 | | | — | | | | — | | | | — | |
Year ended 9/30/128 | | $ | 38.32 | | | | (0.16 | ) | | | 3.28 | | | | 3.12 | | | | — | | | | — | | | | — | | | | — | |
Emerging India Fund — Investor Class | | | | | | | | | | | | | | | | | | | | | | | | | | | | | | | | |
Six Months ended 3/31/17 (unaudited) | | $ | 3.39 | | | | (— | )4 | | | 0.32 | | | | 0.32 | | | | — | 4 | | | — | | | | (0.03 | ) | | | (0.03 | ) |
Year ended 9/30/1622 | | $ | 3.07 | | | | (0.03 | ) | | | 0.39 | | | | 0.36 | | | | — | 4 | | | — | | | | (0.04 | ) | | | (0.04 | ) |
Year ended 9/30/15 | | $ | 2.73 | | | | (0.04 | ) | | | 0.38 | | | | 0.34 | | | | — | 4 | | | — | 4 | | | — | | | | — | 4 |
Year ended 9/30/14 | | $ | 1.78 | | | | (— | )4 | | | 0.95 | | | | 0.95 | | | | — | 4 | | | — | | | | — | | | | — | |
Year ended 9/30/13 | | $ | 2.02 | | | | (0.01 | ) | | | (0.23 | ) | | | (0.24 | ) | | | — | 4 | | | — | | | | — | | | | — | |
Year ended 9/30/12 | | $ | 1.83 | | | | (0.01 | ) | | | 0.21 | | | | 0.20 | | | | — | 4 | | | (0.01 | ) | | | — | | | | (0.01 | ) |
Emerging India Fund — Institutional Class | | | | | | | | | | | | | | | | | | | | | | | | | | | | | | | | |
Six Months ended 3/31/17 (unaudited) | | $ | 3.40 | | | | 0.03 | | | | 0.30 | | | | 0.33 | | | | — | | | | — | | | | (0.03 | ) | | | (0.03 | ) |
Year ended 9/30/1619 22 | | $ | 2.82 | | | | (0.01 | ) | | | 0.59 | | | | 0.58 | | | | — | | | | — | | | | — | | | | — | |
Emerging Markets Select Fund — Investor Class | | | | | | | | | | | | | | | | | | | | | | | | | | | | | |
Six Months ended 3/31/17 (unaudited) | | $ | 9.23 | | | | (0.04 | ) | | | 0.01 | | | | (0.03 | ) | | | — | 4 | | | — | | | | — | | | | — | |
Year ended 9/30/1622 | | $ | 8.35 | | | | (0.05 | ) | | | 0.93 | | | | 0.88 | | | | — | 4 | | | — | | | | — | | | | — | |
Year ended 9/30/15 | | $ | 10.31 | | | | (0.04 | ) | | | (1.89 | ) | | | (1.93 | ) | | | — | 4 | | | (0.03 | ) | | | — | | | | (0.03 | ) |
Year ended 9/30/14 | | $ | 9.56 | | | | (0.01 | ) | | | 0.77 | | | | 0.76 | | | | — | 4 | | | (0.01 | ) | | | — | | | | (0.01 | ) |
Year ended 9/30/1312 | | $ | 10.00 | | | | — | 4 | | | (0.44 | ) | | | (0.44 | ) | | | — | 4 | | | — | | | | — | | | | — | |
Emerging Markets Select Fund — Institutional Class | | | | | | | | | | | | | | | | | | | | | | | | | | | | | |
Six Months ended 3/31/17 (unaudited) | | $ | 9.32 | | | | (0.02 | ) | | | — | 4 | | | (0.02 | ) | | | — | | | | — | | | | — | | | | — | |
Year ended 9/30/1622 | | $ | 8.41 | | | | 0.04 | | | | 0.87 | | | | 0.91 | | | | — | | | | — | | | | — | | | | — | |
Year ended 9/30/15 | | $ | 10.37 | | | | (0.03 | ) | | | (1.88 | ) | | | (1.91 | ) | | | — | 4 | | | (0.05 | ) | | | — | | | | (0.05 | ) |
Year ended 9/30/14 | | $ | 9.61 | | | | — | 4 | | | 0.78 | | | | 0.78 | | | | — | 4 | | | (0.02 | ) | | | — | | | | (0.02 | ) |
Year ended 9/30/1313 | | $ | 10.00 | | | | (— | )4 | | | (0.39 | ) | | | (0.39 | ) | | | — | 4 | | | — | | | | — | | | | — | |
Emerging Markets Small Cap Fund — Investor Class | | | | | | | | | | | | | | | | | | | | | | | | | | | | | |
Six Months ended 3/31/17 (unaudited) | | $ | 2.67 | | | | (0.03 | ) | | | (0.07 | ) | | | (0.10 | ) | | | — | 4 | | | — | | | | — | | | | — | |
Year ended 9/30/1622 | | $ | 2.39 | | | | (0.04 | ) | | | 0.32 | | | | 0.28 | | | | — | 4 | | | — | 4 | | | — | | | | — | 4 |
Year ended 9/30/15 | | $ | 2.74 | | | | (0.03 | ) | | | (0.32 | ) | | | (0.35 | ) | | | — | 4 | | | — | 4 | | | — | | | | — | 4 |
Year ended 9/30/14 | | $ | 2.67 | | | | (0.01 | ) | | | 0.14 | | | | 0.13 | | | | — | 4 | | | — | | | | (0.06 | ) | | | (0.06 | ) |
Year ended 9/30/13 | | $ | 2.66 | | | | 0.01 | | | | 0.01 | | | | 0.02 | | | | — | 4 | | | (0.01 | ) | | | — | | | | (0.01 | ) |
Year ended 9/30/12 | | $ | 2.16 | | | | 0.01 | | | | 0.49 | | | | 0.50 | | | | — | 4 | | | — | | | | — | | | | — | |
Emerging Markets Small Cap Fund — Institutional Class | | | | | | | | | | | | | | | | | | | | | | | | | |
Six Months ended 3/31/17 (unaudited) | | $ | 2.67 | | | | (0.01 | ) | | | (0.09 | ) | | | (0.10 | ) | | | — | 4 | | | — | | | | — | | | | — | |
Period ended 9/30/1619 22 | | $ | 2.31 | | | | (— | )4 | | | 0.36 | | | | 0.36 | | | | — | | | | — | | | | — | | | | — | |
Frontier Emerging Small Countries Fund — Investor Class | | | | | | | | | | | | | | | | | | | | | | | | | |
Six Months ended 3/31/17 (unaudited) | | $ | 2.63 | | | | (0.03 | ) | | | (0.11 | ) | | | (0.14 | ) | | | — | 4 | | | — | | | | — | | | | — | |
Year ended 9/30/1622 | | $ | 2.77 | | | | 0.02 | | | | (0.16 | ) | | | (0.14 | ) | | | — | 4 | | | — | 4 | | | — | | | | — | 4 |
Year ended 9/30/15 | | $ | 3.32 | | | | 0.02 | | | | (0.50 | ) | | | (0.48 | ) | | | — | 4 | | | (0.02 | ) | | | (0.05 | ) | | | (0.07 | ) |
Year ended 9/30/14 | | $ | 2.97 | | | | 0.03 | | | | 0.33 | | | | 0.36 | | | | — | 4 | | | (0.01 | ) | | | — | | | | (0.01 | ) |
Year ended 9/30/13 | | $ | 2.41 | | | | 0.01 | | | | 0.55 | | | | 0.56 | | | | — | 4 | | | — | 4 | | | — | 4 | | | — | 4 |
Year ended 9/30/129 | | $ | 2.00 | | | | 0.01 | | | | 0.40 | | | | 0.41 | | | | — | 4 | | | — | | | | — | | | | — | |
Frontier Emerging Small Countries Fund — Institutional Class | | | | | | | | | | | | | | | | | | | | | | | | | |
Six Months ended 3/31/17 (unaudited) | | $ | 2.64 | | | | (0.05 | ) | | | (0.09 | ) | | | (0.14 | ) | | | — | 4 | | | — | | | | — | | | | — | |
Period ended 9/30/1619 22 | | $ | 2.58 | | | | 0.02 | | | | 0.04 | | | | 0.06 | | | | — | 4 | | | — | | | | — | | | | — | |
Global Opportunities Fund — Investor Class | | | | | | | | | | | | | | | | | | | | | | | | | | | | | |
Six Months ended 3/31/17 (unaudited) | | $ | 3.52 | | | | (0.04 | ) | | | 0.10 | | | | 0.06 | | | | — | 4 | | | — | 4 | | | (0.27 | ) | | | (0.27 | ) |
Year ended 9/30/1622 | | $ | 3.51 | | | | (0.04 | ) | | | 0.51 | | | | 0.47 | | | | — | 4 | | | (0.01 | ) | | | (0.45 | ) | | | (0.46 | ) |
Year ended 9/30/15 | | $ | 4.28 | | | | (0.05 | ) | | | (0.08 | ) | | | (0.13 | ) | | | — | 4 | | | (0.01 | ) | | | (0.63 | ) | | | (0.64 | ) |
Year ended 9/30/14 | | $ | 4.58 | | | | (0.05 | ) | | | 0.23 | | | | 0.18 | | | | — | 4 | | | — | 4 | | | (0.48 | ) | | | (0.48 | ) |
Year ended 9/30/13 | | $ | 4.15 | | | | (0.02 | ) | | | 0.93 | | | | 0.91 | | | | — | 4 | | | — | | | | (0.48 | ) | | | (0.48 | ) |
Year ended 9/30/12 | | $ | 3.68 | | | | (0.03 | ) | | | 0.93 | | | | 0.90 | | | | — | 4 | | | — | | | | (0.43 | ) | | | (0.43 | ) |
Global Opportunities Fund — Institutional Class | | | | | | | | | | | | | | | | | | | | | | | | | |
Six Months ended 3/31/17 (unaudited) | | $ | 3.52 | | | | (0.01 | ) | | | 0.07 | | | | 0.06 | | | | — | | | | (0.01 | ) | | | (0.27 | ) | | | (0.28 | ) |
Period ended 9/30/1619 22 | | $ | 3.09 | | | | (— | )4 | | | 0.43 | | | | 0.43 | | | | — | | | | — | | | | — | | | | — | |
See Notes to Financial Highlights and Notes to Financial Statements.
108
| | |
| | (for a share outstanding throughout each period) (Unaudited) |
|
|
|
| | | | | | | | | | | | | | | | | | | | | | | | | | | | | | |
| | | | | | |
Ratios to Average Net Assets | | | Supplemental Data | |
Net Asset
Value
End of
Period | | | Total Return (%)1 | | | Expenses
Net of
Waivers and
Reimbursements (%)2 | | | Expenses
Before
Waivers and
Reimbursements (%)2 | | | Net Investment
Income Net of
Waivers and
Reimbursements (%)2 | | | Net Investment
Income Before
Waivers and
Reimbursements (%)2 | | | Net Assets
End of
Period
(000s) | | | Portfolio
Turnover
Rate1 3 | |
| | | | | | | | | | | | | | | | | | | | | | | | | | | | | | |
| $ | 60.88 | | | | 7.14 | | | | 1.21 | 5 | | | 1.21 | 5 | | | (0.63 | ) | | | (0.63 | ) | | $ | 1,120,589 | | | | 9% | |
| $ | 56.90 | | | | 10.69 | | | | 1.21 | 5 | | | 1.21 | 5 | | | (0.62 | ) | | | (0.62 | ) | | $ | 1,082,679 | | | | 18% | |
| $ | 57.83 | | | | 10.87 | | | | 1.17 | 5 | | | 1.17 | 5 | | | (0.29 | )14 | | | (0.29 | )14 | | $ | 1,014,515 | | | | 39% | |
| $ | 53.46 | | | | 3.26 | | | | 1.18 | 5 | | | 1.18 | 5 | | | (0.64 | ) | | | (0.64 | ) | | $ | 859,086 | | | | 26% | |
| $ | 52.49 | | | | 26.76 | | | | 1.21 | 5 | | | 1.21 | 5 | | | (0.39 | ) | | | (0.39 | ) | | $ | 924,304 | | | | 16% | |
| $ | 41.41 | | | | 26.91 | | | | 1.23 | 5 | | | 1.23 | 5 | | | (0.70 | ) | | | (0.70 | ) | | $ | 581,371 | | | | 28% | |
| | | | | | | | | | | | | | | | | | | | | | | | | | | | | | |
| $ | 61.17 | | | | 7.23 | | | | 1.05 | 5 | | | 1.08 | 5 | | | (0.46 | ) | | | (0.49 | ) | | $ | 339,122 | | | | 9% | |
| $ | 57.16 | | | | 10.83 | | | | 1.07 | 5 | | | 1.09 | 5 | | | (0.48 | ) | | | (0.50 | ) | | $ | 251,181 | | | | 18% | |
| $ | 57.99 | | | | 10.94 | | | | 1.12 | 5 | | | 1.13 | 5 | | | (0.29 | )14 | | | (0.30 | )14 | | $ | 150,614 | | | | 39% | |
| $ | 53.58 | | | | 3.31 | | | | 1.13 | 5 | | | 1.19 | 5 | | | (0.59 | ) | | | (0.65 | )5 | | $ | 49,369 | | | | 26% | |
| $ | 52.57 | | | | 26.86 | | | | 1.12 | 5 | | | 1.32 | 5 | | | (0.32 | ) | | | (0.52 | )5 | | $ | 19,971 | | | | 16% | |
| $ | 41.44 | | | | 8.14 | | | | 1.12 | 5 | | | 1.55 | 5 | | | (0.62 | ) | | | (1.05 | ) | | $ | 9,101 | | | | 28% | |
| | | | | | | | | | | | | | | | | | | | | | | | | | | | | | |
| $ | 3.68 | | | | 9.73 | | | | 1.75 | 5 | | | 1.78 | 5 | | | (1.41 | ) | | | (1.44 | ) | | $ | 103,413 | | | | 9% | |
| $ | 3.39 | | | | 11.98 | | | | 1.82 | 5 | | | 1.96 | 5 | | | (1.18 | ) | | | (1.32 | ) | | $ | 71,973 | | | | 42% | |
| $ | 3.07 | | | | 12.51 | | | | 1.95 | 5 | | | 2.12 | 5 | | | (1.38 | ) | | | (1.55 | ) | | $ | 63,850 | | | | 36% | |
| $ | 2.73 | | | | 53.37 | | | | 1.96 | 5 | | | 2.58 | 5 | | | (0.76 | ) | | | (1.38 | ) | | $ | 44,150 | | | | 13% | |
| $ | 1.78 | | | | (11.88 | ) | | | 1.95 | 5 | | | 2.99 | 5 | | | (0.99 | ) | | | (2.03 | ) | | $ | 15,938 | | | | 40% | |
| $ | 2.02 | | | | 11.42 | | | | 1.95 | 5 | | | 3.41 | 5 | | | (0.65 | ) | | | (2.11 | ) | | $ | 13,658 | | | | 17% | |
| | | | | | | | | | | | | | | | | | | | | | | | | | | | | | |
| $ | 3.70 | | | | 10.00 | | | | 1.50 | 5 | | | 1.73 | 5 | | | (1.15 | ) | | | (1.38 | ) | | $ | 20,865 | | | | 9% | |
| $ | 3.40 | | | | 20.57 | | | | 1.50 | 5 | | | 2.00 | 5 | | | (0.70 | ) | | | (1.20 | ) | | $ | 9,799 | | | | 42% | |
| | | | | | | | | | | | | | | | | | | | | | | | | | | | | | |
| $ | 9.20 | | | | (0.32 | ) | | | 1.52 | 6 | | | 1.97 | 6 | | | (0.84 | ) | | | (1.29 | ) | | $ | 11,207 | | | | 34% | |
| $ | 9.23 | | | | 10.54 | | | | 1.58 | 6 | | | 1.98 | 6 | | | (0.15 | ) | | | (0.55 | ) | | $ | 11,892 | | | | 62% | |
| $ | 8.35 | | | | (18.81 | ) | | | 1.70 | 6 | | | 2.00 | 6 | | | (0.23 | ) | | | (0.53 | ) | | $ | 18,527 | | | | 46% | |
| $ | 10.31 | | | | 7.92 | | | | 1.69 | 5 | | | 1.88 | 5 | | | (0.09 | ) | | | (0.28 | ) | | $ | 26,502 | | | | 59% | |
| $ | 9.56 | | | | (4.40 | ) | | | 1.69 | 5 | | | 2.40 | 5 | | | 0.04 | | | | (0.67 | ) | | $ | 29,374 | | | | 43% | |
| | | | | | | | | | | | | | | | | | | | | | | | | | | | | | |
| $ | 9.30 | | | | (0.21 | ) | | | 1.22 | 6 | | | 1.54 | 6 | | | (0.54 | ) | | | (0.86 | ) | | $ | 25,863 | | | | 34% | |
| $ | 9.32 | | | | 10.82 | | | | 1.29 | 6 | | | 1.59 | 6 | | | 0.29 | | | | (0.01 | ) | | $ | 26,763 | | | | 62% | |
| $ | 8.41 | | | | (18.67 | ) | | | 1.51 | 6 | | | 1.77 | 6 | | | (0.06 | ) | | | (0.32 | ) | | $ | 19,270 | | | | 46% | |
| $ | 10.37 | | | | 8.13 | | | | 1.51 | 5 | | | 1.71 | 5 | | | 0.05 | | | | (0.15 | ) | | $ | 32,306 | | | | 59% | |
| $ | 9.61 | | | | (3.90 | ) | | | 1.50 | 5 | | | 2.21 | 5 | | | (0.18 | ) | | | (0.89 | ) | | $ | 28,861 | | | | 43% | |
| | | | | | | | | | | | | | | | | | | | | | | | | | | | | | |
| $ | 2.57 | | | | (3.75 | ) | | | 1.96 | 6 | | | 2.02 | 6 | | | (1.19 | ) | | | (1.25 | ) | | $ | 488,853 | | | | 33% | |
| $ | 2.67 | | | | 11.73 | | | | 1.96 | 6 | | | 2.00 | 6 | | | (0.75 | ) | | | (0.79 | ) | | $ | 674,632 | | | | 42% | |
| $ | 2.39 | | | | (12.65 | ) | | | 1.95 | 5 | | | 2.01 | 5 | | | (0.63 | ) | | | (0.69 | ) | | $ | 981,367 | | | | 59% | |
| $ | 2.74 | | | | 4.90 | | | | 1.95 | 5 | | | 2.02 | 5 | | | (0.28 | ) | | | (0.35 | ) | | $ | 1,457,882 | | | | 55% | |
| $ | 2.67 | | | | 0.85 | | | | 1.95 | 5 | | | 2.06 | 5 | | | 0.21 | | | | 0.09 | | | $ | 1,785,681 | | | | 41% | |
| $ | 2.66 | | | | 23.15 | | | | 1.95 | 5 | | | 2.13 | 5 | | | 0.29 | | | | 0.11 | | | $ | 1,482,265 | | | | 39% | |
| | | | | | | | | | | | | | | | | | | | | | | | | | | | | | |
| $ | 2.57 | | | | (3.75 | ) | | | 1.81 | 6 | | | 1.87 | 6 | | | (1.01 | ) | | | (1.07 | ) | | $ | 152,225 | | | | 33% | |
| $ | 2.67 | | | | 15.58 | | | | 1.80 | 6 | | | 1.81 | 6 | | | (0.03 | ) | | | (0.04 | ) | | $ | 160,729 | | | | 42% | |
| | | | | | | | | | | | | | | | | | | | | | | | | | | | | | |
| $ | 2.49 | | | | (4.94 | ) | | | 2.28 | 6 | | | 2.69 | 6 | | | (0.79 | ) | | | (1.20 | ) | | $ | 269,635 | | | | 39% | |
| $ | 2.63 | | | | (4.89 | ) | | | 2.25 | 5 | | | 2.39 | 5 | | | 0.35 | | | | 0.21 | | | $ | 437,850 | | | | 80% | |
| $ | 2.77 | | | | (14.88 | ) | | | 2.25 | 5 | | | 2.28 | 5 | | | 0.39 | | | | 0.36 | | | $ | 1,027,673 | | | | 34% | |
| $ | 3.32 | | | | 11.97 | | | | 2.24 | 5 | | | 2.24 | 5 | | | 0.79 | | | | 0.79 | | | $ | 1,324,694 | | | | 22% | |
| $ | 2.97 | | | | 22.88 | | | | 2.25 | 5 | | | 2.43 | 5 | | | 0.81 | | | | 0.63 | | | $ | 730,694 | | | | 13% | |
| $ | 2.41 | | | | 20.50 | | | | 2.25 | 5 | | | 3.64 | 5 | | | 1.31 | | | | (0.08 | ) | | $ | 33,045 | | | | 5% | |
| | | | | | | | | | | | | | | | | | | | | | | | | | | | | | |
| $ | 2.50 | | | | (4.92 | ) | | | 2.08 | 6 | | | 2.27 | 6 | | | (0.66 | ) | | | (0.85 | ) | | $ | 49,117 | | | | 39% | |
| $ | 2.64 | | | | 2.33 | | | | 2.06 | 6 | | | 2.06 | 6 | | | 1.40 | | | | 1.40 | | | $ | 139,699 | | | | 80% | |
| | | | | | | | | | | | | | | | | | | | | | | | | | | | | | |
| $ | 3.31 | | | | 2.65 | | | | 1.63 | 6 | | | 1.63 | 6 | | | (1.16 | ) | | | (1.16 | ) | | $ | 94,790 | | | | 18% | |
| $ | 3.52 | | | | 13.73 | | | | 1.62 | 6 | | | 1.62 | 6 | | | (0.98 | ) | | | (0.98 | ) | | $ | 150,945 | | | | 44% | |
| $ | 3.51 | | | | (3.88 | ) | | | 1.81 | 5 | | | 1.81 | 5 | | | (1.10 | ) | | | (1.10 | ) | | $ | 155,968 | | | | 54% | |
| $ | 4.28 | | | | 3.94 | | | | 1.78 | 5 | | | 1.78 | 5 | | | (0.83 | ) | | | (0.83 | ) | | $ | 192,664 | | | | 42% | |
| $ | 4.58 | | | | 24.23 | | | | 1.80 | 5 | | | 1.80 | 5 | | | (0.70 | ) | | | (0.70 | ) | | $ | 220,460 | | | | 43% | |
| $ | 4.15 | | | | 26.69 | | | | 1.84 | 5 | | | 1.84 | 5 | | | (0.61 | ) | | | (0.61 | ) | | $ | 153,582 | | | | 38% | |
| | | | | | | | | | | | | | | | | | | | | | | | | | | | | | |
| $ | 3.30 | | | | 2.62 | | | | 1.37 | 6 | | | 1.97 | 6 | | | (0.88 | ) | | | (1.48 | ) | | $ | 6,015 | | | | 18% | |
| $ | 3.52 | | | | 13.92 | | | | 1.35 | 5 | | | 2.32 | 5 | | | (0.57 | ) | | | (1.54 | ) | | $ | 5,348 | | | | 44% | |
109
Financial Highlights (continued)
| | | | | | | | | | | | | | | | | | | | | | | | | | | | | | | | |
| | | | | | Income (Loss) from
Investment Operations | | | | | | | | | Less Distributions | | | | |
| | | Net Asset
Value
Beginning
of Period | | | Net
Investment
Income (Loss) | | | Net Realized
and Unrealized
Gains (Losses)
on Investments | | | Total from
Investment
Operations | | | Redemption
Fees
(See Note 2) | | | Dividends
from Net
Investment
Income | | | Distributions
from Net
Realized
Gains | | | Total
Distributions | |
International Growth Fund — Investor Class | | | | | | | | | | | | | | | | | | | | | | | | | | | | | |
Six Months ended 3/31/17 (unaudited) | | $ | 31.43 | | | | (0.12 | ) | | | (1.09 | ) | | | (1.21 | ) | | | — | 4 | | | — | | | | (1.07 | ) | | | (1.07 | ) |
Year ended 9/30/1622 | | $ | 27.88 | | | | (0.22 | ) | | | 3.77 | | | | 3.55 | | | | — | 4 | | | — | | | | — | | | | — | |
Year ended 9/30/15 | | $ | 26.78 | | | | (0.09 | ) | | | 1.39 | | | | 1.30 | | | | — | 4 | | | (0.01 | ) | | | (0.19 | ) | | | (0.20 | ) |
Year ended 9/30/14 | | $ | 28.76 | | | | (0.02 | ) | | | (1.24 | ) | | | (1.26 | ) | | | — | 4 | | | — | | | | (0.72 | ) | | | (0.72 | ) |
Year ended 9/30/13 | | $ | 22.44 | | | | 0.07 | | | | 6.32 | | | | 6.39 | | | | 0.01 | | | | (0.08 | ) | | | — | | | | (0.08 | ) |
Year ended 9/30/12 | | $ | 17.21 | | | | 0.09 | | | | 5.14 | | | | 5.23 | | | | — | 4 | | | — | | | | — | | | | — | |
International Growth Fund — Institutional Class | | | | | | | | | | | | | | | | | | | | | | | | | | | | | |
Six Months ended 3/31/17 (unaudited) | | $ | 31.46 | | | | (0.09 | ) | | | (1.11 | ) | | | (1.20 | ) | | | — | 4 | | | (0.02 | ) | | | (1.07 | ) | | | (1.09 | ) |
Period ended 9/30/1619 22 | | $ | 28.46 | | | | 0.01 | | | | 2.99 | | | | 3.00 | | | | — | 4 | | | — | | | | — | | | | — | |
International Opportunities Fund — Investor Class | | | | | | | | | | | | | | | | | | | | | | | | | | | | | |
Six Months ended 3/31/17 (unaudited) | | $ | 3.21 | | | | (0.02 | ) | | | (0.06 | ) | | | (0.08 | ) | | | — | 4 | | | — | | | | — | | | | — | |
Year ended 9/30/1622 | | $ | 2.74 | | | | (0.01 | ) | | | 0.61 | | | | 0.60 | | | | — | 4 | | | — | | | | (0.13 | ) | | | (0.13 | ) |
Year ended 9/30/15 | | $ | 3.09 | | | | (0.01 | ) | | | (0.04 | ) | | | (0.05 | ) | | | — | 4 | | | — | | | | (0.30 | ) | | | (0.30 | ) |
Year ended 9/30/14 | | $ | 2.94 | | | | (0.01 | ) | | | 0.33 | | | | 0.32 | | | | — | 4 | | | — | | | | (0.17 | ) | | | (0.17 | ) |
Year ended 9/30/13 | | $ | 2.41 | | | | — | 4 | | | 0.53 | | | | 0.53 | | | | — | 4 | | | — | | | | — | | | | — | |
Year ended 9/30/12 | | $ | 2.24 | | | | — | 4 | | | 0.44 | | | | 0.44 | | | | — | 4 | | | — | | | | (0.27 | ) | | | (0.27 | ) |
International Opportunities Fund — Institutional Class | | | | | | | | | | | | | | | | | | | | | | | | | |
Six Months ended 3/31/17 (unaudited) | | $ | 3.23 | | | | (0.01 | ) | | | (0.07 | ) | | | (0.08 | ) | | | — | 4 | | | — | | | | — | | | | — | |
Period ended 9/30/1619 22 | | $ | 2.71 | | | | 0.01 | | | | 0.51 | | | | 0.52 | | | | — | 4 | | | — | | | | — | | | | — | |
Large Cap Value Fund — Investor Class | | | | | | | | | | | | | | | | | | | | | | | | | | | | | | | | |
Six Months ended 3/31/17 (unaudited) | | $ | 9.02 | | | | 0.09 | | | | 0.89 | | | | 0.98 | | | | — | 4 | | | (0.09 | ) | | | (0.32 | ) | | | (0.41 | ) |
Year ended 9/30/1622 | | $ | 8.84 | | | | 0.16 | | | | 1.01 | | | | 1.17 | | | | — | 4 | | | (0.16 | ) | | | (0.83 | ) | | | (0.99 | ) |
Year ended 9/30/15 | | $ | 12.69 | | | | 0.15 | | | | (0.69 | ) | | | (0.54 | ) | | | — | 4 | | | (0.16 | ) | | | (3.15 | ) | | | (3.31 | ) |
Year ended 9/30/14 | | $ | 16.57 | | | | 0.21 | | | | 1.49 | | | | 1.70 | | | | — | 4 | | | (0.22 | ) | | | (5.36 | ) | | | (5.58 | ) |
Year ended 9/30/13 | | $ | 14.31 | | | | 0.22 | | | | 2.37 | | | | 2.59 | | | | — | 4 | | | (0.20 | ) | | | (0.13 | ) | | | (0.33 | ) |
Year ended 9/30/12 | | $ | 11.85 | | | | 0.20 | | | | 2.46 | | | | 2.66 | | | | — | 4 | | | (0.20 | ) | | | — | | | | (0.20 | ) |
Large Cap Value Fund — Institutional Class | | | | | | | | | | | | | | | | | | | | | | | | | | | | | |
Six Months ended 3/31/17 (unaudited) | | $ | 9.01 | | | | 0.09 | | | | 0.88 | | | | 0.97 | | | | — | 4 | | | (0.09 | ) | | | (0.32 | ) | | | (0.41 | ) |
Year ended 9/30/1622 | | $ | 8.84 | | | | 0.29 | | | | 0.88 | | | | 1.17 | | | | — | 4 | | | (0.17 | ) | | | (0.83 | ) | | | (1.00 | ) |
Year ended 9/30/15 | | $ | 12.69 | | | | (0.04 | ) | | | (0.49 | ) | | | (0.53 | ) | | | — | 4 | | | (0.17 | ) | | | (3.15 | ) | | | (3.32 | ) |
Year ended 9/30/14 | | $ | 16.57 | | | | 0.20 | | | | 1.52 | | | | 1.72 | | | | — | 4 | | | (0.24 | ) | | | (5.36 | ) | | | (5.60 | ) |
Year ended 9/30/13 | | $ | 14.31 | | | | 0.22 | | | | 2.39 | | | | 2.61 | | | | — | 4 | | | (0.22 | ) | | | (0.13 | ) | | | (0.35 | ) |
Period ended 9/30/128 | | $ | 13.77 | | | | 0.12 | | | | 0.57 | | | | 0.69 | | | | — | 4 | | | (0.15 | ) | | | — | | | | (0.15 | ) |
Long/Short Fund — Investor Class | | | | | | | | | | | | | | | | | | | | | | | | | | | | | | | | |
Six Months ended 3/31/17 (unaudited) | | $ | 12.63 | | | | (0.04 | ) | | | 0.40 | | | | 0.36 | | | | — | 4 | | | — | | | | — | 4 | | | — | 4 |
Year ended 9/30/1622 | | $ | 12.36 | | | | (0.08 | ) | | | 1.60 | | | | 1.52 | | | | — | 4 | | | (0.01 | ) | | | (1.24 | ) | | | (1.25 | ) |
Year ended 9/30/15 | | $ | 16.29 | | | | 0.02 | | | | (3.00 | ) | | | (2.98 | ) | | | — | 4 | | | (0.14 | ) | | | (0.81 | ) | | | (0.95 | ) |
Year ended 9/30/14 | | $ | 15.82 | | | | 0.17 | | | | 0.65 | | | | 0.82 | | | | — | 4 | | | — | | | | (0.35 | ) | | | (0.35 | ) |
Year ended 9/30/13 | | $ | 13.66 | | | | (0.04 | ) | | | 2.23 | | | | 2.19 | | | | — | 4 | | | — | | | | (0.03 | ) | | | (0.03 | ) |
Year ended 9/30/12 | | $ | 11.85 | | | | (0.02 | ) | | | 1.83 | | | | 1.81 | | | | — | 4 | | | — | | | | — | | | | — | |
Long/Short Fund — Institutional Class | | | | | | | | | | | | | | | | | | | | | | | | | | | | | | | | |
Six Months ended 3/31/17 (unaudited) | | $ | 12.67 | | | | (0.02 | ) | | | 0.41 | | | | 0.39 | | | | — | 4 | | | — | | | | — | 4 | | | — | 4 |
Year ended 9/30/1622 | | $ | 12.38 | | | | 0.21 | | | | 1.33 | | | | 1.54 | | | | 0.02 | | | | (0.03 | ) | | | (1.24 | ) | | | (1.27 | ) |
Year ended 9/30/15 | | $ | 16.32 | | | | 0.06 | | | | (3.02 | ) | | | (2.96 | ) | | | — | 4 | | | (0.17 | ) | | | (0.81 | ) | | | (0.98 | ) |
Year ended 9/30/14 | | $ | 15.83 | | | | 0.18 | | | | 0.66 | | | | 0.84 | | | | — | 4 | | | — | | | | (0.35 | ) | | | (0.35 | ) |
Period ended 9/30/1313 | | $ | 13.80 | | | | (0.01 | ) | | | 2.07 | | | | 2.06 | | | | — | 4 | | | — | | | | (0.03 | ) | | | (0.03 | ) |
Micro Cap Fund | | | | | | | | | | | | | | | | | | | | | | | | | | | | | | | | |
Six Months ended 3/31/17 (unaudited) | | $ | 7.19 | | | | (0.04 | ) | | | 0.40 | | | | 0.36 | | | | — | 4 | | | (0.01 | ) | | | (0.60 | ) | | | (0.61 | ) |
Year ended 9/30/1622 | | $ | 7.21 | | | | (0.08 | ) | | | 1.15 | | | | 1.07 | | | | — | 4 | | | — | | | | (1.09 | ) | | | (1.09 | ) |
Year ended 9/30/15 | | $ | 7.36 | | | | (0.08 | )15 | | | 0.28 | | | | 0.20 | | | | — | 4 | | | — | 4 | | | (0.35 | ) | | | (0.35 | ) |
Year ended 9/30/14 | | $ | 7.42 | | | | (0.14 | ) | | | 0.08 | | | | (0.06 | ) | | | — | 4 | | | — | | | | — | | | | — | |
Year ended 9/30/13 | | $ | 5.71 | | | | (0.10 | ) | | | 1.81 | | | | 1.71 | | | | — | 4 | | | — | | | | — | | | | — | |
Year ended 9/30/12 | | $ | 4.40 | | | | (0.09 | ) | | | 1.40 | | | | 1.31 | | | | — | 4 | | | — | | | | — | | | | — | |
Micro Cap Value Fund | | | | | | | | | | | | | | | | | | | | | | | | | | | | | | | | |
Six Months ended 3/31/17 (unaudited) | | $ | 2.87 | | | | (0.01 | ) | | | 0.25 | | | | 0.24 | | | | — | 4 | | | — | 4 | | | (0.05 | ) | | | (0.05 | ) |
Year ended 9/30/1622 | | $ | 2.87 | | | | (0.02 | ) | | | 0.34 | | | | 0.32 | | | | — | 4 | | | — | | | | (0.32 | ) | | | (0.32 | ) |
Year ended 9/30/15 | | $ | 3.02 | | | | (0.02 | )16 | | | 0.31 | | | | 0.29 | | | | — | 4 | | | — | | | | (0.44 | ) | | | (0.44 | ) |
Year ended 9/30/14 | | $ | 3.45 | | | | (0.04 | ) | | | 0.18 | | | | 0.14 | | | | — | 4 | | | — | | | | (0.57 | ) | | | (0.57 | ) |
Year ended 9/30/13 | | $ | 2.85 | | | | (0.03 | ) | | | 0.91 | | | | 0.88 | | | | — | 4 | | | — | | | | (0.28 | ) | | | (0.28 | ) |
Year ended 9/30/12 | | $ | 2.24 | | | | (0.04 | ) | | | 0.65 | | | | 0.61 | | | | — | 4 | | | — | | | | — | | | | — | |
See Notes to Financial Highlights and Notes to Financial Statements.
110
| | |
| | (for a share outstanding throughout each period) (Unaudited) |
|
|
|
| | | | | | | | | | | | | | | | | | | | | | | | | | | | | | |
| | | | | | |
Ratios to Average Net Assets | | | Supplemental Data | |
Net Asset
Value
End of
Period | | | Total Return (%)1 | | | Expenses
Net of
Waivers and
Reimbursements (%)2 | | | Expenses
Before
Waivers and
Reimbursements (%)2 | | | Net Investment
Income Net of
Waivers and
Reimbursements (%)2 | | | Net Investment
Income Before
Waivers and
Reimbursements (%)2 | | | Net Assets
End of
Period
(000s) | | | Portfolio
Turnover
Rate1 3 | |
| | | | | | | | | | | | | | | | | | | | | | | | | | | | | | |
| $ | 29.15 | | | | (3.52 | ) | | | 1.48 | 5 | | | 1.48 | 5 | | | (0.72 | ) | | | (0.72 | ) | | $ | 814,710 | | | | 19% | |
| $ | 31.43 | | | | 12.73 | | | | 1.48 | 5 | | | 1.48 | 5 | | | (0.41 | ) | | | (0.41 | ) | | $ | 945,168 | | | | 50% | |
| $ | 27.88 | | | | 4.83 | | | | 1.50 | 5 | | | 1.50 | 5 | | | (0.32 | ) | | | (0.32 | ) | | $ | 1,316,095 | | | | 46% | |
| $ | 26.78 | | | | (4.53 | ) | | | 1.46 | 5 | | | 1.46 | 5 | | | (0.06 | ) | | | (0.06 | ) | | $ | 1,421,086 | | | | 42% | |
| $ | 28.76 | | | | 28.63 | | | | 1.49 | 5 | | | 1.49 | 5 | | | 0.25 | | | | 0.25 | | | $ | 1,326,931 | | | | 44% | |
| $ | 22.44 | | | | 30.39 | | | | 1.57 | 6 | | | 1.57 | 6 | | | 0.51 | | | | 0.51 | | | $ | 434,824 | | | | 44% | |
| | | | | | | | | | | | | | | | | | | | | | | | | | | | | | |
| $ | 29.17 | | | | (3.46 | ) | | | 1.35 | 5 | | | 1.37 | 5 | | | (0.58 | ) | | | (0.60 | ) | | $ | 528,636 | | | | 19% | |
| $ | 31.46 | | | | 10.54 | | | | 1.35 | 5 | | | 1.36 | 5 | | | 0.07 | | | | 0.06 | | | $ | 509,016 | | | | 50% | |
| | | | | | | | | | | | | | | | | | | | | | | | | | | | | | |
| $ | 3.13 | | | | (2.49 | ) | | | 2.26 | 6 | | | 2.27 | 6 | | | (1.36 | ) | | | (1.37 | ) | | $ | 459,212 | | | | 35% | |
| $ | 3.21 | | | | 22.73 | | | | 2.25 | 5 | | | 2.29 | 5 | | | (0.35 | ) | | | (0.39 | ) | | $ | 512,252 | | | | 41% | |
| $ | 2.74 | | | | (1.44 | ) | | | 2.25 | 5 | | | 2.43 | 5 | | | (0.36 | ) | | | (0.54 | ) | | $ | 453,495 | | | | 25% | |
| $ | 3.09 | | | | 11.53 | | | | 2.25 | 5 | | | 2.41 | 5 | | | (0.40 | ) | | | (0.56 | ) | | $ | 339,659 | | | | 38% | |
| $ | 2.94 | | | | 21.99 | | | | 2.25 | 5 | | | 2.42 | 5 | | | (0.03 | ) | | | (0.20 | ) | | $ | 278,216 | | | | 49% | |
| $ | 2.41 | | | | 22.33 | | | | 2.25 | 6 | | | 2.48 | 6 | | | (0.16 | ) | | | (0.39 | ) | | $ | 194,563 | | | | 41% | |
| | | | | | | | | | | | | | | | | | | | | | | | | | | | | | |
| $ | 3.15 | | | | (2.48 | ) | | | 1.96 | 6 | | | 2.04 | 6 | | | (1.01 | ) | | | (1.09 | ) | | $ | 195,520 | | | | 35% | |
| $ | 3.23 | | | | 19.19 | | | | 1.95 | 5 | | | 2.04 | 5 | | | 0.64 | | | | 0.55 | | | $ | 168,136 | | | | 41% | |
| | | | | | | | | | | | | | | | | | | | | | | | | | | | | | |
| $ | 9.59 | | | | 10.96 | | | | 1.10 | 5 | | | 1.17 | 5 | | | 1.95 | | | | 1.88 | | | $ | 185,315 | | | | 18% | |
| $ | 9.02 | | | | 13.92 | | | | 1.10 | 5 | | | 1.17 | 5 | | | 1.70 | | | | 1.63 | | | $ | 189,691 | | | | 26% | |
| $ | 8.84 | | | | (6.61 | ) | | | 1.10 | 5 | | | 1.12 | 5 | | | 1.34 | | | | 1.32 | | | $ | 244,056 | | | | 39% | |
| $ | 12.69 | | | | 11.78 | | | | 1.11 | 5 10 | | | 1.12 | 5 10 | | | 1.38 | | | | 1.37 | | | $ | 409,169 | | | | 53% | |
| $ | 16.57 | | | | 18.40 | | | | 1.10 | 5 | | | 1.16 | 5 | | | 1.27 | | | | 1.21 | | | $ | 786,910 | | | | 47% | |
| $ | 14.31 | | | | 22.50 | | | | 1.10 | 5 | | | 1.15 | 5 | | | 1.42 | | | | 1.37 | | | $ | 1,298,365 | | | | 14% | |
| | | | | | | | | | | | | | | | | | | | | | | | | | | | | | |
| $ | 9.57 | | | | 10.95 | | | | 0.95 | 5 | | | 1.82 | 5 | | | 1.97 | | | | 1.10 | | | $ | 2,646 | | | | 18% | |
| $ | 9.01 | | | | 13.97 | | | | 0.96 | 5 | | | 1.72 | 5 | | | 1.76 | | | | 1.00 | | | $ | 3,589 | | | | 26% | |
| $ | 8.84 | | | | (6.50 | ) | | | 0.98 | 5 | | | 1.44 | 5 | | | 1.40 | | | | 0.94 | | | $ | 1,525 | | | | 39% | |
| $ | 12.69 | | | | 11.95 | | | | 0.98 | 5 | | | 1.25 | 5 | | | 1.52 | | | | 1.25 | | | $ | 8,068 | | | | 53% | |
| $ | 16.57 | | | | 18.54 | | | | 0.98 | 5 | | | 1.35 | 5 | | | 1.37 | | | | 1.00 | | | $ | 15,444 | | | | 47% | |
| $ | 14.31 | | | | 5.02 | | | | 0.98 | 5 | | | 1.31 | 5 | | | 1.44 | | | | 1.11 | | | $ | 15,511 | | | | 14% | |
| | | | | | | | | | | | | | | | | | | | | | | | | | | | | | |
| $ | 12.99 | | | | 2.96 | | | | 2.27 | 6 7 | | | 2.27 | 6 7 | | | (0.50 | ) | | | (0.50 | ) | | $ | 120,054 | | | | 24% | |
| $ | 12.63 | | | | 13.38 | | | | 1.83 | 6 7 | | | 1.83 | 6 7 | | | (0.06 | ) | | | (0.06 | ) | | $ | 184,158 | | | | 47% | |
| $ | 12.36 | | | | (19.33 | ) | | | 1.61 | 7 | | | 1.61 | 7 | | | 0.12 | | | | 0.12 | | | $ | 616,192 | | | | 44% | |
| $ | 16.29 | | | | 5.21 | | | | 1.53 | 7 11 | | | 1.53 | 7 11 | | | 1.05 | | | | 1.05 | | | $ | 1,696,707 | | | | 47% | |
| $ | 15.82 | | | | 16.09 | | | | 1.51 | 7 | | | 1.51 | 7 | | | (0.22 | ) | | | (0.22 | ) | | $ | 1,479,371 | | | | 47% | |
| $ | 13.66 | | | | 15.27 | | | | 1.51 | 7 | | | 1.51 | 7 | | | (0.20 | ) | | | (0.20 | ) | | $ | 1,537,220 | | | | 71% | |
| | | | | | | | | | | | | | | | | | | | | | | | | | | | | | |
| $ | 13.06 | | | | 3.11 | | | | 1.95 | 6 7 | | | 2.05 | 6 7 | | | (0.19 | ) | | | (0.29 | ) | | $ | 54,338 | | | | 24% | |
| $ | 12.67 | | | | 13.71 | | | | 1.52 | 6 7 | | | 1.57 | 6 7 | | | 0.18 | | | | 0.13 | | | $ | 64,009 | | | | 47% | |
| $ | 12.38 | | | | (19.19 | ) | | | 1.47 | 7 | | | 1.47 | 7 | | | 0.25 | | | | 0.25 | | | $ | 408,792 | | | | 44% | |
| $ | 16.32 | | | | 5.33 | | | | 1.42 | 7 | | | 1.42 | 7 | | | 1.18 | | | | 1.18 | | | $ | 1,022,568 | | | | 47% | |
| $ | 15.83 | | | | 14.99 | | | | 1.39 | 7 | | | 1.40 | 7 | | | (0.16 | ) | | | (0.17 | ) | | $ | 824,780 | | | | 47% | |
| | | | | | | | | | | | | | | | | | | | | | | | | | | | | | |
| $ | 6.94 | | | | 5.49 | | | | 1.83 | 5 | | | 1.83 | 5 | | | (1.20 | ) | | | (1.20 | ) | | $ | 272,834 | | | | 10% | |
| $ | 7.19 | | | | 16.04 | | | | 1.92 | 5 | | | 1.92 | 5 | | | (1.14 | ) | | | (1.14 | ) | | $ | 277,691 | | | | 32% | |
| $ | 7.21 | | | | 2.45 | | | | 1.90 | 5 | | | 1.90 | 5 | | | (0.85 | )15 | | | (0.85 | )15 | | $ | 273,311 | | | | 31% | |
| $ | 7.36 | | | | (0.81 | ) | | | 1.97 | | | | 1.97 | | | | (1.67 | ) | | | (1.67 | ) | | $ | 293,815 | | | | 26% | |
| $ | 7.42 | | | | 29.95 | | | | 2.13 | 5 | | | 2.13 | 5 | | | (1.28 | ) | | | (1.28 | ) | | $ | 323,175 | | | | 17% | |
| $ | 5.71 | | | | 29.77 | | | | 2.14 | 5 | | | 2.14 | 5 | | | (1.50 | ) | | | (1.50 | ) | | $ | 289,449 | | | | 25% | |
| | | | | | | | | | | | | | | | | | | | | | | | | | | | | | |
| $ | 3.06 | | | | 8.41 | | | | 1.92 | 5 | | | 1.92 | 5 | | | (0.59 | ) | | | (0.59 | ) | | $ | 188,316 | | | | 33% | |
| $ | 2.87 | | | | 12.04 | | | | 1.95 | 5 | | | 2.04 | 5 | | | (0.59 | ) | | | (0.68 | ) | | $ | 179,116 | | | | 73% | |
| $ | 2.87 | | | | 9.99 | | | | 1.96 | 6 | | | 2.02 | 6 | | | (0.55 | )16 | | | (0.61 | )16 | | $ | 154,169 | | | | 53% | |
| $ | 3.02 | | | | 3.26 | | | | 2.03 | 5 | | | 2.09 | 5 | | | (1.31 | ) | | | (1.37 | ) | | $ | 158,800 | | | | 71% | |
| $ | 3.45 | | | | 33.92 | | | | 2.25 | 5 | | | 2.25 | 5 | | | (0.92 | ) | | | (0.92 | ) | | $ | 166,487 | | | | 66% | |
| $ | 2.85 | | | | 27.23 | | | | 2.25 | 5 | | | 2.31 | 5 | | | (1.27 | ) | | | (1.33 | ) | | $ | 138,299 | | | | 78% | |
111
Financial Highlights (continued)
| | | | | | | | | | | | | | | | | | | | | | | | | | | | | | | | |
| | | | | | Income (Loss) from
Investment Operations | | | | | | | | | Less Distributions | | | | |
| | | Net Asset
Value
Beginning
of Period | | | Net
Investment
Income (Loss) | | | Net Realized
and Unrealized
Gains (Losses)
on Investments | | | Total from
Investment
Operations | | | Redemption
Fees
(See Note 2) | | | Dividends
from Net
Investment
Income | | | Distributions
from Net
Realized
Gains | | | Total
Distributions | |
Small Cap Growth Fund — Investor Class | | | | | | | | | | | | | | | | | | | | | | | | | | | | | |
Six Months ended 3/31/17 (unaudited) | | $ | 43.52 | | | | (0.21 | ) | | | 2.11 | | | | 1.90 | | | | — | 4 | | | — | | | | (3.51 | ) | | | (3.51 | ) |
Year ended 9/30/1622 | | $ | 45.97 | | | | (0.47 | ) | | | 5.65 | | | | 5.18 | | | | — | 4 | | | — | | | | (7.63 | ) | | | (7.63 | ) |
Year ended 9/30/15 | | $ | 50.25 | | | | (0.40 | ) | | | 0.93 | | | | 0.53 | | | | — | 4 | | | — | | | | (4.81 | ) | | | (4.81 | ) |
Year ended 9/30/14 | | $ | 51.31 | | | | (0.41 | ) | | | 1.03 | | | | 0.62 | | | | — | 4 | | | — | | | | (1.68 | ) | | | (1.68 | ) |
Year ended 9/30/13 | | $ | 43.82 | | | | (0.15 | ) | | | 10.53 | | | | 10.38 | | | | — | 4 | | | — | | | | (2.89 | ) | | | (2.89 | ) |
Year ended 9/30/12 | | $ | 35.37 | | | | (0.29 | ) | | | 10.40 | | | | 10.11 | | | | — | 4 | | | — | | | | (1.66 | ) | | | (1.66 | ) |
Small Cap Growth Fund — Institutional Class | | | | | | | | | | | | | | | | | | | | | | | | | | | | | |
Six Months ended 3/31/17 (unaudited) | | $ | 43.58 | | | | — | 4 | | | 1.96 | | | | 1.96 | | | | — | 4 | | | — | | | | (3.51 | ) | | | (3.51 | ) |
Period ended 9/30/1619 22 | | $ | 37.58 | | | | (0.07 | ) | | | 6.07 | | | | 6.00 | | | | — | 4 | | | — | | | | — | | | | — | |
Small Cap Value Fund — Investor Class | | | | | | | | | | | | | | | | | | | | | | | | | | | | | |
Six Months ended 3/31/17 (unaudited) | | $ | 6.61 | | | | 0.01 | | | | 0.64 | | | | 0.65 | | | | — | 4 | | | (— | )4 | | | — | | | | (— | )4 |
Year ended 9/30/1622 | | $ | 5.86 | | | | 0.01 | | | | 0.77 | | | | 0.78 | | | | — | 4 | | | (0.03 | ) | | | — | | | | (0.03 | ) |
Year ended 9/30/15 | | $ | 5.69 | | | | 0.05 | 17 | | | 0.12 | | | | 0.17 | | | | — | 4 | | | — | | | | — | | | | — | |
Year ended 9/30/14 | | $ | 5.12 | | | | (0.02 | ) | | | 0.59 | | | | 0.57 | | | | — | 4 | | | — | | | | — | | | | — | |
Year ended 9/30/13 | | $ | 3.81 | | | | (0.01 | ) | | | 1.32 | | | | 1.31 | | | | — | 4 | | | — | | | | — | | | | — | |
Year ended 9/30/12 | | $ | 3.12 | | | | (0.03 | ) | | | 0.72 | | | | 0.69 | | | | — | 4 | | | — | | | | — | | | | — | |
Small Cap Value Fund — Institutional Class | | | | | | | | | | | | | | | | | | | | | | | | | | | | | |
Six Months ended 3/31/17 (unaudited) | | $ | 6.65 | | | | 0.01 | | | | 0.65 | | | | 0.66 | | | | — | 4 | | | (0.02 | ) | | | — | | | | (0.02 | ) |
Year ended 9/30/1622 | | $ | 5.88 | | | | 0.02 | | | | 0.78 | | | | 0.80 | | | | — | 4 | | | (0.03 | ) | | | — | | | | (0.03 | ) |
Year ended 9/30/15 | | $ | 5.72 | | | | 0.05 | 17 | | | 0.11 | | | | 0.16 | | | | — | 4 | | | — | | | | — | | | | — | |
Year ended 9/30/14 | | $ | 5.14 | | | | (0.03 | ) | | | 0.61 | | | | 0.58 | | | | — | | | | — | | | | — | | | | — | |
Year ended 9/30/13 | | $ | 3.82 | | | | (0.01 | ) | | | 1.33 | | | | 1.32 | | | | — | 4 | | | — | | | | — | | | | — | |
Period ended 9/30/128 | | $ | 3.68 | | | | (0.01 | ) | | | 0.15 | | | | 0.14 | | | | — | | | | — | | | | — | | | | — | |
Strategic Income Fund | | | | | | | | | | | | | | | | | | | | | | | | | | | | | |
Six Months ended 3/31/17 (unaudited) | | $ | 10.62 | | | | 0.11 | | | | 0.52 | | | | 0.63 | | | | — | 4 | | | (0.06 | ) | | | — | | | | (0.06 | ) |
Year ended 9/30/1622 | | $ | 10.49 | | | | 0.26 | | | | 0.49 | | | | 0.75 | | | | — | 4 | | | (0.27 | )20 | | | (0.35 | ) | | | (0.62 | ) |
Year ended 9/30/15 | | $ | 12.63 | | | | 0.30 | | | | (1.38 | ) | | | (1.08 | ) | | | — | 4 | | | (0.44 | ) | | | (0.62 | ) | | | (1.06 | ) |
Year ended 9/30/14 | | $ | 11.08 | | | | 0.32 | | | | 1.74 | | | | 2.06 | | | | — | 4 | | | (0.35 | ) | | | (0.16 | ) | | | (0.51 | ) |
Year ended 9/30/13 | | $ | 9.30 | | | | 0.33 | | | | 1.78 | | | | 2.11 | | | | — | 4 | | | (0.33 | ) | | | — | | | | (0.33 | ) |
Year ended 9/30/12 | | $ | 7.57 | | | | 0.16 | | | | 1.77 | | | | 1.93 | | | | — | 4 | | | (0.20 | ) | | | — | | | | (0.20 | ) |
Ultra Growth Fund | | | | | | | | | | | | | | | | | | | | | | | | | | | | | |
Six Months ended 3/31/17 (unaudited) | | $ | 19.89 | | | | (0.08 | ) | | | 0.97 | | | | 0.89 | | | | — | 4 | | | (0.11 | ) | | | (1.89 | ) | | | (2.00 | ) |
Year ended 9/30/1622 | | $ | 18.06 | | | | (0.18 | ) | | | 3.66 | | | | 3.48 | | | | — | 4 | | | — | | | | (1.65 | ) | | | (1.65 | ) |
Year ended 9/30/15 | | $ | 23.67 | | | | (0.26 | ) | | | 1.54 | | | | 1.28 | | | | — | 4 | | | (0.01 | ) | | | (6.88 | ) | | | (6.89 | ) |
Year ended 9/30/14 | | $ | 24.57 | | | | (0.06 | ) | | | 0.80 | | | | 0.74 | | | | — | 4 | | | — | | | | (1.64 | ) | | | (1.64 | ) |
Year ended 9/30/13 | | $ | 22.83 | | | | (0.15 | ) | | | 4.96 | | | | 4.81 | | | | — | 4 | | | — | | | | (3.07 | ) | | | (3.07 | ) |
Year ended 9/30/12 | | $ | 20.11 | | | | (0.08 | ) | | | 3.98 | | | | 3.90 | | | | — | 4 | | | — | | | | (1.18 | ) | | | (1.18 | ) |
World Innovators Fund — Investor Class | | | | | | | | | | | | | | | | | | | | | | | | | | | | | |
Six Months ended 3/31/17 (unaudited) | | $ | 19.32 | | | | (0.08 | ) | | | 1.20 | | | | 1.12 | | | | — | 4 | | | — | | | | (0.70 | ) | | | (0.70 | ) |
Year ended 9/30/1622 | | $ | 20.17 | | | | (0.12 | ) | | | 1.90 | | | | 1.78 | | | | — | 4 | | | — | | | | (2.63 | ) | | | (2.63 | ) |
Year ended 9/30/15 | | $ | 22.62 | | | | (0.21 | ) | | | 0.30 | | | | 0.09 | | | | — | 4 | | | — | | | | (2.54 | ) | | | (2.54 | ) |
Year ended 9/30/14 | | $ | 23.15 | | | | (0.24 | ) | | | 0.91 | | | | 0.67 | | | | — | 4 | | | — | | | | (1.20 | ) | | | (1.20 | ) |
Year ended 9/30/13 | | $ | 18.55 | | | | (0.12 | ) | | | 4.72 | | | | 4.60 | | | | — | 4 | | | — | | | | — | | | | — | |
Year ended 9/30/12 | | $ | 14.71 | | | | (0.12 | ) | | | 3.96 | | | | 3.84 | | | | — | 4 | | | — | | | | — | | | | — | |
World Innovators Fund — Institutional Class | | | | | | | | | | | | | | | | | | | | | | | | | | | | | |
Six Months ended 3/31/17 (unaudited) | | $ | 19.36 | | | | (0.04 | ) | | | 1.19 | | | | 1.15 | | | | — | | | | — | | | | (0.70 | ) | | | (0.70 | ) |
Period ended 9/30/1619 22 | | $ | 17.54 | | | | (— | )4 | | | 1.82 | | | | 1.82 | | | | — | | | | — | | | | — | | | | — | |
Income Fund | | | | | | | | | | | | | | | | | | | | | | | | | | | | | |
Six Months ended 3/31/17 (unaudited) | | $ | 10.25 | | | | 0.09 | | | | (0.17 | ) | | | (0.08 | ) | | | — | 4 | | | (0.09 | ) | | | (0.01 | ) | | | (0.10 | ) |
Year ended 9/30/1622 | | $ | 10.18 | | | | 0.19 | | | | 0.07 | | | | 0.26 | | | | — | 4 | | | (0.19 | ) | | | — | | | | (0.19 | ) |
Year ended 9/30/15 | | $ | 10.15 | | | | 0.16 | | | | 0.03 | | | | 0.19 | | | | — | 4 | | | (0.16 | ) | | | — | | | | (0.16 | ) |
Year ended 9/30/14 | | $ | 10.13 | | | | 0.17 | | | | 0.02 | | | | 0.19 | | | | — | 4 | | | (0.17 | ) | | | — | | | | (0.17 | ) |
Year ended 9/30/13 | | $ | 10.44 | | | | 0.17 | | | | (0.31 | ) | | | (0.14 | ) | | | — | | | | (0.17 | ) | | | — | | | | (0.17 | ) |
Year ended 9/30/12 | | $ | 10.32 | | | | 0.20 | | | | 0.12 | | | | 0.32 | | | | — | 4 | | | (0.20 | ) | | | — | | | | (0.20 | ) |
U.S. Treasury Fund | | | | | | | | | | | | | | | | | | | | | | | | | | | | | |
Six Months ended 3/31/17 (unaudited) | | $ | 19.86 | | | | 0.18 | | | | (2.92 | ) | | | (2.74 | ) | | | 0.01 | | | | (0.18 | ) | | | (1.32 | ) | | | (1.50 | ) |
Year ended 9/30/1622 | | $ | 18.42 | | | | 0.37 | | | | 2.29 | | | | 2.66 | | | | 0.01 | | | | (0.36 | ) | | | (0.87 | ) | | | (1.23 | ) |
Year ended 9/30/15 | | $ | 17.08 | | | | 0.38 | | | | 1.33 | | | | 1.71 | | | | 0.01 | | | | (0.38 | ) | | | — | | | | (0.38 | ) |
Year ended 9/30/14 | | $ | 15.33 | | | | 0.45 | | | | 1.75 | | | | 2.20 | | | | — | 4 | | | (0.45 | ) | | | — | | | | (0.45 | ) |
Year ended 9/30/13 | | $ | 18.75 | | | | 0.44 | | | | (3.08 | ) | | | (2.64 | ) | | | 0.01 | | | | (0.44 | ) | | | (0.35 | ) | | | (0.79 | ) |
Year ended 9/30/12 | | $ | 18.75 | | | | 0.42 | | | | 0.77 | | | | 1.19 | | | | 0.01 | | | | (0.42 | ) | | | (0.78 | ) | | | (1.20 | ) |
See Notes to Financial Highlights and Notes to Financial Statements.
112
| | |
| | (for a share outstanding throughout each period) (Unaudited) |
|
|
|
| | | | | | | | | | | | | | | | | | | | | | | | | | | | | | |
| | | | | | |
Ratios to Average Net Assets | | | Supplemental Data | |
Net Asset
Value
End of
Period | | | Total Return (%)1 | | | Expenses
Net of
Waivers and
Reimbursements (%)2 | | | Expenses
Before
Waivers and
Reimbursements (%)2 | | | Net Investment
Income Net of
Waivers and
Reimbursements (%)2 | | | Net Investment
Income Before
Waivers and
Reimbursements (%)2 | | | Net Assets
End of
Period
(000s) | | | Portfolio
Turnover
Rate1 3 | |
| | | | | | | | | | | | | | | | | | | | | | | | | | | | | | |
| | $41.91 | | | | 4.77 | | | | 1.31 | 6 | | | 1.31 | 6 | | | (0.75 | ) | | | (0.75 | ) | | $ | 1,283,700 | | | | 9% | |
| | $43.52 | | | | 11.87 | | | | 1.29 | 5 | | | 1.29 | 5 | | | (0.79 | ) | | | (0.79 | ) | | $ | 1,544,796 | | | | 20% | |
| | $45.97 | | | | 0.39 | | | | 1.22 | 5 | | | 1.22 | 5 | | | (0.75 | ) | | | (0.75 | ) | | $ | 2,000,588 | | | | 31% | |
| | $50.25 | | | | 1.09 | | | | 1.21 | 5 | | | 1.21 | 5 | | | (0.75 | ) | | | (0.75 | ) | | $ | 2,219,638 | | | | 23% | |
| | $51.31 | | | | 25.34 | | | | 1.23 | 5 | | | 1.23 | 5 | | | (0.42 | ) | | | (0.42 | ) | | $ | 2,487,031 | | | | 10% | |
| | $43.82 | | | | 29.41 | | | | 1.24 | 5 | | | 1.24 | 5 | | | (0.73 | ) | | | (0.73 | ) | | $ | 1,824,781 | | | | 20% | |
| | | | | | | | | | | | | | | | | | | | | | | | | | | | | | |
| | $42.03 | | | | 4.91 | | | | 1.06 | 6 | | | 1.10 | 6 | | | (0.44 | ) | | | (0.48 | ) | | $ | 444,991 | | | | 9% | |
| | $43.58 | | | | 15.97 | | | | 1.05 | 5 | | | 1.11 | 5 | | | (0.63 | ) | | | (0.69 | ) | | $ | 337,605 | | | | 20% | |
| | | | | | | | | | | | | | | | | | | | | | | | | | | | | | |
| | $ 7.26 | | | | 9.91 | | | | 1.22 | 5 | | | 1.22 | 5 | | | 0.33 | | | | 0.33 | | | $ | 301,728 | | | | 18% | |
| | $ 6.61 | | | | 13.37 | | | | 1.24 | 5 | | | 1.24 | 5 | | | 0.23 | | | | 0.23 | | | $ | 269,710 | | | | 57% | |
| | $ 5.86 | | | | 2.99 | | | | 1.21 | 5 | | | 1.21 | 5 | | | 0.82 | 17 | | | 0.82 | 17 | | $ | 257,655 | | | | 57% | |
| | $ 5.69 | | | | 11.13 | | | | 1.20 | 5 | | | 1.20 | 5 | | | (0.52 | ) | | | (0.52 | ) | | $ | 265,521 | | | | 50% | |
| | $ 5.12 | | | | 34.38 | | | | 1.26 | 5 | | | 1.27 | 5 | | | (0.21 | ) | | | (0.22 | ) | | $ | 201,581 | | | | 40% | |
| | $ 3.81 | | | | 22.12 | | | | 1.46 | 5 | | | 1.46 | 5 | | | (0.73 | ) | | | (0.73 | ) | | $ | 166,330 | | | | 55% | |
| | | | | | | | | | | | | | | | | | | | | | | | | | | | | | |
| | $ 7.29 | | | | 9.88 | | | | 1.05 | 5 | | | 1.14 | 5 | | | 0.53 | | | | 0.44 | | | $ | 39,474 | | | | 18% | |
| | $ 6.65 | | | | 13.54 | | | | 1.08 | 5 | | | 1.20 | 5 | | | 0.40 | | | | 0.28 | | | $ | 23,839 | | | | 57% | |
| | $ 5.88 | | | | 2.97 | | | | 1.15 | 5 | | | 1.20 | 5 | | | 0.92 | 17 | | | 0.87 | 17 | | $ | 18,941 | | | | 57% | |
| | $ 5.72 | | | | 11.28 | | | | 1.15 | 5 | | | 1.44 | 5 | | | (0.49 | ) | | | (0.78 | ) | | $ | 10,436 | | | | 50% | |
| | $ 5.14 | | | | 34.55 | | | | 1.15 | 5 | | | 1.46 | 5 | | | (0.11 | ) | | | (0.42 | ) | | $ | 9,359 | | | | 40% | |
| | $ 3.82 | | | | 3.80 | | | | 1.15 | 5 | | | 1.66 | 5 | | | (0.42 | ) | | | (0.93 | ) | | $ | 7,243 | | | | 55% | |
| | | | | | | | | | | | | | | | | | | | | | | | | | | | | | |
| | $11.19 | | | | 6.00 | | | | 0.95 | 5 | | | 1.09 | 5 | | | 2.01 | | | | 1.87 | | | $ | 48,529 | | | | 20% | |
| | $10.62 | | | | 7.38 | | | | 0.95 | 5 | | | 1.04 | 5 | | | 2.50 | | | | 2.41 | | | $ | 55,112 | | | | 45% | |
| | $10.49 | | | | (9.54 | ) | | | 0.95 | 5 | | | 0.95 | 5 | | | 2.51 | | | | 2.51 | | | $ | 88,661 | | | | 78% | |
| | $12.63 | | | | 18.94 | | | | 0.95 | 5 | | | 0.96 | 5 | | | 2.59 | | | | 2.58 | | | $ | 94,958 | | | | 69% | |
| | $11.08 | | | | 23.01 | | | | 0.95 | 5 | | | 1.06 | 5 | | | 3.16 | | | | 3.05 | | | $ | 66,579 | | | | 54% | |
| | $ 9.30 | | | | 25.61 | | | | 0.95 | 5 | | | 1.14 | 5 | | | 1.74 | | | | 1.55 | | | $ | 44,635 | | | | 57% | |
| | | | | | | | | | | | | | | | | | | | | | | | | | | | | | |
| | $18.78 | | | | 5.16 | | | | 1.31 | 5 | | | 1.31 | 5 | | | (1.03 | ) | | | (1.03 | ) | | $ | 99,276 | | | | 20% | |
| | $19.89 | | | | 20.08 | | | | 1.33 | 5 | | | 1.33 | 5 | | | (1.03 | ) | | | (1.03 | ) | | $ | 101,402 | | | | 28% | |
| | $18.06 | | | | 4.02 | | | | 1.31 | 5 | | | 1.31 | 5 | | | (1.06 | ) | | | (1.06 | ) | | $ | 96,015 | | | | 38% | |
| | $23.67 | | | | 2.66 | | | | 1.26 | 5 | | | 1.26 | 5 | | | (1.00 | ) | | | (1.00 | ) | | $ | 102,834 | | | | 38% | |
| | $24.57 | | | | 24.52 | | | | 1.29 | 5 | | | 1.29 | 5 | | | (0.64 | ) | | | (0.64 | ) | | $ | 151,697 | | | | 25% | |
| | $22.83 | | | | 20.13 | | | | 1.32 | 5 | | | 1.32 | 5 | | | (0.35 | ) | | | (0.35 | ) | | $ | 143,259 | | | | 43% | |
| | | | | | | | | | | | | | | | | | | | | | | | | | | | | | |
| | $19.74 | | | | 6.06 | | | | 1.83 | 5 | | | 1.83 | 5 | | | (0.74 | ) | | | (0.74 | ) | | $ | 172,382 | | | | 51% | |
| | $19.32 | | | | 8.97 | | | | 1.78 | 5 | | | 1.78 | 5 | | | (0.66 | ) | | | (0.66 | ) | | $ | 193,826 | | | | 112% | |
| | $20.17 | | | | 0.32 | | | | 1.76 | 5 | | | 1.76 | 5 | | | (0.76 | ) | | | (0.76 | ) | | $ | 186,272 | | | | 100% | |
| | $22.62 | | | | 2.69 | | | | 1.73 | 5 | | | 1.73 | 5 | | | (0.89 | ) | | | (0.89 | ) | | $ | 253,311 | | | | 111% | |
| | $23.15 | | | | 24.80 | | | | 1.77 | 5 | | | 1.79 | 5 | | | (0.84 | ) | | | (0.86 | ) | | $ | 266,911 | | | | 84% | |
| | $18.55 | | | | 26.10 | | | | 1.85 | 5 | | | 1.85 | 5 | | | (0.99 | ) | | | (0.99 | ) | | $ | 167,934 | | | | 66% | |
| | | | | | | | | | | | | | | | | | | | | | | | | | | | | | |
| | $19.81 | | | | 6.20 | | | | 1.55 | 5 | | | 2.10 | 5 | | | (0.40 | ) | | | (0.95 | ) | | $ | 6,272 | | | | 51% | |
| | $19.36 | | | | 10.38 | | | | 1.55 | 5 | | | 3.69 | 5 | | | (0.01 | ) | | | (2.15 | ) | | $ | 5,977 | | | | 112% | |
| | | | | | | | | | | | | | | | | | | | | | | | | | | | | | |
| | $10.07 | | | | (0.76 | ) | | | 0.74 | 5 | | | 0.74 | 5 | | | 1.77 | | | | 1.77 | | | $ | 99,154 | | | | 39% | |
| | $10.25 | | | | 2.58 | | | | 0.73 | 5 | | | 0.73 | 5 | | | 1.85 | | | | 1.85 | | | $ | 99,706 | | | | 37% | |
| | $10.18 | | | | 1.87 | | | | 0.72 | 5 | | | 0.72 | 5 | | | 1.57 | | | | 1.57 | | | $ | 108,959 | | | | 44% | |
| | $10.15 | | | | 1.91 | | | | 0.70 | 5 | | | 0.70 | 5 | | | 1.66 | | | | 1.66 | | | $ | 116,752 | | | | 13% | |
| | $10.13 | | | | (1.34 | ) | | | 0.71 | | | | 0.71 | | | | 1.67 | | | | 1.67 | | | $ | 130,285 | | | | 35% | |
| | $10.44 | | | | 3.16 | | | | 0.70 | 5 | | | 0.70 | 5 | | | 1.97 | | | | 1.97 | | | $ | 139,186 | | | | 48% | |
| | | | | | | | | | | | | | | | | | | | | | | | | | | | | | |
| | $15.63 | | | | (13.60 | ) | | | 0.75 | 5 | | | 0.75 | 5 | | | 2.00 | | | | 2.00 | | | $ | 302,194 | | | | 6% | |
| | $19.86 | | | | 15.49 | | | | 0.69 | 5 21 | | | 0.73 | 5 | | | 1.97 | 21 | | | 1.93 | | | $ | 489,011 | | | | 59% | |
| | $18.42 | | | | 10.09 | | | | 0.67 | 5 | | | 0.67 | 5 | | | 2.12 | | | | 2.12 | | | $ | 327,861 | | | | 131% | |
| | $17.08 | | | | 14.54 | | | | 0.70 | 5 | | | 0.70 | 5 | | | 2.77 | | | | 2.77 | | | $ | 224,664 | | | | 28% | |
| | $15.33 | | | | (14.43 | ) | | | 0.71 | 5 | | | 0.71 | 5 | | | 2.46 | | | | 2.46 | | | $ | 193,231 | | | | 34% | |
| | $18.75 | | | | 6.66 | | | | 0.72 | 5 | | | 0.72 | 5 | | | 2.33 | | | | 2.33 | | | $ | 271,495 | | | | 13% | |
113
Notes to Financial Highlights
| 1 | Not annualized for periods less than one year. |
| 2 | Annualized for periods less than one year. |
| 3 | Portfolio turnover is calculated on the basis of the Fund as a whole without distinguishing between the classes of shares issued. |
| 4 | Represents amounts less than $0.005 per share. |
| 5 | Includes interest expense of less than 0.005%. |
| 6 | Includes interest expenses of more than 0.005%. |
| 7 | Includes interest expense and dividend payments for securities sold short. The ratios excluding such expenses are listed below: |
| | | | | | | | | | | | |
| | | Expenses Net of
Waivers and
Reimbursements2 | | Expenses Before
Waivers and
Reimbursements2 | | |
Long/Short Fund — Investor Class | | | | | | | | | | | | |
Six Months ended 3/31/17 (unaudited) | | | | 1.47 | % | | | | 1.47 | % | | |
Year ended 9/30/1622 | | | | 1.42 | % | | | | 1.42 | % | | |
Year ended 9/30/15 | | | | 1.30 | % | | | | 1.30 | % | | |
Year ended 9/30/14 | | | | 1.27 | % | | | | 1.27 | % | | |
Year ended 9/30/13 | | | | 1.28 | % | | | | 1.28 | % | | |
Year ended 9/30/12 | | | | 1.27 | % | | | | 1.27 | % | | |
| | | |
Long/Short Fund — Institutional Class | | | | | | | | | | | | |
Six Months ended 3/31/17 (unaudited) | | | | 1.15 | % | | | | 1.25 | % | | |
Year ended 9/30/1622 | | | | 1.17 | % | | | | 1.22 | % | | |
Year ended 9/30/15 | | | | 1.16 | % | | | | 1.16 | % | | |
Year ended 9/30/14 | | | | 1.16 | % | | | | 1.16 | % | | |
Period ended 9/30/1313 | | | | 1.17 | % | | | | 1.18 | % | | |
8 Institutional class inception date was January 31, 2012. 9 Fund inception date was January 31, 2012. 10 Includes extraordinary expenses of 0.01% (see Note 7). 11 Includes extraordinary expenses of less than 0.01% (see Note 7). 12 Fund inception date was December 13, 2012. 13 Institutional class inception date was December 13, 2012. 14 Investment income per share reflects a large, non-recurring dividend which amounted to $0.17 and $0.08 per share for the Investor Class and Institutional Class, respectively. Excluding this non-recurring dividend, income (loss) to average net assets would have been as follows: |
| | | |
| | | Net Investment
Income (Loss) Net
of Waivers and
Reimbursements | | Net Investment
Income (Loss)
Before
Waivers and
Reimbursements | | |
Core Growth Fund — Investor Class | | | | (0.58 | )% | | | | (0.58 | )% | | |
Core Growth Fund — Institutional Class | | | | (0.59 | )% | | | | (0.60 | )% | | |
15 Investment income per share reflects a large, non-recurring dividend which amounted to $0.04 per share. Excluding this non-recurring dividend, the ratio of net investment income (loss) to average net assets would have been (1.40)%. 16 Investment income per share reflects a large, non-recurring dividend which amounted to $0.01 per share. Excluding this non-recurring dividend, the ratio of net investment income (loss) to average net assets would have been (1.04)% for Net Investment Income Net of Waivers and Reimbursements and (1.10)% for Net Investment Income Before Waivers and Reimbursements. 17 Investment income per share reflects a large, non-recurring dividend which amounted to $0.05 and $0.05 per share for the Investor Class and Institutional Class, respectively. Excluding this non-recurring dividend, the ratio of net investment income (loss) to average net assets would have been as follows: |
| | | | | | | | | | | | |
| | | |
| | | Net Investment
Income (Loss) Net
of Waivers and
Reimbursements | | Net Investment
Income (Loss)
Before
Waivers and
Reimbursements | | |
Small Cap Value Fund — Investor Class | | | | (0.00 | )%18 | | | | (0.00 | )%18 | | |
Small Cap Value Fund — Institutional Class | | | | 0.10 | % | | | | 0.05 | % | | |
18 Amount is less than 0.005%. 19Institutional class inception date was February 1, 2016. 20Dividends from net investment income include a return of capital distribution, which amounted to $0.04 per share. 21Includes reimbursement by Hoisington Investment Management Co., the Sub-Advisor, for proxy statement expenses which amounted to $0.01 per share. |
114
| | |
| | MARCH 31, 2017 (UNAUDITED) |
|
|
|
| | | | | | | | | | | | |
22Includes a non-recurring offer to reimburse prior period custody and fund accounting out-of-pocket expenses (see Note 7 “Custodian Out-of-Pocket Expense Reimbursement”). Excluding this non-recurring reimbursement, the ratio of expenses to average net assets would have been as follows: |
| | | |
| | | Expenses Net of
Waivers and
Reimbursements
(%) | | Expenses Before
Waivers and
Reimbursements
(%) | | |
Core Growth Fund — Investor Class | | | | 1.21 | | | | | 1.21 | | | |
Core Growth Fund — Institutional Class | | | | 1.07 | | | | | 1.09 | | | |
Emerging India Fund — Investor Class | | | | 1.84 | | | | | 1.98 | | | |
Emerging India Fund — Institutional Class | | | | 1.56 | | | | | 2.06 | | | |
Emerging Markets Select Fund — Investor Class | | | | 1.60 | | | | | 2.00 | | | |
Emerging Markets Select Fund — Institutional Class | | | | 1.33 | | | | | 1.63 | | | |
Emerging Markets Small Cap Fund — Investor Class | | | | 1.97 | | | | | 2.01 | | | |
Emerging Markets Small Cap Fund — Institutional Class | | | | 1.82 | | | | | 1.83 | | | |
Frontier Emerging Small Countries Fund — Investor Class | | | | 2.25 | | | | | 2.39 | | | |
Frontier Emerging Small Countries Fund — Institutional Class | | | | 2.08 | | | | | 2.08 | | | |
Global Opportunities Fund — Investor Class | | | | 1.64 | | | | | 1.64 | | | |
Global Opportunities Fund — Institutional Class | | | | 1.42 | | | | | 2.39 | | | |
International Growth Fund — Investor Class | | | | 1.48 | | | | | 1.48 | | | |
International Growth Fund — Institutional Class | | | | 1.36 | | | | | 1.37 | | | |
International Opportunities Fund — Investor Class | | | | 2.26 | | | | | 2.30 | | | |
International Opportunities Fund — Institutional Class | | | | 1.97 | | | | | 2.06 | | | |
Large Cap Value Fund — Investor Class | | | | 1.10 | | | | | 1.17 | | | |
Large Cap Value Fund — Institutional Class | | | | 0.96 | | | | | 1.72 | | | |
Long/Short Fund — Investor Class | | | | 1.83 | | | | | 1.83 | | | |
Long/Short Fund — Institutional Class | | | | 1.52 | | | | | 1.57 | | | |
Micro Cap Fund | | | | 1.92 | | | | | 1.92 | | | |
Micro Cap Value Fund | | | | 1.96 | | | | | 2.05 | | | |
Small Cap Growth Fund — Investor Class | | | | 1.29 | | | | | 1.29 | | | |
Small Cap Growth Fund — Institutional Class | | | | 1.05 | | | | | 1.11 | | | |
Small Cap Value Fund — Investor Class | | | | 1.24 | | | | | 1.24 | | | |
Small Cap Value Fund — Institutional Class | | | | 1.08 | | | | | 1.20 | | | |
Strategic Income Fund | | | | 0.95 | | | | | 1.04 | | | |
Ultra Growth Fund | | | | 1.34 | | | | | 1.34 | | | |
World Innovators Fund — Investor Class | | | | 1.79 | | | | | 1.79 | | | |
World Innovators Fund — Institutional Class | | | | 1.63 | | | | | 3.77 | | | |
Income Fund | | | | 0.73 | | | | | 0.73 | | | |
U.S. Treasury Fund | | | | 0.69 | | | | | 0.73 | | | |
See Notes to Financial Statements.
115
Notes to Financial Statements
1. ORGANIZATION
Wasatch Funds Trust (the “Trust”) is a Massachusetts business trust registered under the Investment Company Act of 1940, as amended (the “1940 Act”), as an open-end management investment company and consists of 19 series or funds (each a “Fund” and collectively the “Funds”). The Core Growth Fund, Emerging India Fund, Emerging Markets Select Fund, Emerging Markets Small Cap Fund, Frontier Emerging Small Countries Fund, Global Opportunities Fund, International Growth Fund, International Opportunities Fund, Large Cap Value Fund, Long/Short Fund, Micro Cap Fund, Micro Cap Value Fund, Small Cap Growth Fund, Small Cap Value Fund, Strategic Income Fund, Ultra Growth Fund, World Innovators Fund, Wasatch-1st Source Income Fund (“Income Fund”) (sub-advised), and Wasatch-Hoisington U.S. Treasury Fund (“U.S. Treasury Fund”) (sub-advised) are each diversified funds. Each Fund maintains its own investment objective(s).
On November 9, 2011, the Trust re-designated the shares of the Funds into Investor Class shares effective January 31, 2012, and authorized and designated a new Institutional Class of shares in the Funds. Currently 13 funds offer Institutional Class shares: Core Growth Fund, Large Cap Value Fund and Small Cap Value Fund, which commenced operations on January 31, 2012, Emerging Markets Select Fund and Long/Short Fund, which commenced operations on December 13, 2012 and Emerging India Fund, Emerging Markets Small Cap Fund, Frontier Emerging Small Countries Fund, Global Opportunities Fund, International Growth Fund, International Opportunities Fund, Small Cap Growth Fund and World Innovators Fund, which commenced operations on February 1, 2016. Each class of shares for each Fund has identical rights and privileges except with respect to purchase minimums, distribution and service charges, shareholder services, voting rights on matters affecting a single class of shares, and the exchange and conversion features. The Funds have entered into an investment advisory agreement with Wasatch Advisors, Inc. (the “Advisor” or “Wasatch”) as investment advisor.
The Core Growth, Emerging India, Emerging Markets Select, Emerging Markets Small Cap, Frontier Emerging Small Countries, Global Opportunities, International Growth, International Opportunities, Large Cap Value, Long/Short, Micro Cap, Micro Cap Value, Small Cap Growth, Small Cap Value, Strategic Income, Ultra Growth and World Innovators Funds are referred to herein as the “Equity Funds.”
2. SIGNIFICANT ACCOUNTING POLICIES
The following is a summary of significant policies related to investments of the Funds held at March 31, 2017. These policies are in conformity with accounting principles generally accepted in the United States of America (“U.S. GAAP”).
Valuation of Securities — All investments in securities are recorded at their estimated fair value as described in Note 13.
Foreign Currency Translations — Values of investments denominated in foreign currencies are converted into U.S. dollars using the current exchange rates each business day (generally 4:00 p.m. Eastern Time). Purchases and sales of investments and dividend income are translated into U.S. dollars using the current prevailing exchange rate on the transaction date. The effect of changes in foreign exchange rates on realized and unrealized gains or losses on securities is reflected as a component of such gains or losses. Transactions in foreign denominated assets may involve greater risks than domestic transactions.
Investment in Securities and Related Investment Income — Security transactions are accounted for on the trade date. Gains or losses on securities sold are determined on the identified cost basis. Dividend income and distributions to shareholders are recorded on the ex-dividend date except that certain dividends from foreign securities may be recorded after the ex-dividend date based on when the Fund is informed of the dividend. Interest income and estimated expenses are accrued daily. Bond discount and premiums are amortized using the interest method. To the extent dividends received include return of capital or capital gain distributions, such distributions are recorded as a reduction to cost of the related security or as realized gain or loss.
Expenses — The Funds contract for various services on a collective basis. Most expenses are directly attributable to each Fund and therefore are charged accordingly. Expenses that are not directly attributable to one or more Funds are allocated among applicable Funds on an equitable and consistent basis considering such things as the nature and type of expense and the relative net assets of the Funds.
Use of Management Estimates — The preparation of financial statements in conformity with U.S. GAAP requires management to make estimates and assumptions that affect the reported amounts of assets and liabilities at the date of the financial statements and the reported changes in net assets during the reporting period. Actual results could differ from those estimates.
Guarantees and Indemnifications — In the normal course of business, the Funds enter into contracts that contain a variety of representations and warranties which provide general indemnifications. The maximum exposure under these arrangements is unknown, as this would involve future claims that may be made against the Funds and/or their affiliates that have not yet occurred. Based on experience, however, the risk of loss is expected to be remote.
Redemption Fees — The Funds deduct a fee of 2.00% from redemption proceeds on shares of the Funds held 60 days or less. Redemption fees retained by the Funds are credited to additional paid-in capital.
New Accounting Pronouncements — In December 2016, the Financial Accounting Standards Board (“FASB”) issued Accounting Standards Update 2016-19 — Technical Corrections and Improvements (“ASU 2016-19”), which is effective for interim periods for all entities beginning after December 15, 2016. ASU 2016-19 includes an amendment to Topic 820, Fair Value Measurement, which clarifies the difference between a valuation approach and a valuation technique when applying the guidance in Topic 820. That
116
| | |
| | MARCH 31, 2017 (UNAUDITED) |
|
|
|
amendment also requires an entity to disclose when there has been a change in either or both a valuation approach and/or a valuation technique. The transition guidance for the amendment must be applied prospectively because it could potentially involve the use of hindsight that includes fair value measurements. Although still evaluating the potential impacts of ASU 2016-19 to the Funds, management expects that the impact of the Funds’ adoption will be limited to additional financial statement disclosures.
In October 2016, the Securities and Exchange Commission (“SEC”) issued a new rule, Investment Company Reporting Modernization, which, among other provisions, amends Regulation S-X to require standardized, enhanced disclosures, particularly related to derivatives, in investment company financial statements. Compliance with the guidance is effective for financial statements filed with the SEC on or after August 1, 2017; adoption will have no effect on the Funds’ net assets or results of operations. Although still evaluating the potential impacts of the Investment Company Reporting Modernization rule on the Funds, management expects that the impact of the Funds’ adoption will be limited to additional financial statement disclosures.
Other — Income, expenses, and realized and unrealized gains or losses on investments are generally allocated to each class of shares based on its relative net assets, except that each class separately bears expenses related specifically to that class, such as certain shareholder servicing fees.
3. SECURITIESAND OTHER INVESTMENTS
Repurchase Agreements — The Funds may engage in repurchase transactions. Under the terms of a typical repurchase agreement, a fund takes possession of an underlying debt obligation subject to an obligation of the seller to repurchase and the fund to resell the obligation at an agreed upon price and time. The market value of the collateral must be at least equal at all times to the total amount of the repurchase obligation, including interest. Generally, in the event of counterparty default, the fund has the right to use the collateral to offset losses incurred. Refer to Note 14 (Offsetting) for more information about the offsetting of assets and liabilities.
Short Sales — The Long/Short Fund and to a lesser extent the other Equity Funds may enter into short sales whereby a fund sells a security it generally does not own (the security is borrowed), in anticipation of a decline in the security’s price. The initial amount of a short sale is recorded as a liability which is marked-to-market daily. Fluctuations in the value of the short liability are recorded as unrealized gains or losses. If a Fund shorts a security when also holding a long position in the security (a “short against the box”), as the security’s price declines, the short position increases in value, offsetting the long position’s decrease in value. The opposite effect occurs if the security’s price rises. A Fund realizes a gain or loss upon closing of the short sale (returning the security to the counterparty by way of purchase or delivery of a long position owned). Possible losses from short sales may be unlimited, whereas losses from security purchases cannot exceed the total amount invested. The
Funds are liable to the buyer for any dividends payable on securities while those securities are in a short position. These dividends are an expense of the Funds. The Funds designate collateral consisting of cash, U.S. government securities or other liquid assets sufficient to collateralize the market value of short positions. Refer to Note 14 (Offsetting) for more information about the offsetting of assets and liabilities.
Participation Notes — The Frontier Emerging Small Countries and the Global Opportunities Funds may invest in Participation Notes (P-Notes). P-Notes are promissory notes that are designed to offer a return linked to the performance of a particular underlying equity security or market. P-Notes are issued by banks or broker-dealers and allow a fund to gain exposure to common stocks in markets in which the fund is currently not approved to directly invest, or in markets that prohibit direct investment by foreign purchasers (e.g. Saudi Arabia). While the holder of a P-Note is entitled to receive from the bank or broker-dealer any dividends or other distributions paid on the underlying securities, the holder is not entitled to the same rights as an owner of the underlying securities, such as voting rights. Income received from P-Notes is recorded as dividend income in the Statement of Operations. P-Notes are considered general unsecured contractual obligations of the bank or broker-dealer. Risks associated with P-Notes include the possible failure of a counterparty (i.e., the issuing bank or broker-dealer) to perform in accordance with the terms of the agreement, inability to transfer or liquidate the notes, potential delays or an inability to redeem the notes before maturity under certain market conditions, and limited legal recourse against the issuer of the underlying common stock.
4. FINANCIAL DERIVATIVE INSTRUMENTS
Foreign Currency Contracts — The Funds may enter into foreign currency contracts to settle planned purchases or sales of securities or to protect against a possible loss resulting from adverse change in the relationship between the U.S. dollar and a foreign currency involved in an underlying transaction. Foreign currency contracts are agreements between two parties to buy and sell a currency at a set price on a future date. The market value of a foreign currency contract fluctuates with changes in currency exchange rates. Foreign currency contracts are marked-to-market daily and the change in market value is recorded by a fund as unrealized appreciation or depreciation. When a foreign currency contract is closed, the fund records a realized gain or loss equal to the difference between the value at the time it was opened and the value at the time it was closed. These contracts may involve market risk in excess of the unrealized gain or loss reflected in the Schedule of Investments. In addition, a fund could be exposed to credit risk if a counterparty is unable or unwilling to meet the terms of the contracts or if the value of the currency changes unfavorably. In connection with these contracts, the Funds may segregate cash and/or securities in a sufficient amount as collateral in accordance with the terms of the respective contracts.
Options Transactions — The Equity Funds and the Income Fund may buy and sell put and call options and
117
Notes to Financial Statements (continued)
write covered put and call options, including over-the-counter options, on portfolio securities where the completion of the obligation is dependent upon the credit standing of another party. Options are a type of derivative financial instrument. The Funds may invest in derivative financial instruments, including options, in order to manage risk or gain exposure to various other investments or markets. The risk in writing a call option is that a fund gives up the opportunity for profit if the market price of the security increases. The risk in writing a put option is that a fund may incur a loss if the market price of the security decreases and the option is exercised. The risk in buying an option is that a fund pays a premium whether or not the option is exercised. A fund also has the additional risk of not being able to enter
into a closing transaction if a liquid secondary market does not exist. Possible losses from uncovered written options may be unlimited. Option contracts are valued daily and unrealized appreciation or depreciation is recorded. A fund will realize a gain or loss upon expiration or closing of the option transaction. When an option is exercised, the proceeds on sales for a written call option, the purchase cost for a written put option, or the cost of a security for a purchased put or call option is adjusted by the amount of premium received or paid. The Funds designate collateral consisting of cash, U.S. government securities or other liquid assets sufficient to collateralize the market value of written options. Refer to Note 14 (Offsetting) for more information about the offsetting of assets and liabilities.
Options written activity during the six months ended March 31, 2017 was as follows:
| | | | | | | | | | | | | | | | | | | | | | | | | | | | | | |
| | | Options
Outstanding at
9/30/2016 | | Written | | Closed | | Exercised | | Expired | | Options
Outstanding at
3/31/2017 |
Large Cap Value Fund | | | | | | | | | | | | | | | | | | | | | | | | | | | | | | |
Premium amount | | | $ | — | | | | $ | 99,363 | | | | $ | — | | | | $ | — | | | | $ | (99,363 | ) | | | $ | — | |
Number of contracts | | | | — | | | | | 300 | | | | | — | | | | | — | | | | | (300 | ) | | | | — | |
5. PURCHASESAND SALESOF SECURITIES
Cost of investment securities purchased and proceeds from sales of investment securities, excluding U.S. government and short-term securities, for the six months ended March 31, 2017 are summarized below:
| | | | | | | | | | | | | | | | | | | | | | | | | | | | | | |
| | | Core
Growth
Fund | | Emerging
India
Fund | | Emerging
Markets
Select
Fund | | Emerging
Markets
Small Cap
Fund | | Frontier
Emerging
Small Countries
Fund | | Global
Opportunities
Fund |
Purchases | | $174,323,805 | | $37,079,454 | | $11,741,065 | | $230,536,753 | | $148,181,653 | | $20,403,424 |
Sales | | 118,606,353 | | 7,850,672 | | 13,173,523 | | 407,605,185 | | 400,132,049 | | 73,198,702 |
| | | | | | |
| | | International
Growth
Fund | | International
Opportunities
Fund | | Large Cap
Value
Fund | | Long/Short
Fund | | Micro
Cap
Fund | | Micro Cap
Value
Fund |
Purchases | | $242,526,702 | | $220,132,401 | | $33,090,976 | | $ 43,728,979 | | $25,783,487 | | $58,754,131 |
Sales | | 301,125,680 | | 233,976,399 | | 54,450,609 | | 120,710,435 | | 36,228,237 | | 55,995,030 |
| | | | | | |
| | | Small Cap
Growth
Fund | | Small Cap
Value
Fund | | Strategic
Income
Fund | | Ultra
Growth
Fund | | World
Innovators
Fund | | Income
Fund |
Purchases | | $162,164,101 | | $87,952,284 | | $ 8,177,665 | | $18,542,254 | | $80,535,465 | | $26,404,587 |
Sales | | 398,256,704 | | 53,999,151 | | 14,555,296 | | 22,302,720 | | 94,517,419 | | 27,648,455 |
Purchases and sales of U.S. government securities in the Income Fund were $12,923,525 and $9,873,570, respectively. Purchases and sales of U.S. government securities in the U.S. Treasury Fund were $22,274,240 and $140,692,671, respectively.
6. FEDERAL INCOME TAX INFORMATION
It is each Fund’s policy to comply with the requirements under Subchapter M of the Internal Revenue Code applicable to regulated investment companies and to distribute substantially all taxable income to shareholders. The Funds are no longer subject to examination by tax authorities for years prior to 2013. At this time, management believes there are no uncertain tax positions which, based on their technical merit, would not be sustained upon examination and for which it is reasonably possible that the total of amounts of unrecognized tax benefits will significantly change in the next 12 months. Accordingly, no provision for federal income or excise taxes has been made.
118
| | |
| | MARCH 31, 2017 (UNAUDITED) |
|
|
|
As of March 31, 2017, the cost and unrealized appreciation (depreciation) of securities on a tax basis were as follows:
| | | | | | | | | | | | | | | | | | | | | | | | | | | | | | | | | | | |
| | | Core
Growth
Fund | | Emerging
India
Fund | | Emerging
Markets
Select
Fund | | Emerging
Markets
Small Cap
Fund | | Frontier
Emerging
Small
Countries
Fund | | Global
Opportunities
Fund | | International
Growth
Fund |
Cost | | | $ | 1,000,573,845 | | | | $ | 89,611,647 | | | | $ | 32,194,583 | | | | $ | 500,962,747 | | | | $ | 201,445,755 | | | | $ | 72,093,179 | | | | $ | 1,022,150,405 | |
| | | | | |
Gross appreciation | | | $ | 493,303,124 | | | | $ | 36,072,946 | | | | $ | 6,423,442 | | | | $ | 157,010,968 | | | | $ | 69,353,516 | | | | $ | 29,287,712 | | | | $ | 354,189,923 | |
Gross (depreciation) | | | | (30,718,767 | ) | | | | (522,601 | ) | | | | (1,262,883 | ) | | | | (20,771,596 | ) | | | | (5,101,811 | ) | | | | (1,449,876 | ) | | | | (48,563,578 | ) |
| | | | | |
Net appreciation | | | $ | 462,584,357 | | | | $ | 35,550,345 | | | | $ | 5,160,559 | | | | $ | 136,239,372 | | | | $ | 64,251,705 | | | | $ | 27,837,836 | | | | $ | 305,626,345 | |
| | | | | |
| | | | | | | |
| | | International
Opportunities
Fund | | Large Cap
Value
Fund | | Long/Short
Fund | | Micro
Cap
Fund | | Micro Cap
Value
Fund | | Small Cap
Growth
Fund | | Small Cap
Value
Fund |
Cost | | | $ | 538,832,494 | | | | $ | 150,043,934 | | | | $ | 120,538,908 | | | | $ | 173,302,919 | | | | $ | 137,772,979 | | | | $ | 1,187,544,811 | | | | $ | 268,663,703 | |
| | | | | |
Gross appreciation | | | $ | 132,972,455 | | | | $ | 35,609,059 | | | | $ | 26,028,363 | | | | $ | 109,253,356 | | | | $ | 53,288,041 | | | | $ | 620,179,772 | | | | $ | 83,894,198 | |
Gross (depreciation) | | | | (10,571,362 | ) | | | | (1,364,520 | ) | | | | (30,015,369 | ) | | | | (8,583,940 | ) | | | | (2,611,161 | ) | | | | (80,859,479 | ) | | | | (6,942,216 | ) |
| | | | | |
Net appreciation (depreciation) | | | $ | 122,401,093 | | | | $ | 34,244,539 | | | | $ | (3,987,006 | ) | | | $ | 100,669,416 | | | | $ | 50,676,880 | | | | $ | 539,320,293 | | | | $ | 76,951,982 | |
| | | | | |
| | | | | | | |
| | | Strategic
Income
Fund | | Ultra
Growth
Fund | | World
Innovators
Fund | | Income
Fund | | U.S.
Treasury
Fund | | | | |
Cost | | | $ | 42,260,764 | | | | $ | 76,378,926 | | | | $ | 157,258,001 | | | | $ | 97,705,448 | | | | $ | 335,789,959 | | | | | | | | | | | |
| | | | | | | | | | | | | | | |
Gross appreciation | | | $ | 7,329,967 | | | | $ | 31,903,035 | | | | $ | 25,568,001 | | | | $ | 607,103 | | | | $ | 1,398,984 | | | | | | | | | | | |
Gross (depreciation) | | | | (1,282,586 | ) | | | | (8,903,654 | ) | | | | (4,045,098 | ) | | | | (464,423 | ) | | | | (32,962,264 | ) | | | | | | | | | | |
| | | | | | | | | | | | | | | |
Net appreciation (depreciation) | | | $ | 6,047,381 | | | | $ | 22,999,381 | | | | $ | 21,522,903 | | | | $ | 142,680 | | | | $ | (31,563,280 | ) | | | | | | | | | | |
| | | | | | | | | | | | | | | |
The difference between book-basis and tax-basis unrealized gains are primarily attributable to the tax deferral of losses on wash sales.
The amount and character of tax-basis distributions and composition of net assets are finalized at fiscal year-end; accordingly, tax basis balances have not been determined as of the date of this report.
Dividends from net investment income and net realized gains, if any, are declared and paid at least annually for all Funds, except for dividends from net investment income in four funds. The Income Fund declares and pays dividends monthly. The Large Cap Value, Strategic Income and U.S. Treasury Funds declare and pay dividends quarterly. The amount of dividends and distributions from net investment income and net realized gains are determined in accordance with federal income tax regulations, which may differ from U.S. GAAP. The Funds may utilize earnings and profits distributed to shareholders on redemption of shares as part of the dividends paid deduction (tax equalization).
To the extent these book and tax differences are permanent in nature, such amounts are reclassified at the end of the fiscal year among additional paid-in capital, undistributed net investment income (loss), and undistributed net realized gain (loss) on investments, options and foreign currency translations.
Capital loss carryforwards are available through the date specified below to offset future realized net capital gains for federal income tax purposes. Future capital loss carryover utilization in any given year may be subject to Internal Revenue Code limitations. To the extent future gains are offset by capital loss carryforwards, such gains will not be distributed.
Under the Regulated Investment Company Modernization Act of 2010, a Fund will be permitted to carry forward capital losses incurred in taxable years beginning after December 22, 2010 for an unlimited period. Post-enactment losses that are carried forward will retain their character as either short-term or long-term capital losses rather than being considered all short-term as under previous law. However, any losses incurred during those future taxable years will be required to be utilized prior to the losses incurred in pre-enactment taxable years, which carry an expiration date. As a result of this ordering rule, pre-enactment capital loss carryforwards may be more likely to expire unused.
119
Notes to Financial Statements (continued)
Capital loss carryforwards as of September 30, 2016 are as follows:
| | | | | | | | | | | | | | | | |
| | | Expiring | | | Non-expiring | |
| Fund | | 2017 | | | 2018 | | | Short Term | | | Long Term | |
Emerging Markets Select Fund | | $ | — | | | $ | — | | | $ | 7,565,978 | | | $ | 713,332 | |
Emerging Markets Small Cap Fund | | | — | | | | — | | | | 55,712,840 | | | | 22,118,288 | |
Frontier Emerging Small Countries Fund | | | — | | | | — | | | | 73,690,727 | | | | 74,221,086 | |
International Opportunities Fund | | | — | | | | — | | | | 3,041,476 | | | | 2,630,545 | |
Small Cap Value Fund | | | — | | | | 13,202,080 | | | | — | | | | — | |
Strategic Income Fund | | | — | | | | — | | | | 4,973,715 | | | | 2,717,608 | |
During the tax year ended September 30, 2016, the Funds used capital loss carryforwards in the following amounts:
| | | | |
| Fund | | Amount Used | |
Small Cap Value Fund | | $ | 6,934,432 | |
The Funds have elected to defer losses incurred from November 1, 2015 through September 30, 2016 in accordance with federal income tax rules. These losses are treated as having arisen on the first day of the following fiscal year. The Funds have elected to defer losses as follows:
| | | | | | | | |
| Fund | | Post-October
Capital Losses | | | Late-Year Ordinary
Losses | |
Core Growth Fund | | $ | — | | | $ | 5,575,059 | |
Emerging India Fund | | | — | | | | 580,549 | |
Emerging Markets Select Fund | | | — | | | | 2,674 | |
Emerging Markets Small Cap Fund | | | — | | | | 4,380,565 | |
Frontier Emerging Small Countries Fund | | | — | | | | 5,872,223 | |
Global Opportunities Fund | | | — | | | | 1,333,351 | |
International Growth Fund | | | — | | | | 1,771,842 | |
International Opportunities Fund | | | — | | | | 235,287 | |
Long/Short Fund | | | 157,644,735 | | | | 145,368 | |
Micro Cap Fund | | | — | | | | 1,971,779 | |
Micro Cap Value Fund | | | 257,220 | | | | 689,111 | |
Small Cap Growth Fund | | | — | | | | 10,697,296 | |
Strategic Income Fund | | | — | | | | 16,441 | |
Ultra Growth Fund | | | — | | | | 1,199,720 | |
World Innovators Fund | | | — | | | | 555,051 | |
EU Reclaims — As a result of several court cases in certain countries across the European Union, the Emerging Markets Small Cap Fund, Global Opportunities Fund, International Growth Fund, International Opportunities Fund, Large Cap Value Fund and World Innovators Fund filed tax reclaims for previously withheld taxes on dividends earned in Finland and Poland (EU Reclaims). These additional filings are subject to various administrative proceedings by the local jurisdictions’ tax authorities within the European Union, as well as a number of related judicial proceedings. Income recognized, if any, for EU reclaims is reflected as dividend income in the Statement of Operations and related receivables, if any, are reflected as interest and dividends receivable in the Statement of Assets and Liabilities. When uncertainty exists as to the ultimate resolution of these proceedings, the likelihood of receipt of these EU reclaims and the potential timing of payment, no amounts are reflected in the financial statements.
7. RELATED PARTY TRANSACTIONS
Investment Advisory Fees, Expense Limitations — As the Funds’ investment advisor, the Advisor receives a monthly fee calculated on average daily net assets. The Advisor has contractually agreed to waive its fees and/or reimburse certain Funds should a Fund’s operating expenses exceed a specified annual limitation through at least January 31, 2018. If operating expenses are less than the specified expense limit for the Fund, the Advisor shall be entitled to recoup the fees waived or reduced to the extent that the operating expenses and the amounts reimbursed do not exceed such expense limit for the Fund, under the period of the agreement (currently through January 31, 2018). Such reimbursement shall be paid only while the expense limitation agreement is in effect and only if such amount paid, together with all other amounts reimbursed under this agreement in the fiscal year, do not cause the Fund to exceed the expense limitation. All amounts not recovered at the end of the period expire on January 31, 2018. Ordinary operating expenses exclude any interest, dividend expense on short sales/interest expense, taxes, brokerage commissions, other investment-related costs and extraordinary expenses, such as litigation and other expenses not incurred in the ordinary course of the Funds’ business. In late October 2013, it was discovered that the Long/Short Fund and Large Cap Value Fund had a 12b-1 receivable on the books which dated back to 2008 prior to the conversion of the 1st Source Funds to Wasatch Funds. It was determined that the amount should be written off as an extraordinary expense and posted to other expenses. The balance for the
120
| | |
| | MARCH 31, 2017 (UNAUDITED) |
|
|
|
Large Cap Value Fund was $70,993 and for the Long/Short Fund was $8,622. The impact of these write-offs is reflected in the Financial Highlights. Investment advisory fees and fees waived, if any, for the six months ended March 31, 2017 are disclosed in the Statements of Operations. Investment advisory fee and expense limitation annual rates are shown below.
| | | | | | | | | | | | | | | | | | | | |
| Fund | | Advisory
Fee | | | Expense
Limitation
Investor Class | | | Expense
Limitation
Institutional Class | | | Contractual Expense
Limitation/
Reimbursement
Recoverable
Expiration Date | | | Reimbursement
Recoverable | |
Core Growth Fund | | | 1.00% | | | | 1.50% | | | | 1.05% | | | | 1/31/2018 | | | $ | 42,060 | |
Emerging India Fund | | | 1.25% | | | | 1.75% | | | | 1.50% | | | | 1/31/2018 | | | | 25,767 | |
Emerging Markets Select Fund | | | 1.00% | | | | 1.50% | | | | 1.20% | | | | 1/31/2018 | | | | 62,338 | |
Emerging Markets Small Cap Fund | | | 1.65% | | | | 1.95% | | | | 1.80% | | | | 1/31/2018 | | | | 203,990 | |
Frontier Emerging Small Countries Fund | | | 1.75% | | | | 2.25% | | | | 2.05% | | | | 1/31/2018 | | | | 742,838 | |
Global Opportunities Fund | | | 1.25% | | | | 1.75% | | | | 1.35% | | | | 1/31/2018 | | | | 15,406 | |
International Growth Fund | | | 1.25% | | | | 1.75% | | | | 1.35% | | | | 1/31/2018 | | | | 39,664 | |
International Opportunities Fund | | | 1.75% | | | | 2.25% | | | | 1.95% | | | | 1/31/2018 | | | | 105,230 | |
Large Cap Value Fund | | | 0.90% | | | | 1.10% | | | | 0.95% | | | | 1/31/2018 | | | | 72,581 | |
Long/Short Fund | | | 1.10% | | | | 1.60% | | | | 1.15% | | | | 1/31/2018 | | | | 30,688 | |
Micro Cap Fund | | | 1.50% | 1 | | | 1.95% | | | | N/A | | | | 1/31/2018 | | | | — | |
Micro Cap Value Fund | | | 1.50% | 1 | | | 1.95% | | | | N/A | | | | 1/31/2018 | | | | — | |
Small Cap Growth Fund | | | 1.00% | | | | 1.50% | | | | 1.05% | | | | 1/31/2018 | | | | 86,232 | |
Small Cap Value Fund | | | 1.00% | | | | 1.50% | | | | 1.05% | | | | 1/31/2018 | | | | 15,570 | |
Strategic Income Fund | | | 0.70% | | | | 0.95% | | | | N/A | | | | 1/31/2018 | | | | 34,938 | |
Ultra Growth Fund | | | 1.00% | | | | 1.50% | | | | N/A | | | | 1/31/2018 | | | | — | |
World Innovators Fund | | | 1.50% | | | | 1.95% | | | | 1.55% | | | | 1/31/2018 | | | | 14,942 | |
Income Fund | | | 0.55% | | | | N/A | | | | N/A | | | | N/A | | | | N/A | |
U.S. Treasury Fund | | | 0.50% | | | | 0.75% | | | | N/A | | | | 1/31/2018 | | | | — | |
| 1 | Effective January 31, 2017, the management fee was reduced from 1.75% to 1.50%. |
Affiliated Trades — Certain Funds are permitted to purchase or sell securities from or to certain related affiliated funds under specified conditions outlined in the procedures adopted by the Board of Trustees (the “Board”). The procedures have been designed to ensure that any purchase or sale of securities by the Funds from or to another fund (or funds) that are, or could be, considered an affiliate by virtue of having a common investment advisor (or affiliated investment advisors), common Trustees and/or common officers complies with Rule 17a-7 of the 1940 Act. Further, each transaction is effected at the current market price, as that term is defined under the procedures. During the six months ended March 31, 2017, the Funds below engaged in purchases or sales of securities pursuant to Rule 17a-7 of the 1940 Act.
| | | | | | | | |
| Fund | | Purchases | | | Sales | |
Emerging Markets Small Cap Fund | | | | | | | 2,985,676 | |
International Opportunities Fund | | | 2,985,676 | | | | | |
Compensation — Officers serve in that capacity without compensation from the Trust. Beginning in the calendar year of 2017, the Funds’ method of compensating Trustees is to pay each Independent Trustee a retainer of $120,000 per year for services rendered and a fee of $24,000 for each Board of Trustees meeting attended in person or telephonically. In addition, each Independent Trustee receives a fee of $24,000 for attendance at an executive session held with respect to the contract renewal process for the Funds. In addition, the Chairman of the Board receives an additional fee of $30,000 a year as Chairman and $6,000 for attendance in person or telephonically at a Board meeting; the Chairman of the Audit Committee and the Chairman of the Nominating Committee each receive an additional $18,000 per year as Chairman and $3,600 for attendance in person or telephonically at a Board meeting. Additionally, each Independent Trustee is entitled to reimbursement of expenses related to his or her duties as a Trustee of the Funds. The 2017 calendar year compensation is an increase of approximately 15% percent from the previous calendar year.
Payments by Advisor — During the 2012 fiscal year, the Advisor discovered a trade allocation error involving several of the Wasatch Funds. In August 2012, the Advisor reimbursed the Global Opportunities Fund $1,167, the Micro Cap Fund $1,074, the Micro Cap Value Fund $1,282, the Small Cap Growth Fund $46,199, the Ultra Growth Fund $940 and the World Innovators Fund $437 as reimbursement for the error plus interest.
During the 2013 and 2014 fiscal years, the Advisor paid certain audit, legal and/or printing fees of the Core Growth, Emerging Markets Small Cap, Large Cap Value, Long/Short (Institutional Class), Small Cap Growth, Small Cap Value, Strategic Income and World Innovators Funds. The Advisor does not intend to be reimbursed for these amounts.
On February 20, 2013, the Advisor discovered a trade error involving the Frontier Emerging Small Countries Fund. The Advisor reimbursed the Fund $4,421. On October 16, 2014, the Advisor discovered a trade error involving the Ultra Growth Fund. The Advisor reimbursed the Fund $12,267. On August 2, 2016, the Advisor discovered a trade error involving the Small Cap Growth Fund. The Advisor reimbursed the Fund $12,890.
121
Notes to Financial Statements (continued)
The impact of the payments detailed above is reflected in the net expense ratios in the Financial Highlights.
Payments by Sub-Advisor — In June 2016, the Funds filed a proxy statement with the Securities and Exchange Commission to inform shareholders about a Special Meeting of Shareholders of the Wasatch-Hoisington U.S. Treasury Fund. The purpose of the Shareholder Meeting was to ask shareholders to approve a new Sub-Advisory Agreement between Wasatch Advisors, Inc. and Hoisington Investment Management Company with respect to the Wasatch Hoisington U.S. Treasury Fund. Hoisington Investment Management Co., the Sub-Advisor for the Fund, reimbursed the Wasatch-Hoisington U.S. Treasury Fund for the costs associated with the proxy statement filing. The Sub-Advisor does not intend to be reimbursed for this amount.
Transfer Agent Intermediary Fees Reimbursed to the Advisor — Each Fund paid fees to, and reimbursed certain out-of-pocket expenses of, the Funds’ transfer agent during the period. In addition, the Advisor and the Funds’ distributor have entered into selling dealer agreements and service agreements with certain financial services companies, broker-dealers, banks, advisors, retirement service providers or other authorized agents or organizations (each an “Intermediary,” together, “Intermediaries”) to accept purchase, exchange and redemption orders on the Funds’ behalf. For Investor Class shares of the Funds, some Intermediaries do not charge investors a direct transaction fee, but instead charge a fee for accounting and shareholder services that the agent provided to Fund shareholders on the Funds’ behalf. Those services typically included recordkeeping, transaction processing for shareholders’ accounts, communication of tax information, income distribution and other services. Generally, the fee was either a per account charge based on the number of accounts to which the Intermediary provided such services, or was a percentage (as of March 31, 2017 up to 0.40% annually) of the average value of Fund Investor Class shares held in such accounts. The Advisor paid the Intermediary fees and the Funds reimbursed the Advisor for the portion of such fees, which is intended to compensate the Intermediary for provision of services of the type that would be provided by the Funds’ transfer agent or other service providers if the shares were registered on the books of the Funds’ transfer agent. Institutional Class shares of the Funds do not reimburse the Advisor for payments to Intermediaries. The Funds’ reimbursement of expenses incurred for services provided by Intermediaries are included in “Shareholder servicing fees — Investor Class” in the Statements of Operations.
Custodian Out-of-Pocket Expense Reimbursement — In September 2016, State Street Bank and Trust Company (“SSB”), the Funds’ custodian, provided each Fund with an offer to reimburse the Fund for certain out-of-pocket expenses it charged the Fund between 2003 and 2015. The incorrect charges were due to inaccurate billing rates used by SSB for certain out-of-pocket expenses. The Funds continue to review the information provided by SSB in anticipation of settling the matter. For each Fund, the reimbursement amount offered by SSB is included in “Prepaid expenses and other assets” in the Statements of Assets and Liabilities and reduced “Custody fees,” “Fund accounting fees” and, if applicable, “Reimbursement of expenses by Advisor” in the Statements of Operations. Based on the information provided by SSB, the Funds believe the impact of these errors is immaterial for each Fund.
10% Shareholders — As of March 31, 2017, the Funds had individual shareholder accounts and/or omnibus shareholder accounts (comprised of a group of individual shareholders), which individually amounted to more than 10% of the total shares outstanding of the Fund as detailed below:
| | | | | | | | |
| Fund | | Number of
Accounts | | | Percent of Shares
Outstanding | |
Core Growth Fund | | | 2 | | | | 50.07 | % |
Emerging India Fund | | | 2 | | | | 59.25 | % |
Emerging Markets Select Fund | | | 3 | | | | 81.91 | % |
Emerging Markets Small Cap Fund | | | 3 | | | | 64.60 | % |
Frontier Emerging Small Countries Fund | | | 2 | | | | 80.09 | % |
Global Opportunities Fund | | | 3 | | | | 49.14 | % |
International Growth Fund | | | 3 | | | | 65.33 | % |
International Opportunities Fund | | | 2 | | | | 70.10 | % |
Large Cap Value Fund | | | 2 | | | | 77.76 | % |
Long/Short Fund | | | 2 | | | | 67.79 | % |
Micro Cap Fund | | | 2 | | | | 26.47 | % |
Micro Cap Value Fund | | | 2 | | | | 50.47 | % |
Small Cap Growth Fund | | | 2 | | | | 50.49 | % |
Small Cap Value Fund | | | 2 | | | | 41.46 | % |
Strategic Income Fund | | | 3 | | | | 53.19 | % |
Ultra Growth Fund | | | 2 | | | | 28.95 | % |
World Innovators Fund | | | 3 | | | | 55.47 | % |
Income Fund | | | 1 | | | | 86.89 | % |
U.S. Treasury Fund | | | 3 | | | | 60.07 | % |
122
| | |
| | MARCH 31, 2017 (UNAUDITED) |
|
|
|
Affiliated Interests — As of March 31, 2017, Wasatch Advisors, Inc. and its affiliates, and the retirement plans of Wasatch Advisors, Inc. and its affiliates, held shares of the Funds which may be redeemed at any time as detailed below:
| | | | | | | | |
| | | Number of
Accounts* | | | Percent of Shares
Outstanding | |
Core Growth Fund | | | 19 | | | | 0.99 | % |
Emerging India Fund | | | 25 | | | | 18.39 | % |
Emerging Markets Select Fund | | | 16 | | | | 21.88 | % |
Emerging Markets Small Cap Fund | | | 15 | | | | 1.26 | % |
Frontier Emerging Small Countries Fund | | | 17 | | | | 0.33 | % |
Global Opportunities Fund | | | 18 | | | | 9.91 | % |
International Growth Fund | | | 15 | | | | 0.78 | % |
International Opportunities Fund | | | 20 | | | | 1.73 | % |
Large Cap Value Fund | | | 11 | | | | 2.53 | % |
Long/Short Fund | | | 7 | | | | 0.53 | % |
Micro Cap Fund | | | 11 | | | | 1.01 | % |
Micro Cap Value Fund | | | 9 | | | | 2.43 | % |
Small Cap Growth Fund | | | 19 | | | | 2.96 | % |
Small Cap Value Fund | | | 9 | | | | 1.88 | % |
Strategic Income Fund | | | 6 | | | | 20.61 | % |
Ultra Growth Fund | | | 8 | | | | 3.45 | % |
World Innovators Fund | | | 9 | | | | 2.26 | % |
Income Fund | | | 3 | | | | 0.02 | % |
U.S. Treasury Fund | | | 11 | | | | 0.98 | % |
| * | Multiple accounts with the same beneficial owner are treated as one account. |
8. TRANSACTIONSWITH AFFILIATES
If a Fund’s holding represents ownership of 5% or more of the voting securities of a company, the company is deemed to be an affiliate as defined by the 1940 Act. The following Funds conducted transactions during the six months ended March 31, 2017 with an “affiliated company” as so defined:
| | | | | | | | | | | | | | | | | | | | | | | | |
| | | Share Activity | | | Dividends
Credited to
Income for the period ended
3/31/2017 | | | Gain (Loss)
Realized on
Sale of Shares
for the
period ended
3/31/2017 | |
| | | Balance
9/30/2016 | | | Purchases/
Additions | | | Sales/
Reductions | | | Balance
3/31/2017 | | | |
Small Cap Growth Fund | | | | | | | | | | | | | | | | | | | | | | | | |
Blue Nile, Inc.* | | | 828,553 | | | | — | | | | 828,553 | | | | — | | | $ | — | | | $ | 4,523,310 | |
Chefs’ Warehouse, Inc. (The) | | | 1,897,093 | | | | — | | | | 393,658 | | | | 1,503,435 | | | | — | | | | (3,281,811 | ) |
Papa Murphy’s Holdings, Inc.* | | | 1,042,768 | | | | — | | | | 1,042,768 | | | | — | | | | — | | | | (11,753,461 | ) |
Zumiez, Inc. | | | 1,265,079 | | | | — | | | | — | | | | 1,265,079 | | | | — | | | | — | |
| * | This security was deemed to no longer meet the criteria of an affiliated company at the reporting date. |
9. RESTRICTED SECURITIES
The Funds may own investments that were purchased through private placement transactions or under Rule 144A of the Securities Act of 1933 (the “Securities Act”) and cannot be sold without prior registration under the Securities Act or may be limited due to certain restrictions. These securities are generally deemed to be illiquid and are valued at fair value as determined by a designated Pricing Committee of the Advisor (“Pricing Committee”), comprised of personnel of the Advisor, with oversight by the Board of Trustees and in accordance with Board-approved Pricing Policies and Procedures. If and when such securities are registered, the costs of registering such securities are paid by the issuer. At March 31, 2017, the Funds held the following restricted securities:
| | | | | | | | | | | | | | | | | | |
| | | Security
Type | | Acquisition
Date | | | Cost | | | Fair
Value | | | Value as Percent
of Net Assets | |
Core Growth Fund | | | | | | | | | | | | | | | | | | |
Argos Therapeutics, Inc. | | Warrant | | | 7/28/16 | | | $ | — | | | $ | 17,560 | | | | 0.00% | |
DocuSign, Inc., Series F Pfd. | | Preferred Stock | | | 4/30/15 | | | | 4,000,004 | | | | 3,469,320 | | | | 0.24% | |
| | | | | | | | | | |
| | | | | | | | $ | 4,000,004 | | | $ | 3,486,880 | | | | 0.24% | |
|
| |
123
Notes to Financial Statements (continued)
| | | | | | | | | | | | | | | | | | |
| | | Security
Type | | Acquisition
Date | | | Cost | | | Fair
Value | | | Value as Percent
of Net Assets | |
Emerging India Fund | | | | | | | | | | | | | | | | | | |
Avenue Supermarts Ltd. | | Common Stock | | | 3/7/17 | | | $ | 2,554,113 | | | $ | 5,458,763 | | | | 4.39% | |
|
| |
Micro Cap Fund | | | | | | | | | | | | | | | | | | |
Argos Therapeutics, Inc. | | PIPE | | | 3/14/16 | | | $ | 80,250 | | | $ | 6,779 | | | | 0.00% | |
Argos Therapeutics, Inc. | | PIPE | | | 6/22/16 | | | | 120,375 | | | | 10,168 | | | | 0.00% | |
Argos Therapeutics, Inc. | | Warrant | | | 6/22/16 | | | | 2,109 | | | | 169 | | | | 0.00% | |
| | | | | | | | | | |
| | | | | | | | $ | 202,734 | | | $ | 17,116 | | | | 0.00% | |
|
| |
Micro Cap Value Fund | | | | | | | | | | | | | | | | | | |
Acetylon Pharmaceuticals, Inc. | | Right | | | 12/21/16 | | | $ | — | | | $ | 326,356 | | | | 0.17% | |
Acetylon Pharmaceuticals, Inc. | | Right | | | 12/21/16 | | | | — | | | | — | | | | 0.00% | |
Regenacy Pharmaceuticals, LLC | | LLC Membership Interest | | | 12/21/16 | | | | 30,001 | | | | 51,475 | | | | 0.03% | |
Synergetics USA, Inc. | | Right | | | 10/14/15 | | | | 71,250 | | | | 18,750 | | | | 0.01% | |
Vertex Energy, Inc., Pfd. Series B | | Convertible Preferred Stock | | | 6/22/15 - 1/27/17 | | | | 1,601,521 | | | | 1,424,257 | | | | 0.76% | |
Vertex Energy, Inc. | | Warrant | | | 6/22/15 | | | | 95,000 | | | | 25,000 | | | | 0.01% | |
| | | | | | | | | | |
| | | | | | | | $ | 1,797,772 | | | $ | 1,845,838 | | | | 0.98% | |
|
| |
Small Cap Growth Fund | | | | | | | | | | | | | | | | | | |
Argos Therapeutics, Inc. | | PIPE | | | 3/14/16 | | | $ | 280,608 | | | $ | 23,702 | | | | 0.00% | |
Argos Therapeutics, Inc. | | PIPE | | | 6/22/16 | | | | 421,045 | | | | 35,564 | | | | 0.00% | |
Argos Therapeutics, Inc. | | Warrant | | | 6/22/16 | | | | 7,378 | | | | 590 | | | | 0.00% | |
Argos Therapeutics, Inc. | | Warrant | | | 7/28/16 | | | | — | | | | 38,918 | | | | 0.00% | |
DataStax, Inc., Series E Pfd. | | Preferred Stock | | | 8/12/14 | | | | 8,000,002 | | | | 6,397,861 | | | | 0.37% | |
DocuSign, Inc., Series B Pfd. | | Preferred Stock | | | 3/3/14 | | | | 437,257 | | | | 551,382 | | | | 0.03% | |
DocuSign, Inc., Series B-1 Pfd. | | Preferred Stock | | | 3/3/14 | | | | 130,983 | | | | 165,169 | | | | 0.01% | |
DocuSign, Inc., Series D Pfd. | | Preferred Stock | | | 3/3/14 | | | | 313,930 | | | | 395,867 | | | | 0.02% | |
DocuSign, Inc., Series E Pfd. | | Preferred Stock | | | 3/3/14 | | | | 8,117,819 | | | | 10,236,597 | | | | 0.59% | |
DocuSign, Inc., Series F Pfd. | | Preferred Stock | | | 4/30/15 | | | | 2,999,984 | | | | 2,601,974 | | | | 0.15% | |
Drilling Info Holdings, Inc., Series B Pfd. | | Preferred Stock | | | 9/5/13 | | | | 15,350,001 | | | | 14,386,444 | | | | 0.83% | |
ForeScout Technologies, Inc., Series G | | Preferred Stock | | | 11/25/15 | | | | 6,000,003 | | | | 8,008,767 | | | | 0.47% | |
Greenspring Global Partners II-B, L.P. | | LP Interest | | | 10/10/03 - 3/31/17 | | | | 2,588,398 | | | | 2,346,596 | | | | 0.14% | |
Greenspring Global Partners III-B, L.P. | | LP Interest | | | 3/16/06 - 11/17/15 | | | | 1,160,489 | | | | 1,143,997 | | | | 0.07% | |
Nanosys, Inc., Series D Pfd. | | Preferred Stock | | | 11/8/05 | | | | 2,000,000 | | | | 568,814 | | | | 0.03% | |
Nanosys, Inc., Series E Pfd. | | Preferred Stock | | | 8/13/10 | | | | 184,939 | | | | 191,626 | | | | 0.01% | |
| | | | | | | | | | |
| | | | | | | | $ | 47,992,836 | | | $ | 47,093,868 | | | | 2.72% | |
|
| |
Small Cap Value Fund | | | | | | | | | | | | | | | | | | |
Argos Therapeutics, Inc. | | Warrant | | | 7/28/16 | | | $ | — | | | $ | 9,830 | | | | 0.00% | |
|
| |
Strategic Income Fund | | | | | | | | | | | | | | | | | | |
Star Asia Capital Corp Ltd. | | Common Stock | | | 2/22/07 - 5/11/15 | | | $ | 572,598 | | | $ | 497,999 | | | | 1.03% | |
|
| |
Ultra Growth Fund | | | | | | | | | | | | | | | | | | |
Argos Therapeutics, Inc. | | PIPE | | | 3/14/16 | | | $ | 39,055 | | | $ | 3,299 | | | | 0.00% | |
Argos Therapeutics, Inc. | | PIPE | | | 6/22/16 | | | | 58,582 | | | | 4,948 | | | | 0.01% | |
Argos Therapeutics, Inc. | | Warrant | | | 6/22/16 | | | | 1,026 | | | | 82 | | | | 0.00% | |
Argos Therapeutics, Inc. | | Warrant | | | 7/28/16 | | | | — | | | | 1,191 | | | | 0.00% | |
Data Sciences International, Inc.,
Series B Pfd. | | Preferred Stock | | | 1/20/06 | | | | 399,811 | | | | 270,778 | | | | 0.27% | |
Drilling Info Holdings, Inc., Series B Pfd. | | Preferred Stock | | | 9/5/13 | | | | 1,150,001 | | | | 1,077,812 | | | | 1.09% | |
Greenspring Global Partners II-B, L.P. | | LP Interest | | | 10/10/03 - 3/31/17 | | | | 2,329,551 | | | | 2,111,926 | | | | 2.13% | |
Greenspring Global Partners III-B, L.P. | | LP Interest | | | 3/16/06 - 11/17/15 | | | | 1,160,489 | | | | 1,143,997 | | | | 1.15% | |
Nanosys, Inc., Series D Pfd. | | Preferred Stock | | | 11/8/05 | | | | 500,001 | | | | 142,204 | | | | 0.14% | |
Nanosys, Inc., Series E Pfd. | | Preferred Stock | | | 8/13/10 | | | | 46,235 | | | | 47,907 | | | | 0.05% | |
| | | | | | | | | | |
| | | | | | | | $ | 5,684,751 | | | $ | 4,804,144 | | | | 4.84% | |
|
| |
World Innovators Fund | | | | | | | | | | | | | | | | | | |
Greenspring Global Partners II-B, L.P. | | LP Interest | | | 10/10/13 - 3/31/17 | | | $ | 258,842 | | | $ | 234,661 | | | | 0.13% | |
|
| |
10. PURCHASE COMMITMENTS
In September 2003, the Small Cap Growth, Ultra Growth and World Innovators Funds entered into subscription agreements to acquire limited partnership interests in Greenspring Global Partners II-B, L.P. The final purchase commitments were made on March 31, 2017.
124
| | |
| | MARCH 31, 2017 (UNAUDITED) |
|
|
|
In December 2005, the Small Cap Growth and Ultra Growth Funds entered into subscription agreements to acquire limited partnership interests in Greenspring Global Partners III-B, L.P. The remaining commitment amounts at March 31, 2017 were $45,000 per Fund.
Securities held by the Funds have been designated to meet these purchase commitments as indicated in the Schedules of Investments.
11. LINEOF CREDIT
Effective May 20, 2016, the Funds in the Trust renewed and amended agreements for two open lines of credit totaling $300,000,000, one of which is $100,000,000 committed, and the other of which is $200,000,000 uncommitted, with State Street Bank and Trust Company (together, the “Line”). The agreements, as amended, have no change in the committed, uncommitted and total amounts available on the Line. The Funds incur commitment fees on the undrawn portion of the committed part of the Line, and interest expense to the extent of amounts drawn (borrowed) under the entire Line. Interest is based on the higher of (a) the federal funds rate in effect on the date of borrowing, plus a margin, or (b) the overnight London Interbank Offered Rate (LIBOR) in effect on the date of borrowing, plus a margin. Commitment fees are pro-rated among the Funds based upon relative average net assets. Interest expense is charged directly to a Fund based upon actual amounts borrowed by that Fund.
For the six months ended March 31, 2017, the following Funds had borrowings:
| | | | | | | | | | | | | | | | | | | | |
| Funds Utilizing the Line of Credit | | Average Daily
Borrowings | | | Number of
Days
Outstanding | | | Interest
Expense | | | Weighted
Average
Annualized
Interest Rate | | | Balance at
3/31/2017 | |
Emerging India Fund | | $ | 405,746 | | | | 8 | | | $ | 161 | | | | 1.78 | % | | $ | — | |
Emerging Markets Select Fund | | | 683,233 | | | | 65 | | | | 2,330 | | | | 1.89 | % | | | — | |
Emerging Markets Small Cap Fund | | | 4,401,586 | | | | 57 | | | | 13,632 | | | | 1.96 | % | | | — | |
Frontier Emerging Small Countries Fund | | | 12,796,652 | | | | 80 | | | | 53,709 | | | | 1.89 | % | | | — | |
Global Opportunities Fund | | | 2,896,509 | | | | 80 | | | | 12,352 | | | | 1.92 | % | | | 70,313 | |
International Growth Fund | | | 1,743,578 | | | | 4 | | | | 391 | | | | 2.02 | % | | | — | |
International Opportunities Fund | | | 8,550,795 | | | | 11 | | | | 5,256 | | | | 2.01 | % | | | — | |
Micro Cap Fund | | | 853,672 | | | | 3 | | | | 156 | | | | 2.19 | % | | | — | |
Small Cap Growth Fund | | | 8,017,468 | | | | 49 | | | | 20,921 | | | | 1.92 | % | | | — | |
Small Cap Value Fund | | | 2,587,257 | | | | 3 | | | | 474 | | | | 2.20 | % | | | — | |
Ultra Growth Fund | | | 414,618 | | | | 1 | | | | 26 | | | | 2.23 | % | | | — | |
12. PRINCIPAL RISKS
Market and Credit Risk — In the normal course of business the Funds trade financial instruments and enter into financial transactions where risk of loss exists due to changes in the market (market risk) or the failure of the other party to a transaction to perform (credit risk). Similar to credit risk, the Funds may be exposed to counterparty risk, or the risk that an institution or other entity with which the Funds have unsettled or open transactions will default. The potential loss could exceed the value of the financial assets recorded in the financial statements. Financial assets, which potentially expose the Funds to credit risk, consist principally of cash due from counterparties and investments. The extent of the Funds’ exposure to credit and counterparty risks with respect to these financial assets approximates their carrying value as recorded in the Funds’ Statements of Assets and Liabilities.
Inflation Risk — Inflation risk is the possibility that inflation will reduce the purchasing power of a currency, and subsequently reduce the value of a security or asset, and may result in rising interest rates. Inflation is the overall upward price movement of goods and services in an economy that causes the value of a currency to decline.
Interest Rate Risk — Interest rate risk is the risk that fixed income securities will decline in value because of changes in interest rates. A rise in interest rates typically causes a fall in
values. Interest rate risk should be modest for shorter-term securities, moderate for intermediate-term securities and high for longer-term securities. Generally, an increase in the average maturity of a fund will make it more sensitive to interest rate risk. The interest rate is the amount charged, expressed as a percentage of principal, by a lender to a borrower for the use of assets.
Foreign Currency Risk — If a fund invests directly in foreign currencies or in securities that trade in, and receive revenues in, foreign currencies, or in derivatives that provide exposure to foreign currencies, it will be subject to the risk that those currencies will decline in value relative to the U.S. dollar. This also includes the risk associated with higher transaction costs, delayed settlements, currency controls and adverse economic developments related to foreign investments.
Region Risk — The Funds, except the U.S. Treasury Fund, invest in equity and fixed income securities of non-U.S. issuers. Because certain foreign markets are illiquid, market prices may not necessarily represent realizable value. Although the Funds maintain diversified investment portfolios, political or economic developments within a particular country or region may have an adverse effect on the ability of domiciled issuers to meet their obligations. These risks are exaggerated for securities of issuers tied economically to emerging and frontier market countries. Additionally, political or economic developments may have an
125
Notes to Financial Statements (continued)
adverse effect on the liquidity and volatility of portfolio securities and currency holdings.
Liquidity Risk — The trading market for a particular security may be less liquid than it appears and the market prices may not represent realizable value. This may be likely when a fund has a proportionately large investment in securities with small market capitalizations or securities in foreign markets that trade infrequently. Reduced liquidity will have an adverse impact on a fund’s ability to sell such securities quickly at the currently marked price if necessary to meet redemptions.
Shareholder Concentration Risk — A significant portion of the net assets of the Frontier Emerging Small Countries Fund is owned by a group of shareholders advised by a common investment advisor. The Emerging Markets Select Fund also has a significant portion of net assets concentrated in relatively few related accounts. In the event of significant redemption activity by these shareholders, the Funds could experience a loss when selling portfolio securities to meet such redemption requests. The Funds could be forced to sell portfolio securities at unfavorable prices in an effort to generate sufficient cash to pay redeeming shareholders. Fund expenses may increase and performance may be materially affected.
13. FAIR VALUE MEASUREMENTSAND INVESTMENTS
The fair value of a financial instrument is the amount that would be received to sell an asset or paid to transfer a liability in an orderly transaction between market participants at the measurement date. The Funds use various methods to measure the fair value of their investments on a recurring basis. U.S. GAAP established a hierarchy that prioritizes inputs to valuation methods. The three levels of inputs are:
| | • | | Level 1 — Unadjusted quoted prices in active markets for identical assets or liabilities that the Funds have the ability to access. |
| | • | | Level 2 — Observable inputs other than quoted prices included in Level 1 that are observable for the asset or liability, either directly or indirectly. The inputs may include quoted prices for the identical investment on an inactive market, prices for similar investments, interest rates, prepayment speeds, credit risk, yield curves, default rates and similar data. |
| | • | | Level 3 — Unobservable inputs for the asset or liability, to the extent relevant observable inputs are not available, representing the Funds’ own assumptions about the assumptions a market participant would use in valuing the asset or liability, and would be based on the best information available. |
The availability of observable inputs can vary from security to security and is affected by a wide variety of factors, including, for example, the type of security, whether a security is new and not yet established in the marketplace, the liquidity of markets, and other characteristics particular to the security. To the extent that valuation is based on models or inputs that are less observable or unobservable in the
market, the determination of fair value requires more judgment. Accordingly, the degree of judgment exercised in determining fair value is greatest for instruments categorized in Level 3.
Equity Securities (common and preferred stock) — Securities are valued as of the close of the New York Stock Exchange (“NYSE”) (generally 4:00 p.m. Eastern Time) on the valuation date. Equity securities and listed warrants are valued using a commercial pricing service at the last quoted sales price taken from the primary market in which each security trades and, with respect to equity securities traded on the National Association of Securities Dealer Automated Quotation system (“NASDAQ”), such securities are valued using the NASDAQ Official Closing Price (“NOCP”) or last sales price if no NOCP is available. If there are no sales on the primary exchange or market on a day, then the security shall be valued at the mean of the last bid and ask price on the primary exchange or market as provided by a pricing service. If the mean cannot be calculated or there is no trade activity on a day, then the security shall be valued at the previous trading day’s price as provided by a pricing service. In some instances, particularly on foreign exchanges, an official close or evaluated price may be used if the pricing service is unable to provide the last trade or most recent mean price. To the extent that these securities are actively traded and valuation adjustments are not applied, they are categorized in Level 1 of the fair value hierarchy. Additionally, a fund’s investments are valued at fair value by the Pricing Committee if the Advisor determines that an event impacting the value of an investment occurred between the closing time of a security’s primary market or exchange (for example, a foreign exchange or market) and the time the fund’s share price is calculated. Significant events include, but are not limited to the following: significant fluctuations in domestic markets, foreign markets or foreign currencies; occurrences not directly tied to the securities markets such as natural disasters, armed conflicts or significant governmental actions; and major announcements affecting a single issuer or an entire market or market sector. In responding to a significant event, the Pricing Committee determines the fair value of affected securities by considering factors including, but not limited to: index options and futures traded subsequent to the close; American Depositary Receipts (“ADRs”), Global Depositary Receipts (“GDRs”) or other related receipts; currency spot or forward markets that trade after pricing of the foreign exchange; other derivative securities traded after the close such as Standard & Poor’s Depositary Receipts (“SPDRs”) and other exchange-traded funds (“ETFs”); and alternative market quotes on the affected securities. When applicable, the Funds use a systematic fair valuation model provided by an independent third party to assist in adjusting the valuation of foreign securities. When a Fund uses this fair value pricing method, the values assigned to the Fund’s foreign securities may not be the quoted or published prices of the investments on their primary markets or exchanges, and the securities are categorized in Level 2 of the fair value hierarchy. These valuation procedures apply equally to long or short equity positions in a fund.
126
| | |
| | MARCH 31, 2017 (UNAUDITED) |
|
|
|
Participation Notes — Investments are valued at the market price of the underlying security. Counterparty risk is regularly reviewed and considered for valuation.
Corporate Debt Securities — Investments are valued at current market value by a pricing service, or by using the last sale or bid price based on observable inputs. Observable inputs may include benchmark yields, reported trades, broker/dealer quotes, issuer spreads, two-sided markets, benchmark securities, bids, offers and reference data including market research publications. Although most corporate bonds are categorized in Level 2 of the fair value hierarchy, in instances where observable inputs are not available, they are categorized as Level 3.
Short-Term Notes — Investments maturing in 60 days or less at the time of purchase, are generally valued at amortized cost, unless it is determined that the amortized cost method would not represent fair value, in which case the securities are marked-to-market. To the extent the inputs are observable and timely, the values would be categorized in Level 2 of the fair value hierarchy.
Asset-Backed Securities — Investments are priced using the closing bid as supplied by a pricing service based on observable inputs. Observable inputs may include benchmark yields, reported trades, broker/dealer quotes, issuer spreads, two-sided markets, benchmark securities, bids, offers and reference data including market research publications, new issue data, monthly payment information and collateral performance. Although most asset-backed securities are categorized in Level 2 of the fair value hierarchy, in instances where observable inputs are not available, they are categorized as Level 3.
U.S. Government Issuers — Investments are priced using the closing bid as supplied by a pricing service based on observable inputs. Observable inputs may include benchmark yields, reported trades, broker/dealer quotes, issuer spreads, two-sided markets, benchmark securities, bids, offers and reference data including market research publications. Although most U.S. government bonds are categorized in Level 2 of the fair value hierarchy, in instances where observable inputs are not available, they are categorized as Level 3.
Derivative Instruments — Listed derivatives that are actively traded are valued based on quoted prices from the exchange and are categorized in Level 1 of the fair value hierarchy. Exchange-traded options are valued at the last sale price in the market where they are principally traded. If there are no sales on the primary exchange or market on a given day, then the option is valued at the mean of the last bid price and ask price on the primary exchange or market as provided by a pricing service. Forward foreign currency contracts are valued at the market rate provided by the pricing service and categorized as Level 2.
Restricted Securities — If market quotations are not readily available for the Funds’ investments in securities such as restricted securities, private placements, securities for which trading has been halted or other illiquid securities, these investments are valued at fair value in accordance with Board-approved Pricing Policies and Procedures by the Pricing Committee with oversight by the Board of Trustees. Fair value is defined as the price that would be received upon the sale of an asset, or paid to transfer a liability, in an orderly transaction between market participants at the measurement date under current market conditions. For each applicable investment that is fair valued, the Pricing Committee considers, to the extent applicable, various factors including, but not limited to, the financial condition of the company or limited partnership, operating results, prices paid in follow-on rounds, comparable companies in the public market, the nature and duration of the restrictions for holding the securities, a stated net asset value (NAV) for the partnership, if applicable, and other relevant factors. Depending on the relative significance of valuation inputs, these instruments may be classified in either Level 2 or Level 3 of the fair value hierarchy.
When the last day of the reporting period is a non-business day, certain foreign markets may be open on days the NYSE is closed, which could result in differences between the value of a fund’s portfolio securities on the last business day and the last calendar day of the reporting period. Any significant security valuation changes due to an open foreign market are adjusted and reflected by the fund for financial reporting purposes.
The following is a summary of the fair valuations according to the inputs used as of March 31, 2017 in valuing the Funds’ assets and liabilities:
| | | | | | | | | | | | | | | | | | |
| Fund | | Category | | Quoted Prices
in Active Markets
for Identical
Investments
(Level 1) | | | Significant Other
Observable Inputs
(Level 2) | | | Significant
Unobservable
Inputs
(Level 3) | | | Value at
3/31/2017 | |
| | | | | | | | | | | | | | | | | | |
Core Growth Fund | | | | | | | | | | | | | | | | | | |
Assets | | | | | | | | | | | | | | | | | | |
Common Stocks | | | | $ | 1,375,607,821 | | | $ | — | | | $ | — | | | $ | 1,375,607,821 | |
Preferred Stocks | | | | | — | | | | — | | | | 3,469,320 | | | | 3,469,320 | |
Warrants | | | | | — | | | | — | | | | 17,560 | | | | 17,560 | |
Short-Term Investments | | | | | — | | | | 84,063,501 | | | | — | | | | 84,063,501 | |
| | | | | | |
| | | | $ | 1,375,607,821 | | | $ | 84,063,501 | | | $ | 3,486,880 | | | $ | 1,463,158,202 | |
| | | | | | |
127
Notes to Financial Statements (continued)
| | | | | | | | | | | | | | | | | | |
| Fund | | Category | | Quoted Prices
in Active Markets
for Identical
Investments
(Level 1) | | | Significant Other
Observable Inputs
(Level 2) | | | Significant
Unobservable
Inputs
(Level 3) | | | Value at
3/31/2017 | |
| | | | | | | | | | | | | | | | | | |
Emerging India Fund | | | | | | | | | | | | | | | | | | |
Assets | | | | | | | | | | | | | | | | | | |
Common Stocks | | Food Retail | | $ | 74,855 | | | $ | — | | | $ | 5,458,763 | | | $ | 5,533,618 | |
| | Other | | | 112,895,912 | | | | — | | | | — | | | | 112,895,912 | |
Short-Term Investments | | | | | — | | | | 6,732,462 | | | | — | | | | 6,732,462 | |
| | | | | | |
| | | | $ | 112,970,767 | | | $ | 6,732,462 | | | $ | 5,458,763 | | | $ | 125,161,992 | |
| | | | | | |
Emerging Markets Select Fund | | | | | | | | | | | | | | | | | | |
Assets | | | | | | | | | | | | | | | | | | |
Common Stocks | | Health Care Facilities | | $ | 709,464 | | | $ | 930,941 | | | $ | — | | | $ | 1,640,405 | |
| | Other | | | 33,961,226 | | | | — | | | | — | | | | 33,961,226 | |
Preferred Stocks | | | | | 930,086 | | | | — | | | | — | | | | 930,086 | |
Short-Term Investments | | | | | — | | | | 823,425 | | | | — | | | | 823,425 | |
| | | | | | |
| | | | $ | 35,600,776 | | | $ | 1,754,366 | | | $ | — | | | $ | 37,355,142 | |
| | | | | | |
Emerging Markets Small Cap Fund | | | | | | | | | | | | | | | | | | |
Assets | | | | | | | | | | | | | | | | | | |
Common Stocks | | Consumer Finance | | $ | 37,905,813 | | | $ | 11,734,181 | | | $ | — | | | $ | 49,639,994 | |
| | Electronic Components | | | 18,758,079 | | | | 4,974,276 | | | | — | | | | 23,732,355 | |
| | Home Improvement Retail | | | — | | | | 7,535,908 | | | | — | | | | 7,535,908 | |
| | Hotels, Resorts &
Cruise Lines | | | — | | | | 8,164,018 | | | | — | | | | 8,164,018 | |
| | Pharmaceuticals | | | 10,977,109 | | | | — | | | | 16,750 | | | | 10,993,859 | |
| | Specialty Chemicals | | | 6,115,507 | | | | 8,172,057 | | | | — | | | | 14,287,564 | |
| | Other | | | 506,711,619 | | | | — | | | | — | | | | 506,711,619 | |
Preferred Stocks | | | | | 8,960,458 | | | | — | | | | — | | | | 8,960,458 | |
Warrants | | | | | 164,355 | | | | — | | | | — | | | | 164,355 | |
Short-Term Investments | | | | | — | | | | 7,011,989 | | | | — | | | | 7,011,989 | |
| | | | | | |
| | | | $ | 589,592,940 | | | $ | 47,592,429 | | | $ | 16,750 | | | $ | 637,202,119 | |
| | | | | | |
Frontier Emerging Small Countries Fund | | | | | | | | | | | | | | | | | | |
Assets | | | | | | | | | | | | | | | | | | |
Common Stocks | | Diversified Banks | | $ | 48,216,206 | | | $ | 8,753,658 | | | $ | — | | | $ | 56,969,864 | |
| | Food Retail | | | 13,283,826 | | | | 6,000,683 | | | | — | | | | 19,284,509 | |
| | Packaged Foods & Meats | | | 12,677,573 | | | | 5,633,143 | | | | — | | | | 18,310,716 | |
| | Pharmaceuticals | | | 15,066,206 | | | | 10,686,298 | | | | — | | | | 25,752,504 | |
| | Other | | | 130,119,236 | | | | — | | | | — | | | | 130,119,236 | |
Participation Notes | | | | | — | | | | 1,394,915 | | | | — | | | | 1,394,915 | |
Preferred Stocks | | | | �� | 6,926,169 | | | | — | | | | — | | | | 6,926,169 | |
Short-Term Investments | | | | | — | | | | 6,939,547 | | | | — | | | | 6,939,547 | |
Other Assets less Liabilities | | | | | 48,284,532 | | | | | | | | 4,770,837 | | | | 53,055,369 | |
| | | | | | |
| | | | $ | 274,573,748 | | | $ | 39,408,244 | | | $ | 4,770,837 | | | $ | 318,752,829 | |
| | | | | | |
Global Opportunities Fund | | | | | | | | | | | | | | | | | | |
Assets | | | | | | | | | | | | | | | | | | |
Common Stocks | | Consumer Finance | | $ | 3,273,584 | | | $ | 1,064,256 | | | $ | — | | | $ | 4,337,840 | |
| | Specialty Chemicals | | | — | | | | 1,136,171 | | | | — | | | | 1,136,171 | |
| | Other | | | 94,439,200 | | | | — | | | | — | | | | 94,439,200 | |
Warrants | | | | | 17,804 | | | | — | | | | — | | | | 17,804 | |
| | | | | | |
| | | | $ | 97,730,588 | | | $ | 2,200,427 | | | $ | — | | | $ | 99,931,015 | |
| | | | | | |
128
| | |
| | MARCH 31, 2017 (UNAUDITED) |
|
|
|
| | | | | | | | | | | | | | | | | | |
| Fund | | Category | | Quoted Prices
in Active Markets
for Identical
Investments
(Level 1) | | | Significant Other
Observable Inputs
(Level 2) | | | Significant
Unobservable
Inputs
(Level 3) | | | Value at
3/31/2017 | |
| | | | | | | | | | | | | | | | | | |
International Growth Fund | | | | | | | | | | | | | | | | | | |
Assets | | | | | | | | | | | | | | | | | | |
Common Stocks | | Home Improvement Retail | | $ | — | | | $ | 12,256,939 | | | $ | — | | | $ | 12,256,939 | |
| | Hotels, Resorts &
Cruise Lines | | | 14,766,088 | | | | 19,643,685 | | | | — | | | | 34,409,773 | |
| | Specialty Chemicals | | | 40,938,250 | | | | 13,321,852 | | | | — | | | | 54,260,102 | |
| | Other | | | 1,218,052,899 | | | | — | | | | — | | | | 1,218,052,899 | |
Short-Term Investments | | | | | — | | | | 8,797,037 | | | | — | | | | 8,797,037 | |
| | | | | | |
| | | | $ | 1,273,757,237 | | | $ | 54,019,513 | | | $ | — | | | $ | 1,327,776,750 | |
| | | | | | |
International Opportunities Fund | | | | | | | | | | | | | | | | | | |
Assets | | | | | | | | | | | | | | | | | | |
Common Stocks | | Advertising | | $ | — | | | $ | 3,492,179 | | | $ | — | | | $ | 3,492,179 | |
| | Food Retail | | | 30,825,221 | | | | 5,224,528 | | | | — | | | | 36,049,749 | |
| | Reinsurance | | | — | | | | 5,789,742 | | | | — | | | | 5,789,742 | |
| | Other | | | 587,589,375 | | | | — | | | | — | | | | 587,589,375 | |
Short-Term Investments | | | | | — | | | | 28,312,542 | | | | — | | | | 28,312,542 | |
Liabilities | | | | | | | | | | | | | | | | | | |
Liabilities less Other Assets | | | | | (7,176,060 | ) | | | | | | | 674,594 | | | | (6,501,466 | ) |
| | | | | | |
| | | | $ | 611,238,536 | | | $ | 42,818,991 | | | $ | 674,594 | | | $ | 654,732,121 | |
| | | | | | |
Large Cap Value Fund | | | | | | | | | | | | | | | | | | |
Assets | | | | | | | | | | | | | | | | | | |
Common Stocks | | | | $ | 182,915,175 | | | $ | — | | | $ | — | | | $ | 182,915,175 | |
Short-Term Investments | | | | | — | | | | 1,373,298 | | | | — | | | | 1,373,298 | |
| | | | | | |
| | | | $ | 182,915,175 | | | $ | 1,373,298 | | | $ | — | | | $ | 184,288,473 | |
| | | | | | |
Long/Short Fund | | | | | | | | | | | | | | | | | | |
Assets | | | | | | | | | | | | | | | | | | |
Common Stocks | | | | $ | 150,523,809 | | | $ | — | | | $ | — | | | $ | 150,523,809 | |
Limited Partnership Interest | | | | | 2,756,724 | | | | — | | | | — | | | | 2,756,724 | |
Short-Term Investments | | | | | — | | | | 49,827,125 | | | | — | | | | 49,827,125 | |
| | | | | | |
| | | | $ | 153,280,533 | | | $ | 49,827,125 | | | $ | — | | | $ | 203,107,658 | |
| | | | | | |
Liabilities | | | | | | | | | | | | | | | | | | |
Securities Sold Short | | | | $ | (86,555,756 | ) | | $ | — | | | $ | — | | | $ | (86,555,756 | ) |
| | | | | | |
| | | | $ | (86,555,756 | ) | | $ | — | | | $ | — | | | $ | (86,555,756 | ) |
| | | | | | |
Micro Cap Fund | | | | | | | | | | | | | | | | | | |
Assets | | | | | | | | | | | | | | | | | | |
Common Stocks | | Biotechnology | | $ | 19,243,834 | | | $ | 16,947 | | | $ | — | | | $ | 19,260,781 | |
| | Other | | | 251,892,318 | | | | — | | | | — | | | | 251,892,318 | |
Warrants | | | | | — | | | | — | | | | 169 | | | | 169 | |
Short-Term Investments | | | | | — | | | | 2,819,067 | | | | — | | | | 2,819,067 | |
| | | | | | |
| | | | $ | 271,136,152 | | | $ | 2,836,014 | | | $ | 169 | | | $ | 273,972,335 | |
| | | | | | |
Micro Cap Value Fund | | | | | | | | | | | | | | | | | | |
Assets | | | | | | | | | | | | | | | | | | |
Common Stocks | | | | $ | 180,896,545 | | | $ | — | | | $ | — | | | $ | 180,896,545 | |
Convertible Preferred Stocks | | | | | — | | | | — | | | | 1,424,257 | | | | 1,424,257 | |
Warrants | | | | | — | | | | — | | | | 25,000 | | | | 25,000 | |
Rights | | | | | — | | | | — | | | | 345,106 | | | | 345,106 | |
Limited Liability Company Membership Interest | | | | | — | | | | — | | | | 51,475 | | | | 51,475 | |
Short-Term Investments | | | | | — | | | | 5,707,476 | | | | — | | | | 5,707,476 | |
| | | | | | |
| | | | $ | 180,896,545 | | | $ | 5,707,476 | | | $ | 1,845,838 | | | $ | 188,449,859 | |
| | | | | | |
129
Notes to Financial Statements (continued)
| | | | | | | | | | | | | | | | | | |
| Fund | | Category | | Quoted Prices
in Active Markets
for Identical
Investments
(Level 1) | | | Significant Other
Observable Inputs
(Level 2) | | | Significant
Unobservable
Inputs
(Level 3) | | | Value at
3/31/2017 | |
| | | | | | | | | | | | | | | | | | |
Small Cap Growth Fund | | | | | | | | | | | | | | | | | | |
Assets | | | | | | | | | | | | | | | | | | |
Common Stocks | | Biotechnology | | $ | 129,764,072 | | | $ | 59,266 | | | $ | — | | | $ | 129,823,338 | |
| | Other | | | 1,513,019,011 | | | | — | | | | — | | | | 1,513,019,011 | |
Preferred Stocks | | | | | — | | | | — | | | | 43,504,501 | | | | 43,504,501 | |
Limited Partnership Interests1 | | | | | — | | | | — | | | | — | | | | 3,490,593 | |
Warrants | | | | | — | | | | — | | | | 39,508 | | | | 39,508 | |
Short-Term Investments | | | | | — | | | | 36,988,153 | | | | — | | | | 36,988,153 | |
| | | | | | |
| | | | $ | 1,642,783,083 | | | $ | 37,047,419 | | | $ | 43,544,009 | | | $ | 1,726,865,104 | |
| | | | | | |
Small Cap Value Fund | | | | | | | | | | | | | | | | | | |
Assets | | | | | | | | | | | | | | | | | | |
Common Stocks | | | | $ | 329,454,153 | | | $ | — | | | $ | — | | | $ | 329,454,153 | |
Limited Partnership Interest | | | | | 5,588,439 | | | | — | | | | — | | | | 5,588,439 | |
Warrants | | | | | — | | | | — | | | | 9,830 | | | | 9,830 | |
Short-Term Investments | | | | | — | | | | 10,563,263 | | | | — | | | | 10,563,263 | |
| | | | | | |
| | | | $ | 335,042,592 | | | $ | 10,563,263 | | | $ | 9,830 | | | $ | 345,615,685 | |
| | | | | | |
Strategic Income Fund | | | | | | | | | | | | | | | | | | |
Assets | | | | | | | | | | | | | | | | | | |
Common Stocks | | Diversified REITs | | $ | 996,265 | | | $ | — | | | $ | 497,999 | | | $ | 1,494,264 | |
| | Other | | | 34,012,999 | | | | — | | | | — | | | | 34,012,999 | |
Exchange-Traded Funds | | | | | 47,008 | | | | — | | | | — | | | | 47,008 | |
Limited Liability Company Membership Interest | | | | | 492,313 | | | | — | | | | — | | | | 492,313 | |
Limited Partnership Interest | | | | | 4,029,744 | | | | — | | | | — | | | | 4,029,744 | |
Short-Term Investments | | | | | — | | | | 8,231,817 | | | | — | | | | 8,231,817 | |
| | | | | | |
| | | | $ | 39,578,329 | | | $ | 8,231,817 | | | $ | 497,999 | | | $ | 48,308,145 | |
| | | | | | |
Ultra Growth Fund | | | | | | | | | | | | | | | | | | |
Assets | | | | | | | | | | | | | | | | | | |
Common Stocks | | Biotechnology | | $ | 12,385,512 | | | $ | 8,247 | | | $ | — | | | $ | 12,393,759 | |
| | Other | | | 80,615,578 | | | | — | | | | — | | | | 80,615,578 | |
Preferred Stocks | | | | | — | | | | — | | | | 1,538,701 | | | | 1,538,701 | |
Limited Partnership Interests1 | | | | | — | | | | — | | | | — | | | | 3,255,923 | |
Warrants | | | | | — | | | | — | | | | 1,273 | | | | 1,273 | |
Short-Term Investments | | | | | — | | | | 1,573,073 | | | | — | | | | 1,573,073 | |
| | | | | | |
| | | | $ | 93,001,090 | | | $ | 1,581,320 | | | $ | 1,539,974 | | | $ | 99,378,307 | |
| | | | | | |
World Innovators Fund | | | | | | | | | | | | | | | | | | |
Assets | | | | | | | | | | | | | | | | | | |
Common Stocks | | | | $ | 154,788,158 | | | $ | — | | | $ | — | | | $ | 154,788,158 | |
Exchange-Traded Funds | | | | | 88,140 | | | | — | | | | — | | | | 88,140 | |
Limited Partnership Interest1 | | | | | — | | | | — | | | | — | | | | 234,661 | |
Short-Term Investments | | | | | — | | | | 23,669,945 | | | | — | | | | 23,669,945 | |
| | | | | | |
| | | | $ | 154,876,298 | | | $ | 23,669,945 | | | $ | — | | | $ | 178,780,904 | |
| | | | | | |
Income Fund | | | | | | | | | | | | | | | | | | |
Assets | | | | | | | | | | | | | | | | | | |
Asset-Backed Securities | | | | $ | — | | | $ | 11,925,485 | | | $ | 1,000,625 | | | $ | 12,926,110 | |
Collateralized Mortgage Obligations | | | | | — | | | | 11,410,361 | | | | — | | | | 11,410,361 | |
Commercial Mortgage-Backed Securities | | | | | — | | | | 42,163 | | | | — | | | | 42,163 | |
Corporate Bonds | | | | | — | | | | 52,984,047 | | | | — | | | | 52,984,047 | |
Municipal Bonds | | | | | — | | | | 5,141,062 | | | | — | | | | 5,141,062 | |
U.S. Government Agency Securities | | | | | — | | | | 4,373,089 | | | | — | | | | 4,373,089 | |
U.S. Treasury Inflation-Protected Bonds | | | | | — | | | | 2,017,344 | | | | — | | | | 2,017,344 | |
U.S. Treasury Notes | | | | | — | | | | 8,436,128 | | | | — | | | | 8,436,128 | |
Short-Term Investments | | | | | — | | | | 517,824 | | | | — | | | | 517,824 | |
| | | | | | |
| | | | $ | — | | | $ | 96,847,503 | | | $ | 1,000,625 | | | $ | 97,848,128 | |
| | | | | | |
130
| | |
| | MARCH 31, 2017 (UNAUDITED) |
|
|
|
| | | | | | | | | | | | | | | | | | |
| Fund | | Category | | Quoted Prices
in Active Markets
for Identical
Investments
(Level 1) | | | Significant Other
Observable Inputs
(Level 2) | | | Significant
Unobservable
Inputs
(Level 3) | | | Value at
3/31/2017 | |
| | | | | | | | | | | | | | | | | | |
U.S. Treasury Fund | | | | | | | | | | | | | | | | | | |
Assets | | | | | | | | | | | | | | | | | | |
U.S. Government Obligations | | | | $ | — | | | $ | 300,733,395 | | | $ | — | | | $ | 300,733,395 | |
Short-Term Investments | | | | | — | | | | 3,493,284 | | | | — | | | | 3,493,284 | |
| | | | | | |
| | | | $ | — | | | $ | 304,226,679 | | | $ | — | | | $ | 304,226,679 | |
| | | | | | |
| 1 | Certain investments measured at fair value using the net asset value per share (or its equivalent) practical expedient have not been classified in the fair value levels. The fair value amounts presented in the table are intended to permit reconciliation to the amounts presented in the Schedule of Investments. |
| | | | | | | | | | | | | | | | |
| Fund | | Fair Value
at 3/31/2017 | | | Unfunded
Commitments | | | Redemption
Frequency
(if currently
eligible) | | | Redemption
Notice Period | |
Small Cap Growth Fund | | | | | | | | | | | | | | | | |
Limited Partnership Interests1 | | $ | 3,490,593 | | | $ | 45,000 | | | | — | | | | — | |
Ultra Growth Fund | | | | | | | | | | | | | | | | |
Limited Partnership Interests1 | | $ | 3,255,923 | | | $ | 45,000 | | | | — | | | | — | |
World Innovators Fund | | | | | | | | | | | | | | | | |
Limited Partnership Interest1 | | $ | 234,661 | | | $ | — | | | | — | | | | — | |
| 1 | The fair values of these limited partnership interests have been estimated using the net asset value of the Fund’s Limited Partner’s Capital Account. These limited partnership interests can never be redeemed. Distributions from each limited partnership will be received as the underlying investments are liquidated. It is estimated that the underlying assets of the limited partnerships will be liquidated over the next one to five years. |
If the securities of an Asset Class are all the same level, the asset class is shown in total. If the securities of an Asset Class cross levels, the level with the smallest number of categories and with multiple levels within a category is displayed by category. The remaining categories that do not cross levels are combined into the “Other” category.
The valuation techniques used by the Funds to measure fair value for the six months ended March 31, 2017 maximized the use of observable inputs and minimized the use of unobservable inputs.
The Funds’ policy is to recognize transfers between levels at the end of the reporting period. The table below shows the significant transfers between Level 1 and Level 2 due to fair valuation in certain foreign markets pursuant to a systematic valuation model.
| | | | | | | | |
| Fund | | Transfers Out
Of Level 1 at
Market Value | | | Transfers Into
Level 2 at
Market Value | |
Frontier Emerging Small Countries Fund | | $ | 14,152,799 | | | $ | 14,152,799 | |
| | |
| Fund | | Transfers Out
Of Level 2 at
Market Value | | | Transfers Into
Level 1 at
Market Value | |
Frontier Emerging Small Countries Fund | | $ | 5,479,147 | | | $ | 5,479,147 | |
International Opportunities Fund | | | 7,894,359 | | | | 7,894,359 | |
Small Cap Growth Fund | | | 48,947,470 | | | | 48,947,470 | |
There were transfers of $670,810 in the Emerging India Fund and $1,124,558 in the Global Opportunities Fund from Level 3 to Level 1 due to a change in pricing strategy on a private company that came public. This transfer amount represents the beginning of the period value for ICICI Prudential Life Insurance Co. Ltd., which transferred to Level 1 during the period in order to properly represent the activity on the Level 3 Rollforward presented below.
There were transfers of $572,597 in the Strategic Income Fund from Level 1 to Level 3 due to a reincorporation. This transfer amount represents the value for Star Asia Capital Corp Ltd., which transferred to Level 3 during the period in order to properly represent the activity on the Level 3 Rollforward presented below.
During the period $4,770,837 in the Frontier Emerging Small Countries Fund and $674,594 in the International Opportunities Fund was transferred from Level 1 to Level 3 due to the fair valuation of naira, the Nigerian currency.
There were transfers out of Level 3 of $3,635,554 in the Small Cap Growth Fund, $3,388,501 in the Ultra Growth Fund and $247,043 in the World Innovators Fund due to a change that eliminates the requirement to categorize within the fair value hierarchy investments whose fair values are measured at net asset value per share (or its equivalent) using the practical expedient. This transfer amount represents the beginning of the period value for Greenspring Global Partners II-B, L.P. and Greenspring Global Partners III-B, L.P, which transferred during the period in order to properly represent the activity on the Level 3 Rollforward presented below.
131
Notes to Financial Statements (continued)
The following is a reconciliation of the fair valuations using significant unobservable inputs (Level 3) for the Funds during the six months ended March 31, 2017:
| | | | | | | | | | | | | | | | | | | | | | | | | | | | | | | | | | | | | | | | |
| Fund | | Market Value
Beginning
Balance
9/30/2016 | | | Purchases
at Cost | | | Sales
(Proceeds) | | | Accrued
Discounts
(Premiums) | | | Realized
Gain/
(Loss) | | | Change in
Unrealized
Appreciation
(Depreciation) | | | Transfers
in at
Market
Value | | | Transfers
out at
Market
Value | | | Market
Value
Ending
Balance
3/31/2017 | | | Net Change in
Unrealized
Appreciation
(Depreciation) on
Investments Held
at 3/31/2017 | |
Core Growth Fund | | | | | | | | | | | | | | | | | | | | | | | | | | | | | | | | | | | | | | | | |
Preferred Stocks | | $ | 3,257,725 | | | $ | — | | | $ | — | | | $ | — | | | $ | — | | | $ | 211,595 | | | $ | — | | | $ | — | | | $ | 3,469,320 | | | $ | 211,595 | |
Warrants | | | 193,457 | | | | — | | | | — | | | | — | | | | — | | | | (175,897 | ) | | | — | | | | — | | | | 17,560 | | | | (175,897 | ) |
| | | | |
| | | 3,451,182 | | | | — | | | | — | | | | — | | | | — | | | | 35,698 | | | | — | | | | — | | | | 3,486,880 | | | | 35,698 | |
| | | | |
Emerging India Fund | | | | | | | | | | | | | | | | | | | | | | | | | | | | | | | | | | | | | | | | |
Common Stocks | | | 670,810 | | | | 2,554,113 | | | | — | | | | — | | | | — | | | | 2,904,650 | | | | — | | | | (670,810 | ) | | | 5,458,763 | | | | 2,904,650 | |
| | | | |
| | | 670,810 | | | | 2,554,113 | | | | — | | | | — | | | | — | | | | 2,904,650 | | | | — | | | | (670,810 | ) | | | 5,458,763 | | | | 2,904,650 | |
| | | | |
Emerging Markets Small Cap Fund | | | | | | | | | | | | | | | | | | | | | | | | | | | | | | | | | | | | | | | | |
Common Stocks | | | 16,783 | | | | — | | | | — | | | | — | | | | — | | | | (33 | ) | | | — | | | | — | | | | 16,750 | | | | (33 | ) |
| | | | |
| | | 16,783 | | | | — | | | | — | | | | — | | | | — | | | | (33 | ) | | | — | | | | — | | | | 16,750 | | | | (33 | ) |
| | | | |
Frontier Emerging Small Countries Fund | | | | | | | | | | | | | | | | | | | | | | | | | | | | | | | | | | | | | | | | |
Other Assets less Liabilities | | | — | | | | — | | | | — | | | | — | | | | — | | | | — | | | | 4,770,837 | | | | — | | | | 4,770,837 | | | | — | |
| | | | |
| | | — | | | | — | | | | — | | | | — | | | | — | | | | — | | | | 4,770,837 | | | | — | | | | 4,770,837 | | | | — | |
| | | | |
Global Opportunities Fund | | | | | | | | | | | | | | | | | | | | | | | | | | | | | | | | | | | | | | | | |
Common Stocks | | | 1,124,588 | | | | — | | | | — | | | | — | | | | — | | | | — | | | | — | | | | (1,124,588 | ) | | | — | | | | — | |
| | | | |
| | | 1,124,588 | | | | — | | | | — | | | | — | | | | — | | | | — | | | | — | | | | (1,124,588 | ) | | | — | | | | — | |
| | | | |
International Opportunities Fund | | | | | | | | | | | | | | | | | | | | | | | | | | | | | | | | | | | | | | | | |
Other Assets less Liabilities | | | — | | | | — | | | | — | | | | — | | | | — | | | | — | | | | 674,594 | | | | — | | | | 674,594 | | | | — | |
| | | | |
| | | — | | | | — | | | | — | | | | — | | | | — | | | | — | | | | 674,594 | | | | — | | | | 674,594 | | | | — | |
| | | | |
Micro Cap Fund | | | | | | | | | | | | | | | | | | | | | | | | | | | | | | | | | | | | | | | | |
Warrants | | | 16,031 | | | | — | | | | — | | | | — | | | | — | | | | (15,862 | ) | | | — | | | | — | | | | 169 | | | | (15,862 | ) |
| | | | |
| | | 16,031 | | | | — | | | | — | | | | — | | | | — | | | | (15,862 | ) | | | — | | | | — | | | | 169 | | | | (15,862 | ) |
| | | | |
Micro Cap Value Fund | | | | | | | | | | | | | | | | | | | | | | | | | | | | | | | | | | | | | | | | |
Convertible Preferred Stock | | | 1,387,781 | | | | 49,777 | | | | — | | | | — | | | | — | | | | (13,301 | ) | | | — | | | | — | | | | 1,424,257 | | | | (13,301 | ) |
Rights | | | 37,500 | | | | — | | | | — | | | | — | | | | — | | | | 307,606 | | | | — | | | | — | | | | 345,106 | | | | 307,606 | |
Limited Liability Company Membership Interest | | | — | | | | 30,001 | | | | — | | | | — | | | | — | | | | 21,474 | | | | — | | | | — | | | | 51,475 | | | | 21,474 | |
Preferred Stocks | | | 1,379,998 | | | | — | | | | (809,588 | ) | | | — | | | | 309,589 | | | | (879,999 | ) | | | — | | | | — | | | | — | | | | (879,999 | ) |
Warrants | | | 25,000 | | | | — | | | | — | | | | — | | | | — | | | | — | | | | — | | | | — | | | | 25,000 | | | | — | |
| | | | |
| | | 2,830,279 | | | | 79,778 | | | | (809,588 | ) | | | — | | | | 309,589 | | | | (564,220 | ) | | | — | | | | — | | | | 1,845,838 | | | | (564,220 | ) |
| | | | |
Small Cap Growth Fund | | | | | | | | | | | | | | | | | | | | | | | | | | | | | | | | | | | | | | | | |
Preferred Stocks | | | 37,948,338 | | | | — | | | | — | | | | — | | | | — | | | | 5,556,163 | | | | — | | | | — | | | | 43,504,501 | | | | 5,556,163 | |
Limited Partnership Interests | | | 3,635,554 | | | | — | | | | — | | | | — | | | | — | | | | — | | | | — | | | | (3,635,554 | ) | | | — | | | | — | |
Warrants | | | 484,816 | | | | — | | | | — | | | | — | | | | — | | | | (445,308 | ) | | | — | | | | — | | | | 39,508 | | | | (445,308 | ) |
| | | | |
| | | 42,068,708 | | | | — | | | | — | | | | — | | | | — | | | | 5,110,855 | | | | — | | | | (3,635,554 | ) | | | 43,544,009 | | | | 5,110,855 | |
| | | | |
Small Cap Value Fund | | | | | | | | | | | | | | | | | | | | | | | | | | | | | | | | | | | | | | | | |
Warrants | | | 108,300 | | | | — | | | | — | | | | — | | | | — | | | | (98,470 | ) | | | — | | | | — | | | | 9,830 | | | | (98,470 | ) |
| | | | |
| | | 108,300 | | | | — | | | | — | | | | — | | | | — | | | | (98,470 | ) | | | — | | | | — | | | | 9,830 | | | | (98,470 | ) |
| | | | |
Strategic Income Fund | | | | | | | | | | | | | | | | | | | | | | | | | | | | | | | | | | | | | | | | |
Common Stocks | | | — | | | | — | | | | — | | | | — | | | | — | | | | (74,598 | ) | | | 572,597 | | | | — | | | | 497,999 | | | | (74,598 | ) |
Corporate Bonds | | | 314 | | | | — | | | | (340 | ) | | | — | | | | (151,652 | ) | | | 151,678 | | | | — | | | | — | | | | — | | | | — | |
| | | | |
| | | 314 | | | | — | | | | (340 | ) | | | — | | | | (151,652 | ) | | | 77,080 | | | | 572,597 | | | | — | | | | 497,999 | | | | (74,598 | ) |
| | | | |
132
| | |
| | MARCH 31, 2017 (UNAUDITED) |
|
|
|
| | | | | | | | | | | | | | | | | | | | | | | | | | | | | | | | | | | | | | | | |
| Fund | | Market Value
Beginning
Balance
9/30/2016 | | | Purchases
at Cost | | | Sales
(Proceeds) | | | Accrued
Discounts
(Premiums) | | | Realized
Gain/
(Loss) | | | Change in
Unrealized
Appreciation
(Depreciation) | | | Transfers
in at
Market
Value | | | Transfers
out at
Market
Value | | | Market
Value
Ending
Balance
3/31/2017 | | | Net Change in
Unrealized
Appreciation
(Depreciation) on
Investments Held
at 3/31/2017 | |
Ultra Growth Fund | | | | | | | | | | | | | | | | | | | | | | | | | | | | | | | | | | | | | | | | |
Preferred Stocks | | $ | 1,251,300 | | | $ | — | | | $ | — | | | $ | — | | | $ | — | | | $ | 287,401 | | | $ | — | | | $ | — | | | $ | 1,538,701 | | | $ | 287,401 | |
Limited Partnership Interests | | | 3,388,501 | | | | — | | | | — | | | | — | | | | — | | | | — | | | | — | | | | (3,388,501 | ) | | | — | | | | — | |
Warrants | | | 20,924 | | | | — | | | | — | | | | — | | | | — | | | | (19,651 | ) | | | — | | | | — | | | | 1,273 | | | | (19,651 | ) |
| | | | |
| | | 4,660,725 | | | | — | | | | — | | | | — | | | | — | | | | 267,750 | | | | — | | | | (3,388,501 | ) | | | 1,539,974 | | | | 267,750 | |
| | | | |
World Innovators Fund | | | | | | | | | | | | | | | | | | | | | | | | | | | | | | | | | | | | | | | | |
Limited Partnership Interest | | | 247,043 | | | | — | | | | — | | | | — | | | | — | | | | — | | | | — | | | | (247,043 | ) | | | — | | | | — | |
| | | | |
| | | 247,043 | | | | — | | | | — | | | | — | | | | — | | | | — | | | | — | | | | (247,043 | ) | | | — | | | | — | |
| | | | |
Income Fund | | | | | | | | | | | | | | | | | | | | | | | | | | | | | | | | | | | | | | | | |
Asset-Backed Securities | | | — | | | | 1,000,000 | | | | — | | | | — | | | | — | | | | 625 | | | | — | | | | — | | | | 1,000,625 | | | | 625 | |
| | | | |
| | | — | | | | 1,000,000 | | | | — | | | | — | | | | — | | | | 625 | | | | — | | | | — | | | | 1,000,625 | | | | 625 | |
| | | | |
QUANTITATIVE INFORMATION ABOUT LEVEL 3 FAIR VALUE MEASUREMENTS
| | | | | | | | | | | | | | |
| Fund | | Description | | Fair Value
at 3/31/2017 | | | Valuation Technique | | Unobservable Input | | Range
(Average) | |
Core Growth Fund | | Direct Venture Capital Investments: Systems Software | | $ | 3,469,320 | | | Market comparable companies | | EV/R* multiple
Discount for lack of marketability | | | 5.6 - 8.2 (7.0) 20% | |
Emerging India Fund | | Common Stock: Food Retail | | $ | 5,458,763 | | | Discount to market | | Discount for lack of marketability | | | 2% | |
Frontier Emerging Small Countries Fund | | Other Assets less Liabilities: Nigerian Naira | | $ | 4,770,837 | | | Discount for lack of marketability of currency | | Discount for lack of marketability of currency | | | 35% | |
International Opportunities Fund | | Other Assets less Liabilities: Nigerian Naira | | $ | 674,594 | | | Discount for lack of marketability of currency | | Discount for lack of marketability of currency | | | 35% | |
Micro Cap Value Fund | | Rights: Pharmaceuticals | | $ | 326,356 | | | Probability of receipt | | Probability of receipt | | | 50% | |
Micro Cap Value Fund | | Private Investment in a Public Equity: Oil & Gas Refining & Marketing | | $ | 1,424,257 | | | Underlying price Liquidation preference | | Probability weighting Probability weighting | | | 25% 75% | |
Small Cap Growth Fund | | Direct Venture Capital Investments: Biotechnology | | $ | 760,440 | | | Market comparable companies | | EV/R* multiple
Discount for lack of marketability | | | 1.1 - 9.5 (5.2) 20% | |
Small Cap Growth Fund | | Direct Venture Capital Investments: Computer Services Software & Systems | | $ | 6,397,861 | | | Liquidation preference | | Probability weighting | | | 80% | |
Small Cap Growth Fund | | Direct Venture Capital Investments: Oil & Gas Equipment & Services | | $ | 14,386,444 | | | Market comparable companies | | EV/R* multiple
Discount for lack of marketability | | | 1.3 - 9.2 (5.7) 20% | |
Small Cap Growth Fund | | Direct Venture Capital Investments: Systems Software | | $ | 13,950,989 | | | Market comparable companies | | EV/R* multiple
Discount for lack of marketability | | | 5.6 - 8.2 (7.0) 20% | |
Small Cap Growth Fund | | Direct Venture Capital Investments: Systems Software | | $ | 8,008,767 | | | Market comparable companies | | EV/R* multiple
Discount for lack of marketability | | | 3.5 - 6.5 (5.1) 20% | |
Strategic Income Fund | | Common Stock: Diversified REITs | | $ | 498,000 | | | Last trade | | Last trade | | | 100% | |
Ultra Growth Fund | | Direct Venture Capital Investments: Biotechnology | | $ | 190,111 | | | Market comparable companies | | EV/R* multiple
Discount for lack of marketability | | | 1.1 - 9.5 (5.2) 20% | |
Ultra Growth Fund | | Direct Venture Capital Investments: Health Care Technology | | $ | 270,778 | | | Probability of completion of repurchase | | Discount to repurchase amount | | | 20% | |
133
Notes to Financial Statements (continued)
| | | | | | | | | | | | | | |
| Fund | | Description | | Fair Value
at 3/31/2017 | | | Valuation Technique | | Unobservable Input | | Range
(Average) | |
Ultra Growth Fund | | Direct Venture Capital Investments: Oil & Gas Equipment & Services | | $ | 1,077,812 | | | Market comparable companies | | EV/R* multiple
Discount for lack of marketability | | | 1.3 - 9.2 (5.7) 20% | |
Income Fund | | Asset Backed Security | | $ | 1,000,625 | | | Broker bid | | Broker bid | | | 100% | |
| * | Enterprise-Value-To-Revenue Multiple — (“EV/R”) is a measure of the value of a stock that compares a company’s enterprise value to its revenue. |
Changes in multiples may change the fair value of an investment. Generally, a decrease in this multiple will result in a decrease in the fair value of an investment.
The Funds’ other Level 3 investments have been valued using observable inputs, unadjusted third-party transactions and quotations or unadjusted historical third party information. No unobservable inputs internally developed by the Funds have been applied to these investments, thus they have been excluded from the above table.
14. OFFSETTING
Each Fund is party to various netting arrangements. The FASB requires disclosure about certain netting arrangements and similar agreements to enable users of a Fund’s financial statements to evaluate the effect or potential effect of netting arrangements on the Fund’s financial position. The scope of the disclosure is limited to derivative instruments, repurchase agreements and reverse repurchase agreements, and securities borrowing and securities lending transactions.
The following tables present information about financial instruments that were subject to enforceable netting arrangements as of March 31, 2017:
REPURCHASE AGREEMENTS
| | | | | | | | | | | | | | | | | | |
| | | Gross Amounts Not Offset in the Statements of Assets and Liabilities | |
| Fund | | Counterparty | | Gross Asset Amounts
Presented in Statements
of Assets and Liabilities | | | Financial
Instrument | | | Collateral
Received1 | | | Net Amount
(not less
than 0) | |
Core Growth Fund | | State Street Bank and Trust Co. | | $ | 84,063,501 | | | $ | — | | | $ | (84,063,501 | ) | | $ | — | |
Emerging India Fund | | State Street Bank and Trust Co. | | | 6,732,462 | | | | — | | | | (6,732,462 | ) | | | — | |
Emerging Markets Select Fund | | State Street Bank and Trust Co. | | | 823,425 | | | | — | | | | (823,425 | ) | | | — | |
Emerging Markets Small Cap Fund | | State Street Bank and Trust Co. | | | 7,011,989 | | | | — | | | | (7,011,989 | ) | | | — | |
Frontier Emerging Small Countries Fund | | State Street Bank and Trust Co. | | | 6,939,547 | | | | — | | | | (6,939,547 | ) | | | — | |
Global Opportunities Fund | | State Street Bank and Trust Co. | | | — | | | | — | | | | — | | | | — | |
International Growth Fund | | State Street Bank and Trust Co. | | | 8,797,037 | | | | — | | | | (8,797,037 | ) | | | — | |
International Opportunities Fund | | State Street Bank and Trust Co. | | | 28,312,542 | | | | — | | | | (28,312,542 | ) | | | — | |
Large Cap Value Fund | | State Street Bank and Trust Co. | | | 1,373,298 | | | | — | | | | (1,373,298 | ) | | | — | |
Long/Short Fund | | State Street Bank and Trust Co. | | | 49,827,125 | | | | — | | | | (49,827,125 | ) | | | — | |
Micro Cap Fund | | State Street Bank and Trust Co. | | | 2,819,067 | | | | — | | | | (2,819,067 | ) | | | — | |
Micro Cap Value Fund | | State Street Bank and Trust Co. | | | 5,707,476 | | | | — | | | | (5,707,476 | ) | | | — | |
Small Cap Growth Fund | | State Street Bank and Trust Co. | | | 36,988,153 | | | | — | | | | (36,988,153 | ) | | | — | |
Small Cap Value Fund | | State Street Bank and Trust Co. | | | 10,563,263 | | | | — | | | | (10,563,263 | ) | | | — | |
Strategic Income Fund | | State Street Bank and Trust Co. | | | 8,231,817 | | | | — | | | | (8,231,817 | ) | | | — | |
Ultra Growth Fund | | State Street Bank and Trust Co. | | | 1,573,073 | | | | — | | | | (1,573,073 | ) | | | — | |
World Innovators Fund | | State Street Bank and Trust Co. | | | 23,669,945 | | | | — | | | | (23,669,945 | ) | | | — | |
Income Fund | | State Street Bank and Trust Co. | | | 517,824 | | | | — | | | | (517,824 | ) | | | — | |
U.S. Treasury Fund | | State Street Bank and Trust Co. | | | 3,493,284 | | | | — | | | | (3,493,284 | ) | | | — | |
| 1 | Repurchase agreements are classified as short-term investments in the Statements of Assets and Liabilities. The market value of the collateral received is greater than the amounts indicated in the table. For further information, see Note 3 — Securities and Other Investments “Repurchase Agreements” and the Schedules of Investments. |
| | | | | | | | | | | | | | | | | | |
SECURITIES BORROWEDFOR SHORT SALES | | | | | | | | | | | | | | | | | | |
| | | | | Gross Amounts Not Offset in the Statements of Assets and Liabilities | |
| Fund | | Counterparty | | Gross Liability Amounts Presented in Statements of Assets and Liabilities | | | Financial Instrument | | | Collateral Pledged1 | | | Net Amount (Not Less Than 0) | |
Long/Short Fund | | JPMorgan Chase | | $ | 86,555,756 | | | $ | — | | | $ | (86,555,756 | ) | | $ | — | |
| 1 | The market value of the collateral received is greater than the amounts indicated in the table. For further information, see Note 3 — Securities and Other Investments “Short Sales” and the Schedule of Investments. |
134
| | |
| | MARCH 31, 2017 (UNAUDITED) |
|
|
|
15. FAIR VALUEOF DERIVATIVE INSTRUMENTS*
The following is a summary of the fair valuations of the Funds’ derivative instruments categorized by risk exposure:
WASATCH LARGE CAP VALUE FUND
The Effect of Derivative Instruments on the Statement of Operations for the six months ended March 31, 2017:
| | | | | | | | | | | | | | | | | | | | | | | | |
| | | Derivatives not accounted for as hedging instruments under Statement 133 | |
| | | Interest Rate
Contracts | | | Foreign Exchange
Contracts | | | Credit
Contracts | | | Equity
Contracts | | | Other
Contracts | | | Total | |
Realized Gain on Derivatives Recognized in Income | | | | |
Net realized gain on options written | | $ | — | | | $ | — | | | $ | — | | | $ | 99,363 | | | $ | — | | | $ | 99,363 | |
| | | | |
WASATCH WORLD INNOVATORS FUND
Fair Values of Derivative Instruments on the Statement of Assets and Liabilities as of March 31, 2017:
| | | | | | | | | | | | | | | | | | | | | | | | |
| | | Derivatives not accounted for as hedging instruments under Statement 133 | |
| | | Interest Rate
Contracts | | | Foreign Exchange
Contracts | | | Credit
Contracts | | | Equity
Contracts | | | Other
Contracts | | | Total | |
Asset Derivatives | | | | | | | | | | | | | | | | | | | | | | | | |
Unrealized appreciation of foreign currency exchange contracts | | $ | — | | | $ | 94,191 | | | $ | — | | | $ | — | | | $ | — | | | $ | 94,191 | |
Liabilities Derivatives | | | | | | | | | | | | | | | | | | | | | | | | |
Unrealized depreciation of foreign currency exchange contracts | | $ | — | | | $ | (420,260 | ) | | $ | — | | | $ | — | | | $ | — | | | $ | (420,260 | ) |
| | | | |
The Effect of Derivative Instruments on the Statement of Operations for the six months ended March 31, 2017:
| | | | | | | | | | | | | | | | | | | | | | | | |
| | | Derivatives not accounted for as hedging instruments under Statement 133 | |
| | | Interest Rate
Contracts | | | Foreign Exchange
Contracts | | | Credit
Contracts | | | Equity
Contracts | | | Other
Contracts | | | Total | |
Realized Gain on Derivatives Recognized in Income | | | | | | | | | | | | | | | | | | | | | | | | |
Net realized gain on investments and foreign currency translations | | $ | — | | | $ | 1,387,200 | | | $ | — | | | $ | — | | | $ | — | | | $ | 1,387,200 | |
| | | | |
Net Change in Unrealized Appreciation (Depreciation)
on Derivatives Recognized in Income | | | | | | | | | | | | | | | | | | | | | | | | |
Change in unrealized appreciation (depreciation) on investments and foreign currency translations | | $ | — | | | $ | (212,702 | ) | | $ | — | | | $ | — | | | $ | — | | | $ | (212,702 | ) |
| | | | |
For the six months ended March 31, 2017, the average monthly balance of outstanding derivative financial instruments was as follows:
| | | | | | | | | | |
| | | Large Cap
Value Fund | | | | | World
Innovators Fund | |
Option contracts: | | | | | | Forward currency contracts: | | | | |
Average number of call contracts written | | | 50 | | | Average number of contracts — U.S. dollars purchased | | | — | 1 |
Average value of call contracts written | | $ | 15,792 | | | Average U.S. dollar amounts | | $ | 2,944,400 | |
| | | | | | Average number of contracts — U.S. dollars sold | | | — | 1 |
| | | | | | Average U.S. dollar amounts sold | | $ | 3,500,000 | |
| * | See Note 4 — Financial Derivative Instruments for additional information. |
| 1 | Amount represents less than 0.05. |
16. SUBSEQUENT EVENTS
Management has evaluated the possibility of subsequent events and has determined that there are no additional events that would require adjustment to or additional disclosure in the Funds’ financial statements.
135
Supplemental Information
MANAGEMENT INFORMATION
The business affairs of Wasatch Funds are overseen by its Board of Trustees. The Board consists of five Independent Trustees and one Interested Trustee. Three of the Independent Trustees and the Interested Trustee were elected by shareholders to serve until their successors are qualified, appointed or elected in accordance with the Trust’s Declaration of Trust and By-Laws. Two Independent Trustees have been appointed by the elected Independent Trustees to serve until his or her successor is qualified, appointed or elected in accordance with the Trust’s Declaration of Trust and By-Laws.
The Trustees and executive officers of Wasatch Funds and their principal occupations for at least the last five years are set forth below. The Advisor retains proprietary rights to the Trust name.
| | | | | | | | | | | | |
Name, Address
and Age | | Position(s)
Held with
Wasatch Funds | | Term of Office1
and Length of
Time Served | | Principal Occupation(s)
during Past 5 Years | | Number of
Portfolios
in Fund
Complex
Overseen
by Trustee | | | Other Directorships
Held by Trustees
during Past 5 Years2 |
Independent Trustees | | | | | | | | | | | | |
| | | | | |
James U. Jensen, J.D., MBA 505 Wakara Way
3rd Floor Salt Lake City, UT 84108
Age 72 | | Trustee and Chairman of the Board | | Indefinite Served as Chairman of the Board since 2004 and Trustee since 1986 | | Chief Executive Officer of Clearwater Law & Governance Group (an operating law firm board governance consulting company) April 2008 to present; Co-Founder and Chairman of the Board of Intelisum, Inc. (a company pursuing computer and measurement technology and products) 2001 - 2008; Consultant on corporate growth and technology transfer since 2004; Vice President, Corporate Development, Legal Affairs and General Counsel, and Secretary, NPS Pharmaceuticals, Inc. from 1991 to 2004. | | | 19 | | | Director and Board Chairman of Agricon Global Corporation (formerly known as Bayhill Capital Corporation (telephone communications) from December 2007 to February 2014; Trustee, Northern Lights Fund Trust III (30 portfolios) since 2012. |
| | | | | |
D. James Croft, Ph.D. 505 Wakara Way
3rd Floor
Salt Lake City, UT 84108
Age 75 | | Trustee and Chairman of the Governance and Nominating Committee | | Indefinite Served as Trustee since 2005 | | Consultant to the mortgage industry on issues of mortgage quality, identification of mortgage fraud, strategic planning and client development since 2004; Founder & Executive Director, Mortgage Asset Research Institute, from 1990 to 2004. | | | 19 | | | None |
| | | | | |
Miriam M. Allison 505 Wakara Way
3rd Floor Salt Lake City, UT 84108
Age 69 | | Trustee and Chairman of the Audit Committee | | Indefinite Served as Trustee since 2010 | | Rancher since 2004. From 2001 to 2005, Chairman of UMB Fund Services, Inc. | | | 19 | | | Director, Northwestern Mutual Series Fund, Inc. (27 portfolios) since 2006. |
| | | | | |
Heikki Rinne 505 Wakara Way
3rd Floor Salt Lake City, UT 84108
Age 64 | | Trustee | | Indefinite Served as Trustee since October 2012 | | Chief Executive Officer of the Halton Group Ltd. (an indoor environmental control manufacturing and technology company) from 2002 to 2016. | | | 19 | | | Director, Halton Group Ltd. since 2016. |
| | | | | |
Kristen M. Fletcher 505 Wakara Way
3rd Floor
Salt Lake City, UT 84108
Age 63 | | Trustee | | Indefinite Served as Trustee since October 2014 | | Director, Youth Sports Alliance since 2015; Director, Utah Symphony/Utah Opera since 2005; Trustee, Woodlands Commercial Bank (a/k/a Lehman Brothers Commercial Bank) 2009 - 2012; Chairman and CEO, ABN AMRO, Inc. and U.S. Country Representative, ABN AMRO Bank, NV from 2002-2004. | | | 19 | | | Director, Youth Sports Alliance since 2015; Trustee, Woodlands Commercial Bank (a/k/a Lehman Brothers Commercial Bank) 2009 - 2012; Director Utah Symphony/Utah Opera since 2005. |
|
|
Interested Trustee | | | | | | | | | | | | |
| | | | | |
Samuel S. Stewart, Jr.3 Ph.D. CFA
505 Wakara Way
3rd Floor Salt Lake City, UT 84108
Age 74 | | President and Trustee | | Indefinite Served as President and Trustee since 1986 | | Chairman of the Board for the Advisor since 1975; Chief Investment Officer of the Advisor from 2004 to June 2009; Director of Research of the Advisor from 1975 to 2004; Chairman of the Board of Wasatch Funds from 1986 to 2004. | | | 19 | | | None |
|
|
| 1 | A Trustee may serve until his/her death, resignation, removal or retirement. Each Independent Trustee shall retire as Trustee at the end of the calendar year in which he/she attains the age of 75 years. |
| 2 | Directorships are those held by a Trustee in any company with a class of securities registered pursuant to Section 12 of the Securities Exchange Act of 1934 or subject to the requirements of Section 15(d) of the Securities Exchange Act or any company registered as an investment company under the 1940 Act. |
| 3 | Dr. Stewart is an Interested Trustee because he serves as the Chairman of the Board of the Advisor and is an employee of the Advisor. |
136
| | |
| | MARCH 31, 2017 (UNAUDITED) |
|
|
|
| | | | | | |
Name, Address
and Age | | Position(s)
Held with
Trust | | Term of Office and
Length of Time Served | | Principal Occupation(s)
during Past 5 Years |
Officers | | | | | | |
| | | |
Daniel D. Thurber 505 Wakara Way
3rd Floor Salt Lake City, UT 84108
Age 47 | | Vice President | | Indefinite Served as Vice President since February 2007 | | General Counsel, Chief Compliance Officer and Director of Compliance for the Advisor since 2006. |
| | | |
Russell L. Biles 505 Wakara Way
3rd Floor Salt Lake City, UT 84108
Age 49 | | Chief Compliance Officer, Vice President and Secretary | | Indefinite Served as Chief Compliance Officer and Vice President since February 2007 and Secretary since November 2008 | | Chief Compliance Officer and Vice President for Wasatch Funds since February 2007; Secretary for Wasatch Funds since November 2008; Counsel for the Advisor since October 2006. |
| | | |
Cindy B. Firestone CPA 505 Wakara Way
3rd Floor Salt Lake City, UT 84108
Age 59 | | Treasurer | | Indefinite Served as Treasurer since May 2009 | | Treasurer for Wasatch Funds since May 2009; Assistant Treasurer for Wasatch Funds from November 2008 to May 2009; Internal Auditor for the Advisor from December 2002 to August 2011. |
| | | |
David Corbett 505 Wakara Way
3rd Floor
Salt Lake City, UT 84108
Age 44 | | Assistant Vice President | | Indefinite Served as Assistant Vice President since August 2012 | | Assistant Vice President for Wasatch Funds since August 2012; Director of Mutual Fund Services for the Advisor since June 2007. |
|
|
Additional information about the Funds’ trustees is provided in the Statement of Additional Information and is available without charge, upon request, on the Funds’ website at www.WasatchFunds.com or by calling 800.551.1700.
ADDITIONAL TAX INFORMATION
The Funds hereby designate the following amounts or maximum amounts allowable as long-term capital gain dividends for the purpose of the dividends-paid deduction. The amounts designated here include the utilization of earnings and profits distributed to shareholders on the redemption of shares.
| | | | |
| Fund | | Amount | |
Core Growth Fund | | $ | 138,512,554 | |
Emerging India Fund | | | 958,580 | |
Global Opportunities Fund | | | 19,687,296 | |
International Opportunities Fund | | | 22,512,072 | |
Large Cap Value Fund | | | 20,982,300 | |
Long/Short Fund | | | 70,202,977 | |
Micro Cap Fund | | | 40,544,074 | |
Micro Cap Value Fund | | | 15,487,890 | |
Small Cap Growth Fund | | | 322,361,340 | |
Strategic Income Fund | | | 2,685,547 | |
Ultra Growth Fund | | | 8,679,065 | |
World Innovators Fund | | | 24,130,023 | |
U.S. Treasury Fund | | | 15,905,989 | |
PROXY VOTING POLICIES, PROCEDURESAND RECORD
A description of the policies and procedures that Wasatch Advisors uses to vote proxies related to the Funds’ portfolio securities is set forth in the Funds’ Statement of Additional Information which is available without charge, upon request, on the Funds’ website at www.WasatchFunds.com or by calling 800.551.1700 and on the Securities and Exchange Commission’s (SEC) website at www.sec.gov.
Wasatch Funds’ proxy voting record is available without charge on the Funds’ website at www.WasatchFunds.com and the SEC’s website at www.sec.gov no later than August 31 for the prior 12 months ending June 30.
QUARTERLY PORTFOLIO HOLDINGS DISCLOSUREON FORM N-Q
The Funds file their complete schedules of investments with the SEC for their first and third quarters of each fiscal year on Form N-Q. The Funds’ Form N-Q filings are available on the SEC’s website at www.sec.gov, and may be reviewed and copied at the SEC’s Public Reference Room in Washington, D.C. (information on the operation of the Public Reference room may be obtained by calling 800.SEC.0330).
BOARD CONSIDERATIONSFOR ADVISORYAND SUB-ADVISORY AGREEMENTSOFTHE WASATCH FUNDS
At a meeting held on November 8-9, 2016 (the “Meeting”), the Board of Trustees (the “Board”) of Wasatch Funds Trust (the “Trust”), including the Independent Trustees, unanimously approved the Advisory and Service Contract (the “Advisory Agreement”) between the Trust and Wasatch Advisors, Inc. (the “Advisor”) on behalf of each series of the Trust (each a “Fund”); the sub-advisory agreement between the Advisor and Hoisington Investment Management Company (“HIMCO”) on behalf of the Wasatch-Hoisington U.S. Treasury Fund (the “U.S. Treasury Fund”); and the sub-advisory agreement between the Advisor and 1st Source Corporation Investment Advisors, Inc. (“1st
137
Supplemental Information (continued)
Source”) on behalf of the Wasatch-1st Source Income Fund (the “Income Fund”) (the foregoing sub-advisory agreements are each a “Sub-Advisory Agreement” and collectively, the “Sub-Advisory Agreements,” and HIMCO and 1st Source are each a “Sub-Advisor”).
The Board, including the Independent Trustees, is responsible for overseeing the management of the Funds and as such, the Board determines each year as required by law whether to continue the Advisory Agreement with the Advisor on behalf of each Fund, the Sub-Advisory Agreement with HIMCO on behalf of the U.S. Treasury Fund and the sub-advisory agreement with 1st Source on behalf of the Income Fund.
In preparation for their consideration of the Advisory Agreement and Sub-Advisory Agreements, the Independent Trustees, through their independent counsel, requested and received extensive materials specifically prepared for their annual review of the foregoing agreements. The materials provided a broad range of information regarding the Funds, the Adviser and Sub-Advisers, including a description of, among other things, the terms of the Advisory Agreement and Sub-Advisory Agreements; the services provided by the Advisor and each Sub-Advisor; the experience of the relevant investment personnel; each Fund’s performance and as compared to the performance of peers and appropriate benchmark(s); the fees and expenses of each Fund and as compared to peers; the profitability of the Advisor from serving as advisor to each respective Fund; and the Advisor’s evaluation of each Sub-Advisor. The Independent Trustees also received a memorandum from independent legal counsel outlining their fiduciary duties and legal standards in reviewing the Advisory Agreement and Sub-Advisory Agreements. This information supplemented the materials and information the Trustees received during the year at their quarterly Board meetings which covered a variety of topics that were relevant to the Trustees’ annual consideration of the advisory arrangements, including Fund investment performance, compliance, risk management, valuation, trade execution and other matters related to Fund operations. The Independent Trustees also had met with management of the Advisor (including key investment personnel) at their quarterly meetings.
On October 26, 2016, the Independent Trustees met in executive session to consider the renewal of the Advisory Agreement and Sub-Advisory Agreements. During a portion of the executive session, the Independent Trustees invited members of the Adviser to discuss further some of the information provided and respond to questions. Following their review at the October executive session, the Independent Trustees also requested (through their independent counsel) and received additional supplemental information.
On November 8, 2016, the Independent Trustees met, including in executive session without management present, to further consider, among other things, the renewal of the Advisory Agreement and Sub-Advisory Agreements. At this meeting, the Board, including the Independent Trustees, approved the continuation of the Advisory Agreement for each Fund, the Sub-Advisory Agreement for the U.S. Treasury Fund and the Sub-Advisory Agreement for the Income
Fund. Throughout the year and throughout their review of the Advisory Agreement and Sub-Advisory Agreements, the Independent Trustees were assisted by independent legal counsel. The Independent Trustees’ review of the Advisory Agreement and Sub-Advisory Agreements reflected an ongoing process that incorporated the information and considerations that occurred over the years, including the most recent year, as well as the information furnished specifically for the renewal process.
In evaluating the Advisory Agreement and Sub-Advisory Agreements and determining the factors to be considered and the weight given to each factor, the Independent Trustees relied upon their own business judgment, the legal advice provided by legal counsel and their accumulated knowledge and experience gained from overseeing the Funds and from the information provided by management and discussions with the Funds’ portfolio managers and other service providers at the Board meetings throughout the year. The Independent Trustees’ consideration of the contractual fee arrangements for the Funds were the result of several years of review and discussion between the Independent Trustees and Fund management, and the Independent Trustees’ conclusions may be based, in part, on their consideration of the fee arrangements and other factors developed in prior years. Each Independent Trustee may have accorded different weight to the various factors in reaching his or her conclusions with respect to the Advisory Agreement and applicable Sub-Advisory Agreement. The Independent Trustees did not identify any single factor as all-important or controlling. The Independent Trustees’ considerations were instead based on a comprehensive consideration of all the information presented. A summary of material factors and conclusions that formed the basis for the Trustees’ decision to continue the Advisory Agreement and Sub-Advisory Agreements has been set forth below.
| A. | | NATURE, EXTENTAND QUALITYOF SERVICES |
In considering the renewal of the Advisory and Sub-Advisory Agreements, the Independent Trustees considered the nature, extent and quality of the Advisor’s and Sub-Advisors’ services to the Funds. With respect to the Advisor, the Independent Trustees reviewed information describing the Advisor’s organization, business, resources and financial strength and stability. With respect to the Advisor, the Independent Trustees considered the breadth of services provided to the Funds which included portfolio management services (and the resulting Fund performance) and non-advisory or administrative services. With respect to the portfolio management services for the Funds the Advisor manages, the Independent Trustees considered information describing the Advisor’s investment process in constructing and managing the portfolios of the Funds, including its stock selection, sell discipline and initial and ongoing risk management of the portfolios. The Independent Trustees noted that the Advisor is a research-oriented firm with extensive investment experience and considered the diligence, care and conscientiousness with which the Advisor has managed the Funds. The Independent Trustees considered the portfolio management as well as the other teams
138
| | |
| | MARCH 31, 2017 (UNAUDITED) |
|
|
|
within the Advisor necessary to manage the operations of the Funds. In this regard, the Independent Trustees reviewed the background and experience of the Advisor’s research team, including the portfolio managers, as well as the Advisor’s trading team. The Independent Trustees continue to seek to meet with the portfolio managers of the various Funds during the year to discuss and keep updated on, among other things, their investment approach to the applicable Fund, any adjustments thereto, market conditions and investment performance. The Independent Trustees further considered the costs to the Advisor in providing its services, including compensation expense. With respect to compensation, the Independent Trustees reviewed the compensation structure for the portfolio managers and research analysts in seeking to evaluate the ability of the Advisor to attract and retain qualified investment personnel and to provide appropriate incentives for investment personnel to invest consistently with the respective Fund’s investment parameters and not take undue risks. The Independent Trustees also considered the portfolio managers’ investments, if any, in the Funds they manage. As noted below, in reviewing the Advisor’s investment management performance, the Independent Trustees also evaluated the performance of the Funds.
In addition to the portfolio management function, the Independent Trustees also considered the wide array and quality of the non-advisory or administrative services that the Advisor provides to manage and oversee the day-to-day operations of the Funds. The Independent Trustees noted that such services included compliance (such as evaluating the adequacies of the Funds’ compliance program, recommending changes thereto as necessary, and overseeing the training of personnel); oversight and evaluation of service providers (including the Sub-Advisors, custodian, administrator and transfer agent); board administration (such as preparing or managing the preparation of board reports and other documentation necessary to assist the Independent Trustees, coordinating among service providers for timely reporting, supporting and administering Board and committee meetings and preparing or arranging for special presentations covering various topics that may impact the Funds or industry); and other administrative services (such as preparing or overseeing the preparation of regulatory and tax reports, registration statements and shareholder reports; monitoring and evaluating cross-trades (if any); overseeing the valuation of portfolio securities; and providing analysis in seeking to ensure compliance with applicable law). The Independent Trustees also recognized the Advisor’s commitment, resources and personnel dedicated to compliance and risk management and considered its ongoing activities to identify and manage risks.
With respect to the Sub-Advisors, the Independent Trustees considered the nature, extent and quality of services the Sub-Advisors provide to the respective Funds. The Independent Trustees recognized that the Sub-Advisors primarily provide portfolio management services and were not expected to supply other significant administrative services. In their evaluation, the Independent Trustees reviewed a report prepared by the Advisor evaluating the respective Sub-Advisor with respect to, among other things, the nature
and quality of its portfolio services, the experience and background of the portfolio managers, the respective Fund’s investment performance, the Sub-Advisor’s compliance program, the financial strength and stability of the Sub-Advisor, the Sub-Advisor’s fees, and any indirect benefits to the Sub-Advisor as a result of its relationship to the respective Fund. The Independent Trustees also noted the Advisor’s recommendation to renew each Sub-Advisory Agreement.
Based on their review, the Independent Trustees found that, overall, the nature, extent and quality of services provided under the Advisory Agreement and the Sub-Advisory Agreements were satisfactory on behalf of each applicable Fund.
| B. | | THE INVESTMENT PERFORMANCEOFTHE FUNDS |
With respect to Fund performance, the Independent Trustees recognized that they consider Fund performance data throughout the year, including periodically meeting with a Fund’s portfolio manager(s) during quarterly Board meetings. In their review of the advisory arrangements, the Independent Trustees also review data reflecting the performance history of each Fund over various time periods, including absolute performance, the Fund’s return compared to the performance of other peer funds, and the Fund’s performance compared to its benchmark. More specifically, the Independent Trustees reviewed, among other things, a report prepared by Broadridge Financial Solutions, Inc. (“Broadridge”), an independent data provider, which compared the respective Fund’s total return (Investor Class) for the one-, two-, three-, four-, five-, and ten-year periods ending August 31, 2016 (or for the periods available for Funds that did not exist for part of the foregoing timeframe) with the performance of unaffiliated funds with similar investment objectives or classifications (a “Peer Universe”), to a more focused subset thereof, if any (a “Broadridge Peer Group”) and a benchmark assigned by Broadridge (the “Benchmark”) for the prescribed periods. The Independent Trustees also reviewed materials reflecting the respective Fund’s historic performance for the quarter, one-, three-, five-, and ten-year periods ending September 30, 2016 (or for the periods available for Funds that did not exist for part of the foregoing timeframe together with the average annual return since inception for Funds with the shorter duration) compared to additional benchmark(s) and unaffiliated funds in the Fund’s Morningstar investment category. In addition, the Independent Trustees received analyst reports provided by an unaffiliated party for the following Funds: Core Growth Fund, Small Cap Growth Fund and the Long/Short Fund and considered any Morningstar ratings on the Funds.
When reviewing the performance of a Fund, the Independent Trustees recognized several factors that may impact the evaluation of the performance data as well as the weight given to particular performance data, including the following:
| • | | The performance data reflects a snapshot in time as of a particular period (in this case, the periods ended August 31, 2016 and September 30, 2016) and a different performance period could generate significantly different results; |
139
Supplemental Information (continued)
| • | | Long term performance can be adversely affected by even one period of significant underperformance so that a single investment decision or theme has the ability to disproportionately affect long-term performance; |
| • | | The investment experience of a particular shareholder in the Funds will vary depending on the shareholder’s particular investment period and the Fund’s performance during that period and the class held (if multiple classes offered in a Fund); |
| • | | Certain Funds offer multiple classes and the performance of the classes of a Fund should be substantially similar on a relative basis because the classes are invested in the same portfolio of securities; however, there may be differences in performance between the classes which could be principally attributed to the variation in the expenses of each class; and |
| • | | The Independent Trustees realize that the Advisor and Sub-Advisors are responsible for managing the Funds in accordance with the respective Fund’s investment objectives, investment parameters and guidelines. The Independent Trustees, however, recognize that peers and/or benchmarks may be following different objectives, investment parameters and guidelines and risk tolerance levels and therefore their performance results may differ from that of the Funds. The Independent Trustees considered such differences when evaluating the comparative data and recognized that these differences may limit some of the usefulness of the data as a frame of reference to evaluate Fund performance. The Independent Trustees recognize this issue particularly with the Micro Cap Fund and Micro Cap Value Fund (collectively, the “Micro Cap Funds”). In this regard, the Broadridge Peer Group for the Micro Cap Funds generally focus on companies with a larger market capitalization than those sought by the Micro Cap Funds. As a result, the Independent Trustees also reviewed the Micro Cap Funds’ performance compared to a custom peer group provided by the Advisor for the one-, three-, five- and ten-year periods ended September 30, 2016. |
Based on their review of performance, the Independent Trustees determined the following:
Core Growth Fund
With respect to the Core Growth Fund, the Fund outperformed the median of its Broadridge Peer Group and the Benchmark for the one-, two-, three-, four-, five- and ten-year periods ended August 31, 2016. The Fund also outperformed the peer group average in the Morningstar small growth category for the one-, three-, five- and ten-year periods ended September 30, 2016. The Board considered the Fund’s performance to be generally favorable.
Emerging India Fund
With respect to the Emerging India Fund, other than the one-year period ended August 31, 2016, the Fund outperformed the median of its Broadridge Peer Group in the two-, three-, four- and five-year periods ended August 31, 2016. The Fund also outperformed the average of its peer group in the Morningstar India equity category for the
one-, three- and five-year periods ended September 30, 2016. The Board considered the Fund’s performance to be generally favorable.
Emerging Markets Select Fund
With respect to the Emerging Markets Select Fund, the Independent Trustees recognized that the Fund underperformed the median of its Broadridge Peer Group for the one-, two- and three-year periods ended August 31, 2016. The Fund also underperformed its Benchmark in the one- and two-year periods ended August 31, 2016 but outperformed the Benchmark in the three-year period ended August 31, 2016. The Fund also underperformed the average of its peer group in the Morningstar diversified emerging category for the one- and three-year periods ended September 30, 2016. In reviewing the comparative data, the Independent Trustees recognized that differences between the objectives and strategies of the Fund and the peer groups limit some of the usefulness of the comparative data. The Independent Trustees noted that the Fund was following its investment strategy and in light of the Fund’s investment objectives and strategy, the Board considered the Fund’s performance to be satisfactory.
Emerging Markets Small Cap Fund
With respect to the Emerging Markets Small Cap Fund, the Independent Trustees noted that except for the one-year period ended August 31, 2016, the Fund outperformed the median of its Broadridge Peer Group and Benchmark for the two-, three-, four- and five-year periods ended August 31, 2016. Other than the one-year period ended September 30, 2016, the Fund also outperformed the peer group average in the Morningstar diversified emerging category for the three- and five-year periods ended September 30, 2016. The Board determined that the Fund’s performance was satisfactory.
Frontier Emerging Small Countries Fund
With respect to the Frontier Emerging Small Countries Fund, the Independent Trustees noted that the Fund underperformed the median of its Broadridge Peer Group and its Benchmark for the one-, two- and three-year periods ended August 31, 2016 but outperformed the median of the Broadridge Peer Group and Benchmark in the longer four-year period ended August 31, 2016. The Fund also underperformed its peer group average for the Morningstar diversified emerging category for the one- and three-year periods ended September 30, 2016. The Board discussed the reasons for the Fund’s underperformance and recognized the recent changes in portfolio managers for the Fund. In light of the foregoing, the Board would continue to monitor this Fund closely.
Global Opportunities Fund
With respect to the Global Opportunities Fund, the Independent Trustees noted that although the Fund underperformed the median of its Broadridge Peer Group for the two-, three-, four- and five-years ended August 31, 2016, the Fund outperformed the Benchmark for such periods and outperformed the Benchmark and the median of its
140
| | |
| | MARCH 31, 2017 (UNAUDITED) |
|
|
|
Broadridge Peer Group in the recent one-year period ended August 31, 2016. Except for the three-year period ended September 30, 2016, the Fund also outperformed its peer group average for the Morningstar world stock category for the one- and five-year periods ended September 30, 2016. The Board determined that the Fund’s performance was satisfactory.
U.S. Treasury Fund
With respect to the U.S. Treasury Fund, the Independent Trustees noted that the Fund outperformed the median of its Broadridge Peer Group for the one-, two-, three-, four-, five- and ten-year periods ended August 31, 2016 and its Benchmark for the one-, two-, three-, four- and five-year periods ended August 31, 2016. The Fund also outperformed its peer group average of the Morningstar long government category for the one-, three-, five- and ten-year periods ended September 30, 2016. The Board determined that the Fund’s performance over time was generally favorable.
International Growth Fund
With respect to the International Growth Fund, the Independent Trustees noted that except for the three- and four-year periods ended August 31, 2016, the Fund either matched or outperformed the median of its Broadridge Peer Group for the one-, two-, five- and ten-year periods ended August 31, 2016. Except for the three-year period ended August 31, 2016, the Fund also outperformed its Benchmark for the one-, two-, four-, five- and ten-year periods ended August 31, 2016. The Independent Trustees further noted that the Fund also outperformed its peer group average for the Morningstar foreign small/mid growth category for the one-, three-, five- and ten-year periods ended September 30, 2016. The Board determined that the Fund’s performance over time was consistent and generally favorable.
International Opportunities Fund
With respect to the International Opportunities Fund, the Independent Trustees noted that the Fund outperformed the performance of the median of its Broadridge Peer Group and Benchmark for the one-, two-, three-, four-, five- and ten-year periods ended August 31, 2016. The Fund outperformed its peer group average for the Morningstar foreign small/mid growth category for the one-, three-, five- and ten-year periods ended September 30, 2016. The Board determined that the Fund’s performance over time was generally favorable.
Large Cap Value Fund
With respect to the Large Cap Value Fund, the Independent Trustees noted that the Fund underperformed the performance of the median of its Broadridge Peer Group and Benchmark for the two-, three-, four- and five-year periods ended August 31, 2016, the Fund outperformed the median of the Broadridge Peer Group for the one- and ten-year periods ended August 31, 2016 and provided generally comparable performance to its Benchmark for the one- and ten-year periods. Similarly, although the Fund underperformed
the peer group average of the Morningstar large cap value category over the three- and five-year periods ended September 30, 2016, the Fund outperformed such peer group average in the one- and ten-year periods ended September 30, 2016. While the Independent Trustees recognized that the Funds had experienced periods of challenged performance, the Independent Trustees further recognized the steps the Advisor had taken to address performance issues, including the change in the portfolio manager in 2013. The Independent Trustees further noted the improved performance in the recent one-year period. The Board continues to monitor the Fund closely.
Long/Short Fund
With respect to the Long/Short Fund, the Independent Trustees noted that although the Fund underperformed the median of its Broadridge Peer Group for the two-, three- and five-year periods ended August 31, 2016, the Fund outperformed the median of its Broadridge Peer Group for the one-, four-, and ten-year periods ended August 31, 2016. Although the Fund underperformed its Benchmark for the two-, three- and four-year periods ended August 31, 2016, the Fund outperformed the Benchmark in the one-, five- and ten-year periods ended August 31, 2016. Although the Fund underperformed the peer group average of the Morningstar long/short category over the three-, five- and ten-year periods ended September 30, 2016, the Fund outperformed the peer group average over the one-year period ended September 30, 2016. The Independent Trustees recognized that the Fund has experienced periods of challenged performance and the factors that contributed to such performance results, but noted the steps the Advisor has taken to address performance issues and noted the Fund’s improved performance in the recent one-year period. The Board continues to monitor closely the progress of this Fund in seeking to improve performance.
Micro Cap Fund
With respect to the Micro Cap Fund, the Independent Trustees noted that although the Fund underperformed the median of its Broadridge Peer Group for the three-, four-, five-, and ten-year periods ended August 31, 2016, the Fund outperformed or matched the median of the Broadridge Peer Group in the one- and two-year periods. Similarly, although the Fund underperformed the Benchmark for the four-, five- and ten-year periods ended August 31, 2016, the Fund outperformed the Benchmark in the one-, two- and three-year periods. In addition, although the Fund underperformed its peer group average for the Morningstar small growth category for the ten-year period ended September 30, 2016, the Fund outperformed such peer group average for the one-, three- and five-year periods ended September 30, 2016. In considering the comparative data, the Independent Trustees, however, had recognized that the Broadridge Peer Group may not adequately reflect the investment strategies and investable universe of the Fund as the Broadridge Peer Group may contain small cap funds and focus primarily on much larger companies than the investments of the Fund. The Independent Trustees
141
Supplemental Information (continued)
recognized that due to these differences, the performance comparisons may be inexact and of more limited relevancy. Accordingly, the Independent Trustees also reviewed the Fund’s performance compared to a custom peer group provided by the Advisor and the Russell Micro Cap Index for the one-, three-, five- and ten-year periods ended September 30, 2016. In considering the foregoing, the Independent Trustees determined the performance was satisfactory but would continue to monitor the Fund’s performance closely.
Micro Cap Value Fund
With respect to the Micro Cap Value Fund, the Independent Trustees noted that the Fund outperformed the median of its Broadridge Peer Group for the one-, two, three-, four-, five-, and ten-year periods ended August 31, 2016. Other than the one-year period, the Fund also outperformed the Benchmark for each of the foregoing periods. Similarly, the Fund outperformed the peer group average of the Morningstar small growth category for the one-, three-, five- and ten-year periods ended September 30, 2016. In considering the comparative data, as noted above with the Micro Cap Fund, the Independent Trustees recognized that Broadridge Peer Group may not adequately reflect the investment strategies and investable universe of the Fund thereby limiting some of the usefulness of the comparative data. The Independent Trustees accordingly also reviewed the Fund’s performance compared to a custom peer group provided by the Advisor and the Russell Micro Cap Index for the one-, three-, five- and ten-year periods ended September 30, 2016. In considering the foregoing, the Board determined that the Fund’s performance had been generally favorable.
Small Cap Growth Fund
With respect to the Small Cap Growth Fund, the Independent Trustees noted that although the Fund underperformed the median of its Broadridge Peer Group for the one-, two-, three- four-, five- and ten-year periods ended August 31, 2016 and its Benchmark for such periods (except the ten-year period ended August 31, 2016), the Fund had provided positive absolute performance over such periods. In addition, although the Fund underperformed the peer group average for the Morningstar small cap growth category for the three- and five-year periods ended September 30, 2016, the Fund outperformed such peer group average in the one- and ten-year periods ended September 30, 2016. In considering the foregoing, the Board determined that the Fund’s performance over time had been satisfactory.
Small Cap Value Fund
With respect to the Small Cap Value Fund, the Independent Trustees noted that the Fund outperformed the performance of the median of its Broadridge Peer Group for the one-, two-, three-, four-, five- and ten-year periods ended August 31, 2016. Except for the one- and ten-year periods ended August 31, 2016, the Fund outperformed its Benchmark for the two-, three-, four- and five-year periods ended August 31, 2016. The Fund also outperformed the peer group average of the Morningstar small blend category
for the one-, three-, five- and ten-year periods ended September 30, 2016. The Board determined the Fund’s performance over time had been generally favorable.
Strategic Income Fund
With respect to the Strategic Income Fund, the Independent Trustees noted that the Fund underperformed the performance of the median of its Broadridge Peer Group for various periods ended August 31, 2016 and except for the ten-year period ended August 31, 2016, the Fund underperformed the Benchmark for the one-, two-, three-, four-, and five-year periods ended August 31, 2016. The Fund also underperformed the peer group average for the Morningstar mid-cap value category for the one-, three-, five- and ten-year periods. The Board considered that except for the two-year period ended August 31, 2016; however, the Fund had provided positive absolute performance for the foregoing periods. The Board also considered the investment strategy of the Fund and in light of the foregoing, determined the Fund’s performance over time was satisfactory.
Ultra Growth Fund
With respect to the Ultra Growth Fund, the Independent Trustees noted that other than the ten-year period ended August 31, 2016, the Fund outperformed the median of its Broadridge Peer Group for the one-, two-, three-, four-, and five- year periods ended August 31, 2016 and other than the five- and ten-year periods ended August 31, 2016, outperformed its Benchmark for the one-, two-, three- and four-year periods ended August 31, 2016. In addition, although the Fund underperformed its peer group average of the Morningstar small growth category for the five- and ten-year periods ended September 30, 2016, the Fund outperformed such peer group average in the one- and three-year periods ended September 30, 2016. The Independent Trustees considered that this Fund had experienced periods of challenged performance, but the portfolio management team was adjusted in 2013 and the Independent Trustees recognized that the performance had improved.
World Innovators Fund
With respect to the World Innovators Fund, the Independent Trustees noted that although the Fund underperformed the median of its Broadridge Peer Group and Benchmark for the one-, three- and four-year periods ended August, 31, 2016, the Fund outperformed the median of its peer group and Benchmark in the two-, five- and ten-year periods ended August 31, 2016. Similarly, although the Fund underperformed the peer group average for the Morningstar world stock category for the one- and three-year periods ended September 30, 2016, the Fund outperformed such peer group average in the five- and ten-year periods ended September 30, 2016. The Board determined that the Fund’s performance over time was satisfactory.
Income Fund
Although the Income Fund underperformed the median of its Broadridge Peer Group in the three-, four-, five- and ten-year periods ended August 31, 2016, the Fund
142
| | |
| | MARCH 31, 2017 (UNAUDITED) |
|
|
|
outperformed the median in the one- and two-year periods ended August 31, 2016. Although Fund underperformed the Benchmark in the one-, four-, five- and ten-year periods ended August 31, 2016, the Fund outperformed the Benchmark in the two- and three-year periods ended August 31, 2016. Other than the five-year period ended September 30, 2016, the Fund outperformed its peer group average of the Morningstar short-term bond category for the one-, three-, and ten-year periods ended September 30, 2016. The Board considered the objectives of the Fund and the factors underlying performance and considered its performance satisfactory.
| C. | | FEES, EXPENSESAND PROFITABILITY |
Fees and Expenses
The Independent Trustees evaluated the management fees and other fees and expenses of each Fund. In considering the appropriateness of the management fees and other expenses charged to a Fund, the Board considered various factors including the respective Fund’s investment performance, the quality and experience of the portfolio managers and research staff, the periodic closing of certain Funds to proactively manage growth, expense caps, the research intensive approach followed by the Adviser and the costs of providing services. The Independent Board also considered the factors the Advisor reported that it considers in proposing a management fee for a Fund including, among other things, the value of the services provided (e.g. the potential for the strategy to deliver alpha to shareholders and the expertise of the Advisor with the strategy), the competitive marketplace for the product and the fees of competitive funds, and the economics of the product to the Advisor (e.g. the costs in operating the Fund and constraints on product capacity).
In their evaluation of fees and expenses, the Independent Trustees reviewed the Advisor’s management fees and expense ratios for each Fund in absolute terms as well as in comparison to similar information for a group of comparable funds selected by Broadridge (the “Broadridge Expense Group”) and a larger universe of funds selected by Broadridge (the “Broadridge Expense Universe”). The Independent Trustees reviewed and considered, among other things, comparisons of each respective Fund’s contractual and net management fees, total expenses (including and excluding 12b-1/non-12b-1 service fees), and non-management expenses (such as transfer agency, custodian, administrative and accounting fees) with those of unaffiliated funds in its Broadridge Expense Group. The Board was also provided with a description of the methodology Broadridge followed in selecting funds included in the Broadridge Expense Group and Broadridge Expense Universe and recognized certain limitations with the comparability of certain Funds with its Broadridge Expense Group, including, in particular, with respect to the Micro Cap Funds. The Independent Trustees therefore also reviewed comparisons of each Micro Cap Fund’s management fee and net expense ratio with those of a custom peer group provided by the Advisor. The Trustees considered the Fund’s net total expense ratios which the Trustees considered are the most representative of the shareholder’s net experience in a Fund. In this regard,
the Trustees appreciated the Advisor’s continued efforts with third parties to reduce various Fund expenses, such as custody and transfer agency fees.
In reviewing fees, the Independent Trustees also took into account any expense caps the Advisor has agreed to on behalf of each existing class of shares of the respective Fund and had reviewed the amounts the Advisor has reimbursed to the applicable Fund for the last three fiscal years (if any). The Board has also reviewed prior management fee reductions for various Funds over the years, including the proposed management fee reduction for the Micro Cap Funds. In their evaluation of the fees, the Independent Trustees observed, among other things, the following:
For the Core Growth Fund, Emerging India Fund, Emerging Markets Small Cap Fund, Frontier Emerging Small Countries Fund, Global Opportunities Fund, International Growth Fund, International Opportunities Fund, Micro Cap Fund, Micro Cap Value Fund, Small Cap Growth Fund, Small Cap Value Fund, Ultra Growth Fund and the World Innovations Fund
With respect to the Core Growth Fund, the Independent Trustees recognized that although contractual management fees for the institutional and investor class shares were above the median of its respective Broadridge Expense Group, the Fund had a net expense ratio slightly higher (within 5 basis points) than the median of its Broadridge Expense Group for the investor class shares and below the median of its Broadridge Expense Group for the institutional class shares.
With respect to the Emerging India Fund, the Fund’s contractual management fee was the same as the median of its Broadridge Expense Group and its net expense ratio was the same as the median of its Broadridge Expense Group for the investor class shares and below the median for the institutional class shares.
With respect to the Emerging Markets Small Cap Fund, the Independent Trustees noted that the Fund’s contractual management fee and net total expense ratio were above the median of its Broadridge Expense Group.
With respect to the Frontier Emerging Small Countries Fund, the Independent Trustees noted that the contractual management fee and net expense ratio were above the median of its Broadridge Expense Group for the institutional and investor class shares.
With respect to the Global Opportunities Fund, the Independent Trustees noted that the contractual management fee of the Fund was above the median of its Broadridge Expense Group and the Fund’s net expense ratio was above the median of its Broadridge Expense Group for the investor class shares and below the median for the institutional class shares.
With respect to the International Growth Fund, the Independent Trustees noted that the Fund’s contractual management fee was slightly above (within 5 basis points) of the median of its Broadridge Expense Group but its net expense ratio was below the median for its institutional class shares and the same as the median of the Broadridge Expense Group for the investor class shares.
143
Supplemental Information (continued)
With respect to the International Opportunities Fund, the Independent Trustees noted that the Fund’s contractual management fee and net expense ratio were above the median of its Broadridge Expense Group for the investor class shares and institutional class shares.
With respect to the Micro Cap Fund and the Micro Cap Value Fund, the Independent Trustees noted that each Fund’s contractual management fee and net expense ratio were above the median of its Broadridge Expense Group. The Trustees further noted, however, that the Advisor proposed to reduce the management fee for each Fund by 25 basis points.
With respect to the Small Cap Growth Fund, the Independent Trustees noted that the Fund’s contractual management fee was above the median of its Broadridge Expense Group and its net expense ratio was above the median of its Broadridge Expense Group for the investor class shares and slightly above (within 5 basis points) of the median for the institutional class shares.
With respect to the Small Cap Value Fund, the Independent Trustees noted that the Fund’s contractual management fee was above the median of its Broadridge Expense Group and the net expense ratio of the investor class shares was slightly above (within 5 basis points) of the median of its Broadridge Expense Group but below the median for the institutional class shares.
With respect to the Ultra Growth Fund, the Independent Trustees noted that the Fund’s net expense ratio was above the median of its Broadridge Expense Group for its investor class shares, but the Fund’s contractual management fee was only slightly higher (within 5 basis points) of the median of the Broadridge Expense Group.
With respect to the World Innovators Fund, the Independent Trustees noted that the Fund’s contractual management fee and net expense ratio were above the median of its Broadridge Expense Group for its investor class and institutional class shares.
In addition to the comparative data, the Independent Trustees recognized that many of the foregoing Funds invest in small and/or micro-cap securities. The Independent Trustees recognized the Advisor’s established experience and reputation with this asset class. The Trustees considered that the Advisor is a investment research-oriented firm that follows a research-intensive investment approach and recognized the associated costs incurred in researching and screening potential investments, particularly with respect to the small and micro-cap companies. The Independent Trustees also noted that these costs are increased for the international Funds as the Advisor must employ the resources to perform the necessary due diligence to evaluate the foreign companies across the globe. The Independent Trustees also continued to note the capacity constraints of the Funds investing in the smaller companies. The Trustees have recognized that the Advisor proactively manages the growth of the Funds by closing the applicable Fund to new investments from time to time to protect the performance of such Fund which may not be replicated at higher asset levels. The Trustees, however, also noted that while these actions are intended to benefit existing shareholders, the result of
this practice is to reduce the potential revenues that the Advisor may earn from fees on higher asset levels. The Trustees, however, seek to encourage the practice of closing the Funds when necessary to protect performance. The Trustees further noted that the Advisor had undertaken a review of its pricing and as a result, the management fees of several Funds were reduced last year (including the Global Opportunities Fund, the Emerging India Fund, the Emerging Markets Small Cap Fund, and the International Opportunities Fund) and the management fees of the Micro Cap Funds were proposed to be reduced by 25 basis points.
Given the foregoing factors, among others, the Independent Trustees determined the advisory fees for the foregoing Funds were acceptable.
For the Emerging Markets Select Fund
With respect to the Emerging Markets Select Fund, the Independent Trustees noted that the Fund’s contractual management fee was higher than the median of its Broadridge Expense Group and the net expense ratio for the investor class shares was higher than the median for the Broadridge Expense Group but the net expense ratio for the institutional class was lower than the median. The Trustees recognized the investment strategy of this Fund, the Advisor’s experience with the strategy and the costs of applying the Advisor’s investment approach to evaluating securities in emerging markets. However, the Independent Trustees recognized that this Fund had more capacity than the other Funds that were focused on small- and/or micro-cap companies as described above. The Independent Trustees further noted that the management fee for this Fund was reduced last year. In light of the foregoing factors, among other things, the Independent Trustees determined the advisory fee for the foregoing Fund was acceptable.
For the Long Short Fund, Income Fund, U.S. Treasury Fund, Large Cap Value Fund, and Strategic Income Fund
In considering the management fees of the Income Fund, Large Cap Value Fund, Long Short Fund, Strategic Income Fund and U.S. Treasury Fund, the Independent Trustees recognized that each of such Funds had little or no capacity constraints given their investment strategies unlike the Funds investing in smaller companies noted above. The Independent Trustees also considered, among other things, the comparative fee and expense data and noted the following.
With respect to the U.S. Treasury Fund, the Independent Trustees noted that the Fund’s contractual management fee was slightly above (within 5 basis points) of the median of its Broadridge Expense Group, and the Fund’s net expense ratio was below the median of its Broadridge Expense Group for the investor class shares.
With respect to the Large Cap Value Fund, the Independent Trustees noted that the contractual management fee was above the median of its Broadridge Expense Group, and the Fund’s net expense ratio was above the median of its Broadridge Expense Group for the investor class shares but below the median for its institutional class shares.
144
| | |
| | MARCH 31, 2017 (UNAUDITED) |
|
|
|
With respect to the Long Short Fund, the Independent Trustees noted that the contractual management fee and net expense ratios for the investor class shares and institutional class shares were below the median of its Broadridge Expense Group.
With respect to the Strategic Income Fund, the Independent Trustees noted that the contractual management fee and net expense ratio were below the median of its Broadridge Expense Group for the investor class shares.
With respect to the Income Fund, the Independent Trustees noted that although the Fund’s contractual management fee was above the median of its Broadridge Expense Group, the Fund’s net expense ratio was below the median.
Based on the foregoing factors, among others, the Independent Trustees determined that the advisory fees for the foregoing Funds were acceptable.
| 2. | Fees Charged to Other Advisor and Sub-Advisor Clients |
The Independent Trustees also reviewed information regarding the fee rates and schedules, the range of fees and their weighted average that the Advisor charges to separate accounts that are managed in a style similar to that used for certain Funds. Such Funds include the Core Growth Fund, Emerging Select Fund, Emerging Markets Small Cap Fund, Frontier Emerging Small Countries Fund, International Growth Fund, Small Cap Growth Fund, and Small Cap Value Fund. The Independent Trustees also considered information regarding the management fees the Advisor assesses to other types of clients with investment programs similar to those of certain Funds, including a unified managed account, model account, collective investment trusts and domestic and foreign funds sponsored by other sponsors.
The Independent Trustees noted that the weighted average fee rates for separate accounts were generally lower than the fees for the comparable Fund. The Independent Trustees, however, considered the differences in the nature and scope of services the Adviser provides to the Funds compared to other types of clients. In addition to the portfolio management services the Advisor provides to the respective Funds, the Independent Trustees recognized the other extensive services the Advisor provides to the Funds that are rather unique to the Funds given they are registered investment companies operating in a highly regulated industry. The Independent Trustees recognized that these services included, among other things, fund administrative services and operations, oversight of third party service providers, oversight of shareholder servicing, Trustee support, tax administration and compliance. The Independent Trustees further noted that the portfolio management services may also differ between the Funds and separate accounts as a result of differences in the investment parameters and strategies of the Funds compared to that of the separate accounts, such as the ability to invest in foreign securities. The Independent Trustees recognized that the foregoing variations may result in different economics among the product structures culminating in varying management fees among the types of clients and the Funds. Given the differences among the products, particularly the extensive
services provided to the Funds, the Independent Trustees concluded that such facts justify the different levels of fees.
In considering the fees of the Sub-Advisors for the Income Fund and U.S. Treasury Fund, the Independent Trustees considered the fee rate paid to the respective Sub-Advisor with respect to the applicable Fund compared to the Sub-Advisors pricing schedule for portfolio management services for other clients. The Independent Trustees noted that the fee rates paid these Sub-Advisors for their sub-advisory services were reasonable in comparison to their respective pricing schedule. The Independent Trustees also noted that the Advisor pays the Sub-Advisor(s) from its own revenues and the sub-advisory fees to the Sub-Advisor were established through arm’s length negotiations between the Advisor and the Sub-Advisors, which are unaffiliated with the Advisor.
| 3. | Profitability of the Advisor |
In conjunction with their review of fees, the Independent Trustees reviewed information reflecting the Advisor’s financial position and profitability from its overall business as well as on an individual Fund-by-Fund basis. The Independent Trustees reviewed the consolidated financial statements of WA Holdings, Inc. (the parent of the Advisor) and its subsidiary (the Advisor) for the years ended December 31, 2015 and 2014. The Independent Trustees also reviewed, among other things, the revenues, expenses and operating income of the Advisor for 2015 in absolute terms and in comparison to that of other unaffiliated investment advisors. The Independent Trustees further reviewed profitability information for the Advisor from its relationship with each Fund for the calendar year ended December 31, 2015 on an actual and adjusted basis (as described below).
In considering profitability, the Independent Trustees have recognized the subjective nature in determining profitability. The Independent Trustees considered the methodology used to allocate expenses but recognized that other various allocation methodologies may be reasonable to employ but yield different results. The Independent Trustees recognized that employee compensation is a primary expense of the Advisor and as a privately held S corporation owned by employees, the Advisor’s level of profitability could be influenced, in part, by paying employees through compensation expense as opposed to dividends as shareholders. Accordingly, to enhance the comparability of the Advisor’s profitability with that of certain industry peers, the Independent Trustees also reviewed the Advisor’s profitability data for 2015 on an adjusted basis which reflected adjustments to the compensation expense to reflect such expense as a percentage of total revenues similar to that of certain industry peers. In considering the comparative data, the Independent Trustees also were aware of the limitations of the comparative data as the other advisers may have a different business mix, employ different allocation methodologies, have different capital structure and costs, may not be representative of the industry or other factors that limit the comparability of the profitability information.
145
| | |
| WASATCH FUNDS | | MARCH 31, 2017 (UNAUDITED) |
|
|
|
Supplemental Information (continued)
Notwithstanding the foregoing, the Independent Trustees noted that the Advisor’s profitability (with and without the compensation adjustment) is within a reasonable range compared to the peer group of unaffiliated advisers. Based on their review, the Independent Trustees were satisfied that the Advisor’s level of profitability from its relationship with each Fund was not unreasonable in light of the services provided.
With respect to the Sub-Advisors, although a profitability analysis from their relationship with the applicable Fund was not available, the Independent Trustees received certain financial statements of the Sub-Advisors. The Trustees reviewed HIMCO’s financial statements for the years ended December 31, 2015 and 2014 and 1st Source’s income statement for the month ended September 30, 2015 and September 30, 2014. Considering the Sub-Advisors’ fee schedules and the fact that the sub-advisory fees are established through arm’s length negotiations, the Independent Trustees concluded that HIMCO’s and 1st Source’s profitability from the Sub-Advisor’s relationship with the U.S. Treasury Fund and Income Fund, respectively, is not unreasonable.
In addition to the above, the Independent Trustees also considered any indirect benefits (such as soft dollars) that the Advisor or Sub-Advisor received that were directly attributable to the management of the applicable Funds. See Section E below for additional information on indirect benefits the Advisor or Sub-Advisors may receive as a result of their relationship with the respective Funds.
| D. | | ECONOMIESOF SCALEAND WHETHER FEE LEVELS REFLECT THESE ECONOMIESOF SCALE |
The Independent Trustees recognized that as assets of a particular Fund or in the aggregate in the complex increase over time, economies of scale may be realized in the management of the Funds. Although difficult to measure with precision, the Independent Trustees considered whether there have been any economies of scale and whether the Funds have appropriately benefited from any such economies of scale. In this regard, in the Board’s view, a discussion of economies of scale for the Funds must include the consideration of any capacity constraints on the particular Funds. The Independent Trustees have recognized that the Funds investing in small and micro-cap companies have capacity constraints and accordingly, the Advisor historically has closed certain Funds limiting the respective Fund’s asset growth from time to time to protect such Fund’s ability to achieve good performance results that may not be able to be replicated at higher asset levels. While the Board recognizes that this practice both limits the potential profit the Advisor may earn on higher assets under management and may prevent reaching economies of scales that may exist at higher asset levels, the Board believes it is more beneficial to protect performance for shareholders. In assessing economies of scale with respect to Funds without such capacity constraints, the Independent Trustees also considered the current level of assets of the Funds, the factors the Advisor considered in proposing a fee level and the Advisor’s position that such Funds’ are priced at a level that already reflects potential economies of scale. The Board also considered that the costs associated with the Advisor’s research
intensive approach may inhibit achieving some economies of scale in the management of the Funds. Further, although the Advisor’s and Sub-Advisors’ fee schedules did not contain breakpoints which is a means of sharing economies of scale as assets grow, the Independent Trustees noted that the Advisor has agreed to temporary expense caps that limit the overall net expense ratios on the respective classes of the Funds (other than the Income Fund) which is another means of sharing economies of scale. Considering the factors above, the Independent Trustees concluded the absence of breakpoints in the management fee was acceptable and that such economies as exist are adequately reflected in the Advisor’s fee structure.
The Independent Trustees received and considered information regarding indirect benefits the Advisor and Sub-Advisors may receive as a result of their relationship with the Funds. In this regard, the Independent Trustees recognized that the Advisor may receive benefits from soft dollar arrangements whereby the Advisor may use a portion of the brokerage commissions paid by the Funds to acquire research that may be useful to the Advisor in managing the Funds and other clients. The Independent Trustees recognized that the Advisor’s profitability would be lower if it paid for such research with its own revenues. The Independent Trustees reviewed information regarding the soft dollar arrangements including, among other things, the commissions paid, the services provided and the measures to determine the quality of execution received. With respect to the Sub-Advisors, the Independent Trustees recognized that the Sub-Advisors currently do not have soft dollar arrangements on behalf of their respective Funds but considered any other benefits that the Sub-Advisors may receive from their relationship with the Funds. The Independent Trustees recognized that the Advisor pays certain fees to 1st Source for shareholder servicing. The Independent Trustees further considered the reputational and/or marketing benefits the Advisor and Sub-Advisors may receive as a result of their association with the Funds. The Independent Trustees took these indirect benefits into account when accessing the level of advisory fees paid to the Advisor and sub-advisory fee to the respective Sub-Advisor and considered such indirect benefits to be acceptable.
| F. | | ANNUAL APPROVALOF ADVISORYAND SUB-ADVISORY AGREEMENTS |
The Independent Trustees did not identify any single factor discussed previously as all-important or controlling. The Board, including a majority of Independent Trustees, concluded that the terms of the Advisory Agreement for each Fund, the Sub-Advisory Agreement with HIMCO on behalf of the U.S. Treasury Fund, and the Sub-Advisory Agreement with 1st Source on behalf of the Income Fund were fair and reasonable, that the Advisor’s and Sub-Advisors’ fees are reasonable in light of the services provided to each respective Fund, and that the Advisory Agreement should be approved on behalf of each Fund and the Sub-Advisory Agreements should be approved on behalf of the U.S. Treasury Fund and the Income Fund, respectively.
146
| | |
| WASATCH FUNDS | | MARCH 31, 2017 (UNAUDITED) |
|
|
|
Service Providers
INVESTMENT ADVISOR
Wasatch Advisors, Inc.
505 Wakara Way, 3rd Floor
Salt Lake City, UT 84108
SUB-ADVISORFORTHE INCOME FUND
1st Source Corporation Investment Advisors, Inc.
100 North Michigan Street
South Bend, IN 46601
SUB-ADVISORFORTHE U.S. TREASURY FUND
Hoisington Investment Management Co.
6836 Bee Caves Road
Building 2, Suite 100
Austin, TX 78746
ADMINISTRATORAND FUND ACCOUNTANT
State Street Bank and Trust Company
801 Pennsylvania Avenue
Kansas City, MO 64105
DISTRIBUTOR
ALPS Distributors, Inc.
1290 Broadway, Suite 1100
Denver, CO 80203
TRANSFER AGENT
UMB Fund Services, Inc.
235 West Galena Street
Milwaukee, WI 53212
CUSTODIAN
State Street Bank and Trust Company
801 Pennsylvania Avenue
Kansas City, MO 64105
LEGAL COUNSELTO WASATCH FUNDSANDINDEPENDENT TRUSTEES
Chapman and Cutler, LLP
111 West Monroe Street
Chicago, IL 60603
INDEPENDENT REGISTERED PUBLIC ACCOUNTING FIRM
PricewaterhouseCoopers LLP
1100 Walnut Street, Suite 1300
Kansas City, MO 64106
TELEPHONE
800.551.1700
M - F, 7:00 a.m. to 7:00 p.m. Central Time
Automated Line, 24 Hours
U.S. MAIL
Wasatch Funds
P.O. Box 2172
Milwaukee, WI 53201-2172
OVERNIGHT DELIVERY
Wasatch Funds
235 West Galena Street
Milwaukee, WI 53212
ONLINE
www.WasatchFunds.com
shareholderservice@wasatchfunds.com
147

2017 Semi-Annual Report www.WasatchFunds.com
Not required.
| Item 3. | Audit Committee Financial Expert. |
Not required.
| Item 4. | Principal Accountant Fees and Services. |
Not required.
| Item 5. | Audit Committee of Listed Registrants. |
Not applicable.
| Item 6. | Schedule of Investments. |
| (a) | Schedule of Investments is included as a part of the report to shareholders filed under Item 1 of this Form N-CSR. |
| Item 7. | Disclosure of Proxy Voting Policies and Procedures for Closed-End Management Investment Companies. |
Not applicable.
| Item 8. | Portfolio Managers of Closed-End Investment Companies. |
Not applicable.
| Item 9. | Purchases of Equity Securities by Closed-End Management Investment Company and Affiliated Purchasers. |
Not applicable.
| Item 10. | Submission of Matters to a Vote of Security Holders. |
There have been no material changes to the procedures by which shareholders may recommend nominees to the Registrant’s board of trustees, where those changes were implemented after the Registrant last provided disclosure in response to this item.
| Item 11. | Controls and Procedures. |
| (a) | The Registrant’s principal executive and principal financial officers have concluded that the Registrant’s disclosure controls and procedures (as defined in Rule 30a-3(c) under the Investment Company Act of 1940, as amended (the “1940 Act”)) are effective, as of a date within 90 days of the filing date of this Form N-CSR based on their evaluation of these controls and procedures required by Rule 30a-3(b) under the 1940 Act) and Rules 13a-15(b) or 15d-15(b) under the Securities Exchange Act of 1934). |
| (b) | There were no changes in the Registrant’s internal control over financial reporting (as defined in Rule 30a-3(d) under the 1940 Act) that occurred during the Registrant’s second fiscal quarter of the period covered by this report that has materially affected, or is reasonably likely to materially affect, the Registrant’s internal control over financial reporting. |
| | |
(a)(1) | | Not required. |
| |
(a)(2) | | The certifications required by Rule 30a-2(a) of the 1940 Act are attached hereto. |
| |
(a)(3) | | Not applicable. |
| |
(b) | | The certifications required by Rule 30a-2(b) of the 1940 Act and Section 906 of the Sarbanes-Oxley Act of 2002 are attached hereto. |
SIGNATURES
Pursuant to the requirements of the Securities Exchange Act of 1934 and the Investment Company Act of 1940, the Registrant has duly caused this report to be signed on its behalf by the undersigned, thereunto duly authorized.
WASATCH FUNDS TRUST
| | |
| By: | | /s/ Samuel S. Stewart, Jr. |
| | Samuel S. Stewart, Jr. |
| | President (principal executive officer) of Wasatch Funds Trust |
| |
| Date: | | June 5, 2017 |
Pursuant to the requirements of the Securities Exchange Act of 1934 and the Investment Company Act of 1940, this report has been signed below by the following persons on behalf of the Registrant and in the capacities and on the dates indicated.
| | |
| By: | | /s/ Samuel S. Stewart, Jr. |
| | Samuel S. Stewart, Jr. |
| | President (principal executive officer) of Wasatch Funds Trust |
| |
| Date: | | June 5, 2017 |
| |
| By: | | /s/ Cindy B. Firestone |
| | Cindy B. Firestone |
| | Treasurer (principal financial officer) of Wasatch Funds Trust |
| |
| Date: | | June 5, 2017 |