| | | |
| | |
|
| | | OMB APPROVAL |
| | |
|
| | | OMB Number: 3235-0570 |
| | | Expires: August 31, 2010 |
| | | Estimated average burden |
| | | hours per response: 18.9 |
| | |
|
UNITED STATES
SECURITIES AND EXCHANGE COMMISSION
Washington, D.C. 20549
FORM N-CSR
CERTIFIED SHAREHOLDER REPORT OF REGISTERED MANAGEMENT INVESTMENT COMPANIES
Investment Company Act file number: 811-4923
Longleaf Partners Funds Trust
(Exact name of registrant as specified in charter)
c/o Southeastern Asset Management, Inc.
6410 Poplar Avenue, Suite 900
Memphis, TN 38119
(Address of principal executive offices) (Zip code)
Andrew R. McCarroll, Esq.
Southeastern Asset Management, Inc.
6410 Poplar Ave., Suite 900
Memphis, TN 38119
(Name and address of agent for service)
Registrant’s telephone number, including area code: (901) 761-2474
Date of fiscal year end: December 31
Date of reporting period: December 31, 2009.
TABLE OF CONTENTS
Item 1. Longleaf Partners Funds Annual Report at December 31, 2009.
LONGLEAF PARTNERS FUNDS ®
ANNUAL REPORT
at December 31, 2009
PARTNERS FUND
SMALL-CAP FUND
INTERNATIONAL FUND
MANAGED BY:
SOUTHEASTERN ASSET MANAGEMENT, INC.®
Memphis, TN
Cautionary Statement
One of Longleaf’s “Governing Principles” is that “we will communicate with our investment partners as candidly as possible,” because we believe our shareholders benefit from understanding our investment philosophy and approach. Our views and opinions regarding the investment prospects of our portfolio holdings and Funds are “forward looking statements” which may or may not be accurate over the long term. While we believe we have a reasonable basis for our appraisals and we have confidence in our opinions, actual results may differ materially from those we anticipate. Information provided in this report should not be considered a recommendation to purchase or sell any particular security.
You can identify forward looking statements by words like “believe,” “expect,” “anticipate,” or similar expressions when discussing prospects for particular portfolio holdings and/or one of the Funds. We cannot assure future results and achievements. You should not place undue reliance on forward looking statements, which speak only as of the date of this report. We disclaim any obligation to update or alter any forward looking statements, whether as a result of new information, future events, or otherwise. This material must be preceded or accompanied by a Prospectus. Please read the Prospectus carefully for a discussion of fees, expenses, and risks. Current performance may be lower or higher than the performance quoted herein. You may obtain a current copy of the Prospectus or more current performance information by calling 800-445-9469 or at Longleaf’s website (www.longleafpartners.com).
The price-to-value ratio (“P/V”) is a calculation that compares the prices of the stocks in a portfolio to Southeastern’s appraisal of their intrinsic values. P/V represents a single data point about a Fund, and should not be construed as something more. We caution our shareholders not to give this calculation undue weight. P/V alone tells nothing about:
| |
| • | The quality of the businesses we own or the managements that run them; |
| • | The cash held in the portfolio and when that cash will be invested; |
| • | The range or distribution of individual P/V’s that comprise the average; and |
| • | The sources of and changes in the P/V. |
When all of the above information is considered, the P/V is a useful tool to gauge the attractiveness of a Fund’s potential opportunity. It does not, however, tell when that opportunity will be realized, nor does it guarantee that any particular company’s price will ever reach its value. We remind our shareholders who want to find a single silver bullet of information that investments are rarely that simple. To the extent an investor considers P/V in assessing a Fund’s return opportunity, the limits of this tool should be considered along with other factors relevant to each investor.
© 2010 Longleaf Partners Funds Trust. All Rights Reserved.
LONGLEAF, LONGLEAF PARTNERS FUNDS and the pine cone logo are registered trademarks of Longleaf Partners Funds Trust. SOUTHEASTERN ASSET MANAGEMENT, INC. is a registered trademark.
CONTENTS
| | | |
| | 1 |
| | | |
| Longleaf Partners Fund (Partners Fund) | | |
| | 7 |
| | 10 |
| | 11 |
| | 12 |
| | | |
| Longleaf Partners Small-Cap Fund (Small-Cap Fund) | | |
| | 16 |
| | 18 |
| | 19 |
| | 20 |
| | | |
| Longleaf Partners International Fund (International Fund) | | |
| | 23 |
| | 26 |
| | 27 |
| | 28 |
| | | |
| | 32 |
| | | |
| | 50 |
| | | |
| | 52 |
| | | |
| Unaudited: | | |
| | 54 |
| | 60 |
| | 62 |
| | 65 |
| | 67 |
Longleaf Partners Funds
TO OUR SHAREHOLDERS:
It was a terrific year for the owners of the Longleaf Partners Funds. Each Fund posted another positive quarter and ended 2009 with strong absolute returns that materially exceeded our annual goal of inflation plus 10%. The Partners and Small-Cap Funds produced the best results in their 20+ year histories. They also beat their respective indices meaningfully with Small-Cap having its best relative year ever and Partners having its second best. Although headlines describe the “lost decade,” over the last ten years the Funds generated positive returns that were substantially greater than the relevant benchmarks. The table below shows cumulative returns over both the long run and the more recent periods.
| | | | | | | | | | | | | | | | | | | | | |
| | | Cumulative Returns through December 31, 2009(3) | |
| | | Since IPO(1) | | | 20 Year | | | 10 Year | | | 5 Year | | | 1 Year | |
| |
Partners Fund (4-8-87 IPO) | | | 949.9 | % | | | 623.9 | % | | | 67.7 | % | | | (4.8) | % | | | 53.6 | % |
| S&P 500 Index | | | 545.0 | | | | 384.3 | | | | (9.1) | | | | 2.1 | | | | 26.5 | |
| | | | | | | | | | | | | | | | | | | | | |
Small-Cap Fund (2-21-89 IPO) | | | 636.9 | | | | 506.4 | | | | 120.5 | | | | 16.7 | | | | 49.3 | |
| Russell 2000 Index | | | 441.7 | | | | 396.7 | | | | 41.3 | | | | 2.6 | | | | 27.2 | |
| | | | | | | | | | | | | | | | | | | | | |
International Fund (10-26-98 IPO) | | | 178.4 | | | | NA | | | | 105.4 | | | | 13.4 | | | | 23.2 | |
| EAFE Index | | | 55.9 | | | | NA | | | | 12.4 | | | | 19.0 | | | | 31.8 | |
| | | | | | | | | | | | | | | | | | | | | |
| Inflation plus 10% | | | (2) | | | | 997.9 | | | | 225.5 | | | | 80.7 | | | | 12.7 | |
| | |
| (1) | | During the inception year, the S&P 500 Index and the EAFE Index were available at month-end only; therefore, the S&P 500 Index value at 3-31-87 and the EAFE Index value at 10-31-98 were used to calculate performance since inception. |
| |
| (2) | | Inflation plus 10% since inception for the Partners, Small-Cap and International Funds was 1485.5%, 1142.1% and 275.8%, respectively. |
| |
| (3) | | Average annual returns for the periods ended December 31, 2009 follow: |
| | | | | | | | | | | | | | | | | | | | | |
| | | Since IPO(1) | | | 20 Year | | | 10 Year | | | 5 Year | | | 1 Year | |
Partners Fund | | | 10.90 | % | | | 10.40 | % | | | 5.31 | % | | | (0.98) | % | | | 53.60 | % |
| S&P 500 Index | | | 8.54 | | | | 8.21 | | | | (0.95) | | | | 0.42 | | | | 26.46 | |
Small-Cap Fund | | | 10.05 | | | | 9.43 | | | | 8.23 | | | | 3.13 | | | | 49.31 | |
| Russell 2000 Index | | | 8.44 | | | | 8.34 | | | | 3.51 | | | | 0.51 | | | | 27.17 | |
International Fund | | | 9.59 | | | | NA | | | | 7.46 | | | | 2.54 | | | | 23.17 | |
| EAFE Index | | | 4.06 | | | | NA | | | | 1.17 | | | | 3.54 | | | | 31.78 | |
1
Longleaf Partners Funds
LETTER TO SHAREHOLDERS
Lessons of 2009
After the market meltdown of 2008, the most frequently asked question we received was, “What have you learned?” In previous shareholder communications we have elaborated on the things we learned including painful lessons from mistakes that cost us a few permanent losses.
In addition to that oft asked question, the most discussed topic has been macroeconomic forecasting’s importance. The macro environment dominated everything in 2008. For those doing solid bottoms-up corporate analysis, the credit crisis overwhelmed individual company analytical conclusions. “Micro” work seemed practically irrelevant, generating suggestions that macro issues should become a greater focus for Southeastern to better protect our investment partners. An understanding of how the macro will affect those names that we own or are considering always has been important. For example, in a vacuum we would not follow Mexican macroeconomic statistics. But as a shareowner of Cemex, we must have some grasp of the Mexican economy’s drivers to properly assess intrinsic value and understand appraisal risks.
Interestingly we have not been asked about the “lessons of 2009.” The first answer to that unasked question is that bottoms-up fundamental company analysis matters quite a bit. If it were probable that every year could be like 2008, every investor should try to monitor the global banking system and engage in macroeconomic prognosticating. However, if it were highly probable that the worldwide economy, banking system, and equity markets would not look like 2008 in most years, then we should not abandon lessons from Graham, Buffett, and our 35 years to become macro driven “generals-fighting-the-last-war.” Simply stated, 2009 reminded us that 2008 was anomalous.
A macro oriented investor could have logically decided on January 1, 2009 (or in March when stocks were meaningfully lower) that with the horrible global economy, the teetering banking systems across multiple countries, and the extremely weak stock markets, it was a good time to sit on the sidelines until some economic clarity emerged. By contrast, an intrinsic value investor who focused on the free cash flow that certain well-run, competitively advantaged companies generated – even in a severe recession – would have purchased those cash flow streams at incredibly low multiples, i.e. high cash flow yields. Those who chose the macro route and parked in cash missed what was the best purchase point for equities in our lifetime and earned virtually nothing on their liquidity.
This leads to the second lesson of 2009: comfort comes at a very high cost. Buffett made this point in an August 6, 1979 Forbes article entitled, “You Pay A Very High Price In the Stock Market For A Cheery Consensus.” Selling stocks in 2007 would have been uncomfortable; in retrospect we all should have done more of that. Buying or even holding stocks in early 2009 was very uncomfortable; investors should have
2
Longleaf Partners Funds
LETTER TO SHAREHOLDERS
done that. Many investors feel most comfortable when the consensus confirms their view. Making the same investment choices as a large number of other intelligent people mathematically almost insures doing the wrong thing at the wrong time because security prices reflect the collective action of the consensus group.
So where are we now? We believe that we are between the valuation extremes of the mid-2007 highs and the early 2009 lows. With global markets having risen rapidly since March, bargains are less plentiful, and free cash flow yields are less attractive. However, valuations are still compelling when compared to the past. Our price-to-value ratios remain at or below the long-term average. Also, the “comfort gauge” still appears favorable given the excessive quantity of cash people are holding in lieu of equities. This cash on the sidelines constitutes significant future buying power that will someday make its way back to attractive, growing corporate free cash flow yields that almost always find their long-term recognition either in the stock market when overall psychology shifts or from corporate M&A. Today many macro mavens are comfortable owning the taxable, fixed coupons of 10-year Treasuries at yields of 3.7%. We much prefer the after-tax, growing free cash flow coupons of dominant businesses at yields of 9-10%.
The importance of aligning interests
Some years ago, Jack Byrne, a friend and an exemplary corporate leader at Geico, Fireman’s Fund, and White Mountains, observed that to get proper Board and executive behavior, it is critical to properly align directors’ and managements’ interests with shareholders’. You do that best by equitably making them owners. Owners make better decisions than hired hands.
Subsequently, Southeastern has strived to create a best-in-class, accountable, owner-operator, partnership governance culture for Southeastern’s and Longleaf Partners Funds’ shareholders. Southeastern’s employees must use the Longleaf Partners Funds exclusively for their public equity investing. Longleaf’s Trustees are required to invest an amount equal to their cumulative board compensation in the three Funds. As a result, Southeastern’s employees and affiliates are the largest group of owners across the Funds, and Longleaf’s Trustees have nearly three times their cumulative remuneration invested in the Funds.
Southeastern seeks similar owner-operator corporate governance from our investees. We have found that when directors’ decisions impact their personal economics, board members become extremely engaged and focus on prudently building owners’ value per share. We believe directors should be paid in cash and use all of that cash to purchase shares of the company in the open market. Those shares should be retained for the director’s tenure on the board. This simple standard provides the most accountability and properly aligns the board’s interest with shareholders’. This
3
Longleaf Partners Funds
LETTER TO SHAREHOLDERS
alignment helps insure better operating and capital allocation decisions that responsibly weigh risks against the probabilities for future returns.
Southeastern is in the process of contacting every company owned by the Funds and asking them to adopt this simple governance standard for directors. We intend to back our conviction by adding this policy to proxy statements if directors do not sufficiently incorporate the ownership policies described.
International Fund changes
Several changes to Longleaf International in the last year position the Fund for even better compounding over the next decade. First, we reduced the management fee by at least 30 basis points, and as much as 50 basis points as the fee break takes effect on assets over $2.5 billion. In addition, we have elevated the roles of Scott Cobb and Ken Siazon to oversee their respective regions, and effective with the 2010 Prospectus, each will be a co-portfolio manager of the Fund. We have hired a junior analyst, Manish Sharma, who will be based in Singapore with Ken. Josh Shores, who has been at Southeastern since 2007, will be moving from Memphis to London to work more closely with Scott.
We also decided to eliminate hedging in the Fund. Historically, less than half of the portfolio has been hedged, but the no hedging policy will allow our partners to determine their own strategy for currency exposure.
Hiring Update
In our September 30th report we mentioned our effort to expand our research and client teams. We have had success on both fronts. In addition to adding Manish Sharma in Singapore, we hired Brandon Arrindell as a junior analyst in Memphis. On the client front, John Owen has joined us to work with consultants and prospective clients in the U.S. Peter Montgomery will join us in March to focus on our Longleaf client base. We currently have an open IT position in Memphis primarily focused on the development and management of trading and portfolio accounting systems. If you are interested in a detailed job description or would like to submit your resume, please email itposition@llpf.com.
Annual presentation and web site update
We hope that many of you will join us for the annual Longleaf shareholder gathering in Memphis on Wednesday, May 5 at 5:30 p.m. at the Germantown Performing Arts Center. As the date gets closer, we will have more information posted on our web site. Speaking of the web site, in early 2010 we are undertaking an effort to improve and enhance the Longleaf site, including adding more information related to Southeastern Asset Management, Inc. We welcome any suggestions you have for how the site could be more useful and easier to use. Please send these to website@longleafpartners.com.
4
Longleaf Partners Funds
LETTER TO SHAREHOLDERS
Conclusion
We are pleased to have delivered superior absolute returns in 2009. We believe that we are in the early innings of capturing the opportunity in the Funds. The collective quality and strength of the businesses we own is unprecedented. Our management partners have delivered their companies through the worst of times and positioned them as stronger competitors. P/V’s are near or below the long-term average from which we have compounded successfully. Not only are the Funds quantitatively attractive, but the “V’s”, or appraisals are extremely conservative and probably understated. The returns of 2009 reflected excessively cheap prices moving to more normal discounts. None of the last twelve months’ return was generated by value growth. Going forward our businesses are capable of double-digit value growth given the anemic operating results in 2009 as their base. Any cyclical economic recovery will amplify this growth. The foundation for the next five years is in place to not only protect our partners’ capital, but earn better-than-adequate returns.
Sincerely,
| | | |
 | | |
O. Mason Hawkins, CFA
Chairman & CEO
Southeastern Asset Management, Inc. | | G. Staley Cates, CFA
President
Southeastern Asset Management, Inc. |
5
Intentionally Left Blank
6
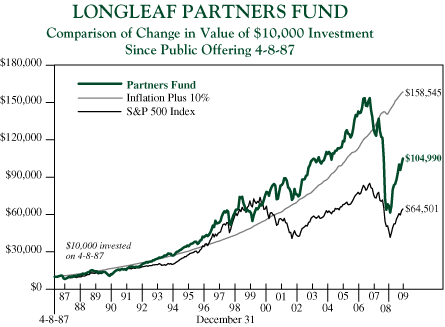
Partners Fund
Longleaf Partners Fund gained 53.6% in 2009, the best return in the Fund’s twenty-two year history. Not only did the Fund far surpass our absolute goal of inflation plus 10%, but the result was the second largest outperformance of the Fund over the S&P 500 Index. The Fund’s 4.8% rise in the fourth quarter also bested our absolute goal. Below are the long-term cumulative returns of the Fund.
| | | | | | | | | | | | | | | | | |
| | | Cumulative Returns at December 31, 2009 | |
| | | Inception | | | 20 Year | | | 15 Year | | | 10 Year | |
| |
Partners Fund | | | 949.9 | % | | | 623.9 | % | | | 287.6 | % | | | 67.7 | % |
| S&P 500 Index | | | 545.0 | | | | 384.3 | | | | 219.2 | | | | (9.1 | ) |
| Inflation plus 10% | | | 1485.5 | | | | 997.9 | | | | 483.1 | | | | 225.5 | |
Please see page 10 for additional performance information.
The Fund’s combined positions in Liberty Media Entertainment (LMDIA) and DIRECTV (DTV), which merged in November, contributed the most to the year and the fourth quarter. Not only was LMDIA up over 100% in 2009, but we opportunistically overweighted the position in late 2008 when the price traded at a 40% discount to that of DTV, the main underlying asset of LMDIA. Management of DTV added subscribers, increased ARPU (average revenue per subscriber), and bought in undervalued shares throughout the year. Although we trimmed some shares as price rose, DTV remains the Fund’s largest position and still sells at a steep discount to our appraised value. Truly discretionary free cash flow far exceeds reported earnings because the cost to gain net new subscribers, an optional investment with a high long-term return, is deducted from current profits.
Several other holdings more than doubled during 2009. Liberty Media Interactive rose almost 250% for the year as QVC’s results outperformed its traditional retailing peers. Management used the company’s improved results and a better credit environment to extend QVC’s debt maturities. Sun Microsystems gained over 130% when Oracle announced its plan to acquire the company last spring. Pioneer Natural Resources ended the year up 198% after rising 33% in the fourth quarter. Rising oil prices brought attention to the Spraberry field where the company is stepping up its drilling. Excitement is also growing about Pioneer’s position in the Eagle Ford shale play. Importantly, the company’s three new independent directors have increased the focus on growing NAV per share.
Several long-term core positions rallied nicely in the fourth quarter and ended the year among the top ten contributors to return. Disney, the Fund’s fourth largest holding, rose 17% over the last three months and 42% in 2009. The company’s purchase of Marvel was approved, and ESPN showed its superiority over other media
7
Partners Fund
MANAGEMENT DISCUSSION
assets by actually growing earnings in 2009. The theme parks also proved to be more stable than many expected. Philips Electronics gained over 20% in the fourth quarter and over 50% for the year. The company beat expectations in the second half in all divisions. The healthcare business grew nicely in emerging markets, and top line declines slowed in developed markets within the lighting and healthcare divisions.
Although Chesapeake Energy’s stock declined in the fourth quarter, it rallied over 60% in 2009 even as natural gas prices were slightly down in the year. The company was highly productive — selling non-core assets, cutting capital spending, growing production, moving probable reserves to proven, and most recently, monetizing value through a minority stake sale in the Barnett Shale to Total S.A. Chesapeake, among our most discounted holdings, is the Fund’s second largest position.
NipponKoa, the only position that meaningfully detracted from the year’s return, fell 6% in the quarter and 23% in 2009. Japan was one of only five major world markets that did not compound at greater than 20%, rising only 6.8% for the year. NipponKoa maintained its strong balance sheet. Under the recently approved merger with Sompo, the new governance structure should hold management accountable for both underwriting and investing. We are confident that management is committed to the combined company being a best in class global non-life insurance business.
In the fourth quarter we sold Liberty Starz, which was spun out of LMDIA before its merger with DTV. Earlier in the year we sold Sun, eBay, and Walgreen. We added to a number of severely discounted names early in the year, and scaled back positions after prices rebounded strongly. In the second half of the year we found few qualifying names. Consequently, the combination of the sales and trims in the portfolio left us with 13% in cash at the end of 2009. We will patiently wait to deploy this liquidity until qualifiers emerge.
Because insurance was one of the few industries that did not participate in the 2009 rally, we found several opportunities in that area. We bought the world’s largest insurance broker, Aon, a previous holding, and Berkshire Hathaway in the first half of the year. More recently we added a small position in Willis, another major international broker. These companies are facing weak pricing as a result of both declining demand from reduced economic activity and the U.S. Treasury’s AIG bailout that enabled the company’s price discounting in an attempt to generate cash to survive. Irrational pricing at some point will be self-correcting. Until that time, we have the opportunity to own these high quality competitors with top notch corporate partners at meaningful discounts. We identified two additional new opportunities in the fourth quarter, Intercontinental Hotels and BNY Mellon. Although in different industries (lodging and financial services), each generates valuable fee streams and has
8
Partners Fund
MANAGEMENT DISCUSSION
management with a record of building value per share. Both stocks have risen above our buy limit, and we therefore have not built full positions.
After such a spectacular year our partners might assume that the portfolio has little remaining upside. To the contrary, because the Fund began 2009 so deeply discounted, the record return has left us at a P/V in the low-60%s — below the long-term average. In addition to being quantitatively attractive, the Partners Fund has the best qualitative characteristics in memory. As you examine the 19 holdings, you will find primarily businesses that are dominant in their competitive arenas and have emerged from the recession in stronger positions versus many of their peers. You will find management teams who have cut costs and protected margins more than most expected in an environment of steep top line declines, and most are significant owners with us. Because of how well these businesses are positioned, secular revenue recovery should result in double-digit value growth, adding to the upside opportunity well beyond what the P/V implies.
9
AVERAGE ANNUAL RETURNS
for the periods ended December 31, 2009
| | | | | | | | | | | | | |
| | | Partners
| | | S&P 500
| | | Inflation
| |
| | | Fund | | | Index | | | Plus 10% | |
| |
| One Year | | | 53.60 | % | | | 26.46 | % | | | 12.72 | % |
| Five Years | | | (0.98 | ) | | | 0.42 | | | | 12.56 | |
| Ten Years | | | 5.31 | | | | (0.95 | ) | | | 12.52 | |
| Since Public Offering 4-8-87 | | | 10.90 | | | | 8.54 | | | | 12.93 | |
Past performance does not predict future performance, Fund prices fluctuate, and the value of an investment at redemption may be worth more or less than the purchase price. The Fund’s performance results in the table shown above do not reflect the deduction of taxes that a shareholder would pay on Fund distributions or the redemption of Fund shares. The S&P 500 Index is shown with all dividends and distributions reinvested. In 1987, the reinvested S&P 500 Index was available at month-end only; therefore, the index value at 3-31-87 was used to calculate performance since public offering. This index is unmanaged and is not hedged for foreign currency risk. Historic numbers include periods in which the Fund used currency hedging as an investment strategy. Beginning in the third quarter 2009, and following a transition period ending in early 2010, hedging as a routine strategy ended. The U.S. Bureau of Labor Statistics compiles the monthly CPI-U values used to calculate inflation. Current performance may be lower or higher than the performance quoted. Please call 800-445-9469 or view Longleaf’s website (www.longleafpartners.com) for more current performance information.
10
TABLE OF PORTFOLIO HOLDINGS
at December 31, 2009
| | | | | | | | | |
| | | | | | Net
| |
| | | | | | Assets | |
| |
| Common Stock | | | | | | | 85.3 | % |
| DIRECTV | | | 10.8 | | | | | |
| Chesapeake Energy Corporation | | | 8.2 | | | | | |
| Dell Inc. | | | 7.6 | | | | | |
| The Walt Disney Corporation | | | 6.8 | | | | | |
| Pioneer Natural Resources Company | | | 5.2 | | | | | |
| Yum! Brands, Inc. | | | 5.0 | | | | | |
| Koninklijke Philips Electronics N.V. | | | 4.7 | | | | | |
| The NipponKoa Insurance Company, Ltd. | | | 4.5 | | | | | |
| Liberty Media Holding Corporation – Interactive | | | 4.4 | | | | | |
| Cemex S.A.B. de C.V. ADS | | | 4.3 | | | | | |
| Marriott International, Inc. | | | 3.9 | | | | | |
| Berkshire Hathaway Inc. | | | 3.5 | | | | | |
| Aon Corporation | | | 3.1 | | | | | |
| FedEx Corporation | | | 3.0 | | | | | |
| Telephone and Data Systems, Inc. | | | 2.8 | | | | | |
| Level 3 Communications, Inc. | | | 2.7 | | | | | |
| The Bank of New York Mellon Corporation | | | 2.6 | | | | | |
| InterContinental Hotels Group PLC | | | 1.3 | | | | | |
| Willis Group Holdings Limited | | | 0.9 | | | | | |
| Corporate Bonds | | | | | | | 1.6 | |
| Level 3 Communications, Inc. | | | 1.6 | | | | | |
| Cash Reserves | | | | | | | 13.0 | |
| Other Assets and Liabilities, net | | | | | | | 0.1 | |
| | | | | | | | | |
| | | | | | | | 100.0 | % |
| | | | | | | | | |
PORTFOLIO CHANGES
January 1, 2009 through December 31, 2009
| | | |
New Holdings | | Eliminations |
Aon Corporation
The Bank of New York
Mellon Corporation
Berkshire Hathaway Inc. – Class A
Chesapeake Energy Corporation
2.50% Contingent Convertible
Senior Notes due 5-15-37
InterContinental Hotels Group PLC
Liberty Media Corporation Starz – Series A
(The DIRECTV Group, Inc.)(a)
Willis Group Holdings Limited | | Chesapeake Energy Corporation
2.50% Contingent Convertible
Senior Notes due 5-15-37
eBay, Inc.
General Motors Corporation,
5.25% Series B Convertible
Senior Debentures due 2032
Level 3 Communications, Inc.,
6% Convertible Subordinated Notes due 3-15-10
Liberty Media Corporation Starz – Series A
(The DIRECTV Group, Inc.)(a)
Liberty Media Entertainment Corporation
(The DIRECTV Group, Inc.)(a)
Sun Microsystems, Inc.
Walgreen Co. |
| |
| (a) | Change due to corporate action (name of related holding) |
11
at December 31, 2009
| | | | | | | | | | | | | | | | | |
| | | Shares | | | | | | | | | Value | |
| | | Common Stock 85.3% | | | | |
| | | | | | | | | Broadcasting and Cable 10.8% | | | | |
| | | | 26,006,724 | | | * | | DIRECTV – Class A (Formerly The DIRECTV Group, Inc.) | | $ | 867,324,245 | |
| | | | | | | | | | | | | | | | | |
| | | | | | | | | Construction Materials 4.3% | | | | | | | | |
| | | | 29,459,040 | | | * | | Cemex S.A.B. de C.V. ADS (Foreign) | | | 348,205,853 | |
| | | | | | | | | | | | | | | | | |
| | | | | | | | | Entertainment 6.8% | | | | | | | | |
| | | | 17,035,082 | | | | | The Walt Disney Corporation | | | 549,381,394 | |
| | | | | | | | | | | | | | | | | |
| | | | | | | | | Financial Services 2.6% | | | | | | | | |
| | | | 7,387,000 | | | | | The Bank of New York Mellon Corporation | | | 206,614,390 | |
| | | | | | | | | | | | | | | | | |
| | | | | | | | | Hotels 5.2% | | | | | | | | |
| | | | 7,260,595 | | | | | InterContinental Hotels Group PLC (Foreign) | | | 104,320,172 | |
| | | | 11,603,201 | | | | | Marriott International, Inc.(d)(e) | | | 316,187,227 | |
| | | | | | | | | | | | | |
| | | | | | | | | | | | 420,507,399 | |
| | | | | | | | | | | | | |
| | | | | | | | | | | | | | | | | |
| | | | | | | | | Insurance Brokerage 4.0% | | | | | | | | |
| | | | 6,410,200 | | | | | Aon Corporation | | | 245,767,068 | |
| | | | 2,800,000 | | | | | Willis Group Holdings Limited (Foreign) | | | 73,864,000 | |
| | | | | | | | | | | | | |
| | | | | | | | | | | | 319,631,068 | |
| | | | | | | | | | | | | |
| | | | | | | | | | | | | | | | | |
| | | | | | | | | Internet and Catalog Retail 4.4% | | | | | | | | |
| | | | 32,411,943 | | | * | | Liberty Media Holding Corporation – Interactive
Series A | | | 351,345,462 | |
| | | | | | | | | | | | | | | | | |
| | | | | | | | | Multi-Industry 4.7% | | | | | | | | |
| | | | 9,523,000 | | | | | Koninklijke (Royal) Philips Electronics N.V. (Foreign) | | | 281,493,243 | |
| | | | 3,406,731 | | | | | Koninklijke (Royal) Philips Electronics N.V. ADR (Foreign) | | | 100,294,161 | |
| | | | | | | | | | | | | |
| | | | | | | | | | | | 381,787,404 | |
| | | | | | | | | | | | | |
| | | | | | | | | | | | | | | | | |
| | | | | | | | | Natural Resources 13.4% | | | | | | | | |
| | | | 25,596,576 | | | | | Chesapeake Energy Corporation | | | 662,439,387 | |
| | | | 8,657,900 | | | | | Pioneer Natural Resources Company(b) | | | 417,051,043 | |
| | | | | | | | | | | | | |
| | | | | | | | | | | | 1,079,490,430 | |
| | | | | | | | | | | | | |
| | | | | | | | | | | | | |
| | | | | | | | | Property & Casualty Insurance 8.0% | | | | |
| | | | 2,863 | | | * | | Berkshire Hathaway Inc. – Class A | | | 284,009,600 | |
| | | | 63,701,000 | | | | | The NipponKoa Insurance Company, Ltd. (Foreign)(b) | | | 362,684,174 | |
| | | | | | | | | | | | | |
| | | | | | | | | | | | 646,693,774 | |
| | | | | | | | | | | | | |
| | | | | | | | | | | | | | | | | |
| | | | | | | | | Restaurants 5.0% | | | | | | | | |
| | | | 11,410,958 | | | | | Yum! Brands, Inc. | | | 399,041,201 | |
| | | | | | | | | | | | | |
| | | | | | | | | Technology 7.6% | | | | |
| | | | 42,430,665 | | | * | | Dell Inc.(d) | | | 609,304,349 | |
See Notes to Financial Statements.
12
Partners Fund - PORTFOLIO OF INVESTMENTS
at December 31, 2009
| | | | | | | | | | | | | | | | | |
| | | Shares | | | | | | | | | Value | |
| | | | | | | | | | | | | | | | | |
| | | | | | | | | Telecommunications 5.5% | | | | | | | | |
| | | | 142,006,754 | | | * | | Level 3 Communications, Inc.(b) | | $ | 217,270,334 | |
| | | | 1,530,800 | | | | | Telephone and Data Systems, Inc. | | | 51,924,736 | |
| | | | 5,666,200 | | | | | Telephone and Data Systems, Inc. – Special | | | 171,119,240 | |
| | | | | | | | | | | | | |
| | | | | | | | | | | | 440,314,310 | |
| | | | | | | | | | | | | |
| | | | | | | | | | | | | | | | | |
| | | | | | | | | Transportation 3.0% | | | | | | | | |
| | | | 2,930,629 | | | | | FedEx Corporation | | | 244,560,990 | |
| | | | | | | | | | | | | |
| | | | | | | | | Total Common Stocks (Cost $6,123,439,464) | | | 6,864,202,269 | |
| | | | | | | | | | | | | |
| | | Principal
| | | | | | | | | | |
| | | Amount | | | | | | | | | | |
Corporate Bonds 1.6% |
| | | | | | | | | | | | | | | | | |
| | | | | | | | | Telecommunications 1.6% | | | | | | | | |
| | | | 100,062,000 | | | | | Level 3 Communications, Inc., 15% Convertible Senior Notes due 1-15-13(b)(c)
(Cost $100,062,000) | | | 125,077,500 | |
| | | | | | | | | | | | | | |
| | | Principal
| | | | | | | | | |
| | | Amount | | | | | | | | | |
| |
Short-Term Obligations 13.0% |
| | | 342,558,000 | | | | Repurchase Agreement with State Street Bank, 0.005% due 1-4-10, Repurchase price $342,558,190 (Collateral: $352,840,000 U.S. Treasury Bonds, 3.28% – 3.80%, due 10-31-16 to 8-15-19 Value $349,412,113) | | 342,558,000 |
| | | 700,000,000 | | | | U.S. Treasury Bills, 0.005% – 0.19% due 3-11-10 to 3-25-10 | | 699,946,400 |
| | | | | | | | | |
| | | | | | | Total Short-Term Obligations (Cost $1,042,544,944) | | 1,042,504,400 |
| | | | | | | | | |
Total Investments (Cost $7,266,046,407)(a) | | | 99 | .9 | % | | 8,031,784,169 |
Other Assets and Liabilities, Net | | | 0 | .1 | | | 7,404,943 |
| | | | | | | | |
Net Assets | | | 100 | .0 | % | | $8,039,189,112 |
| | | | | | | | |
Net asset value per share | | $24.09 |
| | | |
* Non-income producing security.
| |
| (a) | Aggregate cost for federal income tax purposes is $7,287,006,944. Net unrealized appreciation of $765,737,762 consists of unrealized appreciation and depreciation of $1,797,705,213 and $(1,031,967,451), respectively. |
| |
| (b) | Affiliated issuer. See Note 7. |
| |
| (c) | Illiquid and board valued. See Note 8. |
| |
| (d) | A portion designated as collateral for forward currency contracts and option contracts. See Note 9. |
| |
| (e) | A portion related to options written. See Note 13. |
| |
| Note: | Companies designated as “Foreign” are headquartered outside the U.S. and represent 16% of net assets. |
See Notes to Financial Statements.
13
Partners Fund - PORTFOLIO OF INVESTMENTS
at December 31, 2009
FORWARD CURRENCY CONTRACTS
| | | | | | | | | | | |
Currency
| | Currency Sold and
| | Currency
| | | Unrealized
| |
| Units Sold | | Settlement Date | | Market Value | | | Loss | |
| |
| 4,900,000,000 | | Japanese Yen 3-26-10 | | $ | 52,644,792 | | | $ | (1,217,420) | |
| | | | | | | | | | | |
OPTIONS WRITTEN
| | | | | | | | | | | |
| | | | | | | | Unrealized
| |
| Contracts | | Description | | Market Value | | | Gain | |
| |
| 6,000,000 | | Marriott International, Inc. Call,
Expiring 1-11-10 to 2-5-10, Strike Price $30(f) | | $ | (1,050,000) | | | $ | 7,371,600 | |
| 5,000,000 | | Marriott International, Inc. Call,
Expiring 1-11-10 to 2-5-10, Strike Price $27.50(f) | | | (3,875,000) | | | | 2,930,885 | |
| | | | | | | | | | | |
| | | | | $ | (4,925,000) | | | $ | 10,302,485 | |
| | | | | | | | | | | |
| |
| (f) | See Note 13 for a complete schedule of options written. |
See Notes to Financial Statements.
14
Intentionally Left Blank
15
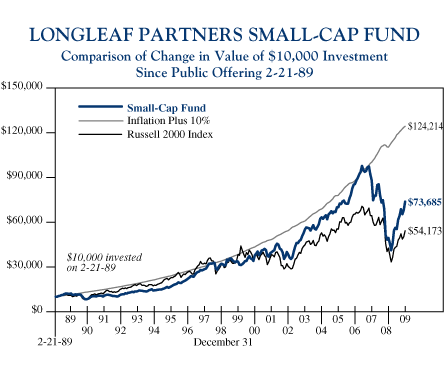
Small-Cap Fund
Longleaf Partners Small-Cap Fund rose 49.3% in 2009, recording the best absolute and relative performance in the Fund’s twenty year history. The Russell 2000 gained 27.2%. The Fund ended with a strong fourth quarter, rising 7.4% versus 3.9% for the Index. Small-Cap’s longer term returns also have meaningfully exceeded the benchmark.
| | | | | | | | | | | | | | | | | | | | | |
| | | Cumulative Returns at December 31, 2009 | |
| | | Inception | | | 20 Year | | | 15 Year | | | 10 Year | | | 5 Year | |
| |
Small-Cap Fund | | | 636.9 | % | | | 506.4 | % | | | 417.1 | % | | | 120.5 | % | | | 16.7 | % |
| Russell 2000 Index | | | 441.7 | | | | 396.7 | | | | 205.6 | | | | 41.3 | | | | 2.6 | |
| Inflation plus 10% | | | 1142.1 | | | | 997.9 | | | | 483.1 | | | | 225.5 | | | | 80.7 | |
Please see page 18 for additional performance information.
Three of the top five holdings were the largest gainers in the fourth quarter as well as for the year. Dillard’s, up 31% for the quarter and 365% over twelve months, surprised investors with its deep cost cutting and substantial free cash flow generation. In spite of the tremendous appreciation, the stock remains the most discounted in the portfolio even if the company is only worth its depressed real estate assets. Pioneer Natural Resources ended the year up 198% after rising 33% in the fourth quarter. Rising oil prices brought attention to the Spraberry field where the company is stepping up its drilling. Excitement is also growing about Pioneer’s position in the Eagle Ford shale play. Importantly, the company’s three new independent directors have increased the focus on growing NAV per share. A 28% return in the last three months helped tw telecom double for the year. This provider of internet connectivity to small and mid-sized companies successfully grew revenues and margins throughout the recession while furthering its first mover advantage in various markets by adding new customers. Discovery Communications almost doubled in 2009. Revenues held up well versus cable TV channel competitors given the company’s programming improvements and subscription fees. Management successfully drove down costs and found new ways to revamp weaker channels.
The only stock that declined in the year was Ruddick, down 7%, which owns the Harris Teeter grocery chain. The supermarket industry in general, and premium stores in particular, suffered from weak stock prices in 2009 as many shoppers turned to discount alternatives. Management showed a disciplined approach by protecting market share and continued the successful expansion into the Washington, DC area. In the fourth quarter Texas Industries fell 16%. Business conditions remain terrible for the short term, but longer term the value of their Texas cement, concrete, and aggregates assets is dramatically higher than the stock price. We have a 13D filed on
16
Small-Cap Fund
MANAGEMENT DISCUSSION
the company to enable us to have frank discussions with management and the board regarding ways to improve the company’s value and get it recognized. Most recently, the board added three new independent directors, eliminated staggered board terms, and agreed to terminate the company’s poison pill in 2012.
In the first half of the year we bought First American, the title insurer and information provider, which we previously owned. We also added to several of the Fund’s most discounted names early in the year. More recently we have added to Wendy’s/Arby’s and FICO at attractive prices. We sold Del Monte Foods in June and in the second half scaled back several positions that had appreciated meaningfully and become overweight. The Fund’s lower-than-average turnover in the year reflects the quality of the businesses we own and how significantly they were undervalued, particularly at the outset of 2009. Numerous companies qualified, but we believe few were as attractive as those we already owned.
Because the Fund started the year at a P/V in the mid-30%s, the portfolio remains below the long-term average of the low-60%s even after the strong price rally. Given our limited trading, there is little cash in the portfolio. The quantitative appeal of the Fund is matched by significant qualitative strength both in the competitive positions of our businesses and in the management teams that run them. Not only is this an attractive opportunity for existing owners to add to their stakes in the Fund, but for those who are taxable, the NAV contains tax loss carryforwards that will offset a meaningful amount of future realized gains. We believe the portfolio can generate better than average returns over the next five years.
17
AVERAGE ANNUAL RETURNS
for the periods ended December 31, 2009
| | | | | | | | | | | | | | |
| | | Small-Cap
| | | Russell 2000
| | | Inflation
| |
| | | Fund | | | Index | | | Plus 10% | |
| |
| One Year | | | 49 | .31 | % | | | 27.17 | % | | | 12.72 | % |
| Five Years | | | 3 | .13 | | | | 0.51 | | | | 12.56 | |
| Ten Years | | | 8 | .23 | | | | 3.51 | | | | 12.52 | |
| Since Public Offering 2-21-89 | | | 10 | .05 | | | | 8.44 | | | | 12.84 | |
Past performance does not predict future performance, Fund prices fluctuate, and the value of an investment at redemption may be worth more or less than the purchase price. The Fund’s performance results in the table shown above do not reflect the deduction of taxes that a shareholder would pay on Fund distributions or the redemption of Fund shares. The Russell 2000 Index is shown with all dividends and distributions reinvested. This index is unmanaged and is not hedged for foreign currency risk. Historic numbers include periods in which the Fund used currency hedging as an investment strategy. Beginning in the third quarter 2009, and following a transition period ending in early 2010, hedging as a routine strategy ended. The U.S. Bureau of Labor Statistics compiles the monthly CPI-U values used to calculate inflation. Current performance may be lower or higher than the performance quoted. Please call 800-445-9469 or view Longleaf’s website (www.longleafpartners.com) for more current performance information.
18
TABLE OF PORTFOLIO HOLDINGS
at December 31, 2009
| | | | | | | | | |
| | | | | | Net
| |
| | | | | | Assets | �� |
| |
| Common Stock | | | | | | | 99.5 | % |
| tw telecom inc. | | | 10.1 | | | | | |
| Fairfax Financial Holdings Limited | | | 9.1 | | | | | |
| Pioneer Natural Resources Company | | | 7.7 | | | | | |
| Dillard’s Inc. | | | 6.7 | | | | | |
| Fair Isaac Corporation | | | 6.2 | | | | | |
| The Washington Post Company | | | 5.9 | | | | | |
| Service Corporation International | | | 4.8 | | | | | |
| Wendy’s/Arby’s Group, Inc. | | | 4.7 | | | | | |
| Everest Re Group, Ltd. | | | 4.6 | | | | | |
| Olympus Corporation | | | 4.4 | | | | | |
| The First American Corporation | | | 4.3 | | | | | |
| Markel Corporation | | | 3.9 | | | | | |
| Potlatch Corporation | | | 3.7 | | | | | |
| Discovery Communications, Inc. | | | 3.6 | | | | | |
| Willis Group Holdings Limited | | | 3.6 | | | | | |
| Texas Industries, Inc. | | | 3.5 | | | | | |
| Worthington Industries, Inc. | | | 3.4 | | | | | |
| Level 3 Communications, Inc. | | | 3.2 | | | | | |
| Ruddick Corporation | | | 3.2 | | | | | |
| DineEquity, Inc. | | | 2.9 | | | | | |
| Cash Reserves | | | | | | | 0.5 | |
| Other Assets and Liabilities, net | | | | | | | – | |
| | | | | | | | | |
| | | | | | | | 100.0 | % |
| | | | | | | | | |
PORTFOLIO CHANGES
January 1, 2009 through December 31, 2009
| | | |
New Holdings | | Eliminations |
| The First American Corporation | | Clearwater Paper Corporation
Del Monte Foods Company
Discovery Communications, Inc. – Class A |
19
at December 31, 2009
| | | | | | | | | | | | | | | |
| | | Shares | | | | | | | | | Value | |
Common Stock 99.5% | | | | | | | | |
| | | | | | | Construction Materials 3.5% | | | | | | | | |
| | | 2,514,100 | | | | Texas Industries, Inc.(b) | | $ | 87,968,359 | |
| | | | | | | | | | | | | | | |
| | | | | | | Education & Media 5.9% | | | | | | | | |
| | | 337,855 | | | | The Washington Post Company – Class B | | | 148,521,058 | |
| | | | | | | | | | | | | | | |
| | | | | | | Entertainment 3.6% | | | | | | | | |
| | | 3,435,550 | | * | | Discovery Communications, Inc. – Class C | | | 91,110,786 | |
| | | | | | | | | | | | | | | |
| | | | | | | Financial Services 4.3% | | | | | | | | |
| | | 3,203,969 | | | | The First American Corporation | | | 106,083,413 | |
| | | | | | | | | | | | | | | |
| | | | | | | Funeral Services 4.8% | | | | | | | | |
| | | 14,608,716 | | | | Service Corporation International(b) | | | 119,645,384 | |
| | | | | | | | | | | | | | | |
| | | | | | | Grocery – Retail 3.2% | | | | | | | | |
| | | 3,107,459 | | | | Ruddick Corporation(b) | | | 79,954,920 | |
| | | | | | | | | | | | | | | |
| | | | | | | Information Technology 6.2% | | | | | | | | |
| | | 7,216,400 | | | | Fair Isaac Corporation(b) | | | 153,781,484 | |
| | | | | | | | | | | |
| | | | | | | Insurance Brokerage 3.6% | | | | |
| | | 3,398,000 | | | | Willis Group Holdings Limited (Foreign) | | | 89,639,240 | |
| | | | | | | | | | | | | | | |
| | | | | | | Manufacturing 3.4% | | | | | | | | |
| | | 6,581,000 | | | | Worthington Industries, Inc.(b) | | | 86,013,670 | |
| | | | | | | | | | | | | | | |
| | | | | | | Medical and Photo Equipment 4.4% | | | | | | | | |
| | | 3,408,000 | | | | Olympus Corporation (Foreign) | | | 109,877,345 | |
| | | | | | | | | | | | | | | |
| | | | | | | Natural Resources 11.4% | | | | | | | | |
| | | 4,004,300 | | | | Pioneer Natural Resources Company | | | 192,887,131 | |
| | | 2,887,000 | | | | Potlatch Corporation(b) | | | 92,037,560 | |
| | | | | | | | | | | |
| | | | | | | | | | 284,924,691 | |
| | | | | | | | | | | |
| | | | | | | | | | | | | | | |
| | | | | | | Property & Casualty Insurance 17.6% | | | | | | | | |
| | | 1,335,000 | | | | Everest Re Group, Ltd. (Foreign) | | | 114,382,800 | |
| | | 579,772 | | | | Fairfax Financial Holdings Limited (Foreign) | | | 227,285,481 | |
| | | 288,000 | | * | | Markel Corporation | | | 97,920,000 | |
| | | | | | | | | | | |
| | | | | | | | | | | | | | 439,588,281 | |
| | | | | | | | | | | | | | | |
| | | | | | | | | | | | | | | |
| | | | | | | Restaurants 7.6% | | | | | | | | |
| | | 2,978,100 | | * | | DineEquity, Inc.(b) | | | 72,338,049 | |
| | | 25,136,597 | | | | Wendy’s/Arby’s Group, Inc.(b) | | | 117,890,640 | |
| | | | | | | | | | | |
| | | | | | | | | | | | | | 190,228,689 | |
| | | | | | | | | | | | | | | |
| | | | | | | | | | | | | | | |
| | | | | | | Retail 6.7% | | | | | | | | |
| | | 9,050,748 | | | | Dillards, Inc. – Class A(b) | | | 166,986,301 | |
See Notes to Financial Statements.
20
Small-Cap Fund - PORTFOLIO OF INVESTMENTS
at December 31, 2009
| | | | | | | | | | | | | | | |
| | | Shares | | | | | | | | | Value | |
| | | | | | | | | | | | | | | |
| | | | | | | Telecommunications 13.3% | | | | | | | | |
| | | 52,451,000 | | * | | Level 3 Communications, Inc. | | $ | 80,250,030 | |
| | | 14,732,670 | | * | | tw telecom inc.(b) | | | 252,517,964 | |
| | | | | | | | | | | |
| | | | | | | | | | | | | | 332,767,994 | |
| | | | | | | | | | | | | | | |
| | | | | | | Total Common Stocks (Cost $2,493,973,717) | | | 2,487,091,615 | |
| | | | | | | | | | | |
| | | | | | | | | | | | | | |
| | | Principal
| | | | | | | | | |
| | | Amount | | | | | | | | | |
Short-Term Obligations 0.5% | | | | | | | |
| | | | | | | | | | | | | | |
| | | 13,091,000 | | | | Repurchase Agreement with State Street Bank, 0.005% due 1-4-10, Repurchase price $13,091,007 (Collateral: $13,420,000 U.S. Treasury Bond, 3.28%, due 10-31-16, Value $13,352,900) | | | | | | | 13,091,000 |
| | | | | | | | | | | | | | |
Total Investments (Cost $2,507,064,717)(a) | | | 100 | .0 | % | | 2,500,182,615 |
Other Assets and Liabilities, Net | | | – | | | | 318,750 |
| | | | | | | | |
Net Assets | | | 100 | .0 | % | | $2,500,501,365 |
| | | | | | | | |
Net asset value per share | | $21.77 |
| | | |
* Non-income producing security.
| |
| (a) | Aggregate cost for federal tax purposes is $2,508,983,419. Net unrealized depreciation of $(6,882,102) consists of unrealized appreciation and depreciation of $458,678,248 and $(465,560,350), respectively. |
| |
| (b) | Affiliated issuer. See Note 7. |
| |
| Note: | Companies designated as “Foreign” are headquartered outside the U.S. and represent 22% of net assets. |
See Notes to Financial Statements.
21
Intentionally Left Blank
22
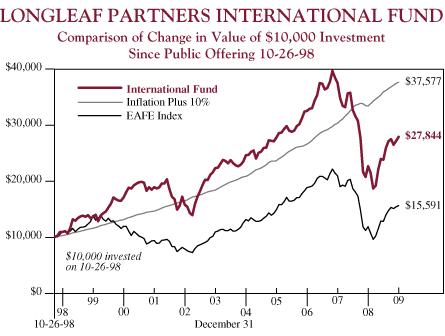
International Fund
The Longleaf Partners International Fund returned 1.5% in the fourth quarter and finished 2009 with a strong absolute return of 23.2%, beating our goal of inflation plus 10%. While the Fund underperformed the EAFE Index’s 31.8% return in 2009, Longleaf International’s long-term results have far surpassed EAFE.
| | | | | | | | | |
| | | Cumulative Returns through
| |
| | | December 31, 2009 | |
| | | Inception | | | 10 Year | |
| |
International Fund | | | 178.4 | % | | | 105.4 | % |
| EAFE Index | | | 55.9 | | | | 12.4 | |
| Inflation plus 10% | | | 275.8 | | | | 225.5 | |
Please see page 26 for additional performance information.
Olympus was the largest contributor in the quarter, rising 25%, and among the top performers for the year, up 70%. Management significantly cut costs and saw a recovery in the medical business, which comprises the large majority of our appraisal. The camera business also regained profitability. Genting and Philips added to the Fund’s results both in the fourth quarter and for the year. Genting’s price almost doubled in 2009 as its Malaysian casinos generated strong results, and its Singapore casino will open in February 2010. Philips gained over 20% in the fourth quarter and nearly 50% for the year, as the company beat expectations in the second half in all divisions. The healthcare business grew nicely in emerging markets, and top line declines slowed in developed markets within the lighting and healthcare divisions. Fairfax Financial was one of the largest contributors to returns in the fourth quarter in spite of weak pricing for insurance coverage. Fairfax dramatically grew book value, maintained underwriting discipline, and enhanced future available cash flow through recent privatizations of Odyssey Re and Northbridge. Our value grew over the quarter, and Fairfax remains attractively discounted. After scaling back all four names in the recent quarter, the Fund still holds a full position in Philips and Olympus and overweight positions in Genting and Fairfax.
Ingersoll-Rand and Cheung Kong also contributed to performance for the year. We sold Ingersoll-Rand in the third quarter when it approached our appraisal after almost tripling from its 2008 lows as the company proved concerns over its balance sheet were severely overblown. Cheung Kong rose over 40% in the year as demand for real estate in Hong Kong and China remained strong, and property transaction prices in the market far exceeded those we use in our appraisals of the company’s assets. Li Ka Shing bought more shares, taking his personal ownership to over 40%.
While the Fund exceeded our absolute return goal in 2009, the relative performance to EAFE lagged for three primary reasons. First, approximately 6% of EAFE’s return
23
International Fund
MANAGEMENT DISCUSSION
came from the dollar’s weakening against other currencies in countries where the International Fund had little or no exposure. Second, the financial sector dominated EAFE’s return. Not surprisingly we do not own any big banks that have heavily levered balance sheets, questionable reserves, and significant government regulatory uncertainty. Many of these banks drove EAFE’s rebound. Conversely, the Fund’s financial exposure consists primarily of property/casualty insurers and an insurance broker. Insurance related stocks were among the weaker industries in 2009. Third, the Fund’s 30% weight in Japanese companies contributed to the relative underperformance. Japan was one of only five major world markets that did not compound at greater than 20% in 2009, rising only 6.8% for the year.
The primary negative impact on the Fund’s return both in 2009 and the fourth quarter was our combined position in Japanese non-life insurers NipponKoa and Sompo which both maintained their strong balance sheets. Under the recently approved merger, the new governance structure should hold management accountable for both underwriting and investing. We are confident that management is committed to the combined company being a best-in-class global non-life insurance business. Two other stocks, Japan Petroleum and Cemex, also hurt Fund returns over the last three months, though both were positive contributors for the year. In the fourth quarter our appraisal of JAPEX grew slightly, and the company sells at a discount to the value of its net cash and public stake in INPEX. We believe a merger of the two companies would benefit all stakeholders. Our appraisal of Cemex held steady in the second half of the year. The company maintained pricing in many markets even as units fell dramatically over the past few years. Cemex could more than triple its free cash flow coupon over the next five years. Its U.S. operations have gone from generating over $2 billion of pro forma EBITDA at the peak to less than $150 million now.
In the fourth quarter, we sold EnCana and trimmed several names that appreciated to fund new purchases in Benesse, Seven Bank, and Hochtief. EnCana rose to our value in the quarter as management followed through with its announcement to split the business into an integrated oil company and a pure-play natural gas producer. Benesse is the dominant Japanese supplementary education company. Seven Bank manages a network of 14,000 ATMs in Japan. Both companies are examples of overcapitalized, growing businesses that are being overlooked in Japan. German-based infrastructure construction company Hochtief has dominant market share in Australia through its 55% ownership of Leighton and competes in the U.S. through Turner and Flatiron. Earlier in the year we bought Linde and Diageo, and both added to performance.
Many investors ask about Longleaf International’s approach to emerging markets. When appraising international companies, our discount rates take into account interest rate differentials so that our comparisons of investment opportunities are
24
International Fund
MANAGEMENT DISCUSSION
on an “apples to apples” basis across different countries. This adjustment helps insure that we do not give too much credit for higher growth rates in emerging countries without penalizing companies for their higher cost of capital in those areas. Many seemingly attractively priced equities in emerging markets do not qualify on a risk adjusted basis. If a company such as Genting does qualify both quantitatively and qualitatively, we are indifferent to its locale assuming we do not see risk of nationalization or other governmental value impairment. We primarily have emerging market exposure through dominant, competitively entrenched international companies with growing pieces of their business in developing economies. Whether through Yum! Brands’ pipeline of thousands of KFC China stores, Philips’ entrenched emerging markets position in consumer products, medical, and lighting, Diageo’s dominant market share in Africa, or Accor’s leading service voucher business in Brazil, we are able to participate in these markets while protecting capital and partnering with shareholder oriented managements.
Even after a year of strong absolute performance, the International Fund portfolio remains attractively discounted in the low-60%s. We have significant opportunity for outperformance, but also a built-in margin of safety both in the price of the portfolio and the qualitative strength of the underlying businesses. Management teams across our holdings have taken advantage of the market environment to strengthen their companies through cost cutting, smart M&A activity, and/or buying in discounted shares. Companies have emerged stronger from the recession, maintaining their competitive positioning and pricing power, which will help protect from the potential threat of inflation. Our appraisals based on depressed 2009 operating results are conservative, and we believe our companies are well positioned for significant value growth over the next several years.
25
AVERAGE ANNUAL RETURNS
for the periods ended December 31, 2009
| | | | | | | | | | | | | |
| | | International
| | | EAFE
| | | Inflation
| |
| | | Fund | | | Index | | | Plus 10% | |
| |
| | | | | | | | | | | | | |
| One Year | | | 23.17 | % | | | 31.78 | % | | | 12.72 | % |
| Five Years | | | 2.54 | | | | 3.54 | | | | 12.56 | |
| Ten Years | | | 7.46 | | | | 1.17 | | | | 12.52 | |
| Since Public Offering 10-26-98 | | | 9.59 | | | | 4.06 | | | | 12.57 | |
Past performance does not predict future performance, Fund prices fluctuate, and the value of an investment at redemption may be worth more or less than the purchase price. The Fund’s performance results in the table shown above do not reflect the deduction of taxes that a shareholder would pay on Fund distributions or the redemption of Fund shares. The EAFE Index is shown with all dividends and distributions reinvested. Because the EAFE was available only at month-end in 1998, we used the 10-31-98 value for performance since inception. This index is unmanaged and is not hedged for foreign currency risk. Historic numbers include periods in which the Fund used currency hedging as an investment strategy. Beginning in the third quarter 2009, and following a transition period ending in early 2010, hedging as a routine strategy ended. The U.S. Bureau of Labor Statistics compiles the monthly CPI-U values used to calculate inflation. Current performance may be lower or higher than the performance quoted. Please call 800-445-9469 or view Longleaf’s website (www.longleafpartners.com) for more current performance information.
26
TABLE OF PORTFOLIO HOLDINGS
at December 31, 2009
| | | | | | | | | |
| | | | | | Net
| |
| | | | | | Assets | |
| |
| Common Stock | | | | | | | 98.4 | % |
| Fairfax Financial Holdings Limited | | | 10.2 | | | | | |
| Accor S.A. | | | 7.7 | | | | | |
| Cheung Kong Holdings Limited | | | 7.6 | | | | | |
| The NipponKoa Insurance Company, Ltd. | | | 7.5 | | | | | |
| ACS, Actividades de Construccion Y Servicios, S.A. | | | 6.9 | | | | | |
| Genting Berhad | | | 6.2 | | | | | |
| Koninklijke Philips Electronics N.V. ADR | | | 4.8 | | | | | |
| Olympus Corporation | | | 4.8 | | | | | |
| Cemex S.A.B. de C.V. ADS | | | 4.8 | | | | | |
| Yum! Brands, Inc. | | | 4.8 | | | | | |
| Dell Inc. | | | 4.5 | | | | | |
| Willis Group Holdings Limited | | | 4.4 | | | | | |
| Sompo Japanese Insurance Company Inc. | | | 4.2 | | | | | |
| Seven Bank, Ltd. | | | 4.0 | | | | | |
| Japan Petroleum Exploration Co., Ltd. | | | 3.7 | | | | | |
| Daiwa Securities Group, Inc. | | | 3.4 | | | | | |
| Diageo plc | | | 3.0 | | | | | |
| Benesse Holdings Inc. | | | 2.5 | | | | | |
| Linde AG | | | 2.0 | | | | | |
| Hochtief AG | | | 1.4 | | | | | |
| Cash Reserves | | | | | | | 2.3 | |
| Other Assets and Liabilities, net | | | | | | | (0.7 | ) |
| | | | | | | | | |
| | | | | | | | 100.0 | % |
| | | | | | | | | |
PORTFOLIO CHANGES
January 1, 2009 through December 31, 2009
| | | |
New Holdings | | Eliminations |
| Benesse Holdings, Inc. | | Benesse Holdings, Inc. |
| Diageo plc | | EnCana Corporation |
| Hochtief AG | | Ingersoll-Rand Company Limited |
| Linde AG | | Koninklijke Philips Electronics N.V. |
| Seven Bank, Ltd. | | NH Hoteles, S.A. |
27
at December 31, 2009
| | | | | | | | | | | | | | | |
| | | Shares | | | | | | | | Value | |
Common Stock 98.4% | | | | | | | | |
| | | | | | | | | | | | | | | |
| | | | | | | Beverages 3.0% | | | | | | | | |
| | | 3,742,000 | | | | Diageo plc (United Kingdom) | | $ | 65,283,289 | |
| | | | | | | | | | | | | | | |
| | | | | | | Construction 1.4% | | | | | | | | |
| | | 392,639 | | | | Hochtief AG (Germany) | | | 29,945,311 | |
| | | | | | | | | | | | | | | |
| | | | | | | Construction Materials 4.8% | | | | | | | | |
| | | 8,727,000 | | * | | Cemex S.A.B. de C.V. ADS (Mexico) | | | 103,153,140 | |
| | | | | | | | | | | | | | | |
| | | | | | | Education 2.5% | | | | | | | | |
| | | 1,278,000 | | | | Benesse Holdings, Inc. (Japan) | | | 53,434,451 | |
| | | | | | | | | | | | | | | |
| | | | | | | Financial Services 4.0% | | | | | | | | |
| | | 43,517 | | | | Seven Bank, Ltd. (Japan) | | | 86,875,367 | |
| | | | | | | | | | | | | | | |
| | | | | | | Hospitality Services 13.9% | | | | | | | | |
| | | 3,064,500 | | | | Accor S.A. (France) | | | 167,695,734 | |
| | | 63,066,000 | | | | Genting Berhad (Malaysia) | | | 134,424,111 | |
| | | | | | | | | | | |
| | | | | | | | | | | | | | 302,119,845 | |
| | | | | | | | | | | | | | | |
| | | | | | | Industrials 2.0% | | | | |
| | | 357,000 | | | | Linde AG (Germany) | | | 43,012,128 | |
| | | | | | | | | | | |
| | | | | | | Insurance Brokerage 4.4% | | | | |
| | | 3,586,000 | | | | Willis Group Holdings Limited (United Kingdom) | | | 94,598,680 | |
| | | | | | | | | | | |
| | | | | | | Medical and Photo Equipment 4.8% | | | | |
| | | 3,218,500 | | | | Olympus Corporation (Japan) | | | 103,767,675 | |
| | | | | | | | | | | | | | | |
| | | | | | | Multi-Industry 19.3% | | | | | | | | |
| | | 2,995,353 | | | | ACS, Actividades de Construccion Y Servicios, S.A. (Spain) | | | 149,730,713 | |
| | | 12,893,000 | | | | Cheung Kong Holdings Limited (Hong Kong)(b) | | | 165,677,368 | |
| | | 3,539,134 | | | | Koninklijke (Royal) Philips Electronics N.V. ADR (Netherlands) | | | 104,192,105 | |
| | | | | | | | | | | |
| | | | | | | | | | | | | | 419,600,186 | |
| | | | | | | | | | | | | | | |
| | | | | | | Natural Resources 3.7% | | | | |
| | | 1,816,900 | | | | Japan Petroleum Exploration Co., Ltd. (Japan)(b) | | | 80,112,248 | |
| | | | | | | | | | | | | | | |
| | | | | | | Property & Casualty Insurance 21.9% | | | | | | | | |
| | | 565,543 | | | | Fairfax Financial Holdings Limited (Canada) | | | 221,707,348 | |
| | | 28,556,000 | | | | The NipponKoa Insurance Company, Ltd. (Japan)(b) | | | 162,584,720 | |
| | | 13,995,000 | | | | Sompo Japanese Insurance Company Inc. (Japan) | | | 90,232,177 | |
| | | | | | | | | | | |
| | | | | | | | | | | | | | 474,524,245 | |
| | | | | | | | | | | | | | | |
| | | | | | | | | | | | | | | |
| | | | | | | Restaurants 4.8% | | | | | | | | |
| | | 2,939,500 | | | | Yum! Brands, Inc. (United States) | | | 102,794,315 | |
See Notes to Financial Statements.
28
International Fund - PORTFOLIO OF INVESTMENTS
at December 31, 2009
| | | | | | | | | | | | | | | |
| | | Shares | | | | | | | | Value | |
| | | | | | | | | | | | | | | |
| | | | | | | Securities Brokerage 3.4% | | | | | | | | |
| | | 14,441,000 | | | | Daiwa Securities Group, Inc. (Japan) | | $ | 72,676,355 | |
| | | | | | | | | | | | | | | |
| | | | | | | Technology 4.5% | | | | | | | | |
| | | 6,832,800 | | * | | Dell Inc. (United States)(b) | | | 98,119,008 | |
| | | | | | | | | | | |
| | | | | | | Total Common Stocks (Cost $1,946,218,697) | | | 2,130,016,243 | |
| | | | | | | | | | | |
| | | | | | | | | | | | | | |
| | | Principal
| | | | | | | | | |
| | | Amount | | | | | | | | | |
Short-Term Obligations 2.3% | | | | | | | |
| | | | | | | | | |
| | | 49,446,000 | | | | Repurchase Agreement with State Street Bank, 0.005% due 1-4-10, Repurchase price $49,446,027 (Collateral: $50,665,000 U.S. Treasury Bonds, 3.80%-4.67%, due
8-15-19 to 8-15-39, Value $50,435,000) | | 49,446,000 |
| | | | | | | | | |
Total Investments (Cost $1,995,664,697)(a) | | | 100 | .7 | % | | 2,179,462,243 |
Other Assets and Liabilities, Net | | | (0 | .7 | ) | | (14,003,009) |
| | | | | | | | |
Net Assets | | | 100 | .0 | % | | $2,165,459,234 |
| | | | | | | | |
Net asset value per share | | $13.66 |
| | | |
* Non-income producing security.
| |
| (a) | Aggregate cost for federal income tax purposes is $1,996,054,287. Net unrealized appreciation of $183,797,546 consists of unrealized appreciation and depreciation of $475,238,920 and $(291,441,374), respectively. |
| |
| (b) | All or a portion designated as collateral for forward currency contracts. See Note 9. |
| |
| Note: | Country listed in parenthesis after each company indicates location of headquarters. |
See Notes to Financial Statements.
29
International Fund - PORTFOLIO OF INVESTMENTS
at December 31, 2009
FORWARD CURRENCY CONTRACTS
| | | | | | | | | | | |
Currency
| | Currency Sold and
| | Currency
| | | Unrealized
| |
| Units Sold | | Settlement Date | | Market Value | | | Loss | |
| |
| 43,000,000 | | Euro 3-26-10 | | $ | 61,626,436 | | | $ | (1,525,335 | ) |
| 9,800,000,000 | | Japanese Yen 2-26-10 | | | 105,271,537 | | | | (4,871,987 | ) |
| 5,750,000,000 | | Japanese Yen 3-26-10 | | | 61,777,052 | | | | (2,741,891 | ) |
| 145,000,000 | | Malaysian Ringgit 3-26-10 | | | 42,225,426 | | | | (1,472,193 | ) |
| 30,000,000 | | Malaysian Ringgit 6-25-10 | | | 8,706,213 | | | | (176,216 | ) |
| | | | | | | | | | | |
| | | | | $ | 279,606,664 | | | $ | (10,787,622 | ) |
| | | | | | | | | | | |
COUNTRY WEIGHTINGS
| | | | | | | | | | |
| | | Equity
| | | | Net
| |
| | | Only | | | | Assets | |
| |
| Japan | | | 30.5 | % | | | | 30.1 | % |
| Canada | | | 10.4 | | | | | 10.2 | |
| United States | | | 9.4 | | | | | 9.3 | |
| France | | | 7.9 | | | | | 7.7 | |
| Hong Kong | | | 7.8 | | | | | 7.6 | |
| United Kingdom | | | 7.5 | | | | | 7.4 | |
| Spain | | | 7.0 | | | | | 6.9 | |
| Malaysia | | | 6.3 | | | | | 6.2 | |
| Netherlands | | | 4.9 | | | | | 4.8 | |
| Mexico | | | 4.9 | | | | | 4.8 | |
| Germany | | | 3.4 | | | | | 3.4 | |
| | | | | | | | | | |
| | | | 100.0 | % | | | | 98.4 | |
| | | | | | | | | | |
| Cash, other assets and liabilities, net | | | | | | | | 1.6 | |
| | | | | | | | | | |
| | | | | | | | | 100.0 | % |
| | | | | | | | | | |
See Notes to Financial Statements.
30
Intentionally Left Blank
31
STATEMENTS OF ASSETS AND LIABILITIES
at December 31, 2009
| | | | | | | | | | | | | |
| | | Partners
| | | Small-Cap
| | | International
| |
| | | Fund | | | Fund | | | Fund | |
| Assets: | | | | | | | | | | | | |
| Investments: | | | | | | | | | | | | |
| Affiliated securities, at market value (cost $902,351,810, $1,271,765,218 and $0, respectively) (Note 2 and 7) | | $ | 1,122,083,051 | | | $ | 1,229,134,331 | | | $ | – | |
| Other securities, at market value (cost $6,363,694,597, $1,235,299,499 and $1,995,664,697, respectively) (Note 2) | | | 6,909,701,118 | | | | 1,271,048,284 | | | | 2,179,462,243 | |
| | | | | | | | | | | | | |
Total Investments | | | 8,031,784,169 | | | | 2,500,182,615 | | | | 2,179,462,243 | |
| Cash | | | 645 | | | | 46 | | | | 293 | |
| Receivable for: | | | | | | | | | | | | |
| Fund shares sold | | | 5,737,122 | | | | 500,676 | | | | 320,657 | |
| Dividends and interest | | | 15,866,298 | | | | 2,323,280 | | | | 932,367 | |
| Securities sold | | | 2,174,578 | | | | – | | | | – | |
| Foreign tax reclaims | | | – | | | | – | | | | 1,256,585 | |
| Prepaid assets | | | 192,495 | | | | 79,299 | | | | 84,410 | |
| | | | | | | | | | | | | |
Total Assets | | | 8,055,755,307 | | | | 2,503,085,916 | | | | 2,182,056,555 | |
| | | | | | | | | | | | | |
Liabilities: | | | | | | | | | | | | |
| Payable for: | | | | | | | | | | | | |
| Forward currency contracts (Note 2, 12) | | | 1,217,420 | | | | – | | | | 10,787,622 | |
| Options written (Note 2, 12) | | | 4,925,000 | | | | – | | | | – | |
| Fund shares redeemed | | | 4,194,358 | | | | 611,938 | | | | 386,248 | |
| Securities purchased | | | – | | | | – | | | | 2,859,374 | |
| Investment counsel fee (Note 3) | | | 5,169,020 | | | | 1,650,270 | | | | 2,223,902 | |
| Administration fee (Note 4) | | | 677,879 | | | | 208,712 | | | | 185,325 | |
| Other accrued expenses | | | 382,518 | | | | 113,631 | | | | 154,850 | |
| | | | | | | | | | | | | |
Total Liabilities | | | 16,566,195 | | | | 2,584,551 | | | | 16,597,321 | |
| | | | | | | | | | | | | |
| | | $ | 8,039,189,112 | | | $ | 2,500,501,365 | | | $ | 2,165,459,234 | |
| | | | | | | | | | | | | |
Net Assets: | | | | | | | | | | | | |
| Net assets consist of: | | | | | | | | | | | | |
| Paid-in capital | | | 8,590,689,446 | | | | 2,795,994,291 | | | | 2,226,392,771 | |
| Undistributed net investment income | | | 23,929,238 | | | | 9,303,219 | | | | 11,488,200 | |
| Accumulated net realized loss on investments and foreign currency | | | (1,350,252,399 | ) | | | (297,914,043 | ) | | | (245,358,754 | ) |
| Unrealized gain(loss) on investments and foreign currency | | | 774,822,827 | | | | (6,882,102 | ) | | | 172,937,017 | |
| | | | | | | | | | | | | |
| Net Assets | | $ | 8,039,189,112 | | | $ | 2,500,501,365 | | | $ | 2,165,459,234 | |
| | | | | | | | | | | | | |
Net asset value per share | | | $24.09 | | | | $21.77 | | | | $13.66 | |
| | | | | | | | | | | | | |
| | | | | | | | | | | | | |
Fund shares issued and outstanding | | | 333,731,375 | | | | 114,849,851 | | | | 158,542,759 | |
See Notes to Financial Statements.
32
Longleaf Partners Funds
STATEMENTS OF OPERATIONS
for the year ended December 31, 2009
| | | | | | | | | | | | | |
| | | Partners
| | | Small-Cap
| | | International
| |
| | | Fund | | | Fund | | | Fund | |
| Investment Income: | | | | | | | | | | | | |
| Income: | | | | | | | | | | | | |
| Dividends from non-affiliates (net of foreign tax withheld of $1,958,662, $800,293, and $4,130,749 respectively) | | $ | 42,975,894 | | | $ | 16,511,113 | | | $ | 43,662,179 | |
| Dividends from affiliates (net of foreign tax withheld of $362,232, $0, and $0 respectively) (Note 7) | | | 5,505,137 | | | | 12,354,882 | | | | – | |
| Interest from affiliates (Note 7) | | | 20,805,850 | | | | – | | | | – | |
| Interest from non-affiliates | | | 11,585,087 | | | | 2,985 | | | | 11,198 | |
| Other income | | | 1,037 | | | | 18 | | | | 12,541 | |
| | | | | | | | | | | | | |
| Total income | | | 80,873,005 | | | | 28,868,998 | | | | 43,685,918 | |
| | | | | | | | | | | | | |
Expenses: | | | | | | | | | | | | |
| Investment counsel fee (Note 3) | | | 52,597,748 | | | | 16,428,808 | | | | 28,918,424 | |
| Administration fee (Note 4) | | | 6,879,700 | | | | 2,057,174 | | | | 2,038,703 | |
| Transfer agent fees and expenses | | | 1,655,905 | | | | 445,782 | | | | 504,332 | |
| Prospectus and shareholder reports | | | 694,398 | | | | 142,602 | | | | 153,602 | |
| Trustees’ fees and expenses | | | 356,601 | | | | 182,051 | | | | 182,051 | |
| Custodian fees and expenses | | | 199,898 | | | | 32,798 | | | | 354,097 | |
| Professional fees | | | 106,502 | | | | 140,412 | | | | 96,502 | |
| Registration fees | | | 66,782 | | | | 41,378 | | | | 54,103 | |
| Other | | | 293,918 | | | | 89,364 | | | | 95,229 | |
| | | | | | | | | | | | | |
| Total expenses | | | 62,851,452 | | | | 19,560,369 | | | | 32,397,043 | |
| | | | | | | | | | | | | |
| Net investment income | | | 18,021,553 | | | | 9,308,629 | | | | 11,288,875 | |
| | | | | | | | | | | | | |
Realized and unrealized gain(loss): | | | | | | | | | | | | |
| Net realized gain(loss): | | | | | | | | | | | | |
| Non-affiliated securities | | | (531,480,524 | ) | | | 41,503,076 | | | | (132,036,328 | ) |
| Affiliated securities (Note 7) | | | (18,766,905 | ) | | | (39,117,709 | ) | | | – | |
| Forward currency contracts | | | (45,536,988 | ) | | | – | | | | (52,748,993 | ) |
| Options written | | | 17,820 | | | | – | | | | – | |
| Foreign currency transactions | | | 222,848 | | | | (5,410 | ) | | | 199,325 | |
| | | | | | | | | | | | | |
| Net gain(loss) | | | (595,543,749 | ) | | | 2,379,957 | | | | (184,585,996 | ) |
| | | | | | | | | | | | | |
| Change in unrealized appreciation(depreciation): | | | | | | | | |
| Securities | | | 3,454,122,693 | | | | 842,522,315 | | | | 548,832,818 | |
| Forward currency contracts | | | 56,527,281 | | | | – | | | | 53,768,725 | |
| Options written | | | 10,302,485 | | | | – | | | | – | |
| Other assets and liabilities | | | – | | | | – | | | | (121,036 | ) |
| | | | | | | | | | | | | |
| Change in net unrealized appreciation | | | 3,520,952,459 | | | | 842,522,315 | | | | 602,480,507 | |
| | | | | | | | | | | | | |
| Net realized and unrealized gain | | | 2,925,408,710 | | | | 844,902,272 | | | | 417,894,511 | |
| | | | | | | | | | | | | |
Net increase in net assets resulting from operations | | $ | 2,943,430,263 | | | $ | 854,210,901 | | | $ | 429,183,386 | |
| | | | | | | | | | | | | |
See Notes to Financial Statements.
33
Longleaf Partners Funds
STATEMENTS OF CHANGES IN NET ASSETS
| | | | | | | | | |
| | | Partners Fund | |
| | | Year ended December 31, | |
| | | 2009 | | | 2008 | |
Operations: | | | | | | | | |
| Net investment income | | $ | 18,021,553 | | | $ | 13,240,348 | |
| Net realized gain(loss) from investments and foreign currency transactions | | | (595,543,749 | ) | | | (736,187,547 | ) |
| Net change in unrealized appreciation (depreciation) of securities, other assets, liabilities and forwards | | | 3,520,952,459 | | | | (5,211,580,464 | ) |
| | | | | | | | | |
| Net increase(decrease) in net assets resulting from operations | | | 2,943,430,263 | | | | (5,934,527,663 | ) |
| | | | | | | | | |
Distributions to shareholders: | | | | | | | | |
| From net investment income | | | (3,365,555 | ) | | | (11,430,796 | ) |
| From net realized gain on investments | | | − | | | | (236,097,775 | ) |
| From return of capital | | | − | | | | − | |
| | | | | | | | | |
| Net decrease in net assets resulting from distributions | | | (3,365,555 | ) | | | (247,528,571 | ) |
| | | | | | | | | |
Capital share transactions (Note 6): | | | | | | | | |
| Net proceeds from sale of shares | | | 982,559,286 | | | | 2,620,154,082 | |
| Net asset value of shares issued to shareholders for reinvestment of shareholder distributions | | | 3,115,035 | | | | 227,059,531 | |
| Cost of shares redeemed | | | (1,675,332,100 | ) | | | (2,107,474,304 | ) |
| | | | | | | | | |
| Net increase(decrease) in net assets from fund share transactions | | | (689,657,779 | ) | | | 739,739,309 | |
| | | | | | | | | |
| Total increase(decrease) in net assets | | | 2,250,406,929 | | | | (5,442,316,925 | ) |
Net assets: | | | | | | | | |
| Beginning of year | | | 5,788,782,183 | | | | 11,231,099,108 | |
| | | | | | | | | |
| End of year | | $ | 8,039,189,112 | | | $ | 5,788,782,183 | |
| | | | | | | | | |
| Undistributed net investment income included in net assets at end of year | | $ | 23,929,238 | | | | $1,624,594 | |
| | | | | | | | | |
See Notes to Financial Statements.
34
Longleaf Partners Funds
STATEMENTS OF CHANGES IN NET ASSETS
| | | | | | | | | | | | | | | |
| Small-Cap Fund | | | International Fund | |
| Year ended December 31, | | | Year ended December 31, | |
| 2009 | | | 2008 | | | 2009 | | | 2008 | |
| | | | | | | | | | | | | | | |
| $ | 9,308,629 | | | $ | 10,420,686 | | | $ | 11,288,875 | | | $ | 8,325,139 | |
| | | | | | | | | | | | | | | |
| | 2,379,957 | | | | (299,952,035 | ) | | | (184,585,996 | ) | | | (70,148,204 | ) |
| | | | | | | | | | | | | | | |
| | | | | | | | | | | | | | | |
| | 842,522,315 | | | | (1,256,493,665 | ) | | | 602,480,507 | | | | (1,510,167,373 | ) |
| | | | | | | | | | | | | | | |
| | | | | | | | | | | | | | | |
| | 854,210,901 | | | | (1,546,025,014 | ) | | | 429,183,386 | | | | (1,571,990,438 | ) |
| | | | | | | | | | | | | | | |
| | | | | | | | | | | | | | | |
| | – | | | | (10,448,092 | ) | | | – | | | | (8,228,743 | ) |
| | – | | | | (55,239,834 | ) | | | – | | | | (134,284,828 | ) |
| | – | | | | (5,666,933 | ) | | | – | | | | (3,227,795 | ) |
| | | | | | | | | | | | | | | |
| | | | | | | | | | | | | | | |
| | – | | | | (71,354,859 | ) | | | – | | | | (145,741,366 | ) |
| | | | | | | | | | | | | | | |
| | | | | | | | | | | | | | | |
| | 216,229,084 | | | | 375,311,743 | | | | 238,931,392 | | | | 572,061,736 | |
| | | | | | | | | | | | | | | |
| | | | | | | | | | | | | | | |
| | – | | | | 64,762,131 | | | | – | | | | 129,894,878 | |
| | (373,623,919 | ) | | | (555,060,645 | ) | | | (543,993,731 | ) | | | (845,706,194 | ) |
| | | | | | | | | | | | | | | |
| | | | | | | | | | | | | | | |
| | (157,394,835 | ) | | | (114,986,771 | ) | | | (305,062,339 | ) | | | (143,749,580 | ) |
| | | | | | | | | | | | | | | |
| | 696,816,066 | | | | (1,732,366,644 | ) | | | 124,121,047 | | | | (1,861,481,384 | ) |
| | | | | | | | | | | | | | | |
| | 1,803,685,299 | | | | 3,536,051,943 | | | | 2,041,338,187 | | | | 3,902,819,571 | |
| | | | | | | | | | | | | | | |
| $ | 2,500,501,365 | | | $ | 1,803,685,299 | | | $ | 2,165,459,234 | | | $ | 2,041,338,187 | |
| | | | | | | | | | | | | | | |
| | | | | | | | | | | | | | | |
| $ | 9,303,219 | | | | $ – | | | $ | 11,488,200 | | | | $ – | |
| | | | | | | | | | | | | | | |
See Notes to Financial Statements.
35
Longleaf Partners Funds
NOTES TO FINANCIAL STATEMENTS
Note 1. Organization
The Longleaf Partners Fund, Longleaf Partners Small-Cap Fund, and Longleaf Partners International Fund (the “Funds”) are non-diversified and each is a series of Longleaf Partners Funds Trust, a Massachusetts business trust, which is registered as an open-end management investment company under the Investment Company Act of 1940, as amended.
Note 2. Significant Accounting Policies
Management Estimates
The accompanying financial statements are prepared in accordance with accounting principles generally accepted in the United States of America; these principles may require the use of estimates by Fund management. Actual results could differ from those estimates. Further, Fund management believes that no events have occurred between December 31, 2009 and February 8, 2010, the date of issuance of the financial statements, that require adjustment of, or disclosure in, the accompanying financial statements.
Security Valuation
Portfolio securities listed or traded on a securities exchange (U.S. or foreign), on the NASDAQ national market, or any representative quotation system providing same day publication of actual prices, are valued at the last sale price. If there are no transactions in the security that day, securities are valued at the midpoint between the closing bid and ask prices or, if there are no such prices, the prior day’s close.
In the case of bonds and other fixed income securities, valuations may be furnished by a pricing service which takes into account factors in addition to quoted prices (such as trading characteristics, yield, quality, coupon rate, maturity, type of issue, and other market data relating to the priced security or other similar securities) where taking such factors into account would lead to a more accurate reflection of the fair market value of such securities.
When market quotations are not readily available, valuations of portfolio securities may be determined in accordance with procedures established by and under the general supervision of the Funds’ Trustees. In determining fair value, the Board considers relevant qualitative and quantitative information including news regarding significant market or security specific events. The Board may also utilize a service provided by an independent third party to assist in fair valuation of certain securities. These factors are subject to change over time and are reviewed periodically. Because the utilization of fair value depends on market activity, the frequency with which fair valuation may be used cannot be predicted. Estimated values may differ from the values that would have been used had a ready market for the investment existed.
36
Repurchase agreements are valued at cost which, combined with accrued interest, approximates market value. Short-term U.S. Government obligations purchased with a remaining maturity of more than 60 days are valued through pricing obtained through pricing services approved by the Funds’ Trustees. Obligations purchased with a remaining maturity of 60 days or less or existing positions that have less than 60 days to maturity generally are valued at amortized cost, which approximates market value. However, if amortized cost is deemed not to reflect fair value, the securities are valued at prices furnished by dealers who make markets in such securities or by an independent pricing service.
The Funds determine net asset values (“NAVs”) once a day, at the close of regular trading on the New York Stock Exchange (“Exchange”) (usually at 4:00 p.m. Eastern time) on days the Exchange is open for business. The Exchange is closed for specified national holidays and on weekends. Foreign securities are generally priced at the latest market close in the foreign market, which may be at different times or days than the close of the Exchange. If events occur which could materially affect the NAV between the close of the foreign market and normal pricing at the close of the Exchange, foreign securities may be fair valued as determined by the Board of Trustees, consistent with any regulatory guidelines.
Accounting for Investments
For financial reporting purposes, the Funds record security transactions on trade date. Realized gains and losses on security transactions are determined using the specific identification method. Dividend income is recognized on the ex-dividend date, except that certain dividends from foreign securities are recorded as soon after the ex-dividend date as the Fund is able to obtain information on the dividend. Interest income and Fund expenses are recognized on an accrual basis.
Distributions to Shareholders
Dividends and distributions to shareholders are recorded on the ex-dividend date.
Federal Income Taxes
The Funds’ policy is to comply with the requirements of the Internal Revenue Code that are applicable to regulated investment companies and to distribute substantially all taxable income to shareholders. Accordingly, no federal income tax provision is required. The Funds intend to make any required distributions to avoid the application of a 4% nondeductible excise tax. Distributions are determined in accordance with income tax regulations which may differ from generally accepted accounting principles. Reclassifications are made within the Funds’ capital accounts to reflect income and gains available for distribution under income tax regulations.
Foreign Currency Translations
The books and records of the Funds are maintained in U.S. dollars. Securities denominated in currencies other than U.S. dollars are subject to changes in value due to fluctuations in exchange rates. Purchases and sales of securities and income and expenses are translated into U.S. dollars at the prevailing exchange rate on the
37
respective date of each transaction. The market values of investment securities, assets and liabilities are translated into U.S. dollars daily.
The Funds do not isolate the portion of net realized and unrealized gains or losses in equity security investments which are attributable to changes in foreign exchange rates. Accordingly, the impact of such changes is included in the realized and unrealized gains or losses on the underlying equity securities.
Forward Currency Contracts
Forward currency contracts are commitments to purchase or sell a foreign currency at a future maturity date. The resulting obligation is marked-to-market daily using foreign currency exchange rates supplied by an independent pricing service. An unrealized gain or loss is recorded for the difference between the contract opening value and its current value. When a contract is closed or delivery is taken, this gain or loss is realized. For federal tax purposes, gain or loss on open forward contracts in qualifying currencies are treated as realized and are subject to distribution at our excise tax year-end date.
Risk of Forward Currency Contracts
The Funds may use forward currency contracts for hedging purposes to offset currency exposure in portfolio holdings, although they have ceased doing so as a routine practice. Forward contracts may reduce the potential gain from a positive change in the relationship between the U.S. dollar and foreign currencies or, considered separately, may produce a loss. Where a liquid secondary market for forwards does not exist, the Funds may not be able to close their positions and in such an event, the loss is theoretically unlimited. In addition, the Funds could be exposed to risks if the counterparty to these contracts is unable to perform.
Repurchase Agreements
The Funds may engage in repurchase agreement transactions. The Funds’ custodian bank sells U.S. government or agency securities to each Fund under agreements to repurchase these securities at a stated repurchase price including interest for the term of the agreement, which is usually overnight or over a weekend. Each Fund, through its custodian, receives delivery of the underlying U.S. government or agency securities as collateral, whose market value is required to be at least equal to the repurchase price. If the custodian becomes bankrupt, the Fund might be delayed, or may incur costs or possible losses of principal and income, in selling the collateral.
Options
The current market value of an exchange traded option is the last sales price. Over-the-counter options are valued in accordance with fair value procedures established by and under the general supervision of the Funds’ Trustees.
38
Risk of Options
Gains on investment in options may depend on correctly predicting the direction of the underlying security. There can be no assurance that a liquid market will exist when a Fund seeks to close out an option position and a Fund may experience losses as a result of such illiquidity.
Note 3. Investment Counsel Agreement
Southeastern Asset Management, Inc. (“Southeastern”) serves as Investment Counsel to the Funds and receives annual compensation, computed daily and paid monthly, in accordance with the following schedule for the Partners Fund and Small-Cap Fund:
| | | | | |
| First $400 million of average daily net assets | | | 1.00 | % |
| In excess of $400 million | | | .75 | % |
For the Partners and Small-Cap Funds, Southeastern has agreed to reduce its fees on a pro rata basis to the extent that each Fund’s normal annual operating expenses (excluding taxes, interest, brokerage fees, and extraordinary expenses) exceed 1.5% of average annual net assets. No such reductions were necessary for the current year.
Through September 30, 2009, the International Fund fee was calculated in accordance with the following schedule:
| | | | | |
| First $2.5 billion of average daily net assets | | | 1.50 | % |
| In excess of $2.5 billion | | | 1.25 | % |
Effective October 1, 2009, the International Fund fee was reduced to:
| | | | | |
| First $2.5 billion of average daily net assets | | | 1.20 | % |
| In excess of $2.5 billion | | | 1.00 | % |
For this Fund, Southeastern has agreed to reduce its fees on a pro rata basis to the extent that the Fund’s normal annual operating expenses (excluding taxes, interest, brokerage fees, and extraordinary expenses) exceed 1.75% of average annual net assets. No reduction was necessary for the current year.
Note 4. Fund Administrator
Southeastern also serves as the Fund Administrator and in this capacity is responsible for managing, performing or supervising the administrative and business operations of the Funds. Functions include the preparation of all registration statements, prospectuses, proxy statements, and oversight of daily valuation of the portfolios and calculation of daily net asset values per share. The Funds pay a fee as compensation for these services, accrued daily and paid monthly, of 0.10% per annum of average daily net assets.
39
Note 5. Investment Transactions
Purchases and sales of equity securities, corporate bonds and purchased options for the period (excluding short-term obligations) are summarized below:
| | | | | | | | | |
| | | Purchases | | | Sales | |
| |
| Partners Fund | | $ | 1,731,362,122 | | | $ | 3,101,487,203 | |
| Small-Cap Fund | | | 260,036,630 | | | | 369,508,635 | |
| International Fund | | | 398,108,668 | | | | 741,020,040 | |
Written options not included in the above purchase and sales transactions for the Partners Fund include:
| | | | | | | | | |
| | | Contracts | | | Premiums | |
| |
| Options outstanding at December 31, 2008 | | | – | | | $ | – | |
| Options written | | | 22,300,000 | | | | 26,155,995 | |
| Options closed | | | (11,300,000 | ) | | | (10,928,510 | ) |
| | | | | | | | | |
| Options outstanding at December 31, 2009 | | | 11,000,000 | | | $ | 15,227,485 | |
| | | | | | | | | |
Note 6. Shares of Beneficial Interest
Each Fund is authorized to issue unlimited shares of beneficial interest with no par value. Transactions in shares of beneficial interest were as follows:
| | | | | | | | | | | | | |
| | | Year ended December 31, 2009 | |
| | | Partners
| | | Small-Cap
| | | International
| |
| | | Fund | | | Fund | | | Fund | |
| |
| Shares sold | | | 53,041,125 | | | | 13,262,919 | | | | 21,003,427 | |
| Reinvestment of shareholder distributions | | | 131,277 | | | | – | | | | – | |
| Shares redeemed | | | (88,314,632 | ) | | | (22,133,908 | ) | | | (46,476,116 | ) |
| | | | | | | | | | | | | |
| | | | (35,142,230 | ) | | | (8,870,989 | ) | | | (25,472,689 | ) |
| | | | | | | | | | | | | |
| | | | | | | | | | | | | |
| | | Year ended December 31, 2008 | |
| | | Partners
| | | Small-Cap
| | | International
| |
| | | Fund | | | Fund | | | Fund | |
| |
| Shares sold | | | 106,833,307 | | | | 17,388,825 | | | | 36,708,815 | |
| Reinvestment of shareholder distributions | | | 14,206,061 | | | | 4,552,502 | | | | 12,499,241 | |
| Shares redeemed | | | (90,836,440 | ) | | | (28,987,627 | ) | | | (62,500,858 | ) |
| | | | | | | | | | | | | |
| | | | 30,202,928 | | | | (7,046,300 | ) | | | (13,292,802 | ) |
| | | | | | | | | | | | | |
40
Note 7. Affiliated Issuer
Under Section 2(a)(3) of the Investment Company Act of 1940, a portfolio company is defined as “affiliated” if a Fund owns five percent or more of its voting stock. Each Fund held at least five percent of the outstanding voting stock of the following companies during the year ended December 31, 2009:
| | | | | | | | | | | | | |
| | | Shares(a) at
| | | Market Value | |
| | | December 31,
| | | December 31, | |
| | | 2009 | | | 2009 | | | 2008 | |
| |
Partners Fund | | | | | | | | | | | | |
| Level 3 Communications, Inc.* | | | 142,006,754 | | | $ | 217,270,334 | | | $ | 107,518,428 | |
Level 3 Communications, Inc., 6%
Convertible Subordinated Notes due 3-15-10 | | | – | | | | – | | | | 28,000,000 | |
Level 3 Communications, Inc.,
15% Convertible Senior Notes due 1-15-13 | | | 100,062,000 | (b) | | | 125,077,500 | | | | 96,289,663 | |
| The NipponKoa Insurance Company, Ltd. | | | 63,701,000 | | | | 362,684,174 | | | | 495,581,331 | |
| Pioneer Natural Resources Company | | | 8,657,900 | | | | 417,051,043 | | | | 140,084,822 | |
| Sun Microsystems, Inc.* | | | – | | | | – | | | | 204,278,320 | |
Sun Microsystems, Inc., Call
January 2010 Strike Price $10 | | | – | | | | – | | | | 1,375,000 | |
| | | | | | | | | | | | | |
| | | | | | | | 1,122,083,051 | | | | 1,073,127,564 | |
| | | | | | | | | | | | | |
Small-Cap Fund | | | | | | | | | | | | |
| Del Monte Foods Company | | | – | | | | – | | | | 87,693,480 | |
| Dillard’s, Inc. — Class A | | | 9,050,748 | | | | 166,986,301 | | | | 35,931,470 | |
| DineEquity, Inc.* | | | 2,978,100 | | | | 72,338,049 | | | | 34,426,836 | |
| Fair Isaac Corporation | | | 7,216,400 | | | | 153,781,484 | | | | 119,308,104 | |
| Potlatch Corporation | | | 2,887,000 | | | | 92,037,560 | | | | 39,136,154 | |
| Ruddick Corporation | | | 3,107,459 | | | | 79,954,920 | | | | 85,921,241 | |
| Service Corporation International | | | 14,608,716 | | | | 119,645,384 | | | | 70,833,325 | |
| Texas Industries, Inc. | | | 2,514,100 | | | | 87,968,359 | | | | 86,736,450 | |
| tw telecom inc.* | | | 14,732,670 | | | | 252,517,964 | | | | 124,785,715 | |
| Wendy’s/Arby’s Group, Inc. | | | 25,136,597 | | | | 117,890,640 | | | | 89,641,280 | |
| Worthington Industries, Inc. | | | 6,581,000 | | | | 86,013,670 | | | | 72,522,620 | |
| | | | | | | | | | | | | |
| | | | | | | $ | 1,229,134,331 | | | $ | 846,936,675 | |
| | | | | | | | | | | | | |
41
Purchases, sales and income for these affiliates for the year ended December 31, 2009 were as follows:
| | | | | | | | | | | | | |
| | | | | | | | | Dividend
| |
| | | | | | | | | or Interest
| |
| | | Purchases | | | Sales | | | Income(c) | |
Partners Fund | | | | | | | | | | | | |
| Level 3 Communications, Inc.* | | $ | – | | | $ | 17,343,163 | | | $ | – | |
Level 3 Communications, Inc.
6% Convertible Senior Notes due 3-15-10 | | | – | | | | 38,900,000 | | | | 5,810,393 | (d) |
Level 3 Communications, Inc.,
6% Convertible Subordinated Notes due 3-15-10 | | | – | | | | – | | | | 14,995,457 | (d) |
| The NipponKoa Insurance Company, Ltd. | | | – | | | | – | | | | 4,812,505 | |
| Pioneer Natural Resources Company | | | – | | | | – | | | | 692,632 | |
| Sun Microsystems, Inc.* | | | – | | | | 485,661,990 | | | | – | |
| Sun Microsystems, Inc., Call January 2010 strike Price $10 | | | – | | | | 851,495 | | | | – | |
| | | | | | | | | | | | | |
| | | | – | | | | 542,756,648 | | | | 26,310,987 | |
| | | | | | | | | | | | | |
Small-Cap Fund | | | | | | | | | | | | |
| Del Monte Foods Company | | | – | | | | 97,094,858 | | | | 864,000 | |
| Dillard’s, Inc. — Class A | | | – | | | | – | | | | 1,448,120 | |
| DineEquity, Inc.* | | | – | | | | – | | | | – | |
| Fair Isaac Corporation | | | 3,056,776 | | | | – | | | | 568,912 | |
| Ruddick Corporation | | | – | | | | – | | | | 1,491,580 | |
| Service Corporation International | | | 22,775,973 | | | | 32,451,607 | | | | 2,881,892 | |
| Texas Industries, Inc. | | | – | | | | – | | | | 754,230 | |
| tw telecom inc.* | | | – | | | | – | | | | – | |
| Potlatch Corporation | | | 33,544,406 | | | | – | | | | – | |
| Wendy’s/Arby’s Group, Inc. | | | 48,482,816 | | | | 19,907,729 | | | | 1,253,078 | |
| Worthington Industries, Inc. | | | – | | | | – | | | | 3,093,070 | |
| | | | | | | | | | | | | |
| | | | 107,859,971 | | | | 149,454,194 | | | | 12,354,882 | |
| | | | | | | | | | | | | |
* Non-income producing
| |
| (a) | Common stock unless otherwise noted. |
| |
| (c) | Dividend income unless otherwise noted. |
Note 8. Illiquid Security
The Partners Fund owns $100,062,000 principal amount of Level 3 Communications, Inc. 15% Convertible Senior Notes due 1-15-13. These notes were acquired directly from Level 3 in an offering registered on Form S-3 under the Securities Act of 1933, and the notes have likewise been registered for resale on Form S-3. Due to the lack of an active trading market, all or a portion of this position may be illiquid. These Level 3 notes represent 1.6% of the Partners Fund’s net assets at December 31, 2009 and are board valued using publicly observable inputs (See Note 2).
42
Note 9. Collateral
Securities with the following aggregate value were segregated to collateralize forward currency and option contracts at December 31, 2009:
| | | | | |
| Partners Fund | | $ | 371,550,000 | |
| International Fund | | | 377,431,031 | |
Note 10. Related Ownership
At December 31, 2009, officers, employees of Southeastern and their families, Fund trustees, the Southeastern retirement plan and other affiliates owned more than 5% of the following Funds:
| | | | | | | | | |
| | | Shares Owned | | | Percent of Fund | |
| |
| Partners Fund | | | 17,847,082 | | | | 5.3 | % |
| Small-Cap Fund | | | 11,522,668 | | | | 10.0 | |
| International Fund | | | 19,912,953 | | | | 12.6 | |
Note 11. Fair Value Measurements and Disclosures
FASB ASC 820 established a single definition of fair value for financial reporting, created a three-tier framework for measuring fair value based on inputs used to value the Funds’ investments, and required additional disclosure about the use of fair value measurements. The hierarchy of inputs is summarized below.
| | |
| | • | Level 1 – quoted prices in active markets for identical investments |
| |
| | • | Level 2 – other significant observable inputs (including quoted prices for similar investments, interest rates, prepayment speeds, credit risk, etc.) |
| |
| | • | Level 3 – significant unobservable inputs (including the Funds’ own assumptions in determining the fair value of investments) |
Observable inputs are those based on market data obtained from sources independent of the Funds’, and unobservable inputs reflect the Funds’ own assumptions based on the best information available. The input levels are not necessarily an indication of risk or liquidity associated with investing in those securities.
A summary of the inputs used in valuing the Funds’ net assets as December 31, 2009 follows:
| | | | | | | | | | | | | | | | | |
| | | Level 1 | | | Level 2 | | | Level 3 | | | Total Value | |
| |
Partners Fund | | | | | | | | | | | | | | | | |
| Common Stocks | | $ | 6,115,704,681 | | | $ | 748,497,588 | | | $ | – | | | $ | 6,864,202,269 | |
| Corporate Bonds | | | – | | | | 125,077,500 | | | | – | | | | 125,077,500 | |
| Short-Term Obligations | | | 1,042,504,400 | | | | – | | | | – | | | | 1,042,504,400 | |
| Forward Currency Contracts | | | (1,217,420 | ) | | | – | | | | – | | | | (1,217,420 | ) |
| Options Written | | | – | | | | (4,925,000 | ) | | | – | | | | (4,925,000 | ) |
| | | | | | | | | | | | | | | | | |
| Total | | $ | 7,156,991,661 | | | $ | 868,650,088 | | | $ | – | | | $ | 8,025,641,749 | |
| | | | | | | | | | | | | | | | | |
43
| | | | | | | | | | | | | | | | | |
| | | Level 1 | | | Level 2 | | | Level 3 | | | Total Value | |
| |
Small-Cap Fund | | | | | | | | | | | | | | | | |
| Common Stocks | | $ | 2,377,214,270 | | | $ | 109,877,345 | | | $ | – | | | $ | 2,487,091,615 | |
| Corporate Bonds | | | – | | | | – | | | | – | | | | – | |
| Short-Term Obligations | | | 13,091,000 | | | | – | | | | – | | | | 13,091,000 | |
| Forward Currency Contracts | | | – | | | | – | | | | – | | | | – | |
| Options Written | | | – | | | | – | | | | – | | | | – | |
| | | | | | | | | | | | | | | | | |
| Total | | $ | 2,390,305,270 | | | $ | 109,877,345 | | | $ | – | | | $ | 2,500,182,615 | |
| | | | | | | | | | | | | | | | | |
International Fund | | | | | | | | | | | | | | | | |
| Common Stocks | | $ | 724,564,596 | | | $ | 1,405,451,647 | | | $ | – | | | $ | 2,130,016,243 | |
| Corporate Bonds | | | – | | | | – | | | | – | | | | – | |
| Short-Term Obligations | | | 49,446,000 | | | | – | | | | – | | | | 49,446,000 | |
| Forward Currency Contracts | | | (10,787,622 | ) | | | – | | | | – | | | | (10,787,622 | ) |
| Options Written | | | – | | | | – | | | | – | | | | – | |
| | | | | | | | | | | | | | | | | |
| Total | | $ | 763,222,974 | | | $ | 1,405,451,647 | | | $ | – | | | $ | 2,168,674,621 | |
| | | | | | | | | | | | | | | | | |
Note 12. Derivatives Instruments
In 2009, the Partners and International Funds invested in forward currency contracts. The Funds focus on absolute returns generated by the local market performance of the equities we purchase. Until September 2009, we often hedged our economic exposure to foreign currency to reduce the impact of foreign currency movements on these returns. After September 2009, we ended the routine practice of hedging as our shareholders wanted more flexibility to manage their own currency exposure. The forward currency contracts remaining at December 31, 2009 were closed in the first quarter of 2010. During the year, exposure to forward contracts, based on their market values, was generally between 0.04% to (0.15)% of the Partners Fund and 0.53% to (1.45)% of the International Fund.
When used as part of an investment strategy, effective currency hedging can offset fluctuations caused by differences between foreign and U.S. currencies, and can isolate the portion of a security’s price fluctuation attributed to capital appreciation or depreciation. Not all foreign currencies can be effectively hedged, and the costs of hedging may outweigh the benefits. If our hedging strategy does not correlate well with market and currency movements, price volatility of the portfolio could increase. Currency hedging, considered separately, can result in losses, but these losses should be offset to an extent by gains in the U.S. dollar equivalent prices of the securities hedged.
In 2009, we wrote covered calls in the Partners Fund. We sold upside calls either (1) against current underlying stock positions near our assessment of fair value when we believed the premium captured more than compensated us for parting with the upside appreciation of the security above the strike price or (2) against current underlying stock positions whose weighting in the portfolio at a stock price equal to the strike price would have merited a reduction in the position size for risk-management
44
purposes. As such - both for valuation and portfolio management reasons - sales of calls served as a method of exit from all or a part of the underlying position. Via the premium we received for selling the calls, we were paid to do that which we would have otherwise done for free (part with all or a portion of our position at a given price.) Each transaction was evaluated on an individual basis and not a routine practice. For the year ended December 31, 2009, the Partners Fund’s exposure to written calls based on their market values was generally between 0% and (0.06)%.
The following is a summary of the location of derivative instruments in the Funds’ financial statements as of December 31, 2009:
| | | | | | | | | |
| Location of Fair Value | | Partners | | | International | |
| |
Forward currency contracts: | | | | | | | | |
| Statement of Assets and Liabilities: | | | | | | | | |
| Liabilities: | | | | | | | | |
| Payable for forward currency contracts | | $ | 1,217,420 | | | $ | 10,787,622 | |
| Statement of Operations: | | | | | | | | |
| Realized gain(loss): | | | | | | | | |
| Net realized loss from forward currency contracts | | | (45,536,988 | ) | | | (52,748,993 | ) |
| Change in unrealized appreciation: | | | | | | | | |
| Change in unrealized appreciation forward currency contracts | | | 56,527,281 | | | | 53,768,725 | |
Options written: | | | | | | | | |
| Statement of Assets and Liabilities: | | | | | | | | |
| Liabilities: | | | | | | | | |
| Payable for options written | | | 4,925,000 | | | | – | |
| Statement of Operations: | | | | | | | | |
| Realized gain(loss): | | | | | | | | |
| Net realized gain from options written | | | 17,820 | | | | – | |
| Change in unrealized appreciation: | | | | | | | | |
| Change in unrealized appreciation on options written | | | 10,302,485 | | | | – | |
Footnote 2, “Significant Accounting Policies,” contains additional information regarding the Funds’ risks associated with forward currency contracts and written options.
Note 13. Schedule of Options Written
The Partners Fund had the following covered calls outstanding at December 31, 2009:
45
| | | | | | | | | | | | | |
| | | | | | | | | Unrealized
| |
Contracts | | | Description | | Market Value | | | Gain | |
| |
| | 315,789 | | | Marriott International, Inc. Call, Expiring 1-11-10, Strike Price $30 | | $ | (55,263 | ) | | $ | 387,980 | |
| | 315,789 | | | Marriott International, Inc. Call, Expiring 1-12-10, Strike Price $30 | | | (55,263 | ) | | | 387,978 | |
| | 315,789 | | | Marriott International, Inc. Call, Expiring 1-13-10, Strike Price $30 | | | (55,263 | ) | | | 387,978 | |
| | 315,789 | | | Marriott International, Inc. Call, Expiring 1-14-10, Strike Price $30 | | | (55,263 | ) | | | 387,978 | |
| | 315,790 | | | Marriott International, Inc. Call, Expiring 1-15-10, Strike Price $30 | | | (55,263 | ) | | | 387,980 | |
| | 315,790 | | | Marriott International, Inc. Call, Expiring 1-19-10, Strike Price $30 | | | (55,263 | ) | | | 387,980 | |
| | 315,790 | | | Marriott International, Inc. Call, Expiring 1-20-10, Strike Price $30 | | | (55,263 | ) | | | 387,980 | |
| | 315,790 | | | Marriott International, Inc. Call, Expiring 1-21-10, Strike Price $30 | | | (55,264 | ) | | | 387,980 | |
| | 315,790 | | | Marriott International, Inc. Call, Expiring 1-22-10, Strike Price $30 | | | (55,264 | ) | | | 387,979 | |
| | 315,790 | | | Marriott International, Inc. Call, Expiring 1-25-10, Strike Price $30 | | | (55,264 | ) | | | 387,979 | |
| | 315,790 | | | Marriott International, Inc. Call, Expiring 1-26-10, Strike Price $30 | | | (55,263 | ) | | | 387,980 | |
| | 315,790 | | | Marriott International, Inc. Call, Expiring 1-27-10, Strike Price $30 | | | (55,263 | ) | | | 387,980 | |
| | 315,790 | | | Marriott International, Inc. Call, Expiring 1-28-10, Strike Price $30 | | | (55,263 | ) | | | 387,980 | |
| | 315,789 | | | Marriott International, Inc. Call, Expiring 1-29-10, Strike Price $30 | | | (55,263 | ) | | | 387,978 | |
| | 315,789 | | | Marriott International, Inc. Call, Expiring 2-1-10, Strike Price $30 | | | (55,263 | ) | | | 387,978 | |
| | 315,789 | | | Marriott International, Inc. Call, Expiring 2-2-10, Strike Price $30 | | | (55,263 | ) | | | 387,978 | |
| | 315,789 | | | Marriott International, Inc. Call, Expiring 2-3-10, Strike Price $30 | | | (55,263 | ) | | | 387,978 | |
| | 315,789 | | | Marriott International, Inc. Call, Expiring 2-4-10, Strike Price $30 | | | (55,263 | ) | | | 387,978 | |
| | 315,789 | | | Marriott International, Inc. Call, Expiring 2-5-10, Strike Price $30 | | | (55,263 | ) | | | 387,978 | |
| | | | | | | | | | | | | |
| | 6,000,000 | | | Subtotal Strike Price $30 | | | (1,050,000 | ) | | | 7,371,600 | |
| | | | | | | | | | | | | |
| | | | | | | | | | | | | |
| | 263,158 | | | Marriott International, Inc. Call, Expiring 1-11-10, Strike Price $27.50 | | | (203,947 | ) | | | 154,257 | |
| | 263,158 | | | Marriott International, Inc. Call, Expiring 1-12-10, Strike Price $27.50 | | | (203,947 | ) | | | 154,257 | |
46
| | | | | | | | | | | | | |
| | | | | | | | | Unrealized
| |
Contracts | | | Description | | Market Value | | | Gain | |
| |
| | 263,158 | | | Marriott International, Inc. Call, Expiring 1-13-10, Strike Price $27.50 | | | (203,947 | ) | | | 154,257 | |
| | 263,158 | | | Marriott International, Inc. Call, Expiring 1-14-10, Strike Price $27.50 | | | (203,947 | ) | | | 154,257 | |
| | 263,158 | | | Marriott International, Inc. Call, Expiring 1-15-10, Strike Price $27.50 | | | (203,947 | ) | | | 154,257 | |
| | 263,158 | | | Marriott International, Inc. Call, Expiring 1-19-10, Strike Price $27.50 | | | (203,947 | ) | | | 154,257 | |
| | 263,158 | | | Marriott International, Inc. Call, Expiring 1-20-10, Strike Price $27.50 | | | (203,947 | ) | | | 154,257 | |
| | 263,158 | | | Marriott International, Inc. Call, Expiring 1-21-10, Strike Price $27.50 | | | (203,947 | ) | | | 154,257 | |
| | 263,157 | | | Marriott International, Inc. Call, Expiring 1-22-10, Strike Price $27.50 | | | (203,947 | ) | | | 154,257 | |
| | 263,157 | | | Marriott International, Inc. Call, Expiring 1-25-10, Strike Price $27.50 | | | (203,947 | ) | | | 154,257 | |
| | 263,158 | | | Marriott International, Inc. Call, Expiring 1-26-10, Strike Price $27.50 | | | (203,947 | ) | | | 154,257 | |
| | 263,158 | | | Marriott International, Inc. Call, Expiring 1-27-10, Strike Price $27.50 | | | (203,948 | ) | | | 154,257 | |
| | 263,158 | | | Marriott International, Inc. Call, Expiring 1-28-10, Strike Price $27.50 | | | (203,948 | ) | | | 154,257 | |
| | 263,158 | | | Marriott International, Inc. Call, Expiring 1-29-10, Strike Price $27.50 | | | (203,948 | ) | | | 154,257 | |
| | 263,158 | | | Marriott International, Inc. Call, Expiring 2-1-10, Strike Price $27.50 | | | (203,948 | ) | | | 154,257 | |
| | 263,158 | | | Marriott International, Inc. Call, Expiring 2-2-10, Strike Price $27.50 | | | (203,948 | ) | | | 154,257 | |
| | 263,158 | | | Marriott International, Inc. Call, Expiring 2-3-10, Strike Price $27.50 | | | (203,948 | ) | | | 154,257 | |
| | 263,158 | | | Marriott International, Inc. Call, Expiring 2-4-10, Strike Price $27.50 | | | (203,948 | ) | | | 154,258 | |
| | 263,158 | | | Marriott International, Inc. Call, Expiring 2-5-10, Strike Price $27.50 | | | (203,947 | ) | | | 154,258 | |
| | | | | | | | | | | | | |
| | 5,000,000 | | | Subtotal Strike Price $27.50 | | | (3,875,000 | ) | | | 2,930,885 | |
| | | | | | | | | | | | | |
| | | | | | | $ | (4,925,000 | ) | | $ | 10,302,485 | |
| | | | | | | | | | | | | |
Note 14. Federal Income Taxes
Required fund distributions are based on income and capital gain amounts determined in accordance with federal income tax regulations, which differ from net investment income and realized gains recognized for financial reporting purposes. Accordingly, the character of distributions and composition of net assets for tax purposes differ from those reflected in the accompanying financial statements.
47
Distributions were subject to tax as follows:
| | | | | | | | | | | | | |
| | | Year ended December 31, 2009 | |
| | | Partners | | | Small-Cap | | | International | |
| |
| Ordinary income | | $ | 3,365,555 | | | $ | – | | | $ | – | |
| | | | | | | | | | | | | |
| | | | | | | | | | | | | |
| | | Year ended December 31, 2008 | |
| | | Partners | | | Small-Cap | | | International | |
| |
| Long-term capital gains | | $ | 236,097,775 | | | $ | 55,215,890 | | | $ | 62,018,266 | |
| Ordinary income | | | 11,430,796 | | | | 16,138,970 | | | | 83,723,100 | |
| | | | | | | | | | | | | |
| | | $ | 247,528,571 | | | $ | 71,354,860 | | | $ | 145,741,366 | |
| | | | | | | | | | | | | |
The tax-basis components of net assets at December 31, 2009 were as follows:
| | | | | | | | | | | | | |
| | | Partners | | | Small-Cap | | | International | |
| |
| Unrealized appreciation | | $ | 776,040,246 | | | $ | – | | | $ | 183,407,957 | |
| Unrealized depreciation | | | (20,960,536 | ) | | | (8,800,804 | ) | | | (1,721,316 | ) |
| | | | | | | | | | | | | |
| Net unrealized appreciation (depreciation) | | | 755,079,710 | | | | (8,800,804 | ) | | | 181,686,641 | |
| Tax loss carryforwards expiring: | | | | | | | | | | | | |
| 12-31-15 | | | (506,357,379 | ) | | | (217,007,632 | ) | | | (32,521,140 | ) |
| 12-31-16 | | | (824,151,903 | ) | | | (78,987,709 | ) | | | (221,976,828 | ) |
| Undistributed ordinary income | | | 23,929,238 | | | | 9,303,219 | | | | 11,877,790 | |
| Paid-in capital | | | 8,590,689,446 | | | | 2,795,994,291 | | | | 2,226,392,771 | |
| | | | | | | | | | | | | |
| | | $ | 8,039,189,112 | | | $ | 2,500,501,365 | | | $ | 2,165,459,234 | |
| | | | | | | | | | | | | |
The following permanent reclassifications were made between capital accounts to reflect the tax character of contingent debt income and foreign currency transactions. These reclassifications did not affect results of operations or net assets.
| | | | | | | | | | | | | |
| | | Partners | | | Small-Cap | | | International | |
| |
| Undistributed net investment income | | $ | 7,648,646 | | | $ | (5,410 | ) | | $ | 199,325 | |
Accumulated net realized gain on investments and foreign
currency | | | (7,648,646 | ) | | | 5,410 | | | | (199,325 | ) |
The Funds’ tax returns are subject to examination by the relevant tax authorities until expiration of the applicable statute of limitations, which is generally three years after filing of the tax return but could be longer in certain circumstances. Management has analyzed the Funds’ tax positions taken on federal income tax returns for all open tax years (tax years ended December 31, 2006-2009), and has concluded that no provision for federal income tax is required in the Funds’ financial statements.
48
Intentionally Left Blank
49
Longleaf Partners Funds
The presentation is for a share outstanding throughout each period.
| | | | | | | | | | | | | | | | | | | | | | | | | |
| | | | | | | | | Net
| | | | | | | | | | |
| | | | | | | | | Gains
| | | | | | | | | | |
| | | Net
| | | | | | (Losses) on
| | | | | | | | | Distri-
| |
| | | Asset
| | | Net
| | | Securities
| | | Total
| | | Dividends
| | | butions
| |
| | | Value
| | | Investment
| | | Realized
| | | From
| | | from Net
| | | from
| |
| | | Beginning
| | | Income
| | | and
| | | Investment
| | | Investment
| | | Capital
| |
| | | of Period | | | (Loss) | | | Unrealized | | | Operations | | | Income | | | Gains | |
Partners Fund | | | | | | | | | | | | | | | | | | | | | | | | |
| Year ended December 31, | | | | | | | | | | | | | | | | | | | | | | | | |
| 2009 | | $ | 15.69 | | | $ | .06 | | | $ | 8.35 | | | $ | 8.41 | | | $ | (.01 | ) | | $ | – | |
| 2008 | | | 33.16 | | | | .03 | | | | (16.80 | ) | | | (16.77 | ) | | | (.03 | ) | | | (0.67 | ) |
| 2007 | | | 34.86 | | | | .07 | | | | (.12 | ) | | | (.05 | ) | | | (.07 | ) | | | (1.58 | ) |
| 2006 | | | 30.97 | | | | .14 | | | | 6.53 | | | | 6.67 | | | | (.14 | ) | | | (2.64 | ) |
| 2005 | | | 31.32 | | | | .29 | | | | .83 | | | | 1.12 | | | | (.29 | ) | | | (1.18 | ) |
| | | | | | | | | | | | | | | | | | | | | | | | | |
Small-Cap Fund | | | | | | | | | | | | | | | | | | | | | | | | |
| Year ended December 31, | | | | | | | | | | | | | | | | | | | | | | | | |
| 2009 | | | 14.58 | | | | .08 | | | | 7.11 | | | | 7.19 | | | | – | | | | – | |
| 2008 | | | 27.04 | | | | .08 | | | | (11.97 | ) | | | (11.89 | ) | | | (.08 | ) | | | (.44 | ) |
| 2007 | | | 30.12 | | | | .14 | | | | .93 | | | | 1.07 | | | | (.14 | ) | | | (4.01 | ) |
| 2006 | | | 27.02 | | | | .50 | | | | 5.49 | | | | 5.99 | | | | (.56 | ) | | | (2.33 | ) |
| 2005 | | | 29.85 | | | | .58 | | | | 2.43 | | | | 3.01 | | | | (.57 | ) | | | (5.27 | ) |
| | | | | | | | | | | | | | | | | | | | | | | | | |
International Fund | | | | | | | | | | | | | | | | | | | | | | | | |
| Year ended December 31, | | | | | | | | | | | | | | | | | | | | | | | | |
| 2009 | | | 11.09 | | | | .07 | | | | 2.50 | | | | 2.57 | | | | – | | | | – | |
| 2008 | | | 19.78 | | | | .04 | | | | (7.93 | ) | | | (7.89 | ) | | | (.04 | ) | | | (.74 | ) |
| 2007 | | | 18.91 | | | | (.01 | ) | | | 2.95 | | | | 2.94 | | | | – | | | | (2.07 | ) |
| 2006 | | | 17.36 | | | | .02 | | | | 2.89 | | | | 2.91 | | | | (.01 | ) | | | (1.35 | ) |
| 2005 | | | 15.55 | | | | (.01 | ) | | | 2.01 | | | | 2.00 | | | | – | | | | (.19 | ) |
| |
| (a) | Total return reflects the rate that an investor would have earned on investment in the Fund during each period, assuming reinvestment of all distributions. |
50
Longleaf Partners Funds
FINANCIAL HIGHLIGHTS
| | | | | | | | | | | | | | | | | | | | | | | | | | | | | | | |
| | | | | | | | | | | | | | | | | | | Ratio of
| | | | |
| | | | | | | | | | | | | | | | Ratio of
| | | Net
| | | | |
Distri-
| | | | | | Net
| | | | | | | | | Expenses
| | | Investment
| | | | |
butions
| | | | | | Asset
| | | | | | Net Assets
| | | to
| | | Income
| | | | |
from
| | | Total
| | | Value
| | | | | | End of
| | | Average
| | | (Loss) to
| | | Portfolio
| |
Return of
| | | Distri-
| | | End of
| | | Total
| | | Period
| | | Net
| | | Average
| | | Turnover
| |
| Capital | | | butions | | | Period | | | Return(a) | | | (thousands) | | | Assets | | | Net Assets | | | Rate | |
| | | | | | | | | | | | | | | | | | | | | | | | | | | | | | | |
| | | | | | | | | | | | | | | | | | | | | | | | | | | | | | | |
| $ | – | | | $ | (.01 | ) | | $ | 24.09 | | | | 53.60 | % | | $ | 8,039,189 | | | | .91 | % | | | .26 | % | | | 28.54 | % |
| | – | | | | (.70 | ) | | | 15.69 | | | | (50.60 | ) | | | 5,788,782 | | | | .90 | | | | .14 | | | | 29.68 | |
| | – | | | | (1.65 | ) | | | 33.16 | | | | (.44 | ) | | | 11,231,099 | | | | .89 | | | | .20 | | | | 15.17 | |
| | – | | | | (2.78 | ) | | | 34.86 | | | | 21.63 | | | | 10,871,594 | | | | .90 | | | | .45 | | | | 18.98 | |
| | – | | | | (1.47 | ) | | | 30.97 | | | | 3.62 | | | | 8,779,205 | | | | .91 | | | | .95 | | | | 6.64 | |
| | | | | | | | | | | | | | | | | | | | | | | | | | | | | | | |
| | | | | | | | | | | | | | | | | | | | | | | | | | | | | | | |
| | – | | | | – | | | | 21.77 | | | | 49.31 | | | | 2,500,501 | | | | .95 | | | | .45 | | | | 12.93 | |
| | (.05 | ) | | | (.57 | ) | | | 14.58 | | | | (43.90 | ) | | | 1,803,685 | | | | .93 | | | | .37 | | | | 22.61 | |
| | – | | | | (4.15 | ) | | | 27.04 | | | | 2.80 | | | | 3,536,052 | | | | .91 | | | | .49 | | | | 28.28 | |
| | – | | | | (2.89 | ) | | | 30.12 | | | | 22.33 | | | | 3,447,285 | | | | .92 | | | | 1.87 | | | | 34.90 | |
| | – | | | | (5.84 | ) | | | 27.02 | | | | 10.75 | | | | 2,812,543 | | | | .93 | | | | 2.21 | | | | 17.28 | |
| | | | | | | | | | | | | | | | | | | | | | | | | | | | | | | |
| | | | | | | | | | | | | | | | | | | | | | | | | | | | | | | |
| | – | | | | – | | | | 13.66 | | | | 23.17 | | | | 2,165,459 | | | | 1.59 | | | | .55 | | | | 20.15 | |
| | (.02 | ) | | | (.80 | ) | | | 11.09 | | | | (39.60 | ) | | | 2,041,338 | | | | 1.60 | | | | .27 | | | | 43.94 | |
| | – | | | | (2.07 | ) | | | 19.78 | | | | 15.29 | | | | 3,902,820 | | | | 1.57 | | | | (.04 | ) | | | 30.44 | |
| | – | | | | (1.36 | ) | | | 18.91 | | | | 17.07 | | | | 3,254,538 | | | | 1.61 | | | | .09 | | | | 24.30 | |
| | – | | | | (.19 | ) | | | 17.36 | | | | 12.88 | | | | 2,880,730 | | | | 1.64 | | | | (.05 | ) | | | 16.93 | |
51
Longleaf Partners Funds
PUBLIC ACCOUNTING FIRM
To the Trustees of Longleaf Partners Funds Trust and Shareholders of Longleaf Partners Fund, Longleaf Partners Small-Cap Fund, and Longleaf Partners Inter- national Fund:
In our opinion, the accompanying statements of assets and liabilities, including the portfolios of investments, and the related statements of operations and of changes in net assets and the financial highlights present fairly, in all material respects, the financial position of Longleaf Partners Funds Trust (comprised of Longleaf Partners Fund, Longleaf Partners Small-Cap Fund, and Longleaf Partners International Fund hereafter referred to as the “Funds”) at December 31, 2009, and the results of each of their operations for the year then ended, and the changes in each of their net assets for each of the two years in the period then ended and the financial highlights for each of the five years in the period then ended, in conformity with accounting principles generally accepted in the United States of America. These financial statements and financial highlights (hereafter referred to as “financial statements”) are the responsibility of the Funds’ management; our responsibility is to express an opinion on these financial statements based on our audits. We conducted our audits of these financial statements in accordance with the standards of the Public Company Accounting Oversight Board (United States.) Those standards require that we plan and perform the audit to obtain reasonable assurance about whether the financial statements are free of material misstatement. An audit includes examining, on a test basis, evidence supporting the amounts and disclosures in the financial statements, assessing the accounting principles used and significant estimates made by management, and evaluating the overall financial statement presentation. We believe that our audits, which included confirmation of securities at December 31, 2009 by correspondence with the custodian and brokers, provide a reasonable basis for our opinion.
PricewaterhouseCoopers LLP
Baltimore, Maryland
February 8, 2010
52
Intentionally Left Blank
53
Longleaf Partners Funds
INVESTMENT ADVISORY CONTRACTS
Longleaf Partners Fund, Longleaf Partners Small-Cap Fund, and Longleaf Partners International Fund (the “Funds”) are non-diversified and each is a series of Longleaf Partners Funds Trust, a Massachusetts business trust which is an open-end management investment company registered with the US Securities and Exchange Commission. Southeastern Asset Management, Inc. (“Southeastern”) acts as investment counsel and fund administrator under agreements with each Fund (the “Agreements”). Trustees for each Fund, including Trustees who are not “interested persons” of the Funds as that term is defined under the Investment Company Act of 1940, as amended (the “Independent Trustees”), are responsible for overseeing the performance of Southeastern and meet annually to review information specific to each Fund to determine whether or not the Agreements with Southeastern ought to be approved.
On September 14, 2009, Trustees for each Fund met to determine whether the Agreements with Southeastern should be approved for the period November 1, 2009 to October 31, 2010. In advance of the meeting, the Independent Trustees reviewed materials relating to the existing Agreements, including an independent expense and performance summary prepared by Lipper Inc. The Lipper materials included comparisons of each Fund with other funds in a comparable Lipper universe, as well as additional funds selected for comparison by the Independent Trustees. Trustees reviewed this comparative Lipper data regarding management and non-management fees and expenses, portfolio turnover, brokerage commissions, investment performance and long-term performance in light of total fund expenses (the “Lipper Data”). Other materials reviewed included information concerning the nature, extent and quality of Southeastern’s services, Southeastern’s profitability and financial results, including advisory fee revenue and separate account advisory fee schedules, and whether economies of scale are, or would be, shared with Fund investors as assets under management increase. Based on the information reviewed, as well as information received throughout the year and first-hand interaction with Southeastern’s personnel, the Trustees for each Fund unanimously approved the selection of Southeastern as adviser and administrator, and the amounts to be paid by each Fund under Agreements with Southeastern.
In addition, the Trustees approved the reappointment of Southeastern Asset Management International (UK) Ltd. (SAMI UK) and Southeastern Asset Management International (Singapore) Pte. Ltd (SAMI Singapore) to serve as subadvisers to each Fund. Importantly, Southeastern reported to the Trustees that the appointment of SAMI UK and SAMI Singapore would not result in a change in the nature, quality or level of service received by the Funds, and no change in fees paid. Southeastern continues to have primary responsibility for managing its clients’ portfolios, including
54
Longleaf Partners Funds
STATEMENT REGARDING BASIS FOR APPROVAL OF
INVESTMENT ADVISORY CONTRACTS
those of the Longleaf Partners Funds. The SAMI UK and SAMI Singapore offices improve Southeastern’s capacity to manage portfolios with investments around the world.
In considering the Agreements, the Trustees did not identify any single factor as all-important or controlling, and each Trustee may have weighed various factors differently. The following summary does not detail all the factors considered, but discusses the material factors and the Trustees’ conclusions.
Nature, Extent and Quality of Services Provided
While the investment performance of each Fund and Southeastern (discussed below) is relevant to an evaluation of the nature, extent and quality of services provided, the Trustees also considered Southeastern’s governing principles as significant. These principles are stated at the beginning of the Funds’ Prospectus:
| |
| • | We will treat your investment in Longleaf as if it were our own. |
| |
| • | We will remain significant investors with you in Longleaf. |
| |
| • | We will invest for the long-term, while striving to maximize returns and minimize business, financial, purchasing power, regulatory and market risks. |
| |
| • | We will choose our equity investments based on their discounts from our appraisals of their corporate intrinsic values, their financial strengths, their managements, their competitive positions, and our assessment of their future earnings potential. |
| |
| • | We will concentrate our assets in our best ideas. |
| |
| • | We will not impose loads, exit fees or 12b-l charges on our investment partners(1).( |
| |
| • | We will consider closing the Funds to new investors if closing would benefit existing shareholders. |
| |
| • | We will discourage short-term speculators and market timers from joining us, the long-term investors in Longleaf. |
| |
| • | We will continue our efforts to enhance shareholder services. |
| |
| • | We will communicate with our investment partners as candidly as possible. |
((1) This principle does not preclude a redemption fee (payable to the Funds) for short-term trades if the Funds’ Trustees determine a fee would be necessary or appropriate to discourage short-term speculators and market timers.
55
Longleaf Partners Funds
STATEMENT REGARDING BASIS FOR APPROVAL OF
INVESTMENT ADVISORY CONTRACTS
The Trustees concluded that Southeastern had been successful in operating each Fund under these governing principles, and that Longleaf shareholders had benefited from Southeastern’s successful execution of its investment discipline over the long term, as well as its shareholder oriented approach. The Trustees looked favorably on Southeastern’s unique Code of Ethics requirement that employees use Longleaf for virtually all public equity investing. The Trustees noted that, as one of the largest shareholder groups, Southeastern and its affiliates’ interests are aligned with other shareholders, facing the same risks, paying the same fees, and sharing the same motivation to achieve positive absolute returns. In addition, significant investment by Southeastern’s personnel has contributed to the economies of scale which have lowered fees and expenses for shareholders over time.
The Trustees recognized that the Longleaf name possesses significant goodwill because of Southeastern’s consistent implementation of the governing principles, noting that Southeastern and the Funds had continued to receive recognition in the press, and among industry observers and participants, for the quality of its investment process, as well as its shareholder orientation and integrity. The Trustees expressed confidence in the research, analysis, knowledge and 34-years’ experience of Southeastern. The Trustees concluded that shareholders buy the Funds primarily to gain access to Southeastern’s investment expertise and shareholder orientation, and weighed this favorably in approving the Agreements.
Trustees concluded that Southeastern’s administrative services, including fund accounting, legal, trading, shareholder reporting, compliance and oversight of Fund operations, had been high quality, and favored approving Southeastern for another year. Trustees concluded that Southeastern had been open, responsive, timely and cooperative in providing information required to oversee the Funds.
Comparative Investment Performance of the Funds and Adviser
Using the Lipper Data, the Trustees compared each Fund through periods ended July 31, 2009, to other similar funds, as well as the following objective benchmarks: inflation plus 10%, and each Fund’s market index plus 200 basis points. All three Longleaf Partners Funds’ long-term results lagged inflation plus 10%, but compared favorably to market indices. A significant factor to all Trustees was Southeastern’s courage to stand behind its convictions, following strict application of its investment discipline, often buying or holding companies currently out of favor. The Trustees concluded that this approach, even though performance had lagged in the short term, is consistent with each Fund’s long-term investment horizon. Specifically, the Trustees noted that, while the Funds’ performance for 2008 and through March of 2009 had
56
Longleaf Partners Funds
STATEMENT REGARDING BASIS FOR APPROVAL OF
INVESTMENT ADVISORY CONTRACTS
been negative, subsequent performance had rebounded significantly, and price to value ratios in each Fund supported the prospect of meaningful future compounding.
The Trustees reviewed after-tax performance information for each Fund and noted that taxable shareholders were benefited by Southeastern’s long-term, low turnover, tax efficient management style as compared to funds with more frequent trading.
The Costs of the Services to be Provided and Profits to be Realized by the
Investment Adviser and its Affiliates from the Relationship with the Fund
The Trustees considered each Fund’s management fee rates and expense ratios (including a reduction in the International Fund’s fee, discussed below) relative to industry averages, advisory fees charged to Southeastern’s private account clients and similar funds selected by Lipper and the Independent Trustees.
While Southeastern’s management fees for each Fund were above average, non- management expenses were below average, due in part to Southeastern’s performance and/or oversight of various operating functions. While the Trustees considered these fees separately, they viewed total expenses borne by shareholders as more important. In addition, the Trustees weighed favorably the fact that Southeastern had foregone additional fee income in each Fund’s early years through application of the expense limitation, and in later years by closing each Fund to protect shareholder interests. The Trustees noted that Longleaf Partners Fund had been closed from July 2004 to January 2008, Longleaf Partners International Fund had been closed from February 2004 to July 2006, and Longleaf Partners Small-Cap Fund was currently closed. The Trustees also recognized that Southeastern does not have an affiliated entity providing transfer agent, custodian, broker dealer or services other than investment management and fund administration. Accordingly, Southeastern neither generates additional fees for itself through related entities, nor allocates Fund brokerage to pay its expenses. The transparency of Southeastern’s fees and lack of supplemental sources of revenue was a significant factor to the Trustees.
With respect to Longleaf Partners Fund for the ten year period ended July 31, 2009, the Fund generated above average returns at below average total expenses when compared to its Lipper universe. With respect to Longleaf Partners Small-Cap Fund, while its performance for the ten year period ended July 31, 2009 was below average, its total expenses were well below average. With respect to Longleaf Partners International Fund, for the ten year period ended July 31, 2009, the Fund’s total expenses were above the average of the Lipper universe, but the Fund’s performance was also above average. As a result of a fee reduction for the International Fund introduced by Southeastern at the meeting, the Fund’s total expenses would move close to the
57
Longleaf Partners Funds
STATEMENT REGARDING BASIS FOR APPROVAL OF
INVESTMENT ADVISORY CONTRACTS
average of its Lipper universe. The Trustees took into account long-term performance, the addition of several analysts to the international research team, the costs of maintaining overseas offices, as well as the fee break when evaluating the fee level of the International Fund. In light of the qualifications, experience, reputation, and performance of Southeastern with respect to each Fund, as well as the steps taken to limit or reduce receipt of fees over time, the Trustees concluded that fees paid to Southeastern by each Fund are reasonable.
The Trustees compared the fees paid to Southeastern by the Funds with those paid by Southeastern’s private account clients, and noted that Southeastern’s domestic private account fees for new accounts had increased in 2009, while international private account fees had decreased. Southeastern reported that these fee changes had been based on the markets for its private account services. To the extent private account fees remained lower than Fund fees, the Trustees concluded that the range of services provided to the Funds is more extensive and the risks associated with operating SEC registered, publicly traded mutual funds are greater. Funds are more work because of the complex overlay of regulatory, tax and accounting issues which are unique to mutual funds. In addition, the work required to service shareholders is more extensive because of the significantly greater number. With respect to risk, not only has regulation become more complex and burdensome, but the scrutiny of regulators and shareholders has gotten more intense. The Trustees concluded that reasonable justifications exist to the extent that there are differences in fee rates between the two lines of business.
The Trustees reviewed reports of Southeastern’s financial position, including overall revenues and expenses of the firm, as well as an Investment Manager Profitability Analysis prepared by Lipper Inc. While the Trustees considered the profitability of Southeastern as a whole, they did not evaluate on a Fund-by-Fund basis Southeastern’s profitability and/or costs. Because no generally accepted cost allocation methodology exists, and estimating the cost of providing services on a Fund specific basis is difficult, Southeastern provided its complete financial statements to the Trustees and stipulated conservatively for renewal purposes that its operation of each Fund should be considered highly profitable, at least as profitable as, if not more profitable than, investment managers with similar assets under management. The Trustees concluded that significant profits were not unreasonable given Southeastern’s successful investment management and strong shareholder orientation, as well as steps it had taken to limit or reduce its fees over time. The Trustees also gave weight to the preferences and expectations of individual Fund shareholders and their relative sophistication, noting that the level of assets under management
58
Longleaf Partners Funds
STATEMENT REGARDING BASIS FOR APPROVAL OF
INVESTMENT ADVISORY CONTRACTS
(despite closing often, no sales force, or 12b-l plan) is a direct result of Southeastern’s successful asset management and strong shareholder orientation. Similarly, if a shareholder wants to redeem, he or she is not constrained by the thought of having to pay a redemption fee or to recoup a front-end load. Thus, in assessing whether the costs of Southeastern’s services and its resulting profits are reasonable, the Trustees considered it relevant that the Funds’ asset base consists of shareholders who have freely chosen to retain access to Southeastern’s services, with full disclosure of advisory fee rates.
The Extent to which Economies of Scale would be Realized as each Fund Grows, and whether Current Fee Levels Reflect these Economies of Scale for the Benefit of Fund Investors
Because Southeastern’s fee structure for each Fund contains a breakpoint, economies of scale will be realized as each Fund grows. The Trustees noted that Southeastern bore costs in excess of each Fund’s expense limitation in early years, and that total expenses of each Fund have declined as a percentage of assets over time. The Trustees recognized that the fee levels for Longleaf Partners Fund and Longleaf Partners Small-Cap Fund currently reflect a greater sharing of economies of scale than the fee for Longleaf Partners International Fund, although the reduction in fees at current asset levels for the International Fund reflects a sharing of economies of scale that will be enhanced when that Fund exceeds $2.5 billion. The Trustees were satisfied that breakpoints of each Fund were set at appropriate levels, and economies of scale are shared sufficiently with Fund shareholders.
Conclusion
While the material factors that the Trustees considered are summarized above, each individual Trustee considered and weighed in the aggregate all information prior to making a renewal decision. All Trustees, including the Independent Trustees, concluded that Southeastern’s fee structure was fair and reasonable in light of the nature and quality of services provided, and that approval of the Investment Counsel and Fund Administration Agreements was in the best interest of each Fund and its shareholders.
59
Longleaf Partners Funds
Shareholders of mutual funds may incur two types of costs: (1) ongoing costs, including management fees, transfer agent fees, and other fund expenses; and (2) transaction costs, including sale charges (loads) and redemption fees. Longleaf does not charge transaction fees of any sort.
The following examples are intended to show the ongoing costs (in dollars) of investing in the Longleaf Funds and to enable you to compare the costs of investing in other mutual funds. Each example is based on an investment of $1,000 made at July 1, 2009 and held through December 31, 2009.
Actual Expenses
The table below provides information about actual account values and actual expenses using each Fund’s actual return for the period. To estimate the expenses that you paid over the period, divide your account balance by $1,000 (for example, a $12,500 account balance divided by $1,000 = 12.5), then multiply the result by the number in the third line entitled “Expenses Paid During Period.”
Ongoing Expenses and Actual Fund Returns
for the period July 1, 2009 to December 31, 2009
| | | | | | | | | | | | | |
| | | Partners | | | Small-Cap | | | International | |
| |
| Beginning Account Value | | $ | 1,000.00 | | | $ | 1,000.00 | | | $ | 1,000.00 | |
| Ending Account Value | | | 1,239.09 | | | | 1,331.50 | | | | 1,171.52 | |
| Expenses Paid During Period* | | | 5.14 | | | | 5.52 | | | | 8.26 | |
| Annualized Expense Ratio for Period | | | 0.91 | % | | | 0.94 | % | | | 1.51 | % |
| |
| * | Expenses are equal to the Fund’s annualized expense ratio, multiplied by the average account value for the period, multiplied by the number of days in the most recent fiscal half year (184) divided by 365 days in the current year. |
60
Longleaf Partners Funds
EXPENSE EXAMPLE
Hypothetical Example for Comparison Purposes
The table below provides information about hypothetical account values and expenses based on each Fund’s actual expense ratio and assumed returns of 5% per year before expenses, which are not the Funds’ actual returns. Do not use the hypothetical data below to estimate your ending account balance or expenses you paid. This information serves only to compare the ongoing costs of investing in Longleaf with other mutual funds. To do so, examine this 5% hypothetical example against the 5% hypothetical examples found in other funds’ shareholder reports.
The expenses shown in the table highlight only ongoing costs and do not reflect transactional costs that may be charged by other funds. Therefore, the third line of the table does not reveal the total relative costs of owning different funds. Since Longleaf does not charge transactions fees, you should evaluate other funds’ transaction costs to assess the total cost of ownership for comparison purposes.
Ongoing Expenses and Hypothetical 5% Return
for the period July 1, 2009 to December 31, 2009
| | | | | | | | | | | | | |
| | | Partners | | | Small-Cap | | | International | |
| |
| Beginning Account Value | | $ | 1,000.00 | | | $ | 1,000.00 | | | $ | 1,000.00 | |
| Ending Account Value | | | 1,020.62 | | | | 1,020.47 | | | | 1,017.59 | |
| Expenses Paid During Period* | | | 4.63 | | | | 4.79 | | | | 7.68 | |
| Annualized Expense Ratio for Period | | | 0.91 | % | | | 0.94 | % | | | 1.51 | % |
| |
| * | Expenses are equal to the Fund’s annualized expense ratio, multiplied by the average account value for the period, multiplied by the number of days in the most recent fiscal half year (184) divided by 365 days in the current year. |
61
Each Fund is served by a separate Board of Trustees composed of eight members. The membership of each Board is the same. There is no stated term of service, and Trustees continue to serve after election until resignation. All Trustees presently serving except for Rex M. Deloach were elected or re-elected at a meeting of shareholders held on September 19, 2001 in Boston, Massachusetts.
| | | | | | | |
| | | | | Length of Service
|
Name, Age
| | Positions Held
| | as Trustee
|
| And Address | | With Funds | | (Year Began) |
|
| |
| Affiliated or Interested Trustees* |
|
| | | | | | | |
O. Mason Hawkins, CFA, (61)
6410 Poplar Ave., Suite 900
Memphis, TN 38119 | | Co-Portfolio Manager | | Partners Fund
Small-Cap Fund
International Fund | | 1987
1989
1998 |
|
| | | | | | | |
Margaret H. Child (54)
137 Marlborough Street #3
Boston, MA 02116
| | Trustee | | Partners Fund
Small-Cap Fund
International Fund | | 2001
2001
2001
|
|
| |
| Independent or Non-Interested Trustees |
|
| | | | | | | |
Chadwick H. Carpenter, Jr. (59)
6410 Poplar Ave., Suite 900
Memphis, TN 38119 | | Trustee | | Partners Fund
Small-Cap Fund
International Fund | | 1993
1993
1998 |
|
| | | | | | | |
Daniel W. Connell, Jr. (61)
4016 Alcazar Avenue
Jacksonville, FL 32207
| | Trustee | | Partners Fund
Small-Cap Fund
International Fund | | 1997
1997
1998 |
|
| | | | | | | |
Rex M. Deloach (72)
154 County Road 231
Oxford, MS 38655
| | Trustee | | Partners Fund
Small-Cap Fund
International Fund | | 2003
2003
2003 |
|
| | | | | | | |
Steven N. Melnyk (62)
105 Virginia Street
St. Simons Island, GA 31522
| | Trustee | | Partners Fund
Small-Cap Fund
International Fund | | 1991
1991
1998 |
|
| | | | | | | |
C. Barham Ray (63)
6410 Poplar Ave., Suite 900
Memphis, TN 38119
| | Trustee | | Partners Fund
Small-Cap Fund
International Fund | | 1992
1992
1998 |
|
| | | | | | | |
Perry C. Steger (47)
1978 South Austin Avenue
Georgetown, TX 78626 | | Chairman of
the Board | | Partners Fund
Small-Cap Fund
International Fund | | 2001
2001
2001 |
|
| |
| * | Mr. Hawkins is a director and officer of Southeastern Asset Management, Inc. and as such is classified as an “interested” Trustee. Ms. Child is not affiliated with Southeastern, but performs certain administration and operational functions for the Funds in Massachusetts, their state of organization, and could be deemed to be an “interested” Trustee. |
62
INFORMATION ON BOARDS OF TRUSTEES
| | | | | |
Principal Occupations
| | Number of
| | Other
|
| During Past 5 Years | | Portfolios Overseen | | Directorships |
|
| |
| | | | | |
| Affiliated or Interested Trustees* |
|
| | | | | |
Chairman of the Board and Chief Executive Officer, Southeastern Asset Management, Inc.
| | 3 | | |
|
| | | | | |
| Marketing Consultant since 2005; Chief Marketing Officer, Bingham McCutchen, LLP (1999-2004) (an international law firm); Director of Marketing, Arthur Andersen LLP (accounting firm) Memphis office (1991-98), Atlanta office (1998-99). | | 3 | | |
|
| |
| Independent or Non-Interested Trustees |
|
| | | | | |
Private Investor and Consultant since 1998;
Senior Executive Officer,
Progress Software Corp. (1983-98) | | 3 | | |
|
| | | | | |
| Private Investor since 2006; President and CEO, Twilight Ventures, LLC (investment holding company) (2004-2005); Senior Vice President-Marketing, Jacksonville Jaguars (NFL franchise) (1994-2004) | | 3 | | |
|
| | | | | |
| President, Financial Insights, Inc. (financial consulting and litigation support) since 2002; Vice President, The Oxford Company (private land and timber, investments) since 1994. | | 3 | | Chairman, Phosphate Holdings, Inc., Madison, MS |
|
| | | | | |
| Senior Vice President, Stephens, Inc. since 2009; | | | | |
| Real Estate Development, The Sea Island Company, (2005-2009); Private Investor and Consultant since 1997; Golf Commentator, ABC Sports since 1991; President, Riverside Golf Group, Inc. since 1989. | | 3 | | Director, First Coast Community Bank, Fernandina Beach, FL |
|
| | | | | |
Private Investor and Consultant since 2008; Partner,
SSM Corp. (venture capital firm) 1974-2007 | | 3 | | Director, Financial Federal Savings Bank, Memphis, TN and INNOVA, Memphis, TN |
|
| | | | | |
President, Steger & Bizzell Engineering, Inc.
(engineering firm) since 2003; Director of Product Strategy, National Instruments, Inc. (1996-2003) | | 3 | | |
|
63
Intentionally Left Blank
64
Longleaf Partners Funds
The following additional information may be obtained without charge, upon request, by calling 800-445-9469, Option 1, or on the Funds’ website at www.longleafpartners.com, or on the SEC’s website at www.sec.gov.
Proxy Voting Policies and Procedures
A description of Longleaf’s Proxy Voting Policies and Procedures is included in the Statement of Additional Information (SAI).
Proxy Voting Record
Information regarding how the Funds voted proxies relating to portfolio securities during the most recent 12-month period ended June 30 is contained in Form N-PX.
Quarterly Portfolio Holdings
Longleaf files a complete schedule of portfolio holdings for the first and third quarters of each fiscal year on Form N-Q, which is available on the SEC’s website, and may be reviewed and copied at the SEC’s Public Reference Room in Washington, D.C. (please call 1-800-SEC-0330 for information on the operation of the Public Reference Room).
In addition to Form N-Q, Longleaf publishes reports for each fiscal quarter. These reports include complete schedules of portfolio holdings, as well as performance updates and management discussion. We furnish Longleaf’s Quarterly Reports in lieu of Form N-Q to shareholders who request information about our first and third quarter portfolio holdings, and Semi-Annual and Annual Reports for requests related to the second and fourth quarters, respectively.
Fund Trustees
Additional information about Fund Trustees is included in the Statement of Additional Information (SAI).
65
Intentionally Left Blank
66
Longleaf Partners Funds
Contact us at www.longleafpartners.com or
(800) 445-9469
To request a Prospectus, Statement of Additional Information (including Longleaf’s Proxy Voting Policies and Procedures), financial report, application or other Fund information from 8:00 a.m. to 8:00 p.m. Eastern time, Monday through Friday.
| |
| DAILY FUND PRICES | OPTION 2 |
For automated reporting 24 hours a day, seven days a week.
| |
| ACCOUNT INFORMATION | OPTION 3 |
For account balance and transaction activity, 24 hours a day, seven days a week. Please have your Fund number (see below) and account number ready to access your investment information.
| |
| SHAREHOLDER INQUIRIES | OPTION 0 |
To request action on your existing account from 9:00 a.m. to 6:00 p.m. Eastern time, Monday through Friday.
CORRESPONDENCE
| | | |
By regular mail: | | By express mail or overnight courier: |
| Longleaf Partners Funds | | Longleaf Partners Funds |
| P.O. Box 9694 | | c/o PNC Global Investment Servicing |
| Providence, RI 02940-9694 | | 101 Sabin Street |
| | | Pawtucket, RI 02860 |
| | | (508) 871-8800 |
PUBLISHED DAILY PRICE QUOTATIONS
Daily net asset value per share of each Fund is reported in mutual fund quotations tables of major newspapers in alphabetical order under the bold heading Longleaf Partners as follows:
| | | | | | | | | |
| | | | | | | Transfer Agent
| | Status to
|
| Abbreviation | | Symbol | | Cusip | | Fund Number | | New Investors |
| Partners | | LLPFX | | 543069108 | | 133 | | Open |
| Sm-Cap | | LLSCX | | 543069207 | | 134 | | Closed 7-31-97 |
| Intl | | LLINX | | 543069405 | | 136 | | Open |
67
Longleaf Partners Funds®
c/o PNC Global Investment Servicing
P.O. Box 9694
Providence, RI 02940-9694
(800) 445-9469
www.longleafpartners.com
Item 2. Code of Ethics.
On December 8, 2003, the Boards of Trustees of the Longleaf Partners Funds adopted a Code of Ethics applicable to officers of Southeastern Asset Management, Inc. performing the principal executive function, the principal financial function, and the principal legal function for the Funds. A copy of this Code of Ethics, as amended, is attached as Exhibit 99.CODE ETH.
Item 3. Audit Committee Financial Expert.
On December 8, 2003, the Independent Trustees of the Longleaf Partners Funds selected Rex M. Deloach to replace G. Staley Cates as Trustee, effective upon Mr. Cates resignation from the Boards December 31, 2003. Mr. Deloach is “independent” as defined by Item 3 of Form N-CSR, and serves as chairman of the Audit Committee. The Trustees have determined that Mr. Deloach meets the definition of “audit committee financial expert” as set forth in Item 3 of Form N-CSR.
In accordance with the SEC’s safe harbor rule for “audit committee financial experts,” no member designated as an audit committee financial expert shall (i) be deemed an “expert” for any other purpose or (ii) have any duty, obligation or liability that is greater than the duties, obligations and liabilities imposed on a member of the board or the audit committee not so designated. Additionally, the designation of a member or members as an “audit committee financial expert” shall in no way affect the duties, obligations or liabilities of any member of the audit committee, or the board, not so designated.
Item 4. Principal Accountant Fees and Services.
| | | | | | | | | | | | |
| Services | | 2008 | 2009 |
| |
|
|
| | (a.) | | | Audit Fees | | | | | | | |
| | | | Audits of the Funds | | $ | 105,000 | | $ | 107,250 | |
| | | |
| | |
| |
| | (b.) | | | Audit Related Fees | | | | | | | |
| Quarterly tax diversification review, tax department review of financial statements | | $ | 18,000 | | $ | 18,000 | |
| | | |
| | |
| |
| | (c.) | | | Tax Fees | | | | | | | |
| Preparation of tax returns, tax consultation and research | | $ | 77,650 | | $ | 90,300 | |
| | | |
| | |
| |
| | (d.) | | | All other fees | | $ | 0 | | | | |
| | | |
| | |
| |
PricewaterhouseCoopers LLP (PwC) serves as the principal accountant for the Longleaf Partners Funds. Under Longleaf’s Audit Committee Charter, the Audit Committee must pre-approve all audit and non-audit services. No additional pre-approval policies and procedures described in paragraph (c)(7) of Rule 2-01 of Regulation S-X have been adopted. No services included in (b.) through (d.) above were approved pursuant to paragraph (c)(7)(i)(C) of Rule 2-01 of Regulation S-X. PWC has not provided any services to Longleaf’s investment adviser or any affiliated entity for the last 2 fiscal years. Accordingly, no consideration was necessary regarding the impact such services might have on PWC’s independence.
Item 5. Audit Committee of Listed Registrants.
Not applicable.
Item 6. Schedule of Investments.
A complete schedule of investments for the period ended December 31, 2009 is included in the Annual Report filed under Item I of this form.
Item 7. Disclosure of Proxy Voting Policies and Procedures for Closed-End Management Investment Companies.
Not applicable.
Item 8. Portfolio Managers of Closed-End Management Investment Companies.
Not applicable.
Item 9. Purchases of Equity Securities by Closed-End Management Investment Company and Affiliated Purchasers.
Not applicable.
Item 10. Submission of Matters to a Vote of Security Holders.
The registrant does not currently have in place procedures by which shareholders may recommend nominees to the registrant’s board of directors.
Item 11. Controls and Procedures.
The registrant’s principal executive officer and principal financial officer have concluded, based on their evaluation of the effectiveness of the design and operation of the registrant’s disclosure controls and procedures as of a date within 90 days of the filing date of this report on Form N-CSR, that the design and operation of such procedures are effective to provide reasonable assurance that information required to be disclosed by the investment company in the reports that it files or submits under the Securities Exchange Act of 1934 is recorded, processed, summarized, and reported within the time periods specified in the Commission’s rules and forms.
At the date of filing this Form N-CSR, the registrant’s principal executive officer and principal financial officer are aware of no changes in the registrant’s internal control over financial reporting during the second fiscal quarter of the period covered by this report (ie, the fourth quarter) that have materially affected, or are reasonably likely to materially affect, the registrant’s internal control over financial reporting.
Item 12. Exhibits.
Exhibit 99. CODE/ETH Code of Ethics required by Item 2.
Exhibit 99. CERT Certification Required by Item 12(a)(2) of Form N-CSR
Exhibit 99.906 CERT Certification Pursuant to Section 906 of the Sarbanes Oxley Act.
SIGNATURES
Pursuant to the requirements of the Securities Exchange Act of 1934 and the Investment Company Act of 1940, the registrant has duly caused this report to be signed on its behalf by the undersigned, thereunto duly authorized.
Longleaf Partners Funds Trust
| | | | | |
| By | | /s/ O. Mason Hawkins | | |
| | |
| | |
| | | O. Mason Hawkins
Trustee
Longleaf Partners Funds Trust | | |
| | | | | |
| Date | | February 22, 2010 | | |
Pursuant to the requirements of the Securities Exchange Act of 1934 and the Investment Company Act of 1940, this report has been signed below by the following persons on behalf of the registrant and in the capacities and on the dates indicated.
| | | | | |
| By | | /s/ O. Mason Hawkins | | |
| | |
| | |
| | | O. Mason Hawkins
Chairman and CEO, Southeastern Asset Management, Inc. Functioning as principal executive officer under agreements with Longleaf Partners Funds Trust and its separate series | | |
| | | | | |
| Date | | February 22, 2010 | | |
| | | | | |
| By | | /s/ Julie M. Bishop | | |
| | |
| | |
| | | Julie M. Bishop
Vice President & CFO – Mutual Funds, Southeastern Asset Management, Inc. Functioning as principal financial officer under agreements with Longleaf Partners Funds Trust and its separate series | | |
| |
| Date | | February 22, 2010 | | |
A signed original of this written statement has been provided to Longleaf Partners Funds Trust and will be retained by Longleaf Partners Funds Trust and furnished to the Securities and Exchange Commission or its staff upon request.