UNITED STATES
SECURITIES AND EXCHANGE COMMISSION
Washington, D.C. 20549
FORM N-CSR
CERTIFIED SHAREHOLDER REPORT OF REGISTERED
MANAGEMENT INVESTMENT COMPANIES
Investment Company Act file number: 811-4923
|
| Longleaf Partners Funds Trust |
(Exact name of registrant as specified in charter)
|
c/o Southeastern Asset Management, Inc. 6410 Poplar Avenue, Suite 900 Memphis, TN 38119 |
(Address of principal executive offices) (Zip code)
Andrew R. McCarroll, Esq.
|
Southeastern Asset Management, Inc. 6410 Poplar Ave., Suite 900 Memphis, TN 38119 |
(Name and address of agent for service)
Registrant’s telephone number, including area code: (901) 761-2474
Date of fiscal year end: December 31
Date of reporting period: December 31, 2012.
| Item 1. | Longleaf Partners Funds Annual Report at December 31, 2012. |
|
| Partners Fund |
| Small-Cap Fund |
| International Fund |
|
| December 31, 2012 |

One of Southeastern’s “Governing Principles” is that “we will communicate with our investment partners as candidly as possible,” because we believe Longleaf shareholders benefit from understanding our investment philosophy and approach. Our views and opinions regarding the investment prospects of our portfolio holdings and Funds are “forward looking statements” which may or may not be accurate over the long term. While we believe we have a reasonable basis for our appraisals, and we have confidence in our opinions, actual results may differ materially from those we anticipate. Information provided in this report should not be considered a recommendation to purchase or sell any particular security.
You can identify forward looking statements by words like “believe,” “expect,” “anticipate,” or similar expressions when discussing prospects for particular portfolio holdings and/or one of the Funds. We cannot assure future results and achievements. You should not place undue reliance on forward looking statements, which speak only as of the date of this report. We disclaim any obligation to update or alter any forward looking statements, whether as a result of new information, future events, or otherwise. Current performance may be lower or higher than the performance quoted herein. Past performance does not guarantee future results, fund prices fluctuate, and the value of an investment may be worth more or less than the purchase price. Call (800)445-9469 or go to longleafpartners.com for current performance information and longleafpartners.com/ mutual_fund_documents/prospectus
for the Prospectus and Summary Prospectus, both of which should be read carefully before investing to learn about fund investment objectives, risks and expenses.
The price-to-value ratio (“P/V”) is a calculation that compares the prices of the stocks in a portfolio to Southeastern’s appraisals of their intrinsic values. P/V represents a single data point about a Fund, and should not be construed as something more. We caution our shareholders not to give this calculation undue weight. P/V alone tells nothing about:
| • | | The quality of the businesses we own or the managements that run them; |
| • | | The cash held in the portfolio and when that cash will be invested; |
| • | | The range or distribution of individual P/V’s that comprise the average; and |
| • | | The sources of and changes in the P/V. |
When all of the above information is considered, the P/V is a useful tool to gauge the attractiveness of a Fund’s potential opportunity. It does not, however, tell when that opportunity will be realized, nor does it guarantee that any particular company’s price will ever reach its value. We remind our shareholders who want to find a single silver bullet of information that investments are rarely that simple. To the extent an investor considers P/V in assessing a Fund’s return opportunity, the limits of this tool should be considered along with other factors relevant to each investor.
© 2013 Southeastern Asset Management, Inc. All Rights Reserved.
Longleaf, Longleaf Partners Funds and the pine cone logo are registered trademarks of Longleaf Partners Funds Trust. Southeastern Asset Management, Inc. is a registered trademark.

| | | | | | |
| | Longleaf Partners Funds | | ¡ | | 1 |
| | |
| Letter To Our Shareholders | | |
We are pleased to report that each of the Longleaf Partners Funds’ 2012 returns exceeded our annual goal of inflation plus 10% and outperformed its relevant benchmark index. We also posted strong fourth quarter gains in all three Funds. Our business appraisals, combined with the quality of our companies and our management teams, anchor our investment decisions and provide the foundation for our confidence that market prices will reflect corporate worth over time. At the outset of 2012, we highlighted the investment cases and free cash flow yields of the Funds’ largest holdings, noting that we were “highly confident future returns should be exceptionally rewarding because of the quality of the businesses we own, their prospects over the next five years, and the compellingly low prices we are paying for them.” Over the year, intrinsic values built, and the gap between prices and values started to close.
Cumulative Returns at December 31, 2012
| | | | | | | | | | | | | | | | | | | | | | | | |
| | | Since
Inception(1) | | | Ten Year | | | Five Year | | | Three Year | | | One Year | | | 4Q | |
Partners Fund
(Inception 4/8/87) | | | 1301.23 | % | | | 83.52 | % | | | 1.27 | % | | | 33.46 | % | | | 16.53 | % | | | 3.11 | % |
| | | | | | | | | | | | | | | | | | | | | | | | | |
S&P 500 Index | | | 779.12 | | | | 98.58 | | | | 8.59 | | | | 36.30 | | | | 16.00 | | | | -0.38 | |
| | | | | | | | | | | | | | | | | | | | | | | | | |
Small-Cap Fund
(Inception 2/21/89) | | | 1028.10 | | | | 194.89 | | | | 28.24 | | | | 53.10 | | | | 22.96 | | | | 3.52 | |
| | | | | | | | | | | | | | | | | | | | | | | | | |
Russell 2000 Index | | | 666.18 | | | | 152.79 | | | | 19.09 | | | | 41.43 | | | | 16.35 | | | | 1.85 | |
| | | | | | | | | | | | | | | | | | | | | | | | | |
International Fund
(Inception 10/26/98) | | | 205.87 | | | | 94.23 | | | | -18.27 | | | | 9.85 | | | | 21.23 | | | | 8.31 | |
| | | | | | | | | | | | | | | | | | | | | | | | | |
EAFE Index | | | 73.16 | | | | 120.21 | | | | -17.13 | | | | 11.06 | | | | 17.32 | | | | 6.57 | |
| | | | | | | | | | | | | | | | | | | | | | | | | |
Average Annual Returns at December 31, 2012
| | | | | | | | | | | | | | | | | | | | |
| | | Since
Inception(1) | | | Ten Year | | | Five Year | | | Three Year | | | One Year | |
Partners Fund
(Inception 4/8/87) | | | 10.80 | % | | | 6.26 | % | | | 0.25 | % | | | 10.10 | % | | | 16.53 | % |
| | | | | | | | | | | | | | | | | | | | | |
S&P 500 Index | | | 8.81 | | | | 7.10 | | | | 1.66 | | | | 10.87 | | | | 16.00 | |
| | | | | | | | | | | | | | | | | | | | | |
Small-Cap Fund
(Inception 2/21/89) | | | 10.69 | | | | 11.42 | | | | 5.10 | | | | 15.25 | | | | 22.96 | |
| | | | | | | | | | | | | | | | | | | | | |
Russell 2000 Index | | | 8.91 | | | | 9.72 | | | | 3.56 | | | | 12.25 | | | | 16.35 | |
| | | | | | | | | | | | | | | | | | | | | |
International Fund
(Inception 10/26/98) | | | 8.20 | | | | 6.86 | | | | -3.95 | | | | 3.18 | | | | 21.23 | |
| | | | | | | | | | | | | | | | | | | | | |
EAFE Index | | | 3.95 | | | | 8.21 | | | | -3.69 | | | | 3.56 | | | | 17.32 | |
| | | | | | | | | | | | | | | | | | | | | |
| (1) | During the inception year, the S&P 500 and the EAFE Index were available only at month-end; therefore the S&P 500 value at 3/31/87 and the EAFE value at 10/31/98 were used to calculate performance since inception. |
See pages 6, 12 and 18 for additional performance information.
| | |
| Letter To Our Shareholders | | |
...the companies we own have larger opportunity for earnings growth and stock return...
Most holdings posted solid 2012 returns. The largest contributors were among our most disdained in 2011. In particular, our cement and aggregates companies illustrated why conservative business appraisals, not short-term price movements, should dictate investment decisions, as these stocks sharply rebounded without improvement in global GDP growth or overall industry volumes. In the third quarter of 2011, when macro fears about global growth and sovereign debt caused stocks to tumble, cement companies were among the worst performers as the timing of a construction rebound grew more uncertain. We did not know when infrastructure, housing, and commercial building investment would turn, but we felt confident that over five years, our companies’ unit sales and pricing would improve. We could adopt a longer time horizon because we had a meaningful margin of safety in the discount placed on cement plants and rock quarries – they sold for far below replacement cost and recent comparable sales. Had we waited for more certainty about recovery and less recession fear, we would have missed the 66-90% gains in our core cement holdings and 30+% appreciation in our aggregates companies over the last year as prices moved to more fully reflect asset values.
Even after the good results of 2012, our compounding opportunity over the next 3-5 years remains compelling. Broadly, yields on the growing, after-tax earnings coupons of businesses are over four-and-a-half times the fixed, pretax yields of 10-year Treasuries, and within our portfolios, free cash flow yields are even more attractive.* Our price-to-value ratios offer attractive upside with the Partners and International Funds in the mid-6o%s and Small-Cap in the low-7o%s. Much like cement companies a year ago, a few of our core positions are excessively discounted and have yet to receive market recognition for addressing their challenges and successfully repositioning. Beyond our opportunity to close the gap between price and value, corporate worth should grow because of our holdings’ competitive advantages and our corporate partners’ competence. Any tailwind from top line growth, anemic since 2008, can provide additional value upside.
The beliefs that U.S. profit margins will decline to their historic mean and that earnings will grow at permanently lower rates have exacerbated skepticism over future equity returns. We are not macro-based investors, but we have a different view. First, higher profit margins are sustainable in the U.S. even as world-wide regression occurs, because many low margin businesses have migrated from the U.S., leaving an era of more profitable companies based on intellectual capital such as Apple, Facebook, Google, and their successors. Second, reported margins should be higher due to a larger portion of foreign earnings being accounted for as “equity affiliates.” (Equity affiliates represent a net operating profit number which is 100% profit margin on the income statement.) Third, given where we are in the economic cycle, top lines are likely to grow more in the next five years than in the recent past, so earnings power can grow as revenues increase, even with steady margins. In both the U.S. and Europe, revenues remain far below peak with additional capacity available to support growth. Finally, top lines should also grow as companies earning nothing on corporate cash in many developed countries see interest rates increase.
More importantly, we believe the companies we own have larger opportunity for earnings growth and stock return than the overall market. First, their prices are trading at a much larger discount to our intrinsic values than the market. Second, a number of companies we own have more potential top line growth than the average business because their industries, such as construction, U.S. natural gas, and non-life insurance, have yet to see much revenue recovery post-recession. Third, many of our holdings based in low-growth GDP geographies have a meaningful portion of their revenues tied to higher growth developing markets. Fourth, our investment returns are not limited to dividends plus GDP-driven organic growth. Because of the quality of what we own and our shareholder-oriented management partners, our free cash flow coupons exceed what is needed to fund growth. Our partners are retaining the excess and redeploying it at higher returns, in particular by buying in discounted shares.
| | | | | | |
| | Longleaf Partners Funds | | ¡ | | 3 |
We are confident that the components of our portfolios should deliver significant returns over the next five years. We are also certain that prices will be volatile, and we will have periods of disappointment. Corporate values are much more stable than stock prices. Our appraisals will continue to anchor us in choppy seas as we embrace volatility and buy at points of pessimism. We then will wait patiently as values grow, and the market ultimately recognizes intrinsic worth.
Sincerely,

O. Mason Hawkins, CFA
Chairman & Chief Executive Officer
Southeastern Asset Management, Inc.

G. Staley Cates, CFA
President & Chief Investment Officer
Southeastern Asset Management, Inc.
February 13, 2013
| * | Based on the 12/31/12 forward earnings yield of the S&P 500 and MSCI EAFE Indices as compared to 10 Year Government bond yields for the U.S., Germany, U.K., and Japan. |
| | |
| Partners Fund Management Discussion | | |
Longleaf Partners Fund delivered strong absolute and relative returns in the fourth quarter and for the year. The Fund gained 3.1% over the last three months versus a loss of 0.4% for the S&P 500. The 16.5% return in 2012 exceeded our annual inflation plus 10% goal and beat the Index’s 16.0% rise. Since the 2008 financial crisis and recession, the Partners Fund has more than doubled, gaining 105.0% for shareholders versus a 72.4% return for the Index.
Cumulative Returns at December 31, 2012
| | | | | | | | | | | | | | | | |
| | | Since Inception | | | Four Year | | | One Year | | | 4Q | |
Partners Fund (lnception 4/8/87) | | | 1301.23 | % | | | 105.00 | % | | | 16.53 | % | | | 3.11 | % |
| | | | | | | | | | | | | | | | | |
S&P 500 | | | 779.12 | | | | 72.37 | | | | 16.00 | | | | -0.38 | |
| | | | | | | | | | | | | | | | | |
See page 6 for additional performance information.
Over the course of 2012, most holdings rose. The largest contributor in the fourth quarter and the year, Cemex, a global cement company, had been among the largest detractors in 2011. The position rose 79% over the course of the year. As the combined position grew, we sold the equity and ended the year with a 5% position in the converts. Cemex benefitted from both company-specific actions and broader changes. Management successfully reduced and renegotiated debt terms without diluting shareholders, continued to cut costs, and IPO’d part of the growing Latin American business. Construction-related stocks moved up as recession fears declined, U.S. housing strengthened, and worldwide cement and aggregates prices rose. These dynamics also impacted Vulcan Materials, the U.S. aggregates company, which added 10% in the last quarter and 33% for the year. Management continued to cut costs and increased free cash flow even without volume increases. We trimmed our position to 4.8% of the portfolio.
Philips Electronics, the global medical, lighting and personal care company, rose 12% in the quarter and 31% over the year. In spite of economic headwinds around the world, revenues, margins, and income exceeded expectations across all segments. Hitting, if not surpassing, margin targets in a tough revenue environment for 2013 looks increasingly likely. Management also grew value through significant share repurchases of discounted shares throughout the year. Bank of New York Mellon appreciated 14%
in the last quarter and 32% in 2012. Management surpassed Basel III tier 1 capital requirements and used excess cash to repurchase shares. Cost savings and strength in the asset management business helped convince investors that current earnings are sustainable. We trimmed the position to a 4.9% weight.
InterContinental Hotels and Disney both contributed significantly to 2012 results even after slight stock retreats in the fourth quarter. InterContinental gained 45%, and we sold the stock after management completed a $500 million special dividend and launched a $500 million repurchase. This worldwide hotel company met our buy criteria in August 2011 when macroeconomic fears drove down the price. In the fifteen months we owned the stock, REVPAR (revenue per available room) rose across all geographies and brands, and management announced a plan to sell the London trophy property. We made 84% over our relatively brief holding period. Disney gained 37% over the year, and we trimmed our position as the gap between price and value began to close. Results at the theme parks drove much of the positive news, and ESPN grew operating income at a solid pace. Management used excess cash flow to buy in shares and to acquire Lucasfilm, maker of Star Wars.
Of the names that lost ground in 2012, two of our core positions, Dell and Chesapeake, penalized results meaningfully. Dell gained 5% in the final quarter but fell 37% for the year. We wrote at length in the third quarter report about
| | | | | | |
| Partners Fund | | Longleaf Partners Funds | | ¡ | | 5 |
the End User Computing (EUC) segment’s decline as PC and notebook sales fell. Even though the higher margin Enterprise Solutions and Services (ESS) business grew, overall top line declined as EUC was a larger percent of Dell’s revenues. Over time these two divisions will trade places in terms of revenue importance, reaping higher margins and stronger long-term growth for Dell. Post year-end, the stock is up significantly following an offer to take the company private.
Chesapeake was the primary detractor in the fourth quarter, losing 10% and ending down 22% for the year. Low natural gas prices have hurt the stock and caused investors to question the company’s ability to cover expenses. In the second quarter, we participated in major governance improvements, essentially replacing five board members. Subsequently, the company has sold assets, reduced board and CEO compensation, cut G&A expenses, and subsequent to year-end, CEO Aubrey McLendon announced his retirement. Investors remain skeptical of additional asset sales and reductions in 2013 capex spending. We anticipate that the board, which collectively purchased substantial shares in 2012, will continue to implement decisions that protect and grow shareholder value, and that over time, supply and demand of natural gas will come into balance, causing prices to more closely reflect the marginal cost of production. In the interim, Chesapeake continues to increase its liquids production and reduce the output from its dry gas plays.
We identified five new qualifiers (CONSOL Energy, Berkshire Hathaway, Vivendi, Republic Services, and Mondelez) during the year, although none in the fourth quarter. We filled out our Mondelez position over the last few months as Kraft completed the spin out of these leading global snack brands including Nabisco, Cadbury, and Trident. We closed out our Republic Services position in the fourth quarter after we adjusted our appraisal of the second largest U.S. solid waste company to reflect a lower volume outlook. We also sold Liberty Interactive as the stock approached our appraisal. While the 2008 recession’s impact on QVC reduced our anticipated return in this investment, from the
November 2008 low, the holding gained over 98% as management subsequently strengthened the balance sheet, bought in shares, and separated Liberty Ventures to create a simplified company. Also noteworthy is the split in Abbott Labs that occurred at the start of 2013. To maintain our position size post-split, we bought “when issued” shares of the new Abbott Labs and sold shares of AbbVie, the separated pharmaceutical company.
As we begin 2013, the portfolio trades at an attractive mid-60%s P/V, and long-term value growth should add more opportunity for return. We primarily own industry leaders that have proven their strength through a challenging economic environment. Our management partners have shown their abilities to cut costs, take share, and build value in both good and tough times. We expect that several of our holdings will be controversial at any given point, but as managements effectively address challenges, the skepticism will subside and value will begin to be recognized. For example, over the last year, both Cemex and Level(3) eliminated their debt challenges, and Chesapeake and Level(3) improved their boards. Our long-term shareholders remember other names that evoked controversy and eventually paid off. Even a successful year such as 2012 seemed more dominated by the two most controversial names rather than the remainder of stocks that actually drove our good returns. As long as we anchor our decisions on conservative business appraisals, ensure we have capable and shareholder-aligned management teams, and own businesses with sustainable competitive advantages, we can use patience and a long time horizon to our advantage. This has been true over our 38 years of investing, through numerous market environments and challenges, and nothing indicates that it will change over the next forty years.
...the portfolio trades at an attractive mid-60%s P/V...
| | | | | | |
| 6 | | ¡ | | Annual Report | | Partners Fund |
Comparison of Change in Value of $10,000 Investment
Since Inception April 8, 1987
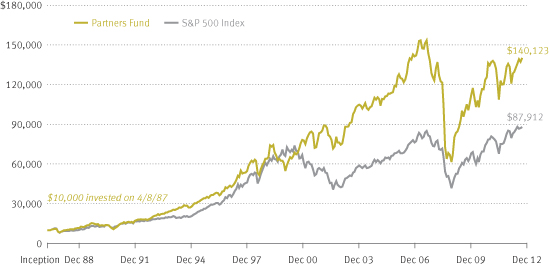
Average Annual Returns for the periods ended December 31, 2012
| | | | | | | | | | | | | | | | | | | | |
| | | Since Inception
4/8/87 | | | 20 Year | | | Ten Year | | | Five Year | | | One Year | |
Partners Fund | | | 10.80 | % | | | 10.13 | % | | | 6.26 | % | | | 0.25 | % | | | 16.53 | % |
| | | | | | | | | | | | | | | | | | | | | |
S&P 500 Index | | | 8.81 | | | | 8.22 | | | | 7.10 | | | | 1.66 | | | | 16.00 | |
| | | | | | | | | | | | | | | | | | | | | |
Past performance does not predict future performance, Fund prices fluctuate, and the value of an investment at redemption may be worth more or less than the purchase price. The Fund’s performance results in the table shown above do not reflect the deduction of taxes that a shareholder would pay on Fund distributions or the redemption of Fund shares. The S&P 500 Index is shown with all dividends and distributions reinvested. Because the S&P 500 Index was available only at month-end in 1987, we used the 3/31/87 value to calculate performance since inception. This index is unmanaged and is not hedged for foreign currency risk. Current performance may be lower or higher than the performance quoted. Please call (800)445-9469 or visit longleafpartners.com for more current performance information. The annualized expense ratio for the Longleaf Partners Fund is 0.91%. The risks associated with an investment in the Longleaf Partners Fund are detailed in the Prospectus. These risks include stock market risk, investment selection risk, corporate ownership risk, non-diversification risk, non-US investment risk, and derivatives risk. Distributed by: Rafferty Capital Markets, LLC.
| | | | | | |
| Partners Fund | | Longleaf Partners Funds | | ¡ | | 7 |
Portfolio Holdings at December 31, 2012
| | | | | | | | |
| | | |
| | | | | | Net Assets | |
Investments | | | | | | | 90.9 | % |
| | | | | | | | | |
Loews Corporation | | | 7.3 | | | | | |
| | | | | | | | | |
Chesapeake Energy Corporation (Common, Convertible Preferred) | | | 7.1 | | | | | |
| | | | | | | | | |
Koninklijke Philips Electronics N.V. | | | 6.0 | | | | | |
| | | | | | | | | |
DIRECTV | | | 6.0 | | | | | |
| | | | | | | | | |
FedEx Corporation | | | 5.9 | | | | | |
| | | | | | | | | |
Dell Inc. (Common, Options) | | | 5.5 | | | | | |
| | | | | | | | | |
CONSOL Energy Inc. | | | 5.2 | | | | | |
| | | | | | | | | |
Cemex S.A.B. de C.V. (Convertible Bonds) | | | 5.0 | | | | | |
| | | | | | | | | |
The Bank of New York Mellon Corporation | | | 4.9 | | | | | |
| | | | | | | | | |
The Travelers Companies, Inc. | | | 4.9 | | | | | |
| | | | | | | | | |
Vulcan Materials Company | | | 4.8 | | | | | |
| | | | | | | | | |
Aon plc | | | 4.8 | | | | | |
| | | | | | | | | |
Level(3) Communications, Inc. | | | 4.5 | | | | | |
| | | | | | | | | |
The Walt Disney Company | | | 4.2 | | | | | |
| | | | | | | | | |
Mondelez International, Inc. | | | 4.0 | | | | | |
| | | | | | | | | |
Abbott Laboratories (Common, When-Issued, Securities Sold Short) | | | 4.0 | | | | | |
| | | | | | | | | |
Franklin Resources, Inc. | | | 3.4 | | | | | |
| | | | | | | | | |
Berkshire Hathaway Inc. | | | 3.4 | | | | | |
| | | | | | | | | |
Cash Reserves | | | | | | | 9.3 | |
| | | | | | | | | |
Other Assets and Liabilities, net | | | | | | | (0.2 | ) |
| | | | | | | | | |
| | | | | | | 100.0 | % |
| | | | | | | | |
Portfolio Changes
January 1, 2012 Through
December 31, 2012
| | | | |
| | |
| New Holdings | | Quarter | |
Berkshire Hathaway Inc. – Class B | | | 2Q | |
| | | | | |
Cemex S.A.B. de C.V. Convertible Subordinated Notes | | | 1Q | |
| | | | | |
Chesapeake Energy Corporation Convertible Preferred Stock | | | 2Q | |
| | | | | |
CONSOL Energy Inc. | | | 1Q | |
| | | | | |
Liberty Ventures Corporation (Liberty Interactive Corporation)(a) | | | 3Q | |
| | | | | |
Mondelez International, Inc. | | | 3Q | |
| | | | | |
Republic Services, Inc. Options | | | 3Q | |
| | | | | |
Vivendi S.A. | | | 2Q | |
| | | | | |
| |
| Eliminations | | | |
Cemex S.A.B. de C.V. ADS | | | 3Q | |
| | | | | |
Cemex S.A.B. de C.V. Bonds Swap Contracts | | | 4Q | |
| | | | | |
Colgate-Palmolive Company Options | | | 2Q | |
| | | | | |
InterContinental Hotels Group PLC | | | 4Q | |
| | | | | |
Level(3) Communications, Inc. Convertible Senior Notes | | | 1Q | |
| | | | | |
Liberty Interactive Corporation | | | 4Q | |
| | | | | |
Liberty Ventures Corporation | | | 3Q | |
| | | | | |
NKSJ Holdings, Inc. | | | 1Q | |
| | | | | |
Republic Services, Inc. Options | | | 4Q | |
| | | | | |
Vivendi S.A. | | | 3Q | |
| | | | | |
Willis Group Holdings Public Limited Company | | | 3Q | |
| | | | | |
Yum! Brands, Inc. | | | 1Q | |
| | | | | |
| (a) | Resulting from corporate action (associated holding) |
| (b) | Exchanged for Level(3) common stock. |
| | | | | | |
| 8 | | ¡ | | Annual Report | | Partners Fund |
| | | | | | | | | | | | |
| Common Stock | |
| | | | |
| | | Share Quantity | | | Market Value | | | % of Net Assets | |
Air Freight & Logistics | | | | | | | | | | | | |
FedEx Corporation | | | 4,922,106 | | | $ | 451,455,562 | | | | 5.9 | % |
| | | | | | | | | | | | | |
Capital Markets | | | | | | | | | | | | |
The Bank of New York Mellon Corporation | | | 14,785,900 | | | | 379,997,630 | | | | 4.9 | |
Franklin Resources, Inc. | | | 2,102,305 | | | | 264,259,738 | | | | 3.4 | |
| | | | | | | | | | | | | |
| | | | | | | 644,257,368 | | | | 8.3 | |
| | | | | | | | | | | | |
Computers & Peripherals | | | | | | | | | | | | |
Dell Inc. | | | 30,878,000 | | | | 312,794,140 | | | | 4.1 | |
| | | | | | | | | | | | | |
Construction Materials | | | | | | | | | | | | |
Vulcan Materials Company(b) | | | 7,138,603 | | | | 371,564,286 | | | | 4.8 | |
| | | | | | | | | | | | | |
Diversified Telecommunication Services | | | | | | | | | | | | |
Level(3) Communications, Inc.*(b) | | | 15,026,565 | | | | 347,263,917 | | | | 4.5 | |
| | | | | | | | | | | | | |
Food Products | | | | | | | | | | | | |
Mondelez International, Inc. | | | 11,947,000 | | | | 304,290,090 | | | | 4.0 | |
| | | | | | | | | | | | | |
Industrial Conglomerates | | | | | | | | | | | | |
Koninklijke Philips Electronics N.V. (Foreign) | | | 14,884,000 | | | | 394,133,408 | | | | 5.1 | |
Koninklijke Philips Electronics N.V. ADR (Foreign) | | | 2,686,500 | | | | 71,299,710 | | | | 0.9 | |
| | | | | | | | | | | | | |
| | | | | | | 465,433,118 | | | | 6.0 | |
| | | | | | | | | | | | |
Insurance | | | | | | | | | | | | |
Aon plc (Foreign) | | | 6,649,788 | | | | 369,728,213 | | | | 4.8 | |
Berkshire Hathaway Inc. – Class B* | | | 2,926,000 | | | | 262,462,200 | | | | 3.4 | |
Loews Corporation | | | 13,853,000 | | | | 564,509,750 | | | | 7.3 | |
The Travelers Companies, Inc. | | | 5,222,252 | | | | 375,062,139 | | | | 4.9 | |
| | | | | | | | | | | | | |
| | | | | | | 1,571,762,302 | | | | 20.4 | |
| | | | | | | | | | | | |
Media | | | | | | | | | | | | |
DIRECTV* | | | 9,211,800 | | | | 462,063,888 | | | | 6.0 | |
The Walt Disney Company | | | 6,462,864 | | | | 321,785,999 | | | | 4.2 | |
| | | | | | | | | | | | | |
| | | | | | | 783,849,887 | | | | 10.2 | |
| | | | | | | | | | | | |
Oil, Gas & Consumable Fuels | | | | | | | | | | | | |
Chesapeake Energy Corporation | | | 27,410,576 | | | | 455,563,773 | | | | 5.9 | |
CONSOL Energy Inc.(b) | | | 12,583,000 | | | | 403,914,300 | | | | 5.2 | |
| | | | | | | | | | | | | |
| | | | | | | 859,478,073 | | | | 11.1 | |
| | | | | | | | | | | | |
Pharmaceuticals | | | | | | | | | | | | |
Abbott Laboratories | | | 4,514,967 | | | | 295,730,338 | | | | 3.9 | |
Abbott Laboratories – When-Issued | | | 5,181,109 | | | | 162,686,823 | | | | 2.1 | |
| | | | | | | | | | | | | |
| | | | | | | 458,417,161 | | | | 6.0 | |
| | | | | | | | | | | | | |
Total Common Stocks (Cost $5,938,843,215) | | | | | | | 6,570,565,904 | | | | 85.3 | |
| | | | | | | | | | | | | |
See Notes to Financial Statements
| | | | | | |
| Partners Fund | | Longleaf Partners Funds | | ¡ | | 9 |
| | | | | | | | | | | | |
| Preferred Stock | | | | | | | | | |
| | | | |
| | | Share Quantity | | | Market Value | | | % of Net Assets | |
Oil, Gas & Consumable Fuels | | | | | | | | | | | | |
Chesapeake Energy Corporation Convertible Preferred Stock 5.75% | | | 56,500 | | | $ | 50,616,938 | | | | 0.7 | % |
Chesapeake Energy Corporation Convertible Preferred Stock – Series A 5.75% | | | 45,480 | | | | 40,505,625 | | | | 0.5 | |
| | | | | | | | | | | | | |
Total Preferred Stocks (Cost $83,894,895) | | | | | | | 91,122,563 | | | | 1.2 | |
| | | | | | | | | | | | | |
| Corporate Bonds | | | | | | | | | |
| | | | |
| | | Principal Amount | | | | | | | |
Construction Materials | | | | | | | | | | | | |
Cemex S.A.B. de C.V. 3.25% Convertible Subordinated Notes due 3/15/16 (Foreign) | | | 182,201,000 | | | | 207,481,389 | | | | 2.7 | |
Cemex S.A.B. de C.V. 3.75% Convertible Subordinated Notes due 3/15/18 (Foreign) | | | 153,203,000 | | | | 174,842,924 | | | | 2.3 | |
| | | | | | | | | | | | | |
Total Corporate Bonds (Cost $302,475,565) | | | | | | | 382,324,313 | | | | 5.0 | |
| | | | | | | | | | | | | |
| Options Purchased | | | | | | | | | |
| | | | |
| | | Share Equivalents | | | | | | | |
Computers & Peripherals | | | | | | | | | | | | |
Dell Inc. Call, 12/14/15, with Deutsche Bank, Strike Price $7 | | | 12,500,000 | | | | 51,750,000 | | | | 0.7 | |
Dell Inc. Call, 12/14/15, with Morgan Stanley, Strike Price $7 | | | 12,500,000 | | | | 54,750,000 | | | | 0.7 | |
| | | | | | | | | | | | | |
Total Options Purchased (Cost $212,877,091) | | | | | | | 106,500,000 | | | | 1.4 | |
| | | | | | | | | | | | | |
| Short-Term Obligations | | | | | | | | | |
| | | | |
| | | Principal Amount | | | | | | | |
Repurchase Agreement with State Street Bank,
0.01% due 1/2/13, Repurchase price $467,828,260 (Collateral: $462,330,000 U.S. Treasury Notes,
0.69% – 0.86% due 12/31/17 to 9/30/18, Value $477,188,715) | | | 467,828,000 | | | | 467,828,000 | | | | 6.1 | |
U.S. Treasury Bill, 0.06% due 3/21/13 | | | 250,000,000 | | | | 249,982,500 | | | | 3.2 | |
| | | | | | | | | | | | | |
Total Short-Term Obligations (Cost $717,806,056) | | | | | | | 717,810,500 | | | | 9.3 | |
| | | | | | | | | | | | | |
Total Investments (Cost $7,255,896,822)(a) | | | | | | | 7,868,323,280 | | | | 102.2 | |
Other Assets and Liabilities, Net | | | | | | | (173,012,924 | ) | | | (2.2 | ) |
Net Assets | | | | | | $ | 7,695,310,356 | | | | 100.0 | % |
Net asset value per share | | | | | | $ | 26.39 | | | | | |
| * | Non-income producing security. |
| (a) | Aggregate cost for federal income tax purposes is $7,719,936,675. Net unrealized appreciation of $612,426,458 consists of unrealized appreciation and depreciation of $1,422,642,043 and $ (810,215,585), respectively. |
| (b) | Affliated issuer during the period. See Note 7. |
Note: Companies designated as “Foreign” are headquartered outside the U.S. and represent 16% of net assets.
| | | | | | | | | | | | |
| Securities Sold Short | |
| | | | |
| | | Share Quantity | | | Market Value | | | % of Net Assets | |
AbbVie Inc. – When-Issued
(Proceeds $150,228,565) | | | (4,514,967 | ) | | $ | (154,231,273 | ) | | | (2.0 | )% |
| | | | | | | | | | | | | |
See Notes to Financial Statements
| | |
| Small-Cap Fund Management Discussion | | |
Longleaf Partners Small-Cap Fund delivered strong absolute and relative results both for the year and the fourth quarter. The Fund far surpassed our annual goal of inflation plus 10%, gaining 23.0% in 2012 versus the Russell 2000’s 16.4%, and advanced 3.5% over the last three months of year compared to 1.9% for the Index. Over the four years since the 2008 financial crisis, the Fund has more than doubled, returning 128.6%. Over longer term periods, the Fund has also delivered strong results.
Cumulative Returns at December 31, 2012
| | | | | | | | | | | | | | | | | | | | |
| | |
| | | Since Inception | | | Ten Year | | | Four Year | | | One Year | | | 4Q | |
Small-Cap Fund (Inception 2/21/89) | | | 1028.10 | % | | | 194.89 | % | | | 128.60 | % | | | 22.96 | % | | | 3.52 | % |
| | | | | | | | | | | | | | | | | | | | | |
Russell 2000 Index | | | 666.18 | | | | 152.79 | | | | 79.86 | | | | 16.35 | | | | 1.85 | |
| | | | | | | | | | | | | | | | | | | | | |
See page 12 for additional performance information.
Throughout the year, most names contributed positively to returns, especially those stocks that suffered the most when macro fears about U.S. default and a double-dip recession caused stocks to tumble in the third quarter of 2011. Texas Industries (TXI), which remains the Fund’s largest holding, drove a substantial portion of results, rising 25% in the fourth quarter and 66% for the year. With U.S. housing beginning to recover, Barron’s succinctly described the case for Texas Industries. “With strongholds in Texas and California, the two largest cement markets in the country, [TXI] has been cutting costs and improving cash flow by modernizing plants and adding capacity. At the same time, cement volumes have started to rise and prices have firmed, particularly in Texas.” (“Building on Housing’s Rousing Rebound” October 22, 2012) The article also cited the company’s undervaluation based on both recent cement plant sales and replacement cost. Martin Marietta, the aggregates company, also benefitted from the same positive industry trends, rising 14% in the quarter and 27% in the year. Both companies serve as examples of the importance of anchoring our investments to conservative appraisals rather than market sentiment, and the benefits of a long time horizon. We did not know when infrastructure, housing, and commercial building investment would turn, but we felt confident that over five years, our companies’ unit sales and pricing would
improve. That long-term view paid off handsomely over the next twelve months.
Numerous other investments had a strong quarter and year. DineEquity, which added 20% over the last three months and 59% in the year, completed its long-term plan to convert to a franchise fee model at Applebee’s. As management sold the last block of stores and reduced debt, the price rose, and we trimmed our position. Over the year, Madison Square Garden gained 55% with 10% coming in the fourth quarter. We scaled the position. The company’s multi-year arena renovation continued on time and in budget, and the completed sections achieved higher ticket prices. Higher affiliate fees both at MSG and other major market teams have supported the value of the Knicks. The entertainment division increased events through the year and purchased the LA Forum to expand its venues. After a 5% rise in the fourth quarter, Lamar gained 42% in 2012, and we trimmed our stake. In the most recent quarter, this billboard company announced a small acquisition at an attractive price and reported revenues and operating cash flow that exceeded guidance. More importantly, the company continued to reduce debt and lower interest cost throughout the year, and the plan to convert to a REIT is progressing. The other major contributor to 2012 return was Dillard’s, which we sold in the second quarter when it approached our appraisal.
| | | | | | |
| Small-Cap Fund | | Longleaf Partners Funds | | ¡ | | 11 |
Of the names that declined in the portfolio during the quarter or year, only Quicksilver had a meaningful impact, losing 27% over the last three months and 53% in 2012. Low natural gas prices hampered this oil and gas exploration and production company’s plan to raise capital through joint ventures in its Horn River, Barnett, and west Texas assets and through an MLP listing. Production declined in the fourth quarter. CEO Glenn Darden is an owner-operator who is focused on building value for his shareholder partners in spite of a challenging environment.
We bought three new names during the year: Leucadia, Tribune via its debt, and Legg Mason in the fourth quarter. Legg Mason has multiple strong brands including small cap specialist Royce and bond manager Western Asset, for which we paid less than ten times adjusted free cash flow. We began purchasing the stock when the CEO stepped down, knowing that the search for a replacement is being led by large shareholder Trian Partners, and the new leader should be able to meaningfully raise margins closer to industry average. Over the last three months we added to several positions, including Saks (via equity and convertible bonds), Wendy’s, Everest Re, and Fairfax. Earlier in the year we sold Dillard’s, Olympus, and Markel, and in the fourth quarter, we eliminated Leucadia after a brief holding period. The company merged with Jeffries Group, increasing the importance of investment banking to its value and reducing the influence of the management team with whom we originally partnered. In addition to previously mentioned trims of the Fund’s strongest performers, we also scaled our positions in Service Corp, tw telecom, and Potlatch.
The Fund’s strong 2012 performance combined with shaving some of our positions left the P/V in the low-70%s and cash at 10.5%. We believe that the companies we own will continue to grow their values through both solid operations and astute capital allocation. We have ample liquidity to buy several new qualifying opportunities when we find them to further enhance our return upside. We will continue to be patient and follow our proven discipline that has guided us for almost four decades.
We believe that the companies we own will continue to grow their values...
| | | | | | |
| 12 | | ¡ | | Annual Report | | Small-Cap Fund |
Comparison of Change in Value of $10,000 Investment
Since Inception February 21, 1989
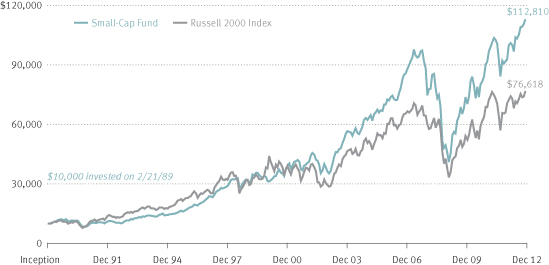
Average Annual Returns for the periods ended December 31, 2012
| | | | | | | | | | | | | | | | | | | | |
| | | Since Inception
2/21/89 | | | 20 Year | | | Ten Year | | | Five Year | | | One Year | |
Small-Cap Fund | | | 10.69 | % | | | 12.11 | % | | | 11.42 | % | | | 5.10 | % | | | 22.96 | % |
| | | | | | | | | | | | | | | | | | | | | |
Russell 2000 Index | | | 8.91 | | | | 8.43 | | | | 9.72 | | | | 3.56 | | | | 16.35 | |
| | | | | | | | | | | | | | | | | | | | | |
Past performance does not predict future performance, Fund prices fluctuate, and the value of an investment at redemption may be worth more or less than the purchase price. The Fund’s performance results in the table shown above do not reflect the deduction of taxes that a shareholder would pay on Fund distributions or the redemption of Fund shares. The Russell 2000 Index is shown with all dividends and distributions reinvested. This index is unmanaged and is not hedged for foreign currency risk. Current performance may be lower or higher than the performance quoted. Please call (800)445-9469 or visit longleafpartners.com for more current performance information. The annualized expense ratio for the Longleaf Partners Small-Cap Fund is 0.92%. The risks associated with an investment in the Longleaf Partners Small-Cap Fund are detailed in the Prospectus. These risks include stock market risk, investment selection risk, corporate ownership risk, non-diversification risk, non-US investment risk, small-cap risk, and derivatives risk. Distributed by: Rafferty Capital Markets, LLC.
| | | | | | |
| Small-Cap Fund | | Longleaf Partners Funds | | ¡ | | 13 |
Portfolio Holdings at December 31, 2012
| | | | | | | | |
| | | |
| | | | | | Net Assets | |
Investments | | | | | | | 89.1 | % |
| | | | | | | | | |
Texas Industries, Inc. | | | 11.3 | | | | | |
| | | | | | | | | |
The Madison Square Garden Company | | | 5.7 | | | | | |
| | | | | | | | | |
Martin Marietta Materials, Inc. | | | 5.5 | | | | | |
| | | | | | | | | |
Vail Resorts, Inc. | | | 5.3 | | | | | |
| | | | | | | | | |
Saks Incorporated (Common, Convertible Bonds) | | | 5.3 | | | | | |
| | | | | | | | | |
Lamar Advertising Company | | | 5.2 | | | | | |
| | | | | | | | | |
DineEquity, Inc. | | | 5.0 | | | | | |
| | | | | | | | | |
Service Corporation International | | | 4.9 | | | | | |
| | | | | | | | | |
Fairfax Financial Holdings Limited | | | 4.9 | | | | | |
| | | | | | | | | |
Everest Re Group, Ltd. | | | 4.7 | | | | | |
| | | | | | | | | |
The Washington Post Company | | | 4.6 | | | | | |
| | | | | | | | | |
Level(3) Communications, Inc. | | | 4.3 | | | | | |
| | | | | | | | | |
tw telecom inc. | | | 4.0 | | | | | |
| | | | | | | | | |
The Wendy’s Company | | | 3.9 | | | | | |
| | | | | | | | | |
Scripps Networks Interactive, Inc. | | | 3.9 | | | | | |
| | | | | | | | | |
Willis Group Holdings Public Limited Company | | | 3.4 | | | | | |
| | | | | | | | | |
Quicksilver Resources Inc. (Common, Bonds) | | | 2.4 | | | | | |
| | | | | | | | | |
Legg Mason, Inc. | | | 2.0 | | | | | |
| | | | | | | | | |
Potlatch Corporation | | | 1.6 | | | | | |
| | | | | | | | | |
Tribune Company | | | 1.2 | | | | | |
| | | | | | | | | |
Cash Reserves | | | | | | | 10.5 | |
| | | | | | | | | |
Other Assets and Liabilities, net | | | | | | | 0.4 | |
| | | | | | | | | |
| | | | | | | 100.0 | % |
| | | | | | | | |
Portfolio Changes
January 1, 2012 Through
December 31, 2012
| | | | |
| | |
| New Holdings | | | |
Legg Mason, Inc. | | | 4Q | |
| | | | | |
Leucadia National Corporation | | | 2Q | |
| | | | | |
Quicksilver Resources Inc. Senior Notes | | | 3Q | |
| | | | | |
Saks Incorporated Convertible Notes | | | 4Q | |
| | | | | |
Tribune Company – Class A(a) | | | 4Q | |
| | | | | |
Tribune Company Senior Bank Debt(a) | | | 3Q | |
| | | | | |
| |
| Eliminations | | | |
Dillards, Inc. | | | 2Q | |
| | | | | |
Leucadia National Corporation | | | 4Q | |
| | | | | |
Markel Corporation | | | 3Q | |
| | | | | |
Olympus Corporation | | | 2Q | |
| | | | | |
Tribune Company Senior Bank Debt(a) | | | 4Q | |
| | | | | |
| (a) | Debt purchased in 3Q was converted by company into common stock in 4Q |
| | | | | | |
| 14 | | ¡ | | Annual Report | | Small-Cap Fund |
| | | | | | | | | | | | |
| Common Stock | |
| | | | |
| | | Share Quantity | | | Market Value | | | Net Assets | |
Capital Markets | | | | | | | | | | | | |
Legg Mason, Inc. | | | 2,625,600 | | | $ | 67,530,432 | | | | 2.0 | % |
| | | | | | | | | | | | | |
Construction Materials | | | | | | | | | | | | |
Martin Marietta Materials, Inc. | | | 1,971,000 | | | | 185,825,880 | | | | 5.5 | |
Texas Industries, Inc.*(b) | | | 7,510,757 | | | | 383,123,714 | | | | 11.3 | |
| | | | | | | | | | | | | |
| | | | | | | 568,949,594 | | | | 16.8 | |
| | | | | | | | | | | | |
Diversified Consumer Services | | | | | | | | | | | | |
Service Corporation International (b) | | | 12,111,900 | | | | 167,265,339 | | | | 4.9 | |
| | | | | | | | | | | | | |
Diversified Telecommunication Services | | | | | | | | | | | | |
Level(3) Communications, Inc.* | | | 6,358,000 | | | | 146,933,380 | | | | 4.3 | |
tw telecom inc.*(b) | | | 5,382,000 | | | | 137,079,540 | | | | 4.0 | |
| | | | | | | | | | | | | |
| | | | | | | 284,012,920 | | | | 8.3 | |
| | | | | | | | | | | | |
Hotels, Restaurants & Leisure | | | | | | | | | | | | |
DineEquity, Inc.*(b) | | | 2,511,331 | | | | 168,259,177 | | | | 5.0 | |
Vail Resorts, Inc.(b) | | | 3,317,000 | | | | 179,416,530 | | | | 5.3 | |
The Wendy’s Company(b) | | | 27,967,000 | | | | 131,444,900 | | | | 3.9 | |
| | | | | | | | | | | | | |
| | | | | | | 479,120,607 | | | | 14.2 | |
| | | | | | | | | | | | |
Insurance | | | | | | | | | | | | |
Everest Re Group, Ltd. (Foreign) | | | 1,449,600 | | | | 159,383,520 | | | | 4.7 | |
Fairfax Financial Holdings Limited (Foreign) | | | 458,700 | | | | 165,343,204 | | | | 4.9 | |
Willis Group Holdings Public Limited Company (Foreign) | | | 3,398,000 | | | | 113,934,940 | | | | 3.4 | |
| | | | | | | | | | | | | |
| | | | | | | 438,661,664 | | | | 13.0 | |
| | | | | | | | | | | | |
Media | | | | | | | | | | | | |
Lamar Advertising Company – Class A* | | | 4,520,772 | | | | 175,179,915 | | | | 5.2 | |
The Madison Square Garden Company – Class A* | | | 4,316,323 | | | | 191,428,925 | | | | 5.7 | |
Scripps Networks Interactive, Inc. – Class A | | | 2,260,000 | | | | 130,899,200 | | | | 3.9 | |
Tribune Company – Class A* | | | 1,010,513 | | | | 42,133,643 | | | | 1.2 | |
The Washington Post Company – Class B(b) | | | 428,000 | | | | 156,309,880 | | | | 4.6 | |
| | | | | | | | | | | | | |
| | | | | | | 695,951,563 | | | | 20.6 | |
| | | | | | | | | | | | |
Multiline Retail | | | | | | | | | | | | |
Saks Incorporated*(b) | | | 14,448,500 | | | | 151,853,735 | | | | 4.5 | |
| | | | | | | | | | | | | |
Oil, Gas & Consumable Fuels | | | | | | | | | | | | |
Quicksilver Resources Inc.*(b) | | | 24,587,000 | | | | 70,318,820 | | | | 2.1 | |
| | | | | | | | | | | | | |
Real Estate Investment Trusts | | | | | | | | | | | | |
Potlatch Corporation(b) | | | 1,365,200 | | | | 53,502,188 | | | | 1.6 | |
| | | | | | | | | | | | | |
Total Common Stocks (Cost $2,515,577,914) | | | | | | | 2,977,166,862 | | | | 88.0 | |
| | | | | | | | | | | | | |
See Notes to Financial Statements
| | | | | | |
| Small-Cap Fund | | Longleaf Partners Funds | | ¡ | | 15 |
| | | | | | | | | | | | |
| Corporate Bonds | |
| | | | |
| | | Principal Amount | | | Market Value | | | Net Assets | |
Multiline Retail | | | | | | | | | | | | |
Saks Incorporated, 7.5% Convertible Notes due 12/1/13(b) | | | 14,051,000 | | | $ | 26,635,427 | | | | 0.8 | % |
| | | | | | | | | | | | | |
Oil, Gas & Consumable Fuels | | | | | | | | | | | | |
Quicksilver Resources Inc., 7.125% Senior Notes due 4/1/16(b) | | | 14,562,000 | | | | 11,722,410 | | | | 0.3 | |
| | | | | | | | | | | | | |
Total Corporate Bonds (Cost $38,533,883) | | | | | | | 38,357,837 | | | | 1.1 | |
| | | | | | | | | | | | | |
| Short-Term Obligations | |
Repurchase Agreement with State Street Bank,
0.01% due 1/2/13, Repurchase price $109,581,061 (Collateral: $110,785,000 U.S. Treasury Notes & Bond,
0.86% – 2.87% due 9/30/18 to 11/15/42, Value $111,774,444) | | | 109,581,000 | | | | 109,581,000 | | | | 3.2 | |
U.S. Treasury Bills, 0.03% – 0.05% due 1/24/13 to 4/4/13 | | | 245,000,000 | | | | 244,991,770 | | | | 7.3 | |
| | | | | | | | | | | | | |
Total Short-Term Obligations (Cost $354,567,851) | | | | | | | 354,572,770 | | | | 10.5 | |
Total Investments (Cost $2,908,679,648)(a) | | | | | | | 3,370,097,469 | | | | 99.6 | |
Other Assets and Liabilities, Net | | | | | | | 14,702,033 | | | | 0.4 | |
Net Assets | | | | | | $ | 3,384,799,502 | | | | 100.0 | % |
Net asset value per share | | | | | | $ | 28.88 | | | | | |
| * | Non-income producing security. |
| (a) | Aggregate cost for federal income tax purposes is $2,910,598,350. Net unrealized appreciation of $461,417,821 consists of unrealized appreciation and depreciation of $810,884,990 and $(349,467,169), respectively. |
| (b) | Affliated issuer during the period. See Note 7. |
Note: Companies designated as “Foreign” are headquartered outside the U.S. and represent 13% of net assets.
See Notes to Financial Statements
| | |
| International Fund Management Discussion | | |
Longleaf Partners International Fund ended 2012 on a strong note, returning 8.3% in the quarter and 21.2% for the full year. The Fund outperformed the MSCI EAFE Index over both periods, which returned 6.6% in the quarter and 17.3% in the year. The Fund’s returns since inception have more than doubled EAFE returns.
Cumulative Returns at December 31, 2012
| | | | | | | | | | | | |
| | | Since Inception | | | One Year | | | 4Q | |
International Fund (Inception 10/26/98) | | | 205.87 | % | | | 21.23 | % | | | 8.31 | % |
| | | | | | | | | | | | | |
EAFE Index | | | 73.16 | | | | 17.32 | | | | 6.57 | |
| | | | | | | | | | | | | |
See page 18 for additional performance information.
Most holdings positively performed in the quarter and for the year, with some of the strongest returns from those companies that became most heavily discounted and hurt Fund performance in 2011. Our cement and aggregates holdings – Lafarge and Cemex – were the top performers for the year and among those in the fourth quarter. When macro fears about global growth and sovereign debt caused stocks to tumble in the third quarter of 2011, Lafarge and Cemex fell as the timing of a construction rebound grew more uncertain. While we did not know when infrastructure, housing, and commercial building investment would turn, we felt confident that over five years, our companies’ unit sales and pricing would improve. We took the opportunity to buy more stock near the lows, and in 2012, Lafarge added 82% and Cemex added 80%. Both companies benefitted from positive company-specific results, as well as increased pricing trends and more positive sentiment regarding U.S. housing, infrastructure spending, and global construction. Lafarge plans to accelerate the company’s cost savings and to sell additional assets in 2013. Cemex management successfully reduced and renegotiated debt terms without diluting shareholders, continued to cut costs, and IPO’d part of the growing Latin American business. We trimmed both holdings in the quarter, but they remain discounted with significant potential for value growth.
As the result of a second round of financing at a price higher than our carrying value, Manabi returned 84% in the year, making it a top contributor. This Brazilian iron ore company has tier one assets with a concentration in the highest quality resources. CEO Ricardo Antunes is an owner with a team of experienced operators and
independent board members. C&C Group, the Irish cider company, returned 30% in the quarter and 68% for the year after reporting strong cider performance outside of Ireland and solid sales and margin growth from Tennent’s beer. C&C acquired Vermont Hard Cider, the largest cider maker in the U.S. We trimmed C&C as price appreciated over the last three months. We sold Ingersoll-Rand, the global industrial firm, early in the fourth quarter after it rose 52% as management paid down debt and returned capital to shareholders through buybacks and dividends. Macau gaming company Melco International returned 30% in the quarter and 57% in 2012, as subsidiary Melco Crown’s mass market operations, particularly at the City of Dreams property, drove growth in revenues and profitability. Because casinos must share VIP revenues with junket operators, the mass market has higher margins. This customer base now comprises two-thirds of Melco Crown’s EBITDA and should continue to increase. Melco has an attractive pipeline of gaming projects in Studio City (Macau) and Belle Grande Manila Bay (Philippines).
Several of our European holdings that declined earlier in the year rebounded in the fourth quarter. Infrastructure company Ferrovial returned 22% in the recent period and 35% for the year after reporting revenue and traffic growth at the Canadian ETR-407 toll road and at Heathrow Airport Holdings. Ferrovial sold an additional 10.62% of Heathrow to Qatar Holding for a price that supports our appraisal. The company also announced two new public-private infrastructure deals in the U.S., a Texas highway and a Virginia toll road. Management returned capital to shareholders with a special dividend in December. We trimmed the position in the quarter. ACS, the Spanish construction and engineering firm,
| | | | | | |
| International Fund | | Longleaf Partners Funds | | ¡ | | 17 |
rebounded 22% in the quarter following positive developments at Hochtief, the German construction company in which ACS holds just over 50%. Hochtief reported solid results and announced the promotion to CEO of COO Marcelino Fernandez, former CEO of ACS’s Dragados construction arm. Hochtief benefitted as public holding Leighton completed its unprofitable Victorian desalination project, easing fears of further cost overruns. Leighton also sold its waste management business and is auctioning its telecom business. After adding to ACS near its low in the first half, we trimmed the position in the fourth quarter following its rebound.
While most holdings rose in 2012, a few companies detracted from performance in spite of fourth quarter gains. Our Dell options added 2% in the final quarter but fell 53% for the year. We wrote at length in the third quarter report about the End User Computing (EUC) segment’s decline as PC and notebook sales fell. Even though the higher margin Enterprise Solutions and Services (ESS) business grew, overall top line declined as EUC was a larger percent of Dell’s revenues. Over time these two divisions will trade places in terms of revenue importance, reaping higher margins and stronger long-term growth for Dell. Post year-end, the stock is up significantly following an offer to take the company private. Brazilian-based oil and gas exploration and production company HRT returned 5% in the fourth quarter, but remained a top detractor for the year after declining 62%. Positive developments in the second half included a letter of intent with Petrobras to monetize Solimoes Basin gas, a farm in deal for 14% of Namibian assets, and the appointment of a majority of new independent board members. This progress, however, was not enough to overcome the dearth of oil discoveries.
During the fourth quarter several names detracted from the Fund’s strong results. Japanese home furniture and fashion company Nitori declined 21% in the quarter and for the year after reporting disappointing same store sales. The home furnishings industry in Japan experienced similar sales declines on the back of unusually hot weather and depressed housing starts. Nitori’s same store sales rebounded late in the quarter, and management reiterated its operating income forecast for the 2013 fiscal year.
In a year of strong performance, we sold seven holdings and trimmed an additional twelve. We bought six new positions, three in the most recent quarter, and added to six existing names in 2012. Exor, the Agnelli family holding company led by Chairman and CEO John Elkann, owns public stakes in competitively positioned businesses, including Fiat Industrial, Fiat Auto, and SGS. Management has opportunistically bought in shares at a discount and is focused on driving value creation at Exor’s underlying businesses. Elkann sits on the boards of Fiat Auto and Fiat Industrial and appointed Sergio Marchionne to oversee the restructuring of these two businesses. We also bought Fiat Industrial, a global leader in agriculture machinery and commercial truck manufacturing. Over 60% of profits come from North and South America through its 88% stake in agricultural equipment business CNH Global. CNH has a comprehensive product offering with a strong distribution network in an oligopolistic industry with pricing power. Fiat Industrial is in the process of merging with the remainder of CNH Global and plans to list the company on the NYSE and move from Italy to the Netherlands to lower its cost of capital and reduce taxes. After we initiated our position in Fiat Industrial, CNH became a cheaper entry point to purchase the same assets. We bought a 1% position in CNH, which we view as a single position with Fiat Industrial. We also initiated a partial position in Nidec, a leader in brushless motor technology that is more energy efficient, quieter, and smaller than conventional motors. This Japanese company serves the commercial, industrial, and auto space, and has over 70% market share in global brushless spindle motors for hard disk drives. We are partnering with the founder and largest shareholder, CEO Nagamori, who has a track record of building shareholder value.
Even after the gains in 2012, the portfolio trades at a price-to-value ratio in the mid-60%s, offering attractive upside. Although we do not know when values will be recognized, we believe that – like at Cemex and Lafarge in 2011 – we own undervalued strong market leaders, with many in depressed industries positioned for recovery, and we expect to see continued value growth across our companies. Thank you for your continued partnership.
...we own undervalued strong market leaders, with many in depressed industries positioned for recovery...
| | | | | | |
| 18 | | ¡ | | Annual Report | | International Fund |
Comparison of Change in Value of $10,000 Investment
Since Inception October 26, 1998
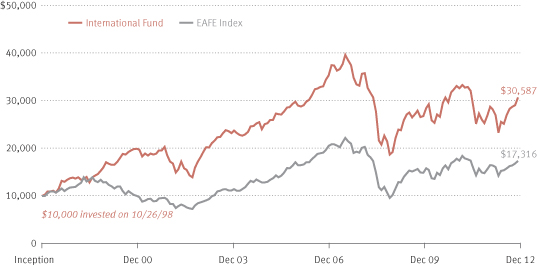
Average Annual Returns for the periods ended December 31, 2012
| | | | | | | | | | | | | | | | |
| | | Since Inception
10/26/98 | | | Ten Year | | | Five Year | | | One Year | |
International Fund | | | 8.20 | % | | | 6.86 | % | | | -3.95 | % | | | 21.23 | % |
| | | | | | | | | | | | | | | | | |
EAFE Index | | | 3.95 | | | | 8.21 | | | | -3.69 | | | | 17.32 | |
| | | | | | | | | | | | | | | | | |
Past performance does not predict future performance, Fund prices fluctuate, and the value of an investment at redemption may be worth more or less than the purchase price. The Fund’s performance results in the table shown above do not reflect the deduction of taxes that a shareholder would pay on Fund distributions or the redemption of Fund shares. The EAFE Index is shown with all dividends and distributions reinvested. Because the EAFE was available only at month-end in 1998, we used the 10/31/98 value to calculate performance since inception. This index is unmanaged and is not hedged for foreign currency risk. Current performance may be lower or higher than the performance quoted. Please call (800)445-9469 or visit longleafpartners.com for more current performance information. The annualized expense ratio for the Longleaf Partners International Fund is 1.29%. The risks associated with an investment in the Longleaf Partners International Fund are detailed in the Prospectus. These risks include stock market risk, investment selection risk, corporate ownership risk, non-diversification risk, non-US investment risk, focused geographic risk, and derivatives risk. Distributed by: Rafferty Capital Markets, LLC.
| | | | | | |
| International Fund | | Longleaf Partners Funds | | ¡ | | 19 |
Portfolio Holdings at December 31, 2012
| | | | | | | | |
| | | |
| | | | | | Net Assets | |
Investments | | | | | | | 89.2 | % |
| | | | | | | | | |
Cheung Kong Holdings Limited | | | 7.6 | | | | | |
| | | | | | | | | |
Manabi Holding S.A. | | | 7.5 | | | | | |
| | | | | | | | | |
Lafarge S.A. | | | 7.0 | | | | | |
| | | | | | | | | |
ACS, Actividades de Construccion Y Servicios, S.A. | | | 6.3 | | | | | |
| | | | | | | | | |
Koninklijke Philips Electronics N.V. | | | 5.9 | | | | | |
| | | | | | | | | |
Melco International Development Limited | | | 5.7 | | | | | |
| | | | | | | | | |
Cemex S.A.B. de C.V. (Bonds) | | | 5.6 | | | | | |
| | | | | | | | | |
C&C Group plc | | | 5.2 | | | | | |
| | | | | | | | | |
Hochtief AG | | | 5.0 | | | | | |
| | | | | | | | | |
Ferrovial S.A. | | | 5.0 | | | | | |
| | | | | | | | | |
Fairfax Financial Holdings Limited | | | 4.5 | | | | | |
| | | | | | | | | |
Willis Group Holdings Public Limited Company | | | 4.2 | | | | | |
| | | | | | | | | |
Genting Berhad | | | 4.0 | | | | | |
| | | | | | | | | |
Nitori Holdings Co., Ltd | | | 3.3 | | | | | |
| | | | | | | | | |
Fiat Industrial S.p.A. | | | 2.6 | | | | | |
| | | | | | | | | |
Accor S.A. | | | 2.5 | | | | | |
| | | | | | | | | |
EXOR S.p.A. | | | 2.4 | | | | | |
| | | | | | | | | |
Vodafone Group plc ADR | | | 2.0 | | | | | |
| | | | | | | | | |
Henderson Stub Swap Contracts | | | 1.6 | | | | | |
| | | | | | | | | |
Nidec Corporation | | | 1.4 | | | | | |
| | | | | | | | | |
HRT Participacoes em Petroleo S.A. | | | 1.2 | | | | | |
| | | | | | | | | |
CNH Global N.V. | | | 0.9 | | | | | |
| | | | | | | | | |
Dell Inc. (Options) | | | (2.2 | ) | | | | |
| | | | | | | | | |
Cash Reserves | | | | | | | 9.4 | |
| | | | | | | | | |
Other Assets and Liabilities, net | | | | | | | 1.4 | |
| | | | | | | | | |
| | | | | | | 100.0 | % |
| | | | | | | | |
Portfolio Changes
January 1, 2012 Through
December 31, 2012
| | | | |
| | |
| New Holdings | | Quarter | |
Anglo & Kumba Swap Contracts | | | 2Q | |
| | | | | |
Cemex S.A.B. de C.V. Convertible Subordinated Notes | | | 1Q | |
| | | | | |
CNH Global N.V. | | | 4Q | |
| | | | | |
EXOR S.p.A. | | | 4Q | |
| | | | | |
Fiat Industrial S.p.A. | | | 4Q | |
| | | | | |
Henderson Stub Swap Contracts | | | 1Q | |
| | | | | |
Nidec Corporation | | | 4Q | |
| | | | | |
Vivendi S.A. | | | 2Q | |
| | | | | |
| |
| Eliminations | | | |
Anglo & Kumba Swap Contracts | | | 3Q | |
| | | | | |
Carrefour S.A. | | | 3Q | |
| | | | | |
Cemex S.A.B. de C.V. ADS | | | 3Q | |
| | | | | |
Cemex Finance LLC U.S., 9.5% Senior Secured Notes due 12/14/16 | | | 1Q | |
| | | | | |
Colgate-Palmolive Company Options | | | 2Q | |
| | | | | |
Ingersoll-Rand plc | | | 4Q | |
| | | | | |
NKSJ Holdings, Inc. | | | 1Q | |
| | | | | |
Olympus Corporation | | | 2Q | |
| | | | | |
Vivendi S.A. | | | 3Q | |
| | | | | |
| | | | | | |
| 20 | | ¡ | | Annual Report | | International Fund |
| | | | | | | | | | | | |
| Common Stock | |
| | | | |
| | | Share Quantity | | | Market Value | | | Net Assets | |
Beverages | | | | | | | | | | | | |
C&C Group plc (Ireland) | | | 12,708,369 | | | $ | 77,895,844 | | | | 5.2 | % |
| | | | | | | | | | | | | |
Construction & Engineering | | | | | | | | | | | | |
ACS, Actividades de Construccion Y Servicios, S.A. (Spain) | | | 3,768,421 | | | | 95,505,825 | | | | 6.3 | |
Ferrovial S.A. (Spain)(d) | | | 5,058,712 | | | | 75,306,133 | | | | 5.0 | |
Hochtief AG (Germany) | | | 1,298,655 | | | | 75,963,218 | | | | 5.0 | |
| | | | | | | | | | | | | |
| | | | | | | 246,775,176 | | | | 16.3 | |
| | | | | | | | | | | | |
Construction Materials | | | | | | | | | | | | |
Lafarge S.A. (France) | | | 1,628,500 | | | | 105,156,548 | | | | 7.0 | |
| | | | | | | | | | | | | |
Diversified Financial Services | | | | | | | | | | | | |
EXOR S.p.A. (Italy) | | | 1,415,000 | | | | 35,660,856 | | | | 2.4 | |
| | | | | | | | | | | | | |
Electrical Equipment | | | | | | | | | | | | |
Nidec Corporation (Japan) | | | 359,000 | | | | 20,965,196 | | | | 1.4 | |
| | | | | | | | | | | | | |
Hotels, Restaurants & Leisure | | | | | | | | | | | | |
Accor S.A. (France) | | | 1,040,673 | | | | 37,117,883 | | | | 2.5 | |
Genting Berhad (Malaysia)(d) | | | 20,167,000 | | | | 60,968,270 | | | | 4.0 | |
Melco International Development Limited (Hong Kong)(b)(d) | | | 71,686,000 | | | | 85,108,753 | | | | 5.7 | |
| | | | | | | | | | | | | |
| | | | | | | 183,194,906 | | | | 12.2 | |
| | | | | | | | | | | | |
Industrial Conglomerates | | | | | | | | | | | | |
Koninklijke Philips Electronics N.V. (Netherlands) | | | 3,372,100 | | | | 89,294,361 | | | | 5.9 | |
| | | | | | | | | | | | | |
Insurance | | | | | | | | | | | | |
Fairfax Financial Holdings Limited (Canada) | | | 189,100 | | | | 68,163,069 | | | | 4.5 | |
Willis Group Holdings Public Limited Company
(Ireland)(d) | | | 1,877,000 | | | | 62,935,810 | | | | 4.2 | |
| | | | | | | | | | | | | |
| | | | | | | 131,098,879 | | | | 8.7 | |
| | | | | | | | | | | | |
Machinery | | | | | | | | | | | | |
CNH Global N.V. (Netherlands) | | | 350,000 | | | | 14,101,500 | | | | 0.9 | |
Fiat Industrial S.p.A. (Italy) | | | 3,523,660 | | | | 38,603,923 | | | | 2.6 | |
| | | | | | | | | | | | | |
| | | | | | | 52,705,423 | | | | 3.5 | |
| | | | | | | | | | | | |
Metals & Mining | | | | | | | | | | | | |
Manabi Holding S.A.* (Brazil)(b)(c) | | | 91,000 | | | | 113,211,111 | | | | 7.5 | |
| | | | | | | | | | | | | |
Oil, Gas & Consumable Fuels | | | | | | | | | | | | |
HRT Participacoes em Petroleo S.A.* (Brazil) | | | 7,665,550 | | | | 17,708,450 | | | | 1.2 | |
| | | | | | | | | | | | | |
Real Estate Management & Development | | | | | | | | | | | | |
Cheung Kong Holdings Limited (Hong Kong)(d) | | | 7,303,000 | | | | 113,630,353 | | | | 7.6 | |
| | | | | | | | | | | | | |
Specialty Retail | | | | | | | | | | | | |
Nitori Holdings Co., Ltd. (Japan) | | | 671,500 | | | | 49,063,254 | | | | 3.3 | |
| | | | | | | | | | | | | |
Wireless Telecommunication Services | | | | | | | | | | | | |
Vodafone Group plc ADR (United Kingdom) | | | 1,215,997 | | | | 30,630,965 | | | | 2.0 | |
| | | | | | | | | | | | | |
Total Common Stocks (Cost $1,192,618,221) | | | | | | | 1,266,991,322 | | | | 84.2 | |
| | | | | | | | | | | | | |
See Notes to Financial Statements
| | | | | | |
| International Fund | | Longleaf Partners Funds | | ¡ | | 21 |
| | | | | | | | | | | | |
| Corporate Bonds | |
| | | | |
| | | Principal Amount | | | Market Value | | | Net Assets | |
Construction Materials | | | | | | | | | | | | |
Cemex S.A.B. de C.V. 3.25% Convertible Subordinated Notes due 3/15/16 (Mexico) | | | 47,008,000 | | | $ | 53,530,360 | | | | 3.6 | |
Cemex S.A.B. de C.V. 3.75% Convertible Subordinated Notes due 3/15/18 (Mexico) | | | 26,812,000 | | | | 30,599,195 | | | | 2.0 | |
| | | | | | | | | | | | | |
Total Corporate Bonds (Cost $66,864,695) | | | | | | | 84,129,555 | | | | 5.6 | |
| | | | | | | | | | | | | |
| Options Purchased(e) | |
| | | | |
| | | Share Equivalents | | | | | | | |
Computers & Peripherals | | | | | | | | | | | | |
Dell Inc. Call, 8/15/16, with Bank of America Merrill Lynch, Strike Price $15.50 (United States) (Cost $35,298,560) | | | 6,476,800 | | | | 9,856,394 | | | | 0.6 | |
| | | | | | | | | | | | | |
| Short-Term Obligations | |
| | | | |
| | | Principal Amount | | | | | | | |
Repurchase Agreement with State Street Bank,
0.01% due 1/2/13, Repurchase price $54,905,031 (Collateral: $55,935,000 U.S. Treasury Note,
0.71% due 12/31/17, Value $56,004,919) | | | 54,905,000 | | | | 54,905,000 | | | | 3.7 | |
U.S. Treasury Bills, 0.03% – 0.05% due 1/24/13 to 3/7/13 | | | 85,000,000 | | | | 84,996,965 | | | | 5.7 | |
| | | | | | | | | | | | | |
Total Short-Term Obligations (Cost $139,898,697) | | | | | | | 139,901,965 | | | | 9.4 | |
| | | | | | | | | | | | | |
Total Investments (Cost $1,434,680,173)(a) | | | | | | | 1,500,879,236 | | | | 99.8 | |
Swap Contracts (Note 12) | | | | | | | 23,765,307 | | | | 1.6 | |
Options Written (Note 12) | | | | | | | (42,855,690 | ) | | | (2.8 | ) |
Forward Currency Contracts (Note 12) | | | | | | | 1,160,596 | | | | – | |
Other Assets and Liabilities, Net | | | | | | | 21,090,222 | | | | 1.4 | |
Net Assets | | | | | | $ | 1,504,039,671 | | | | 100.0 | % |
Net asset value per share | | | | | | $ | 14.04 | | | | | |
| * | Non-income producing security. |
| (a) | Aggregate cost for federal income tax purposes is $1,519,919,032. Net unrealized appepreciation of $66,199,063 consists of unrealized appreciation and depreciation of $247,620,048 and $(181,420,985), respectively. |
| (b) | Affliated issuer during the period. See Note 7. |
| (c) | Illiquid. Board Valued. See Note 8. |
| (d) | All or a portion designated as collateral for options and forward contracts. See Note 9. |
| (e) | See next page for Options Written. |
Note: Country listed in parenthesis after each company indicates location of headquarters.
See Notes to Financial Statements
| | | | | | |
| 22 | | ¡ | | Annual Report | | International Fund |
| | | | | | | | | | | | | | | | |
| Swap Contracts | |
| | | | | |
| | | | | | | | | Market Value | | | % of Net Assets | |
Henderson Stub Swap Contracts with Deutsche Bank due 3/14/17 | | | | | | | $ | 23,765,307 | | | | 1.6 | % |
| | | | | | | | | | | | | | | | | |
| | | | |
| | | | | |
| Real Estate
Management &
Development |
| |
| Oil, Gas &
Consumable
Fuels |
| | | | |
Components of Henderson Stub Swap Contracts | | |
| Henderson Land
Development
Company Limited
(Hong Kong) |
| |
| The Hong Kong
and China
Gas Company
(Hong Kong) |
| | | Total | |
Shares of underlying security | | | | | | | 26,350,000 | | | | (37,680,500 | ) | | | | |
Unrealized appreciation(depreciation) | | | | | | | 40,975,332 | | | | (17,444,952 | ) | | | 23,530,380 | |
Accrued dividends | | | | | | | 3,464,484 | | | | (2,342,853 | ) | | | 1,121,631 | |
Financing Fee | | | | | | | (855,920 | ) | | | (30,784 | ) | | | (886,704 | ) |
Unrealized gain(loss) | | | | | | | 43,583,896 | | | | (19,818,589 | ) | | | 23,765,307 | |
| | | | | | | | | | | | | | | | | |
| | | | |
| Options Written | | | | | | | | | | | | |
| | | | | |
| | | Share Equivalents | | | Unrealized Gain (Loss) | | | Market Value | | | % of Net Assets | |
Computers & Peripherals | | | | | | | | | | | | | | | | |
Dell Inc. Put, 8/15/16, with Bank of America Merrill Lynch, Strike Price $15.50 (United States) (Premiums received $29,016,064) | | | (6,476,800 | ) | | $ | (13,839,626 | ) | | $ | (42,855,690 | ) | | | (2.8 | )% |
| | | | | | | | | | | | | | | | | |
| | | | |
| Forward Currency Contracts | | | | | | | | | | | | |
| | | | | |
| | | Currency Units Sold | | | | | | | | | | |
Japanese Yen Forward with State Street Bank due 3/22/13 | | | (4,135,000,000 | ) | | | 1,160,596 | | | | (47,760,421 | ) | | | – | |
| | | | | | | | | | | | | | | | | |
See Notes to Financial Statements
| | | | | | |
| International Fund | | Longleaf Partners Funds | | ¡ | | 23 |
Country Weightings
| | | | | | | | |
| | | Common Stock & Bonds | | | Net Assets | |
Hong Kong | | | 14.7 | % | | | 13.3 | % |
| | | | | | | | | |
Spain | | | 12.6 | | | | 11.3 | |
| | | | | | | | | |
France | | | 10.5 | | | | 9.5 | |
| | | | | | | | | |
Ireland | | | 10.4 | | | | 9.4 | |
| | | | | | | | | |
Brazil | | | 9.7 | | | | 8.7 | |
| | | | | | | | | |
Netherlands | | | 7.7 | | | | 6.8 | |
| | | | | | | | | |
Mexico | | | 6.2 | | | | 5.6 | |
| | | | | | | | | |
Germany | | | 5.6 | | | | 5.0 | |
| | | | | | | | | |
Italy | | | 5.5 | | | | 5.0 | |
| | | | | | | | | |
Japan | | | 5.2 | | | | 4.7 | |
| | | | | | | | | |
Canada | | | 5.1 | | | | 4.5 | |
| | | | | | | | | |
Malaysia | | | 4.5 | | | | 4.0 | |
| | | | | | | | | |
United Kingdom | | | 2.3 | | | | 2.0 | |
| | | | | | | | | |
| | | 100.0 | % | | | 89.8 | |
| | | | | | | | | |
All other, net | | | | | | | 10.2 | |
| | | | | | | | | |
| | | | | | | 100.0 | % |
| | | | | | | | |
See Notes to Financial Statements
| | |
| Statements of Assets and Liabilities | | at December 31, 2012 |
| | | | | | | | | | | | |
| | | Partners
Fund | | | Small-Cap
Fund | | | International
Fund | |
Assets | | | | | | | | | | | | |
| | | | | | | | | | | | | |
Investments: | | | | | | | | | | | | |
Affiliated securities, at market value (cost $1,171,476,105, $1,417,755,946 and $146,315,680, respectively) (Note 2 and 7) | | $ | 1,122,742,503 | | | $ | 1,636,931,660 | | | $ | 198,319,864 | |
| | | | | | | | | | | | | |
Other securities, at market value (cost $6,084,420,717, $1,490,923,702 and $1,288,364,493, respectively) (Note 2) | | | 6,745,580,777 | | | | 1,733,165,809 | | | | 1,302,559,372 | |
| | | | | | | | | | | | | |
Total Investments | | | 7,868,323,280 | | | | 3,370,097,469 | | | | 1,500,879,236 | |
| | | | | | | | | | | | |
Cash | | | 560 | | | | 420 | | | | 915 | |
| | | | | | | | | | | | | |
Restricted cash (Note 9) | | | – | | | | – | | | | 22,495,000 | |
| | | | | | | | | | | | | |
Receivable for: | | | | | | | | | | | | |
| | | | | | | | | | | | | |
Fund shares sold | | | 6,221,536 | | | | 6,330,897 | | | | 667,266 | |
| | | | | | | | | | | | | |
Dividends and interest | | | 9,134,136 | | | | 32,009,169 | | | | 1,894,000 | |
| | | | | | | | | | | | | |
Securities sold | | | 150,228,565 | | | | 11,200,749 | | | | 687,289 | |
| | | | | | | | | | | | | |
Swap contracts (Note 12) | | | – | | | | – | | | | 23,765,307 | |
| | | | | | | | | | | | | |
Forward currency contracts (Note 12) | | | – | | | | – | | | | 1,160,596 | |
| | | | | | | | | | | | | |
Foreign tax reclaims | | | – | | | | – | | | | 1,110,845 | |
| | | | | | | | | | | | | |
Prepaid assets | | | 178,123 | | | | 74,619 | | | | 38,393 | |
| | | | | | | | | | | | | |
Total Assets | | | 8,034,086,200 | | | | 3,419,713,323 | | | | 1,552,698,847 | |
| | | | | | | | | | | | |
Liabilities | | | | | | | | | | | | |
| | | | | | | | | | | | | |
Securities sold short, at fair value (proceeds $150,228,565) | | | 154,231,273 | | | | – | | | | – | |
| | | | | | | | | | | | | |
Payable for: | | | | | | | | | | | | |
Securities Purchased | | | 164,235,079 | | | | 7,062,500 | | | | – | |
| | | | | | | | | | | | | |
Fund shares redeemed | | | 13,854,116 | | | | 25,084,303 | | | | 4,063,008 | |
| | | | | | | | | | | | | |
Options written (premiums received $29,016,064) (Note 12) | | | – | | | | – | | | | 42,855,690 | |
| | | | | | | | | | | | | |
Investment counsel fee (Note 3) | | | 5,012,651 | | | | 2,244,828 | | | | 1,349,375 | |
| | | | | | | | | | | | | |
Administration fee (Note 4) | | | 657,060 | | | | 288,017 | | | | 126,468 | |
| | | | | | | | | | | | | |
Other accrued expenses | | | 785,665 | | | | 234,173 | | | | 264,635 | |
| | | | | | | | | | | | | |
Total Liabilities | | | 338,775,844 | | | | 34,913,821 | | | | 48,659,176 | |
| | | | | | | | | | | | | |
| | $ | 7,695,310,356 | | | $ | 3,384,799,502 | | | $ | 1,504,039,671 | |
| | | | | | | | | | | | |
Net Assets | | | | | | | | | | | | |
Net assets consist of: | | | | | | | | | | | | |
| | | | | | | | | | | | | |
Paid-in capital | | | 7,371,561,524 | | | | 2,843,459,397 | | | | 1,537,463,899 | |
| | | | | | | | | | | | | |
Undistributed net investment income | | | 7,423,480 | | | | – | | | | 2,051,383 | |
| | | | | | | | | | | | | |
Accumulated net realized gain (loss) on investments and foreign currency | | | (292,098,398 | ) | | | 79,922,284 | | | | (112,781,336 | ) |
| | | | | | | | | | | | | |
Unrealized gain on investments and foreign currency | | | 608,423,750 | | | | 461,417,821 | | | | 77,305,725 | |
| | | | | | | | | | | | | |
Net Assets | | $ | 7,695,310,356 | | | $ | 3,384,799,502 | | | $ | 1,504,039,671 | |
| | | | | | | | | | | | |
Net asset value per share | | | $26.39 | | | | $28.88 | | | | $14.04 | |
| | | | | | | | | | | | | |
Fund shares issued and outstanding | | | 291,588,301 | | | | 117,219,924 | | | | 107,118,974 | |
| | | | | | | | | | | | | |
See Notes to Financial Statements
| | | | | | |
| | Longleaf Partners Funds | | ¡ | | 25 |
| | |
| Statements of Operations | | For the Year Ended December 31, 2012 |
| | | | | | | | | | | | |
| | | Partners
Fund | | | Small-Cap
Fund | | | International
Fund | |
Investment Income: | | | | | | | | | | | | |
| | | | | | | | | | | | | |
Income: | | | | | | | | | | | | |
| | | | | | | | | | | | | |
Dividends from non-affiliates (net of foreign tax withheld of $2,998,344, $527,058, and $4,339,709 respectively) | | $ | 103,570,409 | | | $ | 13,890,707 | | | $ | 42,482,139 | |
| | | | | | | | | | | | | |
Dividends from affiliates (net of foreign tax withheld of $0, $0, and $0 respectively) (Note 7) | | | 24,791,549 | | | | 17,735,513 | | | | 100,782 | |
| | | | | | | | | | | | | |
Interest from non-affiliates | | | 17,635,375 | | | | 104,589 | | | | 4,133,274 | |
| | | | | | | | | | | | | |
Interest from affiliates (Note 7) | | | 3,045,066 | | | | 811,757 | | | | – | |
| | | | | | | | | | | | | |
Total Income | | | 149,042,399 | | | | 32,542,566 | | | | 46,716,195 | |
| | | | | | | | | | | | |
Expenses: | | | | | | | | | | | | |
| | | | | | | | | | | | | |
Investment counsel fee (Note 3) | | | 62,677,101 | | | | 25,659,898 | | | | 16,054,042 | |
| | | | | | | | | | | | | |
Administration fee (Note 4) | | | 8,223,613 | | | | 3,287,986 | | | | 1,505,404 | |
| | | | | | | | | | | | | |
Transfer agent fees and expenses | | | 2,327,643 | | | | 538,301 | | | | 532,703 | |
| | | | | | | | | | | | | |
Prospectus and shareholder reports | | | 774,501 | | | | 194,266 | | | | 112,600 | |
| | | | | | | | | | | | | |
Trustees’ fees and expenses | | | 497,799 | | | | 252,799 | | | | 252,799 | |
| | | | | | | | | | | | | |
Custodian fees and expenses | | | 259,998 | | | | 23,498 | | | | 641,000 | |
| | | | | | | | | | | | | |
Professional fees | | | 108,401 | | | | 108,401 | | | | 133,401 | |
| | | | | | | | | | | | | |
Registration fees | | | 74,212 | | | | 48,409 | | | | 38,710 | |
| | | | | | | | | | | | | |
Other | | | 264,183 | | | | 107,790 | | | | 76,648 | |
| | | | | | | | | | | | | |
Total Expenses | | | 75,207,451 | | | | 30,221,348 | | | | 19,347,307 | |
| | | | | | | | | | | | |
Net Investment Income | | | 73,834,948 | | | | 2,321,218 | | | | 27,368,888 | |
| | | | | | | | | | | | |
Realized and unrealized gain(loss): | | | | | | | | | | | | |
| | | | | | | | | | | | | |
Net realized gain(loss): | | | | | | | | | | | | |
| | | | | | | | | | | | | |
Non-affiliated securities | | | 605,072,791 | | | | 49,392,545 | | | | (57,482,963 | ) |
| | | | | | | | | | | | | |
Affiliated securities (Note 7) | | | 217,206,850 | | | | 256,870,075 | | | | – | |
| | | | | | | | | | | | | |
Options written (Note 12) | | | 25,296,641 | | | | 3,247,029 | | | | 6,786,142 | |
| | | | | | | | | | | | | |
Swap contracts (Note 12) | | | 71,956,532 | | | | – | | | | (8,205,834 | ) |
| | | | | | | | | | | | | |
Forward currency contracts (Note 12) | | | – | | | | – | | | | 4,668,385 | |
| | | | | | | | | | | | | |
Foreign currency transactions | | | (181,289 | ) | | | – | | | | (79,783 | ) |
| | | | | | | | | | | | | |
Net Gain(Loss) | | | 919,351,525 | | | | 309,509,649 | | | | (54,314,053 | ) |
| | | | | | | | | | | | |
Change in unrealized appreciation(depreciation): | | | | | | | | | | | | |
| | | | | | | | | | | | | |
Securities | | | 268,728,987 | | | | 362,423,458 | | | | 308,265,774 | |
| | | | | | | | | | | | | |
Options written (Note 12) | | | (14,669,993 | ) | | | – | | | | (16,867,336 | ) |
| | | | | | | | | | | | | |
Swap contracts (Note 12) | | | (1,256,170 | ) | | | – | | | | 23,765,307 | |
| | | | | | | | | | | | | |
Forward currency contracts (Note 12) | | | – | | | | – | | | | 1,637,114 | |
| | | | | | | | | | | | | |
Other assets and liabilities | | | – | | | | – | | | | 58,471 | |
| | | | | | | | | | | | | |
Change in Net Unrealized Appreciation | | | 252,802,824 | | | | 362,423,458 | | | | 316,859,330 | |
| | | | | | | | | | | | | |
Net Realized and Unrealized Gain | | | 1,172,154,349 | | | | 671,933,107 | | | | 262,545,277 | |
| | | | | | | | | | | | | |
Net Increase in Net Assets Resulting from Operations | | $ | 1,245,989,297 | | | $ | 674,254,325 | | | $ | 289,914,165 | |
| | | | | | | | | | | | |
See Notes to Financial Statements
| | |
| Statements of Changes in Net Assets | | |
| | | | | | | | |
| | | Partners Fund | |
| | | Year Ended December 31, | |
| | | 2012 | | | 2011 | |
Operations: | | | | | | | | |
| | | | | | | | | |
Net investment income | | $ | 73,834,948 | | | $ | 33,960,574 | |
| | | | | | | | | |
Net realized gain(loss) from investments and foreign currency transactions | | | 919,351,525 | | | | 739,231,109 | |
| | | | | | | | | |
Net change in unrealized appreciation(depreciation) of securities, other assets, liabilities and forwards | | | 252,802,824 | | | | (1,011,975,398 | ) |
| | | | | | | | | |
Net increase (decrease) in net assets resulting from operations | | | 1,245,989,297 | | | | (238,783,715 | ) |
| | | | | | | | | |
Distributions to Shareholders: | | | | | | | | |
| | | | | | | | | |
From net investment income | | | (78,165,018 | ) | | | (38,097,173 | ) |
| | | | | | | | | |
From net realized gain on investments | | | (1,118,819,567 | ) | | | (203,712,541 | ) |
| | | | | | | | | |
Net decrease in net assets resulting from distributions | | | (1,196,984,585 | ) | | | (241,809,714 | ) |
| | | | | | | | | |
Capital Share Transactions (Note 6): | | | | | | | | |
| | | | | | | | | |
Net proceeds from sale of shares | | | 649,548,254 | | | | 1,057,457,928 | |
| | | | | | | | | |
Net asset value of shares issued to shareholders for reinvestment of shareholder distributions | | | 1,110,915,679 | | | | 227,136,612 | |
| | | | | | | | | |
Cost of shares redeemed | | | (2,067,956,010 | ) | | | (1,435,166,111 | ) |
| | | | | | | | | |
Net increase(decrease) in net assets from fund share transactions | | | (307,492,077 | ) | | | (150,571,571 | ) |
| | | | | | | | | |
Total increase(decrease) in net assets | | | (258,487,365 | ) | | | (631,165,000 | ) |
| | | | | | | | | |
Net Assets: | | | | | | | | |
Beginning of year | | | 7,953,797,721 | | | | 8,584,962,721 | |
| | | | | | | | | |
End of year | | $ | 7,695,310,356 | | | $ | 7,953,797,721 | |
| | | | | | | | | |
Undistributed net investment income (loss) included in net assets at end of year | | $ | 7,423,480 | | | $ | (3,136,643 | ) |
| | | | | | | | |
See Notes to Financial Statements
| | | | | | |
| | Longleaf Partners Funds | | ¡ | | 27 |
| | | | | | | | | | | | | | |
| Small-Cap Fund | | | International Fund | |
| Year Ended December 31, | | | Year Ended December 31, | |
| 2012 | | | 2011 | | | 2012 | | | 2011 | |
| | | | | | | | | | | | | | |
| | | | | | | | | | | | | | | |
| $ | 2,321,218 | | | $ | 98,864 | | | $ | 27,368,888 | | | $ | 21,768,704 | |
| | | | | | | | | | | | | | | |
| | 309,509,649 | | | | 350,392,188 | | | | (54,314,053 | ) | | | 149,934,671 | |
| | | | | | | | | | | | | | | |
| 362,423,458 | | | | (283,884,938 | ) | | | 316,859,330 | | | | (597,979,448 | ) |
| | | | | | | | | | | | | | | |
| | 674,254,325 | | | | 66,606,114 | | | | 289,914,165 | | | | (426,276,073 | ) |
| | | | | | | | | | | | | | | |
| | | | | | | | | | | | | | |
| | | | | | | | | | | | | | | |
| | (2,321,218 | ) | | | (563,683 | ) | | | (25,376,933 | ) | | | (22,229,266 | ) |
| | | | | | | | | | | | | | | |
| | (230,227,027 | ) | | | (201,415,748 | ) | | | (14,628,946 | ) | | | (21,925,881 | ) |
| | | | | | | | | | | | | | | |
| | (232,548,245 | ) | | | (201,979,431 | ) | | | (40,005,879 | ) | | | (44,155,147 | ) |
| | | | | | | | | | | | | | | |
| | | | | | | | | | | | | | |
| | | | | | | | | | | | | | | |
| | 301,300,827 | | | | 427,610,605 | | | | 105,464,130 | | | | 206,166,812 | |
| | | | | | | | | | | | | | | |
| | 215,308,384 | | | | 193,894,454 | | | | 36,026,754 | | | | 41,254,624 | |
| | | | | | | | | | | | | | | |
| | (611,339,157 | ) | | | (505,015,279 | ) | | | (458,515,934 | ) | | | (417,024,348 | ) |
| | | | | | | | | | | | | | | |
| | (94,729,946 | ) | | | 116,489,780 | | | | (317,025,050 | ) | | | (169,602,912 | ) |
| | | | | | | | | | | | | | | |
| | 346,976,134 | | | | (18,883,537 | ) | | | (67,116,764 | ) | | | (640,034,132 | ) |
| | | | | | | | | | | | | | | |
| | | | | | | | | | | | | | |
| | 3,037,823,368 | | | | 3,056,706,905 | | | | 1,571,156,435 | | | | 2,211,190,567 | |
| | | | | | | | | | | | | | | |
| $ | 3,384,799,502 | | | $ | 3,037,823,368 | | | $ | 1,504,039,671 | | | $ | 1,571,156,435 | |
| | | | | | | | | | | | | | | |
| $ | – | | | $ | – | | | $ | 2,051,383 | | | $ | (96,465 | ) |
| | | | | | | | | | | | | | | |
See Notes to Financial Statements
| | |
| Notes to Financial Statements | | |
Note 1. Organization
Longleaf Partners Fund, Longleaf Partners Small-Cap Fund, and Longleaf Partners International Fund (the “Funds”) are non-diversified and each is a series of Longleaf Partners Funds Trust, a Massachusetts business trust, which is registered as an open-end management investment company under the Investment Company Act of 1940, as amended.
Note 2. Significant Accounting Policies
Management Estimates
The accompanying financial statements are prepared in accordance with accounting principles generally accepted in the United States of America; these principles may require the use of estimates by Fund management. Actual results could differ from those estimates.
Security Valuation
Portfolio securities listed or traded on a securities exchange (U.S. or foreign), on the NASDAQ national market, or any representative quotation system providing same day publication of actual prices, are valued at the last sale price. If there are no transactions in the security that day, securities are valued at the midpoint between the closing bid and ask prices or, if there are no such prices, the prior day’s close.
In the case of bonds and other fixed income securities, valuations may be furnished by a pricing service which takes into account factors in addition to quoted prices (such as trading characteristics, yield, quality, coupon rate, maturity, type of issue, and other market data relating to the priced security or other similar securities) where taking such factors into account would lead to a more accurate reflection of the fair market value of such securities.
When market quotations are not readily available, valuations of portfolio securities may be determined in accordance with procedures established by and under the general supervision of the Funds’ Trustees. In determining fair value, the Board considers relevant qualitative and quantitative information including news regarding significant market or security specific events. The Board may also utilize a service provided by an independent third party to assist in fair valuation of certain securities. These factors are subject to change over time and are reviewed periodically. Because the utilization of fair value depends on market activity, the frequency with which fair valuation may be used cannot be predicted. Estimated values may differ from the values that would have been used had a ready market for the investment existed.
Repurchase agreements are valued at cost which, combined with accrued interest, approximates market value. Short-term U.S. Government obligations purchased with a remaining maturity of more than 60 days are valued through pricing obtained through pricing services approved by the Funds’ Trustees. Obligations purchased with a remaining maturity of 60 days or less or existing positions that have less than 60 days to maturity generally are valued at amortized cost, which approximates market value. However, if amortized cost is deemed not to reflect fair value, the securities are valued at prices furnished by dealers who make markets in such securities or by an independent pricing service.
The Funds determine net asset values (“NAVs”) once a day, at the close of regular trading on the New York Stock Exchange (“Exchange”) (usually at 4:00 p.m. Eastern time) on days the Exchange is open for business. The Exchange is closed for specified national holidays and on weekends. Foreign securities are generally priced at the latest market close in the foreign market, which may be at different times or days than the close of the Exchange. If events occur which could materially affect the NAV between the close of the foreign market and normal pricing at the close of the Exchange, foreign securities may be fair valued as determined by the Board of Trustees, consistent with any regulatory guidelines.
| | | | | | |
| | Longleaf Partners Funds | | ¡ | | 29 |
Accounting for Investments
For financial reporting purposes, the Funds record security transactions on trade date. Realized gains and losses on security transactions are determined using the specific identification method. Dividend income is recognized on the ex-dividend date, except that certain dividends from foreign securities are recorded as soon after the ex-dividend date as the Fund is able to obtain information on the dividend. Interest income and Fund expenses are recognized on an accrual basis.
Distributions to Shareholders
Dividends and distributions to shareholders are recorded on the ex-dividend date.
Federal Income Taxes
The Funds’ policy is to comply with the requirements of the Internal Revenue Code that are applicable to regulated investment companies and to distribute substantially all taxable income to shareholders. Accordingly, no federal income tax provision is required. The Funds intend to make any required distributions to avoid the application of a 4% nondeductible excise tax. Distributions are determined in accordance with income tax regulations which may differ from generally accepted accounting principles. Reclassifications are made within the Funds’ capital accounts to reflect income and gains available for distribution under income tax regulations.
Foreign Currency Translations
The books and records of the Funds are maintained in U.S. dollars. Securities denominated in currencies other than U.S. dollars are subject to changes in value due to fluctuations in exchange rates. Purchases and sales of securities and income and expenses are translated into U.S. dollars at the prevailing exchange rate on the respective date of each transaction. The market values of investment securities, assets and liabilities are translated into U.S. dollars daily.
The Funds do not isolate the portion of net realized and unrealized gains or losses in equity security investments which are attributable to changes in foreign exchange rates. Accordingly, the impact of such changes is included in the realized and unrealized gains or losses on the underlying equity securities.
Repurchase Agreements
The Funds may engage in repurchase agreement transactions. The Fixed Income Clearing Corporation (“FICC”) sells U.S. government or agency securities to each Fund under agreements to repurchase these securities at a stated repurchase price including interest for the term of the agreement, which is usually overnight or over a weekend. Each Fund, through FICC, receives delivery of the underlying U.S. government or agency securities as collateral, whose market value is required to be at least equal to the repurchase price. If FICC becomes bankrupt, the Fund might be delayed, or may incur costs or possible losses of principal and income, in selling the collateral.
When-Issued Securities
The Funds may trade on a when-issued basis when a security has been authorized but not yet issued. In a when-issued transaction, securities are purchased or sold but delivery or settlement is delayed until the underlying stock is issued. Transactions in when-issued securities are subject to market fluctuations and risk of loss prior to settlement. Their value is determined in the same manner as other securities.
Options
The Funds may purchase and sell (“write”) call and put options on various instruments including securities to gain long or short exposure to the underlying instruments.
An option contract gives the buyer the right, but not the obligation, to buy(call) or sell(put) an underlying item at a fixed exercise price on a certain date or during a specified period. The cost of
| | |
| Notes to Financial Statements | | |
securities acquired through the exercise of a call option is increased by the premiums paid. The proceeds from securities sold through the exercise of a purchased put option are decreased by the premiums paid. The cost of purchased options that expire unexercised are treated by the Funds, on expiration date, as realized losses on investments.
When the Funds write an option, an amount equal to the premium received by the Funds is recorded as a liability and is subsequently adjusted to the current fair value of the option written. Premiums received from writing options that expire unexercised are treated by the Funds, on the expiration date, as realized gains on written options. The difference between the premium and the amount paid on effecting a closing transaction, including brokerage commissions, is also treated as a realized gain, or, if the premium is less than the amount paid for the closing transaction, as a realized loss. If a call option is exercised, the premium is added to the proceeds from the sale of the underlying security in determining whether the Funds have a realized gain or loss. If a put option is exercised, the premium reduces the cost basis of the security purchased by the Funds.
The current market value of an exchange traded option is the last sales price. Over-the-counter options are valued in accordance with fair value procedures established by and under the general supervision of the Funds’ Trustees.
Risk of Options
Gains on investment in options may depend on correctly predicting the market value direction of the underlying security. There can be no assurance that a liquid market will exist when a Fund seeks to close out an option position and a Fund may experience losses as a result of such illiquidity. Listed options involve minimal counter-party risk since listed options are guaranteed against default by the exchange on which they trade. When purchasing over-the-counter (OTC) options, the Funds bear the risk of economic loss from counterparty default, equal to the market value of the option.
Swap Contracts
The Funds may enter into swap contracts for purposes of pursuing their investment objectives or as a substitute for investing directly in securities (or shorting securities), or to hedge a position. Swaps are two-party contracts entered into primarily by institutional investors for periods ranging from a day to more than one year. In a standard swap transaction, two parties agree to exchange the returns (or differentials in rates of return) earned or realized on particular predetermined investments or instruments. The gross returns to be exchanged between the parties is calculated with respect to a “notional amount,” for example, the return on or increase in value of a particular dollar amount invested in a basket of securities. Most swap contracts entered into by the Funds calculate and settle the obligations of the parties to the agreement on a “net basis” with a single payment. Consequently, a Fund’s current obligations (or rights) under a swap agreement will generally be equal only to the net amount to be paid or received under the agreement based on the relative values of such obligations (or rights). A Fund’s current obligations under a swap agreement will be accrued daily, offset against any amounts owed to the Fund.
The market value of a swap contract is determined by marking the underlying security (securities) to their last quoted value at the close of the NYSE, usually 4:00 p.m., Eastern Time. The swap’s market value is then adjusted to accrue dividend or interest income, financing charges and/or other economic terms associated with the contract.
Risk of Swaps
Swap contracts involve, to varying degrees, elements of market risk and exposure to loss in excess of the amount reflected in the Statement of Assets and Liabilities. The notional amounts reflect the extent of the total investment exposure each Fund has under the swap contract. The primary risks associated with the
| | | | | | |
| | Longleaf Partners Funds | | ¡ | | 31 |
use of swaps are imperfect correlation between movements in the notional amount and the price of the underlying investments and the inability of counterparties to perform. A Fund bears the risk of loss of the amount expected to be received under a swap contract in the event of the default or bankruptcy of a swap counterparty.
Forward Currency Contracts
Forward currency contracts are commitments to purchase or sell a foreign currency at a future maturity date at a prespecified price. The resulting obligation is marked-to-market daily using foreign currency exchange rates supplied by an independent pricing service. An unrealized gain or loss is recorded for the difference between the contract opening value and its current value. When a contract is closed or delivery is taken, this gain or loss is realized. For federal tax purposes, gain or loss on open forward contracts in qualifying currencies are treated as realized and are subject to distribution at our excise tax year-end date.
Risk of Forward Currency Contracts
The Funds may use forward currency contracts for hedging purposes to offset currency exposure in portfolio holdings, although they have ceased doing so as a routine practice. Forward contracts may reduce the potential gain from a positive change in the relationship between the U.S. dollar and foreign currencies or, considered separately, may produce a loss. Not all foreign currencies can be effectively hedged; and the costs of hedging may outweigh the benefits. If our hedging strategy does not correlate well with market and currency movements, price volatility of the portfolio could increase. Where a liquid secondary market for forwards does not exist, the Funds may not be able to close their positions and in such an event, the loss is theoretically unlimited. In addition, the Funds could be exposed to risks if the counterparty to these contracts is unable to perform.
Counterparty Risk and Collateral
The Funds have entered in to collateral agreements with counterparties to mitigate risk on OTC derivatives. Collateral is generally determined based on the net unrealized gain or loss with each counterparty, subject to minimum exposure amounts. Collateral, both pledged by and for the benefit of a Fund, is held in a segregated account at the Funds’ custodian bank and comprised of assets specific to each agreement. See Note 13, “Counterparty Risk and Credit-Risk-Related Contingent Features on Derivative Instruments,” for additional information.
Note 3. Investment Counsel Agreement
Southeastern Asset Management, Inc. (“Southeastern”) serves as Investment Counsel to the Funds and receives annual compensation, computed daily and paid monthly, in accordance with the following schedule for the Partners Fund and Small-Cap Fund:
| | | | |
First $400 million of average daily net assets | | | 1.00% | |
| | | | | |
In excess of $400 million | | | .75% | |
| | | | | |
For the Partners and Small-Cap Funds, Southeastern has agreed to reduce its fees on a pro rata basis to the extent that each Fund’s normal annual operating expenses (excluding taxes, interest, brokerage fees, and extraordinary expenses) exceed 1.5% of average annual net assets. No such reductions were necessary for the current year.
The International Fund fee is calculated in accordance with the following schedule:
| | | | |
First $500 million of average daily net assets | | | 1.20% | |
| | | | | |
In excess of $500 million | | | 1.00% | |
| | | | | |
For this Fund, Southeastern has agreed to reduce its fees on a pro rata basis to the extent that the Fund’s normal annual operating expenses (excluding taxes, interest, brokerage fees, and extraordinary expenses) exceed 1.75% of average annual net assets. No reduction was necessary for the current year.
| | |
| Notes to Financial Statements | | |
Note 4. Fund Administrator
Southeastern also serves as the Fund Administrator and in this capacity is responsible for managing, performing or supervising the administrative and business operations of the Funds. Functions include the preparation of all registration statements, prospectuses, proxy statements, and oversight of daily valuation of the portfolios and calculation of daily net asset values per share. The Funds pay a fee as compensation for these services, accrued daily and paid monthly, of 0.10% per annum of average daily net assets.
Note 5. Investment Transactions
Purchases and sales of equity securities, purchased options and corporate bonds for the period (excluding short-term obligations) are summarized below:
| | | | | | | | |
| | | Purchases | | | Sales | |
Partners Fund | | $ | 1,955,633,760 | | | $ | 3,442,840,286 | |
| | | | | | | | | |
Small-Cap Fund | | | 445,251,804 | | | | 1,008,766,819 | |
| | | | | | | | | |
International Fund | | | 313,816,842 | | | | 704,758,472 | |
| | | | | | | | | |
Written options not included in the above purchase and sales transactions for the Funds include:
| | | | | | | | | | | | | | | | | | | | | | | | |
| | | Partners Fund | | | Small-Cap Fund | | | International Fund | |
| | | Share
Equivalents | | | Premiums | | | Share
Equivalents | | | Premiums | | | Share
Equivalents | | | Premiums | |
Options outstanding at December 31, 2011 | | | 5,100,000 | | | $ | 43,586,993 | | | | – | | | $ | – | | | | 7,676,800 | | | $ | 39,269,413 | |
| | | | | | | | | | | | | | | | | | | | | | | | | |
Options written | | | 13,400,000 | | | | 46,735,451 | | | | 3,737,800 | | | | 7,741,609 | | | | 2,200,000 | | | | 2,800,930 | |
| | | | | | | | | | | | | | | | | | | | | | | | | |
Options closed | | | (18,500,000 | ) | | | (90,322,444 | ) | | | (3,737,800 | ) | | | (7,741,609 | ) | | | (2,400,000 | ) | | | (11,907,934 | ) |
| | | | | | | | | | | | | | | | | | | | | | | | | |
Options expired | | | – | | | | – | | | | – | | | | – | | | | (1,000,000 | ) | | | (1,146,345 | ) |
| | | | | | | | | | | | | | | | | | | | | | | | | |
Options outstanding at December 31, 2012 | | | – | | | $ | – | | | | – | | | $ | – | | | | 6,476,800 | | | $ | 29,016,064 | |
| | | | | | | | | | | | | | | | | | | | | | | | | |
Note 6. Shares of Beneficial Interest
Each Fund is authorized to issue unlimited shares of beneficial interest with no par value. Transactions in shares of beneficial interest were as follows:
| | | | | | | | | | | | |
| | | Year Ended December 31, 2012 | |
| | | Partners
Fund | | | Small-Cap
Fund | | | International
Fund | |
Shares sold | | | 22,820,434 | | | | 10,779,942 | | | | 8,434,480 | |
| | | | | | | | | | | | | |
Reinvestment of shareholder distributions | | | 43,079,454 | | | | 7,791,685 | | | | 2,639,352 | |
| | | | | | | | | | | | | |
Shares redeemed | | | (72,791,079 | ) | | | (21,748,786 | ) | | | (35,954,602 | ) |
| | | | | | | | | | | | | |
| | | (6,891,191 | ) | | | (3,177,159 | ) | | | (24,880,770 | ) |
| | | | | | | | | | | | |
| |
| | | Year Ended December 31, 2011 | |
| | | Partners
Fund | | | Small-Cap
Fund | | | International
Fund | |
Shares sold | | | 37,051,826 | | | | 15,826,295 | | | | 14,413,196 | |
| | | | | | | | | | | | | |
Reinvestment of shareholder distributions | | | 8,350,296 | | | | 7,612,936 | | | | 3,359,981 | |
| | | | | | | | | | | | | |
Shares redeemed | | | (50,707,810 | ) | | | (18,299,542 | ) | | | (29,944,582 | ) |
| | | | | | | | | | | | | |
| | | (5,305,688 | ) | | | 5,139,689 | | | | (12,171,405 | ) |
| | | | | | | | | | | | |
| | | | | | |
| | Longleaf Partners Funds | | ¡ | | 33 |
Note 7. Affiliated Issuer
Under Section 2(a)(3) of the Investment Company Act of 1940, a portfolio company is defined as “affiliated” if a Fund owns five percent or more of its voting stock during all or part of the period.
| | | | | | | | | | | | |
| | | Shares(a) at December 31,
2012 | | | Market Value at | |
| | | | December 31,
2012 | | | December 31,
2011 | |
Partners Fund | | | | | | | | | | | | |
| | | | | | | | | | | | | |
CONSOL Energy Inc. | | | 12,583,000 | | | $ | 403,914,300 | | | $ | – | |
| | | | | | | | | | | | | |
InterContinental Hotels Group PLC(e) | | | – | | | | – | | | | 344,034,658 | |
| | | | | | | | | | | | | |
InterContinental Hotels Group PLC ADR(e) | | | – | | | | – | | | | 23,949,098 | |
| | | | | | | | | | | | | |
Level(3) Communications, Inc.* | | | 15,026,565 | | | | 347,263,917 | | | | 162,754,618 | |
| | | | | | | | | | | | | |
Level(3) Communications, Inc.
15% Convertible Senior Notes due 2013(e) | | | – | | | | – | | | | 115,696,688 | |
| | | | | | | | | | | | | |
Vulcan Materials Company | | | 7,138,603 | | | | 371,564,286 | | | | 421,206,728 | |
| | | | | | | | | | | | | |
| | | | | | | 1,122,742,503 | | | | 1,067,641,790 | |
| | | | | | | | | | | | |
Small-Cap Fund | | | | | | | | | | | | |
| | | | | | | | | | | | | |
Dillards, Inc. – Class A(e) | | | – | | | | – | | | | 123,617,472 | |
| | | | | | | | | | | | | |
DineEquity, Inc.* | | | 2,511,331 | | | | 168,259,177 | | | | 125,705,601 | |
| | | | | | | | | | | | | |
Potlatch Corporation(e) | | | 1,365,200 | | | | 53,502,188 | | | | 83,653,297 | |
| | | | | | | | | | | | | |
Quicksilver Resources Inc.* | | | 24,587,000 | | | | 70,318,820 | | | | 116,371,530 | |
| | | | | | | | | | | | | |
Quicksilver Resources Inc.,
7.125% Senior Notes due 4/1/16 | | | 14,562,000 | | | | 11,722,410 | | | | – | |
| | | | | | | | | | | | | |
Saks Incorporated* | | | 14,448,500 | | | | 151,853,735 | | | | 139,464,000 | |
| | | | | | | | | | | | | |
Saks Incorporated,
7.5% Convertible Notes due 12/1/13 | | | 14,051,000 | | | | 26,635,427 | | | | – | |
| | | | | | | | | | | | | |
Service Corporation International | | | 12,111,900 | | | | 167,265,339 | | | | 185,858,720 | |
| | | | | | | | | | | | | |
Texas Industries, Inc.* | | | 7,510,757 | | | | 383,123,714 | | | | 231,181,100 | |
| | | | | | | | | | | | | |
tw telecom, inc.*(e) | | | 5,382,000 | | | | 137,079,540 | | | | 216,088,938 | |
| | | | | | | | | | | | | |
Vail Resorts, Inc. | | | 3,317,000 | | | | 179,416,530 | | | | 140,508,120 | |
| | | | | | | | | | | | | |
The Washington Post Company – Class B | | | 428,000 | | | | 156,309,880 | | | | 108,898,090 | |
| | | | | | | | | | | | | |
The Wendy’s Company | | | 27,967,000 | | | | 131,444,900 | | | | 149,313,520 | |
| | | | | | | | | | | | | |
| | | | | | | 1,636,931,660 | | | | 1,620,660,388 | |
| | | | | | | | | | | | |
International Fund | | | | | | | | | | | | |
| | | | | | | | | | | | | |
Manabi Holding S.A.* | | | 91,000 | | | | 113,211,111 | | | | 61,510,682 | |
| | | | | | | | | | | | | |
Melco International Development Limited(e) | | | 71,686,000 | | | | 85,108,753 | | | | 38,739,073 | |
| | | | | | | | | | | | | |
| | | | | | $ | 198,319,864 | | | $ | 100,249,755 | |
| | | | | | | | | | | | |
| | |
| Notes to Financial Statements | | |
| | | | | | | | | | | | |
| | | Purchases | | | Sales | | | Dividend or
Interest Income(c) | |
Partners Fund | | | | | | | | | | | | |
| | | | | | | | | | | | | |
CONSOL Energy Inc. | | $ | 404,777,180 | | | $ | – | | | $ | 5,760,504 | |
| | | | | | | | | | | | | |
InterContinental Hotels Group PLC(e) | | | – | | | | 474,388,509 | | | | 18,069,660 | |
| | | | | | | | | | | | | |
InterContinental Hotels Group PLC ADR(e) | | | – | | | | 32,368,373 | | | | 544,903 | |
| | | | | | | | | | | | | |
Level(3) Communications, Inc.* | | | 102,536,060 | (b) | | | – | | | | – | |
| | | | | | | | | | | | | |
Level(3) Communications, Inc.
15% Convertible Senior Notes due 2013(e) | | | – | | | | 102,536,060 | (b) | | | 3,045,066 | (d) |
| | | | | | | | | | | | | |
Vulcan Materials Company | | | – | | | | 178,824,478 | | | | 416,482 | |
| | | | | | | | | | | | | |
| | | 507,313,240 | | | | 788,117,420 | | | | 27,836,615 | |
| | | | | | | | | | | | |
Small-Cap Fund | | | | | | | | | | | | |
| | | | | | | | | | | | | |
Dillards, Inc. – Class A(e) | | | – | | | | 187,123,566 | | | | 126,300 | |
| | | | | | | | | | | | | |
DineEquity, Inc.* | | | – | | | | 29,314,907 | | | | – | |
| | | | | | | | | | | | | |
Potlatch Corporation(e) | | | 2,334,988 | | | | 54,691,750 | | | | – | |
| | | | | | | | | | | | | |
Quicksilver Resources Inc.* | | | 34,984,102 | | | | – | | | | – | |
| | | | | | | | | | | | | |
Quicksilver Resources Inc.,
7.125% Senior Notes due 4/1/16 | | | 11,408,575 | | | | – | | | | 774,885 | (d) |
| | | | | | | | | | | | | |
Saks Incorporated* | | | 8,521,129 | | | | 8,292,311 | | | | – | |
| | | | | | | | | | | | | |
Saks Incorporated
7.5% Convertible Notes due 12/1/13 | | | 26,817,806 | | | | – | | | | 36,872 | (d) |
| | | | | | | | | | | | | |
Service Corporation International | | | – | | | | 73,642,166 | | | | 4,524,468 | |
| | | | | | | | | | | | | |
Texas Industries, Inc.* | | | – | | | | – | | | | – | |
| | | | | | | | | | | | | |
tw telecom, inc.*(e) | | | – | | | | 136,145,638 | | | | – | |
| | | | | | | | | | | | | |
Vail Resorts, Inc. | | | – | | | | – | | | | 2,487,750 | |
| | | | | | | | | | | | | |
The Washington Post Company – Class B | | | 49,304,540 | | | | – | | | | 7,806,895 | |
| | | | | | | | | | | | | |
The Wendy’s Company | | | 474,100 | | | | – | | | | 2,790,100 | |
| | | | | | | | | | | | | |
| | | 133,845,240 | | | | 489,210,338 | | | | 18,547,270 | |
| | | | | | | | | | | | |
International Fund | | | | | | | | | | | | |
| | | | | | | | | | | | | |
Manabi Holding S.A.* | | | – | | | | – | | | | – | |
| | | | | | | | | | | | | |
Melco International Development Limited(e) | | | 14,840,221 | | | | – | | | | 100,782 | |
| | | | | | | | | | | | | |
| | $ | 14,840,221 | | | $ | – | | | $ | 100,782 | |
| | | | | | | | | | | | |
| (a) | Common stock unless otherwise noted. |
| (b) | Convertible notes exchanged for common stock. |
| (c) | Dividend income unless otherwise noted. |
| (e) | Not an afffiliate at the end of the period. |
Note 8. Illiquid Securities
The International Fund owns 91,000 shares of Manabi Holding S.A. These shares were acquired directly from the issuer in a private placement. They are considered restricted securities within the meaning of Rule 144 promulgated under the Securities Act of 1933. Prior to an initial public offering, shares are subject to other selling restrictions such as a right of first offer for the benefit of other shareholders.
| | | | | | |
| | Longleaf Partners Funds | | ¡ | | 35 |
Further, upon an initial public offering, it is anticipated that the shares will be subject to a post-offering lock up period as required by underwriters, the BM&FBOVESPA or Brazil’s CVM. Due to the lack of an active trading market, all or a portion of this position may be illiquid. Judgement plays a greater role in valuing illiquid securities than those for which a more active market exists. These shares represent 7.5% of the International Fund’s net assets at December 31, 2012 and are valued using procedures adopted by the Board of Trustees (See Note 2).
Note 9. Collateral
Securities and cash with the following aggregate value were designated to collateralize forward contracts and options at December 31, 2012.
| | | | |
| | | | | |
International Fund | | $ | 199,257,600 | |
| | | | | |
Note 10. Related Ownership
At December 31, 2012, officers, employees of Southeastern and their families, Fund trustees, the Southeastern retirement plan and other affiliates owned more than 5% of the following Funds:
| | | | | | | | |
| | | Shares Owned | | | Percent of Fund | |
Partners Fund | | | 20,675,960 | | | | 7.1 | % |
| | | | | | | | | |
Small-Cap Fund | | | 10,523,647 | | | | 9.0 | |
| | | | | | | | | |
International Fund | | | 22,261,814 | | | | 20.8 | |
| | | | | | | | | |
Note 11. Fair Value Measurements and Disclosures
FASB ASC 820 established a single definition of fair value for financial reporting, created a three-tier framework for measuring fair value based on inputs used to value the Funds’ investments, and required additional disclosure about the use of fair value measurements. The hierarchy of inputs is summarized below.
| | • | | Level 1 – quoted prices in active markets for identical investments |
| | • | | Level 2 – other significant observable inputs (including quoted prices for similar investments, interest rates, prepayment speeds, credit risk, etc.) |
| | • | | Level 3 – significant unobservable inputs (including the Funds’ own assumptions in determining the fair value of investments) |
Observable inputs are those based on market data obtained from sources independent of the Funds’, and unobservable inputs reflect the Funds’ own assumptions based on the best information available. The input levels are not necessarily an indication of risk or liquidity associated with investing in those securities.
| | |
| Notes to Financial Statements | | |
A summary of the inputs used in valuing the Funds’ net assets as December 31, 2012 follows:
| | | | | | | | | | | | | | | | |
| | | Level 1 | | | Level 2 | | | Level 3 | | | Total Value | |
Partners Fund | | | | | | | | | | | | | | | | |
| | | | | | | | | | | | | | | | | |
Common Stocks | | $ | 6,176,432,496 | | | $ | 394,133,408 | | | $ | – | | | $ | 6,570,565,904 | |
| | | | | | | | | | | | | | | | | |
Preferred Stocks | | | – | | | | 91,122,563 | | | | – | | | | 91,122,563 | |
| | | | | | | | | | | | | | | | | |
Corporate Bonds | | | – | | | | 382,324,313 | | | | – | | | | 382,324,313 | |
| | | | | | | | | | | | | | | | | |
Options Purchased | | | – | | | | 106,500,000 | | | | – | | | | 106,500,000 | |
| | | | | | | | | | | | | | | | | |
Short-Term Obligations | | | 717,810,500 | | | | – | | | | – | | | | 717,810,500 | |
| | | | | | | | | | | | | | | | | |
Securities Sold Short | | | (154,231,273 | ) | | | – | | | | – | | | | (154,231,273 | ) |
| | | | | | | | | | | | | | | | | |
Total | | | 6,740,011,723 | | | | 974,080,284 | | | | – | | | | 7,714,092,007 | |
| | | | | | | | | | | | | | | | |
Small-Cap Fund | | | | | | | | | | | | | | | | |
| | | | | | | | | | | | | | | | | |
Common Stocks | | | 2,977,166,862 | | | | – | | | | – | | | | 2,977,166,862 | |
| | | | | | | | | | | | | | | | | |
Corporate Bonds | | | – | | | | 38,357,837 | | | | – | | | | 38,357,837 | |
| | | | | | | | | | | | | | | | | |
Short-Term Obligations | | | 354,572,770 | | | | – | | | | – | | | | 354,572,770 | |
| | | | | | | | | | | | | | | | | |
Total | | | 3,331,739,632 | | | | 38,357,837 | | | | | | | | 3,370,097,469 | |
| | | | | | | | | | | | | | | | |
International Fund | | | | | | | | | | | | | | | | |
| | | | | | | | | | | | | | | | | |
Common Stocks | | | 242,603,047 | | | | 911,177,164 | | | | 113,211,111 | | | | 1,266,991,322 | |
| | | | | | | | | | | | | | | | | |
Corporate Bonds | | | – | | | | 84,129,555 | | | | – | | | | 84,129,555 | |
| | | | | | | | | | | | | | | | | |
Options Purchased | | | – | | | | 9,856,394 | | | | – | | | | 9,856,394 | |
| | | | | | | | | | | | | | | | | |
Options Written | | | – | | | | (42,855,690 | ) | | | – | | | | (42,855,690 | ) |
| | | | | | | | | | | | | | | | | |
Short-Term Obligations | | | 139,901,965 | | | | – | | | | – | | | | 139,901,965 | |
| | | | | | | | | | | | | | | | | |
Swaps Contracts | | | – | | | | 23,765,307 | | | | – | | | | 23,765,307 | |
| | | | | | | | | | | | | | | | | |
Forward Currency Contracts | | | 1,160,596 | | | | – | | | | – | | | | 1,160,596 | |
| | | | | | | | | | | | | | | | | |
Total | | $ | 383,665,608 | | | $ | 986,072,730 | | | $ | 113,211,111 | | | $ | 1,482,949,449 | |
| | | | | | | | | | | | | | | | |
Certain foreign securities are fair valued by utilizing an external pricing service in the event of any significant market movements between the time the Funds value such foreign securities and the earlier closing of foreign markets. Such fair valuations are categorized as Level 2 in the hierarchy. Between December 31, 2011 and December 31, 2012, application of these valuation procedures triggered reclassification from Level 1 to Level 2 of $394,133,408, $0 and $911,177,164 in the Partners, Small-Cap and International Funds, respectively.
For Level 3 securities, the Funds use valuation techniques to measure fair value that are consistent with the market approach. The market approach uses prices and other relevant information generated by market transactions involving comparable securities or related indices.
The following is a reconciliation of Level 3 holdings for which significant unobservable inputs were used in determining fair value as of December 31, 2012:
| | | | |
| Level 3 Holdings | | International Fund | |
Fair value beginning of period | | $ | 61,510,682 | |
| | | | | |
Unrealized gain | | | 51,700,429 | |
| | | | | |
Fair value at December 31, 2012 | | $ | 113,211,111 | |
| | | | | |
| | | | | | |
| | Longleaf Partners Funds | | ¡ | | 37 |
Note 12. Derivative Instruments
The Funds invested in options, swaps and forward contracts. Footnote 2, ‘Significant Accounting Policies,” contains additional information regarding the risks of these derivatives.
Options
The Funds use options in several ways:
| | • | | Written covered calls create an exit method for all or a portion of an underlying security position for portfolio management purposes; |
| | • | | Purchased call options secure upside exposure to the underlying security at low implied long-term interest rates. The maximum loss exposure is the premium paid for the options. |
| | • | | Purchased call options are sometimes used in tandem with written put options, to create long synthetic exposure to the underlying security. |
With both purchased call options (sometimes in tandem with written put options) the Funds get exposure to the stock without tying up cash.
Swap Contracts
Swap contracts are used to create exposure to the underlying notional value of a stock or bond position. Swap contracts may be done to free up cash or to access markets or short positions more efficiently than otherwise possible.
Forward Currency Contracts
Forward currency contracts are used on a limited basis to hedge embedded currency exposure related to a specific holding.
The following is a summary of the location of derivative instruments in the Funds’ financial statements at December 31, 2012:
| | | | | | | | | | |
| | | | | Statements of Assets and
Liabilities | |
| Derivative | | Location | | Partners Fund | | | International Fund | |
Options purchased | | Other securities, at market value | | $ | 106,500,000 | | | $ | 9,856,394 | |
| | | | | | | | | | | |
Options written | | Payable for options written | | | – | | | | (42,855,690 | ) |
| | | | | | | | | | | |
Swap contracts | | Receivable for swap contracts | | | – | | | | 23,765,307 | |
| | | | | | | | | | | |
Forward currency contracts | | Receivable for forward currency contracts | | | – | | | | 1,160,596 | |
| | | | | | | | | | | |
| | | | $ | 106,500,000 | | | $ | (8,073,393 | ) |
| | | | | | | | | | |
The Small-Cap fund held no derivatives at December 31, 2012.
| | |
| Notes to Financial Statements | | |
| | | | | | | | | | | | |
| | | Impact of Derivatives
on Statement of Operations | |
| | | PartnersFund | | | Small-Cap Fund | | | International Fund | |
Net realized gain: | | | | | | | | | | | | |
| | | | | | | | | | | | | |
Options purchased | | $ | 48,886,664 | | | $ | – | | | $ | 11,387,572 | |
| | | | | | | | | | | | | |
Options written | | | 25,296,641 | | | | 3,247,029 | | | | 6,786,142 | |
| | | | | | | | | | | | | |
Swap contracts | | | 71,956,532 | | | | – | | | | (8,205,834 | ) |
| | | | | | | | | | | | | |
Forward currency contracts | | | – | | | | – | | | | 4,668,385 | |
| | | | | | | | | | | | | |
| | | 146,139,837 | | | | 3,247,029 | | | | 14,636,265 | |
| | | | | | | | | | | | |
Change in unrealized appreciation(depreciation): | | | | | | | | | | | | |
| | | | | | | | | | | | | |
Options purchased | | | (145,751,006 | ) | | | – | | | | (27,422,561 | ) |
| | | | | | | | | | | | | |
Options written | | | (14,669,993 | ) | | | – | | | | (16,867,336 | ) |
| | | | | | | | | | | | | |
Swap contracts | | | (1,256,170 | ) | | | – | | | | 23,765,307 | |
| | | | | | | | | | | | | |
Forward currency contracts | | | – | | | | – | | | | 1,637,114 | |
| | | | | | | | | | | | | |
| | $ | (161,677,169 | ) | | $ | – | | | $ | (18,887,476 | ) |
| | | | | | | | | | | | |
For the period ended December 31, 2012 the average volume of derivative activities were as follows:
| | | | | | | | | | | | | | | | |
| | | Options
Purchased
Cost | | | Options
Written
Premuims | | | Swap
Contracts
Value | | | Forward
Currency Contracts
Unrealized | |
Partners Fund | | $ | 251,271,294 | | | $ | 30,370,526 | | | $ | 21,313,994 | | | $ | – | |
| | | | | | | | | | | | | | | | | |
Small-Cap Fund | | | – | | | | 1,075,654 | | | | – | | | | – | |
| | | | | | | | | | | | | | | | | |
International Fund | | | 40,301,447 | | | | 32,876,484 | | | | 7,894,720 | | | | (130,420 | ) |
| | | | | | | | | | | | | | | | | |
Note 13. Counterparty Risk and Credit-Risk-Related Contingent Features of Derivative Instruments
The Funds may invest in certain securities or engage in other transactions where the Funds are exposed to counterparty credit risk in addition to broader market risks. The Funds may face increased risk of loss in the event of default or bankruptcy by the counterparty or if the counterparty otherwise fails to meet its contractual obligations. The Funds’ investment manager attempts to mitigate counterparty risk by (i) periodically assessing the creditworthiness of its trading partners, (ii) monitoring and/or limiting the amount of its net exposure to each individual counterparty based on its assessment and (iii) requiring collateral from the counterparty for certain transactions. Market events and changes in overall economic conditions may impact the assessment of such counterparty risk by the investment manager. In addition, declines in the values of underlying collateral received may expose the Funds to increased risk of loss.
The Funds have entered into master agreements with its derivative counterparties that provide for general obligations, representations, agreements, collateral, events of default or termination and credit related contingent features. The credit related contingent features include, but are not limited to, a percentage decrease in the Fund’s net assets or NAV over a specified period of time. If these credit related contingent features were triggered, the derivatives counterparty could terminate the positions and demand payment or require additional collateral.
| | | | | | |
| | Longleaf Partners Funds | | ¡ | | 39 |
As of December 31, 2012, the International Fund held written options with credit related contingent features which had liability positions. If a contingent feature in the master agreement would have been triggered, the Fund could have been required to pay this amount to its counterparty. In addition, the Fund had posted securities and cash as collateral to cover the net liability of these options which could be used to reduce the required payments.
| | | | |
| | | International Fund | |
Liability for options written | | $ | 42,855,690 | |
| | | | | |
Collateral segregated for benefit of counterparty | | $ | 85,430,810 | |
| | | | | |
Note 14. Federal Income Taxes
Required fund distributions are based on income and capital gain amounts determined in accordance with federal income tax regulations, which differ from net investment income and realized gains recognized for financial reporting purposes. Accordingly, the character of distributions and composition of net assets for tax purposes differ from those reflected in the accompanying financial statements.
Distributions were designated subject to tax as follows:
| | | | | | | | | | | | |
| | | Year Ended December 31, 2012 | |
| | | Partners Fund | | | Small-Cap Fund | | | International Fund | |
Long-term capital gains | | $ | 1,038,433,238 | | | $ | 212,677,436 | | | $ | 14,628,946 | |
| | | | | | | | | | | | | |
Ordinary income | | | 158,551,347 | | | | 19,870,809 | | | | 25,376,933 | |
| | | | | | | | | | | | | |
| | $ | 1,196,984,585 | | | $ | 232,548,245 | | | $ | 40,005,879 | |
| | | | | | | | | | | | |
| |
| | | Year Ended December 31, 2011 | |
| | | Partners Fund | | | Small-Cap Fund | | | International Fund | |
Long-term capital gains | | $ | 203,712,541 | | | $ | 201,415,748 | | | $ | 16,184,835 | |
| | | | | | | | | | | | | |
Ordinary income | | | 38,097,173 | | | | 563,683 | | | | 27,970,312 | |
| | | | | | | | | | | | | |
| | $ | 241,809,714 | | | $ | 201,979,431 | | | $ | 44,155,147 | |
| | | | | | | | | | | | |
The tax-basis components of net assets at December 31, 2012 were as follows:
| | | | | | | | | | | | |
| | | Partners Fund | | | Small-Cap Fund | | | International Fund | |
Unrealized appreciation | | $ | 1,332,380,571 | | | $ | 810,884,990 | | | $ | 254,140,874 | |
| | | | | | | | | | | | | |
Unrealized depreciation | | | (1,187,996,674 | ) | | | (351,385,870 | ) | | | (263,234,605 | ) |
| | | | | | | | | | | | | |
Net unrealized appreciation(depreciation) | | | 144,383,897 | | | | 459,499,120 | | | | (9,093,731 | ) |
| | | | | | | | | | | | | |
Post Oct-31st loss deferred | | | (1,447,290 | ) | | | – | | | | – | |
| | | | | | | | | | | | | |
Undistributed ordinary income | | | 1,206,159 | | | | 13,611,898 | | | | 758,663 | |
| | | | | | | | | | | | | |
Undistributed long-term capital gains | | | 179,606,066 | | | | 68,229,087 | | | | – | |
| | | | | | | | | | | | | |
Tax loss carryforwards | | | – | | | | – | | | | (25,089,160 | ) |
| | | | | | | | | | | | | |
Paid-in capital | | | 7,371,561,524 | | | | 2,843,459,397 | | | | 1,537,463,899 | |
| | | | | | | | | | | | | |
| | $ | 7,695,310,356 | | | $ | 3,384,799,502 | | | $ | 1,504,039,671 | |
| | | | | | | | | | | | |
| | |
| Notes to Financial Statements | | |
During the year ended December 31, 2012, no capital loss carryforwards were used to offset capital gains. Long-term loss carryforwards are available for future years, as follows:
| | | | | | | | | | | | |
| | | Partners Fund | | | Small-Cap Fund | | | International Fund | |
Loss carryforwards (no expiration) | | $ | – | | | $ | – | | | $ | (25,089,160 | ) |
| | | | | | | | | | | | | |
The following permanent reclassifications were made between capital accounts to reflect the tax character of foreign currency transactions and distributions. These reclassifications did not affect results of operations or net assets.
| | | | | | | | | | | | |
| | | Partners Fund | | | Small-Cap Fund | | | International Fund | |
Undistributed net investment loss | | $ | 14,890,193 | | | $ | – | | | $ | 155,893 | |
| | | | | | | | | | | | | |
Accumulated net realized gain(loss) on
investments and foreign currency | | | (14,890,193 | ) | | | – | | | | 213,921 | |
| | | | | | | | | | | | | |
Paid-in capital | | | – | | | | – | | | | (369,814 | ) |
| | | | | | | | | | | | | |
The Funds’ tax returns are subject to examination by the relevant tax authorities until expiration of the applicable statute of limitations, which is generally three years after filing of the tax return but could be longer in certain circumstances. Management has analyzed the Funds’ tax positions taken on federal income tax returns for all open tax years (tax years ended December 31, 2009-2012), and has concluded that no provision for federal income tax is required in the Funds’ financial statements.
The presentation is for a share outstanding throughout each period.
| | | | | | | | | | | | | | | | | | | | | | | | |
| | | Net Asset
Value
Beginning
of Period | | | Net
Investment
Income | | | Net Gains
(Losses) on
Securities
Realized
and
Unrealized | | | Total
from
Investment
Operations | | | Dividends
from Net
Investment
Income | | | Distri-
butions
from
Capital
Gains | |
Partners Fund | | | | | | | | | | | | | | | | | | | | | | | | |
| | | | | | | | | | | | | | | | | | | | | | | | | |
Year Ended December 31, | | | | | | | | | | | | | | | | | | | | | | | | |
| | | | | | | | | | | | | | | | | | | | | | | | | |
2012 | | $ | 26.65 | | | $ | 0.31 | | | $ | 3.95 | | | $ | 4.26 | | | $ | (0.27 | ) | | $ | (4.25 | ) |
| | | | | | | | | | | | | | | | | | | | | | | | | |
2011 | | | 28.26 | | | | 0.11 | | | | (0.90 | ) | | | (0.79 | ) | | | (0.13 | ) | | | (0.69 | ) |
| | | | | | | | | | | | | | | | | | | | | | | | | |
2010 | | | 24.09 | | | | 0.07 | | | | 4.24 | | | | 4.31 | | | | (0.14 | ) | | | – | |
| | | | | | | | | | | | | | | | | | | | | | | | | |
2009 | | | 15.69 | | | | 0.06 | | | | 8.35 | | | | 8.41 | | | | (0.01 | ) | | | – | |
| | | | | | | | | | | | | | | | | | | | | | | | | |
2008 | | | 33.16 | | | | 0.03 | | | | (16.80 | ) | | | (16.77 | ) | | | (0.03 | ) | | | (0.67 | ) |
| | | | | | | | | | | | | | | | | | | | | | | | | |
Small-Cap Fund | | | | | | | | | | | | | | | | | | | | | | | | |
| | | | | | | | | | | | | | | | | | | | | | | | | |
Year Ended December 31, | | | | | | | | | | | | | | | | | | | | | | | | |
| | | | | | | | | | | | | | | | | | | | | | | | | |
2012 | | | 25.23 | | | | 0.03 | | | | 5.67 | | | | 5.70 | | | | (0.03 | ) | | | (2.02 | ) |
| | | | | | | | | | | | | | | | | | | | | | | | | |
2011 | | | 26.52 | | | | – | | | | 0.49 | | | | 0.49 | | | | (0.01 | ) | | | (1.77 | ) |
| | | | | | | | | | | | | | | | | | | | | | | | | |
2010 | | | 21.77 | | | | 0.03 | | | | 4.83 | | | | 4.86 | | | | (0.11 | ) | | | – | |
| | | | | | | | | | | | | | | | | | | | | | | | | |
2009 | | | 14.58 | | | | 0.08 | | | | 7.11 | | | | 7.19 | | | | – | | | | – | |
| | | | | | | | | | | | | | | | | | | | | | | | | |
2008 | | | 27.04 | | | | 0.08 | | | | (11.97 | ) | | | (11.89 | ) | | | (0.08 | ) | | | (0.44 | ) |
| | | | | | | | | | | | | | | | | | | | | | | | | |
International Fund | | | | | | | | | | | | | | | | | | | | | | | | |
| | | | | | | | | | | | | | | | | | | | | | | | | |
Year Ended December 31, | | | | | | | | | | | | | | | | | | | | | | | | |
| | | | | | | | | | | | | | | | | | | | | | | | | |
2012 | | | 11.90 | | | | 0.26 | | | | 2.25 | | | | 2.51 | | | | (0.24 | ) | | | (0.13 | ) |
| | | | | | | | | | | | | | | | | | | | | | | | | |
2011 | | | 15.34 | | | | 0.17 | | | | (3.28 | ) | | | (3.11 | ) | | | (0.17 | ) | | | (0.16 | ) |
| | | | | | | | | | | | | | | | | | | | | | | | | |
2010 | | | 13.66 | | | | 0.12 | | | | 1.75 | | | | 1.87 | | | | (0.19 | ) | | | – | |
| | | | | | | | | | | | | | | | | | | | | | | | | |
2009 | | | 11.09 | | | | 0.07 | | | | 2.50 | | | | 2.57 | | | | – | | | | – | |
| | | | | | | | | | | | | | | | | | | | | | | | | |
2008 | | | 19.78 | | | | 0.04 | | | | (7.93 | ) | | | (7.89 | ) | | | (0.04 | ) | | | (0.74 | ) |
| | | | | | | | | | | | | | | | | | | | | | | | | |
| (a) | Total return reflects the rate that an investor would have earned on investment in the Fund during each period, assuming reinvestment of all distributions. |
| | | | | | |
| | Longleaf Partners Funds | | ¡ | | 43 |
| | | | | | | | | | | | | | | | | | | | | | | | | | | | | | |
Distri-
butions
from
Return of
Capital | | | Total
Distri-
butions | | | Net
Asset
Value
End of
Period | | | Total
Return(a) | | | Net Assets
End of
Period
(thousands) | | | Ratio of
Expenses
to
Average
Net Assets | | | Ratio of
Net
Investment
Income
to
Average
Net Assets | | | Portfolio
Turnover
Rate | |
| | | | | | | | | | | | | | | | | | | | | | | | | | | | | | |
| | | | | | | | | | | | | | | | | | | | | | | | | | | | | | | |
| | | | | | | | | | | | | | | | | | | | | | | | | | | | | | |
| | | | | | | | | | | | | | | | | | | | | | | | | | | | | | | |
| $ | – | | | $ | (4.52 | ) | | $ | 26.39 | | | | 16.53 | % | | $ | 7,695,310 | | | | 0.91 | % | | | 0.90 | % | | | 25.53 | % |
| | | | | | | | | | | | | | | | | | | | | | | | | | | | | | | |
| | – | | | | (0.82 | ) | | | 26.65 | | | | (2.85 | ) | | | 7,953,798 | | | | 0.91 | | | | 0.39 | | | | 23.55 | |
| | | | | | | | | | | | | | | | | | | | | | | | | | | | | | | |
| | – | | | | (0.14 | ) | | | 28.26 | | | | 17.89 | | | | 8,584,963 | | | | 0.91 | | | | 0.23 | | | | 36.72 | |
| | | | | | | | | | | | | | | | | | | | | | | | | | | | | | | |
| | – | | | | (0.01 | ) | | | 24.09 | | | | 53.60 | | | | 8,039,189 | | | | 0.91 | | | | 0.26 | | | | 28.54 | |
| | | | | | | | | | | | | | | | | | | | | | | | | | | | | | | |
| | – | | | | (0.70 | ) | | | 15.69 | | | | (50.60 | ) | | | 5,788,782 | | | | 0.90 | | | | 0.14 | | | | 29.68 | |
| | | | | | | | | | | | | | | | | | | | | | | | | | | | | | | |
| | | | | | | | | | | | | | | | | | | | | | | | | | | | | | |
| | | | | | | | | | | | | | | | | | | | | | | | | | | | | | | |
| | | | | | | | | | | | | | | | | | | | | | | | | | | | | | |
| | | | | | | | | | | | | | | | | | | | | | | | | | | | | | | |
| | – | | | | (2.05 | ) | | | 28.88 | | | | 22.96 | | | | 3,384,800 | | | | 0.92 | | | | 0.07 | | | | 14.70 | |
| | | | | | | | | | | | | | | | | | | | | | | | | | | | | | | |
| | – | | | | (1.78 | ) | | | 25.23 | | | | 1.79 | | | | 3,037,823 | | | | 0.92 | | | | – | | | | 37.33 | |
| | | | | | | | | | | | | | | | | | | | | | | | | | | | | | | |
| | – | | | | (0.11 | ) | | | 26.52 | | | | 22.32 | | | | 3,056,707 | | | | 0.93 | | | | 0.14 | | | | 16.67 | |
| | | | | | | | | | | | | | | | | | | | | | | | | | | | | | | |
| | – | | | | – | | | | 21.77 | | | | 49.31 | | | | 2,500,501 | | | | 0.95 | | | | 0.45 | | | | 12.93 | |
| | | | | | | | | | | | | | | | | | | | | | | | | | | | | | | |
| | (0.05 | ) | | | (0.57 | ) | | | 14.58 | | | | (43.90 | ) | | | 1,803,685 | | | | 0.93 | | | | 0.37 | | | | 22.61 | |
| | | | | | | | | | | | | | | | | | | | | | | | | | | | | | | |
| | | | | | | | | | | | | | | | | | | | | | | | | | | | | | |
| | | | | | | | | | | | | | | | | | | | | | | | | | | | | | | |
| | | | | | | | | | | | | | | | | | | | | | | | | | | | | | |
| | | | | | | | | | | | | | | | | | | | | | | | | | | | | | | |
| | – | | | | (0.37 | ) | | | 14.04 | | | | 21.23 | | | | 1,504,040 | | | | 1.29 | | | | 1.82 | | | | 22.59 | |
| | | | | | | | | | | | | | | | | | | | | | | | | | | | | | | |
| | – | | | | (0.33 | ) | | | 11.90 | | | | (20.29 | ) | | | 1,571,156 | | | | 1.37 | | | | 1.07 | | | | 48.87 | |
| | | | | | | | | | | | | | | | | | | | | | | | | | | | | | | |
| | – | | | | (0.19 | ) | | | 15.34 | | | | 13.69 | | | | 2,211,191 | | | | 1.38 | | | | 0.76 | | | | 27.80 | |
| | | | | | | | | | | | | | | | | | | | | | | | | | | | | | | |
| | – | | | | – | | | | 13.66 | | | | 23.17 | | | | 2,165,459 | | | | 1.59 | | | | 0.55 | | | | 20.15 | |
| | | | | | | | | | | | | | | | | | | | | | | | | | | | | | | |
| | (0.02 | ) | | | (0.80 | ) | | | 11.09 | | | | (39.60 | ) | | | 2,041,338 | | | | 1.60 | | | | 0.27 | | | | 43.94 | |
| | | | | | | | | | | | | | | | | | | | | | | | | | | | | | | |
| | |
| Report of Independent Registered Public Accounting Firm | | |
To the Trustees of Longleaf Partners Funds Trust and Shareholders of Longleaf Partners Fund, Longleaf Partners Small-Cap Fund, and Longleaf Partners International Fund:
In our opinion, the accompanying statements of assets and liabilities, including the portfolios of investments, and the related statements of operations and of changes in net assets and the financial highlights present fairly, in all material respects, the financial position of Longleaf Partners Funds Trust (comprised of Longleaf Partners Fund, Longleaf Partners Small-Cap Fund, and Longleaf Partners International Fund hereafter referred to as the “Funds”) at December 31, 2012, and the results of each of their operations for the year then ended, and the changes in each of their net assets for each of the two years in the period then ended and the financial highlights for each of the five years in the period then ended, in conformity with accounting principles generally accepted in the United States of America. These financial statements and financial highlights (hereafter referred to as “financial statements”) are the responsibility of the Funds’ management; our responsibility is to express an opinion on these financial statements based on our audits. We conducted our audits of these financial statements in accordance with the standards of the Public Company Accounting Oversight Board (United States). Those standards require that we plan and perform the audit to obtain reasonable assurance about whether the financial statements are free of material misstatement. An audit includes examining, on a test basis, evidence supporting the amounts and disclosures in the financial statements, assessing the accounting principles used and significant estimates made by management, and evaluating the overall financial statement presentation. We believe that our audits, which included confirmation of securities at December 31, 2012 by correspondence with the custodian and brokers, provide a reasonable basis for our opinion.
PricewaterhouseCoopers LLP
Baltimore, Maryland
February 13, 2013
| | | | | | |
| | Longleaf Partners Funds | | ¡ | | 45 |
| | |
| Statement Regarding Basis for Approval of Investment Advisory Contracts | | |
Longleaf Partners Fund, Longleaf Partners Small-Cap Fund, and Longleaf Partners International Fund (the “Funds”) are non-diversified and each is a series of Longleaf Partners Funds Trust, a Massachusetts business trust which is an open-end management investment company registered with the US Securities and Exchange Commission. Southeastern Asset Management, Inc. (“Southeastern”) acts as investment counsel and fund administrator under agreements with each Fund (the “Agreements”). Trustees for each Fund, including Trustees who are not “interested persons” of the Funds as that term is defined under the Investment Company Act of 1940, as amended (the “Independent Trustees”), are responsible for overseeing the performance of Southeastern and meet annually to review information specific to each Fund to determine whether or not the Agreements with Southeastern ought to be approved.
On August 7, 2012, Trustees for each Fund met to determine whether the Agreements with Southeastern should be approved for the period November 1, 2012 to October 31, 2013. In advance of the meeting, the Independent Trustees reviewed materials relating to the existing Agreements, including an independent expense and performance summary prepared by Lipper Inc. The Lipper materials included comparisons of each Fund with other funds in a comparable Lipper universe, as well as additional funds selected for comparison by the Independent Trustees. Trustees reviewed this comparative Lipper data regarding management and non-management fees and expenses, portfolio turnover, brokerage commissions, investment performance and long-term performance in light of total fund expenses (the “Lipper Data”). Other materials reviewed included information concerning the nature, extent and quality of Southeastern’s services, Southeastern’s profitability and financial results, including advisory fee revenue and separate account advisory fee schedules, and whether economies of scale are, or would be, shared with Fund investors as assets under management increase. Based on the information reviewed, as well as information received throughout the year and first-hand interaction with Southeastern’s personnel, the Trustees for each Fund unanimously approved the selection of Southeastern as adviser and administrator, and the amounts to be paid by each Fund under Agreements with Southeastern.
In considering the Agreements, the Trustees did not identify any single factor as all-important or controlling, and each Trustee may have weighed various factors differently. The following summary does not detail all the factors considered, but discusses the material factors and the Trustees’ conclusions.
Nature, Extent and Quality of Services Provided
While the investment performance of each Fund and Southeastern (discussed below) is relevant to an evaluation of the nature, extent and quality of services provided, the Trustees also considered Southeastern’s governing principles as significant. These principles are stated at the beginning of the Funds’ Prospectus:
| • | | We will treat your investment as if it were our own. |
| • | | We will remain significant investors in Longleaf Partners Funds. |
| • | | We will invest for the long-term, while striving to maximize returns and minimize business, financial, purchasing power, regulatory and market risks. |
| • | | We will choose each equity investment based on its discount from our appraisal of corporate intrinsic value, its financial strength, its management, its competitive position, and our assessment of its future earnings potential. |
| • | | We will focus our assets in our best ideas. |
| • | | We will not impose loads or 12b-l charges on mutual fund shareholders. |
| • | | We will consider closing to new investors if closing would benefit existing clients. |
| | |
| Statement Regarding Basis for Approval of Investment Advisory Contracts | | |
| • | | We will discourage short-term speculators and market timers. |
| • | | We will continue our efforts to enhance shareholder services. |
| • | | We will communicate with our investment partners as candidly as possible. |
The Trustees concluded that Southeastern had been successful in operating each Fund under these governing principles, and that Longleaf shareholders had benefited from Southeastern’s execution of its investment discipline over the long term, as well as its shareholder oriented approach. Southeastern’s actions on behalf of shareholders have gone beyond stock selection and included active engagement with portfolio companies when necessary and involvement in the market structure debate. The Trustees looked favorably on Southeastern’s unique Code of Ethics requirement that employees use Longleaf for virtually all public equity investing. The Trustees noted that, as one of the largest shareholder groups, Southeastern and its affiliates’ interests are aligned with other shareholders, facing the same risks, paying the same fees, and sharing the same motivation to achieve positive absolute returns. In addition, significant investment by Southeastern’s personnel has contributed to the economies of scale which have lowered fees and expenses for shareholders over time.
The Trustees recognized Southeastern’s consistent implementation of the governing principles, noting that Southeastern and the Funds had continued to receive recognition in the press, and among industry observers and participants, for the quality of its investment process, as well as its shareholder orientation and integrity. The Trustees expressed confidence in the research, analysis, knowledge and 37-years’ experience of Southeastern. The Trustees concluded that shareholders buy the Funds primarily to gain access to Southeastern’s investment expertise and shareholder orientation, and weighed this heavily in approving the Agreements.
Trustees concluded that Southeastern’s administrative services, including fund accounting, legal, trading, shareholder reporting, compliance and oversight of Fund operations, had been high quality, and favored approving Southeastern for another year. Trustees concluded that Southeastern had been open, responsive, timely and cooperative in providing information required to oversee the Funds.
Comparative Investment Performance of the Funds and Adviser
Using the Lipper Data, the Trustees compared each Fund through periods ended June 30, 2012, to other similar funds, as well as the following objective benchmarks: inflation plus 10%, and each Fund’s market index plus 200 basis points. All three Longleaf Partners Funds’ long-term results lagged inflation plus 10%, but compared favorably to market indices. A significant factor to all Trustees was Southeastern’s courage to stand behind its convictions, following strict application of its investment discipline, often buying or holding companies currently out of favor. The Trustees concluded that this approach is consistent with each Fund’s long-term investment horizon. Regarding the specifics of each Fund, the Trustees noted that Longleaf Partners Small-Cap Fund had rebounded strongly since the 2008-2009 financial crisis, materially exceeding the Russell 2000 index for that period. Longleaf Partners Fund and Longleaf Partners International Fund had given back some of the post financial crisis gains that had been achieved through June 2010 and 2011, but Trustees discussed individual stocks and price-to-value ratios in these funds with Southeastern, who reported that significant unrealized value continued to be present. In the context of historical analysis of Southeastern’s price-to-value ratios and traditional pay-off patterns in Southeastern’s long-term holdings, the Trustees believed it was reasonable to conclude that Southeastern’s data supported the prospect of improved absolute returns over the long term.
| | | | | | |
| | Longleaf Partners Funds | | ¡ | | 47 |
The Trustees reviewed after-tax performance information for each Fund and noted that taxable shareholders were benefited by Southeastern’s long-term, low turnover, tax efficient management style as compared to funds with more frequent trading.
The Costs of the Services to be Provided and Profits to be Realized by the Investment Adviser and its Affiliates from the Relationship with the Fund
The Trustees considered each Fund’s management fee rates and expense ratios relative to industry averages, advisory fees charged to Southeastern’s private account clients and similar funds selected by Lipper and the Independent Trustees.
While Southeastern’s management fees for each Fund were above average, non- management expenses were below average, due in part to Southeastern’s performance and/or oversight of various operating functions. While the Trustees considered these fees separately, they viewed total expenses borne by shareholders as more important. In addition, the Trustees weighed favorably the fact that Southeastern had foregone additional fee income in each Fund’s early years through application of the expense limitation, and in later years by closing each Fund to protect shareholder interests. The Trustees noted that Longleaf Partners Fund had been closed from July 2004 to January 2008, Longleaf Partners International Fund had been closed from February 2004 to July 2006, and Longleaf Partners Small-Cap Fund had been closed since July 1997. The Trustees also recognized that Southeastern does not have an affiliated entity providing transfer agent, custodian, broker dealer or services other than investment management and fund administration. Accordingly, Southeastern neither generates additional fees for itself through related entities, nor allocates Fund brokerage to pay its expenses. The transparency of Southeastern’s fees and lack of supplemental sources of revenue was a significant factor to the Trustees.
With respect to Longleaf Partners Fund and Longleaf Partners International Fund for the five and ten year period ended June 30, 2012, the Funds charged below average total expenses when compared to their Lipper universe. With respect to Longleaf Partners Small-Cap Fund, for both the 5 and 10 year periods, it generated above average returns with below average expenses compared to its Lipper universe. The Trustees took into account recent as well as long-term performance, Southeastern’s efforts to strengthen the international research team, the costs of maintaining overseas offices, as well as a reduction in fees introduced in 2011, when evaluating the fee level of the International Fund. In light of the qualifications, experience, reputation, and performance of Southeastern with respect to each Fund, as well as the steps taken to limit or reduce receipt of fees over time, the Trustees concluded that fees paid to Southeastern by each Fund are reasonable.
The Trustees compared the fees paid to Southeastern by the Funds with those paid by Southeastern’s private account clients. To the extent private account fees were lower than Fund fees, the Trustees concluded that the range of services provided to the Funds is more extensive and the risks associated with operating SEC registered, publicly traded mutual funds are greater. Funds are more work because of the complex overlay of regulatory, tax and accounting issues which are unique to mutual funds. In addition, the work required to service shareholders is more extensive because of the significantly greater number and managing trading is more complex because of more frequent fund flows, as well as IRS diversification compliance. With respect to risk, not only has regulation become more complex and burdensome, but the scrutiny of regulators and shareholders has gotten more intense. The Trustees concluded that reasonable justifications exist to the extent that there are differences in fee rates between the two lines of business.
The Trustees reviewed reports of Southeastern’s financial position, including overall revenues and expenses of the firm, as well as an Investment Manager Profitability Analysis prepared by Lipper Inc.
| | |
| Statement Regarding Basis for Approval of Investment Advisory Contracts | | |
While the Trustees considered the profitability of Southeastern as a whole, and jointly determined with Southeastern a method to allocate costs between mutual fund and private account activities, they did not evaluate on a Fund-by-Fund basis Southeastern’s profitability and/or costs. Because no generally accepted cost allocation methodology exists, and estimating the cost of providing services on a Fund specific basis is difficult, Southeastern provided its complete financial statements to the Trustees and stipulated conservatively for renewal purposes that its operation of each Fund should be considered highly profitable, at least as profitable as, if not more profitable than, investment managers with similar assets under management. The Trustees concluded that significant profits were not unreasonable given Southeastern’s successful investment management and strong shareholder orientation, as well as steps it had taken to limit or reduce its fees over time. As between the Funds and private account business, the Trustees acknowledged that cost allocation methods were not precise, but felt profits derived with respect to the Funds were reasonable. The Trustees also gave significant weight to the preferences and expectations of individual Fund shareholders and their relative sophistication, noting that the level of assets under management (despite closing often, no sales force, or 12b-l plan) is a direct result of Southeastern’s successful asset management and strong shareholder orientation. Similarly, if a shareholder wants to redeem, he or she is not constrained by the thought of having to pay a redemption fee or to recoup a front-end load. Thus, in assessing whether the costs of Southeastern’s services and its resulting profits are reasonable, the Trustees considered it meaningful that the Funds’ asset base consists of shareholders who have freely chosen to retain access to Southeastern’s services, with full disclosure of advisory fee rates.
The Extent to which Economies of Scale would be Realized as each Fund Grows, and whether Current Fee Levels Reflect these Economies of Scale for the Benefit of Fund Investors
Because Southeastern’s fee structure for each Fund contains a breakpoint, economies of scale will be realized as each Fund grows. The Trustees noted that Southeastern bore costs in excess of each Fund’s expense limitation in early years, and that total expenses of each Fund have declined as a percentage of assets over time. Because fee levels for Longleaf Partners Fund and Longleaf Partners Small-Cap Fund currently reflected a greater sharing of economies of scale than the fee for Longleaf Partners International Fund, and in order to reward the loyalty of International Fund shareholders, Southeastern recommended a reduction in that Fund’s breakpoint from $2.5 billion to $500 million in 2011. The higher breakpoint had been set in expectation that the International Fund could become as large as the Partners Fund. While it could still become that large in time, Southeastern was mindful that at current asset levels, shareholders did not benefit from the breakpoint. With this breakpoint reduction, the Trustees were satisfied that breakpoints of each Fund were set at appropriate levels, and economies of scale would be shared sufficiently with Fund shareholders.
Conclusion
While the material factors that the Trustees considered are summarized above, each individual Trustee considered and weighed in the aggregate all information prior to making a renewal decision. All Trustees, including the Independent Trustees, concluded that Southeastern’s fee structure was fair and reasonable in light of the nature and quality of services provided, and that approval of the Investment Counsel and Fund Administration Agreements was in the best interest of each Fund and its shareholders.
Shareholders of mutual funds may incur two types of costs: (1) ongoing costs, including management fees, transfer agent fees, and other fund expenses; and (2) transaction costs, including sale charges (loads) and redemption fees. Longleaf does not charge transaction fees of any sort.
The following examples are intended to show the ongoing costs (in dollars) of investing in the Longleaf Funds and to enable you to compare the costs of investing in other mutual funds. Each example is based on an investment of $1,000 made at July 1, 2012 and held through December 31, 2012.
Actual Expenses
The table below provides information about actual account values and actual expenses using each Fund’s actual return for the period. To estimate the expenses that you paid over the period, divide your account balance by $1,000 (for example, a $12,500 account balance divided by $1,000 = 12.5), then multiply the result by the number in the third line entitled “Expenses Paid During Period.”
Ongoing Expenses and Actual Fund Returns
for the Period July 1, 2012 to December 31, 2012
| | | | | | | | | | | | |
| | | Partners | | | Small-Cap | | | International | |
Beginning Account Value | | $ | 1,000.00 | | | $ | 1,000.00 | | | $ | 1,000.00 | |
| | | | | | | | | | | | | |
Ending Account Value | | | 1,165.30 | | | | 1,229.62 | | | | 1,212.30 | |
| | | | | | | | | | | | | |
Expenses Paid During Period* | | | 5.01 | | | | 5.16 | | | | 7.23 | |
| | | | | | | | | | | | | |
Annualized Expense Ratio for Period | | | 0.92 | % | | | 0.92 | % | | | 1.30 | % |
| | | | | | | | | | | | | |
| * | Expenses are equal to the Fund’s annualized expense ratio, multiplied by the average account value for the period, multiplied by the number of days in the most recent fiscal half year (184) divided by 366 days in the current year. |
| | | | | | |
| | Longleaf Partners Funds | | ¡ | | 51 |
Hypothetical Example for Comparison Purposes
The table below provides information about hypothetical account values and expenses based on each Fund’s actual expense ratio and assumed returns of 5% per year before expenses, which are not the Funds’ actual returns. Do not use the hypothetical data below to estimate your ending account balance or expenses you paid. This information serves only to compare the ongoing costs of investing in Longleaf with other mutual funds. To do so, examine this 5% hypothetical example against the 5% hypothetical examples found in other funds’ shareholder reports.
The expenses shown in the table highlight only ongoing costs and do not reflect transactional costs that may be charged by other funds. Therefore, the third line of the table does not reveal the total relative costs of owning different funds. Since Longleaf does not charge transactions fees, you should evaluate other funds’ transaction costs to assess the total cost of ownership for comparison purposes.
Ongoing Expenses and Hypothetical 5% Return
for the Period July 1, 2012 to December 31, 2012
| | | | | | | | | | | | |
| | | Partners | | | Small-Cap | | | International | |
Beginning Account Value | | $ | 1,000.00 | | | $ | 1,000.00 | | | $ | 1,000.00 | |
| | | | | | | | | | | | | |
Ending Account Value | | | 1,020.51 | | | | 1,020.51 | | | | 1,018.60 | |
| | | | | | | | | | | | | |
Expenses Paid During Period* | | | 4.67 | | | | 4.67 | | | | 6.60 | |
| | | | | | | | | | | | | |
Annualized Expense Ratio for Period | | | 0.92 | % | | | 0.92 | % | | | 1.30 | % |
| | | | | | | | | | | | | |
| * | Expenses are equal to the Fund’s annualized expense ratio, multiplied by the average account value for the period, multiplied by the number of days in the most recent fiscal half year (184) divided by 366 days in the current year. |
| | |
| Information on Boards of Trustees | | |
Each Fund is served by a separate Board of Trustees composed of eight members. The membership of each Board is the same. There is no stated term of service, and Trustees continue to serve after election until resignation. All Trustees presently serving except for Rex M. Deloach were elected or re-elected at a meeting of shareholders held on September 19, 2001 in Boston, Massachusetts.
| | | | | | | | |
Name, Age And Address | | Positions Held
With Funds | | Length of Service
as Trustee
(Year Began) | |
| Affiliated or Interested Trustees* | |
| | | | | | | | | |
O. Mason Hawkins, CFA, (64) 6410 Poplar Ave., Suite 900 Memphis, TN 38119 | | Co-Portfolio Manager | | Partners Fund Small-Cap Fund International Fund Global Fund | |
| 1987
1989 1998 2012 |
|
| | | | | | | | | |
Margaret H. Child (57) 137 Marlborough Street #3 Boston, MA 02116 | | Trustee | | Partners Fund Small-Cap Fund International Fund Global Fund | |
| 2001
2001 2001 2012 |
|
| | | | | | | | | |
| Independent or Non-Interested Trustees | |
| | | | | | | | | |
Chadwick H. Carpenter, Jr. (62) 6410 Poplar Ave., Suite 900 Memphis, TN 38119 | | Trustee | | Partners Fund Small-Cap Fund International Fund Global Fund | |
| 1993
1993 1998 2012 |
|
| | | | | | | | | |
Daniel W. Connell, Jr. (64) 4016 Alcazar Avenue Jacksonville, FL 32207 | | Trustee | | Partners Fund Small-Cap Fund International Fund Global Fund | |
| 1997
1997 1998 2012 |
|
| | | | | | | | | |
Rex M. Deloach (75) 608-08 Van Buren Oxford, MS 38655 | | Trustee | | Partners Fund Small-Cap Fund International Fund Global Fund | |
| 2003
2003 2003 2012 |
|
| | | | | | | | | |
Steven N. Melnyk (65) 5015 Pirates Cove Road Jacksonville, FL 32210 | | Trustee | | Partners Fund Small-Cap Fund International Fund Global Fund | |
| 1991
1991 1998 2012 |
|
| | | | | | | | | |
C. Barham Ray (66) 6410 Poplar Ave., Suite 900 Memphis, TN 38119 | | Trustee | | Partners Fund Small-Cap Fund International Fund Global Fund | |
| 1992
1992 1998 2012 |
|
| | | | | | | | | |
Perry C. Steger (50) 1978 South Austin Avenue Georgetown, TX 78626 | | Chairman of the Board | | Partners Fund Small-Cap Fund International Fund Global Fund | |
| 2001
2001 2001 2012 |
|
| | | | | | | | | |
| * | Mr. Hawkins is a director and officer of Southeastern Asset Management, Inc. and as such is classified as an “interested” Trustee. Ms. Child is not affiliated with Southeastern, but performs certain administration and operational functions for the Funds in Massachusetts, their state of organization, and could be deemed to be an “interested” Trustee. |
| ** | Includes Longleaf Partners Global Fund launched December 27, 2012, not included in this report. |
| | | | | | |
| | Longleaf Partners Funds | | ¡ | | 53 |
| | | | |
Principal Occupations During Past 5 Years | | Number of
Portfolios
Overseen** | | Other Directorships |
| Affiliated or Interested Trustees* |
| | | | | |
Chairman of the Board and Chief Executive Officer, Southeastern
Asset Management, Inc. | | 4 | | |
| | | | | |
| Marketing Consultant since 2005; Chief Marketing Officer, Bingham McCutchen, LLP (1999-2004) (an international law firm); Director of Marketing, Arthur Andersen LLP (accounting firm) Memphis office (1991-98), Atlanta office (1998-99). | | 4 | | |
| | | | | |
| Independent or Non-Interested Trustees |
| | | | | |
Private Investor and Consultant since 1998; Senior Executive Officer, Progress Software Corp. (1983-98) | | 4 | | |
| | | | | |
Private Investor since 2006; President and CEO, Twilight Ventures,
LLC (investment holding company) (2004-2006); Senior Vice
President-Marketing, Jacksonville Jaguars (NFL franchise) (1994-2004) | | 4 | | |
| | | | | |
President, Financial Insights, LLC (financial consulting and litigation support) since 2002; Vice President, The Oxford Company (private
land and timber, investments) (1994-2012). | | 4 | | |
| | | | | |
Senior Vice President, Stephens, Inc. since 2009; Real Estate Development, The Sea Island Company, (2005-2009); Private
Investor and Consultant since 1997; Golf Commentator, ABC Sports since 1991; President, Riverside Golf Group, Inc. since 1989. | | 4 | | |
| | | | | |
Private Investor and Consultant since 2008; Partner, 360 Goodwyn
LLC (real estate development) since 2005; Partner, SSM Corp.
(venture capital firm) 1974-2007 | | 4 | | Director, Financial
Federal Savings Bank,
Memphis, TN and
INNOVA, Memphis, TN |
| | | | | |
President, Steger & Bizzell Engineering, Inc.
(engineering firm) since 2003; Director of Product Strategy, National Instruments, Inc. (1996-2003) | | 4 | | |
| | | | | |
The following additional information may be obtained for free by calling (800)445-9469, Option 1, or visiting longleafpartners.com, or on the SEC’s website at sec.gov.
Proxy Voting Policies and Procedures
A description of Longleaf’s Proxy Voting Policies and Procedures is included in the Statement of Additional Information (SAI).
Proxy Voting Record
Information regarding how the Funds voted proxies relating to portfolio securities during the most recent 12-month period ended June 30 is contained in Form N-PX.
Quarterly Portfolio Holdings
Longleaf files a complete schedule of portfolio holdings for the first and third quarters of each fiscal year on Form N-Q, which is available on the
SEC’s website, and may be reviewed and copied at the SEC’s Public Reference Room in Washington, D.C. Please call (800) SEC-0330 for information on the operation of the Public Reference Room.
In addition to Form N-Q, Longleaf publishes reports for each calendar quarter. These reports include complete schedules of portfolio holdings, as well as performance updates and management discussion. We furnish Longleaf’s Quarterly Reports in lieu of Form N-Q to shareholders who request information about our first and third quarter portfolio holdings, and Semi-Annual and Annual Reports for requests related to the second and fourth quarters, respectively.
Fund Trustees
Additional information about Fund Trustees is included in the Statement of Additional Information (SAI).
| | | | | | |
| | Longleaf Partners Funds | | ¡ | | 55 |
Call (800) 445-9469
Fund Information ¡ Option 1
To request a printed Prospectus, Summary Prospectus (southeasternasset.com/misc/prospectus.cfm), Statement of Additional Information (including Longleaf’s Proxy Voting Policies and Procedures), financial report, application or other Fund information from 8:00 a.m. to 8:00 p.m. Eastern time, Monday through Friday.
Daily Fund Prices ¡ Option 2
For automated reporting 24 hours a day, seven days a week.
Account Information ¡ Option 3
For account balance and transaction activity, 24 hours a day, seven days a week. Please have your Fund number (see below) and account number ready to access your investment information.
Shareholder Inquiries ¡ Option 0
To request action on your existing account from 9:00 a.m. to 6:00 p.m. Eastern time, Monday through Friday.
Correspondence
| | |
| By regular mail: | | By express mail or overnight courier: |
Longleaf Partners Funds P.O. Box 9694 Providence, RI 02940-9694 | | Longleaf Partners Funds c/o BNY Mellon 4400 Computer Drive Westborough, MA 01581 (800) 445-9469 |
Published Daily Price Quotations
Below are the common references for searching printed or electronic media to find daily NAVs of the Funds.
| | | | | | | | |
| Abbreviation | | Symbol | | Cusip | | Transfer Agent
Fund Number | | Status to
New Investors |
Partners | | LLPFX | | 543069108 | | 133 | | Open |
| | | | | | | | | |
Sm-Cap | | LLSCX | | 543069207 | | 134 | | Closed 7/31/97 |
| | | | | | | | | |
Intl | | LLINX | | 543069405 | | 136 | | Open |
| | | | | | | | | |
Governing Principles
|
| We will treat your investment as if it were our own. |
| |
| We will remain significant investors in Longleaf Partners Funds. |
| |
| We will invest for the long term, while striving to maximize returns and minimize business, financial, purchasing power, regulatory and market risks. |
| |
| We will choose each equity investment based on its discount from our appraisal of corporate intrinsic value, its financial strength, its management, its competitive position, and our assessment of its future earnings potential. |
| |
| We will focus our assets in our best ideas. |
| |
| We will not impose loads or 12b-1 charges on mutual fund shareholders. |
| |
| We will consider closing to new investors if closing would benefit existing clients. |
| |
| We will discourage short-term speculators and market timers. |
| |
| We will continue our efforts to enhance shareholder services. |
| |
| We will communicate with our investment partners as candidly as possible. |
On December 8, 2003, the Boards of Trustees of the Longleaf Partners Funds adopted a Code of Ethics applicable to officers of Southeastern Asset Management, Inc. performing the principal executive function, the principal financial function, and the principal legal function for the Funds. This Code of Ethics, as amended, may be obtained without charge, upon request, by calling (901) 761-2474 and asking Southeastern’s General Counsel for a copy.
| Item 3. | Audit Committee Financial Expert. |
On December 8, 2003, the Independent Trustees of the Longleaf Partners Funds selected Rex M. Deloach to replace G. Staley Cates as Trustee, effective upon Mr. Cates resignation from the Boards December 31, 2003. Mr. Deloach is “independent” as defined by Item 3 of Form N-CSR, and serves as chairman of the Audit Committee. The Trustees have determined that Mr. Deloach meets the definition of “audit committee financial expert” as set forth in Item 3 of Form N-CSR.
In accordance with the SEC’s safe harbor rule for “audit committee financial experts,” no member designated as an audit committee financial expert shall (i) be deemed an “expert” for any other purpose or (ii) have any duty, obligation or liability that is greater than the duties, obligations and liabilities imposed on a member of the board or the audit committee not so designated. Additionally, the designation of a member or members as an “audit committee financial expert” shall in no way affect the duties, obligations or liabilities of any member of the audit committee, or the board, not so designated.
| Item 4. | Principal Accountant Fees and Services. |
| | | | | | | | |
Services | | 2011 | | | 2012 | |
(a.) Audit Fees
Audits of the Funds | | $ | 111,000 | | | $ | 162,250 | |
| | | | | | | | |
(b.) Audit Related Fees
Quarterly tax diversification review, tax department review of financial statements | | $ | 14,400 | | | $ | 34,575 | |
| | | | | | | | |
(c.) Tax Fees
Preparation of tax returns, tax consultation and research | | $ | 54,825 | | | $ | 27,200 | |
| | | | | | | | |
(d.) All other fees | | $ | 1,100 | | | $ | — | |
| | | | | | | | |
PricewaterhouseCoopers LLP (PwC) serves as the principal accountant for the Longleaf Partners Funds. Under Longleaf’s Audit Committee Charter, the Audit Committee must pre-approve all audit and non-audit services. No additional pre-approval policies and procedures described in paragraph (c)(7) of Rule 2-01 of Regulation S-X have been adopted. No services included in (b.) through (d.) above were approved pursuant to paragraph (c)(7)(ii) of Rule 2-01 of Regulation S-X. PwC’s Irish office provided €15,100 worth of tax consulting to Longleaf Management Company (Ireland) Limited, a 100% wholly owned subsidiary of Southeastern Asset Management, Inc., and $11,398 worth of tax consulting to Longleaf Partners Unit Trust, an Irish based UCITS Fund managed by Southeastern. The Audit Committee pre-approved these services and found them compatible with maintaining PwC’s independence.
| Item 5. | Audit Committee of Listed Registrants. |
Not applicable.
| Item 6. | Schedule of Investments. |
A complete schedule of investments for the period ended December 31, 2012 is included in the Annual Report filed under Item I of this form.
| Item 7. | Disclosure of Proxy Voting Policies and Procedures for Closed-End Management Investment Companies. |
Not applicable.
| Item 8. | Portfolio Managers of Closed-End Management Investment Companies. |
Not applicable.
| Item 9. | Purchases of Equity Securities by Closed-End Management Investment Company and Affiliated Purchasers. |
Not applicable.
| Item 10. | Submission of Matters to a Vote of Security Holders. |
The registrant does not currently have in place procedures by which shareholders may recommend nominees to the registrant’s board of directors.
| Item 11. | Controls and Procedures. |
The registrant’s principal executive officer and principal financial officer have concluded, based on their evaluation of the effectiveness of the design and operation of the registrant’s disclosure controls and procedures as of a date within 90 days of the filing date of this report on Form N-CSR, that the design and operation of such procedures are effective to provide reasonable assurance that information required to be disclosed by the investment company in the reports that it files or submits under the Securities Exchange Act of 1934 is recorded, processed, summarized, and reported within the time periods specified in the Commission’s rules and forms.
At the date of filing this Form N-CSR, the registrant’s principal executive officer and principal financial officer are aware of no changes in the registrant’s internal control over financial reporting during the most recent fiscal quarter of the period covered by this report (ie, the fourth quarter) that have materially affected, or are reasonably likely to materially affect, the registrant’s internal control over financial reporting.
Exhibit 99. CERT Certification Required by Item 12(a)(2) of Form N-CSR
Exhibit 99.906 CERT Certification Pursuant to Section 906 of the Sarbanes Oxley Act.
SIGNATURES
Pursuant to the requirements of the Securities Exchange Act of 1934 and the Investment Company Act of 1940, the registrant has duly caused this report to be signed on its behalf by the undersigned, thereunto duly authorized.
| | |
| Longleaf Partners Funds Trust |
| |
| By | | /s/ O. Mason Hawkins |
| | O. Mason Hawkins Trustee Longleaf Partners Funds Trust |
Date February 21, 2013
Pursuant to the requirements of the Securities Exchange Act of 1934 and the Investment Company Act of 1940, this report has been signed below by the following persons on behalf of the registrant and in the capacities and on the dates indicated.
| | |
| By | | /s/ O. Mason Hawkins |
| | O. Mason Hawkins Chairman and CEO, Southeastern Asset Management, Inc. Functioning as principal executive officer under agreements with Longleaf Partners Funds Trust and its separate series |
Date February 21, 2013
| | |
By | | /s/ Julie M. Bishop |
| | Julie M. Bishop Mutual Fund CFO & Principal, Southeastern Asset Management, Inc. Functioning as principal financial officer under agreements with Longleaf Partners Funds Trust and its separate series |
Date February 21, 2013
A signed original of this written statement has been provided to Longleaf Partners Funds Trust and will be retained by Longleaf Partners Funds Trust and furnished to the Securities and Exchange Commission or its staff upon request.