UNITED STATES
SECURITIES AND EXCHANGE COMMISSION
Washington, D.C. 20549
FORM N-CSR
CERTIFIED SHAREHOLDER REPORT OF REGISTERED
MANAGEMENT INVESTMENT COMPANIES
Investment Company Act file number: 811-4923
|
| Longleaf Partners Funds Trust |
(Exact name of registrant as specified in charter)
|
c/o Southeastern Asset Management, Inc. 6410 Poplar Avenue, Suite 900 Memphis, TN 38119 |
(Address of principal executive offices) (Zip code)
Andrew R. McCarroll, Esq.
|
Southeastern Asset Management, Inc. 6410 Poplar Ave., Suite 900 Memphis, TN 38119 |
(Name and address of agent for service)
Registrant’s telephone number, including area code: (901) 761-2474
Date of fiscal year end: December 31
Date of reporting period: December 31, 2014.
| Item 1. | Longleaf Partners Funds Annual Report at December 31, 2014. |
|
| Partners Fund |
| Small-Cap Fund |
| International Fund |
| Global Fund |
|
| December 31, 2014 |

One of Southeastern’s “Governing Principles” is that “we will communicate with our investment partners as candidly as possible,” because we believe Longleaf shareholders benefit from understanding our investment philosophy and approach. Our views and opinions regarding the investment prospects of our portfolio holdings and Funds are “forward looking statements” which may or may not be accurate over the long term. While we believe we have a reasonable basis for our appraisals, and we have confidence in our opinions, actual results may differ materially from those we anticipate. Information provided in this report should not be considered a recommendation to purchase or sell any particular security.
You can identify forward looking statements by words like “believe,” “expect,” “anticipate,” or similar expressions when discussing prospects for particular portfolio holdings and/or one of the Funds. We cannot assure future results and achievements. You should not place undue reliance on forward looking statements, which speak only as of the date of this report. We disclaim any obligation to update or alter any forward looking statements, whether as a result of new information, future events, or otherwise. Current performance may be lower or higher than the performance quoted herein. Past performance does not guarantee future results, fund prices fluctuate, and the value of an investment may be worth more or less than the purchase price. Call (800)445-9469 or go to longleafpartners.com for current performance information and for the Prospectus and Summary Prospectus, both of which should be read carefully before investing to learn about fund investment objectives, risks and expenses. This material must be accompanied or preceded by a prospectus. Please read it carefully before investing.
The price-to-value ratio (“P/V”) is a calculation that compares the prices of the stocks in a portfolio to Southeastern’s appraisals of their intrinsic values. P/V represents a single data point about a Fund, and should not be construed as something more. We caution our shareholders not to give this calculation undue weight. P/V alone tells nothing about:
| • | | The quality of the businesses we own or the managements that run them; |
| • | | The cash held in the portfolio and when that cash will be invested; |
| • | | The range or distribution of individual P/V’s that comprise the average; and |
| • | | The sources of and changes in the P/V. |
When all of the above information is considered, the P/V is a useful tool to gauge the attractiveness of a Fund’s potential opportunity. It does not, however, tell when that opportunity will be realized, nor does it guarantee that any particular company’s price will ever reach its value. We remind our shareholders who want to find a single silver bullet of information that investments are rarely that simple. To the extent an investor considers P/V in assessing a Fund’s return opportunity, the limits of this tool should be considered along with other factors relevant to each investor.
Unless otherwise noted, performance returns of Fund positions combine the underlying stock and bond securities including the effect of trading activity during the period.
Risks
The Longleaf Partners Funds are subject to stock market risk, meaning stocks in the Fund may fluctuate in response to developments at individual companies or due to general market and economic conditions. Also, because the Funds generally invest in 15 to 25 companies, share value could fluctuate more than if a greater number of securities were held. Mid-cap stocks held by the Funds may be more volatile than those of larger companies. With respect to the Small-Cap Fund, smaller company stocks may be more volatile with fewer financial resources than those of larger companies. With respect to the International and Global Funds, investing in non-U.S. securities may entail risk due to non-U.S. economic and political developments, exposure to non-U.S. currencies, and different accounting and financial standards. These risks may be higher when investing in emerging markets.
Indexes
The S&P 500 Index is an index of 500 stocks chosen for market size, liquidity and industry grouping,
among other factors. The S&P is designed to be a leading indicator of U.S. equities and is meant to reflect the risk/return characteristics of the large cap universe.
The Russell 2000 Index measures the performance of the 2,000 smallest companies in the Russell 3000 Index, which represents approximately 10% of the total market capitalization of the Russell 3000 Index.
MSCI EAFE Index (Europe, Australasia, Far East) is a broad based, unmanaged equity market index designed to measure the equity market performance of 22 developed markets, excluding the US & Canada.
MSCI World Index is a broad-based, unmanaged equity market index designed to measure the equity market performance of 24 developed markets, including the United States.
An index cannot be invested in directly.
Definitions
A master limited partnership (MLP) is, generally, a limited partnership that is publicly traded on a securities exchange.
Internal rate of return (IRR) is the interest rate at which the net present value of all the cash flows from an investment equal zero.
EV/EBITDA is a ratio comparing a company’s enterprise value and its earnings before interest, taxes, depreciation and amortization.
© 2015 Southeastern Asset Management, Inc. All Rights Reserved.
Longleaf, Longleaf Partners Funds and the pine cone logo are registered trademarks of Longleaf Partners Funds Trust. Southeastern Asset Management, Inc. is a registered trademark.
Funds distributed by ALPS Distributors, Inc.
| | | | | | |
| | Longleaf Partners Funds | | ¡ | | 1 |
| | | | | | | | | | | | | | | | | | | | | | | | | | | | | | | | |
| Cumulative Returns at December 31, 2014 | |
| | | Since
Inception | | | 25
Year | | | 20
Year | | | 15
Year | | | Ten
Year | | | Five
Year | | | One
Year | | | 4Q | |
Partners Fund
(Inception
4/8/87) | | | 1842.31 | % | | | 1239.19 | % | | | 617.02 | % | | | 210.29 | % | | | 76.15 | % | | | 85.00 | % | | | 4.92 | % | | | 1.46 | % |
S&P 500 Index | | | 1223.16 | | | | 893.51 | | | | 554.75 | | | | 86.48 | | | | 109.47 | | | | 105.14 | | | | 13.69 | | | | 4.93 | |
Small-Cap Fund
(Inception
2/21/89) | | | 1555.39 | | | | 1262.34 | | | | 1061.72 | | | | 395.44 | | | | 162.10 | | | | 124.66 | | | | 12.49 | | | | 3.82 | |
Russell
2000 Index | | | 1015.68 | | | | 922.99 | | | | 529.46 | | | | 190.92 | | | | 111.26 | | | | 105.95 | | | | 4.89 | | | | 9.73 | |
International
Fund
(Inception
10/26/98) | | | 234.08 | | | | na | | | | na | | | | 146.40 | | | | 36.02 | | | | 19.98 | | | | -14.76 | | | | -6.59 | |
MSCI
EAFE Index | | | 102.18 | | | | na | | | | na | | | | 45.73 | | | | 54.29 | | | | 29.68 | | | | -4.90 | | | | -3.57 | |
Global
Fund
(Inception
12/27/12) | | | 20.73 | | | | na | | | | na | | | | na | | | | na | | | | na | | | | -5.98 | | | | -3.26 | |
MSCI
World Index | | | 33.16 | | | | na | | | | na | | | | na | | | | na | | | | na | | | | 4.94 | | | | 1.01 | |
| | |
| Average Annual Returns at December 31, 2014 | | | | | | | |
| | | Since
Inception | | | 25
Year | | | 20
Year | | | 15
Year | | | Ten
Year | | | Five
Year | | | One
Year | | | | |
Partners Fund
(Inception
4/8/87) | | | 11.29 | % | | | 10.94 | % | | | 10.35 | % | | | 7.84 | % | | | 5.82 | % | | | 13.09 | % | | | 4.92 | % | | | | |
S&P 500 Index | | | 9.75 | | | | 9.62 | | | | 9.85 | | | | 4.24 | | | | 7.67 | | | | 15.45 | | | | 13.69 | | | | | |
Small-Cap Fund
(Inception
2/21/89) | | | 11.47 | | | | 11.01 | | | | 13.05 | | | | 11.26 | | | | 10.11 | | | | 17.57 | | | | 12.49 | | | | | |
Russell
2000 Index | | | 9.78 | | | | 9.75 | | | | 9.63 | | | | 7.38 | | | | 7.77 | | | | 15.55 | | | | 4.89 | | | | | |
International
Fund
(Inception
10/26/98) | | | 7.74 | | | | na | | | | na | | | | 6.20 | | | | 3.12 | | | | 3.71 | | | | -14.76 | | | | | |
MSCI
EAFE Index | | | 4.45 | | | | na | | | | na | | | | 2.54 | | | | 4.43 | | | | 5.33 | | | | -4.90 | | | | | |
Global
Fund
(Inception
12/27/12) | | | 9.82 | | | | na | | | | na | | | | na | | | | na | | | | na | | | | -5.98 | | | | | |
MSCI
World Index | | | 15.33 | | | | na | | | | na | | | | na | | | | na | | | | na | | | | 4.94 | | | | | |
The indices are unmanaged. During the inception year, the S&P 500 and the EAFE Index were available only at month-end; therefore the S&P 500 value at 3/31/87 and the EAFE value at 10/31/98 were used to calculate performance since inception. Returns reflect reinvested capital gains and dividends but not the deduction of taxes an investor would pay on distributions or share redemptions. Performance data quoted represents past performance; past performance does not guarantee future results. The investment return and principal value of an investment will fluctuate so that an investor’s shares, when redeemed, may be worth more or less than their original cost. Current performance of the fund may be lower or higher than the performance quoted. Performance data current to the most recent month end may be obtained by visiting longleafpartners.com
The December 31, 2014 total expense ratios for the Longleaf Partners Funds are: Partners Fund 0.91%, Small-Cap Fund 0.91%, International Fund 1.25%, and Global Fund 1.58%. The December 31, 2013 total expense ratios are: Partners Fund 0.92%, Small-Cap Fund 0.91%, International Fund 1.27%, and Global Fund 1.73% before limitation. The Funds’ expense ratios are subject to fee waiver to the extent a Fund’s normal annual operating expenses exceed the following percentages of average annual net assets: Partners Fund 1.5%, Small-Cap Fund 1.5%, International Fund 1.75%, and Global Fund 1.65%.
| | |
| Letter To Our Shareholders | | |
After strong returns across all the Longleaf Partners Funds in 2013, only the Small-Cap Fund in 2014 exceeded its benchmark index and our absolute return goal of inflation plus 10%. We are not pleased with the results in our Funds outside of Small-Cap over the last twelve months, but we do welcome the increased volatility and opportunity created as broad markets and stocks within those markets began to diverge in the second half of the year.
We are seeing strong parallels in current markets versus the late 1990s that lead us to believe we will be returning to an environment where the merits of individual holdings are more likely to be properly weighed by the market and value investment approaches are more likely to be rewarded with solid absolute and relative returns. Based on the underlying fundamentals at our companies, the actions our management partners are taking, and the broader investing environment, we are confident that our portfolios are positioned for successful long-term compounding.
Drivers of 2014 Results
Over our nearly 40 years of investing, Southeastern has built the Longleaf Funds’ portfolios from the “bottom up” as we find stocks that meet our criteria of strong businesses, good people, and deeply discounted prices. In 2014, our fundamentals-based approach was rewarded in the Small-Cap Fund, which benefited from merger and acquisition activity that helped drive double-digit returns in spite of an average cash balance of more than 30%. In our other Funds, various individual holdings gained more than 15%, including Level 3, FedEx, Berkshire Hathaway, and Cheung Kong, as investors began to appreciate how our management partners had positioned their companies for value growth. Unfortunately, three broader portfolio exposures – cash, international exposure to both currency moves and emerging market challenges, and energy – overshadowed strong individual stock returns. In spite of the macro pressures, however, we have rarely been as universally pleased with the activity at our underlying companies.
The first detracting exposure – cash – impacted all of our Funds. We held higher-than-normal liquidity at the outset of the year after we sold fully valued equities and found few qualifying new opportunities. In the Partners Fund, cash averaged more than 20%, impacting relative results as the S&P 500 rose 13.7%. In our other Funds, the first half cash drag was somewhat offset after small cap and non-U.S. indices
tumbled in the third quarter. As we’ve written previously, while a higher cash balance can be a drag on returns in the short term, over the long term the benefits of avoiding lower quality investments and having the flexibility to take advantage of buying opportunities during market dislocations are, we believe, key drivers of long-term outperformance.
Second, our exposure to businesses operating outside of the U.S. weighed on our results primarily due to the strong U.S. dollar (USD) and increased regulatory and economic controls in China. In 2014, all four Longleaf Funds contained companies based outside of the U.S. given the more deeply discounted, high quality opportunities currently available in other parts of the world. The Global Fund held more than 60% outside of the U.S., the Partners Fund held European domiciled global businesses such as Philips, Vivendi, and CNH, and the Small-Cap Fund held OCI, Hopewell, and Fairfax. The strength of the USD versus the euro negatively impacted all four Funds. In the Global Fund our returns based in local currencies were positive but fell below zero when translating performance into USD. Likewise, more than half of the negative return in the International Fund was attributable to currency translation into USD. Separately, increased government scrutiny and regulation in China hurt all Macau gaming companies indiscriminately and made our stakes in Melco and Galaxy via K.Wah primary performance
| | | | | | |
| | Longleaf Partners Funds | | ¡ | | 3 |
detractors in the International and Global Funds. Even in the storm of worry that labeled 2014 a disastrous year for Macau gaming, overall revenues fell less than 3%, the number of visitors rose, and mass (as opposed to VIP) revenues grew double digits. The Chinese government has demonstrated its long-term support of Macau with massive infrastructure projects. We are excited to own these businesses as increased accessibility and additional room supply should enable mass revenue to continue to rise at healthy levels. China’s slower growth in 2014 also hurt iron ore prices, negatively impacting Manabi in the International Fund. Lower ore prices combined with the weak Australian dollar caused our position in Mineral Resources, held in both the International and Global Funds, to suffer even though the company’s services revenues usually increase with lower iron ore pricing.
Energy was the third broad exposure that hurt the Partners and Global Funds. Our investments do not reflect any special affinity for oil and gas. We own a select combination of companies – Chesapeake, Murphy Oil, CONSOL Energy, and Boardwalk Pipeline Partners and Diamond Offshore via Loews – because we feel they have the asset bases, financial ability, and disciplined managements to reinvest in production or assets at returns well above their costs of capital. When oil prices fell 49% in the second half of the year as increasing supply began to exceed demand, stock prices did not discriminate. Low cost producers, higher quality assets, proven management teams, and even energy companies without oil properties such as CONSOL experienced similarly correlated declines. In a year where M&A activity and announced spinoffs massively benefited the Small-Cap Fund, brilliant, value additive divestitures by our energy companies –Chesapeake’s sale of Marcellus and Utica assets, Murphy’s partial sale of Malaysia, and CONSOL’s announced IPOs (initial public offering) of multiple segments – were not only unrewarded in the market, but seemingly punished.
Although our minimal exposure to healthcare did not impact absolute results, this major driver of the S&P 500, Russell 2000, and MSCI World indices hurt relative returns. Healthcare
companies rarely meet our criteria because of the uncertainties in appraising government control over providers, pharmaceutical pipelines, biotech discoveries, and technological obsolescence in medical equipment. During 2014, acquisitions in this sector heated up, with deal multiples moving well beyond norms, driven in part by tax inversion initiatives. Indicative of the heated environment, the stocks of buyers paying those huge multiples were often immediately rewarded, which is unusual and not likely to remain the case. Similarly, the difficulty in appraising the future of information technology companies kept us out of that sector, which was a strong performer in the U.S. and global indices, driven by a limited number of tech stocks that rose over 25%.
Reminiscent of the late 1990s
Our 2014 results and the environment driving them are strikingly similar in a number of ways to the late 1990s. While multiples have not reached the extremes that developed in the dot.com bubble from mid-1999 through March 2000, we see many parallels in the broad market and in the factors impacting our portfolios. In the latter half of the 90s, the U.S. was in a multi-year bull market with low dispersion, little volatility, and momentum investing sending large-cap stocks ever higher while fundamentals at individual companies mattered little. Consider the following comparisons:
| | • | | The S&P 500 was up double digits for five consecutive years at the end of 1999. In 2014, for the first time since 1999, and only the second time in our 40 years, the index posted three consecutive years of double-digit returns.(1) |
| | • | | Small cap stocks substantially underperformed large caps, with the gap between the Russell 2000 and S&P 500 at more than 31% in 1998. The almost 9% gap in 2014 was the largest since then(1). |
| | |
| Letter To Our Shareholders | | |
Similar to the late 1990s, recent returns do not adequately reflect the underlying progress our companies made during the year.
| | • | | The Partners and Small-Cap Funds contained considerably elevated cash levels in both periods because few stocks traded with the margin of safety to meet our requisite discount. |
| | • | | Stocks outside the U.S. were dramatically more undervalued. The MSCI EAFE Index fell short of the S&P 500 by more than 31% in 1997; the 18% disparity in 2014 was the largest underperformance since then.(1) |
| | • | | The U.S. dollar index rose just over 13% in 1997 and just under 13% in 2014.(2) |
| | • | | We held 29% of Longleaf Partners Fund in companies domiciled outside of the U.S. in 1998 because of the opportunity set disparity. The Partners Fund today has 25% in foreign holdings. |
| | • | | Oil prices declined more than 39% during 1998 and 49% in the last six months of 2014 and negatively impacted our energy related holdings in both periods.(2) |
| | • | | We delivered strong three and five year absolute returns that surpassed our goal of inflation plus 10% in the Partners Fund, but underperformed the index in 1998, 1999, and 2014. |
| | • | | Only 14% of U.S. large cap managers beat the S&P 500 in 1997: the next-lowest level was 16% in 2014. Large cap value managers faced even worse odds – fewer than 5% outperformed in 1997 and only 10% in 2014.(3) |
| | • | | The market cap weighted S&P 500 rose 28.6% in 1998 while the equally weighted Value Line Index, which is more representative of the average stock, fell 3.8%. Though not as dramatic, the gap in 2014 was meaningful: 13.7% versus 3.1% respectively.(2) |
Much like today, after widespread underperformance in a stock run that distinguished little among company fundamentals, many investors in the late 1990s moved into what had done well, including passive strategies in U.S. large cap equities. The
momentum of more money flowing into the largest and most expensive stocks forced the cap-weighted S&P 500 to add more to those stocks, driving prices well beyond the values of the underlying businesses. Although relative returns versus the S&P 500 were worse in the late 90s, today the outcry for passive over active and the strong consensus that active is a waste of time (especially in U.S. large cap) are even louder as fund flows indicate. Passive fund flows grew more quickly than active flows in the previous era, but over the last five years, passive funds, including the expanded universe of ETFs, increased inflows as active funds had net outflows each year.(4)
The 1990s momentum-driven virtuous circle continued until the dot.com bubble exploded in March 2000. In the multi-year period that followed, individual company qualities and valuations mattered, and the relative performance of proven active managers versus passive indices reversed itself, as we believe it will again. As our long-term partners would expect, at this moment of weak relative performance with active management in disrepute, our optimism about future relative performance is exceptionally high.
Outlook
The lesson from the 1990s aftermath and from the Small-Cap Fund’s results in 2014 is that underlying corporate values eventually get reflected in stock prices, although nobody knows what the payoff pattern will be in any given year. Our management partners are not simply waiting for a more favorable environment. Where prices are strong, they are selling assets, spinning off segments, or creating high-yielding structures. In the pockets of price weakness, managements are using their financial flexibility to initiate buybacks of their discounted shares, some for the first time. They are opportunistically increasing values per share for a potentially larger ultimate payoff. In many cases, our partners are backing up their corporate conviction with meaningful personal stock purchases.
| (3) | Lipper, a Thomson Reuters Company |
| (4) | Wall Street Journal, 1/6/2015 |
| | | | | | |
| | Longleaf Partners Funds | | ¡ | | 5 |
Similar to the late 1990s, recent returns do not adequately reflect the underlying progress our companies made during the year. We believe the Funds are well-positioned to deliver solid absolute and relative returns over the next five years. We own more competitively entrenched businesses at more deeply discounted prices than the indices. Our management teams are more capable, and our underlying corporate values are growing. As the largest investors across the Longleaf Partners Funds, we are highly confident that our longstanding investment discipline will reward those who are patient as it has done over the long term.
Sincerely,

O. Mason Hawkins, CFA
Chairman & Chief Executive Officer
Southeastern Asset Management, Inc.

G. Staley Cates, CFA
President & Chief Investment Officer
Southeastern Asset Management, Inc.
February 9, 2015
| | | | | | |
| 6 | | ¡ | | Annual Report | | Partners Fund |
| | |
| Partners Fund Management Discussion | | |
Longleaf Partners Fund finished the year up 4.92% after a 1.46% gain in the fourth quarter. These results fell below the S&P 500’s returns of 13.69% and 4.93% for the same periods. During the first half of the year, the Fund kept pace with the Index despite having a greater than 20% cash balance. In the second half of 2014, the Fund lagged the S&P 500’s advance largely due to our energy-related holdings, which were leading contributors in the first half but sold off with the sharp decline in oil prices. We are disappointed in the recent performance, but remain confident in the quality of our businesses and management partners in the portfolio. For the last five years, Longleaf Partners Fund exceeded our annual absolute return goal of inflation plus 10%, despite falling short of the Index. Over longer term periods of 15+ years shown below, the Fund surpassed the Index.
| | | | | | | | | | | | | | | | | | | | | | | | | | | | | | | | |
| Cumulative Returns at December 31, 2014 | |
| | | Since Inception | | | 25
Year | | | 20
Year | | | 15
Year | | | Ten
Year | | | Five
Year | | | One
Year | | | 4Q | |
Partners
Fund (Inception
4/8/87) | | | 1842.31 | % | | | 1239.19 | % | | | 617.02 | % | | | 210.29 | % | | | 76.15 | % | | | 85.00 | % | | | 4.92 | % | | | 1.46 | % |
S&P 500
Index | | | 1223.16 | | | | 893.51 | | | | 554.75 | | | | 86.48 | | | | 109.47 | | | | 105.14 | | | | 13.69 | | | | 4.93 | |
| |
| Average Annual Returns at December 31, 2014 | | | | |
| | | Since Inception | | | 25
Year | | | 20
Year | | | 15
Year | | | Ten
Year | | | Five
Year | | | One
Year | | | | |
Partners
Fund (Inception
4/8/87) | | | 11.29 | % | | | 10.94 | % | | | 10.35 | % | | | 7.84 | % | | | 5.82 | % | | | 13.09 | % | | | 4.92 | % | | | | |
S&P 500
Index | | | 9.75 | | | | 9.62 | | | | 9.85 | | | | 4.24 | | | | 7.67 | | | | 15.45 | | | | 13.69 | | | | | |
Returns reflect reinvested capital gains and dividends but not the deduction of taxes an investor would pay on distributions or share redemptions. Performance data quoted represents past performance; past performance does not guarantee future results. The investment return and principal value of an investment will fluctuate so that an investor’s shares, when redeemed, may be worth more or less than their original cost. Current performance of the fund may be lower or higher than the performance quoted. Performance data current to the most recent month end may be obtained by visiting longleafpartners.com.
The December 31, 2014 and 2013 total expense ratios for the Partners Fund are 0.91% and 0.92%, respectively. The expense ratios are subject to fee waiver to the extent normal annual operating expenses exceed 1.50% of average annual net assets.
Fiber and networking company Level 3 Communications gained 49% and led the Fund’s performance for the year and the fourth quarter, up 8%. Level 3 provides critical infrastructure that connects businesses and consumers to the internet, allowing them to move data, video, and voice. The company’s acquisition of tw telecom closed in the fourth quarter, significantly expanding its network reach in metropolitan markets and providing additional capacity to
grow its enterprise customer base. Throughout the year, CEO Jeff Storey and his team delivered solid revenue growth, margin improvement, and higher free cash flow. The stock remains well below our appraisal of its operating networks and non-earning dark fiber and conduit assets and is the Fund’s largest holding.
FedEx rose 22% for the year and 8% in the fourth quarter. The company expanded operating
| | | | | | |
| Partners Fund | | Longleaf Partners Funds | | ¡ | | 7 |
margins in its Express, Ground and Freight segments over the year and executed on profit improvement initiatives. EPS (earnings per share) grew as did our appraisal. The company repurchased close to 10% of its shares. FedEx moved to further entrench itself in Ground delivery through expansion capex and the acquisition of Genco, which handles reverse logistics for retailer returns. FedEx expects to benefit over the next year from a healthy U.S. economy and lower fuel prices, which improve the relative cost of faster delivery via planes at a premium versus slower shipping via boats.
Berkshire Hathaway appreciated 28% for the year after its fourth quarter gain of 10%. The company’s underlying operating businesses performed well. In insurance, GEICO revenues grew 10% driven 2/3 by units and 1/3 by pricing. Reinsurance endured no major catastrophes and some positive currency impact. BNSF grew 4% with gains in both volume and pricing. In the fourth quarter, Berkshire announced the acquisition of Duracell from Proctor & Gamble in a tax efficient exchange for appreciated Berkshire stock. The stock reached our appraisal, and we sold it. Berkshire rarely sells at enough of a discount to meet our criteria given its quality businesses and management, but we were able to purchase it for the second time in our history in 2012. The stock returned over 89% in our two year holding period.
Hong Kong based conglomerate Cheung Kong gained 15% in the year. Over the course of 2014, results at most of the company’s operating divisions were strong. Additionally, management made several value-enhancing asset sales across multiple business lines at low cap rates and used proceeds to opportunistically reinvest in discounted infrastructure deals outside of Asia with double-digit IRRs (internal rates of return). Management also returned proceeds to shareholders in the form of dividends. Most recently, in a joint venture with Mitsubishi Corp, Cheung Kong bought an airplane leasing portfolio. With its strong balance sheet, Cheung Kong can take advantage of Hong Kong land banking opportunities if prices correct.
For Aon, the world’s largest insurance broker and a leading benefits manager, increasing cash flow and healthy share repurchases helped our combined option and common stock position gain 8% in the fourth quarter and 14% for the year. Aon’s private health care exchange business increased its scale, adding more than a dozen clients and aggressively growing the market. The company, led by CEO Greg Case, used $1.8 billion to repurchase almost 7% of shares in the first nine months of 2014, the highest amount since 2008. Aon authorized an additional repurchase plan of up to $6.1 billion, roughly 24% of outstanding shares.
Four of the five primary performance detractors for the year were energy-related businesses that sold off with the 49% decline in oil in the second half. Our investments do not reflect any special affinity for oil and gas. We own a select combination of companies – Chesapeake, Murphy Oil, CONSOL Energy, and Boardwalk Pipeline Partners and Diamond Offshore via Loews – because we feel they have the asset bases, financial ability, and disciplined managements to reinvest in production and assets at returns well above their costs of capital. Our management partners are controlling costs and making value additive divestitures. Our conservative appraisals use the lower of the marginal cost of production or the futures strip to price oil and gas. Because the strip has fallen below the marginal cost, we lowered our assumptions, but our adjustments were much smaller than the stock price declines. The timing is unknown, but the upside from the current strip pricing combined with the proactive work of our CEO partners presents a compelling opportunity for long-term investors.
Chesapeake declined 21% for the full year and 14% in the fourth quarter. Since Chesapeake’s heavily vested Board took over in mid-2012, the company has delevered the balance sheet and improved production from its irreplaceable 10+ million net acres of oil and gas fields. CEO Doug Lawler is driving value recognition in ways he can control – selling assets at reasonable prices, reducing debt, and increasing operating efficiencies in both corporate and production
The upside from the current strip pricing combined with the proactive work of our CEO partners presents a compelling opportunity for long-term investors.
| | | | | | |
| 8 | | ¡ | | Annual Report | | Partners Fund |
| | |
| Partners Fund Management Discussion | | |
activity. In the first half of the year, Chesapeake sold non-core acreage in Oklahoma, Texas, and Pennsylvania and spun-off its oilfield services business into Seventy-Seven Energy, which we sold. In the fourth quarter, Chesapeake closed the sale of Marcellus and Utica assets to Southwestern Energy for $5 billion. This amounted to selling roughly 8% of Chesapeake’s production for proceeds of nearly half its market cap. Management announced plans to use $1 billion of the proceeds to repurchase the heavily discounted shares.
Despite being up 1% in the fourth quarter, Loews, the holding company owned and managed by the Tisch family, sold off with energy and was down 12% for the year. The company’s CNA insurance unit generated strong cash flow, but its stakes in energy companies Diamond Offshore (DO) and Boardwalk Pipeline Partners (BWP) declined 30% and 29% respectively. DO has the strongest balance sheet among drilling rig operators and should be able to upgrade its fleet cheaply as distressed sellers seek capital. BWP cut its dividend to invest in additional service points along its pipeline and expand its ability to transport gas from the northeastern U.S. Loews repurchased shares amounting to approximately 3.5% of the company and has substantial liquidity to take advantage of undervalued opportunities including additional shares.
Murphy was down 20% in the year after an 11% decline in the fourth quarter. CEO Roger Jenkins took actions to recognize value including selling a 30% stake in Malaysian assets at a price above our appraisal. Murphy also bought back shares in 2014 and has authorization for more. The sharp decline in oil prices most heavily affected Murphy’s ownership in Syncrude’s Canadian oil sands, which represented less than 15% of our appraisal before oil’s drop and less today.
CONSOL Energy dropped 11% in the fourth quarter and for the year in full. CONSOL’s management team took productive action to increase shareholder value despite a difficult coal and gas environment. In the second half of the year, Chairman Brett Harvey and CEO Nick Deluliis completed an IPO (initial public offering)
for a midstream MLP (master limited partnership) at metrics above our appraisal. CONSOL most recently announced it would form an MLP to house its thermal coal business and form a subsidiary to own its metallurgical coal properties. These transactions should bring the value of its coal assets forward, improve the transparency into the value of these assets, and provide additional vehicles to access capital markets, while allowing the company to control the assets and realize synergies across its businesses. In addition, CONSOL authorized a share repurchase program for up to approximately 3.6% of the company.
Philips fell 18% in the year and 8% in the fourth quarter. The company faced a number of short-term challenges including a one-time pension payment, a temporary suspension of production at its Cleveland, OH-based medical imaging plant, slower emerging market demand, and foreign exchange headwinds. Currency translation from euros into U.S. dollars accounted for approximately half of the price decline. The stock price does not reflect the ongoing transformation of the company under CEO Frans Van Houten, who has substantially improved operating margins and focused the company over his 3+ year tenure. Philips’ discounted share price provided management the opportunity to execute another massive €1.5 billion share repurchase. In 2014 Philips announced plans to sell or spin off its Lumiled and auto lighting businesses and to split into two companies: Lighting Solutions and HealthTech, which will be comprised of the current Healthcare and Consumer Lifestyle businesses. We applaud the split. The “conglomerate discount” should disappear as each business stands on its own and is easier to compare to more pure-play peers that trade at higher multiples. Separate reporting will commence in January 2015, and the split is expected to happen by 2016.
We initiated five new positions, all in the second half of the year. We bought Franklin Resources, McDonald’s, Scripps Networks, and Vivendi in the third quarter. In the fourth quarter, we bought agricultural equipment and commercial truck company CNH Industrial as weak U.S. corn and
| | | | | | |
| Partners Fund | | Longleaf Partners Funds | | ¡ | | 9 |
soybean prices weighed on farming-related companies. Our four exits each approached our appraisal values, including DirectTV and Vulcan Materials in the first quarter. As mentioned above, we sold Seventy-Seven Energy when it was spun out of Chesapeake and Berkshire Hathaway when it reached our appraisal.
The Fund started 2014 with 22% cash and ended the year with 13%. Helped by our new names, the price-to-value ratio (P/V) improved to the high-70s%. Our on-deck list of qualified new names remains challenged with deep discounts proving elusive. We continue to see more compelling opportunities outside of the U.S. where more economic uncertainty and weaker currencies are weighing on stocks. Our foreign-domiciled holdings are 25% of the portfolio with a maximum limit of 30%.
As the Fund’s largest shareholders, we are not pleased with our 2014 performance or the impact it had on longer periods. The return, however, does not adequately reflect the underlying progress our companies made during the year. We are confident that our portfolio of high quality, industry-leading companies and our management partners who are taking action to build shareholder value will reward our long-term partners.
| | | | | | |
| 10 | | ¡ | | Annual Report | | Partners Fund |
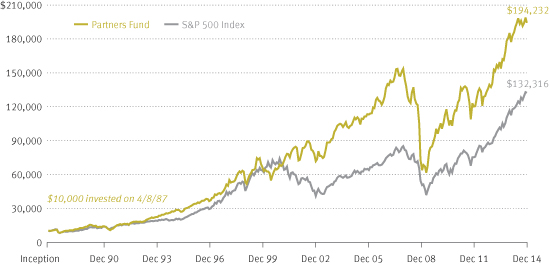
Comparison of Change in Value of $10,000 Investment
Since Inception April 8, 1987
| | | | | | | | | | | | | | | | | | | | | | | | |
| Average Annual Returns for the Periods Ended December 31, 2014 | |
| | | Since Inception
4/8/87 | | | 20 Year | | | 15 Year | | | Ten Year | | | Five Year | | | One Year | |
Partners Fund | | | 11.29 | % | | | 10.35 | % | | | 7.84 | % | | | 5.82 | % | | | 13.09 | % | | | 4.92 | % |
S&P 500 Index | | | 9.75 | | | | 9.85 | | | | 4.24 | | | | 7.67 | | | | 15.45 | | | | 13.69 | |
The index is unmanaged. Because the S&P 500 Index was available only at month-end in 1987, we used the 3/31/87 value for performance since inception. Returns reflect reinvested capital gains and dividends but not the deduction of taxes an investor would pay on distributions or share redemptions. Performance data quoted represents past performance; past performance does not guarantee future results. The investment return and principal value of an investment will fluctuate so that an investor’s shares, when redeemed, may be worth more or less than their original cost. Current performance of the Fund may be lower or higher than the performance quoted. Performance data current to the most recent month end may be obtained by visiting longleafpartners.com. The Partners Fund is subject to stock market risk, meaning stocks in the Fund may fluctuate in response to developments at individual companies or due to general market and economic conditions. Also, because the Fund generally invests in 15 to 25 companies, share value could fluctuate more than if a greater number of securities were held. Mid-cap stocks held may be more volatile than those of larger companies.
The December 31, 2014 and 2013 total expense ratios for the Partners Fund are 0.91% and 0.92%, respectively. The expense ratios are subject to fee waiver to the extent normal annual operating expenses exceed 1.50% of average annual net assets.
| | | | | | |
| Partners Fund | | Longleaf Partners Funds | | ¡ | | 11 |
| | | | | | | | |
| Portfolio Holdings at December 31, 2014 | |
| | | |
| | | | | | Net Assets | |
Investments | | | | | | | 86.9 | % |
Level 3 Communications, Inc. | | | 9.8 | | | | | |
Loews Corporation | | | 7.7 | | | | | |
Cheung Kong Holdings Limited | | | 7.6 | | | | | |
Chesapeake Energy Corporation (Common& Preferred) | | | 6.6 | | | | | |
Koninklijke Philips N.V. | | | 6.2 | | | | | |
CONSOL Energy Inc. | | | 5.2 | | | | | |
Vivendi S.A. | | | 5.0 | | | | | |
McDonald’s Corporation | | | 4.7 | | | | | |
Scripps Networks Interactive, Inc. | | | 4.5 | | | | | |
Mondelez International, Inc. | | | 4.5 | | | | | |
CNH Industrial N.V. | | | 4.1 | | | | | |
FedEx Corporation | | | 4.0 | | | | | |
Abbott Laboratories | | | 3.7 | | | | | |
Murphy Oil Corporation | | | 3.5 | | | | | |
Franklin Resources, Inc. | | | 3.2 | | | | | |
The Travelers Companies, Inc. | | | 2.6 | | | | | |
The Bank of New York Mellon Corporation | | | 2.0 | | | | | |
Aon plc (Common & Options) | | | 2.0 | | | | | |
Cash Reserves Net of Other Assets and Liabilities | | | | | | | 13.1 | |
| | | | | | | 100.0 | % |
Fund holdings are subject to change and holding discussions are not recommendations to buy or sell any security.
| | | | |
Portfolio Changes
January 1, 2014 through
December 31, 2014 | |
| | |
| New Holdings | | Quarter | |
CNH Industrial N.V. | | | 4Q | |
Franklin Resources, Inc. | | | 3Q | |
McDonald’s Corporation | | | 3Q | |
Scripps Networks Interactive, Inc. – Class A | | | 3Q | |
Vivendi S.A. | | | 3Q | |
| |
| Eliminations | | | |
Berkshire Hathaway Inc. – Class B | | | 4Q | |
DIRECTV | | | 1Q | |
Seventy Seven Energy Inc. (Chesapeake Energy Corporation)(a) | | | 3Q | |
Vulcan Materials Company | | | 1Q | |
| (a) | Resulting from corporate action (associated holding) |
| | | | | | |
| 12 | | ¡ | | Annual Report | | Partners Fund |
| | | | | | | | | | | | | | |
| Common Stock | |
| | | | |
| | | Share Quantity | | | Market Value | | | % of Net Assets | |
Air Freight & Logistics | | | | | | | | | | | | |
FedEx Corporation | | | 1,752,682 | | | $ | 304,370,756 | | | | 4.0 | % |
Capital Markets | | | | | | | | | | | | |
The Bank of New York Mellon Corporation | | | 3,710,600 | | | | 150,539,042 | | | | 2.0 | |
Franklin Resources, Inc. | | | 4,334,200 | | | | 239,984,654 | | | | 3.2 | |
| | | | | | | 390,523,696 | | | | 5.2 | |
Diversified Telecommunication Services | | | | | | | | | | | | |
Level 3 Communications, Inc.*(b) | | | | | 15,026,565 | | | | 742,011,780 | | | | 9.8 | |
Vivendi S.A. (Foreign) | | | 15,284,700 | | | | 380,445,248 | | | | 5.0 | |
| | | | | | | 1,122,457,028 | | | | 14.8 | |
Food Products | | | | | | | | | | | | |
Mondelez International, Inc. – Class A | | | 9,278,909 | | | | 337,056,370 | | | | 4.5 | |
Health Care Equipment & Supplies | | | | | | | | | | | | |
Abbott Laboratories | | | 6,169,700 | | | | 277,759,894 | | | | 3.7 | |
Hotels, Restaurants, & Leisure | | | | | | | | | | | | |
McDonald’s Corporation | | | 3,774,000 | | | | 353,623,800 | | | | 4.7 | |
Industrial Conglomerates | | | | | | | | | | | | |
Koninklijke Philips N.V. (Foreign) | | | 13,374,100 | | | | 387,662,710 | | | | 5.1 | |
Koninklijke Philips N.V. ADR (Foreign) | | | 2,734,493 | | | | 79,300,297 | | | | 1.1 | |
| | | | | | | 466,963,007 | | | | 6.2 | |
Insurance | | | | | | | | | | | | |
Aon plc (Foreign) | | | 774,841 | | | | 73,478,172 | | | | 1.0 | |
Loews Corporation | | | 13,853,000 | | | | 582,103,060 | | | | 7.7 | |
The Travelers Companies, Inc. | | | 1,857,600 | | | | 196,626,960 | | | | 2.6 | |
| | | | | | | 852,208,192 | | | | 11.3 | |
Machinery | | | | | | | | | | | | |
CNH Industrial N.V. (Foreign) | | | 8,671,174 | | | | 69,889,662 | | | | 0.9 | |
CNH Industrial N.V. (Local) (Foreign) | | | 29,590,320 | | | | 239,536,614 | | | | 3.2 | |
| | | | | | | 309,426,276 | | | | 4.1 | |
Media | | | | | | | | | | | | |
Scripps Networks Interactive, Inc. – Class A | | | 4,554,500 | | | | 342,817,215 | | | | 4.5 | |
Oil, Gas & Consumable Fuels | | | | | | | | | | | | |
Chesapeake Energy Corporation | | | 22,986,928 | | | | 449,854,181 | | | | 6.0 | |
CONSOL Energy Inc.(b) | | | 11,692,000 | | | | 395,306,520 | | | | 5.2 | |
Murphy Oil Corporation | | | 5,178,829 | | | | 261,634,441 | | | | 3.5 | |
| | | | | | | 1,106,795,142 | | | | 14.7 | |
Real Estate Management & Development | | | | | | | | | | | | |
Cheung Kong Holdings Limited (Foreign) | | | 34,067,000 | | | | 570,514,068 | | | | 7.6 | |
Total Common Stocks (Cost $5,280,212,257) | | | | | | | 6,434,515,444 | | | | 85.3 | |
See Notes to Financial Statements
| | | | | | |
| Partners Fund | | Longleaf Partners Funds | | ¡ | | 13 |
| | | | | | | | | | | | | | |
| Preferred Stock | |
| | | | |
| | | Share Quantity | | | Market Value | | | % of Net Assets | |
Oil, Gas & Consumable Fuels | | | | | | | | | | | | |
Chesapeake Energy Corporation Convertible Preferred Stock 5.75% | | | 10,000 | | | $ | 10,381,250 | | | | 0.1 | % |
Chesapeake Energy Corporation Convertible Preferred Stock – Series A 5.75% | | | 35,480 | | | | 36,411,350 | | | | 0.5 | |
Total Preferred Stocks (Cost $36,260,538) | | | | | | | 46,792,600 | | | | 0.6 | |
| Options Purchased | |
| | | | |
| | | Share Equivalents | | | | | | | |
Insurance | | | | | | | | | | | | |
Aon plc Call, 9/1/15 to 9/30/15, with J.P. Morgan,
Strike Price $80 (Foreign)
(Cost $27,502,879) | | | 4,859,166 | | | | 76,969,189 | | | | 1.0 | |
| Short-Term Obligations | |
| | | | |
| | | Principal Amount | | | | | | | |
Repurchase Agreement with State Street Bank,
0.0% due 1/2/15, Repurchase price $294,474,000 (Collateral: $226,390,000 U.S. Treasury Bonds,
2.60% – 2.76% due 5/15/38 to 11/15/42,
Value $300,367,138) | | | 294,474,000 | | | | 294,474,000 | | | | 3.9 | |
U.S. Treasury Bills, 0.01% – 0.07% due 3/19/15 to 6/25/15 | | | 700,000,000 | | | | 699,849,150 | | | | 9.3 | |
Total Short-Term Obligations (Cost $994,382,464) | | | | 994,323,150 | | | | 13.2 | |
Total Investments (Cost $6,338,358,138)(a) | | | | 7,552,600,383 | | | | 100.1 | |
Options Written | | | | (534,508 | ) | | | – | |
Other Assets and Liabilities, Net | | | | (4,457,435 | ) | | | (0.1 | ) |
Net Assets | | | $ | 7,547,608,440 | | | | 100.0 | % |
Net asset value per share | | | $ | 31.24 | | | | | |
| * | Non-income producing security. |
| (a) | Aggregate cost for federal income tax purposes is $6,349,250,375. Net unrealized appreciation of $1,214,242,245 consists of unrealized appreciation and depreciation of $1,275,897,791 and $(61,655,546), respectively. |
| (b) | Affiliated issuer during the period. See Note 7. |
Note: Companies designated as “Foreign” are headquartered outside the U.S. and represent 25% of net assets.
| | | | | | | | | | | | | | | | |
| Options Written | |
| | | | | |
| | | Share Equivalents | | | Unrealized Gain | | | Market Value | | | % of Net Assets | |
Insurance | | | | | | | | | | | | | | | | |
Aon plc Put, 9/1/15 to 9/30/15, with J.P. Morgan, Strike Price $65 (Foreign)
(Premiums received $20,943,005) | | | (4,859,166 | ) | | $ | 20,408,497 | | | $ | (534,508 | ) | | | – | % |
See Notes to Financial Statements

| | | | | | |
| Small-Cap Fund | | Longleaf Partners Funds | | ¡ | | 15 |
| | |
| Small-Cap Fund Management Discussion | | |
Longleaf Partners Small-Cap Fund returned 12.49% in 2014 and far surpassed the Russell 2000 Index’s 4.89% rise. Strong returns in a number of stocks drove the outperformance. In the fourth quarter, the Fund added 3.82% and lagged the Index’s 9.73% advance due in part to our sizeable cash position. Over longer term periods shown below, the Fund’s performance consistently surpassed the Index. For the last one and five years, Longleaf Small-Cap also exceeded our annual absolute return goal of inflation plus 10%, as it did for the last 20 years.
| | | | | | | | | | | | | | | | | | | | | | | | | | | | | | | | |
| Cumulative Returns at December 31, 2014 | |
| | | Since
Inception | | | 25
Year | | | 20
Year | | | 15
Year | | | Ten
Year | | | Five
Year | | | One
Year | | | 4Q | |
Small-Cap Fund (Inception
2/21/89) | | | 1555.39 | % | | | 1262.34 | % | | | 1061.72 | % | | | 395.44 | % | | | 162.10 | % | | | 124.66 | % | | | 12.49 | % | | | 3.82 | % |
Russell 2000 Index | | | 1015.68 | | | | 922.99 | | | | 529.46 | | | | 190.92 | | | | 111.26 | | | | 105.95 | | | | 4.89 | | | | 9.73 | |
| |
| Average Annual Returns at December 31, 2014 | | | | |
| | | Since
Inception | | | 25
Year | | | 20
Year | | | 15
Year | | | Ten
Year | | | Five
Year | | | One
Year | | | | |
Small-Cap Fund (Inception
2/21/89) | | | 11.47 | % | | | 11.01 | % | | | 13.05 | % | | | 11.26 | % | | | 10.11 | % | | | 17.57 | % | | | 12.49 | % | | | | |
Russell 2000 Index | | | 9.78 | | | | 9.75 | % | | | 9.63 | | | | 7.38 | | | | 7.77 | | | | 15.55 | | | | 4.89 | | | | | |
Returns reflect reinvested capital gains and dividends but not the deduction of taxes an investor would pay on distributions or share redemptions. Performance data quoted represents past performance; past performance does not guarantee future results. The investment return and principal value of an investment will fluctuate so that an investor’s shares, when redeemed, may be worth more or less than their original cost. Current performance of the fund may be lower or higher than the performance quoted. Performance data current to the most recent month end may be obtained by visiting longleafpartners.com.
The December 31, 2014 and 2013 total expense ratios for the Small-Cap Fund are 0.91%. The expense ratios are subject to fee waiver to the extent normal annual operating expenses exceed 1.50% of average annual net assets.
The merged positions of fiber and networking companies Level 3 Communications and tw telecom gained 49% and led the Fund’s performance for the year, after adding 8% in the fourth quarter. Level 3 provides critical infrastructure that connects businesses and consumers to the internet, allowing them to move data, video and voice. The company’s cash-and-stock acquisition of tw telecom closed in the fourth quarter, and the two names combined into the Fund’s largest single holding. By merging the two companies, Level 3 significantly expanded its network reach in metropolitan markets and gained additional capacity to grow its enterprise customer base. Throughout the year, CEO Jeff Storey and his team delivered solid revenue
growth, margin improvement, and higher free cash flow. The stock remains significantly below our appraisal of its operating networks and non-earning dark fiber and conduit assets.
Cement producer Texas Industries (TXI) gained 35% before we sold it at the start of the third quarter following Martin Marietta’s all-stock acquisition of the company. In spite of the financial crisis and worst recession in our lifetime, we doubled our money in the eight years we owned TXI.
Media and education company Graham Holdings (the renamed Washington Post) gained 32% for the year after a 24% rise in the fourth quarter. In November the company announced that it would
| | | | | | |
| 16 | | ¡ | | Annual Report | | Small-Cap Fund |
Weaker small-cap stock prices enabled us to add seven new positions.
spin off its Cable ONE subsidiary. This move, combined with sales of other assets and the tax-free exchange of a Miami television station for undervalued company shares earlier in the year, illustrates how owner-operators can grow value per share through smart capital allocation. On the operating side, the Kaplan business was steady throughout the year. Graham Holdings continued its legacy of capable, aligned leadership with the addition of its new president, Tim O’Shaughnessy, in the recent quarter.
Vail Resorts, owner of U.S. ski resorts, added 24% for the year and 6% in the quarter. Ski pass sales and pricing were strong throughout the year. The company’s acquisition of Park City Mountain Resort in Utah, when connected with Vail’s Canyons Resort, will create the largest ski resort in the country. Vail’s move into Utah has created significant value for shareholders already, and further upside remains.
Empire State Realty Trust (ESRT), the NY metropolitan office REIT (Real Estate Investment Trust), was up 17% for the year after an 18% gain in the fourth quarter. ESRT grew attendance and pricing at the observatory in the Empire State Building and leased various Manhattan office properties at higher rents.
Integrated satellite company ViaSat, which we bought in the summer, added 14% in the fourth quarter. The company delivers fast, secure-communications, internet, and network access to consumers in virtually any U.S. location and also has a stable government business. ViaSat recently reported better-than-expected growth in its Exede residential broadband subscribers and a strong backlog in its government segment.
The Fund had three main detractors in the year, two of which overlapped with the detractors in the fourth quarter. California Resources Group (CRC), the oil and gas company that we purchased in the recent quarter, declined 18%. CRC was recently spun out of Occidental Petroleum and is the largest operator of oil and gas in the state of California. CRC has quality assets, plus a strong management team and board. We believe the low decline nature of its production will allow the
company to survive the oil and gas price downturn better than other levered peers.
Rayonier’s 9% decline in the fourth quarter took its 2014 return to -2%. The company reported that it had overcut its Pacific Northwest timber over the last 10 years. To compensate, Rayonier will reduce its harvest, lowering the dividend from $1.20 to $1 per share. This disappointing news decreased our appraisal, but we believe this is a one-time adjustment that does not alter the quality of the company’s various timber assets. New CEO Dave Nunes addressed the overcutting quickly, and the company is significantly discounted in our view.
Global fertilizer and chemical producer OCI fell 22% for the year, but gained 13% in the fourth quarter after positive news on various fronts. Egyptian natural gas shortages that had negatively impacted OCI’s plant utilization rates stabilized; the company won an Egyptian tax case related to the 2007 sale of its cement unit; and the EPA issued its final construction permit for the greenfield Beaumont, Texas plant that will be the largest methanol facility in the U.S. and is scheduled to begin production in 2016. CEO Nassef Sawiris’ decision in the third quarter to spin out the legacy construction business should help the market properly value OCI as a pure-play nitrogen company. Sawiris opportunistically bought shares personally throughout the year to take advantage of the price discount.
Film studio DreamWorks Animation, which we bought in the third quarter, initially made large gains after reports of acquisition talks with Japanese company Softbank. Following no deal announcement and a weak release of Penguins of Madagascar, DreamWorks pulled back 17% in the fourth quarter, but was up 15% over our holding period in the year. The company owns a valuable movie library and has attractive opportunity in TV, web content, and licensing.
Weaker small-cap stock prices enabled us to add seven new positions, primarily in the second half of the year. The decline in energy prices in the fourth quarter provided an opportunity to initiate positions including CONSOL Energy, California Resources and Diamond Offshore Drilling (DO) at
| | | | | | |
| Small-Cap Fund | | Longleaf Partners Funds | | ¡ | | 17 |
deep discounts to their long-term asset values. DO quickly rose 34%, and we sold it because we had only been able to purchase a small stake within our price limit. In the fourth quarter we also bought industrial specialty chemical company Chemtura. Earlier in the year we purchased our aforementioned ViaSat and DreamWorks stakes as well as Deltic Timber.
We sold nine holdings during the year as prices approached our appraisal values, including Wendy’s, Martin Marietta, and Legg Mason in the first quarter and TXI and DineEquity in the third quarter. In addition to DO, we sold Canadian based Fairfax Financial in the fourth quarter following its 16% stock appreciation in the year. We first purchased Fairfax in April 2000, and it returned 11% annualized over our holding period. CEO Prem Watsa steered the company through challenges in the early 2000s and improved insurance operations over time. He also regularly grew book value, with particularly strong investment returns in the Global Financial Crisis of 2008/2009 when he made substantial gains on credit default swaps. We also exited two small positions that were spun out of existing holdings – Rayonier Advanced Materials and Hopewell Highway.
The Fund began 2014 with 35% cash, but our new positions reduced cash to 23%. They also helped improve the price-to-value ratio (P/V) to the mid-70s%. Our on-deck list of prospective names improved, but finding deeply discounted names that qualify remains difficult. As we did in 2014 and have done previously when qualifiers were elusive, we will remain patient and disciplined but act decisively when opportunities come our way.
| | | | | | |
| 18 | | ¡ | | Annual Report | | Small-Cap Fund |
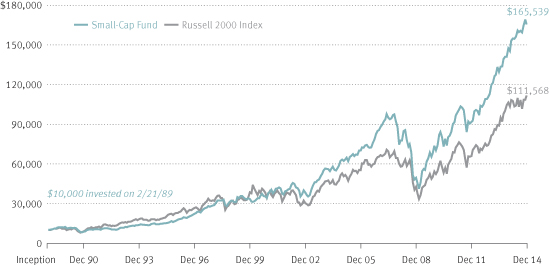
Comparison of Change in Value of $10,000 Investment
Since Inception February 21, 1989
| | | | | | | | | | | | | | | | | | | | | | | | |
| Average Annual Returns for the Periods Ended December 31, 2014 | |
| | | Since Inception 2/21/89 | | | 20 Year | | | 15 Year | | | Ten Year | | | Five Year | | | One Year | |
Small-Cap Fund | | | 11.47 | % | | | 13.05 | % | | | 11.26 | % | | | 10.11 | % | | | 17.57 | % | | | 12.49 | % |
Russell 2000 Index | | | 9.78 | | | | 9.63 | | | | 7.38 | | | | 7.77 | | | | 15.55 | | | | 4.89 | |
The index is unmanaged. Returns reflect reinvested capital gains and dividends but not the deduction of taxes an investor would pay on distributions or share redemptions. Performance data quoted represents past performance; past performance does not guarantee future results. The investment return and principal value of an investment will fluctuate so that an investor’s shares, when redeemed, may be worth more or less than their original cost. Current performance of the Fund may be lower or higher than the performance quoted. Performance data current to the most recent month end may be obtained by visiting longleafpartners.com. The Small-Cap Fund is subject to stock market risk, meaning stocks in the Fund may fluctuate in response to developments at individual companies or due to general market and economic conditions. Also, because the Fund generally invests in 15 to 25 companies, share value could fluctuate more than if a greater number of securities were held. Smaller company stocks may be more volatile with less financial resources than those of larger companies.
The December 31, 2014 and 2013 total expense ratios for the Small-Cap Fund are 0.91%. The expense ratios are subject to fee waiver to the extent normal annual operating expenses exceed 1.50% of average annual net assets.
| | | | | | |
| Small-Cap Fund | | Longleaf Partners Funds | | ¡ | | 19 |
| | | | | | | | |
| Portfolio Holdings at December 31, 2014 | |
| | | |
| | | | | | Net Assets | |
Investments | | | | | | | 76.9 | % |
Level 3 Communications, Inc. | | | 14.0 | | | | | |
Graham Holdings Company | | | 8.4 | | | | | |
Everest Re Group, Ltd. | | | 5.6 | | | | | |
OCI N.V. | | | 5.3 | | | | | |
ViaSat, Inc. | | | 4.9 | | | | | |
Rayonier Inc. | | | 4.9 | | | | | |
Vail Resorts, Inc. | | | 4.8 | | | | | |
DreamWorks Animation SKG, Inc. | | | 4.8 | | | | | |
Hopewell Holdings Limited | | | 4.5 | | | | | |
Scripps Networks Interactive, Inc. | | | 4.5 | | | | | |
CONSOL Energy Inc. | | | 4.3 | | | | | |
California Resources Corporation | | | 4.2 | | | | | |
Empire State Realty Trust, Inc. | | | 4.0 | | | | | |
Chemtura Corporation | | | 2.3 | | | | | |
Deltic Timber Corporation | | | 0.4 | | | | | |
Cash Reserves Net of Other Assets and Liabilities | | | | | | | 23.1 | |
| | | | | | | 100.0 | % |
Fund holdings are subject to change and holding discussions are not recommendations to buy or sell any security.
| | | | |
Portfolio Changes January 1, 2014 through December 31, 2014 | |
| | |
| New Holdings | | Quarter | |
California Resources Corporation | | | 4Q | |
Chemtura Corporation | | | 4Q | |
CONSOL Energy Inc. | | | 4Q | |
Deltic Timber Corporation | | | 3Q | |
Diamond Offshore Drilling, Inc. | | | 4Q | |
DreamWorks Animation SKG, Inc. | | | 3Q | |
ViaSat, Inc. | | | 2Q | |
| |
| Eliminations | | | |
Diamond Offshore Drilling, Inc. | | | 4Q | |
DineEquity, Inc. | | | 3Q | |
Fairfax Financial Holdings Limited | | | 4Q | |
Hopewell Highway Infrastructure Limited (Hopewell Highway Limited)(a) | | | 4Q | |
Legg Mason, Inc. | | | 1Q | |
Martin Marietta Materials, Inc. | | | 1Q | |
Rayonier Advanced Materials (Rayonier Inc.)(a) | | | 2Q | |
Texas Industries, Inc. | | | 3Q | |
tw telecom inc. (Level 3 Communications, Inc.)(a) | | | 4Q | |
The Wendy’s Company | | | 1Q | |
| (a) | Resulting from corporate action (associated holding) |
| | | | | | |
| 20 | | ¡ | | Annual Report | | Small-Cap Fund |
| | | | | | | | | | | | |
| Common Stock | | | | | | | | | |
| | | | |
| | | Share Quantity | | | Market Value | | | % of Net Assets | |
Chemicals | | | | | | | | | | | | |
Chemtura Corporation*(b) | | | 4,071,919 | | | $ | 100,698,557 | | | | 2.3 | % |
Communications Equipment | | | | | | | | | | | | |
ViaSat, Inc.*(b) | | | 3,436,313 | | | | 216,590,808 | | | | 4.9 | |
Construction & Engineering | | | | | | | | | | | | |
OCI N.V.* (Foreign) | | | 6,731,600 | | | | 234,057,295 | | | | 5.3 | |
Diversified Consumer Services | | | | | | | | | | | | |
Graham Holdings Company – Class B(b) | | | 428,000 | | | | 369,667,880 | | | | 8.4 | |
Diversified Telecommunication Services | | | | | | | | | | | | |
Level 3 Communications, Inc.* | | | 12,428,000 | | | | 613,694,640 | | | | 14.0 | |
Hotels, Restaurants & Leisure | | | | | | | | | | | | |
Vail Resorts, Inc.(b) | | | 2,318,300 | | | | 211,266,679 | | | | 4.8 | |
Industrial Conglomerates | | | | | | | | | | | | |
Hopewell Holdings Limited (Foreign)(b) | | | 54,532,000 | | | | 198,503,442 | | | | 4.5 | |
Insurance | | | | | | | | | | | | |
Everest Re Group, Ltd. (Foreign) | | | 1,449,600 | | | | 246,866,880 | | | | 5.6 | |
Media | | | | | | | | | | | | |
DreamWorks Animation SKG, Inc. – Class A*(b) | | | 9,331,277 | | | | 208,367,415 | | | | 4.8 | |
Scripps Networks Interactive, Inc. – Class A | | | 2,591,300 | | | | 195,047,151 | | | | 4.5 | |
| | | | | | | 403,414,566 | | | | 9.3 | |
Oil, Gas & Consumable Fuels | | | | | | | | | | | | |
California Resources Corporation*(b) | | | 33,090,500 | | | | 182,328,655 | | | | 4.2 | |
CONSOL Energy Inc. | | | 5,557,153 | | | | 187,887,343 | | | | 4.3 | |
| | | | | | | 370,215,998 | | | | 8.5 | |
Paper & Forest Products | | | | | | | | | | | | |
Deltic Timber Corporation | | | 278,201 | | | | 19,028,948 | | | | 0.4 | |
Real Estate Investment Trusts (REITs) | | | | | | | | | | | | |
Empire State Realty Trust, Inc. – Class A(b) | | | 9,967,200 | | | | 175,223,376 | | | | 4.0 | |
Rayonier Inc.(b) | | | 7,627,921 | | | | 213,124,113 | | | | 4.9 | |
| | | | | | | 388,347,489 | | | | 8.9 | |
Total Common Stocks (Cost $2,672,552,162) | | | | | | | 3,372,353,182 | | | | 76.9 | |
| Options Purchased | | | | | | | | | |
| | | | |
| | | Currency Units | | | | | | | |
Currency | | | | | | | | | | | | |
Hong Kong Dollar Put, 4/20/17, with BNP Paribas, Strike Price $7.77 (Foreign) (Cost $3,580,175) | | | 189,210,080 | | | | 1,676,023 | | | | – | |
See Notes to Financial Statements
| | | | | | |
| Small-Cap Fund | | Longleaf Partners Funds | | ¡ | | 21 |
| | | | | | | | | | | | |
| Short-Term Obligations | | | | | | | | | |
| | | | |
| | | Principal Amount | | | Market Value | | | % of Net Assets | |
Repurchase Agreement with State Street Bank,
0.0% due 1/2/15, Repurchase price $131,458,000 (Collateral: $121,635,000 U.S. Treasury Bonds, 2.74% – 2.76% due 11/15/42 to 11/15/43, Value $134,091,381) | | | 131,458,000 | | | $ | 131,458,000 | | | | 3.0 | % |
U.S. Treasury Bills, 0.00% - 0.01% due 1/2/15 to 3/19/15 | | | 850,000,000 | | | | 849,990,648 | | | | 19.4 | |
Total Short-Term Obligations (Cost $981,450,809) | | | | | | | 981,448,648 | | | | 22.4 | |
Total Investments (Cost $3,657,583,146)(a) | | | | | | | 4,355,477,853 | | | | 99.3 | |
Other Assets and Liabilities, Net | | | | | | | 28,403,778 | | | | 0.7 | |
Net Assets | | | | | | $ | 4,383,881,631 | | | | 100.0 | % |
Net asset value per share | | | | | | $ | 30.42 | | | | | |
| * | Non-income producing security. |
| (a) | Also represents aggregate cost for federal tax purposes. Net unrealized appreciation of $697,894,707 consists of unrealized appreciation and depreciation of $810,896,745 and $(113,002,038), respectively. |
| (b) | Affiliated issuer during the period. See Note 7. |
| Note: | Companies designated as “Foreign” are headquartered outside the U.S. and represent 16% of net assets. |
See Notes to Financial Statements
| | | | | | |
| 22 | | ¡ | | Annual Report | | International Fund |
| | |
| International Fund Management Discussion | | |
Longleaf Partners International Fund declined 6.59% in the fourth quarter and 14.76% for the full year, underperforming the MSCI EAFE Index’s decline of 3.57% and 4.90% for the two periods. The Fund’s relative performance divergence occurred primarily in the second half of the year. At the end of the first quarter, the International Fund was ahead of the Index for trailing one and five year periods, but relative returns reversed with the steep decline over the last six months. We are disappointed in the recent performance and its impact on our longer term numbers, but we remain highly confident in the quality of our businesses and management partners. Over the 16+ years since its start, Longleaf International has doubled the cumulative performance of the MSCI EAFE Index. We believe the portfolio is positioned to outperform from its current discounted level over the next several years.
| | | | | | | | | | | | | | | | | | | | | | | | |
| Cumulative Returns at December 31, 2014 | |
| | | Since Inception | | | 15
Year | | | Ten
Year | | | Five
Year | | | One
Year | | | 4Q | |
International
Fund (Inception
10/26/98) | | | 234.08 | % | | | 146.40 | % | | | 36.02 | % | | | 19.98 | % | | | -14.76 | % | | | -6.59 | % |
MSCI EAFE
Index | | | 102.18 | | | | 45.73 | | | | 54.29 | | | | 29.68 | | | | -4.90 | | | | -3.57 | |
| |
| Average Annual Returns at December 31, 2014 | | | | |
| | | Since Inception | | | 15
Year | | | Ten
Year | | | Five
Year | | | One
Year | | | | |
International Fund (Inception
10/26/98) | | | 7.74 | % | | | 6.20 | % | | | 3.12 | % | | | 3.71 | % | | | -14.76 | % | | | | |
MSCI EAFE Index | | | 4.45 | | | | 2.54 | | | | 4.43 | | | | 5.33 | | | | -4.90 | | | | | |
Returns reflect reinvested capital gains and dividends but not the deduction of taxes an investor would pay on distributions or share redemptions. Performance data quoted represents past performance; past performance does not guarantee future results. The investment return and principal value of an investment will fluctuate so that an investor’s shares, when redeemed, may be worth more or less than their original cost. Current performance of the fund may be lower or higher than the performance quoted. Performance data current to the most recent month end may be obtained by visiting longleafpartners.com.
The December 31,2014 and 2013 total expense ratios for the International Fund are 1.25% and 1.27%, respectively. The expense ratios are subject to fee waiver to the extent normal annual operating expenses exceed 1.75% of average annual net assets.
Positive performance at a number of holdings was overshadowed by declines across the majority of our companies due primarily to the combination of a strong U.S. dollar and tighter regulation and economic controls in China. More than half of the Fund’s negative return for the year was attributable to currency translation into the U.S. dollar (USD). USD strength against the euro, which was the base currency for a dozen of our holdings over the year, meant that positive local returns at many of our European holdings
translated into negative USD returns. These currency conversions did not reflect the underlying operating performance of our businesses and did not impact our long-term appraisals nearly as much as they impacted prices. The USD/euro disparity may continue given current fears of a Greek exit from the Eurozone as well as slower economic growth in Europe. Most of our European holdings are global market leaders with strong balance sheets, and much of their underlying revenue exposure is
| | | | | | |
| International Fund | | Longleaf Partners Funds | | ¡ | | 23 |
outside of Europe. Most short-term currency dislocations will self correct over time, and our outlook for our companies’ fundamentals remains strong. The stock return figures cited below are shown in USD; most local returns were higher.
Hong Kong based conglomerate Cheung Kong was the largest contributor for the year, gaining 15%. Over the course of 2014, results at most of the company’s operating divisions were strong. Additionally, management made several value-enhancing asset sales across multiple business lines at low cap rates and used proceeds to opportunistically reinvest in discounted infrastructure deals outside of Asia with double-digit IRRs (internal rates of return). Management also returned proceeds to shareholders in the form of dividends. Most recently, in a joint venture with Mitsubishi Corp, Cheung Kong bought an airplane leasing portfolio. With its strong balance sheet, Cheung Kong can take advantage of Hong Kong land banking opportunities if prices correct.
Canadian property and casualty insurance company Fairfax Financial added 15% for the year before we sold it in the fourth quarter. We first purchased Fairfax in January 2000, and it returned approximately 11% annualized over our holding period. CEO Prem Watsa steered the company through challenges in the early 2000s and improved insurance operations over time. He also regularly grew book value, with particularly strong investment returns in the Global Financial Crisis of 2008/2009 when he made substantial gains on credit default swaps.
French luxury goods business Christian Dior (CDI), which we bought early in the year, was the largest performance contributor for the quarter, adding 17%, and ending the year up 13%. Christian Dior is the holding company for LVMH Moët Hennessy-Louis Vuitton (LVMH) and Dior Couture, the world’s most prominent collection of luxury brands. Given its holding company structure, CDI has historically traded at a discount to LVMH ranging from 7% to 40%. Gaining LVMH economic exposure through CDI aligns our interests with owner-operator Bernard Arnault. After nearly tripling shareholder capital on
LVMH’s 24% stake in Hermès, Arnault distributed the Hermès stake to LVMH shareholders, and CDI’s board decided to distribute its pro-rata share of the Hermès stake. We sold the Hermès shares above our appraisal. The transaction realized a 13% yield on our average cost for CDI. Arnault’s opportunistic purchase of Hermès in the Global Financial Crisis and subsequent decision to distribute the fully-valued shares illustrate his financial discipline and intense focus on shareholder value creation.
Global fertilizer and chemical producer OCI also had a strong fourth quarter, adding 13% after positive news on various fronts. Egyptian natural gas shortages that had negatively impacted OCI’s plant utilization rates stabilized; the company won an Egyptian tax case related to the 2007 sale of its cement unit; and the EPA issued its final construction permit for the greenfield Beaumont, Texas plant that will be the largest methanol facility in the U.S. and is scheduled to begin production in 2016. CEO Nassef Sawiris’ decision in the third quarter to spin out the legacy construction business should help the market properly value OCI as a pure-play nitrogen company. Sawiris opportunistically bought shares personally throughout the year to take advantage of the price discount.
Those names that most hurt performance in the year were among the large detractors in the fourth quarter. Increased regulatory and economic controls in China directly or indirectly impacted stock prices. Chinese VIP gamblers reduced their visits to Macau, and lower Chinese demand for natural resources pressured many commodity prices as well as stocks and currencies in countries that produce resources. Some of our businesses and many of our stocks felt the impact, but the longer term fundamentals of our holdings are intact. This broad economic pressure is reminiscent of late 2011 when any stocks directly or indirectly associated with Europe were under pressure. Price declines lasted through the first half of 2012, but those discounted names set the stage for our strong outperformance in 2013. We believe our current Asian holdings are similarly well-positioned for a strong recovery.
The longer term fundamentals of our holdings are intact.
| | | | | | |
| 24 | | ¡ | | Annual Report | | International Fund |
| | |
| International Fund Management Discussion | | |
Increased government scrutiny and regulation in China hurt all Macau gaming companies indiscriminately and made our stakes in Melco and Galaxy via K.Wah primary performance detractors for the year with Melco down 39% and K.Wah, bolstered by its Hong Kong real estate, down 19%. At Melco, less than 15% of EBITDA (earnings before interest, taxes, depreciation, and amortization) is tied to lower margin VIP visitors who have been most severely impacted by China’s anti-corruption scrutiny and increased regulation. Melco grew its mass gaming business at a higher rate than the overall market. The company bought back 15.8 million shares, approximately 1%, over the last four months, and CEO Lawrence Ho bought an approximate $HK600 million personally in 2014. K. Wah owns 3.9% of Galaxy Entertainment, which caters more to Macau’s VIP business. Galaxy significantly outperformed the broader VIP market, and has an advantage with its planned opening in mid-2015 of the next major casino expansion on the Cotai Peninsula. Excluding the discounted market value of its stake in Galaxy, K. Wah’s remaining property business trades at less than 1/3 of book value. Management opportunistically bought urban Hong Kong land at a discount to subsequent auctions in the same area. The planned launch of large scale projects in Tseung Kwan O should increase 2015 sales. Even in the storm of worry that labeled 2014 a disastrous year for Macau gaming, overall revenues fell less than 3%, the number of visitors rose, and mass revenues grew double-digits. The Chinese government has demonstrated its long-term support of Macau with massive infrastructure projects, and efforts to crack down on corruption and attract more legitimate visitors ultimately will benefit our holdings. We are excited to own these businesses as increased accessibility and additional room supply should enable revenues to rise at healthy levels.
Lower demand from China, increased supply from major industry players, and adverse movements in resource-rich currencies and stock markets depressed iron ore prices by 49% for the year, reaching their lowest level since June 2009. Our position in Brazilian iron ore company Manabi declined 45% in the fourth quarter and 60% in the
year. Manabi’s lower price reflects the current commodity environment and delays in implementing the company’s operating plan. Iron ore pressure also hurt Australian based mining services company Mineral Resources (MIN RE), which we bought in the first quarter, with returns down 32% in the year after a 15% fourth quarter decline. Because MIN RE owns some mines, it traded with the iron ore industry. Its core business of iron ore crushing and services, however, depends on volume of work rather than commodity price. Because MIN RE provides crushing services at less than half the cost that miners can achieve themselves, the company benefits as large Australian miners turn to lower-cost outsourcing when ore prices fall. Businesses unrelated to its mines produce $250 million in EBITDA, meaning the company trades at just over 4x EV/ EBITDA (enterprise value/earnings before interest, taxes, depreciation, and amortization). Management is using its financial flexibility to invest in crushing and processing capacity at this opportunistic time.
We bought BR Properties, Brazil’s largest manager of commercial office buildings, in the first quarter. Brazilian stocks and currency declined following the recent re-election of President Dilma Rousseff, who has doubled the pace of interest rate increases in an effort to slow inflation. Our stake in BR Properties fell 27% in the fourth quarter and 29% over our holding period. As lending rates increased to 11.75% and the Brazilian real fell to a nine-year low in December, the entire Brazilian real estate sector declined. BR Properties successfully navigated the political environment under Dilma over the past four years, and the long-term business value of its properties is much more stable than either these rate changes or currency moves. The company continued to lease its new buildings, sold non-core assets, and bought back shares at a steep discount.
Broad pressure on the Norwegian economy and stock market following the price slide in oil hurt our return in consumer goods company Orkla, as did the kroner’s decline to its lowest level since 2009. Orkla lost 25% in the fourth quarter, offsetting earlier gains and ending the year down 9%. Management moved to focus on the branded
| | | | | | |
| International Fund | | Longleaf Partners Funds | | ¡ | | 25 |
consumer goods business following the IPO (initial public offering) of its aluminum business, Granges. This listing strengthened Orkla’s balance sheet by deconsolidating the company’s debt.
Throughout the year we bought nine new positions as dislocations around the world and at individual companies gave us more attractive opportunities than usual. In addition to the first quarter purchases of CDI, MIN RE, and BR Properties discussed above, we added Vopak. In the second quarter, we bought Iida and Colt, and in the third quarter, adidas and Vivendi. In the last three months, we bought Australian-based testing, inspection, and certification company ALS Limited. The same previously described mining pressures impacted ALS, which is associated with Australian mining even though the company has minimal exposure to iron ore.
We exited an unusually high number of businesses because some approached our appraisals and others presented the opportunity to sell more fully valued and/or lesser quality names to position the portfolio in businesses with a larger margin of safety and higher expected value growth. In the most recent quarter, we sold Fairfax and the Hermès distribution from CDI as described above. We exited Vopak, a first quarter purchase, Iida, a second quarter purchase, and NewsCorp after our investment cases changed.
We thank our fellow shareholders for your continued partnership in a year when short-term performance did not reflect our long-term value proposition. As the Fund’s largest owners, we are not pleased with our recent performance. The return, however, does not adequately reflect the underlying progress our companies made during the year. We are confident in the collection of high quality, industry-leading companies in the portfolio as well as in our management partners who are taking action to build shareholder value. As we would expect from shareholder-oriented managements with meaningfully discounted shares, we saw buybacks at most companies and personal share purchases by many of our partners. As you would expect from your
investment management partners, we have been adding to our personal holdings in the International Fund, which currently trades at a mid-60s% price-to-value ratio (P/V).
| | | | | | |
| 26 | | ¡ | | Annual Report | | International Fund |
Comparison of Change in Value of $10,000 Investment
Since Inception October 26, 1998
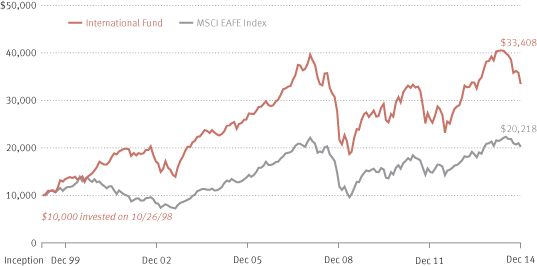
| | | | | | | | | | | | | | | | | | | | |
| Average Annual Returns for the Periods Ended December 31, 2014 | |
| | | Since Inception 10/26/98 | | | 15 Year | | | Ten Year | | | Five Year | | | One Year | |
International Fund | | | 7.74 | % | | | 6.20 | % | | | 3.12 | % | | | 3.71 | % | | | -14.76 | % |
MSCI EAFE Index | | | 4.45 | | | | 2.54 | | | | 4.43 | | | | 5.33 | | | | -4.90 | |
The index is unmanaged. Because the MSCI EAFE was available only at month-end in 1998, we used the 10/31/98 value for performance since inception. Returns reflect reinvested capital gains and dividends but not the deduction of taxes an investor would pay on distributions or share redemptions. Performance data quoted represents past performance; past performance does not guarantee future results. The investment return and principal value of an investment will fluctuate so that an investor’s shares, when redeemed, may be worth more or less than their original cost. Current performance of the Fund may be lower or higher than the performance quoted. Performance data current to the most recent month end may be obtained by visiting longleafpartners.com. The International Fund is subject to stock market risk, meaning stocks in the Fund may fluctuate in response to developments at individual companies or due to general market and economic conditions. Also, because the Fund generally invests in 15 to 25 companies, share value could fluctuate more than if a greater number of securities were held. Investing in non-U.S. securities may entail risk due to non-US economic and political developments, exposure to non-US currencies, and different accounting and financial standards. These risks may be higher when investing in emerging markets.
The December 31, 2014 and 2013 total expense ratios for the International Fund are 1.25% and1.27%, respectively. The expense ratios are subject to fee waiver to the extent normal annual operating expenses exceed 1.75% of average annual net assets.
| | | | | | |
| International Fund | | Longleaf Partners Funds | | ¡ | | 27 |
| | | | | | | | |
| Portfolio Holdings at December 31, 2014 | |
| | | |
| | | | | | Net Assets | |
Investments | | | | | | | 92.4 | % |
EXOR S.p.A. | | | 8.3 | | | | | |
Lafarge S.A. | | | 7.8 | | | | | |
Cheung Kong Holdings Limited | | | 7.7 | | | | | |
Melco International Development Limited | | | 7.4 | | | | | |
OCI N.V. | | | 6.1 | | | | | |
K. Wah International Holdings Limited | | | 5.8 | | | | | |
Christian Dior S.A. | | | 5.2 | | | | | |
Vivendi S.A. | | | 4.9 | | | | | |
Koninklijke Philips N.V. | | | 4.9 | | | | | |
adidas AG | | | 4.9 | | | | | |
Genting Berhad (Common & Warrants) | | | 4.7 | | | | | |
Colt Group S.A. | | | 4.7 | | | | | |
BR Properties S.A. | | | 4.6 | | | | | |
Mineral Resources Limited | | | 4.1 | | | | | |
Orkla ASA | | | 3.7 | | | | | |
Ferrovial S.A. | | | 3.6 | | | | | |
Manabi S.A. (Preferred) | | | 2.1 | | | | | |
ALS Limited | | | 1.9 | | | | | |
Cash Reserves Net of Other Assets and Liabilities | | | | | | | 7.6 | |
| | | | | | | 100.0 | % |
Fund holdings are subject to change and holding discussions are not recommendations to buy or sell any security.
| | | | |
Portfolio Changes January 1, 2014 through
December 31, 2014 | |
| | |
| New Holdings | | Quarter | |
adidas AG | | | 3Q | |
ALS Limited | | | 4Q | |
BR Properties S.A. | | | 1Q | |
Christian Dior S.A. | | | 1Q | |
Colt Group S.A. | | | 2Q | |
Iida Group Holdings Company Limited | | | 2Q | |
Koninklijke Vopak N.V. | | | 1Q | |
Mineral Resources Limited | | | 1Q | |
Vivendi S.A. | | | 3Q | |
| |
| Eliminations | | | |
ACS, Actividades de Construccion Y Servicios, S.A. | | | 1Q | |
CNH Industrial N.V. | | | 1Q | |
Fairfax Financial Holdings Limited | | | 4Q | |
Guinness Peat Group Plc | | | 3Q | |
Hermès International S.A. (Christian Dior S.A.)(a) | | | 4Q | |
Hochtief AG | | | 3Q | |
Iida Group Holdings Company Limited | | | 4Q | |
Koninklijke Vopak N.V. | | | 4Q | |
News Corporation | | | 4Q | |
Nitori Holdings Co., Ltd | | | 1Q | |
TNT Express NV | | | 2Q | |
UGL Limited | | | 2Q | |
Verizon Communications Inc. (Vodafone Group plc ADR)(a) | | | 1Q | |
Vodafone Group plc ADR | | | 3Q | |
| (a) | Resulting from corporate action (associated holding) |
| | | | | | |
| 28 | | ¡ | | Annual Report | | International Fund |
| | | | | | | | | | | | |
| Common Stock | | | | | | | | | |
| | | | |
| | | Share Quantity | | | Market Value | | | % of Net Assets | |
Commercial Services & Supplies | | | | | | | | | | | | |
Mineral Resources Limited(b) (Australia) | | | 9,832,722 | | | $ | 60,173,146 | | | | 4.1 | % |
Construction & Engineering | | | | | | | | | | | | |
Ferrovial S.A. (Spain) | | | 2,653,261 | | | | 52,450,239 | | | | 3.6 | |
OCI N.V.* (Netherlands) | | | 2,544,957 | | | | 88,487,990 | | | | 6.1 | |
| | | | | | | 140,938,229 | | | | 9.7 | |
Construction Materials | | | | | | | | | | | | |
Lafarge S.A. (France) | | | 1,624,691 | | | | 114,053,762 | | | | 7.8 | |
Diversified Financial Services | | | | | | | | | | | | |
EXOR S.p.A. (Italy) | | | 2,946,277 | | | | 120,891,277 | | | | 8.3 | |
Diversified Telecommunication Services | | | | | | | | | | | | |
Colt Group S.A.* (United Kingdom) | | | 32,870,900 | | | | 68,135,443 | | | | 4.7 | |
Vivendi S.A. (France) | | | 2,887,700 | | | | 71,876,565 | | | | 4.9 | |
| | | | | | | 140,012,008 | | | | 9.6 | |
Food Products | | | | | | | | | | | | |
Orkla ASA (Norway) | | | 7,985,900 | | | | 54,363,752 | | | | 3.7 | |
Hotels, Restaurants & Leisure | | | | | | | | | | | | |
Genting Berhad (Malaysia) | | | 15,896,500 | | | | 40,269,506 | | | | 2.8 | |
Melco International Development Limited (Hong Kong) | | | 49,228,700 | | | | 107,767,485 | | | | 7.4 | |
| | | | | | | 148,036,991 | | | | 10.2 | |
Industrial Conglomerates | | | | | | | | | | | | |
Koninklijke Philips N.V. (Netherlands) | | | 2,468,700 | | | | 71,557,932 | | | | 4.9 | |
Professional Services | | | | | | | | | | | | |
ALS Limited (Australia) | | | 6,500,822 | | | | 28,160,136 | | | | 1.9 | |
Real Estate Management & Development | | | | | | | | | | | | |
BR Properties S.A.(b) (Brazil) | | | 17,468,000 | | | | 67,356,482 | | | | 4.6 | |
Cheung Kong Holdings Limited (Hong Kong) | | | 6,703,000 | | | | 112,253,964 | | | | 7.7 | |
K. Wah International Holdings Limited(b) (Hong Kong) | | | 160,137,196 | | | | 84,519,518 | | | | 5.8 | |
| | | | | | | 264,129,964 | | | | 18.1 | |
Textiles, Apparel & Luxury Goods | | | | | | | | | | | | |
adidas AG (Germany) | | | 1,028,839 | | | | 71,448,458 | | | | 4.9 | |
Christian Dior S.A. (France) | | | 443,985 | | | | 75,982,953 | | | | 5.2 | |
| | | | | | | 147,431,411 | | | | 10.1 | |
Total Common Stocks (Cost $1,262,568,387) | | | | | | | 1,289,748,608 | | | | 88.4 | |
See Notes to Financial Statements
| | | | | | |
| International Fund | | Longleaf Partners Funds | | ¡ | | 29 |
| | | | | | | | | | | | |
| Preferred Stock | | | | | | | | | |
| | | | |
| | | Share Quantity | | | Market Value | | | % of Net Assets | |
Metals & Mining | | | | | | | | | | | | |
Manabi S.A. – Class A Preferred*(b)(c) (Brazil) | | | | | | | | | | | | |
Total Preferred Stocks (Cost $90,630,186) | | | 91,000 | | | $ | 31,186,893 | | | | 2.1 | % |
| Warrants | | | | | | | | | |
Hotels, Restaurants & Leisure | | | | | | | | | | | | |
Genting Berhad Warrants 12/18/18* (Malaysia) (Cost $29,512,850) | | | 34,998,950 | | | | 27,927,090 | | | | 1.9 | |
| Options Purchased | |
| | | | |
| | | Currency Units | | | | | | | |
Currency | | | | | | | | | | | | |
Hong Kong Dollar Put, 4/20/17, with BNP Paribas, Strike Price $7.77 (Hong Kong) (Cost $3,915,343) | | | 207,323,218 | | | | 1,836,469 | | | | 0.1 | |
| Short-Term Obligations | |
| | | | |
| | | Principal Amount | | | | | | | |
Repurchase Agreement with State Street Bank,
0.0% due 1/2/15, Repurchase price $39,925,000 (Collateral: $30,365,000 U.S. Treasury Bond, 2.60% due 5/15/38, Value $40,727,056) | | | 39,925,000 | | | | 39,925,000 | | | | 2.7 | |
U.S. Treasury Bills, 0.01% – 0.07% due 3/19/15 to 6/25/15 | | | 75,000,000 | | | | 74,988,425 | | | | 5.2 | |
Total Short-Term Obligations (Cost $114,917,392) | | | | | | | 114,913,425 | | | | 7.9 | |
Total Investments (Cost $1,501,544,158)(a) | | | | | | | 1,465,612,485 | | | | 100.4 | |
Other Assets and Liabilities, Net | | | | | | | (6,004,137 | ) | | | (0.4 | ) |
Net Assets | | | | | | $ | 1,459,608,348 | | | | 100.0 | % |
Net asset value per share | | | | | | $ | 13.80 | | | | | |
| * | Non-income producing security. |
| (a) | Aggregate cost for federal income tax purposes is $1,501,617,670. Net unrealized depreciation of $(35,931,673) consists of unrealized appreciation and depreciation of $158,961,125 and $(194,892,798), respectively. |
| (b) | Affiliated issuer during the period. See Note 7. |
| (c) | Illiquid. Board Valued. See Note 8. |
| Note: | Country listed in parenthesis after each company indicates location of headquarters. |
See Notes to Financial Statements
| | | | | | |
| 30 | | ¡ | | Annual Report | | International Fund |
| | | | | | | | |
| Country Weightings | |
| | | Stocks & Warrants | | | Net Assets | |
Hong Kong | | | 22.6 | % | | | 20.9 | % |
France | | | 19.4 | | | | 17.9 | |
Netherlands | | | 11.9 | | | | 11.0 | |
Italy | | | 9.0 | | | | 8.3 | |
Brazil | | | 7.3 | | | | 6.7 | |
Australia | | | 6.5 | | | | 6.0 | |
Germany | | | 5.3 | | | | 4.9 | |
Malaysia | | | 5.1 | | | | 4.7 | |
United Kingdom | | | 5.0 | | | | 4.7 | |
Norway | | | 4.0 | | | | 3.7 | |
Spain | | | 3.9 | | | | 3.6 | |
| | | | 100.0 | % | | | 92.4 | |
All other, net | | | | | | | 7.6 | |
| | | | | | | 100.0 | % |
| | | | |
| Regional Weightings |
| | | Region | | Net Assets |
|
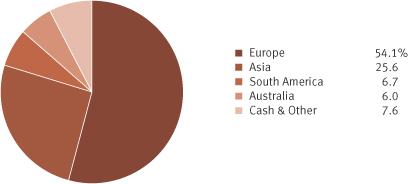 |
|
Fund holdings are subject to change and holding discussions are not
recommendations to buy or sell any security. |
| | | | | | |
| 32 | | ¡ | | Annual Report | | Global Fund |
| | |
| Global Fund Management Discussion | | |
Longleaf Partners Global Fund declined 5.98% for the year and 3.26% in the fourth quarter, underperforming the MSCI World Index’s return of 4.94% and 1.01% in the same periods. The negative performance occurred in the second half of the year and impacted the Fund’s returns since its inception two years ago. We believe the portfolio is positioned to outperform from its current discounted level over the next several years.
| | | | | | | | | | | | |
| Cumulative Returns at December 31, 2014 | |
| | | Since Inception | | | One
Year | | | 4Q | |
Global Fund
(Inception
12/27/12) | | | 20.73 | % | | | -5.98 | % | | | -3.26 | % |
MSCI World Index | | | 33.16 | | | | 4.94 | | | | 1.01 | |
| |
| Average Annual Returns at December 31, 2014 | | | | |
| | | Since Inception | | | One
Year | | | | |
Global Fund
(Inception
12/27/12) | | | 9.82 | % | | | -5.98 | % | | | | |
MSCI World Index | | | 15.33 | | | | 4.94 | | | | | |
Returns reflect reinvested capital gains and dividends but not the deduction of taxes an investor would pay on distributions or share redemptions. Performance data quoted represents past performance; past performance does not guarantee future results. The investment return and principal value of an investment will fluctuate so that an investor’s shares, when redeemed, may be worth more or less than their original cost. Current performance of the fund may be lower or higher than the performance quoted. Performance data current to the most recent month end may be obtained by visiting longleafpartners.com.
The December 31, 2014 and 2013 total expense ratios for the Global Fund are 1.58% and 1.73%(before limitation), respectively. The Fund’s expense ratios are subject to fee waiver to the extent normal annual operating expenses exceed 1.65% of average annual net assets.
Fiber and networking company Level 3 Communications gained 49% and led the Fund’s performance for the year and the fourth quarter, up 8%. Level 3 provides critical infrastructure that connects businesses and consumers to the internet, allowing them to move data, video and voice. The company’s acquisition of tw telecom closed in the fourth quarter, significantly expanding its network reach in metropolitan markets and providing additional capacity to grow its enterprise customer base. Throughout the year, CEO Jeff Storey and his team delivered solid revenue growth, margin improvement, and higher free cash flow. The stock remains significantly below our appraisal of its operating networks and non-earning dark fiber and conduit assets and is the Fund’s largest holding.
Hong Kong based conglomerate Cheung Kong rose 15% for the year. Over the course of 2014, results at most of the company’s operating divisions were
strong. Additionally, management made several value-enhancing asset sales across multiple business lines at low cap rates and used proceeds to opportunistically reinvest in discounted infrastructure deals outside of Asia with double-digit IRRs (internal rates of return). Management also returned proceeds to shareholders in the form of dividends. Most recently, in a joint venture with Mitsubishi Corp, Cheung Kong bought an airplane leasing portfolio. With its strong balance sheet, Cheung Kong can take advantage of Hong Kong land banking opportunities if prices correct.
We bought French luxury goods business Christian Dior (CDI) in October, and the position added 17% through year end. Christian Dior is the holding company for LVMH Moët Hennessy-Louis Vuitton (LVMH) and Dior Couture, the world’s most prominent collection of luxury brands. Given its holding company structure, CDI has
| | | | | | |
| Global Fund | | Longleaf Partners Funds | | ¡ | | 33 |
historically traded at a discount to LVMH ranging from 7% to 40%. Gaining LVMH economic exposure through CDI aligns our interests with owner-operator Bernard Arnault. After nearly tripling shareholder capital on LVMH’s 24% stake in Hermès, Arnault distributed the Hermès stake to LVMH shareholders, and CDI’s board decided to distribute its pro-rata share of the Hermès stake. We sold the Hermès shares above our appraisal. The transaction realized a 12% yield on our average cost for CDI. Arnault’s opportunistic purchase of Hermès in the Global Financial Crisis and subsequent decision to distribute the fully-valued shares illustrate his financial discipline and intense focus on shareholder value creation.
Positive performance at many of our holdings was overshadowed by negative performance in the face of a combination of challenges – a strong U.S. dollar, regulatory and economic controls in China, sluggish European economies, and sharp declines in oil and gas prices in the second half. The U.S. dollar (USD) strength had a large impact on the performance of many of our holdings in the fourth quarter and for the year. Our positive local currency returns turned negative after translating them into USD. These currency conversions did not reflect the underlying operating performance of our businesses and did not impact our long-term appraisals nearly as much as they impacted prices. The stock return figures cited below are shown in USD; most local returns were higher.
Increased government scrutiny and regulation in China hurt all Macau gaming companies indiscriminately and made our stakes in Melco and Galaxy via K.Wah primary performance detractors for the year with Melco down 39% and K.Wah, bolstered by its Hong Kong real estate, down 22%. At Melco, less than 15% of EBITDA (earnings before interest, taxes, depreciation, and amortization) is tied to lower margin VIP visitors who have been most severely impacted by China’s anti- corruption scrutiny and increased regulation. Melco grew its mass gaming business at a higher rate than the overall market. The company bought back 15.8 million shares, approximately 1%, over the last four months, and CEO Lawrence Ho bought an additional approximate $HK600 million personally in 2014.
K. Wah owns 3.9% of Galaxy Entertainment, which caters more to Macau’s VIP business. Galaxy significantly outperformed the broader VIP market, and has an advantage with its planned opening in mid-2015 of the next major casino expansion on the Cotai Peninsula. Excluding the discounted market value of its stake in Galaxy, K. Wah’s remaining property business trades at less than 1/3 of book value. Management opportunistically bought urban Hong Kong land at a discount to subsequent auctions in the same area. The planned launch of large scale projects in Tseung Kwan O should increase 2015 sales. Even in the storm of worry that labeled 2014 a disastrous year for Macau gaming, overall revenues fell less than 3%, the number of visitors rose, and mass revenues grew double-digits. The Chinese government has demonstrated its long-term support of Macau with massive infrastructure projects, and efforts to crack down on corruption and attract more legitimate visitors ultimately will benefit our holdings. We are excited to own these businesses as increased accessibility and additional room supply should enable revenues to rise at healthy levels.
China’s slower economic growth reduced iron ore demand, helping to push ore prices down 49% during the year to their lowest level since June 2009. Iron ore pressure hurt Australian based mining services company Mineral Resources (MIN RE), which we bought in the second quarter, with returns down 35% in the year after a 15% fourth quarter decline. Because MIN RE owns some mines, it traded with the iron ore industry. Its core business of iron ore crushing and services, however, depends on volume of work rather than commodity price. Because MIN RE provides crushing services at less than half the cost that miners can achieve themselves, the company benefits as large Australian miners turn to lower-cost outsourcing when ore prices fall. Businesses unrelated to its mines produce $250 million in EBITDA, meaning the company trades at just over 4x EV/EBITDA (enterprise value/earnings before interest, taxes, depreciation, and amortization). Management is using its financial flexibility to invest in crushing and processing capacity at this opportunistic time.
Our positive local currency returns turned negative after translating them into USD.
| | | | | | |
| 34 | | ¡ | | Annual Report | | Global Fund |
| | |
| Global Fund Management Discussion | | |
Global fertilizer and chemical producer OCI fell 23% in the year in spite of a 13% fourth quarter gain after positive news on various fronts. Egyptian natural gas shortages that had negatively impacted OCI’s plant utilization rates stabilized; the company won an Egyptian tax case related to the 2007 sale of its cement unit; and the Environmental Protection Agency issued its final construction permit for the greenfield Beaumont, Texas plant that will be the largest methanol facility in the U.S. and is scheduled to begin production in 2016. CEO Nassef Sawiris’ decision in the third quarter to spin out the legacy construction business should help the market properly value OCI as a pure-play nitrogen company. Sawiris opportunistically bought shares personally throughout the year to take advantage of the price discount.
The 49% decline in the price of oil in the second half of the year impacted several of our holdings. Oil fell as increasing supply began to exceed demand, and stocks did not discriminate. Low cost producers, higher quality assets, proven management teams, and even companies with no direct energy exposure that are based in oil-dependent markets, such as Norwegian consumer goods company Orkla, had substantial declines. Broad pressure on the Norwegian economy and stock market, as well as the kroner’s decline to its lowest level since 2009 hurt Orkla’s shares, which lost 25% in the fourth quarter, offsetting earlier gains and ending the year down 9%. Management moved to focus on the branded consumer goods business following the IPO (initial public offering) of its aluminum business, Granges. This listing strengthened Orkla’s balance sheet by deconsolidating the company’s debt. U.S. oil and gas exploration and production company Chesapeake declined 23% for the full year and 16% in the fourth quarter. Since Chesapeake’s heavily vested Board took over in mid-2012, the company has delevered the balance sheet and improved production from its irreplaceable 10+million net acres of oil and gas fields. CEO Doug Lawler is driving value recognition in ways he can control – selling assets at reasonable prices, reducing debt, and increasing operating efficiencies in both corporate and production
activity. In the first half of the year, Chesapeake sold non-core acreage in Oklahoma, Texas, and Pennsylvania and spun-off its oilfield services business into Seventy-Seven Energy, which we sold. In the fourth quarter, Chesapeake closed the sale of Marcellus and Utica assets to Southwestern Energy for $5 billion. This amounted to selling roughly 8% of Chesapeake’s production for proceeds of nearly half its market capitalization. Management announced plans to use $1 billion of the proceeds to repurchase the heavily discounted shares.
The Fund began the year holding 17% cash, with limited qualifying prospects. We put the cash to work as increased volatility created more opportunities to buy twelve new positions, including three in the fourth quarter – CONSOL Energy, McDonald’s, and Christian Dior discussed above.
CONSOL is a leading U.S. producer of low-cost natural gas and thermal coal. The share price declined with oil even though the company has no oil assets. Chairman Brett Harvey and CEO Nick Deluliis are owner-operators who have grown and monetized value. They recently announced CONSOL would form an MLP (master limited partnership) to house its thermal coal business and form a subsidiary to own its metallurgical coal properties. Food quality issues at McDonald’s China supplier, minimum wage pressure in the U.S., Russian challenges, European macro concerns, and improvements at competing chains pressured the stock and enabled us to own the company’s valuable real estate and dominant breakfast business at a discount to our appraisal.
We exited a number of holdings during the year as some approached our appraisals, some no longer were discounted enough to buy but were too small to impact results, and others were more fully valued and/or lesser quality names that we could replace with businesses with a larger margin of safety and higher expected value growth. In the fourth quarter, we sold Vodafone, which we purchased earlier in the year, because more undervalued opportunities emerged. We sold Vopak, another purchase earlier in 2014, and
| | | | | | |
| Global Fund | | Longleaf Partners Funds | | ¡ | | 35 |
NewsCorp after our investment cases changed. As discussed above, we sold the Hermès shares that CDI distributed. Additionally, Hopewell Holdings distributed its Hopewell Highway, which we also sold.
As the Fund’s largest shareholders, we were not pleased with 2014 performance. The return, however, does not adequately reflect the underlying progress our companies made during the year. The Fund’s price-to-value ratio (PV) is in the high-60s%. We are confident that the Global Fund is positioned for successful long-term compounding, given the underlying fundamentals at our companies and the value additive actions our management partners are taking.
| | | | | | |
| 36 | | ¡ | | Annual Report | | Global Fund |
Comparison of Change in Value of $10,000 Investment
Since Inception December 27, 2012
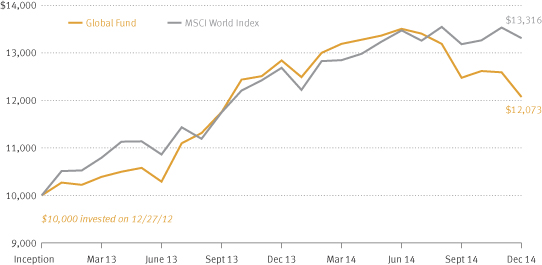
| | | | | | | | |
| Average Annual Returns for the Periods Ended December 31, 2014 | |
| | | Since Inception
12/27/12 | | | One Year | |
Global Fund | | | 9.82 | % | | | -5.98 | % |
MSCI World Index | | | 15.33 | | | | 4.94 | |
The index is unmanaged. Returns reflect reinvested capital gains and dividends but not the deduction of taxes an investor would pay on distributions or share redemptions. Performance data quoted represents past performance; past performance does not guarantee future results. The investment return and principal value of an investment will fluctuate so that an investor’s shares, when redeemed, may be worth more or less than their original cost. Current performance of the Fund may be lower or higher than the performance quoted. Performance data current to the most recent month end may be obtained by visiting longleafpartners.com. The Global Fund is subject to stock market risk, meaning stocks in the Fund may fluctuate in response to developments at individual companies or due to general market and economic conditions. Also, because the Fund generally invests in 15 to 25 companies, share value could fluctuate more than if a greater number of securities were held. Investing in non-U.S. securities may entail risk due to non-US economic and political developments, exposure to non-US currencies, and different accounting and financial standards. These risks may be higher when investing in emerging markets.
The December 31, 2014 and 2013 total expense ratios for the Global Fund are 1.58% and 1.73%(before limitation), respectively. The Fund’s expense ratios are subject to fee waiver to the extent normal annual operating expenses exceed 1.65% of average annual net assets.
| | | | | | |
| Global Fund | | Longleaf Partners Funds | | ¡ | | 37 |
| | | | | | | | |
| Portfolio Holdings at December 31, 2014 | |
| | | |
| | | | | | Net Assets | |
Investments | | | | | | | 95.9 | % |
Level 3 Communications, Inc. | | | 11.2 | | | | | |
Melco International Development Limited | | | 7.4 | | | | | |
Cheung Kong Holdings Limited | | | 6.5 | | | | | |
EXOR S.p.A. | | | 6.3 | | | | | |
Koninklijke Philips N.V. | | | 5.7 | | | | | |
Chesapeake Energy Corporation | | | 5.6 | | | | | |
OCI N.V. | | | 5.0 | | | | | |
Loews Corporation | | | 4.7 | | | | | |
McDonald’s Corporation | | | 4.6 | | | | | |
Vivendi S.A. | | | 4.4 | | | | | |
Christian Dior S.A. | | | 4.3 | | | | | |
adidas AG | | | 4.2 | | | | | |
Lafarge S.A. | | | 4.2 | | | | | |
Genting Berhad (Common & Warrants) | | | 4.1 | | | | | |
Hopewell Holdings Limited | | | 3.7 | | | | | |
K. Wah International Holdings Limited | | | 3.6 | | | | | |
Orkla ASA | | | 3.2 | | | | | |
Mineral Resources Limited | | | 3.1 | | | | | |
CONSOL Energy Inc. | | | 2.4 | | | | | |
Murphy Oil Corporation | | | 1.7 | | | | | |
Cash Reserves Net of Other Assets and Liabilities | | | | | | | 4.1 | |
| | | | | | | 100.0 | % |
Fund holdings are subject to change and holding discussions are not recommendations to buy or sell any security.
| | | | |
Portfolio Changes January 1, 2014 through December 31, 2014 | |
| | |
| New Holdings | | Quarter | |
adidas AG | | | 3Q | |
Christian Dior S.A. | | | 4Q | |
CONSOL Energy Inc. | | | 4Q | |
Hopewell Holdings Limited | | | 2Q | |
K. Wah International Holdings Limited | | | 2Q | |
Koninklijke Vopak N.V. | | | 1Q | |
Lafarge S.A. | | | 3Q | |
McDonald’s Corporation | | | 4Q | |
Mineral Resources Limited | | | 2Q | |
Sino Land Company Limited | | | 1Q | |
Vivendi S.A. | | | 3Q | |
Vodafone Group plc ADR | | | 3Q | |
| |
| Eliminations | | | |
The Bank of New York Mellon Corporation | | | 3Q | |
CNH Industrial N.V. | | | 2Q | |
DIRECTV | | | 1Q | |
Everest Re Group, Ltd. | | | 3Q | |
Fairfax Financial Holdings Limited | | | 3Q | |
FedEx Corporation | | | 3Q | |
Guinness Peat Group Plc | | | 3Q | |
Hermès International S.A. (Christian Dior S.A.)(a) | | | 4Q | |
Hochtief AG | | | 3Q | |
Hopewell Highway Infrastructure Limited (Hopewell Highway Limited)(a) | | | 4Q | |
Koninklijke Vopak N.V. | | | 4Q | |
Mondelez International, Inc. | | | 3Q | |
News Corporation | | | 4Q | |
Seventy Seven Energy Inc. (Chesapeake Energy Corporation)(a) | | | 3Q | |
Sino Land Company Limited | | | 3Q | |
TNT Express NV | | | 2Q | |
Vodafone Group plc ADR | | | 4Q | |
| (a) | Resulting from corporate action (associated holding) |
| | | | | | |
| 38 | | ¡ | | Annual Report | | Global Fund |
| | | | | | | | | | | | |
| Common Stock | |
| | | | |
| | | Share Quantity | | | Market Value | | | % of Net Assets | |
Commercial Services & Supplies | | | | | | | | | | | | |
Mineral Resources Limited (Australia) | | | 830,166 | | | $ | 5,080,353 | | | | 3.1 | % |
Construction & Engineering | | | | | | | | | | | | |
OCI N.V.* (Netherlands) | | | 236,282 | | | | 8,215,510 | | | | 5.0 | |
Construction Materials | | | | | | | | | | | | |
Lafarge S.A. (France) | | | 97,900 | | | | 6,872,607 | | | | 4.2 | |
Diversified Financial Services | | | | | | | | | | | | |
EXOR S.p.A. (Italy) | | | 250,700 | | | | 10,286,692 | | | | 6.3 | |
Diversified Telecommunication Services | | | | | | | | | | | | |
Level 3 Communications, Inc.* (United States) | | | 371,627 | | | | 18,350,941 | | | | 11.2 | |
Vivendi S.A. (France) | | | 293,300 | | | | 7,300,411 | | | | 4.4 | |
| | | | | | | 25,651,352 | | | | 15.6 | |
Food Products | | | | | | | | | | | | |
Orkla ASA (Norway) | | | 765,000 | | | | 5,207,712 | | | | 3.2 | |
Hotels, Restaurants & Leisure | | | | | | | | | | | | |
Genting Berhad (Malaysia) | | | 1,187,649 | | | | 3,008,589 | | | | 1.8 | |
McDonald’s Corporation (United States) | | | 80,300 | | | | 7,524,110 | | | | 4.6 | |
Melco International Development Limited (Hong Kong) | | | 5,529,388 | | | | 12,104,489 | | | | 7.4 | |
| | | | | | | 22,637,188 | | | | 13.8 | |
Industrial Conglomerates | | | | | | | | | | | | |
Hopewell Holdings Limited (Hong Kong) | | | 1,687,500 | | | | 6,142,715 | | | | 3.7 | |
Koninklijke Philips N.V. (Netherlands) | | | 324,556 | | | | 9,407,606 | | | | 5.7 | |
| | | | | | | 15,550,321 | | | | 9.4 | |
Insurance | | | | | | | | | | | | |
Loews Corporation (United States) | | | 184,215 | | | | 7,740,714 | | | | 4.7 | |
Oil, Gas & Consumable Fuels | | | | | | | | | | | | |
Chesapeake Energy Corporation (United States) | | | 467,200 | | | | 9,143,104 | | | | 5.6 | |
CONSOL Energy Inc. (United States) | | | 117,400 | | | | 3,969,294 | | | | 2.4 | |
Murphy Oil Corporation (United States) | | | 56,708 | | | | 2,864,888 | | | | 1.7 | |
| | | | | | | 15,977,286 | | | | 9.7 | |
Real Estate Management & Development | | | | | | | | | | | | |
Cheung Kong Holdings Limited (Hong Kong) | | | 642,029 | | | | 10,751,947 | | | | 6.5 | |
K. Wah International Holdings Limited (Hong Kong) | | | 11,307,233 | | | | 5,967,895 | | | | 3.6 | |
| | | | | | | 16,719,842 | | | | 10.1 | |
Textiles, Apparel & Luxury Goods | | | | | | | | | | | | |
adidas AG (Germany) | | | 100,400 | | | | 6,972,350 | | | | 4.2 | |
Christian Dior S.A. (France) | | | 41,500 | | | | 7,102,250 | | | | 4.3 | |
| | | | | | | 14,074,600 | | | | 8.5 | |
Total Common Stocks (Cost $158,569,989) | | | | | | | 154,014,177 | | | | 93.6 | |
See Notes to Financial Statements
| | | | | | |
| Global Fund | | Longleaf Partners Funds | | ¡ | | 39 |
| | | | | | | | | | | | |
| Warrants | |
| | | | |
| | | Share Quantity | | | Market Value | | | % of Net Assets | |
Hotels, Restaurants & Leisure | | | | | | | | | | | | |
Genting Berhad Warrants 12/18/18* (Malaysia) (Cost $4,008,255) | | | 4,626,762 | | | $ | 3,691,882 | | | | 2.3 | % |
| Options Purchased | | | | | | | | | |
| | | | |
| | | Currency Units | | | | | | | |
Currency | | | | | | | | | | | | |
Hong Kong Dollar Put, 4/20/17, with BNP Paribas, Strike Price $7.77 (Hong Kong) (Cost $257,896) | | | 13,422,290 | | | | 118,895 | | | | 0.1 | |
| Short-Term Obligations | |
| | | | |
| | | Principal Amount | | | | | | | |
Repurchase Agreement with State Street Bank,
0.0% due 1/2/15, Repurchase price $6,790,000
(Collateral: $5,165,000 U.S. Treasury Bond, 2.60%
due 5/15/38, Value $6,927,556) | | | 6,790,000 | | | | 6,790,000 | | | | 4.1 | |
Total Investments (Cost $169,626,140)(a) | | | | | | | 164,614,954 | | | | 100.1 | |
Other Assets and Liabilities, Net | | | | | | | (242,732 | ) | | | (0.1 | ) |
Net Assets | | | | | | $ | 164,372,222 | | | | 100.0 | % |
Net asset value per share | | | | | | $ | 11.60 | | | | | |
| * | Non-income producing security. |
| (a) | Aggregate cost for federal income tax purposes is $169,697,305. Net unrealized depreciation of $(5,011,186) consists of unrealized appreciation and depreciation of $10,166,783 and $(15,177,969), respectively. |
Note: Country listed in parenthesis after each company indicates location of headquarters.
See Notes to Financial Statements
| | | | | | |
| 40 | | ¡ | | Annual Report | | Global Fund |
| | | | | | | | |
| Country Weightings | |
| | | Stocks & Warrants | | | Net Assets | |
United States | | | 31.5 | % | | | 30.2 | % |
Hong Kong | | | 22.2 | | | | 21.2 | |
France | | | 13.5 | | | | 12.9 | |
Netherlands | | | 11.2 | | | | 10.7 | |
Italy | | | 6.5 | | | | 6.3 | |
Germany | | | 4.4 | | | | 4.2 | |
Malaysia | | | 4.2 | | | | 4.1 | |
Norway | | | 3.3 | | | | 3.2 | |
Australia | | | 3.2 | | | | 3.1 | |
| | | | 100.0 | % | | | 95.9 | |
All other, net | | | | | | | 4.1 | |
| | | | | | | 100.0 | % |
Regional Weightings

Fund holdings are subject to change and holding discussions are not recommendations to buy or sell any security.
| | |
| Statements of Assets and Liabilities | | at December 31, 2014 |
| | | | | | | | | | | | | | | | |
| | | Partners
Fund | | | Small-Cap
Fund | | | International
Fund | | | Global
Fund | |
Assets | | | | | | | | | | | | | | | | |
Investments: | | | | | | | | | | | | | | | | |
Affiliated securities, at market value (cost $900,657,709, $1,631,089,996, $404,317,878, and $0 respectively) (Note 2 and 7) | | $ | 1,137,318,300 | | | $ | 1,875,770,925 | | | $ | 243,236,039 | | | $ | – | |
Other securities, at market value (cost $5,437,700,429, $2,026,493,150, $1,097,226,280, and $169,626,140 respectively) (Note 2) | | | 6,415,282,083 | | | | 2,479,706,928 | | | | 1,222,376,446 | | | | 164,614,954 | |
Total Investments | | | 7,552,600,383 | | | | 4,355,477,853 | | | | 1,465,612,485 | | | | 164,614,954 | |
Cash | | | 424 | | | | 498 | | | | 676 | | | | 846 | |
Receivable for: | | | | | | | | | | | | | | | | |
Fund shares sold | | | 1,993,399 | | | | 24,820,269 | | | | 902,336 | | | | 107,323 | |
Dividends and interest | | | 4,559,603 | | | | 962,094 | | | | – | | | | – | |
Securities sold | | | – | | | | 6,627,607 | | | | 1,639,300 | | | | – | |
Foreign tax reclaims | | | – | | | | – | | | | 146,558 | | | | 9,435 | |
Prepaid assets | | | 162,110 | | | | 84,623 | | | | 37,485 | | | | 6,033 | |
Total Assets | | | 7,559,315,919 | | | | 4,387,972,944 | | | | 1,468,338,840 | | | | 164,738,591 | |
Liabilities | | | | | | | | | | | | | | | | |
Payable for: | | | | | | | | | | | | | | | | |
Fund shares redeemed | | | 4,505,983 | | | | 311,358 | | | | 6,464,626 | | | | 55,975 | |
Options written (premiums received $20,943,005) (Note 12) | | | 534,508 | | | | – | | | | – | | | | – | |
Investment counsel fee (Note 3) | | | 5,284,152 | | | | 3,063,859 | | | | 1,464,845 | | | | 167,683 | |
Administration fee (Note 4) | | | 692,499 | | | | 396,460 | | | | 137,443 | | | | 14,905 | |
Foreign tax withheld | | | – | | | | – | | | | 444,506 | | | | 41,549 | |
Other accrued expenses | | | 690,337 | | | | 319,636 | | | | 219,072 | | | | 86,257 | |
Total Liabilities | | | 11,707,479 | | | | 4,091,313 | | | | 8,730,492 | | | | 366,369 | |
| | $ | 7,547,608,440 | | | $ | 4,383,881,631 | | | $ | 1,459,608,348 | | | $ | 164,372,222 | |
Net Assets | | | | | | | | | | | | | | | | |
Net assets consist of: | | | | | | | | | | | | | | | | |
Paid-in capital | | | 5,774,236,285 | | | | 3,600,251,685 | | | | 1,502,727,202 | | | | 170,645,757 | |
Undistributed net investment income (loss) | | | 147,529 | | | | – | | | | (1,142,335 | ) | | | (10,614 | ) |
Accumulated net realized gain (loss) on investments and foreign currency | | | 538,573,884 | | | | 85,735,239 | | | | (6,023,890 | ) | | | (1,250,595 | ) |
Unrealized gain (loss) on investments and foreign currency | | | 1,234,650,742 | | | | 697,894,707 | | | | (35,952,629 | ) | | | (5,012,326 | ) |
Net Assets | | $ | 7,547,608,440 | | | $ | 4,383,881,631 | | | $ | 1,459,608,348 | | | $ | 164,372,222 | |
Net asset value per share | | $ | 31.24 | | | $ | 30.42 | | | $ | 13.80 | | | $ | 11.60 | |
Fund shares issued and outstanding | | | 241,604,839 | | | | 144,106,374 | | | | 105,777,129 | | | | 14,172,963 | |
See Notes to Financial Statements
| | | | | | |
| | Longleaf Partners Funds | | ¡ | | 43 |
| | |
| Statements of Operations | | For the Year Ended December 31, 2014 |
| | | | | | | | | | | | | | | | |
| | | Partners
Fund | | | Small-Cap
Fund | | | International
Fund | | | Global
Fund | |
Investment Income: | | | | | | | | | | | | | | | | |
Income: | | | | | | | | | | | | | | | | |
Dividends from non-affiliates (net of foreign tax withheld of $0, $688,207, $3,589,676, and $180,753 respectively) | | $ | 118,257,124 | | | $ | 9,808,107 | | | $ | 61,019,970 | | | $ | 3,475,965 | |
Dividends from affiliates (no foreign tax withheld) (Note 7) | | | 2,923,000 | | | | 21,628,605 | | | | 14,957,418 | | | | – | |
Interest from non-affiliates | | | 341,695 | | | | 303,260 | | | | 40,359 | | | | 60 | |
Total Income | | | 121,521,819 | | | | 31,739,972 | | | | 76,017,747 | | | | 3,476,025 | |
Expenses: | | | | | | | | | | | | | | | | |
Investment counsel fee (Note 3) | | | 62,587,372 | | | | 33,295,652 | | | | 18,624,150 | | | | 1,713,131 | |
Administration fee (Note 4) | | | 8,211,650 | | | | 4,306,087 | | | | 1,762,415 | | | | 152,278 | |
Transfer agent fees and expenses | | | 2,235,253 | | | | 618,294 | | | | 506,834 | | | | 38,940 | |
Trustees’ fees and expenses | | | 288,249 | | | | 288,249 | | | | 288,249 | | | | 289,249 | |
Custodian fees and expenses | | | 348,460 | | | | 119,815 | | | | 579,396 | | | | 53,482 | |
Prospectus and shareholder reports | | | 711,350 | | | | 232,550 | | | | 95,149 | | | | 12,202 | |
Professional fees | | | 95,505 | | | | 93,505 | | | | 142,000 | | | | 92,504 | |
Registration fees | | | 178,299 | | | | 119,001 | | | | 43,701 | | | | 45,276 | |
Other | | | 240,222 | | | | 125,504 | | | | 62,517 | | | | 10,416 | |
Total Expenses | | | 74,896,360 | | | | 39,198,657 | | | | 22,104,411 | | | | 2,407,478 | |
Net Investment Income (loss) | | | 46,625,459 | | | | (7,458,685 | ) | | | 53,913,336 | | | | 1,068,547 | |
Realized and Unrealized Gain (Loss): | | | | | | | | | | | | | | | | |
Net realized gain (loss): | | | | | | | | | | | | | | | | |
Non-affiliated securities | | | 1,280,128,602 | | | | 304,966,575 | | | | 163,292,813 | | | | 4,369,141 | |
Affiliated securities (Note 7) | | | – | | | | 508,658,743 | | | | (28,100 | ) | | | – | |
Options written (Note 11) | | | (2,934,458 | ) | | | – | | | | – | | | | – | |
Swap contracts (Note 11) | | | – | | | | (20,037,574 | ) | | | 28,267,262 | | | | (40,414 | ) |
Forward currency contracts (Note 11) | | | – | | | | – | | | | 649,081 | | | | – | |
Foreign currency transactions | | | 30,342 | | | | 315 | | | | (449,445 | ) | | | (24,151 | ) |
Net Gain | | | 1,277,224,486 | | | | 793,588,059 | | | | 191,731,611 | | | | 4,304,576 | |
Change in Unrealized Appreciation (Depreciation): | | | | | | | | | | | | | | | | |
Non-affiliated Securities | | | (1,034,792,289 | ) | | | (46,575,492 | ) | | | (338,472,615 | ) | | | (16,903,122 | ) |
Affiliated Securities (Note 7) | | | 88,070,199 | | | | (236,742,366 | ) | | | (148,334,230 | ) | | | – | |
Forward currency contracts (Note 11) | | | – | | | | – | | | | (1,396,441 | ) | | | – | |
Options written (Note 11) | | | 8,263,088 | | | | – | | | | – | | | | – | |
Swap contracts (Note 11) | | | – | | | | – | | | | (19,791,130 | ) | | | – | |
Other assets and liabilities | | | – | | | | – | | | | (27,983 | ) | | | (1,357 | ) |
Change in Net Unrealized Depreciation | | | (938,459,002 | ) | | | (283,317,858 | ) | | | (508,022,399 | ) | | | (16,904,479 | ) |
Net Realized and Unrealized Gain (Loss) | | | 338,765,484 | | | | 510,270,201 | | | | (316,290,788 | ) | | | (12,599,903 | ) |
Net Increase (Decrease) in Net Assets Resulting from Operations | | $ | 385,390,943 | | | $ | 502,811,516 | | | $ | (262,377,452 | ) | | $ | (11,531,356 | ) |
See Notes to Financial Statements
| | |
| Statements of Changes in Net Assets | | |
| | | | | | | | | | | | | | | | |
| | | Partners Fund | | | Small-Cap Fund | |
| | |
| | | Year Ended December 31, | | | Year Ended December 31, | |
| | | 2014 | | | 2013 | | | 2014 | | | 2013 | |
Operations: | | | | | | | | | | | | | | | | |
Net investment income (loss) | | $ | 46,625,459 | | | $ | 20,798,530 | | | $ | (7,458,685 | ) | | $ | (9,697,340 | ) |
Net realized gain from investments and foreign currency transactions | | | 1,277,224,486 | | | | 688,971,198 | | | | 793,588,059 | | | | 534,843,069 | |
Net change in unrealized appreciation (depreciation) of securities, other assets, liabilities and forwards | | | (938,459,002 | ) | | | 1,564,685,994 | | | | (283,317,858 | ) | | | 519,794,744 | |
Net increase (decrease) in net assets resulting from operations | | | 385,390,943 | | | | 2,274,455,722 | | | | 502,811,516 | | | | 1,044,940,473 | |
Distributions to Shareholders: | | | | | | | | | | | | | | | | |
From net investment income | | | (47,174,296 | ) | | | (20,343,744 | ) | | | – | | | | – | |
From net realized gain on investments | | | (894,787,301 | ) | | | (247,918,001 | ) | | | (742,901,276 | ) | | | (570,019,242 | ) |
Net decrease in net assets resulting from distributions | | | (941,961,597 | ) | | | (268,261,745 | ) | | | (742,901,276 | ) | | | (570,019,242 | ) |
Capital Share Transactions (Note 6): | | | | | | | | | | | | | | | | |
Net proceeds from sale of shares | | | 345,107,371 | | | | 498,162,969 | | | | 360,014,183 | | | | 539,499,976 | |
Net asset value of shares issued to shareholders for reinvestment of shareholder distributions | | | 869,836,345 | | | | 249,351,112 | | | | 701,720,321 | | | | 533,915,240 | |
Cost of shares redeemed | | | (1,711,306,379 | ) | | | (1,848,476,657 | ) | | | (564,396,521 | ) | | | (806,502,541 | ) |
Net increase (decrease) in net assets from fund share transactions | | | (496,362,663 | ) | | | (1,100,962,576 | ) | | | 497,337,983 | | | | 266,912,675 | |
Total increase (decrease) in net assets | | | (1,052,933,317 | ) | | | 905,231,401 | | | | 257,248,223 | | | | 741,833,906 | |
Net Assets: | | | | | | | | | | | | | | | | |
Beginning of year | | | 8,600,541,757 | | | | 7,695,310,356 | | | | 4,126,633,408 | | | | 3,384,799,502 | |
End of year | | $ | 7,547,608,440 | | | $ | 8,600,541,757 | | | $ | 4,383,881,631 | | | $ | 4,126,633,408 | |
Undistributed net investment income (loss) included in net assets at end of year | | $ | 147,529 | | | $ | 433,479 | | | $ | – | | | $ | – | |
See Notes to Financial Statements
| | | | | | |
| | Longleaf Partners Funds | | ¡ | | 45 |
| | | | | | | | | | | | | | |
| International Fund | | | Global Fund | |
| |
| Year Ended December 31, | | | Year Ended December 31, | |
| 2014 | | | 2013 | | | 2014 | | | 2013 | |
| | | | | | | | | | | | | | | |
| $ | 53,913,336 | | | $ | 5,976,093 | | | $ | 1,068,547 | | | $ | (251,535 | ) |
| 191,731,611 | | | | 12,794,028 | | | | 4,304,576 | | | | 56,141 | |
| (508,022,399 | ) | | | 394,764,045 | | | | (16,904,479 | ) | | | 11,892,153 | |
| (262,377,452 | ) | | | 413,534,166 | | | | (11,531,356 | ) | | | 11,696,759 | |
| | | | | | | | | | | | | | | |
| | (55,795,549 | ) | | | (5,078,816 | ) | | | (1,094,027 | ) | | | – | |
| | (99,976,975 | ) | | | – | | | | (5,540,046 | ) | | | – | |
| | (155,772,524 | ) | | | (5,078,816 | ) | | | (6,634,073 | ) | | | – | |
| | | | | | | | | | | | | | | |
| | 178,068,654 | | | | 149,183,991 | | | | 67,654,918 | | | | 103,356,309 | |
| 138,078,311 | | | | 4,492,269 | | | | 3,648,608 | | | | – | |
| | (266,155,742 | ) | | | (238,404,180 | ) | | | (2,241,777 | ) | | | (1,587,164 | ) |
| 49,991,223 | | | | (84,727,920 | ) | | | 69,061,749 | | | | 101,769,145 | |
| | (368,158,753 | ) | | | 323,727,430 | | | | 50,896,320 | | | | 113,465,904 | |
| | | | | | | | | | | | | | |
| | 1,827,767,101 | | | | 1,504,039,671 | | | | 113,475,902 | | | | 9,998 | |
| $ | 1,459,608,348 | | | $ | 1,827,767,101 | | | $ | 164,372,222 | | | $ | 113,475,902 | |
$ | (1,142,335 | ) | | $ | 1,189,323 | | | $ | (10,614 | ) | | $ | – | |
See Notes to Financial Statements
| | |
| Notes to Financial Statements | | |
Note 1. Organization
Longleaf Partners Fund, Longleaf Partners Small-Cap Fund, Longleaf Partners International Fund, and the Longleaf Partners Global Fund (the “Funds”) are non-diversified and each is a series of Longleaf Partners Funds Trust, a Massachusetts business trust, which is registered as an open-end management investment company under the Investment Company Act of 1940, as amended.
Note 2. Significant Accounting Policies
Management Estimates
The accompanying financial statements are prepared in accordance with accounting principles generally accepted in the United States of America; these principles may require the use of estimates by Fund management. Actual results could differ from those estimates.
Security Valuation
Portfolio securities listed or traded on a securities exchange (U.S. or foreign), on the NASDAQ national market, or any representative quotation system providing same day publication of actual prices, are valued at the last sale price. If there are no transactions in the security that day, securities are valued at the midpoint between the closing bid and ask prices or, if there are no such prices, the prior day’s close.
In the case of bonds and other fixed income securities, valuations may be furnished by a pricing service which takes into account factors in addition to quoted prices (such as trading characteristics, yield, quality, coupon rate, maturity, type of issue, and other market data relating to the priced security or other similar securities) where taking such factors into account would lead to a more accurate reflection of the fair market value of such securities.
When market quotations are not readily available, valuations of portfolio securities may be determined in accordance with procedures established by and under the general supervision of the Funds’ Trustees. In determining fair value, the Board considers relevant qualitative and quantitative information including news regarding significant market or security specific events. The Board may also utilize a service provided by an independent third party to assist in fair valuation of certain securities. These factors are subject to change over time and are reviewed periodically. Because the utilization of fair value depends on market activity, the frequency with which fair valuation may be used cannot be predicted. Estimated values may differ from the values that would have been used had a ready market for the investment existed.
Repurchase agreements are valued at cost which, combined with accrued interest, approximates market value. Short-term U.S. Government obligations purchased with a remaining maturity of more than 60 days are valued through pricing obtained through pricing services approved by the Funds’ Trustees. Obligations purchased with a remaining maturity of 60 days or less or existing positions that have less than 60 days to maturity generally are valued at amortized cost, which approximates market value. However, if amortized cost is deemed not to reflect fair value, the securities are valued at prices furnished by dealers who make markets in such securities or by an independent pricing service.
The Funds determine net asset values (“NAVs”) once a day, at the close of regular trading on the New York Stock Exchange (“Exchange”) (usually at 4:00 p.m. Eastern time) on days the Exchange is open for business. The Exchange is closed for specified national holidays and on weekends. Foreign securities are generally priced at the latest market close in the foreign market, which may be at different times or days than the close of the Exchange. If events occur which could materially affect the NAV between the close of the foreign market and normal pricing at the close of the Exchange, foreign securities may be fair valued as determined by the Board of Trustees, consistent with any regulatory guidelines.
| | | | | | |
| | Longleaf Partners Funds | | ¡ | | 47 |
Accounting for Investments
For financial reporting purposes, the Funds record security transactions on trade date. Realized gains and losses on security transactions are determined using the specific identification method. Dividend income is recognized on the ex-dividend date, except that certain dividends from foreign securities are recorded as soon after the ex-dividend date as the Fund is able to obtain information on the dividend. Interest income and Fund expenses are recognized on an accrual basis.
Distributions to Shareholders
Dividends and distributions to shareholders are recorded on the ex-dividend date.
Federal Income Taxes
The Funds’ policy is to comply with the requirements of the Internal Revenue Code that are applicable to regulated investment companies and to distribute substantially all taxable income to shareholders. Accordingly, no federal income tax provision is required. The Funds intend to make any required distributions to avoid the application of a 4% nondeductible excise tax. Distributions are determined in accordance with income tax regulations which may differ from generally accepted accounting principles. Reclassifications are made within the Funds’ capital accounts to reflect income and gains available for distribution under income tax regulations.
Foreign Currency Translations
The books and records of the Funds are maintained in U.S. dollars. Securities denominated in currencies other than U.S. dollars are subject to changes in value due to fluctuations in exchange rates. Purchases and sales of securities and income and expenses are translated into U.S. dollars at the prevailing exchange rate on the respective date of each transaction. The market values of investment securities, assets and liabilities are translated into U.S. dollars daily.
The Funds do not isolate the portion of net realized and unrealized gains or losses in equity security investments which are attributable to changes in foreign exchange rates. Accordingly, the impact of such changes is included in the realized and unrealized gains or losses on the underlying equity securities.
Repurchase Agreements
The Funds may engage in repurchase agreement transactions. The Fixed Income Clearing Corporation (“FICC”) sells U.S. government or agency securities to each Fund under agreements to repurchase these securities at a stated repurchase price including interest for the term of the agreement, which is usually overnight or over a weekend. Each Fund, through FICC, receives delivery of the underlying U.S. government or agency securities as collateral, whose market value is required to be at least equal to the repurchase price. If FICC becomes bankrupt, the Fund might be delayed, or may incur costs or possible losses of principal and income, in selling the collateral.
When-Issued Securities
The Funds may trade on a when-issued basis when a security has been authorized but not yet issued. In a when-issued transaction, securities are purchased or sold but delivery or settlement is delayed until the underlying stock is issued. Transactions in when-issued securities are subject to market fluctuations and risk of loss prior to settlement. Their value is determined in the same manner as other securities.
Options
The Funds may purchase and sell (“write”) call and put options on various instruments including securities to gain long or short exposure to the underlying instruments.
An option contract gives the buyer the right, but not the obligation, to buy(call) or sell(put) an underlying item at a fixed exercise price on a certain date or during a specified period. The cost of
| | |
| Notes to Financial Statements | | |
securities acquired through the exercise of a call option is increased by the premiums paid. The proceeds from securities sold through the exercise of a purchased put option are decreased by the premiums paid. The cost of purchased options that expire unexercised are treated by the Funds, on expiration date, as realized losses on investments.
When the Funds write an option, an amount equal to the premium received is recorded as a liability and is subsequently adjusted to the current fair value of the option written. Premiums received from writing options that expire unexercised are treated, on the expiration date, as realized gains on written options. The difference between the premium and the amount paid on effecting a closing transaction, including brokerage commissions, is also treated as a realized gain, or, if the premium is less than the amount paid for the closing transaction, as a realized loss. If a call option is exercised, the premium is added to the proceeds from the sale of the underlying security in determining whether the Funds have a realized gain or loss. If a put option is exercised, the premium reduces the cost basis of the security purchased.
The current market value of an exchange traded option is the last sales price. Over-the-counter options are valued in accordance with fair value procedures established by and under the general supervision of the Funds’ Trustees.
Risk of Options
Gains on investment in options may depend on correctly predicting the market value direction of the underlying security. There can be no assurance that a liquid market will exist when a Fund seeks to close out an option position and a Fund may experience losses as a result of such illiquidity. Listed options involve minimal counter-party risk since listed options are guaranteed against default by the exchange on which they trade. When purchasing over-the-counter (OTC) options, the Funds bear the risk of economic loss from counterparty default, equal to the market value of the option.
Swap Contracts
The Funds may enter into swap contracts for purposes of pursuing their investment objectives or as a substitute for investing directly in securities, shorting securities, or to hedge a position. Swaps are two-party contracts entered into primarily by institutional investors for periods ranging from a day to more than one year. In a standard swap transaction, two parties agree to exchange the returns (or differentials in rates of return) earned or realized on particular predetermined investments or instruments. The gross returns to be exchanged between the parties is calculated with respect to a “notional amount,” for example, the return on or increase in value of a particular dollar amount invested in a basket of securities. Most swap contracts entered into by the Funds calculate and settle the obligations of the parties to the agreement on a “net basis” with a single payment. Consequently, a Fund’s current obligations (or rights) under a swap agreement will generally be equal only to the net amount to be paid or received under the agreement based on the relative values of such obligations (or rights). A Fund’s current obligations under a swap agreement are accrued daily, offset against any amounts owed to the Fund.
The market value of a swap contract is determined by marking the underlying security (securities) to their last quoted value at the close of the NYSE, usually 4:00 p.m., Eastern Time. The swap’s market value is then adjusted to accrue dividend or interest income, financing charges and/or other economic terms associated with the contract.
Risk of Swaps
Swap contracts involve, to varying degrees, elements of market risk and exposure to loss in excess of the amount reflected in the Statement of Assets and Liabilities. The notional amounts reflect the extent of the total investment exposure each Fund has under the swap contract. The primary risks associated with the
| | | | | | |
| | Longleaf Partners Funds | | ¡ | | 49 |
use of swaps are imperfect correlation between movements in the notional amount and the price of the underlying investments and the inability of counterparties to perform. A Fund bears the risk of loss of the amount expected to be received under a swap contract in the event of the default or bankruptcy of a swap counterparty.
Forward Currency Contracts
Forward currency contracts are commitments to purchase or sell a foreign currency at a future maturity date at a prespecified price. The resulting obligation is marked-to-market daily using foreign currency exchange rates supplied by an independent pricing service. An unrealized gain or loss is recorded for the difference between the contract opening value and its current value. When a contract is closed or delivery is taken, this gain or loss is realized. For federal tax purposes, gain or loss on open forward contracts in qualifying currencies are treated as realized and are subject to distribution at our excise tax year-end date.
Risk of Forward Currency Contracts
The Funds may use forward currency contracts for hedging purposes to offset currency exposure in portfolio holdings. Forward contracts may reduce the potential gain from a positive change in the relationship between the U.S. dollar and foreign currencies or, considered separately, may produce a loss. Not all foreign currencies can be effectively hedged; and the costs of hedging may outweigh the benefits. If our hedging strategy does not correlate well with market and currency movements, price volatility of the portfolio could increase. Where a liquid secondary market for forwards does not exist, the Funds may not be able to close their positions and in such an event, the loss is theoretically unlimited. In addition, the Funds could be exposed to risks if the counterparty to these contracts is unable to perform.
Counterparty Risk and Collateral
The Funds have entered in to collateral agreements with counterparties to mitigate risk on OTC derivatives. Collateral is generally determined based on the net unrealized gain or loss with each counterparty, subject to minimum exposure amounts. Collateral, both pledged by and for the benefit of a Fund, is held in a segregated account at the Funds’ custodian bank and is comprised of assets specific to each agreement. See Note 13, “Counterparty Risk and Credit-Risk-Related Contingent Features Derivative Instruments,” for additional information.
Note 3. Investment Counsel Agreement
Southeastern Asset Management, Inc. (“Southeastern”) serves as Investment Counsel to the Funds and receives annual compensation, computed daily and paid monthly, in accordance with the following schedule for the Partners Fund and Small-Cap Fund:
| | | | |
First $400 million of average daily net assets | | | 1.00% | |
In excess of $400 million | | | .75% | |
For the Partners and Small-Cap Funds, Southeastern has agreed to reduce its fees on a pro rata basis to the extent that each Fund’s normal annual operating expenses (excluding taxes, interest, brokerage fees, and extraordinary expenses) exceed 1.5% of average annual net assets. No such reductions were necessary for the current year.
The International Fund fee is calculated in accordance with the following schedule:
| | | | |
First $500 million of average daily net assets | | | 1.20% | |
In excess of $500 million | | | 1.00% | |
| | |
| Notes to Financial Statements | | |
For this Fund, Southeastern has agreed to reduce its fees on a pro rata basis to the extent that the Fund’s normal annual operating expenses (excluding taxes, interest, brokerage fees, and extraordinary expenses) exceed 1.75% of average annual net assets. No reduction was necessary for the current year.
The Global Fund fee is calculated in accordance with the following schedule:
| | | | |
First $500 million of average daily net assets | | | 1.125% | |
In excess of $500 million | | | 1.00% | |
For this Fund, Southeastern has agreed to reduce its fees on a pro rata basis to the extent that the Fund’s normal annual operating expenses (excluding taxes, interest, brokerage fees, and extraordinary expenses) exceed 1.65% of average annual net assets. No reduction was necessary for the current year.
Note 4. Fund Administrator
Southeastern also serves as the Fund Administrator and in this capacity is responsible for managing, performing or supervising the administrative and business operations of the Funds. Functions include the preparation of all registration statements, prospectuses, proxy statements, and oversight of daily valuation of the portfolios and calculation of daily net asset values per share. The Funds pay a fee as compensation for these services, accrued daily and paid monthly, of 0.10% per annum of average daily net assets.
Note 5. Investment Transactions
Purchases and sales of equity securities and purchased options for the year (excluding short-term obligations) are summarized below:
| | | | | | | | |
| | | Purchases | | | Sales | |
Partners Fund | | $ | 1,945,691,077 | | | $ | 2,456,680,606 | |
Small-Cap Fund | | | 1,567,556,353 | | | | 1,416,208,050 | |
International Fund | | | 1,069,174,748 | | | | 862,886,337 | |
Global Fund | | | 130,350,901 | | | | 55,070,128 | |
Written options not included in the above purchase and sales transactions for the Funds include:
| | | | | | | | |
| | | Partners Fund | |
| | | Share Equivalents | | | Premiums | |
Options outstanding at December 31, 2013 | | | 5,303,672 | | | $ | 22,858,826 | |
Options written | | | 4,000,000 | | | | 28,452,742 | |
Options closed | | | (4,444,506 | ) | | | (30,368,563 | ) |
Options outstanding at December 31, 2014 | | | 4,859,166 | | | $ | 20,943,005 | |
| | | | | | |
| | Longleaf Partners Funds | | ¡ | | 51 |
Note 6. Shares of Beneficial Interest
Each Fund is authorized to issue unlimited shares of beneficial interest with no par value. Transactions in shares of beneficial interest were as follows:
| | | | | | | | | | | | | | | | |
| | | Year Ended December 31, 2014 | |
| | | Partners
Fund | | | Small-Cap
Fund | | | International
Fund | | | Global
Fund | |
Shares sold | | | 10,153,252 | | | | 10,846,952 | | | | 10,425,753 | | | | 5,211,392 | |
Reinvestment of shareholder distributions | | | 27,308,973 | | | | 23,351,758 | | | | 9,413,420 | | | | 303,002 | |
Shares redeemed | | | (50,656,578 | ) | | | (17,225,234 | ) | | | (15,941,361 | ) | | | (180,713 | ) |
| | | (13,194,353 | ) | | | 16,973,476 | | | | 3,897,812 | | | | 5,333,681 | |
| |
| | | Year Ended December 31, 2013 | |
| | | Partners
Fund | | | Small-Cap
Fund | | | International
Fund | | | Global
Fund | |
Shares sold | | | 16,489,626 | | | | 16,945,800 | | | | 9,489,933 | | | | 8,990,215 | |
Reinvestment of shareholder distributions | | | 7,728,681 | | | | 17,289,978 | | | | 250,825 | | | | | |
Shares redeemed | | | (61,007,416 | ) | | | (24,322,804 | ) | | | (14,980,415 | ) | | | (151,933 | ) |
| | | (36,789,109 | ) | | | 9,912,974 | | | | (5,239,657 | ) | | | 8,838,282 | |
Note 7. Affiliated Issuer
Under Section 2(a)(3) of the Investment Company Act of 1940, a portfolio company is defined as “affiliated” if a Fund owns five percent or more of its voting stock during all or part of the year.
| | | | | | | | | | | | |
| | | Shares at
December 31,
2014 | | | Market Value at | |
| | | | December 31,
2014 | | | December 31,
2013 | |
Partners Fund | | | | | | | | | | | | |
CONSOL Energy Inc. | | | 11,692,000 | | | $ | 395,306,520 | | | $ | 444,763,680 | |
Level 3 Communications, Inc.*(a) | | | 15,026,565 | | | | 742,011,780 | | | | 498,431,161 | |
| | | | | | | 1,137,318,300 | | | | 943,194,841 | |
Small-Cap Fund | | | | | | | | | | | | |
California Resources Corporation* | | | 33,090,500 | | | | 182,328,655 | | | | – | |
Chemtura Corporation* | | | 4,071,919 | | | | 100,698,557 | | | | – | |
DineEquity, Inc.(a) | | | – | | | | – | | | | 105,411,192 | |
DreamWorks Animation SKG, Inc. – Class A* | | | 9,331,277 | | | | 208,367,415 | | | | – | |
Empire State Realty Trust, Inc. – Class A | | | 9,967,200 | | | | 175,223,376 | | | | 187,744,005 | |
Graham Holdings Company – Class B | | | 428,000 | | | | 369,667,880 | | | | 283,900,960 | |
Hopewell Holdings Limited | | | 54,532,000 | | | | 198,503,442 | | | | 85,251,651 | |
Rayonier Inc. | | | 7,627,921 | | | | 213,124,113 | | | | 3,255,340 | |
Texas Industries, Inc.*(a) | | | – | | | | – | | | | 516,589,866 | |
Vail Resorts, Inc. | | | 2,318,300 | | | | 211,266,679 | | | | 186,344,710 | |
ViaSat, Inc.* | | | 3,436,313 | | | | 216,590,808 | | | | – | |
| | | | | | | 1,875,770,925 | | | | 1,368,497,724 | |
| | |
| Notes to Financial Statements | | |
| | | | | | | | | | | | |
| | | Shares at
December 31,
2014 | | | Market Value at | |
| | | | December 31,
2014 | | | December 31,
2013 | |
International Fund | | | | | | | | | | | | |
BR Properties S.A. | | | 17,468,000 | | | $ | 67,356,482 | | | $ | – | |
K. Wah International Holdings Limited | | | 160,137,196 | | | | 84,519,518 | | | | 8,987,478 | |
Manabi Holding S.A. – Class A Preferred* | | | 91,000 | | | | 31,186,893 | | | | 77,882,577 | |
Mineral Resources Limited | | | 9,832,722 | | | | 60,173,146 | | | | – | |
| | | | | | $ | 243,236,039 | | | $ | 86,870,055 | |
| | | |
| | | Purchases | | | Sales | | | Dividend
Income | |
Partners Fund | | | | | | | | | | | | |
CONSOL Energy Inc. | | $ | – | | | $ | – | | | $ | 2,923,000 | |
| | | |
Small-Cap Fund | | | | | | | | | | | | |
California Resources Corporation* | | | 225,030,121 | | | | – | | | | – | |
Chemtura Corporation* | | | 89,257,714 | | | | – | | | | – | |
DineEquity, Inc.(a) | | | – | | | | 101,822,260 | | | | 1,257,790 | |
DreamWorks Animation SKG, Inc. – Class A* | | | 194,782,764 | | | | – | | | | – | |
Empire State Realty Trust, Inc. – Class A | | | – | | | | 40,729,027 | | | | 4,172,089 | |
Graham Holdings Company – Class B | | | – | | | | – | | | | 4,365,600 | |
Hopewell Holdings Limited | | | 101,120,262 | | | | – | | | | 7,787,167 | |
Rayonier Inc. | | | 273,317,401 | | | | – | | | | – | |
Texas Industries, Inc.*(a) | | | – | | | | 694,631,708 | | | | – | |
Vail Resorts, Inc. | | | – | | | | 14,238,422 | | | | 4,045,959 | |
ViaSat, Inc.* | | | 194,660,664 | | | | 6,979,353 | | | | – | |
| | | 1,078,168,926 | | | | 858,400,770 | | | | 21,628,605 | |
International Fund | | | | | | | | | | | | |
BR Properties S.A. | | | 103,464,166 | | | | 1,814,112 | | | | 8,198,707 | |
K. Wah International Holdings Limited | | | 109,558,642 | | | | – | | | | 3,023,170 | |
Mineral Resources Limited | | | 93,947,732 | | | | – | | | | 3,735,541 | |
| | $ | 306,970,540 | | | $ | 1,814,112 | | | $ | 14,957,418 | |
| (a) | Not an affiliate at the end of the year. |
Note 8. Illiquid Securities
The International Fund owns 91,000 shares of Manabi S.A. Class A Preferred. These shares were acquired directly from the issuer in a private placement. They are considered restricted securities within the meaning of Rule 144 promulgated under the Securities Act of 1933. Prior to an initial public offering, shares are subject to other selling restrictions such as a right of first offer for the benefit of other shareholders. Further, upon an initial public offering, it is anticipated that the shares will be subject to a post-offering lock up period as required by underwriters, the BM&FBOVESPA or Brazil’s CVM. Due to the lack of an active trading market, all or a portion of this position may be illiquid. Judgement plays a greater role in valuing illiquid securities than those for which a more active market exists. (See Notes 2 and 10).
| | | | | | |
| | Longleaf Partners Funds | | ¡ | | 53 |
Note 9. Related Ownership
At December 31, 2014, officers, employees of Southeastern and their families, Fund trustees, the Southeastern retirement plan and other affiliates owned more than 5% of the following Funds:
| | | | | | |
| | | | | Percent of Fund | |
Partners Fund | | | | | 9.7 | % |
Small-Cap Fund | | | | | 6.8 | |
International Fund | | | | | 23.2 | |
Global Fund | | | | | 53.6 | |
Note 10. Fair Value Measurements and Disclosures
FASB ASC 820 established a single definition of fair value for financial reporting, created a three-tier framework for measuring fair value based on inputs used to value the Funds’ investments, and required additional disclosure about the use of fair value measurements. The hierarchy of inputs is summarized below.
| | • | | Level 1 – quoted prices in active markets for identical investments |
| | • | | Level 2 – other significant observable inputs (including quoted prices for similar investments, interest rates, prepayment speeds, credit risk, etc.) |
| | • | | Level 3 – significant unobservable inputs (including the Funds’ own assumptions in determining the fair value of investments) |
Observable inputs are those based on market data obtained from sources independent of the Funds’, and unobservable inputs reflect the Funds’ own assumptions based on the best information available. The input levels are not necessarily an indication of risk or liquidity associated with investing in those securities.
A summary of the inputs used in valuing the Funds’ net assets as December 31, 2014 follows:
| | | | | | | | | | | | | | | | |
| | | Level 1 | | | Level 2 | | | Level 3 | | | Total Value | |
Partners Fund | | | | | | | | | | | | | | | | |
Common Stock | | $ | 4,856,356,804 | | | $ | 1,578,158,640 | | | $ | – | | | $ | 6,434,515,444 | |
Preferred Stock | | | – | | | | 46,792,600 | | | | – | | | | 46,792,600 | |
Short-Term Obligations | | | 994,323,150 | | | | – | | | | – | | | | 994,323,150 | |
Options Purchased | | | – | | | | 76,969,189 | | | | – | | | | 76,969,189 | |
Options Written | | | – | | | | (534,508 | ) | | | – | | | | (534,508 | ) |
Total | | | 5,850,679,954 | | | | 1,701,385,921 | | | | – | | | | 7,552,065,875 | |
Small-Cap Fund | | | | | | | | | | | | | | | | |
Common Stock | | | 2,939,792,445 | | | | 432,560,737 | | | | – | | | | 3,372,353,182 | |
Short-Term Obligations | | | 981,448,648 | | | | – | | | | – | | | | 981,448,648 | |
Options Purchased | | | – | | | | 1,676,023 | | | | – | | | | 1,676,023 | |
Total | | | 3,921,241,093 | | | | 434,236,760 | | | | – | | | | 4,355,477,853 | |
International Fund | | | | | | | | | | | | | | | | |
Common Stock | | | 67,356,482 | | | | 1,222,392,126 | | | | – | | | | 1,289,748,608 | |
Preferred Stock | | | – | | | | – | | | | 31,186,893 | | | | 31,186,893 | |
Short-Term Obligations | | | 114,913,425 | | | | – | | | | – | | | | 114,913,425 | |
Warrants | | | 27,927,090 | | | | – | | | | – | | | | 27,927,090 | |
Options Purchased | | | – | | | | 1,836,469 | | | | – | | | | 1,836,469 | |
Total | | | 210,196,997 | | | | 1,224,228,595 | | | | 31,186,893 | | | | 1,465,612,485 | |
| | |
| Notes to Financial Statements | | |
| | | | | | | | | | | | | | | | |
| | | Level 1 | | | Level 2 | | | Level 3 | | | Total Value | |
Global Fund | | | | | | | | | | | | | | | | |
Common Stocks | | $ | 49,593,051 | | | $ | 104,421,126 | | | $ | – | | | $ | 154,014,177 | |
Short-Term Obligations | | | 6,790,000 | | | | – | | | | – | | | | 6,790,000 | |
Warrants | | | 3,691,882 | | | | – | | | | – | | | | 3,691,882 | |
Options Purchased | | | – | | | | 118,895 | | | | – | | | | 118,895 | |
Total | | $ | 60,074,933 | | | $ | 104,540,021 | | | $ | – | | | $ | 164,614,954 | |
Certain foreign securities are fair valued by utilizing an external pricing service in the event of significant market movements between the time the Funds value such foreign securities and the earlier closing of foreign markets. Such fair valuations are categorized as Level 2 in the hierarchy. Between December 31, 2013 and December 31, 2014, application of these valuation procedures triggered reclassification from Level 1 to Level 2 of $1,578,158,640, $432,560,737, $1,222,392,126 and $104,421,126 in the Partners, Small-Cap, International, and Global Funds, respectively.
The sole Level 3 holding at December 31, 2014 was Manabi S.A. which was valued by taking into account company specific developments and other relevant factors. These other factors include offers to sell made by other Preferred Class A shareholders and trading multiples of comparable public companies. See Note 8 for additional information on this security.
The following is a reconciliation of Level 3 holdings for which significant unobservable inputs were used in determining fair value as of December 31, 2014:
| | | | |
| Level 3 Holding | | International Fund | |
Fair value at December 31, 2013 | | $ | 77,882,577 | |
Unrealized loss | | | (46,695,684 | ) |
Fair value at December 31, 2014 | | $ | 31,186,893 | |
The following table provides quantitate information about significant unobservable inputs used to determine the fair valuations of the International Fund’s Level 3 asset, and the sensitivity of the valuations to changes in those significant unobservable inputs. Because the Valuation Committee considers a variety of factors and inputs, both observable and unobservable, in determining fair values, the unobservable inputs presented do not reflect all inputs significant to the fair value determination.
| | | | | | | | | | | | | | | | |
| Investments in Securities | | Fair Value at
12/31/14
(000s) | | | Valuation Technique | | Unobservable Input | | Value or
Range of
Input | | | Impact to
Valuation
from an
Increase
in Input | |
Class A Preferred Stock | | $ | 31,187 | | | Recent transactions involving comparable businesses or assets. | | Minority/Marketability Discount | | | 23 | % | | | Decrease | * |
| * | Represents the directional change in the fair value of the Level 3 investments that would result in an increase from the corresponding unobservable input. A decrease to the unobservable input would have the opposite effect. Significant increases and decreases in these unobservable inputs in insolation could result in significantly higher or lower fair value measurements. |
| | | | | | |
| | Longleaf Partners Funds | | ¡ | | 55 |
Note 11. Derivative Instruments
The Funds invested in options, swaps and forward contracts. Footnote 2, ‘Significant Accounting Policies,” contains additional information regarding the risks of these derivatives.
Options
The Funds use options in several ways:
| | • | | Written covered calls create an exit method for all or a portion of an underlying security position for portfolio management purposes; |
| | • | | Purchased call options secure upside exposure to the underlying security at low implied long-term interest rates. The maximum loss exposure is the premium paid for the options. |
| | • | | Purchased call options are sometimes used in tandem with written put options, to create long synthetic exposure to the underlying security. |
With both purchased call options (sometimes in tandem with written put options) the Funds get exposure to the stock without tying up cash.
Swap Contracts
Swap contracts are used to create exposure to the underlying notional value of a stock or bond position. Swap contracts may be done to free up cash or to access markets or short positions more efficiently than otherwise possible.
Forward Currency Contracts
Forward currency contracts are used on a limited basis to hedge embedded currency exposure related to a specific holding.
The following is a summary of the location and type of derivative instruments in the Funds’ financial statements at December 31, 2014:
| | | | | | | | | | | | | | |
| | | Statements of Assets and Liabilities | |
| | | | | By Derivative Type | |
| | | Location | | Equity | | | Currency | | | Total | |
| | | | | Partners Fund | |
Options purchased | | Others securities, at market value | | $ | 76,969,189 | | | $ | – | | | $ | 76,969,189 | |
Options written | | Payable for options written | | | (534,508 | ) | | | – | | | | (534,508 | ) |
| | | | | 76,434,681 | | | | – | | | | 76,434,681 | |
| | | | | | | | | | | | | | |
| | | | | Small-Cap Fund | |
Options purchased | | Others securities, at market value | | | – | | | | 1,676,023 | | | | 1,676,023 | |
| | | | | | | | | | | | | | |
| | | | | International Fund | |
Options purchased | | Others securities, at market value | | | – | | | | 1,836,469 | | | | 1,836,469 | |
| | | | | | | | | | | | | | |
| | | | | Global Fund | |
Options purchased | | Others securities, at market value | | | – | | | | 118,895 | | | | 118,895 | |
| | |
| Notes to Financial Statements | | |
| | | | | | | | | | | | |
| | | Impact of Derivatives
on Statements of Operations | |
| | | By Derivative Type | |
| | | Equity | | | Currency | | | Total | |
| | | Partners Fund | |
Net realized gain (loss): | | | | | | | | | | | | |
Non-affiliated securities (Options purchased) | | $ | 3,546,657 | | | $ | – | | | $ | 3,546,657 | |
Options written | | | (2,934,458 | ) | | | – | | | | (2,934,458 | ) |
| | | 612,199 | | | | – | | | | 612,199 | |
Change in unrealized appreciation: | | | | | | | | | | | | |
Non-affiliated securities (Options purchased) | | | 25,599,785 | | | | – | | | | 25,599,785 | |
Options written | | | 8,263,088 | | | | – | | | | 8,263,088 | |
| | | 33,862,873 | | | | – | | | | 33,862,873 | |
| | | | | | | | | | | | |
| | | Small-Cap Fund | |
Net realized loss: | | | | | | | | | | | | |
Swap contracts | | | (20,037,574 | ) | | | – | | | | (20,037,574 | ) |
Change in unrealized depreciation: | | | | | | | | | | | | |
Non-affiliated securities (Options purchased) | | | – | | | | (1,904,152 | ) | | | (1,904,152 | ) |
| | | | | | | | | | | | |
| | | International Fund | |
Net realized gain: | | | | | | | | | | | | |
Swap contracts | | | 28,267,262 | | | | – | | | | 28,267,262 | |
Forward currency contracts | | | – | | | | 649,081 | | | | 649,081 | |
| | | 28,267,262 | | | | 649,081 | | | | 28,916,343 | |
Change in unrealized depreciation: | | | | | | | | | | | | |
Non-affiliated securities (Options purchased) | | | – | | | | (2,078,874 | ) | | | (2,078,874 | ) |
Swap contracts | | | (19,791,130 | ) | | | – | | | | (19,791,130 | ) |
Forward currency contracts | | | – | | | | (1,396,441 | ) | | | (1,396,441 | ) |
| | | (19,791,130 | ) | | | (3,475,315 | ) | | | (23,266,445 | ) |
| | | | | | | | | | | | |
| | | Global Fund | |
Net realized loss: | | | | | | | | | | | | |
Swap contracts | | | (40,414 | ) | | | – | | | | (40,414 | ) |
Change in unrealized depreciation: | | | | | | | | | | | | |
Non-affiliated securities (Options purchased) | | | – | | | | (139,001 | ) | | | (139,001 | ) |
| | | | | | |
| | Longleaf Partners Funds | | ¡ | | 57 |
For the period ended December 31, 2014, the average volume of derivative activities were as follows:
| | | | | | | | | | | | | | | | |
| | | Options
Purchased Cost | | | Options
Written Premiums | | | Swap Contracts Value | | | Forward
Currency Contracts
Unrealized | |
Partners Fund | | $ | 33,671,748 | | | $ | 26,422,885 | | | $ | – | | | $ | – | |
Small-Cap Fund | | | 2,450,221 | | | | – | | | | 708,407 | | | | – | |
International Fund | | | 2,695,358 | | | | – | | | | 2,452,008 | | | | 207,277 | |
Global Fund | | | 168,329 | | | | – | | | | – | | | | – | |
Note 12. Collateral
The table below summarizes collateral related to each derivative type held at December 31, 2014. Derivative assets and liabilities are presented in the Statement of Assets and Liabilities at their gross amount. The amount pledged (received) may be greater than the amount shown due to over collateralization.
| | | | | | | | | | | | | | | | |
| | | Partners Fund | | | Small-Cap Fund | | | International Fund | | | Global
Fund | |
Derivative Assets – Options Purchased* | | | 76,969,189 | | | | 1,676,023 | | | | 1,836,469 | | | | 118,895 | |
Collateral Received | | | (76,969,189 | ) | | | – | | | | – | | | | – | |
| | | – | | | | 1,676,023 | | | | 1,836,469 | | | | 118,895 | |
Derivative Liabilities – Options Written | | | (534,508 | ) | | | – | | | | – | | | | – | |
Collateral Pledged | | | – | | | | – | | | | – | | | | – | |
| | | (534,508 | ) | | | – | | | | – | | | | – | |
| * | Options purchased are included in “Other securities, at market value” in the Statement of Assets and Liabilities. |
Note 13. Counterparty Risk and Credit-Risk-Related Contingent Features of Derivative Instruments
The Funds may invest in certain securities or engage in other transactions where the Funds are exposed to counterparty credit risk in addition to broader market risks. The Funds may face increased risk of loss in the event of default or bankruptcy by the counterparty or if the counterparty otherwise fails to meet its contractual obligations. The Funds’ investment manager attempts to mitigate counterparty risk by (i) periodically assessing the creditworthiness of its trading partners, (ii) monitoring and/or limiting the amount of its net exposure to each individual counterparty based on its assessment and (iii) requiring collateral from the counterparty for certain transactions. Market events and changes in overall economic conditions may impact the assessment of such counterparty risk by the investment manager. In addition, declines in the values of underlying collateral received may expose the Funds to increased risk of loss.
The Funds have entered into master agreements with its derivative counterparties that provide for general obligations, representations, agreements, collateral, events of default or termination and credit related contingent features. The credit related contingent features include, but are not limited to, a percentage decrease in the Fund’s net assets or NAV over a specified period of time. If these credit related contingent features were triggered, the derivatives counterparty could terminate the positions and demand payment or require additional collateral.
Note 14. Federal Income Taxes
Required fund distributions are based on income and capital gain amounts determined in accordance with federal income tax regulations, which differ from net investment income and realized gains recognized for financial reporting purposes. Accordingly, the character of distributions and composition of net assets for tax purposes differ from those reflected in the accompanying financial statements.
| | |
| Notes to Financial Statements | | |
Distributions were designated subject to tax as follows:
| | | | | | | | | | | | | | | | |
| |
| | | Year Ended December 31, 2014 | |
| | | Partners
Fund | | | Small-Cap
Fund | | | International
Fund | | | Global
Fund | |
Long-term capital gains | | $ | 894,787,301 | | | $ | 742,901,276 | | | $ | 88,360,981 | | | $ | 4,227,185 | |
| | | | | | | | | | | | | | | | | |
Ordinary income | | | 47,174,296 | | | | – | | | | 67,411,543 | | | | 2,406,888 | |
| | | | | | | | | | | | | | | | | |
| | $ | 941,961,597 | | | $ | 742,901,276 | | | $ | 155,772,524 | | | $ | 6,634,073 | |
| | | | | | | | | | | | | | | | |
| |
| | | Year Ended December 31, 2013 | |
| | | Partners
Fund | | | Small-Cap
Fund | | | International
Fund | | | Global
Fund | |
Long-term capital gains | | $ | 247,918,001 | | | $ | 540,598,961 | | | $ | – | | | $ | – | |
| | | | | | | | | | | | | | | | | |
Ordinary income | | | 20,343,744 | | | | 29,420,281 | | | | 5,078,816 | | | | – | |
| | | | | | | | | | | | | | | | | |
| | $ | 268,261,745 | | | $ | 570,019,242 | | | $ | 5,078,816 | | | $ | – | |
| | | | | | | | | | | | | | | | |
The tax-basis components of net assets at December 31, 2014 were as follows:
| | | | | | | | | | | | | | | | |
| | | Partners Fund | | | Small-Cap Fund | | | International Fund | | | Global Fund | |
Unrealized appreciation | | $ | 1,291,261,238 | | | $ | 810,896,746 | | | $ | 158,961,121 | | | $ | 10,166,783 | |
| | | | | | | | | | | | | | | | | |
Unrealized depreciation | | | (67,502,733 | ) | | | (113,002,039 | ) | | | (194,987,264 | ) | | | (15,250,275 | ) |
| | | | | | | | | | | | | | | | | |
Net unrealized appreciation(depreciation) | | | 1,223,758,505 | | | | 697,894,707 | | | | (36,026,143 | ) | | | (5,083,492 | ) |
| | | | | | | | | | | | | | | | | |
Post Oct-31st loss deferred | | | – | | | | – | | | | (7,092,711 | ) | | | (1,190,043 | ) |
| | | | | | | | | | | | | | | | | |
Undistributed ordinary income | | | 1,454,382 | | | | – | | | | – | | | | – | |
| | | | | | | | | | | | | | | | | |
Undistributed long-term capital gains | | | 548,159,268 | | | | 85,735,239 | | | | – | | | | – | |
| | | | | | | | | | | | | | | | | |
Paid-in capital | | | 5,774,236,285 | | | | 3,600,251,685 | | | | 1,502,727,202 | | | | 170,645,757 | |
| | | | | | | | | | | | | | | | | |
| | $ | 7,547,608,440 | | | $ | 4,383,881,631 | | | $ | 1,459,608,348 | | | $ | 164,372,222 | |
| | | | | | | | | | | | | | | | |
The following permanent reclassifications were made between capital accounts to reflect the tax character of foreign currency transactions, preferred security sales and distributions. These reclassifications did not affect results of operations or net assets.
| | | | | | | | | | | | | | | | |
| | | Partners Fund | | | Small-Cap Fund | | | International Fund | | | Global Fund | |
Undistributed net investment income | | $ | 262,887 | | | $ | 7,458,685 | | | $ | (449,445 | ) | | $ | 14,864 | |
| | | | | | | | | | | | | | | | | |
Accumulated net realized gain(loss) on
investments and foreign currency | | | (262,887 | ) | | | (315 | ) | | | 449,445 | | | | (14,864 | ) |
| | | | | | | | | | | | | | | | | |
Paid-in capital | | | – | | | | (7,458,370 | ) | | | – | | | | – | |
| | | | | | | | | | | | | | | | | |
The Funds’ tax returns are subject to examination by the relevant tax authorities until expiration of the applicable statute of limitations, which is generally three years after filing of the tax return but could be longer in certain circumstances. Management has analyzed the Funds’ tax positions taken on federal income tax returns for all open tax years (tax years ended December 31, 2011-2014), and has concluded that no provision for federal income tax is required in the Funds’ financial statements.
The presentation is for a share outstanding throughout each period.
| | | | | | | | | | | | | | | | | | | | | | | | |
| | | Net Asset
Value
Beginning
of Period | | | Net
Investment
Income
(Loss) | | | Net Gains
(Losses) on
Securities
Realized
and
Unrealized | | | Total
from
Investment
Operations | | | Dividends
from Net
Investment
Income | | | Distri-
butions
from
Capital
Gains | |
Partners Fund | | | | | | | | | | | | | | | | | | | | | | | | |
Year Ended December 31, | | | | | | | | | | | | | | | | | | | | | |
2014(c) | | $ | 33.75 | | | $ | 0.19 | | | $ | 1.53 | | | $ | 1.72 | | | $ | (0.20 | ) | | $ | (4.03 | ) |
2013(d) | | | 26.39 | | | | 0.09 | | | | 8.34 | | | | 8.43 | | | | (0.08 | ) | | | (0.99 | ) |
2012(d) | | | 26.65 | | | | 0.31 | | | | 3.95 | | | | 4.26 | | | | (0.27 | ) | | | (4.25 | ) |
2011(d) | | | 28.26 | | | | 0.11 | | | | (0.90 | ) | | | (0.79 | ) | | | (0.13 | ) | | | (0.69 | ) |
2010(d) | | | 24.09 | | | | 0.07 | | | | 4.24 | | | | 4.31 | | | | (0.14 | ) | | | – | |
Small-Cap Fund | | | | | | | | | | | | | | | | | | | | | | | | |
Year Ended December 31, | | | | | | | | | | | | | | | | | | | | | |
2014(c) | | | 32.46 | | | | (0.06 | ) | | | 4.04 | | | | 3.98 | | | | – | | | | (6.02 | ) |
2013(d) | | | 28.88 | | | | (0.08 | ) | | | 8.62 | | | | 8.54 | | | | – | | | | (4.96 | ) |
2012(d) | | | 25.23 | | | | 0.03 | | | | 5.67 | | | | 5.70 | | | | (0.03 | ) | | | (2.02 | ) |
2011(d) | | | 26.52 | | | | – | | | | 0.49 | | | | 0.49 | | | | (0.01 | ) | | | (1.77 | ) |
2010(d) | | | 21.77 | | | | 0.03 | | | | 4.83 | | | | 4.86 | | | | (0.11 | ) | | | – | |
International Fund | | | | | | | | | | | | | | | | | | | | | | | | |
Year Ended December 31, | | | | | | | | | | | | | | | | | | | | | |
2014(c) | | | 17.94 | | | | 0.53 | | | | (3.12 | ) | | | (2.59 | ) | | | (0.54 | ) | | | (1.01 | ) |
2013(d) | | | 14.04 | | | | 0.06 | | | | 3.89 | | | | 3.95 | | | | (0.05 | ) | | | – | |
2012(d) | | | 11.90 | | | | 0.26 | | | | 2.25 | | | | 2.51 | | | | (0.24 | ) | | | (0.13 | ) |
2011(d) | | | 15.34 | | | | 0.17 | | | | (3.28 | ) | | | (3.11 | ) | | | (0.17 | ) | | | (0.16 | ) |
2010(d) | | | 13.66 | | | | 0.12 | | | | 1.75 | | | | 1.87 | | | | (0.19 | ) | | | – | |
Global Fund | | | | | | | | | | | | | | | | | | | | | | | | |
Year Ended December 31, | | | | | | | | | | | | | | | | | | | | | |
2014(c) | | | 12.84 | | | | 0.09 | | | | (0.84 | ) | | | (0.75 | ) | | | (0.08 | ) | | | (0.41 | ) |
2013(d) | | | 10.00 | | | | (0.03 | ) | | | 2.87 | | | | 2.84 | | | | – | | | | – | |
Inception December 27, 2012 to December 31, 2012(d) | | | 10.00 | | | | – | | | | – | | | | – | | | | – | | | | – | |
| (a) | Total return reflects the rate that an investor would have earned on investment in the Fund during each period, assuming reinvestment of all distributions. |
| (b) | Expenses presented net of fee waiver. For the Global Fund, the expense ratio before waiver for the periods ended December 31, 2013 and 2012 were 1.73% and 96.24%, respectively. |
| (c) | Computed using average shares outstanding throughout the year. |
| (d) | Computed using SEC method throughout the period. |
| | | | | | |
| | Longleaf Partners Funds | | ¡ | | 61 |
| | | | | | | | | | | | | | | | | | | | | | | | | | |
Total
Distri-
butions | | | Net
Asset
Value
End of
Period | | | Total
Return(a) | | | Net Assets
End of
Period
(thousands) | | | Ratio of
Expenses
to Average
Net Assets(b) | | | Ratio of
Net
Investment
Income
(Loss) to
Average
Net Assets | | | Portfolio
Turnover
Rate | |
| | | | | | | | | | | | | | | | | | | | | | | | | | | |
| | | | | | | | | | | | | | | | | | | | | | | | | | | |
| $ | (4.23 | ) | | $ | 31.24 | | | | 4.92 | % | | $ | 7,547,608 | | | | 0.91 | % | | | 0.57 | % | | | 29.64 | % |
| | (1.07 | ) | | | 33.75 | | | | 32.12 | | | | 8,600,542 | | | | 0.92 | | | | 0.25 | | | | 22.73 | |
| | (4.52 | ) | | | 26.39 | | | | 16.53 | | | | 7,695,310 | | | | 0.91 | | | | 0.90 | | | | 25.53 | |
| | (0.82 | ) | | | 26.65 | | | | (2.85 | ) | | | 7,953,798 | | | | 0.91 | | | | 0.39 | | | | 23.55 | |
| | (0.14 | ) | | | 28.26 | | | | 17.89 | | | | 8,584,963 | | | | 0.91 | | | | 0.23 | | | | 36.72 | |
| | | | | | | | | | | | | | | | | | | | | | | | | | | |
| | | | | | | | | | | | | | | | | | | | | | | | | | | |
| | (6.02 | ) | | | 30.42 | | | | 12.49 | | | | 4,383,882 | | | | 0.91 | | | | (0.17 | ) | | | 50.61 | |
| | (4.96 | ) | | | 32.46 | | | | 30.45 | | | | 4,126,633 | | | | 0.91 | | | | (0.24 | ) | | | 20.41 | |
| | (2.05 | ) | | | 28.88 | | | | 22.96 | | | | 3,384,800 | | | | 0.92 | | | | 0.07 | | | | 14.70 | |
| | (1.78 | ) | | | 25.23 | | | | 1.79 | | | | 3,037,823 | | | | 0.92 | | | | – | | | | 37.33 | |
| | (0.11 | ) | | | 26.52 | | | | 22.32 | | | | 3,056,707 | | | | 0.93 | | | | 0.14 | | | | 16.67 | |
| | | | | | | | | | | | | | | | | | | | | | | | | | | |
| | | | | | | | | | | | | | | | | | | | | | | | | | | |
| | (1.55 | ) | | | 13.80 | | | | (14.76 | ) | | | 1,459,608 | | | | 1.25 | | | | 3.06 | | | | 54.37 | |
| | (0.05 | ) | | | 17.94 | | | | 28.14 | | | | 1,827,767 | | | | 1.27 | | | | 0.36 | | | | 36.12 | |
| | (0.37 | ) | | | 14.04 | | | | 21.23 | | | | 1,504,040 | | | | 1.29 | | | | 1.82 | | | | 22.59 | |
| | (0.33 | ) | | | 11.90 | | | | (20.29 | ) | | | 1,571,156 | | | | 1.37 | | | | 1.07 | | | | 48.87 | |
| | (0.19 | ) | | | 15.34 | | | | 13.69 | | | | 2,211,191 | | | | 1.38 | | | | 0.76 | | | | 27.80 | |
| | | | | | | | | | | | | | | | | | | | | | | | | | | |
| | | | | | | | | | | | | | | | | | | | | | | | | | | |
| | (0.49 | ) | | | 11.60 | | | | (5.98 | ) | | | 164,372 | | | | 1.58 | | | | 0.70 | | | | 40.19 | |
| | – | | | | 12.84 | | | | 28.40 | | | | 113,476 | | | | 1.65 | | | | (0.55 | ) | | | 4.14 | |
|
– |
| | | 10.00 | | | | – | | | | 10 | | | | 1.65 | | | | – | | | | – | |
| | |
| Report of Independent Registered Public Accounting Firm | | |
To the Board of Trustees of Longleaf Partners Funds Trust and Shareholders of Longleaf Partners Fund, Longleaf Partners Small-Cap Fund, Longleaf Partners International Fund, and Longleaf Partners Global Fund:
In our opinion, the accompanying statements of assets and liabilities, including the portfolios of investments, and the related statements of operations and of changes in net assets and the financial highlights present fairly, in all material respects, the financial position of Longleaf Partners Fund, Longleaf Partners Small-Cap Fund, Longleaf Partners International Fund, and Longleaf Partners Global Fund (four of the funds comprising Longleaf Partners Funds Trust the “Funds”) at December 31, 2014, the results of each of their operations, the changes in each of their net assets and the financial highlights for each of the periods presented, in conformity with accounting principles generally accepted in the United States of America. These financial statements and financial highlights (hereafter referred to as “financial statements”) are the responsibility of the Funds’ management. Our responsibility is to express an opinion on these financial statements based on our audits. We conducted our audits of these financial statements in accordance with the standards of the Public Company Accounting Oversight Board (United States). Those standards require that we plan and perform the audit to obtain reasonable assurance about whether the financial statements are free of material misstatement. An audit includes examining, on a test basis, evidence supporting the amounts and disclosures in the financial statements, assessing the accounting principles used and significant estimates made by management, and evaluating the overall financial statement presentation. We believe that our audits, which included confirmation of securities at December 31, 2014 by correspondence with the custodian and brokers, provide a reasonable basis for our opinion.
PricewaterhouseCoopers LLP
Baltimore, Maryland
February 9, 2015
| | | | | | |
| | Longleaf Partners Funds | | ¡ | | 63 |
| | |
| Statement Regarding Basis for Approval of Investment Advisory Contracts | | |
Longleaf Partners Fund, Longleaf Partners Small-Cap Fund, Longleaf Partners International Fund, and Longleaf Partners Global Fund (the “Funds”) are non-diversified and each is a series of Longleaf Partners Funds Trust, a Massachusetts business trust which is an open-end management investment company registered with the US Securities and Exchange Commission. Southeastern Asset Management, Inc. (“Southeastern”) acts as investment counsel and fund administrator under agreements with each Fund (the “Agreements”). Trustees for each Fund, including Trustees who are not “interested persons” of the Funds as that term is defined under the Investment Company Act of 1940, as amended (the “Independent Trustees”), are responsible for overseeing the performance of Southeastern and meet annually to review information specific to each Fund to determine whether or not the Agreements with Southeastern ought to be approved.
On September 8, 2014, Trustees for each Fund met to determine whether the Agreements with Southeastern should be approved for the period November 1, 2014 to October 31, 2015. In advance of the meeting, the Independent Trustees reviewed materials relating to the existing Agreements, including an independent expense and performance summary prepared by Lipper Inc. The Lipper materials included comparisons of each Fund with other funds in a comparable Lipper universe, as well as additional funds selected for comparison by the Independent Trustees. Trustees reviewed this comparative Lipper data regarding management and non-management fees and expenses, portfolio turnover, brokerage commissions, investment performance and long-term performance in light of total fund expenses (the “Lipper Data”). Other materials reviewed included information concerning the nature, extent and quality of Southeastern’s services, Southeastern’s profitability and financial results, including advisory fee revenue and separate account advisory fee schedules, and whether economies of scale are, or would be, shared with Fund investors as assets under management increase. Based on the information reviewed, as well as information received throughout the year and first-hand interaction with Southeastern’s personnel, the Trustees for each Fund unanimously approved the selection of Southeastern as adviser and administrator, and the amounts to be paid by each Fund under Agreements with Southeastern.
In considering the Agreements, the Trustees did not identify any single factor as all-important or controlling, and each Trustee may have weighed various factors differently. The following summary does not detail all the factors considered, but discusses the material factors and the Trustees’ conclusions.
Nature, Extent and Quality of Services Provided
While the investment performance of each Fund and Southeastern (discussed below) is relevant to an evaluation of the nature, extent and quality of services provided, the Trustees also considered Southeastern’s governing principles as significant. These principles are stated at the beginning of the Funds’ Prospectus:
| • | | We will treat your investment as if it were our own. |
| • | | We will remain significant investors in Longleaf Partners Funds. |
| • | | We will invest for the long-term, while striving to maximize returns and minimize business, financial, purchasing power, regulatory and market risks. |
| • | | We will choose each equity investment based on its discount from our appraisal of corporate intrinsic value, its financial strength, its management, its competitive position, and our assessment of its future earnings potential. |
| • | | We will focus our assets in our best ideas. |
| • | | We will not impose loads or 12b-l charges on mutual fund shareholders. |
| • | | We will consider closing to new investors if closing would benefit existing clients. |
| | |
| Statement Regarding Basis for Approval of Investment Advisory Contracts | | |
| • | | We will discourage short-term speculators and market timers. |
| • | | We will continue our efforts to enhance shareholder services. |
| • | | We will communicate with our investment partners as candidly as possible. |
The Trustees concluded that Southeastern had been successful in operating each Fund under these governing principles, and that Longleaf shareholders had benefited from Southeastern’s execution of its investment discipline over the long term, as well as its shareholder oriented approach. Southeastern’s actions on behalf of shareholders have gone beyond stock selection and included active engagement with portfolio companies when necessary and involvement in the market structure debate. The Trustees looked favorably on Southeastern’s unique Code of Ethics requirement that employees use Longleaf for virtually all public equity investing. The Trustees noted that, as one of the largest shareholder groups, Southeastern and its affiliates’ interests are aligned with other shareholders, facing the same risks, paying the same fees, and sharing the same motivation to achieve positive absolute returns. In addition, significant investment by Southeastern’s personnel has contributed to the economies of scale which have lowered fees and expenses for shareholders over time.
The Trustees recognized Southeastern’s consistent implementation of the governing principles, noting that Southeastern and the Funds had continued to receive recognition in the press, and among industry observers and participants, for the quality of its investment process, as well as its shareholder orientation and integrity. The Trustees expressed confidence in the research, analysis, knowledge and 39-years’ experience of Southeastern. The Trustees concluded that shareholders buy the Funds primarily to gain access to Southeastern’s investment expertise and shareholder orientation, and weighed this heavily in approving the Agreements.
Trustees concluded that Southeastern’s administrative services, including fund accounting, legal, trading, shareholder reporting, compliance and oversight of Fund operations, had been high quality, and favored approving Southeastern for another year. Trustees concluded that Southeastern had been open, responsive, timely and cooperative in providing information required to oversee the Funds.
Comparative Investment Performance of the Funds and Adviser
Using the Lipper Data, the Trustees compared each Fund through periods ended June 30, 2014 to other similar funds, as well as the following objective benchmarks: inflation plus 10%, and each Fund’s market index plus 200 basis points. Each of the Partners, Small-Cap, International and Global Funds’ 1-year performance had been outstanding, materially outperforming inflation plus 10%. The Partners, International, and Global Funds exceeded their benchmarks plus 200 basis points over shorter periods, while the Small-Cap Fund exceeded its benchmark plus 200 basis points over the 5 and 10 year periods.
The Trustees also reviewed after-tax performance information for each Fund and noted that taxable shareholders were benefited by Southeastern’s long-term, low turnover, tax efficient management style as compared to funds with more frequent trading.
The Costs of the Services to be Provided and Profits to be Realized by the Investment Adviser and its Affiliates from the Relationship with the Fund
The Trustees considered each Fund’s management fee rates and expense ratios relative to industry averages, advisory fees charged to Southeastern’s private account clients and similar funds selected by Lipper and the Independent Trustees.
| | | | | | |
| | Longleaf Partners Funds | | ¡ | | 65 |
While Southeastern’s management fees for each Fund were above average, non- management expenses (except for the Global Fund) were below average, due in part to Southeastern’s performance and/or oversight of various operating functions. While the Trustees considered these fees separately, they viewed total expenses borne by shareholders as more important. In addition, the Trustees weighed favorably the fact that Southeastern had foregone additional fee income by closing each Fund to protect shareholder interests. The Trustees noted that Longleaf Partners Fund had been closed from July 2004 to January 2008, Longleaf Partners International Fund had been closed from February 2004 to July 2006, Longleaf Partners Small-Cap Fund had been closed since July 1997, and Longleaf Partners Global Fund had been closed briefly from January 28, 2013 to April 16, 2013. The Trustees also recognized that Southeastern does not have an affiliated entity providing transfer agent, custodian, broker dealer or services other than investment management and fund administration. Accordingly, Southeastern neither generates additional fees for itself through related entities, nor allocates Fund brokerage to pay its expenses. The transparency of Southeastern’s fees and lack of supplemental sources of revenue was a significant factor to the Trustees.
In light of the qualifications, experience, reputation, and performance of Southeastern with respect to each Fund, as well as the steps taken to limit or reduce receipt of fees over time, the Trustees concluded that fee rates paid to Southeastern by each Fund are at an acceptable level.
The Trustees compared the fees paid to Southeastern by the Funds with those paid by Southeastern’s private account clients. To the extent private account fees were lower than Fund fees, the Trustees concluded that the range of services provided to the Funds is more extensive and the risks associated with operating SEC registered, publicly traded mutual funds are greater. Funds are more work because of the complex overlay of regulatory, tax and accounting issues which are unique to mutual funds. In addition, the work required to service shareholders is more extensive because of the significantly greater number and managing trading is more complex because of more frequent fund flows, as well as IRS diversification compliance. With respect to risk, not only has regulation become more complex and burdensome, but the scrutiny of regulators and shareholders has gotten more intense. The Trustees concluded that reasonable justifications exist to the extent that there are differences in fee rates between the two lines of business.
The Trustees reviewed reports of Southeastern’s financial position, including overall revenues and expenses of the firm, as well as an Investment Manager Profitability Analysis prepared by Lipper Inc. While the Trustees considered the profitability of Southeastern as a whole, and jointly determined with Southeastern a method to allocate costs between mutual fund and private account activities, they did not evaluate on a Fund-by-Fund basis Southeastern’s profitability and/or costs. Because no generally accepted cost allocation methodology exists, and estimating the cost of providing services on a Fund specific basis is difficult, Southeastern provided its complete financial statements to the Trustees and stipulated conservatively for renewal purposes that its operation of each Fund should be considered highly profitable, at least as profitable as, if not more profitable than, investment managers with similar assets under management. The Trustees concluded that significant profits were not unreasonable given Southeastern’s successful investment management and strong shareholder orientation, as well as steps it had taken to limit or reduce its fees over time. As between the Funds and private account business, the
Trustees acknowledged that cost allocation methods were not precise, but felt profits derived with respect to the Funds were acceptable in light of all the facts and circumstances. The Trustees also gave significant weight to the preferences and expectations of individual Fund shareholders and their relative sophistication, noting that the level of assets under management (despite closing often, no sales force, or 12b-l plan) is a direct result of Southeastern’s successful asset management and strong shareholder
| | |
| Statement Regarding Basis for Approval of Investment Advisory Contracts | | |
orientation. Similarly, if a shareholder wants to redeem, he or she is not constrained by the thought of having to pay a redemption fee or to recoup a front-end load. Thus, in assessing whether the costs of Southeastern’s services and its resulting profits are acceptable, the Trustees considered it meaningful that the Funds’ asset base consists of shareholders who have freely chosen to retain access to Southeastern’s services, with full disclosure of advisory fee rates.
The Extent to which Economies of Scale would be Realized as each Fund Grows, and whether Current Fee Levels Reflect these Economies of Scale for the Benefit of Fund Investors
Because Southeastern’s fee structure for each Fund contains a breakpoint, economies of scale will be realized as each Fund grows. The Trustees noted that Southeastern bore costs in excess of each Fund’s expense limitation in early years, and that total expenses of each Fund have declined as a percentage of assets over time. Because fee levels for Longleaf Partners Fund and Longleaf Partners Small-Cap Fund currently reflected a greater sharing of economies of scale than the fee for Longleaf Partners International Fund, and in order to reward the loyalty of International Fund shareholders, Southeastern recommended a reduction in that Fund’s breakpoint from $2.5 billion to $500 million in 2011. The higher breakpoint had been set in expectation that the International Fund could become as large as the Partners Fund. While it could still become that large in time, Southeastern was mindful that at current asset levels, shareholders did not benefit from the breakpoint. With this in mind, the breakpoint for the Global Fund was set at the same $500 million level. Accordingly, the Trustees were satisfied that breakpoints of each Fund were set at appropriate levels, and economies of scale would be shared sufficiently with Fund shareholders.
Conclusion
While the material factors that the Trustees considered are summarized above, each individual Trustee considered and weighed in the aggregate all information prior to making a renewal decision. All Trustees, including the Independent Trustees, concluded that Southeastern’s fee structure was fair and reasonable in light of the nature and quality of services provided, and that approval of the Investment Counsel and Fund Administration Agreements was in the best interest of each Fund and its shareholders.
Shareholders of mutual funds may incur two types of costs: (1) ongoing costs, including management fees, transfer agent fees, and other fund expenses; and (2) transaction costs, including sale charges (loads) and redemption fees. Longleaf does not charge transaction fees of any sort.
The following examples are intended to show the ongoing costs (in dollars) of investing in the Longleaf Funds and to enable you to compare the costs of investing in other mutual funds. Each example is based on an investment of $1,000 made at July 1, 2014 and held through December 31, 2014.
Actual Expenses
The table below provides information about actual account values and actual expenses using each Fund’s actual return for the period. To estimate the expenses that you paid over the period, divide your account balance by $1,000 (for example, a $12,500 account balance divided by $1,000 = 12.5), then multiply the result by the number in the third line entitled “Expenses Paid During Period.”
Ongoing Expenses and Actual Fund Returns
for the Period July 1, 2014 to December 31, 2014
| | | | | | | | | | | | | | | | |
| | | Partners | | | Small-Cap | | | International | | | Global | |
Beginning Account Value | | $ | 1,000.00 | | | $ | 1,000.00 | | | $ | 1,000.00 | | | $ | 1,000.00 | |
Ending Account Value | | | 1,049.20 | | | | 1,124.90 | | | | 852.36 | | | | 940.20 | |
Expenses Paid During the Period* | | | 4.70 | | | | 4.87 | | | | 5.98 | | | | 7.73 | |
Annualized Expense Ratio for Period | | | 0.91 | % | | | 0.91 | % | | | 1.28 | % | | | 1.58 | % |
| * | Expenses are equal to the Fund’s annualized expense ratio, multiplied by the average account value for the period, multiplied by the number of days in the most recent fiscal half year (184) divided by 365 days in the current year. |
| | | | | | |
| | Longleaf Partners Funds | | ¡ | | 69 |
Hypothetical Example for Comparison Purposes
The table below provides information about hypothetical account values and expenses based on each Fund’s actual expense ratio and assumed returns of 5% per year before expenses, which are not the Funds’ actual returns. Do not use the hypothetical data below to estimate your ending account balance or expenses you paid. This information serves only to compare the ongoing costs of investing in Longleaf with other mutual funds. To do so, examine this 5% hypothetical example against the 5% hypothetical examples found in other funds’ shareholder reports.
The expenses shown in the table highlight only ongoing costs and do not reflect transactional costs that may be charged by other funds. Therefore, the third line of the table does not reveal the total relative costs of owning different funds. Since Longleaf does not charge transactions fees, you should evaluate other funds’ transaction costs to assess the total cost of ownership for comparison purposes.
Ongoing Expenses and Hypothetical 5% Return
for the Period July 1, 2014 to December 31, 2014
| | | | | | | | | | | | | | | | |
| | | Partners | | | Small-Cap | | | International | | | Global | |
Beginning Account Value | | $ | 1,000.00 | | | $ | 1,000.00 | | | $ | 1,000.00 | | | $ | 1,000.00 | |
Ending Account Value | | | 1,024.60 | | | | 1,062.45 | | | | 926.18 | | | | 970.10 | |
Expenses Paid During the Period* | | | 4.63 | | | | 4.63 | | | | 6.51 | | | | 8.03 | |
Annualized Expense Ratio for Period | | | 0.91 | % | | | 0.91 | % | | | 1.28 | % | | | 1.58 | % |
| * | Expenses are equal to the Fund’s annualized expense ratio, multiplied by the average account value for the period, multiplied by the number of days in the most recent fiscal half year (184) divided by 365 days in the current year. |
| | |
| Information on Boards of Trustees | | |
Each Fund is served by a separate Board of Trustees composed of eight members. The membership of each Board is the same. There is no stated term of service, and Trustees continue to serve after election until resignation. All Trustees presently serving except for Rex M. Deloach were elected or re-elected at a meeting of shareholders held on September 19, 2001 in Boston, Massachusetts.
| | | | | | | | |
Name, Age And Address | | Positions Held
With Funds | | Length of Service
as Trustee
(Year Began) | |
| Affiliated or Interested Trustees* | |
O. Mason Hawkins, CFA, (66) 6410 Poplar Ave., Suite 900 Memphis, TN 38119 | | Co-Portfolio Manager | | Partners Fund Small-Cap Fund International Fund Global Fund | |
| 1987
1989 1998 2012 |
|
Margaret H. Child (59) 137 Marlborough Street #3 Boston, MA 02116 | | Trustee | | Partners Fund Small-Cap Fund International Fund Global Fund | |
| 2001
2001 2001 2012 |
|
| Independent or Non-Interested Trustees | |
Chadwick H. Carpenter, Jr. (65) 6410 Poplar Ave., Suite 900 Memphis, TN 38119 | | Trustee | | Partners Fund Small-Cap Fund International Fund Global Fund | |
| 1993
1993 1998 2012 |
|
Daniel W. Connell, Jr. (66) 4016 Alcazar Avenue Jacksonville, FL 32207 | | Trustee | | Partners Fund Small-Cap Fund International Fund Global Fund | |
| 1997
1997 1998 2012 |
|
Rex M. Deloach (77) 4033 Spring Island Okatie, SC 29909 | | Trustee | | Partners Fund Small-Cap Fund International Fund Global Fund | |
| 2003
2003 2003 2012 |
|
Steven N. Melnyk (68) 5015 Pirates Cove Road Jacksonville, FL 32210 | | Trustee | | Partners Fund Small-Cap Fund International Fund Global Fund | |
| 1991
1991 1998 2012 |
|
C. Barham Ray (68) 6410 Poplar Ave., Suite 900 Memphis, TN 38119 | | Trustee | | Partners Fund Small-Cap Fund International Fund Global Fund | |
| 1992
1992 1998 2012 |
|
Perry C. Steger (53) 1978 South Austin Avenue Georgetown, TX 78626 | | Chairman of the Board | | Partners Fund Small-Cap Fund International Fund Global Fund | |
| 2001
2001 2001 2012 |
|
| * | Mr. Hawkins is a director and officer of Southeastern Asset Management, Inc. and as such is classified as an “interested” Trustee. Ms. Child is not affiliated with Southeastern, but performs certain administration and operational functions for the Funds in Massachusetts, their state of organization, and could be deemed to be an “interested” Trustee. |
| | | | | | |
| | Longleaf Partners Funds | | ¡ | | 71 |
| | | | |
Principal Occupations During Past 5 Years | | Number of
Portfolios
Overseen | | Other Directorships |
| Affiliated or Interested Trustees* |
Chairman of the Board and Chief Executive Officer, Southeastern
Asset Management, Inc.
| | 4 | | |
| Marketing Consultant since 2005; Chief Marketing Officer, Bingham McCutchen, LLP (1999-2004) (an international law firm); Director of Marketing, Arthur Andersen LLP (accounting firm) Memphis office (1991-98), Atlanta office (1998-99). | | 4 | | |
| Independent or Non-Interested Trustees |
Private Investor and Consultant since 1998; Senior Executive Officer, Progress Software Corp. (1983-98) | | 4 | | |
Private Investor since 2006; President and CEO, Twilight Ventures,
LLC (investment holding company) (2004-2006); Senior Vice
President-Marketing, Jacksonville Jaguars (NFL franchise) (1994-2004) | | 4 | | |
President, Financial Insights, LLC (financial consulting and litigation support) since 2002; Vice President, The Oxford Company (private
land and timber, investments) (1994-2012). | | 4 | | |
Senior Vice President, Stephens, Inc. since 2009; Real Estate Development, The Sea Island Company, (2005-2009); Private
Investor and Consultant since 1997; Golf Commentator, ABC Sports since 1991; President, Riverside Golf Group, Inc. since 1989. | | 4 | | |
| Private Investor and Consultant since 2008 | | 4 | | Director, Financial
Federal Savings Bank,
Memphis, TN and
INNOVA, Memphis, TN |
President, Steger & Bizzell Engineering, Inc.
(engineering firm) since 2003; Director of Product Strategy, National Instruments, Inc. (1996-2003) | | 4 | | |
| | | | | | |
| | Longleaf Partners Funds | | ¡ | | 73 |
The following additional information may be obtained for free by calling (800)445-9469, Option 1, or visiting longleafpartners.com, or on the SEC’s website at sec.gov.
Proxy Voting Policies and Procedures
A description of Longleaf’s Proxy Voting Policies and Procedures is included in the Statement of Additional Information (SAI).
Proxy Voting Record
Information regarding how the Funds voted proxies relating to portfolio securities during the most recent 12-month period ended June 30 is contained in Form N-PX.
Quarterly Portfolio Holdings
Longleaf files a complete schedule of portfolio holdings for the first and third quarters of each fiscal year on Form N-Q, which is available on the
SEC’s website, and may be reviewed and copied at the SEC’s Public Reference Room in Washington, D.C. Please call (800) SEC-0330 for information on the operation of the Public Reference Room.
In addition to Form N-Q, Longleaf publishes reports for each calendar quarter. These reports include complete schedules of portfolio holdings, as well as performance updates and management discussion. We furnish Longleaf’s Quarterly Reports in lieu of Form N-Q to shareholders who request information about our first and third quarter portfolio holdings, and Semi-Annual and Annual Reports for requests related to the second and fourth quarters, respectively.
Fund Trustees
Additional information about Fund Trustees is included in the Statement of Additional Information (SAI).
| | | | | | |
| | Longleaf Partners Funds | | ¡ | | 75 |
Call (800)445-9469
Fund Information ¡ Option 1
To request a printed Prospectus, Summary Prospectus (longleafpartners.com/mutual_fund_documents/prospectus), Statement of Additional Information (including Longleaf’s Proxy Voting Policies and Procedures), financial report, application or other Fund information from 8:00 a.m. to 8:00 p.m. Eastern time, Monday through Friday.
Daily Fund Prices ¡ Option 2
For automated reporting 24 hours a day, seven days a week.
Account Information ¡ Option 3
For account balance and transaction activity, 24 hours a day, seven days a week. Please have your Fund number (see below) and account number ready to access your investment information.
Shareholder Inquiries ¡ Option 0
To request action on your existing account from 9:00 a.m. to 6:00 p.m. Eastern time, Monday through Friday.
| | |
| |
| Correspondence |
| |
| By regular mail: | | By express mail or overnight courier: |
Longleaf Partners Funds P.O. Box 9694 Providence, RI 02940-9694 | | Longleaf Partners Funds c/o BNY Mellon 4400 Computer Drive Westborough, MA 01581 (800)445-9469 |
Published Daily Price Quotations
Below are the common references for searching printed or electronic media to find daily NAVs of the Funds.
| | | | | | | | |
| Abbreviation | | Symbol | | Cusip | | Transfer Agent
Fund Number | | Status to
New Investors |
Partners | | LLPFX | | 543069108 | | 133 | | Open |
Sm-Cap | | LLSCX | | 543069207 | | 134 | | Closed 7/31/97 |
Intl | | LLINX | | 543069405 | | 136 | | Open |
Global | | LLGLX | | 543069504 | | 137 | | Open |
Our Governing Principles
|
| We will treat your investment as if it were our own. |
| We will remain significant investors in Longleaf Partners Funds. |
| We will invest for the long term, while striving to maximize returns and minimize business, financial, purchasing power, regulatory and market risks. |
| We will choose each equity investment based on its discount from our appraisal of corporate intrinsic value, its financial strength, its management, its competitive position, and our assessment of its future earnings potential. |
| We will focus our assets in our best ideas. |
| We will not impose loads or 12b-1 charges on mutual fund shareholders. |
| We will consider closing to new investors if closing would benefit existing clients. |
| We will discourage short-term speculators and market timers. |
| We will continue our efforts to enhance shareholder services. |
| We will communicate with our investment partners as candidly as possible. |
On December 8, 2003, the Boards of Trustees of the Longleaf Partners Funds adopted a Code of Ethics applicable to officers of Southeastern Asset Management, Inc. performing the principal executive function, the principal financial function, and the principal legal function for the Funds. This Code of Ethics, as amended, may be obtained without charge, upon request, by calling (901) 761-2474 and asking Southeastern’s General Counsel for a copy.
| Item 3. | Audit Committee Financial Expert. |
On December 8, 2003, the Independent Trustees of the Longleaf Partners Funds selected Rex M. Deloach to replace G. Staley Cates as Trustee, effective upon Mr. Cates resignation from the Boards December 31, 2003. Mr. Deloach is “independent” as defined by Item 3 of Form N-CSR, and serves as chairman of the Audit Committee. The Trustees have determined that Mr. Deloach meets the definition of “audit committee financial expert” as set forth in Item 3 of Form N-CSR.
In accordance with the SEC’s safe harbor rule for “audit committee financial experts,” no member designated as an audit committee financial expert shall (i) be deemed an “expert” for any other purpose or (ii) have any duty, obligation or liability that is greater than the duties, obligations and liabilities imposed on a member of the board or the audit committee not so designated. Additionally, the designation of a member or members as an “audit committee financial expert” shall in no way affect the duties, obligations or liabilities of any member of the audit committee, or the board, not so designated.
| Item 4. | Principal Accountant Fees and Services. |
| | | | | | | | |
Services | | 2013 | | | 2014 | |
(a.) Audit Fees
Audits of the Funds | | $ | 227,640 | | | $ | 308,144 | |
(b.) Audit Related Fees | | $ | — | | | $ | — | |
(c.) Tax Fees
Preparation of tax returns, tax consultation and research | | $ | 55,424 | | | $ | 48,433 | |
(d.) All other fees | | $ | — | | | $ | — | |
| | | | | | | | |
PricewaterhouseCoopers LLP (PwC) serves as the principal accountant for the Longleaf Partners Funds. Under Longleaf’s Audit Committee Charter, the Audit Committee must pre-approve all audit and non-audit services. No additional pre-approval policies and procedures described in paragraph (c)(7) of Rule 2-01 of Regulation S-X have been adopted. No services included in (b.) through (d.) above were approved pursuant to paragraph (c)(7)(ii) of Rule 2-01 of Regulation S-X. PwC’s Dublin office provided €16,298 of audit and €10,455 of tax services to Longleaf Management Company (Ireland) Limited, a 100% wholly owned subsidiary of Southeastern Asset Management, Inc.; $43,174 of audit and $20,112 of tax services to Longleaf Partners Unit Trust, an Irish based UCITS Fund managed by Southeastern, and $8,610 of tax services to Southeastern Asset Management, Inc. related to the UCITS Funds.
| Item 5. | Audit Committee of Listed Registrants. |
Not applicable.
| Item 6. | Schedule of Investments. |
A complete schedule of investments for the period ended December 31, 2014 is included in the Annual Report filed under Item I of this form.
| Item 7. | Disclosure of Proxy Voting Policies and Procedures for Closed-End Management Investment Companies. |
Not applicable.
| Item 8. | Portfolio Managers of Closed-End Management Investment Companies. |
Not applicable.
| Item 9. | Purchases of Equity Securities by Closed-End Management Investment Company and Affiliated Purchasers. |
Not applicable.
| Item 10. | Submission of Matters to a Vote of Security Holders. |
The registrant does not currently have in place procedures by which shareholders may recommend nominees to the registrant’s board of directors.
| Item 11. | Controls and Procedures. |
The registrant’s principal executive officer and principal financial officer have concluded, based on their evaluation of the effectiveness of the design and operation of the registrant’s disclosure controls and procedures as of a date within 90 days of the filing date of this report on Form N-CSR, that the design and operation of such procedures are effective to provide reasonable assurance that information required to be disclosed by the investment company in the reports that it files or submits under the Securities Exchange Act of 1934 is recorded, processed, summarized, and reported within the time periods specified in the Commission’s rules and forms.
At the date of filing this Form N-CSR, the registrant’s principal executive officer and principal financial officer are aware of no changes in the registrant’s internal control over financial reporting during the most recent fiscal quarter of the period covered by this report (ie, the fourth quarter) that have materially affected, or are reasonably likely to materially affect, the registrant’s internal control over financial reporting.
Exhibit 99. CERT Certification Required by Item 12(a)(2) of Form N-CSR
Exhibit 99.906 CERT Certification Pursuant to Section 906 of the Sarbanes Oxley Act.
SIGNATURES
Pursuant to the requirements of the Securities Exchange Act of 1934 and the Investment Company Act of 1940, the registrant has duly caused this report to be signed on its behalf by the undersigned, thereunto duly authorized.
| | |
| Longleaf Partners Funds Trust |
| |
| By | | /s/ O. Mason Hawkins |
| | O. Mason Hawkins Trustee Longleaf Partners Funds Trust |
Date February 13, 2015
Pursuant to the requirements of the Securities Exchange Act of 1934 and the Investment Company Act of 1940, this report has been signed below by the following persons on behalf of the registrant and in the capacities and on the dates indicated.
| | |
| By | | /s/ O. Mason Hawkins |
| | O. Mason Hawkins Chairman and CEO, Southeastern Asset Management, Inc. Functioning as principal executive officer under agreements with Longleaf Partners Funds Trust and its separate series |
Date February 13, 2015
| | |
By | | /s/ Julie M. Bishop |
| | Julie M. Bishop Mutual Fund CFO & Principal, Southeastern Asset Management, Inc. Functioning as principal financial officer under agreements with Longleaf Partners Funds Trust and its separate series |
Date February 13, 2015
A signed original of this written statement has been provided to Longleaf Partners Funds Trust and will be retained by Longleaf Partners Funds Trust and furnished to the Securities and Exchange Commission or its staff upon request.