UNITED STATES
SECURITIES AND EXCHANGE COMMISSION
Washington, D.C. 20549
FORM N-CSR
CERTIFIED SHAREHOLDER REPORT OF REGISTERED
MANAGEMENT INVESTMENT COMPANIES
Investment Company Act file number: 811-4923
|
| Longleaf Partners Funds Trust |
(Exact name of registrant as specified in charter)
|
c/o Southeastern Asset Management, Inc. 6410 Poplar Avenue, Suite 900 Memphis, TN 38119 |
(Address of principal executive offices) (Zip code)
Andrew R. McCarroll, Esq.
|
Southeastern Asset Management, Inc. 6410 Poplar Ave., Suite 900 Memphis, TN 38119 |
(Name and address of agent for service)
Registrant’s telephone number, including area code: (901) 761-2474
Date of fiscal year end: December 31
Date of reporting period: December 31, 2016.
| Item 1. | Longleaf Partners Funds Annual Report at December 31, 2016. |
|
Partners Fund |
|
Small-Cap Fund |
|
International Fund |
|
Global Fund |
|
December 31, 2016 |

One of Southeastern’s “Governing Principles” is that “we will communicate with our investment partners as candidly as possible,” because we believe Longleaf shareholders benefit from understanding our investment philosophy and approach. Our views and opinions regarding the investment prospects of our portfolio holdings and Funds are “forward looking statements” which may or may not be accurate over the long term. While we believe we have a reasonable basis for our appraisals, and we have confidence in our opinions, actual results may differ materially from those we anticipate. Information provided in this report should not be considered a recommendation to purchase or sell any particular security.
You can identify forward looking statements by words like “believe,” “expect,” “anticipate,” or similar expressions when discussing prospects for particular portfolio holdings and/or one of the Funds. We cannot assure future results and achievements. You should not place undue reliance on forward looking statements, which speak only as of the date of this report. We disclaim any obligation to update or alter any forward looking statements, whether as a result of new information, future events, or otherwise. Current performance may be lower or higher than the performance quoted herein. Past performance does not guarantee future results, fund prices fluctuate, and the value of an investment may be worth more or less than the purchase price. Call (800) 445-9469 or go to longleafpartners.com for current performance information and for the Prospectus and Summary Prospectus, both of which should be read carefully before investing to learn about fund investment objectives, risks and expenses. This material must be accompanied or preceded by a prospectus. Please read it carefully before investing.
The price-to-value ratio (“P/V”) is a calculation that compares the prices of the stocks in a portfolio to Southeastern’s appraisals of their intrinsic values. P/V represents a single data point about a Fund, and should not be construed as something more. We caution our shareholders not to give this calculation undue weight. P/V alone tells nothing about:
| • | | The quality of the businesses we own or the managements that run them; |
| • | | The cash held in the portfolio and when that cash will be invested; |
| • | | The range or distribution of individual P/V’s that comprise the average; and |
| • | | The sources of and changes in the P/V. |
When all of the above information is considered, the P/V is a useful tool to gauge the attractiveness of a Fund’s potential
opportunity. It does not, however, tell when that opportunity will be realized, nor does it guarantee that any particular company’s price will ever reach its value. We remind our shareholders who want to find a single silver bullet of information that investments are rarely that simple. To the extent an investor considers P/V in assessing a Fund’s return opportunity, the limits of this tool should be considered along with other factors relevant to each investor.
Unless otherwise noted, performance returns of Fund positions combine the underlying stock and bond securities including the effect of trading activity during the period.
Risks
The Longleaf Partners Funds are subject to stock market risk, meaning stocks in the Fund may fluctuate in response to developments at individual companies or due to general market and economic conditions. Also, because the Funds generally invest in 15 to 25 companies, share value could fluctuate more than if a greater number of securities were held. Mid-cap stocks held by the Funds may be more volatile than those of larger companies. With respect to the Small-Cap Fund, smaller company stocks may be more volatile with fewer financial resources than those of larger companies. With respect to the International and Global Funds, investing in non- U.S. securities may entail risk due to non-U.S. economic and political developments, exposure to non-U.S. currencies, and different accounting and financial standards. These risks may be higher when investing in emerging markets. Diversification does not eliminate the risk of experiencing investment losses.
Derivatives may involve certain costs and risks such as liquidity, interest rate, market, credit, management, and the risk that a position could not be closed when most advantageous. Investing in derivatives could lose more than the amount invested.
Indexes
The S&P 500 Index is an index of 500 stocks chosen for market size, liquidity and industry grouping, among other factors. The S&P is designed to be a leading indicator of U.S. equities and is meant to reflect the risk/return characteristics of the large cap universe.
The Russell 2000 Index measures the performance of the 2,000 smallest companies in the Russell 3000 Index, which represents approximately 10% of the total market capitalization of the Russell 3000 Index.
MSCI EAFE Index (Europe, Australasia, Far East) is a broad based, unmanaged equity market index designed to measure the equity market performance of 22 developed markets, excluding the US & Canada.
MSCI World Index is a broad-based, unmanaged equity market index designed to measure the equity market performance of 24 developed markets, including the United States.
An index cannot be invested in directly.
Definitions
Brexit (“British exit”) refers to the June 23, 2016 referendum by British voters to leave the European Union.
Earnings Power is Southeastern’s estimated free cash flow per share that we expect the company is able to produce in the time-frame mentioned. Pro-forma for any one time items and/or mergers and acquisitions.
EBIT is earnings before interest and taxes.
EBITDA is a company’s earnings before interest, taxes, depreciation and amortization.
Free Cash Flow (FCF) is a measure of a company’s ability to generate the cash flow necessary to maintain operations. Generally, it is calculated as operating cash flow minus capital expenditures.
Master limited partnership (MLP) is, generally, a limited partnership that is publicly traded on a securities exchange.
Price / Earnings (P/E) is the ratio of a company’s share price compared to its earnings per share.
P/V (“price to value”) is a calculation that compares the prices of the stocks in a portfolio to Southeastern’s appraisal of their intrinsic values. The ratio represents a single data point about a Fund and should not be construed as something more. P/V does not guarantee future results, and we caution investors not to give this calculation undue weight.
REIT is a real estate investment trust.
© 2017 Southeastern Asset Management, Inc. All Rights Reserved.
Longleaf, Longleaf Partners Funds and the pine cone logo are registered trademarks of Longleaf Partners Funds Trust. Southeastern Asset Management, Inc. is a registered trademark.
Funds distributed by ALPS Distributors, Inc.
| | | | | | |
| | Longleaf Partners Funds | | ◾ | | 1 |
| | |
Performance Summary | | (Unaudited) |
| | | | | | | | | | | | | | | | | | | | | | | | | | | | | | | | |
| Cumulative Returns at December 31, 2016 | |
| | | Since Inception | | 25 Year | | 20 Year | | 15 Year | | Ten Year | | Five Year | | One Year | | 4Q | |
Partners Fund
(Inception 4/8/87) | | | 1803.91 | % | | | 1027.38 | % | | | 355.55 | % | | | 128.56 | % | | | 37.00 | % | | | 58.33 | % | | | 20.72 | % | | | 2.03 | % |
S&P 500 Index | | | 1401.91 | | | | 792.07 | | | | 339.34 | | | | 164.28 | | | | 95.72 | | | | 98.18 | | | | 11.96 | | | | 3.82 | |
Small-Cap Fund
(Inception 2/21/89) | | | 1773.70 | | | | 1645.45 | | | | 748.58 | | | | 371.48 | | | | 118.97 | | | | 104.24 | | | | 20.48 | | | | 3.88 | |
Russell 2000 Index | | | 1193.67 | | | | 908.67 | | | | 387.76 | | | | 239.40 | | | | 97.94 | | | | 96.45 | | | | 21.31 | | | | 8.83 | |
International Fund
(Inception 10/26/98) | | | 245.18 | | | | na | | | | na | | | | 83.00 | | | | 6.35 | | | | 36.81 | | | | 12.20 | | | | -0.31 | |
MSCI EAFE Index | | | 102.54 | | | | na | | | | na | | | | 116.52 | | | | 7.75 | | | | 37.22 | | | | 1.00 | | | | -0.71 | |
Global Fund
(Inception 12/27/12) | | | 25.38 | | | | na | | | | na | | | | na | | | | na | | | | na | | | | 20.43 | | | | 1.60 | |
MSCI World Index | | | 41.91 | | | | na | | | | na | | | | na | | | | na | | | | na | | | | 7.51 | | | | 1.86 | |
| | |
| Average Annual Returns at December 31, 2016 | | | | | | |
| | | Since Inception | | 25 Year | | 20 Year | | 15 Year | | Ten Year | | Five Year | | One Year | | | |
Partners Fund
(Inception 4/8/87) | | | 10.42 | % | | | 10.17 | % | | | 7.88 | % | | | 5.67 | % | | | 3.20 | % | | | 9.63 | % | | | 20.72 | % | | | | |
S&P 500 Index | | | 9.53 | | | | 9.15 | | | | 7.68 | | | | 6.69 | | | | 6.95 | | | | 14.66 | | | | 11.96 | | | | | |
Small-Cap Fund
(Inception 2/21/89) | | | 11.09 | | | | 12.12 | | | | 11.28 | | | | 10.89 | | | | 8.15 | | | | 15.35 | | | | 20.48 | | | | | |
Russell 2000 Index | | | 9.63 | | | | 9.69 | | | | 8.25 | | | | 8.49 | | | | 7.07 | | | | 14.46 | | | | 21.31 | | | | | |
International Fund
(Inception 10/26/98) | | | 7.05 | | | | na | | | | na | | | | 4.11 | | | | 0.62 | | | | 6.47 | | | | 12.20 | | | | | |
MSCI EAFE Index | | | 3.96 | | | | na | | | | na | | | | 5.28 | | | | 0.75 | | | | 6.53 | | | | 1.00 | | | | | |
Global Fund
(Inception 12/27/12) | | | 5.80 | | | | na | | | | na | | | | na | | | | na | | | | na | | | | 20.43 | | | | | |
MSCI World Index | | | 9.13 | | | | na | | | | na | | | | na | | | | na | | | | na | | | | 7.51 | | | | | |
The indices are unmanaged. During the inception year, the S&P 500 and the EAFE Index were available only at month-end; therefore the S&P 500 value at 3/31/87 and the EAFE value at 10/31/98 were used to calculate performance since inception. Returns reflect reinvested capital gains and dividends but not the deduction of taxes an investor would pay on distributions or share redemptions. Performance data quoted represents past performance; past performance does not guarantee future results. The investment return and principal value of an investment will fluctuate so that an investor’s shares, when redeemed, may be worth more or less than their original cost. Current performance of a Fund may be lower or higher than the performance quoted. Performance data current to the most recent month end may be obtained by visiting longleafpartners.com.
As reported in the Prospectus dated May 1, 2016, the total expense ratios for the Longleaf Partners Funds are: Partners Fund 0.93%, Small-Cap Fund 0.91%, International Fund 1.28%, and Global Fund 1.54%. The Funds’ expense ratios are subject to fee waiver to the extent a Fund’s normal annual operating expenses exceed the following percentages of average annual net assets: Partners Fund 1.50%, Small-Cap Fund 1.50%, International Fund 1.75%, and Global Fund 1.65%. Effective May 1, 2016, Southeastern agreed to voluntarily reduce the Global Fund’s expense limit to 1.20%. This voluntary fee waiver for the Global Fund may be discontinued at any time.
| | | | | | |
| | Longleaf Partners Funds | | ◾ | | 2 |
| | |
Letter To Our Shareholders | | |
We are pleased to report that 2016 was a great year for the shareholders of the Longleaf Partners Funds. All four Funds delivered strong absolute results, three outperformed their indices by a wide margin, and each Fund ended the year well-positioned for the future. We produced good returns because: the competitive advantages of our businesses built organic value growth; our corporate leaders made intelligent capital allocation decisions that meaningfully augmented value; the market began to recognize our companies’ higher intrinsic worth; and, we positioned the Funds’ portfolios to maximize returns while limiting downside. We are highly confident the Funds will continue delivering excess returns because the quality and leadership of our investees should drive additional value accretion and because of market factors that appear more favorable to our bottom-up, valuation based investment approach.
| | | | | | | | |
| | | One Year | | | 4Q | |
Partners Fund | | | 20.72 | % | | | 2.03 | % |
S&P 500 Index | | | 11.96 | | | | 3.82 | |
Small-Cap Fund | | | 20.48 | | | | 3.88 | |
Russell 2000 Index | | | 21.31 | | | | 8.83 | |
International Fund | | | 12.20 | | | | -0.31 | |
MSCI EAFE Index | | | 1.00 | | | | -0.71 | |
Global Fund | | | 20.43 | | | | 1.60 | |
MSCI World Index | | | 7.51 | | | | 1.86 | |
Past performance does not guarantee future results.
Our most widely held and more heavily weighted holdings across the Funds are uniquely long-term investments that we know very well. These companies, like Level 3 Communications, FedEx, CK Hutchison, Cheung Kong Property, EXOR, CNH Industrial, Graham Holdings, LafargeHolcim, and Liberty Media, all have growing competitive advantages, highly capable management partners, and cash-generative businesses that should continue to grow their values per share. This group trades at a very attractive average multiple of 11 to 12 times our calculated 2017 - 18 earnings power versus the S&P 500’s 16 to 17 times and MSCI EAFE’s 14 to 15 times current price-earnings (P/E) multiple based on next twelve month estimates.
This time last year, the energy and gaming investments in the Funds were a source of disappointment, even though we felt that our management partners were making smart moves. In 2016, as a whole these investments posted substantial returns that outperformed their industries. Going into 2017, these companies have strengthened their balance sheets through accretive actions while focusing and improving their operations. Their industries
now have tailwinds, as commodity prices have returned to more reasonable, yet still low, levels, and Macau gaming has shown early signs of renewed growth. This group is now on offense.
Most of our remaining investments in the Funds fall into a third group of diverse businesses. We have not held them as long as most of the companies mentioned above, but they qualify strongly on business, people, and price. We expect their values to grow at an above-average level. Our management partners are exceptional, and these companies could remain core holdings for many years. They include businesses such as Alphabet, United Technologies, and ViaSat in the U.S., European-based C&C and Ferrovial (that we successfully owned in the last Eurozone crisis) and Asian-based Great Eagle and Yum China (a fourth quarter addition that we have known well for many years).
A final point on the Funds’ portfolios is that our on-deck list — while shorter than usual — does have strong candidates. After another up year, the U.S. is less compelling than other world markets. Still, we have found new qualifiers in both the large and small-cap areas and continue to search. In Europe, dispersion among stocks is greater, but the lower-than- U.S. market P/E multiple is dragged down by lesser quality businesses that are not attractive to us. However, we have several exceptions on deck. Asia remains the most discounted region, although the most undervalued industries of real estate and gaming are already well represented in our portfolios. We have looked at a number of Japanese prospects in the last year, but most either were away from our price limit or had limited liquidity.
The shift to indexing had been a headwind for the Funds for several years because it drove stocks to move in lockstep and favored momentum investing, as indexing is a strategy that buys more of what has been going up. Even though indexing remains in favor, 2016, and the second half of the year in particular, saw positive signs that this force is abating. Correlations between stocks declined, and the market began to weigh company-specific factors more, which rewards our skills as business appraisers. As contrarians we couldn’t help but get excited by a classic headline in the October 17th edition of the Wall Street Journal — “The Dying Business of Picking Stocks.”
Persistently low — and in some cases negative — interest rates stayed with us for most of 2016, but the fourth quarter saw a dramatic turn upward in rates after the U.S. election. While we do not claim to be macro forecasters, higher rates going forward now seem more likely than not. We have avoided higher yielding stocks that had become bond proxies and are now most at risk of a multiple re-rating. We believe we own companies with pricing power and intelligently structured balance sheets that will allow them to build value expeditiously in a higher rate world.
| | | | | | |
| | Longleaf Partners Funds | | ◾ | | 3 |
| | |
Letter To Our Shareholders | | |
One final point on markets is that the fourth quarter of 2016 saw a return of potentially excessive optimism in certain market segments and geographies, especially in the U.S. We are seeing high readings of bullishness from market prognosticators, and the volatility index is approaching historically low levels — a dangerous mix of exuberant complacency. Should recent indexers get disappointed, their exit could catalyze a more serious market correction, and yield-seekers who switched out of bonds might regret that stocks don’t have fixed maturity payoffs. The Funds’ current above-average cash levels, which are a result of finding few qualifying investments, should provide a buffer for any market pullback. More importantly, they will allow us to purchase our next great investments.
While a discriminating market should favor the Funds, our current investments and what we purchase in the future will drive our returns going forward, just as they did in 2016. We have worked to intelligently build concentrated portfolios that should deliver over the long term, and we will remain engaged with our management partners to both help them and hold them accountable.
As we wrote in early 2016, we began shifting Southeastern’s managerial responsibilities to maximize the time our most senior
investors spend on research and portfolio management and to broaden the experience of other team members. Our Deputy Director of Research and co-manager of the Small-Cap Fund, Ross Glotzbach, who joined Southeastern in 2004, has increasingly coordinated our research process and helped us become more effective. As the logical next step to assuming more research management duties, Ross will become Head of Research in 2017.
We close this letter by thanking you for your investing partnership. As the largest investor group in the Funds, Southeastern employees are gratified we delivered the significant risk-adjusted excess returns you expect. At the end of 2000, another strong year following an out of favor period, we ended our letter “...with a word of thanks for being logical, disciplined partners who understood the difference between investment and speculation when the rational world seemed gone. Standing against conventional wisdom is never easy, but is often profitable. We are pleased that your patience was rewarded.” Those words ring true today, and we are as excited about the future now as we were then.
Southeastern’s Co-Investing Partnership Approach
Southeastern believes in aligning our interests with our client partners by investing alongside them. Employees and their immediate family members who want to own public equities must invest via the funds that Southeastern manages - special approval to own individual public equities is a rare exception.
- U.S. employees can invest in the Longleaf Partners mutual funds.
- Offshore employees and clients who require non-U.S. vehicles for tax and regulatory reasons can own Ireland-based Longleaf Partners UCITS funds, which generally replicate our U.S. mutual funds and separately managed strategies.
- We also manage private funds that include some companies held by the mutual funds and UCITS plus investments that do not meet Longleaf’s criteria. Although many of our employees are not eligible to access these funds, several have ownership interests in these structures, which aligns us with investors in these strategies.
The employees of Southeastern, the Longleaf Board, and non-profit entities affiliated with members of the firm are the largest collective shareholder group across the Longleaf mutual funds.
ALPS Distributors, Inc. is not the distributor for the UCITS or separately managed strategies.
| | | | | | |
| Partners Fund | | Longleaf Partners Funds | | ◾ | | 4 |
| | |
Partners Fund Management Discussion | | |
Longleaf Partners Fund made substantial gains throughout the year, rising 20.72% in 2016, a large premium over the S&P 500’s 11.96% return. The Fund’s outperformance began in mid-February and occurred in spite of higher-than-normal cash in the portfolio. In the fourth quarter, the Fund appreciated 2.03% while the S&P 500 added 3.82%, most of which came following the presidential election.
The Fund outperformed in two distinct market environments. Over the first seven months of the year, the pursuit of high yield and low volatility dominated. Then more cyclical stocks took over, with over half of their last five month returns occurring in November. The Partners Fund’s successful performance had little to do with the index’s return. We had limited exposure to the markets’ preferences in either period.
Solid operational performance and smart capital allocation by our management partners who pursued value accretive transactions drove the Fund’s substantial results. The company-specific nature of our 2016 return reinforced the importance of investing with a long time horizon and aligned, shareholder-oriented capable corporate leadership. While it is difficult to predict near term stock prices, if our businesses are selling at a meaningful discount to their intrinsic worth, are growing free cash flow over the long term, and are run by people who are motivated to build value per share, good returns can be expected. These same characteristics describe our current holdings, are the criteria required for new investments, and therefore form the basis for our confidence in our ability to continue to deliver solid results.
Annual Contributors/Detractors
(2016 investment return; 2016 Fund contribution)
Chesapeake Energy (+377%; +8.46%), one of the largest U.S. producers of natural gas, oil, and natural gas liquids, was the Fund’s top contributor to performance in 2016 and gained an additional 12% in the fourth quarter. Earlier in the year, we transitioned our equity position into heavily discounted bonds and convertible preferred stock, which offered equity-like returns higher in the capital structure and a potentially faster payback. As the bonds rose close to par, we exited them. At the end of the third quarter, we converted all of our appreciated preferred securities into common stock for an attractive premium. Over the course of the year, management executed beyond expectations, selling various assets, improving the balance sheet through discounted debt repurchases, reducing operating and capital expenditures, and renegotiating midstream contracts. The most recent asset sales in the fourth quarter included a portion of the company’s properties in the Haynesville Shale in northern
Louisiana for proceeds of approximately $915 million. Signed or closed asset sales reached $2.5 billion in 2016, exceeding management’s original target of $1 billion. To further strengthen its balance sheet, the company secured a term loan and convertible debt offering, which raised more capital at better terms than expected. Since the beginning of 2012, Chesapeake has reduced debt by 50%, and its remaining fixed liabilities should be well covered in the coming years. The company has targeted a two times net debt over earnings before interest, taxes, depreciation, and amortization (EBITDA) with cash flow neutrality by 2018 and 5 to 15% of annual production growth by 2020. We salute CEO Doug Lawler and Chesapeake’s board, with Brad Martin as Chairman, for their successful pursuit of shareholder value in the face of massive headwinds.
CONSOL Energy (+131%; +3.96%), the natural gas and Appalachian coal company also contributed large gains over the year. CEO Nick Deluliis, management and the board, led by Chairman Will Thorndike, monetized assets and continued to cut costs in the pursuit of separating the coal and gas businesses which is expected to happen in 2017. Following the disposition of its metallurgical coal assets in the first half of the year, CONSOL sold its high cost Miller Creek and Fola thermal coal mines to a private buyer at a price above our appraisal. The company also delivered positive free cash flow (FCF) for the year, which many thought very unlikely at the start of 2016. In the fourth quarter, CONSOL announced the unwinding of a joint venture with Noble Energy in which the company received $205 million in cash from Noble while maintaining ownership of valuable EBITDA-producing properties. Recent transactions involving other companies’ gas assets in Appalachia, as well as CONSOL’s own midstream master limited partnerships’ (MLP) prices, support our appraisal of CONSOL, which is much higher than the stock price.
Wynn Resorts (+28%; +2.29%), the luxury gaming and hotel operator with prime real estate in Las Vegas, Macau, and Boston, was another significant contributor during the year, despite a slight retreat in the fourth quarter. The total Macau market reported higher gross gaming revenues year-over-year in most months of the second half, indicating stabilization and a return to growth. In August, the company opened the Wynn Palace in Cotai (Macau). The property has ramped up more slowly than some analysts had hoped, but Wynn has a history of careful openings and eventual success. During the fourth quarter, sentiment shifted up and down, as some positive industry level data points were offset by concerns over Chinese policy changes that could potentially impact Macau indirectly. In the U.S., Las Vegas had solid results, and the company received the final licenses necessary to begin construction of Wynn Boston Harbor, which is expected to open in 2019. Wynn also announced plans to develop
| | | | | | |
| Partners Fund | | Longleaf Partners Funds | | ◾ | | 5 |
| | |
Partners Fund Management Discussion | | |
part of its Las Vegas golf course property into a hotel, restaurants, and other attractions. In December, the company sold 49% of its retail assets in Las Vegas for over twenty times EBITDA, which was accretive to our value and well above where the stock trades. The sale was also further evidence of how our heavily-aligned partner, Steve Wynn, continues to build value per share and pursue value recognition for shareholders.
FedEx (+26%; +2.16%), the global transportation and logistics company, was also a leading contributor for 2016 after gaining 7% in the fourth quarter. The company raised guidance for fiscal year 2017 and continued to buy back its discounted shares. Our appraisal increased as expense reductions in Express over the last several years helped raise margins. Investing in growth at Ground depressed margins in that division but should have meaningful payoff longer term. The TNT acquisition, finalized in May, should materially benefit profitability by increasing the final mile density of FedEx’s business across Europe. Management indicated that the integration of TNT should generate at least $750 million of annual synergies across its network over the next few years. We believe that CEO Fred Smith and his capable leadership team will continue to drive value growth for shareholders.
Scripps Networks (+32%,+1.92%), the media company whose three main brands are HGTV, Food Network, and Travel Channel, had solid advertising revenue gains during the year, and the stock continued its rise in the fourth quarter, gaining 13%. Ratings were strong overall in 2016, and HGTV ended up as the third most watched U.S. cable channel behind ESPN and Fox News. The company’s advertising has more exposure to stable categories than most competitors and also earns premiums per viewer over the competition. The year did see a decline in distributor fees paid to Scripps, but this was due to one-time items that will be lapped next year. Part of the stock’s discount is related to international expansion which has not yet produced profits but has created startup costs and non-cash amortization. Scripps’ high-profile lifestyle channels could be valuable content for other media and entertainment companies, as evidenced by AT&T’s recent bid for Time Warner at an attractive multiple relative to Scripps’ stock price.
Level 3 Communications (+4%; +0.31%), a global fiber and integrated communications network company was the primary contributor to the Fund’s fourth quarter return. The stock rose 22% with the announcement of a merger with CenturyLink, Inc., equating to $66.50 per Level 3 share, a 42% premium to the closing price prior to the announcement. This deal offers numerous benefits for shareholders. The combined company will increase the capacity and reach of CenturyLink’s domestic and Level 3’s global high- bandwidth fiber networks. Although
CenturyLink has been tainted by the performance of its legacy landline business, its Qwest fiber network is a high quality asset. Projected synergies total $975 million, with $125 million in reduced capital expenditures and the remaining $850 million split in half between operating expense reductions and moving data usage onto the company’s own network. Additionally, Level 3 will get four directors on the new board. CenturyLink CEO Glen Post has announced that the new CFO will be Sunit Patel who has successfully integrated large acquisitions and managed balance sheets well in his tenure at Level 3.
CK Hutchison (-14%; -1.59%), a global conglomerate comprised of five core businesses (retail, telecommunications, infrastructure, ports, and energy) was the Fund’s only noteworthy detractor for the year. The stock declined in the first half of 2016 in the wake of the rejection by European regulators of its acquisition of U.K. telecom company O2, in addition to Brexit which created concerns about the impact on the company’s sizable operations in Europe and the U.K. Following a strong third quarter where the company announced a merger creating the largest Italian mobile operator, the stock lost ground in the fourth quarter after the U.S. election. A stronger U.S. dollar and expectations of tougher trade weighed on Hong Kong stocks in general and on the Hong Kong dollar’s relationship to the British pound and euro, where over half of the company’s earnings before interest and taxes (EBIT) originate. Our owner-operator partners, Victor Li and his father Li Ka-shing, continued to focus the company on its core competencies by selling its aircraft leasing business during the quarter.
Annual Portfolio Activity
Given the long running bull market and additional rise in 2016, finding new businesses that met our requisite discount proved challenging. Additionally, with our strong returns, prices of many holdings grew closer to appraisals, and some of the biggest performers became more heavily weighted in the portfolio. We trimmed a number of positions and exited McDonald’s, Aon, and National Oilwell Varco in the first quarter, as well as Philips in the third quarter. Cash rose in the portfolio during the first quarter and remained in the teens throughout the year. We were able to buy two new investments in the Fund —Ralph Lauren in the second quarter and T. Rowe Price (TROW) in the fourth. TROW is a diversified investment advisory firm with a dominant position in U.S. target date fund retirement assets, which account for about twenty percent of assets under management (AUM). TROW’s funds have performed well and had net inflows, even with the active management headwinds the industry has faced. Over the last ten years, the company has put capital into building its international investments and
| | | | | | |
| Partners Fund | | Longleaf Partners Funds | | ◾ | | 6 |
| | |
Partners Fund Management Discussion | | |
distribution. The company currently has just below twenty percent of AUM in international funds and a mid-single digit percent of total AUM coming from offshore investors. As this business grows, margins should rise accordingly. The company’s balance sheet has net cash, and we are confident in the aligned management team who has a record of prudent capital allocation.
Outlook
The Fund’s price-to-value (P/V) in the low-70s% offers attractive upside. Much uncertainty remains as to how U.S. tax, trade, and regulatory policies will change in the new administration. More volatility, lower market correlations, and higher interest rates would likely unearth new opportunities for the Fund’s 18% cash. For example, we are already beginning to find more prospects in healthcare following the sector’s decline amid controversies around drug pricing and questions over the future of the U.S. system.
Most importantly, we believe our companies can grow their values substantially and have the ability to deliver good returns in a variety of scenarios. For example, our two largest holdings, Level 3 and FedEx, as well as LafargeHolcim, benefitted from merger activity in 2016 and have significant revenue prospects from their combinations that are not included in projected synergies, and they have skilled leadership with experience at successful company integrations. We hold numerous other businesses that have had meaningful capital investment programs over the last few years that should begin to generate returns in 2017 and beyond. These include Wynn’s newly opened Palace in Macau, United Technologies’ Pratt jet engines, T. Rowe’s international business, and varied projects at Alphabet. As 2016 showed, CEOs and boards who are competent and shareholder-oriented create value. Our corporate partners, as well as the quality of our businesses, give us confidence in our future prospects.
| | | | | | |
| Partners Fund | | Longleaf Partners Funds | | ◾ | | 7 |
| | |
Performance History | | (Unaudited) |
Comparison of Change in Value of $10,000 Investment
Since Inception April 8, 1987
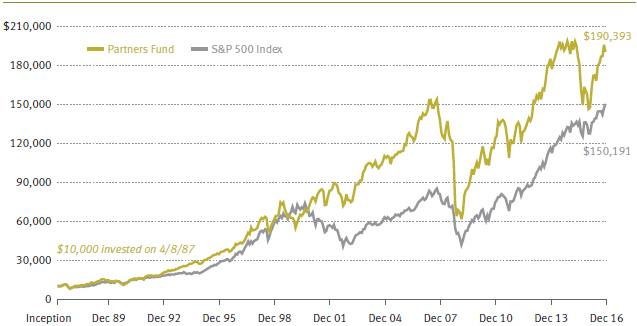
Average Annual Returns for the Periods Ended December 31, 2016
| | | | | | | | | | | | | | |
| | | Since Inception 4/8/87 | | 25 Year | | 20 Year | | 15 Year | | Ten Year | | Five Year | | One Year |
Partners Fund | | 10.42% | | 10.17% | | 7.88% | | 5.67% | | 3.20% | | 9.63% | | 20.72% |
S & P 500 Index | | 9.53 | | 9.15 | | 7.68 | | 6.69 | | 6.95 | | 14.66 | | 11.96 |
The index is unmanaged. Because the S&P 500 Index was available only at month-end in 1987, we used the 3/31/87 value for performance since inception. Returns reflect reinvested capital gains and dividends but not the deduction of taxes an investor would pay on distributions or share redemptions. Performance data quoted represents past performance; past performance does not guarantee future results. The investment return and principal value of an investment will fluctuate so that an investor’s shares, when redeemed, may be worth more or less than their original cost. Current performance of the Fund may be lower or higher than the performance quoted. Performance data current to the most recent month end may be obtained by visiting longleafpartners.com. The Partners Fund is subject to stock market risk, meaning stocks in the Fund may fluctuate in response to developments at individual companies or due to general market and economic conditions. Also, because the Fund generally invests in 15 to 25 companies, share value could fluctuate more than if a greater number of securities were held. Mid-cap stocks held may be more volatile than those of larger companies.
As reported in the Prospectus dated May 1, 2016, the total expense ratio for the Partners Fund is 0.93%. The expense ratio is subject to fee waiver to the extent normal annual operating expenses exceed 1.50% of average annual net assets.
| | | | | | |
| Partners Fund | | Longleaf Partners Funds | | ◾ | | 8 |
| | | | | | | | |
| Portfolio Holdings at December 31, 2016 | |
| | | |
| | | | | | Net Assets |
Investments | | | | | | | 81.9 | % |
Level 3 Communications, Inc. | | | 9.7 | | | | | |
FedEx Corporation | | | 9.5 | | | | | |
Alphabet Inc. | | | 6.4 | | | | | |
CONSOL Energy Inc. | | | 6.1 | | | | | |
CK Hutchison Holdings Limited | | | 6.1 | | | | | |
Wynn Resorts, Limited | | | 5.9 | | | | | |
CNH Industrial N.V. | | | 5.8 | | | | | |
Scripps Networks Interactive, Inc. | | | 4.8 | | | | | |
United Technologies Corporation | | | 4.8 | | | | | |
LafargeHolcim Ltd | | | 4.8 | | | | | |
Chesapeake Energy Corporation | | | 4.5 | | | | | |
Cheung Kong Property Holdings Limited | | | 4.1 | | | | | |
Ralph Lauren Corporation | | | 3.5 | | | | | |
E.I. du Pont de Nemours and Company | | | 3.4 | | | | | |
T. Rowe Price Group, Inc. | | | 2.5 | | | | | |
Cash Reserves Net of Other Assets and Liabilities | | | | | | | 18.1 | |
| | | | | | | 100.0 | % |
Fund holdings are subject to change and holding discussions are not recommendations to buy or sell any security.
| | | | |
Portfolio Changes
January 1, 2016 through
December 31, 2016 | |
| | |
| New Holdings | | Quarter | |
Ralph Lauren Corporation | | | 2Q | |
T. Rowe Price Group, Inc. | | | 4Q | |
| Eliminations | | | |
Aon plc | | | 1Q | |
Koninklijke Philips N.V. | | | 3Q | |
McDonald’s Corporation | | | 1Q | |
National Oilwell Varco, Inc. | | | 1Q | |
| | | | | | |
| Partners Fund | | Longleaf Partners Funds | | ◾ | | 9 |
| | | | | | | | | | | | |
| Common Stocks | | | | | | | | | |
| | | | |
| | | Shares | | | Market Value | | | % of Net Assets | |
Aerospace & Defense | | | | | | | | | | | | |
United Technologies Corporation | | | 1,510,327 | | | $ | 165,562,046 | | | | 4.8 | % |
Air Freight & Logistics | | | | | | | | | | | | |
FedEx Corporation | | | 1,752,682 | | | | 326,349,388 | | | | 9.5 | |
Capital Markets | | | | | | | | | | | | |
T. Rowe Price Group, Inc. | | | 1,155,251 | | | | 86,944,190 | | | | 2.5 | |
Chemicals | | | | | | | | | | | | |
E.I. du Pont de Nemours and Company | | | 1,607,158 | | | | 117,965,397 | | | | 3.4 | |
Construction Materials | | | | | | | | | | | | |
LafargeHolcim Ltd(b) (Switzerland) | | | 3,125,741 | | | | 164,236,470 | | | | 4.8 | |
Diversified Telecommunication Services | | | | | | | | | | | | |
Level 3 Communications, Inc.* | | | 5,958,138 | | | | 335,800,658 | | | | 9.7 | |
Hotels, Restaurants & Leisure | | | | | | | | | | | | |
Wynn Resorts, Limited | | | 2,356,836 | | | | 203,889,882 | | | | 5.9 | |
Industrial Conglomerates | | | | | | | | | | | | |
CK Hutchison Holdings Limited (Hong Kong) | | | 18,489,500 | | | | 209,585,022 | | | | 6.1 | |
Internet Software & Services | | | | | | | | | | | | |
Alphabet Inc. — Class C* | | | 287,304 | | | | 221,746,973 | | | | 6.4 | |
Machinery | | | | | | | | | | | | |
CNH Industrial N.V. (U.S. Exchange) (Netherlands) | | | 6,035,759 | | | | 52,450,746 | | | | 1.5 | |
CNH Industrial N.V. (Italian Exchange) (Netherlands) | | | 16,741,515 | | | | 145,654,247 | | | | 4.3 | |
| | | | | | | 198,104,993 | | | | 5.8 | |
Media | | | | | | | | | | | | |
Scripps Networks Interactive, Inc. — Class A | | | 2,325,355 | | | | 165,960,586 | | | | 4.8 | |
Oil, Gas & Consumable Fuels | | | | | | | | | | | | |
Chesapeake Energy Corporation* | | | 21,824,451 | | | | 153,207,646 | | | | 4.5 | |
CONSOL Energy Inc.(c) | | | 11,536,742 | | | | 210,314,807 | | | | 6.1 | |
| | | | | | | 363,522,453 | | | | 10.6 | |
Real Estate Management & Development | | | | | | | | | | | | |
Cheung Kong Property Holdings Limited (Hong Kong) | | | 23,164,000 | | | | 142,039,874 | | | | 4.1 | |
Textiles, Apparel & Luxury Goods | | | | | | | | | | | | |
Ralph Lauren Corporation — Class A | | | 1,348,742 | | | | 121,818,377 | | | | 3.5 | |
Total Common Stocks (Cost $2,212,013,297) | | | | | | | 2,823,526,309 | | | | 81.9 | |
See Notes to Financial Statements.
| | | | | | |
| Partners Fund | | Longleaf Partners Funds | | ◾ | | 10 |
| | |
Portfolio of Investments | | continued |
| | | | | | | | | | | | |
| Options Purchased | | | | | | | | | |
| | | | |
| | | Currency Units | | | Market Value | | | % of Net Assets | |
Currency | | | | | | | | | | | | |
Hong Kong Dollar Put, 9/6/18, with BNP Paribas, Strike Price $7.80 (Hong Kong) (Cost $1,899,750) | | | 170,000,000 | | | $ | 2,686,000 | | | | 0.1 | % |
| Short-Term Obligations | | | | | | | | | |
| | | | |
| | | Principal Amount | | | | | | | |
Repurchase Agreement with State Street Bank, 0.03%, dated 12/30/16, due 1/3/17, Repurchase price $104,334,348 (Collateral: $106,423,777 U.S. Treasury Bond, 3.75% due 11/15/43, Par $94,020,000) | | | 104,334,000 | | | | 104,334,000 | | | | 3.0 | |
U.S. Treasury Bill, 0.51% due 3/16/17 | | | 200,000,000 | | | | 199,802,000 | | | | 5.8 | |
U.S. Treasury Bill, 0.50% due 3/23/17 | | | 325,000,000 | | | | 324,648,025 | | | | 9.4 | |
Total Short-Term Obligations (Cost $628,759,143) | | | | | | | 628,784,025 | | | | 18.2 | |
Total Investments (Cost $2,842,672,190)(a) | | | | | | | 3,454,996,334 | | | | 100.2 | |
Other Assets (Liabilities), Net | | | | | | | (6,708,174 | ) | | | (0.2 | ) |
Net Assets | | | | | | $ | 3,448,288,160 | | | | 100.0 | % |
| * | Non-income producing security. |
| (a) | Aggregate cost for federal income tax purposes is $2,906,672,167. |
| (c) | Affiliated issuer during the period. See Note 5. |
| Note: | Companies headquartered outside the U.S. represent 20.8% of net assets. |
See Notes to Financial Statements.
| | | | | | |
| Small-Cap Fund | | Longleaf Partners Funds | | ◾ | | 11 |
| | |
Small-Cap Fund Management Discussion | | |
Longleaf Partners Small-Cap Fund delivered a substantial return of 20.48% in 2016, following a 3.88% gain in the fourth quarter. The Fund far outpaced the Russell 2000 Index throughout the year until the November presidential election sent the index soaring over 13%, catching up with the Small-Cap Fund to deliver 8.83% in the fourth quarter and 21.31% for the year. Our 2016 risk adjusted absolute and relative returns were impressive given that our cash balance averaged 23% throughout the year. The Fund’s longer term results have materially outpaced the index.
Results at our companies drove the Fund’s return, with a large part of our success coming at the hands of our corporate partners’ moves to build shareholder value. Four holdings, including DreamWorks Animation, Chemtura, Liberty Media, and Level 3 Communications, were involved in attractive mergers or acquisitions. A number of other companies sold or bought assets to focus more heavily on their core businesses. Even at OCI, our primary detractor in 2016, the company was in the process of being acquired before the U.S. government removed tax inversion benefits. The year highlighted the importance of value additive capital allocation by our CEOs and boards. In large measure, because of our capable management partners, we believe the Fund will continue to benefit from not only their operating skills, but their abilities to successfully integrate merged businesses and make value accretive capital decisions. The competitive strength of our businesses and our collaborative engagement with our partners make us confident in the Fund’s future returns.
Annual Contributors/Detractors
(2016 investment return; 2016 Fund contribution)
DreamWorks Animation (+55%, +5.06%), the film studio and multimedia company, was the Fund’s largest contributor for the year. We sold the position in the second quarter after Comcast announced an all cash acquisition for $41 per share. We started buying DreamWorks in the third quarter of 2014 at $19 per share following disappointing new movie releases. Our appraisal hinged on the valuable film library and DreamWorks’ growing success in TV and web content, as well as licensing. We partnered with a strong board led by Chairman Mellody Hobson and owner-operator CEO Jeffrey Katzenberg, who built the company’s brands, developed a presence in China, managed costs, and ultimately monetized the company at full value with a 104% return for the Fund during our two year holding period.
CONSOL Energy (+131%; +3.55%), the natural gas and Appalachian coal company also contributed large gains over the year. CEO Nick Deluliis, management, and the board, led by Chairman Will Thorndike, monetized assets and continued to cut costs in the pursuit of separating the coal and gas businesses,
which is expected to happen in 2017. Following the disposition of its metallurgical coal assets in the first half of the year, CONSOL sold its high cost Miller Creek and Fola thermal coal mines to a private buyer at a price above our appraisal. The company also delivered positive free cash flow (FCF) for the year, which many thought very unlikely at the start of 2016. In the fourth quarter, CONSOL announced the unwinding of a joint venture with Noble Energy in which the company received $205 million in cash from Noble while maintaining ownership of valuable earnings before interest, taxes, depreciation, and amortization (EBITDA) producing properties. Recent transactions involving other companies’ gas assets in Appalachia, as well as CONSOL’s own midstream master limited partnerships’ (MLP) prices, support our appraisal of CONSOL, which is much higher than the stock price.
Liberty Media Corp. (+79%; +3.36%), a holding company for a broad range of entertainment businesses, was an additional large contributor to the Fund’s return in 2016 and rose 11% in the fourth quarter. We initiated the position in the second quarter when “old Liberty Media” spun out three tracking stocks, including Liberty Media Corp (LMCK). LMCK’s main asset immediately post-spin was 34% of Live Nation Entertainment, the largest ticketing and live entertainment company in the world. Live Nation reported solid results throughout the year. Shortly after our purchase of Liberty Media, the company announced its acquisition of a controlling interest in Formula One Group, which is now LMCK’s most important asset. Formula One adds to LMCK’s properties a global, live sports brand with over 400 million unique viewers, and its worldwide races generate long-term contracted revenue from broadcasting, event fees, and advertising. A key part of the acquisition was the appointment of Chase Carey as Formula One Group Chairman. Southeastern successfully partnered with Carey previously, and we are thrilled to partner with him again, as his experience as one of the smartest people in sports media directly relates to the Formula One opportunity. Upon the anticipated first quarter 2017 closing of the acquisition, Liberty Media Corp. will be renamed Formula One Group. Our past investments with Chairman JohnMalone and CEO Greg Maffei have been rewarding, and we expect this opportunity to partner with these superior capital allocators to continue to benefit the Fund.
Wynn Resorts (+27%; +1.67%), the luxury gaming and hotel operator with prime real estate in Las Vegas, Macau, and Boston, was another significant contributor during the year despite a slight retreat in the fourth quarter. The total Macau market reported higher gross gaming revenues year-over-year in most months of the second half, indicating stabilization and a return to growth. In August, the company opened the Wynn Palace in Cotai (Macau). The property has ramped up more slowly than some analysts had hoped, but Wynn has a history of careful openings
| | | | | | |
| Small-Cap Fund | | Longleaf Partners Funds | | ◾ | | 12 |
| | |
Small-Cap Fund Management Discussion | | |
and eventual success. During the fourth quarter, sentiment shifted up and down, as some positive industry level data points were offset by concerns over Chinese policy changes that could potentially impact Macau indirectly. In the U.S., Las Vegas had solid results, and the company received the final licenses necessary to begin construction of Wynn Boston Harbor, which is expected to open in 2019. Wynn also announced plans to develop part of its Las Vegas golf course property into a hotel, restaurants, and other attractions. In December, the company sold 49% of its retail assets in Las Vegas for over twenty times EBITDA, which was accretive to our value and well above where the stock trades. The sale was also further evidence of how our heavily-aligned partner, Steve Wynn, continues to build value per share and pursue value recognition for shareholders.
Scripps Networks (+31%,+1.51%), the media company whose three main brands are HGTV, Food Network and Travel Channel, had solid advertising revenue gains during the year, and the stock continued its rise in the fourth quarter, gaining 13%. Ratings were strong overall in 2016, and HGTV ended up as the third most watched U.S. cable channel behind ESPN and Fox News. The company’s advertising has more exposure to stable categories than most competitors and also earns premiums per viewer over the competition. The year did see a decline in distributor fees paid to Scripps, but this was due to one-time items that will be lapped next year. Part of the stock’s discount is related to international expansion which has not yet produced profits but has created startup costs and non-cash amortization. Scripps’ high-profile lifestyle channels could be valuable content for other media and entertainment companies, as evidenced by AT&T’s recent bid for Time Warner at an attractive multiple relative to Scripps’ stock price.
Level 3 Communications (+4%, +0.19%), a global fiber and integrated communications network company was the primary contributor to the Fund’s fourth quarter return with a 22% gain. The stock rose with the announcement of a merger with CenturyLink, Inc., equating to $66.50 per Level 3 share, a 42% premium to the closing price prior to the announcement. This deal offers numerous benefits for shareholders. The combined company will increase the capacity and reach of CenturyLink’s domestic and Level 3’s global high-bandwidth fiber networks. Although CenturyLink has been tainted by the performance of its legacy landline business, its Qwest fiber network is a high quality asset. Projected synergies total $975 million, with $125 million in reduced capital expenditures and the remaining $850 million split in half between operating expense reductions and moving data usage onto the company’s own network. Additionally, Level 3 will get four directors on the new board. CenturyLink CEO Glen Post has announced that the new CFO will be Sunit Patel who has
successfully integrated large acquisitions and managed balance sheets well in his tenure at Level 3.
OCI (-28%, -0.69%), a global fertilizer and chemical producer, was the largest detractor in the Fund for the year, even after a rebound of 18% in the fourth quarter. The two main pressures on the share price were weakness in nitrogen fertilizer prices and the cancellation of the CF Industries merger as a result of the U.S. government crackdown on tax inversions. Despite depressed fertilizer prices, nitrogen remains an essential part of global food production, and global demand is growing by around 2%, which will help deplete the current excess supply by 2018. Given the high cost and long lead time of building a new plant, it is unlikely that new capacity will be built in the medium term. OCI owns the newest and most efficient nitrogen fertilizer plants in the industry, with its large, new Iowa plant now producing. Its Texas Greenfield methanol plant comes online in late 2017. OCI recently initiated a cost savings plan over $100 million, $65 million of which is executed, and the company has completed the majority of its large capital expenditures. We expect significant earnings production in the coming two years, and CEO Nassef Sawiris and his team are working diligently to grow value per share. In early December, the company announced a 25% premium offer to acquire all publicly held shares of OCI Partners in exchange for OCI shares. The acquisition should allow for operating synergies between methanol assets and incremental free cash flow with a positive impact on the combined balance sheet in 2017.
Annual Portfolio Changes
When their prices reached our appraisals following announcements of being acquired, we exited two holdings during the year — DreamWorks in the second quarter and Chemtura in the third. We also sold our long-held investment in Vail Resorts in the third quarter when the stock reached our appraisal, generating a return of over 300% over our holding period. We trimmed a number of the Fund’s holdings that became overweight and as their price to values (P/V) rose. Our sales added to our cash position, which remained above 20% for most of the year because we found a limited number of new opportunities. The four new qualifiers we did buy — Liberty Media, SEACOR, Sonic, and Eastman Kodak — were positive performers, particularly Liberty. Kodak was initiated in the fourth quarter with the negotiation and subsequent purchase of convertible preferred stock (Preferred) of Kodak. This new security issued by the company at our suggestion is an example of the benefits of our engaged, collaborative approach with boards and management teams. The proceeds from our investment will allow the company to refinance high cost debt and unlock encumbered cash. Most importantly, it will allow CEO
| | | | | | |
| Small-Cap Fund | | Longleaf Partners Funds | | ◾ | | 13 |
| | |
Small-Cap Fund Management Discussion | | |
Jeff Clarke and his team increased financial flexibility to highlight the value of a unique set of printing, imaging, and materials science technology assets. The Preferred provides an attractive risk/reward opportunity. It has an annual cash dividend of 5.5%, is convertible into shares of common stock at $17.40 per share (a substantial discount to our appraisal), and allows us to nominate directors to the board.
Outlook
The Fund’s price-to-value (P/V) in the mid-70s% offers attractive upside. Much uncertainty remains as to how U.S. tax, trade, and regulatory policies will change in the new administration. More volatility, lower market correlations, and higher interest rates would likely unearth new opportunities for the Fund’s 19% cash position.
Most importantly, we believe our companies can grow their values substantially and have the ability to deliver good returns in a variety of scenarios. For example, our two largest holdings, Level 3 and Liberty Media, which benefitted from merger and acquisition activity in 2016, have significant revenue prospects from their combinations that are not included in projected synergies, and they have skilled leadership with experience at successful company integrations. We hold numerous other businesses that have had meaningful capital expenditure investment programs over the last few years that should begin to generate returns in 2017 and beyond. These include ViaSat’s new satellites, Wynn’s newly opened Palace in Macau, Hopewell’s Centre II project, and OCI’s new fertilizer and methanol plants. As 2016 showed, CEOs and boards who are competent and shareholder-oriented create value. Our corporate partners, as well as the quality of our businesses, give us confidence in our future prospects.
| | | | | | |
Small-Cap Fund | | Longleaf Partners Funds | | ◾ | | 14 |
| | |
Performance History | | (Unaudited) |
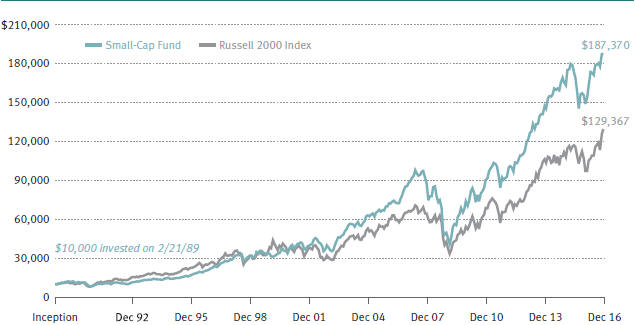
Comparison of Change in Value of $10,000 Investment
Since Inception February 21, 1989
| | | | | | | | | | | | | | | | | | | | | | | | | | | | | | | | | | | |
| Average Annual Returns for the Periods Ended December 31, 2016 |
| | | Since Inception
2/21/89 | | 25 Year | | 20 Year | | 15 Year | | Ten Year | | Five Year | | One Year |
Small-Cap Fund | | | | 11.09 | % | | | | 12.12 | % | | | | 11.28 | % | | | | 10.89 | % | | | | 8.15 | % | | | | 15.35 | % | | | | 20.48 | % |
Russell 2000 Index | | | | 9.63 | | | | | 9.69 | | | | | 8.25 | | | | | 8.49 | | | | | 7.07 | | | | | 14.46 | | | | | 21.31 | |
The index is unmanaged. Returns reflect reinvested capital gains and dividends but not the deduction of taxes an investor would pay on distributions or share redemptions. Performance data quoted represents past performance; past performance does not guarantee future results. The investment return and principal value of an investment will fluctuate so that an investor’s shares, when redeemed, may be worth more or less than their original cost. Current performance of the Fund may be lower or higher than the performance quoted. Performance data current to the most recent month end may be obtained by visiting longleafpartners.com. The Small-Cap Fund is subject to stock market risk, meaning stocks in the Fund may fluctuate in response to developments at individual companies or due to general market and economic conditions. Also, because the Fund generally invests in 15 to 25 companies, share value could fluctuate more than if a greater number of securities were held. Smaller company stocks may be more volatile with less financial resources than those of larger companies.
As reported in the Prospectus dated May 1, 2016, the total expense ratio for the Small-Cap Fund is 0.91%. The expense ratio is subject to fee waiver to the extent normal annual operating expenses exceed 1.50% of average annual net assets.
| | | | | | |
| Small-Cap Fund | | Longleaf Partners Funds | | ◾ | | 15 |
| | | | | | | | |
Portfolio Holdings at December 31, 2016 | |
| | | |
| | | | | | Net Assets | |
Investments | | | | | | | 81.2% | |
Level 3 Communications, Inc. | | | 8.1 | | | | | |
Liberty Media Corporation | | | 6.8 | | | | | |
CONSOL Energy Inc. | | | 5.7 | | | | | |
ViaSat, Inc. | | | 5.7 | | | | | |
Graham Holdings Company | | | 5.5 | | | | | |
Wynn Resorts, Limited | | | 5.4 | | | | | |
Eastman Kodak Company (Preferred) | | | 5.1 | | | | | |
OCI N.V. | | | 4.8 | | | | | |
Scripps Networks Interactive, Inc. | | | 4.8 | | | | | |
Hopewell Holdings Limited | | | 4.6 | | | | | |
Rayonier Inc. | | | 4.4 | | | | | |
Actuant Corporation | | | 3.8 | | | | | |
Deltic Timber Corporation | | | 3.5 | | | | | |
Sonic Corp. | | | 3.1 | | | | | |
Everest Re Group, Ltd. | | | 2.7 | | | | | |
Tribune Media Company | | | 2.6 | | | | | |
Neiman Marcus Group LTD LLC (Bonds) | | | 1.9 | | | | | |
SEACOR Holdings Inc. | | | 1.6 | | | | | |
Triangle USA Petroleum Corporation (Bond) | | | 1.1 | | | | | |
Cash Reserves Net of Other Assets and Liabilities | | | | | | | 18.8 | |
| | | | | | | 100.0% | |
Fund holdings are subject to change and holding discussions are not recommendations to buy or sell any security.
| | | | |
Portfolio Changes
January 1, 2016 through
December 31, 2016 | |
| | |
| New Holdings | | Quarter | |
Eastman Kodak Company | | | 4Q | |
Liberty Media Corporation | | | 2Q | |
SEACOR Holdings Inc. | | | 2Q | |
Sonic Corp. | | | 3Q | |
| Eliminations | | | |
Chemtura Corporation | | | 3Q | |
DreamWorks Animation SKG, Inc. | | | 2Q | |
Orascom Construction Limited | | | 1Q | |
Vail Resorts, Inc. | | | 3Q | |
Wynn Macau, Limited | | | 1Q | |
| | | | | | |
Small-Cap Fund | | Longleaf Partners Funds | | ◾ | | 16 |
| | | | | | | | | | | | |
| Common Stocks | |
| | | | |
| | | Shares | | | Market Value | | | % of Net Assets | |
Chemicals | | | | | | | | | | | | |
OCI N.V.*(b)(c) (Netherlands) | | | 11,011,630 | | | $ | 192,185,967 | | | | 4.8 | % |
Communications Equipment | | | | | | | | | | | | |
ViaSat, Inc.*(c) | | | 3,436,313 | | | | 227,552,647 | | | | 5.7 | |
Diversified Consumer Services | | | | | | | | | | | | |
Graham Holdings Company — Class B(c) | | | 428,000 | | | | 219,114,600 | | | | 5.5 | |
Diversified Telecommunication Services | | | | | | | | | | | | |
Level 3 Communications, Inc.* | | | 5,717,590 | | | | 322,243,373 | | | | 8.1 | |
Energy Equipment & Services | | | | | | | | | | | | |
SEACOR Holdings Inc.*(c) | | | 876,472 | | | | 62,474,924 | | | | 1.6 | |
Hotels, Restaurants & Leisure | | | | | | | | | | | | |
Sonic Corp.(c) | | | 4,590,108 | | | | 121,683,763 | | | | 3.1 | |
Wynn Resorts, Limited | | | 2,504,593 | | | | 216,672,341 | | | | 5.4 | |
| | | | | | | 338,356,104 | | | | 8.5 | |
Insurance | | | | | | | | | | | | |
Everest Re Group, Ltd. (Bermuda) | | | 502,640 | | | | 108,771,296 | | | | 2.7 | |
Machinery | | | | | | | | | | | | |
Actuant Corporation — Class A(c) | | | 5,841,674 | | | | 151,591,440 | | | | 3.8 | |
Media | | | | | | | | | | | | |
Scripps Networks Interactive, Inc. — Class A | | | 2,676,757 | | | | 191,040,147 | | | | 4.8 | |
Tribune Media Company — Class A | | | 3,027,150 | | | | 105,889,707 | | | | 2.6 | |
| | | | | | | 296,929,854 | | | | 7.4 | |
Movies & Entertainment | | | | | | | | | | | | |
Liberty Media Corporation — Class A* | | | 554,201 | | | | 17,374,202 | | | | 0.4 | |
Liberty Media Corporation — Class C* | | | 8,191,953 | | | | 256,653,887 | | | | 6.4 | |
| | | | | | | 274,028,089 | | | | 6.8 | |
Oil, Gas & Consumable Fuels | | | | | | | | | | | | |
CONSOL Energy Inc.(c) | | | 12,494,200 | | | | 227,769,266 | | | | 5.7 | |
Paper & Forest Products | | | | | | | | | | | | |
Deltic Timber Corporation(c) | | | 1,808,158 | | | | 139,354,737 | | | | 3.5 | |
Real Estate Investment Trusts (REITs) | | | | | | | | | | | | |
Rayonier Inc.(c) | | | 6,663,700 | | | | 177,254,420 | | | | 4.4 | |
Real Estate Management & Development | | | | | | | | | | | | |
Hopewell Holdings Limited(c) (Hong Kong) | | | 53,463,500 | | | | 184,772,945 | | | | 4.6 | |
Total Common Stocks (Cost $2,470,083,439) | | | | | | | 2,922,399,662 | | | | 73.1 | |
See Notes to Financial Statements.
| | | | | | |
| Small-Cap Fund | | Longleaf Partners Funds | | ◾ | | 17 |
| | | | | | | | | | | | |
| Preferred Stock | |
| | | | |
| | | Shares | | | Market Value | | | % of Net Assets | |
Technology, Hardware, Storage & Peripherals | | | | | | | | | | | | |
Eastman Kodak Company Convertible Preferred Stock — Series A 5.50%(c)(d) (Cost $186,430,000) | | | 1,864,300 | | | $ | 202,108,763 | | | | 5.1 | % |
| | | |
| Corporate Bonds | | | | | | | | | |
| | | | |
| | | Principal Amount | | | | | | | |
Multiline Retail | | | | | | | | | | | | |
Neiman Marcus Group LTD LLC
8.00% 144A Senior Notes due 10/15/21(e) | | | 79,102,000 | | | | 59,128,745 | | | | 1.5 | |
Neiman Marcus Group LTD LLC
8.75% 144A Senior Notes due 10/15/21(e)(f) | | | 23,236,000 | | | | 16,555,650 | | | | 0.4 | |
| | | | | | | 75,684,395 | | | | 1.9 | |
Oil, Gas & Consumable Fuels | | | | | | | | | | | | |
Triangle USA Petroleum Corporation
6.75% 144A Senior Notes due 7/15/22*(e)(g) | | | 149,101,000 | | | | 45,475,805 | | | | 1.1 | |
Total Corporate Bonds (Cost $146,306,541) | | | | | | | 121,160,200 | | | | 3.0 | |
|
| Options Purchased | |
| | | | |
| | | Currency Units | | | | | | | |
Currency | | | | | | | | | | | | |
Hong Kong Dollar Put, 4/20/17, with BNP Paribas, Strike Price $7.77 (Hong Kong) (Cost $3,580,175) | | | 189,210,080 | | | | 548,709 | | | | — | |
|
| Short-Term Obligations | |
| | | | |
| | | Principal Amount | | | | | | | |
Repurchase Agreement with State Street Bank, 0.03%, dated 12/30/16, due 1/3/17, Repurchase price $142,028,473 (Collateral: $144,869,677 U.S. Treasury Bonds, 3.75% due 11/15/43, Par $127,985,000) | | | 142,028,000 | | | | 142,028,000 | | | | 3.6 | |
U.S. Treasury Bill, 0.51% due 03/16/2017 | | | 150,000,000 | | | | 149,851,500 | | | | 3.8 | |
U.S. Treasury Bill, 0.50% due 03/23/2017 | | | 350,000,000 | | | | 349,620,950 | | | | 8.7 | |
U.S. Treasury Bill, 0.50% due 03/30/2017 | | | 100,000,000 | | | | 99,882,000 | | | | 2.5 | |
Total Short-Term Obligations (Cost $741,355,583) | | | | | | | 741,382,450 | | | | 18.6 | |
Total Investments (Cost $3,547,755,738)(a) | | | | | | | 3,987,599,784 | | | | 99.8 | |
Other Assets (Liabilities), Net | | | | | | | 8,061,522 | | | | 0.2 | |
Net Assets | | | | | | $ | 3,995,661,306 | | | | 100.0 | % |
| * | Non-income producing security. |
| (a) | Aggregate cost for federal income tax purposes is $3,557,110,740. |
| (c) | Affiliated issuer during the period. See Note 5. |
| (d) | These shares were acquired directly from the issuer in a private placement. They are considered restricted securities under the Securities Act of 1933 (the “33 Act”). These shares may be sold only if registered under the 33 Act or an exemption is available. The issuer has filed with the SEC a registration statement on Form S-3 providing for the potential resale on an ongoing basis under 33 Act Rule 415 of Series |
See Notes to Financial Statements.
| | | | | | |
| Small-Cap Fund | | Longleaf Partners Funds | | ◾ | | 18 |
| | A Preferred Stock as well as the Common Stock issuable upon conversion of the Series A Preferred Stock, subject to certain terms of a Registration Rights Agreement with the issuer. Due to the lack of an active trading market, all or a portion of this position may be illiquid. Judgment plays a greater role in valuing illiquid securities than those for which a more active market exists, and are valued using procedures adopted by the Board of Trustees (See Notes 2 and 7). |
| (e) | Security is exempt from registration under Rule 144A of the Securities Act of 1933. This security may be resold in transactions that are exempt from registration, normally to qualified institutional buyers. This security has been deemed liquid pursuant to guidelines approved by the Board of Directors, unless otherwise noted. |
| (f) | Payment-in-kind security for which the issuer has the option at each interest payment date of making interest payments in cash or additional debt securities. |
| (g) | Security is in default. At December 31, 2016, the Fund did not receive scheduled interest payments totaling $7,535,025. |
Note : Companies headquartered outside the U.S. represent 12.1% of net assets.
See Notes to Financial Statements.
| | | | | | |
| International Fund | | Longleaf Partners Funds | | ◾ | | 19 |
| | |
International Fund Management Discussion | | |
Longleaf Partners International Fund returned 12.20% for the year, meaningfully outperforming the MSCI EAFE Index’s 1.00% return and beating our absolute goal of inflation plus 10%. In the fourth quarter, the Fund fared better than the index, falling - 0.31% versus the index’s -0.71% decline.
In two distinct environments, the Fund outperformed with minimal exposure to the areas that periodically drove market returns. In the first nine months, perceived “safe” stocks dominated. The fourth quarter reversed, with cyclicals making gains and defensive and minimum volatility stocks declining rapidly to end the full year among the worst performing areas. Global markets had significant quarterly price volatility across geographies. For example, Hong Kong markets suffered declines in the first and fourth quarters amid China concerns, with the fourth quarter further complicated by fears of higher U.S. interest rates and impacts of a Trump presidency on global trade. Our Hong Kong exposure added positively to 2016 results despite these fears. In Europe, markets rebounded quickly in the third quarter after a negative first half overshadowed by Brexit and European terrorist attacks.
The International Fund’s successful performance had little to do with the index’s return. Solid operational performance and smart capital allocation by our management partners who pursued value accretive transactions drove the Fund’s substantial results. The company-specific nature of our 2016 return reinforced the importance of investing with a long time horizon and aligned, shareholder-oriented corporate leadership. While it is difficult to predict near term stock prices, if our businesses are selling at a meaningful discount to their intrinsic worth, are growing free cash flow over the long term, and are run by people who are motivated to build value per share, good returns can be expected. These same characteristics describe our current holdings, are the criteria required for new investments, and therefore form the basis for our confidence in our ability to continue to deliver solid results.
Annual Contributors/Detractors
(2016 investment return; 2016 Fund contribution)
adidas (+70%, +3.58%), the German-based global sportswear and equipment brand, was the Fund’s top contributor for the year. We sold our stake in the third quarter as the price approached our appraisal value. We engaged in a productive dialogue with the company when necessary since initiating the position in August 2014. Over that time, adidas re-focused on its core brand, grew revenues, sold or sought buyers for non-core segments including Rockport and golf, repurchased just over five percent of the company at substantially discounted prices, replaced the CEO,
and added two highly qualified owners to the Supervisory Board, one of whom we proposed. In the Fund’s two year holding period, adidas returned 122% (in U.S. dollar) and 166% in local currency (euro).
Great Eagle (+60%, +3.06%), a diversified property holding company based in Hong Kong also added to the Fund’s 2016 return. Great Eagle announced a $2 per share special dividend in the second quarter after monetizing commercial real estate in San Francisco at a sub 4% net operating income cap rate. The company also successfully completed the acquisition of a prime hotel site in Roppongi, Tokyo, expected to be operational by the 2020 Tokyo Olympics. In addition to the Langham Hotels owned and operated across global capital cities, Great Eagle owns Hong Kong-listed Champion Real Estate Investment Trust (REIT) and Langham Hotel REIT. The company is led by Dr. Lo Ka Shui who owns 59% of Great Eagle and has an exceptional record of savvy acquisitions and divestitures, as well as value growth.
CEMEX (+41%, +1.94%), the global cement, ready-mix concrete, and aggregates company, performed well, reflecting improved fundamentals. The convertible bonds that we own have an attractive risk/reward profile, with asset coverage over twice the debt. Our long-term upside beyond par value, plus the 3.75% annual coupon, will depend on where the equity price trades relative to the conversion price. Our appraisal of CEMEX grew during the year, and we expect further appreciation since its core markets of Mexico and the U.S. are improving. Tonnage prices are rising, with cement plant capacity utilization in the U.S. at approximately 95% in the fourth quarter. On the capital allocation front, the company divested non-core assets. Proceeds from asset sales, as well as free cash flow, continue to reduce debt.
Sika (+35%, +1.77%), the Swiss provider of specialty materials and services for the construction industry was another major contributor in the Fund for the year. Since we initiated the position, the company has consistently reported strong quarterly results, with increased revenues and improved margins across all regions. Prior to our investment, the founding Burkard family made an agreement to sell its 16% stake to French company Saint- Gobain at an 80% premium without a concurrent offer to others shareholders. We have taken a public stand against the proposed deal, as we believe that all owners should be treated equitably. In late October, Sika’s share price rallied after an initial corporate governance win in the two year battle against the Saint-Gobain takeover. The Swiss court ruled that Sika could limit the voting rights of the Burkard family to 5%, essentially blocking the proposed deal. We trimmed the position after strong
| | | | | | |
| International Fund | | Longleaf Partners Funds | | ◾ | | 20 |
| | |
International Fund Management Discussion | | |
performance, and we remain optimistic about value growth and the outlook from today.
BR Properties (+25%, +1.55%), one of the main commercial real estate investment companies in Brazil, also stood out as a strong performer in 2016. We sold the holding in the second quarter on the strength of a recovery in the company’s earnings, in addition to an offer by GP Investments, a Bermuda-based investment company, to acquire 70% of BR Properties’ outstanding shares.
OCI (-29%, -1.52%), a global fertilizer and chemical producer, was the largest detractor in the Fund for the year, even after a rebound of 18% in the fourth quarter. The two main pressures on the share price were weakness in nitrogen fertilizer prices and the cancellation of the CF Industries merger as a result of the U.S. government crackdown on tax inversions. Despite depressed fertilizer prices, nitrogen remains an essential part of global food production, and global demand is growing by around 2%, which will help deplete the current excess supply by 2018. Given the high cost and long lead time of building a new plant, it is unlikely that new capacity will be built in the medium term. OCI owns the newest and most efficient nitrogen fertilizer plants in the industry, with its large, new Iowa plant now producing. Its Texas Greenfield methanol plant comes online in late 2017. OCI recently initiated a cost savings plan over $100 million, $65 million of which is executed, and the company has completed the majority of its large capital expenditures. We expect significant earnings production in the coming two years, and CEO Nassef Sawiris and his team are working diligently to grow value per share. In early December, the company announced a 25% premium offer to acquire all publicly held shares of OCI Partners in exchange for OCI shares. The acquisition should allow for operating synergies between methanol assets and incremental free cash flow with a positive impact on the combined balance sheet in 2017.
CK Hutchison (-14%, -1.24%), a global conglomerate comprised of five core businesses (retail, telecommunications, infrastructure, ports, and energy) was the only other noteworthy detractor in the Fund for 2016. The stock declined in the first half of 2016 in the wake of the rejection by European regulators of its acquisition of U.K. telecom company O2, in addition to Brexit which created concerns about the impact on the company’s sizable operations in Europe and the U.K. Following a strong third quarter where the company announced a merger creating the largest Italian mobile operator, the stock lost ground in the fourth quarter after the U.S. election. A stronger U.S. dollar and expectations of tougher trade weighed on Hong Kong stocks in general and on the Hong Kong dollar’s relationship to the British pound and euro, where over half of the company’s earnings before interest and taxes (EBIT) originate. Our owner-operator
partners, Victor Li and his father Li Ka-shing, continued to focus the company on its core competencies by selling its aircraft leasing business during the quarter. In recognition of the steep discount at which CK Hutchison trades to value, the company initiated its first share repurchase in the fourth quarter.
Annual Portfolio Changes
We took advantage of the market volatility and individual company performance throughout the year. We exited several core holdings in the first half, including ALS, Mineral Resources, and BR Properties, as well as Philips, SoftBank, and adidas in the third quarter on the back of share price strength. We exited our small position in Vivendi in the fourth quarter. Currency translation to U.S. dollars dampened the return on our investment in this euro-denominated business. In the Fund’s two year holding period, Vivendi returned -5% in USD but added 21% in local currency.
We bought a small position in Applus in the second quarter, and we added three new purchases in the fourth quarter. We bought two European-based businesses. One of these we owned during the Eurozone crisis in 2011, and it remains undisclosed while we build the position. The other is STADA Arzneimittel, a leading European pharmaceutical company based in Germany. Approximately 60% of this business is generic drugs, and 40% is the over-the-counter branded drugs business that is high margin and better growing. STADA historically traded at a depressed value due to questionable governance and management under its prior executive team. The former CEO used a German “restricted transferability of shares” rule that acted as a poison pill, allowing management to block daily trading of public shares. A local German activist investor, Active Ownership Capital (AOC), took a large stake in the company early in 2016 and made substantial governance improvements, including replacing the CEO with an interim executive, replacing the Chairman, replacing five of six supervisory board members, and abolishing the restricted transferability of shares. New Chairman Ferdinand Oetker is focused on hiring the executive committee and ensuring alignment through ownership incentives at the executive and board level. There is significant room for operational improvement at the business. We also added Yum China, which recently spun out of Yum! Brands, a company our team knows well from the Fund’s successful multi-year prior investment. Yum China has exclusive rights to KFC, China’s leading quick-service restaurant concept, Pizza Hut, a leading casual dining brand, and Taco Bell, with expansion plans in China. Yum China has over 7,300 restaurants and more than 400,000 employees in 1,100+ cities in China with additional expansion opportunity in urban centers. Yum China’s brand and scale are unique advantages and
| | | | | | |
| International Fund | | Longleaf Partners Funds | | ◾ | | 21 |
| | |
International Fund Management Discussion | | |
fit the desires of a rapidly growing middle class, where eating outside the home is becoming more commonplace.
Outlook
In 2016 we delivered substantial absolute performance, and the Fund far outpaced the index, even with a larger-than-average cash balance. The International Fund’s price-to-value remains attractive in the high-60s%. We believe that uncertainty over the future of the Eurozone in the wake of Brexit and pending elections in France and Germany, as well as world trade under a Trump administration, is likely to lead to further volatility and opportunity. Weakness in emerging markets and China macro fears are creating further opportunity in Asia to buy world class businesses like Yum China that are trading at meaningful discounts to our appraisal of intrinsic value. The Americas have several near-qualifying opportunities on deck. We believe we have a portfolio of competitively advantaged businesses that are financially strong with management partners who can go on offense in times of uncertainty. Our on-deck list has expanded in the last few months with new prospective investments around the world. Our 18% cash will allow us to invest in high quality businesses with strong management partners. We believe our existing companies and management teams will continue to deliver both organic and transaction-driven value growth that should benefit our future results, as they did in 2016.
| | | | | | |
| International Fund | | Longleaf Partners Funds | | ◾ | | 22 |
| | |
Performance History | | (Unaudited) |
Comparison of Change in Value of $10,000 Investment
Since Inception October 26, 1998
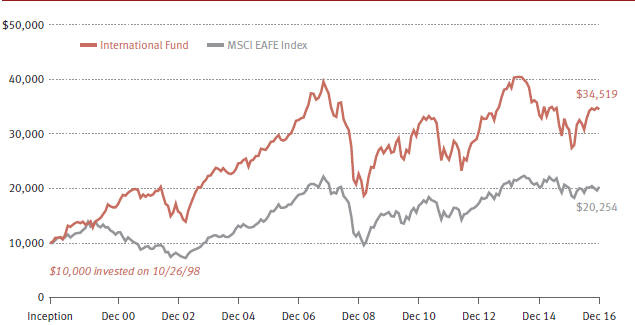
| | | | | | | | | | |
| Average Annual Returns for the Periods Ended December 31, 2016 |
| | | Since Inception
10/26/98 | | 15 Year | | Ten Year | | Five Year | | One Year |
International Fund | | 7.05% | | 4.11% | | 0.62% | | 6.47% | | 12.20% |
MSCI EAFE Index | | 3.96 | | 5.28 | | 0.75 | | 6.53 | | 1.00 |
The index is unmanaged. Because the MSCI EAFE Index was available only at month-end in 1998, we used the 10/31/98 value for performance since inception. Returns reflect reinvested capital gains and dividends but not the deduction of taxes an investor would pay on distributions or share redemptions. Performance data quoted represents past performance; past performance does not guarantee future results. The investment return and principal value of an investment will fluctuate so that an investor’s shares, when redeemed, may be worth more or less than their original cost. Current performance of the Fund may be lower or higher than the performance quoted. Performance data current to the most recent month end may be obtained by visiting longleafpartners.com. The International Fund is subject to stock market risk, meaning stocks in the Fund may fluctuate in response to developments at individual companies or due to general market and economic conditions. Also, because the Fund generally invests in 15 to 25 companies, share value could fluctuate more than if a greater number of securities were held. Investing in non-U.S. securities may entail risk due to non-U.S. economic and political developments, exposure to non-U.S. currencies, and different accounting and financial standards. These risks may be higher when investing in emerging markets.
As reported in the Prospectus dated May 1, 2016, the total expense ratio for the International Fund is 1.28%. The expense ratio is subject to fee waiver to the extent normal annual operating expenses exceed 1.75% of average annual net assets.
| | | | | | |
| International Fund | | Longleaf Partners Funds | | ◾ | | 23 |
| | | | | | | | |
Portfolio Holdings at December 31, 2016 | |
| | | |
| | | | | | Net Assets | |
Investments | | | | | | | 82.2% | |
EXOR N.V. | | | 8.9 | | | | | |
LafargeHolcim Ltd | | | 8.2 | | | | | |
CK Hutchison Holdings Limited | | | 7.0 | | | | | |
Melco International Development Limited | | | 6.7 | | | | | |
Great Eagle Holdings Limited | | | 6.0 | | | | | |
OCI N.V. | | | 5.7 | | | | | |
Cemex S.A.B. de C.V. (Bond) | | | 5.1 | | | | | |
C&C Group plc | | | 4.8 | | | | | |
Cheung Kong Property Holdings Limited | | | 4.7 | | | | | |
Yum China Holdings, Inc. | | | 4.5 | | | | | |
Baidu, Inc. ADR | | | 4.3 | | | | | |
Ferrovial S.A. | | | 3.1 | | | | | |
K. Wah International Holdings Limited | | | 2.8 | | | | | |
Sika AG | | | 2.6 | | | | | |
Genting Singapore PLC | | | 2.6 | | | | | |
STADA Arzneimittel AG | | | 2.5 | | | | | |
Applus Services, S.A. | | | 1.1 | | | | | |
Genting Berhad (Warrants) | | | 1.0 | * | | | | |
MLog S.A. | | | 0.6 | | | | | |
Cash Reserves Net of Other Assets and Liabilities | | | | | | | 17.8* | |
| | | | | | | 100.0% | |
| | | | |
* Weightings adjusted for sale of warrants and purchase of underlying stock: | |
Genting Berhad | | | 5.8 | % |
Cash Reserves Net of Other Assets and Liabilities | | | 12.9 | |
Fund holdings are subject to change and holding discussions are not recommendations to buy or sell any security.
| | |
Portfolio Changes
January 1, 2016 through
December 31, 2016 |
| | |
| New Holdings | | Quarter |
Applus Services, S.A. | | 2Q |
CF Industries Holdings, Inc. | | 1Q |
Ferrovial S.A. | | 4Q |
STADA Arzneimittel AG | | 4Q |
Yum China Holdings, Inc. | | 4Q |
Eliminations | | |
adidas AG | | 3Q |
ALS Limited | | 1Q |
BR Properties S.A. | | 2Q |
CF Industries Holdings, Inc. | | 2Q |
Koninklijke Philips N.V. | | 3Q |
Mineral Resources Limited | | 2Q |
Orascom Construction Limited | | 1Q |
Rolls-Royce Holdings plc | | 1Q |
SoftBank Group Corp. | | 3Q |
Vivendi S.A. (Swap) | | 4Q |
| | | | | | |
| International Fund | | Longleaf Partners Funds | | ◾ | | 24 |
| | | | | | | | | | | | |
| Common Stocks | |
| | | | |
| | | Shares | | | Market Value | | | % of Net Assets | |
Beverages | | | | | | | | | | | | |
C&C Group plc (Ireland) | | | 11,656,876 | | | $ | 47,242,018 | | | | 4.8 | % |
Chemicals | | | | | | | | | | | | |
OCI N.V.*(b) (Netherlands) | | | 3,225,110 | | | | 56,287,842 | | | | 5.7 | |
Sika AG (Switzerland) | | | 5,472 | | | | 26,287,954 | | | | 2.6 | |
| | | | | | | 82,575,796 | | | | 8.3 | |
Construction & Engineering | | | | | | | | | | | | |
Ferrovial S.A. (Spain) | | | 1,708,405 | | | | 30,563,110 | | | | 3.1 | |
Construction Materials | | | | | | | | | | | | |
LafargeHolcim Ltd(b) (Switzerland) | | | 1,535,332 | | | | 80,671,274 | | | | 8.2 | |
Diversified Financial Services | | | | | | | | | | | | |
EXOR N.V. (Netherlands) | | | 2,038,241 | | | | 87,925,131 | | | | 8.9 | |
Hotels, Restaurants & Leisure | | | | | | | | | | | | |
Genting Singapore PLC (Singapore) | | | 41,464,100 | | | | 25,912,378 | | | | 2.6 | |
Melco International Development Limited (Hong Kong) | | | 48,411,700 | | | | 65,801,705 | | | | 6.7 | |
Yum China Holdings, Inc.* (China) | | | 1,713,427 | | | | 44,754,713 | | | | 4.5 | |
| | | | | | | 136,468,796 | | | | 13.8 | |
Industrial Conglomerates | | | | | | | | | | | | |
CK Hutchison Holdings Limited (Hong Kong) | | | 6,122,000 | | | | 69,395,035 | | | | 7.0 | |
Internet Software & Services | | | | | | | | | | | | |
Baidu, Inc. ADR* (China) | | | 260,015 | | | | 42,749,066 | | | | 4.3 | |
Metals & Mining | | | | | | | | | | | | |
MLog S.A.*(c) (Brazil) | | | 108,226 | | | | 5,472,318 | | | | 0.6 | |
Pharmaceuticals | | | | | | | | | | | | |
STADA Arzneimittel AG (Germany) | | | 481,084 | | | | 24,908,016 | | | | 2.5 | |
Professional Services | | | | | | | | | | | | |
Applus Services, S.A.(d) (Spain) | | | 1,072,066 | | | | 10,890,163 | | | | 1.1 | |
Real Estate Management & Development | | | | | | | | | | | | |
Cheung Kong Property Holdings Limited (Hong Kong) | | | 7,560,000 | | | | 46,357,341 | | | | 4.7 | |
Great Eagle Holdings Limited (Hong Kong) | | | 12,537,904 | | | | 59,742,801 | | | | 6.0 | |
K. Wah International Holdings Limited(e) (Hong Kong) | | | 59,733,762 | | | | 27,731,194 | | | | 2.8 | |
| | | | | | | | 133,831,336 | | | | 13.5 | |
Total Common Stocks (Cost $730,881,903) | | | | | | | 752,692,059 | | | | 76.1 | |
| Warrants | |
Hotels, Restaurants & Leisure | | | | | | | | | | | | |
Genting Berhad Warrants 12/18/18* (Malaysia)
(Cost $26,851,683) | | | 32,370,750 | | | | 10,030,170 | | | | 1.0 | |
See Notes to Financial Statements.
| | | | | | |
| International Fund | | Longleaf Partners Funds | | ◾ | | 25 |
| | |
Portfolio of Investments | | continued |
| | | | | | | | | | | | |
| Corporate Bonds | |
| | | | |
| | | Principal Amount | | | Market Value | | | % of Net Assets | |
Construction Materials | | | | | | | | | | | | |
Cemex S.A.B. de C.V. Convertible Subordinated Notes 3.72% due 3/15/20 (Mexico) (Cost $46,836,150) | | | 47,253,000 | | | $ | 50,737,909 | | | | 5.1 | % |
| Options Purchased | |
| | | | |
| | | Currency Units | | | | | | | |
Currency | | | | | | | | | | | | |
Hong Kong Dollar Put, 4/20/17, with BNP Paribas,
Strike Price $7.77 (Hong Kong) (Cost $3,915,343) | | | 207,323,218 | | | | 601,237 | | | | 0.1 | |
| Short-Term Obligations | |
| | | | |
| | | Principal Amount | | | | | | | |
Repurchase Agreement with State Street Bank, 0.03%, dated 12/30/16, due 1/3/17, Repurchase price $49,897,166 (Collateral: $50,897,098 U.S. Treasury Bond, 3.75% due 11/15/43, Par $44,965,000)
U.S. Treasury Bill, 0.50% due 3/23/17 | |
| 49,897,000
110,000,000 |
| |
| 49,897,000
109,880,870 |
| |
| 5.1
11.1 |
|
Total Short-Term Obligations (Cost $159,773,745) | | | | | | | 159,777,870 | | | | 16.2 | |
Total Investments (Cost $968,258,824)(a) | | | | | | | 973,839,245 | | | | 98.5 | |
Forward Currency Contracts | | | | | | | 4,126,877 | | | | 0.4 | |
Other Assets (Liabilities), Net | | | | | | | 10,776,870 | | | | 1.1 | |
Net Assets | | | | | | $ | 988,742,992 | | | | 100.0 | % |
| * | Non-income producing security. |
| (a) | Aggregate cost for federal income tax purposes is $985,220,114. |
| (c) | These shares were acquired directly from the issuer in a private placement. They are considered restricted securities within the meaning of Rule 144 promulgated under the Securities Act of 1933. Due to the lack of an active trading market, all or a portion of this position may be illiquid. Judgment plays a greater role in valuing illiquid securities than those for which a more active market exists, and are valued using procedures adopted by the Board of Trustees (See Notes 2 and 7). |
| (d) | A Portfolio manager of the International Fund is a director of Applus. |
| (e) | Affiliated issuer during the period. See Note 5. |
Forward Currency Contracts
| | | | | | | | | | | | | | | | |
| | | | |
| Currency Purchased | | Currency Sold | | | Counterparty | | | Settlement Date | | | Unrealized Gain | |
USD 39,558,281 | | | RMB 262,845,000 | | | | State Street | | | | 3/24/17 | | | $ | 2,650,661 | |
USD 52,100,000 | | | RMB 367,887,350 | | | | State Street | | | | 9/21/17 | | | | 1,476,216 | |
| | | | | | | | | | | | | | $ | 4,126,877 | |
Currency Abbreviation:
RMB — Chinese Renminbi
USD — U.S. Dollar
See Notes to Financial Statements.
| | | | | | |
| International Fund | | Longleaf Partners Funds | | ◾ | | 26 |
| | |
Portfolio of Investments | | continued |
| | | | |
| Country Weightings | |
| | | Net Assets | |
Hong Kong | | | 27.2 | % |
Netherlands | | | 14.6 | |
Switzerland | | | 10.8 | |
China | | | 8.8 | |
Mexico | | | 5.1 | |
Ireland | | | 4.8 | |
Spain | | | 4.2 | |
Singapore | | | 2.6 | |
Germany | | | 2.5 | |
Malaysia | | | 1.0 | |
Brazil | | | 0.6 | |
| | | | 82.2 | |
All other, net | | | 17.8 | |
| | | 100.0 | % |
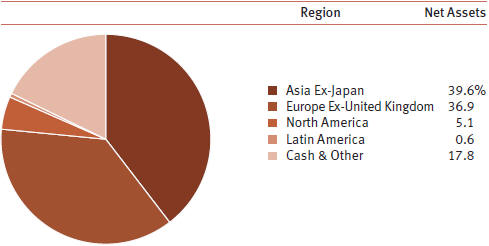
See Notes to Financial Statements.
| | | | | | |
| Global Fund | | Longleaf Partners Funds | | ◾ | | 27 |
| | |
Global Fund Management Discussion | | |
Longleaf Partners Global Fund returned 20.43% for the year, more than doubling the MSCI World Index’s 7.51% return and beating our absolute goal of inflation plus 10%. In the fourth quarter, the Fund posted a positive return of 1.60%, narrowly falling shy of the MSCI World’s 1.86% return in the period.
The Fund’s large return had little to do with the index, which experienced two distinct environments. In the first seven months, perceived “safe” stocks dominated. Beginning in August, cyclicals, gained meaningful ground, and defensive and minimum volatility stocks declined rapidly. Global markets had significant price volatility across geographies. For example, Hong Kong markets suffered declines in the first and fourth quarters amid China concerns, with the fourth quarter further complicated by fears of higher U.S. interest rates and impacts of a Trump presidency on global trade. In Europe, markets rebounded quickly in the third quarter after a negative first half overshadowed by Brexit and European terrorist attacks. Most of the U.S. market return came in the second half, including the post-election rally.
Solid operational performance and smart capital allocation by our management partners who pursued value accretive transactions drove the Fund’s substantial results. The company-specific nature of our 2016 return reinforced the importance of investing with a long time horizon and aligned, shareholder-oriented corporate leadership. While it is difficult to predict near term stock prices, if our businesses are selling at a meaningful discount to their intrinsic worth, are growing free cash flow over the long term, and are run by people who are motivated to build value per share, good returns can be expected. These same characteristics describe our current holdings, are the criteria required for new investments, and therefore form the basis for our confidence in our ability to continue to deliver solid results.
Annual Contributors/Detractors
(2016 investment return; 2016 Fund contribution)
Chesapeake Energy (+319%, +11.13%), one of the largest U.S. producers of natural gas, oil, and natural gas liquids, was the Fund’s top contributor to performance in 2016 and gained an additional 12% in the fourth quarter. Earlier in the year, we transitioned our equity position into heavily discounted bonds and convertible preferred stock, which offered equity-like returns higher in the capital structure and a potentially faster payback. As the bonds rose close to par, we exited them. At the end of the third quarter, we converted all of our appreciated preferred securities into common stock for an attractive premium. Over the course of the year, management executed beyond expectations, selling various assets, improving the balance sheet through
discounted debt repurchases, reducing operating and capital expenditures, and renegotiating midstream contracts. The most recent asset sales in the fourth quarter included a portion of the company’s properties in the Haynesville Shale in northern Louisiana for proceeds of approximately $915 million. Signed or closed asset sales reached $2.5 billion in 2016, exceeding management’s original target of $1 billion. To further strengthen its balance sheet, the company secured a term loan and convertible debt offering, which raised more capital at better terms than expected. Since the beginning of 2012, Chesapeake has reduced debt by 50%, and its remaining fixed liabilities should be well covered in the coming years. The company has targeted a two times net debt over earnings before interest, taxes, depreciation, and amortization (EBITDA) with cash flow neutrality by 2018 and 5 to 15% of annual production growth by 2020. We salute CEO Doug Lawler and Chesapeake’s board, with Brad Martin as Chairman, for their successful pursuit of shareholder value in the face of massive headwinds.
adidas (+60%, +2.60%), the German-based global sportswear and equipment brand, was another significant contributor for the year. We sold our stake in the third quarter as price approached our appraisal value. We engaged in a productive dialogue with the company when necessary since initiating the position in August 2014. Over that time, adidas re-focused on its core brand, grew revenues, sold or sought buyers for non-core segments including Rockport and golf, repurchased just over five percent of the company at substantially discounted prices, replaced the CEO, and added two highly qualified owners to the Supervisory Board, one of whom we proposed. In the Fund’s two year holding period, adidas returned 104% (in U.S. dollar) and 147% in local currency (euro).
Wynn Resorts (+28%, +1.76%), the luxury gaming and hotel operator with prime real estate in Las Vegas, Macau, and Boston, also helped drive 2016 returns, despite a slight retreat in the fourth quarter. The total Macau market reported higher gross gaming revenues year-over-year in most months of the second half, indicating stabilization and a return to growth. In August, the company opened the Wynn Palace in Cotai (Macau). The property has ramped up more slowly than some analysts had hoped, but Wynn has a history of careful openings and eventual success. During the fourth quarter, sentiment shifted up and down, as some positive industry level data points were offset by concerns over Chinese policy changes that could potentially impact Macau indirectly. In the U.S., Las Vegas had solid results, and the company received the final licenses necessary to begin construction of Wynn Boston Harbor, which is expected to open in 2019. Wynn also announced plans to develop part of its Las Vegas golf course property into a hotel, restaurants, and other
| | | | | | |
| Global Fund | | Longleaf Partners Funds | | ◾ | | 28 |
| | |
Global Fund Management Discussion | | |
attractions. In December, the company sold 49% of its retail assets in Las Vegas for over twenty times EBITDA, which was accretive to our value and well above where the stock trades. The sale was also further evidence of how our heavily-aligned partner, Steve Wynn, will continue to build value per share and pursue value recognition for shareholders.
FedEx (+26%, +1.45%), the global transportation and logistics company, was a leading contributor in the Fund for the year after gaining 7% in the fourth quarter. The company raised guidance for fiscal year 2017 and continued to buy back its discounted shares. Our appraisal increased as expense reductions in Express over the last several years helped raise margins. Investing in growth at Ground depressed margins in that division but should have meaningful payoff longer term. The TNT acquisition, finalized in May, should materially benefit profitability by increasing the final mile density of FedEx’s business across Europe. Management indicated that the integration of TNT should generate at least $750 million of annual synergies across its network over the next few years. We believe that CEO Fred Smith and his capable leadership team will continue to drive value growth for shareholders.
CONSOL Energy (+131%, +1.45%), the natural gas and Appalachian coal company also contributed large gains over the year. CEO Nick Deluliis, management and the board, led by Chairman Will Thorndike, monetized assets and continued to cut costs in the pursuit of separating the coal and gas businesses, which is expected to happen in 2017. Following the disposition of its metallurgical coal assets in the first half of the year, CONSOL sold its high cost Miller Creek and Fola thermal coal mines to a private buyer at a price above our appraisal. The company also delivered positive free cash flow (FCF) for the year, which many thought very unlikely at the start of 2016. In the fourth quarter, CONSOL announced the unwinding of a joint venture with Noble Energy in which the company received $205 million in cash from Noble while maintaining ownership of valuable EBITDA-producing properties. Recent transactions involving other companies’ gas assets in Appalachia, as well as CONSOL’s own midstream master limited partnerships’ (MLP) prices, support our appraisal of CONSOL, which is much higher than the stock price.
OCI (-30%, -1.44%), a global fertilizer and chemical producer, was the largest detractor in the Fund for the year, even after a rebound of 18% in the fourth quarter. The two main pressures on the share price were weakness in nitrogen fertilizer prices and the cancellation of the CF Industries merger as a result of the U.S. government crackdown on tax inversions. Despite depressed fertilizer prices, nitrogen remains an essential part of global food production, and global demand is growing by around 2%, which
will help deplete the current excess supply by 2018. Given the high cost and long lead time of building a new plant, it is unlikely that new capacity will be built in the medium term. OCI owns the newest and most efficient nitrogen fertilizer plants in the industry, with its large, new Iowa plant now producing. Its Texas Greenfield methanol plant comes online in late 2017. OCI recently initiated a cost savings plan over $100 million, $65 million of which is executed, and the company has completed the majority of its large capital expenditures. We expect significant earnings production in the coming two years, and CEO Nassef Sawiris and his team are working diligently to grow value per share. In early December, the company announced a 25% premium offer to acquire all publicly held shares of OCI Partners in exchange for OCI shares. The acquisition should allow for operating synergies between methanol assets and incremental free cash flow with a positive impact on the combined balance sheet in 2017.
CK Hutchison (-14%, -0.77%), a global conglomerate comprised of five core businesses (retail, telecommunications, infrastructure, ports, and energy), was the other primary detractor for the year and fell by -11% in the final quarter. The stock declined in the first half of 2016 in the wake of the rejection by European regulators of its acquisition of U.K. telecom company O2, in addition to Brexit which created concerns about the impact on the company’s sizable operations in Europe and the U.K. Following a strong third quarter where the company announced a merger creating the largest Italian mobile operator, the stock lost ground in the fourth quarter after the U.S. election. A stronger U.S. dollar and expectations of tougher trade weighed on Hong Kong stocks in general and on the Hong Kong dollar’s relationship to the British pound and euro, where over half of the company’s earnings before interest and taxes (EBIT) originate. Our owner-operator partners, Victor Li and his father Li Ka-shing, continued to focus the company on its core competencies by selling its aircraft leasing business during the quarter. In recognition of the steep discount at which CK Hutchison trades to value, the company initiated its first share repurchase in the fourth quarter.
Annual Portfolio Activity
We took advantage of the market volatility and individual company performance throughout the year. We exited National Oilwell Varco in the first quarter and Philips, SoftBank, and adidas in the third quarter on the back of share price strength. We added three new positions from around the globe, all in the fourth quarter. One of these is a European-based business that remains undisclosed while we build the position. We also added Asian company Yum China, which recently spun out of Yum! Brands, a company we have known well for many years. Yum China has exclusive rights to KFC, China’s leading quick-service
| | | | | | |
| Global Fund | | Longleaf Partners Funds | | ◾ | | 29 |
| | |
Global Fund Management Discussion | | |
restaurant concept, Pizza Hut, a leading casual dining brand, and Taco Bell, with expansion plans in China. Yum China has over 7,300 restaurants and more than 400,000 employees in 1,100+ cities in China with additional expansion opportunity in urban centers. Yum China’s brand and scale are unique advantages and fit the desires of a rapidly growing middle class, where eating outside the home is becoming more commonplace. Our third addition was U.S. based T. Rowe Price (TROW), a diversified investment advisory firm with a dominant position in U.S. target date fund retirement assets which account for about twenty percent of assets under management (AUM). TROW’s funds have performed well and had net inflows, even with the active management headwinds the industry has faced. Over the last ten years, the company has put capital into building its international investments and distribution. The company currently has just below twenty percent of AUM in international funds and a mid-single digit percent of total AUM coming from offshore investors. As this business grows, margins should rise accordingly. The company’s balance sheet has net cash, and we are confident in the aligned management team who has a record of prudent capital allocation.
Outlook
In 2016 we delivered substantial absolute performance, and the Fund far outpaced the index. Much uncertainty remains as to the impact of U.S. tax, trade, and regulatory policies in the new administration. The future of the Eurozone is also unclear in the wake of Brexit and pending elections in France and Germany. Weakness in emerging markets and China macro fears are creating further opportunity in Asia, and the Americas have several on deck investment prospects. More global volatility, lower market correlations, and higher interest rates would likely unearth new opportunities for the Fund’s 11% cash.
The Fund’s price-to-value (P/V) in the high-60s% offers attractive upside. We believe our companies can grow their values substantially and have the ability to deliver good returns in a variety of scenarios. For example, the Fund’s three largest holdings - Level 3, FedEx, and LafargeHolcim - benefitted from merger activity in 2016 and have significant revenue prospects from their combinations that are not included in projected synergies, and they have skilled leadership with experience at successful company integrations. We hold numerous other businesses that have had meaningful capital investment programs over the last few years that should begin to generate returns in 2017 and beyond. These include Wynn’s newly opened Palace and Melco’s Studio City in Macau, United Technologies’ Pratt jet engines, OCI’s new fertilizer and methanol plants, Hopewell’s Centre II project, and varied projects at Alphabet.
As 2016 showed, CEOs and boards who are competent and shareholder-oriented create value. Our corporate partners, as well as the quality of our businesses, give us confidence in our future prospects.
| | | | | | |
| Global Fund | | Longleaf Partners Funds | | ◾ | | 30 |
| | |
Performance History | | (Unaudited) |
Comparison of Change in Value of $10,000 Investment
Since Inception December 27, 2012
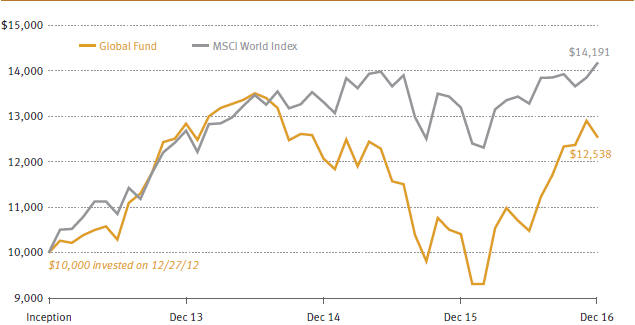
| | | | |
| Average Annual Returns for the Periods Ended December 31, 2016 |
| | | Since Inception
12/27/12 | | One Year |
Global Fund | | 5.80% | | 20.43% |
MSCI World Index | | 9.13 | | 7.51 |
The index is unmanaged. Returns reflect reinvested capital gains and dividends but not the deduction of taxes an investor would pay on distributions or share redemptions. Performance data quoted represents past performance; past performance does not guarantee future results. The investment return and principal value of an investment will fluctuate so that an investor’s shares, when redeemed, may be worth more or less than their original cost. Current performance of the Fund may be lower or higher than the performance quoted. Performance data current to the most recent month end may be obtained by visiting longleafpartners.com. The Global Fund is subject to stock market risk, meaning stocks in the Fund may fluctuate in response to developments at individual companies or due to general market and economic conditions. Also, because the Fund generally invests in 15 to 25 companies, share value could fluctuate more than if a greater number of securities were held. Investing in non-U.S. securities may entail risk due to non-U.S. economic and political developments, exposure to non-U.S. currencies, and different accounting and financial standards. These risks may be higher when investing in emerging markets.
As reported in the Prospectus dated May 1, 2016, the total expense ratio for the Global Fund is 1.54%. The expense ratio is subject to fee waiver to the extent normal annual operating expenses exceed 1.65% of average annual net assets. Effective May 1, 2016, Southeastern agreed to voluntarily reduce the expense limit to 1.20%. This voluntary fee waiver for the Global Fund may be discontinued at any time.
| | | | | | |
| Global Fund | | Longleaf Partners Funds | | ◾ | | 31 |
| | | | | | | | |
Portfolio Holdings at December 31, 2016 | |
| | | |
| | | | | | Net Assets |
Investments | | | | | | | 89.2 | % |
Level 3 Communications, Inc. | | | 9.3 | | | | | |
FedEx Corporation | | | 6.6 | | | | | |
LafargeHolcim Ltd | | | 6.3 | | | | | |
Melco International Development Limited | | | 6.0 | | | | | |
Wynn Resorts, Limited | | | 5.8 | | | | | |
CK Hutchison Holdings Limited | | | 5.5 | | | | | |
EXOR N.V. | | | 4.9 | | | | | |
Yum China Holdings, Inc. | | | 4.8 | | | | | |
United Technologies Corporation | | | 4.5 | | | | | |
OCI N.V. | | | 4.3 | | | | | |
Chesapeake Energy Corporation | | | 4.1 | | | | | |
Alphabet Inc. | | | 4.0 | | | | | |
Cheung Kong Property Holdings Limited | | | 3.8 | | | | | |
CNH Industrial N.V. | | | 3.1 | | | | | |
Ferrovial S.A. | | | 3.1 | | | | | |
K. Wah International Holdings Limited | | | 2.6 | | | | | |
Hopewell Holdings Limited | | | 2.6 | | | | | |
T. Rowe Price Group, Inc. | | | 2.4 | | | | | |
CONSOL Energy Inc. | | | 2.4 | | | | | |
Genting Berhad (Common & Warrants) | | | 1.7 | * | | | | |
Genting Singapore PLC | | | 1.4 | | | | | |
Cash Reserves Net of Other Assets and Liabilities | | | | | | | 10.8 | * |
| | | | | | | 100.0 | % |
| | | | | | | | |
*Weightings adjusted for sale of warrants and purchase of underlying stock: | |
Genting Berhad | | | | | | | 5.3 | % |
Cash Reserves Net of Other Assets and Liabilities | | | | | | | 7.2 | |
Fund holdings are subject to change and holding discussions are not recommendations to buy or sell any security.
| | | | |
Portfolio Changes
January 1, 2016 through
December 31, 2016 | |
| | |
| New Holdings | | Quarter | |
Ferrovial S.A. | | | 4Q | |
T. Rowe Price Group, Inc. | | | 4Q | |
Yum China Holdings, Inc. | | | 4Q | |
Eliminations | | | | |
adidas AG | | | 3Q | |
Koninklijke Philips N.V. | | | 3Q | |
National Oilwell Varco, Inc. | | | 1Q | |
SoftBank Group Corp. | | | 3Q | |
| | | | | | |
| Global Fund | | Longleaf Partners Funds | | ◾ | | 32 |
| | | | | | | | | | | | |
| Common Stocks | |
| | | | |
| | | Shares | | | Market Value | | | % of Net Assets | |
Aerospace & Defense | | | | | | | | | | | | |
United Technologies Corporation (United States) | | | 76,724 | | | $ | 8,410,485 | | | | 4.5 | % |
Air Freight & Logistics | | | | | | | | | | | | |
FedEx Corporation (United States) | | | 66,061 | | | | 12,300,558 | | | | 6.6 | |
Capital Markets | | | | | | | | | | | | |
T. Rowe Price Group, Inc. (United States) | | | 59,700 | | | | 4,493,022 | | | | 2.4 | |
Chemicals | | | | | | | | | | | | |
OCI N.V.*(b) (Netherlands) | | | 465,968 | | | | 8,132,539 | | | | 4.3 | |
Construction & Engineering | | | | | | | | | | | | |
Ferrovial S.A. (Spain) | | | 327,327 | | | | 5,855,831 | | | | 3.1 | |
Construction Materials | | | | | | | | | | | | |
LafargeHolcim Ltd (French Exchange)(b) (Switzerland) | | | 205,845 | | | | 10,815,757 | | | | 5.8 | |
LafargeHolcim Ltd (Swiss Exchange)(b) (Switzerland) | | | 19,600 | | | | 1,032,643 | | | | 0.5 | |
| | | | | | | 11,848,400 | | | | 6.3 | |
Diversified Financial Services | | | | | | | | | | | | |
EXOR N.V. (Netherlands) | | | 214,151 | | | | 9,237,992 | | | | 4.9 | |
Diversified Telecommunication Services | | | | | | | | | | | | |
Level 3 Communications, Inc.* (United States) | | | 308,764 | | | | 17,401,939 | | | | 9.3 | |
Hotels, Restaurants & Leisure | | | | | | | | | | | | |
Genting Berhad (Malaysia) | | | 993,349 | | | | 1,771,465 | | | | 0.9 | |
Genting Singapore PLC (Singapore) | | | 4,070,300 | | | | 2,543,674 | | | | 1.4 | |
Melco International Development Limited (Hong Kong) | | | 8,266,388 | | | | 11,235,764 | | | | 6.0 | |
Wynn Resorts, Limited (United States) | | | 124,859 | | | | 10,801,552 | | | | 5.8 | |
Yum China Holdings, Inc.* (China) | | | 348,387 | | | | 9,099,868 | | | | 4.8 | |
| | | | | | | 35,452,323 | | | | 18.9 | |
Industrial Conglomerates | | | | | | | | | | | | |
CK Hutchison Holdings Limited (Hong Kong) | | | 901,029 | | | | 10,213,482 | | | | 5.5 | |
Internet Software & Services | | | | | | | | | | | | |
Alphabet Inc. — Class C* (United States) | | | 9,735 | | | | 7,513,668 | | | | 4.0 | |
Machinery | | | | | | | | | | | | |
CNH Industrial N.V. (Netherlands) | | | 676,037 | | | | 5,881,646 | | | | 3.1 | |
Oil, Gas & Consumable Fuels | | | | | | | | | | | | |
Chesapeake Energy Corporation* (United States) | | | 1,106,711 | | | | 7,769,111 | | | | 4.1 | |
CONSOL Energy Inc. (United States) | | | 246,324 | | | | 4,490,487 | | | | 2.4 | |
| | | | | | | 12,259,598 | | | | 6.5 | |
Real Estate Management & Development | | | | | | | | | | | | |
Cheung Kong Property Holdings Limited (Hong Kong) | | | 1,166,529 | | | | 7,153,066 | | | | 3.8 | |
Hopewell Holdings Limited (Hong Kong) | | | 1,391,500 | | | | 4,809,104 | | | | 2.6 | |
See Notes to Financial Statements.
| | | | | | |
| Global Fund | | Longleaf Partners Funds | | ◾ | | 33 |
| | | | | | | | | | | | |
| Common Stocks | |
| | | | |
| | | Shares | | | Market Value | | | % of Net Assets | |
K. Wah International Holdings Limited (Hong Kong) | | | 10,381,506 | | | $ | 4,819,579 | | | | 2.6 | % |
| | | | | | | | 16,781,749 | | | | 9.0 | |
Total Common Stocks (Cost $158,837,193) | | | | | | | 165,783,232 | | | | 88.4 | |
|
| Warrants | |
Hotels, Restaurants & Leisure | | | | | | | | | | | | |
Genting Berhad Warrants 12/18/18* (Malaysia)
(Cost $4,008,255) | | | 4,626,762 | | | | 1,433,616 | | | | 0.8 | |
|
| Options Purchased | |
| | | | |
| | | Currency Units | | | | | | | |
Currency | | | | | | | | | | | | |
Hong Kong Dollar Put, 4/20/17, with BNP Paribas,
Strike Price $7.77 (Hong Kong) (Cost $257,895) | | | 13,422,290 | | | | 38,925 | | | | — | |
|
| Short-Term Obligations | |
| | | | |
| | | Principal Amount | | | | | | | |
Repurchase Agreement with State Street Bank, 0.03%, dated 12/30/16, due 1/3/17, Repurchase price $20,168,067 (Collateral: $20,572,773 U.S. Treasury Bond, 3.75% due 11/15/43, Par $18,175,000)
(Cost $20,168,000) | | | 20,168,000 | | | | 20,168,000 | | | | 10.7 | |
| | | |
| Total Investments (Cost $183,271,343)(a) | | | | | | | 187,423,773 | | | | 99.9 | |
| Forward Currency Contracts | | | | | | | 215,528 | | | | 0.1 | |
| Other Assets (Liabilities), Net | | | | | | | (55,693 | ) | | | — | |
Net Assets | | | | | | $ | 187,583,608 | | | | 100.0 | % |
| * | Non-income producing security. |
| (a) | Aggregate cost for federal income tax purposes is $184,548,550. |
Forward Currency Contracts
| | | | | | | | | | | | | | |
| Currency Purchased | | Currency Sold | | | Counterparty | | | Settlement Date | | | Unrealized Gain |
USD 9,500,000 | | | RMB 67,471,050 | | | | State Street | | | | 9/21/17 | | | $215,528 |
| | | | | | | | | | | | | | $215,528 |
Currency Abbreviation:
RMB — Chinese Renminbi
USD — U.S. Dollar
See Notes to Financial Statements.
| | | | | | |
| Global Fund | | Longleaf Partners Funds | | ◾ | | 34 |
| | | | |
| Country Weightings | |
| | | Net Assets | |
United States | | | 39.1% | |
Hong Kong | | | 20.5 | |
Netherlands | | | 12.3 | |
Switzerland | | | 6.3 | |
China | | | 4.8 | |
Spain | | | 3.1 | |
Malaysia | | | 1.7 | |
Singapore | | | 1.4 | |
| | | | 89.2 | |
All other, net | | | 10.8 | |
| | | 100.0% | |
Regional Weightings
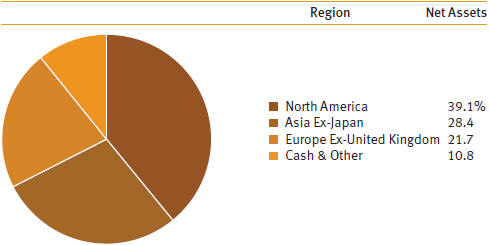
See Notes to Financial Statements.
| | | | | | |
| | Longleaf Partners Funds | | ◾ | | 35 |
| | |
Statements of Assets and Liabilities | | at December 31, 2016 |
| | | | | | | | | | | | | | | | |
| | | Partners Fund | | | Small-Cap Fund | | | International Fund | | | Global Fund | |
Assets | | | | | | | | | | | | | | | | |
Investments: | | | | | | | | | | | | | | | | |
Affiliated securities, at market value (Cost $365,057,109, $1,927,959,396, $38,126,422, $0, respectively) (Note 2 and 5) | | $ | 210,314,807 | | | $ | 1,905,863,472 | | | $ | 27,731,194 | | | $ | — | |
Non-affiliated securities, at market value (Cost $2,477,615,081, $1,619,796,342, $930,132,402, $183,271,343, respectively) (Note 2) | | | 3,244,681,527 | | | | 2,081,736,312 | | | | 946,108,051 | | | | 187,423,773 | |
Total Investments | | | 3,454,996,334 | | | | 3,987,599,784 | | | | 973,839,245 | | | | 187,423,773 | |
Cash | | | 135 | | | | 573 | | | | 12 | | | | 784 | |
Receivable for: | | | | | | | | | | | | | | | | |
Fund shares sold | | | 1,204,523 | | | | 3,149,633 | | | | 267,985 | | | | 180,000 | |
Dividends and interest | | | 1,315,118 | | | | 1,791,945 | | | | 524,065 | | | | 26,458 | |
Securities sold | | | 7,378,368 | | | | 10,787,892 | | | | 11,815,844 | | | | — | |
Foreign tax reclaims | | | — | | | | — | | | | 284,956 | | | | 45,524 | |
Unrealized gain on forward currency contracts (Note 8) | | | — | | | | — | | | | 4,126,877 | | | | 215,528 | |
Other assets | | | 100,899 | | | | 109,881 | | | | 31,169 | | | | 8,332 | |
Total Assets | | | 3,464,995,377 | | | | 4,003,439,708 | | | | 990,890,153 | | | | 187,900,399 | |
Liabilities | | | | | | | | | | | | | | | | |
Payable for: | | | | | | | | | | | | | | | | |
Fund shares redeemed | | | 2,771,536 | | | | 4,556,238 | | | | 865,752 | | | | 102,617 | |
Securities purchased | | | 10,903,382 | | | | — | | | | — | | | | — | |
Investment counsel fee (Note 3) | | | 2,363,090 | | | | 2,688,085 | | | | 931,761 | | | | 134,028 | |
Administration fee (Note 3) | | | 303,785 | | | | 347,118 | | | | 84,706 | | | | 16,191 | |
Other accrued expenses | | | 365,424 | | | | 186,961 | | | | 264,942 | | | | 63,955 | |
Total Liabilities | | | 16,707,217 | | | | 7,778,402 | | | | 2,147,161 | | | | 316,791 | |
Net Assets | | $ | 3,448,288,160 | | | $ | 3,995,661,306 | | | $ | 988,742,992 | | | $ | 187,583,608 | |
| | | | |
Net assets consist of: | | | | | | | | | | | | | | | | |
Paid-in capital | | $ | 2,956,574,207 | | | $ | 3,587,601,845 | | | $ | 1,084,064,289 | | | $ | 184,817,730 | |
Undistributed net investment income (loss) | | | 27,781,980 | | | | — | | | | (12,241,301 | ) | | | — | |
Accumulated net realized loss on investments and foreign currency | | | (148,392,171 | ) | | | (31,784,585 | ) | | | (92,769,239 | ) | | | (1,597,570 | ) |
Net unrealized appreciation on investments and foreign currency | | | 612,324,144 | | | | 439,844,046 | | | | 9,689,243 | | | | 4,363,448 | |
Net Assets | | $ | 3,448,288,160 | | | $ | 3,995,661,306 | | | $ | 988,742,992 | | | $ | 187,583,608 | |
Net asset value per share | | $ | 25.36 | | | $ | 27.49 | | | $ | 13.53 | | | $ | 11.96 | |
Fund shares issued and outstanding (unlimited number of shares authorized, no par value) | | | 135,984,532 | | | | 145,347,171 | | | | 73,068,733 | | | | 15,689,467 | |
| | | | | | |
| | Longleaf Partners Funds | | ◾ | | 36 |
| | |
Statements of Operations | | For the Year Ended December 31, 2016 |
| | | | | | | | | | | | | | | | |
| | | Partners Fund | | | Small-Cap Fund | | | International Fund | | | Global Fund | |
Investment Income: | | | | | | | | | | | | | | | | |
Dividends from non-affiliates (net of foreign tax withheld of $0, $0, $463,008, $43,502, respectively) | | $ | 48,935,290 | | | $ | 15,054,768 | | | $ | 17,740,031 | | | $ | 2,700,828 | |
Dividends from affiliates (no foreign tax withheld) (Note 5) | | | 122,635 | | | | 12,773,769 | | | | 2,239,160 | | | | — | |
Interest from non-affiliates | | | 13,456,520 | | | | 17,661,819 | | | | 2,321,416 | | | | 624,819 | |
Total Investment Income | | | 62,514,445 | | | | 45,490,356 | | | | 22,300,607 | | | | 3,325,647 | |
Expenses: | | | | | | | | | | | | | | | | |
Investment counsel fee (Note 3) | | | 27,131,593 | | | | 30,757,458 | | | | 11,111,024 | | | | 2,015,752 | |
Administration fee (Note 3) | | | 3,484,212 | | | | 3,967,661 | | | | 1,011,102 | | | | 179,178 | |
Transfer agent fees and expenses | | | 1,504,658 | | | | 635,269 | | | | 437,949 | | | | 51,374 | |
Prospectus and shareholder reports | | | 96,611 | | | | 120,823 | | | | 29,874 | | | | 14,029 | |
Trustees’ fees and expenses | | | 305,398 | | | | 305,398 | | | | 305,398 | | | | 305,398 | |
Custodian fees and expenses | | | 258,729 | | | | 117,124 | | | | 243,899 | | | | 42,238 | |
Professional fees | | | 101,526 | | | | 64,676 | | | | 193,431 | | | | 76,826 | |
Registration fees | | | 61,998 | | | | 63,001 | | | | 43,001 | | | | 24,665 | |
Other | | | 198,128 | | | | 206,103 | | | | 61,094 | | | | 21,603 | |
Total Expenses | | | 33,142,853 | | | | 36,237,513 | | | | 13,436,772 | | | | 2,731,063 | |
Expense reimbursement (Note 3) | | | — | | | | — | | | | — | | | | (371,884 | ) |
Net expenses after reimbursement | | | 33,142,853 | | | | 36,237,513 | | | | 13,436,772 | | | | 2,359,179 | |
Net Investment Income | | | 29,371,592 | | | | 9,252,843 | | | | 8,863,835 | | | | 966,468 | |
Realized and Unrealized Gain (Loss): | | | | | | | | | | | | | | | | |
Net Realized Gain (Loss): | | | | | | | | | | | | | | | | |
Non-affiliated securities | | | 87,708,590 | | | | 284,655,216 | | | | 31,836,153 | | | | 18,159,028 | |
Affiliated securities (Note 5) | | | (13,799,575 | ) | | | 283,068,415 | | | | (75,685,724 | ) | | | — | |
Options written (Note 8) | | | (152,226,307 | ) | | | 14,048,382 | | | | — | | | | (3,703,630 | ) |
Options purchased (Note 8) | | | (65,799,919 | ) | | | 48,300,672 | | | | — | | | | (1,389,131 | ) |
Swap contracts (Note 8) | | | — | | | | — | | | | (9,944,157 | ) | | | — | |
Forward currency contracts (Note 8) | | | — | | | | — | | | | 696,329 | | | | — | |
Foreign currency transactions | | | (12,917 | ) | | | 1,942 | | | | (78,527 | ) | | | (2,160 | ) |
Net Realized Gain (Loss) | | | (144,130,128 | ) | | | 630,074,627 | | | | (53,175,926 | ) | | | 13,064,107 | |
Change in Unrealized Appreciation (Depreciation): | | | | | | | | | | | | | | | | |
Non-affiliated securities | | | 461,129,888 | | | | 130,500,359 | | | | (33,722,345 | ) | | | 17,711,957 | |
Affiliated securities (Note 5) | | | 138,028,080 | | | | (3,120,820 | ) | | | 173,103,822 | | | | — | |
Options written (Note 8) | | | 105,201,461 | | | | (3,696,746 | ) | | | — | | | | 2,712,478 | |
Options purchased (Note 8) | | | 61,841,645 | | | | (17,690,044 | ) | | | (829,293 | ) | | | 1,301,782 | |
Swap contracts (Note 8) | | | — | | | | — | | | | 8,749,155 | | | | — | |
Forward currency contracts (Note 8) | | | — | | | | — | | | | 4,126,877 | | | | 215,528 | |
Foreign currency transactions | | | — | | | | — | | | | (9,870 | ) | | | (1,661 | ) |
Net Change in Unrealized Appreciation | | | 766,201,074 | | | | 105,992,749 | | | | 151,418,346 | | | | 21,940,084 | |
Net Realized and Unrealized Gain | | | 622,070,946 | | | | 736,067,376 | | | | 98,242,420 | | | | 35,004,191 | |
Net Increase in Net Assets Resulting from Operations | | $ | 651,442,538 | | | $ | 745,320,219 | | | $ | 107,106,255 | | | $ | 35,970,659 | |
| | | | | | |
| | Longleaf Partners Funds | | ◾ | | 37 |
| | |
Statements of Changes in Net Assets | | |
| | | | | | | | | | | | | | | | |
| | | Partners Fund | | | Small-Cap Fund | |
| | | Year Ended December 31, | | | Year Ended December 31, | |
| | | 2016 | | | 2015 | | | 2016 | | | 2015 | |
| |
Operations: | |
| |
Net investment income (loss) | | $ | 29,371,592 | | | $ | 53,750,431 | | | $ | 9,252,843 | | | $ | (1,078,558 | ) |
| |
Net realized gain (loss) from investments and foreign currency transactions | | | (144,130,128 | ) | | | 204,136,034 | | | | 630,074,627 | | | | 110,958,716 | |
| |
Net change in unrealized appreciation(depreciation) from investments and foreign currency transactions | | | 766,201,074 | | | | (1,388,527,672 | ) | | | 105,992,749 | | | | (364,043,410 | ) |
| |
Net increase (decrease) in net assets resulting from operations | | | 651,442,538 | | | | (1,130,641,207 | ) | | | 745,320,219 | | | | (254,163,252 | ) |
| |
Distributions to Shareholders: | |
| |
From net investment income | | | (340,704 | ) | | | (50,085,076 | ) | | | (13,901,253 | ) | | | — | |
| |
From net realized gain on investments | | | (73,156,585 | ) | | | (594,966,698 | ) | | | (631,805,935 | ) | | | (222,103,895 | ) |
| |
Net decrease in net assets resulting from distributions | | | (73,497,289 | ) | | | (645,051,774 | ) | | | (645,707,188 | ) | | | (222,103,895 | ) |
| |
Capital Share Transactions: | |
| |
Net proceeds from sale of shares | | | 160,784,617 | | | | 252,241,649 | | | | 318,047,835 | | | | 431,374,493 | |
| |
Reinvestment of shareholder distributions | | | 67,776,841 | | | | 600,948,964 | | | | 518,783,340 | | | | 209,296,128 | |
| |
Cost of shares redeemed | | | (982,801,821 | ) | | | (3,000,522,798 | ) | | | (750,426,127 | ) | | | (738,641,878 | ) |
| |
Net increase (decrease) in net assets from fund share transactions | | | (754,240,363 | ) | | | (2,147,332,185 | ) | | | 86,405,048 | | | | (97,971,257 | ) |
| |
Total increase (decrease) in net assets | | | (176,295,114 | ) | | | (3,923,025,166 | ) | | | 186,018,079 | | | | (574,238,404 | ) |
| |
Net Assets: | | | | | | | | | | | | | | | | |
Beginning of year | | | 3,624,583,274 | | | | 7,547,608,440 | | | | 3,809,643,227 | | | | 4,383,881,631 | |
| |
End of year | | $ | 3,448,288,160 | | | $ | 3,624,583,274 | | | $ | 3,995,661,306 | | | $ | 3,809,643,227 | |
| |
Undistributed net investment income | | $ | 27,781,980 | | | $ | 334,608 | | | $ | — | | | $ | — | |
| |
|
Capital Share Transactions: | |
| |
Issued | | | 7,039,409 | | | | 9,653,017 | | | | 11,190,230 | | | | 14,141,235 | |
| |
Reinvested | | | 2,679,881 | | | | 27,078,603 | | | | 19,051,655 | | | | 7,765,828 | |
| |
Redeemed | | | (42,694,248 | ) | | | (109,376,969 | ) | | | (26,087,020 | ) | | | (24,821,131 | ) |
| |
Net increase (decrease) in shares outstanding | | | (32,974,958 | ) | | | (72,645,349 | ) | | | 4,154,865 | | | | (2,914,068 | ) |
| |
| | | | | | |
| | Longleaf Partners Funds | | ◾ | | 38 |
| | |
Statements of Changes in Net Assets | | |
| | | | | | | | | | | | | | | | |
| | | International Fund | | | Global Fund | |
| | | Year Ended December 31, | | | Year Ended December 31, | |
| | | 2016 | | | 2015 | | | 2016 | | | 2015 | |
Operations: | | | | | | | | | | | | | | | | |
| |
Net investment income | | $ | 8,863,835 | | | $ | 22,201,565 | | | $ | 966,468 | | | $ | 511,260 | |
| |
Net realized gain (loss) from investments and foreign currency transactions | | | (53,175,926 | ) | | | (19,518,237 | ) | | | 13,064,107 | | | | (13,563,170 | ) |
| |
Net change in unrealized appreciation(depreciation) from investments and foreign currency transactions | | | 151,418,346 | | | | (105,776,474 | ) | | | 21,940,084 | | | | (12,564,310 | ) |
| |
Net increase (decrease) in net assets resulting from operations | | | 107,106,255 | | | | (103,093,146 | ) | | | 35,970,659 | | | | (25,616,220 | ) |
| |
Distributions to Shareholders: | | | | | | | | | | | | | | | | |
| |
From net investment income | | | (23,296,482 | ) | | | (20,069,333 | ) | | | (924,728 | ) | | | (402,723 | ) |
| |
From net realized gain on investments | | | — | | | | (12,849,739 | ) | | | — | | | | — | |
| |
Net decrease in net assets resulting from distributions | | | (23,296,482 | ) | | | (32,919,072 | ) | | | (924,728 | ) | | | (402,723 | ) |
| |
Capital Share Transactions: | | | | | | | | | | | | | | | | |
| |
Net proceeds from sale of shares | | | 79,067,355 | | | | 156,526,912 | | | | 47,872,912 | | | | 119,826,997 | |
| |
Reinvestment of shareholder distributions | | | 20,439,479 | | | | 29,393,008 | | | | 654,820 | | | | 261,515 | |
| |
Cost of shares redeemed | | | (311,556,604 | ) | | | (392,533,061 | ) | | | (63,455,139 | ) | | | (90,976,707 | ) |
| |
Net increase (decrease) in net assets from fund share transactions | | | (212,049,770 | ) | | | (206,613,141 | ) | | | (14,927,407 | ) | | | 29,111,805 | |
| |
Total increase (decrease) in net assets | | | (128,239,997 | ) | | | (342,625,359 | ) | | | 20,118,524 | | | | 3,092,862 | |
| |
Net Assets: | | | | | | | | | | | | | | | | |
Beginning of year | | | 1,116,982,989 | | | | 1,459,608,348 | | | | 167,465,084 | | | | 164,372,222 | |
| |
End of year | | $ | 988,742,992 | | | $ | 1,116,982,989 | | | $ | 187,583,608 | | | $ | 167,465,084 | |
| |
Undistributed net investment loss | | $ | (12,241,301 | ) | | $ | (47,833 | ) | | $ | — | | | $ | — | |
| |
| | | | |
Capital Share Transactions: | | | | | | | | | | | | | | | | |
| |
Issued | | | 6,192,019 | | | | 11,608,136 | | | | 5,054,847 | | | | 11,649,372 | |
| |
Reinvested | | | 1,520,720 | | | | 2,307,745 | | | | 54,797 | | | | 25,969 | |
| |
Redeemed | | | (25,056,854 | ) | | | (29,280,162 | ) | | | (6,207,475 | ) | | | (9,061,006 | ) |
| |
Net increase (decrease) in shares outstanding | | | (17,344,115 | ) | | | (15,364,281 | ) | | | (1,097,831 | ) | | | 2,614,335 | |
| |
| | | | | | |
| | Longleaf Partners Funds | | ◾ | | 39 |
| | |
Notes to Financial Statements | | |
Note 1. Organization
Longleaf Partners Fund, Longleaf Partners Small-Cap Fund, Longleaf Partners International Fund, and Longleaf Partners Global Fund (the “Funds”) are non-diversified and each is a series of Longleaf Partners Funds Trust, a Massachusetts business trust, which is registered as an open-end management investment company under the Investment Company Act of 1940, as amended.
Note 2. Significant Accounting Policies
The Funds follow the accounting and reporting guidance in FASB Accounting Standards Codification 946.
Management Estimates
The accompanying financial statements are prepared in accordance with U.S. generally accepted accounting principles (“U.S. GAAP”); these principles may require the use of estimates by Fund management. Actual results could differ from those estimates.
Security Valuation
The following is a description of the valuation techniques applied to the Funds’ investments (see also Note 7. Fair Value Measurements).
Portfolio securities listed or traded on a securities exchange (U.S. or foreign), on the NASDAQ national market, or any representative quotation system providing same day publication of actual prices, are valued at the last sale price, and categorized as Level 1 of the fair value hierarchy. If there are no transactions in the security that day, securities are valued at the midpoint between the closing bid and ask prices or, if there are no such prices, the prior day’s close, and categorized as Level 2.
In the case of bonds and other fixed income securities, valuations may be furnished by a pricing service which takes into account factors in addition to quoted prices (such as trading characteristics, yield, quality, coupon rate, maturity, type of issue, and other market data relating to the priced security or other similar securities) where taking such factors into account would lead to a more accurate reflection of the fair market value of such securities. Such securities are categorized as Level 2.
When market quotations are not readily available, valuations of portfolio securities may be determined in accordance with procedures established by and under the general supervision of the Funds’ Trustees. In determining fair value, the Board considers relevant qualitative and quantitative information including news regarding significant market or security specific events. The Board may also utilize a service provided by an independent third party to assist in fair valuation of certain securities. These factors are subject to change over time and are reviewed periodically. Because the utilization of fair value depends on market activity, the frequency with which fair valuation may be used cannot be predicted. Estimated values may differ from the values that would have been used had a ready market for the investment existed. Such securities are categorized as either Level 2 or 3.
Repurchase agreements are valued at cost which, combined with accrued interest, approximates market value. Short-term U.S. Government obligations purchased with a remaining maturity of more than 60 days are valued through pricing obtained through pricing services approved by the Funds’ Trustees. Obligations purchased with a remaining maturity of 60 days or less or existing positions that have less than 60 days to maturity generally are valued at amortized cost, which approximates market value. However, if amortized cost is deemed not to reflect fair value, the securities are valued at prices furnished by dealers who make markets in such securities or by an independent pricing service. Such securities are categorized as Level 2.
The Funds determine net asset values (“NAVs”) once a day, at the close of regular trading on the New York Stock Exchange (“Exchange”) (usually at 4:00 p.m. Eastern time) on days the Exchange is open for business. The Exchange is closed for specified national holidays and on weekends. Foreign securities are generally priced at the latest market close in the foreign market, which may be at different times or days than the close of the Exchange. If events occur which could materially affect the NAV between the close of the foreign market and normal pricing at the close of the Exchange, foreign securities may be fair valued by using an external pricing service as determined by the Board of Trustees, consistent with any regulatory guidelines, and are categorized as Level 2.
Security Transactions
For financial reporting purposes, the Funds record security transactions on trade date. Realized gains and losses on security transactions are determined using the specific identification method. Dividend income is recognized on the ex-dividend date, except that certain dividends from foreign securities are recorded as soon after the ex-dividend date as the Fund is able to obtain information on
| | | | | | |
| | Longleaf Partners Funds | | ◾ | | 40 |
| | |
Notes to Financial Statements | | |
the dividend. Interest income is recognized on an accrual basis. Discounts and premiums on securities purchased are amortized using the daily effective yield method. The Funds record distributions received from investments in Real Estate Investment Trusts (“REITS”) in excess of income from underlying investments as a reduction of cost of investments and/or realized gain. Such amounts are based on estimates if actual amounts are not available and actual amounts of income, realized gain and return of capital may differ from the estimated amounts. The Funds adjust the estimated amounts once the issuers provide information about the actual composition of the distributions.
Distributions to Shareholders
Dividends from net investment income, if any, are declared and distributed to shareholders annually. Net realized capital gains from investment transactions, if any, are declared and distributed to shareholders at least annually. Furthermore, capital gains are distributed only to the extent they exceed available capital loss carryforwards. Distributions to shareholders are recorded on the ex-dividend date. The amount and timing of distributions are determined in accordance with federal income tax regulations, which may differ from U.S. GAAP.
Federal Income Taxes
The Funds’ policy is to comply with the requirements of Subchapter M of the Internal Revenue Code applicable to regulated investment companies and to distribute substantially all taxable income to shareholders. Accordingly, no federal income tax provision is required. Reclassifications are made within the Funds’ capital accounts for permanent book and tax basis differences.
Foreign Currency Translations
The books and records of the Funds are maintained in U.S. dollars. Securities denominated in currencies other than U.S. dollars are subject to changes in value due to fluctuations in exchange rates. Purchases and sales of securities and income and expenses are translated into U.S. dollars at the prevailing exchange rate on the respective date of each transaction. The market values of investment securities, assets and liabilities are translated into U.S. dollars daily. The Funds do not isolate the portion of net realized and unrealized gains or losses in equity security investments which are attributable to changes in foreign exchange rates. Accordingly, the impact of such changes is included in the realized and unrealized gains or losses on the underlying equity securities.
Repurchase Agreements
The Funds may engage in repurchase agreement transactions. The Fixed Income Clearing Corporation (“FICC”) sells U.S. government or agency securities to each Fund under agreements to repurchase these securities at a stated repurchase price including interest for the term of the agreement, which is usually overnight or over a weekend. Each Fund, through FICC, receives delivery of the underlying U.S. government or agency securities as collateral, whose market value is required to be at least equal to the repurchase price. If FICC becomes bankrupt, the Fund might be delayed, or may incur costs or possible losses of principal and income, in selling the collateral.
Warrants
The Funds may invest in warrants and stock purchase rights of companies, which gives the Funds the right to buy stock. The warrant specifies the amount of the underlying stock, the exercise price, and the date the warrant expires. The Funds have no obligation to exercise the warrant and buy the stock.
Options
The Funds may purchase and sell (“write”) call and put options on various instruments including securities to gain long or short exposure to the underlying instruments.
An option contract gives the buyer the right, but not the obligation, to buy(call) or sell(put) an underlying item at a fixed exercise price on a certain date or during a specified period. The cost of securities acquired through the exercise of a call option is increased by the premiums paid. The proceeds from securities sold through the exercise of a purchased put option are decreased by the premiums paid. The cost of purchased options that expire unexercised are treated by the Funds, on expiration date, as realized losses on investments.
When the Funds write an option, an amount equal to the premium received is recorded as a liability and is subsequently adjusted to the current fair value of the option written. Premiums received from writing options that expire unexercised are treated, on the expiration
| | | | | | |
| | Longleaf Partners Funds | | ◾ | | 41 |
| | |
Notes to Financial Statements | | |
date, as realized gains on written options. The difference between the premium and the amount paid on effecting a closing transaction, including brokerage commissions, is also treated as a realized gain, or, if the premium is less than the amount paid for the closing transaction, as a realized loss. If a call option is exercised, the premium is added to the proceeds from the sale of the underlying security in determining whether the Funds have a realized gain or loss. If a put option is exercised, the premium reduces the cost basis of the security purchased.
A written put with a knock-in feature can only be exercised if the knock-in or “barrier” price is reached during the term of the contract. Once the barrier is reached, the option functions as a standard written put. If the barrier is not met, the put can’t be exercised and the Fund retains the premium received at the inception of the contract.
The current market value of an exchange traded option is the last sales price. Over-the-counter (“OTC”) options are valued at the mean of their closing bid and ask prices supplied by the counterparty in accordance with fair value procedures established by and under the general supervision of the Funds’ Trustees, and are categorized in Level 2 of the fair value hierarchy.
Risk of Options
Gains on investment in options may depend on correctly predicting the market value direction of the underlying security. There can be no assurance that a liquid market will exist when a Fund seeks to close out an option position and a Fund may experience losses as a result of such illiquidity. Listed options involve minimal counter-party risk since listed options are guaranteed against default by the exchange on which they trade. When purchasing over-the-counter (OTC) options, the Funds bear the risk of economic loss from counterparty default, equal to the market value of the option.
Swap Contracts
The Funds may enter into swap contracts for purposes of pursuing their investment objectives or as a substitute for investing directly in securities, shorting securities, or to hedge a position. Swaps are two-party contracts entered into primarily by institutional investors for periods ranging from a day to more than one year. In a standard swap transaction, two parties agree to exchange the returns (or differential in rates of return) earned or realized on particular predetermined investments or instruments. The gross returns to be exchanged between the parties is calculated with respect to a “notional amount,” for example, the return on or increase in value of a particular dollar amount invested in a basket of securities. Most swap contracts entered into by the Funds calculate and settle the obligations of the parties to the agreement on a “net basis” with a single payment. Consequently, a Fund’s current obligations (or rights) under a swap agreement will generally be equal only to the net amount to be paid or received under the agreement based on the relative values of such obligations (or rights). A Fund’s current obligations under a swap agreement are accrued daily, offset against any amounts owed to the Fund.
The market value of a swap contract is determined by marking the underlying security (securities) to their last quoted value at the close of the NYSE, usually 4:00 p.m., Eastern Time. The swap’s market value is then adjusted to accrue dividend or interest income, financing charges and/or other economic terms associated with the contract.
Risk of Swaps
Swap contracts involve, to varying degrees, elements of market risk and exposure to loss in excess of the amount reflected in the Statement of Assets and Liabilities. The notional amounts reflect the extent of the total investment exposure each Fund has under the swap contract. The primary risks associated with the use of swaps are imperfect correlation between movements in the notional amount and the price of the underlying investments and the inability of counterparties to perform. A Fund bears the risk of loss of the amount expected to be received under a swap contract in the event of the default or bankruptcy of a swap counterparty.
Forward Currency Contracts
Forward currency contracts are commitments to purchase or sell a foreign currency at a future maturity date at a prespecified price. The resulting obligation is marked-to-market daily using foreign currency exchange rates supplied by an independent pricing service, and are categorized in Level 2 of the fair value hierarchy. An unrealized gain or loss is recorded for the difference between the contract
| | | | | | |
| | Longleaf Partners Funds | | ◾ | | 42 |
| | |
Notes to Financial Statements | | |
opening value and its current value. When a contract is closed or delivery is taken, this gain or loss is realized. For federal tax purposes, gain or loss on open forward contracts in qualifying currencies are treated as realized and are subject to distribution at our excise tax year-end date.
Risk of Forward Currency Contracts
The Funds may use forward currency contracts for hedging purposes to offset currency exposure in portfolio holdings. Forward contracts may reduce the potential gain from a positive change in the relationship between the U.S. dollar and foreign currencies or, considered separately, may produce a loss. Not all foreign currencies can be effectively hedged; and the costs of hedging may outweigh the benefits. If our hedging strategy does not correlate well with market and currency movements, price volatility of the portfolio could increase. Where a liquid secondary market for forwards does not exist, the Funds may not be able to close their positions and in such an event, the loss is theoretically unlimited. In addition, the Funds could be exposed to risks if the counterparty to these contracts is unable to perform.
Counterparty Risk and Collateral
The Funds have entered into collateral agreements with counterparties to mitigate risk on OTC derivatives. Collateral is generally determined based on the net unrealized gain or loss with each counterparty, subject to minimum exposure amounts. Collateral, both pledged by and for the benefit of a Fund, is held in a segregated account at the Funds’ custodian bank and is comprised of assets specific to each agreement.
Note 3. Investment Counsel Agreement and Other Transactions with Affiliates
Southeastern Asset Management, Inc. (“Southeastern”) serves as Investment Counsel to the Funds and receives annual compensation, computed daily and paid monthly, in accordance with the following schedule:
| | |
Partners Fund | | 1.00% on first $400 million of average net assets
0.75% in excess of $400 million |
Small-Cap Fund | | 1.00% on first $400 million of average net assets
0.75% in excess of $400 million |
International Fund | | 1.20% on first $500 million of average net assets
1.00% in excess of $500 million |
Global Fund | | 1.125% on first $500 million of average net assets
1.00% in excess of $500 million |
Southeastern has agreed to waive fees and/or reimburse expenses so that each Fund’s annual operating expenses (excluding taxes, interest, brokerage fees, and extraordinary expenses) do not exceed the following:
| | | | |
Partners Fund | | | 1.50 | % |
Small-Cap Fund | | | 1.50 | |
International Fund | | | 1.75 | |
Global Fund | | | 1.20 | * |
| * | Effective May 1, 2016, Southeastern agreed to voluntarily reduce the expense limit from 1.65% to 1.20%. The voluntary waiver and/or reimbursement for the Global Fund may be discontinued at any time. Southeastern waived and/or reimbursed $371,884 of Global Fund’s expenses during the period ended December 31, 2016. |
Southeastern also serves as the Fund Administrator and in this capacity is responsible for managing, performing or supervising the administrative and business operations of the Funds. Functions include the preparation of all registration statements, prospectuses, proxy statements, and oversight of daily valuation of the portfolios and calculation of daily net asset values per share. The Funds pay a fee as compensation for these services, accrued daily and paid monthly, of 0.10% per annum of average daily net assets.
| | | | | | |
| | Longleaf Partners Funds | | ◾ | | 43 |
| | |
| |
Notes to Financial Statements | | |
A substantial shareholder of Southeastern Concentrated Value Ltd. (SCV), a private fund under a discretionary investment management agreement with Southeastern and in which Longleaf portfolio managers and related parties have a substantial financial interest, is CEO and a director of OCI N.V. and a director of LafargeHolcim Ltd, which are investments in the Funds. Southeastern intends to follow its established investment disciplines with respect to OCI N.V. and LafargeHolicm Ltd and will disregard any potential biases the SCV relationship might create.
Note 4. Investment Transactions
Purchases and sales of investment securities for the period ended December 31, 2016 (excluding short-term and U.S. government obligations) are summarized below:
| | | | | | | | |
| | | Purchases | | | Sales | |
Partners Fund | | $ | 504,981,737 | | | $ | 1,784,798,038 | |
Small-Cap Fund | | | 930,711,418 | | | | 1,491,714,940 | |
International Fund | | | 185,824,259 | | | | 619,337,913 | |
Global Fund | | | 52,237,030 | | | | 82,966,357 | |
Note 5. Affiliated Issuer
Under Section 2(a)(3) of the Investment Company Act of 1940, a portfolio company is defined as “affiliated” if a Fund owns five percent or more of its voting stock during all or part of the period. Affiliated companies during the period ended December 31, 2016 were as follows:
| | | | | | | | | | | | | | | | | | | | | | | | |
| | | Shares at | | | Market Value at | | | | | | | | | | |
| | | 12/31/16 | | | 12/31/16 | | | 12/31/15 | | | Purchases | | | Sales | | | Dividends | |
Partners Fund | | | | | | | | | | | | | | | | | | | | | | | | |
CONSOL Energy Inc. | | | 11,536,742 | | | $ | 210,314,807 | | | $ | 96,881,650 | | | $ | — | | | $ | 10,795,348 | | | $ | 122,635 | |
Small-Cap Fund | | | | | | | | | | | | | | | | | | | | | | | | |
Actuant Corporation - Class A | | | 5,841,674 | | | | 151,591,440 | | | | 147,121,205 | | | | 4,048,223 | | | | 13,754,651 | | | | 253,357 | |
Chemtura Corporation*(a) | | | — | | | | — | | | | 115,862,867 | | | | — | | | | 138,503,243 | | | | — | |
CONSOL Energy Inc. | | | 12,494,200 | | | | 227,769,266 | | | | 98,704,180 | | | | — | | | | — | | | | 124,942 | |
Deltic Timber Corporation | | | 1,808,158 | | | | 139,354,737 | | | | 106,446,262 | | | | — | | | | — | | | | 723,263 | |
DreamWorks Animation SKG, Inc. - Class A*(a) | | | — | | | | — | | | | 359,218,338 | | | | — | | | | 543,195,282 | | | | — | |
Eastman Kodak Company Convertible Preferred Stock - Series A 5.5% | | | 1,864,300 | | | | 202,108,763 | | | | — | | | | 186,430,000 | | | | — | | | | — | |
Graham Holdings Company - Class B | | | 428,000 | | | | 219,114,600 | | | | 207,567,160 | | | | — | | | | — | | | | 2,071,520 | |
Hopewell Holdings Limited | | | 53,463,500 | | | | 184,772,945 | | | | 194,181,406 | | | | — | | | | 2,562,551 | | | | 8,958,072 | |
OCI N.V.* | | | 11,011,630 | | | | 192,185,967 | | | | 163,404,476 | | | | 79,324,476 | | | | 25,335,489 | | | | — | |
Rayonier Inc. | | | 6,663,700 | | | | 177,254,420 | | | | 147,934,140 | | | | — | | | | — | | | | — | |
SEACOR Holdings Inc.* | | | 876,472 | | | | 62,474,924 | | | | — | | | | 48,493,542 | | | | — | | | | — | |
Sonic Corp. | | | 4,590,108 | | | | 121,683,763 | | | | — | | | | 116,063,704 | | | | — | | | | 642,615 | |
ViaSat, Inc.* | | | 3,436,313 | | | | 227,552,647 | | | | 209,649,456 | | | | — | | | | — | | | | — | |
| | | | | | $ | 1,905,863,472 | | | $ | 1,750,089,490 | | | $ | 434,359,945 | | | $ | 723,351,216 | | | $ | 12,773,769 | |
| | | | | | |
| | Longleaf Partners Funds | | ◾ | | 44 |
| | |
| |
Notes to Financial Statements | | |
| | | | | | | | | | | | | | | | | | | | | | | | |
| | | Shares at | | | Market Value at | | | | | | | | | | |
| | | 12/31/16 | | | 12/31/16 | | | 12/31/15 | | | Purchases | | | Sales | | | Dividends | |
International Fund | | | | | | | | | | | | | | | | | | | | | | | | |
BR Properties S.A.(a) | | | — | | | $ | — | | | $ | 37,443,270 | | | | $ — | | | $ | 51,084,593 | | | $ | — | |
K. Wah International Holdings Limited(a) | | | 59,733,762 | | | | 27,731,194 | | | | 64,954,826 | | | | — | | | | 45,331,153 | | | | 2,239,160 | |
| | | | | | $ | 27,731,194 | | | $ | 102,398,096 | | | | $ — | | | $ | 96,415,746 | | | $ | 2,239,160 | |
| * | Non-income producing security. |
| (a) | Not an affiliate at the end of the period. |
Note 6. Related Ownership
At December 31, 2016 officers, employees of Southeastern and their families, Fund trustees, the Southeastern retirement plan and other affiliates owned the following:
| | |
| | | Percent of Fund |
Partners Fund | | 12% |
Small-Cap Fund | | 3 |
International Fund | | 27 |
Global Fund | | 65 |
Note 7. Fair Value Measurements
FASB ASC 820 established a single definition of fair value for financial reporting, created a three-tier framework for measuring fair value based on inputs used to value the Funds’ investments, and required additional disclosure about the use of fair value measurements. The hierarchy of inputs is summarized below.
| | • | | Level 1 – quoted prices in active markets for identical investments |
| | • | | Level 2 – other significant observable inputs (including quoted prices for similar investments, interest rates, prepayment speeds, credit risk, etc.) |
| | • | | Level 3 – significant unobservable inputs (including the Funds’ own assumptions in determining the fair value of investments) |
Observable inputs are those based on market data obtained from sources independent of the Funds, and unobservable inputs reflect the Funds’ own assumptions based on the best information available. The input levels are not necessarily an indication of risk or liquidity associated with investing in those securities.
A summary of the inputs used in valuing the Funds’ investments at December 31, 2016 follows:
| | | | | | | | | | | | | | | | |
| | | Level 1 | | | Level 2 | | | Level 3 | | | Total Value | |
Partners Fund | | | | | | | | | | | | | | | | |
Common Stock | | $ | 2,823,526,309 | | | $ | — | | | $ | — | | | $ | 2,823,526,309 | |
Options Purchased | | | — | | | | 2,686,000 | | | | — | | | | 2,686,000 | |
Short-Term Obligations | | | — | | | | 628,784,025 | | | | — | | | | 628,784,025 | |
Total | | $ | 2,823,526,309 | | | $ | 631,470,025 | | | $ | — | | | $ | 3,454,996,334 | |
| | | | | | |
| | Longleaf Partners Funds | | ◾ | | 45 |
| | |
| |
Notes to Financial Statements | | |
| | | | | | | | | | | | | | | | |
| | | Level 1 | | | Level 2 | | | Level 3 | | | Total Value | |
| | | | |
Small-Cap Fund | | | | | | | | | | | | | | | | |
Common Stock | | $ | 2,922,399,662 | | | $ | — | | | $ | — | | | $ | 2,922,399,662 | |
Preferred Stock | | | — | | | | — | | | | 202,108,763 | | | | 202,108,763 | |
Corporate Bonds | | | — | | | | 121,160,200 | | | | — | | | | 121,160,200 | |
Options Purchased | | | — | | | | 548,709 | | | | — | | | | 548,709 | |
Short-Term Obligations | | | — | | | | 741,382,450 | | | | — | | | | 741,382,450 | |
Total | | $ | 2,922,399,662 | | | $ | 863,091,359 | | | $ | 202,108,763 | | | $ | 3,987,599,784 | |
International Fund | | | | | | | | | | | | | | | | |
Common Stock | | $ | 747,219,741 | | | $ | — | | | $ | 5,472,318 | | | $ | 752,692,059 | |
Warrants | | | 10,030,170 | | | | — | | | | — | | | | 10,030,170 | |
Corporate Bonds | | | — | | | | 50,737,909 | | | | — | | | | 50,737,909 | |
Options Purchased | | | — | | | | 601,237 | | | | — | | | | 601,237 | |
Short-Term Obligations | | | — | | | | 159,777,870 | | | | — | | | | 159,777,870 | |
Forward Currency Contracts | | | — | | | | 4,126,877 | | | | — | | | | 4,126,877 | |
Total | | $ | 757,249,911 | | | $ | 215,243,893 | | | $ | 5,472,318 | | | $ | 977,966,122 | |
Global Fund | | | | | | | | | | | | | | | | |
Common Stocks | | $ | 165,783,232 | | | $ | — | | | $ | — | | | $ | 165,783,232 | |
Warrants | | | 1,433,616 | | | | — | | | | — | | | | 1,433,616 | |
Options Purchased | | | — | | | | 38,925 | | | | — | | | | 38,925 | |
Short-Term Obligations | | | — | | | | 20,168,000 | | | | — | | | | 20,168,000 | |
Forward Currency Contracts | | | — | | | | 215,528 | | | | — | | | | 215,528 | |
Total | | $ | 167,216,848 | | | $ | 20,422,453 | | | $ | — | | | $ | 187,639,301 | |
Fair value adjustments were not applied to foreign securities as of December 31, 2016, therefore $887,861,922, $358,617,783, $657,811,360, and $76,820,673 were transferred from Level 2 to Level 1 for Partners Fund, Small-Cap Fund, International Fund, and Global Fund, respectively. Transfers are recognized at the beginning of the reporting period. There were no other transfers between Level 1, 2, or 3 during the period.
The following table provides quantitative information about significant unobservable inputs used to determine the fair valuations of Level 3 assets, and the sensitivity of the valuations to changes in those significant unobservable inputs. These securities were valued by a third party specialist utilizing fundamental data relating to the issuer. Because the Valuation Committee considers a variety of factors and inputs, both observable and unobservable, in determining fair values, the unobservable inputs presented do not reflect all inputs significant to the fair value determination.
| | | | | | | | | | | | | | |
| Fund | | Investments in Securities | | Fair Value at 12/31/16 (000s) | | Valuation Technique | | Unobservable Input | | Value or Range of Input | | | Impact to Valuation from an Increase in Input* |
Small-Cap Fund | | Preferred Stock | | $202,109 | | Preferred Stock Pricing
Model | | Expected Volatility | | | 32% | | | Increase |
International Fund | | Common Stock | | $ 5,472 | | Discounted Cash Flow
Method | | Discount Rate
Revenue Growth Rate | |
| 11 - 35%
4 - 197% |
| | Decrease
Increase |
| * | Represents the directional change in the fair value that would result in an increase from the corresponding unobservable input. A decrease to the unobservable input would have the opposite effect. Significant increases and decreases in these unobservable inputs in insolation could result in significantly higher or lower fair value. |
| | | | | | |
| | Longleaf Partners Funds | | ◾ | | 46 |
| | |
| |
Notes to Financial Statements | | |
The following is a reconciliation of Level 3 holdings for which significant unobservable inputs were used in determining fair value at December 31, 2016:
| | | | | | | | | | |
| | | Small-Cap Fund | | International Fund |
Fair value at December 31, 2015 | | | $ | — | | | | $ | 4,773,849 | |
Change in unrealized appreciation | | | | 15,678,763(a) | | | | | 698,469(b) | |
Purchases | | | | 186,430,000 | | | | | — | |
Fair value at December 31, 2016 | | | $ | 202,108,763 | | | | $ | 5,472,318 | |
| (a) | Statements of Operations location: Change in Unrealized Appreciation (Depreciation) Affiliated securities. |
| (b) | Statements of Operations location: Change in Unrealized Appreciation (Depreciation) Non-affiliated securities. |
Note 8. Derivative Instruments
The Funds invested in options, swaps and forward contracts. Footnote 2, ‘Significant Accounting Policies,” contains additional information regarding the risks of these derivatives.
Options
The Funds use options in several ways:
| | • | | Written covered calls create an exit method for all or a portion of an underlying security position for portfolio management purposes; |
| | • | | Purchased call options secure upside exposure to the underlying security or currency at low implied long-term interest rates. The maximum loss exposure is the premium paid for the options. |
| | • | | Purchased call options are sometimes used in tandem with written put options, to create long synthetic exposure to the underlying security. |
With purchased call options (sometimes in tandem with written put options) the Funds get exposure to the stock without spending cash.
Written options during the period ended December 31, 2016 include:
| | | | | | | | |
| | | Partners Fund | |
| | | Share Equivalents | | | Premiums | |
Options outstanding at December 31, 2015 | | | 20,630,500 | | | $ | 77,065,406 | |
Options closed | | | (20,630,500 | ) | | | (77,065,406 | ) |
Options outstanding at December 31, 2016 | | | — | | | $ | — | |
| |
| | | Small-Cap Fund | |
| | | Share Equivalents | | | Premiums | |
Options outstanding at December 31, 2015 | | | 3,300,000 | | | $ | 58,930,496 | |
Options closed | | | (3,300,000 | ) | | | (58,930,496 | ) |
Options outstanding at December 31, 2016 | | | — | | | $ | — | |
| | | | | | |
| | Longleaf Partners Funds | | ◾ | | 47 |
| | |
| |
Notes to Financial Statements | | |
| | | | | | | | |
| | | Global Fund | |
| | | Share Equivalents | | | Premiums | |
Options outstanding at December 31, 2015 | | | 428,600 | | | $ | 1,346,739 | |
Options closed | | | (428,600 | ) | | | (1,346,739 | ) |
Options outstanding at December 31, 2016 | | | — | | | $ | — | |
Swap Contracts
Swap contracts are used to create exposure to the underlying notional value of a stock or bond position. Swap contracts may be done to free up cash or to access markets or short positions more efficiently than otherwise possible. The Funds did not hold swap contracts at December 31, 2016.
Forward Currency Contracts
Forward currency contracts are used on a limited basis to hedge embedded currency exposure related to a specific holding.
The following is a summary of the location and type of derivative instruments in the Funds’ financial statements at December 31, 2016:
| | | | | | | | | | |
| | | Statements of Assets and Liabilities | |
| | | | | By Derivative Type | |
| | | Location | | Currency | | | Total | |
| | | | | Partners Fund | |
Options Purchased | | Other securities, at market value | | $ | 2,686,000 | | | $ | 2,686,000 | |
| | |
| | | | | Small-Cap Fund | |
Options Purchased | | Other securities, at market value | | $ | 548,709 | | | $ | 548,709 | |
| | |
| | | | | International Fund | |
Options Purchased | | Other securities, at market value | | $ | 601,237 | | | $ | 601,237 | |
Forward currency contracts | | Unrealized gain on forward currency contracts | | | 4,126,877 | | | | 4,126,877 | |
| | | | $ | 4,728,114 | | | $ | 4,728,114 | |
| | |
| | | | | Global Fund | |
Options Purchased | | Other securities, at market value | | $ | 38,925 | | | $ | 38,925 | |
Forward currency contracts | | Unrealized gain on forward currency contracts | | | 215,528 | | | | 215,528 | |
| | | | $ | 254,453 | | | $ | 254,453 | |
| | | | | | |
| | Longleaf Partners Funds | | ◾ | | 48 |
| | |
| |
Notes to Financial Statements | | |
| | | | | | | | | | | | |
| | | Impact of Derivatives on Statements of Operations | |
| | | By Derivative Type | |
| | | Equity | | | Currency | | | Total | |
| | | Partners Fund | |
Net realized loss: | | | | | | | | | | | | |
Non-affiliated securities (Options purchased) | | $ | (65,799,919 | ) | | $ | — | | | $ | (65,799,919 | ) |
Options written | | | (152,226,307 | ) | | | — | | | | (152,226,307 | ) |
| | | (218,026,226 | ) | | | — | | | | (218,026,226 | ) |
Change in unrealized appreciation: | | | | | | | | | | | | |
Non-affiliated securities (Options purchased) | | | 61,055,395 | | | | 786,250 | | | | 61,841,645 | |
Options written | | | 105,201,461 | | | | — | | | | 105,201,461 | |
| | $ | 166,256,856 | | | $ | 786,250 | | | $ | 167,043,106 | |
| |
| | | Small-Cap Fund | |
Net realized gain: | | | | | | | | | | | | |
Non-affiliated securities (Options purchased) | | $ | 48,300,672 | | | $ | — | | | $ | 48,300,672 | |
Options written | | | 14,048,382 | | | | — | | | | 14,048,382 | |
| | | 62,349,054 | | | | — | | | | 62,349,054 | |
Change in unrealized depreciation: | | | | | | | | | | | | |
Non-affiliated securities (Options purchased) | | | — | | | | (17,690,044 | ) | | | (17,690,044 | ) |
Options written | | | (3,696,746 | ) | | | — | | | | (3,696,746 | ) |
| | $ | (3,696,746 | ) | | $ | (17,690,044 | ) | | $ | (21,386,790 | ) |
| |
| | | International Fund | |
Net realized gain (loss): | | | | | | | | | | | | |
Swap contracts | | $ | (9,944,157 | ) | | $ | — | | | $ | (9,944,157 | ) |
Forward currency contracts | | | — | | | | 696,329 | | | | 696,329 | |
| | | (9,944,157 | ) | | | 696,329 | | | | (9,247,828 | ) |
Change in unrealized appreciation (depreciation): | | | | | | | | | | | | |
Non-affiliated securities (Options purchased) | | | — | | | | (829,293 | ) | | | ( 829,293 | ) |
Swap contracts | | | 8,749,155 | | | | — | | | | 8,749,155 | |
Forward currency contracts | | | — | | | | 4,126,877 | | | | 4,126,877 | |
| | $ | 8,749,155 | | | $ | 3,297,584 | | | $ | 12,046,739 | |
| | | | | | |
| | Longleaf Partners Funds | | ◾ | | 49 |
| | |
| |
Notes to Financial Statements | | |
| | | | | | | | | | | | |
| | | Impact of Derivatives on Statements of Operations | |
| | | By Derivative Type | |
| | | Equity | | | Currency | | | Total | |
| | | Global Fund | |
Net realized loss: | | | | | | | | | | | | |
Non-affiliated securities (Options purchased) | | $ | (1,389,131 | ) | | $ | — | | | $ | (1,389,131 | ) |
Options written | | | (3,703,630 | ) | | | — | | | | (3,703,630 | ) |
| | | (5,092,761 | ) | | | — | | | | (5,092,761 | ) |
Change in unrealized appreciation (depreciation): | | | | | | | | | | | | |
Non-affiliated securities (Options purchased) | | | 1,355,471 | | | | (53,689 | ) | | | 1,301,782 | |
Options written | | | 2,712,478 | | | | — | | | | 2,712,478 | |
Forward currency contracts | | | — | | | | 215,528 | | | | 215,528 | |
| | $ | 4,067,949 | | | $ | 161,839 | | | $ | 4,229,788 | |
For the period ended December 31, 2016, the average monthly notional value of derivatives activities were as follows:
| | | | | | | | | | | | | | | | |
| | | Options Purchased | | | Options Written | | | Swap Contracts | | | Forward Currency Contracts | |
Partners Fund | | $ | 85,732,270 | | | $ | 29,065,603 | | | $ | — | | | $ | — | |
Small-Cap Fund | | | 221,818,913 | | | | 32,608,833 | | | | — | | | | — | |
International Fund | | | 207,323,218 | | | | — | | | | 35,787,578 | | | | 52,853,245 | |
Global Fund | | | 13,543,370 | | | | 121,080 | | | | — | | | | 791,667 | |
The Funds may invest in certain securities or engage in other transactions where the Funds are exposed to counterparty credit risk in addition to broader market risks. The Funds may face increased risk of loss in the event of default or bankruptcy by the counterparty or if the counterparty otherwise fails to meet its contractual obligations. The Funds’ investment manager attempts to mitigate counterparty risk by (i) periodically assessing the creditworthiness of its trading partners, (ii) monitoring and/or limiting the amount of its net exposure to each individual counterparty based on its assessment and (iii) requiring collateral from the counterparty for certain transactions. Market events and changes in overall economic conditions may impact the assessment of such counterparty risk by the investment manager. In addition, declines in the values of underlying collateral received may expose the Funds to increased risk of loss.
The Funds have entered into master agreements with its derivative counterparties that provide for general obligations, representations, agreements, collateral, events of default or termination and credit related contingent features. The credit related contingent features include, but are not limited to, a percentage decrease in the Fund’s net assets or NAV over a specified period of time. If these credit related contingent features were triggered, the derivatives counterparty could terminate the positions and demand payment or require additional collateral.
| | | | | | |
| | Longleaf Partners Funds | | ◾ | | 50 |
| | |
| |
Notes to Financial Statements | | |
The following table presents derivatives that are subject to a master netting agreement and the related collateral amounts at December 31, 2016.
| | | | | | | | | | | | | | | | |
| | | Gross Value on Statement of Assets and Liabilities | | | Collateral Pledged (Received) | | | | |
| Financial Instrument(1) | | Asset | | | Liability | | | By Fund(2) | | | Net Amount | |
Partners Fund | | | | | | | | | | | | | | | | |
Options Purchased | | $ | 2,686,000 | | | | $ — | | | $ | (2,686,000 | ) | | | $ — | |
Small-Cap Fund | | | | | | | | | | | | | | | | |
Options Purchased | | | 548,709 | | | | — | | | | (548,709 | ) | | | — | |
International Fund | | | | | | | | | | | | | | | | |
Options Purchased | | | 601,237 | | | | — | | | | (601,237 | ) | | | — | |
Global Fund | | | | | | | | | | | | | | | | |
Options Purchased | | | 38,925 | | | | — | | | | (34,375 | ) | | | 4,550 | |
| (1) | Subject to a master netting or similar arrangement with BNP Paribas. |
| (2) | The amount pledged(received) may be greater than the amount shown due to overcollateralization. |
Note 9. Federal Income Taxes
Required fund distributions are based on income and capital gain amounts determined in accordance with federal income tax regulations, which differ from net investment income and realized gains recognized for financial reporting purposes. Accordingly, the character of distributions and composition of net assets for tax purposes differ from those reflected in the accompanying financial statements.
The tax character of distributions paid was as follows:
| | | | | | | | | | | | | | | | |
| | | Year Ended December 31, 2016 | |
| | | Partners Fund | | | Small-Cap Fund | | | International Fund | | | Global Fund | |
Long-term capital gains | | $ | 73,149,595 | | | $ | 618,884,164 | | | $ | — | | | $ | — | |
Ordinary income | | | 347,694 | | | | 26,823,024 | | | | 23,296,482 | | | | 924,728 | |
| | $ | 73,497,289 | | | $ | 645,707,188 | | | $ | 23,296,482 | | | $ | 924,728 | |
| |
| | | Year Ended December 31, 2015 | |
| | | Partners Fund | | | Small-Cap Fund | | | International Fund | | | Global Fund | |
Long-term capital gains | | $ | 593,842,301 | | | $ | 222,103,895 | | | $ | 28,818,091 | | | $ | — | |
Ordinary income | | | 51,209,473 | | | | — | | | | 4,100,981 | | | | 402,723 | |
| | $ | 645,051,774 | | | $ | 222,103,895 | | | $ | 32,919,072 | | | $ | 402,723 | |
| | | | | | |
| | Longleaf Partners Funds | | ◾ | | 51 |
| | |
| |
Notes to Financial Statements | | |
The tax-basis components of accumulated earnings (losses) at December 31, 2016 were as follows:
| | | | | | | | | | | | | | | | |
| | | Partners Fund | | | Small-Cap Fund | | | International Fund | | | Global Fund | |
Unrealized appreciation | | $ | 767,383,739 | | | $ | 673,320,105 | | | $ | 104,869,412 | | | $ | 24,793,670 | |
Unrealized depreciation | | | (219,059,572 | ) | | | (242,831,061 | ) | | | (116,268,336 | ) | | | (21,922,957 | ) |
Net unrealized appreciation (depreciation) | | | 548,324,167 | | | | 430,489,044 | | | | (11,398,924 | ) | | | 2,870,713 | |
Late-year losses deferred | | | — | | | | (22,429,583 | ) | | | — | | | | — | |
Capital loss carryforwards | | | (84,392,194 | ) | | | — | | | | (88,548,282 | ) | | | (104,835 | ) |
Undistributed ordinary income | | | 27,781,980 | | | | — | | | | 4,625,909 | | | | — | |
| | $ | 491,713,953 | | | $ | 408,059,461 | | | $ | (95,321,297 | ) | | $ | 2,765,878 | |
Capital loss carryforwards may be available to offset future realized capital gains and thereby reduce future capital gains distributions. The following table shows the amounts of capital loss carryforwards, if any, as of December 31, 2016.
| | | | | | | | | | | | | | | | |
| | | Partners Fund | | | Small-Cap Fund | | | International Fund | | | Global Fund | |
Short-term losses | | $ | (84,392,194 | ) | | $ | — | | | $ | (5,970,481 | ) | | $ | — | |
Long-term losses | | | — | | | | — | | | | (82,577,801 | ) | | | (104,835 | ) |
| | $ | (84,392,194 | ) | | $ | — | | | $ | (88,548,282 | ) | | $ | (104,835 | ) |
During the year ended December 31, 2016, the Global Fund utilized $13,249,557 of capital loss carryforwards.
The following permanent reclassifications were made between capital accounts to reflect the tax character of foreign currency transactions, preferred security sales and distributions. These reclassifications did not affect results of operations or net assets.
| | | | | | | | | | | | | | | | |
| | | Partners Fund | | | Small-Cap Fund | | | International Fund | | | Global Fund | |
Undistributed net investment income | | $ | (1,583,516 | ) | | $ | 4,648,410 | | | $ | 2,239,179 | | | $ | (41,740 | ) |
Accumulated net realized gain(loss) on investments and foreign currency | | | 1,583,516 | | | | (4,648,410 | ) | | | (2,239,177 | ) | | | 45,020 | |
Paid-in capital | | | — | | | | — | | | | (2 | ) | | | (3,280 | ) |
The Funds’ tax returns are subject to examination by the relevant tax authorities until expiration of the applicable statute of limitations, which is generally three years after filing of the tax return but could be longer in certain circumstances. Management has analyzed the Funds’ tax positions taken on federal income tax returns for all open tax years (tax years ended December 31, 2013-2016), and has concluded that no provision for federal income tax is required in the Funds’ financial statements.
Note 10. Subsequent Events
The Funds evaluated events from the date of the financial statements through the date the financial statements were issued. There were no subsequent events requiring recognition or disclosure.
| | | | | | |
| | Longleaf Partners Funds | | ◾ | | 52 |
The presentation is for a share outstanding throughout each period.
| | | | | | | | | | | | | | | | | | | | |
| Partners Fund | | | | | | | | | | | | | | | |
| | | Year Ended December 31, | |
| | | 2016 | | | 2015 | | | 2014 | | | 2013 | | | 2012 | |
Net Asset Value Beginning of Period | | $ | 21.45 | | | $ | 31.24 | | | $ | 33.75 | | | $ | 26.39 | | | $ | 26.65 | |
Net Investment Income (Loss) | | | 0.20 | (a) | | | 0.26 | (a) | | | 0.19 | (a) | | | 0.09 | | | | 0.31 | |
Net Realized and Unrealized Gain (Loss) | | | 4.24 | | | | (6.05 | ) | | | 1.53 | | | | 8.34 | | | | 3.95 | |
Total from Investment Operations | | | 4.44 | | | | (5.79 | ) | | | 1.72 | | | | 8.43 | | | | 4.26 | |
Dividends from Net Investment Income | | | — | (b) | | | (0.30 | ) | | | (0.20 | ) | | | (0.08 | ) | | | (0.27 | ) |
Distributions from Net Realized Capital Gains | | | (0.53 | ) | | | (3.70 | ) | | | (4.03 | ) | | | (0.99 | ) | | | (4.25 | ) |
Total Distributions | | | (0.53 | ) | | | (4.00 | ) | | | (4.23 | ) | | | (1.07 | ) | | | (4.52 | ) |
Net Asset Value End of Period | | $ | 25.36 | | | $ | 21.45 | | | $ | 31.24 | | | $ | 33.75 | | | $ | 26.39 | |
Total Return | | | 20.72 | % | | | (18.80 | )% | | | 4.92 | % | | | 32.12 | % | | | 16.53 | % |
Net Assets End of Period (thousands) | | $ | 3,448,288 | | | $ | 3,624,583 | | | $ | 7,547,608 | | | $ | 8,600,542 | | | $ | 7,695,310 | |
Ratio of Expenses to Average Net Assets | | | 0.95 | % | | | 0.93 | % | | | 0.91 | % | | | 0.92 | % | | | 0.91 | % |
Ratio of Net Investment Income to Average Net Assets | | | 0.84 | % | | | 0.92 | % | | | 0.57 | % | | | 0.25 | % | | | 0.90 | % |
Portfolio Turnover Rate | | | 17 | % | | | 46 | % | | | 30 | % | | | 23 | % | | | 26 | % |
| | | | | |
| Small-Cap Fund | | | | | | | | | | | | | | | |
| | | Year Ended December 31, | |
| | | 2016 | | | 2015 | | | 2014 | | | 2013 | | | 2012 | |
Net Asset Value Beginning of Period | | $ | 26.98 | | | $ | 30.42 | | | $ | 32.46 | | | $ | 28.88 | | | $ | 25.23 | |
Net Investment Income (Loss) | | | 0.07 | (a) | | | (0.01 | )(a) | | | (0.06 | )(a) | | | (0.08 | ) | | | 0.03 | |
Net Realized and Unrealized Gain (Loss) | | | 5.39 | | | | (1.83 | ) | | | 4.04 | | | | 8.62 | | | | 5.67 | |
Total from Investment Operations | | | 5.46 | | | | (1.84 | ) | | | 3.98 | | | | 8.54 | | | | 5.70 | |
Dividends from Net Investment Income | | | (0.10 | ) | | | — | | | | — | | | | — | | | | (0.03 | ) |
Distributions from Net Realized Capital Gains | | | (4.85 | ) | | | (1.60 | ) | | | (6.02 | ) | | | (4.96 | ) | | | (2.02 | ) |
Total Distributions | | | (4.95 | ) | | | (1.60 | ) | | | (6.02 | ) | | | (4.96 | ) | | | (2.05 | ) |
Net Asset Value End of Period | | $ | 27.49 | | | $ | 26.98 | | | $ | 30.42 | | | $ | 32.46 | | | $ | 28.88 | |
Total Return | | | 20.48 | % | | | (6.05 | )% | | | 12.49 | % | | | 30.45 | % | | | 22.96 | % |
Net Assets End of Period (thousands) | | $ | 3,995,661 | | | $ | 3,809,643 | | | $ | 4,383,882 | | | $ | 4,126,633 | | | $ | 3,384,800 | |
Ratio of Expenses to Average Net Assets | | | 0.91 | % | | | 0.91 | % | | | 0.91 | % | | | 0.91 | % | | | 0.92 | % |
Ratio of Net Investment Income (Loss) to Average Net Assets | | | 0.23 | % | | | (0.03 | )% | | | (0.17 | )% | | | (0.24 | )% | | | 0.07 | % |
Portfolio Turnover Rate | | | 31 | % | | | 46 | % | | | 51 | % | | | 20 | % | | | 15 | % |
| (a) | Computed using average shares outstanding throughout the period. |
| (b) | Rounds to less than $0.01. |
| | | | | | |
| | Longleaf Partners Funds | | ◾ | | 53 |
| | | | | | | | | | | | | | | | | | | | |
| International Fund | | | | | | | | | | | | | | | |
| | | Year Ended December 31, | |
| | | 2016 | | | 2015 | | | 2014 | | | 2013 | | | 2012 | |
Net Asset Value Beginning of Period | | $ | 12.35 | | | $ | 13.80 | | | $ | 17.94 | | | $ | 14.04 | | | $ | 11.90 | |
Net Investment Income (Loss) | | | 0.11 | (a) | | | 0.22 | (a) | | | 0.53 | (a) | | | 0.06 | | | | 0.26 | |
Net Realized and Unrealized Gain (Loss) | | | 1.39 | | | | (1.30 | ) | | | (3.12 | ) | | | 3.89 | | | | 2.25 | |
Total from Investment Operations | | | 1.50 | | | | (1.08 | ) | | | (2.59 | ) | | | 3.95 | | | | 2.51 | |
Dividends from Net Investment Income | | | (0.32 | ) | | | (0.23 | ) | | | (0.54 | ) | | | (0.05 | ) | | | (0.24 | ) |
Distributions from Net Realized Capital Gains | | | — | | | | (0.14 | ) | | | (1.01 | ) | | | — | | | | (0.13 | ) |
Total Distributions | | | (0.32 | ) | | | (0.37 | ) | | | (1.55 | ) | | | (0.05 | ) | | | (0.37 | ) |
Net Asset Value End of Period | | $ | 13.53 | | | $ | 12.35 | | | $ | 13.80 | | | $ | 17.94 | | | $ | 14.04 | |
Total Return | | | 12.20 | % | | | (7.91 | )% | | | (14.76 | )% | | | 28.14 | % | | | 21.23 | % |
Net Assets End of Period (thousands) | | $ | 988,743 | | | $ | 1,116,983 | | | $ | 1,459,608 | | | $ | 1,827,767 | | | $ | 1,504,040 | |
Ratio of Expenses to Average Net Assets | | | 1.33 | % | | | 1.28 | % | | | 1.25 | % | | | 1.27 | % | | | 1.29 | % |
Ratio of Net Investment Income to Average Net Assets | | | 0.88 | % | | | 1.61 | % | | | 3.06 | % | | | 0.36 | % | | | 1.82 | % |
Portfolio Turnover Rate | | | 21 | % | | | 53 | % | | | 54 | % | | | 36 | % | | | 23 | % |
| | | | | | | | | | | | | | | | | | | | |
| | | | | |
| Global Fund | | | | | | | | | | | | | | | |
| | | Year Ended December 31, | | | Inception December 27, 2012 to | |
| | | 2016 | | | 2015 | | | 2014 | | | 2013 | | | December 31, 2012 | |
Net Asset Value Beginning of Period | | $ | 9.98 | | | $ | 11.60 | | | $ | 12.84 | | | $ | 10.00 | | | | $10.00 | |
Net Investment Income (Loss) | | | 0.06 | (a) | | | 0.03 | (a) | | | 0.09 | (a) | | | (0.03 | ) | | | — | |
Net Realized and Unrealized Gain (Loss) | | | 1.98 | | | | (1.63 | ) | | | (0.84 | ) | | | 2.87 | | | | — | |
Total from Investment Operations | | | 2.04 | | | | (1.60 | ) | | | (0.75 | ) | | | 2.84 | | | | — | |
Dividends from Net Investment Income | | | (0.06 | ) | | | (0.02 | ) | | | (0.08 | ) | | | — | | | | — | |
Distributions from Net Realized Capital Gains | | | — | | | | — | | | | (0.41 | ) | | | — | | | | — | |
Total Distributions | | | (0.06 | ) | | | (0.02 | ) | | | (0.49 | ) | | | — | | | | — | |
Net Asset Value End of Period | | $ | 11.96 | | | $ | 9.98 | | | $ | 11.60 | | | $ | 12.84 | | | | $10.00 | |
Total Return | | | 20.43 | % | | | (13.76 | )% | | | (5.98 | )% | | | 28.40 | % | | | — | |
Net Assets End of Period (thousands) | | $ | 187,584 | | | $ | 167,465 | | | $ | 164,372 | | | $ | 113,476 | | | | $ 10 | |
Ratio of Expenses to Average Net Assets(b) | | | 1.32 | % | | | 1.54 | % | | | 1.58 | % | | | 1.65 | % | | | 1.65% | |
Ratio of Net Investment Income (Loss) to Average Net Assets | | | 0.54 | % | | | 0.30 | % | | | 0.70 | % | | | (0.55 | )% | | | — | |
Portfolio Turnover Rate | | | 33 | % | | | 58 | % | | | 40 | % | | | 4 | % | | | — | |
| (a) | Computed using average shares outstanding throughout the period. |
| (b) | Expenses presented net of fee waiver, the expense ratio before waiver for the periods ended December 31, 2016, 2013 and 2012 were 1.52%, 1.73% and 96.24%, respectively. |
| | | | | | |
| | Longleaf Partners Funds | | ◾ | | 54 |
|
|
Report of Independent Registered Public Accounting Firm |
To the Board of Trustees of Longleaf Partners Funds Trust and Shareholders of Longleaf Partners Fund, Longleaf Partners Small-Cap Fund, Longleaf Partners International Fund, and Longleaf Partners Global Fund:
In our opinion, the accompanying statements of assets and liabilities, including the portfolios of investments, and the related statements of operations and of changes in net assets and the financial highlights present fairly, in all material respects, the financial position of Longleaf Partners Fund, Longleaf Partners Small-Cap Fund, Longleaf Partners International Fund, and Longleaf Partners Global Fund (four of the funds comprising Longleaf Partners Funds Trust, the “Funds”) at December 31, 2016, the results of each of their operations, the changes in each of their net assets and the financial highlights for each of the periods presented, in conformity with accounting principles generally accepted in the United States of America. These financial statements and financial highlights (hereafter referred to as “financial statements”) are the responsibility of the Funds’ management. Our responsibility is to express an opinion on these financial statements based on our audits. We conducted our audits of these financial statements in accordance with the standards of the Public Company Accounting Oversight Board (United States). Those standards require that we plan and perform the audit to obtain reasonable assurance about whether the financial statements are free of material misstatement. An audit includes examining, on a test basis, evidence supporting the amounts and disclosures in the financial statements, assessing the accounting principles used and significant estimates made by management, and evaluating the overall financial statement presentation. We believe that our audits, which included confirmation of securities at December 31, 2016 by correspondence with the custodian and brokers, provide a reasonable basis for our opinion.
PricewaterhouseCoopers LLP
Baltimore, Maryland
February 15, 2017
| | | | | | |
| | Longleaf Partners Funds | | ◾ | | 55 |
|
|
Statement Regarding Basis for Approval of Investment Advisory Contracts |
Longleaf Partners Fund, Longleaf Partners Small-Cap Fund, Longleaf Partners International Fund, and Longleaf Partners Global Fund (the “Funds”) are non-diversified and each is a series of Longleaf Partners Funds Trust, a Massachusetts business trust which is an open-end management investment company registered with the US Securities and Exchange Commission. Southeastern Asset Management, Inc. (“Southeastern”) acts as investment counsel and fund administrator under agreements with each Fund (the “Agreements”). Trustees for each Fund, including Trustees who are not “interested persons” of the Funds as that term is defined under the Investment Company Act of 1940, as amended (the “Independent Trustees”), are responsible for overseeing the performance of Southeastern and meet annually to review information specific to each Fund to determine whether or not the Agreements with Southeastern ought to be approved.
On September 8, 2016, Trustees for each Fund met to determine whether the Agreements with Southeastern should be approved for the period November 1, 2016 to October 31, 2017. In advance of the meeting, the Independent Trustees reviewed materials relating to the existing Agreements, including an independent expense and performance summary prepared by Lipper Inc. The Lipper materials included comparisons of each Fund with other funds in a comparable Lipper universe, as well as additional funds selected for comparison by the Independent Trustees. Trustees reviewed this comparative Lipper data regarding management and non-management fees and expenses, portfolio turnover, brokerage commissions, investment performance and long-term performance in light of total fund expenses (the “Lipper Data”). Other materials reviewed included information concerning the nature, extent and quality of Southeastern’s services, Southeastern’s profitability and financial results, including advisory fee revenue and separate account advisory fee schedules, and whether economies of scale are, or would be, shared with Fund investors as assets under management increase. Based on the information reviewed, as well as information received throughout the year and first-hand interaction with Southeastern’s personnel, the Trustees for each Fund unanimously approved the selection of Southeastern as adviser and administrator, and the amounts to be paid by each Fund under Agreements with Southeastern.
Nature, Extent and Quality of Services Provided
While the investment performance of each Fund and Southeastern (discussed below) is relevant to an evaluation of the nature, extent and quality of services provided, the Trustees also considered Southeastern’s governing principles as significant. These principles are stated at the beginning of the Funds’ prospectus:
| • | | We will treat your investment as if it were our own. |
| • | | We will remain significant investors in Longleaf Partners Funds. |
| • | | We will invest for the long-term, while striving to maximize returns and minimize business, financial, purchasing power, regulatory and market risks. |
| • | | We will choose each equity investment based on its discount from our appraisal of corporate intrinsic value, its financial strength, its management, its competitive position, and our assessment of its future earnings potential. |
| • | | We will focus our assets in our best ideas. |
| • | | We will not impose loads or 12b-l charges on mutual fund shareholders. |
| • | | We will consider closing to new investors if closing would benefit existing clients. |
| • | | We will discourage short-term speculators and market timers. |
| • | | We will continue our efforts to enhance shareholder services. |
| • | | We will communicate with our investment partners as candidly as possible. |
The Trustees concluded that Southeastern had operated each Fund under these governing principles, and that Longleaf shareholders had benefited from Southeastern’s execution of its investment discipline over the long term, as well as its shareholder oriented approach. Southeastern’s actions on behalf of shareholders have gone beyond stock selection and included active engagement with portfolio companies when necessary and involvement in the market structure debate. The Trustees looked favorably on Southeastern’s
| | | | | | |
| | Longleaf Partners Funds | | ◾ | | 56 |
|
|
Statement Regarding Basis for Approval of Investment Advisory Contracts |
Code of Ethics requirement that employees use funds advised by Southeastern for virtually all public equity investing. The Trustees noted that, as one of the largest Longeleaf shareholder groups, Southeastern and its affiliates’ interests are aligned with other shareholders. In addition, significant investment by Southeastern’s personnel has contributed to the economies of scale which have lowered fees and expenses for shareholders over time.
The Trustees recognized Southeastern’s consistent implementation of the governing principles, noting that Southeastern and the Funds had received recognition in the press, and among industry observers and participants, for the quality of its investment process, as well as its shareholder orientation and integrity. The Trustees expressed confidence in the research, analysis, knowledge and over 40-years’ experience of Southeastern. The Trustees concluded that shareholders buy the Funds primarily to gain access to Southeastern’s investment expertise and shareholder orientation, and weighed this heavily in approving the Agreements.
Trustees concluded that Southeastern’s administrative services, including fund accounting, legal, trading, shareholder reporting, compliance and oversight of Fund operations, had been high quality, and favored approving Southeastern for another year. Trustees concluded that Southeastern had been open, responsive, timely and cooperative in providing information required to oversee the Funds.
Comparative Investment Performance of the Funds and Adviser
Using the Lipper Data, the Trustees compared each Fund through periods ended June 30, 2016 to other similar funds, as well as the following objective benchmarks: inflation plus 10%, and each Fund’s market index plus 200 basis points. The Partners Fund exceeded inflation plus 10% in the short term as well as the S&P 500’s return for the long term, but not by 200 basis points. The Small-Cap Fund exceeded inflation plus 10% for shorter periods and the Russell 2000’s return plus 200 basis points for the long term. The International Fund exceeded inflation plus 10% in the short term, as well as EAFE plus 200 basis points for the long term. The Global Fund lagged inflation plus 10% and MSCI World plus 200 basis points for all periods. As of August 31, 2016, each of the four Funds had made material progress versus their indexes for the year to date. Southeastern discussed its approach of intelligent, concentrated, engaged, long-term, partnership investing and its confidence in delivering long-term performance clients expect.
The Trustees also reviewed after-tax performance information for each Fund and noted that taxable shareholders were benefited by Southeastern’s long-term, low turnover, tax efficient management style as compared to funds with more frequent trading.
The Costs of the Services to be Provided and Profits to be Realized by the Investment Adviser and its Affiliates from the Relationship with the Fund
The Trustees considered each Fund’s management fee rates and expense ratios relative to industry averages, advisory fees charged to Southeastern’s private account clients and similar funds selected by Lipper and the Independent Trustees.
While Southeastern’s management fees for each Fund were above average, non- management expenses (except for the Global Fund) were below average, due in part to Southeastern’s performance and/or oversight of various operating functions. While the Trustees considered these fees separately, they viewed total expenses borne by shareholders as more important. In addition, the Trustees weighed favorably the fact that Southeastern had foregone additional fee income by closing each Fund to protect shareholder interests. The Trustees noted that Longleaf Partners Fund had been closed from July 2004 to January 2008, Longleaf Partners International Fund had been closed from February 2004 to July 2006, Longleaf Partners Small-Cap Fund had been closed since July 1997, and Longleaf Partners Global Fund had been closed briefly from January 28, 2013 to April 16, 2013. The Trustees also recognized that Southeastern does not have an affiliated entity providing transfer agent, custodian, broker dealer services other than investment management and fund administration. Accordingly, Southeastern neither generates additional fees for itself through related entities, nor allocates Fund brokerage to pay its expenses. The transparency of Southeastern’s fees and lack of supplemental sources of revenue was a significant factor to the Trustees.
In light of the qualifications, experience, reputation, and performance of Southeastern with respect to each Fund, as well as the steps taken to limit or reduce receipt of fees over time, the Trustees concluded that fee rates paid to Southeastern by each Fund are at an acceptable level.
The Trustees compared the fees paid to Southeastern by the Funds with those paid by Southeastern’s private account clients. To the extent private account fees were lower than Fund fees, the Trustees concluded that the range of services provided to the Funds is more
| | | | | | |
| | Longleaf Partners Funds | | ◾ | | 57 |
|
|
Statement Regarding Basis for Approval of Investment Advisory Contracts |
extensive and the risks associated with operating SEC registered, publicly traded mutual funds are greater. Funds are more work because of the complex overlay of regulatory, tax and accounting issues which are unique to mutual funds. In addition, the work required to service shareholders is more extensive because of the significantly greater number and managing trading is more complex because of more frequent fund flows, as well as IRS diversification compliance. With respect to risk, not only has regulation become more complex and burdensome, but the scrutiny of regulators and shareholders has gotten more intense. The Trustees concluded that reasonable justifications exist to the extent that there are differences in fee rates between the two lines of business.
The Trustees reviewed reports of Southeastern’s financial position, including overall revenues and expenses of the firm, as well as an Investment Manager Profitability Analysis prepared by Lipper Inc. While the Trustees considered the profitability of Southeastern as a whole, and jointly determined with Southeastern a method to allocate costs between mutual fund and private account activities, they did not evaluate on a Fund-by-Fund basis Southeastern’s profitability and/or costs. Because no generally accepted cost allocation methodology exists, and estimating the cost of providing services on a Fund specific basis is difficult, Southeastern provided its complete financial statements to the Trustees and stipulated conservatively for renewal purposes that its operation of each Fund should be considered highly profitable, at least as profitable as, if not more profitable than, investment managers with similar assets under management. The Trustees concluded that significant profits were not unreasonable given Southeastern’s successful investment management and strong shareholder orientation, as well as steps it had taken to limit or reduce its fees over time. As between the Funds and private account business, the Trustees acknowledged that cost allocation methods were not precise, but felt profits derived with respect to the Funds were acceptable in light of all the facts and circumstances. The Trustees also gave significant weight to the preferences and expectations of individual Fund shareholders and their relative sophistication, noting that the level of assets under management (despite closing, no sales force, or 12b-l plan) is a direct result of Southeastern’s successful asset management and strong shareholder orientation. Similarly, if a shareholder wants to redeem, he or she is not constrained by the thought of having to pay a redemption fee or to recoup a front-end load. Thus, in assessing whether the costs of Southeastern’s services and its resulting profits are acceptable, the Trustees considered it meaningful that the Funds’ asset base consists of shareholders who have freely chosen to retain access to Southeastern’s services, with full disclosure of advisory fee rates.
The Extent to which Economies of Scale would be Realized as each Fund Grows, and whether Current Fee Levels Reflect these Economies of Scale for the Benefit of Fund Investors
Because Southeastern’s fee structure for each Fund contains a breakpoint, economies of scale will be realized as each Fund grows. The Trustees noted that Southeastern bore costs in excess of each Fund’s expense limitation in early years, and that total expenses of each Fund have declined as a percentage of assets over time. Because fee levels for Longleaf Partners Fund and Longleaf Partners Small-Cap Fund currently reflected a greater sharing of economies of scale than the fee for Longleaf Partners International Fund, and in order to reward the loyalty of International Fund shareholders, Southeastern recommended a reduction in that Fund’s breakpoint from $2.5 billion to $500 million in 2011. The higher breakpoint had been set in expectation that the International Fund could become as large as the Partners Fund. While it could still become that large in time, Southeastern was mindful that at current asset levels, shareholders did not benefit from the breakpoint. With this in mind, the breakpoint for the Global Fund was set at the same $500 million level. In addition, effective May 1, 2016, Southeastern agreed to voluntarily reduce the Global Fund’s expense limit to 1.20% (a voluntary fee waiver which may be discontinued at any time). Accordingly, the Trustees were satisfied that breakpoints and expense limits for each Fund were set at appropriate levels, and economies of scale would be shared sufficiently with Fund shareholders.
Conclusion
While the material factors that the Trustees considered are summarized above, each individual Trustee considered and weighed in the aggregate all information prior to making a renewal decision. All Trustees, including the Independent Trustees, concluded that Southeastern’s fee structure was acceptable in light of the nature and quality of services provided, and that approval of the Investment Counsel and Fund Administration Agreements was in the best interest of each Fund and its shareholders.
| | | | | | |
| | Longleaf Partners Funds | | ◾ | | 58 |
Shareholders of mutual funds may incur two types of costs: (1) ongoing costs, including management fees, transfer agent fees, and other fund expenses; and (2) transaction costs, including sale charges (loads) and redemption fees. Longleaf does not charge transaction fees of any sort.
The following examples are intended to show the ongoing costs (in dollars) of investing in the Longleaf Partners Funds and to enable you to compare the costs of investing in other mutual funds. Each example is based on an investment of $1,000 made at June 30, 2016 and held through December 31, 2016.
Actual Expenses
The table below provides information about actual account values and actual expenses using each Fund’s actual return for the period. To estimate the expenses that you paid over the period, divide your account balance by $1,000 (for example, a $12,500 account balance divided by $1,000 = 12.5), then multiply the result by the number in the third line entitled “Expenses Paid During Period.”
Hypothetical Example for Comparison Purposes
The table below also provides information about hypothetical account values and expenses based on each Fund’s actual expense ratio and assumed returns of 5% per year before expenses, which are not the Funds’ actual returns. Do not use the hypothetical data below to estimate your ending account balance or expenses you paid. This information serves only to compare the ongoing costs of investing in Longleaf with other mutual funds. To do so, examine this 5% hypothetical example against the 5% hypothetical examples found in other funds’ shareholder reports.
The expenses shown in the table highlight only ongoing costs and do not reflect transactional costs that may be charged by other funds. Therefore, the table does not reveal the total relative costs of owning different funds. Since Longleaf does not charge transactions fees, you should evaluate other funds’ transaction costs to assess the total cost of ownership for comparison purposes.
| | | | | | | | | | | | | | | | | | |
| | | | | | | Actual | | | | Hypothetical (5% return before expenses) | | | | |
| | | Beginning account value 6/30/16 | | | | Ending account value 12/31/16 | | Expenses paid during period* | | | | Ending account value 12/31/16 | | Expenses paid during period* | | | | Annualized expense ratio |
Partners Fund | | $1,000.00 | | | | $1,133.30 | | $5.09 | | | | $1,020.36 | | $4.82 | | | | 0.95% |
Small-Cap Fund | | 1,000.00 | | | | 1,093.70 | | 4.79 | | | | 1,020.56 | | 4.62 | | | | 0.91 |
International Fund | | 1,000.00 | | | | 1,122.00 | | 7.15 | | | | 1,018.40 | | 6.80 | | | | 1.34 |
Global Fund | | 1,000.00 | | | | 1,195.90 | | 6.62 | | | | 1,019.10 | | 6.09 | | | | 1.20 |
| * | Expenses are equal to each Fund’s annualized expense ratio, multiplied by the average account value over the period, multiplied by the number of days in the most recent fiscal half year (184) divided by 366 days in the current year. |
| | | | | | |
| | Longleaf Partners Funds | | ◾ | | 59 |
| | |
| |
Information on Boards of Trustees | | |
Each Fund is served by a separate Board of Trustees composed of eight members. The membership of each Board is the same. There is no stated term of service, and Trustees continue to serve after election until resignation. All Trustees presently serving except for Rex M. Deloach were elected or re-elected at a meeting of shareholders held on September 19, 2001 in Boston, Massachusetts.
| | | | | | | | | | | | |
Name, Age And Address | | Positions Held With Funds | | Length of Service as Trustee (Year Began) | | Principal Occupations During Past 5 Years | | Number of Portfolios Overseen | | Other Directorships |
| Affiliated or Interested Trustees* |
O. Mason Hawkins, CFA, (68) 6410 Poplar Ave., Suite 900 Memphis, TN 38119 | | Co-Portfolio Manager | | Partners Fund Small-Cap Fund International Fund Global Fund | | 1987 1987 1998 2012 | | Chairman of the Board and Chief Executive Officer, Southeastern Asset Management, Inc. | | 4 | | |
Margaret H. Child (60) 137 Marlborough Street #3 Boston, MA 02116 | | Trustee | | Partners Fund Small-Cap Fund International Fund Global Fund | | 2001 2001 2001 2012 | | Marketing Consultant since 2005; Trustee and Vice-Chair, John F. Kennedy Library Foundation (2004-Present); Trustee, The Harvard Lampoon Trust (2010-Present); Trustee, Harris J. and Geraldine S. Nelson Foundation (2011-Present) | | 4 | | |
| Independent or Non-Interested Trustees |
Chadwick H. Carpenter, Jr. (66) 6410 Poplar Ave., Suite 900 Memphis, TN 38119 | | Trustee | | Partners Fund Small-Cap Fund International Fund Global Fund | | 1993 1993 1998 2012 | | Private Investor and Consultant since 1997; Senior Executive Officer, Progress Software Corp. (1983-97) | | 4 | | |
Daniel W. Connell, Jr. (68) 4016 Alcazar Avenue Jacksonville, FL 32207 | | Trustee | | Partners Fund Small-Cap Fund International Fund Global Fund | | 1997 1997 1998 2012 | | Private Investor since 2006; President and CEO, Twilight Ventures, LLC (investment holding company) (2004-2006); Senior Vice President- Marketing, Jacksonville Jaguars (NFL franchise) (1994-2004) | | 4 | | |
Rex M. Deloach (79) 4033 Spring Island Okatie, SC 29909 | | Trustee | | Partners Fund Small-Cap Fund International Fund Global Fund | | 2003 2003 2003 2012 | | President, Financial Insights, LLC (financial consulting and litigation support) since 2002; Vice President, The Oxford Company (private land and timber, investments) (1994-2012) | | 4 | | |
| | | | | | |
| | Longleaf Partners Funds | | ◾ | | 60 |
| | |
| |
Information on Boards of Trustees | | |
| | | | | | | | | | | | |
Name, Age And Address | | Positions Held With Funds | | Length of Service as Trustee (Year Began) | | Principal Occupations During Past 5 Years | | Number of Portfolios Overseen | | Other Directorships |
Steven N. Melnyk (69) 5015 Pirates Cove Road Jacksonville, FL 32210 | | Trustee | | Partners Fund Small-Cap Fund International Fund Global Fund | | 1991 1991 1998 2012 | | Senior Vice President, Stephens, Inc. (financial services) since 2009; Real Estate Development, The Sea Island Company, (2005-2009); Private Investor and Consultant since 1997; Golf Commentator, ABC Sports (1991-2004); President, Riverside Golf Group, Inc. (since 1989) | | 4 | | |
C. Barham Ray (70) 6410 Poplar Ave., Suite 900 Memphis, TN 38119 | | Trustee | | Partners Fund Small-Cap Fund International Fund Global Fund | | 1992 1992 1998 2012 | | Private Investor and Consultant since 2008; Partner, 360 Goodwyn LLC (real estate development) (2005-2013) | | 4 | | Director, Financial Federal Savings Bank, Memphis, TN |
Perry C. Steger (54) 1978 South Austin Avenue Georgetown, TX 78626 | | Chairman of the Board | | Partners Fund Small-Cap Fund International Fund Global Fund | | 2001 2001 2001 2012 | | President, Steger & Bizzell Engineering, Inc. (engineering firm) since 2003; Director of Product Strategy, National Instruments, Inc. (1996-2003) | | 4 | | |
| * | Mr. Hawkins is a director and officer of Southeastern Asset Management, Inc. and as such is classified as an “interested” Trustee. Ms. Child is not affiliated with Southeastern, but performs certain administration and operational functions for the Funds in Massachusetts, their state of organization, and could be deemed to be an “interested” Trustee. |
| | | | | | |
| | Longleaf Partners Funds | | ◾ | | 61 |
The following additional information may be obtained for free by calling (800) 445-9469, visiting longleafpartners.com, or on the SEC’s website at sec.gov.
Proxy Voting Policies and Procedures
A description of Longleaf’s Proxy Voting Policies and Procedures is included in the Statement of Additional Information (SAI).
Proxy Voting Record
Information regarding how the Funds voted proxies relating to portfolio securities during the most recent 12-month period ended June 30 is contained in Form N-PX.
Quarterly Portfolio Holdings
Longleaf provides a complete list of its holdings four times each year, as of the end of each quarter. The Fund files the lists with
the Securities and Exchange Commission (SEC) on Form N-CSR (second and fourth quarters) and Form N-Q (first and third quarters). Shareholders may view the Longleaf Funds’ Forms N-CSR and N-Q on the SEC’s website at www.sec.gov. Forms N-CSR and N-Q may also be reviewed and copied at the SEC’s Public Reference Room in Washington, DC. Information regarding the operations of the Public Reference Roommay be obtained by calling (202) 551-8090 (direct) or (800) 732-0330 (general SEC number). A list of the Longleaf Funds’ quarter-end holdings is also available at www.longleafpartners.com on or about 15 days following each quarter end and remains available on the until the list is updated in the subsequent quarter.
Fund Trustees
Additional information about Fund Trustees is included in the Statement of Additional Information (SAI).
| | | | | | |
| | Longleaf Partners Funds | | ◾ | | 62 |
Call (800) 445-9469
Fund Information
To request a printed Prospectus, Summary Prospectus (longleafpartners.com/mutual_fund_documents/ prospectus), Statement of Additional Information (including Longleaf’s Proxy Voting Policies and Procedures), financial report, application or other Fund information from 8:00 a.m. to 8:00 p.m. Eastern time, Monday through Friday.
Shareholder Inquiries
To request action on your existing account from 9:00 a.m. to 6:00 p.m. Eastern time, Monday through Friday.
Account Information
For automated account balance and transaction activity, 24 hours a day, seven days a week.
| | |
Correspondence | | |
| By regular mail: | | By express mail or overnight courier: |
| Longleaf Partners Funds | | Longleaf Partners Funds |
| P.O. Box 9694 | | c/o BNY Mellon |
| Providence, RI 02940-9694 | | 4400 Computer Drive |
| | Westborough, MA 01581 |
| | (800) 445-9469 |
| | | |
Published Daily Price Quotations
Below are the common references for searching printed or electronic media to find daily NAVs of the Funds.
| | | | | | | | |
| Abbreviation | | Symbol | | Cusip | | Transfer Agent Fund Number | | Status to New Investors |
| Partners | | LLPFX | | 543069108 | | 133 | | Open |
| Sm-Cap | | LLSCX | | 543069207 | | 134 | | Closed 7/31/97 |
| Intl | | LLINX | | 543069405 | | 136 | | Open |
| Global | | LLGLX | | 543069504 | | 137 | | Open |

Our Governing Principles
We will treat your investment as if it were our own.
We will remain significant investors in Longleaf Partners Funds.
We will invest for the long term, while striving to maximize returns and minimize business, financial, purchasing power, regulatory and market risks.
We will choose each equity investment based on its discount from our appraisal of corporate intrinsic value, its financial strength, its management, its competitive position, and our assessment of its future earnings potential.
We will focus our assets in our best ideas.
We will not impose loads or 12b-1 charges on mutual fund shareholders.
We will consider closing to new investors if closing would benefit existing clients.
We will discourage short-term speculators and market timers.
We will continue our efforts to enhance shareholder services.
We will communicate with our investment partners as candidly as possible.

On December 8, 2003, the Boards of Trustees of the Longleaf Partners Funds adopted a Code of Ethics applicable to officers of Southeastern Asset Management, Inc. performing the principal executive function, the principal financial function, and the principal legal function for the Funds. This Code of Ethics, as amended, may be obtained without charge, upon request, by calling (901) 761-2474 and asking Southeastern’s General Counsel for a copy.
| Item 3. | Audit Committee Financial Expert. |
On December 8, 2003, the Independent Trustees of the Longleaf Partners Funds selected Rex M. Deloach to replace G. Staley Cates as Trustee, effective upon Mr. Cates resignation from the Boards December 31, 2003. Mr. Deloach is “independent” as defined by Item 3 of Form N-CSR, and serves as chairman of the Audit Committee. The Trustees have determined that Mr. Deloach meets the definition of “audit committee financial expert” as set forth in Item 3 of Form N-CSR.
In accordance with the SEC’s safe harbor rule for “audit committee financial experts,” no member designated as an audit committee financial expert shall (i) be deemed an “expert” for any other purpose or (ii) have any duty, obligation or liability that is greater than the duties, obligations and liabilities imposed on a member of the board or the audit committee not so designated. Additionally, the designation of a member or members as an “audit committee financial expert” shall in no way affect the duties, obligations or liabilities of any member of the audit committee, or the board, not so designated.
| Item 4. | Principal Accountant Fees and Services. |
| | | | | | | | |
| | | 2016 | | | 2015 | |
(a) Audit Fees | | $ | 213,735 | | | $ | 269,288 | |
(b) Audit Related Fees | | | — | | | | — | |
(c) Tax Fees* | | | 52,000 | | | | 73,888 | |
(d) All Other Fees | | | — | | | | — | |
* Includes amounts related to services for tax compliance, tax planning, and tax advice. The nature of these services specifically includes the review of distribution calculations and the preparation of Federal, state, and excise tax returns.
(e)(1) Audit Committee Pre-Approval Policies – Under Longleaf Partners Funds (the “Funds”) Audit Committee Charter, the Audit Committee must pre-approve all audit and non-audit services to be provided to the Funds and all non-audit services to be provided to Southeastern Asset Management, Inc., by the Funds’ principal accountant.
(e)(2) No percentage of the principal accountant’s fees or services were approved pursuant to the waiver provision of paragraph (c)(7)(i)(C) of Rule 2-01 of Regulation S-X.
(f) Not applicable.
(g) The aggregate non-audit fees for services to the registrant, its investment adviser and any entity controlling, controlled by, or under common control with the adviser that provides ongoing services to the registrant were $70,672 and $92,560 in 2016 and 2015, respectively.
(h) No services included in (b) through (d) above were approved pursuant to paragraph (c)(7)(ii) of Rule 2-01 of Regulation S-X.
| Item 5. | Audit Committee of Listed Registrants. |
Not applicable.
| Item 6. | Schedule of Investments. |
A complete schedule of investments for the period ended December 31, 2016 is included in the Annual Report filed under Item I of this form.
| Item 7. | Disclosure of Proxy Voting Policies and Procedures for Closed-End Management Investment Companies. |
Not applicable.
| Item 8. | Portfolio Managers of Closed-End Management Investment Companies. |
Not applicable.
| Item 9. | Purchases of Equity Securities by Closed-End Management Investment Company and Affiliated Purchasers. |
Not applicable.
| Item 10. | Submission of Matters to a Vote of Security Holders. |
The registrant does not currently have in place procedures by which shareholders may recommend nominees to the registrant’s board of directors.
| Item 11. | Controls and Procedures. |
The registrant’s principal executive officer and principal financial officer have concluded, based on their evaluation of the effectiveness of the design and operation of the registrant’s disclosure controls and procedures as of a date within 90 days of the filing date of this report on Form N-CSR, that the design and operation of such procedures are effective to provide reasonable assurance that information required to be disclosed by the investment company in the reports that it files or submits under the Securities Exchange Act of 1934 is recorded, processed, summarized, and reported within the time periods specified in the Commission’s rules and forms.
At the date of filing this Form N-CSR, the registrant’s principal executive officer and principal financial officer are aware of no changes in the registrant’s internal control over financial reporting during the most recent fiscal quarter of the period covered by this report (ie, the fourth quarter) that have materially affected, or are reasonably likely to materially affect, the registrant’s internal control over financial reporting.
Exhibit 99. CERT Certification Required by Item 12(a)(2) of Form N-CSR
Exhibit 99.906 CERT Certification Pursuant to Section 906 of the Sarbanes Oxley Act.
SIGNATURES
Pursuant to the requirements of the Securities Exchange Act of 1934 and the Investment Company Act of 1940, the registrant has duly caused this report to be signed on its behalf by the undersigned, thereunto duly authorized.
| | |
| Longleaf Partners Funds Trust |
| |
| By | | /s/ O. Mason Hawkins |
| | O. Mason Hawkins Trustee Longleaf Partners Funds Trust |
Date February 23, 2017
Pursuant to the requirements of the Securities Exchange Act of 1934 and the Investment Company Act of 1940, this report has been signed below by the following persons on behalf of the registrant and in the capacities and on the dates indicated.
| | |
| By | | /s/ O. Mason Hawkins |
| | O. Mason Hawkins Chairman and CEO, Southeastern Asset Management, Inc. Functioning as principal executive officer under agreements with Longleaf Partners Funds Trust and its separate series |
Date February 23, 2017
| | |
By | | /s/ Ryan S. Hocker |
| | Ryan S. Hocker Global Funds Treasurer, Southeastern Asset Management, Inc. Functioning as principal financial officer under agreements with Longleaf Partners Funds Trust and its separate series |
Date February 23, 2017
A signed original of this written statement has been provided to Longleaf Partners Funds Trust and will be retained by Longleaf Partners Funds Trust and furnished to the Securities and Exchange Commission or its staff upon request.