UNITED STATES
SECURITIES AND EXCHANGE COMMISSION
Washington, D.C. 20549
FORM N-CSR
CERTIFIED SHAREHOLDER REPORT OF REGISTERED
MANAGEMENT INVESTMENT COMPANIES
Investment Company Act file number: 811-4923
|
| Longleaf Partners Funds Trust |
(Exact name of registrant as specified in charter)
|
c/o Southeastern Asset Management, Inc. 6410 Poplar Avenue, Suite 900 Memphis, TN 38119 |
(Address of principal executive offices) (Zip code)
Andrew R. McCarroll, Esq.
|
Southeastern Asset Management, Inc. 6410 Poplar Ave., Suite 900 Memphis, TN 38119 |
(Name and address of agent for service)
Registrant’s telephone number, including area code: (901) 761-2474
Date of fiscal year end: December 31
Date of reporting period: December 31, 2018.
| Item 1. | Longleaf Partners Funds Annual Report at December 31, 2018. |
Annual Report
December 31, 2018
Partners Fund
Small-Cap Fund
International Fund
Global Fund
IMPORTANT NOTE: Beginning on January 1, 2021, as permitted by regulations adopted by the Securities and Exchange Commission, paper copies of the fund’s shareholder reports will no longer be sent by mail, unless you specifically request paper copies of the reports from the fund or from your financial intermediary, such as a broker-dealer or bank. Instead, the reports will be made available on a website, and you will be notified by mail each time a report is posted and provided with a website link to access the report.
If you already elected to receive shareholder reports electronically, you will not be affected by this change and you need not take any action. You may elect to receive shareholder reports and other communications electronically from the fund by calling (800) 445-9469, by written request to Longleaf Partners Funds, P.O. Box 9694, Providence, RI 02940-9694, or by contacting your financial intermediary.
You may elect to receive all future reports in paper free of charge. You can inform the fund that you wish to continue receiving paper copies of your shareholder reports by calling (800) 445-9469, by written request to Longleaf Partners Funds, P.O. Box 9694, Providence, RI 02940-9694, or by contacting your financial intermediary. Your election to receive reports in paper will apply to all funds held with the fund complex/your financial intermediary.
One of Southeastern's “Governing Principles” is that “we will communicate with our investment partners as candidly as possible,” because we believe Longleaf shareholders benefit from understanding our investment philosophy and approach. Our views and opinions regarding the investment prospects of our portfolio holdings and Funds are “forward looking statements” which may or may not be accurate over the long term. While we believe we have a reasonable basis for our appraisals, and we have confidence in our opinions, actual results may differ materially from those we anticipate. Information provided in this report should not be considered a recommendation to purchase or sell any particular security.
You can identify forward looking statements by words like “believe,” “expect,” “anticipate,” or similar expressions when discussing prospects for particular portfolio holdings and/or one of the Funds. We cannot assure future results and achievements. You should not place undue reliance on forward looking statements, which speak only as of the date of this report. We disclaim any obligation to update or alter any forward looking statements, whether as a result of new information, future events, or otherwise. Current performance may be lower or higher than the performance quoted herein. Past performance does not guarantee future results, fund prices fluctuate, and the value of an investment may be worth more or less than the purchase price.Call (800) 445-9469 or go to longleafpartners.com for current performance information and for the Prospectus and Summary Prospectus, both of which should be read carefully before investing to learn about fund investment objectives, risks and expenses. This material must be accompanied or preceded by a prospectus. Please read it carefully before investing.
The price-to-value ratio (“P/V”) is a calculation that compares the prices of the stocks in a portfolio to Southeastern's appraisals of their intrinsic values. P/V represents a single data point about a Fund, and should not be construed as something more. We caution our shareholders not to give this calculation undue weight. P/V alone tells nothing about:
| • | The quality of the businesses we own or the managements that run them; |
| • | The cash held in the portfolio and when that cash will be invested; |
| • | The range or distribution of individual P/V's that comprise the average; and |
| • | The sources of and changes in the P/V. |
When all of the above information is considered, the P/V is a useful tool to gauge the attractiveness of a Fund's potential opportunity. It does not, however, tell when that opportunity will be realized, nor does it guarantee that any particular company's price will ever reach its value. We remind our shareholders who want to find a single silver bullet of information that investments are rarely that simple. To the extent an investor considers P/V in assessing a Fund's return opportunity, the limits of this tool should be considered along with other factors relevant to each investor.
Unless otherwise noted, performance returns of Fund positions combine the underlying stock and bond securities including the effect of trading activity during the period.
Risks
The Longleaf Partners Funds are subject to stock market risk, meaning stocks in the Fund may fluctuate in response to developments at individual companies or due to general market and economic conditions. Also, because the Funds generally invest in 15 to 25 companies, share value could fluctuate more than if a greater number of securities were held. Mid-cap stocks held by the Funds may be more volatile than those of larger companies. With respect to the Small-Cap Fund, smaller company stocks may be more volatile with fewer financial resources than those of larger companies. With respect to the International and Global Funds, investing in non- U.S. securities may entail risk due to non-U.S. economic and political developments, exposure to non-U.S. currencies, and different accounting and financial standards. These risksmay be higher when investing in emerging markets. Diversification does not eliminate the risk of experiencing investment losses.
Derivatives may involve certain costs and risks such as liquidity, interest rate, market, credit, management, and the risk that a position could not be closed when most advantageous. Investing in derivatives could lose more than the amount invested.
Indexes
The S&P 500 Index is an index of 500 stocks chosen for market size, liquidity and industry grouping, among other factors. The S&P is designed to be a leading indicator of U.S. equities and is meant to reflect the risk/return characteristics of the large cap universe.
The S&P 500 Growth Index represents the companies of the S&P 500 Index that are considered to have growth characteristics (e.g., using earnings per share growth rate and sales per share growth rate).
The S&P 500 Value Index represents the companies of the S&P 500 Index that are considered to have value characteristics (e.g., using book value to price and earnings to price).
The Russell 2000 Index measures the performance of the 2,000 smallest companies in the Russell 3000 Index, which represents approximately 10% of the total market capitalization of the Russell 3000 Index.
MSCI EAFE Index (Europe, Australasia, Far East) is a broad based, unmanaged equity market index designed to measure the equity market performance of 22 developed markets, excluding the US & Canada.
MSCI World Index is a broad-based, unmanaged equity market index designed to measure the equity market performance of 24 developed markets, including the United States.
An index cannot be invested in directly.
Definitions
Aggregates are materials such as sand or gravel that are ingredients in concrete.
Brexit (“British exit”) refers to the June 23, 2016 referendum by British voters to leave the European Union.
Capital Expenditure (capex) is the amount spent to acquire or upgrade productive assets in order to increase the capacity or efficiency of a company for more than one accounting period.
Discounted cash flow (DCF) is a valuation method used to estimate the attractiveness of an investment opportunity. DCF analysis uses future free cash flow projections and discounts them to arrive at a present value estimate, which is used to evaluate the potential for investment.
Earnings multiple, also called the price/earnings ratio, is the ratio of a company’s share price compared to its earnings per share.
Free Cash Flow (FCF) is a measure of a company’s ability to generate the cash flow necessary to maintain operations. Generally, it is calculated as operating cash flow minus capital expenditures.
IPO is an initial public offer.
Leverage refers to the use of debt. De-leverage refers to a decrease in debt.
“Margin of Safety” is a reference to the difference between a stock’s market price and Southeastern’s calculated appraisal value. It is not a guarantee of investment performance or returns.
Price / Earnings (P/E) is the ratio of a company’s share price compared to its earnings per share.
P/V (“price to value”) is a calculation that compares the prices of the stocks in a portfolio to Southeastern’s appraisal of their intrinsic values. The ratio represents a single data point about a Fund and should not be construed as something more. P/V does not guarantee future results, and we caution investors not to give this calculation undue weight.
Spot price is the current market price at which an asset, like a commodity, can be bought or sold for immediate delivery.
© 2018 Southeastern Asset Management, Inc. All Rights Reserved.
Longleaf, Longleaf Partners Funds and the pine cone logo are registered trademarks of Longleaf Partners Funds Trust.
Southeastern Asset Management, Inc. is a registered trademark.
Funds distributed by ALPS Distributors, Inc.
Performance Summary(Unaudited)
| Average Annual Returns for the Periods Ended December 31, 2018 |
| | 1 Year | 5 Year | 10 Year | 20 Year | Since
Inception |
Partners Fund
(Inception 4/8/87) | -17.98% | -0.52% | 10.19% | 5.55% | 9.54% |
| S&P 500 Index | -4.38 | 8.49 | 13.12 | 5.62 | 9.43 |
Small-Cap Fund
(Inception 2/21/89) | -6.52 | 5.34 | 14.49 | 9.32 | 10.38 |
| Russell 2000 Index | -11.01 | 4.41 | 11.97 | 7.40 | 9.03 |
International Fund
(Inception 10/26/98) | -7.08 | 0.33 | 5.83 | 6.69 | 7.09 |
| MSCI EAFE Index | -13.79 | 0.53 | 6.32 | 3.52 | 3.95 |
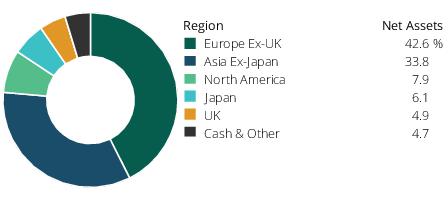
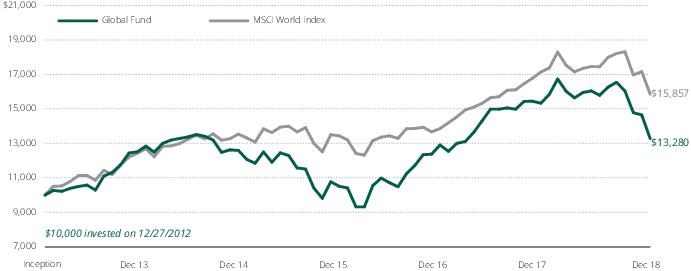
Global Fund
(Inception 12/27/12) | -16.16 | 0.68 | na | na | 4.83 |
| MSCI World Index | -8.71 | 4.56 | na | na | 7.98 |
The indices are unmanaged. During the inception year, the S&P 500 and the EAFE Index were available only at month-end; therefore the S&P 500 value at 3/31/87 and the EAFE value at 10/31/98 were used to calculate performance since inception. Returns reflect reinvested capital gains and dividends but not the deduction of taxes an investor would pay on distributions or share redemptions. Performance data quoted represents past performance; past performance does not guarantee future results. The investment return and principal value of an investment will fluctuate so that an investor's shares, when redeemed, may be worth more or less than their original cost. Current performance of a Fund may be lower or higher than the performance quoted. Performance data current to the most recent month end may be obtained by visiting longleafpartners.com.
As reported in the Prospectus dated May 1, 2018, the total expense ratios for the Partners Fund and Small-Cap Fund is 0.95% and 0.92%, respectively. The total expense ratio for the International Fund is 1.19% (gross) and 1.15% (net). This expense ratio is subject to fee waiver to the extent the fund's normal annual operating expenses exceed 1.15% of average annual net assets. The total expense ratio for the Global Fund is 1.48% (gross) and 1.20% (net). This expense ratio is subject to fee waiver to the extent normal annual operating expenses exceed 1.20% of average annual net assets.
Letter To Our Shareholders(Unaudited)
Widespread market declines hurt investors in public equities in 2018. As the year progressed, trade wars, U.S. interest rate increases, geopolitical unrest, fears of economic slowdowns in multiple countries, including China, and falling oil prices were among the primary headlines pressuring equity prices around the world. The U.S. significantly outperformed other regions in the first nine months of the year, particularly with the strengthening dollar, but the worldwide downturn in the fourth quarter most impacted the U.S. market. By the end of the year, broad indices around the world were in negative territory, but U.S. large caps outperformed once again, further increasing the value disparity in which the S&P 500 has almost tripled the EAFE Index over the last decade.1 Even so, 2018 was a big deviation from the 16 percent average annual returns for the S&P 500 that U.S. large cap investors had become accustomed to over the prior five years.
| | 2018 | 4Q |
| Partners Fund | -17.98% | -20.67% |
| S&P 500 Index | -4.38 | -13.52 |
| Small-Cap Fund | -6.52 | -15.55 |
| Russell 2000 Index | -11.01 | -20.20 |
| International Fund | -7.08 | -9.90 |
| MSCI EAFE Index | -13.79 | -12.54 |
| Global Fund | -16.16 | -17.22 |
| MSCI World Index | -8.71 | -13.42 |
Past performance does not guarantee future results.
110-Year cumulative return for S&P 500 was 243% and for MSCI EAFE was 85%. The S&P 500 outperformed the MSCI EAFE Index on an annual basis in seven out the past ten years.
The Longleaf Funds were not immune to the broad price declines. Strong stock performance at several portfolio companies was not enough to offset negative pressures, and all four Funds were down for the year. The International Fund and Small Cap Fund performed significantly better than their respective indices’ double-digit retreats, partially due to portfolio companies being acquired. The Partners and Global Funds underperformed the single-digit declines of their benchmarks, in part because of more exposure to stocks outside the U.S. The Funds continued to battle the longstanding challenges of passive inflows at the expense of active managers, growth outperforming value and U.S. stocks overshadowing those offshore. The biggest performance detractors were those companies that missed expectations and/or lowered guidance, which the market punished particularly severely in the fourth quarter. Among the causes for disappointments were revenues associated with emerging markets, particularly China, companies undergoing some type of corporate or industry structural change and industrial businesses. The commentary for each Fund provides a more robust discussion of specific performance drivers.
2018 results did not reflect the progress within our portfolios, where we put cash to work and repositioned into more heavily discounted and/or qualitatively attractive opportunities over the course of the year. Early in the year, we locked in gains at several investments that successfully reached our appraisals - Wynn, CONSOL Energy, Sonic and Forest City in the U.S. and Yum China overseas. In the second half, we sold additional non-U.S. winners, including Hikma, Ferrovial, Vocus and Televisa. We deployed cash on hand and proceeds from sales into new investment opportunities that emerged as world uncertainty increased and into existing holdings that became more discounted. We purchased five new companies in the Partners Fund, all of which are “recycled” businesses that we previously owned, five in Small-Cap (two recycles), four in Global (two recycles) and an unusually high thirteen in International (two recycles). We believe these new investments across the Funds add to the foundation for future compounding. Cash ended the year below 5% in Partners, International and Global, and down from 23% to under 9% in Small-Cap. Additionally, portfolio repositioning and value growth amid stock price declines helped the price-to-value (P/V) ratio move into the low-60s% for the International Fund and the 50s% for Partners, Small-Cap and Global, a somewhat rare level that has historically preceded strong returns.
Just as performance did not reflect portfolio enhancements, we believe the stock prices of most companies in the Funds did not indicate the positive progress that our companies and management partners made throughout the year. Stronger CEOs were secured at CenturyLink, GE, CNH and Mattel. Several businesses sold assets for attractive prices, including Allergan, Park Hotels, Kodak, Fairfax, CK Asset, CK Hutchison, EXOR, LafargeHolcim, United Technologies, Baidu and GE. United Technologies, Belmond, thyssenkrupp, Bharti Infratel and GE announced company breakup/simplification plans, while Forest City, Sonic and Belmond were acquired near our appraisal values. Importantly, the primary business segments at most of our core holdings grew – Enterprise at CenturyLink, Cable at Comcast, Search and YouTube at Alphabet, Retail at CK Hutchison, Barbie and Hot Wheels at Mattel, Broadcasting and Kaplan International at Graham Holdings, Botox at Allergan, Ground at FedEx, Core Search at Baidu, Agriculture at CNH, Bearings at MinebeaMitsumi, North American Cement at LafargeHolcim, Aviation and Healthcare at GE, Partner Re at EXOR, North American Fertilizer at OCI and Mass Gaming at Melco. As their stock prices became more
discounted, numerous companies we own repurchased shares, thereby increasing the remaining value per share. We believe growing free cash flow and earnings per share eventually should translate into stock prices that properly reflect value, whether by investor re-rating, much higher earnings than currently being delivered or corporate partners taking action to gain value recognition.
Choppy markets and the economic uncertainty that feeds them could last for a while. While many CEOs we talk to are optimistic about revenue growth, they are cautious about rising labor and materials costs on a local level and general increases in barriers to trade and geopolitical friction potentially impacting revenue and margins. We believe the best way to manage against investment risk is to know what we own very well and incorporate conservative-to-skeptical assumptions about the future. Investing in a limited number of companies, having a broad and deep research network and engaging with managements are critical advantages in providing the knowledge that may prevent permanent losses over the long term. In our process we always consider external challenges that could deteriorate competitive positions, such as technology, government regulation, higher tariffs and general geopolitical tensions. Most importantly, we have partnered with management teams who, in our view, can control their own destiny in terms of value realization, and we are working with boards and leaders at certain holdings to accelerate this realization.
We are neither pleased nor complacent about 2018 returns. As your largest co-investors in the Longleaf Funds, it is our view that the momentum style and passive investing that have dominated for the past decade are overdue for a reversal. We believe that the attractive P/V of our portfolios, combined with the underlying strength of the businesses we own and the management teams leading them, can generate strong absolute and relative results going forward and the payoff for 2018 company-level and portfolio-level progress is deferred but not lost.
Enhancing Communications with Clients
Our Governing Principles state that we will “continue our efforts to enhance client and shareholder services” and “communicate with our investment partners as candidly as possible.” To that end, we are adjusting our communications to provide the most relevant information in a timely and convenient manner. Going forward, we will continue to provide a quarterly commentary with detailed discussion of each Fund’s strategy, individual positions and performance each period. We will move our more general quarterly shareholder letter to a year-end review, providing an overview of the year that includes broader market, strategy and portfolio-wide observations.
In addition, we have launched The Price-to-Value Podcast, which is available on our website or wherever you download podcasts. We will produce monthly podcasts to discuss current topics that are top of mind for our clients. Please send any suggestions for topics to podcast@SEasset.com. For those who prefer to read, rather than listen, transcripts are available on our website.
Succession Planning
We have thought a great deal about and discussed Southeastern’s management succession and the firm’s future leadership for almost a decade. As part of our planning, we are pleased to announce that Ross Glotzbach transitioned from President to CEO of Southeastern, effective January 1, 2019. We have made this important decision now because we believe Ross is the right person to lead our company and because we have developed effective department leaders and officers in COO Steve Fracchia, CFO Jessica Pressgrove, CCO Mike Wittke, General Counsel Andy McCarroll, Head of Risk Management Jim Barton, Jr., Head of Client Relations Gwin Myerberg and Head of Trading Doug Schrank. This experienced team will allow Ross to focus on investing and continue leading our global research efforts.
Ross has been an important contributor to our investment process over the past fifteen years in his roles as an analyst, Co-PM on the Small-Cap Fund (since 2014) and Partners Fund (since 2017) and Head of Research (since 2016). Effective January 1, he also became a Co-PM on the Global Fund. Ross is greatly respected by all our associates, is a humble team builder, leads by asking wise questions and is quick to give credit to others, while immediately taking responsibility for challenges. Most importantly, we are confident that Ross will protect our partnership culture and improve the execution of our long-term, concentrated, engaged value investing disciplines.
We also believe it is important for Southeastern to remain independent, so we can continue to work for our clients without distraction and provide career opportunities for our team members. Ross is assuring the firm’s independence by buying a more significant stake in the company from Mason Hawkins, who remains the Chairman and largest shareholder. Vice-Chairman Staley Cates will remain the second largest owner of Southeastern.
These changes and the competency of our department heads will give Mason and Staley more time to do what they love for many years to come - read, think, discuss investment opportunities and engage with our corporate partners. Both continue to serve as Co-PMs on all four Longleaf Partners Funds and sit on Southeastern’s Executive Committee, along with Ross, Steve Fracchia and Josh Shores.
We encourage you to listen to the Price-to-Value Podcast Episode 5: Three Generations of Leadership (available on our website or wherever you listen to podcasts) for a more robust discussion with Mason, Staley and Ross about Southeastern’s leadership succession and outlook. It is rare for an investment firm to have three experienced generations of investment leaders actively engaged. Mason, Staley and Ross are committed to ensuring the next four-plus decades at Southeastern are as fruitful as our first 43 years. Our ownership and responsibility transitions enable Southeastern to remain independent. As the largest investors in the Longleaf Funds, it is our belief that the firm’s continuity and stability will enable us to deliver superior results, both in the near term and over decades.
Management Discussion(Unaudited)
Partners Fund
Longleaf Partners Fund declined -20.67% in the fourth quarter, taking its 2018 return to -17.98%. The S&P 500 Index fell -13.52% in the final three months and ended the year down -4.38%. Four primary challenges impacted the Fund’s absolute and relative returns in 2018. First, our investment in companies based outside of the U.S. hurt performance, even though many of them have significant U.S. segments. The strong dollar was a headwind, and U.S. stocks outperformed those based elsewhere, despite the large fourth quarter U.S. decline. Second, we were too early investing in several of the Fund’s more recent purchases. While we averaged into General Electric (GE), Mattel and Affiliated Managers Group (AMG), these stocks are currently trading well below our average costs. Third, we owned five companies externally categorized in the Industrials sector. These are diverse businesses with very different factors driving results, but they collectively impacted the Fund’s return as the Industrials sector was among the worst performing areas of the market. Fourth, the strong investor preference for momentum-driven growth stocks, where we have limited exposure, continued to negatively impact undervalued businesses’ prices.
We periodically experience a year where either our geographic or sector exposure penalizes returns, our newer investments hit bottom after initial purchase or our approach is out of favor. In 2018, the Fund suffered from all of these. Companies that missed short-term expectations generated the largest declines, with the market severely punishing those that disappointed in the fourth quarter. On the other hand, stock prices largely ignored the progress that our companies and management partners made. CEOs whom we view as stronger, were secured at CenturyLink, GE, CNHI and Mattel. Businesses sold assets for attractive prices, including Allergan, Fairfax, CK Asset, LafargeHolcim, United Technologies and GE. United Technologies and GE announced company breakup / simplification plans. Importantly, the primary business segments at most of our core holdings grew – Enterprise at CenturyLink, Cable at Comcast, Search and YouTube at Alphabet, Aesthetics (Botox) at Allergan, Ground at FedEx, Agriculture at CNHI, North American Cement at LafargeHolcim, Aviation and Healthcare at GE, and Barbie and Hot Wheels at Mattel.
During the year, we sold three investments, added five new qualifiers and increased the Fund’s stake in three others. Cash started the year at 23% but was below 5% by the end of December. Portfolio repositioning and value growth amid stock price declines helped the price-to-value (P/V) ratio move into the mid-50s%, a somewhat rare level that has historically preceded strong absolute and relative returns.
Taking a longer term view, 2018 marked the end point of a ten-year period when the Fund earned over 10% annual returns but did not meet inflation plus 10% or outperform the Index. The Fund was challenged as momentum stocks dominated and were pushed to greater heights with massive inflows into cap-weighted passive indices at the expense of active managers. In the last few years, larger technology-related stocks were the driving force. The Value/Growth disparity, tech driven market and Index outperformance in the five years ended December 1999 were similar. Importantly, following 1999, the Fund delivered four years of outperformance – a cumulative 8000 basis points - that far exceeded the previous five years’ shortfall. We are highly confident that the Fund may outperform the Index and deliver even better absolute results than the last decade for four main reasons:
1. As holdings reached full value in the extended bull market of the last decade, qualifying replacements for those sales were elusive. The consequential high cash levels over extended periods created the single largest driver of the Fund’s underperformance. Today, however, the Fund is fully invested after increased price volatility in 2018 created new, compelling investment opportunities.
2. The second largest performance challenge over the last decade, including in 2018, was the Fund’s collective investment in companies based outside of the U.S., which averaged approximately 20% of the portfolio. U.S. stocks in the Partners Fund actually outperformed the S&P for the ten years. But, the S&P 500’s cumulative return (+243%) dominated the international MSCI EAFE Index’s (+85%), making international companies more compelling investments today but also a relative headwind looking backward. Today, 28% of the portfolio is in stocks domiciled outside of the U.S. Not only does each company have compelling prospects, but international stocks are much more attractive overall with the price/earnings (P/E) multiple for EAFE at 12.5X versus 15.6X for the S&P. While U.S. and international stocks have performed at a similar annual rate of 8.4% (EAFE) to 9.3% (S&P) over almost sixty years, we believe the recent ten-year huge disparity (EAFE at 6.3% v. S&P at 13.1%) and large divergence from each index’s own average bode well for the Fund’s stocks based outside of the U.S.
3. Individual investments where our assessments of the people or the companies were wrong also hurt the Fund’s ten-year relative results. Each case was unique, but our analysis showed that holding mistakes for too long and increasing their weighting at the wrong time turned normal errors into performance killers. We have made adjustments accordingly. We build positions in new companies more slowly while getting to know the company and management more deeply. We limit exposure to businesses with less control of their own outcomes, either because they are closely tied to a commodity price or they have financial obligations that restrict flexibility. We also limit ownership of businesses closely linked in the same industry to less than 15% of the portfolio. We overweight few positions and only where the qualitative and quantitative characteristics are equally compelling, with the maximum investment at purchase generally being 10%. We also sell and move on more quickly if the qualitative case changes meaningfully, even if the stock remains statistically cheap. We focus more on declines in intrinsic value as a sign that we mis-assessed the company and take a deeper dive before adding to the holding. We systematically conduct an 18-month review of any new investment that is underperforming as our data shows this to be a key time to decide whether to maintain an investment. Understanding our errors and making related adjustments in our execution will not eliminate company-specific mistakes, but we believe they are less likely to compound as they should be shorter-lived and lower impact going forward.
4. Although the Fund posted double-digit annualized gains, the last 10 years were an abnormally long period of relative underperformance for our investment approach. Momentum, rather than fundamentals, fed the long-running bull market where many stocks sold for multiples far higher than we could justify, particularly biotech and technology-related areas whose long-term competitive advantages we find difficult to assess with confidence. More discounted stocks that did meet our criteria remained out-of-favor with their payoffs delayed. The S&P 500 Growth Index outperformed the S&P 500 Value by approximately 3.5% per year over the last ten years. We believe this disparity awaits a meaningful reversal, given the 30+ years prior, where Value outperformed Growth by approximately 2% annually. We were encouraged by early signs of Value making up ground in late 2018 / early 2019.
The current positioning of the Partners Fund, along with improvements in our execution, make us confident in future return potential. The Fund is fully invested in businesses that meet our qualitative criteria and are selling at a rarely seen deep discount that can yield far greater than average upside. The chart shows that following other periods when the P/V was below 60%, the Fund averaged substantially higher returns than the Index at real rates in excess of 10%*.
*Quarter-ends since 1993 were identified where the Partners Fund’s “price-to-value ratio” (P/V) was less than 60%. From each quarter end identified, the 1, 3, and 5 year cumulative returns for the Fund and the S&P 500 were calculated. Those returns were then averaged and the 3 and 5 year returns were annualized. Current circumstances may not be comparable.
Contributors/Detractors
(2018 Investment return; 2018 Fund contribution; Q4 Investment return; Q4 Fund contribution)
Park Hotels (10%, 0.43%, -18%, -0.78%), the owner of Hawaiian Village and other Hilton properties, was the primary positive contributor in 2018 after our first quarter purchase of the stock. The business delivered mid-single-digit comparable revenue per available room (RevPAR) growth despite hurricanes near its Florida and Hawaiian hotels. Early in the year, CEO Tom Baltimore sold multiple properties above our appraisal, and the company has additional opportunity to realize more value out of the portfolio’s assets. Recent transactions for top-tier luxury properties support significantly larger multiples than the stock price implies for Park’s trophy properties like the Hawaiian Village. Despite good results in its second year as a stand-alone company, Park still trades at a meaningful discount to peers with what we view as inferior properties.
General Electric (-54%, -3.14%, -32%, -1.93%), the aviation, healthcare and power company, fell throughout the year, making it the Fund’s largest detractor. GE’s former leadership and business model are dramatically different from what is in place today. The management team is new, plus the board has been reduced in size and upgraded in quality. The "business" and "price" parts of our investment case boil down to three main assumptions:
1) The best-in-class Aviation and Healthcare businesses continue to deliver strong profit growth, could be severed from the rest of GE and, we believe are worth a combined $16+/share.
2) GE’s holdings in transportation and industrial services businesses Wabtec and Baker Hughes GE are solid, liquid and have self-help ability to grow earnings. Other smaller businesses like Renewables have demonstrably positive value. This group of assets is worth more than the net industrial debt/share of GE.
3) We believe the currently struggling Power business should recover over several years as the company and the industry rightsize capacity and headwinds abate. GE Capital’s issues will continue to be addressed aggressively and will be smaller in the years to come. Even a negative value for GE Capital gets to an appraisal for the company that is over 2X the current stock price.
We slowly initiated our position in GE in late 2017 and bought most shares in the first seven months of 2018, after the unexpected increase in reserves for long-term care insurance at GE Capital. Nonetheless, we were too early, with an average cost basis in the low teens. Our adjusted appraisal approaches three times the current stock price, leaving ample margin of safety for a solid return even if some of our investment case assumptions above are wrong. Larry Culp, a legend given his record at Danaher, took the GE CEO job in September after doing deep diligence into the company’s challenges and prospects as a new board member earlier in 2018. GE stock must return to the high teens within four years for half of Culp’s long-term incentive shares to vest and generate the kind of CEO-level pay he could have easily secured elsewhere, and he receives additional shares only if the stock reaches $31 in that period. This degree of out-of-the-money alignment is both extremely rare and highly encouraging.
Mattel (-35%, -2.32%, -36%, -2.42%), the classic toy company, fell in the fourth quarter, making it a detractor for the year after the company lowered full-year revenue guidance by 3%. The primary challenge was sorting through the retail disruption caused by the Toys “R” Us bankruptcy, combined with self-inflicted Chinese inventory problems. The weaker revenue number ignores CEO Ynon Kreiz’s solid progress towards cutting $650m in operating costs. For the first nine months of 2018, the company’s two most important brands, Barbie and Hot Wheels, grew gross sales 15% and 6%, respectively. Fisher-Price, Thomas and American Girl all declined, but each brand has strong, unique drivers for future growth. To invest in high-return growth projects, Kreiz is creating new businesses using Mattel’s deep well of brands and intellectual property. The stock ended the year trading at less than half the 2017 rumored acquisition offer and has already rebounded strongly in the first two weeks of 2019.
FedEx (-35%, -2.22%, -33%, -2.17%), the transportation and logistics company, fell in the fourth quarter and for the year. Express revenues missed expectations after weakness in all the major Euro economies and what CEO Fred Smith called “bad political choices” weighed down international trade. These headwinds caused the company to lower earnings per share guidance by 8%. The stock’s sharp decline ignored that the Ground segment, the largest part of our appraisal, reported strong high-teens earnings growth. FedEx’s Freight segment also performed very well with EBITDA (earnings before interest, taxes, depreciation, and amortization) up over 20% in 2018. If the weakness in international trade persists, Ground should still grow revenues and margins. Because Amazon, another perceived risk to FedEx, constitutes less than 5% of company revenue, Amazon’s internal delivery development will have minimal effect on results. The company has a solid balance sheet and the potential to go on offense with share repurchase at these prices.
CK Hutchison (-21%, -1.53%, -17%, -1.16%), a Hong Kong based conglomerate of telecommunications, health & beauty, infrastructure, global ports and energy, fell during the final quarter and the year. While a trade war between China and the U.S. will pressure less than 5% of its Ports business, concerns of this trade tension generated broad negative sentiment around Asian stocks. In Italy, the company’s Telecommunications business struggled as a tough macro environment and increased competition from a new entrant pressured prices. In the second half of the year, declining oil prices impacted Husky Energy, the Canadian energy associate of CK Hutchison. These short-term headwinds negatively impacted sentiment, but the overall company’s cash flow, as well as management’s capital allocation decisions, helped our appraisal grow in the mid-single digits for the year. Chairman Victor Li sold CK Hutchison’s interests in several infrastructure projects at 12X EBITDA and redeployed the proceeds to acquire the Italian telecom joint venture at 5x EBITDA. The company also repurchased its discounted shares for the first time in almost two years.
LafargeHolcim (-25%, -1.49%, -17%, -0.95%), the largest global cement, aggregates and ready-mix concrete producer, was a 2018 detractor after a notable decline in the fourth quarter. Weaker cement demand in Latin America, the Middle East and Africa, as well as higher energy and transportation costs, globally impacted profits. With two thirds of consolidated revenues (but a smaller % of the net value) tied to emerging markets, broader EM concerns heavily contributed to the stock price weakness. CEO Jan Jenisch believes efficiency gains and pricing will offset cost inflation. The cost savings program is ahead of target, and Aggregates and Ready-Mix margins are improving. The company’s North American business, which represents over one quarter of our appraisal, grew profits during the year. The company announced the sale of its Indonesian assets at an attractive price, and management plans for additional divestments over the next two years, providing meaningful cash proceeds to reinvest.
Affiliated Managers Group (-32%, -1.37%, -28%, -1.16%), the owner of diverse investment firms, declined following our third quarter purchase and was among the Fund’s notable 2018 detractors. We purchased AMG, which we previously owned, in the third quarter. Asset-manager stocks fell as indices went down in the fourth quarter. AMG’s intrinsic value is not tied to index performance, but instead to the differentiated outcomes at concentrated value managers (like ValueAct and Yacktman), quantitative strategies (AQR and Winton), international stock pickers (Tweedy Browne and Harding Loevner) and several other strong funds not directly correlated with public equities or fixed income. The various managers within AMG have long-term records of outperforming the S&P 500 that should drive asset growth, as should expanded international distribution. We have solid partners in CEO Nate Dalton and CFO Jay Horgen, a business that can grow with minimal capital and a deeply discounted stock.
CNX (-22%, -1.35%, -20%, -1.30%), the Appalachian natural gas company, detracted for the year. The stock declined after reporting an 8.5% increase in capital expenditure guidance during the second quarter. Additionally, nearly all energy stocks had a sharp selloff following the fourth quarter’s commodity price volatility. CEO Nick DeIuliis took advantage of the dislocation by repurchasing over 16% of CNX’s outstanding shares in the 12 months ended in October. Our appraisal increased
with the company’s growth in cash-flow. In June, CNX sold its Ohio Utica acreage for a good price. The company has other non-core assets to monetize in coming years. Most production is hedged several years out, helping to insulate the business’s value from declines in the gas strip. The stock trades at below half of our appraisal.
CNHI (-31%, -1.32%, -25%, -1.12%), the maker of Case and New Holland agriculture equipment (AG) and Iveco trucks (CV), was a detractor in the quarter and for the year. The U.S.-China trade tension threatened tariffs that would impact AG purchases by U.S. farmers. Tariffs remain uncertain and if imposed, may have less impact than anticipated because of offsetting subsidies and current equipment demand from less discretionary replacement needs after a several year downturn. CNHI is in a solid position to withstand the potential challenge with an investment grade balance sheet, balanced channel inventory and positive pricing and product mix trends. New CEO Hubertus M. Mühlhäuser sees opportunities to improve margins. The company returned excess capital to shareholders in the form of dividends and buybacks. The company also has upside from streamlining its disparate non-AG assets via either sales or spin-offs.
CenturyLink (2%, -0.65%, -26%, -3.25%), the telecommunications company, was a fourth quarter detractor, but ended slightly up for the year after substantial gains earlier in 2018. The stock declined after third-quarter revenues came in below expectations, but our appraisal rose with 7% yearly EBITDA growth as higher margin revenue within the Enterprise segment increased and consolidated free cash flow (FCF) nearly doubled year-over-year. CenturyLink’s FCF is more than $3.00 per share and growing, yet the stock trades around $15. Revenues declined in part because the company wisely exited unprofitable business lines, prioritizing capital efficiency and deleveraging over top line growth. The dividend moved back up to a mid-teens yield with minimal chance of any cut (Update at February 19, 2019: CTL did cut the dividend to use the cash instead to strengthen the balance sheet. We believe a better way to address the balance sheet is to explore asset sales given the multiples being paid in fiber transactions, and/or to issue tracking stocks for the separate Fiber and Consumer segments to highlight their values and offer the potential to raise capital. Southeastern filed a 13-D to talk to interested buyers and nominate appropriately experienced directors to the board. The dividend cut did not alter our appraisal of the company or its earnings power). We expect consolidated EBITDA to grow by a low-single digits percentage next year, but within that number we believe high-value Enterprise fiber revenues and cash flows will grow above that, making up for the low-quality legacy landline run off. CenturyLink remains an overweight position given its deep discount and the quality of both its management team, led by CEO Jeff Storey, and its fiber assets, which we believe are of high strategic value to numerous infrastructure investors.
Portfolio Activity
Swings in stock prices generated portfolio activity in 2018, ultimately driving cash from 23% to 2%. We sold three investments – Wynn and Chesapeake in the first quarter and CONSOL Energy in the third – and trimmed seven other holdings that performed well during the first nine months. We bought Park and Comcast in the first quarter, AMG in the third, and DowDuPont and Wynn Resorts in the fourth. All five new holdings are “recycles” that we successfully invested in previously. Recycles tend to have fewer surprises since we have closely followed the business as owners and have already deeply engaged with our management partners.
Outlook
As co-investors in the Fund, we are neither pleased nor complacent about the 2018 return, but we firmly believe that the portfolio is positioned well for future absolute and relative results. First, a P/V at this level is rare, and we think portends an exceptional next few years. Second, the Fund’s cash position is below 5%, and our on-deck list of prospective qualifiers has more than a dozen possible opportunities. Third, numerous companies in the portfolio either have corporate transactions in process or are good candidates for prospective activity over the next few years, with capable management partners who can control their own destiny in terms of value realization. We are working with boards and leaders at certain holdings to accelerate this realization.
The Partners Fund is a compelling opportunity, with more prospective investments than cash. Consequently, we re-opened the Fund to new investors effective January 30, 2019. We believe that partners who invest now could be greatly rewarded, as the best time to hire a manager with a good long-term record often is when their record looks the worst.
Performance History(Unaudited)
Partners Fund
Comparison of Change in Value of $10,000 Investment
Since Inception April 8, 1987
| Average Annual Returns for the Periods Ended December 31, 2018 |
| | 1 Year | 5 Year | 10 Year | 20 Year | Since Inception
4/8/1987 |
| Partners Fund | -17.98% | -0.52% | 10.19% | 5.55% | 9.54% |
| S&P 500 Index | -4.38 | 8.49 | 13.12 | 5.62 | 9.43 |
The index is unmanaged. Because the S&P 500 Index was available only at month-end in 1987, we used the 3/31/87 value for performance since inception. Returns reflect reinvested capital gains and dividends but not the deduction of taxes an investor would pay on distributions or share redemptions. Performance data quoted represents past performance; past performance does not guarantee future results. The investment return and principal value of an investment will fluctuate so that an investor’s shares, when redeemed, may be worth more or less than their original cost. Current performance of the Fund may be lower or higher than the performance quoted. Performance data current to the most recent month end may be obtained by visiting longleafpartners.com. The Partners Fund is subject to stock market risk, meaning stocks in the Fund may fluctuate in response to developments at individual companies or due to general market and economic conditions. Also, because the Fund generally invests in 15 to 25 companies, share value could fluctuate more than if a greater number of securities were held. Mid-cap stocks held may be more volatile than those of larger companies.
As reported in the Prospectus dated May 1, 2018, the total expense ratio for the Partners Fund is 0.95%.
Portfolio Summary(Unaudited)
Partners Fund
Portfolio Holdings at December 31, 2018 |
|
|
| | | Net Assets |
| Investments | | 97.7% |
| CenturyLink, Inc. | 10.8 | |
| CK Hutchison Holdings Limited | 7.6 | |
| General Electric Company | 6.9 | |
| CNX Resources Corporation | 6.1 | |
| LafargeHolcim Ltd | 5.9 | |
| FedEx Corporation | 5.7 | |
| Mattel, Inc. | 5.7 | |
| Affiliated Managers Group, Inc. | 4.8 | |
| Alphabet Inc. | 4.8 | |
| Fairfax Financial Holdings Limited | 4.8 | |
| CNH Industrial N.V. | 4.8 | |
| Allergan plc | 4.7 | |
| CK Asset Holdings Limited | 4.7 | |
| United Technologies Corporation | 4.6 | |
| Wynn Resorts, Limited | 4.4 | |
| Park Hotels & Resorts Inc. | 4.3 | |
| Comcast Corporation | 3.7 | |
| DowDuPont Inc. | 3.4 | |
| Cash Reserves Net of Other Assets and Liabilities | | 2.3 |
| | | 100.0% |
Fund holdings are subject to change and holding discussions are not recommendations to buy or sell any security.
Portfolio Changes
January 1, 2018 through
December 31, 2018 | |
| New Holdings | Quarter |
| Affiliated Managers Group, Inc. | 3Q |
| Comcast Corporation | 1Q |
| DowDuPont Inc. | 4Q |
| Park Hotels & Resorts Inc. | 1Q |
| Wynn Resorts, Limited | 4Q |
| Eliminations | |
| Chesapeake Energy Corporation | 1Q |
| CONSOL Energy Inc. | 3Q |
| Wynn Resorts, Limited | 1Q |
Portfolio of Investments
Partners Fund
| Common Stocks |
| | Shares | Value | % of Net Assets |
| Aerospace & Defense |
| United Technologies Corporation | 859,803 | $ 91,551,823 | 4.6% |
| Air Freight & Logistics |
| FedEx Corporation | 703,003 | 113,415,474 | 5.7 |
| Capital Markets |
| Affiliated Managers Group, Inc. | 975,850 | 95,086,824 | 4.8 |
| Chemicals |
| DowDuPont Inc. | 1,245,673 | 66,618,592 | 3.4 |
| Construction Materials |
| LafargeHolcim Ltd(a) (Switzerland) | 2,853,731 | 117,050,623 | 5.9 |
| Diversified Telecommunication Services |
| CenturyLink, Inc. | 14,087,844 | 213,430,837 | 10.8 |
| Hotels, Restaurants & Leisure |
| Wynn Resorts, Limited | 882,885 | 87,326,155 | 4.4 |
| Industrial Conglomerates |
| CK Hutchison Holdings Limited (Hong Kong) | 15,710,500 | 150,792,692 | 7.6 |
| General Electric Company | 18,011,988 | 136,350,749 | 6.9 |
| | | 287,143,441 | 14.5 |
| Insurance |
| Fairfax Financial Holdings Limited (Canada) | 214,446 | 94,402,108 | 4.8 |
| Interactive Media & Services |
| Alphabet Inc. - Class C* | 91,343 | 94,595,724 | 4.8 |
| Leisure Products |
| Mattel, Inc.* | 11,351,473 | 113,401,215 | 5.7 |
| Machinery |
| CNH Industrial N.V. (Netherlands) | 10,447,844 | 94,399,399 | 4.8 |
| Media |
| Comcast Corporation - Class A | 2,126,951 | 72,422,682 | 3.7 |
| Oil, Gas & Consumable Fuels |
| CNX Resources Corporation*(b) | 10,605,889 | 121,119,252 | 6.1 |
| Pharmaceuticals |
| Allergan plc | 696,600 | 93,107,556 | 4.7 |
| Real Estate Investment Trusts (REITs) |
| Park Hotels & Resorts Inc. | 3,284,886 | 85,341,338 | 4.3 |
| Real Estate Management & Development |
| CK Asset Holdings Limited (Hong Kong) | 12,700,500 | 92,924,220 | 4.7 |
| Total Common Stocks (Cost $2,177,926,256) | | 1,933,337,263 | 97.7 |
| Options Purchased |
| | Notional Amount | | |
| Currency |
| Hong Kong Dollar Put, 5/28/19, with BNP Paribas, Strike Price $7.80 (Hong Kong) | 85,000,000 | 212,500 | — |
| Hong Kong Dollar Put, 7/19/19, with BNP Paribas, Strike Price $7.80 (Hong Kong) | 24,000,000 | 57,600 | — |
| Total Options Purchased (Cost $586,100) | | 270,100 | — |
See Notes to Financial Statements.
| Short-Term Obligations |
| | Principal Amount | Value | % of Net Assets |
| Repurchase agreement with State Street Bank, 0.50%, dated 12/31/18, due 01/02/19, Repurchase price $37,978,055 (Collateral: $38,738,059 U.S. Treasury Bond, 0.13% due 4/15/19, Par $36,415,000) (Cost $37,977,000) | 37,977,000 | $ 37,977,000 | 1.9% |
| Total Investments (Cost $2,216,489,356) | | 1,971,584,363 | 99.6 |
| Other Assets (Liabilities), Net | | 8,496,532 | 0.4 |
| Net Assets | | $1,980,080,895 | 100.0% |
| * | Non-income producing security. |
| (a) | See Note 3. |
| (b) | Affiliated issuer during the period. See Note 6. |
Note: Non-U.S. Companies represent 27.8% of net assets.
See Notes to Financial Statements.
Management Discussion(Unaudited)
Small-Cap Fund
Longleaf Partners Small-Cap Fund fell -15.55% in the fourth quarter, bringing the 2018 return to -6.52%. The Fund significantly outperformed the Russell 2000 Index in both periods. The Index declined -20.20% and -11.01% respectively. Few stocks escaped the market decline in the fourth quarter as trade wars, U.S. interest rate increases, geopolitical unrest, fears of economic slowdowns in multiple countries, including China, and falling oil prices were among the primary headlines pressuring equity prices around the world.
The Fund’s outperformance was primarily driven by transactions at two holdings during the year. Additionally, the cash position that previously had been a drag on relative returns became a benefit, not only because it helped buffer performance in the downturn, but also because it provided the liquidity to buy new positions as more qualifiers emerged. The Fund’s negative absolute return came primarily from companies that missed expectations. The market punished companies that disappointed particularly severely in the fourth quarter.
2018 results did not reflect the progress in the portfolio. During the year, we sold four investments that successfully reached our appraisals. We deployed proceeds from these sales, plus a large part of the 22% cash in the Fund at the outset of the year into five new qualifiers and several more discounted holdings. Cash ended the year under 9%. Portfolio repositioning and value growth amid stock price declines helped the price-to-value (P/V) ratio move into the 50s%, a somewhat rare level that has historically preceded strong absolute and relative returns.
Just as performance did not reflect portfolio enhancements, the stock prices of most companies did not indicate what we view as positive progress made by our companies and management partners throughout the year. CEOs whom we view as stronger, were secured at CenturyLink and Mattel. Park Hotels and Kodak agreed to sell assets for attractive prices. Forest City, Sonic and Hopewell were acquired or agreed to go private at strong premiums. Importantly, the primary business segments at most of the Fund’s core holdings grew – Enterprise at CenturyLink, Barbie and Hot Wheels at Mattel, Broadcasting and Kaplan International at Graham Holdings and North American Fertilizer at OCI. As their stock prices became more discounted, numerous companies in the Fund repurchased shares, thereby increasing the remaining value per share.
Choppy markets and the economic uncertainty that feeds them could last for a while. To manage investment risk, we incorporate conservative-to-skeptical assumptions about the future, invest in a limited number of companies, have a broad and deep research network and engage with managements. We believe that the Fund’s compelling P/V, combined with the underlying strength of the businesses we own and the management teams leading them, can generate strong absolute and relative results going forward and that the payoff for 2018 company-level and portfolio-level progress is deferred but not lost.
Contributors/Detractors
(2018 Investment return; 2018 Fund contribution; Q4 Investment return; Q4 Fund contribution)
Sonic (61%, 2.26%, -, -), the quick service restaurant franchise, was the Fund’s largest contributor for the year. Southeastern first bought shares in late 2016, when competing brands’ discounting and unit expansion weighed down Sonic’s system-wide sales growth. CEO Cliff Hudson and his team did good work as they revamped marketing, improved the menu, sold company-owned stores to franchisees, released a mobile app and consistently bought back shares at low earnings multiples. In 2018, Sonic reported growing sales, sending the stock 30% higher in a week. In September, private-equity firm Inspire Brands announced its acquisition of Sonic near our appraisal, and we sold the stock at nearly double the Fund’s cost.
Hopewell Holdings (35%, 1.68%, 35%,1.60%) a Hong Kong-listed property company, was the primary contributor for the fourth quarter and among the top performers for 2018. On the final day of 2017, Hopewell announced the sale of its Hopewell Highway Infrastructure toll road company for 20% above our appraisal, and part of the proceeds went to a special cash dividend of HK$2 per share when the deal closed in April. In December, the founder, Gordon Wu, offered HK$38.8 per share to buy out other shareholders and privatize the company. Independent shareholders will vote later in 2019 on the offer, and we are not opposed.
Realogy (-43%, -2.28%, -29%, -1.41%), the owner of leading real-estate franchises like Coldwell Banker and Century21, fell during the year. The company missed third-quarter EBITDA (earnings before interest, taxes, depreciation, and amortization) expectations and lowered full-year guidance by 5% after weaker existing home sales in coastal markets hurt the owned brokerage and title insurance segments. However, Realogy’s franchise segment, the most important part of our appraisal, held up well despite the more difficult real estate environment in the wake of higher interest rates and changes in tax laws related to real estate deductions. CEO Ryan Schneider used the large free cash flow (FCF) coupon to repurchase shares at a mid-single digit FCF multiple. Realogy also launched two new brokerage brands for luxury and urban millennial sales this year. We remain confident that the value of this business will grow long-term with home prices and as millennials migrate to home ownership. Fears that online tools for viewing and advertising homes will displace realtors have been overblown as the use of realtors and online tools actually have grown in tandem. We believe that online home-selling economic models may be successful in areas where housing is somewhat standardized, but in most of the U.S., meaningful home variations by city, neighborhood, and even block do not lend themselves to purely online comparisons and transactions.
Mattel (-35%, -2.08%, -36%, -2.22%), the classic toy company, fell in the fourth quarter, making it a detractor for the year after the company lowered full-year revenue guidance by 3%. The primary challenge was sorting through the retail disruption caused by the Toys “R” Us bankruptcy, combined with self-inflicted Chinese inventory problems. The weaker revenue number ignores CEO Ynon Kreiz’s solid progress towards cutting $650m in operating costs. For the first nine months of 2018, the
company’s two most important brands, Barbie and Hot Wheels, grew gross sales 15% and 6%, respectively. Fisher-Price, Thomas and American Girl all declined, but each brand has strong, unique drivers for future growth. To invest in high-return growth projects, Kreiz is creating new businesses using Mattel’s deep well of brands and intellectual property. The stock ended the year trading at less than half the 2017 rumored acquisition offer and has already rebounded strongly in the first two weeks of 2019.
Summit Materials (-34%, -1.60%, -31%, -1.50%), a U.S. cement and aggregates company, declined in the fourth quarter, making it a detractor for the year. We began buying the stock in the third quarter after the company’s moderate cut to EBITDA guidance led to a sell off. Flooding and hurricane recovery took longer than anticipated and cost inflation also impacted profits, though Summit had already begun to increase pricing as an offset. Slowing national home construction hurt U.S. building materials companies, but Summit's stock felt more impact because of the company’s leverage and lower aggregates mix. Summit owns 2.5 million tons of cement capacity, 10 river terminals and 3.7 billion tons of aggregates reserves. U.S. cement demand is above current capacity, and much-needed infrastructure spending would increase demand substantially. In aggregates, Summit benefits from exclusive local positions in several large urban markets where it commands significant pricing premiums to competitors who bear additional shipping costs. Summit is not significantly exposed to high-rise construction, the biggest cyclical risk to the industry. In the event of a recession, its public-sector exposure, which comprises 40%+ of its business, should prove more durable. CEO Tom Hill has a strong record of intelligent acquisitions and is using FCF to de-lever the balance sheet. We paid a single-digit FCF multiple and expect the coupon to grow substantially in coming years.
ViaSat (-21%, -1.49%, -8%, -0.44%), the satellite communications company, was a detractor for the year but declined much less than many businesses in the fourth quarter after reporting strong quarterly results. In the Broadband segment, subscribers, ARPU (average revenue per user) and margins all increased. In Government, revenues and earnings grew over 20%. For InFlight, Viasat gained North American commercial aircraft market share beyond 20% for the first time, doubling in only two years. We believe ViaSat’s superior inflight internet product should continue to gain business from slower competitors. ViaSat-3, the company’s most powerful satellites by orders of magnitude, are scheduled to launch in less than two years, allowing the company to service several thousand government aircraft and offer a competitive broadband product to rural customers around the world.
OCI (-19%, -1.32%, -36%, -2.78%), a global producer of nitrogen fertilizers and natural gas-based chemicals, was the primary detractor in the fourth quarter, primarily due to the decline in the methanol spot price, which is linked to oil. To the positive, non-methanol-related assets, which represent three quarters of the value, did well. African facilities resolved gas supply issues and achieved 95%+ utilization rates. The company sells for less than the replacement cost of its assets and our conservative estimate of the discounted cash flow value. CEO Nassef Sawiris is an owner-operator focused on optimizing the capital structure and generating significant free cash flow.
CenturyLink (2%, -0.04%, -26%, -2.15%), the telecommunications company, was a fourth quarter detractor, but ended slightly up for the year after substantial gains earlier in 2018. The stock declined after third-quarter revenues came in below expectations, but our appraisal rose with 7% yearly EBITDA growth as higher margin revenue within the Enterprise segment increased and consolidated FCF nearly doubled year-over-year. CenturyLink’s FCF, which grows beyond inflation, is more than $4.00 per share, yet the stock trades around $15. Revenues declined in part because the company wisely exited unprofitable business lines, prioritizing capital efficiency and deleveraging over top line growth. The dividend moved back up to a mid-teens yield with minimal chance of any cut (Update at February 19, 2019: CTL did cut the dividend to use the cash instead to strengthen the balance sheet. We believe a better way to address the balance sheet is to explore asset sales given the multiples being paid in fiber transactions, and/or to issue tracking stocks for the separate Fiber and Consumer segments to highlight their values and offer the potential to raise capital. Southeastern filed a 13-D to talk to interested buyers and nominate appropriately experienced directors to the board. The dividend cut did not alter our appraisal of the company or its earnings power). We expect consolidated EBITDA to grow by a low-single digits percentage next year, but within that number we believe high-value Enterprise fiber revenues and cash flows will grow above that, making up for the low-quality legacy landline run off. CenturyLink remains an overweight position given its deep discount and the quality of both its management team, led by CEO Jeff Storey, and its fiber assets, which we believe are of high strategic value to numerous infrastructure investors.
Portfolio Activity
We exited four successful investments, all prior to the fourth quarter. In addition to Sonic, we sold Wynn Resorts and CONSOL Energy, the coal company. We both bought and sold Forest City, a real estate company that was acquired within a few months of our purchase. We also bought GCI Liberty, Lazard, Summit Materials and PotlatchDeltic. Both Forest City and PotlatchDeltic are “recycled names” that we previously owned. Recycles tend to have fewer surprises since we have closely followed the business as owners and have already deeply engaged with our management partners.
Outlook
As co-investors in the Fund, we are neither pleased nor complacent about the 2018 absolute return, but we firmly believe that the portfolio is positioned well for future absolute and relative results. First, in the relatively rare times when the Fund traded below a 60% P/V in the past, the following one, three and five-year performance averaged well over 300 basis points above the Index annually. More importantly, Fund annual returns averaged in the mid-teens, far exceeding inflation plus 10%*. Second,
the Fund’s cash position is below 10%, and our on-deck list of prospective qualifiers has more than ten new possible opportunities. Third, we believe that a number of companies in the portfolio are good candidates over the next few years for the types of corporate transactions that have been an important source of the Fund’s success over time, including in 2018. Fourth, we anticipate that the results of the strong businesses we own and the management teams leading them can eventually translate into stock prices that properly reflect value, whether by investor re-rating, much higher earnings than are currently being delivered or corporate partners taking action to gain value recognition.
*Quarter-ends since 1993 were identified where the Small-Cap Fund’s “price-to-value ratio” (P/V) was less than 60%. From each quarter end identified, the 1, 3, and 5 year cumulative returns for the Fund and the Russell 2000 were calculated. Those returns were then averaged and the 3 and 5 year returns were annualized. The results were: 17.73% for 1 year, 15.05% for 3 year, and 16.53% for 5 year for the Small-Cap Fund and 14.36%, 10.79% and 12.81% for the Russell 2000. Current circumstances may not be comparable.
Performance History(Unaudited)
Small-Cap Fund
Comparison of Change in Value of $10,000 Investment
Since Inception February 21, 1989
| Average Annual Returns for the Periods Ended December 31, 2018 |
| | 1 Year | 5 Year | 10 Year | 20 Year | Since Inception
2/21/1989 |
| Small-Cap Fund | -6.52% | 5.34% | 14.49% | 9.32% | 10.38% |
| Russell 2000 Index | -11.01 | 4.41 | 11.97 | 7.40 | 9.03 |
The index is unmanaged. Returns reflect reinvested capital gains and dividends but not the deduction of taxes an investor would pay on distributions or share redemptions. Performance data quoted represents past performance; past performance does not guarantee future results. The investment return and principal value of an investment will fluctuate so that an investor’s shares, when redeemed, may be worth more or less than their original cost. Current performance of the Fund may be lower or higher than the performance quoted. Performance data current to the most recent month end may be obtained by visiting longleafpartners.com. The Small-Cap Fund is subject to stock market risk, meaning stocks in the Fund may fluctuate in response to developments at individual companies or due to general market and economic conditions. Also, because the Fund generally invests in 15 to 25 companies, share value could fluctuate more than if a greater number of securities were held. Smaller company stocks may be more volatile with less financial resources than those of larger companies.
As reported in the Prospectus dated May 1, 2018, the total expense ratio for the Small-Cap Fund is 0.92%.
Portfolio Summary(Unaudited)
Small-Cap Fund
Portfolio Holdings at December 31, 2018 |
|
|
| | | Net Assets |
| Investments | | 91.4% |
| Graham Holdings Company | 8.8 | |
| Hopewell Holdings Limited | 7.5 | |
| CenturyLink, Inc. | 7.2 | |
| Liberty Media Formula One | 6.8 | |
| OCI N.V. | 6.4 | |
| Eastman Kodak Company (Common and Preferred) | 5.1 | |
| Summit Materials, Inc. | 5.1 | |
| Lazard Ltd | 4.9 | |
| Mattel, Inc. | 4.8 | |
| ViaSat, Inc. | 4.7 | |
| Park Hotels & Resorts Inc. | 4.7 | |
| PotlatchDeltic Corporation | 4.6 | |
| CNX Resources Corporation | 4.4 | |
| GCI Liberty, Inc. | 4.3 | |
| Realogy Holdings Corp. | 4.3 | |
| Actuant Corporation | 4.0 | |
| Neiman Marcus Group LTD LLC (Bonds) | 3.8 | |
| Cash Reserves Net of Other Assets and Liabilities | | 8.6 |
| | | 100.0% |
Fund holdings are subject to change and holding discussions are not recommendations to buy or sell any security.
Portfolio Changes
January 1, 2018 through
December 31, 2018 | |
| New Holdings | Quarter |
| Forest City Realty | 2Q |
| GCI Liberty, Inc. | 2Q |
| Lazard Ltd. | 3Q |
| PotlatchDeltic Corporation | 4Q |
| Summit Materials, Inc. | 3Q |
| Eliminations | |
| CONSOL Energy | 3Q |
| Forest City Realty | 3Q |
| Sonic Corp. | 3Q |
| Wynn Resorts, Limited | 1Q |
Portfolio of Investments
Small-Cap Fund
| Common Stocks |
| | Shares | Value | % of Net Assets |
| Capital Markets |
| Lazard Ltd - Class A(a) | 4,083,512 | $ 150,722,428 | 4.9% |
| Chemicals |
| OCI N.V.*(b)(c) (Netherlands) | 9,661,792 | 197,312,060 | 6.4 |
| Communications Equipment |
| ViaSat, Inc.*(c) | 2,498,135 | 147,265,058 | 4.7 |
| Construction Materials |
| Summit Materials, Inc. - Class A*(c) | 12,699,444 | 157,473,106 | 5.1 |
| Diversified Consumer Services |
| Graham Holdings Company - Class B(c) | 428,000 | 274,168,240 | 8.8 |
| Diversified Telecommunication Services |
| CenturyLink, Inc. | 14,779,941 | 223,916,106 | 7.2 |
| Entertainment |
| Liberty Media Formula One - Class A* | 2,322,149 | 69,014,269 | 2.2 |
| Liberty Media Formula One - Class C* | 4,582,116 | 140,670,961 | 4.6 |
| | | 209,685,230 | 6.8 |
| Leisure Products |
| Mattel, Inc.* | 15,013,426 | 149,984,126 | 4.8 |
| Machinery |
| Actuant Corporation - Class A(c) | 5,841,674 | 122,616,737 | 4.0 |
| Media |
| GCI Liberty, Inc. - Class A* | 3,274,555 | 134,780,684 | 4.3 |
| Oil, Gas & Consumable Fuels |
| CNX Resources Corporation*(c) | 12,038,143 | 137,475,593 | 4.4 |
| Real Estate Investment Trusts (REITs) |
| Park Hotels & Resorts Inc. | 5,597,585 | 145,425,258 | 4.7 |
| PotlatchDeltic Corporation(c) | 4,584,378 | 145,049,720 | 4.6 |
| | | 290,474,978 | 9.3 |
| Real Estate Management & Development |
| Hopewell Holdings Limited(c) (Hong Kong) | 52,817,500 | 232,262,962 | 7.5 |
| Realogy Holdings Corp.(c) | 9,135,453 | 134,108,450 | 4.3 |
| | | 366,371,412 | 11.8 |
| Technology Hardware, Storage & Peripherals |
| Eastman Kodak Company*(d) | 4,000,000 | 10,200,000 | 0.3 |
| Total Common Stocks (Cost $2,784,418,590) | | 2,572,445,758 | 82.8 |
| Preferred Stock |
| | | | |
| Technology Hardware, Storage & Peripherals |
| Eastman Kodak Company Convertible Preferred Stock - Series A 5.50%(d)(e) (Cost $186,430,000) | 1,864,300 | 148,771,140 | 4.8 |
| Corporate Bonds |
| | Principal Amount | | |
| Multiline Retail |
| Neiman Marcus Group LTD LLC 8.00% 144A Senior Notes due 10/15/2021(f) | 180,971,000 | 75,555,392 | 2.4 |
See Notes to Financial Statements.
| Corporate Bonds |
| | Principal Amount | Value | % of Net Assets |
| Multiline Retail |
| Neiman Marcus Group LTD LLC 8.75% 144A Senior Notes due 10/15/2021(f)(g) | 102,049,503 | $ 43,371,039 | 1.4% |
| Total Corporate Bonds (Cost $194,470,050) | | 118,926,431 | 3.8 |
| Options Purchased |
| | Notional Amount | | |
| Currency |
| Hong Kong Dollar Put, 7/19/19, with BNP Paribas, Strike Price $7.80 (Hong Kong) (Cost $1,231,700) | 218,000,000 | 523,200 | — |
| Short-Term Obligations |
| | Principal Amount | | |
| Repurchase agreement with State Street Bank, 0.50%, dated 12/31/18, due 01/02/19, Repurchase price $68,818,912 (Collateral: $70,196,759 U.S. Treasury Bonds, 2.13% - 2.25% due 12/31/23 to 2/29/24, Par $71,285,000) | 68,817,000 | 68,817,000 | 2.2 |
| U.S. Treasury Bill, 2.20% due 04/25/19 | 200,000,000 | 198,492,548 | 6.4 |
| Total Short-Term Obligations (Cost $267,331,833) | | 267,309,548 | 8.6 |
| Total Investments (Cost $3,433,882,173) | | 3,107,976,077 | 100.0 |
| Other Assets (Liabilities), Net | | 1,460,196 | — |
| Net Assets | | $3,109,436,273 | 100.0% |
| * | Non-income producing security. |
| (a) | Master Limited Partnership |
| (b) | See Note 3. |
| (c) | Affiliated issuer during the period. See Note 6. |
| (d) | Controlled investment during the period. See Note 6. |
| (e) | These shares were acquired directly from the issuer in a private placement on November 7, 2016 with a total cost at December 31, 2018 of $186,430,000.They are considered restricted securities under the Securities Act of 1933 (the “33 Act”). These shares may be sold only if registered under the 33 Act or an exemption is available. The issuer has filed with the SEC a registration statement on Form S-3 providing for the potential resale on an ongoing basis under 33 Act Rule 415 of Series A Preferred Stock as well as the Common Stock issuable upon conversion of the Series A Preferred Stock, subject to certain terms of a Registration Rights Agreement with the issuer. Due to the lack of an active trading market, all or a portion of this position may be illiquid. Judgment plays a greater role in valuing illiquid securities than those for which a more active market exists, and are valued using procedures adopted by the Board of Trustees (See Note 2). |
| (f) | Security is exempt from registration under Rule 144A of the Securities Act of 1933. This security may be resold in transactions that are exempt from registration, normally to qualified institutional buyers. This security has been deemed liquid pursuant to guidelines approved by the Board of Trustees, unless otherwise noted. |
| (g) | Payment-in-kind security for which the issuer has the option at each interest payment date of making interest payments in cash or additional debt securities. |
Note: Non-U.S. Companies represent 13.9% of net assets.
See Notes to Financial Statements.
Management Discussion(Unaudited)
International Fund
Longleaf Partners International Fund declined -9.90% in the fourth quarter, pushing the 2018 return to -7.08%. The Fund significantly outperformed the MSCI EAFE Index for both periods. The Index fell -12.54% in the quarter and -13.79% for the year. Pressure on stocks built with headlines of trade wars, higher U.S. interest rates, geopolitical unrest, economic slowdowns in multiple countries, including China, and falling oil prices.
Several factors contributed to the Fund’s outperformance over the Index. The primary driver was strong individual stock returns at various successful companies, including four that we sold after a relatively short holding period to fund more discounted qualifiers. The Fund also held less exposure to Financials, the worst performing and most detracting sector in the Index. The International Fund owned EXOR and Fairfax, a combination of re-insurance and industrial businesses that held up much better than the more heavily levered institutions in the sector. Additionally, the 20% cash in the Fund at the outset of 2018 helped the relative return, while also providing dry powder for new opportunities over the course of the year.
Although the International Fund outperformed the Index and most of its peers, the Fund declined during the year. The strong U.S. dollar negatively impacted both the Index and the Fund’s results by approximately 3%. Businesses that had meaningful economic exposure in emerging markets (EMs), including China, collectively impacted results. Emerging markets declined as the Federal Reserve began increasing interest rates and later as fear of a U.S.-China trade war developed. The EM sell-off, however, also provided opportunities to add to EM-exposed telco Millicom and to Macau gaming company Melco. In addition, we established new positions in Bolloré, which is Africa exposed, Becle of Mexico, Bharti Infratel of India and three undisclosed holdings in the fourth quarter, including two with sizable EM customer bases.
In our view, returns for the year did not reflect the progress within the portfolio. We not only invested the cash but also had much higher turnover than normal as the opportunity set expanded throughout the year. We sold one company, Yum China, early in 2018, and seven others in the second half. We deployed the proceeds into over half a dozen material new investments, while opportunistically adding to existing holdings. In addition to EM-related qualifiers, German industrials became more appealing, as political and economic uncertainty made Germany among the worst performing European countries within EAFE. In aggregate, portfolio repositioning, value growth and stock price declines moved the price-to-value (P/V) ratio near 60%, a level that has historically preceded strong returns*.
Just as performance did not reflect portfolio enhancements, many stock prices did not indicate the positive progress that our companies and management partners made throughout the year. Several businesses sold assets for attractive prices, including Fairfax, CK Asset, LafargeHolcim, CK Hutchison, EXOR and Baidu. Belmond agreed to be bought by LVMH. Importantly, the primary business segments at most of our core holdings grew, for instance North American Cement at LafargeHolcim, Partner Re at EXOR, Retail at CK Hutchison, North American Fertilizer at OCI, Core Search at Baidu, Bearings at MinebeaMitsumi and Mass Gaming at Melco. Numerous companies in the Fund repurchased shares, thereby increasing the remaining value per share.
Choppy markets and the economic uncertainty that feeds them could last for a while. While many CEOs we talk to are optimistic about revenue growth, they are cautious about rising labor and materials costs on a local level and increases in trade barriers and geopolitical friction potentially impacting revenues and margins. To manage investment risk, we incorporate conservative-to-skeptical assumptions about the future, invest in a limited number of companies, have a broad and deep research network and engage with managements.
Even though the Fund outperformed the Index, we are neither pleased nor complacent about 2018 absolute returns. As your largest co-investors in the Fund, we believe it is a compelling time to add to Longleaf International. We believe the EAFE is overdue for a relative tailwind after being almost tripled by the U.S. market over the last ten years (10-year cumulative return for S&P 500 was 243% and 85% for MSCI EAFE). The Fund’s attractive P/V, and the underlying strength of the businesses we own lead us to believe that the Fund may generate strong absolute and relative results going forward. Most importantly, we have partnered with management teams who, in our view, can control their own destiny in terms of value realization, and we are working with boards and leaders at certain holdings to accelerate this realization.
Contributors/Detractors
(2018 Investment return; 2018 Fund contribution; Q4 Investment return; Q4 Fund contribution)
Belmond (105%, 4.49%, 37%, 2.22%), a collection of iconic luxury hotels located mostly in Europe, was the largest contributor in the fourth quarter and for the year. Owned hotels are over 85% of the asset value, with management fees and other leisure businesses the remainder. In August, the company announced a strategic review and ran a competitive sales process. In December, LVMH, the Paris-based luxury-goods company, whose brands include Fendi, Louis Vuitton and Dom Pérignon, agreed to pay $25 per share in cash, valuing Belmond’s equity at around $2.6 billion. This share price premium of more than 80% since the August announcement reflected a fair value for those assets. The sale is expected to close by June of 2019.
*Quarter-ends since 1998 were identified where the International Fund’s “price-to-value ratio” (P/V) was less than 60%. From each quarter end identified, the 1, 3, and 5 year cumulative returns for the Fund and the MSCI EAFE were calculated. Those returns were then averaged and the 3 and 5 year returns were annualized. The results were: 17.00% for 1 year, 10.49% for 3 year, and 11.28% for 5 year for the International Fund and 6.95%, 6.25% and 9.08% for the EAFE. Current circumstances may not be comparable.
Hikma Pharmaceuticals (54%, 2.04%, -, -), a multinational injectables and generic pharmaceuticals company based in the U.K., was the Fund’s other primary contributor in 2018. We bought Hikma in October 2017, knowing we had an owner in Chairman and CEO Said Darwazah and two quality segments in the flagship Injectables segment and the Branded MENA business that were being temporarily overshadowed by a more competitive environment in the smaller U.S. oral generic drug segment. Darwazah proved himself an excellent partner when he brought in well-respected industry veteran Siggi Olafsson to take over as CEO. In a short period, the company made considerable progress in its Injectables operations, the Generics environment improved and the stock exceeded our appraisal leading to a complete exit of the position by August.
LafargeHolcim (-25%, -1.77%, -17%, -1.11%), the largest global cement, aggregates and ready-mix concrete producer, was the biggest 2018 detractor in the Fund after a notable decline in the fourth quarter. Weaker cement demand in Latin America, the Middle East and Africa, as well as higher energy and transportation costs globally impacted profits. With two thirds of revenues tied to emerging markets, broader EM concerns heavily contributed to the stock price weakness. CEO Jan Jenisch believes efficiency gains and pricing will offset cost inflation. The cost savings program is ahead of target, and Aggregates and Ready-Mix margins are improving. The company’s North American business, which represents over one quarter of our appraisal, grew profits during the year. The company announced the sale of its Indonesian assets at an attractive price, and management plans to accelerate divestments over the next two years, providing meaningful cash proceeds to reinvest.
thyssenkrupp (-36%, -1.58%, -32%, -1.62%), the German steel conglomerate, declined in the fourth quarter, making it among the Fund’s 2018 detractors following our second quarter purchase of the stock. In July, the CEO and Chairman each resigned under pressure from activist investors. In September, the company named Guido Kerkoff, who had been CFO and interim CEO, as permanent CEO and announced the decision to split thyssenkrupp into an Industrials business and a Materials business. We identified the strategic potential early in the year but underestimated the time and expense required to effect the split. If approved by shareholders in March of 2020, the split can help each division more properly reflect our appraisal of its parts. Industrials will consist of three units: Elevators (the largest part of our appraisal), Automotive Supplies and Core Plant Construction. Materials will contain Materials Services, Slewing Bearings, Forging, Marine and a 50 percent interest in the joint venture of thyssenkrupp’s and Tata’s European steel businesses. While being early has led to a painful experience in the short term, we are confident in our assessment of the eventual asset value once the transformation completes in approximately 18 months.
CK Hutchison (-21%, -1.53%, -17%, -1.25%), a Hong Kong based conglomerate of telecommunications, health & beauty, infrastructure, global ports and energy, fell during the final quarter and the year. While a trade war between China and the U.S. will pressure less than 5% of its Ports business, concerns of this trade tension generated broad negative sentiment around Asian stocks. In Italy, the company’s Telecommunications business struggled as increased competition from a new entrant pressured prices. In the second half of the year, declining oil prices impacted Husky Energy, the Canadian energy associate of CK Hutchison. These short-term headwinds negatively impacted sentiment, but the company’s cash flow, as well as management’s capital allocation decisions, helped our appraisal grow in the mid-single digits for the year. Chairman Victor Li sold CK Hutchison’s interests in several infrastructure projects at 12X EBITDA (earnings before interest, taxes, depreciation, and amortization) and redeployed the proceeds to acquire the Italian telecom joint venture at 5x EBITDA. The company also repurchased its discounted shares for the first time in almost two years.
Baidu (-32%, -1.53%, -31%, -1.52%), the dominant online search business in China, declined in the fourth quarter and hurt results for the year. Lower growth guidance for the fourth quarter reflected macro uncertainties in China, and U.S.-China trade discussions distorted U.S. listed share prices of Chinese companies such as Baidu. The recent stock decline did not reflect the future earnings power of the company or the progress made during 2018, when our appraisal grew over 20%. During the year, Baidu completed non-core divestments of Financial Services and Global DU and IPO’d video business iQiyi. Baidu Core grew with news feed and AI-related business contributing over 20% of revenue. In July, Baidu launched the first fully autonomous Level 4 minibus with King Long Motor. CEO Robin Li announced a US$1 billion share buyback program to take advantage of the discounted share price.
MinebeaMitsumi (-35%, -1.47%, -21%, -0.98%), the Japanese manufacturer of high precision equipment and components, negatively impacted performance for the year. Most of the stock’s decline was related to worries that Apple iPhone screens will entirely shift from LED to OLED technology and that iPhone sales will slow. MinebeaMitsumi supplies Apple with LED backlight and camera actuators, but this division represents less than 5% of the company’s intrinsic value. The core miniature ball bearings business with over 60% global market share increased pricing in October, while units continued to grow at the historic mid-single digits rate. In November, MinebeaMitsumi offered to acquire U-Shin, a Japanese auto parts manufacturer specializing in locks, at below 4X EBITDA. This value-accretive acquisition will double the size of the auto-related business and improve automotive distribution, and further demonstrates management’s capabilities in acquiring and fixing undervalued Japanese opportunities. CEO Yoshihisa Kainuma personally bought 1.5% of outstanding stock, and the company is repurchasing discounted shares.
Melco (-30%, -1.41%, 2%, 0.29%), the Macau-based gaming company, declined for the year over concerns about decelerating growth with ongoing U.S.-China trade war issues, a slower Chinese economy and weakening Renminbi. The decline in China’s A-share markets and slow-down in neighboring province Guangdong (export hub of China) are likely to impact gross gaming revenues, but we believe most of the impact will be on the lower-margin VIP business. Increased profits from growing, higher-margin Mass visitors should compensate for any VIP decline over time, as infrastructure improvements (HK-Zhuhai-Macau bridge, high speed rail, etc.) and additional hotel room supply make Macau more accessible. Despite the
stock’s decline, during 2018, our appraisal grew as reported earnings doubled. CEO Lawrence Ho created value for shareholders via buying out minorities at Melco Resorts Philippines at attractive multiples, IPOing Studio City to create opportunity for an ownership increase in 2019 and repurchasing discounted shares.
OCI (-19%, -0.86%, -36%, -2.41%), a global producer of nitrogen fertilizers and natural gas-based chemicals, was the primary detractor in the fourth quarter, primarily due to the decline in the methanol spot price, which is linked to oil. To the positive, non-methanol-related assets, which represent three quarters of the value, did well. African facilities resolved gas supply issues and achieved 95%+ utilization rates. The company sells for less than the replacement cost of its assets and our conservative estimate of the discounted cash flow value. CEO Nassef Sawiris is an owner-operator focused on optimizing the capital structure and generating significant free cash flow.
Portfolio Activity
In a particularly active year, we exited nine holdings, including Ferrovial in the fourth quarter. The Fund had previously held this Spanish transport infrastructure company that owns toll roads in Europe and North America, airports in Europe, including London Heathrow, and infrastructure construction and servicing businesses. The company’s Spanish and British businesses faced increasing headwinds, including Catalonia and Brexit uncertainty. Given less certain prospective value growth and the rising interest rate environment, we sold the position. During our two-year investment, the Fund earned over 15% as traffic and pricing increased on the company’s toll roads and at Heathrow, even as European headwinds mounted.
As markets declined in 2018, we invested in thirteen new qualifiers, some of which quickly did well and we sold for even more compelling opportunities. The three new positions purchased in the fourth quarter included one-and-a-half “recycled” names that we previously owned. The half includes assets from a company that was once held in Longleaf Partners Small-Cap Fund and was acquired by the foreign business we recently bought. It serves as a good example of how operating as a single research team, without silos based on geography or strategy, leverages our knowledge and opportunity across Southeastern. The three new positions, which are in disparate industries, remain undisclosed. Two are European based but with global markets, and one is Asian based.
Outlook
The Fund has more prospective investments than cash. We view EM and EM-related opportunities as the most discounted, with Asia Pacific the most undervalued region. More recently, Europe moved to the cheap bucket. The U.K., Germany and Italy face concerns over Brexit, China trade and Italy’s budget fights with the European Union. The equal-weighted P/V on the broad international universe we track moved from overvalued at the start of the year to high-80s% at the end of December. The Fund’s P/V moved to the low-60s%, with the prospect of dropping into the 50s% as one company is approaching full value and likely to be replaced with one of several very undervalued on-deck qualifiers.
In 2018 the Fund reached its twentieth anniversary. Southeastern has come a long way since moving one American from Memphis to Tokyo in 1998 and a second Memphis team member to London three years later. Since inception, the Fund has produced 300 basis points per year of excess return versus the EAFE Index. Returns in concentrated value investing can be lumpy, as the Fund’s track record demonstrates, with strong outperformance interspersed between more difficult periods. We view the firm’s unique global structure and decision-making process today as a long-term research advantage that can continue to deliver what we believe will be superior results for our clients over the coming decades.
- We have four researchers in Singapore and a junior analyst starting in 2019. There are four researchers in London, with a search currently underway to add a junior analyst. We continue to broaden and deepen our global research capabilities. A critical mass in each office makes our research more comprehensive, allowing people to brainstorm and get instant feedback in person and involving multiple people in management engagement or other research meetings.
- Southeastern seeded Asian and European regional strategies four years ago to create more ways for the international research team members to own the opportunities within their territories. Idea generation has increased, feeding more prospective investments to the International Fund, and more people on the team have developed a broader portfolio management perspective.
- Seven of the overseas analysts are from countries other than the U.S. (the eighth has dual U.K. citizenship). We believe locals committed to staying in their regions bring diverse views with more understanding of cultural nuances and opportunities and provide a unique network of research contacts that expands over time.
- The Fund has held meaningful stakes in over 170 companies during our successful 20-year history. Southeastern’s cumulative research and results have enhanced our reputation and increased our relationships globally, increasing access to corporate managements and boards for productive engagement and research insights.
- We operate as a single, integrated research team with the eight offshore analysts and seven Memphis-based analysts reviewing and challenging one another’s work. We bring to bear all the team’s collective investing experience, industry knowledge and network of helpful contacts across three continents before committing our clients’ and our own capital.
- Southeastern has developed from a U.S. firm with overseas offices into a global investment company, with nine of our fifteen analysts, including Josh Shores, who lives in Memphis after spending most of the last decade in our London office, focused primarily on investments outside of the U.S. As Co-PM of the International Fund and a member of Southeastern’s Executive Committee, Josh helps insure a global perspective, as our Memphis-based firm provides the resources needed to deliver successful results around the world.
In our view, the Fund’s strong returns over the last three years reflect the progress that we have made in fully developing our global team. We believe that the next twenty years can be even more successful, not only because of the set of businesses and corporate partners in the portfolio today, but because we are armed with our deepest-ever international research following a decade when both our style of investing and owning companies outside of the U.S. have been dramatically out of favor. This is a time when we think investors adding to Longleaf International may be particularly rewarded.
Performance History(Unaudited)
International Fund
Comparison of Change in Value of $10,000 Investment
Since Inception October 26, 1998
| Average Annual Returns for the Periods Ended December 31, 2018 |
| | 1 Year | 5 Year | 10 Year | 20 Year | Since Inception
10/26/1998 |
| International Fund | -7.08% | 0.33% | 5.83% | 6.69% | 7.09% |
| MSCI EAFE Index | -13.79 | 0.53 | 6.32 | 3.52 | 3.95 |
The index is unmanaged. Because the MSCI EAFE Index was available only at month-end in 1998, we used the 10/31/98 value for performance since inception. Returns reflect reinvested capital gains and dividends but not the deduction of taxes an investor would pay on distributions or share redemptions. Performance data quoted represents past performance; past performance does not guarantee future results. The investment return and principal value of an investment will fluctuate so that an investor’s shares, when redeemed, may be worth more or less than their original cost. Current performance of the Fund may be lower or higher than the performance quoted. Performance data current to the most recent month end may be obtained by visiting longleafpartners.com. The International Fund is subject to stock market risk, meaning stocks in the Fund may fluctuate in response to developments at individual companies or due to general market and economic conditions. Also, because the Fund generally invests in 15 to 25 companies, share value could fluctuate more than if a greater number of securities were held. Investing in non-U.S. securities may entail risk due to non-U.S. economic and political developments, exposure to non-U.S. currencies, and different accounting and financial standards. These risks may be higher when investing in emerging markets.
As reported in the Prospectus dated May 1, 2018, the total expense ratio for the International Fund is 1.19% (gross) and 1.15% (net). The expense ratio is subject to fee waiver to the extent normal annual operating expenses exceed 1.15% of average annual net assets.
Portfolio Summary(Unaudited)
International Fund
Portfolio Holdings at December 31, 2018 |
|
|
| | | Net Assets |
| Investments | | 95.3% |
| EXOR N.V. | 7.8 | |
| Melco International Development Limited | 7.2 | |
| CK Hutchison Holdings Limited | 6.9 | |
| LafargeHolcim Ltd | 6.2 | |
| MinebeaMitsumi Inc. | 6.1 | |
| Millicom International Cellular S.A. | 5.8 | |
| Vestas Wind Systems A/S | 5.7 | |
| Belmond Ltd. | 4.9 | |
| Bollore | 4.8 | |
| CK Asset Holdings Limited | 4.8 | |
| Great Eagle Holdings Limited | 4.5 | |
| Fairfax Financial Holdings Limited | 4.2 | |
| OCI N.V. | 4.1 | |
| C&C Group plc | 4.0 | |
| Baidu, Inc. ADR | 3.8 | |
| Yum China Holdings, Inc. | 3.7 | |
| Becle, S.A.B. de C.V. | 3.7 | |
| Bharti Infratel Limited | 2.9 | |
| Compagnie Financiere Richemont SA | 2.0 | |
| thyssenkrupp AG | 2.0 | |
| LANXESS AG | 0.2 | |
| Cash Reserves Net of Other Assets and Liabilities | | 4.7 |
| | | 100.0% |
Fund holdings are subject to change and holding discussions are not recommendations to buy or sell any security.
Portfolio Changes
January 1, 2018 through
December 31, 2018 | |
| New Holdings | Quarter |
| AIN Holdings Inc. | 1Q |
| Becle, S.A.B. de C.V. | 3Q |
| Bharti Infratel Limited | 2Q |
| Bollore | 3Q |
| Cemex S.A.B. de C.V. Convertible Bond | 1Q |
| Compagnie Financiere Richemont SA | 4Q |
| Grupo Televisa, S.A.B. | 1Q |
| LANXESS AG | 4Q |
| MinebeaMitsumi Inc. | 1Q |
| thyssenkrupp AG | 2Q |
| Vestas Wind Systems A/S | 1Q |
| Vocus Group Ltd. | 3Q |
| Yum China Holdings, Inc. | 4Q |
| Eliminations | |
| AIN Holdings Inc. | 3Q |
| Cemex S.A.B. de C.V. Convertible Bond | 2Q |
| Ferrovial S.A. | 4Q |
| Genting Berhad | 4Q |
| Grupo Televisa, S.A.B. | 3Q |
| Hikma Pharmaceuticals PLC | 3Q |
| MLog S.A. | 2Q |
| Vocus Group Ltd. | 3Q |
| Yum China Holdings, Inc. | 1Q |
Portfolio of Investments
International Fund
| Common Stocks |
| | Shares | Value | % of Net Assets |
| Air Freight & Logistics |
| Bollore (France) | 12,044,989 | $ 48,288,857 | 4.8% |
| Beverages |
| Becle, S.A.B. de C.V. (Mexico) | 27,603,645 | 37,068,464 | 3.7 |
| C&C Group plc (Ireland) | 13,035,273 | 40,698,357 | 4.0 |
| | | 77,766,821 | 7.7 |
| Chemicals |
| LANXESS AG (Germany) | 43,201 | 1,986,230 | 0.2 |
| OCI N.V.*(a)(b) (Netherlands) | 2,013,672 | 41,122,990 | 4.1 |
| | | 43,109,220 | 4.3 |
| Construction Materials |
| LafargeHolcim Ltd(a)(b) (Switzerland) | 1,535,332 | 62,974,249 | 6.2 |
| Diversified Financial Services |
| EXOR N.V.(b) (Netherlands) | 1,446,650 | 78,534,884 | 7.8 |
| Diversified Telecommunication Services |
| Bharti Infratel Limited (India) | 7,990,809 | 29,638,683 | 2.9 |
| Electrical Equipment |
| Vestas Wind Systems A/S (Denmark) | 767,037 | 58,063,670 | 5.7 |
| Hotels, Restaurants & Leisure |
| Belmond Ltd. - Class A* (United Kingdom) | 1,983,125 | 49,637,619 | 4.9 |
| Melco International Development Limited(b) (Hong Kong) | 35,902,700 | 72,803,170 | 7.2 |
| Yum China Holdings, Inc. (China) | 1,134,022 | 38,023,757 | 3.7 |
| | | 160,464,546 | 15.8 |
| Industrial Conglomerates |
| CK Hutchison Holdings Limited (Hong Kong) | 7,318,000 | 70,239,707 | 6.9 |
| Insurance |
| Fairfax Financial Holdings Limited (Canada) | 95,827 | 42,184,376 | 4.2 |
| Interactive Media & Services |
| Baidu, Inc. ADR* (China) | 243,861 | 38,676,355 | 3.8 |
| Machinery |
| MinebeaMitsumi Inc. (Japan) | 4,250,200 | 61,287,937 | 6.1 |
| Metals & Mining |
| thyssenkrupp AG (Germany) | 1,170,559 | 20,107,831 | 2.0 |
| Real Estate Management & Development |
| CK Asset Holdings Limited (Hong Kong) | 6,575,000 | 48,106,511 | 4.8 |
| Great Eagle Holdings Limited(b) (Hong Kong) | 10,659,476 | 45,679,232 | 4.5 |
| | | 93,785,743 | 9.3 |
| Textiles, Apparel & Luxury Goods |
| Compagnie Financiere Richemont SA (Switzerland) | 320,197 | 20,648,746 | 2.0 |
| Wireless Telecommunication Services |
| Millicom International Cellular S.A. (Sweden) | 929,168 | 58,793,807 | 5.8 |
| Total Common Stocks (Cost $924,370,292) | | 964,565,432 | 95.3 |
| Options Purchased |
| | Notional Amount | | |
| Currency |
| Hong Kong Dollar Put, 7/19/19, with BNP Paribas, Strike Price $7.80 (Hong Kong) (Cost $841,850) | 149,000,000 | 357,600 | — |
See Notes to Financial Statements.
| Short-Term Obligations |
| | Principal Amount | Value | % of Net Assets |
| Repurchase agreement with State Street Bank, 0.50%, dated 12/31/18, due 01/02/19, Repurchase price $45,401,261 (Collateral: $46,312,272 U.S. Treasury Bond, 0.13% due 4/15/19, Par $43,535,000) (Cost $45,400,000) | 45,400,000 | $ 45,400,000 | 4.5% |
| Total Investments (Cost $970,612,142) | | 1,010,323,032 | 99.8 |
| Forward Currency Contracts | | (951,900) | (0.1) |
| Other Assets (Liabilities), Net | | 3,336,114 | 0.3 |
| Net Assets | | $1,012,707,246 | 100.0% |
| * | Non-income producing security. |
| (a) | See Note 3. |
| (b) | All or a portion of this security is restricted to cover the notional amount of forward currency contracts, total value $75,570,650. |
| Forward Currency Contracts |
| Currency Purchased | Currency Sold | Counterparty | Settlement Date | Unrealized Loss |
| USD 43,713,047 | RMB 301,860,446 | State Street | 6/19/19 | $(223,620) |
| USD 31,856,332 | RMB 223,908,755 | State Street | 12/18/19 | (728,280) |
| | | | | $(951,900) |
| Currency Abbreviation: |
| RMB - Chinese Renminbi |
| USD - U.S. Dollar |
| Country Weightings | |
| | Net Assets |
| Hong Kong | 23.4% |
| Netherlands | 11.9 |
| Switzerland | 8.2 |
| China | 7.5 |
| Japan | 6.1 |
| Sweden | 5.8 |
| Denmark | 5.7 |
| United Kingdom | 4.9 |
| France | 4.8 |
| Canada | 4.2 |
| Ireland | 4.0 |
| Mexico | 3.7 |
| India | 2.9 |
| Germany | 2.2 |
| Cash & Other | 4.7 |
| | 100.0% |
See Notes to Financial Statements.
Management Discussion(Unaudited)
Global Fund
Longleaf Partners Global Fund declined -17.22% in the fourth quarter, taking its 2018 return to -16.16%. The MSCI World Index fell -13.42% in the final three months and ended the year down -8.71%. Four primary challenges impacted the Fund’s absolute and relative returns in 2018. First, the Fund held an average 41% in U.S. stocks, while the Index had 59%. The strong dollar was a headwind, and U.S. stocks outperformed those based elsewhere, despite the large fourth quarter U.S. decline. Second, we were too early investing in General Electric (GE), which we averaged into but is trading below our cost. Third, we owned eight companies externally categorized in the Industrials sector, including the Fund’s biggest positive performer Vestas. Although these are diverse businesses with very different factors driving results, they collectively impacted the Fund’s return as the Industrials sector was among the worst performing areas of the market. Fourth, the strong investor preference for momentum-driven growth stocks, where we have limited exposure, continued to negatively impact undervalued businesses’ prices.
We periodically experience a year where either our geographic or sector exposure penalizes returns, our newer investments hit bottom after initial purchase or our approach is out of favor. In 2018, we suffered from all of these. Companies that missed short-term expectations generated the largest declines, with the market severely punishing those that disappointed in the fourth quarter. Additionally, stocks of businesses that had meaningful economic exposure in emerging markets (EMs), including China, suffered. Emerging markets declined as the Federal Reserve began increasing interest rates and later as fear of a U.S.-China trade war developed.
We believe stock prices largely ignored the positive progress that our companies and management partners made. In our view, stronger CEOs were secured at CenturyLink, GE and CNHI. Businesses sold assets for attractive prices, including Allergan, Fairfax, CK Asset, LafargeHolcim, United Technologies and GE. United Technologies and GE announced company breakup / simplification plans. Importantly, the primary business segments at most of our core holdings grew – Enterprise at CenturyLink, Cable at Comcast, Search and YouTube at Alphabet, Aesthetics (Botox) at Allergan, Ground at FedEx, Agriculture at CNHI, North American Cement at LafargeHolcim, Aviation and Healthcare at GE, Partner Re at EXOR, Retail at CK Hutchison, North American Fertilizer at OCI, Bearings at MinebeaMitsumi and Mass Gaming at Melco.
2018 results did not reflect the progress in the portfolio. During the year, we sold seven investments, added four new qualifiers and increased the Fund’s stake in seven others. Cash started the year at 13% but was below 2% by the end of December. Portfolio repositioning and value growth amid stock price declines helped the price-to-value (P/V) ratio move from the mid-70s% into the high-50s%, a somewhat rare level that has historically preceded strong absolute and relative returns in our longer lived Funds*.
Choppy markets and the economic uncertainty that feeds them could last for a while. To manage investment risk, we incorporate conservative-to-skeptical assumptions about the future, invest in a limited number of companies, have a broad and deep research network and engage with managements. We believe that the Fund’s compelling P/V, combined with the underlying strength of the businesses we own and the management teams leading them, may generate strong absolute and relative results going forward and that the payoff for 2018 company-level and portfolio-level progress is deferred but not lost.
Contributors/Detractors
(2018 Investment return; 2018 Fund contribution; Q4 Investment return; Q4 Fund contribution)
Vestas (7%, 0.58%, 12%, 0.61%), a global leader in onshore wind equipment and a provider of aftermarket services to the wind industry, rose double-digits in the fourth quarter and was the primary positive contributor for both the quarter and the year. The stock, which we bought in the first quarter, gained even more in local currency. The company reported three consecutive quarters of per megawatt pricing stabilization after eighteen months of negative pricing. Vestas continued to add new orders, particularly excelling against second-tier players. In the past, rapid market evolution, low barriers to entry and government subsidies characterized industry economics. However, the levelized cost of energy for new onshore wind (at good locations) has reached parity with traditional power providers and reduced the reliance on subsidies, making the industry more attractive. Vestas’s competitive advantages include economies of scale, accumulated know-how and a global service network. Since coming aboard in 2013, our corporate partners have fixed the balance sheet and transformed the company into a stable, net cash, dividend paying, share repurchasing company. Value has grown since our purchase, and the stock remains attractively discounted.
*Quarter-ends since 1993 were identified where the Longleaf Partners Fund’s “price-to-value ratio” (P/V) was less than 60%. From each quarter end identified, the 1, 3, and 5 year cumulative returns for the Fund and the S&P 500 were calculated. Those returns were then averaged and the 3 and 5 year returns were annualized. The results were: 18.46% for 1 year, 13.43% for 3 year, and 12.98% for 5 year for the Partners Fund and 7.39%, 8.29%, and 10.84% for the S&P 500. In addition, quarter-ends since 1998 were identified where the Longleaf Partners International Fund’s “price-to-value ratio” (P/V) was less than 60%. From each quarter end identified, the 1, 3, and 5 year cumulative returns for the Fund and the MSCI EAFE were calculated. Those returns were then averaged and the 3 and 5 year returns were annualized. The results were: 17.00% for 1 year, 10.49% for 3 year, and 11.28% for 5 year for the International Fund and 6.95%, 6.25% and 9.08% for the EAFE. Current circumstances may not be comparable.
General Electric (-54%, -3.12%, -32%, -1.88%), the aviation, healthcare and power company, fell throughout the year, making it the Fund’s largest detractor. GE’s former leadership and business model are dramatically different from what is in place today. The management team is new, plus the board has been reduced in size and upgraded in quality. The “business” and “price” parts of our investment case boil down to three main assumptions:
1) The best-in-class Aviation and Healthcare businesses continue to deliver strong profit growth, could be severed from the rest of GE and, we believe, are worth a combined $16+/share.
2) GE’s holdings in transportation and industrial services businesses Wabtec and Baker Hughes GE are solid, liquid and have self-help ability to grow earnings. Other smaller business like Renewables have demonstrably positive value. This group of assets is worth more than the net industrial debt/share of GE.
3) We believe the currently struggling Power business will recover over several years as the company and the industry right-size capacity and headwinds abate. GE Capital’s issues will continue to be addressed aggressively and will be smaller in the years to come. Even a negative value for GE Capital gets to an appraisal for the company that is over 2X the current stock price.
We slowly initiated our position in GE in late 2017 and bought most shares in the first seven months of 2018, after the unexpected increase in reserves for long-term care insurance at GE Capital. Nonetheless, we were too early, with an average cost basis in the low teens. Our adjusted appraisal approaches three times the current stock price, leaving ample margin of safety for a solid return even if some of our investment case assumptions above are wrong. Larry Culp, a legend given his record at Danaher, took the GE CEO job in September after doing deep diligence into the company’s challenges and prospects as a new board member earlier in 2018. GE stock must return to the high teens within four years for half of Culp’s long-term incentive shares to vest and generate the kind of CEO-level pay he could have easily secured elsewhere, and he receives additional shares only if the stock reaches $31 in that period. This degree of out-of-the-money alignment is both extremely rare and highly encouraging.
FedEx (-35%, -1.96%, -33%, -1.91%), the transportation and logistics company, fell in the fourth quarter and for the year. Express revenues missed expectations after weakness in all the major Euro economies and what CEO Fred Smith called “bad political choices” weighed down international trade. These headwinds caused the company to lower earnings per share (EPS) guidance by 8%. The stock’s sharp decline ignored that the Ground segment, the largest part of our appraisal, reported strong high-teens earnings growth. FedEx’s Freight segment also performed very well with EBITDA (earnings before interest, taxes, depreciation, and amortization) up over 20% in 2018. If the weakness in international trade persists, Ground should still grow revenues and margins. Because Amazon, another perceived risk to FedEx, constitutes less than 5% of company revenue, Amazon’s internal delivery development will have minimal effect on results. The company has a solid balance sheet and the potential to go on offense with share repurchase at these prices.
Melco (-30%, -1.30%, 2%, 0.31%), the Macau-based gaming company, declined for the year over concerns about decelerating growth with ongoing U.S.-China trade war issues, a slower Chinese economy and weakening Renminbi. The decline in China’s A-share markets and slow-down in neighboring province Guangdong (export hub of China) are likely to impact gross gaming revenues, but we believe most of the impact will be on the lower-margin VIP business. Increased profits from growing, higher-margin Mass visitors should compensate for any VIP decline over time, as infrastructure improvements (HK-Zhuhai-Macau bridge, high speed rail, etc.) and additional hotel room supply make Macau more accessible. Despite the stock’s decline, during 2018, our appraisal grew as reported earnings doubled. CEO Lawrence Ho created value for shareholders via buying out minorities at Melco Resorts Philippines at attractive multiples, IPOing Studio City to create opportunity for an ownership increase in 2019 and repurchasing discounted shares.
CK Hutchison (-21%, -1.18%, -17%, -1.04%), a Hong Kong based conglomerate of telecommunications, health & beauty, infrastructure, global ports and energy, fell during the final quarter and the year. While a trade war between China and the U.S. will pressure less than 5% of its Ports business, concerns of this trade tension generated broad negative sentiment around Asian stocks. In Italy, the company’s Telecommunications business struggled as a tough macro environment and increased competition from a new entrant pressured prices. In the second half of the year, declining oil prices impacted Husky Energy, the Canadian energy associate of CK Hutchison. These short-term headwinds negatively impacted sentiment, but the overall company’s cash flow, as well as management’s capital allocation decisions, helped our appraisal grow in the mid-single digits for the year. Chairman Victor Li sold CK Hutchison’s interests in several infrastructure projects at 12X EBITDA and redeployed the proceeds to acquire the Italian telecom joint venture at 5x EBITDA. The company also repurchased its discounted shares for the first time in almost two years.
LafargeHolcim (-25%, -1.13%, -17%, -0.72%), the largest global cement, aggregates and ready-mix concrete producer, was a 2018 detractor after a notable decline in the fourth quarter. Weaker cement demand in Latin America, the Middle East and Africa, as well as higher energy and transportation costs, globally impacted profits. With two thirds of consolidated revenues (but a smaller % of the net value) tied to emerging markets, broader EM concerns heavily contributed to the stock price weakness. CEO Jan Jenisch believes efficiency gains and pricing will offset cost inflation. The cost savings program is ahead of target, and Aggregates and Ready-Mix margins are improving. The company’s North American business, which represents over one quarter of our appraisal, grew profits during the year. The company announced the sale of its Indonesian assets at an attractive price, and management plans for additional divestments over the next two years, providing meaningful cash proceeds to reinvest.
CNHI (-32%, -1.10%, -25%, -0.80%), the maker of Case and New Holland agriculture equipment (AG) and Iveco trucks (CV), was a detractor in the quarter and for the year. The U.S.-China trade tension threatened tariffs that would impact AG purchases by U.S. farmers. Tariffs remain uncertain and if imposed, may have less impact than anticipated because of offsetting subsidies and current equipment demand from less discretionary replacement needs after a several year downturn. CNHI is in a solid position to withstand the potential challenge with an investment grade balance sheet, balanced channel inventory and positive pricing and product mix trends. New CEO Hubertus M. Mühlhäuser sees opportunities to improve margins. The company returned excess capital to shareholders in the form of dividends and buybacks. The company also has upside from streamlining its disparate non-AG assets via either sales or spin-offs.
CNX (-22%, -1.05%, -20%, -1%), the Appalachian natural gas company, detracted for the year. The stock declined after reporting an 8.5% increase in capital expenditure guidance during the second quarter. Additionally, nearly all energy stocks had a sharp selloff following the fourth quarter’s commodity price volatility. CEO Nick DeIuliis took advantage of the dislocation by repurchasing over 16% of CNX’s outstanding shares in the 12 months ended in October. Our appraisal increased with the company’s growth in cash flow. In June, CNX sold its Ohio Utica acreage for a good price. The company has other non-core assets to monetize in coming years. Most production is hedged several years out, helping to insulate the business’s value from declines in the gas strip. The stock trades at below half of our appraisal.
EXOR (-10%, -1.04%, -19%, -1.44%), one of Europe’s leading investment holding companies, fell in the fourth quarter and became a detractor for the year. Italy’s economic uncertainty and EXOR’s conglomerate structure impacted the stock, which is listed in Italy but has less than 5% of its value based there. Additionally, the general breakdown of global trade and frictionless borders pressured the stock since this could affect Fiat Chrysler Automobiles (FCA) brands in China and indirectly impact CNHI’s AG sales. The main component pieces of our appraisal are FCA (35%), PartnerRe (24%), CNHI (19%), and Ferrari (17%). EXOR reported much good news in 2018. FCA sold Magnetti Marelli for significantly more than our appraisal with much of the proceeds to be paid out as a special dividend, giving EXOR the capital for its announced share buyback. FCA announced a new recurring dividend, doubling EXOR’s free cash flow (FCF). Crown jewel Ferrari continued to perform well. CEO John Elkann is an owner-operator who has grown corporate value and seen the stock compound at nearly 20% per year since we invested in 2012, despite the 2018 return. We have an overweight position in this collection of high quality businesses and assets that have ample transformation value and are selling at a deep discount to the sum-of-the-parts value in the hands of a proven and aligned partner.
CenturyLink (2%, -0.31%, -26%, -2.71%), the telecommunications company, was a fourth quarter detractor, but ended slightly up for the year after substantial gains earlier in 2018. The stock declined after third-quarter revenues came in below expectations, but our appraisal rose with 7% yearly EBITDA growth as higher margin revenue within the Enterprise segment increased and consolidated FCF nearly doubled year-over-year. CenturyLink’s FCF is more than $3.00 per share and growing, yet the stock trades around $15. Revenues declined in part because the company wisely exited unprofitable business lines, prioritizing capital efficiency and deleveraging over top line growth. The dividend moved back up to a mid-teens yield with minimal chance of any cut (Update at February 19, 2019: CTL did cut the dividend to use the cash instead to strengthen the balance sheet. We believe a better way to address the balance sheet is to explore asset sales given the multiples being paid in fiber transactions, and/or to issue tracking stocks for the separate Fiber and Consumer segments to highlight their values and offer the potential to raise capital. Southeastern filed a 13-D to talk to interested buyers and nominate appropriately experienced directors to the board. The dividend cut did not alter our appraisal of the company or its earnings power). We expect consolidated EBITDA to grow by a low-single digits percentage next year, but within that number we believe high-value Enterprise fiber revenues and cash flows will grow above that, making up for the low-quality legacy landline run off. CenturyLink remains an overweight position given its deep discount and the quality of both its management team, led by CEO Jeff Storey, and its fiber assets, which we believe are of high strategic value to numerous infrastructure investors.
Portfolio Activity
Swings in stock prices generated portfolio activity in 2018, ultimately driving cash from 13% to 2%. We sold seven investments – Wynn, Chesapeake and Yum China in the first quarter, CONSOL Energy and Genting in the third and Ferrovial and Hopewell in the fourth. The Fund had previously held Ferrovial, the Spanish transport infrastructure company that owns toll roads in Europe and North America, airports in Europe, including London Heathrow, and infrastructure construction and servicing businesses. The company’s Spanish and British businesses faced increasing headwinds, including Catalonia and Brexit uncertainty. Given less certain prospective value growth and the rising interest rate environment, we sold the position. During our two-year investment, we earned over 20% as traffic and pricing increased on the company’s toll roads and at Heathrow, even as European headwinds mounted. We also sold Hopewell Holdings, the Hong Kong-listed property company. The stock rose during the year with the special cash dividend in April from the sale of the company’s ownership in Hopewell Highway Infrastructure toll road company for 20% above our appraisal. We sold the stock, which gained 31% over four years, in order to redeploy the capital into available investments with much more attractive value growth.
We bought two new investments in the first quarter, Comcast and top performing Vestas, Yum China in the third, and MinebeaMitsui in the fourth. Comcast and Yum China are “recycles” that we successfully invested in previously, and MinebeaMitsui, while new to the Global Fund, has been a holding in our Asia Pacific strategy for over a year. Recycles tend to have fewer surprises since we have closely followed the business as owners and have already deeply engaged with our management partners.
Outlook
We are neither pleased nor complacent about 2018 returns. As your largest co-investors in the Fund, we believe it is a compelling time to add to Longleaf Global. First, a P/V at this level is rare, and we think portends an exceptional next few years. Second, the Fund’s cash position is below 2%, and our on-deck list of prospective qualifiers is robust. Third, numerous companies in the portfolio either have corporate transactions in process or are good candidates for prospective activity over the next few years, with capable management partners who can control their own destiny in terms of value realization. We are working with boards and leaders at certain holdings to accelerate this realization.
Performance History(Unaudited)
Global Fund
Comparison of Change in Value of $10,000 Investment
Since Inception December 27, 2012
| Average Annual Returns for the Periods Ended December 31, 2018 |
| | 1 Year | 5 Year | Since Inception
12/27/2012 |
| Global Fund | -16.16% | 0.68% | 4.83% |
| MSCI World Index | -8.71 | 4.56 | 7.98 |
The index is unmanaged. Returns reflect reinvested capital gains and dividends but not the deduction of taxes an investor would pay on distributions or share redemptions. Performance data quoted represents past performance; past performance does not guarantee future results. The investment return and principal value of an investment will fluctuate so that an investor’s shares, when redeemed, may be worth more or less than their original cost. Current performance of the Fund may be lower or higher than the performance quoted. Performance data current to the most recent month end may be obtained by visiting longleafpartners.com. The Global Fund is subject to stock market risk, meaning stocks in the Fund may fluctuate in response to developments at individual companies or due to general market and economic conditions. Also, because the Fund generally invests in 15 to 25 companies, share value could fluctuate more than if a greater number of securities were held. Investing in non-U.S. securities may entail risk due to non-U.S. economic and political developments, exposure to non-U.S. currencies, and different accounting and financial standards. These risks may be higher when investing in emerging markets.
As reported in the Prospectus dated May 1, 2018, the total expense ratio for the Global Fund is 1.48% (gross) and 1.20% (net). The expense ratio is subject to fee waiver to the extent normal annual operating expenses exceed 1.20% of average annual net assets.
Portfolio Summary(Unaudited)
Global Fund
Portfolio Holdings at December 31, 2018 |
|
|
| | | Net Assets |
| Investments | | 98.1% |
| CenturyLink, Inc. | 8.6 | |
| EXOR N.V. | 7.9 | |
| Melco International Development Limited | 7.3 | |
| Vestas Wind Systems A/S | 6.9 | |
| CK Hutchison Holdings Limited | 6.9 | |
| General Electric Company | 5.8 | |
| FedEx Corporation | 5.4 | |
| Fairfax Financial Holdings Limited | 4.9 | |
| Alphabet Inc. | 4.8 | |
| LafargeHolcim Ltd | 4.8 | |
| CK Asset Holdings Limited | 4.6 | |
| Allergan plc | 4.6 | |
| CNX Resources Corporation | 4.4 | |
| OCI N.V. | 4.3 | |
| United Technologies Corporation | 4.0 | |
| Comcast Corporation | 3.8 | |
| Yum China Holdings, Inc. | 3.4 | |
| CNH Industrial N.V. | 3.2 | |
| MinebeaMitsumi Inc. | 2.5 | |
| Cash Reserves Net of Other Assets and Liabilities | | 1.9 |
| | | 100.0% |
Fund holdings are subject to change and holding discussions are not recommendations to buy or sell any security.
Portfolio Changes
January 1, 2018 through
December 31, 2018 | |
| New Holdings | Quarter |
| Comcast Corporation | 1Q |
| MinebeaMitsumi Inc. | 4Q |
| Vestas Wind Systems A/S | 1Q |
| Yum China Holdings, Inc. | 3Q |
| Eliminations | |
| Chesapeake Energy Corporation | 1Q |
| CONSOL Energy | 3Q |
| Ferrovial S.A. | 4Q |
| Genting Berhad | 4Q |
| Hopewell Holdings Limited | 4Q |
| Wynn Resorts, Limited | 1Q |
| Yum China Holdings, Inc. | 1Q |
Portfolio of Investments
Global Fund
| Common Stocks |
| | Shares | Value | % of Net Assets |
| Aerospace & Defense |
| United Technologies Corporation(a) (United States) | 79,985 | $ 8,516,803 | 4.0% |
| Air Freight & Logistics |
| FedEx Corporation(a) (United States) | 71,274 | 11,498,634 | 5.4 |
| Chemicals |
| OCI N.V.*(b) (Netherlands) | 450,464 | 9,199,327 | 4.3 |
| Construction Materials |
| LafargeHolcim Ltd (French Exchange)(b) (Switzerland) | 205,845 | 8,443,082 | 4.0 |
| LafargeHolcim Ltd (Swiss Exchange)(b) (Switzerland) | 42,410 | 1,750,201 | 0.8 |
| | | 10,193,283 | 4.8 |
| Diversified Financial Services |
| EXOR N.V. (Netherlands) | 309,470 | 16,800,325 | 7.9 |
| Diversified Telecommunication Services |
| CenturyLink, Inc. (United States) | 1,207,254 | 18,289,898 | 8.6 |
| Electrical Equipment |
| Vestas Wind Systems A/S (Denmark) | 194,656 | 14,735,197 | 6.9 |
| Hotels, Restaurants & Leisure |
| Melco International Development Limited (Hong Kong) | 7,654,388 | 15,521,499 | 7.3 |
| Yum China Holdings, Inc. (China) | 216,521 | 7,259,949 | 3.4 |
| | | 22,781,448 | 10.7 |
| Industrial Conglomerates |
| CK Hutchison Holdings Limited (Hong Kong) | 1,522,029 | 14,608,755 | 6.9 |
| General Electric Company (United States) | 1,630,392 | 12,342,068 | 5.8 |
| | | 26,950,823 | 12.7 |
| Insurance |
| Fairfax Financial Holdings Limited (Canada) | 23,482 | 10,337,102 | 4.9 |
| Interactive Media & Services |
| Alphabet Inc. - Class C*(a) (United States) | 9,909 | 10,261,859 | 4.8 |
| Machinery |
| CNH Industrial N.V. (Netherlands) | 747,953 | 6,757,979 | 3.2 |
| MinebeaMitsumi Inc. (Japan) | 372,100 | 5,365,687 | 2.5 |
| | | 12,123,666 | 5.7 |
| Media |
| Comcast Corporation - Class A (United States) | 235,984 | 8,035,255 | 3.8 |
| Oil, Gas & Consumable Fuels |
| CNX Resources Corporation* (United States) | 825,368 | 9,425,703 | 4.4 |
| Pharmaceuticals |
| Allergan plc (United States) | 72,656 | 9,711,201 | 4.6 |
| Real Estate Management & Development |
| CK Asset Holdings Limited (Hong Kong) | 1,350,029 | 9,877,595 | 4.6 |
| Total Common Stocks (Cost $220,923,617) | | 208,738,119 | 98.1 |
| Options Purchased |
| | Notional Amount | | |
| Currency |
| Hong Kong Dollar Put, 7/19/19, with BNP Paribas, Strike Price $7.80 (Hong Kong) (Cost $144,075) | 25,500,000 | 61,200 | — |
See Notes to Financial Statements.
| Short-Term Obligations |
| | Principal Amount | Value | % of Net Assets |
| Repurchase agreement with State Street Bank, 0.50%, dated 12/31/18, due 01/02/19, Repurchase price $3,608,100 (Collateral: $3,680,727 U.S. Treasury Bond, 0.13% due 4/15/19, Par $3,460,000) (Cost $3,608,000) | 3,608,000 | $ 3,608,000 | 1.7% |
| Total Investments (Cost $224,675,692) | | 212,407,319 | 99.8 |
| Forward Currency Contracts | | (175,409) | (0.1) |
| Other Assets (Liabilities), Net | | 591,799 | 0.3 |
| Net Assets | | $212,823,709 | 100.0% |
| * | Non-income producing security. |
| (a) | All or a portion of this security is restricted to cover the notional amount of forward currency contracts, total value $7,197,217. |
| (b) | See Note 3. |
| Forward Currency Contracts |
| Currency Purchased | Currency Sold | Counterparty | Settlement Date | Unrealized Loss |
| USD 7,196,307 | RMB 50,655,560 | State Street | 12/18/19 | $(175,409) |
| Currency Abbreviation: |
| RMB - Chinese Renminbi |
| USD - U.S. Dollar |
| Country Weightings | |
| | Net Assets |
| United States | 41.4% |
| Hong Kong | 18.8 |
| Netherlands | 15.4 |
| Denmark | 6.9 |
| Canada | 4.9 |
| Switzerland | 4.8 |
| China | 3.4 |
| Japan | 2.5 |
| Cash & Other | 1.9 |
| | 100.0% |
See Notes to Financial Statements.
Statements of Assets and Liabilities
at December 31, 2018
| | Partners
Fund | Small-Cap
Fund | International
Fund | Global
Fund |
| Assets: | | | | |
| Affiliated investments, at value (Cost $279,785,454, $1,705,363,386, $0, $0, respectively) | $121,119,252 | $1,547,731,926 | $— | $— |
| Controlled investments, at value (Cost $0, $229,430,000, $0, $0, respectively) | — | 158,971,140 | — | — |
| Non-affiliated securities, at value (Cost $1,936,703,902, $1,499,088,787, $970,612,142, $224,675,692, respectively) | 1,850,465,111 | 1,401,273,011 | 1,010,323,032 | 212,407,319 |
| Cash | 990 | 642 | 82 | 538 |
| Receivable from: | | | | |
| Fund shares sold | 627,418 | 5,520,149 | 4,064,499 | 902,623 |
| Dividends and interest | 4,324,711 | 13,179,081 | 112,461 | 118,717 |
| Securities sold | 12,802,689 | 2,907,641 | 330,063 | — |
| Investment Counsel | — | — | 81,166 | — |
| Foreign tax reclaims | — | — | 311,383 | 50,706 |
| Other assets | 97,697 | 125,002 | 36,208 | 7,351 |
| Total Assets | 1,989,437,868 | 3,129,708,592 | 1,015,258,894 | 213,487,254 |
| Liabilities: | | | | |
| Payable for: | | | | |
| Fund shares redeemed | 7,497,861 | 17,606,262 | 576,297 | 195,705 |
| Investment Counsel fee | 1,442,068 | 2,190,693 | 866,383 | 217,988 |
| Administration fee | 180,952 | 280,768 | 86,828 | 17,475 |
| Unrealized loss on forward currency contracts | — | — | 951,900 | 175,409 |
| Other accrued expenses | 236,092 | 194,596 | 70,240 | 56,968 |
| Total Liabilities | 9,356,973 | 20,272,319 | 2,551,648 | 663,545 |
| Net Assets | $1,980,080,895 | $3,109,436,273 | $1,012,707,246 | $212,823,709 |
| Net assets consist of: | | | | |
| Paid-in capital | $2,226,966,755 | $3,441,880,590 | $973,594,942 | $225,273,500 |
| Total distributable earnings | $(246,885,860) | $(332,444,317) | $39,112,304 | $(12,449,791) |
| Net Assets | $1,980,080,895 | $3,109,436,273 | $1,012,707,246 | $212,823,709 |
| Net asset value per share | $18.35 | $22.10 | $15.26 | $11.25 |
| Fund shares issued and outstanding (unlimited number of shares authorized, no par value) | 107,884,296 | 140,729,459 | 66,356,527 | 18,917,019 |
See Notes to Financial Statements.
Statements of Operations
For the Year Ended December 31, 2018
| | Partners
Fund | Small-Cap
Fund | International
Fund | Global
Fund |
| Investment Income: | | | | |
| Dividends from non-affiliates (net of foreign tax withheld of $537,567, $0, $777,289, $83,070, respectively) | $70,730,839 | $34,197,271 | $21,028,498 | $5,636,657 |
| Dividends from affiliates | — | 33,455,849 | — | — |
| Dividends from controlled investments | — | 10,253,650 | — | — |
| Interest from non-affiliates | 4,527,751 | 57,159,783 | 919,065 | 92,545 |
| Total Investment Income | 75,258,590 | 135,066,553 | 21,947,563 | 5,729,202 |
| Expenses: | | | | |
| Investment Counsel fee | 23,074,902 | 29,719,055 | 11,540,461 | 2,692,666 |
| Administration fee | 2,943,320 | 3,829,207 | 1,138,553 | 239,348 |
| Transfer agent fees and expenses | 1,313,153 | 632,095 | 418,481 | 63,456 |
| Trustees’ fees and expenses | 448,154 | 571,869 | 170,017 | 36,465 |
| Custodian fees and expenses | 206,910 | 135,303 | 255,050 | 52,727 |
| Other | 454,422 | 385,630 | 200,101 | 105,155 |
| Total Expenses | 28,440,861 | 35,273,159 | 13,722,663 | 3,189,817 |
| Expenses waived and/or reimbursed | — | — | (256,021) | (317,630) |
| Net expenses | 28,440,861 | 35,273,159 | 13,466,642 | 2,872,187 |
| Net Investment Income | 46,817,729 | 99,793,394 | 8,480,921 | 2,857,015 |
| Realized and Unrealized Loss: | | | | |
| Net Realized Gain: | | | | |
| Non-affiliated securities | 251,261,976 | 119,225,769 | 48,156,438 | 9,934,639 |
| Affiliated securities | 1,576,887 | 110,944,091 | — | — |
| Forward currency contracts | — | — | (3,708,135) | (285,245) |
| Forward currency transactions | (126,029) | (3,860) | (91,597) | 2,458 |
| Net Realized Gain | 252,712,834 | 230,166,000 | 44,356,706 | 9,651,852 |
| Change in Unrealized Appreciation (Depreciation): | | | | |
| Non-affiliated securities | (723,557,937) | (262,539,815) | (135,694,304) | (51,321,609) |
| Affiliated securities | (30,322,250) | (275,500,349) | — | — |
| Controlled investments | — | (745,846) | — | — |
| Forward currency contracts | — | — | 4,120,562 | 33,859 |
| Foreign currency transactions | — | — | (9,227) | (3,092) |
| Net Change in Unrealized Depreciation | (753,880,187) | (538,786,010) | (131,582,969) | (51,290,842) |
| Net Realized and Unrealized Loss | (501,167,353) | (308,620,010) | (87,226,263) | (41,638,990) |
| Net Decrease in Net Assets Resulting from Operations | $(454,349,624) | $(208,826,616) | $(78,745,342) | $(38,781,975) |
See Notes to Financial Statements.
Statements of Changes in Net Assets
| | Partners Fund | | Small-Cap Fund |
| | Year Ended
December 31, | Year Ended
December 31, | | Year Ended
December 31, | Year Ended
December 31, |
| | 2018 | 2017 | | 2018 | 2017 |
| Operations: | | | | | |
| Net investment income | $46,817,729 | $14,991,227 | | $99,793,394 | $67,317,277 |
| Net realized gain from investments and foreign currency transactions | 252,712,834 | 574,611,796 | | 230,166,000 | 507,291,035 |
| Net change in unrealized appreciation (depreciation) from investments and foreign currency transactions | (753,880,187) | (103,348,950) | | (538,786,010) | (226,964,132) |
| Net increase (decrease) in net assets resulting from operations | (454,349,624) | 486,254,073 | | (208,826,616) | 347,644,180 |
| Distributions to Shareholders: | | | | | |
| Total distributions | (406,781,530) | (278,435,451)1 | | (525,911,606) | (309,775,384)1 |
| Capital Share Transactions: | | | | | |
| Net proceeds from sale of shares | 73,068,942 | 73,944,693 | | 339,022,106 | 321,311,467 |
| Reinvestment of shareholder distributions | 370,784,337 | 257,051,190 | | 407,614,634 | 240,839,718 |
| Cost of shares redeemed | (896,174,101) | (693,569,794) | | (708,058,893) | (790,084,639) |
| Net increase (decrease) in net assets from fund share transactions | (452,320,822) | (362,573,911) | | 38,577,847 | (227,933,454) |
| Total increase (decrease) in net assets | (1,313,451,976) | (154,755,289) | | (696,160,375) | (190,064,658) |
| Net Assets: | | | | | |
| Beginning of year | 3,293,532,871 | 3,448,288,160 | | 3,805,596,648 | 3,995,661,306 |
| End of year | $1,980,080,895 | $3,293,532,8713 | | $3,109,436,273 | $3,805,596,6483 |
| Capital Share Transactions: | | | | | |
| Issued | 2,849,576 | 2,776,283 | | 12,350,260 | 11,329,725 |
| Reinvested | 17,578,051 | 9,789,569 | | 16,606,718 | 8,738,049 |
| Redeemed | (35,255,000) | (25,838,716) | | (26,087,053) | (27,555,411) |
| Net increase (decrease) in shares outstanding | (14,827,373) | (13,272,864) | | 2,869,925 | (7,487,637) |
| 1 | Reclassified to conform with current period presentation to reflect changes prescribed in amendments to Regulation S-X. Distributions to shareholders from net investment income and net realized gains on investments were $(40,004,719) and $(238,430,732) for Partners Fund and $(61,941,724) and (247,833,660) for Small-Cap Fund, respectively. |
| 3 | Includes undistributed net investment income of $2,730,664 and $2,051,734 for Partners Fund and Small-Cap Fund, respectively. |
See Notes to Financial Statements.
| | International Fund | | Global Fund |
| | Year Ended
December 31, | Year Ended
December 31, | | Year Ended
December 31, | Year Ended
December 31, |
| | 2018 | 2017 | | 2018 | 2017 |
| Operations: | | | | | |
| Net investment income | $8,480,921 | $3,823,708 | | $2,857,015 | $776,084 |
| Net realized gain from investments and foreign currency transactions | 44,356,706 | 74,413,792 | | 9,651,852 | 13,460,561 |
| Net change in unrealized appreciation (depreciation) from investments and foreign currency transactions | (131,582,969) | 160,641,931 | | (51,290,842) | 34,481,120 |
| Net increase (decrease) in net assets resulting from operations | (78,745,342) | 238,879,431 | | (38,781,975) | 48,717,765 |
| Distributions to Shareholders: | | | | | |
| Total distributions | (13,254,171) | (12,446,317)2 | | (22,556,605) | (2,594,854)2 |
| Capital Share Transactions: | | | | | |
| Net proceeds from sale of shares | 129,873,910 | 134,261,807 | | 42,509,889 | 25,952,131 |
| Reinvestment of shareholder distributions | 11,894,969 | 11,154,846 | | 16,718,201 | 1,939,912 |
| Cost of shares redeemed | (214,259,101) | (183,395,778) | | (23,930,583) | (22,733,780) |
| Net increase (decrease) in net assets from fund share transactions | (72,490,222) | (37,979,125) | | 35,297,507 | 5,158,263 |
| Total increase (decrease) in net assets | (164,489,735) | 188,453,989 | | (26,041,073) | 51,281,174 |
| Net Assets: | | | | | |
| Beginning of year | 1,177,196,981 | 988,742,992 | | 238,864,782 | 187,583,608 |
| End of year | $1,012,707,246 | $1,177,196,9814 | | $212,823,709 | $238,864,7824 |
| Capital Share Transactions: | | | | | |
| Issued | 7,889,524 | 8,771,323 | | 3,418,290 | 1,864,982 |
| Reinvested | 761,033 | 672,785 | | 1,349,912 | 134,321 |
| Redeemed | (13,081,494) | (11,725,377) | | (1,836,497) | (1,703,455) |
| Net increase (decrease) in shares outstanding | (4,430,937) | (2,281,269) | | 2,931,705 | 295,848 |
| 2 | Reclassified to conform with current period presentation to reflect changes prescribed in amendments to Regulation S-X. Distributions to shareholders from net investment income and net realized gains on investments were $(12,446,317) and $(-) for International Fund and $(528,457) and $(2,066,397) for Global Fund, respectively. |
| 4 | Includes undistributed net investment loss of $(22,109,997) and $(-) for International Fund and Global Fund, respectively. |
See Notes to Financial Statements.
Notes to Financial Statements
Note 1. Organization
Longleaf Partners Fund, Longleaf Partners Small-Cap Fund, Longleaf Partners International Fund, and Longleaf Partners Global Fund (the “Funds”) are non-diversified and each is a series of Longleaf Partners Funds Trust, a Massachusetts business trust, which is registered as an open-end management investment company under the Investment Company Act of 1940, as amended.
Note 2. Significant Accounting Policies
The Funds follow the accounting and reporting guidance in FASB Accounting Standards Codification 946.
Management Estimates
The accompanying financial statements are prepared in accordance with U.S. generally accepted accounting principles (“U.S. GAAP”); these principles may require the use of estimates by Fund management. Actual results could differ from those estimates.
Security Valuation
The following is a description of the valuation techniques applied to the Funds' investments (see also Note 7. Fair Value Measurements).
Portfolio securities listed or traded on a securities exchange (U.S. or foreign), on the NASDAQ national market, or any representative quotation system providing same day publication of actual prices, are valued at the last sale price, and categorized as Level 1 of the fair value hierarchy. If there are no transactions in the security that day, securities are valued at the midpoint between the closing bid and ask prices or, if there are no such prices, the prior day's close, and categorized as Level 2.
In the case of bonds and other fixed income securities, valuations are furnished by a pricing service which takes into account factors in addition to quoted prices (such as trading characteristics, yield, quality, coupon rate, maturity, type of issue, and other market data relating to the priced security or other similar securities) where taking such factors into account would lead to a more accurate reflection of the fair market value of such securities. Such securities are categorized as Level 2.
When market quotations are not readily available, valuations of portfolio securities are determined in accordance with procedures established by and under the general supervision of the Funds' Board of Trustees (the “Board”). In determining fair value, the Board considers relevant qualitative and quantitative information including news regarding significant market or security specific events. The Board may also utilize a service provided by an independent third party to assist in fair valuation of certain securities. These factors are subject to change over time and are reviewed periodically. Because the utilization of fair value depends on market activity, the frequency with which fair valuation may be used cannot be predicted. Estimated values may differ from the values that would have been used had a ready market for the investment existed. Such securities are categorized as either Level 2 or 3.
Repurchase agreements are valued at cost which, combined with accrued interest, approximates market value. Short-term U.S. Government obligations purchased with a remaining maturity of more than 60 days are valued through pricing obtained through pricing services approved by the Funds' Trustees. Obligations purchased with a remaining maturity of 60 days or less or existing positions that have less than 60 days to maturity generally are valued at amortized cost, which approximates market value. However, if amortized cost is deemed not to reflect fair value, the securities are valued at prices furnished by dealers who make markets in such securities or by an independent pricing service. Such securities are categorized as Level 2.
The Funds determine net asset values (“NAVs”) once a day, at the close of regular trading on the New York Stock Exchange (“Exchange”) (usually at 4:00 p.m. Eastern time) on days the Exchange is open for business. The Exchange is closed for specified national holidays and on weekends. Foreign securities are generally priced at the latest market close in the foreign market, which may be at different times or days than the close of the Exchange. If country specific (i.e. natural disaster, economic or political developments), issuer specific (i.e. earnings report, merger announcement), or U.S. markets-specific (i.e. significant movement in U.S. markets that would likely affect the value of foreign securities) events occur which could materially affect the NAV between the close of the foreign market and normal pricing at the close of the Exchange, foreign securities may be fair valued by the Board using observable data (i.e. trading in depository receipts) or using an external pricing service approved by the Board. The pricing service uses an automated system incorporating a model based on multiple parameters, including a security’s local closing price, relevant general and sector indices, currency fluctuations, trading in depositary receipts and futures, if applicable, and/or research valuations by its staff, in determining what it believes is the fair value of the securities. Such securities are categorized as Level 2.
Security Transactions
For financial reporting purposes, the Funds record security transactions on trade date. Realized gains and losses on security transactions are determined using the specific identification method. Dividend income is recognized on the ex-dividend date, except that certain dividends from foreign securities are recorded as soon after the ex-dividend date as the Fund is able to obtain information on the dividend. Interest income is recognized on an accrual basis and includes, where applicable, the amortization of premium or accretion of discount using the effective interest method. The Funds record distributions received from investments in Real Estate Investment Trusts (“REITs”) and Master Limited Partnerships ("MLPs") in excess of income from underlying investments as a reduction of cost of investments and/or realized gain. Such amounts are based on estimates if actual amounts are not available and actual amounts of income, realized gain and return of capital may differ from the estimated amounts. The Funds adjust the estimated amounts once the issuers provide information about the actual composition of the distributions.
The Funds’ investments in debt securities may contain payment-in-kind ("PIK") interest provisions. PIK interest, which represents contractually deferred interest added to the loan balance that is generally due at the end of the loan term, is generally recorded on the accrual basis to the extent such amounts are expected to be collected. The Funds generally cease accruing PIK interest if there is insufficient value to support the accrual or if the Funds do not expect the underlying company to be able to pay all principal and interest due.
Distributions to Shareholders
Dividends from net investment income, if any, are declared and distributed to shareholders annually. Net realized capital gains from investment transactions, if any, are declared and distributed to shareholders at least annually. Furthermore, capital gains are distributed only to the extent they exceed available capital loss carryforwards. Distributions to shareholders are recorded on the ex-dividend date. The amount and timing of distributions are determined in accordance with federal income tax regulations, which may differ from U.S. GAAP.
Federal Income Taxes
The Funds' policy is to comply with the requirements of Subchapter M of the Internal Revenue Code applicable to regulated investment companies and to distribute substantially all taxable income to shareholders. Accordingly, no federal income tax provision is required. Reclassifications are made within the Funds' capital accounts for permanent book and tax basis differences.
Foreign Currency Translations
The books and records of the Funds are maintained in U.S. dollars. Securities denominated in currencies other than U.S. dollars are subject to changes in value due to fluctuations in exchange rates. Purchases and sales of securities and income and expenses are translated into U.S. dollars at the prevailing exchange rate on the respective date of each transaction. The market values of investment securities, assets and liabilities are translated into U.S. dollars daily. The Funds do not isolate the portion of net realized and unrealized gains or losses in security investments which are attributable to changes in foreign exchange rates. Accordingly, the impact of such changes is included in the realized and unrealized gains or losses on the underlying securities.
Repurchase Agreements
The Funds may engage in repurchase agreement transactions. The Fixed Income Clearing Corporation (“FICC”) sells U.S. government or agency securities to each Fund under agreements to repurchase these securities at a stated repurchase price including interest for the term of the agreement, which is usually overnight or over a weekend. Each Fund, through FICC, receives delivery of the underlying U.S. government or agency securities as collateral, whose market value is required to be at least equal to the repurchase price. If FICC becomes bankrupt, the Fund might be delayed, or may incur costs or possible losses of principal and income, in selling the collateral.
Warrants
The Funds may invest in warrants and stock purchase rights of companies, which gives the Funds the right to buy stock. The warrant specifies the amount of the underlying stock, the exercise price, and the date the warrant expires. The Funds have no obligation to exercise the warrant and buy the stock.
Options
The Funds may purchase and sell (“write”) call and put options on various instruments including securities to gain long or short exposure to the underlying instruments. An option contract gives the buyer the right, but not the obligation, to buy (call) or sell (put) an underlying item at a fixed exercise price on a certain date or during a specified period. The cost of securities
acquired through the exercise of a call option is increased by the premiums paid. The proceeds from securities sold through the exercise of a purchased put option are decreased by the premiums paid. The cost of purchased options that expire unexercised are treated, on expiration date, as realized losses on investments.
The market value of an exchange traded option is the last sales price, and are categorized in Level 1 of the fair value hierchy. Over-thecounter (“OTC”) options are valued at the mean of their closing bid and ask prices supplied by the counterparty in accordance with fair value procedures established by and under the general supervision of the Funds' Trustees, and are categorized in Level 2 of the fair value hierarchy.
Risk of Options
Gains on investment in options may depend on correctly predicting the market value direction of the underlying security. There can be no assurance that a liquid market will exist when a Fund seeks to close out an option position and a Fund may experience losses as a result of such illiquidity. Listed options involve minimal counter-party risk since listed options are guaranteed against default by the exchange on which they trade. When purchasing OTC options, the Funds bear the risk of economic loss from counterparty default, equal to the market value of the option.
Forward Currency Contracts
The Funds may use forward currency contracts for hedging purposes to offset currency exposure in portfolio holdings. Forward currency contracts are commitments to purchase or sell a foreign currency at a future maturity date at a prespecified price. The resulting obligation is marked-to-market daily using foreign currency exchange rates supplied by an independent pricing service, and are categorized in Level 2 of the fair value hierarchy. An unrealized gain or loss is recorded for the difference between the contract opening value and its current value. When a contract is closed or delivery is taken, this gain or loss is realized. For federal tax purposes, gain or loss on open forward contracts in qualifying currencies are treated as realized and are subject to distribution at our excise tax year-end date.
Risk of Forward Currency Contracts
Forward contracts may reduce the potential gain from a positive change in the relationship between the U.S. dollar and foreign currencies or, considered separately, may produce a loss. Not all foreign currencies can be effectively hedged; and the costs of hedging may outweigh the benefits. If our hedging strategy does not correlate well with market and currency movements, price volatility of the portfolio could increase. Where a liquid secondary market for forwards does not exist, the Funds may not be able to close their positions and in such an event, the loss is theoretically unlimited. In addition, the Funds could be exposed to risks if the counterparty to these contracts is unable to perform.
Counterparty Risk and Collateral
The Funds have entered into collateral agreements with counterparties to mitigate risk on OTC derivatives. Collateral is generally determined based on the net unrealized gain or loss with each counterparty, subject to minimum exposure amounts. Collateral, both pledged by and for the benefit of a Fund, is held in a segregated account at the Funds' custodian bank and is comprised of assets specific to each agreement.
Note 3. Investment Counsel Agreement and Other Transactions with Affiliates
Southeastern Asset Management, Inc. (“Southeastern”) serves as Investment Counsel to the Funds and receives annual compensation, computed daily and paid monthly, in accordance with the following schedule:
| Partners Fund | 1.00% on first $400 million of average net assets
0.75% in excess of $400 million |
| Small-Cap Fund | 1.00% on first $400 million of average net assets
0.75% in excess of $400 million |
| International Fund | 1.10% on first $500 million of average net assets
0.90% in excess of $500 million* |
| Global Fund | 1.125% on first $500 million of average net assets
1.00% in excess of $500 million |
| * | Prior to April 1, 2018, the International Fund paid 1.20% on first $500 million of average net assets, and 1.00% in excess of $500 million. |
Southeastern has contractually committed to waive fees and/or reimburse expenses so that each Fund's annual operating expenses (excluding taxes, interest, brokerage fees, and extraordinary expenses) do not exceed the following:
| Partners Fund | 1.50% |
| Small-Cap Fund | 1.50 |
| International Fund | 1.15* |
| Global Fund | 1.20 |
| * | Prior to April 1, 2018, the International Fund expense limit was 1.75% of average net assets per year. |
During the period ended December 31, 2018, Southeastern waived and/or reimbursed $256,021 and $317,630 expenses of International Fund and Global Fund, respectively. The International Fund and Global Fund agreement is in effect through at least October 31, 2019 and may not be terminated before that date without Board approval.
Southeastern also serves as the Fund Administrator and in this capacity is responsible for managing, performing or supervising the administrative and business operations of the Funds. Functions include the preparation of all registration statements, prospectuses, proxy statements, and oversight of daily valuation of the portfolios and calculation of daily net asset values per share. The Funds pay a fee as compensation for these services, accrued daily and paid monthly, of 0.10% per annum of average daily net assets.
A substantial shareholder of Southeastern Concentrated Value Ltd. (SCV), a private fund under a discretionary investment management agreement with Southeastern and in which Longleaf portfolio managers and related parties have a substantial financial interest, is CEO and a director of OCI N.V. and a director of LafargeHolcim Ltd, which are investments in the Funds. Southeastern intends to follow its established investment disciplines with respect to OCI N.V. and LafargeHolcim Ltd and will disregard any potential biases the SCV relationship might create.
The Board supervises the business activities of the Trust. Each Trustee serves as a Trustee for the lifetime of the Trust or until resignation or removal. “Independent Trustees,” meaning those Trustees who are not “interested persons” as defined in the Investment Company Act of 1940 (“1940 Act”) of the Trust, each received annual compensation of $170,000 from the Trust, paid in four equal quarterly installments. In addition, the Trust reimburses Trustees for out-of-pocket expense incurred in conjunction with attendance at Board meetings. One Trustee of the Trust is an employee of Southeastern.
Note 4. Investment Transactions
Purchases and sales of investment securities for the period ended December 31, 2018 (excluding short-term and U.S. government obligations) are summarized below:
| | Purchases | Sales |
| Partners Fund | $924,967,585 | $1,010,298,210 |
| Small-Cap Fund | 1,184,125,706 | 968,632,127 |
| International Fund | 607,266,485 | 476,704,029 |
| Global Fund | 106,443,468 | 64,464,500 |
Note 5. Related Ownership
At December 31, 2018 officers, employees of Southeastern and their families, Fund trustees, the Southeastern retirement plan and other affiliates owned the following:
| | % of Fund |
| Partners Fund | 18% |
| Small-Cap Fund | 3 |
| International Fund | 27 |
| Global Fund | 50* |
| * | A significant portion consists of a few shareholders whose redemptions could have a material impact on the Fund. |
Note 6. Affiliated Issuer and Controlled Investments
Under Section 2(a)(3) of the Investment Company Act of 1940, a portfolio company is defined as “affiliated” if a fund owns five percent or more of its voting stock during all or part of the period. Also, under the 1940 Act, a fund is required to identify investments where it owns greater than 25% of the portfolio company's outstanding voting shares as a controlled investment. Affiliated companies and controlled investments during the period ended December 31, 2018 were as follows:
| | Shares at
12/31/18 | Value at
12/31/17 | Purchases | Sales | Dividends | Net
Realized
Gain (Loss)
1/1/18
to
12/31/18 | Net
Unrealized
Appreciation
(Depreciation)
1/1/18
to
12/31/18 | Value at
12/31/18 |
| Partners Fund | | | | | | | | |
| CNX Resources Corporation* | 10,605,889 | $ 157,682,169 | $ - | $ 2,032,216 | $ - | $ (2,840,052) | $ (31,690,649) | $ 121,119,252 |
| CONSOL Energy Inc.*(a) | - | 56,314,275 | - | 62,099,613 | - | 4,416,939 | 1,368,399 | - |
| | | 213,996,444 | - | 64,131,829 | - | 1,576,887 | (30,322,250) | 121,119,252 |
| Small-Cap Fund | | | | | | | | |
| Actuant Corporation – Class A | 5,841,674 | 147,794,352 | - | - | 233,667 | - | (25,177,615) | 122,616,737 |
| CNX Resources Corporation* | 12,038,143 | 181,313,057 | 18,947,250 | 25,833,034 | - | (19,778,361) | (17,173,319) | 137,475,593 |
| CONSOL Energy Inc.*(a) | - | 60,200,439 | - | 66,030,225 | - | 9,057,354 | (3,227,568) | - |
| Eastman Kodak Company*(b) | 4,000,000 | 12,400,000 | - | - | - | - | (2,200,000) | 10,200,000 |
| Eastman Kodak Company Convertible Preferred Stock – Series A 5.5%(b)(c) | 1,864,300 | 147,316,986 | - | - | 10,253,650 | - | 1,454,154 | 148,771,140 |
| Graham Holdings Company – Class B | 428,000 | 238,973,800 | - | - | 2,276,960 | - | 35,194,440 | 274,168,240 |
| Hopewell Holdings Limited | 52,817,500 | 195,035,726 | - | - | 25,112,544 | - | 37,227,236 | 232,262,962 |
| OCI N.V.*(a)(d) | 9,661,792 | 277,203,176 | - | 34,739,343 | - | (6,654,263) | (38,497,510) | 197,312,060 |
| PotlatchDeltic Corporation | 4,584,378 | - | 165,813,910 | - | | 1,833,751 | (20,764,190) | 145,049,720 |
| Realogy Holdings Corp. | 9,135,453 | 136,107,021 | 110,563,002 | 17,795,461 | 2,775,078 | (34,121) | (94,731,991) | 134,108,450 |
| Sonic Corp.(a) | - | 175,047,600 | - | 276,294,062 | 3,057,600 | 118,993,749 | (17,747,287) | - |
| Summit Materials, Inc. - Class A* | 12,699,444 | - | 226,502,181 | - | - | - | (69,029,075) | 157,473,106 |
| ViaSat, Inc.*(a) | 2,498,135 | 281,714,966 | - | 80,402,420 | - | 7,525,982 | (61,573,470) | 147,265,058 |
| | | $ 1,853,107,123 | $ 521,826,343 | $ 501,094,545 | $ 43,709,499 | $ 110,944,091 | $ (276,246,195) | $ 1,706,703,066 |
| * | Non-income producing security. |
| (a) | Not an affiliate at the end of the period. |
| (b) | Controlled investment. |
| (c) | Restricted security, see Portfolio of Investments for additional disclosures. |
Note 7. Fair Value Measurements
FASB ASC 820 established a single definition of fair value for financial reporting, created a three-tier framework for measuring fair value based on inputs used to value the Funds' investments, and required additional disclosure about the use of fair value measurements. The hierarchy of inputs is summarized below.
| • | Level 1 – quoted prices in active markets for identical investments |
| • | Level 2 – other significant observable inputs (including quoted prices for similar investments, interest rates, prepayment speeds, credit risk, etc.)
|
| • | Level 3 – significant unobservable inputs (including the Funds' own assumptions in determining the fair value of investments) |
Observable inputs are those based on market data obtained from sources independent of the Funds, and unobservable inputs reflect the Funds' own assumptions based on the best information available. The input levels are not necessarily an indication of risk or liquidity associated with investing in those securities.
A summary of the inputs used in valuing the Funds' investments at December 31, 2018 follows:
| | Level 1 | Level 2 | Level 3 | Total Value |
| Partners Fund | | | | |
| Common Stocks - North America | $1,478,170,329 | - | - | $1,478,170,329 |
| Common Stocks - Other | - | 455,166,934 | - | 455,166,934 |
| Options Purchased | - | 270,100 | - | 270,100 |
| Short-Term Obligations | - | 37,977,000 | - | 37,977,000 |
| | $1,478,170,329 | $493,414,034 | $- | $1,971,584,363 |
| Small-Cap Fund | | | | |
| Common Stocks - North America | $2,142,870,736 | - | - | $2,142,870,736 |
| Common Stocks - Other | - | 429,575,022 | - | 429,575,022 |
| Preferred Stocks | - | 148,771,140 | - | 148,771,140 |
| Corporate Bonds | - | 118,926,431 | - | 118,926,431 |
| Options Purchased | - | 523,200 | - | 523,200 |
| Short-Term Obligations | - | 267,309,548 | - | 267,309,548 |
| | $2,142,870,736 | $965,105,341 | $- | $3,107,976,077 |
| International Fund | | | | |
| Common Stocks - North America | $79,252,840 | - | - | $79,252,840 |
| Common Stocks - Other | 167,036,088 | 718,276,504 | - | 885,312,592 |
| Options Purchased | — | 357,600 | — | 357,600 |
| Short-Term Obligations | — | 45,400,000 | — | 45,400,000 |
| Forward Currency Contracts | — | (951,900) | — | (951,900) |
| | $246,288,928 | $763,082,204 | $— | $1,009,371,132 |
| Global Fund | | | | |
| Common Stocks - North America | $98,418,523 | - | - | $98,418,523 |
| Common Stocks - Other | 7,259,949 | 103,059,647 | - | 110,319,596 |
| Options Purchased | — | 61,200 | — | 61,200 |
| Short-Term Obligations | — | 3,608,000 | — | 3,608,000 |
| Forward Currency Contracts | — | (175,409) | — | (175,409) |
| | $105,678,472 | $106,553,438 | $— | $212,231,910 |
The following is a reconciliation of Level 3 holdings for which significant unobservable inputs were used in determining fair value during the year ended December 31, 2018. Transfers out of Level 3 were the result of unobservable inputs no longer being material to the valuation. Transfers are recognized at the beginning of the reporting period.
| | Small-Cap Fund | International Fund |
| Fair value at December 31, 2017 | $147,316,986 | $860,040 |
| Realized loss | — | (39,324,395)(b) |
| Change in unrealized apppreciation | — | 38,464,355(a) |
| Transfers out | (147,316,986) | — |
| Fair value at December 31, 2018 | $— | $— |
| (a) | Statements of Operations location: Change in Unrealized Appreciation (Depreciation) Non-affiliated securities. |
| (b) | Statements of Operations location: Net Realized Gain (Loss) Non-affiliated securities. |
Note 8. Derivative Instruments
The Funds invested in options and forward currency contracts to hedge embedded currency exposure related to specific holdings.
The Statements of Assets and Liabilities included the following financial derivative instrument fair values at December 31, 2018:
| | Location | Currency |
| Partners Fund | | |
| Options Purchased | Non-affiliated securities, at value | $270,100 |
| Small-Cap Fund | | |
| Options Purchased | Non-affiliated securities, at value | $523,200 |
| International Fund | | |
| Options Purchased | Non-affiliated securities, at value | $357,600 |
| Forward currency contracts | Unrealized loss on forward currency contracts | (951,900) |
| | | $(594,300) |
| Global Fund | | |
| Options Purchased | Non-affiliated securities, at value | $61,200 |
| Forward currency contracts | Unrealized loss on forward currency contracts | (175,409) |
| | | $(114,209) |
Financial derivative instruments had the following effect on the Statements of Operations for the period ended December 31, 2018:
| | Location | Currency |
| Partners Fund | | |
| Net realized loss: | | |
| Options purchased | Non-affiliated securities | $(946,323) |
| Change in unrealized appreciation: | | |
| Options purchased | Non-affiliated securities | $1,397,950 |
| Small-Cap Fund | | |
| Net realized loss: | | |
| Options purchased | Non-affiliated securities | $(1,955,441) |
| Change in unrealized appreciation: | | |
| Options purchased | Non-affiliated securities | $1,386,412 |
| International Fund | | |
| Net realized loss: | | |
| Options purchased | Non-affiliated securities | $(1,345,252) |
| Forward currency contracts | Forward currency contracts | (3,708,135) |
| | | $(5,053,387) |
| Change in unrealized appreciation: | | |
| Options purchased | Non-affiliated securities | $880,877 |
| Forward currency contracts | Forward currency contracts | 4,120,562 |
| | | $5,001,439 |
| | Location | Currency |
| Global Fund | | |
| Net realized loss: | | |
| Options purchased | Non-affiliated securities | $(230,613) |
| Forward currency contracts | Forward currency contracts | (285,245) |
| | | $(515,858) |
| Change in unrealized appreciation: | | |
| Options purchased | Non-affiliated securities | $157,525 |
| Forward currency contracts | Forward currency contracts | 33,859 |
| | | $191,384 |
For the period ended December 31, 2018, the average monthly notional value of derivative instruments were as follows:
| | Options Purchased | Forward Currency Contracts |
| Partners Fund | $164,416,667 | $— |
| Small-Cap Fund | 228,833,333 | — |
| International Fund | 149,000,000 | 61,997,419 |
| Global Fund | 26,125,000 | 1,699,385 |
The Funds may invest in certain securities or engage in other transactions where the Funds are exposed to counterparty credit risk in addition to broader market risks. The Funds may face increased risk of loss in the event of default or bankruptcy by the counterparty or if the counterparty otherwise fails to meet its contractual obligations. The Funds' investment manager attempts to mitigate counterparty risk by (i) periodically assessing the creditworthiness of its trading partners, (ii) monitoring and/or limiting the amount of its net exposure to each individual counterparty based on its assessment and (iii) requiring collateral from the counterparty for certain transactions. Market events and changes in overall economic conditions may impact the assessment of such counterparty risk by the investment manager. In addition, declines in the values of underlying collateral received may expose the Funds to increased risk of loss.
The Funds have entered into master agreements with its derivative counterparties that provide for general obligations, representations, agreements, collateral, events of default or termination and credit related contingent features. The credit related contingent features include, but are not limited to, a percentage decrease in the Fund's net assets or NAV over a specified period of time. If these credit related contingent features were triggered, the derivatives counterparty could terminate the positions and demand payment or require additional collateral.
Note 9. Federal Income Taxes
The tax basis unrealized appreciation (depreciation) and federal tax cost of investments held by each fund as of December 31, 2018 were as follows:
| | Partners Fund | Small-Cap Fund | International Fund | Global Fund |
| Gross unrealized appreciation | $213,322,547 | $276,004,711 | $158,555,044 | $17,196,022 |
| Gross unrealized depreciation | (463,805,113) | (612,416,126) | (128,005,723) | (30,571,525) |
| Net unrealized appreciation (depreciation) | $(250,482,566) | $(336,411,415) | $30,549,321 | $(13,375,503) |
| Cost for federal income tax purposes | $2,222,066,929 | $3,444,387,492 | $979,773,711 | $225,782,822 |
Required fund distributions are based on income and capital gain amounts determined in accordance with federal income tax regulations, which may differ from net investment income and realized gains recognized for financial reporting purposes primarily because of losses deferred due to wash sale adjustments, foreign currency gains and losses, adjustments related to Passive Foreign Investment Companies ("PFICS"), and partnerships. Accordingly, the character of distributions and composition of net assets for tax purposes differ from those reflected in the accompanying financial statements.
The tax character of distributions paid was as follows:
| | Year Ended December 31, 2018 |
| | Partners
Fund | Small-Cap
Fund | International
Fund | Global
Fund |
| Long-term capital gains | $356,777,517 | $384,774,573 | $— | $20,112,824 |
| Ordinary income | 50,004,013 | 141,137,033 | 13,254,171 | 2,443,781 |
| | $406,781,530 | $525,911,606 | $13,254,171 | $22,556,605 |
| | Year Ended December 31, 2017 |
| | Partners
Fund | Small-Cap
Fund | International
Fund | Global
Fund |
| Long-term capital gains | $238,430,732 | $247,833,660 | $— | $1,242,695 |
| Ordinary income | 40,004,719 | 61,941,724 | 12,446,317 | 1,352,159 |
| | $278,435,451 | $309,775,384 | $12,446,317 | $2,594,854 |
The tax-basis components of accumulated earnings (losses) at December 31, 2018 were as follows:
| | Partners
Fund | Small-Cap
Fund | International
Fund | Global
Fund |
| Net unrealized appreciation (depreciation) | $(250,482,566) | $(336,411,415) | $30,538,535 | $(13,377,995) |
| Undistributed ordinary income | — | — | 8,573,769 | 182,118 |
| Undistributed long-term capital gains | 3,596,706 | 3,967,098 | — | 746,086 |
| | $(246,885,860) | $(332,444,317) | $39,112,304 | $(12,449,791) |
The Funds did not have any capital loss carryforwards at December 31, 2018. During the year ended December 31, 2018, the International Fund utilized $22,161,248 of capital loss carryforwards.
The following permanent reclassifications were made between capital accounts to reflect the portion of the payment made to redeeming shareholders that was claimed as as a distribution for income tax purposes during the year ended December 31, 2018.
| | Partners
Fund | Small-Cap
Fund | International
Fund | Global
Fund |
| Paid-in capital | $85,287,281 | $43,634,352 | $— | $— |
| Total distributable earnings | (85,287,281) | (43,634,352) | — | — |
The Funds' tax returns are subject to examination by the relevant tax authorities until expiration of the applicable statute of limitations, which is generally three years after filing of the tax return but could be longer in certain circumstances. Management has analyzed the Funds' tax positions taken on federal income tax returns for all open tax years (tax years ended December 31, 2015-2018), and has concluded that no provision for federal income tax is required in the Funds' financial statements. The Funds recognize interest and penalties, if any, related to unrecognized tax benefits as income tax expense in the Statements of Operations. The Funds did not incur any interest or penalties during the period.
Note 10. Commitments and Contingencies
The Funds indemnify the Trust's Trustees for certain liabilities that might arise from their performance of their duties to the Funds. Additionally, in the normal course of business, the Funds enter into contracts that contain a variety of representations and warranties and which provide general indemnifications. The Funds' maximum exposure under these arrangements is unknown, as this would involve future claims that may be made against the Funds that have not yet occurred. However, based on experience, the Funds expect the risk of loss to be remote.
Note 11. Subsequent Events
The Funds evaluated events from the date of the financial statements through the date the financial statements were issued. There were no subsequent events requiring recognition or disclosure.
The presentation is for a share outstanding throughout each period.
| Partners Fund | | | | | |
| | Year Ended December 31, |
| | 2018 | 2017 | 2016 | 2015 | 2014 |
| Net Asset Value Beginning of Period | $26.84 | $25.36 | $21.45 | $31.24 | $33.75 |
| Net Investment Income (Loss)(a) | 0.42 | 0.12 | 0.20 | 0.26 | 0.19 |
| Net Realized and Unrealized Gain (Loss) | (4.78) | 3.74 | 4.24 | (6.05) | 1.53 |
| Total from Investment Operations | (4.36) | 3.86 | 4.44 | (5.79) | 1.72 |
| Dividends from Net Investment Income | (0.47) | (0.33) | —(c) | (0.30) | (0.20) |
| Distributions from Net Realized Capital Gains | (3.66) | (2.05) | (0.53) | (3.70) | (4.03) |
| Total Distributions | (4.13) | (2.38) | (0.53) | (4.00) | (4.23) |
| Net Asset Value End of Period | $18.35 | $26.84 | $25.36 | $21.45 | $31.24 |
| Total Return | (17.98)% | 15.51% | 20.72% | (18.80)% | 4.92% |
| Net Assets End of Period (thousands) | $1,980,081 | $3,293,533 | $3,448,288 | $3,624,583 | $7,547,608 |
| Ratio of Expenses to Average Net Assets | 0.97% | 0.95% | 0.95% | 0.93% | 0.91% |
| Ratio of Net Investment Income to Average Net Assets | 1.59% | 0.44% | 0.84% | 0.92% | 0.57% |
| Portfolio Turnover Rate | 37% | 28% | 17% | 46% | 30% |
| Small-Cap Fund | | | | | |
| | Year Ended December 31, |
| | 2018 | 2017 | 2016 | 2015 | 2014 |
| Net Asset Value Beginning of Period | $27.60 | $27.49 | $26.98 | $30.42 | $32.46 |
| Net Investment Income (Loss)(a) | 0.74 | 0.48(b) | 0.07 | (0.01) | (0.06) |
| Net Realized and Unrealized Gain (Loss) | (2.24) | 1.95 | 5.39 | (1.83) | 4.04 |
| Total from Investment Operations | (1.50) | 2.43 | 5.46 | (1.84) | 3.98 |
| Dividends from Net Investment Income | (0.76) | (0.45) | (0.10) | — | — |
| Distributions from Net Realized Capital Gains | (3.24) | (1.87) | (4.85) | (1.60) | (6.02) |
| Total Distributions | (4.00) | (2.32) | (4.95) | (1.60) | (6.02) |
| Net Asset Value End of Period | $22.10 | $27.60 | $27.49 | $26.98 | $30.42 |
| Total Return | (6.52)% | 8.99% | 20.48% | (6.05)% | 12.49% |
| Net Assets End of Period (thousands) | $3,109,436 | $3,805,597 | $3,995,661 | $3,809,643 | $4,383,882 |
| Ratio of Expenses to Average Net Assets | 0.92% | 0.92% | 0.91% | 0.91% | 0.91% |
| Ratio of Net Investment Income to Average Net Assets | 2.61% | 1.70%(b) | 0.23% | (0.03)% | (0.17)% |
| Portfolio Turnover Rate | 32% | 29% | 31% | 46% | 51% |
| (a) | Computed using average shares outstanding throughout the period. |
| (b) | Includes receipt of a $17,466,656 special dividend, if the special dividend had not occurred, net investment income per share and the ratio of net investment income to average net assets would have decreased by $0.12 and 0.43%, respectively. |
| (c) | Rounds to less than $0.01. |
| International Fund | | | | | |
| | Year Ended December 31, |
| | 2018 | 2017 | 2016 | 2015 | 2014 |
| Net Asset Value Beginning of Period | $16.63 | $13.53 | $12.35 | $13.80 | $17.94 |
| Net Investment Income(a) | 0.12 | 0.05 | 0.11 | 0.22 | 0.53 |
| Net Realized and Unrealized Gain (Loss) | (1.29) | 3.23 | 1.39 | (1.30) | (3.12) |
| Total from Investment Operations | (1.17) | 3.28 | 1.50 | (1.08) | (2.59) |
| Dividends from Net Investment Income | — | (0.18) | (0.32) | (0.23) | (0.54) |
| Distributions from Net Realized Capital Gains | (0.20) | — | — | (0.14) | (1.01) |
| Total Distributions | (0.20) | (0.18) | (0.32) | (0.37) | (1.55) |
| Net Asset Value End of Period | $15.26 | $16.63 | $13.53 | $12.35 | $13.80 |
| Total Return | (7.08)% | 24.23% | 12.20% | (7.91)% | (14.76)% |
| Net Assets End of Period (thousands) | $1,012,707 | $1,177,197 | $988,743 | $1,116,983 | $1,459,608 |
| Ratio of Expenses to Average Net Assets | 1.18%(b) | 1.29% | 1.33% | 1.28% | 1.25% |
| Ratio of Net Investment Income to Average Net Assets | 0.75% | 0.33% | 0.88% | 1.61% | 3.06% |
| Portfolio Turnover Rate | 46% | 25% | 21% | 53% | 54% |
| Global Fund | | | | | |
| | Year Ended December 31, |
| | 2018 | 2017 | 2016 | 2015 | 2014 |
| Net Asset Value Beginning of Period | $14.94 | $11.96 | $9.98 | $11.60 | $12.84 |
| Net Investment Income(a) | 0.18 | 0.05 | 0.06 | 0.03 | 0.09 |
| Net Realized and Unrealized Gain (Loss) | (2.48) | 3.09 | 1.98 | (1.63) | (0.84) |
| Total from Investment Operations | (2.30) | 3.14 | 2.04 | (1.60) | (0.75) |
| Dividends from Net Investment Income | (0.13) | (0.03) | (0.06) | (0.02) | (0.08) |
| Distributions from Net Realized Capital Gains | (1.26) | (0.13) | — | — | (0.41) |
| Total Distributions | (1.39) | (0.16) | (0.06) | (0.02) | (0.49) |
| Net Asset Value End of Period | $11.25 | $14.94 | $11.96 | $9.98 | $11.60 |
| Total Return | (16.16)% | 26.33% | 20.43% | (13.76)% | (5.98)% |
| Net Assets End of Period (thousands) | $212,824 | $238,865 | $187,584 | $167,465 | $164,372 |
| Ratio of Expenses to Average Net Assets | 1.20%(b) | 1.20%(b) | 1.32%(b) | 1.54% | 1.58% |
| Ratio of Net Investment Income to Average Net Assets | 1.19% | 0.36% | 0.54% | 0.30% | 0.70% |
| Portfolio Turnover Rate | 29% | 27% | 33% | 58% | 40% |
| (a) | Computed using average shares outstanding throughout the period. |
| (b) | Expenses presented net of fee waiver. The International Fund expense ratio before waiver for the year ended December 31, 2018 was 1.21%. The Global Fund expense ratio before waiver for the years ended December 31, 2018, 2017, and 2016 were 1.33%, 1.48%, and 1.52%, respectively. |
Report of Independent Registered Public Accounting Firm
To the Shareholders and the Board of Trustees of Longleaf Partners Funds Trust
Opinion on the Financial Statements
We have audited the accompanying statements of assets and liabilities of Longleaf Partners Funds Trust (the "Trust") (comprising of the Longleaf Partners Fund, Longleaf Partners Small-Cap Fund, Longleaf Partners International Fund and Longleaf Partners Global Fund (collectively referred to as the "Funds")), including the portfolios of investments, as of December 31, 2018, the related statements of operations, changes in net assets and financial highlights for the year then ended and the related notes (collectively referred to as the “financial statements”). In our opinion, the financial statements present fairly, in all material respects, the financial position of the Funds comprising Longleaf Partners Funds Trust at December 31, 2018, the results of their operations, the changes in their net assets and their financial highlights for the year then ended, in conformity with U.S. generally accepted accounting principles.
The statements of changes in net assets and financial highlights of the Funds for the periods presented through December 31, 2017 were audited by other auditors whose report dated February 12, 2018, expressed an unqualified opinion on those statements of changes in net assets and financial highlights.
Basis for Opinion
These financial statements are the responsibility of the Trust’s management. Our responsibility is to express an opinion on each of the Funds’ financial statements based on our audits. We are a public accounting firm registered with the Public Company Accounting Oversight Board (United States) (PCAOB) and are required to be independent with respect to the Trust in accordance with the U.S. federal securities laws and the applicable rules and regulations of the Securities and Exchange Commission and the PCAOB.
We conducted our audits in accordance with the standards of the PCAOB. Those standards require that we plan and perform the audit to obtain reasonable assurance about whether the financial statements are free of material misstatement, whether due to error or fraud. The Trust is not required to have, nor were we engaged to perform, an audit of the Trust’s internal control over financial reporting. As part of our audits we are required to obtain an understanding of internal control over financial reporting but not for the purpose of expressing an opinion on the effectiveness of the Trust’s internal control over financial reporting. Accordingly, we express no such opinion.
Our audits included performing procedures to assess the risks of material misstatement of the financial statements, whether due to error or fraud, and performing procedures that respond to those risks. Such procedures included examining, on a test basis, evidence regarding the amounts and disclosures in the financial statements. Our procedures included confirmation of securities owned as of December 31, 2018, by correspondence with the custodian and brokers or by other appropriate auditing procedures where replies from brokers were not received. Our audits also included evaluating the accounting principles used and significant estimates made by management, as well as evaluating the overall presentation of the financial statements. We believe that our audits provide a reasonable basis for our opinion.
/s/ Ernst & Young LLP
We have served as the auditor of one or more Longleaf Partners Funds Trust investment companies since 2018.
Cincinnati, Ohio
February 26, 2019
Statement Regarding Basis for Approval of Investment Advisory Contracts
Longleaf Partners Fund, Longleaf Partners Small-Cap Fund, Longleaf Partners International Fund, and Longleaf Partners Global Fund (the “Funds”) are non-diversified and each is a series of Longleaf Partners Funds Trust, a Massachusetts business trust which is an openend management investment company registered with the US Securities and Exchange Commission. Southeastern Asset Management, Inc. (“Southeastern”) acts as investment counsel and fund administrator under agreements with each Fund (the “Agreements”). Trustees for each Fund, including Trustees who are not “interested persons” of the Funds as that term is defined under the Investment Company Act of 1940, as amended (the “Independent Trustees”), are responsible for overseeing the performance of Southeastern and meet annually to review information specific to each Fund to determine whether or not the Agreements with Southeastern ought to be approved.
On September 11, 2018, Trustees for each Fund met to determine whether the Agreements with Southeastern should be approved for the period November 1, 2018 to October 31, 2019. In advance of the meeting, the Independent Trustees reviewed materials relating to the existing Agreements, including an independent expense and performance summary prepared by Lipper Inc. The Lipper materials included comparisons of each Fund with other funds in a comparable Lipper universe, as well as additional funds selected for comparison by the Independent Trustees. Trustees reviewed this comparative Lipper data regarding management and non-management fees and expenses, portfolio turnover, brokerage commissions, investment performance and long-term performance in light of total fund expenses (the “Lipper Data”). Other materials reviewed included information concerning the nature, extent and quality of Southeastern's services, Southeastern's profitability and financial results, including advisory fee revenue and separate account advisory fee schedules, and whether economies of scale are, or would be, shared with Fund investors as assets under management increase. Based on the information reviewed, as well as information received throughout the year and first-hand interaction with Southeastern's personnel, the Trustees for each Fund unanimously approved the selection of Southeastern as adviser and administrator, and the amounts to be paid by each Fund under Agreements with Southeastern.
Nature, Extent and Quality of Services Provided
While the investment performance of each Fund and Southeastern (discussed below) is relevant to an evaluation of the nature, extent and quality of services provided, the Trustees also considered Southeastern's governing principles as significant. These principles are stated at the beginning of the Funds' prospectus:
| • | We will treat your investment as if it were our own. |
| • | We will remain significant investors in Longleaf Partners Funds. |
| • | We will invest for the long-term, while striving to maximize returns and minimize business, financial, purchasing power, regulatory and market risks.
|
| • | We will choose each equity investment based on its discount from our appraisal of corporate intrinsic value, its financial strength, its management, its competitive position, and our assessment of its future earnings potential.
|
| • | We will focus our assets in our best ideas. |
| • | We will not impose loads or 12b-l charges on mutual fund shareholders. |
| • | We will consider closing to new investors if closing would benefit existing clients. |
| • | We will discourage short-term speculators and market timers. |
| • | We will continue our efforts to enhance shareholder services. |
| • | We will communicate with our investment partners as candidly as possible. |
The Trustees concluded that Southeastern had operated each Fund under these governing principles, and that Longleaf shareholders had benefited from Southeastern's execution of its investment discipline, as well as its shareholder oriented approach. Southeastern's actions on behalf of shareholders have gone beyond stock selection and included active engagement with portfolio companies when necessary and involvement in the market structure debate. The Trustees looked favorably on Southeastern's Code of Ethics requirement that employees use funds advised by Southeastern for virtually all public equity investing. The Trustees noted that, as one of the largest Longeleaf shareholder groups, Southeastern and its affiliates' interests are aligned with other shareholders. In addition, significant investment by Southeastern's personnel has contributed to the economies of scale which have lowered fees and expenses for shareholders over time.
The Trustees recognized Southeastern's consistent implementation of the governing principles, noting that Southeastern and the Funds had received recognition in the press, and among industry observers and participants, for the quality of its investment process, as well as its shareholder orientation and integrity. The Trustees expressed confidence in the research, analysis, knowledge and over 40-years' experience of Southeastern. The Trustees concluded that shareholders buy the Funds primarily to gain access to Southeastern's investment expertise and shareholder orientation, and weighed this heavily in approving the Agreements.
Trustees concluded that Southeastern's administrative services, including fund accounting, legal, trading, shareholder reporting, compliance and oversight of Fund operations, had been high quality, and favored approving Southeastern for another year. Trustees concluded that Southeastern had been open, responsive, timely and cooperative in providing information required to oversee the Funds.
Comparative Investment Performance of the Funds and Adviser
Using the Lipper Data, the Trustees compared each Fund through periods ended June 30, 2018 to other similar funds, as well as the following objective benchmarks: inflation plus 10%, and each Fund's market index plus 200 basis points. The Partners Fund exceeded inflation plus 10% for the 2-year period. The Small-Cap Fund exceeded inflation plus 10% for the 2-year period and the Russell 2000's return for the 10-year period, but not by 200 basis points. The International Fund exceeded inflation plus 10% for the 2-year period, as well as EAFE plus 200 basis points for the 2 and 3-year periods. The Global Fund exceeded inflation plus 10% for the 2-year period and MSCI World plus 200 basis points for the 2 and 3-year periods. Southeastern discussed its approach of intelligent, concentrated, engaged, long-term, partnership investing and its confidence in delivering long-term performance clients expect.
The Trustees also reviewed after-tax performance information for each Fund and noted that taxable shareholders were benefited by Southeastern's long-term, low turnover, tax efficient management style as compared to funds with more frequent trading.
The Costs of the Services to be Provided and Profits to be Realized by the Investment Adviser and its Affiliates from the Relationship with the Fund
The Trustees considered each Fund's management fee rates and expense ratios relative to industry averages, advisory fees charged to Southeastern's private account clients and similar funds selected by Lipper and the Independent Trustees.
While Southeastern's management fees for each Fund were above average, non- management expenses (except for the Global Fund) were below average, due in part to Southeastern's performance and/or oversight of various operating functions. While the Trustees considered these fees separately, they viewed total expenses borne by shareholders as more important. In addition, the Trustees weighed favorably the fact that Southeastern had foregone additional fee income by closing each Fund to protect shareholder interests. The Trustees noted that Longleaf Partners Fund had been closed since June 9, 2017, and also from July 2004 to January 2008, Longleaf Partners International Fund had been closed from February 2004 to July 2006, Longleaf Partners Small-Cap Fund had been closed since July 1997, and Longleaf Partners Global Fund had been closed briefly from January 28, 2013 to April 16, 2013. The Trustees also recognized that Southeastern does not have an affiliated entity providing transfer agent, custodian, broker dealer services other than investment management and fund administration. Accordingly, Southeastern neither generates additional fees for itself through related entities, nor allocates Fund brokerage to pay its expenses. The transparency of Southeastern's fees and lack of supplemental sources of revenue was a significant factor to the Trustees.
In light of the qualifications, experience, reputation, and performance of Southeastern with respect to each Fund, as well as the steps taken to limit or reduce receipt of fees over time, the Trustees concluded that fee rates paid to Southeastern by each Fund are at an acceptable level.
The Trustees compared the fees paid to Southeastern by the Funds with those paid by Southeastern's private account clients. To the extent private account fees were lower than Fund fees, the Trustees concluded that the range of services provided to the Funds is more extensive and the risks associated with operating SEC registered, publicly traded mutual funds are greater. Funds are more work because of the complex overlay of regulatory, tax and accounting issues which are unique to mutual funds. In addition, the work required to service shareholders is more extensive because of the significantly greater number and managing trading is more complex because of more frequent fund flows, as well as IRS diversification compliance. With respect to risk, not only has regulation become more complex and burdensome, but the scrutiny of regulators and shareholders has gotten more intense. The Trustees concluded that reasonable justifications exist to the extent that there are differences in fee rates between the two lines of business.
The Trustees reviewed reports of Southeastern's financial position, including overall revenues and expenses of the firm, as well as an Investment Manager Profitability Analysis prepared by Lipper Inc. While the Trustees considered the profitability of Southeastern as a whole, and jointly determined with Southeastern a method to allocate costs between mutual fund and private account activities, they did not evaluate on a Fund-by-Fund basis Southeastern's profitability and/or costs. Because no generally accepted cost allocation methodology exists, and estimating the cost of providing services on a Fund specific basis is difficult, Southeastern provided its complete financial statements to the Trustees and stipulated conservatively for renewal purposes that its operation of each Fund should be considered highly profitable, at least as profitable as, if not more profitable than, investment managers with similar assets under management. The Trustees concluded that significant profits were not unreasonable given Southeastern's successful investment management and strong shareholder orientation, as well as steps it had taken to limit or reduce its fees over time. As between the Funds and private account business, the Trustees
acknowledged that cost allocation methods were not precise, but felt profits derived with respect to the Funds were acceptable in light of all the facts and circumstances. The Trustees also gave significant weight to the preferences and expectations of individual Fund shareholders and their relative sophistication, noting that the level of assets under management (despite closing, no sales force, or 12b-l plan) is a direct result of Southeastern's successful asset management and strong shareholder orientation. Similarly, if a shareholder wants to redeem, he or she is not constrained by the thought of having to pay a redemption fee or to recoup a front-end load. Indeed, as Fund assets decline Southeastern's profits are reduced. Thus, in assessing whether the costs of Southeastern's services and its resulting profits are acceptable, the Trustees considered it meaningful that the Funds' asset base consists of shareholders who have freely chosen to retain access to Southeastern's services, with full disclosure of advisory fee rates.
The Extent to which Economies of Scale would be Realized as each Fund Grows, and whether Current Fee Levels Reflect these Economies of Scale for the Benefit of Fund Investors
Because Southeastern's fee structure for each Fund contains a breakpoint, economies of scale will be realized as each Fund grows. Because fee levels for Longleaf Partners Fund and Longleaf Partners Small-Cap Fund currently reflected a greater sharing of economies of scale than the fee for Longleaf Partners International Fund, and in order to reward the loyalty of International Fund shareholders, Southeastern recommended a reduction in that Fund's breakpoint from $2.5 billion to $500 million in 2011. The higher breakpoint had been set in expectation that the International Fund could become as large as the Partners Fund. While it could still become that large in time, Southeastern was mindful that at current asset levels, shareholders did not benefit from the breakpoint. In addition, effective April 1, 2018, Southeastern reduced the International Fund fee to 1.10% breaking to 0.90% above $500 million with a 1.15% fee cap. Using the International Fund as a model, the breakpoint for the Global Fund was set at the same $500 million level. In addition, effective May 1, 2016, Southeastern agreed to voluntarily reduce the Global Fund's expense limit to 1.20%, and on April 1, 2018 made that limit a contractual commitment. Accordingly, the Trustees were satisfied that breakpoints and expense limits for each Fund were set at appropriate levels, and economies of scale would be shared sufficiently with Fund shareholders.
Conclusion
While the material factors that the Trustees considered are summarized above, each individual Trustee considered and weighed in the aggregate all information prior to making a renewal decision. All Trustees, including the Independent Trustees, concluded that Southeastern's fee structure was acceptable in light of the nature and quality of services provided, and that approval of the Investment Counsel and Fund Administration Agreements was in the best interest of each Fund and its shareholders.
Shareholders of mutual funds may incur two types of costs: (1) ongoing costs, including management fees, transfer agent fees, and other fund expenses; and (2) transaction costs, including sale charges (loads) and redemption fees. Longleaf does not charge transaction fees of any sort.
The following examples are intended to show the ongoing costs (in dollars) of investing in the Longleaf Partners Funds and to enable you to compare the costs of investing in other mutual funds. Each example is based on an investment of $1,000 made at June 30, 2018 and held through December 31, 2018.
Actual Expenses
The table below provides information about actual account values and actual expenses using each Fund's actual return for the period. To estimate the expenses that you paid over the period, divide your account balance by $1,000 (for example, a $12,500 account balance divided by $1,000 = 12.5), then multiply the result by the number in the third line entitled “Expenses Paid During Period.”
Hypothetical Example for Comparison Purposes
The table below also provides information about hypothetical account values and expenses based on each Fund's actual expense ratio and assumed returns of 5% per year before expenses, which are not the Funds' actual returns. Do not use the hypothetical data below to estimate your ending account balance or expenses you paid. This information serves only to compare the ongoing costs of investing in Longleaf with other mutual funds. To do so, examine this 5% hypothetical example against the 5% hypothetical examples found in other funds' shareholder reports.
The expenses shown in the table highlight only ongoing costs and do not reflect transactional costs that may be charged by other funds. Therefore, the table does not reveal the total relative costs of owning different funds. Since Longleaf does not charge transactions fees, you should evaluate other funds' transaction costs to assess the total cost of ownership for comparison purposes.
| | | Actual | | Hypothetical
(5% return before
expenses) | |
| | Beginning
account
value
6/30/2018 | Ending
account
value
12/31/2018 | Expenses
paid during
period* | | Ending
account
value
12/31/2018 | Expenses
paid during
period | Annualized
expense
ratio |
| Partners Fund | $1,000.00 | $814.80 | $4.44 | | $1,020.32 | $4.94 | 0.97% |
| Small-Cap Fund | 1,000.00 | 867.80 | 4.38 | | 1,020.52 | 4.74 | 0.93 |
| International Fund | 1,000.00 | 929.70 | 5.59 | | 1,019.41 | 5.85 | 1.15 |
| Global Fund | 1,000.00 | 841.20 | 5.57 | | 1,019.16 | 6.11 | 1.20 |
| *Expenses are equal to each Fund's annualized expense ratio, multiplied by the average account value over the period, multiplied by the number of days in the most recent fiscal half year (184) divided by 365 days in the current year. |
Information on Boards of Trustees
Each Fund is served by a separate Board of Trustees composed of eight members. The membership of each Board is the same. There is no stated term of service, and Trustees continue to serve after election until resignation. All Trustees presently serving except for Mr. Misener were elected or re-elected at a meeting of shareholders held on September 19, 2001 in Boston, Massachusetts.
Name, Age
And Address | Positions
Held
With Funds | Length of Service
as Trustee
(Year Began) | Principal Occupations
During Past 5 Years | Number of
Portfolios
Overseen | Other Directorships |
| Affiliated or Interested Trustees* |
O. Mason Hawkins, CFA, (70)
6410 Poplar Ave., Suite 900
Memphis, TN 38119 | Co-Portfolio Manager | Partners Fund
Small-Cap Fund
International Fund
Global Fund | 1987
1989
1998
2012 | Chairman of the Board and Chief Executive Officer, Southeastern Asset Management, Inc. | 4 | |
| Independent or Non-Interested Trustees |
Chadwick H. Carpenter, Jr. (68)
6410 Poplar Ave., Suite 900
Memphis, TN 38119 | Trustee | Partners Fund
Small-Cap Fund
International Fund
Global Fund | 1993
1993
1998
2012 | Private Investor and Consultant since 1997; Senior Executive Officer, Progress Software Corp. (1983-97) | 4 | |
Margaret H. Child (62)
137 Marlborough Street Apt. 3
Boston, MA 02116 | Trustee | Partners Fund
Small-Cap Fund
International Fund
Global Fund | 2001
2001
2001
2012 | Marketing Consultant (2005 -2017) | 4 | Trustee and Vice Chair, John F. Kennedy Library Foundation (2004-2017); Trustee, The Harvard Lampoon Trust (2010-Present); Trustee, Harris J. and Geraldine S. Nelson Foundation 2011-Present) |
Daniel W. Connell, Jr. (70)
4016 Alcazar Avenue
Jacksonville, FL 32207 | Trustee | Partners Fund
Small-Cap Fund
International Fund
Global Fund | 1997
1997
1998
2012 | Private Investor since 2006; President and CEO, Twilight Ventures, LLC (investment holding company) (2005-2006); Senior Vice President-Marketing, Jacksonville Jaguars (NFL franchise) (1994-2004) | 4 | |
Name, Age
And Address | Positions
Held
With Funds | Length of Service
as Trustee
(Year Began) | Principal Occupations
During Past 5 Years | Number of
Portfolios
Overseen | Other Directorships |
Steven N. Melnyk (71)
105 Virginia St.
St. Simons Island, GA 31522 | Trustee | Partners Fund
Small-Cap Fund
International Fund
Global Fund | 1991
1991
1998
2012 | Private Investor and Consultant since 1997; Senior Vice President, Stephens, Inc. (financial services) (2009-2016); Real Estate Development, The Sea Island Company, (2005-2009); Golf Commentator, ABC Sports (1991-2004); President, Riverside Golf Group, Inc. (since 1989) | 4 | |
Kent A. Misener (66)
380 North 200 West, Suite 102
Bountiful, UT 84010 | Trustee | Partners Fund
Small-Cap Fund
International Fund
Global Fund | 2018
2018
2018
2018 | Chief Executive/Chief Investment Officer, Verapath Global Investing LLC since 2015; Chief Investment Officer, Deseret Mutual Benefits Administrators (1983-2015) | 4 | Trustee, State Institutional
Trust Fund, Salt Lake
City, UT |
C. Barham Ray (72)
6410 Poplar Ave., Suite 900
Memphis, TN 38119 | Trustee | Partners Fund
Small-Cap Fund
International Fund
Global Fund | 1992
1992
1998
2012 | Private Investor and Consultant since 2008; Partner, 360 Goodwyn LLC (real estate development) (2005-2013) | 4 | Director, Financial
Federal Savings Bank,
Memphis, TN |
Perry C. Steger (56)
1978 South Austin Avenue
Georgetown, TX 78626 | Chairman
of
the Board | Partners Fund
Small-Cap Fund
International Fund
Global Fund | 2001
2001
2001
2012 | President, Steger & Bizzell Engineering, Inc. (engineering firm) since 2003; Director of Product Strategy, National Instruments, Inc. (1996-2003) | 4 | |
| * | Mr. Hawkins is a director and officer of Southeastern Asset Management, Inc. and as such is classified as an “interested” Trustee. |
The following additional information may be obtained for free by calling (800) 445-9469, visiting longleafpartners.com, or on the SEC's website at sec.gov.
Proxy Voting Policies and Procedures
A description of Longleaf's Proxy Voting Policies and Procedures is included in the Statement of Additional Information (SAI).
Proxy Voting Record
Information regarding how the Funds voted proxies relating to portfolio securities during the most recent 12-month period ended June 30 is contained in Form N-PX.
Quarterly Portfolio Holdings
Longleaf provides a complete list of its holdings four times each year, as of the end of each quarter. The Fund files the lists with the Securities and Exchange Commission (SEC) on Form N-CSR (second and fourth quarters) and Form N-Q (first and third quarters). Shareholders may view the Longleaf Funds' Forms N-CSR and N-Q on the SEC's website at www.sec.gov. Forms N-CSR and N-Q may also be reviewed and copied at the SEC's Public Reference Room in Washington, DC. Information regarding the operations of the Public Reference Room may be obtained by calling (202) 551-8090 (direct) or (800) 732-0330 (general SEC number). A list of the Longleaf Funds' quarter-end holdings is also available at www.longleafpartners.com on or about 15 days following each quarter end and remains available until the list is updated in the subsequent quarter.
Fund Trustees
Additional information about Fund Trustees is included in the SAI.
Change in Independent Registered Public Accounting Firm
On September 18, 2018, PricewaterhouseCoopers LLP (“PwC”) resigned as the independent registered public accounting firm to the Longleaf Partners Funds Trust, comprising Longleaf Partners Fund, Longleaf Partners Small-Cap Fund, Longleaf Partners International Fund, and Longleaf Partners Global Fund (collectively referred to as the “Funds”). The Audit Committee of the Funds’ Board of Trustees participated in, and approved, the decision to change the independent registered public accounting firm. PwC’s reports on the Funds’ financial statements for the fiscal periods ended December 31, 2017 and December 31, 2016 contained no adverse opinion or disclaimer of opinion nor were they qualified or modified as to uncertainty, audit scope or accounting principle. During the Funds’ fiscal periods ended December 31, 2017 and December 31, 2016 and the subsequent interim period through September 18, 2018, (i) there were no disagreements with PwC on any matter of accounting principles or practices, financial statement disclosure or auditing scope or procedure, which disagreements, if not resolved to the satisfaction of PwC, would have caused them to make reference to the subject matter of the disagreements in connection with their reports on the Funds’ financial statements for such periods, and (ii) there were no “reportable events” of the kind described in Item 304(a)(1)(v) of Regulation S-K under the Securities Exchange Act of 1934, as amended.
The Audit Committee of the Funds’ Board of Trustees approved the engagement of Ernst & Young LLP (“EY”) as the Funds’ independent registered public accounting firm on December 14, 2018 for the fiscal year ending December 31, 2018. During the Funds’ fiscal periods ended December 31, 2017 and December 31, 2016, and the subsequent interim period through December 14, 2018, neither the Fund, nor anyone on its behalf, consulted with EY on items which: (i) concerned the application of accounting principles to a specified transaction, either completed or proposed, or the type of audit opinion that might be rendered on the Funds’ financial statements; or (ii) concerned the subject of a disagreement (as defined in paragraph (a)(1)(iv) of Item 304 of Regulation S-K) or reportable events (as described in paragraph (a)(1)(v) of said Item 304).
Call (800) 445-9469
Fund Information
To request a printed Prospectus, Summary Prospectus (longleafpartners.com/mutual_fund_documents/ prospectus), Statement of Additional Information (including Longleaf's Proxy Voting Policies and Procedures), financial report, application or other Fund information from 8:00 a.m. to 8:00 p.m. Eastern time, Monday through Friday.
Shareholder Inquiries
To request action on your existing account from 9:00 a.m. to 6:00 p.m. Eastern time, Monday through Friday.
Account Information
For automated account balance and transaction activity, 24 hours a day, seven days a week.
| Correspondence | |
| By regular mail: | By express mail or overnight courier: |
| Longleaf Partners Funds | Longleaf Partners Funds |
| P.O. Box 9694 | c/o BNY Mellon |
| Providence, RI 02940-9694 | 4400 Computer Drive |
| | Westborough, MA 01581 |
| | (800) 445-9469 |
Published Daily Price Quotations
Below are the common references for searching printed or electronic media to find daily NAVs of the Funds.
| Abbreviation | Symbol | Cusip | Transfer Agent
Fund Number | Status to
New Investors |
| Partners | LLPFX | 543069108 | 133 | Open |
| Sm-Cap | LLSCX | 543069207 | 134 | Closed 7/31/1997 |
| Intl | LLINX | 543069405 | 136 | Open |
| Global | LLGLX | 543069504 | 137 | Open |
Our Governing Principles
We will treat your investment as if it were our own.
We will remain significant investors in Longleaf Partners Funds.
We will invest for the long term, while striving to maximize returns and minimize business, financial, purchasing power, regulatory and market risks.
We will choose each equity investment based on its discount from our appraisal of corporate intrinsic value, its financial strength, its management, its competitive position, and our assessment of its future earnings potential.
We will focus our assets in our best ideas.
We will not impose loads or 12b-1 charges on mutual fund shareholders.
We will consider closing to new investors if closing would benefit existing clients.
We will discourage short-term speculators and market timers.
We will continue our efforts to enhance shareholder services.
We will communicate with our investment partners as candidly as possible.
On December 8, 2003, the Board of Trustees of the Longleaf Partners Funds adopted a Code of Ethics applicable to officers of Southeastern Asset Management, Inc. performing the principal executive function, the principal financial function, and the principal legal function for the Funds. This Code of Ethics, as amended, may be obtained without charge, upon request, by calling (901) 761-2474 and asking Southeastern’s General Counsel for a copy.
| Item 3. | Audit Committee Financial Expert. |
The Board of Trustees of the Longleaf Partners Funds determined that the registrant has at least one audit committee financial expert serving on its audit committee. Mr. Kent Misener is the registrant’s “audit committee financial expert” and is “independent” as defined by Item 3 of Form N-CSR.
| Item 4. | Principal Accountant Fees and Services. |
| | | | | | | | |
| | | 2018 | | | 2017 | |
(a) Audit Fees | | $ | 120,000 | | | $ | 179,463 | |
(b) Audit Related Fees | | | — | | | | — | |
(c) Tax Fees* | | | 36,750 | | | | 48,700 | |
(d) All Other Fees | | | — | | | | — | |
* Includes amounts related to the review of excise distribution requirements, review and signature of Federal, state, and excise tax returns, and ongoing tax compliance and tax filings in foreign jurisdictions.
(e)(1) Audit Committee Pre-Approval Policies – Under Longleaf Partners Funds (the “Funds”) Audit Committee Charter, the Audit Committee must pre-approve all audit and non-audit services to be provided to the Funds and all non-audit services to be provided to Southeastern Asset Management, Inc., by the Funds’ principal accountant.
(e)(2) No percentage of the principal accountant’s fees or services were approved pursuant to the waiver provision of paragraph (c)(7)(i)(C) of Rule 2-01 of Regulation S-X.
(f) Not applicable.
(g) The aggregate non-audit fees for services to the registrant, its investment adviser and any entity controlling, controlled by, or under common control with the adviser that provides ongoing services to the registrant were $160,937 and $69,989 in 2018 and 2017, respectively.
(h) No services included in (b) through (d) above were approved pursuant to paragraph (c)(7)(ii) of Rule 2-01 of Regulation S-X.
| Item 5. | Audit Committee of Listed Registrants. |
Not applicable.
| Item 6. | Schedule of Investments. |
A complete schedule of investments for the period ended December 31, 2018 is included in the Annual Report filed under Item I of this form.
| Item 7. | Disclosure of Proxy Voting Policies and Procedures for Closed-End Management Investment Companies. |
Not applicable.
| Item 8. | Portfolio Managers of Closed-End Management Investment Companies. |
Not applicable.
| Item 9. | Purchases of Equity Securities by Closed-End Management Investment Company and Affiliated Purchasers. |
Not applicable.
| Item 10. | Submission of Matters to a Vote of Security Holders. |
The registrant does not currently have in place procedures by which shareholders may recommend nominees to the registrant’s board of directors.
| Item 11. | Controls and Procedures. |
The registrant’s principal executive officer and principal financial officer have concluded, based on their evaluation of the effectiveness of the design and operation of the registrant’s disclosure controls and procedures as of a date within 90 days of the filing date of this report on Form N-CSR, that the design and operation of such procedures are effective to provide reasonable assurance that information required to be disclosed by the investment company in the reports that it files or submits under the Securities Exchange Act of 1934 is recorded, processed, summarized, and reported within the time periods specified in the Commission’s rules and forms.
At the date of filing this Form N-CSR, the registrant’s principal executive officer and principal financial officer are aware of no changes in the registrant’s internal control over financial reporting during the most recent fiscal quarter of the period covered by this report (ie, the fourth quarter) that have materially affected, or are reasonably likely to materially affect, the registrant’s internal control over financial reporting.
| Item 12. | Disclosure of Securities Lending Activities for Closed-End Management Investment Companies. |
Not applicable.
Exhibit 99.1 Certification Required by Item 13(a)(2) of Form N-CSR.
Exhibit 99.2 Certification Pursuant to Section 906 of the Sarbanes Oxley Act.
Exhibit 99.3 Change in the Registrant’s Independent Public Accounting Firm.
Exhibit 99.4 Letter of Agreement
SIGNATURES
Pursuant to the requirements of the Securities Exchange Act of 1934 and the Investment Company Act of 1940, the registrant has duly caused this report to be signed on its behalf by the undersigned, thereunto duly authorized.
| | |
| Longleaf Partners Funds Trust |
| |
| By | | /s/ O. Mason Hawkins |
| | O. Mason Hawkins Trustee Longleaf Partners Funds Trust |
Date February 28, 2019
Pursuant to the requirements of the Securities Exchange Act of 1934 and the Investment Company Act of 1940, this report has been signed below by the following persons on behalf of the registrant and in the capacities and on the dates indicated.
| | |
| By | | /s/ Ross Glotzbach |
| | Ross Glotzbach CEO, Southeastern Asset Management, Inc. Functioning as principal executive officer under agreements with Longleaf Partners Funds Trust and its separate series |
Date February 28, 2019
| | |
By | | /s/ Ryan S. Hocker |
| | Ryan S. Hocker Global Funds Treasurer, Southeastern Asset Management, Inc. Functioning as principal financial officer under agreements with Longleaf Partners Funds Trust and its separate series |
Date February 28, 2019
A signed original of this written statement has been provided to Longleaf Partners Funds Trust and will be retained by Longleaf Partners Funds Trust and furnished to the Securities and Exchange Commission or its staff upon request.