UNITED STATES
SECURITIES AND EXCHANGE COMMISSION
Washington, D.C. 20549
FORM N-CSR
CERTIFIED SHAREHOLDER REPORT OF REGISTERED MANAGEMENT
INVESTMENT COMPANIES
| | |
Investment Company Act file number: | | 811-04930 |
| |
Exact name of registrant as specified in charter: | | Dryden Municipal Bond Fund |
| |
Address of principal executive offices: | | Gateway Center 3, |
| | | 100 Mulberry Street, |
| | | Newark, New Jersey 07102 |
| |
Name and address of agent for service: | | Deborah A. Docs |
| | | Gateway Center 3, |
| | | 100 Mulberry Street, |
| | | Newark, New Jersey 07102 |
| |
Registrant’s telephone number, including area code: | | 973-367-7521 |
| |
Date of fiscal year end: | | 4/30/2005 |
| |
Date of reporting period: | | 4/30/2005 |
Item 1 – Reports to Stockholders – [INSERT REPORT]

Dryden Municipal Bond Fund/
High Income Series & Insured Series
| | |
| APRIL 30, 2005 | | ANNUAL REPORT |

FUND TYPE
Municipal Bond
OBJECTIVE
High Income Series: Maximum amount of income that is eligible for exclusion from federal income taxes.
Insured Series: Maximum amount of income that is eligible for exclusion from federal income taxes, consistent with the preservation of capital.
This report is not authorized for distribution to prospective investors unless preceded or accompanied by a current prospectus.
The views expressed in this report and information about the Series’ portfolio holdings are for the period covered by this report and are subject to change thereafter.
JennisonDryden is a registered trademark of The Prudential Insurance Company of America.

Dear Shareholder,
June 17, 2005
We hope that you find the annual report for the Dryden Municipal Bond Fund/High Income Series and Insured Series informative and useful. As a JennisonDryden Mutual Fund shareholder, you may be thinking about where you can find additional growth opportunities. You could invest in last year’s top-performing asset class and hope that history repeats itself or you could stay in cash while waiting for the “right moment” to invest.
We believe it is wise to take advantage of developing domestic and global investment opportunities through a diversified portfolio of stock and bond mutual funds. A diversified asset allocation offers two advantages. It helps you manage downside risk by not being overly exposed to any particular asset class, plus it gives you a better opportunity to have at least some of your assets in the right place at the right time. Your financial professional can help you create a diversified investment plan that may include mutual funds that cover all the basic asset classes and is reflective of your personal investor profile and tolerance for risk.
JennisonDryden Mutual Funds give you a wide range of choices that can help you make progress toward your financial goals. Our funds offer the experience, resources, and professional discipline of three leading asset managers. They are recognized and respected in the institutional market and by discerning investors for excellence in their respective strategies. JennisonDryden equity funds are advised by Jennison Associates LLC and/or Quantitative Management Associates LLC (QMA). Prudential Investment Management, Inc. (PIM) advises the JennisonDryden fixed income and money market funds. Jennison Associates, QMA, and PIM are registered investment advisers and Prudential Financial companies.
Thank you for choosing JennisonDryden Mutual Funds.
Sincerely,

Judy A. Rice, President
Dryden Municipal Bond Fund/High Income Series and Insured Series
| | |
| Dryden Municipal Bond Fund | | 1 |
Your Series’ Performance
High Income Series
Series objective
The investment objective of the Dryden Municipal Bond Fund/High Income Series (the Series) is to seek the maximum amount of income that is eligible for exclusion from federal income taxes. There can be no assurance that the Series will achieve its investment objective.
Performance data quoted represent past performance. Past performance does not guarantee future results. The investment return and principal value of an investment will fluctuate, so that an investor’s shares, when redeemed, may be worth more or less than their original cost. Current performance may be lower or higher than the past performance data quoted. An investor may obtain performance data current to the most recent month-end by visiting our website at www.jennisondryden.com or by calling (800) 225-1852. The maximum initial sales charge is 4.00% (Class A shares).
| | | | | | | | | | |
| Cumulative Total Returns1 as of 4/30/05 |
| | | One Year | | | Five Years | | | Ten Years | | Since Inception2 |
Class A | | 8.81 | % | | 33.18 | % | | 72.38% (71.71) | | 153.16% (151.44) |
Class B | | 8.53 | | | 31.63 | | | 67.50 (66.85) | | 209.76 (200.77) |
Class C | | 8.26 | | | 30.01 | | | 63.39 (62.76) | | 69.77 (69.11) |
Class Z | | 9.09 | | | 34.89 | | | N/A | | 59.06 (58.75) |
LB Muni Bond Index3 | | 6.81 | | | 40.52 | | | 87.35 | | *** |
LB Non-Investment-Grade Muni Bond Index4, 5 | | 12.58 | | | 45.30 | | | — | | **** |
Lipper HY Muni Debt Funds Avg.6 | | 8.28 | | | 36.04 | | | 69.51 | | ***** |
| | | | | | | | | | | |
| Average Annual Total Returns1 as of 3/31/05 |
| | | One Year | | | Five Years | | | Ten Years | | Since Inception2 |
Class A | | 1.13 | % | | 4.62 | % | | 5.03% (4.99) | | 5.92% (5.87) |
Class B | | 0.08 | | | 5.06 | | | 5.14 (5.10) | | 6.56 (6.39) |
Class C | | 3.82 | | | 4.96 | | | 4.88 (4.84) | | 4.94 (4.90) |
Class Z | | 5.61 | | | 5.74 | | | N/A | | 5.40 (5.38) |
LB Muni Bond Index3 | | 2.67 | | | 6.58 | | | 6.33 | | *** |
LB Non-Investment-Grade Muni Bond Index4, 5 | | 9.19 | | | 7.28 | | | — | | **** |
Lipper HY Muni Debt Funds Avg.6 | | 5.29 | | | 5.83 | | | 5.28 | | ***** |
| | | | | | | | | | | | |
| Distribution and Yields1 as of 4/30/05 | |
| | | Total Distributions
Paid for 12 Months | | 30-Day
SEC Yield | | | Taxable Equivalent Yield7
at Tax Rates of | |
| | | | | 33% | | | 35% | |
Class A | | $ | 0.52 | | 4.40 | % | | 6.57 | % | | 6.77 | % |
Class B | | $ | 0.49 | | 4.34 | | | 6.48 | | | 6.68 | |
Class C | | $ | 0.47 | | 4.09 | | | 6.10 | | | 6.29 | |
Class Z | | $ | 0.54 | | 4.84 | | | 7.22 | | | 7.45 | |
| | |
| 2 | | Visit our website at www.jennisondryden.com |
The cumulative total returns do not reflect the deduction of applicable sales charges. If reflected, the applicable sales charges would reduce the cumulative total returns performance quoted. Class A shares are subject to a maximum front-end sales charge of 4.00%. Under certain circumstances, Class A shares may be subject to a contingent deferred sales charge (CDSC) of 1%. Class B and Class C shares are subject to a maximum CDSC of 5% and 1% respectively. Class Z shares are not subject to a sales charge.
1Source: Prudential Investments LLC and Lipper Inc. The average annual total returns take into account applicable sales charges. During certain periods shown, fee waivers and/or expense reimbursements were in effect. Without such fee waivers and expense reimbursements, the returns for the share classes would have been lower, as indicated in parentheses. Class A, Class B, and Class C shares are subject to an annual distribution and service (12b-1) fee of up to 0.30%, 0.50%, and 1.00% respectively. Approximately seven years after purchase, Class B shares will automatically convert to Class A shares on a quarterly basis. Class Z shares are not subject to a 12b-1 fee. The returns in the tables do not reflect the deduction of taxes that a shareholder would pay on Fund distributions or following the redemption of Fund shares.
2Inception dates: Class A, 1/22/90; Class B, 9/17/87; Class C, 8/1/94; and Class Z, 9/16/96.
3The Lehman Brothers (LB) Municipal (Muni) Bond Index is an unmanaged index of over 39,000 long-term investment-grade municipal bonds. It gives a broad look at how long-term investment-grade municipal bonds have performed.
4The Lehman Brothers (LB) Non-Investment-Grade Municipal (Muni) Bond Index is an unmanaged index of non-rated or Ba1 below-rated municipal bonds. It gives a broad look at how non-investment-grade municipal bonds have performed. The bonds in this index must have an outstanding par value of at least $3 million and be issued as part of a transaction of at least $20 million. The bonds must also have a dated date after December 31, 1990, and must be at least one year from their maturity date.
5The inception date of the LB Non-Investment-Grade Muni Bond Index is October 1995.
6The Lipper High Yield (HY) Muni Debt Funds Average (Lipper Average) represents returns based on an average return of all funds in the Lipper High Yield Muni Debt Funds category for the periods noted. Funds in the Lipper Average invest at least 50% of their assets in lower-rated municipal debt issues.
7Some investors may be subject to the federal alternative minimum tax and/or state and local taxes. Taxable equivalent yields reflect federal taxes only.
Investors cannot invest directly in an index. The returns for the Lehman Brothers Indexes and the Lipper Average would be lower if they included the effects of sales charges, operating expenses of a mutual fund, or taxes. Returns for the Lipper Average reflect the deduction of operating expenses, but not sales charges or taxes.
***LB Muni Bond Index Closest Month-End to Inception cumulative total returns as of 4/30/05 are 181.28% for Class A, 256.94% for Class B, 95.72% for Class C, and 67.90% for Class Z. LB Muni Bond Index Closest Month-End to Inception average annual total returns as of 3/31/05 are 6.95% for Class A, 7.45% for Class B, 6.34% for Class C, and 6.09% for Class Z.
****LB Non-Investment-Grade Muni Bond Index Closest Month-End to Inception cumulative total return as of 4/30/05 is 75.18% for Class Z. LB Non-Investment-Grade Muni Bond Index Closest Month-End to Inception average annual total return as of 3/31/05 is 6.57% for Class Z.
*****Lipper Average Closest Month-End to Inception cumulative total returns as of 4/30/05 are 150.10% for Class A, 212.96% for Class B, 77.87% for Class C, and 54.16% for Class Z. Lipper Average Closest Month-End to Inception average annual total returns as of 3/31/05 are 6.11% for Class A, 6.62% for Class B, 5.38% for Class C, and 5.04% for Class Z.
| | |
| Dryden Municipal Bond Fund | | 3 |
Your Series’ Performance (continued)
| | | |
| Five Largest Issues expressed as a percentage of net assets as of 4/30/05 | |
Memphis (TN) Ctr. City Rev. Fin. Corp., 6.50%, 09/01/28 | | 4.1 | % |
New York (NY) City Trans. Fin. Auth. Rev., 5.50%, 11/01/20 | | 1.6 | |
City of Cedar Rapids (IA) Rev., 9.00%, 07/01/18 | | 1.4 | |
Tobacco Settlement Corp., (NY) 5.50%, 06/01/14 | | 1.4 | |
Austin (TX) Hsg. Fin. Corp., 7.75%, 11/01/29 | | 1.4 | |
Issues are subject to change.
| | | |
| Credit Quality expressed as a percentage of net assets as of 4/30/05 | |
Aaa | | 23.9 | % |
Aa | | 5.8 | |
A | | 9.6 | |
Baa | | 19.4 | |
Ba | | 7.2 | |
B | | 3.6 | |
Caa | | 1.7 | |
NR | | 27.3 | |
Total Investments | | 98.5 | |
Other assets in excess of liabilities | | 1.5 | |
Net Assets | | 100.0 | % |
| | |
|
|
Source: Moody’s rating, defaulting to S&P when not rated.
Credit quality is subject to change.
| | |
| 4 | | Visit our website at www.jennisondryden.com |
Investment Adviser’s Report—High Income Series
Prudential Investment Management, Inc.
Lower-quality municipal bonds shine
For the High Income Series’ fiscal year that began May 1, 2004, municipal bonds rated below investment grade performed significantly better than higher-quality municipal bonds. Solid economic conditions in the United States helped boost investor confidence in lower-quality municipal bonds, which were sought for their relatively attractive yields.
Reflecting its “all weather” strategy, the Series continued to invest in bonds of investment-grade and below-investment-grade quality in about a 60/40 mix. Therefore for the fiscal year ended April 30, 2005, the Series outperformed the Lehman Brothers Municipal Bond Index, which consists entirely of investment-grade bonds. By contrast, the Series trailed the Lehman Brothers Non-Investment-Grade Municipal Bond Index, which includes bonds that are non-rated or rated below investment grade. The Series’ Class A, B, and Z shares’ cumulative total returns exceeded the Lipper High Yield Municipal Debt Funds Average (Lipper Average), but its Class C shares’ cumulative total return lagged the Lipper Average.
Emphasis on long-term municipal bonds benefited High Income Series
During the reporting period, repeated increases in short-term interest rates by the Federal Reserve (the Fed) were among the most important developments that affected the municipal bond market. The Fed increased its target for the federal funds rate—the rate banks charge each other on overnight loans—by a quarter percentage point seven times. Raising the target rate from 1.00% to 2.75% removed some of the aggressive monetary stimulus from the U.S. economy, which had begun to show signs of mounting inflationary pressures.
Short-term municipal bond yields rose considerably as these bond yields are the most sensitive to changes in short-term rates. By contrast, intermediate-term municipal bond yields declined moderately, while surprisingly, long-term municipal bond yields declined significantly. The change in yields created a pronounced flattening in the slope of the municipal bond yield curve, which depicts yields on tax-exempt bonds from the shortest to the longest maturities. Because bond prices rise (fall) when yields decline (increase), long-term bonds outperformed short- and intermediate-term bonds for the reporting period. Therefore the Series benefited from its large exposure to long-term municipal bonds.
High Income Series favored municipal bond healthcare sector
As for allocation to specific sectors of the tax-exempt market, the Series generally benefited from its considerable exposure to healthcare bonds. There was solid investor demand for these bonds, which offer relatively attractive yields in what is still essentially a low-interest-rate environment. The sector also benefited from an absence
| | |
| Dryden Municipal Bond Fund | | 5 |
Investment Adviser’s Report—High Income Series
Prudential Investment Management, Inc. (continued)
of major negative credit events. Among the Series’ healthcare positions that performed well were Decatur Hospital Authority bonds for the Wise Regional Health System in Texas, Hillsborough County Industrial Development Authority bonds for the Lakeshore Villas Project in Florida, and Suffolk County Industrial Development Agency bonds for the South Hampton Hospital Association in New York.
In the previous annual report for the fiscal year ended April 30, 2004, we mentioned that the Series held Somerset County Hospital Authority bonds for the Meadow View Nursing Center in Pennsylvania that experienced a weakening occupancy rate and reduced revenues from Medicaid. In December 2004, only a partial interest payment was made on the bonds, causing them to default. The payment default had a negligible impact on the Series’ performance during the fiscal year ended April 30, 2005. On the whole, our strategy favors facilities with relatively lower dependence on Medicaid.
Gains in tobacco-related bonds aided High Income Series
The tobacco-related sector of the municipal bond market remains volatile. There are ongoing disputes about how much money has to be paid by tobacco firms that participate in the Master Settlement Agreement (MSA) signed in 1998. MSA funds are used to back bonds issued by non recourse trusts created by state, county, and local governments.
That said, the Series benefited from our decision to increase its exposure to the sector. Among the Series’ largest holdings were bonds of the Tobacco Settlement Financing Corp. of New York. These bonds are backed by MSA funds, and they are also obligations of the state of New York. Consequently, in the event that the MSA revenues are insufficient to pay debt service on the bonds, such debt service would be payable from funds of the state of New York. Some bonds held by the Series are backed solely by MSA funds.
Tobacco-related municipal bonds gained in value after a three-judge panel of a U.S. federal appellate court decided in February 2005 that the U.S. Justice Department could not force tobacco firms to give up billions of dollars in profits that might be used to fund stop-smoking programs and other initiatives. Another development that favored tobacco firms occurred in April 2005 when the full federal appeals court in Washington D.C. decided not to review the U.S. Justice Department’s case against the tobacco industry. (No assurance can be given that these rulings will not be overturned, in whole or in part, by another court of competent jurisdiction.)
High Income Series comfortable with limited exposure to airline-related municipal bonds
Airline-related bonds were among the most volatile areas of the Lehman Brothers Non-Investment-Grade Municipal Bond Index during the reporting period. This volatility reflected the industry’s challenging operating environment, characterized by
| | |
| 6 | | Visit our website at www.jennisondryden.com |
the high cost of jet fuel, limited ability to pass along increased operating costs to passengers, and struggles to cut other costs and boost passenger traffic. Despite this volatility, airline-related bonds were among the best performers in the Index. Nevertheless, the Series had a very limited exposure to the sector, as we believed its risk/reward balance did not warrant having a larger position.
Toll road municipal bonds another positive for the High Income Series
The Series’ exposure to the transportation sector included a few positions in the bonds of Pocahontas Parkway Association Toll Road in Virginia among others. These bonds performed well, reflecting the toll road’s improved traffic trends and toll rate increases. However, late in the reporting period, Moody’s Investors Service lowered the senior bonds’ credit rating to Ba3 from Ba2 and the first tier subordinated bonds’ credit rating to B3 from B1, citing concern about toll road revenues among other factors. Moody’s downgrade did not have a material impact on the prices of the Pocahontas Parkway bonds. We continue to expect improving trends in traffic on the toll road.
Multifamily housing bonds weighed on High Income Series’ returns
Multifamily housing projects are sometimes burdened by weakening occupancy rates. Such was the case with Florida Housing Finance Corp. bonds for the Westchase Apartments and the Austin, Texas Housing Finance Corp. bonds for the Stony Creek/Princeton Apartments. Both declined in value during the reporting period, detracting from the Series’ returns.
Focus on bonds backed by special taxes aided High Income Series
The Series benefited from holding special tax/assessment district bonds, which represented one of its largest sector concentrations during the reporting period. The bonds help finance the development of public infrastructure for residential communities in California. These bonds are secured by special taxes levied on parcels of land. A strong real estate market, fueled by attractive mortgage rates, supported these bonds during the reporting period.
| | |
| Dryden Municipal Bond Fund | | 7 |
Your Series’ Performance
Insured Series
Series objective
The investment objective of the Dryden Municipal Bond Fund/Insured Series (the Series) is to seek the maximum amount of income that is eligible for exclusion from federal income taxes, consistent with the preservation of capital. There can be no assurance that the Series will achieve its investment objective.
Performance data quoted represent past performance. Past performance does not guarantee future results. The investment return and principal value of an investment will fluctuate, so that an investor’s shares, when redeemed, may be worth more or less than their original cost. Current performance may be lower or higher than the past performance data quoted. An investor may obtain performance data current to the most recent month-end by visiting our website at www.jennisondryden.com or by calling (800) 225-1852. The maximum initial sales charge is 4.00% (Class A shares).
| | | | | | | | | | |
| Cumulative Total Returns1 as of 4/30/05 |
| | | One Year | | | Five Years | | | Ten Years | | Since Inception2 |
Class A | | 5.74 | % | | 35.14 | % | | 72.50% (72.03) | | 152.77% (150.47) |
Class B | | 5.45 | | | 33.41 | | | 67.25 (66.79) | | 200.61 (183.66) |
Class C | | 5.18 | | | 31.77 | | | 63.17 (62.72) | | 69.74 (69.28) |
Class Z | | 5.94 | | | 36.65 | | | N/A | | 60.03 (59.89) |
LB Muni Bond Index3 | | 6.81 | | | 40.52 | | | 87.35 | | *** |
Lipper Insured Muni Debt Funds Avg.4 | | 5.89 | | | 34.83 | | | 69.80 | | **** |
| | | | | | | | | | | |
| Average Annual Total Returns1 as of 3/31/05 |
| | | One Year | | | Five Years | | | Ten Years | | Since Inception2 |
Class A | | –3.03 | % | | 4.86 | % | | 5.01% (4.99) | | 5.90% (5.83) |
Class B | | –4.08 | | | 5.31 | | | 5.13 (5.10) | | 6.39 (6.04) |
Class C | | –0.47 | | | 5.21 | | | 4.87 (4.84) | | 4.94 (4.91) |
Class Z | | 1.20 | | | 5.96 | | | N/A | | 5.46 (5.45) |
LB Muni Bond Index3 | | 2.67 | | | 6.58 | | | 6.33 | | *** |
Lipper Insured Muni Debt Funds Avg.4 | | 1.48 | | | 5.67 | | | 5.25 | | **** |
| | | | | | | | | | | | |
| Distribution and Yields1 as of 4/30/05 | |
| | | Total Distributions
Paid for 12 Months | | 30-Day
SEC Yield | | | Taxable Equivalent Yield5
at Tax Rates of | |
| | | | | 33% | | | 35% | |
Class A | | $ | 0.53 | | 2.68 | % | | 4.00 | % | | 4.12 | % |
Class B | | $ | 0.50 | | 2.55 | | | 3.81 | | | 3.92 | |
Class C | | $ | 0.47 | | 2.30 | | | 3.43 | | | 3.54 | |
Class Z | | $ | 0.56 | | 3.05 | | | 4.55 | | | 4.69 | |
| | |
| 8 | | Visit our website at www.jennisondryden.com |
The cumulative total returns do not reflect the deduction of applicable sales charges. If reflected, the applicable sales charges would reduce the cumulative total returns performance quoted. Class A shares are subject to a maximum front-end sales charge of 4.00%. Under certain circumstances, Class A shares may be subject to a contingent deferred sales charge (CDSC) of 1%. Class B and Class C shares are subject to a maximum CDSC of 5% and 1% respectively. Class Z shares are not subject to a sales charge.
1Source: Prudential Investments LLC and Lipper Inc. The average annual total returns take into account applicable sales charges. During certain periods shown, fee waivers and/or expense reimbursements were in effect. Without such fee waivers and expense reimbursements, the returns for the share classes would have been lower, as indicated in parentheses. Class A, Class B, and Class C shares are subject to an annual distribution and service (12b-1) fee of up to 0.30%, 0.50%, and 1.00% respectively. Approximately seven years after purchase, Class B shares will automatically convert to Class A shares on a quarterly basis. Class Z shares are not subject to a 12b-1 fee. The returns in the tables do not reflect the deduction of taxes that a shareholder would pay on Fund distributions or following the redemption of Fund shares.
2Inception dates: Class A, 1/22/90; Class B, 9/17/87; Class C, 8/1/94; and Class Z, 9/16/96.
3The Lehman Brothers (LB) Municipal (Muni) Bond Index is an unmanaged index of over 39,000 long-term investment-grade municipal bonds. It gives a broad look at how long-term investment-grade municipal bonds have performed.
4The Lipper Insured Muni Debt Funds Average (Lipper Average) represents returns based on an average return of all funds in the Lipper Insured Muni Debt Funds category for the periods noted. Funds in the Lipper Average invest primarily in municipal debt issues insured as to timely payment.
5Some investors may be subject to the federal alternative minimum tax and/or state and local taxes. Taxable equivalent yields reflect federal taxes only.
Investors cannot invest directly in an index. The returns for the LB Muni Bond Index and the Lipper Average would be lower if they included the effects of sales charges, operating expenses of a mutual fund, or taxes. Returns for the Lipper Average reflect the deduction of operating expenses, but not sales charges or taxes.
***LB Muni Bond Index Closest Month-End to Inception cumulative total returns as of 4/30/05 are 181.28% for Class A, 256.94% for Class B, 95.72% for Class C, and 67.90% for Class Z. LB Muni Bond Index Closest Month-End to Inception average annual total returns as of 3/31/05 are 6.95% for Class A, 7.45% for Class B, 6.34% for Class C, and 6.09% for Class Z.
****Lipper Average Closest Month-End to Inception cumulative total returns as of 4/30/05 are 152.10% for Class A, 221.75% for Class B, 78.12% for Class C, and 54.21% for Class Z. Lipper Average Closest Month-End to Inception average annual total returns as of 3/31/05 are 6.16% for Class A, 6.79% for Class B, 5.39% for Class C, and 5.02% for Class Z.
| | |
| Dryden Municipal Bond Fund | | 9 |
Your Series’ Performance (continued)
| | | |
| Five Largest Issues expressed as a percentage of net assets as of 4/30/05 | |
Hawaii (HI) Dept. Budget & Fin., 6.20%, 11/01/29 | | 3.0 | % |
Metro. (NY) Trans. Auth. N.Y. Svc. Contract, 5.50%, 07/01/23 | | 2.7 | |
Clark Cnty. (NV) Sch. Dist., 5.00%, 06/15/19 | | 2.6 | |
California (CA) St., 5.25%, 02/01/27 | | 2.5 | |
Brevard Cnty. (FL) Hlth. Facs., 5.60%, 10/01/10 | | 2.1 | |
Issues are subject to change.
| | | |
| Credit Quality expressed as a percentage of net assets as of 4/30/05 | |
Aaa | | 93.5 | % |
Aa | | 2.8 | |
A | | 3.4 | |
Total Investments | | 99.7 | |
Other assets in excess of liabilities | | 0.3 | |
Net Assets | | 100.0 | % |
| | |
|
|
Source: Moody’s rating, defaulting to S&P when not rated.
Credit quality is subject to change.
| | |
| 10 | | Visit our website at www.jennisondryden.com |
Investment Adviser’s Report—Insured Series
Prudential Investment Management, Inc.
Higher short-term rates flatten municipal bond yield curve
During the Insured Series’ fiscal year that began May 1, 2004, repeated increases in short-term interest rates by the Federal Reserve (the Fed) were among the most important developments that affected the municipal bond market. The Fed raised its target for the federal funds rate—the rate banks charge each other on overnight loans—by a quarter percentage point seven times. By raising the target rate from 1.00% to 2.75%, the Fed withdrew some of the aggressive monetary stimulus from a U.S. economy that had begun to show signs of mounting inflationary pressures.
Short-term municipal bond yields rose considerably as these bond yields are the most sensitive to changes in short-term rates. By contrast, intermediate-term municipal bond yields declined moderately, while surprisingly, long-term municipal bond yields declined significantly. The change in yields created a pronounced flattening in the slope of the municipal bond yield curve, which depicts yields on tax-exempt bonds from the shortest to the longest maturities.
Holding too few long-term municipal bonds hurt Insured Series
Because bond prices decline (rise) when yields increase (fall), short- and intermediate-term municipal bonds underperformed long-term municipal bonds for the fiscal year ended April 30, 2005. We sold some of the Series’ intermediate-term municipal bonds and purchased long-term municipal bonds. Nevertheless, the bulk of the Series’ holdings still consisted of short- and intermediate-term municipal bonds, particularly in the 10-year maturity sector.
Selling more of the bonds in the 10-year maturity sector to purchase more long-term municipal bonds would have created large capital gains that would lessen the advantage of the Series’ tax-exempt dividend payments. Therefore the Series’ lack of exposure to long-term municipal bonds detracted from its performance relative to the Lipper Insured Municipal Debt Fund’s Average and the Lehman Brothers Municipal Bond Index (Index). In addition, some of the Series’ long-term municipal bonds did not benefit fully from the bullish trend in that maturity category. These bonds had short-term “call” features that allow their respective issuers to retire them well ahead of their stated maturity dates, and so behaved like shorter-term bonds.
Gains in tobacco-related sector aided Insured Series
The Series can invest in a limited amount of municipal bonds that are not insured. During the reporting period, the Series had exposure to bonds backed by payments of tobacco companies to state governments under the Master Settlement Agreement (MSA) signed in 1998. Bonds backed by the Tobacco Settlement Financing Corp. of New York are also obligations of the state of New York. Consequently, in the event
| | |
| Dryden Municipal Bond Fund | | 11 |
Investment Adviser’s Report—Insured Series
Prudential Investment Management, Inc. (continued)
that the MSA revenues are insufficient to pay debt service on the bonds, such debt service would be payable from funds of the state of New York. The bonds performed relatively well as they are supported by two sources of revenue rather than just the MSA payments.
Recent legal developments also supported the tobacco-related sector. In February 2005, a three-judge panel of a U.S. federal appellate court decided that the U.S. Justice Department could not force tobacco firms to give up billions of dollars in profits that might be used to fund stop-smoking programs and other initiatives. Then in April 2005, the full federal appeals court in Washington D.C. decided not to review the U.S. Justice Department’s case against the tobacco industry. (No assurance can be given that these rulings will not be overturned, in whole or in part, by another court of competent jurisdiction.) Nonetheless, on the whole, the tobacco-related sector remains volatile amid ongoing disputes about how much money has to be paid by tobacco firms that participate in the MSA.
Exposure to healthcare bonds another positive for Insured Series
The Series also benefited from its exposure to healthcare bonds, one of the best performing sectors in the municipal market during the reporting period, based on the Index. There was solid investor demand for these bonds as the sector offers relatively attractive yields in what is still essentially a low-interest-rate environment. In addition, the healthcare sector benefited from an absence of major negative credit events.
| | |
| 12 | | Visit our website at www.jennisondryden.com |
Fees and Expenses (Unaudited)
As a shareholder of a Series, you incur two types of costs: (1) transaction costs, including sales charges (loads) on purchase payments and redemptions, as applicable, and (2) ongoing costs, including management fees, distribution and/or service (12b-1) fees, and other Series expenses, as applicable. This example is intended to help you understand your ongoing costs (in dollars) of investing in each Series and to compare these costs with the ongoing costs of investing in other mutual funds.
The example is based on an investment of $1,000 invested on November 1, 2004, at the beginning of the period, and held through the six-month period ended April 30, 2005.
Each Series may charge additional fees to holders of certain accounts that are not included in the expenses shown in the table on the following page. These fees apply to Individual Retirement Accounts (IRAs), Section 403(b) accounts, and Section 529 plan accounts. As of the close of the six-month period covered by the table, IRA fees included a setup fee of $5, a maintenance fee of up to $36 annually ($18 for the six-month period), and a termination fee of $10. Section 403(b) accounts and Section 529 plan accounts are each charged an annual $25 fiduciary maintenance fee ($12.50 for the six-month period). Some of the fees vary in amount, or are waived, based on your total account balance or the number of JennisonDryden or Strategic Partners funds, including the Series, that you own. You should consider the additional fees that were charged to your Series account over the six-month period when you estimate the total ongoing expenses paid over the period and the impact of these fees on your ending account value, as these additional expenses are not reflected in the information provided in the expense table. Additional fees have the effect of reducing investment returns.
Actual Expenses
The first line for each share class in the tables on the following pages provides information about actual account values and actual expenses. You may use the information on this line, together with the amount you invested, to estimate the expenses that you paid over the period. Simply divide your account value by $1,000 (for example, an $8,600 account value ÷ $1,000 = 8.6), then multiply the result by the number on the first line under the heading “Expenses Paid During the Six-Month Period” to estimate the expenses you paid on your account during this period.
Hypothetical Example for Comparison Purposes
The second line for each share class in the tables on the following pages provides information about hypothetical account values and hypothetical expenses based on each Series’ actual expense ratio and an assumed rate of return of 5% per year before expenses, which is not a Series’ actual return. The hypothetical account values and expenses may
| | |
| Dryden Municipal Bond Fund | | 13 |
Fees and Expenses (continued)
not be used to estimate the actual ending account balance or expenses you paid for the period. You may use this information to compare the ongoing costs of investing in a Series and other funds. To do so, compare this 5% hypothetical example with the 5% hypothetical examples that appear in the shareholder reports of the other funds.
Please note that the expenses shown in the table are meant to highlight your ongoing costs only, and do not reflect any transactional costs such as sales charges (loads). Therefore the second line for each share class in the table is useful in comparing ongoing costs only, and will not help you determine the relative total costs of owning different funds. In addition, if these transactional costs were included, your costs would have been higher.
| | | | | | | | | | | | | | |
Dryden Municipal
Bond Fund/High
Income Series | | Beginning Account
Value
November 1, 2004 | | Ending Account
Value April 30, 2005 | | Annualized
Expense Ratio
Based on the
Six-Month Period | | | Expenses Paid
During the
Six-Month
Period* |
| | | | | | | | | | | | | | | |
| Class A | | Actual | | $ | 1,000.00 | | $ | 1,037.99 | | 0.86 | % | | $ | 4.35 |
| | | Hypothetical | | $ | 1,000.00 | | $ | 1,020.53 | | 0.86 | % | | $ | 4.31 |
| | | | | | | | | | | | | | | |
| Class B | | Actual | | $ | 1,000.00 | | $ | 1,036.70 | | 1.11 | % | | $ | 5.61 |
| | | Hypothetical | | $ | 1,000.00 | | $ | 1,019.29 | | 1.11 | % | | $ | 5.56 |
| | | | | | | | | | | | | | | |
| Class C | | Actual | | $ | 1,000.00 | | $ | 1,035.31 | | 1.36 | % | | $ | 6.86 |
| | | Hypothetical | | $ | 1,000.00 | | $ | 1,018.05 | | 1.36 | % | | $ | 6.80 |
| | | | | | | | | | | | | | | |
| Class Z | | Actual | | $ | 1,000.00 | | $ | 1,039.42 | | 0.61 | % | | $ | 3.08 |
| | | Hypothetical | | $ | 1,000.00 | | $ | 1,021.77 | | 0.61 | % | | $ | 3.06 |
| | |
| 14 | | Visit our website at www.jennisondryden.com |
| | | | | | | | | | | | | | |
Dryden Municipal
Bond Fund/
Insured Series | | Beginning Account
Value
November 1, 2004 | | Ending Account
Value April 30, 2005 | | Annualized
Expense Ratio
Based on the
Six-Month Period | | | Expenses Paid
During the
Six-Month
Period* |
| | | | | | | | | | | | | | | |
| Class A | | Actual | | $ | 1,000.00 | | $ | 1,011.21 | | 0.91 | % | | $ | 4.54 |
| | | Hypothetical | | $ | 1,000.00 | | $ | 1,020.28 | | 0.91 | % | | $ | 4.56 |
| | | | | | | | | | | | | | | |
| Class B | | Actual | | $ | 1,000.00 | | $ | 1,008.78 | | 1.16 | % | | $ | 5.78 |
| | | Hypothetical | | $ | 1,000.00 | | $ | 1,019.04 | | 1.16 | % | | $ | 5.81 |
| | | | | | | | | | | | | | | |
| Class C | | Actual | | $ | 1,000.00 | | $ | 1,007.59 | | 1.41 | % | | $ | 7.02 |
| | | Hypothetical | | $ | 1,000.00 | | $ | 1,017.80 | | 1.41 | % | | $ | 7.05 |
| | | | | | | | | | | | | | | |
| Class Z | | Actual | | $ | 1,000.00 | | $ | 1,011.90 | | 0.66 | % | | $ | 3.29 |
| | | Hypothetical | | $ | 1,000.00 | | $ | 1,021.52 | | 0.66 | % | | $ | 3.31 |
* Series expenses for each share class are equal to the annualized expense ratio for each share class (provided in the table), multiplied by the average account value over the period, multiplied by the 181 days in the six-month period ended April 30, 2005, and divided by the 365 days in the Series’ fiscal year ended April 30, 2005 (to reflect the six-month period).
| | |
| Dryden Municipal Bond Fund | | 15 |
This Page Intentionally Left Blank
Portfolio of Investments
as of April 30, 2005
| | | | | | | | | | | | |
| Description (a) | | Moody’s
Rating (Unaudited) | | Interest
Rate | | Maturity
Date | | Principal
Amount (000) | | Value (Note 1) |
| | | | | | | | | | | | | |
LONG-TERM INVESTMENTS 97.2% | | | | | | | | |
| | | | | |
Alabama 0.5% | | | | | | | | | | | | |
Butler Ind. Dev. Brd. Solid Wste. Disp. Rev., GA-Pacific Corp. Proj., A.M.T. | | BB+(b) | | 5.75% | | 9/01/28 | | $ | 1,000 | | $ | 1,014,850 |
Camden Ind. Dev. Brd. Facs. Rev., Rfdg. Weyerhaeuser, | | | | | | | | | | | | |
Ser. A | | BBB(b) | | 6.125 | | 12/01/24 | | | 1,000 | | | 1,105,430 |
Ser. B, A.M.T. | | BBB(b) | | 6.375 | | 12/01/24 | | | 1,000 | | | 1,091,360 |
| | | | | | | | | | | |
|
|
| | | | | | | | | | | | | 3,211,640 |
| | | | | |
Alaska 0.6% | | | | | | | | | | | | |
Northern Tobacco Secur. Corp., Asset Bkd. Bonds | | Baa3 | | 6.50 | | 6/01/31 | | | 3,500 | | | 3,581,690 |
| | | | | |
Arizona 1.1% | | | | | | | | | | | | |
Coconino Cnty. Poll. Ctrl. Corp. Rev. Tuscon Elec. Pwr., Navajo, | | | | | | | | | | | | |
Ser. A, A.M.T. | | Ba1 | | 7.125 | | 10/01/32 | | | 5,000 | | | 5,284,700 |
Ser. B | | Ba1 | | 7.00 | | 10/01/32 | | | 1,700 | | | 1,774,188 |
| | | | | | | | | | | |
|
|
| | | | | | | | | | | | | 7,058,888 |
| | | | | |
California 12.3% | | | | | | | | | | | | |
Antelope Valley California Hlthcare. Dis. Rfdg., Ser. A, F.S.A. | | Aaa | | 5.20 | | 1/01/17 | | | 1,005 | | | 1,073,702 |
California St., G.O., M.B.I.A. | | Aaa | | 5.25 | | 2/01/27 | | | 4,905 | | | 5,242,562 |
California St. Pub. Wks. Brd. Lease Rev., | | | | | | | | | | | | |
Dept. Mental Hlth., Coalinga, Ser. A | | Baa1 | | 5.50 | | 6/01/19 | | | 2,000 | | | 2,221,820 |
Dept. Mental Hlth., Coalinga, Ser. A | | Baa1 | | 5.50 | | 6/01/20 | | | 2,000 | | | 2,217,000 |
Dept. Mental Hlth., Coalinga, Ser. A | | Baa1 | | 5.50 | | 6/01/22 | | | 2,000 | | | 2,204,220 |
California Statewide Cmntys. Dev. Auth. Rev., | | | | | | | | | | | | |
Kaiser Permanente, Ser. G | | A(b) | | 2.30 | | 4/01/34 | | | 3,400 | | | 3,329,314 |
Rfdg. Daughters Charity Hlth., | | BBB+(b) | | 5.25 | | 7/01/30 | | | 500 | | | 520,155 |
See Notes to Financial Statements.
| | |
| Dryden Municipal Bond Fund/High Income Series | | 17 |
Portfolio of Investments
as of April 30, 2005 Cont’d.
| | | | | | | | | | | | |
| Description (a) | | Moody’s
Rating (Unaudited) | | Interest
Rate | | Maturity
Date | | Principal
Amount (000) | | Value (Note 1) |
| | | | | | | | | | | | | |
Capistrano Uni. Sch. Dist. Cmnty. Facs., Talega | | NR | | 6.00% | | 9/01/33 | | $ | 1,000 | | $ | 1,064,620 |
Central California Joint Pwr. Hlth. Fin. Auth., Cmnty. Hosps. of Central California, C.O.P. | | Baa2 | | 6.00 | | 2/01/30 | | | 2,550 | | | 2,650,240 |
Foothill/Eastern Trans. Corridor Agcy. Toll Rd. Rev., C.A.B.S. | | Baa3 | | Zero | | 1/15/28 | | | 6,700 | | | 5,588,403 |
Golden St. Securitization Corp. Tobacco Settlement Rev., | | | | | | | | | | | | |
Asset Bkd., Ser. B | | Baa1 | | 5.75 | | 6/01/23 | | | 3,940 | | | 4,188,969 |
Asset Bkd., Ser. B | | Baa1 | | 5.50 | | 6/01/43 | | | 3,500 | | | 3,725,190 |
La Quinta Fin. Auth. Local Agcy. Rev., Ser. A, A.M.B.A.C. | | Aaa | | 5.25 | | 9/01/24 | | | 3,500 | | | 3,809,505 |
Lincoln Impvt. Bond Act 1915, Pub. Fin. Auth., Twelve Bridges | | NR | | 6.20 | | 9/02/25 | | | 3,495 | | | 3,702,288 |
Los Angeles Wtr. & Pwr. Rev. Pwr. Sys., | | | | | | | | | | | | |
Ser. A, F.G.I.C. | | Aaa | | 5.125 | | 7/01/40 | | | 3,660 | | | 3,796,152 |
Ser. B, F.S.A. | | Aaa | | 5.125 | | 7/01/15 | | | 1,000 | | | 1,100,400 |
Ser. B, F.S.A. | | Aaa | | 5.125 | | 7/01/16 | | | 1,000 | | | 1,098,920 |
Ser. B, F.S.A. | | Aaa | | 5.125 | | 7/01/17 | | | 2,100 | | | 2,306,178 |
Ser. B, F.S.A. | | Aaa | | 5.125 | | 7/01/18 | | | 1,555 | | | 1,704,249 |
Murrieta Cmnty. Facs. Dist. Spl. Tax, No. 2, The Oaks Impt. Area, Ser. A | | NR | | 5.90 | | 9/01/27 | | | 1,000 | | | 1,052,700 |
Orange Cnty. Cmnty. Loc. Trans. Auth., Reg. Linked, S.A.V.R.S., R.I.B.S. | | Aa2 | | 6.20 | | 2/14/11 | | | 7,000 | | | 8,028,860 |
Perris California Cmnty. Facs. Dist., Spec. Tax, No. 01-2, Ser. A | | NR | | 6.25 | | 9/01/23 | | | 3,000 | | | 3,238,710 |
Rancho Cordova Cmnty. Facs. Dist., | | | | | | | | | | | | |
Spec. Tax No. 2003-1, Sunridge Anatolia | | NR | | 6.00 | | 9/01/33 | | | 1,000 | | | 1,025,160 |
Spec. Tax No. 2003-1, Sunridge Anatolia | | NR | | 6.10 | | 9/01/37 | | | 2,000 | | | 2,054,020 |
Roseville Joint Union H.S. Dist., Ser. B, F.G.I.C. | | Aaa | | Zero | | 8/01/11 | | | 1,440 | | | 1,148,616 |
See Notes to Financial Statements.
| | |
| 18 | | Visit our website at www.jennisondryden.com |
| | | | | | | | | | | | | |
| Description (a) | | Moody’s
Rating (Unaudited) | | Interest
Rate | | Maturity
Date | | Principal
Amount (000) | | | Value (Note 1) |
| | | | | | | | | | | | | | |
Saugus Uni. Sch. Dist. Cmnty. Facs. | | NR | | 6.00% | | 9/01/33 | | $ | 1,800 | | | $ | 1,903,770 |
University Revs., | | | | | | | | | | | | | |
Hosp. UCLA Med. Ctr., Ser. A, A.M.B.A.C. | | Aaa | | 5.50 | | 5/15/23 | | | 1,330 | | | | 1,470,860 |
Res. Facs., Ser. E, A.M.B.A.C. | | Aaa | | 5.00 | | 9/01/18 | | | 2,115 | | | | 2,268,888 |
Vallejo, Touro Univ., C.O.P. | | Ba2 | | 7.375 | | 6/01/29 | | | 3,500 | | | | 3,754,590 |
Valley Hlth. Sys. California Hosp. Rev., Rfdg. & Impvt. Proj., Ser. A | | B+(b) | | 6.50 | | 5/15/25 | | | 1,000 | | | | 1,001,320 |
| | | | | | | | | | | | |
|
|
| | | | | | | | | | | | | | 78,491,381 |
| | | | | |
Colorado 3.1% | | | | | | | | | | | | | |
Black Hawk Bus. Impvt. Dist. | | NR | | 7.75 | | 12/01/19 | | | 5,285 | (d) | | | 6,358,595 |
Colorado Hlth. Facs. Auth. Rev., Rfdg. Hosp. Poudre Valley Hlthcare. | | Baa2 | | 5.00 | | 3/01/25 | | | 5,560 | | | | 5,610,429 |
Colorado Springs Hosp. Rev. | | A3 | | 6.375 | | 12/15/30 | | | 1,240 | (d) | | | 1,442,207 |
Colorado Springs Hosp. Rev., Unrfdg. | | A3 | | 6.375 | | 12/15/30 | | | 1,260 | | | | 1,362,539 |
Denver Urban Ren. Auth. Tax, Inc., Rev., A.M.T. | | NR | | 7.75 | | 9/01/16 | | | 3,895 | | | | 4,078,338 |
Lake Creek Affordable Hsg. Corp. Multi-Fam. Rev., Ser. B | | NR | | 7.00 | | 12/01/23 | | | 935 | | | | 845,221 |
| | | | | | | | | | | | |
|
|
| | | | | | | | | | | | | | 19,697,329 |
| | | | | |
Connecticut 0.9% | | | | | | | | | | | | | |
Connecticut St., 1060 R, G.O., R.I.T.E.S. | | AAA(b) | | 6.79 | | 5/05/05 | | | 5,000 | | | | 5,977,700 |
| | | | | |
District of Columbia 0.5% | | | | | | | | | | | | | |
District of Columbia Rev., Univ., George Washington Univ., Ser. A, M.B.I.A. | | Aaa | | 5.125 | | 9/15/31 | | | 3,000 | | | | 3,121,020 |
| | | | | |
Florida 4.3% | | | | | | | | | | | | | |
Arbor Greene Cmnty. Dev. Dist., Spec. Assmt. Rev. | | NR | | 6.50 | | 5/01/07 | | | 50 | | | | 50,010 |
Broward Cnty. Res. Recov. Rev., Rfdg. Wheelabrator, Ser. A | | A3 | | 5.50 | | 12/01/08 | | | 4,000 | | | | 4,300,040 |
Escambia Cnty. Hlth. Fac. Rev., Hlthcare. Fac., A.M.B.A.C. | | Aaa | | 5.95 | | 7/01/20 | | | 500 | | | | 506,495 |
See Notes to Financial Statements.
| | |
| Dryden Municipal Bond Fund/High Income Series | | 19 |
Portfolio of Investments
as of April 30, 2005 Cont’d.
| | | | | | | | | | | | |
| Description (a) | | Moody’s
Rating (Unaudited) | | Interest
Rate | | Maturity
Date | | Principal
Amount (000) | | Value (Note 1) |
| | | | | | | | | | | | | |
Florida St. Corr. Privatization Cmnty. Cert. Partner, | | | | | | | | | | | | |
Ser. A, A.M.B.A.C. | | Aaa | | 5.00% | | 8/01/17 | | $ | 1,660 | | $ | 1,792,584 |
Ser. B, C.O.P., A.M.B.A.C. | | Aaa | | 5.00 | | 8/01/14 | | | 2,020 | | | 2,220,283 |
Hillsborough Cnty. Ind. Dev. Auth. Rev., Lakeshore Villas Proj., Ser. A | | NR | | 6.75 | | 7/01/29 | | | 3,000 | | | 2,933,250 |
Indigo Cmnty. Dev. Dist. Florida Cap. Impvt. Rev. | | NR | | 5.75 | | 5/01/36 | | | 2,000 | | | 2,000,000 |
Miami Beach Hlth. Facs. Auth. Hosp. Rev., Mount Sinai Med. Ctr., Ser. A | | Ba2 | | 6.70 | | 11/15/19 | | | 1,000 | | | 1,090,410 |
North Springs Impvt. Dist. Wtr. Mgmt., Ser. B | | NR | | 8.30 | | 5/01/24 | | | 1,550 | | | 1,568,910 |
Oakstead Cmnty. Dev. Dist., Cap. Impvt., Ser. B | | NR | | 6.50 | | 5/01/07 | | | 85 | | | 85,664 |
Orlando Util. Cmnty. Wtr. & Elec. Rev., Ser. D, E.T.M. | | Aa1 | | 6.75 | | 10/01/17 | | | 2,000 | | | 2,475,960 |
Palm Beach Cnty. Pub. Impvt. Rev., Convention Ctr. Proj., F.G.I.C. | | Aaa | | 5.00 | | 11/01/30 | | | 3,500 | | | 3,760,925 |
Reunion West Cmnty. Dev. Dist. Spec. Assmt. | | NR | | 6.25 | | 5/01/36 | | | 1,500 | | | 1,554,390 |
Stoneybrook West Cmnty. Dev. Dist. Spec. Assmt. Rev., Ser. B | | NR | | 6.45 | | 5/01/10 | | | 525 | | | 536,035 |
Volusia Cnty. Sch. Brd. Sales Tax Rev., F.S.A. | | Aaa | | 5.00 | | 10/01/10 | | | 2,500 | | | 2,726,225 |
| | | | | | | | | | | |
|
|
| | | | | | | | | | | | | 27,601,181 |
| | | | | |
Georgia 0.7% | | | | | | | | | | | | |
Cobb Cnty. Georgia Dev. Auth. Solid Wste. Disp. Rev., Georgia Wste. Mgmt. Proj. Ser. A, A.M.T. | | BBB(b) | | 3.65 | | 4/01/05 | | | 2,000 | | | 1,997,620 |
Fulton Cnty. Residential Care Facs., Canterbury Court Proj., Ser. A | | NR | | 6.125 | | 2/15/34 | | | 1,200 | | | 1,187,688 |
Henry Cnty. Wtr. & Swr. Auth. Rev., A.M.B.A.C. | | Aaa | | 6.15 | | 2/01/20 | | | 1,000 | | | 1,234,510 |
| | | | | | | | | | | |
|
|
| | | | | | | | | | | | | 4,419,818 |
See Notes to Financial Statements.
| | |
| 20 | | Visit our website at www.jennisondryden.com |
| | | | | | | | | | | | | |
| Description (a) | | Moody’s
Rating (Unaudited) | | Interest
Rate | | Maturity
Date | | Principal
Amount (000) | | | Value (Note 1) |
| | | | | | | | | | | | | | |
| | | | | |
Hawaii 0.3% | | | | | | | | | | | | | |
Hawaii St., Ser. DD, G.O., M.B.I.A. | | Aaa | | 5.25% | | 5/01/24 | | $ | 2,000 | | | $ | 2,165,000 |
| | | | | |
Illinois 9.1% | | | | | | | | | | | | | |
Alton Illinois Hosp. Fac. Rev., | | BB+(b) | | 6.00 | | 9/01/10 | | | 2,000 | | | | 1,989,900 |
St. Anthony’s Hlth. Ctr. | | BB+(b) | | 6.00 | | 9/01/14 | | | 1,765 | | | | 1,731,147 |
Cary Illinois Spec. Tax Spec. Svcs., | | | | | | | | | | | | | |
Area No. 1, Cambridge, Ser. A | | NR | | 7.625 | | 3/01/30 | | | 3,855 | | | | 4,173,038 |
Area No. 2, Foxford Hill | | NR | | 7.50 | | 3/01/30 | | | 4,826 | | | | 5,188,577 |
Chicago Illinois Proj. & Rfdg., F.G.I.C. | | Aaa | | 5.25 | | 1/01/28 | | | 4,375 | | | | 4,644,763 |
Gilberts Illinois Spec. Svcs. Area No. 9, Spec. Tax, Big Timber Proj. | | NR | | 7.75 | | 3/01/27 | | | 5,000 | | | | 5,585,100 |
Illinois Dev. Fin. Auth. Solid Wste. Disp. Rev., Wste. Mgmt., Inc. Prog., A.M.T. | | Baa3 | | 5.05 | | 1/01/10 | | | 4,000 | | | | 4,171,960 |
Illinois Edl. Facs. Auth. Student Hsg. Rev., Edl. Advnmt. Fdg. Univ. Ctr. Proj. | | Baa2 | | 6.25 | | 5/01/30 | | | 2,000 | | | | 2,150,560 |
Illinois Fin. Auth. Rev., Northwestern Mem. Hosp., Ser. A | | Aa2 | | 5.25 | | 8/15/34 | | | 5,000 | | | | 5,278,050 |
Illinois Hlth. Facs. Auth. Rev., | | | | | | | | | | | | | |
Holy Cross Hosp. Proj. | | B2 | | 6.75 | | 3/01/24 | | | 3,000 | | | | 2,897,490 |
Lake Forest Hosp., Ser. A | | A3 | | 6.25 | | 7/01/22 | | | 4,200 | | | | 4,651,416 |
Kane & De Kalb Cntys. Sch. Dist., No. 301, A.M.B.A.C., C.A.B.S. | | Aaa | | Zero | | 12/01/11 | | | 3,360 | | | | 2,631,619 |
McLean & Woodford Cntys. Cmnty. Unit Sch. Dist. No. 005, G.O., F.S.A. | | Aaa | | 5.625 | | 12/01/17 | | | 4,535 | (d) | | | 5,067,273 |
Metro. Pier & Expo. Auth. Dedicated St. Tax Rev., McCormick Place Expansion, Ser. A, M.B.I.A. | | Aaa | | 5.25 | | 6/15/42 | | | 6,000 | | | | 6,437,040 |
Robbins Illinois Res. Recov. Rev. Restruct. Proj., | | | | | | | | | | | | | |
Ser. A, A.M.T. | | NR | | 8.375 | | 10/15/16 | | | 5,031 | (c) | | | 10,062 |
Ser. B, A.M.T. | | NR | | 8.375 | | 10/15/16 | | | 1,969 | (c) | | | 3,938 |
See Notes to Financial Statements.
| | |
| Dryden Municipal Bond Fund/High Income Series | | 21 |
Portfolio of Investments
as of April 30, 2005 Cont’d.
| | | | | | | | | | | | | |
| Description (a) | | Moody’s
Rating (Unaudited) | | Interest
Rate | | Maturity
Date | | Principal
Amount (000) | | | Value (Note 1) |
| | | | | | | | | | | | | | |
Round Lake Rev. | | NR | | 6.70% | | 3/01/33 | | $ | 1,000 | | | $ | 1,054,390 |
| | | | | | | | | | | | |
|
|
| | | | | | | | | | | | | | 57,666,323 |
| | | | | |
Indiana 0.8% | | | | | | | | | | | | | |
Indiana Hlth. Fac. Fin. Auth. Hosp. Rev., Cmnty. Foundation Northwest Ind., Ser. A | | BBB-(b) | | 6.00 | | 3/01/34 | | | 3,000 | | | | 3,165,330 |
Indiana St. Hsg. Fin. Auth. Sngl. Fam. Mtge. Rev., Ser. B2, A.M.T. | | Aaa | | 4.00 | | 1/01/34 | | | 2,000 | | | | 2,003,960 |
| | | | | | | | | | | | |
|
|
| | | | | | | | | | | | | | 5,169,290 |
| | | | | |
Iowa 3.1% | | | | | | | | | | | | | |
City of Cedar Rapids Rev. First Mtge., | | | | | | | | | | | | | |
Cottage Grove Place Proj. | | AAA(b) | | 9.00 | | 7/01/18 | | | 8,780 | (d) | | | 9,049,019 |
Cottage Grove Place Proj. | | AAA(b) | | 9.00 | | 7/01/25 | | | 4,435 | (d) | | | 4,571,864 |
Iowa St. Fin. Auth. Hlthcare., Facs. Rev., Mercy Hlth. Initiatives Proj. | | NR | | 9.25 | | 7/01/25 | | | 4,840 | | | | 5,831,135 |
| | | | | | | | | | | | |
|
|
| | | | | | | | | | | | | | 19,452,018 |
| | | | | |
Louisiana 1.8% | | | | | | | | | | | | | |
Calcasieu Parish Inc., Ind. Dev. Brd. Rev., Rfdg. Olin Corp. Proj. | | Baa3 | | 6.625 | | 2/01/16 | | | 3,500 | | | | 3,744,685 |
De Soto Parish Louisiana Environ. Impvt. Rev., Rfdg. Int’l. Paper, Ser. A, A.M.T. | | Baa2 | | 4.75 | | 3/01/19 | | | 2,500 | | | | 2,462,475 |
West Feliciana Parish Poll. Ctrl. Rev., Gulf St. Util. | | Ba1 | | 7.70 | | 12/01/14 | | | 5,000 | | | | 5,025,600 |
| | | | | | | | | | | | |
|
|
| | | | | | | | | | | | | | 11,232,760 |
| | | | | |
Maine 0.7% | | | | | | | | | | | | | |
Maine Hlth. & Higher Edl. Facs. Auth. Rev. Piper Shores, | | | | | | | | | | | | | |
Ser. A | | NR | | 7.50 | | 1/01/19 | | | 1,000 | (d) | | | 1,140,720 |
Ser. A | | NR | | 7.55 | | 1/01/29 | | | 3,000 | (d) | | | 3,427,320 |
| | | | | | | | | | | | |
|
|
| | | | | | | | | | | | | | 4,568,040 |
See Notes to Financial Statements.
| | |
| 22 | | Visit our website at www.jennisondryden.com |
| | | | | | | | | | | | | |
| Description (a) | | Moody’s
Rating (Unaudited) | | Interest
Rate | | Maturity
Date | | Principal
Amount (000) | | | Value (Note 1) |
| | | | | | | | | | | | | | |
| | | | | |
Maryland 2.0% | | | | | | | | | | | | | |
Anne Arundel Cnty. Spec. Oblig., Arundel Mills Proj. | | AAA(b) | | 7.10% | | 7/01/29 | | $ | 3,000 | (d) | | $ | 3,516,570 |
Maryland St. Hlth. & Higher Edl. Facs. Auth. Rev. | | A3 | | 6.75 | | 7/01/30 | | | 5,000 | | | | 5,607,350 |
Northeast Wste. Disp. Auth. Rev., | | | | | | | | | | | | | |
Sludge Corp. Facs. | | NR | | 7.25 | | 7/01/07 | | | 1,527 | | | | 1,608,587 |
Sludge Corp. Facs., A.M.T. | | NR | | 8.50 | | 7/01/07 | | | 2,070 | | | | 2,236,242 |
| | | | | | | | | | | | |
|
|
| | | | | | | | | | | | | | 12,968,749 |
| | | | | |
Massachusetts 3.0% | | | | | | | | | | | | | |
Massachusetts St., Cons. Ln., G.O., Ser. C | | Aa2 | | 5.25 | | 11/01/30 | | | 1,495 | (d) | | | 1,663,561 |
Massachusetts St. Coll. Bldg., Proj. & Rfdg. Bonds, Ser. A | | Aa2 | | 7.50 | | 5/01/14 | | | 1,750 | | | | 2,221,292 |
Massachusetts St. Dev. Fin. Agcy. Rev., Hlthcare. Fac., Alliance, Ser. A | | NR | | 7.10 | | 7/01/32 | | | 4,055 | | | | 4,060,434 |
Massachusetts St. Hlth. & Edl. Facs. Auth. Rev. Caritas Christi Oblig. Group, | | | | | | | | | | | | | |
Rfdg., Ser. A | | Baa3 | | 5.75 | | 7/01/28 | | | 2,000 | | | | 2,034,620 |
Rfdg., Ser. B | | Baa3 | | 6.75 | | 7/01/16 | | | 3,595 | | | | 4,034,453 |
Massachusetts St. Wtr. Poll. Abatement Trust, Pool Proj., Ser. 9 | | Aaa | | 5.25 | | 8/01/33 | | | 2,500 | | | | 2,679,575 |
Nantucket, | | | | | | | | | | | | | |
G.O., M.B.I.A. | | Aaa | | 3.375 | | 10/01/15 | | | 1,205 | | | | 1,162,849 |
G.O., M.B.I.A. | | Aaa | | 3.50 | | 10/01/16 | | | 1,200 | | | | 1,161,888 |
| | | | | | | | | | | | |
|
|
| | | | | | | | | | | | | | 19,018,672 |
| | | | | |
Michigan 1.1% | | | | | | | | | | | | | |
Kalamazoo Michigan Hosp. Fin. Auth. Hosp. Fac. Rev., E.T.M., F.G.I.C. | | Aaa | | 7.338(f) | | 6/01/11 | | | 2,000 | | | | 2,083,920 |
Kent Hosp. Fin. Auth. Michigan Rev., Metro. Hosp. Proj., Ser. A | | BBB(b) | | 6.25 | | 7/01/40 | | | 3,000 | | | | 3,277,380 |
Michigan St. Hosp. Fin. Auth. Rev., Ascension Hlth. Sub Credit, Ser. A | | Aa3 | | 5.00 | | 11/01/12 | | | 1,250 | | | | 1,353,600 |
| | | | | | | | | | | | |
|
|
| | | | | | | | | | | | | | 6,714,900 |
See Notes to Financial Statements.
| | |
| Dryden Municipal Bond Fund/High Income Series | | 23 |
Portfolio of Investments
as of April 30, 2005 Cont’d.
| | | | | | | | | | | | | |
| Description (a) | | Moody’s
Rating (Unaudited) | | Interest
Rate | | Maturity
Date | | Principal
Amount (000) | | | Value (Note 1) |
| | | | | | | | | | | | | | |
| | | | | |
Minnesota 0.4% | | | | | | | | | | | | | |
St. Paul Hsg. & Redev. Auth. Hosp. Rev., Hltheast Proj., Ser. A | | Ba1 | | 6.625% | | 11/01/17 | | $ | 2,385 | | | $ | 2,397,450 |
| | | | | |
Nevada 3.5% | | | | | | | | | | | | | |
Clark Cnty. Impvt. Dist., | | | | | | | | | | | | | |
No. 121, Southern Highlands Area | | NR | | 7.50 | | 12/01/19 | | | 4,735 | | | | 5,167,827 |
Spec. Impvt. Dist. No. 142, Loc. Impvt. | | NR | | 6.10 | | 8/01/18 | | | 2,000 | | | | 2,062,840 |
Clark Cnty. Ind. Dev. Rev., | | | | | | | | | | | | | |
Nevada Pwr. Co. Proj., Ser. A, A.M.T. | | B-(b) | | 5.60 | | 10/01/30 | | | 2,500 | | | | 2,391,600 |
Rfdg. Nevada Pwr. Co. Proj., Ser. C | | B-(b) | | 5.50 | �� | 10/01/30 | | | 4,500 | | | | 4,397,400 |
Director St. Nevada Dept. Bus. & Ind., | | | | | | | | | | | | | |
Las Ventanas Ret., Proj. A | | NR | | 7.00 | | 11/15/34 | | | 1,500 | | | | 1,551,150 |
Las Ventanas Ret., Proj. B | | NR | | 6.75 | | 11/15/23 | | | 1,315 | | | | 1,360,341 |
North Las Vegas Local Impvt., | | | | | | | | | | | | | |
Spec. Impvt. Dist. No. 60 Aliante | | NR | | 5.60 | | 12/01/12 | | | 1,525 | | | | 1,571,268 |
Spec. Impvt. Dist. No. 60 Aliante | | NR | | 6.40 | | 12/01/22 | | | 1,250 | | | | 1,277,863 |
Washoe Cnty. Wtr. Fac. Rev., Sierra Pac. Pwr. Co., A.M.T. | | Ba2 | | 5.00 | | 3/01/36 | | | 2,500 | | | | 2,547,150 |
| | | | | | | | | | | | |
|
|
| | | | | | | | | | | | | | 22,327,439 |
| | | | | |
New Jersey 6.2% | | | | | | | | | | | | | |
Camden Cnty. Auth. Rev., Hlthcare. Redev. Cooper Proj. | | Baa3 | | 6.00 | | 2/15/27 | | | 2,250 | | | | 2,324,273 |
New Jersey Econ. Dev. Auth. Rev., | | | | | | | | | | | | | |
Cigarette Tax | | Baa2 | | 5.625 | | 6/15/19 | | | 1,250 | | | | 1,342,663 |
Cigarette Tax | | Baa2 | | 5.75 | | 6/15/34 | | | 750 | | | | 800,970 |
Kapkowski Rd., Ser. A | | Aaa | | 6.375 | | 4/01/31 | | | 7,000 | (d) | | | 8,518,300 |
Kapkowski Rd., Ser. A, C.A.B.S., E.T.M. | | Baa3 | | Zero | | 4/01/12 | | | 1,115 | | | | 863,032 |
Rfdg. First Mtge. Franciscan Oaks Proj. | | NR | | 5.70 | | 10/01/17 | | | 165 | | | | 164,599 |
See Notes to Financial Statements.
| | |
| 24 | | Visit our website at www.jennisondryden.com |
| | | | | | | | | | | | | |
| Description (a) | | Moody’s
Rating (Unaudited) | | Interest
Rate | | Maturity
Date | | Principal
Amount (000) | | | Value (Note 1) |
| | | | | | | | | | | | | | |
Spec. Facs. Rev., Continental Airlines, Inc. Proj., A.M.T. | | Caa2 | | 6.25% | | 9/15/29 | | $ | 3,500 | | | $ | 2,831,290 |
New Jersey Hlthcare. Facs. Fin. Auth. Rev., | | | | | | | | | | | | | |
Cherry Hill Proj. | | NR | | 8.00 | | 7/01/27 | | | 2,000 | | | | 2,102,500 |
Raritan Bay Med. Ctr. | | NR | | 7.25 | | 7/01/27 | | | 4,000 | | | | 4,169,600 |
St. Peters Univ. Hosp., Ser. A | | Baa1 | | 6.875 | | 7/01/30 | | | 2,250 | | | | 2,487,397 |
New Jersey St. Edl. Facs. Auth. Rev., Felician Coll. of Lodi, Ser. D | | NR | | 7.375 | | 11/01/22 | | | 3,615 | | | | 3,646,523 |
New Jersey St. Tpke. Auth. Tpke. Rev., Growth & Income, Secs., Ser. B, A.M.B.A.C. | | Aaa | | Zero | | 1/01/35 | | | 4,000 | | | | 2,539,120 |
Tobacco Settlement Fin. Corp., | | | | | | | | | | | | | |
Asset Bkd. | | Baa3 | | 6.75 | | 6/01/39 | | | 1,000 | | | | 1,057,930 |
Asset Bkd. | | Baa3 | | 6.125 | | 6/01/42 | | | 1,000 | | | | 1,006,150 |
Asset Bkd. | | Baa3 | | 6.25 | | 6/01/43 | | | 5,250 | | | | 5,339,512 |
| | | | | | | | | | | | |
|
|
| | | | | | | | | | | | | | 39,193,859 |
| | | | | |
New Mexico 0.8% | | | | | | | | | | | | | |
New Mexico Mtge. Fin. Auth. Sngl. Fam. Mtge., | | | | | | | | | | | | | |
Ser. A, A.M.T., G.N.M.A., F.N.M.A., F.H.L.M.C. | | Aaa | | 3.50 | | 7/01/36 | | | 2,000 | | | | 2,127,440 |
Ser. E, A.M.T., G.N.M.A., F.N.M.A., F.H.L.M.C. | | AAA(b) | | 3.50 | | 7/01/35 | | | 2,500 | | | | 2,666,075 |
| | | | | | | | | | | | |
|
|
| | | | | | | | | | | | | | 4,793,515 |
| | | | | |
New York 8.2% | | | | | | | | | | | | | |
Brookhaven New York Ind. Dev. Agcy. Civic Facs. Rev., Mem. Hosp. Med. Ctr., Inc., Ser. A | | NR | | 8.25 | | 11/15/30 | | | 2,000 | (e) | | | 2,170,820 |
Metro. Trans. Auth. Rev., Ser. A, A.M.B.A.C. | | Aaa | | 5.50 | | 11/15/18 | | | 4,045 | | | | 4,534,566 |
Metro. Trans. Auth. Svc. Contract, Ser. B, M.B.I.A. | | Aaa | | 5.50 | | 7/01/19 | | | 3,050 | | | | 3,403,068 |
New York City Ind. Dev. Agcy. Civic Fac. Rev., | | | | | | | | | | | | | |
Liberty 7 World Trade Ctr., Ser. A | | NR | | 6.50 | | 3/01/35 | | | 2,500 | | | | 2,553,150 |
Staten Island Univ. Hosp. Proj., Ser. B | | Ba3 | | 6.375 | | 7/01/31 | | | 995 | | | | 991,746 |
See Notes to Financial Statements.
| | |
| Dryden Municipal Bond Fund/High Income Series | | 25 |
Portfolio of Investments
as of April 30, 2005 Cont’d.
| | | | | | | | | | | | | |
| Description (a) | | Moody’s
Rating (Unaudited) | | Interest
Rate | | Maturity
Date | | Principal
Amount (000) | | | Value (Note 1) |
| | | | | | | | | | | | | | |
New York City Transitional Fin. Auth. Rev., Future Tax Sec’d., | | | | | | | | | | | | | |
Ser. C | | Aa1 | | 5.50% | | 2/15/16 | | $ | 2,500 | | | $ | 2,774,350 |
Ser. C | | Aa1 | | 5.50 | | 11/01/20 | | | 9,000 | | | | 9,860,850 |
New York St. Environ. Facs. Rev. Corp., Revolving Funds, Ser. B | | Aaa | | 5.00 | | 6/15/27 | | | 780 | | | | 815,123 |
New York, NY, | | | | | | | | | | | | | |
Ser. G, G.O. | | A1 | | 5.00 | | 12/01/25 | | | 1,000 | | | | 1,045,690 |
Ser. J, G.O., F.S.A. | | Aaa | | 5.00 | | 3/01/18 | | | 2,740 | | | | 2,970,188 |
Suffolk Cnty. Ind. Dev. Agcy. Civic Facs. Rev., South Hampton Hosp. Assoc., Ser. B | | NR | | 7.625 | | 1/01/30 | | | 4,945 | | | | 5,173,410 |
Tobacco Settlement Fin. Corp., | | | | | | | | | | | | | |
Asset Bkd., Ser. A-1 | | A2 | | 5.50 | | 6/01/14 | | | 8,000 | | | | 8,677,360 |
Asset Bkd., Ser. C-1 | | A2 | | 5.50 | | 6/01/14 | | | 3,500 | | | | 3,794,945 |
Asset Bkd., Ser. C-1 | | A2 | | 5.50 | | 6/01/15 | | | 3,000 | | | | 3,270,060 |
| | | | | | | | | | | | |
|
|
| | | | | | | | | | | | | | 52,035,326 |
| | | | | |
North Carolina 0.3% | | | | | | | | | | | | | |
North Carolina Mun. Pwr. Agcy. Pwr. Sys. Rev., Rfdg., Ser. D | | Baa2 | | 5.125 | | 1/01/26 | | | 2,000 | | | | 2,047,620 |
| | | | | |
North Dakota 0.7% | | | | | | | | | | | | | |
Ward Cnty. Hlthcare. Facs. Rev., Rfdg. Trinity Oblig., | | | | | | | | | | | | | |
Group A | | BBB+(b) | | 6.25 | | 7/01/26 | | | 2,110 | | | | 2,219,699 |
Group B | | BBB+(b) | | 6.25 | | 7/01/21 | | | 2,000 | | | | 2,099,520 |
| | | | | | | | | | | | |
|
|
| | | | | | | | | | | | | | 4,319,219 |
| | | | | |
Ohio 1.1% | | | | | | | | | | | | | |
Cuyahoga Cnty. Hosp. Facs. Rev., Canton, Inc. Proj. | | Baa2 | | 7.50 | | 1/01/30 | | | 3,000 | | | | 3,370,530 |
Mahoning Cnty. Ohio Hosp. Facs. Rev., Forum Hlth. Oblig. Group, Ser. A | | Baa1 | | 6.00 | | 11/15/32 | | | 1,500 | | | | 1,609,470 |
Ohio St. Wtr. Dev. Auth. Solid Wste Disp. Rev., Wste. Mgmt. Proj., A.M.T. | | A2 | | 4.50 | | 7/01/21 | | | 1,000 | | | | 1,017,830 |
Ohio St. Solid Wste. Rev., | | | | | | | | | | | | | |
CSC Ltd. Proj., A.M.T. | | NR | | Zero | | 8/01/22 | | | 7,000 | (c) | | | 0 |
Rep. Eng. Steels, Inc., A.M.T. | | NR | | Zero | | 6/01/21 | | | 2,250 | (c) | | | 225 |
See Notes to Financial Statements.
| | |
| 26 | | Visit our website at www.jennisondryden.com |
| | | | | | | | | | | | | |
| Description (a) | | Moody’s
Rating (Unaudited) | | Interest
Rate | | Maturity
Date | | Principal
Amount (000) | | | Value (Note 1) |
| | | | | | | | | | | | | | |
Richland Cnty. Hosp. Facs. Rev., Rfdg. Medcentral Hlth. Sys., Ser. A | | A-(b) | | 6.125% | | 11/15/16 | | $ | 1,000 | | | $ | 1,092,040 |
| | | | | | | | | | | | |
|
|
| | | | | | | | | | | | | | 7,090,095 |
| | | | | |
Oklahoma 0.5% | | | | | | | | | | | | | |
Oklahoma Hsg. Fin. Agcy. Sngl. Fam. Rev., Mtge. Homeownership ln. Prog. Ser. B, A.M.T. | | Aaa | | 4.875 | | 9/01/33 | | | 3,240 | | | | 3,356,024 |
| | | | | |
Pennsylvania 3.7% | | | | | | | | | | | | | |
Allegheny Cnty. Hosp. Dev. Auth. Rev., Ohio Valley Gen. Hosp. Proj., Ser. A | | Baa2 | | 5.125 | | 4/01/35 | | | 1,335 | | | | 1,331,289 |
Allegheny Cnty. Hosp. Dev. Auth. Rev. Hlth. Sys., | | | | | | | | | | | | | |
Ser. B | | B1 | | 9.25 | | 11/15/15 | | | 1,000 | | | | 1,180,290 |
Ser. B | | B1 | | 9.25 | | 11/15/22 | | | 1,825 | | | | 2,154,029 |
Cumberland Cnty. Mun. Auth. Ret. Cmnty. Rev., Wesley Affiliated Svcs., Ser. A | | NR | | 7.25 | | 1/01/35 | | | 4,000 | | | | 4,253,200 |
Lancaster Cnty. Hosp. Auth. Rev., Gen. Hosp. Proj. | | A(b) | | 5.50 | | 3/15/26 | | | 780 | | | | 818,899 |
Langhorne Manor Boro. Higher Ed. & Hlth. Auth. Rev., Hosp. Lower Bucks Hosp. | | B2 | | 7.35 | | 7/01/22 | | | 4,650 | | | | 4,626,006 |
Montgomery Cnty. Pennsylvania Ind. Dev. Auth. Rev., MTG-Whitemarsh Cont. Care | | NR | | 6.25 | | 2/01/35 | | | 2,450 | | | | 2,512,818 |
Philadelphia Hosps. & Higher Ed. Facs. Auth. Rev., | | | | | | | | | | | | | |
Grad. Hlth. Sys. | | Ca | | Zero | | 7/01/05 | | | 1,651 | (c) | | | 16 |
Grad. Hlth. Sys. | | Ca | | Zero | | 7/01/18 | | | 2,269 | (c) | | | 23 |
Grad. Hlth. Sys., Ser. A | | Ca | | Zero | | 7/01/13 | | | 2,015 | (c) | | | 20 |
Somerset Cnty. Hosp. Auth. Rev., | | | | | | | | | | | | | |
Hlthcare. First Mtge. | | NR | | 4.20 | | 6/01/09 | | | 1,235 | | | | 826,450 |
Hlthcare. First Mtge. | | NR | | 4.25 | | 6/01/24 | | | 8,805 | | | | 5,587,036 |
| | | | | | | | | | | | |
|
|
| | | | | | | | | | | | | | 23,290,076 |
See Notes to Financial Statements.
| | |
| Dryden Municipal Bond Fund/High Income Series | | 27 |
Portfolio of Investments
as of April 30, 2005 Cont’d.
| | | | | | | | | | | | | |
| Description (a) | | Moody’s
Rating (Unaudited) | | Interest
Rate | | Maturity
Date | | Principal
Amount (000) | | | Value (Note 1) |
| | | | | | | | | | | | | | |
| | | | | |
South Carolina 0.9% | | | | | | | | | | | | | |
South Carolina Jobs Econ. Dev. Auth. Hosp. Facs. Rev., Rfdg. & Palmetto Hlth., Ser. C | | Baa1 | | 6.875% | | 8/01/27 | | $ | 5,000 | | | $ | 5,659,400 |
| | | | | |
South Dakota 0.7% | | | | | | | | | | | | | |
South Dakota Econ. Dev. Fin. Auth., Dakota Park, A.M.T. | | NR | | 10.25 | | 1/01/19 | | | 4,220 | | | | 4,271,189 |
| | | | | |
Tennessee 6.3% | | | | | | | | | | | | | |
Bradley Cnty. Ind. Dev. Brd., Rfdg. Olin Corp. Proj., Ser. C | | Baa3 | | 6.625 | | 11/01/17 | | | 2,000 | | | | 2,166,760 |
Johnson City Hlth. & Edl. Facs. Brd. Hosp. Rev., Rfdg. First Mtge., Ser. A, M.B.I.A. | | Aaa | | 6.75 | | 7/01/17 | | | 2,000 | | | | 2,479,820 |
Memphis Ctr. City Rev., Fin. Corp., Ser. B | | NR | | 6.50 | | 9/01/28 | | | 26,000 | | | | 26,346,580 |
Rutherford Cnty. Hlth. & Edl. Facs. Brd., First Mtge. Rev. | | NR | | 9.50 | | 12/01/19 | | | 5,100 | | | | 5,208,630 |
Shelby Cnty. Hlth. Edl. & Hsg. Fac. Brd. Hosp. Rev., | | | | | | | | | | | | | |
Methodist Hlthcare. | | A3 | | 6.50 | | 9/01/26 | | | 2,195 | (d) | | | 2,627,701 |
Methodist Hlthcare., E.T.M. | | A3 | | 6.50 | | 9/01/26 | | | 1,305 | | | | 1,551,736 |
| | | | | | | | | | | | |
|
|
| | | | | | | | | | | | | | 40,381,227 |
| | | | | |
Texas 7.7% | | | | | | | | | | | | | |
Alliance Arpt. Auth., Inc. Spec. Facs. Rev., American Airlines, Inc. Proj., A.M.T. | | Caa2 | | 7.50 | | 12/01/29 | | | 2,500 | | | | 1,956,300 |
Austin Hsg. Fin. Corp. Multi-Fam. Hsg. Rev., Stony Creek, Ser. A | | Ba2 | | 7.75 | | 11/01/29 | | | 9,315 | | | | 9,047,007 |
Brazos River Auth. Poll. Ctrl. Rev., TXU Energy Co. LLC Proj., | | | | | | | | | | | | | |
Ser. C, A.M.T. | | Baa2 | | 6.75 | | 10/01/38 | | | 1,255 | | | | 1,375,944 |
Ser. D | | Baa2 | | 5.40 | | 10/01/29 | | | 1,000 | | | | 1,068,860 |
Dallas-Fort Worth Int’l. Arpt. Fac. Impvt. Corp. Rev., | | | | | | | | | | | | | |
American Airlines, Inc. | | Caa2 | | 6.00 | | 11/01/14 | | | 1,050 | | | | 836,073 |
American Airlines, Inc., A.M.T. | | Caa2 | | 6.375 | | 5/01/35 | | | 2,000 | | | | 1,367,560 |
See Notes to Financial Statements.
| | |
| 28 | | Visit our website at www.jennisondryden.com |
| | | | | | | | | | | | | |
| Description (a) | | Moody’s
Rating (Unaudited) | | Interest
Rate | | Maturity
Date | | Principal
Amount (000) | | | Value (Note 1) |
| | | | | | | | | | | | | | |
American Airlines, Ser. C, A.M.T. | | Caa2 | | 6.15% | | 5/01/29 | | $ | 1,950 | | | $ | 1,803,906 |
Decatur Hosp. Auth. Rev., Wise Reg. Hlth. Sys., Ser. A | | Ba2 | | 7.125 | | 9/01/34 | | | 3,000 | | | | 3,214,140 |
Houston Arpt. Sys. Rev., Spec. Facs., Continental Airlines, Ser. E, A.M.T. | | Caa2 | | 6.75 | | 7/01/29 | | | 2,000 | | | | 1,711,540 |
Houston Hlth. Facs. Dev. Corp. Ret. Fac. Rev., Buckingham Sr. Living Cmnty., Ser. A | | NR | | 7.125 | | 2/15/34 | | | 1,250 | | | | 1,342,538 |
Houston Util. Sys. Rev., Ref., Comb., First Lien, Ser. A, F.S.A. | | Aaa | | 5.25 | | 5/15/21 | | | 7,000 | | | | 7,579,950 |
Katy Texas Dev. Auth. Rev., Tax Increment Contract, Ser. B | | NR | | 6.00 | | 6/01/18 | | | 4,000 | | | | 4,197,280 |
Lower Colo River Auth., Rfdg., Trans. Svcs. Corp. Proj., Ser. C, A.M.B.A.C. | | Aaa | | 5.25 | | 5/15/24 | | | 4,515 | | | | 4,902,568 |
Matagorda Cnty. Nav. Dist. No. 1 Rev., Coll. Centerpoint Engy. Proj. | | Baa2 | | 5.60 | | 3/01/27 | | | 2,000 | | | | 2,082,280 |
North Central Texas Hlth. Fac. Dev. Corp. Rev., Ret. Fac. Sr. Hsg., Ser. A | | NR | | 7.50 | | 11/15/29 | | | 2,000 | | | | 2,162,400 |
Sabine River Auth. Poll. Ctl. Rev., TXU Energy Co. LLC Proj., Ser. B | | Baa2 | | 6.15 | | 8/01/22 | | | 1,000 | | | | 1,097,940 |
San Antonio Elec. & Gas Rev., Rfdg., Ser. A | | Aa1 | | 5.00 | | 2/01/18 | | | 3,000 | | | | 3,178,560 |
Texas Mun. Pwr. Agcy. Rev., M.B.I.A., E.T.M. | | Aaa | | Zero | | 9/01/15 | | | 50 | | | | 32,567 |
| | | | | | | | | | | | |
|
|
| | | | | | | | | | | | | | 48,957,413 |
| | | | | |
Utah | | | | | | | | | | | | | |
Tooele Cnty. Poll. Ctrl. Rev., Rfdg. Laidlaw Environ., Ser. A, A.M.T. | | NR | | Zero | | 7/01/27 | | | 3,718 | (c) | | | 9,296 |
| | | | | |
Virginia 3.8% | | | | | | | | | | | | | |
Chesapeake Hosp. Auth. Fac. Rev., Rfdg. Chesapeake Gen. Hosp., Ser. A | | A3 | | 5.25 | | 7/01/17 | | | 3,445 | | | | 3,637,955 |
See Notes to Financial Statements.
| | |
| Dryden Municipal Bond Fund/High Income Series | | 29 |
Portfolio of Investments
as of April 30, 2005 Cont’d.
| | | | | | | | | | | | |
| Description (a) | | Moody’s
Rating (Unaudited) | | Interest
Rate | | Maturity
Date | | Principal
Amount (000) | | Value (Note 1) |
| | | | | | | | | | | | | |
Chesterfield Cnty. Ind. Dev. Auth. Poll. Ctrl. Rev., Virginia Elec. & Pwr., Ser. A | | A3 | | 5.875% | | 6/01/17 | | $ | 2,000 | | $ | 2,181,920 |
Gloucester Cnty. Ind. Dev. Auth. Solid Wste. Disp. Rev., Wste. Mgmt. Svcs., Ser. A Rmkt. 5/3/04, A.M.T. | | BBB(b) | | 5.125 | | 9/01/38 | | | 2,700 | | | 2,825,226 |
Norfolk Redev. & Hsg. Auth., Multi-Fam. Rental Hsg. Facs. Rev., A.M.T. | | NR | | 8.00 | | 9/01/26 | | | 5,775 | | | 5,841,239 |
Pocahontas Pkwy. Assoc. Toll Rd. Rev., C.A.B.S., | | | | | | | | | | | | |
Ser. B | | Ba3 | | Zero | | 8/15/16 | | | 7,000 | | | 3,701,040 |
Ser. C | | B3 | | Zero | | 8/15/25 | | | 5,000 | | | 1,104,700 |
Ser. C | | B3 | | Zero | | 8/15/32 | | | 6,200 | | | 827,762 |
Ser. C | | B3 | | Zero | | 8/15/33 | | | 6,200 | | | 773,078 |
Ser. C | | B3 | | Zero | | 8/15/34 | | | 6,200 | | | 718,270 |
Ser. C | | B3 | | Zero | | 8/15/35 | | | 5,800 | | | 624,254 |
Sussex Cnty. Ind. Dev. Auth. Solid Wste. Disp. Rev., Atlantic Wste., Ser. A, Rmkt. 5/3/04, A.M.T. | | BBB(b) | | 5.125 | | 6/01/28 | | | 1,600 | | | 1,674,208 |
| | | | | | | | | | | |
|
|
| | | | | | | | | | | | | 23,909,652 |
| | | | | |
Washington 2.6% | | | | | | | | | | | | |
Bellevue Conv. Ctr. Auth., King City, Oblig. Rev., M.B.I.A. | | Aaa | | Zero | | 2/01/10 | | | 870 | | | 734,332 |
Energy Northwest Elec. Rev., | | | | | | | | | | | | |
Columbia Generating, Ser. B, A.M.B.A.C. | | Aaa | | 6.00 | | 7/01/18 | | | 5,050 | | | 5,772,100 |
Proj. No. 1, Ser. B, M.B.I.A. | | Aaa | | 6.00 | | 7/01/17 | | | 4,300 | | | 4,920,662 |
Skagit Cnty. Washington Pub. Hosp. Dist. No. 001 Rev., Skagit Valley Hosp. | | Baa3 | | 5.50 | | 12/01/30 | | | 1,250 | | | 1,283,350 |
Tobacco Settlement Auth. Tobacco Settlement Rev., Asset Bkd. | | Baa3 | | 6.50 | | 6/01/26 | | | 2,625 | | | 2,759,400 |
Washington St. Pub. Pwr. Sup. Sys. Rev., Nuclear Proj. No.1, Ser. B, E.T.M. | | Aaa | | 7.25 | | 7/01/09 | | | 760 | | | 838,029 |
| | | | | | | | | | | |
|
|
| | | | | | | | | | | | | 16,307,873 |
See Notes to Financial Statements.
| | |
| 30 | | Visit our website at www.jennisondryden.com |
| | | | | | | | | | | | | | |
| Description (a) | | Moody’s
Rating (Unaudited) | | Interest
Rate | | Maturity
Date | | | Principal
Amount (000) | | | Value (Note 1) |
| | | | | | | | | | | | | | | |
| | | | | |
West Virginia 1.3% | | | | | | | | | | | | | | |
West Virginia St. Hosp. Fin. Auth. Hosp. Rev., Oak Hill Hosp., Ser. B | | A2 | | 6.75% | | 9/01/30 | | | $ | 7,000 | (d) | | $ | 8,259,160 |
| | | | | |
Wisconsin 1.9% | | | | | | | | | | | | | | |
Badger Tobacco Asset Secur. Corp., Asset Bkd | | Baa3 | | 6.125 | | 6/01/27 | | | | 2,975 | | | | 3,039,022 |
Oconto Falls Cmnty. Dev. Auth. Dev. Rev., A.M.T. | | NR | | 8.125 | | 12/01/22 | | | | 1,395 | | | | 1,062,418 |
Oconto Falls Tissue, Inc. Proj., A.M.T. | | NR | | 7.75 | | 12/01/22 | | | | 7,800 | | | | 5,766,462 |
Wisconsin Hlth. & Edl. Facs. Auth. Rev., Eastcastle Place, Inc. Proj. | | NR | | 6.125 | | 12/01/34 | | | | 1,000 | | | | 976,060 |
Wisconsin St. Hlth. & Edl. Fac. Auth. Rev., Beaver Dam Cmnty. Hosp. Inc., Ser. A | | NR | | 6.75 | | 8/15/34 | | | | 1,250 | | | | 1,286,925 |
| | | | | | | | | | | | | |
|
|
| | | | | | | | | | | | | | | 12,130,887 |
| | | | | |
Wyoming 0.4% | | | | | | | | | | | | | | |
Weston Cnty. Wyoming Poll. Ctrl. Rev., Rfdg., Black Hills Pwr. Inc. Proj. | | Baa2 | | 4.80 | | 10/01/14 | | | | 2,850 | | | | 2,876,562 |
| | | | | |
Trust Territories 0.3% | | | | | | | | | | | | | | |
Northern Mariana Islands Comnwlth., Ser. A, G.O. | | Ba3 | | 6.75 | | 10/01/33 | | | | 2,000 | | | | 2,190,300 |
| | | | | | | | | | | | | |
|
|
Total long-term investments
(cost $615,229,843) | | | | | | | | | | | | | | 617,919,981 |
| | | | | | | | | | | | | |
|
|
SHORT-TERM INVESTMENTS 1.3% | | | | | | | | | | |
| | | | | |
Delaware 0.9% | | | | | | | | | | | | | | |
Delaware St. Econ. Dev. Auth. Rev., | | | | | | | | | | | | | | |
Delmarva Pwr. & Lt. Co. Proj., A.M.T., F.R.D.D. | | VMIG2 | | 3.20 | | 5/02/05 | (g) | | | 5,150 | | | | 5,150,000 |
Delmarva Pwr. & Lt. Co. Proj., A.M.T., F.R.D.D. | | VMIG2 | | 3.20 | | 5/02/05 | (g) | | | 700 | | | | 700,000 |
| | | | | | | | | | | | | |
|
|
| | | | | | | | | | | | | | | 5,850,000 |
See Notes to Financial Statements.
| | |
| Dryden Municipal Bond Fund/High Income Series | | 31 |
Portfolio of Investments
as of April 30, 2005 Cont’d.
| | | | | | | | | | | | | |
| Description (a) | | Moody’s
Rating (Unaudited) | | Interest
Rate | | Maturity
Date | | | Principal
Amount (000) | | Value (Note 1) |
| | | | | | | | | | | | | | |
| | | | | |
Virginia 0.4% | | | | | | | | | | | | | |
King George Cnty. Ind. Dev. Auth. Exempt Fac. Rev., | | | | | | | | | | | | | |
Birchwood Pwr. Partners Proj., | | | | | | | | | | | | | |
Ser. A, A.M.T., F.R.D.D. | | A-1(b) | | 3.21% | | 5/02/05 | (g) | | $ | 1,150 | | $ | 1,150,000 |
Ser. A, A.M.T., F.R.D.D. | | A-1(b) | | 3.21 | | 5/02/05 | (g) | | | 1,100 | | | 1,100,000 |
| | | | | | | | | | | | |
|
|
| | | | | | | | | | | | | | 2,250,000 |
| | | | | | | | | | | | |
|
|
Total short-term investments
(cost $8,100,000) | | | | | | | | | | | | | 8,100,000 |
| | | | | | | | | | | | |
|
|
Total Investments 98.5%
(cost $623,329,843; Note 5) | | | | | | | | | | | | | 626,019,981 |
Other assets in excess of liabilities(h) 1.5% | | | | | | | | | | | | | 9,821,804 |
| | | | | | | | | | | | |
|
|
Net Assets 100.0% | | | | | | | | | | | | $ | 635,841,785 |
| | | | | | | | | | | | |
|
|
| (a) | The following abbreviations are used in portfolio descriptions: |
A.M.B.A.C.—American Municipal Bond Assurance Corporation.
A.M.T.—Alternative Minimum Tax.
C.A.B.S.—Capital Appreciation Bonds.
C.O.P.—Certificates of Participation.
E.T.M.—Escrowed to Maturity.
F.G.I.C.—Financial Guaranty Insurance Company.
F.H.L.M.C.—Federal Home Loan Mortgage Corporation.
F.N.M.A.—Federal National Mortgage Association.
F.R.D.D.—Floating Rate Daily Demand Note(g).
F.S.A.—Financial Security Assurance.
G.N.M.A.—Government National Mortgage Association.
G.O.—General Obligation.
LLC—Limited Liability Company.
M.B.I.A.—Municipal Bond Insurance Corporation.
R.I.B.S.—Residential Interest Bonds.
R.I.T.E.S—Residual Interest Tax Exempt Securities Receipts.
S.A.V.R.S.—Select Auction Variable Rate Securities.
| (b) | Standard & Poor’s rating. |
| (c) | Represents issuer in default of interest payments; non-income producing security. |
| (d) | Prerefunded issues are secured by escrowed cash and/or direct U.S. government guaranteed obligations. |
| (e) | All or partial principal amount segregated as initial margin on financial futures contracts. |
| (f) | Inverse floating rate bond. The coupon is inversely indexed to a floating rate. The rate shown is the rate at year end. |
See Notes to Financial Statements.
| | |
| 32 | | Visit our website at www.jennisondryden.com |
| (g) | The maturity date shown is the later of the next date on which the security can be redeemed at par or the next date on which the rate of interest is adjusted. |
| (h) | Other assets in excess of liabilities include net unrealized appreciation (depreciation) on financial futures as follows: |
Open futures contracts outstanding at April 30, 2005:
| | | | | | | | | | | | | | | | |
Number of Contracts
| | Type
| | Expiration Date
| | Value at April 30, 2005
| | | Value at Trade Date
| | | Unrealized
Appreciation (Depreciation)
| |
| | | Long Positions: | | | | | | | | | | | | | | |
| 81 | | U.S. Treasury Bonds | | Jun. 05 | | $ | 9,302,343 | | | $ | 9,180,736 | | | $ | 121,607 | |
| 24 | | U.S. Treasury 2 Yr. Notes | | Jun. 05 | | | 4,984,875 | | | | 4,959,779 | | | | 25,096 | |
| | | | | | | | | | | | | | |
|
|
|
| | | | | | | | | | | | | | | $ | 146,703 | |
| | | | | | | | | | | | | | |
|
|
|
| | | Short Positions: | | | | | | | | | | | | | | |
| 329 | | U.S. Treasury 10 Yr. Notes | | Jun. 05 | | | (36,657,796 | ) | | | (36,145,000 | ) | | | (512,796 | ) |
| | | | | | | | | | | | | | |
|
|
|
| | | | | | | | | | | | | | | $ | (366,093 | ) |
| | | | | | | | | | | | | | |
|
|
|
NR—Not Rated by Moody’s or Standard & Poor’s.
The Fund’s current prospectus contains a description of Moody’s and Standard & Poor’s ratings
The Industry classification of long-term portfolio holdings, short-term investments and other assets in excess of liabilities shown as a percentage of net assets as of April 30, 2005 was as follows:
| | | |
| Portfolio Composition expressed as a percentage of net assets as of 4/30/05 | | | |
Healthcare | | 28.9 | % |
Special Tax/Assessment District | | 15.2 | |
Corporate-Backed IDB & PCR | | 13.2 | |
Other | | 7.8 | |
General Obligation | | 6.0 | |
Housing | | 4.1 | |
Power | | 3.8 | |
Tobacco Appropriated | | 3.7 | |
Transportation | | 3.2 | |
Water & Sewer | | 3.0 | |
Education | | 2.8 | |
Tobacco | | 2.6 | |
Lease-Backed Certificate of Participation | | 2.2 | |
Solid Waste/Resource Recovery | | 1.6 | |
Pooled Financing | | 0.4 | |
Total Investments | | 98.5 | |
Other assets in excess of liabilities | | 1.5 | |
Net Assets | | 100.0 | % |
| | |
|
|
See Notes to Financial Statements.
| | |
| Dryden Municipal Bond Fund/High Income Series | | 33 |
Statement of Assets and Liabilities
as of April 30, 2005
| | | | |
Assets | | | | |
Investments, at value (cost $623,329,843) | | $ | 626,019,981 | |
Cash | | | 2,789 | |
Interest receivable | | | 11,242,549 | |
Receivable for investments sold | | | 2,000,946 | |
Receivable for Series shares sold | | | 122,516 | |
Due from broker-variation margin | | | 64,787 | |
Prepaid expenses | | | 18,450 | |
| | |
|
|
|
Total assets | | | 639,472,018 | |
| | |
|
|
|
| |
Liabilities | | | | |
Payable for investments purchased | | | 1,282,219 | |
Dividends payable | | | 832,318 | |
Payable for Series shares reacquired | | | 773,884 | |
Accrued expenses | | | 275,922 | |
Management fee payable | | | 260,980 | |
Distribution fee payable | | | 166,107 | |
Transfer agent fee payable | | | 20,860 | |
Deferred trustees’ fees | | | 17,943 | |
| | |
|
|
|
Total liabilities | | | 3,630,233 | |
| | |
|
|
|
| |
Net Assets | | $ | 635,841,785 | |
| | |
|
|
|
| | | | | |
Net assets were comprised of: | | | | |
Shares of beneficial interest, at par | | $ | 615,366 | |
Paid-in capital in excess of par | | | 681,248,987 | |
| | |
|
|
|
| | | | 681,864,353 | |
Undistributed net investment income | | | 1,810,131 | |
Accumulated net realized loss on investments | | | (50,156,805 | ) |
Net unrealized appreciation on investments and financial future contracts | | | 2,324,106 | |
| | |
|
|
|
Net assets, April 30, 2005 | | $ | 635,841,785 | |
| | |
|
|
|
See Notes to Financial Statements.
| | |
| 34 | | Visit our website at www.jennisondryden.com |
| | | |
Class A | | | |
Net asset value and redemption price per share
($459,598,351 ÷ 44,483,185 shares of beneficial interest issued and outstanding) | | $ | 10.33 |
Maximum sales charge (4% of offering price) | | | 0.43 |
| | |
|
|
Maximum offering price to public | | $ | 10.76 |
| | |
|
|
| |
Class B | | | |
Net asset value, offering price and redemption price per share
($141,831,838 ÷ 13,722,480 shares of beneficial interest issued and outstanding) | | $ | 10.34 |
| | |
|
|
| |
Class C | | | |
Net asset value, offering price and redemption price per share
($22,032,974 ÷ 2,131,733 shares of beneficial interest issued and outstanding) | | $ | 10.34 |
| | |
|
|
| |
Class Z | | | |
Net asset value, offering price and redemption price per share
($12,378,622 ÷ 1,199,221 shares of beneficial interest issued and outstanding) | | $ | 10.32 |
| | |
|
|
See Notes to Financial Statements.
| | |
| Dryden Municipal Bond Fund/High Income Series | | 35 |
Statement of Operations
Year Ended April 30, 2005
| | | | |
Net Investment Income | | | | |
Income | | | | |
Interest | | $ | 38,842,057 | |
| | |
|
|
|
| |
Expenses | | | | |
Management fee | | | 3,294,146 | |
Distribution fee—Class A | | | 1,146,849 | |
Distribution fee—Class B | | | 827,978 | |
Distribution fee—Class C | | | 172,817 | |
Transfer agent’s fees and expenses (including affiliated expense of $213,700) | | | 294,000 | |
Custodian’s fees and expenses | | | 150,000 | |
Reports to shareholders | | | 145,000 | |
Registration fees | | | 55,000 | |
Legal fees and expenses | | | 27,000 | |
Trustees’ fees | | | 26,000 | |
Audit fee | | | 24,000 | |
Miscellaneous | | | 32,436 | |
| | |
|
|
|
Total expenses | | | 6,195,226 | |
| | |
|
|
|
Net investment income | | | 32,646,831 | |
| | |
|
|
|
| |
Realized And Unrealized Gain (Loss) On Investments | | | | |
Net realized gain (loss) on: | | | | |
Investment transactions | | | (600,111 | ) |
Financial futures transactions | | | 1,369,933 | |
Interest rate swap | | | 304,880 | |
| | |
|
|
|
| | | | 1,074,702 | |
| | |
|
|
|
Net change in unrealized appreciation (depreciation) on: | | | | |
Investment transactions | | | 21,289,126 | |
Financial futures contracts | | | (87,132 | ) |
Interest rate swap | | | (97,411 | ) |
| | |
|
|
|
| | | | 21,104,583 | |
| | |
|
|
|
Net gain on investments | | | 22,179,285 | |
| | |
|
|
|
Net Increase In Net Assets Resulting From Operations | | $ | 54,826,116 | |
| | |
|
|
|
See Notes to Financial Statements.
| | |
| 36 | | Visit our website at www.jennisondryden.com |
Statement of Changes in Net Assets
| | | | | | | | |
| | | Year Ended April 30,
| |
| | | 2005 | | | 2004 | |
Decrease In Net Assets | | | | | | | | |
Operations | | | | | | | | |
Net investment income | | $ | 32,646,831 | | | $ | 38,287,964 | |
Net realized gain on investments transactions | | | 1,074,702 | | | | 5,342,223 | |
Net change in unrealized appreciation (depreciation) on investments | | | 21,104,583 | | | | (13,123,851 | ) |
| | |
|
|
| |
|
|
|
Net increase in net assets resulting from operations | | | 54,826,116 | | | | 30,506,336 | |
| | |
|
|
| |
|
|
|
Dividends | | | | | | | | |
Dividends from net investment income | | | | | | | | |
Class A | | | (23,408,983 | ) | | | (25,207,520 | ) |
Class B | | | (8,039,534 | ) | | | (10,929,151 | ) |
Class C | | | (1,059,656 | ) | | | (1,276,742 | ) |
Class Z | | | (614,345 | ) | | | (863,578 | ) |
| | |
|
|
| |
|
|
|
| | | | (33,122,518 | ) | | | (38,276,991 | ) |
| | |
|
|
| |
|
|
|
| | |
Series share transactions (Net of share conversions) (Note 6) | | | | | | | | |
Net proceeds from shares sold | | | 26,586,733 | | | | 53,315,667 | |
Net asset value of shares issued in reinvestment of dividends | | | 15,439,660 | | | | 17,099,105 | |
Cost of shares reacquired | | | (116,275,299 | ) | | | (150,460,389 | ) |
| | |
|
|
| |
|
|
|
Net decrease in net assets from Series share transactions | | | (74,248,906 | ) | | | (80,045,617 | ) |
| | |
|
|
| |
|
|
|
Total decrease | | | (52,545,308 | ) | | | (87,816,272 | ) |
| | |
Net Assets | | | | | | | | |
Beginning of year | | | 688,387,093 | | | | 776,203,365 | |
| | |
|
|
| |
|
|
|
End of year (a) | | $ | 635,841,785 | | | $ | 688,387,093 | |
| | |
|
|
| |
|
|
|
(a) Includes undistributed net investment income of | | $ | 1,810,131 | | | $ | 1,701,509 | |
| | |
|
|
| |
|
|
|
See Notes to Financial Statements.
| | |
| Dryden Municipal Bond Fund/High Income Series | | 37 |
Portfolio of Investments
as of April 30, 2005 Cont’d.
| | | | | | | | | | | | | |
| Description (a) | | Moody’s
Rating (Unaudited) | | Interest
Rate | | Maturity
Date | | Principal
Amount (000) | | | Value (Note 1) |
| | | | | | | | | | | | | | |
LONG-TERM INVESTMENTS 97.8% | | | | | | | | | |
| | | | | |
California 8.6% | | | | | | | | | | | | | |
California St., G.O. | | Aaa | | 5.25% | | 2/01/27 | | $ | 7,000 | | | $ | 7,481,740 |
Los Angeles Unif. Sch. Dist. Cert. Part., Admin. Bldg. Proj., Ser. B, C.O.P. | | Aaa | | 5.00 | | 10/01/31 | | | 3,000 | | | | 3,101,340 |
San Diego Cnty. Wtr. Rev., C.O.P., F.G.I.C. | | Aa3 | | 8.254(c) | | 4/26/06 | | | 5,800 | | | | 6,128,744 |
San Joaquin Hills Trans. Corridor Agcy. Toll Rd. Rev., C.A.B.S., Ser. A, M.B.I.A. | | Aaa | | Zero | | 1/15/36 | | | 10,000 | | | | 2,116,300 |
San Juan Capistrano Unif. Sch. Dist. Cmnty. Facs. Dist. Spec. Tax., F.G.I.C. | | Aaa | | Zero | | 9/01/32 | | | 5,000 | | | | 1,261,900 |
South Orange Cnty. Pub. Fin., Foothill Area Proj., Ser. C, F.G.I.C. | | Aaa | | 8.00 | | 8/15/08 | | | 2,000 | | | | 2,312,680 |
University Rev., Hosp., UCLA Med. Ctr., Ser. A, A.M.B.A.C. | | Aaa | | 5.25 | | 5/15/30 | | | 3,000 | | | | 3,196,230 |
| | | | | | | | | | | | |
|
|
| | | | | | | | | | | | | | 25,598,934 |
| | | | | |
Colorado 2.5% | | | | | | | | | | | | | |
Colorado Dept. Trans. Rev., Trans. Rev. Antic Nts., Ser. A, F.G.I.C. | | Aaa | | 5.00 | | 12/15/16 | | | 4,000 | | | | 4,390,600 |
Denver City & Cnty. Arpt. Rev., Ser. C, A.M.T., M.B.I.A. | | Aaa | | 5.60 | | 11/15/11 | | | 3,000 | | | | 3,129,450 |
| | | | | | | | | | | | |
|
|
| | | | | | | | | | | | | | 7,520,050 |
| | | | | |
Delaware 0.5% | | | | | | | | | | | | | |
Delaware River & Bay Auth. Dev. Rev., M.B.I.A. | | Aaa | | 5.00 | | 1/01/24 | | | 1,500 | | | | 1,609,290 |
| | | | | |
District of Columbia 3.0% | | | | | | | | | | | | | |
Dist. of Columbia Rev., George Washington Univ., Ser. A | | Aaa | | 5.125 | | 9/15/31 | | | 2,000 | | | | 2,080,680 |
Dist. of Columbia, G.O., | | | | | | | | | | | | | |
Ser. A, E.T.M., M.B.I.A. | | Aaa | | 6.50 | | 6/01/10 | | | 2,905 | | | | 3,363,031 |
Ser. A, M.B.I.A. | | Aaa | | 6.50 | | 6/01/10 | | | 3,095 | (e) | | | 3,554,577 |
| | | | | | | | | | | | |
|
|
| | | | | | | | | | | | | | 8,998,288 |
See Notes to Financial Statements.
| | |
| 38 | | Visit our website at www.jennisondryden.com |
| | | | | | | | | | | | |
| Description (a) | | Moody’s
Rating (Unaudited) | | Interest
Rate | | Maturity
Date | | Principal
Amount (000) | | Value (Note 1) |
| | | | | | | | | | | | | |
| | | | | |
Florida 8.4% | | | | | | | | | | | | |
Brevard Cnty. Hlth. Facs. Auth., Holmes Reg. Med. Ctr. Proj., M.B.I.A. | | Aaa | | 5.60% | | 10/01/10 | | $ | 6,000 | | $ | 6,266,940 |
Duval Cnty. Sch. Brd. Cert. Part., F.G.I.C. | | Aaa | | 5.00 | | 7/01/21 | | | 5,300 | | | 5,684,091 |
Florida St. Corr. Privatization Comn. Cert. Partner, A.M.B.A.C., C.O.P., | | | | | | | | | | | | |
Ser. B | | Aaa | | 5.00 | | 8/01/15 | | | 2,125 | | | 2,316,760 |
Ser. B | | Aaa | | 5.00 | | 8/01/16 | | | 2,235 | | | 2,424,349 |
Indian River Cnty. Wtr. & Swr. Rev., Ser. A, F.G.I.C. | | Aaa | | 5.25 | | 9/01/18 | | | 2,600 | | | 2,810,106 |
Orange Cnty. Tourist Dev. Tax Rev., M.B.I.A. | | Aaa | | 5.00 | | 10/01/17 | | | 2,000 | | | 2,103,420 |
Polk Cnty. Sch. Dist. Sales Tax Rev., | | | | | | | | | | | | |
F.S.A. | | Aaa | | 5.25 | | 10/01/17 | | | 1,580 | | | 1,756,012 |
F.S.A. | | Aaa | | 5.25 | | 10/01/18 | | | 1,325 | | | 1,467,080 |
| | | | | | | | | | | |
|
|
| | | | | | | | | | | | | 24,828,758 |
| | | | | |
Georgia 3.3% | | | | | | | | | | | | |
Atlanta Arpt. Facs. Rev., Ser. A, A.M.B.A.C., E.T.M. | | Aaa | | 6.50 | | 1/01/10 | | | 2,000 | | | 2,295,420 |
Georgia Mun. Elec. Auth., Pwr. Rev., Ser. B, M.B.I.A. | | Aaa | | 6.20 | | 1/01/10 | | | 3,495 | | | 3,948,756 |
Newnan Hosp. Auth. Rev., M.B.I.A. | | Aaa | | 5.50 | | 1/01/21 | | | 3,185 | | | 3,475,790 |
| | | | | | | | | | | |
|
|
| | | | | | | | | | | | | 9,719,966 |
| | | | | |
Hawaii 3.0% | | | | | | | | | | | | |
Hawaii Dept. Budget & Fin., Hawaiian Elec. Co. Projs., Ser. C, A.M.B.A.C., A.M.T. | | Aaa | | 6.20 | | 11/01/29 | | | 8,000 | | | 8,933,520 |
| | | | | |
Idaho 0.2% | | | | | | | | | | | | |
Idaho Hsg. & Fin. Assoc., Sngl. Fam. Mtge., Ser. E, A.M.T. | | Aaa | | 5.55 | | 7/01/31 | | | 570 | | | 571,374 |
| | | | | |
Illinois 9.5% | | | | | | | | | | | | |
Chicago Midway Arpt. Rev., Ser. B, M.B.I.A., A.M.T. | | Aaa | | 5.75 | | 1/01/22 | | | 5,000 | | | 5,219,750 |
See Notes to Financial Statements.
| | |
| Dryden Municipal Bond Fund/Insured Series | | 39 |
Portfolio of Investments
as of April 30, 2005 Cont’d.
| | | | | | | | | | | | | |
| Description (a) | | Moody’s
Rating (Unaudited) | | Interest
Rate | | Maturity
Date | | Principal
Amount (000) | | | Value (Note 1) |
| | | | | | | | | | | | | | |
Chicago O’Hare Int’l. Arpt. Pass. Facs. Chrg., Ser. A, A.M.B.A.C. | | Aaa | | 5.625% | | 1/01/15 | | $ | 2,000 | | | $ | 2,072,700 |
Chicago Proj. & Rfdg., G.O., F.G.I.C. | | Aaa | | 5.25 | | 1/01/28 | | | 2,000 | | | | 2,123,320 |
Illinois St., | | | | | | | | | | | | | |
G.O. | | Aaa | | 5.625 | | 4/01/15 | | | 3,250 | | | | 3,568,922 |
G.O., F.S.A. | | Aaa | | 5.25 | | 4/01/22 | | | 2,500 | | | | 2,704,525 |
Illinois St. Civic Ctr., Spec. St. Oblig., F.S.A. | | Aaa | | 5.50 | | 12/15/15 | | | 2,710 | | | | 2,981,949 |
McLean & Woodford Cntys. Cmnty. Unif. Sch. Dist. No. 005, F.S.A., G.O. | | Aaa | | 5.625 | | 12/01/17 | | | 4,000 | (d) | | | 4,469,480 |
Metro. Pier & Exposition Auth. Dedicated St. Tax Rev., | | | | | | | | | | | | | |
C.A.B.S, McCormick, Ser. A | | Aaa | | Zero | | 12/15/34 | | | 10,000 | | | | 2,328,400 |
C.A.B.S, McCormick, Ser. A | | Aaa | | Zero | | 6/15/37 | | | 7,500 | | | | 1,532,175 |
Onterie Ctr. Hsg. Fin. Corp., Mtge. Rev., Ser. A, M.B.I.A. | | Aaa | | 7.00 | | 7/01/12 | | | 1,290 | | | | 1,305,364 |
| | | | | | | | | | | | |
|
|
| | | | | | | | | | | | | | 28,306,585 |
| | | | | |
Kansas 0.8% | | | | | | | | | | | | | |
Saline Cnty. Unif. Sch. Dist. No. 305 Salina, | | | | | | | | | | | | | |
G.O., F.S.A. | | Aaa | | 5.50 | | 9/01/17 | | | 1,525 | (d) | | | 1,691,210 |
G.O., F.S.A. | | Aaa | | 5.50 | | 9/01/17 | | | 475 | | | | 526,941 |
| | | | | | | | | | | | |
|
|
| | | | | | | | | | | | | | 2,218,151 |
| | | | | |
Louisiana 0.4% | | | | | | | | | | | | | |
New Orleans Fin. Auth., Sngl. Fam. Mtge., Ser. B-2, A.M.T., G.N.M.A./F.N.M.A. | | Aaa | | 6.00 | | 12/01/21 | | | 1,070 | | | | 1,119,134 |
| | | | | |
Maryland | | | | | | | | | | | | | |
Prince Georges Cnty. Hsg., Sngl. Fam. Mtge., Ser. A, A.M.T., G.N.M.A./F.N.M.A. | | AAA(b) | | 6.15 | | 8/01/19 | | | 90 | | | | 93,997 |
| | | | | |
Massachusetts 1.1% | | | | | | | | | | | | | |
Boston Convention Ctr. Act of 1997, Spec. Oblig., Ser. A, A.M.B.A.C. | | Aaa | | 5.00 | | 5/01/19 | | | 2,000 | | | | 2,140,060 |
See Notes to Financial Statements.
| | |
| 40 | | Visit our website at www.jennisondryden.com |
| | | | | | | | | | | | |
| Description (a) | | Moody’s
Rating (Unaudited) | | Interest
Rate | | Maturity
Date | | Principal
Amount (000) | | Value (Note 1) |
| | | | | | | | | | | | | |
Massachusetts St. Spec. Oblig. Rev., Cons. Ln., Ser. A, F.S.A. | | Aaa | | 5.50% | | 6/01/21 | | $ | 1,000 | | $ | 1,167,570 |
| | | | | | | | | | | |
|
|
| | | | | | | | | | | | | 3,307,630 |
| | | | | |
Michigan 3.5% | | | | | | | | | | | | |
Detroit Wtr. Sup. Sys., Ser. B, M.B.I.A. | | Aaa | | 5.25 | | 7/01/32 | | | 5,500 | | | 5,866,245 |
Michigan Mun. Bond Auth. Rev., Clean Wtr., St. Revolving Fd. | | Aaa | | 5.00 | | 10/01/15 | | | 4,000 | | | 4,405,360 |
| | | | | | | | | | | |
|
|
| | | | | | | | | | | | | 10,271,605 |
| | | | | |
Minnesota 4.0% | | | | | | | | | | | | |
Becker Indpt. Sch. Dist. No. 726., F.S.A., | | | | | | | | | | | | |
Ser. A | | Aaa | | 6.00 | | 2/01/15 | | | 1,610 | | | 1,800,753 |
Ser. A | | Aaa | | 6.00 | | 2/01/16 | | | 1,750 | | | 1,957,340 |
Minneapolis & St. Paul Metro. Arpts., F.G.I.C., | | | | | | | | | | | | |
Ser. A | | Aaa | | 5.75 | | 1/01/32 | | | 4,285 | | | 4,700,388 |
Ser. C | | Aaa | | 5.50 | | 1/01/19 | | | 3,000 | | | 3,294,780 |
| | | | | | | | | | | |
|
|
| | | | | | | | | | | | | 11,753,261 |
| | | | | |
Missouri 1.1% | | | | | | | | | | | | |
St. Louis Arpt. Rev., Arpt. Dev. Proj., Ser. A, M.B.I.A. | | Aaa | | 5.625 | | 7/01/19 | | | 3,000 | | | 3,331,620 |
| | | | | |
Nevada 2.6% | | | | | | | | | | | | |
Clark Cnty. Nevada Sch. Dist. Refdg., Ser. B, G.O., F.G.I.C. | | Aaa | | 5.00 | | 6/15/19 | | | 7,000 | | | 7,592,620 |
| | | | | |
New Jersey 3.0% | | | | | | | | | | | | |
Jersey City Swr. Auth., | | | | | | | | | | | | |
Rev., A.M.B.A.C. | | Aaa | | 6.00 | | 1/01/10 | | | 2,585 | | | 2,905,023 |
Rev., A.M.B.A.C. | | Aaa | | 6.25 | | 1/01/14 | | | 4,255 | | | 5,070,811 |
New Jersey St. Tpke. Auth., Rev., Growth & Income Secs., Ser. B | | Aaa | | Zero | | 1/01/35 | | | 1,500 | | | 952,170 |
| | | | | | | | | | | |
|
|
| | | | | | | | | | | | | 8,928,004 |
See Notes to Financial Statements.
| | |
| Dryden Municipal Bond Fund/Insured Series | | 41 |
Portfolio of Investments
as of April 30, 2005 Cont’d.
| | | | | | | | | | | | | |
| Description (a) | | Moody’s
Rating (Unaudited) | | Interest
Rate | | Maturity
Date | | Principal
Amount (000) | | | Value (Note 1) |
| | | | | | | | | | | | | | |
| | | | | |
New York 11.2% | | | | | | | | | | | | | |
Erie Cnty. Ind. Dev. Agcy. Sch. Facs. Rev., City of Buffalo Proj., F.S.A. | | Aaa | | 5.75% | | 5/01/21 | | $ | 2,750 | | | $ | 3,082,502 |
Islip Res. Rec. Facs., Ser. B, A.M.B.A.C., A.M.T. | | Aaa | | 7.20 | | 7/01/10 | | | 1,750 | | | | 2,058,315 |
Metro. Trans. Auth., N.Y. Svc. Contract, Rfdg., M.B.I.A., | | | | | | | | | | | | | |
Ser. B | | Aaa | | 5.50 | | 7/01/19 | | | 5,000 | | | | 5,578,800 |
Ser. B | | Aaa | | 5.50 | | 7/01/23 | | | 7,285 | | | | 8,046,064 |
New York St. Dorm. Auth. Rev., Sch. Dist. Fin. Proj., Ser. A, M.B.I.A. | | Aaa | | 5.75 | | 10/01/17 | | | 3,000 | | | | 3,410,460 |
New York St. Environ. Facs. Poll. Ctrl. Rev., | | | | | | | | | | | | | |
Ser. C | | Aaa | | 5.70 | | 7/15/12 | | | 25 | | | | 25,995 |
Ser. C | | Aaa | | 5.75 | | 7/15/13 | | | 10 | | | | 10,402 |
Ser. C | | Aaa | | 5.80 | | 7/15/14 | | | 35 | | | | 36,428 |
New York, N. Y., | | | | | | | | | | | | | |
Prerfdg., Ser. G, G.O., M.B.I.A. | | Aaa | | 5.75 | | 2/01/14 | | | 470 | (d) | | | 487,860 |
Pub. Impvt., Ser. J, G.O., F.S.A. | | Aaa | | 5.00 | | 3/01/18 | | | 2,500 | | | | 2,710,025 |
Suffolk Cnty. Judicial Facs., John P. Cohalan Complex, A.M.B.A.C. | | Aaa | | 5.75 | | 10/15/12 | | | 3,000 | | | | 3,318,840 |
Tobacco Settlement Fin. Corp., Asset-Bkd., | | | | | | | | | | | | | |
Ser. A-1 | | A2 | | 5.50 | | 6/01/14 | | | 3,000 | | | | 3,254,010 |
Ser. C-1 | | A2 | | 5.50 | | 6/01/15 | | | 1,000 | | | | 1,090,020 |
| | | | | | | | | | | | |
|
|
| | | | | | | | | | | | | | 33,109,721 |
| | | | | |
Ohio 1.8% | | | | | | | | | | | | | |
Bowling Green St. Univ., F.G.I.C. | | Aaa | | 5.75 | | 6/01/16 | | | 2,815 | | | | 3,149,985 |
Ohio St. Wtr. Dev. Auth. Rev., Wtr. Dev., Fresh Wtr., Ser. A | | Aa1 | | 5.125 | | 12/01/18 | | | 2,000 | (d) | | | 2,146,800 |
| | | | | | | | | | | | |
|
|
| | | | | | | | | | | | | | 5,296,785 |
| | | | | |
Oklahoma 4.0% | | | | | | | | | | | | | |
Edmond Pub. Wks. Auth. Util. Rev., A.M.B.A.C. | | Aaa | | 5.625 | | 7/01/24 | | | 4,440 | | | | 4,810,252 |
See Notes to Financial Statements.
| | |
| 42 | | Visit our website at www.jennisondryden.com |
| | | | | | | | | | | | | |
| Description (a) | | Moody’s
Rating
(Unaudited) | | Interest
Rate | | Maturity
Date | | Principal
Amount (000) | | | Value (Note 1) |
| | | | | | | | | | | | | | |
Norman Reg. Hosp. Auth., Rev., Ser. A, M.B.I.A. | | Aaa | | 5.50% | | 9/01/11 | | $ | 4,110 | | | $ | 4,319,322 |
Oklahoma City Arpt. Trust, Jr. Lien, Ser. 24, A.M.B.A.C., A.M.T. | | Aaa | | 5.75 | | 2/01/18 | | | 2,620 | | | | 2,717,097 |
| | | | | | | | | | | | |
|
|
| | | | | | | | | | | | | | 11,846,671 |
| | | | | |
Pennsylvania 2.6% | | | | | | | | | | | | | |
Pennsylvania St. Ind. Dev. Auth. Rev., Econ. Dev. | | Aaa | | 5.50 | | 7/01/17 | | | 5,000 | | | | 5,614,000 |
Philadelphia Wtr. & Swr. Rev., Wrt. Util. Impvt. Ser. A, F.S.A. | | Aaa | | 5.25 | | 7/01/20 | | | 2,000 | | | | 2,200,980 |
| | | | | | | | | | | | |
|
|
| | | | | | | | | | | | | | 7,814,980 |
| | | | | |
Puerto Rico 2.3% | | | | | | | | | | | | | |
Puerto Rico Comnwlth. Hwy. & Transit Auth. Trans. Rev., | | | | | | | | | | | | | |
Ser. I, F.G.I.C. | | Aaa | | 5.00 | | 7/01/25 | | | 3,000 | | | | 3,199,800 |
Ser. I, F.G.I.C. | | Aaa | | 5.00 | | 7/01/26 | | | 3,465 | | | | 3,690,294 |
| | | | | | | | | | | | |
|
|
| | | | | | | | | | | | | | 6,890,094 |
| | | | | |
South Carolina 2.2% | | | | | | | | | | | | | |
Lexington Wtr. & Swr., Rev., Ser. A, M.B.I.A. | | Aaa | | 5.75 | | 4/01/20 | | | 4,180 | | | | 4,630,980 |
Univ. of South Carolina, Rev., Ser. A, F.G.I.C. | | Aaa | | 5.75 | | 6/01/30 | | | 1,615 | | | | 1,773,513 |
| | | | | | | | | | | | |
|
|
| | | | | | | | | | | | | | 6,404,493 |
| | | | | |
Texas 7.3% | | | | | | | | | | | | | |
Corpus Christi Util. Sys. Rev., F.S.A., | | | | | | | | | | | | | |
Ser. A | | Aaa | | 6.00 | | 7/15/19 | | | 3,255 | (d) | | | 3,681,405 |
Ser. A | | Aaa | | 6.00 | | 7/15/20 | | | 3,450 | (d) | | | 3,901,950 |
Houston Arpt. Sys. Rev., E.T.M. | | Aaa | | 7.20 | | 7/01/13 | | | 3,095 | | | | 3,590,602 |
Houston Texas, Rfdg., Pub. Impvt., Ser. A, G.O., M.B.I.A. | | Aaa | | 5.375 | | 3/01/15 | | | 5,000 | | | | 5,573,950 |
Mission Cons. Indpt. Sch. Dist., G.O., P.S.F.G. | | Aaa | | 5.75 | | 2/15/19 | | | 1,360 | (d) | | | 1,516,142 |
Northwest Indpt. Sch. Dist., P.S.F.G.,
Sch. Bldg. & Rfdg., G.O. | | Aaa | | 5.50 | | 8/15/17 | | | 1,080 | | | | 1,201,251 |
Sch. Bldg. & Rfdg., G.O. | | Aaa | | 5.50 | | 8/15/18 | | | 1,000 | | | | 1,112,270 |
See Notes to Financial Statements.
| | |
| Dryden Municipal Bond Fund/Insured Series | | 43 |
Portfolio of Investments
as of April 30, 2005 Cont’d.
| | | | | | | | | | | | | |
| Description (a) | | Moody’s
Rating (Unaudited) | | Interest
Rate | | Maturity
Date | | Principal
Amount (000) | | | Value (Note 1) |
| | | | | | | | | | | | | | |
Van Alstyne Indpt. Sch. Dist. Rfdg., G.O., P.S.F.G. | | Aaa | | 5.95% | | 8/15/29 | | $ | 1,105 | | | $ | 1,170,361 |
| | | | | | | | | | | | |
|
|
| | | | | | | | | | | | | | 21,747,931 |
| | | | | |
Vermont 0.7% | | | | | | | | | | | | | |
Vermont Hsg. Fin. Agcy., Sngl. Fam. Mtge., Ser. 13A, A.M.T., F.S.A. | | Aaa | | 5.45 | | 5/01/26 | | | 2,075 | | | | 2,089,567 |
| | | | | |
Washington 8.2% | | | | | | | | | | | | | |
Clark Cnty. Sch. Dist. No. 114, G.O., F.S.A. | | Aaa | | 5.25 | | 12/01/18 | | | 3,800 | | | | 4,146,864 |
Cowlitz Cnty. Sch. Dist. No. 122 Longview, F.S.A., G.O. | | Aaa | | 5.50 | | 12/01/19 | | | 1,725 | | | | 1,912,784 |
Grant Cnty. Pub. Util. Dist. No. 002 Wanapum Hydro Elec. Rev., Ser. A | | Aaa | | 5.00 | | 1/01/29 | | | 1,000 | | | | 1,043,590 |
King Cnty. Sch. Dist. No 411, G.O., F.S.A. | | Aaa | | 6.25 | | 12/01/15 | | | 1,900 | (d) | | | 2,177,381 |
Ocean Shores, G.O., F.G.I.C. | | Aaa | | 5.50 | | 12/01/20 | | | 1,570 | | | | 1,727,283 |
Port Seattle Rev., | | | | | | | | | | | | | |
Prerfdg., Ser. A, F.G.I.C. | | Aaa | | 5.375 | | 6/01/13 | | | 595 | (d) | | | 642,850 |
Unrfdg., Ser. A, F.G.I.C. | | Aaa | | 5.375 | | 6/01/13 | | | 1,405 | | | | 1,504,319 |
Skagit Cnty. Cons. Sch. Dist. No. 320 Mount Vernon, G.O., M.B.I.A. | | Aaa | | 5.50 | | 12/01/18 | | | 2,000 | | | | 2,217,720 |
Snohomish Cnty., Ltd. Tax, G.O., M.B.I.A. | | Aaa | | 5.375 | | 12/01/19 | | | 2,000 | | | | 2,199,500 |
Washington St. Hsg. Fin. Comn., Sngl. Fam. Pg., Ser. 2A, A.M.T., G.N.M.A./F.N.M.A. | | Aaa | | 5.375 | | 12/01/18 | | | 2,505 | | | | 2,577,219 |
Washington St. Pub. Pwr. Supply, M.B.I.A. | | Aaa | | 5.75 | | 7/01/10 | | | 4,000 | | | | 4,210,000 |
| | | | | | | | | | | | |
|
|
| | | | | | | | | | | | | | 24,359,510 |
| | | | | |
West Virginia 1.1% | | | | | | | | | | | | | |
Clarksburg Wtr. Rev., F.G.I.C. | | Aaa | | 5.25 | | 9/01/19 | | | 2,000 | | | | 2,201,660 |
West Virginia St. Wtr. Dev. Auth., Ser. B, A.M.B.A.C., A.M.T. | | Aaa | | 5.875 | | 7/01/20 | | | 1,015 | | | | 1,116,327 |
| | | | | | | | | | | | |
|
|
| | | | | | | | | | | | | | 3,317,987 |
See Notes to Financial Statements.
| | |
| 44 | | Visit our website at www.jennisondryden.com |
| | | | | | | | | | | | | |
| Description (a) | | Moody’s
Rating (Unaudited) | | Interest
Rate | | Maturity
Date | | | Principal
Amount (000) | | Value (Note 1) |
| | | | | | | | | | | | | | |
| | | | | |
Wisconsin 0.9% | | | | | | | | | | | | | |
Manitowoc Elec. Rev., Pwr. Sys., F.G.I.C. | | Aaa | | 5.25% | | 10/01/34 | | | $ | 2,500 | | $ | 2,653,525 |
| | | | | | | | | | | | |
|
|
Total long-term investments
(cost $274,282,254) | | | | | | | | | | | | | 290,234,051 |
| | | | | | | | | | | | |
|
|
SHORT-TERM INVESTMENTS 1.9% | | | | | | | | | |
| | | | | |
California 0.3% | | | | | | | | | | | | | |
California Hsg. Fin. Agcy. Home Mtge., Rev., Ser. F, F.R.D.D., A.M.T. | | VMIG1 | | 3.03 | | 5/02/05 | (f) | | | 10 | | | 10,000 |
California St., Mun. Secs. Trust Rcpts., SGA 135, A.M.B.A.C., F.R.D.D. | | A1+(b) | | 3.03 | | 5/02/05 | (f) | | | 800 | | | 800,000 |
| | | | | | | | | | | | |
|
|
| | | | | | | | | | | | | | 810,000 |
| | | | | |
Texas 1.6% | | | | | | | | | | | | | |
Bell Cnty. Hlth. Facs. Dev. Corp. Rev., M.B.I.A., F.R.D.D. | | VMIG1 | | 3.05 | | 5/02/05 | (f) | | | 4,400 | | | 4,400,000 |
Dallas-Fort Worth Reg. Arpt. Rev., Mun. Secs. Trust Rcpts., SGA 49, F.R.D.D., M.B.I.A., A.M.T. | | A-1+(b) | | 3.07 | | 5/02/05 | (f) | | | 400 | | | 400,000 |
| | | | | | | | | | | | |
|
|
| | | | | | | | | | | | | | 4,800,000 |
| | | | | | | | | | | | |
|
|
Total short-term investments
(cost $5,610,000) | | | | | | | | | | | | | 5,610,000 |
| | | | | | | | | | | | |
|
|
Total Investments 99.7%
(cost $279,892,254; Note 5) | | | | | | | | | | | | | 295,844,051 |
Other assets in excess of liabilities(g) 0.3% | | | | | | | | | | | | | 946,160 |
| | | | | | | | | | | | |
|
|
Net Assets 100.0% | | | | | | | | | | | | $ | 296,790,211 |
| | | | | | | | | | | | |
|
|
| (a) | The following abbreviations are used in portfolio descriptions: |
A.M.B.A.C.—American Municipal Bond Assurance Corporation.
A.M.T.—Alternative Minimum Tax.
C.A.B.S.—Capital Appreciation Bonds.
C.O.P.—Certificates of Participation.
E.T.M.—Escrowed to Maturity.
See Notes to Financial Statements.
| | |
| Dryden Municipal Bond Fund/Insured Series | | 45 |
Portfolio of Investments
as of April 30, 2005 Cont’d.
F.G.I.C.—Financial Guaranty Insurance Company.
F.N.M.A.—Federal National Mortgage Association.
F.R.D.D.—Floating Rate Daily Demand Note(f).
F.S.A.—Financial Security Assurance.
G.N.M.A.—Government National Mortgage Association.
G.O.—General Obligation.
M.B.I.A.—Municipal Bond Insurance Corporation.
P.S.F.G.—Public School Fund Guaranty.
| (b) | Standard & Poor’s rating. |
| (c) | Inverse floating rate bond. The coupon is inversely indexed to a floating rate. The rate shown is the rate at year end. |
| (d) | Prerefunded issues are secured by escrowed cash or direct U.S. government guaranteed obligations. |
| (e) | All or partial amount segregated as initial margin on financial futures contracts. |
| (f) | The maturity date shown is the later of the next date on which the security can be redeemed at par or the next date on which the rate of interest is adjusted. |
| (g) | Other assets in excess of liabilities include net unrealized appreciation (depreciation) on financial futures and interest rate swap as follows: |
Open futures contracts outstanding at April 30, 2005:
| | | | | | | | | | | | | | | | |
Number of
Contracts
| | Type
| | Expiration
Date
| | Value at
April 30,
2005
| | | Value at
Trade Date
| | | Unrealized
Appreciation
(Depreciation)
| |
| Long Positions: | | | | | | | | | | | | | | | | |
| 13 | | U.S. Treasury 10 Yr. Notes | | Jun. 05 | | $ | 1,448,484 | | | $ | 1,423,719 | | | $ | 24,765 | |
| 64 | | U.S. Treasury Bonds | | Jun. 05 | | | 7,350,000 | | | | 7,141,626 | | | | 208,374 | |
| Short Positions: | | | | | | | | | | | | | | | | |
| 69 | | U.S. Treasury 5 Yr. Notes | | Jun. 05 | | | (7,483,265 | ) | | | (7,423,250 | ) | | | (60,015 | ) |
| 72 | | U.S. Treasury 2 Yr. Notes | | Jun. 05 | | | (14,954,625 | ) | | | (14,936,438 | ) | | | (18,187 | ) |
| | | | | | | | | | | | | | |
|
|
|
| | | | | | | | | | | | | | | $ | 154,937 | |
| | | | | | | | | | | | | | |
|
|
|
Interest rate swap agreement outstanding at April 30, 2005:
| | | | | | | | | | | | | |
Counterparty
| | Termination
Date
| | Notional
Amount (000)
| | Fixed
Rate
| | Floating
Rate
| | Unrealized
(Depreciation)
| |
Morgan Stanley Capital Services, Inc.* | | 3/17/2021 | | $ | 1,700 | | 3.865% | | BMA Municipal Swap Index | | $ | (20,054 | ) |
| | | | | | | | | | | |
|
|
|
| * | Portfolio pays the floating rate and receives the fixed rate. |
The Fund’s current prospectus contains a description of Moody’s and Standard & Poor’s ratings.
See Notes to Financial Statements.
| | |
| 46 | | Visit our website at www.jennisondryden.com |
The industry classification of long-term portfolio holdings, short-term investments and other assets in excess of liabilities shown as a percentage of net assets as of April 30, 2005 was as follows:
| | | |
| Portfolio Composition expressed as a percentage of net assets as of 4/30/05 | | | |
General Obligation | | 21.7 | % |
Water & Sewer | | 17.5 | |
Transportation | | 16.5 | |
Lease-Backed Certificate of Participation | | 8.4 | |
Healthcare | | 7.3 | |
Education | | 7.1 | |
Special Tax/Assessment District | | 5.8 | |
Power | | 4.0 | |
Corporate-Backed IDB & PCR | | 3.0 | |
Housing | | 2.6 | |
Pooled Financing | | 1.9 | |
Other | | 1.7 | |
Tobacco Appropriated | | 1.5 | |
Solid Waste/Resource Recovery | | 0.7 | |
Tobacco | | — | |
Total Investments | | 99.7 | |
Other assets in excess of liabilities | | 0.3 | |
Net Assets | | 100.0 | % |
| | |
|
|
See Notes to Financial Statements.
| | |
| Dryden Municipal Bond Fund/Insured Series | | 47 |
Statement of Assets and Liabilities
as of April 30, 2005
| | | |
Assets | | | |
Investments, at value (cost $279,892,254) | | $ | 295,844,051 |
Interest receivable | | | 4,130,884 |
Receivable for Series shares sold | | | 28,252 |
Due from broker-variation margin | | | 23,912 |
Prepaid expenses | | | 9,961 |
| | �� |
|
|
Total assets | | | 300,037,060 |
| | |
|
|
| |
Liabilities | | | |
Payable for investments purchased | | | 2,199,880 |
Payable for Series shares reacquired | | | 328,074 |
Dividends payable | | | 300,906 |
Accrued expenses | | | 135,414 |
Management fee payable | | | 121,696 |
Distribution fee payable | | | 71,658 |
Payable to custodian | | | 45,155 |
Unrealized depreciation on interest rate swaps | | | 20,054 |
Deferred trustees’ fees | | | 14,029 |
Transfer agent fee payable | | | 9,983 |
| | |
|
|
Total liabilities | | | 3,246,849 |
| | |
|
|
| |
Net Assets | | $ | 296,790,211 |
| | |
|
|
| | | | |
Net assets were comprised of: | | | |
Shares of beneficial interest, at par | | $ | 270,315 |
Paid-in capital in excess of par | | | 279,857,856 |
| | |
|
|
| | | | 280,128,171 |
Undistributed net investment income | | | 293,286 |
Accumulated net realized gain on investments | | | 282,074 |
Net unrealized appreciation on investments, financial futures contracts and interest rate swap | | | 16,086,680 |
| | |
|
|
Net assets, April 30, 2005 | | $ | 296,790,211 |
| | |
|
|
See Notes to Financial Statements.
| | |
| 48 | | Visit our website at www.jennisondryden.com |
| | | |
Class A | | | |
Net asset value and redemption price per share
($242,325,174 ÷ 22,076,075 shares of beneficial interest issued and outstanding) | | $ | 10.98 |
Maximum sales charge (4% of offering price) | | | 0.46 |
| | |
|
|
Maximum offering price to public | | $ | 11.44 |
| | |
|
|
| |
Class B | | | |
Net asset value, offering price and redemption price per share
($42,362,581 ÷ 3,853,334 shares of beneficial interest issued and outstanding) | | $ | 10.99 |
| | |
|
|
| |
Class C | | | |
Net asset value, offering price and redemption price per share
($7,537,613 ÷ 685,625 shares of beneficial interest issued and outstanding) | | $ | 10.99 |
| | |
|
|
| |
Class Z | | | |
Net asset value, offering price and redemption price per share
($4,564,843 ÷ 416,437 shares of beneficial interest issued and outstanding) | | $ | 10.96 |
| | |
|
|
See Notes to Financial Statements.
| | |
| Dryden Municipal Bond Fund/Insured Series | | 49 |
Statement of Operations
Year Ended April 30, 2005
| | | | |
Net Investment Income | | | | |
Income | | | | |
Interest | | $ | 14,342,538 | |
| | |
|
|
|
| |
Expenses | | | | |
Management fee | | | 1,551,516 | |
Distribution fee—Class A | | | 622,686 | |
Distribution fee—Class B | | | 241,291 | |
Distribution fee—Class C | | | 57,792 | |
Transfer agent’s fees and expenses (including affiliated expense of $125,300) | | | 158,000 | |
Custodian’s fees and expenses | | | 121,000 | |
Reports to shareholders | | | 70,000 | |
Registration fees | | | 54,000 | |
Legal fees and expenses | | | 25,000 | |
Audit fee | | | 24,000 | |
Trustees’ fees | | | 18,000 | |
Miscellaneous | | | 16,111 | |
| | |
|
|
|
Total expenses | | | 2,959,396 | |
| | |
|
|
|
Net investment income | | | 11,383,142 | |
| | |
|
|
|
| |
Realized And Unrealized Gain (Loss) On Investments | | | | |
Net realized gain (loss) on: | | | | |
Investment transactions | | | 1,909,468 | |
Financial futures transactions | | | (830,882 | ) |
Interest rate swap | | | 142,080 | |
| | |
|
|
|
| | | | 1,220,666 | |
| | |
|
|
|
Net change in unrealized appreciation (depreciation) on: | | | | |
Investments transactions | | | 3,600,032 | |
Financial futures contracts | | | 655,285 | |
Interest rate swap | | | (65,449 | ) |
| | |
|
|
|
| | | | 4,189,868 | |
| | |
|
|
|
Net gain on investments | | | 5,410,534 | |
| | |
|
|
|
Net Increase In Net Assets Resulting From Operations | | $ | 16,793,676 | |
| | |
|
|
|
See Notes to Financial Statements.
| | |
| 50 | | Visit our website at www.jennisondryden.com |
Statement of Changes in Net Assets
| | | | | | | | |
| | | Year Ended April 30,
| |
| | | 2005 | | | 2004 | |
Decrease In Net Assets | | | | | | | | |
Operations | | | | | | | | |
Net investment income | | $ | 11,383,142 | | | $ | 12,609,352 | |
Net realized gain on investments | | | 1,220,666 | | | | 4,982,368 | |
Net change in unrealized appreciation (depreciation) on investments | | | 4,189,868 | | | | (16,980,033 | ) |
| | |
|
|
| |
|
|
|
Net increase in net assets resulting from operations | | | 16,793,676 | | | | 611,687 | |
| | |
|
|
| |
|
|
|
Dividends and distributions (Note 1) | | | | | | | | |
Dividends from net investment income | | | | | | | | |
Class A | | | (9,275,030 | ) | | | (10,094,835 | ) |
Class B | | | (1,664,406 | ) | | | (1,949,647 | ) |
Class C | | | (246,667 | ) | | | (266,136 | ) |
Class Z | | | (210,938 | ) | | | (295,156 | ) |
| | |
|
|
| |
|
|
|
| | | | (11,397,041 | ) | | | (12,605,774 | ) |
| | |
|
|
| |
|
|
|
Distributions from net realized gains | | | | | | | | |
Class A | | | (2,585,711 | ) | | | (7,002,039 | ) |
Class B | | | (509,925 | ) | | | (1,457,020 | ) |
Class C | | | (83,023 | ) | | | (211,875 | ) |
Class Z | | | (52,719 | ) | | | (186,705 | ) |
| | |
|
|
| |
|
|
|
| | | | (3,231,378 | ) | | | (8,857,639 | ) |
| | |
|
|
| |
|
|
|
| | |
Series share transactions (Net of share conversions) (Note 6) | | | | | | | | |
Net proceeds from shares sold | | | 13,443,993 | | | | 39,399,592 | |
Net asset value of shares issued in reinvestment of dividends and distributions | | | 9,115,454 | | | | 13,517,012 | |
Cost of shares reacquired | | | (51,064,171 | ) | | | (68,371,805 | ) |
| | |
|
|
| |
|
|
|
Net decrease in net assets from Series share transactions | | | (28,504,724 | ) | | | (15,455,201 | ) |
| | |
|
|
| |
|
|
|
Total decrease | | | (26,339,467 | ) | | | (36,306,927 | ) |
| | |
Net Assets | | | | | | | | |
Beginning of year | | | 323,129,678 | | | | 359,436,605 | |
| | |
|
|
| |
|
|
|
End of year (a) | | $ | 296,790,211 | | | $ | 323,129,678 | |
| | |
|
|
| |
|
|
|
(a) Includes undistributed net investment income of | | $ | 293,286 | | | $ | 332,410 | |
| | |
|
|
| |
|
|
|
See Notes to Financial Statements.
| | |
| Dryden Municipal Bond Fund/Insured Series | | 51 |
Notes to Financial Statements
Dryden Municipal Bond Fund (the “Fund”) is registered under the Investment Company Act of 1940 as a diversified, open-end management investment company. The Fund was organized as an unincorporated business trust in Massachusetts on November 3, 1986 and consists of two series: the “High Income Series” and the “Insured Series”. Investment operations for Class A, Class B, Class C and Class Z shares of each Series commenced on January 22, 1990, September 17, 1987, August 1, 1994 and September 16, 1996, respectively.
The investment objectives of the Series are as follows: (i) the objective of the High Income Series is to provide the maximum amount of income that is eligible for exclusion from federal income taxes, (ii) the objective of the Insured Series is to provide the maximum amount of income that is eligible for exclusion from federal income taxes consistent with the preservation of capital. The ability of issuers of debt securities held by the Fund to meet their obligations may be affected by economic and political developments in a specific state, region or industry.
Note 1. Accounting Policies
The following is a summary of significant accounting policies followed by the Fund in the preparation of its financial statements.
Securities Valuation: The Fund values municipal securities (including commitments to purchase such securities on a “when-issued” basis) as of the close of trading on the New York Stock Exchange, on the basis of prices provided by a pricing service which uses information with respect to transactions in comparable securities and various relationships between securities in determining values. Securities listed on a securities exchange (other than options on securities and indices) are valued at the last sale price on such exchange on the day of valuation or, if there was no sale on such day, at the mean between the last reported bid and asked prices, or at the last bid price on such day in the absence of an asked price. Securities that are actively traded in the over-the-counter market, including listed securities for which the primary market is believed by Prudential Investments LLC (“PI” or “Manager”) in consultation with the subadvisor, to be over-the-counter, are valued at market value using prices provided, by an independent pricing agent or principal market maker. Futures contracts and options thereon traded on a commodities exchange or board of trade are valued at the last sale price at the close of trading on such exchange or board of trade or, if there was no sale on the applicable commodities exchange or board of trade on such day, at the mean between the most recently quoted prices on such exchange or board of trade or at the last bid price in the absence of an asked price. Securities for which
| | |
| 52 | | Visit our website at www.jennisondryden.com |
reliable market quotations are not readily available or for which the pricing service does not provide a valuation methodology, or does not present fair value, are valued at fair value in accordance with Board of Trustees’ approved fair valuation procedures. Using fair value to price securities may result in a value that is different from a security’s most recent closing price and from the price used by other mutual funds to calculate their net asset values. Investments in mutual funds are valued at their net asset value as of the close of the New York Stock Exchange on the date of valuation.
Short-term securities which mature in sixty days or less are valued at amortized cost, which approximates market value. Short-term securities which mature in more than sixty days are valued at current market quotations. The amortized cost method involves valuing a security at its cost on the date of purchase and thereafter assuming a constant amortization to maturity of the difference between the principal amount due at maturity and cost.
Financial Futures Contracts: A financial futures contract is an agreement to purchase (long) or sell (short) an agreed amount of securities at a set price for delivery on a future date. Upon entering into a financial futures contract, the Fund is required to pledge to the broker an amount of cash and/or other assets equal to a certain percentage of the contract amount. This amount is known as the “initial margin”. Subsequent payments, known as “variation margin”, are made or received by the Fund each day, depending on the daily fluctuations in the value of the underlying security. Such variation margin is recorded for financial statement purposes on a daily basis as unrealized gain or loss. When the contract expires or is closed, the gain or loss is realized and is presented in the Statement of Operations as net realized gain or loss on financial futures contracts.
The Fund invests in financial futures contracts in order to hedge its existing portfolio securities, or securities the Fund intends to purchase, against fluctuations in value caused by changes in prevailing interest rates or market conditions. Should interest rates move unexpectedly, the Fund may not achieve the anticipated benefits of the financial futures contracts and may realize a loss. The use of futures transactions involves the risk of imperfect correlation in movements in the price of futures contracts, interest rates and the underlying hedged assets.
Options: The Fund may either purchase or write options in order to hedge against adverse market movements or fluctuations in value caused by changes in prevailing interest rates with respect to securities which the Fund currently owns or intends to purchase. The Fund’s principal reason for writing options is to realize, through receipt of premiums, a greater current return than would be realized on the underlying
| | |
| Dryden Municipal Bond Fund | | 53 |
Notes to Financial Statements
Cont’d
security alone. When the Fund purchases an option, it pays a premium and an amount equal to that premium is recorded as an asset. When the Fund writes an option, it receives a premium and an amount equal to that premium is recorded as a liability. The asset or liability is adjusted daily to reflect the current market value of the option.
If an option expires unexercised, the Fund realizes a gain or loss to the extent of the premium received or paid. If an option is exercised, the premium received or paid is an adjustment to the proceeds from the sale or the cost of the purchase in determining whether the Fund has realized a gain or loss. The difference between the premium and the amount received or paid on effecting a closing purchase or sale transaction is also treated as a realized gain or loss. Gain or loss on purchased options is included in net realized gain or loss on investment transactions. Gain or loss on written options is presented separately as net realized gain or loss on written options.
The Fund, as writer of an option, has no control over whether the underlying securities may be sold (called) or purchased (put). As a result, the Fund bears the market risk of an unfavorable change in the price of the security underlying the written option. The Fund, as purchaser of an option that is traded in the over-the-counter market, bears the risk of the potential inability of the counterparties to meet the terms of their contracts.
Interest Rate Swap: The Fund may enter into interest rate swaps. In a simple interest rate swap, one investor pays a floating rate of interest on a notional amount and receives a fixed rate of interest on the same notional principal amount for a specified period of time. Alternatively, an investor may pay a fixed rate and receive a floating rate. Interest rate swaps were developed as asset/liability management tools. In more complex swaps, the notional principal may decline (or amortize) over time.
During the term of the swap, changes in the value of the swap are recorded as unrealized gains or losses by “marking-to-market” to reflect the market value of the swap. When the swap is terminated, the Fund will record a realized gain or loss equal to the difference between the proceeds from (or cost of) the closing transaction and the fund’s basis in the contract, if any.
The Fund is exposed to credit loss in the event of non-performance by the other party to the interest rate swap. However, the Fund does not anticipate non-performance by any counterparty.
| | |
| 54 | | Visit our website at www.jennisondryden.com |
Written options, future contracts and swap contracts involve elements of both market and credit risk in excess of the amounts reflected in the Statement of Assets and Liabilities.
Inverse Floaters: The Fund invests in variable rate securities commonly called “inverse floaters”. The interest rates on these securities have an inverse relationship to market interest rate of other securities or the value of an index. Changes in interest rates on the other security or index inversely affect the rate paid on the inverse floater, and the inverse floater’s price will be more volatile than that of a fixed-rate bond. Additionally, some of these securities contain a “leverage factor” whereby the interest rate moves inversely by a “factor” to the benchmark rate. Certain interest rate movements and other market factors can substantially affect the liquidity of inverse floating rate notes.
When-Issued/Delayed Delivery Securities: Securities purchased or sold on a when-issued or delayed-delivery basis may be settled a month or more after trade date; interest income is not accrued until settlement date. At the time a Fund enters into such transactions, it instructs the custodian to segregate assets with a current value at least equal to the amount of its when-issued or delayed-delivery purchase commitments.
Securities Transactions and Net Investment Income: Securities transactions are recorded on the trade date. Realized gains or losses on sales of investments are calculated on the identified cost basis. Interest income, including amortization of premium and accretion of discount on debt securities, as required, is recorded on the accrual basis as an adjustment to interest income.
Net investment income or loss (other than distribution fees, which are charged directly to the respective Class) and unrealized and realized gains or losses, are allocated daily to each class of shares based upon the relative proportion of net assets of each class at the beginning of the day.
Dividends and Distributions: The Fund declares daily dividends from the net investment income daily and distributions of net realized capital and currency gains, if any, annually. Dividends and distributions to shareholders, which are determined in accordance with federal income tax regulations and which may differ from generally accepted accounting principles, are recorded on the ex-dividend date. Permanent book/tax differences relating to income and gains are reclassified amongst undistributed net investment income, accumulated net realized gain or loss and paid in capital in excess of par, as appropriate.
| | |
| Dryden Municipal Bond Fund | | 55 |
Notes to Financial Statements
Cont’d
Federal Income Taxes: For federal income tax purposes, each Series in the Fund is treated as a separate taxpaying entity. It is the Fund’s policy to continue to meet the requirements of the Internal Revenue Code applicable to regulated investment companies and to distribute all of its taxable net income and capital gains, if any, to its shareholders. Therefore, no federal income tax provision is required.
Estimates: The preparation of the financial statements requires management to make estimates and assumptions that affect the reported amounts and disclosures in the financial statements. Actual results could differ from those estimates.
Note 2. Agreements
The Fund has a management agreement with PI. Pursuant to this agreement, PI has responsibility for all investment advisory services and supervises the subadviser’s performance of such services. PI has entered into a subadvisory agreement with Prudential Investment Management (“PIM”). The Subadvisory Agreement provides that PIM will furnish investment advisory services in connection with the management of the Fund. PI pays for the services of PIM, the cost of compensation of officers for the Fund, occupancy and certain clerical and bookkeeping cost of the Fund. The Fund bears all other costs and expenses.
The management fee paid PI is computed daily and payable monthly at an annual rate of .50 of 1% of the average daily net assets of each series up to $1 billion and .45 of 1% of the average daily net assets of each series in excess of $1 billion. The effective management fee rate was .50 of 1% of the High Income and Insured Series’ average daily net assets for the year ended April 30, 2005.
The Fund has a distribution agreement with Prudential Investment Management Services LLC (“PIMS”) which acts as the distributor of the Fund. The Fund compensates PIMS for distributing and servicing the Fund’s Class A, Class B and Class C shares, pursuant to plans of distribution (the “Class A, B and C Plans”), regardless of expenses actually incurred by it. The distribution fees are accrued daily and payable monthly. No distribution or service fees are paid to PIMS as distributor of the Class Z shares of the Fund.
Pursuant to the Class A, B and C Plans, the Fund compensates PIMS for distribution-related activities at an annual rate of up to .30 of 1%, .50 of 1% and 1%, of the average daily net assets of the Class A, B and C shares, respectively. PIMS
| | |
| 56 | | Visit our website at www.jennisondryden.com |
contractually agreed to limit such fees to .25 of 1% and .75 of 1% average daily net assets of the Class A shares and Class C shares, respectively.
PIMS has advised the High Income Series and Insured Series that it received approximately $146,400 and $74,600 for Class A shares, respectively, in front-end sales charges during the year ended April 30, 2005. From these fees, PIMS paid such sales charges to affiliated broker-dealers, which in turn paid commissions to salespersons and incurred other distribution costs.
PIMS has advised the High Income Series and Insured Series that for the year ended April 30, 2005, it received approximately $229,400 ($222,200-Class B; $7,200-Class C) and $99,700 ($98,000-Class B; $1,700-Class C), respectively, in contingent deferred sales charges imposed upon certain redemptions by Class B and C shareholders, respectively.
PI, PIMS and PIM are indirect wholly owned subsidiaries of Prudential Financial, Inc. (“Prudential”).
The Fund, along with other affiliated registered investment companies (the “Funds”), is a party to a syndicated credit agreement (“SCA”) with a group of banks. The SCA provided for a commitment of $500 million. Interest on any borrowings under the SCA would be incurred at market rates. The Funds paid a commitment fee of .08 of 1% of the unused portion of the SCA. The commitment fee is accrued daily and paid quarterly and is allocated to the Funds pro rata, based on net assets. The expiration date of the SCA was October 29, 2004. Effective October 29, 2004, the Funds entered into a revised credit agreement with two banks. The commitment under the revised SCA continues to be $500 million. The Funds pay a commitment fee of .075 of 1% of the unused portion of the SCA. The expiration of the revised SCA is October 28, 2005. The Fund did not borrow any amounts pursuant to the SCA during the year ended April 30, 2005.
Note 3. Other Transactions With Affiliates
Prudential Mutual Fund Services LLC (“PMFS”), an affiliate of PI and an indirect, wholly owned subsidiary of Prudential, serves as the Fund’s transfer agent. Transfer agent fees and expenses in the Statement of Operations also include certain out of pocket expenses paid to nonaffiliates.
The Fund pays networking fees to affiliated and unaffiliated broker/dealers, including fees relating to the services of Wachovia Securities, LLC (“Wachovia”) and First Clearing,
| | |
| Dryden Municipal Bond Fund | | 57 |
Notes to Financial Statements
Cont’d
LLC (“First Clearing”), affiliates of PI. These networking fees are payments made to broker/dealers that clear mutual fund transactions through a national clearing system. For the year ended April 30, 2005, the Fund incurred approximately $88,700 ($69,600 High Income Series; $19,100 Insured Series) in total networking fees. These amounts are included in transfer agent’s fees and expenses in the Statement of Operations.
For the year ended April 30, 2005, the Fund did not pay brokerage commissions to Wachovia or First Clearing.
Note 4. Portfolio Securities
Purchases and sales of portfolio securities, other than short-term investments, for the year ended April 30, 2005, were as follows:
| | | | |
Series
| | Purchases
| | Sales
|
| High Income | | $184,456,882 | | $291,239,804 |
| Insured | | $45,477,623 | | $87,148,005 |
Note 5. Distributions and Tax Information
In order to present undistributed net investment income or loss and accumulated net realized gains or losses on the Statement of Assets and Liabilities that more closely represent their tax character, certain adjustments have been made to paid-in-capital in excess of par, undistributed net investment income or loss and accumulated net realized gain or loss on investments.
For the year ended April 30, 2005, the adjustments were as follows:
| | | | | | |
Series
| | Paid in Capital in
Excess of Par
| | Undistributed
Net Investment Income
| | Accumulated
Net Realized Gain (Loss)
|
| High Income | | $(1,049,548) | | $584,309 | | $465,239 |
| Insured | | $(20,054) | | $(25,225) | | $45,279 |
These adjustments were primarily due to the difference in the treatment of accreting market discount between financial and tax reporting the sale of securities purchased with market discount, expired capital loss carryforward and certain other differences
| | |
| 58 | | Visit our website at www.jennisondryden.com |
between financial and tax reporting. Net investment income, net realized losses and net assets were not affected by this change.
The tax character of total dividends paid for the years ended are as follows:
| | | | | | |
| | | High Income
Series
| | Insured
Series
|
April 30, 2005 | | | | | | |
Tax-Exempt | | $ | 32,425,147 | | $ | 11,337,863 |
Ordinary Income | | | 697,371 | | | 59,178 |
Long-term Capital Gains | | | — | | | 3,231,378 |
| | |
|
| |
|
|
Total Dividends | | $ | 33,122,518 | | $ | 14,628,419 |
| | |
|
| |
|
|
April 30, 2004 | | | | | | |
Tax-Exempt | | $ | 38,169,475 | | $ | 12,548,980 |
Ordinary Income | | | 107,516 | | | 56,794 |
Long-term Capital Gains | | | — | | | 8,857,639 |
| | |
|
| |
|
|
Total Dividends | | $ | 38,276,991 | | $ | 21,463,413 |
| | |
|
| |
|
|
As of April 30, 2005, the components of distributable earnings on a tax basis were as follows:
| | | | | | |
Series
| | Tax-Exempt
| | Ordinary Income
| | Long-Term Capital Gains
|
| High Income | | $2,427,963 | | $232,428 | | — |
| Insured | | $588,167 | | — | | $136,784 |
These amounts include a dividends payable timing difference of $832,318 and $300,906 as of April 30, 2005 to the High Income Series and Insured Series, respectively.
The United States federal income tax basis of the Series’ investments and the net unrealized appreciation (depreciation) as of April 30, 2005 were as follows:
| | | | | | | | | | | | | |
Series
| | Tax Basis
| | Appreciation
| | (Depreciation)
| | | Net Unrealized Appreciation
|
| High Income | | $ | 623,045,630 | | $ | 35,745,094 | | $ | (32,770,743 | ) | | $ | 2,974,351 |
| Insured | | $ | 279,587,579 | | $ | 16,294,589 | | $ | (38,117 | ) | | $ | 16,256,472 |
The difference between book basis and tax basis was primarily attributable to deferred losses on wash sales and the differences in the treatment of premium amortization for book and tax purposes.
For federal income tax purposes, the High Income Series has a capital loss carryforward as of April 30, 2005 of approximately $47,661,000, of which $554,000
| | |
| Dryden Municipal Bond Fund | | 59 |
Notes to Financial Statements
Cont’d
expires in 2006, $3,137,000 expires in 2007, $5,906,000 expires in 2008, $20,095,000 expires in 2009, $13,512,000 expires in 2010 and $4,457,000 expires in 2011. Accordingly, no capital gains distributions are expected to be paid to shareholders until net gains have been realized in excess of such carryforwards. The tax basis differs from the amount on the Statement of Assets and Liabilities primarily due to differences in the treatment of discount and premium amortization for book and tax purposes. The High Income Series and Insured Series elected to treat post-October capital losses of approximately $3,146,500 and $4,400, respectively incurred in the six months ended April 30, 2005 as having incurred in the next fiscal year.
In addition, the High Income Series utilized approximately $2,175,000 of its capital loss carryforward to offset net taxable gains realized and approximately $1,050,000 of its capital loss carryforward expired in the fiscal year ended April 30, 2005.
Note 6. Capital
The High Income Series and Insured Series offer Class A, Class B, Class C and Class Z shares. Class A shares were sold with a front-end sales charge of up to 4%. All investors who purchase Class A shares in the amount of $1 million or more and sell these shares within 12 months of purchase are subject to a contingent deferred sales charge (CDSC) of 1%, including investors who purchase their shares through broker-dealers affiliated with Prudential. Class B shares are sold with a contingent deferred sales charge which declines from 5% to zero depending on the period of time the shares are held. Class C shares are sold with a contingent deferred sales charge of 1% during the first 12 months. Class B shares automatically convert to Class A shares on a quarterly basis approximately seven years after purchase. A special exchange privilege is also available for shareholders who qualify to purchase Class A shares at net asset value. Class Z shares are not subject to any sales or redemption charge and are offered exclusively for sale to a limited group of investors.
| | |
| 60 | | Visit our website at www.jennisondryden.com |
The Fund has authorized an unlimited number of shares of beneficial interest of each class at $.01 par value per share. Transactions in shares of beneficial interest were as follows:
| | | | | | | | | | | | | | |
| | | High Income Series
Class A
| | | Insured Series
Class A
| |
| | | Shares
| | | Amount
| | | Shares
| | | Amount
| |
Year Ended April 30, 2005: | | | | | | | | | | | | | | |
Shares sold | | 1,385,419 | | | | 14,021,188 | | | 778,046 | | | $ | 8,615,005 | |
Shares issued in reinvestment of dividends and distributions | | 1,099,579 | | | | 11,164,001 | | | 670,895 | | | | 7,366,574 | |
Shares reacquired | | (7,283,489 | ) | | | (73,874,672 | ) | | (3,456,633 | ) | | | (37,849,162 | ) |
| | |
|
| |
|
|
| |
|
| |
|
|
|
Net increase (decrease) in shares outstanding before conversion | | (4,798,491 | ) | | | (48,689,483 | ) | | (2,007,692 | ) | | | (21,867,583 | ) |
Shares issued upon conversion from Class B | | 3,536,976 | | | | 35,857,695 | | | 431,070 | | | | 4,722,888 | |
| | |
|
| |
|
|
| |
|
| |
|
|
|
Net increase (decrease) in shares outstanding | | (1,261,515 | ) | | $ | (12,831,788 | ) | | (1,576,622 | ) | | $ | (17,144,695 | ) |
| | |
|
| |
|
|
| |
|
| |
|
|
|
| | |
| | | High Income Series
Class A
| | | Insured Series Class A
| |
| | | Shares
| | | Amount
| | | Shares
| | | Amount
| |
Year Ended April 30, 2004: | | | | | | | | | | | | | | |
Shares sold | | 2,982,186 | | | $ | 30,011,088 | | | 2,366,060 | | | $ | 26,820,648 | |
Shares issued in reinvestment of dividends and distributions | | 1,135,503 | | | | 11,521,606 | | | 947,575 | | | | 10,712,511 | |
Shares reacquired | | (9,454,923 | ) | | | (95,529,854 | ) | | (4,417,356 | ) | | | (50,085,703 | ) |
| | |
|
| |
|
|
| |
|
| |
|
|
|
Net increase (decrease) in shares outstanding before conversion | | (5,337,234 | ) | | | (53,997,160 | ) | | (1,103,721 | ) | | | (12,552,544 | ) |
Shares issued upon conversion from Class B | | 2,484,594 | | | | 25,324,224 | | | 504,923 | | | | 5,847,494 | |
| | |
|
| |
|
|
| |
|
| |
|
|
|
Net increase (decrease) in shares outstanding | | (2,852,640 | ) | | $ | (28,672,936 | ) | | (598,798 | ) | | $ | (6,705,050 | ) |
| | |
|
| |
|
|
| |
|
| |
|
|
|
| | |
| | | High Income Series
Class B
| | | Insured Series
Class B
| |
| | | Shares
| | | Amount
| | | Shares
| | | Amount
| |
Year Ended April 30, 2005: | | | | | | | | | | | | | | |
Shares sold | | 550,724 | | | $ | 5,601,938 | | | 260,009 | | | $ | 2,860,840 | |
Shares issued in reinvestment of dividends and distributions | | 315,199 | | | | 3,196,834 | | | 123,998 | | | | 1,363,624 | |
Shares reacquired | | (2,865,056 | ) | | | (28,975,493 | ) | | (814,723 | ) | | | (8,926,398 | ) |
| | |
|
| |
|
|
| |
|
| |
|
|
|
Net increase (decrease) in shares outstanding before conversion | | (1,999,133 | ) | | | (20,176,721 | ) | | (430,716 | ) | | | (4,701,934 | ) |
Shares issued upon conversion into Class A | | (3,533,490 | ) | | | (35,857,695 | ) | | (430,465 | ) | | | (4,722,888 | ) |
| | |
|
| |
|
|
| |
|
| |
|
|
|
Net increase (decrease) in shares outstanding | | (5,532,623 | ) | | $ | (56,034,416 | ) | | (861,181 | ) | | $ | (9,424,822 | ) |
| | |
|
| |
|
|
| |
|
| |
|
|
|
| | |
| Dryden Municipal Bond Fund | | 61 |
Notes to Financial Statements
Cont’d
| | | | | | | | | | | | | | |
| | | High Income Series
Class B
| | | Insured Series
Class B
| |
| | | Shares
| | | Amount
| | | Shares
| | | Amount
| |
Year Ended April 30, 2004: | | | | | | | | | | | | | | |
Shares sold | | 890,244 | | | $ | 9,045,150 | | | 731,337 | | | $ | 8,360,381 | |
Shares issued in reinvestment of dividends and distributions | | 430,037 | | | | 4,363,278 | | | 192,647 | | | | 2,181,194 | |
Shares reacquired | | (3,450,421 | ) | | | (34,941,711 | ) | | (939,519 | ) | | | (10,655,967 | ) |
| | |
|
| |
|
|
| |
|
| |
|
|
|
Net increase (decrease) in shares outstanding before conversion | | (2,130,140 | ) | | | (21,533,283 | ) | | (15,535 | ) | | | (114,392 | ) |
Shares issued upon conversion into Class A | | (2,483,978 | ) | | | (25,324,224 | ) | | (504,418 | ) | | | (5,847,494 | ) |
| | |
|
| |
|
|
| |
|
| |
|
|
|
Net increase (decrease) in shares outstanding | | (4,614,118 | ) | | $ | (46,857,507 | ) | | (519,953 | ) | | $ | (5,961,886 | ) |
| | |
|
| |
|
|
| |
|
| |
|
|
|
| | |
| | | High Income Series
Class C
| | | Insured Series
Class C
| |
| | | Shares
| | | Amount
| | | Shares
| | | Amount
| |
Year Ended April 30, 2005: | | | | | | | | | | | | | | |
Shares sold | | 150,208 | | | $ | 1,534,352 | | | 135,601 | | | $ | 1,502,577 | |
Shares issued in reinvestment of dividends and distributions | | 58,491 | | | | 593,704 | | | 17,891 | | | | 196,735 | |
Shares reacquired | | (537,413 | ) | | | (5,453,703 | ) | | (167,243 | ) | | | (1,834,979 | ) |
| | |
|
| |
|
|
| |
|
| |
|
|
|
Net increase (decrease) in shares outstanding | | (328,714 | ) | | $ | (3,325,647 | ) | | (13,751 | ) | | $ | (135,667 | ) |
| | |
|
| |
|
|
| |
|
| |
|
|
|
| | |
| | | High Income Series
Class C
| | | Insured Series
Class C
| |
| | | Shares
| | | Amount
| | | Shares
| | | Amount
| |
Year Ended April 30, 2004: | | | | | | | | | | | | | | |
Shares sold | | 195,467 | | | $ | 1,984,234 | | | 114,819 | | | $ | 1,320,672 | |
Shares issued in reinvestment of dividends and distributions | | 67,249 | | | | 682,480 | | | 29,002 | | | | 328,359 | |
Shares reacquired | | (602,755 | ) | | | (6,102,370 | ) | | (173,459 | ) | | | (1,981,231 | ) |
| | |
|
| |
|
|
| |
|
| |
|
|
|
Net increase (decrease) in shares outstanding | | (340,039 | ) | | $ | (3,435,656 | ) | | (29,638 | ) | | $ | (332,200 | ) |
| | |
|
| |
|
|
| |
|
| |
|
|
|
| | |
| 62 | | Visit our website at www.jennisondryden.com |
| | | | | | | | | | | | | | |
| | |
| | | High Income Series
Class Z
| | | Insured Series
Class Z
| |
| | | Shares
| | | Amount
| | | Shares
| | | Amount
| |
Year Ended April 30, 2005: | | | | | | | | | | | | | | |
Shares sold | | 536,589 | | | $ | 5,429,255 | | | 42,683 | | | $ | 465,571 | |
Shares issued in reinvestment of dividends and distributions | | 47,658 | | | | 485,121 | | | 17,180 | | | | 188,521 | |
Shares reacquired | | (795,862 | ) | | | (7,971,431 | ) | | (224,936 | ) | | | (2,453,632 | ) |
| | |
|
| |
|
|
| |
|
| |
|
|
|
Net increase (decrease) in shares outstanding | | (211,615 | ) | | $ | (2,057,055 | ) | | (165,073 | ) | | $ | (1,799,540 | ) |
| | |
|
| |
|
|
| |
|
| |
|
|
|
| | |
| | | High Income Series
Class Z
| | | Insured Series
Class Z
| |
| | | Shares
| | | Amount
| | | Shares
| | | Amount
| |
Year Ended April 30, 2004: | | | | | | | | | | | | | | |
Shares sold | | 1,212,110 | | | $ | 12,275,195 | | | 255,063 | | | $ | 2,897,891 | |
Shares issued in reinvestment of dividends and distributions | | 52,458 | | | | 531,741 | | | 26,088 | | | | 294,948 | |
Shares reacquired | | (1,374,892 | ) | | | (13,886,454 | ) | | (492,160 | ) | | | (5,648,904 | ) |
| | |
|
| |
|
|
| |
|
| |
|
|
|
Net increase (decrease) in shares outstanding | | (110,324 | ) | | $ | (1,079,518 | ) | | (211,009 | ) | | $ | (2,456,065 | ) |
| | |
|
| |
|
|
| |
|
| |
|
|
|
| | |
| Dryden Municipal Bond Fund | | 63 |
Financial Highlights
High Income Series
| | | | |
| | | Class A
| |
| | | Year Ended
April 30, 2005 | |
Per Share Operating Performance: | | | | |
Net Asset Value, Beginning Of Year | | $ | 9.99 | |
| | |
|
|
|
Income from investment operations | | | | |
Net investment income | | | .51 | |
Net realized and unrealized gain (loss) on investment transactions | | | .35 | |
| | |
|
|
|
Total from investment operations | | | .86 | |
| | |
|
|
|
Less Dividends: | | | | |
Dividends from net investment income | | | (.52 | ) |
| | |
|
|
|
Net asset value, end of year | | $ | 10.33 | |
| | |
|
|
|
Total Return(a): | | | 8.81 | % |
Ratios/Supplemental Data: | | | | |
Net assets, end of year (000) | | $ | 459,598 | |
Average net assets (000) | | $ | 458,739 | |
Ratios to average net assets: | | | | |
Expenses, including distribution fees(c) | | | .86 | % |
Expenses, excluding distribution fees | | | .61 | % |
Net investment income | | | 5.03 | % |
For Class A, B, C and Z shares: | | | | |
Portfolio turnover rate | | | 29 | % |
| (a) | Total return does not consider the effects of sales loads. Total return is calculated assuming a purchase of shares on the first day and a sale on the last day of each year reported and includes reinvestment of dividends and distributions. |
| (b) | Effective May 1, 2001, the Dryden Municipal Bond Fund/High Income Series has adopted the provisions of the AICPA Audit and Accounting Guide for Investment Companies and began accreting market discount on debt securities. The effect of this change for the year ended April 30, 2002 was to increase net investment income per share by $.01, decrease net realized and unrealized gain (loss) per share by $.01 and increase the ratio of net investment income from 5.84% to 5.87%. Per share amounts and ratios for the years ended prior to April 30, 2002 have not been restated to reflect this change in presentation. |
| (c) | The distributor of the Fund contractually agreed to limit its distribution and service (12b-1) fees to .25 of 1% on the average daily net assets of the Class A shares. |
See Notes to Financial Statements.
| | |
| 64 | | Visit our website at www.jennisondryden.com |
| | | | | | | | | | | | | | |
| Class A | |
| Year Ended April 30, | |
| 2004 | | | 2003 | | | 2002(b) | | | 2001 | |
| | | | | | | | | | | | | | | |
| $ | 10.11 | | | $ | 10.06 | | | $ | 10.11 | | | $ | 10.22 | |
|
|
| |
|
|
| |
|
|
| |
|
|
|
| | | | | | | | | | | | | | | |
| | .53 | | | | .56 | | | | .61 | | | | .61 | |
| | (.12 | ) | | | .04 | | | | (.06 | ) | | | (.12 | ) |
|
|
| |
|
|
| |
|
|
| |
|
|
|
| | .41 | | | | .60 | | | | .55 | | | | .49 | |
|
|
| |
|
|
| |
|
|
| |
|
|
|
| | | | | | | | | | | | | | | |
| | (.53 | ) | | | (.55 | ) | | | (.60 | ) | | | (.60 | ) |
|
|
| |
|
|
| |
|
|
| |
|
|
|
| $ | 9.99 | | | $ | 10.11 | | | $ | 10.06 | | | $ | 10.11 | |
|
|
| |
|
|
| |
|
|
| |
|
|
|
| | 4.13 | % | | | 6.15 | % | | | 5.53 | % | | | 4.94 | % |
| | | | | | | | | | | | | | | |
| $ | 457,184 | | | $ | 491,218 | | | $ | 501,501 | | | $ | 522,556 | |
| $ | 479,691 | | | $ | 496,597 | | | $ | 517,930 | | | $ | 527,117 | |
| | | | | | | | | | | | | | | |
| | .87 | % | | | .85 | % | | | .84 | % | | | .84 | % |
| | .62 | % | | | .60 | % | | | .59 | % | | | .59 | % |
| | 5.25 | % | | | 5.53 | % | | | 5.87 | % | | | 6.05 | % |
| | | | | | | | | | | | | | | |
| | 89 | % | | | 88 | % | | | 58 | % | | | 46 | % |
See Notes to Financial Statements.
| | |
| Dryden Municipal Bond Fund/High Income Series | | 65 |
Financial Highlights
Cont’d
| | | | |
| | | Class B
| |
| | | Year Ended
April 30, 2005 | |
Per Share Operating Performance: | | | | |
Net Asset Value, Beginning Of Year | | $ | 10.00 | |
| | |
|
|
|
Income from investment operations | | | | |
Net investment income | | | .49 | |
Net realized and unrealized gain (loss) on investment transactions | | | .34 | |
| | |
|
|
|
Total from investment operations | | | .83 | |
| | |
|
|
|
Less Dividends: | | | | |
Dividends from net investment income | | | (.49 | ) |
| | |
|
|
|
Net asset value, end of year | | $ | 10.34 | |
| | |
|
|
|
Total Return(a): | | | 8.53 | % |
Ratios/Supplemental Data: | | | | |
Net assets, end of year (000) | | $ | 141,832 | |
Average net assets (000) | | $ | 165,596 | |
Ratios to average net assets: | | | | |
Expenses, including distribution fees | | | 1.11 | % |
Expenses, excluding distribution fees | | | .61 | % |
Net investment income | | | 4.78 | % |
| (a) | Total return does not consider the effects of sales loads. Total return is calculated assuming a purchase of shares on the first day and a sale on the last day of each year reported and includes reinvestment of dividends and distributions. |
| (b) | Effective May 1, 2001, the Dryden Municipal Bond Fund/High Income Series has adopted the provisions of the AICPA Audit and Accounting Guide for Investment Companies and began accreting market discount on debt securities. The effect of this change for the year ended April 30, 2002 was to increase net investment income and decrease net realized and unrealized gain (loss) per share by less than $.005 and increase the ratio of net investment income from 5.59% to 5.62%. Per share amounts and ratios for the years ended prior to April 30, 2002 have not been restated to reflect this change in presentation. |
See Notes to Financial Statements.
| | |
| 66 | | Visit our website at www.jennisondryden.com |
| | | | | | | | | | | | | | |
| Class B | |
| Year Ended April 30, | |
| 2004 | | | 2003 | | | 2002(b) | | | 2001 | |
| | | | | | | | | | | | | | | |
| $ | 10.11 | | | $ | 10.06 | | | $ | 10.11 | | | $ | 10.22 | |
|
|
| |
|
|
| |
|
|
| |
|
|
|
| | | | | | | | | | | | | | | |
| | .51 | | | | .54 | | | | .58 | | | | .59 | |
| | (.12 | ) | | | .04 | | | | (.06 | ) | | | (.13 | ) |
|
|
| |
|
|
| |
|
|
| |
|
|
|
| | .39 | | | | .58 | | | | .52 | | | | .46 | |
|
|
| |
|
|
| |
|
|
| |
|
|
|
| | | | | | | | | | | | | | | |
| | (.50 | ) | | | (.53 | ) | | | (.57 | ) | | | (.57 | ) |
|
|
| |
|
|
| |
|
|
| |
|
|
|
| $ | 10.00 | | | $ | 10.11 | | | $ | 10.06 | | | $ | 10.11 | |
|
|
| |
|
|
| |
|
|
| |
|
|
|
| | 3.95 | % | | | 5.88 | % | | | 5.27 | % | | | 4.68 | % |
| | | | | | | | | | | | | | | |
| $ | 192,517 | | | $ | 241,311 | | | $ | 285,581 | | | $ | 324,299 | |
| $ | 219,376 | | | $ | 264,067 | | | $ | 307,192 | | | $ | 375,632 | |
| | | | | | | | | | | | | | | |
| | 1.12 | % | | | 1.10 | % | | | 1.09 | % | | | 1.09 | % |
| | .62 | % | | | .60 | % | | | .59 | % | | | .59 | % |
| | 5.00 | % | | | 5.31 | % | | | 5.62 | % | | | 5.78 | % |
See Notes to Financial Statements.
| | |
| Dryden Municipal Bond Fund/High Income Series | | 67 |
Financial Highlights
Cont’d
| | | | |
| | | Class C
| |
| | | Year Ended
April 30, 2005 | |
Per Share Operating Performance: | | | | |
Net Asset Value, Beginning Of Year | | $ | 10.00 | |
| | |
|
|
|
Income from investment operations | | | | |
Net investment income | | | .46 | |
Net realized and unrealized gain (loss) on investment transactions | | | .35 | |
| | |
|
|
|
Total from investment operations | | | .81 | |
| | |
|
|
|
Less Dividends: | | | | |
Dividends from net investment income | | | (.47 | ) |
| | |
|
|
|
Net asset value, end of year | | $ | 10.34 | |
| | |
|
|
|
Total Return(a): | | | 8.26 | % |
Ratios/Supplemental Data: | | | | |
Net assets, end of year (000) | | $ | 22,033 | |
Average net assets (000) | | $ | 23,042 | |
Ratios to average net assets: | | | | |
Expenses, including distribution fees(c) | | | 1.36 | % |
Expenses, excluding distribution fees | | | .61 | % |
Net investment income | | | 4.53 | % |
| (a) | Total return does not consider the effects of sales loads. Total return is calculated assuming a purchase of shares on the first day and a sale on the last day of each year reported and includes reinvestment of dividends and distributions. |
| (b) | Effective May 1, 2001, the Dryden Municipal Bond Fund/High Income Series has adopted the provisions of the AICPA Audit and Accounting Guide for Investment Companies and began accreting market discount on debt securities. The effect of this change for the year ended April 30, 2002 was to increase net investment income and decrease net realized and unrealized gain (loss) per share by less than $.005 and increase the ratio of net investment income from 5.35% to 5.38%. Per share amounts and ratios for the years ended prior to April 30, 2002 have not been restated to reflect this change in presentation. |
| (c) | The distributor of the Fund contractually agreed to limit its distribution and service (12b-1) fees to .75 of 1% on the average daily net assets of the Class C shares. |
See Notes to Financial Statements.
| | |
| 68 | | Visit our website at www.jennisondryden.com |
| | | | | | | | | | | | | | |
| Class C | |
| Year Ended April 30, | |
| 2004 | | | 2003 | | | 2002(b) | | | 2001 | |
| | | | | | | | | | | | | | | |
| $ | 10.11 | | | $ | 10.06 | | | $ | 10.11 | | | $ | 10.22 | |
|
|
| |
|
|
| |
|
|
| |
|
|
|
| | | | | | | | | | | | | | | |
| | .48 | | | | .51 | | | | .55 | | | | .56 | |
| | (.11 | ) | | | .04 | | | | (.05 | ) | | | (.12 | ) |
|
|
| |
|
|
| |
|
|
| |
|
|
|
| | .37 | | | | .55 | | | | .50 | | | | .44 | |
|
|
| |
|
|
| |
|
|
| |
|
|
|
| | | | | | | | | | | | | | | |
| | (.48 | ) | | | (.50 | ) | | | (.55 | ) | | | (.55 | ) |
|
|
| |
|
|
| |
|
|
| |
|
|
|
| $ | 10.00 | | | $ | 10.11 | | | $ | 10.06 | | | $ | 10.11 | |
|
|
| |
|
|
| |
|
|
| |
|
|
|
| | 3.69 | % | | | 5.62 | % | | | 5.00 | % | | | 4.42 | % |
| | | | | | | | | | | | | | | |
| $ | 24,599 | | | $ | 28,313 | | | $ | 26,619 | | | $ | 27,263 | |
| $ | 26,968 | | | $ | 27,121 | | | $ | 27,814 | | | $ | 28,028 | |
| | | | | | | | | | | | | | | |
| | 1.37 | % | | | 1.35 | % | | | 1.34 | % | | | 1.34 | % |
| | .62 | % | | | .60 | % | | | .59 | % | | | .59 | % |
| | 4.75 | % | | | 5.04 | % | | | 5.38 | % | | | 5.55 | % |
See Notes to Financial Statements.
| | |
| Dryden Municipal Bond Fund/High Income Series | | 69 |
Financial Highlights
Cont’d
| | | | |
| | | Class Z
| |
| | | Year Ended
April 30, 2005 | |
Per Share Operating Performance: | | | | |
Net Asset Value, Beginning Of Year | | $ | 9.98 | |
| | |
|
|
|
Income from investment operations | | | | |
Net investment income | | | .54 | |
Net realized and unrealized gain (loss) on investment transactions | | | .34 | |
| | |
|
|
|
Total from investment operations | | | .88 | |
| | |
|
|
|
Less Dividends: | | | | |
Dividends from net investment income | | | (.54 | ) |
| | |
|
|
|
Net asset value, end of year | | $ | 10.32 | |
| | |
|
|
|
Total Return(a): | | | 9.09 | % |
Ratios/Supplemental Data: | | | | |
Net assets, end of year (000) | | $ | 12,379 | |
Average net assets (000) | | $ | 11,451 | |
Ratios to average net assets: | | | | |
Expenses, including distribution fees | | | .61 | % |
Expenses, excluding distribution fees | | | .61 | % |
Net investment income | | | 5.29 | % |
| (a) | Total return is calculated assuming a purchase of shares on the first day and a sale on the last day of each year reported and includes reinvestment of dividends and distributions. |
| (b) | Effective May 1, 2001, the Dryden Municipal Bond Fund/High Income Series has adopted the provisions of the AICPA Audit and Accounting Guide for Investment Companies and began accreting market discount on debt securities. The effect of this change for the year ended April 30, 2002 was to increase net investment income per share by $.01 and decrease net realized and unrealized gain (loss) per share by $.01 and increase the ratio of net investment income from 6.11% to 6.14%. Per share amounts and ratios for the years ended prior to April 30, 2002 have not been restated to reflect this change in presentation. |
See Notes to Financial Statements.
| | |
| 70 | | Visit our website at www.jennisondryden.com |
| | | | | | | | | | | | | | |
| Class Z | |
| Year Ended April 30, | |
| 2004 | | | 2003 | | | 2002(b) | | | 2001 | |
| | | | | | | | | | | | | | | |
| $ | 10.10 | | | $ | 10.05 | | | $ | 10.10 | | | $ | 10.21 | |
|
|
| |
|
|
| |
|
|
| |
|
|
|
| | | | | | | | | | | | | | | |
| | .56 | | | | .59 | | | | .63 | | | | .64 | |
| | (.12 | ) | | | .04 | | | | (.06 | ) | | | (.13 | ) |
|
|
| |
|
|
| |
|
|
| |
|
|
|
| | .44 | | | | .63 | | | | .57 | | | | .51 | |
|
|
| |
|
|
| |
|
|
| |
|
|
|
| | | | | | | | | | | | | | | |
| | (.56 | ) | | | (.58 | ) | | | (.62 | ) | | | (.62 | ) |
|
|
| |
|
|
| |
|
|
| |
|
|
|
| $ | 9.98 | | | $ | 10.10 | | | $ | 10.05 | | | $ | 10.10 | |
|
|
| |
|
|
| |
|
|
| |
|
|
|
| | 4.41 | % | | | 6.41 | % | | | 5.79 | % | | | 5.19 | % |
| | | | | | | | | | | | | | | |
| $ | 14,087 | | | $ | 15,361 | | | $ | 7,000 | | | $ | 5,966 | |
| $ | 15,572 | | | $ | 10,813 | | | $ | 6,368 | | | $ | 7,182 | |
| | | | | | | | | | | | | | | |
| | .62 | % | | | .60 | % | | | .59 | % | | | .59 | % |
| | .62 | % | | | .60 | % | | | .59 | % | | | .59 | % |
| | 5.51 | % | | | 5.78 | % | | | 6.14 | % | | | 6.32 | % |
See Notes to Financial Statements.
| | |
| Dryden Municipal Bond Fund/High Income Series | | 71 |
Financial Highlights
Insured Series
| | | | |
| | | Class A
| |
| | | Year Ended
April 30, 2005 | |
Per Share Operating Performance: | | | | |
Net Asset Value, Beginning Of Year | | $ | 10.90 | |
| | |
|
|
|
Income from investment operations | | | | |
Net investment income | | | .41 | |
Net realized and unrealized gain (loss) on investment transactions | | | .20 | |
| | |
|
|
|
Total from investment operations | | | .61 | |
| | |
|
|
|
Less dividends and distributions: | | | | |
Dividends from net investment income | | | (.41 | ) |
Distributions from net realized capital gains | | | (.12 | ) |
| | |
|
|
|
Total dividends and distributions | | | (.53 | ) |
| | |
|
|
|
Net asset value, end of year | | $ | 10.98 | |
| | |
|
|
|
Total Return(a): | | | 5.74 | % |
Ratios/Supplemental Data: | | | | |
Net assets, end of year (000) | | $ | 242,325 | |
Average net assets (000) | | $ | 249,074 | |
Ratios to average net assets: | | | | |
Expenses, including distribution and service (12b-1) fees(c) | | | .91 | % |
Expenses, excluding distribution and service (12b-1) fees | | | .66 | % |
Net investment income | | | 3.72 | % |
For Class A, B, C and Z shares: | | | | |
Portfolio turnover rate | | | 15 | % |
| (a) | Total return does not consider the effects of sales loads. Total return is calculated assuming a purchase of shares on the first day and a sale on the last day of each year reported and includes reinvestment of dividends and distributions. |
| (b) | Effective May 1, 2001, the Dryden Municipal Bond Fund/Insured Series has adopted the provisions of the AICPA Audit and Accounting Guide for Investment Companies and began accreting market discount on debt securities. The effect of this change for the year ended April 30, 2002 was to increase net investment income and to decrease net realized and unrealized gains per share by less than $.005 and increase the ratio of net investment income from 4.62% to 4.64%. Per share amounts and ratios for the years ended prior to April 30, 2002 have not been restated to reflect this change in presentation. |
| (c) | The distributor of the Fund contractually agreed to limit its distribution and service (12b-1) fees to .25 of 1% on the average daily net assets of the Class A shares. |
See Notes to Financial Statements.
| | |
| 72 | | Visit our website at www.jennisondryden.com |
| | | | | | | | | | | | | | |
| Class A | |
| Year Ended April 30, | |
| 2004 | | | 2003 | | | 2002(b) | | | 2001 | |
| | | | | | | | | | | | | | | |
| $ | 11.59 | | | $ | 11.08 | | | $ | 10.91 | | | $ | 10.40 | |
|
|
| |
|
|
| |
|
|
| |
|
|
|
| | | | | | | | | | | | | | | |
| | .42 | | | | .49 | | | | .52 | | | | .51 | |
| | (.39 | ) | | | .51 | | | | .17 | | | | .51 | |
|
|
| |
|
|
| |
|
|
| |
|
|
|
| | .03 | | | | 1.00 | | | | .69 | | | | 1.02 | |
|
|
| |
|
|
| |
|
|
| |
|
|
|
| | | | | | | | | | | | | | | |
| | (.42 | ) | | | (.49 | ) | | | (.52 | ) | | | (.51 | ) |
| | (.30 | ) | | | 0.00 | | | | 0.00 | | | | 0.00 | |
|
|
| |
|
|
| |
|
|
| |
|
|
|
| | (.72 | ) | | | (.49 | ) | | | (.52 | ) | | | (.51 | ) |
|
|
| |
|
|
| |
|
|
| |
|
|
|
| $ | 10.90 | | | $ | 11.59 | | | $ | 11.08 | | | $ | 10.91 | |
|
|
| |
|
|
| |
|
|
| |
|
|
|
| | .13 | % | | | 9.17 | % | | | 6.38 | % | | | 9.90 | % |
| | | | | | | | | | | | | | | |
| $ | 257,738 | | | $ | 281,077 | | | $ | 261,227 | | | $ | 265,718 | |
| $ | 271,328 | | | $ | 272,608 | | | $ | 269,146 | | | $ | 254,718 | |
| | | | | | | | | | | | | | | |
| | .90 | % | | | .88 | % | | | .87 | % | | | .89 | % |
| | .65 | % | | | .63 | % | | | .62 | % | | | .64 | % |
| | 3.72 | % | | | 4.35 | % | | | 4.64 | % | | | 4.72 | % |
| | | | | | | | | | | | | | | |
| | 71 | % | | | 59 | % | | | 22 | % | | | 38 | % |
See Notes to Financial Statements.
| | |
| Dryden Municipal Bond Fund/Insured Series | | 73 |
Financial Highlights
Cont’d
| | | | |
| | | Class B
| |
| | | Year Ended
April 30, 2005 | |
Per Share Operating Performance: | | | | |
Net Asset Value, Beginning Of Year | | $ | 10.91 | |
| | |
|
|
|
Income from investment operations | | | | |
Net investment income | | | .38 | |
Net realized and unrealized gain (loss) on investment transactions | | | .20 | |
| | |
|
|
|
Total from investment operations | | | .58 | |
| | |
|
|
|
Less dividends and distributions: | | | | |
Dividends from net investment income | | | (.38 | ) |
Distributions from net realized capital gains | | | (.12 | ) |
| | |
|
|
|
Total dividends and distributions | | | (.50 | ) |
| | |
|
|
|
Net asset value, end of year | | $ | 10.99 | |
| | |
|
|
|
Total Return(a): | | | 5.45 | % |
Ratios/Supplemental Data: | | | | |
Net assets, end of year (000) | | $ | 42,363 | |
Average net assets (000) | | $ | 48,258 | |
Ratios to average net assets: | | | | |
Expenses, including distribution and service (12b-1) fees | | | 1.16 | % |
Expenses, excluding distribution and service (12b-1) fees | | | .66 | % |
Net investment income | | | 3.46 | % |
| (a) | Total return does not consider the effects of sales loads. Total return is calculated assuming a purchase of shares on the first day and a sale on the last day of each year reported and includes reinvestment of dividends and distributions. |
| (b) | Effective May 1, 2001, the Dryden Municipal Bond Fund/Insured Series has adopted the provisions of the AICPA Audit and Accounting Guide for Investment Companies and began accreting market discount on debt securities. The effect of this change for the year ended April 30, 2002 was to increase net investment income and decrease net realized and unrealized gains per share by less than $.005 and increase the ratio of net investment income from 4.38% to 4.40%. Per share amounts and ratios for the years ended prior to April 30, 2002 have not been restated to reflect this change in presentation. |
See Notes to Financial Statements.
| | |
| 74 | | Visit our website at www.jennisondryden.com |
| | | | | | | | | | | | | | |
| Class B | |
| Year Ended April 30, | |
| 2004 | | | 2003 | | | 2002(b) | | | 2001 | |
| | | | | | | | | | | | | | | |
| $ | 11.60 | | | $ | 11.09 | | | $ | 10.92 | | | $ | 10.41 | |
|
|
| |
|
|
| |
|
|
| |
|
|
|
| | | | | | | | | | | | | | | |
| | .40 | | | | .47 | | | | .49 | | | | .48 | |
| | (.40 | ) | | | .50 | | | | .17 | | | | .51 | |
|
|
| |
|
|
| |
|
|
| |
|
|
|
| | — | | | | .97 | | | | .66 | | | | .99 | |
|
|
| |
|
|
| |
|
|
| |
|
|
|
| | | | | | | | | | | | | | | |
| | (.39 | ) | | | (.46 | ) | | | (.49 | ) | | | (.48 | ) |
| | (.30 | ) | | | — | | | | — | | | | — | |
|
|
| |
|
|
| |
|
|
| |
|
|
|
| | (.69 | ) | | | (.46 | ) | | | (.49 | ) | | | (.48 | ) |
|
|
| |
|
|
| |
|
|
| |
|
|
|
| $ | 10.91 | | | $ | 11.60 | | | $ | 11.09 | | | $ | 10.92 | |
|
|
| |
|
|
| |
|
|
| |
|
|
|
| | (.14 | )% | | | 8.90 | % | | | 6.12 | % | | | 9.63 | % |
| | | | | | | | | | | | | | | |
| $ | 51,432 | | | $ | 60,724 | | | $ | 55,145 | | | $ | 55,459 | |
| $ | 56,466 | | | $ | 58,003 | | | $ | 54,136 | | | $ | 70,084 | |
| | | | | | | | | | | | | | | |
| | 1.15 | % | | | 1.13 | % | | | 1.12 | % | | | 1.14 | % |
| | .65 | % | | | .63 | % | | | .62 | % | | | .64 | % |
| | 3.47 | % | | | 4.10 | % | | | 4.40 | % | | | 4.48 | % |
See Notes to Financial Statements.
| | |
| Dryden Municipal Bond Fund/Insured Series | | 75 |
Financial Highlights
Cont’d
| | | | |
| | | Class C
| |
| | | Year Ended
April 30, 2005 | |
Per Share Operating Performance: | | | | |
Net Asset Value, Beginning Of Year | | $ | 10.91 | |
| | |
|
|
|
Income from investment operations | | | | |
Net investment income | | | .35 | |
Net realized and unrealized gain (loss) on investment transactions | | | .20 | |
| | |
|
|
|
Total from investment operations | | | .55 | |
| | |
|
|
|
Less dividends and distributions: | | | | |
Dividends from net investment income | | | (.35 | ) |
Distributions from net realized capital gains | | | (.12 | ) |
| | |
|
|
|
Total dividends and distributions | | | (.47 | ) |
| | |
|
|
|
Net asset value, end of year | | $ | 10.99 | |
| | |
|
|
|
Total Return(a): | | | 5.18 | % |
Ratios/Supplemental Data: | | | | |
Net assets, end of year (000) | | $ | 7,538 | |
Average net assets (000) | | $ | 7,706 | |
Ratios to average net assets: | | | | |
Expenses, including distribution and service (12b-1) fees(c) | | | 1.41 | % |
Expenses, excluding distribution and service (12b-1) fees | | | .66 | % |
Net investment income | | | 3.22 | % |
| (a) | Total return does not consider the effects of sales loads. Total return is calculated assuming a purchase of shares on the first day and a sale on the last day of each year reported and includes reinvestment of dividends and distributions. |
| (b) | Effective May 1, 2001, the Dryden Municipal Bond Fund/Insured Series has adopted the provisions of the AICPA Audit and Accounting Guide for Investment Companies and began accreting market discount on debt securities. The effect of this change for the year ended April 30, 2002 was to increase net investment income per share by $.01, decrease net realized and unrealized gains per share by $.01 and increase the ratio of net investment income from 4.14% to 4.17%. Per share amounts and ratios for the years ended prior to April 30, 2002 have not been restated to reflect this change in presentation. |
| (c) | The distributor of the Fund contractually agreed to limit its distribution and service (12b-1) fees to .75 of 1% on the average daily net assets of the Class C shares. |
See Notes to Financial Statements.
| | |
| 76 | | Visit our website at www.jennisondryden.com |
| | | | | | | | | | | | | | |
| Class C | |
| Year Ended April 30, | |
| 2004 | | | 2003 | | | 2002(b) | | | 2001 | |
| | | | | | | | | | | | | | | |
| $ | 11.60 | | | $ | 11.09 | | | $ | 10.92 | | | $ | 10.41 | |
|
|
| |
|
|
| |
|
|
| |
|
|
|
| | | | | | | | | | | | | | | |
| | .37 | | | | .44 | | | | .47 | | | | .45 | |
| | (.40 | ) | | | .50 | | | | .16 | | | | .51 | |
|
|
| |
|
|
| |
|
|
| |
|
|
|
| | (0.03 | ) | | | .94 | | | | .63 | | | | .96 | |
|
|
| |
|
|
| |
|
|
| |
|
|
|
| | | | | | | | | | | | | | | |
| | (.36 | ) | | | (.43 | ) | | | (.46 | ) | | | (.45 | ) |
| | (.30 | ) | | | 0.00 | | | | 0.00 | | | | 0.00 | |
|
|
| |
|
|
| |
|
|
| |
|
|
|
| | (.66 | ) | | | (.43 | ) | | | (.46 | ) | | | (.45 | ) |
|
|
| |
|
|
| |
|
|
| |
|
|
|
| $ | 10.91 | | | $ | 11.60 | | | $ | 11.09 | | | $ | 10.92 | |
|
|
| |
|
|
| |
|
|
| |
|
|
|
| | (.39 | )% | | | 8.63 | % | | | 5.86 | % | | | 9.37 | % |
| | | | | | | | | | | | | | | |
| $ | 7,629 | | | $ | 8,457 | | | $ | 6,456 | | | $ | 4,085 | |
| $ | 8,329 | | | $ | 7,559 | | | $ | 5,320 | | | $ | 3,413 | |
| | | | | | | | | | | | | | | |
| | 1.40 | % | | | 1.38 | % | | | 1.37 | % | | | 1.39 | % |
| | .65 | % | | | .63 | % | | | .62 | % | | | .64 | % |
| | 3.21 | % | | | 3.85 | % | | | 4.17 | % | | | 4.23 | % |
See Notes to Financial Statements.
| | |
| Dryden Municipal Bond Fund/Insured Income | | 77 |
Financial Highlights
Cont’d
| | | | |
| | | Class Z
| |
| | | Year Ended
April 30, 2005 | |
Per Share Operating Performance: | | | | |
Net Asset Value, Beginning Of Year | | $ | 10.89 | |
| | |
|
|
|
Income from investment operations | | | | |
Net investment income | | | .44 | |
Net realized and unrealized gain (loss) on investment transactions | | | .19 | |
| | |
|
|
|
Total from investment operations | | | .63 | |
| | |
|
|
|
Less dividends and distributions: | | | | |
Dividends from net investment income | | | (.44 | ) |
Distributions from net realized capital gains | | | (.12 | ) |
| | |
|
|
|
Total dividends and distributions | | | (.56 | ) |
| | |
|
|
|
Net asset value, end of year | | $ | 10.96 | |
| | |
|
|
|
Total Return(a): | | | 5.94 | % |
Ratios/Supplemental Data: | | | | |
Net assets, end of year (000) | | $ | 4,565 | |
Average net assets (000) | | $ | 5,265 | |
Ratios to average net assets: | | | | |
Expenses, including distribution and service (12b-1) fees | | | .66 | % |
Expenses, excluding distribution and service (12b-1) fees | | | .66 | % |
Net investment income | | | 3.96 | % |
| (a) | Total return is calculated assuming a purchase of shares on the first day and a sale on the last day of each year reported and includes reinvestment of dividends and distributions. |
| (b) | Effective May 1, 2001, the Dryden Municipal Bond Fund/Insured Series has adopted the provisions of the AICPA Audit and Accounting Guide for Investment Companies and began accreting market discount on debt securities. The effect of this change for the year ended April 30, 2002 was to increase net investment income per share by $.01, decrease net realized and unrealized gains per share by $.01 and increase the ratio of net investment income from 4.88% to 4.91%. Per share amounts and ratios for the years ended prior to April 30, 2002 have not been restated to reflect this change in presentation. |
See Notes to Financial Statements.
| | |
| 78 | | Visit our website at www.jennisondryden.com |
| | | | | | | | | | | | | | |
| Class Z | |
| Year Ended April 30, | |
| 2004 | | | 2003 | | | 2002(b) | | | 2001 | |
| | | | | | | | | | | | | | | |
| $ | 11.58 | | | $ | 11.07 | | | $ | 10.91 | | | $ | 10.40 | |
|
|
| |
|
|
| |
|
|
| |
|
|
|
| | | | | | | | | | | | | | | |
| | .45 | | | | .52 | | | | .55 | | | | .53 | |
| | (.39 | ) | | | .50 | | | | .15 | | | | .51 | |
|
|
| |
|
|
| |
|
|
| |
|
|
|
| | .06 | | | | 1.02 | | | | .70 | | | | 1.04 | |
|
|
| |
|
|
| |
|
|
| |
|
|
|
| | | | | | | | | | | | | | | |
| | (.45 | ) | | | (.51 | ) | | | (.54 | ) | | | (.53 | ) |
| | (.30 | ) | | | — | | | | — | | | | — | |
|
|
| |
|
|
| |
|
|
| |
|
|
|
| | (.75 | ) | | | (.51 | ) | | | (.54 | ) | | | (.53 | ) |
|
|
| |
|
|
| |
|
|
| |
|
|
|
| $ | 10.89 | | | $ | 11.58 | | | $ | 11.07 | | | $ | 10.91 | |
|
|
| |
|
|
| |
|
|
| |
|
|
|
| | .40 | % | | | 9.45 | % | | | 6.55 | % | | | 10.17 | % |
| | | | | | | | | | | | | | | |
| $ | 6,330 | | | $ | 9,179 | | | $ | 4,238 | | | $ | 2,182 | |
| $ | 7,365 | | | $ | 6,605 | | | $ | 3,152 | | | $ | 1,993 | |
| | | | | | | | | | | | | | | |
| | .65 | % | | | .63 | % | | | .62 | % | | | .64 | % |
| | .65 | % | | | .63 | % | | | .62 | % | | | .64 | % |
| | 3.98 | % | | | 4.61 | % | | | 4.91 | % | | | 4.99 | % |
See Notes to Financial Statements.
| | |
| Dryden Municipal Bond Fund/Insured Series | | 79 |
Report of Independent Registered Public Accounting Firm
The Board of Trustees and Shareholders of
Dryden Municipal Bond Fund:
We have audited the accompanying statements of assets and liabilities of the High Income Series and Insured Series (constituting the Dryden Municipal Bond Fund, formerly the Prudential Municipal Bond Fund, hereafter referred to as the “Fund”) including the portfolios of investments, as of April 30, 2005, and the related statements of operations for the year then ended and the statements of changes in net assets, and the financial highlights for each of years in the two year period then ended. These financial statements and financial highlights are the responsibility of the Fund’s management. Our responsibility is to express an opinion on these financial statements and financial highlights based on our audits. The financial highlights for the periods presented prior to April 30, 2004, were audited by another independent registered public accounting firm, whose report dated, June 23, 2003, expressed an unqualified opinion thereon.
We conducted our audits in accordance with the standards of the Public Accounting Oversight Board (United States). Those standards require that we plan and perform the audit to obtain reasonable assurance about whether the financial statements and financial highlights are free of material misstatement. An audit includes examining, on a test basis, evidence supporting the amounts and disclosures in the financial statements. Our procedures included confirmation of securities owned as of April 30, 2005, by correspondence with the custodian and brokers. As to securities purchased or sold but not yet received or delivered, we performed other appropriate auditing procedures. An audit also includes assessing the accounting principles used and significant estimates made by management, as well as evaluating the overall financial statement presentation. We believe that our audits provide a reasonable basis for our opinion.
In our opinion, the financial statements and financial highlights referred to above present fairly, in all material respects, the financial position of the Dryden Municipal Bond Fund as of April 30, 2005 and the results of its operations for the year then ended, and the changes in its net assets, and the financial highlights for each of the years in the two year period then ended in conformity with accounting principles generally accepted in the United States of America.

New York, New York
June 27, 2005
| | |
| 80 | | Visit our website at www.jennisondryden.com |
Tax Information
(Unaudited)
As required by the Internal Revenue Code, we wish to advise you as to the federal tax status of dividends and distributions paid by the Fund during its fiscal year ended April 30, 2005.
During its fiscal year ended April 30, 2005, the Fund paid aggregate dividends and distributions as follows:
| | | | | | | | | | | | |
| | | Dividends and Distributions per share
|
Series
| | Class A
| | Class B
| | Class C
| | Class Z
|
High Income | | | | | | | | | | | | |
| | | | |
Tax-Exempt Income | | $ | 0.508 | | $ | 0.483 | | $ | 0.457 | | $ | 0.533 |
Ordinary Income | | | 0.011 | | | 0.011 | | | 0.010 | | | 0.011 |
Long-Term Capital Gains | | | — | | | — | | | — | | | — |
| | |
|
| |
|
| |
|
| |
|
|
| | | $ | 0.519 | | $ | 0.494 | | $ | 0.467 | | $ | 0.544 |
| | |
|
| |
|
| |
|
| |
|
|
| | | | | | | | | | | | |
| | | Dividends and Distributions per share
|
Series
| | Class A
| | Class B
| | Class C
| | Class Z
|
Insured | | | | | | | | | | | | |
| | | | |
Tax-Exempt Income | | $ | 0.407 | | $ | 0.380 | | $ | 0.352 | | $ | 0.434 |
Ordinary Income | | | 0.003 | | | — | | | — | | | 0.006 |
Long-Term Capital Gains | | | 0.115 | | | 0.115 | | | 0.115 | | | 0.115 |
| | |
|
| |
|
| |
|
| |
|
|
| | | $ | 0.525 | | $ | 0.495 | | $ | 0.467 | | $ | 0.555 |
| | |
|
| |
|
| |
|
| |
|
|
Shortly after the close of the calendar year ending December 31, 2005, you will be advised again as to the federal tax status of the dividends and distributions received in calendar 2005. In addition, you will be advised at that time as to the portion of your dividends which may be subject to the Alternative Minimum Tax (AMT) as well as information with respect to state taxability.
| | |
| Dryden Municipal Bond Fund | | 81 |
Management of the Fund
(Unaudited)
Information pertaining to the Trustees of the Fund is set forth below. Trustees who are not deemed to be “interested persons” of the Fund, as defined in the Investment Company Act of 1940 (the 1940 Act) are referred to as “Independent Trustees.” Trustees who are deemed to be “interested persons” of the Fund are referred to as “Interested Trustees.” “Fund Complex”† consists of the Fund and any other investment companies managed by PI.
Independent Trustees(2)
Linda W. Bynoe (52), Trustee since 2005(3)
President and Chief Executive Officer (since March 1995) of Telemat Ltd.; formerly Vice President at Morgan Stanley & Co.
Other Directorships held:(4) Director of Dynegy Inc. (since September 2002) and Simon Property Group, Inc. (since May 2003).
David E.A. Carson (70), Trustee since 2003(3) Oversees 91 portfolios in Fund complex
Principal occupations (last 5 years): Director (January 2000 to May 2000), Chairman (January 1999 to December 1999), Chairman and Chief Executive Officer (January 1998 to December 1998) and President, Chairman and Chief Executive Officer (1983-1997) of People’s Bank.
Robert E. La Blanc (71), Trustee since 2003(3) Oversees 91 portfolios in Fund complex
Principal occupations (last 5 years): President (since 1981) of Robert E. La Blanc Associates, Inc. (telecommunications); formerly General Partner at Salomon Brothers and Vice-Chairman of Continental Telecom; Trustee of Manhattan College.
Other Directorships held:(4) Director of Chartered Semiconductor Manufacturing, Ltd. (since 1998); Titan Corporation (electronics) (since 1995), Computer Associates International, Inc. (software company) (since 2002); FiberNet Telecom Group, Inc. (telecom company) (since 2003); Director (since April 1999) of the High Yield Plus Fund, Inc.
Douglas H. McCorkindale (66), Trustee since 2003(3) Oversees 91 portfolios in Fund complex
Principal occupations (last 5 years): Chairman (since February 2001), Chief Executive Officer (since June 2000) and President (since September 1997) of Gannett Co. Inc. (publishing and media); formerly Vice Chairman (March 1984-May 2000) of Gannett Co., Inc.
Other Directorships held:(4) Director of Gannett Co. Inc., Director of Continental Airlines, Inc. (since May 1993); Director of Lockheed Martin Corp. (aerospace and defense) (since May 2001); Director of The High Yield Plus Fund, Inc. (since 1996).
Richard A. Redeker (61), Trustee since 1993(3) Oversees 90 portfolios in Fund complex
Principal occupations (last 5 years): Management Consultant; Director of Invesmart, Inc. (since 2001) and Director of Penn Tank Lines, Inc. (since 1999).
Other Directorships held:(4) None.
| | |
| 82 | | Visit our website at www.jennisondryden.com |
Robin B. Smith (65), Trustee since 2003(3) Oversees 90 portfolios in Fund complex
Principal occupations (last 5 years): Chairman of the Board (since January 2003) of Publishers Clearing House (direct marketing); formerly Chairman and Chief Executive Officer (August 1996-January 2003) of Publishers Clearing House.
Other Directorships held:(4) Director of BellSouth Corporation (since 1992).
Stephen G. Stoneburn (61), Trustee since 2003(3) Oversees 90 portfolios in Fund complex
Principal occupations (last 5 years): President and Chief Executive Officer (since June 1996) of Quadrant Media Corp. (a publishing company); formerly President (June 1995-June 1996) of Argus Integrated Media, Inc.; Senior Vice President and Managing Director (January 1993-1995) of Cowles Business Media and Senior Vice President of Fairchild Publications, Inc. (1975-1989).
Other Directorships held:(4) None
Clay T. Whitehead (66), Trustee since 2003(3) Oversees 91 portfolios in Fund complex
Principal occupations (last 5 years): President (since 1983) of National Exchange Inc. (new business development firm).
Other Directorships held:(4) Director (since 2000) of the High Yield Plus Fund, Inc.
Interested Trustees(1)
Judy A. Rice (57), President since 2003 and Trustee since 2000(3) Oversees 91 portfolios in Fund complex
Principal occupations (last 5 years): President, Chief Executive Officer, Chief Operating Officer and Officer-in-Charge (since 2003) of PI; Director, Officer-in-Charge, President, Chief Executive Officer and Chief Operating Officer (since May 2003) of American Skandia Advisory Services, Inc. and American Skandia Investment Services, Inc.; Director, Officer-in-Charge, President, Chief Executive Officer (since May 2003) of American Skandia Fund Services, Inc.; Vice President (since February 1999) of Prudential Investment Management Services LLC; President, Chief Executive Officer and Officer-in-Charge (since April 2003) of Prudential Mutual Fund Services LLC; formerly various positions to Senior Vice President (1992-1999) of Prudential Securities Incorporated (Prudential Securities); and various positions to Managing Director (1975-1992) of Salomon Smith Barney; Member of Board of Governors of the Money Management Institute.
Other Directorships held:(4) None
Robert F. Gunia (58), Vice President and Trustee since 1996(3) Oversees 166 portfolios in Fund complex
Principal occupations (last 5 years): Chief Administrative Officer (since June 1999) of PI; Executive Vice President (since January 1996) of PI; President (since April 1999) of Prudential Investment Management Services LLC (PIMS); Director, Executive Vice President and Chief Administrative Officer (since May 2003) of American Skandia Investment Services, Inc., American Skandia Advisory Services, Inc. and American Skandia Fund Services, Inc.; Executive Vice President (since March 1999) of Prudential Mutual Fund Services LLC; formerly Senior Vice President (March 1987-May 1999) of Prudential Securities.
Other Directorships held:(4) Vice President and Director (since May 1989) and Treasurer (since 1999) of The Asia Pacific Fund, Inc.
| | |
| Dryden Municipal Bond Fund | | 83 |
Information pertaining to the Officers of the Fund who are not also Trustees is set forth below.
Officers(2)
William V. Healey (51), Chief Legal Officer since 2004(3)
Principal occupations (last 5 years): Vice President and Associate General Counsel (since 1998) of Prudential; Executive Vice President and Chief Legal Officer (since February 1999) of Prudential Investments LLC; Senior Vice President, Chief Legal Officer and Secretary (since December 1998) of Prudential Investment Management Services LLC; Executive Vice President and Chief Legal Officer (since February 1999) of Prudential Mutual Fund Services LLC; Vice President and Secretary (since October 1998) of Prudential Investment Management, Inc., Executive Vice President and Chief Legal Officer (since May 2003) of American Skandia Investment Services, Inc., American Skandia Fund Services, Inc. and American Skandia Advisory Services, Inc.; Director (June 1999-June 2002 and June 2003-present) of ICI Mutual Insurance Company; prior to August 1998, Associate General Counsel of the Dreyfus Corporation (Dreyfus), a subsidiary of Mellon Bank, N.A. (Mellon Bank), and an officer and/or director of various affiliates of Mellon Bank and Dreyfus.
Deborah A. Docs (47), Secretary since 1996
Principal occupations (last 5 years): Vice President and Corporate Counsel (since January 2001) of Prudential Insurance Company of America (Prudential); Vice President and Assistant Secretary (since December 1996) of PI; Vice President and Assistant Secretary (since May 2003) of American Skandia Investment Services, Inc.
Maryanne Ryan (40), Anti-Money Laundering Compliance Officer since 2002(3)
Principal occupations (last 5 years): Vice President, Prudential (since November 1998); First Vice President, Prudential Securities (March 1997-May 1998); Anti-Money Laundering Compliance Officer (since 2003) of American Skandia Investment Services, Inc., American Skandia Advisory Services, Inc. and American Skandia Marketing, Inc.
Helene Gurian (51), Acting Anti-Money Laundering Compliance Officer since 2004
Principal Occupations (last 5 years): Vice President, Prudential (since July 1997). Vice President, Compliance (July 1997-January 2001); Vice President, Compliance and Risk Officer, Retail Distribution (January 2001-May 2002); Vice President, Corporate Investigations (May 2002-date) responsible for supervision of Prudential’s fraud investigations, anti-money laundering program and high technology investigation unit.
Lee D. Augsburger (46), Chief Compliance Officer since 2004(3)
Principal occupations (last 5 years): Vice President and Chief Compliance Officer (since May 2003) of PI; Vice President and Chief Compliance Officer (since October 2000) of Prudential Investment Management, Inc.; formerly Vice President and Chief Legal Officer—Annuities (August 1999-October 2000) of Prudential Insurance Company of America; Vice President and Corporate Counsel (November 1997-August 1999) of Prudential Insurance Company of America.
Grace C. Torres (46), Treasurer and Principal Financial and Accounting Officer since 1996(3)
Principal occupations (last 5 years): Senior Vice President (since January 2000) of PI; Senior Vice President and Assistant Treasurer (since May 2003) of American Skandia Investment Services, Inc. and American Skandia Advisory Services, Inc.; formerly First Vice President (December 1996-January 2000) of PI and First Vice President (March 1993-1999) of Prudential Securities.
Jonathan D. Shain (46), Assistant Secretary since 2004(3)
Principal occupations (last 5 years): Vice President and Corporate Counsel (since August 1998) of Prudential; Vice President and Assistant Secretary (since May 2003) of American Skandia Investment Services, Inc. and American Skandia Fund Services, Inc.
| | |
| 84 | | Visit our website at www.jennisondryden.com |
| † | The Fund Complex consists of all investment companies managed by PI. The Funds for which PI serves as manager include JennisonDryden Mutual Funds, Strategic Partners Funds, The Prudential Variable Contract Accounts 2, 10, 11, The Target Portfolio Trust, The Prudential Series Fund, Inc., American Skandia Trust, and Prudential’s Gibraltar Fund. |
| (1) | “Interested” Trustee, as defined in the 1940 Act, by reason of employment with the Manager (Prudential Investments LLC or PI), the Subadviser (Prudential Investment Management, Inc. or “PIM”) or the Distributor (Prudential Investment Management Services LLC or PIMS). |
| (2) | Unless otherwise noted, the address of the Trustees and Officers is c/o: Prudential Investments LLC, Gateway Center Three, 100 Mulberry Street, Newark, NJ 07102. |
| (3) | There is no set term of office for Trustees and Officers. The Independent Trustees have adopted a retirement policy, which calls for the retirement of Trustees on December 31 of the year in which they reach the age of 75. The table shows the individuals length of service as Trustee and/or Officer. |
| (4) | This includes only directorships of companies requested to register, or file reports with the SEC under the Securities and Exchange Act of 1934 (that is, “public companies”) or other investment companies registered under the 1940 Act. |
Additional information about the Fund’s Trustees is included in the Fund’s Statement of Additional Information which is available without charge, upon request, by calling (800) 521-7466 or (732) 482-7555 (Calling from outside the U.S.)
| | |
| Dryden Municipal Bond Fund | | 85 |
Growth of a $10,000 Investment
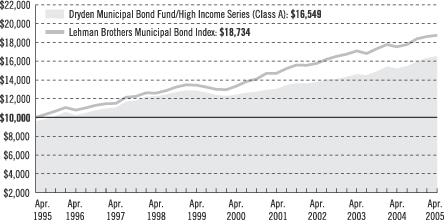
| | | | | | | | | | |
| Average Annual Total Returns (With Sales Charges) as of 4/30/05 |
| | | One Year | | | Five Years | | | Ten Years | | Since Inception |
Class A | | 4.46 | % | | 5.04 | % | | 5.17% (5.13) | | 5.99% (5.94) |
Class B | | 3.53 | | | 5.49 | | | 5.29 (5.25) | | 6.63 (6.45) |
Class C | | 7.26 | | | 5.39 | | | 5.03 (4.99) | | 5.05 (5.01) |
Class Z | | 9.09 | | | 6.17 | | | N/A | | 5.53 (5.51) |
| | | | | | | | | | | |
| Average Annual Total Returns (Without Sales Charges) as of 4/30/05 |
| | | One Year | | | Five Years | | | Ten Years | | Since Inception |
Class A | | 8.81 | % | | 5.90 | % | | 5.60% (5.56) | | 6.27% (6.22) |
Class B | | 8.53 | | | 5.65 | | | 5.29 (5.25) | | 6.63 (6.45) |
Class C | | 8.26 | | | 5.39 | | | 5.03 (4.99) | | 5.05 (5.01) |
Class Z | | 9.09 | | | 6.17 | | | N/A | | 5.53 (5.51) |
Performance data quoted represent past performance. Past performance does not guarantee future results. The investment return and principal value of an investment will fluctuate, so that an investor’s shares, when redeemed, may be worth more or less than their original cost. Current performance may be lower or higher than the past performance data quoted. The returns in the graph and the tables do not reflect the deduction of taxes that a shareholder would pay on Series distributions or following the redemption of Series shares. An investor may obtain performance data current to the most recent month-end by visiting our website at www.jennisondryden.com or by calling (800) 225-1852. The maximum initial sales charge is 4.00%.
| | |
| | | Visit our website at www.jennisondryden.com |
Source: Prudential Investments LLC and Lipper Inc. Inception dates: Class A, 1/22/90; Class B, 9/17/87; Class C, 8/1/94; and Class Z, 9/16/96.
The graph compares a $10,000 investment in the Dryden Municipal Bond Fund/High Income Series (Class A shares) with a similar investment in the Lehman Brothers Municipal Bond Index by portraying the initial account values at the beginning of the 10-year period for Class A shares (April 30, 1995) and the account values at the end of the current fiscal year (April 30, 2005) as measured on a quarterly basis. For purposes of the graph, and unless otherwise indicated, it has been assumed that (a) the maximum applicable front-end sales charge was deducted from the initial $10,000 investment in Class A shares; (b) all recurring fees (including management fees) were deducted; and (c) all dividends and distributions were reinvested. The line graph provides information for Class A shares only. As indicated in the tables provided earlier, performance for Class B, Class C, and Class Z shares will vary due to the differing charges and expenses applicable to each share class (as indicated in the following paragraphs). Without a distribution and service (12b-1) fee waiver of 0.05% for Class A shares through April 30, 2005, the returns shown in the graph and for Class A shares in the tables would have been lower, as indicated in parentheses.
The Lehman Brothers Municipal Bond Index (Index) is an unmanaged index of over 39,000 long-term investment-grade municipal bonds. It gives a broad look at how long-term investment-grade municipal bonds have performed. The Index’s total returns include the reinvestment of all dividends, but do not include the effects of sales charges, operating expenses of a mutual fund, or taxes. The returns for the Index would be lower if they included the effects of sales charges, operating expenses, or taxes. The securities that comprise the Index may differ substantially from the securities in the Series. This is not the only index that may be used to characterize performance of municipal bond funds. Other indexes may portray different comparative performance. Investors cannot invest directly in an index.
Through March 14, 2004, the Series charged a maximum front-end sales charge of 3.00% for Class A shares and a 12b-1 fee of up to 0.30% annually. Effective March 15, 2004, Class A shares are subject to a maximum front-end sales charge of 4.00% and a 12b-1 fee of up to 0.30% annually. Investors who purchase Class A shares in an amount of $1 million or more do not pay a front-end sales charge, but are subject to a contingent deferred sales charge (CDSC) of 1% for shares sold within 12 months of purchase. Class B shares are subject to a declining CDSC of 5%, 4%, 3%, 2%, 1%, and 1% respectively for the first six years after the purchase and a 12b-1 fee of up to 0.50% annually. Approximately seven years after purchase, Class B shares will automatically convert to Class A shares on a quarterly basis. Through February 1, 2004, Class C shares were subject to a front-end sales charge of 1%, a CDSC of 1% for shares redeemed within 18 months of purchase, and a 12b-1 fee of 1% annually. Class C shares purchased on or after February 2, 2004, are not subject to a front-end sales charge, the CDSC of 1% for Class C shares purchased on or after that date will apply for 12 months from the date of purchase, and the annual 12b-1 fee will remain 1%. Class Z shares are not subject to a sales charge or 12b-1 fee. The returns on investment in the graph and the returns in the tables do not reflect the deduction of taxes that a shareholder would pay on Fund distributions or following the redemption of Fund shares. Without waiver of fees and/or expense subsidization, the Series’ returns would have been lower, as indicated in parentheses.
| | |
| Dryden Municipal Bond Fund | | |
Growth of a $10,000 Investment
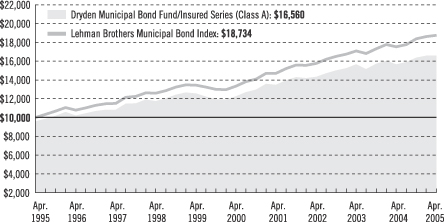
| | | | | | | | | | |
| Average Annual Total Returns (With Sales Charges) as of 4/30/05 |
| | | One Year | | | Five Years | | | Ten Years | | Since Inception |
Class A | | 1.51 | % | | 5.34 | % | | 5.17% (5.14) | | 5.98% (5.91) |
Class B | | 0.45 | | | 5.77 | | | 5.28 (5.25) | | 6.45 (6.10) |
Class C | | 4.18 | | | 5.67 | | | 5.02 (4.99) | | 5.05 (5.02) |
Class Z | | 5.94 | | | 6.44 | | | N/A | | 5.61 (5.59) |
| | | | | | | | | | | |
| Average Annual Total Returns (Without Sales Charges) as of 4/30/05 |
| | | One Year | | | Five Years | | | Ten Years | | Since Inception |
Class A | | 5.74 | % | | 6.21 | % | | 5.60% (5.58) | | 6.26% (6.20) |
Class B | | 5.45 | | | 5.93 | | | 5.28 (5.25) | | 6.45 (6.10) |
Class C | | 5.18 | | | 5.67 | | | 5.02 (4.99) | | 5.05 (5.02) |
Class Z | | 5.94 | | | 6.44 | | | N/A | | 5.61 (5.59) |
Performance data quoted represent past performance. Past performance does not guarantee future results. The investment return and principal value of an investment will fluctuate, so that an investor’s shares, when redeemed, may be worth more or less than their original cost. Current performance may be lower or higher than the past performance data quoted. The returns in the graph and the tables do not reflect the deduction of taxes that a shareholder would pay on Series distributions or following the redemption of Series shares. An investor may obtain performance data current to the most recent month-end by visiting our website at www.jennisondryden.com or by calling (800) 225-1852. The maximum initial sales charge is 4.00%.
| | |
| | | Visit our website at www.jennisondryden.com |
Source: Prudential Investments LLC and Lipper Inc. Inception dates: Class A, 1/22/90; Class B, 9/17/87; Class C, 8/1/94; and Class Z, 9/16/96.
The graph compares a $10,000 investment in the Dryden Municipal Bond Fund/Insured Series (Class A shares) with a similar investment in the Lehman Brothers Municipal Bond Index by portraying the initial account values at the beginning of the 10-year period for Class A shares (April 30, 1995) and the account values at the end of the current fiscal year (April 30, 2005) as measured on a quarterly basis. For purposes of the graph, and unless otherwise indicated, it has been assumed that (a) the maximum applicable front-end sales charge was deducted from the initial $10,000 investment in Class A shares; (b) all recurring fees (including management fees) were deducted; and (c) all dividends and distributions were reinvested. The line graph provides information for Class A shares only. As indicated in the tables provided earlier, performance for Class B, Class C, and Class Z shares will vary due to the differing charges and expenses applicable to each share class (as indicated in the following paragraphs). Without a distribution and service (12b-1) fee waiver of 0.05% for Class A shares through April 30, 2005, the returns shown in the graph and for Class A shares in the tables would have been lower, as indicated in parentheses.
The Lehman Brothers Municipal Bond Index (Index) is an unmanaged index of over 39,000 long-term investment-grade municipal bonds. It gives a broad look at how long-term investment-grade municipal bonds have performed. The Index’s total returns include the reinvestment of all dividends, but do not include the effects of sales charges, operating expenses of a mutual fund, or taxes. The returns for the Index would be lower if they included the effects of sales charges, operating expenses, or taxes. The securities that comprise the Index may differ substantially from the securities in the Series. This is not the only index that may be used to characterize performance of municipal bond funds. Other indexes may portray different comparative performance. Investors cannot invest directly in an index.
Through March 14, 2004, the Series charged a maximum front-end sales charge of 3.00% for Class A shares and a 12b-1 fee of up to 0.30% annually. Effective March 15, 2004, Class A shares are subject to a maximum front-end sales charge of 4.00% and a 12b-1 fee of up to 0.30% annually. Investors who purchase Class A shares in an amount of $1 million or more do not pay a front-end sales charge, but are subject to a contingent deferred sales charge (CDSC) of 1% for shares sold within 12 months of purchase. Class B shares are subject to a declining CDSC of 5%, 4%, 3%, 2%, 1%, and 1% respectively for the first six years after the purchase and a 12b-1 fee of up to 1.00% annually. Approximately seven years after purchase, Class B shares will automatically convert to Class A shares on a quarterly basis. Through February 1, 2004, Class C shares were subject to a front-end sales charge of 1%, a CDSC of 1% for shares redeemed within 18 months of purchase, and a 12b-1 fee of up to 1% annually. Class C shares purchased on or after February 2, 2004, are not subject to a front-end sales charge, the CDSC of 1% for Class C shares purchased on or after that date will apply for 12 months from the date of purchase, and the annual 12b-1 fee will remain up to 1%. Class Z shares are not subject to a sales charge or 12b-1 fee. The returns on investment in the graph and the returns in the tables do not reflect the deduction of taxes that a shareholder would pay on Fund distributions or following the redemption of Fund shares. Without waiver of fees and/or expense subsidization, the Series’ returns would have been lower, as indicated in parentheses.
| | |
| Dryden Municipal Bond Fund | | |
| | | | |
| n MAIL | | n TELEPHONE | | n WEBSITE |
Gateway Center Three 100 Mulberry Street Newark, NJ 07102 | | (800) 225-1852 | | www.jennisondryden.com |
PROXY VOTING
The Board of Trustees for the Series has delegated to the Series’ investment adviser the responsibility for voting any proxies and maintaining proxy recordkeeping with respect to the Series. A description of these proxy voting policies and procedures is available without charge, upon request, by calling (800) 225-1852 or by visiting the Securities and Exchange Commission’s (the Commission) website at http://www.sec.gov. Information regarding how the Series voted proxies relating to portfolio securities during the most recent 12-month period ended June 30, 2004, is available on the Series’ website at http://www.prudential.com and on the Commission’s website at http://www.sec.gov.
TRUSTEES
Linda W. Bynoe • David E.A. Carson • Robert F. Gunia • Robert E. La Blanc • Douglas H. McCorkindale • Richard A. Redeker • Judy A. Rice • Robin B. Smith • Stephen G. Stoneburn • Clay T. Whitehead
OFFICERS
Judy A. Rice, President • Robert F. Gunia, Vice President • Grace C. Torres, Treasurer and Principal Financial and Accounting Officer • William V. Healey, Chief Legal Officer • Deborah A. Docs, Secretary • Jonathan D. Shain, Assistant Secretary • Maryanne Ryan, Anti-Money Laundering Officer • Helene Gurian, Acting Anti-Money Laundering Compliance Officer • Lee D. Augsburger, Chief Compliance Officer
| | | | |
| MANAGER | | Prudential Investments LLC | | Gateway Center Three
100 Mulberry Street
Newark, NJ 07102 |
|
| INVESTMENT ADVISER | | Prudential Investment
Management, Inc. | | Gateway Center Two
100 Mulberry Street
Newark, NJ 07102 |
|
| DISTRIBUTOR | | Prudential Investment
Management Services LLC | | Gateway Center Three
100 Mulberry Street
Newark, NJ 07102 |
|
| CUSTODIAN | | State Street Bank
and Trust Company | | One Heritage Drive
North Quincy, MA 02171 |
|
| TRANSFER AGENT | | Prudential Mutual Fund
Services LLC | | PO Box 8098
Philadelphia, PA 19176 |
|
| INDEPENDENT REGISTERED PUBLIC ACCOUNTING FIRM | | KPMG LLP | | 345 Park Avenue
New York, NY 10154 |
|
| FUND COUNSEL | | Shearman & Sterling LLP | | 599 Lexington Avenue
New York, NY 10022 |
| | | | | | | | | | | | |
| Dryden Municipal Bond Fund/High Income Series | | | | |
| Share Class | | | | A | | B | | C | | Z | | |
NASDAQ | | | | PRHAX | | PMHYX | | PHICX | | PHIZX | | |
CUSIP | | | | 262467103 | | 262467202 | | 262467301 | | 262467400 | | |
| | | | | | | | | | | | | |
| Dryden Municipal Bond Fund/Insured Series | | | | |
| Share Class | | | | A | | B | | C | | Z | | |
NASDAQ | | | | PMIAX | | PMINX | | PMICX | | PMIZX | | |
CUSIP | | | | 262467509 | | 262467608 | | 262467707 | | 262467806 | | |
| | | | | | | | | | | | | |
|
| An investor should consider the investment objectives, risks, charges and expenses of the Series carefully before investing. The prospectus for the Series contains this and other information about the Series. An investor may obtain a prospectus by visiting our website at www.jennisondryden.com or by calling (800) 225-1852. The prospectus should be read carefully before investing. |
|
| Prudential Fixed Income is a business unit of Prudential Investment Management, Inc. (PIM). Quantitative Management Associates LLC, Jennison Associates LLC, and PIM are registered investment advisers and Prudential Financial companies. |
|
| E-DELIVERY |
To receive your mutual fund documents on-line, go to www.icsdelivery.com/prudential/funds
and enroll. Instead of receiving printed documents by mail, you will receive notification via e-mail when new materials are available. You can cancel your enrollment or change your e-mail
address at any time by clicking on the change/cancel enrollment option at the icsdelivery website address. |
|
| SHAREHOLDER COMMUNICATIONS WITH TRUSTEES |
| Shareholders of a Series can communicate directly with the Board of Trustees by writing to the Chair of the Board, Dryden Municipal Bond Fund/High Income Series and Insured Series, PO Box 13964, Philadelphia, PA 19176. Shareholders can communicate directly with an individual Trustee by writing to that Trustee at Dryden Municipal Bond Fund/High Income Series and Insured Series, PO Box 13964, Philadelphia, PA 19176. Such communications to the Board or individual Trustees are not screened before being delivered to the addressee. |
|
| AVAILABILITY OF QUARTERLY PORTFOLIO SCHEDULE |
| Each Series files its complete schedule of portfolio holdings with the Securities and Exchange Commission (the Commission) for the first and third quarters of each fiscal year on Form N-Q. The Series’ Forms N-Q are available on the Commission’s website at http://www.sec.gov. The Series’ Forms N-Q may also be reviewed and copied at the Commission’s Public Reference Room in Washington, D.C. Information on the operation and location of the Public Reference Room may be obtained by calling (800) SEC-0330 (732-0330). Each Series will provide a full list of its portfolio holdings as of the end of each fiscal quarter on its website at www.jennisondryden.com approximately 60 days after the end of the fiscal quarter. |
Mutual Funds:
| | | | |
| ARE NOT INSURED BY THE FDIC OR ANY FEDERAL GOVERNMENT AGENCY | | MAY LOSE VALUE | | ARE NOT A DEPOSIT OF OR GUARANTEED BY ANY BANK OR ANY BANK AFFILIATE |

| | | | | | | | | | | | |
| Dryden Municipal Bond Fund/High Income Series | | | | |
| | | Share Class | | A | | B | | C | | Z | | |
| | | NASDAQ | | PRHAX | | PMHYX | | PHICX | | PHIZX | | |
| | | CUSIP | | 262467103 | | 262467202 | | 262467301 | | 262467400 | | |
| | | | | | | | | | | | | |
| Dryden Municipal Bond Fund/Insured Series | | | | |
| | | Share Class | | A | | B | | C | | Z | | |
| | | NASDAQ | | PMIAX | | PMINX | | PMICX | | PMIZX | | |
| | | CUSIP | | 262467509 | | 262467608 | | 262467707 | | 262467806 | | |
| | | | | | | | | | | | | |
MF133E IFS-A 105495 Ed. 05/2005
Item 2 – Code of Ethics – – See Exhibit (a)
As of the end of the period covered by this report, the registrant has adopted a code of ethics (the “Section 406 Standards for Investment Companies – Ethical Standards for Principal Executive and Financial Officers”) that applies to the registrant’s Principal Executive Officer and Principal Financial Officer; the registrant’s Principal Financial Officer also serves as the Principal Accounting Officer.
The registrant hereby undertakes to provide any person, without charge, upon request, a copy of the code of ethics. To request a copy of the code of ethics, contact the registrant 973-367-7521, and ask for a copy of the Section 406 Standards for Investment Companies - Ethical Standards for Principal Executive and Financial Officers.
Item 3 – Audit Committee Financial Expert –
The registrant’s Board has determined that Mr. David Carson, member of the Board’s Audit Committee is an “audit committee financial expert,” and that he is “independent,” for purposes of this Item.
Item 4 – Principal Accountant Fees and Services –
For the fiscal years ended April 30, 2005 and April 30, 2004, KPMG LLP (“KPMG”), the Registrant’s principal accountant, billed the Registrant $47,000 and $47,000, respectively, for professional services rendered for the audit of the Registrant’s annual financial statements or services that are normally provided in connection with statutory and regulatory filings.
None.
None.
None.
| (e) | (1) Audit Committee Pre-Approval Policies and Procedures |
THE PRUDENTIAL MUTUAL FUNDS
AUDIT COMMITTEE POLICY
on
Pre-Approval of Services Provided by the Independent Accountants
The Audit Committee of each Prudential Mutual Fund is charged with the responsibility to monitor the independence of the Fund’s independent accountants. As part of this responsibility, the Audit Committee must pre-approve any independent accounting firm’s engagement to render audit and/or permissible non-audit services, as required by law. In evaluating a proposed engagement of the independent accountants, the Audit Committee will assess the effect that the engagement might reasonably be expected to have on the accountant’s independence. The Committee’s evaluation will be based on:
| | • | | a review of the nature of the professional services expected to be provided, |
| | • | | a review of the safeguards put into place by the accounting firm to safeguard independence, and |
| | • | | periodic meetings with the accounting firm. |
Policy for Audit and Non-Audit Services Provided to the Funds
On an annual basis, the scope of audits for each Fund, audit fees and expenses, and audit-related and non-audit services (and fees proposed in respect thereof) proposed to be performed by the Fund’s independent accountants will be presented by the Treasurer and the independent accountants to the Audit Committee for review and, as appropriate, approval prior to the initiation of such services. Such presentation shall be accompanied by confirmation by both the Treasurer and the independent accountants that the proposed services will not adversely affect the independence of the independent accountants. Proposed services shall be described in sufficient detail to enable the Audit Committee to assess the appropriateness of such services and fees, and the compatibility of the provision of such services with the auditor’s independence. The Committee shall receive periodic reports on the progress of the audit and other services which are approved by the Committee or by the Committee Chair pursuant to authority delegated in this Policy.
The categories of services enumerated under “Audit Services”, “Audit-related Services”, and “Tax Services” are intended to provide guidance to the Treasurer and the independent accountants as to those categories of services which the Committee believes are generally consistent with the independence of the independent accountants and which the Committee (or the Committee Chair) would expect upon the presentation of specific proposals to pre-approve. The enumerated categories are not intended as an exclusive list of audit, audit-related or tax services which the Committee (or the Committee Chair) would consider for pre-approval.
Audit Services
The following categories of audit services are considered to be consistent with the role of the Fund’s independent accountants:
| | • | | Annual Fund financial statement audits |
| | • | | Seed audits (related to new product filings, as required) |
| | • | | SEC and regulatory filings and consents |
Audit-related Services
The following categories of audit-related services are considered to be consistent with the role of the Fund’s independent accountants:
| | • | | Accounting consultations |
| | • | | Fund merger support services |
| | • | | Agreed Upon Procedure Reports |
| | • | | Other Internal Control Reports |
Individual audit-related services that fall within one of these categories and are not presented to the Audit Committee as part of the annual pre-approval process will be subject to pre-approval by the Committee Chair (or any other Committee member on whom this responsibility has been delegated) so long as the estimated fee for those services does not exceed $50,000.
Tax Services
The following categories of tax services are considered to be consistent with the role of the Fund’s independent accountants:
| | • | | Tax compliance services related to the filing or amendment of the following: |
| | • | | Federal, state and local income tax compliance; and, |
| | • | | Sales and use tax compliance |
| | • | | Timely RIC qualification reviews |
| | • | | Tax distribution analysis and planning |
| | • | | Tax authority examination services |
| | • | | Tax appeals support services |
| | • | | Accounting methods studies |
| | • | | Fund merger support services |
| | • | | Tax consulting services and related projects |
Individual tax services that fall within one of these categories and are not presented to the Audit Committee as part of the annual pre-approval process will be subject to pre-approval by the Committee Chair (or any other Committee member on whom this responsibility has been delegated) so long as the estimated fee for those services does not exceed $50,000.
Other Non-audit Services
Certain non-audit services that the independent accountants are legally permitted to render will be subject to pre-approval by the Committee or by one or more Committee members to whom the Committee has delegated this authority and who will report to the full Committee any pre-approval decisions made pursuant to this Policy. Non-audit services presented for pre-approval pursuant to this paragraph will be accompanied by a confirmation from both the Treasurer and the independent accountants that the proposed services will not adversely affect the independence of the independent accountants.
Proscribed Services
The Fund’s independent accountants will not render services in the following categories of non-audit services:
| | • | | Bookkeeping or other services related to the accounting records or financial statements of the Fund |
| | • | | Financial information systems design and implementation |
| | • | | Appraisal or valuation services, fairness opinions, or contribution-in-kind reports |
| | • | | Internal audit outsourcing services |
| | • | | Management functions or human resources |
| | • | | Broker or dealer, investment adviser, or investment banking services |
| | • | | Legal services and expert services unrelated to the audit |
| | • | | Any other service that the Public Company Accounting Oversight Board determines, by regulation, is impermissible. |
Pre-approval of Non-Audit Services Provided to Other Entities Within the Prudential Fund Complex
Certain non-audit services provided to Prudential Investments LLC or any of its affiliates that also provide ongoing services to the Prudential Mutual Funds will be subject to pre-approval by the Audit Committee. The only non-audit services provided to these entities that will require pre-approval are those related directly to the operations and financial reporting of the Funds. Individual projects that are not presented to the Audit Committee as part of the annual pre-approval process, will be subject to pre-approval by the Committee Chair (or any other Committee member on whom this responsibility has been delegated) so long as the estimated fee for those services does not exceed $50,000. Services presented for pre-approval pursuant to this paragraph will be accompanied by a confirmation from both the Treasurer and the independent accountants that the proposed services will not adversely affect the independence of the independent accountants.
Although the Audit Committee will not pre-approve all services provided to Prudential Investments LLC and its affiliates, the Committee will receive an annual report from the Fund’s independent accounting firm showing the aggregate fees for all services provided to Prudential Investments and its affiliates.
| (e) | (2) Percentage of services referred to in 4(b)- (4)(d) that were approved by the audit committee – |
Not applicable.
| (f) | Percentage of hours expended attributable to work performed by other than full time employees of principal accountant if greater than 50%. |
Not applicable.
Not applicable to Registrant for the fiscal years 2005 and 2004. The aggregate non-audit fees billed by KPMG for services rendered to the registrant’s investment adviser and any entity controlling, controlled by, or under common control with the investment adviser that provides ongoing services to the registrant for the fiscal year 2005 was $33,500. There were no non-audit fees billed by KPMG for services rendered to the registrant’s investment adviser and any entity controlling, controlled by, or under common control with the investment adviser that provides ongoing services to the registrant for the fiscal year 2004.
| (h) | Principal Accountants Independence |
Not applicable as KPMG has not provided non-audit services to the registrant’s investment adviser and any entity controlling, controlled by, or under common control with the investment adviser that provides ongoing services to the registrant that were not pre-approved pursuant to Rule 2-01(c)(7)(ii) of Regulation S-X.
Item 5 – Audit Committee of Listed Registrants – Not applicable.
Item 6 – Schedule of Investments – The schedule is included as part of the report to shareholders filed under Item 1 of this Form.
Item 7 – Disclosure of Proxy Voting Policies and Procedures for Closed-End Management Investment Companies – Not applicable.
Item 8 – Portfolio Managers of Closed-End Management Investment Companies – Not applicable.
Item 9 – Purchases of Equity Securities by Closed-End Management Investment Company and Affiliated Purchasers – Not applicable.
Item 10 – Submission of Matters to a Vote of Security Holders – Not applicable.
Item 11 – Controls and Procedures
| | (a) | It is the conclusion of the registrant’s principal executive officer and principal financial officer that the effectiveness of the registrant’s current disclosure controls and procedures (such disclosure controls and procedures having been evaluated within 90 days of the date of this filing) provide reasonable assurance that the information required to be disclosed by the registrant has been recorded, processed, summarized and reported within the time period specified in the Commission’s rules and forms and that the information required to be disclosed by the registrant has been accumulated and communicated to the registrant’s principal executive officer and principal financial officer in order to allow timely decisions regarding required disclosure. |
| | (b) | There have been no significant changes in the registrant’s internal controls or in other factors that could significantly affect these controls subsequent to the date of their evaluation, including any corrective actions with regard to significant deficiencies and material weaknesses. |
Item 12 – Exhibits
| | (a) | Code of Ethics – Attached hereto |
| | (b) | Certifications pursuant to Section 302 and 906 of the Sarbanes-Oxley Act – Attached hereto |
SIGNATURES
Pursuant to the requirements of the Securities Exchange Act of 1934 and the Investment Company Act of 1940, the registrant has duly caused this report to be signed on its behalf by the undersigned, thereunto duly authorized.
| | |
(Registrant) | | Dryden Municipal Bond Fund |
| | |
| |
| By (Signature and Title)* | | /s/ DEBORAH A. DOCS |
| | | Deborah A. Docs |
| | | Secretary |
Pursuant to the requirements of the Securities Exchange Act of 1934 and the Investment Company Act of 1940, this report has been signed below by the following persons on behalf of the registrant and in the capacities and on the dates indicated.
| | |
| |
| By (Signature and Title)* | | /s/ JUDY A. RICE |
| | | Judy A. Rice |
| | | President and Principal Executive Officer |
| | |
| |
| By (Signature and Title)* | | /s/ GRACE C. TORRES |
| | | Grace C. Torres |
| | | Treasurer and Principal Financial Officer |
| * | Print the name and title of each signing officer under his or her signature. |