UNITED STATES
SECURITIES AND EXCHANGE COMMISSION
Washington, D.C. 20549
FORM N-CSR
CERTIFIED SHAREHOLDER REPORT OF REGISTERED
MANAGEMENT INVESTMENT COMPANIES
| | |
| Investment Company Act file number: | | 811-04930 |
| |
| Exact name of registrant as specified in charter: | | Dryden Municipal Bond Fund |
| |
| Address of principal executive offices: | | Gateway Center 3, |
| | 100 Mulberry Street, |
| | Newark, New Jersey 07102 |
| |
| Name and address of agent for service: | | Deborah A. Docs |
| | Gateway Center 3, |
| | 100 Mulberry Street, |
| | Newark, New Jersey 07102 |
| |
| Registrant’s telephone number, including area code: | | 800-225-1852 |
| |
| Date of fiscal year end: | | 4/30/2007 |
| |
| Date of reporting period: | | 4/30/2007 |
Item 1 – Reports to Stockholders

Dryden Municipal Bond Fund/
High Income Series & Insured Series
| | |
| APRIL 30, 2007 | | ANNUAL REPORT |

FUND TYPE
Municipal Bond
OBJECTIVE
High Income Series: Maximum amount of income that is eligible for exclusion from federal income taxes.
Insured Series: Maximum amount of income that is eligible for exclusion from federal income taxes, consistent with the preservation of capital.
This report is not authorized for distribution to prospective investors unless preceded or accompanied by a current prospectus.
The views expressed in this report and information about the Series’ portfolio holdings are for the period covered by this report and are subject to change thereafter.
JennisonDryden is a registered trademark of The Prudential Insurance Company of America.

June 15, 2007
Dear Shareholder:
We hope you find the annual report for the Dryden Municipal Bond Fund/High Income Series and Insured Series informative and useful. As a JennisonDryden mutual fund shareholder, you may be thinking about where you can find additional growth opportunities. You could invest in last year’s top-performing asset class and hope history repeats itself or you could stay in cash while waiting for the “right moment” to invest.
Instead, we believe it is better to take advantage of developing domestic and global investment opportunities through a diversified portfolio of stock and bond mutual funds. A diversified asset allocation offers two potential advantages. It helps you manage downside risk by not being overly exposed to any particular asset class, plus it gives you a better opportunity to have at least some of your assets in the right place at the right time. Your financial professional can help you create a diversified investment plan that may include mutual funds covering all the basic asset classes and that reflects your personal investor profile and tolerance for risk.
JennisonDryden Mutual Funds gives you a wide range of choices that can help you make progress toward your financial goals. Our funds offer the experience, resources, and professional discipline of four leading asset managers. They are recognized and respected in the institutional market and by discerning investors for excellence in their respective strategies. JennisonDryden equity funds are advised by Jennison Associates LLC, Quantitative Management Associates LLC (QMA), or Prudential Real Estate Investors (PREI). Prudential Investment Management, Inc. (PIM) advises the JennisonDryden fixed income and money market funds. Jennison Associates, QMA, and PIM are registered investment advisers and Prudential Financial companies. PREI is a registered investment adviser and a unit of PIM.
Thank you for choosing JennisonDryden Mutual Funds.
Sincerely,

Judy A. Rice, President
Dryden Municipal Bond Fund
| | |
| Dryden Municipal Bond Fund | | 1 |
Your Series’ Performance
High Income Series
Series objective
The investment objective of the Dryden Municipal Bond Fund/High Income Series is to seek the maximum amount of income that is eligible for exclusion from federal income taxes. There can be no assurance that the Series will achieve its investment objective.
Performance data quoted represent past performance. Past performance does not guarantee future results. The investment return and principal value of an investment will fluctuate, so that an investor’s shares, when redeemed, may be worth more or less than their original cost. Current performance may be lower or higher than the past performance data quoted. An investor may obtain performance data as of the most recent month-end by visiting our website at www.jennisondryden.com or by calling (800) 225-1852. The maximum initial sales charge is 4.00% (Class A shares). Gross operating expenses: Class A, 0.94%; Class B, 1.14%; Class C, 1.64%; Class Z, 0.64%. Net Operating Expenses apply to: Class A, 0.89%; Class B, 1.14%; Class C, 1.39%; Class Z, 0.64%, after contractual reduction through 8/31/2008.
| | | | | | | | | |
| Cumulative Total Returns as of 4/30/07 | | | | |
| | | One Year | | | Five Years | | | Ten Years | |
Class A | | 6.94 | % | | 34.83 | % | | 67.89 | % |
Class B | | 6.67 | | | 33.13 | | | 63.31 | |
Class C | | 6.41 | | | 31.51 | | | 59.33 | |
Class Z | | 7.21 | | | 36.55 | | | 71.71 | |
LB Muni Bond Index1 | | 5.78 | | | 28.58 | | | 75.88 | |
LB Non-Investment-Grade Muni Bond Index2,3 | | 9.94 | | | 51.68 | | | 98.12 | |
Lipper HY Muni Debt Funds Avg.4 | | 6.91 | | | 35.58 | | | 68.06 | |
| | | | | | | | | |
| Average Annual Total Returns5 as of 3/31/07 | | | | |
| | | One Year | | | Five Years | | | Ten Years | |
Class A | | 2.42 | % | | 5.42 | % | | 4.92 | % |
Class B | | 1.53 | | | 5.88 | | | 5.07 | |
Class C | | 5.27 | | | 5.77 | | | 4.81 | |
Class Z | | 6.96 | | | 6.55 | | | 5.58 | |
LB Muni Bond Index1 | | 5.43 | | | 5.50 | | | 5.87 | |
LB Non-Investment-Grade Muni Bond Index2,3 | | 9.84 | | | 8.80 | | | 7.08 | |
Lipper HY Muni Debt Funds Avg.4 | | 6.67 | | | 6.42 | | | 5.34 | |
| | |
| 2 | | Visit our website at www.jennisondryden.com |
| | | | | | | | | | | | |
| Distribution and Yields as of 4/30/07 | |
| | | Total Distributions
Paid for 12 Months | | 30-Day
SEC Yield | | | Taxable Equivalent Yield6
at Tax Rates of | |
| | | | | 33% | | | 35% | |
Class A | | $ | 0.50 | | 3.81 | % | | 6.00 | % | | 6.19 | % |
Class B | | $ | 0.48 | | 3.71 | | | 5.85 | | | 6.03 | |
Class C | | $ | 0.45 | | 3.46 | | | 5.45 | | | 5.62 | |
Class Z | | $ | 0.53 | | 4.22 | | | 6.65 | | | 6.86 | |
The cumulative total returns do not reflect the deduction of applicable sales charges. If reflected, the applicable sales charges would reduce the cumulative total returns performance quoted. The average annual total returns assume the payment of the maximum applicable sales charge. Class A shares are subject to a maximum front-end sales charge of 4.00%. Under certain circumstances, Class A shares may be subject to a contingent deferred sales charge (CDSC) of 1%. Class B and Class C shares are subject to a maximum CDSC of 5% and 1%, respectively. Class Z shares are not subject to a sales charge.
Source: Prudential Investments LLC and Lipper Inc. Performance figures may reflect fee waivers and/or expense reimbursements. In the absence of such fee waivers and/or expense reimbursements, total returns would be lower.
1The Lehman Brothers (LB) Municipal (Muni) Bond Index is an unmanaged index of over 39,000 long-term investment-grade municipal bonds. It gives a broad look at how long-term investment-grade municipal bonds have performed.
2The Lehman Brothers (LB) Non-Investment-Grade Municipal (Muni) Bond Index is an unmanaged index of non-rated or Ba1 below-rated municipal bonds. It gives a broad look at how non-investment-grade municipal bonds have performed. The bonds in this index must have an outstanding par value of at least $3 million and be issued as part of a transaction of at least $20 million. The bonds must also have a dated date after December 31, 1990, and must be at least one year from their maturity date.
3The inception date of the LB Non-Investment-Grade Muni Bond Index is October 1995.
4The Lipper High Yield (HY) Municipal (Muni) Debt Funds Average (Lipper Average) represents returns based on an average return of all funds in the Lipper HY Muni Debt Funds category for the periods noted. Funds in the Lipper Average invest at least 50% of their assets in lower-rated municipal debt issues.
5The average annual total returns take into account applicable sales charges. Class A, Class B, and Class C shares are subject to an annual distribution and service (12b-1) fee of up to 0.30%, 0.50%, and 1.00%, respectively. Approximately seven years after purchase, Class B shares will automatically convert to Class A shares on a quarterly basis. Class Z shares are not subject to a 12b-1 fee. The returns in the tables do not reflect the deduction of taxes that a shareholder would pay on Fund distributions or following the redemption of Fund shares.
6Some investors may be subject to the federal alternative minimum tax and/or state and local taxes. Taxable equivalent yields reflect federal taxes only.
Investors cannot invest directly in an index. The returns for the Lehman Brothers Indexes and the Lipper Average would be lower if they included the effects of sales charges, operating expenses of a mutual fund, or taxes. Returns for the Lipper Average reflect the deduction of operating expenses, but not sales charges or taxes.
| | |
| Dryden Municipal Bond Fund | | 3 |
Your Series’ Performance (continued)
| | | |
| Five Largest Issues expressed as a percentage of net assets as of 4/30/07 | |
Memphis (TN) Ctr. City Rev., Fin. Corp., Red Birds, Ser. B 6.50%, 09/01/28 | | 4.5 | % |
Connecticut (CT) St. G.O., 5.00%, 11/15/19 | | 1.9 | |
West Virginia (WV) St. Hosp. Fin. Auth. Hosp. Rev., Oak Hill Hosp., Ser. B, 6.75%, 09/01/30 | | 1.4 | |
Orange Cnty. (CA) Loc. Trans. Auth. Sales Tax Rev., Linked, S.A.V.R.S, R.I.B.S., 6.20%, 02/14/11 | | 1.4 | |
Somerset Cnty. (PA) Hosp. Auth. Rev. GF Somers Hlthcare. First Mtge, 8.50%, 06/01/24 | | 1.2 | |
Issues are subject to change.
| | | |
| Credit Quality expressed as a percentage of net assets as of 4/30/07 | |
Aaa | | 13.9 | % |
Aa | | 9.3 | |
A | | 15.1 | |
Baa | | 26.8 | |
Ba | | 3.1 | |
B | | 3.4 | |
Caa | | 1.8 | |
NR | | 26.9 | |
Total Investments | | 100.3 | |
Liabilities in excess of other assets | | (0.3 | ) |
Net Assets | | 100.0 | % |
| | | |
Source: Moody’s rating, defaulting to S&P when not rated by Moody’s.
Credit quality is subject to change.
| | |
| 4 | | Visit our website at www.jennisondryden.com |
Investment Subadviser’s Report—High Income Series
Prudential Investment Management, Inc.
Lower-quality municipal bonds led U.S. tax-exempt market
There was strong demand for municipal bonds rated below investment grade during the Series’ fiscal year that began May 1, 2006. These lower-quality, tax-exempt debt securities provided more attractive yields than higher-quality municipal bonds and significantly outperformed higher-quality municipal bonds for the 12-month reporting period.
We continued to pursue our “all-weather” strategy in which the Series held approximately 62% in higher-yielding, lower-quality municipal bonds with the remainder in higher-quality municipal bonds that are more liquid. For the fiscal year ended April 30, 2007, the Series performed better than the Lehman Brothers Municipal Bond Index, which consists entirely of investment-grade bonds. However, the Series underperformed the Lehman Brothers Non-Investment-Grade Municipal Bond Index, which includes bonds that are non-rated or rated below investment grade. The Series’ Class A shares posted a cumulative total return in line with the Lipper High Yield Municipal Debt Funds Average (the Lipper Average), while its Class Z shares’ cumulative total return exceeded the Lipper Average. Its Class B and Class C shares’ cumulative total returns lagged the Lipper Average.
Record 17 consecutive short-term rate hikes put on hold
Prior to the start of the reporting period, the Federal Reserve (the Fed) raised its target for the federal funds rate on overnight loans between banks 15 consecutive times to gradually slow economic growth enough to tame inflation without triggering a recession. The target for the key rate was also increased a quarter percentage point in May and June 2006, raising it from 4.75% to 5.25%. Higher interest rates began to cool the housing market, which slowed economic growth in the spring. As the economy continued to lose steam in 2006 and oil prices declined, the Fed left short-term rates unchanged. Interest-rate futures prices reflected the possibility that policymakers would have to cut short-term rates early in the following year to stimulate economic activity. Consequently, municipal bond yields gradually declined during the summer and fall of 2006, which drove their prices higher, as bond prices move inversely to yields.
Despite sporadic signs of renewed strength, the economy continued to weaken in early 2007, particularly as the housing sector slumped amid reports of rising delinquencies and foreclosures on subprime mortgages, which are made to borrowers with spotty credit histories. However, because concern about mounting inflationary pressures in the economy prevented the Fed from easing monetary policy, rate-cut hopes faded and municipal bond prices turned lower at times. Then too, investor demand dwindled for the flood of new municipal bonds issued by states, local
| | |
| Dryden Municipal Bond Fund | | 5 |
Investment Subadviser’s Report—High Income Series
Prudential Investment Management, Inc. (continued)
governments, and authorities that took advantage of attractive borrowing costs afforded by the low level of long-term rates. During the Series’ fiscal year, the slope of the municipal bond yield curve flattened—short-term municipal bond yields finished slightly higher, intermediate-term bond yields ended slightly lower, and long-term bond yields finished sharply lower.
Proposed buyout hurt municipal bonds tied to TXU Corp.
While the economy lost steam, it remained healthy enough to support strong corporate earnings growth that benefited the corporate-backed sector of the municipal bond market. In fact this sector outperformed the broader municipal bond market during the reporting period, based on the Lehman Brothers Municipal Bond Index. While the Series held many corporate-backed municipal bonds that performed well, it also held Brazos River Authority pollution control revenue bonds for TXU Energy Co., which performed poorly. Weighing on the bonds was news that TXU Corp. is to be acquired by private equity investors in a transaction that may require the TXU holding company or its subsidiaries to take on a heavy load of new debt.
Large healthcare-bond exposure aided High Income Series
The healthcare sector, which also performed better than the broader municipal bond market, remained the Series’ largest sector concentration. A favorable credit environment continued in which many hospitals benefited from increased patient volumes, good reimbursements, and better financial management. In addition, demographic trends bode well for the sector as an aging U.S. population is expected to increasingly require the services of hospitals and other healthcare institutions. We took profits on some lower-quality hospital bonds held by the Series.
Tobacco-related municipal bonds were another positive
The tobacco-related municipal bond sector also performed well. Certain legal rulings widely believed to favor the industry helped its municipal bonds gain in value. For example, the U.S. Supreme Court threw out a $79.5 million punitive-damage award against Phillip Morris, citing an earlier ruling that limited the amount of punitive damages. The sector made a positive contribution to the Series’ returns. The Series held Tobacco Settlement Financing Corp. of New Jersey bonds that improved in credit quality and gained in value because they were pre-refunded. That is, new bonds with lower interest rates were issued whose proceeds were used to purchase special government securities held in an escrow account. The government securities pay interest on the pre-refunded bonds until a predetermined date, at which time the bonds will be retired ahead of their original maturity. This enabled the issuer to reduce its costs.
| | |
| 6 | | Visit our website at www.jennisondryden.com |
Selectively investing in volatile airline-related bonds
We increased the Series’ holdings in the airline-related sector by purchasing Alliance Airport Authority of Texas municipal bonds backed by AMR Corp, the parent company of American Airlines. However, we continued to limit exposure to this volatile sector even though the Series’ underweight exposure versus the Lehman Brothers Non-Investment Grade Municipal Bond Index detracted from its relative performance. Airline-related municipal bonds were supported by continued improvement in traffic trends, the industry’s ability to raise its fares, and positive rating actions in which bonds backed by American Airlines and Continental Airlines were upgraded. That said, the airline-related sector of the municipal market was pressured late in the first quarter of 2007 by a surge in jet fuel prices, but it still posted a solid return for the reporting period.
What ever happened to…
In the previous annual report, we mentioned that the Series held Oconto Falls Wisconsin Community Development Authority bonds for Oconto Falls Tissue Inc. The company bought back its bonds at a price above their face value, which enabled the Series to book a profit on the position.
| | |
| Dryden Municipal Bond Fund | | 7 |
Your Series’ Performance
Insured Series
Series objective
The investment objective of the Dryden Municipal Bond Fund/Insured Series is to seek the maximum amount of income that is eligible for exclusion from federal income taxes, consistent with the preservation of capital. There can be no assurance that the Series will achieve its investment objective.
Performance data quoted represent past performance. Past performance does not guarantee future results. The investment return and principal value of an investment will fluctuate, so that an investor’s shares, when redeemed, may be worth more or less than their original cost. Current performance may be lower or higher than the past performance data quoted. An investor may obtain performance data as of the most recent month-end by visiting our website at www.jennisondryden.com or by calling (800) 225-1852. The maximum initial sales charge is 4.00% (Class A shares). Gross operating expenses: Class A, 0.95%; Class B, 1.15%; Class C, 1.65%; Class Z, 0.65%. Net Operating Expenses apply to: Class A, 0.90%; Class B, 1.15%; Class C, 1.40%; Class Z, 0.65%, after contractual reduction through 8/31/2008.
| | | | | | | | | |
| Cumulative Total Returns as of 4/30/07 | | | | |
| | | One Year | | | Five Years | | | Ten Years | |
Class A | | 5.42 | % | | 23.47 | % | | 63.68 | % |
Class B | | 5.15 | | | 21.99 | | | 59.32 | |
Class C | | 4.88 | | | 20.47 | | | 55.41 | |
Class Z | | 5.69 | | | 25.09 | | | 67.18 | |
LB Muni Bond Index1 | | 5.78 | | | 28.58 | | | 75.88 | |
Lipper Insured Muni Debt Funds Avg.2 | | 4.79 | | | 23.34 | | | 60.34 | |
| | | | | | | | | |
| Average Annual Total Returns3 as of 3/31/07 | | | | |
| | | One Year | | | Five Years | | | Ten Years | |
Class A | | 0.60 | % | | 3.75 | % | | 4.65% | |
Class B | | –0.48 | | | 4.19 | | | 4.79 | |
Class C | | 3.26 | | | 4.09 | | | 4.53 | |
Class Z | | 5.05 | | | 4.90 | | | 5.31 | |
LB Muni Bond Index1 | | 5.43 | | | 5.50 | | | 5.87 | |
Lipper Insured Muni Debt Funds Avg.2 | | 4.39 | | | 4.60 | | | 4.88 | |
| | |
| 8 | | Visit our website at www.jennisondryden.com |
| | | | | | | | | | | | | | |
| Distribution and Yields as of 4/30/07 | | | | | | | | | |
| | | | | Total Distributions
Paid for 12 Months | | 30-Day
SEC Yield | | | Taxable Equivalent Yield4
at Tax Rates of | |
| | | | | | 33% | | | 35% | |
Class A | | | | $ | 0.46 | | 3.20 | % | | 4.78 | % | | 4.92 | % |
Class B | | | | $ | 0.44 | | 3.08 | | | 4.60 | | | 4.74 | |
Class C | | | | $ | 0.41 | | 2.83 | | | 4.22 | | | 4.35 | |
Class Z | | | | $ | 0.49 | | 3.59 | | | 5.36 | | | 5.52 | |
The cumulative total returns do not reflect the deduction of applicable sales charges. If reflected, the applicable sales charges would reduce the cumulative total returns performance quoted. The average annual total returns assume the payment of the maximum applicable sales charge. Class A shares are subject to a maximum front-end sales charge of 4.00%. Under certain circumstances, Class A shares may be subject to a contingent deferred sales charge (CDSC) of 1%. Class B and Class C shares are subject to a maximum CDSC of 5% and 1%, respectively. Class Z shares are not subject to a sales charge.
Source: Prudential Investments LLC and Lipper Inc. Performance figures may reflect fee waivers and/or expense reimbursements. In the absence of such fee waivers and/or expense reimbursements, total returns would be lower.
1The Lehman Brothers (LB) Municipal (Muni) Bond Index is an unmanaged index of over 39,000 long-term investment-grade municipal bonds. It gives a broad look at how long-term investment-grade municipal bonds have performed.
2The Lipper Insured Municipal (Muni) Debt Funds Average (Lipper Average) represents returns based on an average return of all funds in the Lipper Insured Muni Debt Funds category for the periods noted. Funds in the Lipper Average invest primarily in municipal debt issues insured as to timely payment.
3The average annual total returns take into account applicable sales charges. Class A, Class B, and Class C shares are subject to an annual distribution and service (12b-1) fee of up to 0.30%, 0.50%, and 1.00%, respectively. Approximately seven years after purchase, Class B shares will automatically convert to Class A shares on a quarterly basis. Class Z shares are not subject to a 12b-1 fee. The returns in the tables do not reflect the deduction of taxes that a shareholder would pay on Fund distributions or following the redemption of Fund shares.
4Some investors may be subject to the federal alternative minimum tax and/or state and local taxes. Taxable equivalent yields reflect federal taxes only.
Investors cannot invest directly in an index. The returns for the LB Muni Bond Index and the Lipper Average would be lower if they included the effects of sales charges, operating expenses of a mutual fund, or taxes. Returns for the Lipper Average reflect the deduction of operating expenses, but not sales charges or taxes.
| | |
| Dryden Municipal Bond Fund | | 9 |
Your Series’ Performance
Insured Series (continued)
| | | |
| Five Largest Issues expressed as a percentage of net assets as of 4/30/07 | |
Hawaii (HI) Dept. Budget & Fin., Hawaiian Elec. Co. Projs. Rev, Ser. C, A.M.B.A.C., A.M.T., 6.20%, 11/01/29 | | 3.9 | % |
Metro. (NY) Trans. Auth. N.Y. Svc. Contract, Rfdg. Rev., Ser. B, M.B.I.A., 5.50%, 7/01/23 | | 3.6 | |
Detroit (MI) Wtr. Sup. Sys. Rev., Ser. B, M.B.I.A. (Prerefunded date 7/01/13), 5.25%, 7/01/32 | | 2.7 | |
Northside (TX) Tex. Indpt. Sch. Dist. Ref., Ser. D, G.O., P.S.F.G., 5.00%, 6/15/28 | | 2.5 | |
Pennsylvania (PA) St. Ind. Dev. Auth. Rev., Econ. Dev., A.M.B.A.C., 5.50%, 7/01/17 | | 2.5 | |
Issues are subject to change.
| | | |
| Credit Quality expressed as a percentage of net assets as of 4/30/07 | |
Aaa | | 95.4 | % |
Aa | | 2.9 | |
A | | 0.5 | |
Total Investments | | 98.8 | |
Other assets in excess of liabilities | | 1.2 | |
Net Assets | | 100.0 | % |
| | | |
Source: Moody’s rating, defaulting to S&P when not rated by Moody’s.
Credit quality is subject to change.
| | |
| 10 | | Visit our website at www.jennisondryden.com |
Investment Subadviser’s Report—Insured Series
Prudential Investment Management, Inc.
An improved investment environment for municipal bonds
During the Series fiscal year that began May 1, 2006, conditions in the municipal bond market improved after the Federal Reserve (the Fed) halted its campaign to increase short-term interest rates in the United States. The municipal bond market rallied for several consecutive months, but in the second half of the reporting period, uncertainty about short-term rates and the outlook for economic growth pressured it periodically. The municipal bond market also struggled to absorb a substantial amount of new issue supply.
In this largely favorable investment environment, tax-exempt debt securities returned 5.78% for the fiscal year ended April 30, 2007, according to the Lehman Brothers Municipal Bond Index (the Index). The Series lagged the Index, which does not include the effect of mutual fund operating expenses. But the Series outperformed the Lipper Insured Municipal Debt Funds Average for the 12-month reporting period.
Record 17 consecutive short-term rate hikes put on hold
Prior to the start of the reporting period, the Fed raised the target for the federal funds rate on overnight loans between banks 15 consecutive times in its latest effort to gradually slow economic growth enough to tame inflation without triggering a recession. The target for the key rate was also increased a quarter percentage point in May and June 2006, raising it from 4.75% to 5.25%. Higher interest rates began to cool the housing market, which slowed economic growth in the spring. As the economy continued to lose steam in 2006 and oil prices declined, the Fed left short-term rates unchanged. Interest-rate futures prices reflected the possibility that policymakers would have to cut short-term rates early in the following year to stimulate economic activity. Consequently, municipal bond yields gradually declined during the summer and fall of 2006, which drove their prices higher as bond prices move inversely to yields.
Despite sporadic signs of renewed strength, the economy continued to weaken in early 2007, particularly as the housing sector slumped amid reports of rising delinquencies and foreclosures on subprime mortgages, which are made to borrowers with spotty credit histories. However, because concern about mounting inflationary pressures in the economy prevented the Fed from easing monetary policy, rate-cut hopes faded and municipal bond prices turned lower at times. Then too, investor demand dwindled for the flood of new municipal bonds issued by states, local governments, and authorities that took advantage of attractive borrowing costs afforded by the low level of long-term rates.
| | |
| Dryden Municipal Bond Fund | | 11 |
Investment Subadviser’s Report—Insured Series
Prudential Investment Management, Inc. (continued)
Emphasis on long-term municipal bonds worked well
During the Series’ fiscal year, the slope of the municipal bond yield curve flattened—short-term municipal bond yields finished slightly higher, intermediate-term bond yields ended slightly lower, and long-term bond yields finished sharply lower. The Series benefited from a yield curve strategy that favored long-term municipal bonds, which outperformed other maturities as the sharp decline in their yields meant prices rose. Among the Series’ long-term municipal bonds were zero coupon bonds, which do not provide periodic interest payments and are bought at a discount from their value at maturity. The difference between the purchase price and the maturity value is paid to investors when the bonds mature. Because zero coupon bonds are very sensitive to changes in interest rates, prices of long-term zero coupon bonds gained nicely as long-term rates slid lower.
Mixed impact from holding pre-refunded municipal bonds
The Series’ had exposure to the intermediate-term portion of the municipal yield curve partly through a position in pre-refunded municipal bonds that was greater than that of the Index. A pre-refunded bond is a bond whose maturity is shortened when an issuer takes advantage of a decline in yields by issuing new bonds at lower interest rates. The proceeds of the new bond deal are used to purchase special government securities that are held in an escrow account. The government securities are used to pay interest on the pre-refunded bond until a predetermined date when the bond will be retired ahead of its original maturity. This process may reduce the issuer’s costs.
Because of the lackluster performance of bonds in the intermediate-term portion of the municipal bond yield curve, the Series’ overweight exposure to pre-refunded bonds detracted from its relative performance. The Series maintains a considerable exposure to pre-refunded bonds because the debt securities provide attractive interest income and most have large unrealized capital gains.
Municipal bond healthcare sector remained in good shape
Healthcare bonds, which outperformed the broader municipal debt market, made a positive contribution to the Series returns. Some healthcare bonds held by the Series performed well after being pre-refunded, reflecting improvement in their credit quality that occurred when the bonds became backed by government securities. In general, the sector did well amid a continued favorable credit environment in which many hospitals benefited from increased patient volumes, good reimbursements, and better financial management. Demographic trends bode well for the sector as an aging U.S. population is expected to increasingly require the services of hospitals and other healthcare institutions.
| | |
| 12 | | Visit our website at www.jennisondryden.com |
Fees and Expenses (Unaudited)
As a shareholder of a Series, you incur two types of costs: (1) transaction costs, including sales charges (loads) on purchase payments and redemptions, as applicable, and (2) ongoing costs, including management fees, distribution and/or service (12b-1) fees, and other Series expenses, as applicable. This example is intended to help you understand your ongoing costs (in dollars) of investing in each Series and to compare these costs with the ongoing costs of investing in other mutual funds.
The example is based on an investment of $1,000 invested on November 1, 2006, at the beginning of the period, and held through the six-month period ended April 30, 2007. The example is for illustrative purposes only; you should consult the Prospectus for information on initial and subsequent minimum investment requirements.
Each Series’ transfer agent may charge additional fees to holders of certain accounts that are not included in the expenses shown in the table on the following page. These fees apply to Individual Retirement Accounts (IRAs) and Section 403(b) accounts. As of the close of the six-month period covered by the table, IRA fees included an annual maintenance fee of $15 per account (subject to a maximum annual maintenance fee of $25 for all accounts held by the same shareholder). Section 403(b) accounts are charged an annual $25 fiduciary maintenance fee. Some of the fees may vary in amount, or may be waived, based on your total account balance or the number of JennisonDryden or Strategic Partners Funds, including the Series, that you own. You should consider the additional fees that were charged to your Series account over the six-month period when you estimate the total ongoing expenses paid over the period and the impact of these fees on your ending account value, as these additional expenses are not reflected in the information provided in the expense table. Additional fees have the effect of reducing investment returns.
Actual Expenses
The first line for each share class in the table on the following page provides information about actual account values and actual expenses. You may use the information on this line, together with the amount you invested, to estimate the expenses that you paid over the period. Simply divide your account value by $1,000 (for example, an $8,600 account value ÷ $1,000 = 8.6), then multiply the result by the number on the first line under the heading “Expenses Paid During the Six-Month Period” to estimate the expenses you paid on your account during this period.
Hypothetical Example for Comparison Purposes
The second line for each share class in the table on the following page provides information about hypothetical account values and hypothetical expenses based on
| | |
| Dryden Municipal Bond Fund | | 13 |
Fees and Expenses (continued)
the Series’ actual expense ratio and an assumed rate of return of 5% per year before expenses, which is not the Series’ actual return. The hypothetical account values and expenses may not be used to estimate the actual ending account balance or expenses you paid for the period. You may use this information to compare the ongoing costs of investing in the Series and other funds. To do so, compare this 5% hypothetical example with the 5% hypothetical examples that appear in the shareholder reports of the other funds.
Please note that the expenses shown in the table are meant to highlight your ongoing costs only, and do not reflect any transactional costs such as sales charges (loads). Therefore the second line for each share class in the table is useful in comparing ongoing costs only, and will not help you determine the relative total costs of owning different funds. In addition, if these transactional costs were included, your costs would have been higher.
| | | | | | | | | | | | | | |
Dryden Municipal Bond
Fund/High Income
Series | | Beginning Account
Value
November 1, 2006 | | Ending Account
Value April 30, 2007 | | Annualized
Expense Ratio
Based on the
Six-Month Period | | | Expenses Paid
During the
Six-Month
Period* |
| | | | | | | | | | | | | | | |
| Class A | | Actual | | $ | 1,000.00 | | $ | 1,020.30 | | 0.84 | % | | $ | 4.21 |
| | | Hypothetical | | $ | 1,000.00 | | $ | 1,020.63 | | 0.84 | % | | $ | 4.21 |
| | | | | | | | | | | | | | | |
| Class B | | Actual | | $ | 1,000.00 | | $ | 1,019.00 | | 1.09 | % | | $ | 5.46 |
| | | Hypothetical | | $ | 1,000.00 | | $ | 1,019.39 | | 1.09 | % | | $ | 5.46 |
| | | | | | | | | | | | | | | |
| Class C | | Actual | | $ | 1,000.00 | | $ | 1,017.80 | | 1.34 | % | | $ | 6.70 |
| | | Hypothetical | | $ | 1,000.00 | | $ | 1,018.15 | | 1.34 | % | | $ | 6.71 |
| | | | | | | | | | | | | | | |
| Class Z | | Actual | | $ | 1,000.00 | | $ | 1,021.60 | | 0.59 | % | | $ | 2.96 |
| | | Hypothetical | | $ | 1,000.00 | | $ | 1,021.87 | | 0.59 | % | | $ | 2.96 |
| | |
| 14 | | Visit our website at www.jennisondryden.com |
| | | | | | | | | | | | | | |
Dryden Municipal
Bond Fund/
Insured Series | | Beginning Account
Value
November 1, 2006 | | Ending Account
Value April 30, 2007 | | Annualized
Expense Ratio
Based on the
Six-Month Period | | | Expenses Paid
During the
Six-Month
Period* |
| | | | | | | | | | | | | | | |
| Class A | | Actual | | $ | 1,000.00 | | $ | 1,013.40 | | 0.88 | % | | $ | 4.39 |
| | | Hypothetical | | $ | 1,000.00 | | $ | 1,020.43 | | 0.88 | % | | $ | 4.41 |
| | | | | | | | | | | | | | | |
| Class B | | Actual | | $ | 1,000.00 | | $ | 1,012.20 | | 1.13 | % | | $ | 5.64 |
| | | Hypothetical | | $ | 1,000.00 | | $ | 1,019.19 | | 1.13 | % | | $ | 5.66 |
| | | | | | | | | | | | | | | |
| Class C | | Actual | | $ | 1,000.00 | | $ | 1,010.90 | | 1.38 | % | | $ | 6.88 |
| | | Hypothetical | | $ | 1,000.00 | | $ | 1,017.95 | | 1.38 | % | | $ | 6.90 |
| | | | | | | | | | | | | | | |
| Class Z | | Actual | | $ | 1,000.00 | | $ | 1,014.70 | | 0.63 | % | | $ | 3.15 |
| | | Hypothetical | | $ | 1,000.00 | | $ | 1,021.67 | | 0.63 | % | | $ | 3.16 |
* Fund expenses (net of fee waivers or subsidies, if any) for each share class are equal to the annualized expense ratio for each share class (provided in the table), multiplied by the average account value over the period, multiplied by the 181 days in the six-month period ended April 30, 2007, and divided by the 365 days in the Fund’s fiscal year ended April 30, 2007 (to reflect the six-month period). Expenses presented in the table include the expenses of any underlying portfolios in which the Fund may invest.
| | |
| Dryden Municipal Bond Fund | | 15 |
Portfolio of Investments
as of April 30, 2007
| | | | | | | | | | | | |
| Description (a) | | Moody’s
Rating*
(Unaudited) | | Interest
Rate | | Maturity
Date | | Principal
Amount (000) | | Value (Note 1) |
| | | | | | | | | | | | |
LONG-TERM INVESTMENTS 99.8% | | | | | | | | |
| | | | | |
Alabama 1.0% | | | | | | | | | | | | |
Alabama Spl. Care Facs. Fing. Auth. Mobile Rev., Ascension Health Sr. Credit, Ser. D | | Aa2 | | 5.00% | | 11/15/39 | | $ | 3,000 | | $ | 3,102,540 |
Camden Ind. Dev. Brd. Facs. Rev., Rfdg. Weyerhaeuser,
Ser. A | | BBB(b) | | 6.125 | | 12/1/24 | | | 1,000 | | | 1,094,190 |
Ser. B, A.M.T. | | BBB(b) | | 6.375 | | 12/1/24 | | | 1,000 | | | 1,097,150 |
| | | | | | | | | | | | |
| | | | | | | | | | | | 5,293,880 |
| | | | | |
Arizona 2.7% | | | | | | | | | | | | |
Coconino Cnty. Poll. Ctrl. Corp. Rev., Tuscon Elec. Pwr., Navajo, | | | | | | | | | | | | |
Ser. A, A.M.T. | | Baa3 | | 7.125 | | 10/1/32 | | | 5,000 | | | 5,148,450 |
Ser. B | | Baa3 | | 7.00 | | 10/1/32 | | | 1,700 | | | 1,749,827 |
Maricopa Cnty. Indl. Dev. Auth. Hlth. Facs. Rev., Catholic Hlthcare. West, Ser. A | | A2 | | 5.25 | | 7/1/32 | | | 2,500 | | | 2,634,800 |
Pima Cnty. Indl. Dev. Auth. Ed. Rev. Fac.-P.L.C. Charter Schs. Proj. | | NR | | 6.75 | | 4/1/36 | | | 1,500 | | | 1,603,440 |
Pinal Cnty Correct. Facs. Rev., Florence West Prison PJ-A | | A(b) | | 5.25 | | 10/1/19 | | | 3,135 | | | 3,346,048 |
| | | | | | | | | | | | |
| | | | | | | | | | | | 14,482,565 |
| | | | | |
California 10.5% | | | | | | | | | | | | |
California Poll. Ctrl. Fin. Auth. Solid Wste. Disp. Rev. Wste. Mgmt., Inc. PJ-Ser. B, A.M.T. | | BBB(b) | | 5.00 | | 7/1/27 | | | 1,000 | | | 1,016,680 |
California St. Pub. Wks. Brd. Lease Rev., Dept. Mental Hlth., Coalinga, | | | | | | | | | | | | |
Ser. A | | A2 | | 5.50 | | 6/1/19 | | | 2,000 | | | 2,199,760 |
Ser. A | | A2 | | 5.50 | | 6/1/20 | | | 2,000 | | | 2,200,280 |
Ser. A | | A2 | | 5.50 | | 6/1/22 | | | 2,000 | | | 2,200,280 |
California St., G.O. | | A1 | | 4.50 | | 8/1/30 | | | 4,000 | | | 3,954,240 |
California Statewide Cmntys Dev. Auth. Rev., Kaiser Permanente, Ser. C (Mandatory put date 6/1/12) | | A+(b) | | 3.85 | | 11/1/29 | | | 2,000 | | | 1,987,540 |
Ser. C Rmkt. 8/1/06 | | A+(b) | | 5.25 | | 8/1/31 | | | 1,280 | | | 1,354,893 |
See Notes to Financial Statements.
| | |
| Dryden Municipal Bond Fund/High Income Series | | 17 |
Portfolio of Investments
as of April 30, 2007 Cont’d
| | | | | | | | | | | | |
| Description (a) | | Moody’s
Rating* (Unaudited) | | Interest
Rate | | Maturity
Date | | Principal
Amount (000) | | Value (Note 1) |
| | | | | | | | | | | | |
Capistrano Uni. Sch. Dist. Cmnty. Facs., Rev. Talega CFD#90-2 | | NR | | 6.00% | | 9/1/33 | | $ | 1,000 | | $ | 1,062,010 |
Central California Joint Pwr. Hlth. Fin. Auth., Cmnty. Hosps. of Central California, C.O.P. | | Baa2 | | 6.00 | | 2/1/30 | | | 2,550 | | | 2,664,291 |
City of Chula Vista Indl. Dev. Rev., San Diego, A.M.T. | | A1 | | 5.00 | | 12/1/27 | | | 1,000 | | | 1,047,710 |
Foothill/Eastern Trans. Corridor Agcy. Toll Rd. Rev., C.A.B.S. (Converts to 5.875% on 7/15/09) | | Baa3 | | Zero | | 1/15/28 | | | 6,700 | | | 6,265,370 |
Lake Elsinore Spl. Tax Cmnty. Facs. Dist.-2-Area A-A | | NR | | 5.45 | | 9/1/36 | | | 1,500 | | | 1,551,150 |
Lincoln Impvt. Bond Act 1915, Pub. Fin. Auth. Rev., Twelve Bridges | | NR | | 6.20 | | 9/2/25 | | | 3,390 | | | 3,556,856 |
Los Angeles Regional Airports Impt. Corp. Lse. Rev., American Airlines, Inc., A.M.T. | | Caa1 | | 7.50 | | 12/1/24 | | | 2,000 | | | 2,267,640 |
Murrieta Cmnty. Facs. Dist. Spl. Tax., No. 2, The Oaks Impt. Area, Ser. A | | NR | | 5.90 | | 9/1/27 | | | 1,000 | | | 1,063,460 |
Orange Cnty, Loc. Trans. Auth. Sales Tax Rev., Linked, S.A.V.R.S., R.I.B.S. | | Aa2 | | 6.20 | | 2/14/11 | | | 7,000 | | | 7,595,419 |
Perris Cmnty. Facs. Dist., Spec. Tax, No. 01- 2, Avalon Ser. A | | NR | | 6.25 | | 9/1/23 | | | 3,000 | | | 3,251,940 |
Rancho Cordova Cmnty. Facs. Dist., Spec. Tax No. 2003-1, | | | | | | | | | | | | |
Sunridge Anatolia | | NR | | 6.00 | | 9/1/33 | | | 1,000 | | | 1,023,350 |
Sunridge Anatolia | | NR | | 6.10 | | 9/1/37 | | | 2,000 | | | 2,049,060 |
Roseville Joint Unified High School Dist., Ser. B, G.O., F.G.I.C., C.A.B.S. | | Aaa | | Zero | | 8/1/11 | | | 1,440 | | | 1,224,936 |
Saugus Uni. Sch. Dist. Spl. Tax Cmnty. Facs. Dist. No. 2002-1 | | NR | | 6.00 | | 9/1/33 | | | 1,800 | | | 1,910,106 |
Vallejo, Touro Univ., C.O.P. | | Ba2 | | 7.375 | | 6/1/29 | | | 3,500 | | | 3,734,290 |
Valley Hlth. Sys. Hosp. Rev., Rfdg. & Impvt. Proj., Ser. A | | B+(b) | | 6.50 | | 5/15/25 | | | 1,000 | | | 1,006,240 |
See Notes to Financial Statements.
| | |
| 18 | | Visit our website at www.jennisondryden.com |
| | | | | | | | | | | | | |
| Description (a) | | Moody’s
Rating*
(Unaudited) | | Interest
Rate | | Maturity
Date | | Principal
Amount (000) | | | Value (Note 1) |
| | | | | | | | | | | | | |
Wm. S. Hart Unif. High Sch. Dist., Spl. Tax Cmnty. Fac. Dist. No. 2005-1 | | NR | | 5.30% | | 9/1/36 | | $ | 1,000 | | | $ | 1,027,720 |
| | | | | | | | | | | | | |
| | | | | | | | | | | | | 57,215,221 |
Colorado 3.3% | | | | | | | | | | | | | |
Black Hawk Bus. Impvt. Dist. Utl. (Prerefunded 12/1/09) | | NR | | 7.75 | | 12/1/19 | | | 5,285 | (d) | | | 5,872,058 |
Colorado Health Facs. Auth. Rev., Rfdg. Adventist Hlth./Sunbelt Ser. D | | A2 | | 5.25 | | 11/15/35 | | | 2,250 | | | | 2,370,758 |
Christian Living Cmntys. Proj., Ser. A | | NR | | 5.75 | | 1/1/37 | | | 1,500 | | | | 1,571,355 |
Rfdg. Hosp. Poudre Valley Hlthcare. | | Baa2 | | 5.00 | | 3/1/25 | | | 5,560 | | | | 5,675,259 |
Colorado Springs Hosp. Rev., (Prerefunded 12/15/10) | | A3 | | 6.375 | | 12/15/30 | | | 1,240 | (e) | | | 1,358,370 |
Unrefunded balance | | A3 | | 6.375 | | 12/15/30 | | | 1,260 | | | | 1,359,817 |
| | | | | | | | | | | | | |
| | | | | | | | | | | | | 18,207,617 |
| | | | | |
Connecticut 1.9% | | | | | | | | | | | | | |
Connecticut St. G.O. (Prerefunded 11/15/11)(h) | | Aa3 | | 5.00 | | 11/15/19 | | | 10,000 | (e) | | | 10,547,300 |
| | | | | |
Delaware 0.4% | | | | | | | | | | | | | |
Delaware St. Health Facs. Auth. Rev., Beebe Med. Ctr. Proj., Ser. A | | Baa1 | | 5.00 | | 6/1/30 | | | 2,000 | | | | 2,035,860 |
| | | | |
District of Columbia 0.8% | | | | | | | | | | | |
Dist. of Columbia Rev.,
George Washington Univ., Ser. A, M.B.I.A. | | Aaa | | 5.125 | | 9/15/31 | | | 3,000 | | | | 3,107,640 |
Friendship Pub. Charter Sch., A.C.A. | | A(b) | | 5.00 | | 6/1/35 | | | 1,100 | | | | 1,137,290 |
| | | | | | | | | | | | | |
| | | | | | | | | | | | | 4,244,930 |
| | | | | |
Florida 5.2% | | | | | | | | | | | | | |
Greater Orlando Aviation Auth., Orlando Arpt. Fac. Rev.,
Spl. Purp.-Jetblue Airways Corp., A.M.T. | | NR | | 6.375 | | 11/15/26 | | | 2,000 | | | | 2,122,660 |
See Notes to Financial Statements.
| | |
| Dryden Municipal Bond Fund/High Income Series | | 19 |
Portfolio of Investments
as of April 30, 2007 Cont’d
| | | | | | | | | | | | | |
| Description (a) | | Moody’s
Rating*
(Unaudited) | | Interest
Rate | | Maturity
Date | | Principal
Amount (000) | | | Value (Note 1) |
| | | | | | | | | | | | | |
Spl. Purp.-Jetblue Airways Corp., A.M.T. | | NR | | 6.50% | | 11/15/36 | | $ | 2,000 | | | $ | 2,133,120 |
Highlands Cmnty. Dev. Dist. Spl. Assmt. | | NR | | 5.55 | | 5/1/36 | | | 500 | | | | 511,010 |
Highlands Cnty. Hlth. Facs. Auth. Rev., Hosp.-Adventist Hlth. Sys. Ser.-C | | A2 | | 5.25 | | 11/15/36 | | | 2,000 | | | | 2,093,160 |
Indigo Cmnty. Dev. Dist. Cap. Impvt. Rev. | | NR | | 5.75 | | 5/1/36 | | | 2,000 | | | | 2,040,360 |
Jacksonville Aviation Auth. Rev., A.M.B.A.C., A.M.T. | | Aaa | | 5.00 | | 10/1/26 | | | 2,000 | | | | 2,094,800 |
Jacksonville Econ. Dev. Commn., Anheuser Busch Co., Ser. B, A.M.T. | | A2 | | 4.75 | | 3/1/47 | | | 3,000 | | | | 2,941,950 |
Lee Mem. Hlth. Sys. Hosp. Rev., Ser. A | | A2 | | 5.00 | | 4/1/32 | | | 5,000 | | | | 5,125,600 |
Miami Beach Hlth. Facs. Auth. Hosp. Rev., Mount Sinai Med. Ctr., Ser. A | | Ba1 | | 6.70 | | 11/15/19 | | | 1,000 | | | | 1,091,410 |
Orlando Util. Cmnty. Wtr. & Elec. Rev., Ser. D, E.T.M. | | AA(b) | | 6.75 | | 10/1/17 | | | 2,000 | (e) | | | 2,372,120 |
Palm Beach Cnty. Pub. Impvt. Rev., Convention Ctr. Proj., F.G.I.C. (Mandatory put date 11/1/11) | | Aaa | | 5.00 | | 11/1/30 | | | 2,500 | | | | 2,622,025 |
Paseo Cmnty Dev. Dist. Cap. Impvt. Rev., Ser. A | | NR | | 5.40 | | 5/1/36 | | | 1,400 | | | | 1,418,914 |
Reunion West Cmnty. Dev. Dist. Spec. Assmt. | | NR | | 6.25 | | 5/1/36 | | | 1,500 | | | | 1,594,485 |
Stoneybrook West Cmnty. Dev. Dist. Spec. Assmt. Rev., Ser. B | | NR | | 6.45 | | 5/1/10 | | | 240 | | | | 241,507 |
| | | | | | | | | | | | | |
| | | | | | | | | | | | | 28,403,121 |
| | | | | |
Georgia 0.4% | | | | | | | | | | | | | |
Fulton Cnty. Residential Care Facs. Rev., Canterbury Court Proj., Ser. A | | NR | | 6.125 | | 2/15/34 | | | 1,200 | | | | 1,267,872 |
Henry Cnty. Wtr. & Swr. Auth. Rev., A.M.B.A.C. | | Aaa | | 6.15 | | 2/1/20 | | | 1,000 | | | | 1,208,600 |
| | | | | | | | | | | | | |
| | | | | | | | | | | | | 2,476,472 |
See Notes to Financial Statements.
| | |
| 20 | | Visit our website at www.jennisondryden.com |
| | | | | | | | | | | | | |
| Description (a) | | Moody’s
Rating*
(Unaudited) | | Interest
Rate | | Maturity
Date | | Principal
Amount (000) | | | Value (Note 1) |
| | | | | | | | | | | | | |
Hawaii 0.4% | | | | | | | | | | | | | |
Hawaii St., Ser. DD, G.O., M.B.I.A. | | Aaa | | 5.25% | | 5/1/24 | | $ | 2,000 | | | $ | 2,157,720 |
| | | | | |
Illinois 9.4% | | | | | | | | | | | | | |
Cary Spec. Tax Svcs. Rev.,
Area No. 1, Cambridge, Ser. A
(Prerefunded 3/1/10) | | NR | | 7.625 | | 3/1/30 | | | 3,115 | (e) | | | 3,461,450 |
Area No. 2, Foxford Hill (Prerefunded 3/1/10) | | NR | | 7.50 | | 3/1/30 | | | 4,572 | (e) | | | 4,981,423 |
Gilberts Spec. Svcs. Area No. 9, Spec. Tax, Big Timber Proj. (Prerefunded 3/1/11) | | AAA(b) | | 7.75 | | 3/1/27 | | | 5,000 | (e) | | | 5,763,600 |
Illinois Fin. Auth. Rev., Friendship Vlg. Schaumburg, Ser. A | | NR | | 5.625 | | 2/15/37 | | | 1,000 | | | | 1,032,030 |
Illinois Inst. of Technology, Ser. A | | Baa1 | | 5.00 | | 4/1/31 | | | 2,500 | | | | 2,572,400 |
Illinois Inst. of Technology, Ser. A | | Baa1 | | 5.00 | | 4/1/36 | | | 5,000 | | | | 5,093,450 |
Noble Network Charter Schs. Ser. C, A.C.A. | | A(b) | | 5.00 | | 9/1/31 | | | 2,000 | | | | 2,080,060 |
Northwestern Mem. Hosp., Ser. A | | Aa2 | | 5.25 | | 8/15/34 | | | 5,000 | | | | 5,303,900 |
Plymouth Landing Proj. | | NR | | 6.00 | | 5/15/37 | | | 1,000 | | | | 1,065,790 |
Student Hsg. Rfdg. Edl. Advancement Fd., Inc. Ser. B | | Baa3 | | 5.00 | | 5/1/30 | | | 5,000 | | | | 5,113,900 |
Illinois Hlth. Facs. Auth. Rev., Lake Forest Hosp., Ser. A | | A3 | | 6.25 | | 7/1/22 | | | 4,200 | | | | 4,579,764 |
Kane & De Kalb Cntys. Sch. Dist., No. 301, A.M.B.A.C., C.A.B.S., G.O. | | Aaa | | Zero | | 12/1/11 | | | 3,360 | | | | 2,812,018 |
Metro. Pier & Expo. Auth. Dedicated St. Tax Rev., McCormick Place Expansion, Ser. A, M.B.I.A. | | Aaa | | 5.25 | | 6/15/42 | | | 6,000 | | | | 6,366,779 |
Round Lake Rev., Lakewood Spl. Tax #1 (Prerefunded 3/1/13) | | NR | | 6.70 | | 3/1/33 | | | 1,000 | (e) | | | 1,146,410 |
| | | | | | | | | | | | | |
| | | | | | | | | | | | | 51,372,974 |
See Notes to Financial Statements.
| | |
| Dryden Municipal Bond Fund/High Income Series | | 21 |
Portfolio of Investments
as of April 30, 2007 Cont’d
| | | | | | | | | | | | | |
| Description (a) | | Moody’s
Rating*
(Unaudited) | | Interest
Rate | | Maturity
Date | | Principal
Amount (000) | | | Value (Note 1) |
| | | | | | | | | | | | | |
Indiana 1.4% | | | | | | | | | | | | | |
Indiana Hlth. Fac. Fin. Auth. Hosp. Rev., Cmnty. Foundation Northwest Ind., Ser. A | | BBB-(b) | | 6.00% | | 3/1/34 | | $ | 3,000 | | | $ | 3,223,710 |
Indiana St. Hsg. Fin. Auth. Singl. Fam. Mtge. Rev., Ser. B2, A.M.T., G.N.M.A./F.N.M.A. | | Aaa | | 4.00 | | 1/1/34 | | | 1,440 | | | | 1,428,710 |
Noblesville Redev. Auth. Economic Dev. Rev. Lease Rental 146th Str. Extn., Ser. A | | A+(b) | | 5.25 | | 8/1/25 | | | 3,000 | | | | 3,210,750 |
| | | | | | | | | | | | | |
| | | | | | | | | | | | | 7,863,170 |
| | | | | |
Iowa 0.7% | | | | | | | | | | | | | |
Iowa Fin. Auth. Sr. Living Fac. Rev., Deerfield Ret. Cmnty. Inc., Ser. A | | NR | | 5.50 | | 11/15/37 | | | 1,250 | | | | 1,280,100 |
Iowa St. Fin. Auth. Hlthcare., Facs. Rev., Mercy Hlth. Initiatives Proj.
(Prerefunded 7/1/11) | | AAA(b) | | 9.25 | | 7/1/25 | | | 2,210 | (e) | | | 2,691,007 |
| | | | | | | | | | | | | |
| | | | | | | | | | | | | 3,971,107 |
| | | | | |
Kansas 0.5% | | | | | | | | | | | | | |
University of Kansas Hosp. Auth. Hlth. Fac., Sys. Rev., Rfdg. & Impt. Hlth. Sys. | | A(b) | | 5.00 | | 9/1/36 | | | 2,830 | | | | 2,895,543 |
| | | | | |
Louisiana 0.7% | | | | | | | | | | | | | |
Calcasieu Parish, Inc., Ind. Dev. Brd. Rev., Rfdg. Olin Corp. Proj. | | Baa3 | | 6.625 | | 2/1/16 | | | 3,500 | | | | 3,742,760 |
| | | | | |
Maine 0.8% | | | | | | | | | | | | | |
Maine Hlth. & Higher Edl. Facs. Auth. Rev. Piper Shores, | | | | | | | | | | | | | |
Ser. A (Prerefunded 1/1/09) | | NR | | 7.50 | | 1/1/19 | | | 1,000 | (e) | | | 1,054,900 |
Ser. A (Prerefunded 1/1/09) | | NR | | 7.55 | | 1/1/29 | | | 3,000 | (e) | | | 3,167,100 |
| | | | | | | | | | | | | |
| | | | | | | | | | | | | 4,222,000 |
See Notes to Financial Statements.
| | |
| 22 | | Visit our website at www.jennisondryden.com |
| | | | | | | | | | | | | |
| Description (a) | | Moody’s
Rating*
(Unaudited) | | Interest
Rate | | Maturity
Date | | Principal
Amount (000) | | | Value (Note 1) |
| | | | | | | | | | | | | |
Maryland 1.5% | | | | | | | | | | | | | |
Anne Arundel Cnty. Spec. Oblig., Arundel Mills Proj. (Prerefunded 7/1/09)(d) | | AAA(b) | | 7.10% | | 7/1/29 | | $ | 3,000 | (e) | | $ | 3,262,200 |
Maryland St. Hth. & Higher Edl. Facs. Auth. Rev., Medstar Health | | A3 | | 5.25 | | 5/15/46 | | | 2,500 | | | | 2,611,150 |
Northeast Wste. Disp. Auth. Rev., | | | | | | | | | | | | | |
Sludge Corp. Facs. | | NR | | 7.25 | | 7/1/07 | | | 534 | | | | 536,579 |
Sludge Corp. Facs., A.M.T. | | NR | | 8.50 | | 7/1/07 | | | 1,645 | | | | 1,656,301 |
| | | | | | | | | | | | | |
| | | | | | | | | | | | | 8,066,230 |
| | | | | |
Massachusetts 2.3% | | | | | | | | | | | | | |
Massachusetts St. Coll. Bldg., Auth. Rev. Proj. & Rfdg. Bonds, Ser. A | | Aa2 | | 7.50 | | 5/1/14 | | | 1,750 | | | | 2,088,013 |
Massachusetts St. Dev. Fin. Agcy. Rev., Hlthcare. Fac., Alliance, Ser. A | | NR | | 7.10 | | 7/1/32 | | | 4,010 | | | | 4,180,465 |
Massachusetts St. Hlth. & Edl. Facs. Auth. Rev., Caritas Christi Oblig. Group, Rfdg., | | | | | | | | | | | | | |
Ser. A | | Baa3 | | 5.75 | | 7/1/28 | | | 2,000 | | | | 2,070,300 |
Ser. B | | Baa3 | | 6.75 | | 7/1/16 | | | 3,595 | | | | 4,019,102 |
Massachusetts St. Wtr. Poll. Abatement Trust Rev., Poll Proj., Ser. 9 | | Aaa | | 5.25 | | 8/1/33 | | | 150 | | | | 159,675 |
| | | | | | | | | | | | | |
| | | | | | | | | | | | | 12,517,555 |
| | | | | |
Michigan 4.1% | | | | | | | | | | | | | |
Kalamazoo Hosp. Fin. Auth., Borgess Hosp. Fac.
Rev., E.T.M., F.G.I.C.(j) | | Aaa | | 5.244 | | 6/1/11 | | | 2,000 | (e) | | | 2,004,880 |
Kent Hosp. Fin. Auth. Rev., Metro. Hosp. Proj.,
Ser. A | | BBB(b) | | 6.25 | | 7/1/40 | | | 3,000 | | | | 3,346,680 |
Michigan Pub. Edl. Facs. Auth. Rev. Rfdg. Ltd. Oblig.-Black River Sch. | | NR | | 5.80 | | 9/1/30 | | | 1,250 | | | | 1,286,188 |
See Notes to Financial Statements.
| | |
| Dryden Municipal Bond Fund/High Income Series | | 23 |
Portfolio of Investments
as of April 30, 2007 Cont’d
| | | | | | | | | | | | | |
| Description (a) | | Moody’s
Rating*
(Unaudited) | | Interest
Rate | | Maturity
Date | | Principal
Amount (000) | | | Value (Note 1) |
| | | | | | | | | | | | | |
Michigan St. Hosp Fin. Auth. Rev., Ascension Hlth. Sub Credit, Ser. A | | Aa3 | | 5.00% | | 11/1/12 | | $ | 1,250 | | | $ | 1,314,538 |
Rfdg.-Henry Ford Hlth. Sys.,
Ser. A | | A1 | | 5.25 | | 11/15/46 | | | 3,000 | | | | 3,148,230 |
Trinty Hlth. Cr. Group Ser. A | | Aa2 | | 5.00 | | 12/1/31 | | | 6,000 | | | | 6,259,799 |
Michigan Strategic Fund Solid Waste Disp. Rev., A.M.T. | | BBB(b) | | 4.50 | | 12/1/13 | | | 1,000 | | | | 1,005,630 |
Summit Academy,
Pub. Sch., Academy Rev. Rfdg. | | BB+(b) | | 6.25 | | 11/1/25 | | | 2,060 | | | | 2,151,011 |
North Pub. Sch., Academy Rev. Rfdg. | | BB+(b) | | 5.50 | | 11/1/30 | | | 1,500 | | | | 1,517,250 |
| | | | | | | | | | | | | |
| | | | | | | | | | | | | 22,034,206 |
| | | | | |
Minnesota 0.3% | | | | | | | | | | | | | |
Minnesota St. Higher Ed. Facs. Auth. Rev., St. Olaf College, Ser. Six O | | A2 | | 4.50 | | 10/1/32 | | | 500 | | | | 494,755 |
St. Paul Hsg. & Redev. Auth. Hosp. Rev. Healtheast Proj. | | Baa3 | | 6.00 | | 11/15/35 | | | 1,000 | | | | 1,102,320 |
| | | | | | | | | | | | | |
| | | | | | | | | | | | | 1,597,075 |
| | | | | |
Nebraska 0.4% | | | | | | | | | | | | | |
Central Plains Energy Proj. Nebgas. Proj. Rev.,
Proj. No1 | | Aa3 | | 4.248 | | 12/1/26 | | | 2,000 | | | | 2,002,000 |
| | | | | |
Nevada 2.6% | | | | | | | | | | | | | |
Clark Cnty. Impvt. Dist. Rev.,
No. 121, Southern Highlands Area (Prerefunded 12/1/09) | | NR | | 7.50 | | 12/1/19 | | | 4,655 | (e) | | | 5,128,041 |
Spec. Impvt. Dist. No. 142, Loc. Impvt. | | NR | | 6.10 | | 8/1/18 | | | 1,990 | | | | 2,055,252 |
Clark Cnty. Ind. Dev. Rev., Rfdg. Nevada Pwr. Co. Proj., Ser. C | | B(b) | | 5.50 | | 10/1/30 | | | 4,500 | | | | 4,486,860 |
Washoe Cnty. Wtr. Fac. Rev., Sierra Pac. Pwr. Co., A.M.T. (Mandatory put date 7/1/09) | | Ba1 | | 5.00 | | 3/1/36 | | | 2,500 | | | | 2,525,150 |
| | | | | | | | | | | | | |
| | | | | | | | | | | | | 14,195,303 |
See Notes to Financial Statements.
| | |
| 24 | | Visit our website at www.jennisondryden.com |
| | | | | | | | | | | | | |
| Description (a) | | Moody’s
Rating*
(Unaudited) | | Interest
Rate | | Maturity
Date | | Principal
Amount (000) | | | Value (Note 1) |
| | | | | | | | | | | | | |
New Jersey 7.7% | | | | | | | | | | | | | |
New Jersey Econ. Dev. Auth. Rev., | | | | | | | | | | | | | |
Cigarette Tax | | Baa2 | | 5.625% | | 6/15/19 | | $ | 1,250 | | | $ | 1,305,050 |
Cigarette Tax | | Baa2 | | 5.75 | | 6/15/34 | | | 750 | | | | 807,180 |
Gloucester Marine, Ser. B, A.M.T. | | NR | | 6.875 | | 1/1/37 | | | 3,000 | | | | 3,216,990 |
Kapkowski Rd. Landfill, Ser. A, C.A.B.S., E.T.M. | | Baa3 | | Zero | | 4/1/12 | | | 1,115 | (e) | | | 925,617 |
Rfdg. First Mtge. Franciscan Oaks Proj. | | NR | | 5.70 | | 10/1/17 | | | 165 | | | | 168,227 |
Spec. Facs. Rev., Continental Air., Inc. Proj., A.M.T. | | B3 | | 6.25 | | 9/15/29 | | | 5,530 | | | | 5,714,868 |
New Jersey Hlthcare. Facs. Fin. Auth. Rev., Cherry Hill Proj. | | NR | | 8.00 | | 7/1/27 | | | 2,000 | | | | 2,040,920 |
St. Peters Univ. Hosp., Ser. A | | Baa1 | | 6.875 | | 7/1/30 | | | 2,250 | | | | 2,438,505 |
New Jersey St. Edl. Facs. Auth. Rev., Felician Coll. of Lodi, Ser. D | | NR | | 7.375 | | 11/1/22 | | | 3,375 | | | | 3,495,353 |
New Jersey St. Tpke. Auth. Tpke. Rev., Growth & Income. Secs., Ser. B, A.M.B.A.C., C.A.B.S., (Converts to 5.15% on 1/1/15) | | Aaa | | Zero | | 1/1/35 | | | 4,000 | | | | 2,886,480 |
New Jersey St. Transn. Tr. Fd. Transn, Sys., Ser. A | | A1 | | 5.50 | | 12/15/23 | | | 4,000 | | | | 4,607,120 |
Tobacco Settlement Fin. Corp., NJ Rev.,
Asset Bkd. (Prerefunded 6/1/13) | | Aaa | | 6.75 | | 6/1/39 | | | 1,000 | (e) | | | 1,161,850 |
Asset Bkd. (Prerefunded 6/1/12) | | Aaa | | 6.125 | | 6/1/42 | | | 1,000 | (e) | | | 1,110,960 |
Asset Bkd. (Prerefunded 6/1/13) | | Aaa | | 6.25 | | 6/1/43 | | | 5,250 | (e) | | | 5,958,068 |
Ser. 1A | | Baa3 | | 5.00 | | 6/1/41 | | | 6,000 | | | | 5,902,260 |
| | | | | | | | | | | | | |
| | | | | | | | | | | | | 41,739,448 |
| | | | | |
New Mexico 1.1% | | | | | | | | | | | | | |
Farmington Poll. Ctrl. Rev., El Paso Elec. Co. Proj., Ser. A, F.G.I.C. (Mandatory put date 8/1/12) | | Aaa | | 4.00 | | 6/1/32 | | | 2,000 | | | | 1,998,020 |
See Notes to Financial Statements.
| | |
| Dryden Municipal Bond Fund/High Income Series | | 25 |
Portfolio of Investments
as of April 30, 2007 Cont’d
| | | | | | | | | | | | | |
| Description (a) | | Moody’s
Rating*
(Unaudited) | | Interest
Rate | | Maturity
Date | | Principal
Amount (000) | | | Value (Note 1) |
| | | | | | | | | | | | | |
New Mexico Mtge. Fin. Auth. Rev., Sngl. Fam. Mtge., | | | | | | | | | | | | | |
Ser. A, A.M.T., G.N.M.A., F.N.M.A., F.H.L.M.C. | | Aaa | | 5.50% | | 7/1/36 | | $ | 1,720 | | | $ | 1,810,833 |
Ser. E, A.M.T., G.N.M.A., F.N.M.A., F.H.L.M.C. | | AAA(b) | | 5.50 | | 7/1/35 | | | 2,110 | | | | 2,223,413 |
| | | | | | | | | | | | | |
| | | | | | | | | | | | | 6,032,266 |
| | | | | |
New York 4.6% | | | | | | | | | | | | | |
Brookhaven Ind. Dev. Agcy. Civic Facs. Rev., Brooks Mem. Hosp. Med. Ctr., Inc., Ser. A (Prerefunded 11/15/10)(f) | | NR | | 8.25 | | 11/15/30 | | | 2,000 | (e) | | | 2,290,800 |
Erie Cnty. Tob. Asset Securitization Corp. Cap. Apprec., | | | | | | | | | | | | | |
Asset Bkd.-1st Sub., Ser. B, C.A.B.S. | | NR | | Zero | | 6/1/47 | | | 5,000 | | | | 518,800 |
Asset Bkd.-2nd Sub., Ser. C, C.A.B.S. | | NR | | Zero | | 6/1/50 | | | 4,000 | | | | 285,800 |
Metro. Trans. Auth. Rev., Svc. Contract, Rfdg., Ser. B, M.B.I.A. | | Aaa | | 5.50 | | 7/1/19 | | | 3,050 | | | | 3,301,534 |
Ser. B | | A2 | | 4.75 | | 11/15/31 | | | 4,000 | | | | 4,108,040 |
New York City Ind. Dev. Agcy., Civic Fac. Rev., Staten Island Univ. Hosp. Proj., Ser. B | | B2 | | 6.375 | | 7/1/31 | | | 990 | | | | 1,049,865 |
Spl. Fac. Rev., American Airlines-JFK Int’l. Arpt., A.M.T. | | B(b) | | 7.125 | | 8/1/11 | | | 3,495 | | | | 3,687,470 |
Spl. Fac. Rev., American Airlines-JFK Int’l. Arpt., A.M.T. | | B(b) | | 7.75 | | 8/1/31 | | | 2,000 | | | | 2,413,580 |
New York Liberty Dev. Corp. Rev., National Sports Museum Proj. A | | NR | | 6.125 | | 2/15/19 | | | 1,250 | | | | 1,315,863 |
New York St. Dorm Auth. Revs., Non St. Supported Debt, Mt. Sinai, | | | | | | | | | | | | | |
NYU Hlth., Rmkt 7/1/05 | | Baa1 | | 5.50 | | 7/1/26 | | | 4,000 | | | | 4,058,040 |
NYU Hlth.,-C-Rmkt 7/1/05 | | Baa1 | | 5.50 | | 7/1/26 | | | 2,000 | | | | 2,034,980 |
| | | | | | | | | | | | | |
| | | | | | | | | | | | | 25,064,772 |
See Notes to Financial Statements.
| | |
| 26 | | Visit our website at www.jennisondryden.com |
| | | | | | | | | | | | | |
| Description (a) | | Moody’s
Rating*
(Unaudited) | | Interest
Rate | | Maturity
Date | | Principal
Amount (000) | | | Value (Note 1) |
| | | | | | | | | | | | | |
North Carolina 0.4% | | | | | | | | | | | | | |
North Carolina Eastern Mun. Pwr. Agcy. Pwr. Sys. Rev., Rfdg., Ser. D | | Baa2 | | 5.125% | | 1/1/26 | | $ | 2,000 | | | $ | 2,082,120 |
| | | | | |
North Dakota 0.4% | | | | | | | | | | | | | |
Ward Cnty. Hlthcare. Facs. Rev., Rfdg. Trinity Oblig., Group B | | BBB+(b) | | 6.25 | | 7/1/21 | | | 2,000 | | | | 2,045,620 |
| | | | | |
Ohio 1.2% | | | | | | | | | | | | | |
Cuyahoga Cnty. Hosp. Facs. Rev., Canton, Inc. Proj. | | Baa2 | | 7.50 | | 1/1/30 | | | 3,000 | | | | 3,286,080 |
Miami Cnty. Hosp. Fac. Rfdg. & Impt.-Upper Vy. Med. Ctr. | | Baa1 | | 5.25 | | 5/15/26 | | | 1,250 | | | | 1,311,413 |
Ohio St. Wtr. Dev. Auth. Solid Wste. Disp. Rev., Wste. Mgmt. Proj., A.M.T. (Mandatory put date 7/1/09) | | BBB(b) | | 4.50 | | 7/1/21 | | | 1,000 | | | | 1,002,200 |
Richland Cnty. Hosp. Facs. Rev., Medcentral Hlth. Sys., Unref., Ser. A | | A-(b) | | 6.125 | | 11/15/16 | | | 335 | | | | 359,244 |
Medcentral Hlth. Sys., Ser. A (Prerefunded 11/15/10) | | A-(b) | | 6.125 | | 11/15/16 | | | 665 | (e) | | | 722,975 |
| | | | | | | | | | | | | |
| | | | | | | | | | | | | 6,681,912 |
| | | | | |
Oklahoma 0.9% | | | | | | | | | | | | | |
Norman Regional Hospital Authority Rev. | | BBB-(b) | | 5.375 | | 9/1/36 | | | 2,000 | | | | 2,097,080 |
Oklahoma Hsg. Fin. Agcy. Sngl. Fam. Rev., Mtge. Homeownership Ln. Prog. Ser. B, A.M.T., G.N.M.A., F.N.M.A. | | Aaa | | 4.875 | | 9/1/33 | | | 2,545 | | | | 2,566,709 |
| | | | | | | | | | | | | |
| | | | | | | | | | | | | 4,663,789 |
| | | | | |
Pennsylvania 5.6% | | | | | | | | | | | | | |
Allegheny Cnty. Hosp.
Dev. Auth. Rev., | | | | | | | | | | | | | |
Hlth. Sys., Ser. B | | Ba3 | | 9.25 | | 11/15/15 | | | 960 | | | | 1,132,445 |
Hlth. Sys., Ser. B | | Ba3 | | 9.25 | | 11/15/22 | | | 1,825 | | | | 2,149,522 |
Ohio Valley Gen. Hosp. Proj., Ser. A | | Baa2 | | 5.125 | | 4/1/35 | | | 1,335 | | | | 1,366,786 |
See Notes to Financial Statements.
| | |
| Dryden Municipal Bond Fund/High Income Series | | 27 |
Portfolio of Investments
as of April 30, 2007 Cont’d
| | | | | | | | | | | | | |
| Description (a) | | Moody’s
Rating*
(Unaudited) | | Interest
Rate | | Maturity
Date | | Principal
Amount (000) | | | Value (Note 1) |
| | | | | | | | | | | | | |
Chester Cnty. Indl. Dev. Auth. Wtr. Facs. Rev., Aqua P.A., Inc. Proj., Ser. A, A.M.T., F.G.I.C. | | AAA(b) | | 5.00% | | 2/1/41 | | $ | 4,000 | | | $ | 4,172,280 |
Cumberland Cnty. Mun. Auth. Ret. Cmnty. Rev., Wesley Affiliated, | | | | | | | | | | | | | |
Ser. A (Prerefunded 1/1/13) | | NR | | 7.25 | | 1/1/35 | | | 2,890 | (e) | | | 3,407,657 |
Ser. A (Prerefunded 1/1/13) | | NR | | 7.25 | | 1/1/35 | | | 1,110 | (e) | | | 1,308,823 |
Fulton Cnty. Indl. Dev. Auth. Hosp. Rev., Med. Ctr. Proj. | | NR | | 5.90 | | 7/1/40 | | | 1,000 | | | | 1,036,870 |
Lancaster Cnty. Hosp. Auth. Rev., Gen. Hosp. Proj. Woods Sch. (Prerefunded 9/15/13) | | AA-(b) | | 5.50 | | 3/15/26 | | | 780 | (e) | | | 855,800 |
Montgomery Cnty. Ind. Dev. Auth. Rev., MTG- Whitemarsh Cont. Care | | NR | | 6.25 | | 2/1/35 | | | 2,450 | | | | 2,594,550 |
Pennsylvania Econ. Dev. Fin. Auth. Res. Recov. Rfdg., Colver Proj., Ser F, A.M.B.A.C., A.M.T. | | Aaa | | 4.625 | | 12/1/18 | | | 1,500 | | | | 1,535,610 |
Philadelphia Auth. For Indl. Dev. Revs., Please Touch Museum Proj. | | BBB-(b) | | 5.25 | | 9/1/31 | | | 1,500 | | | | 1,587,240 |
Philadelphia Hosps & Higher Ed. Facs. Auth. Rev., Children’s Hosp. Philadelphia Proj., Ser. A | | Aa2 | | 4.50 | | 7/1/37 | | | 2,000 | | | | 1,967,440 |
Grad. Hlth. Sys. (cost $1,664,031; purchased 1/22/98)(c)(i)(k) | | Ca | | 7.00 | | 7/1/05 | | | 1,651 | | | | 17 |
Grad. Hlth. Sys. (cost $2,298,709; purchased 1/22/98)(c)(i)(k) | | NR | | 7.25 | | 7/1/18 | | | 2,269 | | | | 23 |
Grad. Hlth. Sys., Ser. A (cost $1,890,089; purchased 1/21/98)(c)(i)(k) | | NR | | 6.25 | | 7/1/13 | | | 1,111 | | | | 11 |
Somerset Cnty. Hosp. Auth. Rev., GF Somers Hlthcare. First Mtge. (cost $1,106,647; purchased 2/10/97)(d)(i)(k) | | NR | | 8.40 | | 6/1/09 | | | 1,095 | | | | 816,323 |
See Notes to Financial Statements.
| | |
| 28 | | Visit our website at www.jennisondryden.com |
| | | | | | | | | | | | | |
| Description (a) | | Moody’s
Rating*
(Unaudited) | | Interest
Rate | | Maturity
Date | | Principal
Amount (000) | | | Value (Note 1) |
| | | | | | | | | | | | | |
GF Somers Hlthcare. First Mtge. (cost $8,898,687; purchased 2/10/97)(d)(i)(k) | | NR | | 8.50% | | 6/1/24 | | $ | 8,805 | | | $ | 6,599,611 |
| | | | | | | | | | | | | |
| | | | | | | | | | | | | 30,531,008 |
| | | | | |
Puerto Rico 3.1% | | | | | | | | | | | | | |
Puerto Rico Comwlth. Govt. Dev. BK. Sr. Notes,
Ser. B | | Baa3 | | 5.00 | | 12/1/15 | | | 2,715 | | | | 2,900,787 |
Ser. C, A.M.T. | | Baa3 | | 5.25 | | 1/1/15 | | | 3,000 | | | | 3,208,590 |
Puerto Rico Comwlth. Hwy. & Transn. Auth. Hwy. Rev., Ser. CC | | Baa2 | | 5.50 | | 7/1/28 | | | 2,500 | | | | 2,879,850 |
Puerto Rico Comwlth. Rfdg. Pub. Impt., G.O., Ser. B | | Baa3 | | 5.00 | | 7/1/35 | | | 5,000 | | | | 5,231,750 |
Puerto Rico Elec. Pwr. Auth. Rev., Ser. | | | | | | | | | | | | | |
Ser. TT | | A3 | | 5.00 | | 07/01/22 | | | 1,000 | | | | 1,060,500 |
Ser. TT | | A3 | | 5.00 | | 07/01/32 | | | 1,250 | | | | 1,315,075 |
| | | | | | | | | | | | | |
| | | | | | | | | | | | | 16,596,552 |
| | | | | |
South Carolina 0.1% | | | | | | | | | | | | | |
South Carolina Jobs Econ. Dev. Auth. Hosp. Facs. Rev., Rfdg. Palmetto Hlth.,
Ser. C (Prerefunded 8/1/13) | | Baa1 | | 6.875 | | 8/1/27 | | | 540 | (e) | | | 629,316 |
| | | | | |
Tennessee 8.3% | | | | | | | | | | | | | |
Bradley Cnty. Ind. Dev. Brd. Rev., Rfdg. Olin Corp. Proj., Ser. C | | Baa3 | | 6.625 | | 11/1/17 | | | 2,000 | | | | 2,195,920 |
Johnson City Hlth. & Edl. Facs. Brd. Hosp. Rev., Rfdg. First Mtge., Mountain States Hlth., Ser. A, M.B.I.A. | | Aaa | | 6.75 | | 7/1/17 | | | 2,000 | | | | 2,412,900 |
Knox Cnty. Hlth. Edl. & Hsg. Facs. Brd. Hosp. Facs. Rev., Covenant Health, Ser. A, C.A.B.S. | | A-(b) | | Zero | | 1/1/35 | | | 1,000 | | | | 252,270 |
Univ. Health Sys., Inc. | | BBB+(b) | | 5.25 | | 4/1/27 | | | 3,000 | | | | 3,122,250 |
Memphis Ctr. City Rev., Fin. Corp., Red Birds, Ser. B (cost $26,000,000; purchased 12/30/98)(i)(k) | | NR | | 6.50 | | 9/1/28 | | | 26,000 | | | | 24,536,199 |
See Notes to Financial Statements.
| | |
| Dryden Municipal Bond Fund/High Income Series | | 29 |
Portfolio of Investments
as of April 30, 2007 Cont’d
| | | | | | | | | | | | | |
| Description (a) | | Moody’s
Rating*
(Unaudited) | | Interest
Rate | | Maturity
Date | | Principal
Amount (000) | | | Value (Note 1) |
| | | | | | | | | | | | | |
Rutherford Cnty. Hlth. & Edl. Facs. GRP Homes Brd., First Mtge. Rev. | | NR | | 9.50% | | 12/1/19 | | $ | 5,100 | | | $ | 5,110,557 |
Shelby Cnty. Hlth. Edl. & Hsg. Fac. Brd. Hosp. Rev., Methodist Hlthcare. (Prerefunded 9/1/12) | | AAA(b) | | 6.50 | | 9/1/26 | | | 2,195 | (e) | | | 2,490,008 |
Methodist Hlthcare., (Prerefunded 9/1/12) | | AAA(b) | | 6.50 | | 9/1/26 | | | 1,305 | (e) | | | 1,480,392 |
Sullivan Cnty. Health Edl. & Hsg. Facs. Hosp. Rev., Wellmont Health Sys. Proj. Ser. C | | BBB+(b) | | 5.25 | | 9/1/36 | | | 1,250 | | | | 1,295,650 |
Tennessee Energy Acquisition Corp. Gas Rev., Ser. C | | Aa3 | | 5.00 | | 2/1/18 | | | 2,000 | | | | 2,142,540 |
| | | | | | | | | | | | | |
| | | | | | | | | | | | | 45,038,686 |
| | | | | |
Texas 7.5% | | | | | | | | | | | | | |
Alliance Arpt. Auth., Inc. Spl. Facs. Rev., American Airlines, Inc. Proj., A.M.T. | | CCC+(b) | | 5.75 | | 12/1/29 | | | 2,500 | | | | 2,537,650 |
Austin Covention Enterprises, Inc., Convention Ctr., Rfdg. Second Tier, Ser. B | | Ba2 | | 5.75 | | 1/1/24 | | | 1,000 | | | | 1,056,870 |
Brazos River Auth. Poll. Ctrl. Rev., TXU Energy Co. LLC Proj., Ser. D (Mandatory put date 10/1/14) | | Baa2 | | 5.40 | | 10/1/29 | | | 1,000 | | | | 1,026,370 |
TXU Energy Co. LLC, A.M.T. | | Baa2 | | 5.40 | | 5/1/29 | | | 2,000 | | | | 2,050,680 |
Dallas Fort Worth Int’l. Arpt. Fac. Impvt. Corp. Rev., | | | | | | | | | | | | | |
American Airlines, Inc., A.M.T. | | Caa1 | | 6.375 | | 5/1/35 | | | 3,000 | | | | 3,105,690 |
American Airlines, Inc., Ser. A. A.M.T. (Mandatory put date 5/1/08) | | Caa1 | | 8.50 | | 5/1/29 | | | 2,000 | | | | 2,075,580 |
American Airlines, Inc., Ser. C, A.M.T. (Mandatory put date 11/1/07) | | Baa1 | | 6.15 | | 5/1/29 | | | 3,950 | | | | 3,964,971 |
Decatur Hosp. Auth. Rev., Wise Reg. Hlth. Sys., Ser. A | | NR | | 7.125 | | 9/1/34 | | | 3,000 | | | | 3,301,170 |
Houston Hlth. Facs. Dev. Corp. Ret. Fac. Rev., Buckingham Sr. Living Cmnty., Ser. A | | NR | | 7.125 | | 2/15/34 | | | 1,250 | | | | 1,395,425 |
See Notes to Financial Statements.
| | |
| 30 | | Visit our website at www.jennisondryden.com |
| | | | | | | | | | | | | |
| Description (a) | | Moody’s
Rating*
(Unaudited) | | Interest
Rate | | Maturity
Date | | Principal
Amount (000) | | | Value (Note 1) |
| | | | | | | | | | | | | |
Katy Dev. Auth. Rev., Tax Increment Contract, Ser. B | | NR | | 6.00% | | 6/1/18 | | $ | 4,000 | | | $ | 4,122,840 |
Kerrville Hlth. Facs. Dev. Corp. Hosp. Rev., Sid Peterson Mem. Hosp. Proj. | | BBB-(b) | | 5.375 | | 8/15/35 | | | 4,050 | | | | 4,227,228 |
Matagorda Cnty. Nav. Dist. No. 1 Rev., Coll. Centerpoint Energy Proj. | | Baa2 | | 5.60 | | 3/1/27 | | | 2,000 | | | | 2,125,060 |
Pollution Ctl. Rev., Rfdg. PJ-B-RMKT, A.M.B.A.C., A.M.T. | | Aaa | | 4.55 | | 5/1/30 | | | 2,000 | | | | 1,948,220 |
North Central Texas Hlth. Fac. Dev. Corp. Rev., Edgemere Ret. Fac. Sr. Hsg., Ser. A (Prerefunded 11/15/09) | | NR | | 7.50 | | 11/15/29 | | | 2,000 | (e) | | | 2,211,920 |
Sabine River Auth. Poll. Ctrl. Rev., TXU Energy Co. LLC Proj., Ser. B | | Baa2 | | 6.15 | | 8/1/22 | | | 1,000 | | | | 1,069,020 |
Texas Mun. Gas Acquisition & Supply Corp I Gas Supply Rev., Sr. Lien, Ser. A | | Aa3 | | 5.25 | | 12/15/26 | | | 3,900 | | | | 4,337,970 |
Texas Mun. Pwr. Agcy. Rev., M.B.I.A., E.T.M., C.A.B.S. | | Aaa | | Zero | | 9/1/15 | | | 50 | (e) | | | 35,979 |
| | | | | | | | | | | | | |
| | | | | | | | | | | | | 40,592,643 |
| | | | | |
Vermont 0.3% | | | | | | | | | | | | | |
Vermont Edl. & Health Blds, Fing. Agy. Rev., Hosp-Fletcher Allen Hlth., Ser A | | Baa1 | | 4.75 | | 12/1/36 | | | 1,500 | | | | 1,476,510 |
| | | | | |
Virgin Islands 0.5% | | | | | | | | | | | | | |
Virgin Islands Pub. Fin. Auth. Refinery Facs. Rev., Ser. Secd. Hovensa Refinery, A.M.T. | | Baa3 | | 4.70 | | 7/1/22 | | | 2,500 | | | | 2,510,075 |
| | | | | |
Virginia 2.9% | | | | | | | | | | | | | |
Chesapeake Hosp. Auth. Fac. Rev., Rfdg. Chesapeake Gen. Hosp., Ser. A | | A3 | | 5.25 | | 7/1/17 | | | 3,445 | | | | 3,651,183 |
Chesterfield Cnty. Ind. Dev. Auth. Poll. Ctrl. Rev., Virginia Elec. & Pwr., Ser. A | | Baa1 | | 5.875 | | 6/1/17 | | | 2,000 | | | | 2,142,480 |
See Notes to Financial Statements.
| | |
| Dryden Municipal Bond Fund/High Income Series | | 31 |
Portfolio of Investments
as of April 30, 2007 Cont’d
| | | | | | | | | | | | | |
| Description (a) | | Moody’s
Rating*
(Unaudited) | | Interest
Rate | | Maturity
Date | | Principal
Amount (000) | | | Value (Note 1) |
| | | | | | | | | | | | | |
Gloucester Cnty. Ind. Dev. Auth. Solid Wste Disp. Rev., Wste. Mgmt. Svcs., Ser. A, A.M.T. (Mandatory put date 5/1/14) | | BBB(b) | | 5.125% | | 9/1/38 | | $ | 2,700 | | | $ | 2,812,239 |
Norfolk Redev. & Hsg. Auth. Multi-Fam. Rental Hsg. Fac. Rev., Sussex Apts., A.M.T.(i) | | NR | | 8.00 | | 9/1/26 | | | 5,575 | | | | 5,764,216 |
Sussex Cnty. Ind. Dev. Auth. Solid Wste. Disp. Rev., Atlantic Wste., Ser. A, A.M.T. (Mandatory put date 5/1/14) | | BBB(b) | | 5.125 | | 6/1/28 | | | 1,600 | | | | 1,658,720 |
| | | | | | | | | | | | | |
| | | | | | | | | | | | | 16,028,838 |
| | | | | |
Washington 1.2% | | | | | | | | | | | | | |
Bellevue Conv. Ctr. Auth., King City, Spec. Oblig. Rev., M.B.I.A., C.A.B.S. | | Aaa | | Zero | | 2/1/10 | | | 870 | | | | 782,669 |
Skagit Cnty. Pub. Hosp. Dist. No. 001 Rev.,
Skagit Valley Hosp. | | Baa2 | | 5.375 | | 12/1/22 | | | 1,190 | | | | 1,238,909 |
Skagit Valley Hosp. | | Baa2 | | 5.50 | | 12/1/30 | | | 1,250 | | | | 1,312,725 |
Tobacco Settlement Fin. Corp. Auth. Tobacco Settlement Rev., Asset Bkd. | | Baa3 | | 6.50 | | 6/1/26 | | | 2,485 | | | | 2,734,569 |
Washington St. Pub. Pwr. Sup. Sys. Rev., Nuclear Proj. No. 1, Ser. B, E.T.M. | | Aaa | | 7.25 | | 7/1/09 | | | 575 | (e) | | | 597,023 |
| | | | | | | | | | | | | |
| | | | | | | | | | | | | 6,665,895 |
| | | |
West Virginia 1.4% | | | | | | | | | |
West Virginia St. Hosp. Fin. Auth. Hosp. Rev., Oak Hill Hosp., Ser. B. (Prerefunded 9/1/10) | | A2 | | 6.75 | | 9/1/30 | | | 7,000 | (e) | | | 7,714,139 |
| | | |
Wisconsin 1.3% | | | | | | | | | |
Badger Tobacco Asset Secur. Corp., Rev. Asset Bkd. | | Baa3 | | 6.125 | | 6/1/27 | | | 2,720 | | | | 2,914,099 |
Milwaukee Redev. Auth. Redev. Rev. Science Ed. Consortium Proj., Ser. A | | BB+(b) | | 5.75 | | 8/1/35 | | | 1,500 | | | | 1,527,855 |
See Notes to Financial Statements.
| | |
| 32 | | Visit our website at www.jennisondryden.com |
| | | | | | | | | | | | | |
| Description (a) | | Moody’s
Rating*
(Unaudited) | | Interest
Rate | | Maturity
Date | | Principal
Amount (000) | | Value (Note 1) | |
| | | | | | | | | | | | | |
Wisconsin Hlth. & Edl. Facs. Auth. Rev.,
Beaver Dam Cmnty. Hosp., Inc., Ser. A | | NR | | 6.75% | | 8/15/34 | | $ | 1,250 | | $ | 1,365,500 | |
Eastcastle Place, Inc. Proj. | | NR | | 6.125 | | 12/1/34 | | | 1,000 | | | 1,029,050 | |
| | | | | | | | | | | | | |
| | | | | | | | | | | | 6,836,504 | |
| | | | | | | | | | | | | |
Total long-term investments
(cost $524,592,690) | | | | | | | | | | | | 542,474,702 | |
| | | | | | | | | | | | | |
SHORT-TERM INVESTMENTS 0.5% | | | | | | | | | |
| | | |
Alabama 0.1% | | | | | | | | | |
McIntosh Indl. Dev. Brd. Environ. Impt. Rev., CIBA Specialty Chem. Corp., Ser. E, A.M.T., F.R.D.D.(g) | | P-2 | | 4.43 | | 5/1/07 | | | 300 | | | 300,000 | |
| | | |
Illinois 0.1% | | | | | | | | | |
Will Cnty. Exempt Facs. Rev., BP Amoco Chemical PJ, A.M.T., F.R.D.D.(g) | | VMIG1 | | 4.13 | | 5/1/07 | | | 750 | | | 750,000 | |
| | | |
Montana 0.2% | | | | | | | | | |
Anaconda Deer Lodge Cnty. Mont. Environmental Facs. Rev., A.M.T., F.R.D.D.(g) | | VMIG1 | | 4.13 | | 5/1/07 | | | 1,000 | | | 1,000,000 | |
| | | |
Texas 0.1% | | | | | | | | | |
West Side Calhoun Cnty. Nav. Dist. Environmental Facs. Rev., BP Chemicals Inc., Proj., A.M.T., F.R.D.D.(g) | | A-1+(b) | | 4.13 | | 5/1/07 | | | 400 | | | 400,000 | |
| | | | | | | | | | | | | |
Total short-term investments
(cost $2,450,000) | | | | | | | | | | | | 2,450,000 | |
| | | | | | | | | | | | | |
Total Investments 100.3%
(cost $527,042,751; Note 5) | | | | | | | | | | | | 544,924,702 | |
Liabilities in excess of other
assets(l)(m) (0.3)% | | | | | | | | | | | | (1,761,055 | ) |
| | | | | | | | | | | | | |
Net Assets 100.0% | | | | | | | | | | | $ | 543,163,647 | |
| | | | | | | | | | | | | |
See Notes to Financial Statements.
| | |
| Dryden Municipal Bond Fund/High Income Series | | 33 |
Portfolio of Investments
as of April 30, 2007 Cont’d
| * | The Series’ current Statement of Additional Information contains a description of Moody’s and Standard & Poor’s ratings. |
| (a) | The following abbreviations are used in portfolio descriptions: |
A.C.A.—ACA Financial Guaranty Corporation.
A.M.B.A.C.—American Municipal Bond Assurance Corporation.
A.M.T.—Alternative Minimum Tax.
C.A.B.S.—Capital Appreciation Bonds.
C.O.P.—Certificates of Participation.
E.T.M.—Escrowed to Maturity.
F.G.I.C.—Financial Guaranty Insurance Company.
F.H.L.M.C.—Federal Home Loan Mortgage Corporation.
F.N.M.A.—Federal National Mortgage Association.
F.R.D.D.—Floating Rate (Daily) Demand Note(g).
G.N.M.A.—Government National Mortgage Association.
G.O.—General Obligation.
LLC—Limited Liability Corporation.
M.B.I.A.—Municipal Bond Investors Assurance Company.
NR—Not Rated by Moody’s or Standard & Poor’s.
R.I.B.S.—Residual Interest Bearing Securities.
S.A.V.R.S.—Select Auction Variable Rate Securities.
| (b) | Standard & Poor’s rating. |
| (c) | Represents issuer in default of interest payments; non-income producing security. |
| (d) | Represents issuer in default of interest payments. |
| (e) | All or partial escrowed to maturity and pre-refunded issues are secured by escrowed cash and/or U.S. guaranteed obligations. |
| (f) | All or partial principal amount segregated as initial margin on financial futures contracts. |
| (g) | Indicates a variable rate security. The maturity date presented for these instruments is the later of the next date on which the security can be redeemed at par or the next date on which the rate of interest is adjusted. The interest rate shown reflects the rate in effect at April 30, 2007. |
| (h) | Represents all or partial amount utilized in the Municipal Tender Option Bond transactions. The aggregated principal amount of the inverse floater and the floating rate note (included in liabilities) is $5,000,000 and $5,000,000, respectively. |
| (i) | Indicates a security that has been deemed illiquid. |
| (j) | Inverse floating rate bond. The coupon is inversely indexed to a floating interest rate. The rate shown is the rate as of April 30, 2007. |
| (k) | Indicates a security restricted to resale. The aggregate cost of such securities is $41,858,163. The aggregate value of $31,952,184 is approximately 5.9% of net assets. |
| (l) | Includes $5,000,000 payable for the floating rate note issued. |
| (m) | Liabilities in excess of other assets include net unrealized appreciation (depreciation) on financial futures and interest rate swap as follows: |
See Notes to Financial Statements.
| | |
| 34 | | Visit our website at www.jennisondryden.com |
Open futures contracts outstanding at April 30, 2007:
| | | | | | | | | | | | | | |
Number of
Contracts | | Type | | Expiration
Date | | Value at
April 30,
2007 | | Value at
Trade
Date | | Unrealized
Appreciation
(Depreciation) | |
| | Long Positions: | | | | | | | | | | | | |
| 30 | | U.S. Treasury 5 Yr. Notes | | Jun. 07 | | $ | 3,174,844 | | $ | 3,179,568 | | $ | (4,724 | ) |
| | Short Positions: | | | | | | | | | | | | |
| 55 | | U.S. Treasury 10 Yr. Notes | | Jun. 07 | | | 5,958,047 | | | 5,923,673 | | | (34,374 | ) |
| 130 | | U.S. Treasury 30 Yr. Notes | | Jun. 07 | | | 14,527,500 | | | 14,548,457 | | | 20,957 | |
| | | | | | | | | | | | | | |
| | | | | | | | | | | | $ | (18,141 | ) |
| | | | | | | | | | | | | | |
Interest rate swap agreement outstanding at April 30, 2007:
| | | | | | | | | | | | |
Counterparty (a) | | Termination
Date | | Notional
Amount
(000) | | Fixed
Rate | | Floating
Rate | | Unrealized
Appreciation |
Merrill Lynch Capital Services | | 06/27/19 | | $ | 10,300 | | 3.716% | | 1 week BMA Municipal Swap Index | | $ | 9,067 |
| | | | | | | | | | | | |
| (a) | Fund pays the fixed rate and receives the floating rate. |
The industry classification of long-term portfolio holdings, short-term investments and liabilities in excess of other assets shown as a percentage of net assets as of April 30, 2007 was as follows:
| | | |
Healthcare | | 33.2 | % |
Corporate Backed IDB & PCR | | 15.8 | |
Special Tax/Assessment District | | 12.4 | |
Other | | 11.1 | |
General Obligation | | 5.9 | |
Education | | 5.5 | |
Transportation | | 4.0 | |
Tobacco | | 3.8 | |
Power | | 2.9 | |
Housing | | 2.5 | |
Lease Backed Certificate of Participation | | 1.8 | |
Solid Waste/Resource Recovery | | 0.7 | |
Short-Term Investments | | 0.5 | |
Water & Sewer | | 0.2 | |
| | | |
| | 100.3 | |
Liabilities in excess of other assets | | (0.3 | ) |
| | | |
Net Assets | | 100.0 | % |
| | | |
Industry classification is subject to change.
See Notes to Financial Statements.
| | |
| Dryden Municipal Bond Fund/High Income Series | | 35 |
Statement of Assets and Liabilities
as of April 30, 2007
| | | | |
Assets | | | | |
Unaffiliated investments, at value (cost $527,042,751) | | $ | 544,924,702 | |
Cash | | | 20,667 | |
Interest receivable | | | 8,932,568 | |
Receivable for investment sold | | | 550,847 | |
Receivable for Series shares sold | | | 452,857 | |
Unrealized appreciation on interest rate swaps | | | 9,067 | |
Prepaid expenses | | | 4,521 | |
| | | | |
Total assets | | | 554,895,229 | |
| | | | |
| |
Liabilities | | | | |
Payable for floating rate notes issued | | | 5,000,000 | |
Payable for investments purchased | | | 4,189,308 | |
Payable for Series shares reacquired | | | 896,050 | |
Dividends payable | | | 550,483 | |
Accrued expenses | | | 299,735 | |
Interest expense and fees payable | | | 255,121 | |
Management fee payable | | | 223,834 | |
Distribution fee payable | | | 134,247 | |
Due to broker—variation margin | | | 126,953 | |
Transfer agent fee payable | | | 40,664 | |
Deferred trustees’ fees | | | 15,187 | |
| | | | |
Total liabilities | | | 11,731,582 | |
| | | | |
| |
Net Assets | | $ | 543,163,647 | |
| | | | |
| | | | | |
Net assets were comprised of: | | | | |
Shares of beneficial interest, at par | | $ | 515,859 | |
Paid-in capital in excess of par | | | 575,978,283 | |
| | | | |
| | | 576,494,142 | |
Undistributed net investment income | | | 1,866,802 | |
Accumulated net realized loss on investments, financial futures transactions and swaps | | | (53,070,174 | ) |
Net unrealized appreciation on investments, financial futures transactions and interest rate swaps | | | 17,872,877 | |
| | | | |
Net assets, April 30, 2007 | | $ | 543,163,647 | |
| | | | |
See Notes to Financial Statements.
| | |
| 36 | | Visit our website at www.jennisondryden.com |
| | | |
Class A | | | |
Net asset value and redemption price per share
($444,750,991 ÷ 42,241,534 shares of beneficial interest issued and outstanding) | | $ | 10.53 |
Maximum sales charge (4% of offering price) | | | .44 |
| | | |
Maximum offering price to public | | $ | 10.97 |
| | | |
| |
Class B | | | |
Net asset value, offering price and redemption price per share
($58,278,431 ÷ 5,532,813 shares of beneficial interest issued and outstanding) | | $ | 10.53 |
| | | |
| |
Class C | | | |
Net asset value, offering price and redemption price per share
($30,255,776 ÷ 2,872,466 shares of beneficial interest issued and outstanding) | | $ | 10.53 |
| | | |
| |
Class Z | | | |
Net asset value, offering price and redemption price per share
($9,878,449 ÷ 939,056 shares of beneficial interest issued and outstanding) | | $ | 10.52 |
| | | |
See Notes to Financial Statements.
| | |
| Dryden Municipal Bond Fund/High Income Series | | 37 |
Statement of Operations
Year Ended April 30, 2007
| | | | |
Net Investment Income | | | | |
Income | | | | |
Unaffiliated interest | | $ | 32,941,651 | |
| | | | |
| |
Expenses | | | | |
Management fee | | | 2,796,192 | |
Distribution fee—Class A | | | 1,128,097 | |
Distribution fee—Class B | | | 350,723 | |
Distribution fee—Class C | | | 213,896 | |
Interest expense and fees | | | 255,121 | |
Transfer agent’s fees and expenses (including affiliated expense of $206,900) | | | 235,000 | |
Custodian’s fees and expenses | | | 90,000 | |
Reports to shareholders | | | 75,000 | |
Registration fees | | | 53,000 | |
Audit fee | | | 28,000 | |
Legal fees and expenses | | | 25,000 | |
Trustees’ fees | | | 20,000 | |
Miscellaneous | | | 19,562 | |
| | | | |
Total expenses | | | 5,289,591 | |
Less: Custodian fee credit (Note 1) | | | (749 | ) |
| | | | |
Net expenses | | | 5,288,842 | |
| | | | |
Net investment income | | | 27,652,809 | |
| | | | |
| |
Realized And Unrealized Gain (Loss) On Investments | | | | |
Net realized gain (loss) on: | | | | |
Investment transactions | | | 7,250,318 | |
Financial futures transactions | | | 254,404 | |
Interest rate swaps | | | (126,471 | ) |
| | | | |
| | | 7,378,251 | |
| | | | |
Net change in unrealized appreciation (depreciation) on: | | | | |
Investments | | | 2,732,405 | |
Financial futures transactions | | | (471,345 | ) |
Interest rate swaps | | | 245,551 | |
| | | | |
| | | 2,506,611 | |
| | | | |
Net gain on investments | | | 9,884,862 | |
| | | | |
Net Increase In Net Assets Resulting From Operations | | $ | 37,537,671 | |
| | | | |
See Notes to Financial Statements.
| | |
| 38 | | Visit our website at www.jennisondryden.com |
Statement of Changes in Net Assets
| | | | | | | | |
| | | Year Ended April 30, | |
| | | 2007 | | | 2006 | |
Increase (Decrease) In Net Assets | | | | | | | | |
Operations | | | | | | | | |
Net investment income | | $ | 27,652,809 | | | $ | 30,785,711 | |
Net realized gain (loss) on investments, financial futures transactions and interest rate swaps | | | 7,378,251 | | | | (15,740,743 | ) |
Net change in unrealized appreciation (depreciation) on investments, financial futures and interest rate swaps | | | 2,506,611 | | | | 13,265,946 | |
| | | | | | | | |
Net increase in net assets resulting from operations | | | 37,537,671 | | | | 28,310,914 | |
| | | | | | | | |
| | |
Dividends from net investment income (Note 1) | | | | | | | | |
Class A | | | (21,570,038 | ) | | | (21,806,352 | ) |
Class B | | | (3,174,686 | ) | | | (5,060,707 | ) |
Class C | | | (1,221,320 | ) | | | (1,074,682 | ) |
Class Z | | | (469,819 | ) | | | (532,470 | ) |
| | | | | | | | |
| | | (26,435,863 | ) | | | (28,474,211 | ) |
| | | | | | | | |
| | |
Series share transactions (Net of share conversions) (Note 6) | | | | | | | | |
Net proceeds from shares sold | | | 32,293,361 | | | | 29,403,230 | |
Net asset value of shares issued in reinvestment of dividends | | | 14,073,450 | | | | 13,984,438 | |
Cost of shares reacquired | | | (86,426,740 | ) | | | (106,944,388 | ) |
| | | | | | | | |
Net decrease in net assets from Series share transactions | | | (40,059,929 | ) | | | (63,556,720 | ) |
| | | | | | | | |
Total decrease | | | (28,958,121 | ) | | | (63,720,017 | ) |
| | |
Net Assets | | | | | | | | |
Beginning of year | | | 572,121,768 | | | | 635,841,785 | |
| | | | | | | | |
End of year(a) | | $ | 543,163,647 | | | $ | 572,121,768 | |
| | | | | | | | |
(a) Includes undistributed net investment income of: | | $ | 1,866,802 | | | $ | 1,615,042 | |
| | | | | | | | |
See Notes to Financial Statements.
| | |
| Dryden Municipal Bond Fund/High Income Series | | 39 |
Portfolio of Investments
as of April 30, 2007
| | | | | | | | | | | | | |
| Description (a) | | Moody’s Rating* (Unaudited) | | Interest Rate | | Maturity
Date | | Principal
Amount (000) | | | Value (Note 1) |
| | | | | | | | | | | | | |
| | | | | | | | | | | | | |
LONG-TERM INVESTMENTS 98.6% | | | | | | | | | |
| | | | |
California 6.3% | | | | | | | | | | | |
California Hlth. Facs. Fin., Auth. Rev. Cedar-Sinai Med. Ctr. | | A2 | | 5.00% | | 11/15/21 | | $ | 1,000 | | | $ | 1,035,110 |
California St., G.O., M.B.I.A. | | Aaa | | 5.25 | | 2/01/27 | | | 5,000 | | | | 5,299,600 |
Golden St. Tobacco Securitization Corp. Tobacco Settlement Rev., Asset Bkd., Ser. B, C.A.B.S., A.M.B.A.C. (Converts to 4.60% on 6/01/10) | | Aaa | | Zero | | 6/01/23 | | | 1,500 | | | | 1,329,000 |
San Joaquin Hills Trans. Corridor Agcy. Toll Rd. Rev., Ser. A, C.A.B.S., M.B.I.A. | | Aaa | | Zero | | 1/15/36 | | | 10,000 | | | | 2,826,600 |
University Rev., Hosp., UCLA Med. Ctr., Ser. A, A.M.B.A.C. | | Aaa | | 5.25 | | 5/15/30 | | | 3,000 | | | | 3,180,090 |
| | | | | | | | | | | | | |
| | | | | | | | | | | | | 13,670,400 |
| | | | |
Colorado 3.9% | | | | | | | | | | | |
Denver City & Cnty. Arpt. Rev., | | | | | | | | | | | | | |
Ser. A, F.G.I.C. | | Aaa | | 5.00 | | 11/15/16 | | | 2,000 | | | | 2,167,720 |
Ser. A, F.G.I.C. | | Aaa | | 5.00 | | 11/15/25 | | | 3,500 | | | | 3,721,025 |
Ser. B, A.M.T., F.G.I.C. | | Aaa | | 5.00 | | 11/15/15 | | | 2,500 | | | | 2,666,850 |
| | | | | | | | | | | | | |
| | | | | | | | | | | | | 8,555,595 |
| | | | |
District of Columbia 3.9% | | | | | | | | | | | |
Dist. of Columbia Rev., George Washington Univ., Ser. A, M.B.I.A. | | Aaa | | 5.125 | | 9/15/31 | | | 2,000 | | | | 2,071,760 |
Dist. of Columbia, G.O., | | | | | | | | | | | | | |
Ser. A, E.T.M., M.B.I.A.(c) | | Aaa | | 6.50 | | 6/01/10 | | | 2,905 | (d) | | | 3,140,044 |
Ser. A, M.B.I.A. | | Aaa | | 6.50 | | 6/01/10 | | | 3,095 | (d) | | | 3,338,855 |
| | | | | | | | | | | | | |
| | | | | | | | | | | | | 8,550,659 |
See Notes to Financial Statements.
| | |
| 40 | | Visit our website at www.jennisondryden.com |
| | | | | | | | | | | | |
| Description (a) | | Moody’s Rating* (Unaudited) | | Interest Rate | | Maturity
Date | | Principal
Amount (000) | | Value (Note 1) |
| | | | | | | | | | | | |
Florida 2.2% | | | | | | | | | | |
Jacksonville Economic Dev. Comm. Hlth. Care Facs. Rev. Mayo Clinic | | Aa2 | | 5.00% | | 11/15/36 | | $ | 1,500 | | $ | 1,564,230 |
Polk Cnty. Sch. Dist., | | | | | | | | | | | | |
Sales Tax Rev., F.S.A. | | Aaa | | 5.25 | | 10/01/17 | | | 1,580 | | | 1,724,933 |
Sales Tax Rev., F.S.A. | | Aaa | | 5.25 | | 10/01/18 | | | 1,325 | | | 1,438,354 |
| | | | | | | | | | | | |
| | | | | | | | | | | | 4,727,517 |
| | | | |
Georgia 2.6% | | | | | | | | | | |
Atlanta Arpt. Facs. Rev., Ser. A, A.M.B.A.C., E.T.M.(c) | | Aaa | | 6.50 | | 1/01/10 | | | 2,000 | | | 2,138,340 |
Newnan Hosp. Auth. Rev., M.B.I.A. | | Aaa | | 5.50 | | 1/01/21 | | | 3,185 | | | 3,426,678 |
| | | | | | | | | | | | |
| | | | | | | | | | | | 5,565,018 |
| | | | |
Hawaii 3.9% | | | | | | | | | | |
Hawaii Dept. Budget & Fin., Hawaiian Elec. Co. Projs. Rev., Ser. C, A.M.B.A.C., A.M.T. | | Aaa | | 6.20 | | 11/01/29 | | | 8,000 | | | 8,498,639 |
| | | | |
Idaho 2.5% | | | | | | | | | | |
Idaho Hsg. & Fin. Assn., Fed. Hwy. Tr., M.B.I.A. | | Aaa | | 5.00 | | 7/15/21 | | | 5,000 | | | 5,373,700 |
| | | | | |
Illinois 11.7% | | | | | | | | | | | | |
Chicago Midway Arpt. Rev., Ser. B, M.B.I.A., A.M.T. | | Aaa | | 5.75 | | 1/01/22 | | | 5,000 | | | 5,056,400 |
Chicago O’Hare Int’l Arpt. Rev., Pass. Facs. Chrg., Ser. A, A.M.B.A.C. | | Aaa | | 5.625 | | 1/01/15 | | | 2,000 | | | 2,022,700 |
Ser. A, M.B.I.A. | | Aaa | | 5.25 | | 1/01/26 | | | 4,000 | | | 4,323,440 |
Ser. B, F.G.I.C. | | Aaa | | 5.25 | | 1/01/15 | | | 1,000 | | | 1,088,690 |
Illinois St. Toll Hwy. Auth. Toll Hwy. Rev.,
Ser. A-1, F.S.A. | | Aaa | | 5.00 | | 1/01/24 | | | 5,000 | | | 5,325,050 |
Illinois St., G.O., F.S.A. | | Aaa | | 5.25 | | 4/01/22 | | | 2,500 | | | 2,645,075 |
See Notes to Financial Statements.
| | |
| Dryden Municipal Bond Fund/Insured Series | | 41 |
Portfolio of Investments
as of April 30, 2007 Cont’d
| | | | | | | | | | | | |
| Description (a) | | Moody’s Rating* (Unaudited) | | Interest Rate | | Maturity
Date | | Principal
Amount (000) | | Value (Note 1) |
| | | | | | | | | | | | |
Metro. Pier & Exposition Auth. Dedicated St. Tax Rev., McCormick,
Ser. A, C.A.B.S., M.B.I.A. | | Aaa | | Zero | | 12/15/34 | | | $10,000 | | $ | 2,948,600 |
Ser. A, C.A.B.S., M.B.I.A. | | Aaa | | Zero | | 6/15/37 | | | 7,500 | | | 1,962,675 |
| | | | | | | | | | | | |
| | | | | | | | | | | | 25,372,630 |
| | | | | |
Indiana 5.8% | | | | | | | | | | | | |
Indiana Fin. Auth. Hwy. Rev., Ref., Ser. A, F.G.I.C. | | Aaa | | 5.00% | | 12/01/16 | | | 1,595 | | | 1,726,460 |
Indianapolis Local Pub. Impt. Bd. Bk., Rev., Indianapolis Airport Auth., A.M.T., A.M.B.A.C. | | Aaa | | 5.00 | | 1/01/36 | | | 2,500 | | | 2,615,875 |
Waterworks Proj., Ser. A, M.B.I.A. | | Aaa | | 5.50 | | 7/01/18 | | | 3,540 | | | 4,031,494 |
Purdue Univ. Ind., Ctfs. Partn. | | Aa1 | | 5.25 | | 7/01/24 | | | 3,780 | | | 4,261,874 |
| | | | | | | | | | | | |
| | | | | | | | | | | | 12,635,703 |
| | | | | |
Louisiana 0.8% | | | | | | | | | | | | |
New Orleans, G.O., M.B.I.A. | | Aaa | | 5.25 | | 12/01/22 | | | 1,540 | | | 1,663,570 |
| | | | | |
Massachusetts 3.3% | | | | | | | | | | | | |
Massachusetts Bay Tran. Auth. Sales Tax Rev.,
Ser. B, M.B.I.A. | | Aaa | | 5.50 | | 7/01/27 | | | 1,325 | | | 1,571,728 |
Massachusetts St. Ref., Ser. B, F.S.A. | | Aaa | | 5.25 | | 9/01/24 | | | 3,000 | | | 3,424,920 |
Massachusetts St. Sch. Bldg. Auth. Dedicated Sales Tax Rev., Ser. A, A.M.B.A.C. | | Aaa | | 4.75 | | 8/15/32 | | | 2,000 | | | 2,069,040 |
| | | | | | | | | | | | |
| | | | | | | | | | | | 7,065,688 |
| | | | | |
Michigan 2.7% | | | | | | | | | | | | |
Detroit Wtr. Sup. Sys. Rev., Ser. B, M.B.I.A. (Prerefunded date 7/01/13)(c) | | Aaa | | 5.25 | | 7/01/32 | | | 5,500 | | | 5,944,070 |
See Notes to Financial Statements.
| | |
| 42 | | Visit our website at www.jennisondryden.com |
| | | | | | | | | | | | |
| Description (a) | | Moody’s Rating* (Unaudited) | | Interest Rate | | Maturity
Date | | Principal
Amount (000) | | Value (Note 1) |
| | | | | | | | | | | | |
Minnesota 1.5% | | | | | | | | | | | | |
Minneapolis & St. Paul Metro. Arpts. Rev., Ser. C, F.G.I.C. (Prerefunded date 1/01/11)(c) | | Aaa | | 5.50% | | 1/01/19 | | $ | 3,000 | | $ | 3,183,540 |
| | | | | |
New Jersey 5.5% | | | | | | | | | | | | |
Jersey City Swr. Auth., Rev.,
A.M.B.A.C. | | Aaa | | 6.00 | | 1/01/10 | | | 2,585 | | | 2,735,990 |
A.M.B.A.C. | | Aaa | | 6.25 | | 1/01/14 | | | 4,255 | | | 4,726,752 |
New Jersey St. Tpke. Auth. Rev., Growth & Inc. Secs., Ser. B, A.M.B.A.C., C.A.B.S. (Converts to 5.15% on 1/01/15) | | Aaa | | Zero | | 1/01/35 | | | 1,500 | | | 1,082,430 |
New Jersey St. Transn. Tr. Fd. Auth. Rev., Transn. Sys., Ser. B, M.B.I.A. | | Aaa | | 5.50 | | 12/15/15 | | | 3,000 | | | 3,358,110 |
| | | | | | | | | | | | |
| | | | | | | | | | | | 11,903,282 |
| | | | | |
New York 9.4% | | | | | | | | | | | | |
Erie Cnty. Ind. Dev. Agcy. Sch. Facs. Rev., City of Buffalo Proj., F.S.A. | | Aaa | | 5.75 | | 5/01/21 | | | 2,750 | | | 3,001,378 |
Islip Res. Rec. Agy. Rev., Ser. B, A.M.B.A.C., A.M.T. | | Aaa | | 7.20 | | 7/01/10 | | | 1,750 | | | 1,919,383 |
Metro. Trans. Auth. N.Y. Svc. Contract, Rfdg. Rev., Ser. B, | | | | | | | | | | | | |
M.B.I.A. | | Aaa | | 5.50 | | 7/01/19 | | | 5,000 | | | 5,412,350 |
M.B.I.A. | | Aaa | | 5.50 | | 7/01/23 | | | 7,285 | | | 7,864,449 |
New York Convention Ctr. Dev. Corp., Rev., Hotel Unit Fee, A.M.B.A.C. | | Aaa | | 5.00 | | 11/15/30 | | | 2,000 | | | 2,116,760 |
| | | | | | | | | | | | |
| | | | | | | | | | | | 20,314,320 |
| | | | | |
Ohio 1.0% | | | | | | | | | | | | |
Miami Univ. Gen. Rcpts. Rev., A.M.B.A.C. | | Aaa | | 5.25 | | 9/01/17 | | | 2,010 | | | 2,240,185 |
See Notes to Financial Statements.
| | |
| Dryden Municipal Bond Fund/Insured Series | | 43 |
Portfolio of Investments
as of April 30, 2007 Cont’d
| | | | | | | | | | | | |
| Description (a) | | Moody’s Rating* (Unaudited) | | Interest Rate | | Maturity
Date | | Principal
Amount (000) | | Value (Note 1) |
| | | | | | | | | | | | |
Oklahoma 2.4% | | | | | | | | | | | | |
Oklahoma City Arpt. Trust, Jr. Lien Rev., Ser. B, A.M.B.A.C. | | Aaa | | 5.00% | | 7/01/21 | | $ | 2,330 | | $ | 2,502,816 |
Ser. 24, A.M.B.A.C., A.M.T. | | Aaa | | 5.75 | | 2/01/18 | | | 2,620 | | | 2,623,432 |
| | | | | | | | | | | | |
| | | | | | | | | | | | 5,126,248 |
| | | | | |
Pennsylvania 6.4% | | | | | | | | | | | | |
Pennsylvania Econ. Dev. Fin. Auth. Res. Recov. Rev., Colver Proj., Ser. F, A.M.B.A.C., A.M.T. | | Aaa | | 5.00 | | 12/01/15 | | | 2,500 | | | 2,665,475 |
Colver Proj., Ser F, Ref., A.M.B.A.C., A.M.T. | | Aaa | | 4.625 | | 12/01/18 | | | 1,250 | | | 1,279,675 |
Pennsylvania St. Ind. Dev. Auth. Rev., Econ. Dev., A.M.B.A.C. | | Aaa | | 5.50 | | 7/01/17 | | | 5,000 | | | 5,422,950 |
Pennsylvania St. Tpk. Commn. Rev., Ser. A, F.S.A. | | Aaa | | 5.25 | | 7/15/21 | | | 2,000 | | | 2,261,860 |
Philadelphia Wtr. & Swr. Rev., Wtr. Util. Impvt., Ser. A, F.S.A. | | Aaa | | 5.25 | | 7/01/20 | | | 2,000 | | | 2,171,200 |
| | | | | | | | | | | | |
| | | | | | | | | | | | 13,801,160 |
| | | | | |
Puerto Rico 3.2% | | | | | | | | | | | | |
Puerto Rico Comwlth. Hwy. & Transit Auth., Trans. Rev., | | | | | | | | | | | | |
Ser. I, F.G.I.C. | | Aaa | | 5.00 | | 7/01/25 | | | 3,000 | | | 3,184,650 |
Ser. I, F.G.I.C. | | Aaa | | 5.00 | | 7/01/26 | | | 3,465 | | | 3,676,538 |
| | | | | | | | | | | | |
| | | | | | | | | | | | 6,861,188 |
| | | | | |
South Carolina 2.1% | | | | | | | | | | | | |
Lexington Wtr. & Swr., Rev., Ser. A, M.B.I.A. | | Aaa | | 5.75 | | 4/01/20 | | | 4,180 | | | 4,446,517 |
See Notes to Financial Statements.
| | |
| 44 | | Visit our website at www.jennisondryden.com |
| | | | | | | | | | | | |
| Description (a) | | Moody’s Rating* (Unaudited) | | Interest Rate | | Maturity
Date | | Principal
Amount (000) | | Value (Note 1) |
| | | | | | | | | | | | |
Texas 9.1% | | | | | | | | | | | | |
Austin Convention Enterprises, Inc., Convention Ctr. Ref. First Tier, Ser. A, X.L.C.A. | | Aaa | | 5.00% | | 1/01/34 | | $ | 1,000 | | $ | 1,053,230 |
Corpus Christi Util., | | | | | | | | | | | | |
Sys. Rev., Ser. A, F.S.A. (Prerefunded date 7/15/10)(c) | | Aaa | | 6.00 | | 7/15/19 | | | 3,255 | | | 3,478,293 |
Sys. Rev., Ser. A, F.S.A. (Prerefunded date 7/15/10)(c) | | Aaa | | 6.00 | | 7/15/20 | | | 3,450 | | | 3,686,670 |
Houston Arpt. Sys. Rev., E.T.M.(c) | | Aaa | | 7.20 | | 7/01/13 | | | 2,750 | | | 3,041,280 |
Keller Indpt. Sch. Dist. Sch. Bldg. Rev., G.O., P.S.F.G. | | Aaa | | 4.75 | | 8/15/32 | | | 3,000 | | | 3,093,480 |
Northside Tex. Indpt. Sch. Dist. Ref., Ser. D, | | | | | | | | | | | | |
G.O., P.S.F.G. | | Aaa | | 5.00 | | 6/15/28 | | | 5,150 | | | 5,451,378 |
| | | | | | | | | | | | |
| | | | | | | | | | | | 19,804,331 |
| | | | | |
Utah 1.0% | | | | | | | | | | | | |
Intermountain Pwr.Agy. Pwr. Supply Rev., Ser. A, A.M.B.A.C. | | Aaa | | 5.00 | | 7/01/17 | | | 2,000 | | | 2,179,620 |
| | | | | |
Washington 6.9% | | | | | | | | | | | | |
Clark Cnty. Sch. Dist. No. 114, Evergreen, G.O., F.S.A. | | Aaa | | 5.25 | | 12/01/18 | | | 3,800 | | | 4,048,900 |
Port Seattle Wash. Rev., Ref. Interm. Lien, X.L.C.A. | | Aaa | | 5.00 | | 2/01/28 | | | 3,000 | | | 3,162,840 |
Snohomish Cnty. Ltd. Tax, G.O., M.B.I.A. | | Aaa | | 5.375 | | 12/01/19 | | | 2,000 | | | 2,130,500 |
Washington St. Health Care Facs. Auth. Rev., Providence Healthcare, Ser. A, F.G.I.C. (Prerefunded Date 10/01/16)(c) | | Aaa | | 5.00 | | 10/01/36 | | | 85 | | | 92,659 |
See Notes to Financial Statements.
| | |
| Dryden Municipal Bond Fund/Insured Series | | 45 |
Portfolio of Investments
as of April 30, 2007 Cont’d
| | | | | | | | | | | | |
| Description (a) | | Moody’s Rating* (Unaudited) | | Interest Rate | | Maturity
Date | | Principal
Amount (000) | | Value (Note 1) |
| | | | | | | | | | | | |
Unrefunded Bal., Providence Health, Ser. A, F.G.I.C | | Aaa | | 5.00% | | 10/01/36 | | $ | 2,915 | | $ | 3,062,353 |
Washington St. Hsg. Fin. Comn. Rev., Sngl. Fam. Pg., Ser. 2A, A.M.T., G.N.M.A./F.N.M.A. | | Aaa | | 5.375 | | 12/01/18 | | | 2,505 | | | 2,551,393 |
| | | | | | | | | | | | |
| | | | | | | | | | | | 15,048,645 |
| | | | | |
West Virginia 0.5% | | | | | | | | | | | | |
West Virginia St. Wtr. Dev. Auth. Rev., Ser. B, A.M.B.A.C., A.M.T. | | Aaa | | 5.875 | | 7/01/20 | | | 1,015 | | | 1,078,762 |
| | | | | | | | | | | | |
Total long-term investments
(cost $204,445,760) | | | | | | | | | | | | 213,610,987 |
| | | | | | | | | | | | |
| | | | |
SHORT-TERM INVESTMENT 0.2% | | | | | | | | | | |
| | | | | |
Texas | | | | | | | | | | | | |
Dallas-Fort Worth Texas Regl. Arpt. Rev., Mun. Sec. Tr. Rcpts. SGA 49, M.B.I.A., F.R.D.D., A.M.T. (cost $500,000) | | A-1+(b) | | 4.05(e) | | 5/01/07 | | | 500 | | | 500,000 |
| | | | | | | | | | | | |
Total Investments 98.8%
(cost $204,945,760; Note 5) | | | | | | | | | | | | 214,110,987 |
Other assets in excess of liabilities(f) 1.2% | | | | | | | | | | | | 2,644,585 |
| | | | | | | | | | | | |
Net Assets 100.0% | | | | | | | | | | | $ | 216,755,572 |
| | | | | | | | | | | | |
| * | The Series’ current Statement of Additional Information contains a description of Moody’s and Standard & Poor’s ratings. |
| (a) | The following abbreviations are used in portfolio descriptions: |
A.M.B.A.C.—American Municipal Bond Assurance Corporation.
A.M.T.—Alternative Minimum Tax.
C.A.B.S.—Capital Appreciation Bonds.
E.T.M.—Escrowed to Maturity.
F.G.I.C.—Financial Guaranty Insurance Company.
F.N.M.A.—Federal National Mortgage Association.
F.R.D.D.—Floating Rate Daily Demand Note(e).
See Notes to Financial Statements.
| | |
| 46 | | Visit our website at www.jennisondryden.com |
F.S.A.—Financial Security Assurance.
G.N.M.A.—Government National Mortgage Association.
G.O.—General Obligation.
M.B.I.A.—Municipal Bond Investors Assurance Company.
P.S.F.G.—Permanent School Fund Guaranty.
X.L.C.A.—XL Capital Assurance.
| (b) | Standard & Poor’s rating. |
| (c) | All or partial escrowed to maturity and prerefunded securities are secured by escrowed cash and/or U.S. government guaranteed obligations. |
| (d) | All or partial amount segregated as initial margin on financial futures contracts. |
| (e) | Indicates a variable rate security. The maturity date presented for these instruments is the later of the next date on which the security can be redeemed at par or the next date on which the rate of interest is adjusted. The interest rate shown reflects the rate in effect at April 30, 2007. |
| (f) | Other assets in excess of liabilities include net unrealized appreciation (depreciation) on financial futures as follows: |
Open futures contracts outstanding at April 30, 2007:
| | | | | | | | | | | | | | |
Number of
Contracts | | Type | | Expiration
Date | | Value at
April 30,
2007 | | Value at Trade
Date | | Unrealized
Appreciation/
(Depreciation) | |
| | Short Positions: | | | | | | | | | | | | |
| 32 | | U.S. Treasury 5 Yr. Notes | | Jun. 07 | | $ | 3,386,500 | | $ | 3,371,940 | | $ | (14,560 | ) |
| 60 | | U.S. Treasury 30 Yr. Bond | | Jun. 07 | | | 6,705,000 | | | 6,713,808 | | | 8,808 | |
| | | | | | | | | | | | | | |
| | | | | | | | | | | | $ | (5,752 | ) |
| | | | | | | | | | | | | | |
The industry classification of long-term portfolio holdings, short-term investment and other assets in excess of liabilities shown as a percentage of net assets as of April 30, 2007 was as follows:
| | | |
Transportation | | 35.7 | % |
General Obligation | | 15.8 | |
Water & Sewer | | 14.9 | |
Special Tax/Assessment District | | 7.9 | |
Healthcare | | 5.7 | |
Education | | 4.0 | |
Corporate Backed IDB & PCR | | 3.9 | |
Solid Waste/Resource Recovery | | 2.7 | |
Pooled Financing | | 2.5 | |
Lease Backed Certificate of Participation | | 2.2 | |
Housing | | 1.2 | |
Power | | 1.0 | |
Tobacco Appropriated | | 0.6 | |
Other | | 0.5 | |
Short-Term Investment | | 0.2 | |
| | | |
| | 98.8 | |
Other assets in excess of liabilities | | 1.2 | |
| | | |
Net Assets | | 100.0 | % |
| | | |
Industry classification is subject to change.
See Notes to Financial Statements.
| | |
| Dryden Municipal Bond Fund/Insured Series | | 47 |
Statement of Assets and Liabilities
as of April 30, 2007
| | | |
Assets | | | |
Unaffiliated investments, at value (cost $204,945,760) | | $ | 214,110,987 |
Cash | | | 19,091 |
Interest receivable | | | 3,375,355 |
Receivable for Series shares sold | | | 11,482 |
Prepaid expenses | | | 1,876 |
| | | |
Total assets | | | 217,518,791 |
| | | |
| |
Liabilities | | | |
Payable for Series shares reacquired | | | 214,055 |
Dividends payable | | | 180,911 |
Accrued expenses | | | 124,858 |
Management fee payable | | | 89,311 |
Due to broker—variation margin | | | 60,625 |
Distribution fee payable | | | 51,519 |
Transfer agent fee payable | | | 27,736 |
Deferred trustees’ fees | | | 14,204 |
| | | |
Total liabilities | | | 763,219 |
| | | |
| |
Net Assets | | $ | 216,755,572 |
| | | |
| | | | |
Net assets were comprised of: | | | |
Shares of beneficial interest, at par | | $ | 201,960 |
Paid-in capital in excess of par | | | 206,155,300 |
| | | |
| | | 206,357,260 |
Undistributed net investment income | | | 269,768 |
Accumulated net realized gain on investments and financial futures transactions | | | 969,069 |
Net unrealized appreciation on investments and financial futures contracts | | | 9,159,475 |
| | | |
Net assets, April 30, 2007 | | $ | 216,755,572 |
| | | |
See Notes to Financial Statements.
| | |
| 48 | | Visit our website at www.jennisondryden.com |
| | | |
Class A | | | |
Net asset value and redemption price per share
($183,271,493 ÷ 17,079,756 shares of beneficial interest issued and outstanding) | | $ | 10.73 |
Maximum sales charge (4.00% of offering price) | | | .45 |
| | | |
Maximum offering price to public | | $ | 11.18 |
| | | |
| |
Class B | | | |
Net asset value, offering price and redemption price per share
($25,295,423 ÷ 2,353,632 shares of beneficial interest issued and outstanding) | | $ | 10.75 |
| | | |
| |
Class C | | | |
Net asset value, offering price and redemption price per share
($5,570,883 ÷ 518,351 shares of beneficial interest issued and outstanding) | | $ | 10.75 |
| | | |
| |
Class Z | | | |
Net asset value, offering price and redemption price per share
($2,617,773 ÷ 244,280 shares of beneficial interest issued and outstanding) | | $ | 10.72 |
| | | |
See Notes to Financial Statements.
| | |
| Dryden Municipal Bond Fund/Insured Series | | 49 |
Statement of Operations
Year Ended April 30, 2007
| | | | |
Net Investment Income | | | | |
Income | | | | |
Unaffiliated interest | | $ | 10,631,693 | |
| | | | |
| |
Expenses | | | | |
Management fee | | | 1,140,532 | |
Distribution fee—Class A | | | 481,691 | |
Distribution fee—Class B | | | 135,283 | |
Distribution fee—Class C | | | 41,543 | |
Transfer agent’s fees and expenses (including affiliated expense of $98,800) | | | 127,000 | |
Custodian’s fees and expenses | | | 56,000 | |
Registration fees | | | 45,000 | |
Legal fees and expenses | | | 35,000 | |
Audit fee | | | 24,000 | |
Reports to shareholders | | | 20,000 | |
Trustees’ fees | | | 14,000 | |
Miscellaneous | | | 11,178 | |
| | | | |
Total expenses | | | 2,131,227 | |
Less: Custodian fee credit (Note 1) | | | (780 | ) |
| | | | |
Net expenses | | | 2,130,447 | |
| | | | |
Net investment income | | | 8,501,246 | |
| | | | |
| |
Realized And Unrealized Gain (Loss) On Investment Transactions | | | | |
Net realized gain (loss) on: | | | | |
Investment transactions | | | 815,909 | |
Financial futures transactions | | | (23,558 | ) |
| | | | |
| | | 792,351 | |
| | | | |
Net change in unrealized appreciation (depreciation) on: | | | | |
Investments | | | 2,992,502 | |
Financial futures contracts | | | (354,912 | ) |
| | | | |
| | | 2,637,590 | |
| | | | |
Net gain on investment transactions | | | 3,429,941 | |
| | | | |
Net Increase In Net Assets Resulting From Operations | | $ | 11,931,187 | |
| | | | |
See Notes to Financial Statements.
| | |
| 50 | | Visit our website at www.jennisondryden.com |
Statement of Changes in Net Assets
| | | | | | | | |
| | | Year Ended April 30, | |
| | | 2007 | | | 2006 | |
Increase (Decrease) In Net Assets | | | | | | | | |
Operations | | | | | | | | |
Net investment income | | $ | 8,501,246 | | | $ | 10,225,515 | |
Net realized gain on investment transactions and financial futures transactions | | | 792,351 | | | | 3,310,415 | |
Net change in unrealized appreciation (depreciation) on investments and financial futures transactions | | | 2,637,590 | | | | (9,564,795 | ) |
| | | | | | | | |
Net increase in net assets resulting from operations | | | 11,931,187 | | | | 3,971,135 | |
| | | | | | | | |
Dividends and distributions (Note 1) | | | | | | | | |
Dividends from net investment income | | | | | | | | |
Class A | | | (7,204,497 | ) | | | (8,495,339 | ) |
Class B | | | (944,255 | ) | | | (1,266,061 | ) |
Class C | | | (179,669 | ) | | | (216,152 | ) |
Class Z | | | (112,223 | ) | | | (155,897 | ) |
| | | | | | | | |
| | | (8,440,644 | ) | | | (10,133,449 | ) |
| | | | | | | | |
Distributions from net realized gains | | | | | | | | |
Class A | | | (1,131,737 | ) | | | (1,874,458 | ) |
Class B | | | (155,496 | ) | | | (290,276 | ) |
Class C | | | (31,606 | ) | | | (53,264 | ) |
Class Z | | | (18,294 | ) | | | (31,353 | ) |
| | | | | | | | |
| | | (1,337,133 | ) | | | (2,249,351 | ) |
| | | | | | | | |
| | |
Series share transactions (Net of share conversions) (Note 6) | | | | | | | | |
Net proceeds from shares sold | | | 8,362,252 | | | | 5,307,860 | |
Net asset value of shares issued in reinvestment of dividends and distributions | | | 6,218,667 | | | | 7,924,862 | |
Cost of shares reacquired | | | (40,649,767 | ) | | | (60,940,258 | ) |
| | | | | | | | |
Net decrease in net assets from Series share transactions | | | (26,068,848 | ) | | | (47,707,536 | ) |
| | | | | | | | |
Total decrease | | | (23,915,438 | ) | | | (56,119,201 | ) |
| | |
Net Assets | | | | | | | | |
Beginning of year | | | 240,671,010 | | | | 296,790,211 | |
| | | | | | | | |
End of year(a) | | $ | 216,755,572 | | | $ | 240,671,010 | |
| | | | | | | | |
(a) Includes undistributed net investment income of: | | $ | 269,768 | | | $ | 300,775 | |
| | | | | | | | |
See Notes to Financial Statements.
| | |
| Dryden Municipal Bond Fund/Insured Series | | 51 |
Notes to Financial Statements
Dryden Municipal Bond Fund (the “Fund”) is registered under the Investment Company Act of 1940 as a diversified, open-end management investment company. The Fund was organized as an unincorporated business trust in Massachusetts on November 3, 1986 and consists of two series: the “High Income Series” and the “Insured Series”. Investment operations for Class A, Class B, Class C and Class Z shares of each Series commenced on January 22, 1990, September 17, 1987, August 1, 1994 and September 16, 1996, respectively.
The investment objectives of the Series are as follows: (i) the objective of the High Income Series is to provide the maximum amount of income that is eligible for exclusion from federal income taxes, (ii) the objective of the Insured Series is to provide the maximum amount of income that is eligible for exclusion from federal income taxes consistent with the preservation of capital. The ability of issuers of debt securities held by the Fund to meet their obligations may be affected by economic and political developments in a specific state, region or industry.
Note 1. Accounting Policies
The following is a summary of significant accounting policies followed by the Fund in the preparation of its financial statements.
Securities Valuation: The Fund values municipal securities (including commitments to purchase such securities on a “when-issued” basis) as of the normal close of trading on the New York Stock Exchange, on the basis of prices provided by a pricing service which uses information with respect to transactions in comparable securities and various relationships between securities in determining values. Securities listed on a securities exchange (other than options on securities and indices) are valued at the last sale price on such exchange on the day of valuation or, if there was no sale on such day, at the mean between the last reported bid and asked prices, or at the last bid price on such day in the absence of an asked price. Securities that are actively traded in the over-the-counter market, including listed securities for which the primary market is believed by Prudential Investments LLC (“PI” or “Manager”) in consultation with the subadvisor, to be over-the-counter, are valued at market value using prices provided, by an independent pricing agent or principal market maker. Futures contracts and options thereon traded on a commodities exchange or board of trade are valued at the last sale price at the close of trading on such exchange or board of trade or, if there was no sale on the applicable commodities exchange or board of trade on such day, at the mean between the most recently quoted prices on such exchange or board of trade or at the last bid price in the absence of an asked
| | |
| 52 | | Visit our website at www.jennisondryden.com |
price. Securities for which reliable market quotations are not readily available or for which the pricing service does not provide a valuation methodology, or does not present fair value, are valued at fair value in accordance with Board of Trustees’ approved fair valuation procedures. When determining the fair valuation of securities some of the factors influencing the valuation include, the nature of any restrictions on disposition of the securities; assessment of the general liquidity of the securities; the issuer’s financial condition and the markets in which it does business; the cost of the investment; the size of the holding and the capitalization of issuer; the prices of any recent transactions or bids/offers for such securities or any comparable securities; any available analyst media or other reports or information deemed reliable by the investment adviser regarding the issuer or the markets or industry in which it operates. Using fair value to price securities may result in a value that is different from a security’s most recent closing price and from the price used by other mutual funds to calculate their net asset values. Investments in mutual funds are valued at their net asset value as of the close of the New York Stock Exchange on the date of valuation.
Short-term securities which mature in sixty days or less are valued at amortized cost, which approximates market value. Short-term securities which mature in more than sixty days are valued at current market quotations. The amortized cost method involves valuing a security at its cost on the date of purchase and thereafter assuming a constant amortization to maturity of the difference between the principal amount due at maturity and cost.
Financial Futures Contracts: A financial futures contract is an agreement to purchase (long) or sell (short) an agreed amount of securities at a set price for delivery on a future date. Upon entering into a financial futures contract, the Fund is required to pledge to the broker an amount of cash and/or other assets equal to a certain percentage of the contract amount. This amount is known as the “initial margin”. Subsequent payments, known as “variation margin”, are made or received by the Fund each day, depending on the daily fluctuations in the value of the underlying security. Such variation margin is recorded for financial statement purposes on a daily basis as unrealized gain or loss. When the contract expires or is closed, the gain or loss is realized and is presented in the Statement of Operations as net realized gain or loss on financial futures contracts.
The Fund invests in financial futures contracts in order to hedge its existing portfolio securities, or securities the Fund intends to purchase, against fluctuations in value caused by changes in prevailing interest rates or market conditions. Should interest rates move unexpectedly, the Fund may not achieve the anticipated benefits of the financial futures contracts and may realize a loss. The use of futures transactions involves the risk of imperfect correlation in movements in the price of futures contracts, interest rates and the underlying hedged assets.
| | |
| Dryden Municipal Bond Fund | | 53 |
Notes to Financial Statements
Cont’d
Options: The Fund may either purchase or write options in order to hedge against adverse market movements or fluctuations in value caused by changes in prevailing interest rates with respect to securities which the Fund currently owns or intends to purchase. The Fund’s principal reason for writing options is to realize, through receipt of premiums, a greater current return than would be realized on the underlying security alone. When the Fund purchases an option, it pays a premium and an amount equal to that premium is recorded as an asset. When the Fund writes an option, it receives a premium and an amount equal to that premium is recorded as a liability. The asset or liability is adjusted daily to reflect the current market value of the option.
If an option expires unexercised, the Fund realizes a gain or loss to the extent of the premium received or paid. If an option is exercised, the premium received or paid is an adjustment to the proceeds from the sale or the cost of the purchase in determining whether the Fund has realized a gain or loss. The difference between the premium and the amount received or paid on effecting a closing purchase or sale transaction is also treated as a realized gain or loss. Gain or loss on purchased options is included in net realized gain or loss on investment transactions. Gain or loss on written options is presented separately as net realized gain or loss on written options.
The Fund, as writer of an option, has no control over whether the underlying securities may be sold (called) or purchased (put). As a result, the Fund bears the market risk of an unfavorable change in the price of the security underlying the written option. The Fund, as purchaser of an option that is traded in the over-the counter market, bears the risk of the potential inability of the counterparties to meet the terms of their contracts.
Interest Rate Swap: The Fund may enter into interest rate swaps. In a simple interest rate swap, one investor pays a floating rate of interest on a notional amount and receives a fixed rate of interest on the same notional principal amount for a specified period of time. Alternatively, an investor may pay a fixed rate and receive a floating rate. Interest rate swaps were developed as asset/liability management tools. In more complex swaps, the notional principal may decline (or amortize) over time.
During the term of the swap, changes in the value of the swap are recorded as unrealized gains or losses by “marking-to-market” to reflect the market value of the swap. When the swap is terminated, the Fund will record a realized gain or loss equal to the difference between the proceeds from (or cost of) the closing transaction and the fund’s basis in the contract, if any.
| | |
| 54 | | Visit our website at www.jennisondryden.com |
The Fund is exposed to credit loss in the event of non-performance by the other party to the interest rate swap. However, the Fund does not anticipate non-performance by any counterparty.
Written options, future contracts and swap contracts involve elements of both market and credit risk in excess of the amounts reflected in the Statement of Assets and Liabilities.
Inverse Floaters: The Fund invests in variable rate securities commonly called “inverse floaters”. The interest rates on these securities have an inverse relationship to market interest rate of other securities or the value of an index. Changes in interest rates on the other security or index inversely affect the rate paid on the inverse floater, and the inverse floater’s price will be more volatile than that of a fixed-rate bond. Additionally, some of these securities contain a “leverage factor” whereby the interest rate moves inversely by a “factor” to the benchmark rate. Certain interest rate movements and other market factors can substantially affect the liquidity of inverse floating rate notes.
When-Issued/Delayed Delivery Securities: Securities purchased or sold on a when-issued or delayed-delivery basis may be settled a month or more after trade date; interest income is not accrued until settlement date. At the time a Fund enters into such transactions, it instructs the custodian to segregate assets with a current value at least equal to the amount of its when-issued or delayed-delivery purchase commitments.
Securities Transactions and Net Investment Income: Securities transactions are recorded on the trade date. Realized gains or losses on sales of investments are calculated on the identified cost basis. Interest income, including amortization of premium and accretion of discount on debt securities, as required, is recorded on the accrual basis as an adjustment to interest income.
Net investment income or loss (other than distribution fees, which are charged directly to the respective Class) and unrealized and realized gains or losses, are allocated daily to each class of shares based upon the relative proportion of net assets of each class at the beginning of the day.
Dividends and Distributions: The Fund declares dividends from the net investment income daily and distributions of net realized capital and currency gains, if any, annually. Dividends and distributions to shareholders, which are determined in accordance with federal income tax regulations and which may differ from generally accepted accounting principles, are recorded on the ex-dividend date. Permanent
| | |
| Dryden Municipal Bond Fund | | 55 |
Notes to Financial Statements
Cont’d
book/tax differences relating to income and gains are reclassified amongst undistributed net investment income, accumulated net realized gain or loss and paid in capital in excess of par, as appropriate.
Federal Income Taxes: For federal income tax purposes, each Series in the Fund is treated as a separate taxpaying entity. It is the Fund’s policy to continue to meet the requirements of the Internal Revenue Code applicable to regulated investment companies and to distribute all of its taxable net income and capital gains, if any, to its shareholders. Therefore, no federal income tax provision is required.
Custody Fee Credits: The Fund has an arrangement with its custodian bank, whereby uninvested cash earn credits which reduce the fees charged by the custodian. Such custody fee credits, if any, are presented as a reduction of gross expenses in the accompanying Statement of Operations.
Estimates: The preparation of the financial statements requires management to make estimates and assumptions that affect the reported amounts and disclosures in the financial statements. Actual results could differ from those estimates.
Note 2. Agreements
The Fund has a management agreement with PI. Pursuant to this agreement, PI has responsibility for all investment advisory services and supervises the subadviser’s performance of such services. PI has entered into a subadvisory agreement with Prudential Investment Management (“PIM”). The Subadvisory Agreement provides that PIM will furnish investment advisory services in connection with the management of the Fund. PI pays for the services of PIM, the cost of compensation of officers for the Fund, occupancy and certain clerical and bookkeeping cost of the Fund. The Fund bears all other costs and expenses.
The management fee paid PI is computed daily and payable monthly at an annual rate of .50 of 1% of the average daily net assets of each series up to $1 billion and .45 of 1% of the average daily net assets of each series in excess of $1 billion. The effective management fee rate was .50 of 1% of the average daily net assets of the High Income and Insured Series for the year ended April 30, 2007.
The Fund has a distribution agreement with Prudential Investment Management Services LLC (“PIMS”) which acts as the distributor of the Fund. The Fund
| | |
| 56 | | Visit our website at www.jennisondryden.com |
compensates PIMS for distributing and servicing the Fund’s Class A, Class B and Class C shares, pursuant to plans of distribution (the “Class A, B and C Plans”), regardless of expenses actually incurred by it. The distribution fees are accrued daily and payable monthly. No distribution or service fees are paid to PIMS as distributor of the Class Z shares of the Fund.
Pursuant to the Class A, B and C Plans, the Fund compensates PIMS for distribution related activities at an annual rate of up to .30 of 1%, .50 of 1% and 1%, of the average daily net assets of the Class A, B and C shares, respectively. PIMS contractually agreed to limit such fees to .25 of 1% and .75 of 1% average daily net assets of the Class A shares and Class C shares, respectively.
PIMS has advised the High Income Series and Insured Series that it received approximately $126,000 and $45,400 for Class A shares, respectively, in front-end sales charges during the year ended April 30, 2007. From these fees, PIMS paid such sales charges to affiliated broker-dealers, which in turn paid commissions to salespersons and incurred other distribution costs.
PIMS has advised the High Income Series and Insured Series that for the year ended April 30, 2007, it received approximately $68,100 ($66,200 Class B; $1,900 Class C) and $47,100 ($46,600 Class B; $500 Class C), respectively, in contingent deferred sales charges imposed upon certain redemptions by Class B and C shareholders, respectively.
PI, PIM and PIMS are indirect wholly owned subsidiaries of Prudential Financial, Inc. (“Prudential”).
The Fund, along with other affiliated registered investment companies (the “Funds”), is a party to a Syndicated Credit Agreement (“SCA”) with two banks. The SCA provides for a commitment of $500 million. Interest on any borrowings under the SCA is incurred at contracted market rates and a commitment fee for the unused amount is accrued daily and paid quarterly. Effective October 27, 2006, the Funds renewed SCA with the banks. The commitment under the renewed SCA continues to be $500 million. The Funds pay a commitment fee of .07 of 1% of the unused portion of the renewed SCA. The expiration date of the renewed SCA will be October 26, 2007. For the period from October 29, 2005 through October 26, 2006, the Funds paid a commitment fee of ..0725 of 1% of the unused portion of the agreement. The purpose of the SCA is to provide an alternative source of temporary funding for capital share redemptions. The Fund did not borrow any amounts pursuant to the SCA during the year ended April 30, 2007.
| | |
| Dryden Municipal Bond Fund | | 57 |
Notes to Financial Statements
Cont’d
Note 3. Other Transactions With Affiliates
Prudential Mutual Fund Services LLC (“PMFS”), an affiliate of PI and an indirect, wholly-owned subsidiary of Prudential, serves as the Fund’s transfer agent. Transfer agent’s fees and expenses in the Statement of Operations include certain out-of-pocket expenses paid to non-affiliates, where applicable.
The Fund pays networking fees to affiliated and unaffiliated broker/dealers including fees relating to the services of Wachovia Securities, LLC (“Wachovia”) and First Clearing, LLC (“First Clearing”), affiliates of PI. These networking fees are payments made to broker/dealers that clear mutual fund transactions through a national clearing system. For the year ended April 30, 2007, the Fund incurred approximately $100,200 ($80,700 High Income Series; $19,500 Insured Series) in total networking fees of which approximately $55,400 was paid to Wachovia and First Clearing ($43,600 High Income Series; $11,800 Insured Series). These amounts are included in transfer agent’s fees and expenses in the Statement of Operations.
For the year ended April 30, 2007, the Fund did not pay brokerage commissions to Wachovia or First Clearing.
Note 4. Portfolio Securities
Purchases and sales of portfolio securities, other than short-term investments, for the year ended April 30, 2007, were as follows:
| | | | |
Series | | Purchases | | Sales |
| High Income | | $182,617,886 | | $217,097,341 |
| Insured | | $88,581,390 | | $116,665,828 |
Note 5. Distributions and Tax Information
In order to present undistributed net investment income, accumulated net realized gains or losses on investments, financial futures transactions and interest rate swaps, unrealized appreciation on investments, financial futures transactions and interest rate swaps and paid-in capital in excess of par on the Statement of Assets and Liabilities that more closely represent their tax character, certain adjustments have been made to paid-in-capital in excess of par, undistributed net investment income, accumulated net realized gain or loss on investments, financial futures transactions and interest rate
| | |
| 58 | | Visit our website at www.jennisondryden.com |
swaps and unrealized appreciation on investments, financial futures transactions and interest rate swaps.
For the year ended April 30, 2007, the adjustments were as follows:
| | | | | | | | |
Series | | Paid in Capital in
Excess of Par | | Undistributed
Net Investment Income | | Accumulated
Net Realized
Gain | | Unrealized
Depreciation |
| High Income | | $(1,199,534) | | $(965,186) | | $2,388,506 | | $(223,786) |
| Insured | | 5,473 | | (91,609) | | 86,136 | | — |
For High Income Series, these adjustments were primarily due to the difference between financial and tax reporting with respect to accretion of market discount, expiration of capital loss carryforward, swap treatment, differences in accounting treatment between book and tax relating to municipal tender option bond transactions and other differences. For Insured Series, these adjustments were primarily due to the difference between financial and tax purposes with respect to accretion of market discount, reclassification of dividend distributions and redemptions utilized as distributions for tax purposes. Net investment income, net realized gains or losses and net assets were not affected by this change.
The tax character of total dividends paid for the most recent two fiscal years are as follows:
| | | | | | |
| | | High Income
Series | | Insured
Series |
April 30, 2007 | | | | | | |
Tax-Exempt | | $ | 26,260,911 | | $ | 8,409,305 |
Ordinary Income | | | 174,952 | | | 31,339 |
Long-term Capital Gains | | | — | | | 1,337,133 |
| | | | | | |
Total Dividends | | $ | 26,435,863 | | $ | 9,777,777 |
| | | | | | |
April 30, 2006 | | | | | | |
Tax-Exempt | | $ | 28,241,396 | | $ | 10,132,683 |
Ordinary Income | | | 232,815 | | | 176,975 |
Long-term Capital Gains | | | — | | | 2,073,142 |
| | | | | | |
Total Dividends | | $ | 28,474,211 | | $ | 12,382,800 |
| | | | | | |
As of April 30, 2007, the components of distributable earnings on a tax basis were as follows:
| | | | | | |
Series | | Tax-Exempt | | Ordinary
Income | | Long-Term
Capital
Gains |
| High Income | | $2,386,677 | | $45,800 | | — |
| Insured | | $464,883 | | — | | $435,121 |
| | |
| Dryden Municipal Bond Fund | | 59 |
Notes to Financial Statements
Cont’d
These amounts include a dividends payable timing difference of $550,483 and $180,911 for the High Income Series and Insured Series, respectively as of April 30, 2007.
The United States federal income tax basis of the Series’ investments and total net unrealized appreciation as of April 30, 2007 were as follows:
| | | | | | | | | | | | | | | | | | |
| Series | | Tax Basis | | Appreciation | | (Depreciation) | | | Total
Unrealized
Appreciation | | Other
Cost Basis
Adjustment | | Total Net
Unrealized
Appreciation |
| High Income | | $525,097,247 | | $ | 27,891,379 | | $ | (8,063,924 | ) | | $ | 19,827,455 | | $ | 9,067 | | $ | 19,836,522 |
| Insured | | $204,417,565 | | $ | 9,799,571 | | $ | (106,149 | ) | | $ | 9,693,422 | | | — | | $ | 9,693,422 |
The difference between book and tax basis were primarily due to the difference between financial and tax reporting with respect to accretion of market discount and municipal tender option bond transaction. The other cost basis adjustments were primarily attributable to appreciation on interest rate swaps.
For federal income tax purposes, the High Income Series has a capital loss carryforward as of April 30, 2007 of approximately $55,034,000, of which $5,906,000 expires in 2008, $20,095,000 expires in 2009, $13,512,000 expires in 2010, $4,457,000 expires in 2011 and $11,064,000 expires in 2014. Accordingly, no capital gains distributions are expected to be paid to shareholders until net gains have been realized in excess of such carryforwards. In addition, the Series utilized approximately of $1,938,000 of its capital loss carryforward to offset net taxable gains realized in the fiscal year ended April 30, 2007. Also, approximately $1,199,000 of its capital loss carryforward expired in the fiscal year ended April 30, 2007.
Note 6. Capital
The High Income Series and Insured Series offer Class A, Class B, Class C and Class Z shares. Class A shares were sold with a front-end sales charge of up to 4%. All investors who purchase Class A shares in the amount of $1 million or more and sell these shares within 12 months of purchase are subject to a contingent deferred sales charge (CDSC) of 1%, including investors who purchase their shares through broker dealers affiliated with Prudential. Class B shares are sold with a contingent deferred sales charge which declines from 5% to zero depending on the period of time the shares are held. Class C shares are sold with a contingent deferred sales charge of 1% during the first 12 months. Class B shares automatically convert to Class A shares on a
| | |
| 60 | | Visit our website at www.jennisondryden.com |
quarterly basis approximately seven years after purchase. A special exchange privilege is also available for shareholders who qualify to purchase Class A shares at net asset value. Class Z shares are not subject to any sales or redemption charge and are offered exclusively for sale to a limited group of investors.
The Fund has authorized an unlimited number of shares of beneficial interest of each class at $.01 par value per share. Transactions in shares of beneficial interest were as follows:
Dryden Municipal Bond Fund/High Income Series
| | | | | | | |
Class A | | Shares | | | Amount | |
Year ended April 30, 2007: | | | | | | | |
Shares sold | | 1,613,562 | | | $ | 16,961,622 | |
Shares issued in reinvestment of dividends | | 1,094,506 | | | | 11,483,605 | |
Shares reacquired | | (6,389,309 | ) | | | (66,991,309 | ) |
| | | | | | | |
Net increase (decrease) in shares outstanding before conversion | | (3,681,241 | ) | | | (38,546,082 | ) |
Shares issued upon conversion from Class B | | 2,162,578 | | | | 22,712,217 | |
| | | | | | | |
Net increase (decrease) in shares outstanding | | (1,518,663 | ) | | $ | (15,833,865 | ) |
| | | | | | | |
Year ended April 30, 2006: | | | | | | | |
Shares sold | | 1,516,896 | | | $ | 15,761,657 | |
Shares issued in reinvestment of dividends | | 1,038,877 | | | | 10,780,505 | |
Shares reacquired | | (7,279,786 | ) | | | (75,542,675 | ) |
| | | | | | | |
Net increase (decrease) in shares outstanding before conversion | | (4,724,013 | ) | | | (49,000,513 | ) |
Shares issued upon conversion from Class B | | 4,001,025 | | | | 41,582,297 | |
| | | | | | | |
Net increase (decrease) in shares outstanding | | (722,988 | ) | | $ | (7,418,216 | ) |
| | | | | | | |
Class B | | | | | | |
Year ended April 30, 2007: | | | | | | | |
Shares sold | | 521,323 | | | $ | 5,467,582 | |
Shares issued in reinvestment of dividends | | 140,893 | | | | 1,478,160 | |
Shares reacquired | | (1,214,056 | ) | | | (12,731,452 | ) |
| | | | | | | |
Net increase (decrease) in shares outstanding before conversion | | (551,840 | ) | | | (5,785,710 | ) |
Shares reacquired upon conversion into Class A | | (2,162,578 | ) | | | (22,712,217 | ) |
| | | | | | | |
Net increase (decrease) in shares outstanding | | (2,714,418 | ) | | $ | (28,497,927 | ) |
| | | | | | | |
Year ended April 30, 2006: | | | | | | | |
Shares sold | | 318,017 | | | $ | 3,304,697 | |
Shares issued in reinvestment of dividends | | 202,826 | | | | 2,105,931 | |
Shares reacquired | | (1,996,903 | ) | | | (20,732,680 | ) |
| | | | | | | |
Net increase (decrease) in shares outstanding before conversion | | (1,476,060 | ) | | | (15,322,052 | ) |
Shares reacquired upon conversion into Class A | | (3,999,189 | ) | | | (41,582,297 | ) |
| | | | | | | |
Net increase (decrease) in shares outstanding | | (5,475,249 | ) | | $ | (56,904,349 | ) |
| | | | | | | |
| | |
| Dryden Municipal Bond Fund | | 61 |
Notes to Financial Statements
Cont’d
| | | | | | | |
Class C | | Shares | | | Amount | |
Year ended April 30, 2007: | | | | | | | |
Shares sold | | 676,592 | | | $ | 7,109,768 | |
Shares issued in reinvestment of dividends | | 63,461 | | | | 666,335 | |
Shares reacquired | | (444,010 | ) | | | (4,666,286 | ) |
| | | | | | | |
Net increase (decrease) in shares outstanding | | 296,043 | | | $ | 3,109,817 | |
| | | | | | | |
Year ended April 30, 2006: | | | | | | | |
Shares sold | | 774,023 | | | $ | 8,044,948 | |
Shares issued in reinvestment of dividends | | 57,560 | | | | 597,542 | |
Shares reacquired | | (386,893 | ) | | | (4,016,766 | ) |
| | | | | | | |
Net increase (decrease) in shares outstanding | | 444,690 | | | $ | 4,625,724 | |
| | | | | | | |
Class Z | | | | | | |
Year ended April 30, 2007: | | | | | | | |
Shares sold | | 261,845 | | | $ | 2,754,389 | |
Shares issued in reinvestment of dividends | | 42,465 | | | | 445,350 | |
Shares reacquired | | (193,869 | ) | | | (2,037,693 | ) |
| | | | | | | |
Net increase (decrease) in shares outstanding | | 110,441 | | | $ | 1,162,046 | |
| | | | | | | |
Year ended April 30, 2006: | | | | | | | |
Shares sold | | 221,330 | | | $ | 2,291,928 | |
Shares issued in reinvestment of dividends | | 48,255 | | | | 500,460 | |
Shares reacquired | | (640,191 | ) | | | (6,652,267 | ) |
| | | | | | | |
Net increase (decrease) in shares outstanding | | (370,606 | ) | | $ | (3,859,879 | ) |
| | | | | | | |
Dryden Municipal Bond Fund/Insured Series
| | | | | | | |
| | |
Class A | | | | | | |
Year ended April 30, 2007: | | | | | | | |
Shares sold | | 421,255 | | | $ | 4,529,270 | |
Shares issued in reinvestment of dividends | | 491,890 | | | | 5,282,341 | |
Shares reacquired | | (3,022,935 | ) | | | (32,450,676 | ) |
| | | | | | | |
Net increase (decrease) in shares outstanding before conversion | | (2,109,790 | ) | | | (22,639,065 | ) |
Shares issued upon conversion from Class B | | 277,437 | | | | 2,983,087 | |
| | | | | | | |
Net increase (decrease) in shares outstanding | | (1,832,353 | ) | | $ | (19,655,978 | ) |
| | | | | | | |
Year ended April 30, 2006: | | | | | | | |
Shares sold | | 351,961 | | | $ | 3,828,011 | |
Shares issued in reinvestment of dividends and distributions | | 611,603 | | | | 6,623,957 | |
Shares reacquired | | (4,587,717 | ) | | | (49,657,641 | ) |
| | | | | | | |
Net increase (decrease) in shares outstanding before conversion | | (3,624,153 | ) | | | (39,205,673 | ) |
Shares issued upon conversion from Class B | | 460,187 | | | | 5,012,185 | |
| | | | | | | |
Net increase (decrease) in shares outstanding | | (3,163,966 | ) | | $ | (34,193,488 | ) |
| | | | | | | |
| | |
| 62 | | Visit our website at www.jennisondryden.com |
| | | | | | | |
Class B | | Shares | | | Amount | |
Year ended April 30, 2007: | | | | | | | |
Shares sold | | 140,273 | | | $ | 1,510,963 | |
Shares issued in reinvestment of dividends | | 65,430 | | | | 703,635 | |
Shares reacquired | | (422,590 | ) | | | (4,537,325 | ) |
| | | | | | | |
Net increase (decrease) in shares outstanding before conversion | | (216,887 | ) | | | (2,322,727 | ) |
Shares reacquired upon conversion into Class A | | (276,981 | ) | | | (2,983,087 | ) |
| | | | | | | |
Net increase (decrease) in shares outstanding | | (493,868 | ) | | $ | (5,305,814 | ) |
| | | | | | | |
Year ended April 30, 2006: | | | | | | | |
Shares sold | | 98,154 | | | $ | 1,067,999 | |
Shares issued in reinvestment of dividends and distributions | | 91,401 | | | | 991,716 | |
Shares reacquired | | (735,913 | ) | | | (8,003,408 | ) |
| | | | | | | |
Net increase (decrease) in shares outstanding before conversion | | (546,358 | ) | | | (5,943,693 | ) |
Shares reacquired upon conversion into Class A | | (459,476 | ) | | | (5,012,185 | ) |
| | | | | | | |
Net increase (decrease) in shares outstanding | | (1,005,834 | ) | | $ | (10,955,878 | ) |
| | | | | | | |
Class C | | | | | | |
Year ended April 30, 2007: | | | | | | | |
Shares sold | | 96,831 | | | $ | 1,044,372 | |
Shares issued in reinvestment of dividends | | 11,549 | | | | 124,213 | |
Shares reacquired | | (150,694 | ) | | | (1,623,775 | ) |
| | | | | | | |
Net increase (decrease) in shares outstanding | | (42,314 | ) | | $ | (455,190 | ) |
| | | | | | | |
Year ended April 30, 2006: | | | | | | | |
Shares sold | | 29,419 | | | $ | 322,155 | |
Shares issued in reinvestment of dividends and distributions | | 14,170 | | | | 153,692 | |
Shares reacquired | | (168,549 | ) | | | (1,837,284 | ) |
| | | | | | | |
Net increase (decrease) in shares outstanding | | (124,960 | ) | | $ | (1,361,437 | ) |
| | | | | | | |
Class Z | | | | | | |
Year ended April 30, 2007: | | | | | | | |
Shares sold | | 118,815 | | | $ | 1,277,647 | |
Shares issued in reinvestment of dividends | | 10,116 | | | | 108,478 | |
Shares reacquired | | (190,748 | ) | | | (2,037,991 | ) |
| | | | | | | |
Net increase (decrease) in shares outstanding | | (61,817 | ) | | $ | (651,866 | ) |
| | | | | | | |
Year ended April 30, 2006: | | | | | | | |
Shares sold | | 8,274 | | | $ | 89,695 | |
Shares issued in reinvestment of dividends and distributions | | 14,364 | | | | 155,497 | |
Shares reacquired | | (132,978 | ) | | | (1,441,925 | ) |
| | | | | | | |
Net increase (decrease) in shares outstanding | | (110,340 | ) | | $ | (1,196,733 | ) |
| | | | | | | |
| | |
| Dryden Municipal Bond Fund | | 63 |
Notes to Financial Statements
Cont’d
Note 7. New Accounting Pronouncements
On July 13, 2006, the Financial Accounting Standards Board (FASB) released FASB Interpretation No. 48 “Accounting for Uncertainty in Income Taxes” (FIN 48). FIN 48 provides guidance for how uncertain tax positions should be recognized, measured, presented and disclosed in the financial statements. FIN 48 requires the evaluation of tax positions taken or expected to be taken in the course of preparing the Fund’s tax returns to determine whether the tax positions are “more-likely-than-not” of being sustained by the applicable tax authority. The impact of the tax positions not deemed to meet the more-likely-than-not threshold would be recorded in the year in which they arise. On December 22, 2006 the Securities and Exchange Commission delayed the effective date until the last net asset value calculation in the first required financial reporting period for its fiscal year begining after December 15, 2006. At this time, management is evaluating the implications of FIN 48 and its impact, if any, in the financial statements has not yet been determined.
On September 20, 2006, the FASB released Statement of Financial Accounting Standards No. 157 “Fair Value Measurements” (FAS 157). FAS 157 establishes an authoritative definition of fair value, sets out a framework for measuring fair value, and requires additional disclosures about fair-value measurements. The application of FAS 157 is required for fiscal years beginning after November 15, 2007 and interim periods within those fiscal years. At this time, management is evaluating the implications of FAS 157 and its impact, if any, in the financial statements has not yet been determined.
| | |
| 64 | | Visit our website at www.jennisondryden.com |
Financial Highlights
| | |
| APRIL 30, 2007 | | ANNUAL REPORT |
Dryden Municipal Bond Fund
High Income Series/Insured Series
Financial Highlights
High Income Series
| | | | |
| | | Class A | |
| | | Year Ended
April 30, 2007(c) | |
Per Share Operating Performance: | | | | |
Net Asset Value, Beginning Of Year | | $ | 10.32 | |
| | | | |
Income from investment operations: | | | | |
Net investment income | | | .53 | |
Net realized and unrealized gain (loss) on investment transactions | | | .18 | |
| | | | |
Total from investment operations | | | .71 | |
| | | | |
Less Dividends: | | | | |
Dividends from net investment income | | | (.50 | ) |
| | | | |
Net asset value, end of year | | $ | 10.53 | |
| | | | |
Total Return(a): | | | 6.94 | % |
Ratios/Supplemental Data: | | | | |
Net assets, end of year (000) | | $ | 444,751 | |
Average net assets (000) | | $ | 451,239 | |
Ratios to average net assets: | | | | |
Expenses, including distribution and service (12b-1) fees(b) | | | .89 | %(d) |
Expenses, excluding distribution and service (12b-1) fees | | | .64 | %(d) |
Net investment income | | | 5.00 | % |
For Class A, B, C and Z shares: | | | | |
Portfolio turnover rate | | | 33 | % |
| (a) | Total return does not consider the effects of sales loads. Total return is calculated assuming a purchase of shares on the first day and a sale on the last day of each year reported, and includes reinvestment of dividends and distributions. |
| (b) | The distributor of the Series has contractually agreed to limit its distribution and service (12b-1) fees to .25 of 1% of the average daily net assets of the Class A shares. |
| (c) | Calculated based upon average shares outstanding during the year. |
| (d) | The expense ratio reflects the interest and fees expense related to the liability for the floating rate notes issued in conjunction with the inverse floater securities. The total expense ratio excluding interest and fees expense is .85% and the expense ratio excluding 12b-1 and interest and fees expense is .60%. |
See Notes to Financial Statements.
| | |
| 66 | | Visit our website at www.jennisondryden.com |
| | | | | | | | | | | | | | |
| Class A | |
| Year Ended April 30, | |
| 2006(c) | | | 2005 | | | 2004 | | | 2003 | |
| | | | | | | | | | | | | | |
| $ | 10.33 | | | $ | 9.99 | | | $ | 10.11 | | | $ | 10.06 | |
| | | | | | | | | | | | | | | |
| | | | | | | | | | | | | | |
| | .53 | | | | .51 | | | | .53 | | | | .56 | |
| | (.05 | ) | | | .35 | | | | (.12 | ) | | | .04 | |
| | | | | | | | | | | | | | | |
| | .48 | | | | .86 | | | | .41 | | | | .60 | |
| | | | | | | | | | | | | | | |
| | | | | | | | | | | | | | |
| | (.49 | ) | | | (.52 | ) | | | (.53 | ) | | | (.55 | ) |
| | | | | | | | | | | | | | | |
| $ | 10.32 | | | $ | 10.33 | | | $ | 9.99 | | | $ | 10.11 | |
| | | | | | | | | | | | | | | |
| | 4.84 | % | | | 8.81 | % | | | 4.13 | % | | | 6.15 | % |
| | | | | | | | | | | | | | |
| $ | 451,785 | | | $ | 459,598 | | | $ | 457,184 | | | $ | 491,218 | |
| $ | 458,445 | | | $ | 458,739 | | | $ | 479,691 | | | $ | 496,597 | |
| | | | | | | | | | | | | | |
| | .87 | % | | | .86 | % | | | .87 | % | | | .85 | % |
| | .62 | % | | | .61 | % | | | .62 | % | | | .60 | % |
| | 5.14 | % | | | 5.03 | % | | | 5.25 | % | | | 5.53 | % |
| | | | | | | | | | | | | | |
| | 32 | % | | | 29 | % | | | 89 | % | | | 88 | % |
See Notes to Financial Statements.
| | |
| Dryden Municipal Bond Fund/High Income Series | | 67 |
Financial Highlights
Cont’d
| | | | |
| | | Class B | |
| | | Year Ended
April 30, 2007(b) | |
Per Share Operating Performance: | | | | |
Net Asset Value, Beginning Of Year | | $ | 10.33 | |
| | | | |
Income from investment operations: | | | | |
Net investment income | | | .50 | |
Net realized and unrealized gain (loss) on investment transactions | | | .18 | |
| | | | |
Total from investment operations | | | .68 | |
| | | | |
Less Dividends: | | | | |
Dividends from net investment income | | | (.48 | ) |
| | | | |
Net asset value, end of year | | $ | 10.53 | |
| | | | |
Total Return(a): | | | 6.67 | % |
Ratios/Supplemental Data: | | | | |
Net assets, end of year (000) | | $ | 58,278 | |
Average net assets (000) | | $ | 70,145 | |
Ratios to average net assets: | | | | |
Expenses, including distribution and service (12b-1) fees | | | 1.14 | %(c) |
Expenses, excluding distribution and service (12b-1) fees | | | .64 | %(c) |
Net investment income | | | 4.74 | % |
| (a) | Total return does not consider the effects of sales loads. Total return is calculated assuming a purchase of shares on the first day and a sale on the last day of each year reported, and includes reinvestment of dividends and distributions. |
| (b) | Calculated based upon average shares outstanding during the year. |
| (c) | The expense ratio reflects the interest and fees expense related to the liability for the floating rate notes issued in conjunction with the inverse floater securities. The total expense ratio excluding interest and fees expense is 1.10% and the expense ratio excluding 12b-1 and interest and fees expense is .60%. |
See Notes to Financial Statements.
| | |
| 68 | | Visit our website at www.jennisondryden.com |
| | | | | | | | | | | | | | |
| Class B | |
| Year Ended April 30, | |
| 2006(b) | | | 2005 | | | 2004 | | | 2003 | |
| | | | | | | | | | | | | | |
| $ | 10.34 | | | $ | 10.00 | | | $ | 10.11 | | | $ | 10.06 | |
| | | | | | | | | | | | | | | |
| | | | | | | | | | | | | | |
| | .51 | | | | .49 | | | | .51 | | | | .54 | |
| | (.06 | ) | | | .34 | | | | (.12 | ) | | | .04 | |
| | | | | | | | | | | | | | | |
| | .45 | | | | .83 | | | | .39 | | | | .58 | |
| | | | | | | | | | | | | | | |
| | | | | | | | | | | | | | |
| | (.46 | ) | | | (.49 | ) | | | (.50 | ) | | | (.53 | ) |
| | | | | | | | | | | | | | | |
| $ | 10.33 | | | $ | 10.34 | | | $ | 10.00 | | | $ | 10.11 | |
| | | | | | | | | | | | | | | |
| | 4.48 | % | | | 8.53 | % | | | 3.95 | % | | | 5.88 | % |
| | | | | | | | | | | | | | |
| $ | 85,179 | | | $ | 141,832 | | | $ | 192,517 | | | $ | 241,311 | |
| $ | 112,213 | | | $ | 165,596 | | | $ | 219,376 | | | $ | 264,067 | |
| | | | | | | | | | | | | | |
| | 1.12 | % | | | 1.11 | % | | | 1.12 | % | | | 1.10 | % |
| | .62 | % | | | .61 | % | | | .62 | % | | | .60 | % |
| | 4.90 | % | | | 4.78 | % | | | 5.00 | % | | | 5.31 | % |
See Notes to Financial Statements.
| | |
| Dryden Municipal Bond Fund/High Income Series | | 69 |
Financial Highlights
Cont’d
| | | | |
| | | Class C | |
| | | Year Ended
April 30, 2007(c) | |
Per Share Operating Performance: | | | | |
Net Asset Value, Beginning Of Year | | $ | 10.33 | |
| | | | |
Income from investment operations: | | | | |
Net investment income | | | .47 | |
Net realized and unrealized gain (loss) on investment transactions | | | .18 | |
| | | | |
Total from investment operations | | | .65 | |
| | | | |
Less Dividends: | | | | |
Dividends from net investment income | | | (.45 | ) |
| | | | |
Net asset value, end of year | | $ | 10.53 | |
| | | | |
Total Return(a): | | | 6.41 | % |
Ratios/Supplemental Data: | | | | |
Net assets, end of year (000) | | $ | 30,256 | |
Average net assets (000) | | $ | 28,519 | |
Ratios to average net assets: | | | | |
Expenses, including distribution and service (12b-1) fees(b) | | | 1.39 | %(d) |
Expenses, excluding distribution and service (12b-1) fees | | | .64 | %(d) |
Net investment income | | | 4.50 | % |
| (a) | Total return does not consider the effects of sales loads. Total return is calculated assuming a purchase of shares on the first day and a sale on the last day of each year reported, and includes reinvestment of dividends and distributions. |
| (b) | The distributor of the Series has contractually agreed to limit its distribution and service (12b-1) fees to .75 of 1% of the average daily net assets of the Class C shares. |
| (c) | Calculated based upon average shares outstanding during the year. |
| (d) | The expense ratio reflects the interest and fees expense related to the liability for the floating rate notes issued in conjunction with the inverse floater securities. The total expense ratio excluding interest and fees expense is 1.35% and the expense ratio excluding 12b-1 and interest and fees expense is .60%. |
See Notes to Financial Statements.
| | |
| 70 | | Visit our website at www.jennisondryden.com |
| | | | | | | | | | | | | | |
| Class C | |
| Year Ended April 30, | |
| 2006(c) | | | 2005 | | | 2004 | | | 2003 | |
| | | | | | | | | | | | | | |
| $ | 10.34 | | | $ | 10.00 | | | $ | 10.11 | | | $ | 10.06 | |
| | | | | | | | | | | | | | | |
| | | | | | | | | | | | | | |
| | .48 | | | | .46 | | | | .48 | | | | .51 | |
| | (.05 | ) | | | .35 | | | | (.11 | ) | | | .04 | |
| | | | | | | | | | | | | | | |
| | .43 | | | | .81 | | | | .37 | | | | .55 | |
| | | | | | | | | | | | | | | |
| | | | | | | | | | | | | | |
| | (.44 | ) | | | (.47 | ) | | | (.48 | ) | | | (.50 | ) |
| | | | | | | | | | | | | | | |
| $ | 10.33 | | | $ | 10.34 | | | $ | 10.00 | | | $ | 10.11 | |
| | | | | | | | | | | | | | | |
| | 4.23 | % | | | 8.26 | % | | | 3.69 | % | | | 5.62 | % |
| | | | | | | | | | | | | | |
| $ | 26,611 | | | $ | 22,033 | | | $ | 24,599 | | | $ | 28,313 | |
| $ | 25,219 | | | $ | 23,042 | | | $ | 26,968 | | | $ | 27,121 | |
| | | | | | | | | | | | | | |
| | 1.37 | % | | | 1.36 | % | | | 1.37 | % | | | 1.35 | % |
| | .62 | % | | | .61 | % | | | .62 | % | | | .60 | % |
| | 4.64 | % | | | 4.53 | % | | | 4.75 | % | | | 5.04 | % |
See Notes to Financial Statements.
| | |
| Dryden Municipal Bond Fund/High Income Series | | 71 |
Financial Highlights
Cont’d
| | | | |
| | | Class Z | |
| | | Year Ended
April 30, 2007(b) | |
Per Share Operating Performance: | | | | |
Net Asset Value, Beginning Of Year | | $ | 10.31 | |
| | | | |
Income from investment operations: | | | | |
Net investment income | | | .55 | |
Net realized and unrealized gain (loss) on investment transactions | | | .19 | |
| | | | |
Total from investment operations | | | .74 | |
| | | | |
Less Dividends: | | | | |
Dividends from net investment income | | | (.53 | ) |
| | | | |
Net asset value, end of year | | $ | 10.52 | |
| | | | |
Total Return(a): | | | 7.21 | % |
Ratios/Supplemental Data: | | | | |
Net assets, end of year (000) | | $ | 9,878 | |
Average net assets (000) | | $ | 9,335 | |
Ratios to average net assets: | | | | |
Expenses, including distribution and service (12b-1) fees | | | .64 | %(c) |
Expenses, excluding distribution and service (12b-1) fees | | | .64 | %(c) |
Net investment income | | | 5.25 | % |
| (a) | Total return does not consider the effects of sales loads. Total return is calculated assuming a purchase of shares on the first day and a sale on the last day of each year reported, and includes reinvestment of dividends and distributions. |
| (b) | Calculated based upon average shares outstanding during the year. |
| (c) | The expense ratio reflects the interest and fees expense related to the liability for the floating rate notes issued in conjunction with the inverse floater securities. The total expense ratio excluding interest and fees expense is .60% and the expense ratio excluding 12b-1 and interest and fees expense is .60%. |
See Notes to Financial Statements.
| | |
| 72 | | Visit our website at www.jennisondryden.com |
| | | | | | | | | | | | | | |
| Class Z | |
| Year Ended April 30, | |
| 2006(b) | | | 2005 | | | 2004 | | | 2003 | |
| | | | | | | | | | | | | | |
| $ | 10.32 | | | $ | 9.98 | | | $ | 10.10 | | | $ | 10.05 | |
| | | | | | | | | | | | | | | |
| | | | | | | | | | | | | | |
| | .56 | | | | .54 | | | | .56 | | | | .59 | |
| | (.06 | ) | | | .34 | | | | (.12 | ) | | | .04 | |
| | | | | | | | | | | | | | | |
| | .50 | | | | .88 | | | | .44 | | | | .63 | |
| | | | | | | | | | | | | | | |
| | | | | | | | | | | | | | |
| | (.51 | ) | | | (.54 | ) | | | (.56 | ) | | | (.58 | ) |
| | | | | | | | | | | | | | | |
| $ | 10.31 | | | $ | 10.32 | | | $ | 9.98 | | | $ | 10.10 | |
| | | | | | | | | | | | | | | |
| | 5.08 | % | | | 9.09 | % | | | 4.41 | % | | | 6.41 | % |
| | | | | | | | | | | | | | |
| $ | 8,547 | | | $ | 12,379 | | | $ | 14,087 | | | $ | 15,361 | |
| $ | 10,650 | | | $ | 11,451 | | | $ | 15,572 | | | $ | 10,813 | |
| | | | | | | | | | | | | | |
| | .62 | % | | | .61 | % | | | .62 | % | | | .60 | % |
| | .62 | % | | | .61 | % | | | .62 | % | | | .60 | % |
| | 5.39 | % | | | 5.29 | % | | | 5.51 | % | | | 5.78 | % |
See Notes to Financial Statements.
| | |
| Dryden Municipal Bond Fund/High Income Series | | 73 |
Financial Highlights
Insured Series
| | | | |
| | | Class A | |
| | | Year Ended
April 30, 2007 | |
Per Share Operating Performance: | | | | |
Net Asset Value, Beginning Of Year | | $ | 10.63 | |
| | | | |
Income from investment operations: | | | | |
Net investment income | | | .41 | |
Net realized and unrealized gain (loss) on investment transactions | | | .15 | |
| | | | |
Total from investment operations | | | .56 | |
| | | | |
Less Dividends and Distributions: | | | | |
Dividends from net investment income | | | (.40 | ) |
Distributions from net realized capital gains | | | (.06 | ) |
| | | | |
Total dividends and distributions | | | (.46 | ) |
| | | | |
Net asset value, end of year | | $ | 10.73 | |
| | | | |
Total Return(a): | | | 5.42 | % |
Ratios/Supplemental Data: | | | | |
Net assets, end of year (000) | | $ | 183,271 | |
Average net assets (000) | | $ | 192,676 | |
Ratios to average net assets: | | | | |
Expenses, including distribution and service (12b-1) fees(b) | | | .90 | % |
Expenses, excluding distribution and service (12b-1) fees | | | .65 | % |
Net investment income | | | 3.77 | % |
For Class A, B, C and Z shares: | | | | |
Portfolio turnover rate | | | 39 | % |
| (a) | Total return does not consider the effects of sales loads. Total return is calculated assuming a purchase of shares on the first day and a sale on the last day of each year reported and includes reinvestment of dividends and distributions. |
| (b) | The distributor of the Series contractually agreed to limit its distribution and service (12b-1) fees to .25 of 1% on the average daily net assets of the Class A shares. |
See Notes to Financial Statements.
| | |
| 74 | | Visit our website at www.jennisondryden.com |
| | | | | | | | | | | | | | |
| Class A | |
| Year Ended April 30, | |
| 2006 | | | 2005 | | | 2004 | | | 2003 | |
| | | | | | | | | | | | | | |
| $ | 10.98 | | | $ | 10.90 | | | $ | 11.59 | | | $ | 11.08 | |
| | | | | | | | | | | | | | | |
| | | | | | | | | | | | | | |
| | .41 | | | | .41 | | | | .42 | | | | .49 | |
| | (.26 | ) | | | .20 | | | | (.39 | ) | | | .51 | |
| | | | | | | | | | | | | | | |
| | .15 | | | | .61 | | | | .03 | | | | 1.00 | |
| | | | | | | | | | | | | | | |
| | | | | | | | | | | | | | |
| | (.41 | ) | | | (.41 | ) | | | (.42 | ) | | | (.49 | ) |
| | (.09 | ) | | | (.12 | ) | | | (.30 | ) | | | — | |
| | | | | | | | | | | | | | | |
| | (.50 | ) | | | (.53 | ) | | | (.72 | ) | | | (.49 | ) |
| | | | | | | | | | | | | | | |
| $ | 10.63 | | | $ | 10.98 | | | $ | 10.90 | | | $ | 11.59 | |
| | | | | | | | | | | | | | | |
| | 1.33 | % | | | 5.74 | % | | | .13 | % | | | 9.17 | % |
| | | | | | | | | | | | | | |
| $ | 201,121 | | | $ | 242,325 | | | $ | 257,738 | | | $ | 281,077 | |
| $ | 227,378 | | | $ | 249,074 | | | $ | 271,328 | | | $ | 272,608 | |
| | | | | | | | | | | | | | |
| | .93 | % | | | .91 | % | | | .90 | % | | | .88 | % |
| | .68 | % | | | .66 | % | | | .65 | % | | | .63 | % |
| | 3.77 | % | | | 3.72 | % | | | 3.72 | % | | | 4.35 | % |
| | | | | | | | | | | | | | |
| | 34 | % | | | 15 | % | | | 71 | % | | | 59 | % |
See Notes to Financial Statements.
| | |
| Dryden Municipal Bond Fund/Insured Series | | 75 |
Financial Highlights
Cont’d
| | | | |
| | | Class B | |
| | | Year Ended
April 30, 2007 | |
Per Share Operating Performance: | | | | |
Net Asset Value, Beginning Of Year | | $ | 10.65 | |
| | | | |
Income from investment operations: | | | | |
Net investment income | | | .38 | |
Net realized and unrealized gain (loss) on investment transactions | | | .16 | |
| | | | |
Total from investment operations | | | .54 | |
| | | | |
Less Dividends and Distributions: | | | | |
Dividends from net investment income | | | (.38 | ) |
Distributions from net realized capital gains | | | (.06 | ) |
| | | | |
Total dividends and distributions | | | (.44 | ) |
| | | | |
Net asset value, end of year | | $ | 10.75 | |
| | | | |
Total Return(a): | | | 5.15 | % |
Ratios/Supplemental Data: | | | | |
Net assets, end of year (000) | | $ | 25,295 | |
Average net assets (000) | | $ | 27,057 | |
Ratios to average net assets: | | | | |
Expenses, including distribution and service (12b-1) fees | | | 1.15 | % |
Expenses, excluding distribution and service (12b-1) fees | | | .65 | % |
Net investment income | | | 3.52 | % |
| (a) | Total return does not consider the effects of sales loads. Total return is calculated assuming a purchase of shares on the first day and a sale on the last day of each year reported and includes reinvestment of dividends and distributions. |
See Notes to Financial Statements.
| | |
| 76 | | Visit our website at www.jennisondryden.com |
| | | | | | | | | | | | | | |
| Class B | |
| Year Ended April 30, | |
| 2006 | | | 2005 | | | 2004 | | | 2003 | |
| | | | | | | | | | | | | | |
| $ | 10.99 | | | $ | 10.91 | | | $ | 11.60 | | | $ | 11.09 | |
| | | | | | | | | | | | | | | |
| | | | | | | | | | | | | | |
| | .39 | | | | .38 | | | | .40 | | | | .47 | |
| | (.26 | ) | | | .20 | | | | (.40 | ) | | | .50 | |
| | | | | | | | | | | | | | | |
| | .13 | | | | .58 | | | | — | | | | .97 | |
| | | | | | | | | | | | | | | |
| | | | | | | | | | | | | | |
| | (.38 | ) | | | (.38 | ) | | | (.39 | ) | | | (.46 | ) |
| | (.09 | ) | | | (.12 | ) | | | (.30 | ) | | | — | |
| | | | | | | | | | | | | | | |
| | (.47 | ) | | | (.50 | ) | | | (.69 | ) | | | (.46 | ) |
| | | | | | | | | | | | | | | |
| $ | 10.65 | | | $ | 10.99 | | | $ | 10.91 | | | $ | 11.60 | |
| | | | | | | | | | | | | | | |
| | 1.18 | % | | | 5.45 | % | | | (.14 | )% | | | 8.90 | % |
| | | | | | | | | | | | | | |
| $ | 30,328 | | | $ | 42,363 | | | $ | 51,432 | | | $ | 60,724 | |
| $ | 36,339 | | | $ | 48,258 | | | $ | 56,466 | | | $ | 58,003 | |
| | | | | | | | | | | | | | |
| | 1.18 | % | | | 1.16 | % | | | 1.15 | % | | | 1.13 | % |
| | .68 | % | | | .66 | % | | | .65 | % | | | .63 | % |
| | 3.52 | % | | | 3.46 | % | | | 3.47 | % | | | 4.10 | % |
See Notes to Financial Statements.
| | |
| Dryden Municipal Bond Fund/Insured Series | | 77 |
Financial Highlights
Cont’d
| | | | |
| | | Class C | |
| | | Year Ended
April 30, 2007 | |
Per Share Operating Performance: | | | | |
Net Asset Value, Beginning Of Year | | $ | 10.65 | |
| | | | |
Income (loss) from investment operations: | | | | |
Net investment income | | | .35 | |
Net realized and unrealized gain (loss) on investment transactions | | | .16 | |
| | | | |
Total from investment operations | | | .51 | |
| | | | |
Less Dividends and Distributions: | | | | |
Dividends from net investment income | | | (.35 | ) |
Distributions from net realized capital gains | | | (.06 | ) |
| | | | |
Total dividends and distributions | | | (.41 | ) |
| | | | |
Net asset value, end of year | | $ | 10.75 | |
| | | | |
Total Return(a): | | | 4.88 | % |
Ratios/Supplemental Data: | | | | |
Net assets, end of year (000) | | $ | 5,571 | |
Average net assets (000) | | $ | 5,539 | |
Ratios to average net assets: | | | | |
Expenses, including distribution and service (12b-1) fees(b) | | | 1.40 | % |
Expenses, excluding distribution and service (12b-1) fees | | | .65 | % |
Net investment income | | | 3.27 | % |
| (a) | Total return does not consider the effects of sales loads. Total return is calculated assuming a purchase of shares on the first day and a sale on the last day of each year reported and includes reinvestment of dividends and distributions. |
| (b) | The distributor of the Series contractually agreed to limit its distribution and service (12b-1) fees to .75 of 1% on the average daily net assets of the Class C shares. |
See Notes to Financial Statements.
| | |
| 78 | | Visit our website at www.jennisondryden.com |
| | | | | | | | | | | | | | |
| Class C | |
| Year Ended April 30, | |
| 2006 | | | 2005 | | | 2004 | | | 2003 | |
| | | | | | | | | | | | | | |
| $ | 10.99 | | | $ | 10.91 | | | $ | 11.60 | | | $ | 11.09 | |
| | | | | | | | | | | | | | | |
| | | | | | | | | | | | | | |
| | .36 | | | | .35 | | | | .37 | | | | .44 | |
| | (.26 | ) | | | .20 | | | | (.40 | ) | | | .50 | |
| | | | | | | | | | | | | | | |
| | .10 | | | | .55 | | | | (.03 | ) | | | .94 | |
| | | | | | | | | | | | | | | |
| | | | | | | | | | | | | | |
| | (.35 | ) | | | (.35 | ) | | | (.36 | ) | | | (.43 | ) |
| | (.09 | ) | | | (.12 | ) | | | (.30 | ) | | | — | |
| | | | | | | | | | | | | | | |
| | (.44 | ) | | | (.47 | ) | | | (.66 | ) | | | (.43 | ) |
| | | | | | | | | | | | | | | |
| $ | 10.65 | | | $ | 10.99 | | | $ | 10.91 | | | $ | 11.60 | |
| | | | | | | | | | | | | | | |
| | .92 | % | | | 5.18 | % | | | (.39 | )% | | | 8.63 | % |
| | | | | | | | | | | | | | |
| $ | 5,971 | | | $ | 7,538 | | | $ | 7,629 | | | $ | 8,457 | |
| $ | 6,683 | | | $ | 7,706 | | | $ | 8,329 | | | $ | 7,559 | |
| | | | | | | | | | | | | | |
| | 1.43 | % | | | 1.41 | % | | | 1.40 | % | | | 1.38 | % |
| | .68 | % | | | .66 | % | | | .65 | % | | | .63 | % |
| | 3.27 | % | | | 3.22 | % | | | 3.21 | % | | | 3.85 | % |
See Notes to Financial Statements.
| | |
| Dryden Municipal Bond Fund/Insured Series | | 79 |
Financial Highlights
Cont’d
| | | | |
| | | Class Z | |
| | | Year Ended
April 30, 2007 | |
Per Share Operating Performance: | | | | |
Net Asset Value, Beginning Of Year | | $ | 10.62 | |
| | | | |
Income from investment operations: | | | | |
Net investment income | | | .44 | |
Net realized and unrealized gain (loss) on investment transactions | | | .15 | |
| | | | |
Total from investment operations | | | .59 | |
| | | | |
Less Dividends and Distributions: | | | | |
Dividends from net investment income | | | (.43 | ) |
Distributions from net realized capital gains | | | (.06 | ) |
| | | | |
Total dividends and distributions | | | (.49 | ) |
| | | | |
Net asset value, end of year | | $ | 10.72 | |
| | | | |
Total Return(a): | | | 5.69 | % |
Ratios/Supplemental Data: | | | | |
Net assets, end of year (000) | | $ | 2,618 | |
Average net assets (000) | | $ | 2,834 | |
Ratios to average net assets: | | | | |
Expenses, including distribution and service (12b-1) fees | | | .65 | % |
Expenses, excluding distribution and service (12b-1) fees | | | .65 | % |
Net investment income | | | 3.98 | % |
| (a) | Total return does not consider the effects of sales loads. Total return is calculated assuming a purchase of shares on the first day and a sale on the last day of each year reported and includes reinvestment of dividends and distributions. |
See Notes to Financial Statements.
| | |
| 80 | | Visit our website at www.jennisondryden.com |
| | | | | | | | | | | | | | |
| Class Z | |
| Year Ended April 30, | |
| 2006 | | | 2005 | | | 2004 | | | 2003 | |
| | | | | | | | | | | | | | |
| $ | 10.96 | | | $ | 10.89 | | | $ | 11.58 | | | $ | 11.07 | |
| | | | | | | | | | | | | | | |
| | | | | | | | | | | | | | |
| | .44 | | | | .44 | | | | .45 | | | | .52 | |
| | (.26 | ) | | | .19 | | | | (.39 | ) | | | .50 | |
| | | | | | | | | | | | | | | |
| | .18 | | | | .63 | | | | .06 | | | | 1.02 | |
| | | | | | | | | | | | | | | |
| | | | | | | | | | | | | | |
| | (.43 | ) | | | (.44 | ) | | | (.45 | ) | | | (.51 | ) |
| | (.09 | ) | | | (.12 | ) | | | (.30 | ) | | | — | |
| | | | | | | | | | | | | | | |
| | (.52 | ) | | | (.56 | ) | | | (.75 | ) | | | (.51 | ) |
| | | | | | | | | | | | | | | |
| $ | 10.62 | | | $ | 10.96 | | | $ | 10.89 | | | $ | 11.58 | |
| | | | | | | | | | | | | | | |
| | 1.67 | % | | | 5.94 | % | | | .40 | % | | | 9.45 | % |
| | | | | | | | | | | | | | |
| $ | 3,251 | | | $ | 4,565 | | | $ | 6,330 | | | $ | 9,179 | |
| $ | 3,913 | | | $ | 5,265 | | | $ | 7,365 | | | $ | 6,605 | |
| | | | | | | | | | | | | | |
| | .68 | % | | | .66 | % | | | .65 | % | | | .63 | % |
| | .68 | % | | | .66 | % | | | .65 | % | | | .63 | % |
| | 4.02 | % | | | 3.96 | % | | | 3.98 | % | | | 4.61 | % |
See Notes to Financial Statements.
| | |
| Dryden Municipal Bond Fund/Insured Series | | 81 |
Report of Independent Registered Public Accounting Firm
The Board of Trustees and Shareholders of
Dryden Municipal Bond Fund:
We have audited the accompanying statements of assets and liabilities of the High Income Series and Insured Series (constituting the Dryden Municipal Bond Fund; hereafter referred to as the “Funds”) including the portfolios of investments, as of April 30, 2007, and the related statements of operations for the year then ended, the statements of changes in net assets for each of the years in the two-year period then ended, and the financial highlights for each of years in the four-year period then ended. These financial statements and financial highlights are the responsibility of the Funds’ management. Our responsibility is to express an opinion on these financial statements and financial highlights based on our audits. The financial highlights for the year ended April 30, 2003 were audited by another independent registered public accounting firm, whose report dated June 23, 2003, expressed an unqualified opinion thereon.
We conducted our audits in accordance with the standards of the Public Accounting Oversight Board (United States). Those standards require that we plan and perform the audit to obtain reasonable assurance about whether the financial statements and financial highlights are free of material misstatement. An audit includes examining, on a test basis, evidence supporting the amounts and disclosures in the financial statements. Our procedures included confirmation of securities owned as of April 30, 2007, by correspondence with the custodian and brokers or by other appropriate audit procedures when replies from brokers were not received. An audit also includes assessing the accounting principles used and significant estimates made by management, as well as evaluating the overall financial statement presentation. We believe that our audits provide a reasonable basis for our opinion.
In our opinion, the financial statements and financial highlights referred to above present fairly, in all material respects, the financial position of the Funds as of April 30, 2007, and the results of their operations for the year then ended, the changes in their net assets for each of the years in the two-year period then ended, and the financial highlights for each of the years in the four-year period then ended, in conformity with U.S. generally accepted accounting principles.

New York, New York
June 25, 2007
| | |
| 82 | | Visit our website at www.jennisondryden.com |
Tax Information
(Unaudited)
As required by the Internal Revenue Code, we wish to advise you as to the federal tax status of dividends and distributions paid by the Fund during its fiscal year ended April 30, 2007.
During its fiscal year ended April 30, 2007, the Fund paid aggregate dividends and distributions as follows:
| | | | | | | | | | | | |
| | | Dividends and Distributions per share |
Series | | Class A | | Class B | | Class C | | Class Z |
High Income | | | | | | | | | | | | |
| | | | |
Tax-Exempt Income | | $ | .498 | | $ | .472 | | $ | .446 | | $ | .524 |
Ordinary Income | | | .003 | | | .003 | | | .003 | | | .003 |
Long-Term Capital Gains | | | — | | | — | | | — | | | — |
| | | | | | | | | | | | |
| | $ | .501 | | $ | .475 | | $ | .449 | | $ | .527 |
| | | | | | | | | | | | |
| | | | | | | | | | | | |
| | | Dividends and Distributions per share |
Series | | Class A | | Class B | | Class C | | Class Z |
Insured | | | | | | | | | | | | |
| | | | |
Tax-Exempt Income | | $ | .401 | | $ | .375 | | $ | .348 | | $ | .428 |
Ordinary Income | | | .002 | | | .002 | | | .002 | | | .002 |
Long-Term Capital Gains | | | .064 | | | .064 | | | .064 | | | .064 |
| | | | | | | | | | | | |
| | $ | .467 | | $ | .441 | | $ | .414 | | $ | .494 |
| | | | | | | | | | | | |
Shortly after the close of the calendar year ending December 31, 2007, you will be advised again as to the federal tax status of the dividends and distributions received in calendar year 2007. In addition, you will be advised at that time as to the portion of your dividends which may be subject to the Alternative Minimum Tax (AMT) as well as information with respect to state taxability.
| | |
| Dryden Municipal Bond Fund | | 83 |
Management of the Fund
(Unaudited)
Information pertaining to the Trustees of the Fund is set forth below. Trustees who are not deemed to be “interested persons” of the Fund, as defined in the Investment Company Act of 1940 (the 1940 Act), are referred to as “Independent Trustees.” Trustees who are deemed to be “interested persons” of the Fund are referred to as “Interested Trustees.” “Fund Complex”† consists of the Fund and any other investment companies managed by PI.
Independent Trustees(2)
Linda W. Bynoe (54), Director since 2005(3) Oversees 62 portfolios in Fund complex
Principal occupations (last 5 years): President and Chief Executive Officer (since March 1995) of Telemat, Ltd. (management consulting); formerly Vice President at Morgan Stanley & Co.
Other Directorships held: Director of Simon Property Group, Inc. (real estate investment trust) (since May 2003); Anixter International (communication products distributor) (since January 2006); Director of Northern Trust Corporation (since April 2006).
David E.A. Carson (72), Trustee since 2003(3) Oversees 66 portfolios in Fund complex
Principal occupations (last 5 years): Formerly Director (January 2000-May 2000), Chairman (January 1999-December 1999), Chairman and Chief Executive Officer (January 1998-December 1998) and President, Chairman and Chief Executive Officer of People’s Bank (1983-1997).
Robert E. La Blanc (73), Trustee since 2003(3) Oversees 64 portfolios in Fund complex
Principal occupations (last 5 years): President (since 1981) of Robert E. La Blanc Associates, Inc. (telecommunications).
Other Directorships held:(4) Director of CA, Inc. (since 2002) (software company); FiberNet Telecom Group, Inc. (since 2003) (telecom company).
Douglas H. McCorkindale (68), Trustee since 2003(3) Oversees 62 portfolios in Fund complex
Principal occupations (last 5 years): Formerly Chairman (February 2001-June 2006), Chief Executive Officer (June 2000-July 2005), President (September 1997-July 2005) and Vice Chairman (March 1984-May 2000) of Gannett Co. Inc. (publishing and media).
Other Directorships held:(4) Director of Continental Airlines, Inc. (since May 1993); Director of Lockheed Martin Corp. (aerospace and defense) (since May 2001).
Richard A. Redeker (63), Trustee since 1993(3) Oversees 63 portfolios in Fund complex
Principal occupations (last 5 years): Management Consultant; Director (since 2001) and Chairman of the Board (since 2006) of Invesmart, Inc.; Director of Penn Tank Lines, Inc. (since 1999).
Robin B. Smith (67), Trustee since 2003(3) Oversees 64 portfolios in Fund complex
Principal occupations (last 5 years): Chairman of the Board (since January 2003) of Publishers Clearing House (direct marketing); formerly Chairman and Chief Executive Officer (August 1996-January 2003) of Publishers Clearing House.
Other Directorships held:(4) Formerly Director of BellSouth Corporation (1992-2006).
| | |
| 84 | | Visit our website at www.jennisondryden.com |
Stephen G. Stoneburn (63), Trustee since 2003(3) Oversees 64 portfolios in Fund complex
Principal occupations (last 5 years): President and Chief Executive Officer (since June 1996) of Quadrant Media Corp. (publishing company); formerly President (June 1995-June 1996) of Argus Integrated Media, Inc.; Senior Vice President and Managing Director (January 1993-1995) of Cowles Business Media; Senior Vice President of Fairchild Publications, Inc. (1975-1989).
Clay T. Whitehead (68), Trustee since 2003(3) Oversees 64 portfolios in Fund complex
Principal occupations (last 5 years): President (since 1983) of YCO (new business development firm).
Interested Trustees(1)
Judy A. Rice (59), President since 2003 and Trustee since 2000(3) Oversees 63 portfolios in Fund complex
Principal occupations (last 5 years): President, Chief Executive Officer, Chief Operating Officer and Officer-In-Charge (since February 2003) of Prudential Investments LLC; Vice President (since February 1999) of Prudential Investment Management Services LLC; President, Chief Executive Officer and Officer-In-Charge (since April 2003) of Prudential Mutual Fund Services LLC; formerly Director (May 2003-March 2006) and Executive Vice President (June 2005-March 2006) of AST Investment Services, Inc.; formerly Executive Vice President (September 1999-February 2003) of Prudential Investments LLC; Member of Board of Governors of the Investment Company Institute.
Robert F. Gunia (60), Vice President and Trustee since 1996(3) Oversees 143 portfolios in Fund complex
Principal occupations (last 5 years): Chief Administrative Officer (since September 1999) and Executive Vice President (since December 1996) of Prudential Investments LLC; President (since April 1999) of Prudential Investment Management Services LLC; Executive Vice President (since March 1999) and Treasurer (since May 2000) of Prudential Mutual Fund Services LLC; Chief Administrative Officer, Executive Vice President and Director (since May 2003) of AST Investment Services, Inc.
Other Directorships held:(4) Vice President and Director (since May 1989) and Treasurer (since 1999) of The Asia Pacific Fund, Inc.
Information pertaining to the Officers of the Fund who are not also Trustees is set forth below.
Officers(2)
Kathryn L. Quirk (54), Chief Legal Officer since 2005(3)
Principal occupations (last 5 years): Vice President and Corporate Counsel (since September 2004) of Prudential; Executive Vice President, Chief Legal Officer and Secretary (since July 2005) of Prudential Investments LLC and Prudential Mutual Fund Services LLC; formerly Managing Director, General Counsel, Chief Compliance Officer, Chief Risk Officer and Corporate Secretary (1997-2002) of Zurich Scudder Investments, Inc.
Deborah A. Docs (49), Secretary since 1996(3)
Principal occupations (last 5 years): Vice President and Corporate Counsel (since January 2001) of Prudential; Vice President (since December 1996) and Assistant Secretary (since March 1999) of PI; formerly Vice President and Assistant Secretary (May 2003-June 2005) of AST Investment Services, Inc.
Jonathan D. Shain (48), Assistant Secretary since 2004(3)
Principal occupations (last 5 years): Vice President and Corporate Counsel (since August 1998) of Prudential; Vice President and Assistant Secretary (since May 2001) of PI; Vice President and Assistant Secretary (since February 2001) of PMFS; formerly Vice President and Assistant Secretary (May 2003-June 2005) of AST Investment Services, Inc.
| | |
| Dryden Municipal Bond Fund | | 85 |
Claudia DiGiacomo (32), Assistant Secretary since 2005(3)
Principal occupations (last 5 years): Vice President and Corporate Counsel (since January 2005) of Prudential; Vice President and Assistant Secretary of PI (since December 2005); Associate at Sidley Austin Brown & Wood LLP (1999-2004).
Lee D. Augsburger (48), Chief Compliance Officer since 2004(3)
Principal occupations (last 5 years): Senior Vice President and Chief Compliance Officer (since April 2003) of PI; Vice President (since November 2000) and Chief Compliance Officer (since October 2000) of Prudential Investment Management, Inc.; Chief Compliance Officer and Senior Vice President (since May 2003) of AST Investment Services, Inc.
Valerie M. Simpson (48), Deputy Chief Compliance Officer since 2007(3)
Principal occupations (last 5 years): Vice President and Senior Compliance Officer (since March 2006) of PI; Vice President-Financial Reporting (since March 2006) for Prudential Life and Annuities Finance.
Grace C. Torres (48), Treasurer and Principal Financial and Accounting Officer since 1996(3)
Principal occupations (last 5 years): Assistant Treasurer (since March 1999) and Senior Vice President (since September 1999) of PI; Assistant Treasurer (since May 2003) and Vice President (since June 2005) of AST Investment Services, Inc.; Senior Vice President and Assistant Treasurer (since May 2003) of Prudential Annuities Advisory Services, Inc.; formerly Senior Vice President (May 2003-June 2005) of AST Investment Services, Inc.
John P. Schwartz (36), Assistant Secretary since 2006(3)
Principal occupations (last 5 years): Vice President and Corporate Counsel (since April 2005) of Prudential; Vice President and Assistant Secretary of PI (since December 2005); Associate at Sidley, Austin Brown & Wood LLP (1997-2005).
M. Sadiq Peshimam (43), Assistant Treasurer since 2006(3)
Principal occupations (last 5 years): Vice President (since 2005) and Director (2000-2005) within Prudential Mutual Fund Administration.
Andrew R. French (44), Assistant Secretary since 2006(3)
Principal occupations (last 5 years): Director and Corporate Counsel (since May 2006) of Prudential; Vice President and Assistant Secretary (since January 2007) of PI; Vice President and Assistant Secretary (since January 2007) of PMFS; formerly Senior Legal Analyst of Prudential Mutual Fund Law Department (1997-2006).
Noreen M. Fierro (42), Anti-Money Laundering Compliance Officer since 2006(3)
Principal occupations (last 5 years): Vice President, Corporate Compliance (since May 2006) of Prudential; formerly Corporate Vice President, Associate General Counsel (April 2002-May 2005) of UBS Financial Services, Inc., in their Money Laundering Prevention Group; Senior Manager (May 2005-May 2006) of Deloitte Financial Advisory Services, LLP, in their Forensic and Dispute Services, Anti-Money Laundering Group.
| | |
| 86 | | Visit our website at www.jennisondryden.com |
† | The Fund Complex consists of all investment companies managed by PI. The Funds for which PI serves as manager include Jennison Dryden Mutual Funds, Strategic Partners Funds, The Prudential Variable Contract Accounts 2, 10, 11. The Target Portfolio Trust, The Prudential Series Fund, The High Yield Income Fund, Inc., The High Yield Plus Fund, Inc., Nicholas-Applegate Fund, Inc., Advanced Series Trust (formerly American Skandia Trust), and Prudential’s Gibraltar Fund, Inc. |
(1) | “Interested” Trustee, as defined in the 1940 Act, by reason of employment with the Manager, a Subadvisor or the Distributor. |
(2) | Unless otherwise noted, the address of the Trustees and Officers is c/o: Prudential Investments LLC, Gateway Center Three, 100 Mulberry Street, Newark, NJ 07102. |
(3) | There is no set term of office for Trustees and Officers. The Independent Trustees have adopted a retirement policy, which calls for the retirement of Trustees on December 31 of the year in which they reach the age of 75. The table shows the individual’s length of service as Trustee and/or Officer. |
(4) | This includes only directorships of companies required to register, or file reports with the SEC under the Securities and Exchange Act of 1934 (that is, “public companies”) or other investment companies registered under the 1940 Act. |
Additional Information about the Fund’s Trustees is included in the Fund’s Statement of Additional Information which is available without charge, upon request, by calling (800) 521-7466 or (732) 482-7555 (Calling from outside the U.S.)
| | |
| Dryden Municipal Bond Fund | | 87 |
Growth of a $10,000 Investment
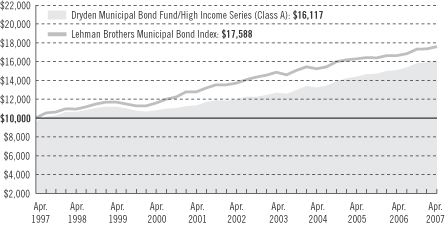
| | | | | | | | | |
| Average Annual Total Returns (With Sales Charges) as of 4/30/07 | | | | | | | | | |
| | | One Year | | | Five Years | | | Ten Years | |
Class A | | 2.66 | % | | 5.30 | % | | 4.89 | % |
Class B | | 1.67 | | | 5.73 | | | 5.03 | |
Class C | | 5.41 | | | 5.63 | | | 4.77 | |
Class Z | | 7.21 | | | 6.43 | | | 5.56 | |
| | | | | | | | | |
| Average Annual Total Returns (Without Sales Charges) as of 4/30/07 | | | | | | | | | |
| | | One Year | | | Five Years | | | Ten Years | |
Class A | | 6.94 | % | | 6.16 | % | | 5.32 | % |
Class B | | 6.67 | | | 5.89 | | | 5.03 | |
Class C | | 6.41 | | | 5.63 | | | 4.77 | |
Class Z | | 7.21 | | | 6.43 | | | 5.56 | |
Performance data quoted represent past performance. Past performance does not guarantee future results. The investment return and principal value of an investment will fluctuate, so that an investor’s shares, when redeemed, may be worth more or less than their original cost. Current performance may be lower or higher than the past performance data quoted. The returns in the graph and the tables do not reflect the deduction of taxes that a shareholder would pay on Series distributions or following the redemption of Series shares. An investor may obtain performance data current to the most recent month-end by visiting our website at www.jennisondryden.com or by calling (800) 225-1852. The maximum initial sales charge is 4.00%. Gross operating expenses: Class A, 0.94%; Class B, 1.14%;
| | |
| | Visit our website at www.jennisondryden.com |
Class C, 1.64%; Class Z, 0.64%. Net Operating Expenses apply to: Class A, 0.89%; Class B, 1.14%; Class C, 1.39%; Class Z, 0.64%, after contractual reduction through 8/31/2008.
Source: Prudential Investments LLC and Lipper Inc.
Inception dates: Class A, 1/22/90; Class B, 9/17/87; Class C, 8/1/94; and Class Z, 9/16/96.
The graph compares a $10,000 investment in the Dryden Municipal Bond Fund/High Income Series (Class A shares) with a similar investment in the Lehman Brothers Municipal Bond Index by portraying the initial account values at the beginning of the 10-year period for Class A shares (April 30, 1996) and the account values at the end of the current fiscal year (April 30, 2007) as measured on a quarterly basis. For purposes of the graph, and unless otherwise indicated, it has been assumed that (a) the maximum applicable front-end sales charge was deducted from the initial $10,000 investment in Class A shares; (b) all recurring fees (including management fees) were deducted; and (c) all dividends and distributions were reinvested. The line graph provides information for Class A shares only. As indicated in the tables provided earlier, performance for Class B, Class C, and Class Z shares will vary due to the differing charges and expenses applicable to each share class (as indicated in the following paragraphs). Without a distribution and service (12b-1) fee waiver of 0.05% for Class A shares through April 30, 2007, the returns shown in the graph and for Class A shares in the tables would have been lower.
The Lehman Brothers Municipal Bond Index (Index) is an unmanaged index of over 39,000 long-term investment-grade municipal bonds. It gives a broad look at how long-term investment-grade municipal bonds have performed. The Index’s total returns include the reinvestment of all dividends, but do not include the effects of sales charges, operating expenses of a mutual fund, or taxes. The returns for the Index would be lower if they included the effects of sales charges, operating expenses, or taxes. The securities that comprise the Index may differ substantially from the securities in the Series. This is not the only index that may be used to characterize performance of municipal bond funds. Other indexes may portray different comparative performance. Investors cannot invest directly in an index.
Through March 14, 2004, the Series charged a maximum front-end sales charge of 3.00% for Class A shares and a 12b-1 fee of up to 0.30% annually. Effective March 15, 2004, Class A shares are subject to a maximum front-end sales charge of 4.00% and a 12b-1 fee of up to 0.30% annually. Investors who purchase Class A shares in an amount of $1 million or more do not pay a front-end sales charge, but are subject to a contingent deferred sales charge (CDSC) of 1% for shares sold within 12 months of purchase. Class B shares are subject to a declining CDSC of 5%, 4%, 3%, 2%, 1%, and 1%, respectively, for the first six years after the purchase and a 12b-1 fee of up to 0.50% annually. Approximately seven years after purchase, Class B shares will automatically convert to Class A shares on a quarterly basis. Through February 1, 2004, Class C shares were subject to a front-end sales charge of 1%, a CDSC of 1% for shares redeemed within 18 months of purchase, and a 12b-1 fee of 1% annually. Class C shares purchased on or after February 2, 2004, are not subject to a front-end sales charge, the CDSC of 1% for Class C shares purchased on or after that date will apply for 12 months from the date of purchase, and the annual 12b-1 fee will remain 1%. Class Z shares are not subject to a sales charge or 12b-1 fee. The returns on investment in the graph and the returns in the tables do not reflect the deduction of taxes that a shareholder would pay on Fund distributions or following the redemption of Fund shares. Without waiver of fees and/or expense subsidization, the Series’ returns would have been lower.
| | |
| Dryden Municipal Bond Fund | | |
Growth of a $10,000 Investment
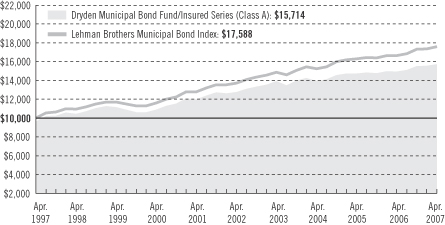
| | | | | | | | | |
| Average Annual Total Returns (With Sales Charges) as of 4/30/07 | | | | | | | | | |
| | | One Year | | | Five Years | | | Ten Years | |
Class A | | 1.20 | % | | 3.46 | % | | 4.62 | % |
Class B | | 0.15 | | | 3.89 | | | 4.77 | |
Class C | | 3.88 | | | 3.80 | | | 4.51 | |
Class Z | | 5.69 | | | 4.58 | | | 5.27 | |
| | | | | | | | | |
| Average Annual Total Returns (Without Sales Charges) as of 4/30/07 | | | | | | | | | |
| | | One Year | | | Five Years | | | Ten Years | |
Class A | | 5.42 | % | | 4.31 | % | | 5.05 | % |
Class B | | 5.15 | | | 4.06 | | | 4.77 | |
Class C | | 4.88 | | | 3.80 | | | 4.51 | |
Class Z | | 5.69 | | | 4.58 | | | 5.27 | |
Performance data quoted represent past performance. Past performance does not guarantee future results. The investment return and principal value of an investment will fluctuate, so that an investor’s shares, when redeemed, may be worth more or less than their original cost. Current performance may be lower or higher than the past performance data quoted. The returns in the graph and the tables do not reflect the deduction of taxes that a shareholder would pay on Series distributions or following the redemption of Series shares. An investor may obtain performance data current to the most recent month-end by visiting our website at www.jennisondryden.com or by calling (800) 225-1852. The maximum initial sales charge is 4.00%. Gross operating expenses: Class A, 0.95%; Class B, 1.15%; Class C, 1.65%; Class Z, 0.65%. Net
| | |
| | Visit our website at www.jennisondryden.com |
Operating Expenses apply to: Class A, 0.90%; Class B, 1.15%; Class C, 1.40%; Class Z, 0.65%, after contractual reduction through 8/31/2008.
Source: Prudential Investments LLC and Lipper Inc.
Inception dates: Class A, 1/22/90; Class B, 9/17/87; Class C, 8/1/94; and Class Z, 9/16/96.
The graph compares a $10,000 investment in the Dryden Municipal Bond Fund/Insured Series (Class A shares) with a similar investment in the Lehman Brothers Municipal Bond Index by portraying the initial account values at the beginning of the 10-year period for Class A shares (April 30, 1996) and the account values at the end of the current fiscal year (April 30, 2007) as measured on a quarterly basis. For purposes of the graph, and unless otherwise indicated, it has been assumed that (a) the maximum applicable front-end sales charge was deducted from the initial $10,000 investment in Class A shares; (b) all recurring fees (including management fees) were deducted; and (c) all dividends and distributions were reinvested. The line graph provides information for Class A shares only. As indicated in the tables provided earlier, performance for Class B, Class C, and Class Z shares will vary due to the differing charges and expenses applicable to each share class (as indicated in the following paragraphs). Without a distribution and service (12b-1) fee waiver of 0.05% for Class A shares through April 30, 2007, the returns shown in the graph and for Class A shares in the tables would have been lower.
The Lehman Brothers Municipal Bond Index (Index) is an unmanaged index of over 39,000 long-term investment-grade municipal bonds. It gives a broad look at how long-term investment-grade municipal bonds have performed. The Index’s total returns include the reinvestment of all dividends, but do not include the effects of sales charges, operating expenses of a mutual fund, or taxes. The returns for the Index would be lower if they included the effects of sales charges, operating expenses, or taxes. The securities that comprise the Index may differ substantially from the securities in the Series. This is not the only index that may be used to characterize performance of municipal bond funds. Other indexes may portray different comparative performance. Investors cannot invest directly in an index.
Through March 14, 2004, the Series charged a maximum front-end sales charge of 3.00% for Class A shares and a 12b-1 fee of up to 0.30% annually. Effective March 15, 2004, Class A shares are subject to a maximum front-end sales charge of 4.00% and a 12b-1 fee of up to 0.30% annually. Investors who purchase Class A shares in an amount of $1 million or more do not pay a front-end sales charge, but are subject to a contingent deferred sales charge (CDSC) of 1% for shares sold within 12 months of purchase. Class B shares are subject to a declining CDSC of 5%, 4%, 3%, 2%, 1%, and 1%, respectively, for the first six years after the purchase and a 12b-1 fee of up to 1.00% annually. Approximately seven years after purchase, Class B shares will automatically convert to Class A shares on a quarterly basis. Through February 1, 2004, Class C shares were subject to a front-end sales charge of 1%, a CDSC of 1% for shares redeemed within 18 months of purchase, and a 12b-1 fee of up to 1% annually. Class C shares purchased on or after February 2, 2004, are not subject to a front-end sales charge, the CDSC of 1% for Class C shares purchased on or after that date will apply for 12 months from the date of purchase, and the annual 12b-1 fee will remain up to 1%. Class Z shares are not subject to a sales charge or 12b-1 fee. The returns on investment in the graph and the returns in the tables do not reflect the deduction of taxes that a shareholder would pay on Fund distributions or following the redemption of Fund shares. Without waiver of fees and/or expense subsidization, the Series’ returns would have been lower.
| | |
| Dryden Municipal Bond Fund | | |
| | | | |
| n MAIL | | n TELEPHONE | | n WEBSITE |
Gateway Center Three 100 Mulberry Street Newark, NJ 07102 | | (800) 225-1852 | | www.jennisondryden.com |
|
| PROXY VOTING |
| The Board of Trustees of the Series has delegated to the Series’ investment subadviser the responsibility for voting any proxies and maintaining proxy recordkeeping with respect to the Series. A description of these proxy voting policies and procedures is available without charge, upon request, by calling (800) 225-1852 or by visiting the Securities and Exchange Commission’s website at www.sec.gov. Information regarding how the Series voted proxies relating to portfolio securities during the most recent 12-month period ended June 30 is available on the Series’ website and on the Commission’s website. |
|
| TRUSTEES |
| Linda W. Bynoe • David E.A. Carson • Robert F. Gunia • Robert E. La Blanc • Douglas H. McCorkindale • Richard A. Redeker • Judy A. Rice • Robin B. Smith • Stephen G. Stoneburn • Clay T. Whitehead |
|
| OFFICERS |
| Judy A. Rice, President • Robert F. Gunia, Vice President • Grace C. Torres, Treasurer and Principal Financial and Accounting Officer • Kathryn L. Quirk, Chief Legal Officer • Deborah A. Docs, Secretary • Lee D. Augsburger, Chief Compliance Officer • Valerie M. Simpson, Deputy Chief Compliance Officer • Noreen M. Fierro, Anti-Money Laundering Compliance Officer • Jonathan D. Shain, Assistant Secretary • Claudia DiGiacomo, Assistant Secretary • John P. Schwartz, Assistant Secretary • Andrew R. French, Assistant Secretary • M. Sadiq Peshimam, Assistant Treasurer |
| | | | |
| MANAGER | | Prudential Investments LLC | | Gateway Center Three
100 Mulberry Street
Newark, NJ 07102 |
|
| INVESTMENT SUBADVISER | | Prudential Investment
Management, Inc. | | Gateway Center Two
100 Mulberry Street
Newark, NJ 07102 |
|
| DISTRIBUTOR | | Prudential Investment
Management Services LLC | | Gateway Center Three
100 Mulberry Street
Newark, NJ 07102 |
|
| CUSTODIAN | | The Bank of New York | | One Wall Street
New York, NY 10286 |
|
| TRANSFER AGENT | | Prudential Mutual Fund
Services LLC | | P.O. Box 9658
Providence, RI 02940 |
|
INDEPENDENT REGISTERED
PUBLIC ACCOUNTING FIRM | | KPMG LLP | | 345 Park Avenue
New York, NY 10154 |
|
| FUND COUNSEL | | Willkie Farr & Gallagher LLP | | 787 Seventh Avenue
New York, NY 10019 |
|
| An investor should consider the investment objectives, risks, charges, and expenses of the Series carefully before investing. The prospectus for the Series contains this and other information about the Series. An investor may obtain a prospectus by visiting our website at www.jennisondryden.com or by calling (800) 225-1852. The prospectus should be read carefully before investing. |
|
| E-DELIVERY |
To receive your mutual fund documents on-line, go to www.icsdelivery.com/prudential/funds
and enroll. Instead of receiving printed documents by mail, you will receive notification via e-mail when new materials are available. You can cancel your enrollment or change your e-mail
address at any time by clicking on the change/cancel enrollment option at the icsdelivery website address. |
|
| SHAREHOLDER COMMUNICATIONS WITH TRUSTEES |
| Shareholders can communicate directly with the Board of Trustees by writing to the Chair of the Board, Dryden Municipal Bond Fund/High Income Series and Insured Series, Prudential Investments, Attn: Board of Trustees, 100 Mulberry Street, Gateway Center Three, Newark, NJ 07102. Shareholders can communicate directly with an individual Trustee by writing to the same address. Communications are not screened before being delivered to the addressee. |
|
| AVAILABILITY OF PORTFOLIO SCHEDULE |
| Each Series files its complete schedule of portfolio holdings with the Securities and Exchange Commission for the first and third quarters of each fiscal year on Form N-Q. The Series’ Forms N-Q are available on the Commission’s website at www.sec.gov. The Series’ Forms N-Q may also be reviewed and copied at the Commission’s Public Reference Room in Washington, D.C. Information on the operation and location of the Public Reference Room may be obtained by calling (800) SEC-0330 (732-0330). The Series’ schedule of portfolio holdings is also available on the Series’ website as of the end of each fiscal quarter. |
|
| The Series’ Statement of Additional Information contains additional information about the Series’ Trustees and is available without charge, upon request, by calling (800) 225-1852. |
Mutual Funds:
| | | | |
| ARE NOT INSURED BY THE FDIC OR ANY FEDERAL GOVERNMENT AGENCY | | MAY LOSE VALUE | | ARE NOT A DEPOSIT OF OR GUARANTEED BY ANY BANK OR ANY BANK AFFILIATE |

| | | | | | | | | | | | |
| Dryden Municipal Bond Fund/High Income Series | | | | |
| | | Share Class | | A | | B | | C | | Z | | |
| | NASDAQ | | PRHAX | | PMHYX | | PHICX | | PHIZX | | |
| | CUSIP | | 262467103 | | 262467202 | | 262467301 | | 262467400 | | |
| | | | | | | | | | | | |
| Dryden Municipal Bond Fund/Insured Series | | | | |
| | | Share Class | | A | | B | | C | | Z | | |
| | NASDAQ | | PMIAX | | PMINX | | PMICX | | PMIZX | | |
| | CUSIP | | 262467509 | | 262467608 | | 262467707 | | 262467806 | | |
| | | | | | | | | | | | |
MF133E IFS-A134866 Ed. 06/2007
Item 2 – Code of Ethics – See Exhibit (a)
As of the end of the period covered by this report, the registrant has adopted a code of ethics (the “Section 406 Standards for Investment Companies – Ethical Standards for Principal Executive and Financial Officers”) that applies to the registrant’s Principal Executive Officer and Principal Financial Officer; the registrant’s Principal Financial Officer also serves as the Principal Accounting Officer.
The registrant hereby undertakes to provide any person, without charge, upon request, a copy of the code of ethics. To request a copy of the code of ethics, contact the registrant 800-225-1852, and ask for a copy of the Section 406 Standards for Investment Companies - Ethical Standards for Principal Executive and Financial Officers.
Item 3 – Audit Committee Financial Expert –
The registrant’s Board has determined that Mr. David E. A. Carson, member of the Board’s Audit Committee is an “audit committee financial expert,” and that he is “independent,” for purposes of this Item.
Item 4 – Principal Accountant Fees and Services –
(a) Audit Fees
For the fiscal years ended April 30, 2007 and April 30, 2006 KPMG LLP (“KPMG”), the Registrant’s principal accountant, billed the Registrant $55,892 and $47,000, respectively, for professional services rendered for the audit of the Registrant’s annual financial statements or services that are normally provided in connection with statutory and regulatory filings.
(b) Audit-Related Fees
None.
(c) Tax Fees
None.
(d) All Other Fees
None.
(e) (1) Audit Committee Pre-Approval Policies and Procedures
THE PRUDENTIAL MUTUAL FUNDS
AUDIT COMMITTEE POLICY
on
Pre-Approval of Services Provided by the Independent Accountants
The Audit Committee of each Prudential Mutual Fund is charged with the responsibility to monitor the independence of the Fund’s independent accountants. As part of this responsibility, the Audit Committee must pre-approve any independent accounting firm’s engagement to render audit and/or permissible non-audit services, as required by law. In evaluating a proposed engagement of the independent accountants, the Audit Committee will assess the effect that the engagement might reasonably be expected to have on the accountant’s independence. The Committee’s evaluation will be based on:
| | • | | a review of the nature of the professional services expected to be provided, |
| | • | | a review of the safeguards put into place by the accounting firm to safeguard independence, and |
| | • | | periodic meetings with the accounting firm. |
Policy for Audit and Non-Audit Services Provided to the Funds
On an annual basis, the scope of audits for each Fund, audit fees and expenses, and audit-related and non-audit services (and fees proposed in respect thereof) proposed to be performed by the Fund’s independent accountants will be presented by the Treasurer and the independent accountants to the Audit Committee for review and, as appropriate, approval prior to the initiation of such services. Such presentation shall be accompanied by confirmation by both the Treasurer and the independent accountants that the proposed services will not adversely affect the independence of the independent accountants. Proposed services shall be described in sufficient detail to enable the Audit Committee to assess the appropriateness of such services and fees, and the compatibility of the provision of such services with the auditor’s independence. The Committee shall receive periodic reports on the progress of the audit and other services which are approved by the Committee or by the Committee Chair pursuant to authority delegated in this Policy.
The categories of services enumerated under “Audit Services”, “Audit-related Services”, and “Tax Services” are intended to provide guidance to the Treasurer and the independent accountants as to those categories of services which the Committee believes are generally consistent with the independence of the independent accountants and which the Committee (or the Committee Chair) would expect upon the presentation of specific proposals to pre-approve. The enumerated categories are not intended as an exclusive list of audit, audit-related or tax services, which the Committee (or the Committee Chair) would consider for pre-approval.
Audit Services
The following categories of audit services are considered to be consistent with the role of the Fund’s independent accountants:
| | Ø | | Annual Fund financial statement audits |
| | Ø | | Seed audits (related to new product filings, as required) |
| | Ø | | SEC and regulatory filings and consents |
Audit-related Services
The following categories of audit-related services are considered to be consistent with the role of the Fund’s independent accountants:
| | Ø | | Accounting consultations |
| | Ø | | Fund merger support services |
| | Ø | | Agreed Upon Procedure Reports |
| | Ø | | Other Internal Control Reports |
Individual audit-related services that fall within one of these categories and are not presented to the Audit Committee as part of the annual pre-approval process will be subject to pre-approval by the Committee Chair (or any other Committee member on whom this responsibility has been delegated) so long as the estimated fee for those services does not exceed $50,000.
Tax Services
The following categories of tax services are considered to be consistent with the role of the Fund’s independent accountants:
| | Ø | | Tax compliance services related to the filing or amendment of the following: |
| | n | Federal, state and local income tax compliance; and, |
| | n | Sales and use tax compliance |
| | Ø | | Timely RIC qualification reviews |
| | Ø | | Tax distribution analysis and planning |
| | Ø | | Tax authority examination services |
| | Ø | | Tax appeals support services |
| | Ø | | Accounting methods studies |
| | Ø | | Fund merger support services |
| | Ø | | Tax consulting services and related projects |
Individual tax services that fall within one of these categories and are not presented to the Audit Committee as part of the annual pre-approval process will be subject to pre-approval by the Committee Chair (or any other Committee member on whom this responsibility has been delegated) so long as the estimated fee for those services does not exceed $50,000.
Other Non-audit Services
Certain non-audit services that the independent accountants are legally permitted to render will be subject to pre-approval by the Committee or by one or more Committee members to whom the Committee has delegated this authority and who will report to the full Committee any pre-approval decisions made pursuant to this Policy. Non-audit services presented for pre-approval pursuant to this paragraph will be accompanied by a confirmation from both the Treasurer and the independent accountants that the proposed services will not adversely affect the independence of the independent accountants.
Proscribed Services
The Fund’s independent accountants will not render services in the following categories of non-audit services:
| | Ø | | Bookkeeping or other services related to the accounting records or financial statements of the Fund |
| | Ø | | Financial information systems design and implementation |
| | Ø | | Appraisal or valuation services, fairness opinions, or contribution-in-kind reports |
| | Ø | | Internal audit outsourcing services |
| | Ø | | Management functions or human resources |
| | Ø | | Broker or dealer, investment adviser, or investment banking services |
| | Ø | | Legal services and expert services unrelated to the audit |
| | Ø | | Any other service that the Public Company Accounting Oversight Board determines, by regulation, is impermissible. |
Pre-approval of Non-Audit Services Provided to Other Entities Within the Prudential Fund Complex
Certain non-audit services provided to Prudential Investments LLC or any of its affiliates that also provide ongoing services to the Prudential Mutual Funds will be subject to pre-approval by the Audit Committee. The only non-audit services provided to these entities that will require pre-approval are those related directly to the operations and financial reporting of the Funds. Individual projects that are not presented to the Audit Committee as part of the annual pre-approval process will be subject to pre-approval by the Committee Chair (or any other Committee member on whom this responsibility has been delegated) so long as the estimated fee for those services does not exceed $50,000. Services presented for pre-approval pursuant to this paragraph will be accompanied by a confirmation from both the Treasurer and the independent accountants that the proposed services will not adversely affect the independence of the independent accountants.
Although the Audit Committee will not pre-approve all services provided to Prudential Investments LLC and its affiliates, the Committee will receive an annual report from the Fund’s independent accounting firm showing the aggregate fees for all services provided to Prudential Investments and its affiliates.
(e) (2) Percentage of services referred to in 4(b)- (4)(d) that were approved by the audit committee –
Not applicable.
(f) Percentage of hours expended attributable to work performed by other than full time employees of principal accountant if greater than 50%.
Not applicable.
(g) Non-Audit Fees
Not applicable to Registrant for the fiscal years 2007 and 2006. The aggregate non-audit fees billed by KPMG for services rendered to the registrant’s investment adviser and any entity controlling, controlled by, or under common control with the investment adviser that provides ongoing services to the registrant for the fiscal years 2007 and 2006 was $317,300 and $51,000, respectively.
(h) Principal Accountant’s Independence
Not applicable as KPMG has not provided non-audit services to the registrant’s investment adviser and any entity controlling, controlled by, or under common control with the investment adviser that provides ongoing services to the registrant that were not pre-approved pursuant to Rule 2-01(c)(7)(ii) of Regulation S-X.
Item 5 – Audit Committee of Listed Registrants – Not applicable.
Item 6 – Schedule of Investments – The schedule is included as part of the report to shareholders filed under Item 1 of this Form.
Item 7 – Disclosure of Proxy Voting Policies and Procedures for Closed-End Management Investment Companies – Not applicable.
Item 8 – Portfolio Managers of Closed-End Management Investment Companies – Not applicable.
Item 9 – Purchases of Equity Securities by Closed-End Management Investment Company and Affiliated Purchasers – Not applicable.
Item 10 – Submission of Matters to a Vote of Security Holders – Not applicable.
Item 11 – Controls and Procedures
| | (a) | It is the conclusion of the registrant’s principal executive officer and principal financial officer that the effectiveness of the registrant’s current disclosure controls and procedures (such disclosure controls and procedures having been evaluated within 90 days of the date of this filing) provide reasonable assurance that the information required to be disclosed by the registrant has been recorded, processed, summarized and reported within the time period specified in the Commission’s rules and forms and that the information required to be disclosed by the registrant has been accumulated and communicated to the registrant’s principal executive officer and principal financial officer in order to allow timely decisions regarding required disclosure. |
| | (b) | There has been no significant change in the registrant’s internal control over financial reporting that occurred during the registrant’s most recent fiscal quarter of the period covered by this report that has materially affected, or is likely to materially affect, the registrant’s internal control over financial reporting. |
Item 12 – Exhibits
| | | | |
| (a) | | (1) | | Code of Ethics – Attached hereto as Exhibit EX-99.CODE-ETH |
| | |
| | (2) | | Certifications pursuant to Section 302 of the Sarbanes-Oxley Act – Attached hereto as Exhibit EX-99.CERT. |
| | |
| | (3) | | Any written solicitation to purchase securities under Rule 23c-1. – Not applicable. |
| | (b) | Certifications pursuant to Section 906 of the Sarbanes-Oxley Act – Attached hereto as Exhibit EX-99.906CERT. |
SIGNATURES
Pursuant to the requirements of the Securities Exchange Act of 1934 and the Investment Company Act of 1940, the registrant has duly caused this report to be signed on its behalf by the undersigned, thereunto duly authorized.
| | | | | | |
| (Registrant) | | Dryden Municipal Bond Fund | | | | |
| | | | |
| By (Signature and Title)* | | /s/ Deborah A. Docs | | |
| | Deborah A. Docs | | |
| | Secretary | | |
Pursuant to the requirements of the Securities Exchange Act of 1934 and the Investment Company Act of 1940, this report has been signed below by the following persons on behalf of the registrant and in the capacities and on the dates indicated.
| | | | |
| By (Signature and Title)* | | /s/ Judy A. Rice | | |
| | Judy A. Rice | | |
| | President and Principal Executive Officer | | |
| | | | |
| | |
| By (Signature and Title)* | | /s/ Grace C. Torres | | |
| | Grace C. Torres | | |
| | Treasurer and Principal Financial Officer | | |
* | Print the name and title of each signing officer under his or her signature. |