UNITED STATES
SECURITIES AND EXCHANGE COMMISSION
Washington, D.C. 20549
FORM N-CSR
CERTIFIED SHAREHOLDER REPORT OF REGISTERED
MANAGEMENT INVESTMENT COMPANIES
| | |
| Investment Company Act file number: | | 811-04930 |
| |
| Exact name of registrant as specified in charter: | | Prudential Investment Portfolios 4 f/k/a Dryden Municipal Bond Fund |
| |
| Address of principal executive offices: | | Gateway Center 3, 100 Mulberry Street, Newark, New Jersey 07102 |
| |
| Name and address of agent for service: | | Deborah A. Docs Gateway Center 3, 100 Mulberry Street, Newark, New Jersey 07102 |
| |
| Registrant’s telephone number, including area code: | | 800-225-1852 |
| |
| Date of fiscal year end: | | 4/30/2010 |
| |
| Date of reporting period: | | 4/30/2010 |
Item 1 – Reports to Stockholders

| | |
| ANNUAL REPORT | | APRIL 30, 2010 |
Prudential Muni High Income Fund
(Formerly known as Dryden Municipal Bond Fund/High Income Series)
| | | | |
Fund Type Municipal bond Objective Maximum amount of income that is eligible for exclusion from federal income taxes | | | | This report is not authorized for distribution to prospective investors unless preceded or accompanied by a current prospectus. The views expressed in this report and information about the Fund’s portfolio holdings are for the period covered by this report and are subject to change thereafter. Prudential Investments, Prudential Financial, and the Rock Prudential logo are registered service marks of The Prudential Insurance Company of America, Newark, NJ, and its affiliates. |
| | |

| | To enroll in e-delivery, go to www.prudentialfunds.com/edelivery |
June 14, 2010
Dear Shareholder:
Recently we announced the renaming of JennisonDryden, Prudential Financial’s mutual fund family, to Prudential Investments. As a result of this change, each of our funds has been renamed to feature “Prudential” as part of its new name. The name of your fund has changed from the Dryden Municipal Bond Fund/High Income Series to the Prudential Muni High Income Fund.
While the name of your fund has changed, its investment objectives and portfolio management team remain the same. No action is required on your part. If you participate in an automatic investment plan, your account continues to be invested in the Fund under its new name.
Featuring the Prudential name in our funds creates an immediate connection to the experience and heritage of Prudential, a name recognized by millions for helping people grow and protect their wealth.
On the following pages, you will find your fund’s annual report, including an analysis of its performance over its fiscal year in addition to other data. If you have questions about your fund or the renaming of our mutual fund family, please contact your financial professional or visit our website at www.prudentialfunds.com.
Sincerely,

Judy A. Rice, President
Prudential Muni High Income Fund
| | |
| Prudential Muni High Income Fund | | 1 |
Your Fund’s Performance
Performance data quoted represent past performance. Past performance does not guarantee future results. The investment return and principal value of an investment will fluctuate, so that an investor’s shares, when redeemed, may be worth more or less than their original cost. Current performance may be lower or higher than the past performance data quoted. An investor may obtain performance data as of the most recent month-end by visiting our website at www.prudentialfunds.com or by calling (800) 225-1852. The maximum initial sales charge is 4.00% (Class A shares). Gross operating expenses: Class A, 0.92%; Class B, 1.12%; Class C, 1.62%; Class Z, 0.62%. Net operating expenses: Class A, 0.87%; Class B, 1.12%; Class C, 1.37%; Class Z, 0.62%, after contractual reduction through 8/31/2011 for Class A and 8/31/2010 for Class C.
| | | | | | | | | |
| Cumulative Total Returns (Without Sales Charges) as of 4/30/10 | |
| | | One Year | | | Five Years | | | Ten Years | |
Class A | | 18.75 | % | | 19.79 | % | | 59.53 | % |
Class B | | 18.45 | | | 18.34 | | | 55.75 | |
Class C | | 18.18 | | | 16.96 | | | 52.04 | |
Class Z | | 19.08 | | | 21.50 | | | 63.88 | |
Barclays Capital Muni Bond Index | | 8.85 | | | 24.67 | | | 75.19 | |
Barclays Capital Non-Investment-Grade Muni Bond Index | | 27.56 | | | 15.75 | | | 68.19 | |
Lipper Average | | 23.49 | | | 9.89 | | | 49.97 | |
| | | | | | | | | |
| Average Annual Total Returns (With Sales Charges) as of 3/31/10 | |
| | | One Year | | | Five Years | | | Ten Years | |
Class A | | 16.08 | % | | 2.88 | % | | 4.16 | % |
Class B | | 15.49 | | | 3.30 | | | 4.34 | |
Class C | | 19.22 | | | 3.22 | | | 4.08 | |
Class Z | | 21.12 | | | 3.99 | | | 4.86 | |
Barclays Capital Muni Bond Index | | 9.69 | | | 4.58 | | | 5.58 | |
Barclays Capital Non-Investment-Grade Muni Bond Index | | 28.31 | | | 3.06 | | | 5.15 | |
Lipper Average | | 25.75 | | | 1.81 | | | 3.96 | |
| | | | | | | | | |
| Average Annual Total Returns (With Sales Charges) as of 4/30/10 | | | | |
| | | One Year | | | Five Years | | | Ten Years | |
Class A | | 14.00 | % | | 2.83 | % | | 4.35 | % |
Class B | | 13.45 | | | 3.26 | | | 4.53 | |
Class C | | 17.18 | | | 3.18 | | | 4.28 | |
Class Z | | 19.08 | | | 3.97 | | | 5.06 | |
| | |
| 2 | | Visit our website at www.prudentialfunds.com |
| | | | | | | | | |
| Average Annual Total Returns (Without Sales Charges) as of 4/30/10 | | | | |
| | | One Year | | | Five Years | | | Ten Years | |
Class A | | 18.75 | % | | 3.68 | % | | 4.78 | % |
Class B | | 18.45 | | | 3.42 | | | 4.53 | |
Class C | | 18.18 | | | 3.18 | | | 4.28 | |
Class Z | | 19.08 | | | 3.97 | | | 5.06 | |
Growth of a $10,000 Investment
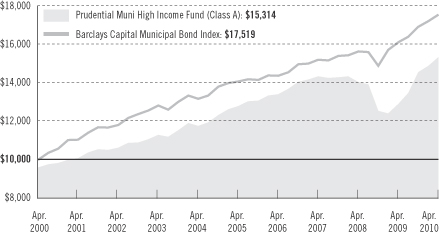
The returns in the graph and the tables do not reflect the deduction of taxes that a shareholder would pay on Fund distributions or following the redemption of Fund shares.
The graph compares a $10,000 investment in the Prudential Muni High Income Fund (Class A shares) with a similar investment in the Barclays Capital Municipal Bond Index by portraying the initial account values at the beginning of the 10-year period for Class A shares (April 30, 2000) and the account values at the end of the current fiscal year (April 30, 2010) as measured on a quarterly basis. For purposes of the graph, and unless otherwise indicated, it has been assumed that (a) the maximum applicable front-end sales charge was deducted from the initial $10,000 investment in Class A shares; (b) all recurring fees (including management fees) were deducted; and (c) all dividends and distributions were reinvested. The line graph provides information for Class A shares only. As indicated in the tables provided earlier, performance for Class B, Class C, and Class Z shares will vary due to the differing charges and expenses applicable to each share class. Without a distribution and service (12b-1) fee waiver of 0.05% for Class A shares through April 30, 2010, the returns shown in the graph and for Class A shares in the tables would have been lower.
Source: Prudential Investments LLC and Lipper Inc. Performance figures may reflect fee waivers and/or expense reimbursements. In the absence of such fee waivers and/or expense reimbursements, total returns would be lower.
| | |
| Prudential Muni High Income Fund | | 3 |
Your Fund’s Performance (continued)
The average annual total returns take into account applicable sales charges. Class A, Class B, and Class C shares are subject to an annual distribution and service (12b-1) fee of up to 0.30%, 0.50%, and 1.00%, respectively. Approximately seven years after purchase, Class B shares will automatically convert to Class A shares on a quarterly basis. Class Z shares are not subject to a 12b-1 fee. Under certain circumstances, Class A shares may be subject to a contingent deferred sales charge (CDSC) of 1%. Class B and Class C shares are subject to a maximum CDSC of 5% and 1%, respectively. Class Z shares are not subject to a sales charge. The returns in the tables do not reflect the deduction of taxes that a shareholder would pay on Fund distributions or following the redemption of Fund shares.
Benchmark Definitions
The Barclays Capital Municipal (Muni) Bond Index
The Barclays Capital Municipal (Muni) Bond Index is an unmanaged index of over 46,000 investment-grade municipal bonds. It gives a broad look at how long-term investment-grade municipal bonds have performed.
The Barclays Capital Non-Investment-Grade Municipal (Muni) Bond Index
The Barclays Capital Non-Investment-Grade Municipal (Muni) Bond Index is an unmanaged index of non-rated or Ba1 or below-rated municipal bonds. It gives a broad look at how non-investment-grade municipal bonds have performed. The bonds in this index must have an outstanding par value of at least $3 million and be issued as part of a transaction of at least $20 million. The bonds must also have a dated date after December 31, 1990, and must be at least one year from their maturity date. The inception date of the Barclays Capital Non-Investment-Grade Muni Bond Index is October 1995.
The Lipper High Yield Municipal Debt Funds Average
The Lipper High Yield Municipal Debt Funds Average (Lipper Average) represents returns based on an average return of all funds in the Lipper High Yield Municipal Debt Funds category for the periods noted. Funds in the Lipper Average invest at least 50% of their assets in lower-rated municipal debt issues.
Investors cannot invest directly in an index. The returns for the Barclays Capital Indexes and the Lipper Average would be lower if they included the effects of sales charges, operating expenses of a mutual fund, or taxes. Returns for the Lipper Average reflect the deduction of operating expenses, but not sales charges or taxes.
| | | | | | | | | | | | |
| Distribution and Yields as of 4/30/10 | |
| | | Total Distributions
Paid for 12 Months | | 30-Day
SEC Yield | | | Taxable Equivalent Yield*
at Tax Rates of | |
| | | | | 33% | | | 35% | |
Class A | | $ | 0.51 | | 4.50 | % | | 7.09 | % | | 7.31 | % |
Class B | | | 0.49 | | 4.43 | | | 6.98 | | | 7.20 | |
Class C | | | 0.47 | | 4.18 | | | 6.59 | | | 6.79 | |
Class Z | | | 0.54 | | 4.94 | | | 7.79 | | | 8.03 | |
*Some investors may be subject to the federal alternative minimum tax and/or state and local taxes. Taxable equivalent yields reflect federal taxes only.
| | |
| 4 | | Visit our website at www.prudentialfunds.com |
| | | |
| Five Largest Holdings expressed as a percentage of net assets as of 4/30/10 | |
West Virginia (WV) St. Hosp. Fin. Auth. Hosp. Rev., Oak Hill Hosp., Ser. B, (Prerefunded 09/01/10),
6.750%, 09/01/30 | | 1.3 | % |
Memphis (TN) Ctr. City Rev., Fin. Corp., Red Birds, Ser. B, 6.500%, 09/01/28 | | 1.3 | |
Foothill/Eastern (CA) Trans. Corridor Agcy. Toll Rd. Rev., Convertible C.A.B.S., Converted to Fixed on 07/15/09,
5.875%, 01/15/28 | | 1.2 | |
New Jersey (NJ) Econ. Dev. Auth. Rev., Continental Airlines, Inc., Proj., Spec. Facs. Rev., A.M.T., 6.250%, 09/15/29 | | 1.1 | |
Metro Pier & Expo. (IL) Auth. Dedicated St. Tax Rev., McCormick Place Expansion, Ser. A, N.A.T.L.,
5.250%, 06/15/42 | | 1.1 | |
Holdings are subject to change.
| | | |
| Credit Quality* expressed as a percentage of net assets as of 4/30/10 | |
Aaa | | 2.7 | % |
Aa | | 6.7 | |
A | | 28.1 | |
Baa | | 31.1 | |
Ba | | 6.4 | |
B | | 2.8 | |
Caa | | 2.7 | |
Not Rated | | 18.4 | |
Total Investments | | 98.9 | |
Other assets in excess of liabilities | | 1.1 | |
Net Assets | | 100.0 | % |
| | | |
*Source: Moody’s rating, defaulting to S&P when not rated by Moody’s.
Credit Quality is subject to change.
| | |
| Prudential Muni High Income Fund | | 5 |
Strategy and Performance Overview
How did the Fund perform?
The Fund’s Class A shares returned 18.75% for the 12 months ended April 30, 2010, outperforming the 8.85% gain of the Barclays Capital Municipal Bond Index, which consists entirely of investment-grade bonds. Yet the Fund’s Class A shares trailed the 23.49% gain of the Lipper High Yield Municipal Debt Funds Average and the 27.56% gain of the Barclays Capital Non-Investment-Grade Municipal Bond Index, which tracks bonds that are not rated or rated below investment grade.
How is the Fund managed?
Prudential Fixed Income manages the Fund, which normally invests at least 80% of its investable assets in municipal bonds issued by states and municipalities whose interest is free from regular federal income tax. It can also invest in municipal bonds whose interest is subject to the federal alternative minimum tax.
Research is crucial to the Fund’s investment process. Senior investment professionals develop a quarterly market outlook that provides an overall view of the economy, interest rates, and risk levels in the major bond markets. This outlook helps set broad investment strategies for the Fund. In deciding which bonds to buy or sell, portfolio managers work closely with a team of five credit research analysts, four of whom have more than 15 years of experience analyzing municipal bonds.
During the reporting period, the Fund’s exposure to municipal bonds in the highest investment-grade rating category declined, while its exposure to municipal bonds in certain lower rating categories was selectively increased. This strategy worked well as the latter outperformed the former as explained on the following pages.
How did the municipal bond market perform overall?
When the reporting period began on May 1, 2009, economic conditions in the United States had begun to stabilize, setting the stage for the resumption of growth that summer. The federal government’s economic stimulus plan, the American Recovery and Reinvestment Act of 2009, created programs such as “cash for clunkers” that encouraged consumers to buy new, more fuel-efficient autos and a tax credit for first-time homebuyers. Both played a crucial role in getting the economy moving again. The Federal Reserve (the Fed) also continued various efforts to boost growth such as leaving its target for the overnight bank lending rate at a record low range of zero to 0.25%.
Though state and local governments faced budget imbalances aggravated by weak tax revenues, strong investor demand enabled municipal bond prices to gain for most months of the reporting period. Another positive was the Build America Bond
| | |
| 6 | | Visit our website at www.prudentialfunds.com |
program, which is a part of the economic stimulus plan, that allows state and local governments to issue taxable bonds through the end of 2010 to finance construction of roads and other capital projects. Build America Bonds pay interest subject to federal income tax and, therefore, offer a higher yield than comparable tax-exempt bonds. The federal government pays issuers of Build America Bonds a subsidy equal to 35% of their interest costs, thereby lowering issuers’ borrowing costs. (Congress may extend the program with lower subsidy rates.)
State and local governments issued large amounts of Build America Bonds during the reporting period, particularly longer-term ones. The program did siphon away issuance from the tax-exempt bond market in the face of very strong investor demand for tax-advantaged assets, which also helped boost tax-exempt bond prices. Municipal bond prices were also supported by periodic reinvestment of large amounts of monies that investors received from coupon and principal payments.
How did the different sectors of the municipal bond market perform?
All sectors of the municipal bond market finished the reporting period in positive territory. But low short-term rates and increased investor appetite for risk helped revenue bonds, favored for their comparatively higher yields, outperform general obligation (GO) bonds. (A revenue bond is typically backed by money from a specific project or systems, while a GO bond is typically backed by the taxing authority of a state or municipality.)
From the perspective of credit quality, low short-term rates and increased appetite for risk also helped municipal bonds of below-investment-grade quality, favored for their higher yields, outperform municipal bonds rated investment grade. This caused the yield differential between the Barclays Capital Non-Investment-Grade Municipal Bond Index and the Barclays Capital Municipal Bond Index to shrink from 583 basis points as of April 30, 2009 to 341 basis points as of April 30, 2010. (A basis point equals one hundredth of a percentage point.) Among investment-grade municipal bonds, the preference for risk was evident as the lowest rating category, Baa, outperformed the higher rating categories, which are single-A, Aa, and Aaa as defined by Moody’s Investors Service.
What contributed most to the Fund’s performance?
The Fund benefited from maintaining a larger exposure to revenue bonds than to GO bonds. And as previously mentioned, it also benefited as its exposure to municipal bonds in the highest investment-grade rating category declined, while its exposure to municipal bonds in certain lower rating categories was selectively increased. For example, the Fund reinvested proceeds from prerefunded municipal bonds, which are
| | |
| Prudential Muni High Income Fund | | 7 |
Strategy and Performance Overview (continued)
often rated AAA, into municipal bonds rated Baa or lower, which performed better and provided more attractive yields.
Bonds become prerefunded and their maturities shorten when their issuer takes advantage of a decline in yields by issuing new bonds at lower interest rates. Proceeds of the new bonds are used to purchase special federal government securities held in an escrow account. Cash flow from these debt securities pays interest on the prerefunded bonds until a predetermined date, when the prerefunded bonds are retired prior to their original maturity. This process may reduce the issuer’s costs, and the prerefunded bonds may become rated AAA.
The Fund used proceeds from prerefunded bonds to purchase healthcare municipal bonds and corporate-backed municipal bonds, which finance industrial development or pollution control projects. Both were among the best performing sectors of the municipal bond market, with the corporate-backed sector performing particularly well as the resumption of economic growth helped improve corporate earnings in the United States. Among the Fund’s high-yield purchases were debt securities issued by the Hamden, Connecticut Facilities Authority for the Whitney Center (a senior living facility) and debt securities issued by Clayton County, Georgia Development Authority for Delta Airlines.
What subtracted most from the Fund’s performance?
Bonds of the Memphis Center City Revenue Financing Corp. for the Memphis Redbirds, a minor league baseball team in Tennessee, remained one of the Fund’s largest holdings. Though the bonds continued to be a drag on the Fund’s return during the reporting period, the 2009 baseball season was a time of new developments for the team.
The Memphis Redbirds Baseball Foundation hired Global Spectrum, a venue management firm, to be the new manager of the Memphis Redbirds in 2009 and to operate the team’s home field, AutoZone Park. The Memphis Redbirds’ performance also improved and by the end of the season, the team was the 2009 champion of the Pacific Coast League. With the start of the 2010 baseball season, Global Spectrum continues to make strides in all aspects of operations.
What else had a major impact on the Fund’s return?
As previously mentioned, the Build America Bond program siphoned away issuance from the tax-exempt bond market, particularly from the long-term maturity category. Consequently, longer-term tax-exempt bond prices gained the most for the reporting period, pushing their yields lower, as bond prices move inversely to yields.
| | |
| 8 | | Visit our website at www.prudentialfunds.com |
The slope of the municipal bond yield curve became flatter as yields on longer-term tax-exempt bonds declined more than yields on shorter-term tax-exempt bonds. (The yield curve shows the relationship between tax-exempt bonds of the same credit quality from the shortest to the longest maturities.) Prudential Fixed Income anticipated this shift in the municipal bond yield curve and positioned the Fund to benefit by increasing its exposure to longer-term municipal bonds.
| | |
| Prudential Muni High Income Fund | | 9 |
Fees and Expenses
As a shareholder of a Fund, you incur two types of costs: (1) transaction costs, including sales charges (loads) on purchase payments and redemptions, as applicable, and (2) ongoing costs, including management fees, distribution and/or service (12b-1) fees, and other Fund expenses, as applicable. This example is intended to help you understand your ongoing costs (in dollars) of investing in each Fund and to compare these costs with the ongoing costs of investing in other mutual funds.
The example is based on an investment of $1,000 invested on November 1, 2009, at the beginning of the period, and held through the six-month period ended April 30, 2010. The example is for illustrative purposes only; you should consult the Prospectus for information on initial and subsequent minimum investment requirements.
The Fund’s transfer agent may charge additional fees to holders of certain accounts that are not included in the expenses shown in the table on the following page. These fees apply to individual retirement accounts (IRAs) and Section 403(b) accounts. As of the close of the six-month period covered by the table, IRA fees included an annual maintenance fee of $15 per account (subject to a maximum annual maintenance fee of $25 for all accounts held by the same shareholder). Section 403(b) accounts are charged an annual $25 fiduciary maintenance fee. Some of the fees may vary in amount, or may be waived, based on your total account balance or the number of Prudential Investments funds, including the Fund, that you own. You should consider the additional fees that were charged to your Fund account over the six-month period when you estimate the total ongoing expenses paid over the period and the impact of these fees on your ending account value, as these additional expenses are not reflected in the information provided in the expense table. Additional fees have the effect of reducing investment returns.
Actual Expenses
The first line for each share class in the tables on the following pages provides information about actual account values and actual expenses. You may use the information on this line, together with the amount you invested, to estimate the expenses that you paid over the period. Simply divide your account value by $1,000 (for example, an $8,600 account value ÷ $1,000 = 8.6), then multiply the result by the number on the first line under the heading “Expenses Paid During the Six-Month Period” to estimate the expenses you paid on your account during this period.
Hypothetical Example for Comparison Purposes
The second line for each share class in the tables on the following pages provides information about hypothetical account values and hypothetical expenses based on the Fund’s actual expense ratio and an assumed rate of return of 5% per year before
| | |
| 10 | | Visit our website at www.prudentialfunds.com |
expenses, which is not the Fund’s actual return. The hypothetical account values and expenses may not be used to estimate the actual ending account balance or expenses you paid for the period. You may use this information to compare the ongoing costs of investing in the Fund and other funds. To do so, compare this 5% hypothetical example with the 5% hypothetical examples that appear in the shareholder reports of the other funds.
Please note that the expenses shown in the tables are meant to highlight your ongoing costs only and do not reflect any transactional costs such as sales charges (loads). Therefore, the second line for each share class in the table is useful in comparing ongoing costs only and will not help you determine the relative total costs of owning different funds. In addition, if these transactional costs were included, your costs would have been higher.
| | | | | | | | | | | | | | |
Prudential Muni High
Income Fund | | Beginning Account
Value
November 1, 2009 | | Ending Account
Value April 30, 2010 | | Annualized
Expense Ratio
Based on the
Six-Month Period | | | Expenses Paid
During the
Six-Month Period* |
| | | | | | | | | | | | | | |
| Class A | | Actual | | $ | 1,000.00 | | $ | 1,053.50 | | 0.87 | % | | $ | 4.43 |
| | | Hypothetical | | $ | 1,000.00 | | $ | 1,020.48 | | 0.87 | % | | $ | 4.36 |
| | | | | | | | | | | | | | |
| Class B | | Actual | | $ | 1,000.00 | | $ | 1,052.20 | | 1.12 | % | | $ | 5.70 |
| | | Hypothetical | | $ | 1,000.00 | | $ | 1,019.24 | | 1.12 | % | | $ | 5.61 |
| | | | | | | | | | | | | | |
| Class C | | Actual | | $ | 1,000.00 | | $ | 1,052.10 | | 1.37 | % | | $ | 6.97 |
| | | Hypothetical | | $ | 1,000.00 | | $ | 1,018.00 | | 1.37 | % | | $ | 6.85 |
| | | | | | | | | | | | | | |
| Class Z | | Actual | | $ | 1,000.00 | | $ | 1,056.10 | | 0.62 | % | | $ | 3.16 |
| | | Hypothetical | | $ | 1,000.00 | | $ | 1,021.72 | | 0.62 | % | | $ | 3.11 |
* Fund expenses (net of fee waivers or subsidies, if any) for each share class are equal to the annualized expense ratio for each share class (provided in the table), multiplied by the average account value over the period, multiplied by the 181 days in the six-month period ended April 30, 2010, and divided by the 365 days in the Fund’s fiscal year ended April 30, 2010 (to reflect the six-month period). Expenses presented in the table include the expenses of any underlying portfolios in which the Fund may invest.
| | |
| Prudential Muni High Income Fund | | 11 |
Portfolio of Investments
as of April 30, 2010
| | | | | | | | | | | | |
| Description (a) | | Moody’s
Rating*†
(Unaudited) | | Interest
Rate | | Maturity
Date | | Principal
Amount (000) | | Value (Note 1) |
| | | | | | | | | | | | |
LONG-TERM INVESTMENTS 97.2% | | | | | | | | | | |
| | | | |
Alabama 0.7% | | | | | | | | | | |
Camden Ind. Dev. Brd. Facs. Rev., Rfdg. Weyerhaeuser, Ser. B, A.M.T. (Prerefunded 12/1/13)(e) | | AAA(b) | | 6.375% | | 12/01/24 | | $ | 1,000 | | $ | 1,176,090 |
Cullman Cnty., Healthcare Auth., Cullman Reg. Med. Ctr., Ser. A | | Baa3 | | 7.000 | | 02/01/36 | | | 1,000 | | | 1,031,490 |
Selma Indl. Dev. Brd. Rev., Gulf Opportunity Zone, Intl. Paper Co., Ser. A | | Baa3 | | 6.250 | | 11/01/33 | | | 1,750 | | | 1,797,915 |
| | | | | | | | | | | | |
| | | | | | | | | | | | 4,005,495 |
| | | | | |
Arizona 3.3% | | | | | | | | | | | | |
Arizona Hlth. Facs. Auth. Rev., Banner Hlth., Ser. D | | A+(b) | | 5.500 | | 01/01/38 | | | 2,500 | | | 2,543,575 |
Coconino Cnty. Poll. Ctrl. Corp. Rev., Tucson Elec. Pwr., Navajo, Ser. A, A.M.T. | | Baa3 | | 7.125 | | 10/01/32 | | | 5,000 | | | 5,002,300 |
Maricopa Cnty. Indl. Dev. Auth. Hlth. Facs. Rev., Catholic Healthcare West, Ser. A | | A2 | | 5.250 | | 07/01/32 | | | 2,500 | | | 2,513,150 |
Maricopa Cnty. Poll. Ctrl. Corp., Rev., El Paso Elec. Co., Ser. B | | Baa2 | | 7.250 | | 04/01/40 | | | 1,500 | | | 1,695,435 |
Pima Cnty. Indl. Dev. Auth. Rev., Ed. Fac.-P.L.C. Charter Sch. Proj. | | NR | | 6.750 | | 04/01/36 | | | 1,500 | | | 1,341,690 |
Tucson Elec. Pwr. Co. | | Baa3 | | 5.750 | | 09/01/29 | | | 1,000 | | | 1,017,580 |
Tucson Elec. Pwr. Co., San Juan, Ser. A | | Baa3 | | 4.950 | | 10/01/20 | | | 1,000 | | | 1,010,510 |
Pinal Cnty. Correct. Facs. Rev., Florence West Prison Proj., Ser. A, A.C.A. | | BBB(b) | | 5.250 | | 10/01/19 | | | 3,135 | | | 3,008,848 |
| | | | | | | | | | | | |
| | | | | | | | | | | | 18,133,088 |
| | | | | |
California 11.5% | | | | | | | | | | | | |
California Cnty. Tob. Sec. Agcy. Tob. Conv. Bonds Asset Bkd., Ser. B | | NR | | 5.100 | | 06/01/28 | | | 1,750 | | | 1,509,865 |
See Notes to Financial Statements.
| | |
| Prudential Muni High Income Fund | | 13 |
Portfolio of Investments
as of April 30, 2010 continued
| | | | | | | | | | | | |
| Description (a) | | Moody’s
Rating*†
(Unaudited) | | Interest
Rate | | Maturity
Date | | Principal
Amount (000) | | Value (Note 1) |
| | | | | | | | | | | | |
California (cont’d.) | | | | | | | | | | | | |
California Hlth. Facs. Fing. Auth. Rev.,
Cedars-Sinai Med. Ctr. | | A2 | | 5.000% | | 08/15/39 | | $ | 1,000 | | $ | 967,090 |
St. Joseph Hlth. Sys., Ser. A | | A1 | | 5.750 | | 07/01/39 | | | 1,000 | | | 1,039,630 |
California Mun. Fin. Auth. Ctfs. Partn. Cmnty. Hosps. Cent. | | Baa2 | | 5.500 | | 02/01/39 | | | 500 | | | 450,725 |
California Poll. Ctrl. Fin. Auth. Solid Wste. Disp. Rev., Wste. Mgmt., Inc. PJ-Ser. B, A.M.T. | | BBB(b) | | 5.000 | | 07/01/27 | | | 1,000 | | | 984,090 |
California St. Pub. Wks. Brd. Lease Rev., Various Cap. Proj., | | | | | | | | | | | | |
Ser. A-1 | | A2 | | 6.000 | | 03/01/35 | | | 1,500 | | | 1,562,040 |
Ser. G-1 | | A2 | | 5.750 | | 10/01/30 | | | 750 | | | 768,585 |
Ser. I-1 | | A2 | | 6.375 | | 11/01/34 | | | 750 | | | 803,513 |
California St.,
G.O. | | A1 | | 6.000 | | 04/01/38 | | | 3,500 | | | 3,809,645 |
Var. Purp., G.O. | | A1 | | 5.000 | | 10/01/29 | | | 1,500 | | | 1,507,770 |
Var. Purp., G.O. | | A1 | | 5.500 | | 11/01/39 | | | 1,000 | | | 1,035,160 |
Var. Purp., G.O. | | A1 | | 6.000 | | 11/01/39 | | | 1,500 | | | 1,639,650 |
California Statewide Cmntys. Dev. Auth. Rev., John Muir Hlth. | | A1 | | 5.125 | | 07/01/39 | | | 500 | | | 484,875 |
Sch. Fac., Aspire Pub. Sch. | | NR | | 6.000 | | 07/01/30 | | | 1,000 | | | 1,003,920 |
Sr. Living Southn. Calif. Presbyterian Homes | | BBB(b) | | 7.250 | | 11/15/41 | | | 500 | | | 542,240 |
Capistrano Unif. Sch. Dist. Cmnty. Facs., Rev., Talega Cmnty. Facs. Dist. #90-2 | | NR | | 6.000 | | 09/01/33 | | | 1,000 | | | 958,770 |
City of Chula Vista Indl. Dev. Rev., San Diego Gas, A.M.T. | | Aa3 | | 5.000 | | 12/01/27 | | | 1,000 | | | 979,340 |
Foothill/Eastern Trans. Corridor Agcy. Toll Rd. Rev., Convertible C.A.B.S., Converted to Fixed on 7/15/09 | | Baa3 | | 5.875 | | 01/15/28 | | | 6,700 | | | 6,623,820 |
Golden St. Tob. Secur. Corp. Tob. Settlement Rev., | | | | | | | | | | | | |
Asset Bkd., Ser. A | | A2 | | 5.000 | | 06/01/45 | | | 1,000 | | | 909,660 |
Asset Bkd., Sr., Ser. A-1 | | Baa3 | | 5.750 | | 06/01/47 | | | 6,515 | | | 4,996,353 |
Lake Elsinore Spl. Tax Cmnty. Facs. Dist.-2-Area A-A | | NR | | 5.450 | | 09/01/36 | | | 1,500 | | | 1,219,800 |
See Notes to Financial Statements.
| | |
| 14 | | Visit our website at www.prudentialfunds.com |
| | | | | | | | | | | | |
| Description (a) | | Moody’s
Rating*†
(Unaudited) | | Interest
Rate | | Maturity
Date | | Principal
Amount (000) | | Value (Note 1) |
| | | | | | | | | | | | |
California (cont’d.) | | | | | | | | | | | | |
Lincoln Impvt. Bond Act 1915, Pub. Fin. Auth. Rev., Twelve Bridges | | NR | | 6.200% | | 09/02/25 | | $ | 3,330 | | $ | 3,339,391 |
Los Angeles Regional Arpts. Impt. Corp. Lse. Rev., American Airlines, Inc., A.M.T. | | Caa2 | | 7.500 | | 12/01/24 | | | 2,000 | | | 2,006,540 |
M-S-R Energy Auth. Calif., | | | | | | | | | | | | |
Ser. A | | A(b) | | 6.500 | | 11/01/39 | | | 2,000 | | | 2,208,820 |
Ser. A | | A(b) | | 7.000 | | 11/01/34 | | | 1,650 | | | 1,941,126 |
Murrieta Cmnty. Facs. Dist. Spl. Tax., No. 2, The Oaks Impt. Area, Ser. A | | NR | | 5.900 | | 09/01/27 | | | 1,000 | | | 934,110 |
Orange Cnty, Loc. Trans. Auth. Sales Tax Rev., Linked, S.A.V.R.S., R.I.B.S. | | Aa2 | | 6.200 | | 02/14/11 | | | 3,400 | | | 3,487,414 |
Perris Cmnty. Facs. Dist., Spec. Tax, No. 01- 2, Avalon Ser. A | | NR | | 6.250 | | 09/01/23 | | | 3,000 | | | 2,838,900 |
Port of Oakland, Ser. K (Prerefunded 5/1/10) A.M.T., N.A.T.L.(e) | | A2 | | 5.875 | | 11/01/30 | | | 40 | | | 40,005 |
Unrefunded Balance, Ser. K, A.M.T., N.A.T.L. | | A2 | | 5.875 | | 11/01/30 | | | 4,960 | | | 4,960,248 |
Rancho Cordova Cmnty. Facs. Dist., Spec. Tax No. 2003-1, | | | | | | | | | | | | |
Sunridge Anatolia | | NR | | 6.000 | | 09/01/33 | | | 1,000 | | | 930,080 |
Sunridge Anatolia | | NR | | 6.100 | | 09/01/37 | | | 1,980 | | | 1,845,756 |
Saugus Unif. Sch. Dist. Spl. Tax Cmnty. Facs. Dist. No. 2002-1 | | NR | | 6.000 | | 09/01/33 | | | 1,800 | | | 1,725,786 |
South Bayside Wste. Mgmt. Auth. Calif. Solid Wste. Enterprise Shoreway Environmental, Ser. A | | A3 | | 6.000 | | 09/01/36 | | | 500 | | | 518,390 |
Valley Hlth. Sys. Hosp. Rev., Rfdg. & Impvt. Proj., Ser. A(c)(h) | | C(b) | | 6.500 | | 05/15/25 | | | 130 | | | 71,357 |
Vernon California Elec. Sys. Rev., Ser. A | | A3 | | 5.125 | | 08/01/21 | | | 1,500 | | | 1,583,340 |
See Notes to Financial Statements.
| | |
| Prudential Muni High Income Fund | | 15 |
Portfolio of Investments
as of April 30, 2010 continued
| | | | | | | | | | | | |
| Description (a) | | Moody’s
Rating*†
(Unaudited) | | Interest
Rate | | Maturity
Date | | Principal
Amount (000) | | Value (Note 1) |
| | | | | | | | | | | | |
California (cont’d.) | | | | | | | | | | | | |
Wm. S. Hart Unif. High Sch. Dist., Spl. Tax Cmnty. Fac. Dist. No. 2005-1 | | NR | | 5.300% | | 09/01/36 | | $ | 1,000 | | $ | 719,860 |
| | | | | | | | | | | | |
| | | | | | | | | | | | 62,947,664 |
| | | | | |
Colorado 1.4% | | | | | | | | | | | | |
Colorado Hlth. Facs. Auth. Rev., Adventist Hlth. Sunbelt Ser. D, Rfdg. | | A1 | | 5.250 | | 11/15/35 | | | 2,500 | | | 2,508,175 |
Christian Living Cmntys. Proj., Ser. A | | NR | | 5.750 | | 01/01/37 | | | 1,500 | | | 1,297,290 |
Valley View Assn. Proj. | | BBB(b) | | 5.125 | | 05/15/37 | | | 1,240 | | | 1,153,522 |
Colorado Springs Memorial Hosp. Rev., Unrefunded balance | | A3 | | 6.375 | | 12/15/30 | | | 1,260 | | | 1,280,702 |
Pub. Auth. Energy Nat. Gas Pur. Rev. | | A2 | | 6.500 | | 11/15/38 | | | 1,500 | | | 1,641,120 |
| | | | | | | | | | | | |
| | | | | | | | | | | | 7,880,809 |
| | | | | |
Connecticut 1.1% | | | | | | | | | | | | |
Connecticut St. Dev. Auth. Poll. Rev., Conn. Lt. & Pwr. B, A.M.T. | | Baa1 | | 5.950 | | 09/01/28 | | | 1,500 | | | 1,507,950 |
Connecticut St. Dev. Auth. Solid Wste. Disp. Facs. Rev., PSEG Pwr. LLC Proj., Ser. A, A.M.T. | | Baa1 | | 5.750 | | 11/01/37 | | | 1,600 | | | 1,602,208 |
Hamden Fac. Rev., Whitney Ctr. Proj., Ser. A | | NR | | 7.750 | | 01/01/43 | | | 1,000 | | | 1,042,280 |
Harbor Point Infrastructure Impt. Dist. Spl. Oblig. Rev., Harbor Point Proj., Ser. A | | NR | | 7.875 | | 04/01/39 | | | 2,000 | | | 2,094,780 |
| | | | | | | | | | | | |
| | | | | | | | | | | | 6,247,218 |
| | | | | |
Delaware 0.4% | | | | | | | | | | | | |
Delaware St. Econ. Dev. Auth. Rev., Rfdg. Gas Facs., Delmarva Pwr. | | Baa2 | | 5.400 | | 02/01/31 | | | 1,000 | | | 1,018,040 |
See Notes to Financial Statements.
| | |
| 16 | | Visit our website at www.prudentialfunds.com |
| | | | | | | | | | | | |
| Description (a) | | Moody’s
Rating*†
(Unaudited) | | Interest
Rate | | Maturity
Date | | Principal
Amount (000) | | Value (Note 1) |
| | | | | | | | | | | | |
Delaware (cont’d.) | | | | | | | | | | | | |
Delaware St. Hlth. Facs. Auth. Rev., Beebe Med. Ctr. Proj., Ser. A | | Ba3 | | 5.000% | | 06/01/30 | | $ | 2,000 | | $ | 1,200,000 |
| | | | | | | | | | | | |
| | | | | | | | | | | | 2,218,040 |
| | | | | |
District of Columbia 0.3% | | | | | | | | | | | | |
Metropolitan Washington D.C. Arpt. Auth. Sys. Rev., Ser. A, A.M.T. | | Aa3 | | 5.250 | | 10/01/27 | | | 1,500 | | | 1,533,720 |
| | | | | |
Florida 4.6% | | | | | | | | | | | | |
Citizens Ppty. Ins. Corp., Sr. Secd., High Act | | A2 | | 6.000 | | 06/01/16 | | | 1,500 | | | 1,644,885 |
Greater Orlando Aviation Auth., Orlando Arpt. Fac. Rev., Spl. Purp.- Jetblue Airways Corp., A.M.T. | | NR | | 6.375 | | 11/15/26 | | | 3,000 | | | 2,803,950 |
Spl. Purp.- Jetblue Airways Corp., A.M.T. | | NR | | 6.500 | | 11/15/36 | | | 2,000 | | | 1,850,060 |
Highlands Cmnty. Dev. Dist. Spl. Assmt.(c)(h) | | NR | | 5.550 | | 05/01/36 | | | 400 | | | 203,600 |
Hillsborough Cnty. Indl. Dev. Auth. Rev.,
Hlth. Facs., Univ. Cmnty. Hosp., Ser. B | | Baa3 | | 8.000 | | 08/15/32 | | | 1,000 | | | 1,138,070 |
Tampa Electric | | Baa1 | | 5.650 | | 05/15/18 | | | 1,000 | | | 1,105,970 |
Indigo Cmnty. Dev. Dist. Cap.
Impvt. Rev. | | NR | | 5.750 | | 05/01/36 | | | 1,920 | | | 1,069,248 |
Jacksonville Aviation Auth. Rev., A.M.B.A.C., A.M.T. | | A2 | | 5.000 | | 10/01/26 | | | 2,000 | | | 1,999,920 |
Jacksonville Econ. Dev.,
Anheuser Busch Co., Ser. B, A.M.T. | | Baa2 | | 4.750 | | 03/01/47 | | | 2,500 | | | 2,130,300 |
Gerdau Ameristeel U.S., Inc., A.M.T. | | Ba1 | | 5.300 | | 05/01/37 | | | 3,000 | | | 2,319,720 |
Miami Beach Hlth. Facs. Auth. Hosp. Rev., Mount Sinai Med. Ctr., Ser. A | | Ba2 | | 6.700 | | 11/15/19 | | | 1,000 | | | 1,015,300 |
Miami-Dade Cnty. Aviation Rev., Miami Intl. Arpt., Ser. A-1 | | A2 | | 5.375 | | 10/01/35 | | | 1,600 | | | 1,628,672 |
See Notes to Financial Statements.
| | |
| Prudential Muni High Income Fund | | 17 |
Portfolio of Investments
as of April 30, 2010 continued
| | | | | | | | | | | | |
| Description (a) | | Moody’s
Rating*†
(Unaudited) | | Interest
Rate | | Maturity
Date | | Principal
Amount (000) | | Value (Note 1) |
| | | | | | | | | | | | |
Florida (cont’d.) | | | | | | | | | | | | |
Paseo Cmnty. Dev. Dist. Cap. Impvt. Rev., Ser. A (original cost $1,360,000; purchased 6/17/05)(c)(h)(i) | | NR | | 5.400% | | 05/01/36 | | $ | 1,360 | | $ | 217,600 |
Reunion West Cmnty. Dev. Dist.
Spec. Assmt. | | NR | | 6.250 | | 05/01/36 | | | 1,420 | | | 586,829 |
Sarasota Cnty. Fla. Pub. Hosp. Dist. Hosp. Rev., Sarasota Mem. Hosp. Proj., Ser. A | | A1 | | 5.625 | | 07/01/39 | | | 1,000 | | | 1,036,510 |
Seminole Tribe Spl. Oblig. Rev., Ser. A, 144A | | Ba1 | | 5.500 | | 10/01/24 | | | 1,000 | | | 938,380 |
South Lake Cnty. Hosp. Dist. Rev., South Lake Hosp., Ser. A | | Baa2 | | 6.250 | | 04/01/39 | | | 1,910 | | | 1,960,787 |
St. Petersburg Hlth. Facs. Auth. Rev., All Childrens Hosp. | | A1 | | 6.500 | | 11/15/39 | | | 1,500 | | | 1,654,680 |
| | | | | | | | | | | | |
| | | | | | | | | | | | 25,304,481 |
| | | | | |
Georgia 1.7% | | | | | | | | | | | | |
Burke Cnty. Dev. Auth. Poll. Rev., Oglethorpe Pwr.-Vogtle Proj., Ser. B | | A3 | | 5.500 | | 01/01/33 | | | 1,000 | | | 1,037,260 |
Clayton Cnty. Dev. Auth. Spl. Facs. Rev.,
Delta Air Lines, Ser. A | | Caa1 | | 8.750 | | 06/01/29 | | | 2,000 | | | 2,133,640 |
Delta Air Lines, Ser. B, A.M.T. | | Caa1 | | 9.000 | | 06/01/35 | | | 1,000 | | | 1,041,840 |
De Kalb Cnty. Hosp. Auth. Rev., Antic Ctfs., DeKalb Med. Ctr., Inc., Proj. | | NR | | 6.125 | | 09/01/40 | | | 1,000 | | | 1,000,280 |
Fulton Cnty. Residential Care Facs. Rev., Canterbury Court Proj., Ser. A | | NR | | 6.125 | | 02/15/34 | | | 1,200 | | | 1,069,152 |
Henry Cnty. Wtr. & Swr. Auth. Rev., A.M.B.A.C. | | Aa2 | | 6.150 | | 02/01/20 | | | 1,000 | | | 1,189,780 |
Marietta Development Auth. Rev., Life Univ. | | Ba3 | | 7.000 | | 06/15/39 | | | 1,000 | | | 973,270 |
Thomasville Hosp. Auth. Rev., Antic Ctfs. John D. Archbold | | A2 | | 5.375 | | 11/01/40 | | | 1,000 | | | 991,850 |
| | | | | | | | | | | | |
| | | | | | | | | | | | 9,437,072 |
See Notes to Financial Statements.
| | |
| 18 | | Visit our website at www.prudentialfunds.com |
| | | | | | | | | | | | |
| Description (a) | | Moody’s
Rating*†
(Unaudited) | | Interest
Rate | | Maturity
Date | | Principal
Amount (000) | | Value (Note 1) |
| | | | | | | | | | | | |
Guam 0.2% | | | | | | | | | | | | |
Guam Govt., Ser. A | | B+(b) | | 7.000% | | 11/15/39 | | $ | 1,000 | | $ | 1,067,840 |
| | | | | |
Hawaii 0.4% | | | | | | | | | | | | |
Hawaii St. Dept. Budget & Fin. Spl. Purp. Rev.,
Hawaiian Elec. Co. | | Baa1 | | 6.500 | | 07/01/39 | | | 1,000 | | | 1,077,890 |
15 Craigside Proj. | | NR | | 9.000 | | 11/15/44 | | | 1,000 | | | 1,115,470 |
| | | | | | | | | | | | |
| | | | | | | | | | | | 2,193,360 |
| | | | | |
Idaho 0.4% | | | | | | | | | | | | |
Idaho Hlth. Facs. Auth. Rev., St. Lukes Hlth. Sys. Proj., Ser. A | | A2 | | 6.750 | | 11/01/37 | | | 1,000 | | | 1,101,820 |
Idaho Hsg. & Fin. Assn. Rev., North Star Charter Sch. Proj. | | NR | | 9.500 | | 07/01/39 | | | 1,000 | | | 1,147,910 |
| | | | | | | | | | | | |
| | | | | | | | | | | | 2,249,730 |
| | | | | |
Illinois 9.2% | | | | | | | | | | | | |
Gilberts Spec. Svcs. Area No. 9, Spec. Tax, Big Timber Proj. (Prerefunded 3/1/11)(e) | | AAA(b) | | 7.750 | | 03/01/27 | | | 5,000 | | | 5,401,350 |
Illinois Fin. Auth. Rev.,
American Water Cap. Corp. Proj. | | Baa2 | | 5.250 | | 10/01/39 | | | 3,150 | | | 3,145,181 |
Cent. Dupage Health, Ser. B | | AA(b) | | 5.500 | | 11/01/39 | | | 1,500 | | | 1,558,485 |
Friendship Vlg. Schaumburg, Ser. A | | NR | | 5.625 | | 02/15/37 | | | 1,000 | | | 796,870 |
Illinois Inst. of Technology, Ser. A | | Baa2 | | 5.000 | | 04/01/31 | | | 2,500 | | | 2,206,900 |
Illinois Inst. of Technology, Ser. A | | Baa2 | | 5.000 | | 04/01/36 | | | 5,000 | | | 4,282,300 |
NorthWestern Mem. Hosp., Ser. A | | Aa2 | | 6.000 | | 08/15/39 | | | 1,500 | | | 1,635,885 |
Provena Hlth., Ser. A | | Baa1 | | 6.000 | | 05/01/28 | | | 1,500 | | | 1,488,600 |
Provena Hlth., Ser. A | | Baa1 | | 7.750 | | 08/15/34 | | | 1,000 | | | 1,129,220 |
Rush Univ. Med. Ctr., Oblig. Grp. A | | A3 | | 7.250 | | 11/01/38 | | | 3,405 | | | 3,827,526 |
Rush Univ. Med. Ctr., Ser. C | | A3 | | 6.625 | | 11/01/39 | | | 1,000 | | | 1,077,570 |
Silver Cross & Med. Ctrs. | | BBB(b) | | 7.000 | | 08/15/44 | | | 3,000 | | | 3,190,290 |
See Notes to Financial Statements.
| | |
| Prudential Muni High Income Fund | | 19 |
Portfolio of Investments
as of April 30, 2010 continued
| | | | | | | | | | | | |
| Description (a) | | Moody’s
Rating*†
(Unaudited) | | Interest
Rate | | Maturity
Date | | Principal
Amount (000) | | Value (Note 1) |
| | | | | | | | | | | | |
Illinois (cont’d.) | | | | | | | | | | | | |
Student Hsg., Rfdg. Edl. Advancement Fd., Inc. Ser. B | | Baa3 | | 5.000% | | 05/01/30 | | $ | 5,000 | | $ | 4,297,100 |
Swedish Covenant, Ser. A | | BBB+(b) | | 6.000 | | 08/15/38 | | | 1,500 | | | 1,502,040 |
Illinois Hlth. Facs. Auth. Rev., Lake Forest Hosp., Ser. A | | Aa2 | | 6.250 | | 07/01/22 | | | 4,200 | | | 4,341,204 |
Kane & De Kalb Cntys. Sch. Dist., No. 301, A.M.B.A.C., C.A.B.S., G.O. | | NR | | 2.190(k) | | 12/01/11 | | | 3,360 | | | 3,245,894 |
Metro. Pier & Expo. Auth. Dedicated St. Tax Rev., McCormick Place Expansion, Ser. A, N.A.T.L. | | A1 | | 5.250 | | 06/15/42 | | | 6,000 | | | 6,077,159 |
Round Lake Rev., Lakewood Spl. Tax #1 (Prerefunded 3/1/13)(e) | | NR | | 6.700 | | 03/01/33 | | | 1,000 | | | 1,151,680 |
| | | | | | | | | | | | |
| | | | | | | | | | | | 50,355,254 |
| | | | | |
Indiana 2.3% | | | | | | | | | | | | |
Indiana Hlth. & Edl. Fac. Fin. Auth. Hosp. Rev., Cmnty. Foundation Northwest Ind. | | BBB(b) | | 5.500 | | 03/01/37 | | | 2,000 | | | 1,947,860 |
Cmnty. Foundation Northwest Ind., Ser. A | | BBB(b) | | 6.000 | | 03/01/34 | | | 3,000 | | | 3,017,280 |
Indiana St. Fin. Auth. Env. Facs. Rev.,
Duke Energy Ind., Ser. B | | A3 | | 6.000 | | 08/01/39 | | | 1,000 | | | 1,091,060 |
Ind. Pwr. & Lt. Co., Ser. B | | A3 | | 4.900 | | 01/01/16 | | | 1,500 | | | 1,608,675 |
Indiana St. Fin. Auth. Rev., Drexel Fndtn. Edl. Facs. Proj., Ser. A | | NR | | 7.000 | | 10/01/39 | | | 1,000 | | | 1,044,040 |
Rfdg. Impt., U.S. Steel Corp. | | Ba2 | | 6.000 | | 12/01/26 | | | 1,000 | | | 1,000,000 |
Indiana St. Hsg. Fin. Auth. Singl. Fam. Mtge. Rev., Ser. B2, A.M.T., G.N.M.A./F.N.M.A. | | Aaa | | 4.000 | | 01/01/34 | | | 505 | | | 498,400 |
Indianapolis Ind. Loc. Pub. Impt. Bd. Bk. Wtrwks. Proj. Ser. A | | A1 | | 5.750 | | 01/01/38 | | | 1,000 | | | 1,072,520 |
Vigo Cnty. Hosp. Auth. Rev., Union Hosp., Inc. | | NR | | 5.800 | | 09/01/47 | | | 1,500 | | | 1,276,215 |
| | | | | | | | | | | | |
| | | | | | | | | | | | 12,556,050 |
See Notes to Financial Statements.
| | |
| 20 | | Visit our website at www.prudentialfunds.com |
| | | | | | | | | | | | |
| Description (a) | | Moody’s
Rating*†
(Unaudited) | | Interest
Rate | | Maturity
Date | | Principal
Amount (000) | | Value (Note 1) |
| | | | | | | | | | | | |
Iowa 0.6% | | | | | | | | | | | | |
Altoona Urban Renewal Tax Rev., Annual Appr. | | BBB+(b) | | 6.000% | | 06/01/43 | | $ | 1,000 | | $ | 1,008,850 |
Iowa St. Fin. Auth. Healthcare., Facs. Rev., Mercy Hlth. Initiatives Proj. (Prerefunded 7/1/11)(e) | | NR | | 9.250 | | 07/01/25 | | | 2,050 | | | 2,291,408 |
| | | | | | | | | | | | |
| | | | | | | | | | | | 3,300,258 |
| | | | | |
Kansas 0.2% | | | | | | | | | | | | |
Kansas St. Dev. Fin. Auth. Hosp. Rev., Adventist Hlth. | | A1 | | 5.750 | | 11/15/38 | | | 1,000 | | | 1,068,860 |
| | | | | |
Kentucky 0.7% | | | | | | | | | | | | |
Kentucky Economic Dev. Fin. Auth. Hosp. Facs. Rev., Owensboro Med. Health Sys. | | Baa2 | | 6.375 | | 06/01/40 | | | 2,500 | | | 2,570,000 |
Owen Cnty. Wtrwks. Sys. Rev., Amern. Wtr. Co. Proj., | | | | | | | | | | | | |
Ser. A | | Baa2 | | 6.250 | | 06/01/39 | | | 500 | | | 533,505 |
Ser. B | | Baa2 | | 5.625 | | 09/01/39 | | | 500 | | | 515,895 |
| | | | | | | | | | | | |
| | | | | | | | | | | | 3,619,400 |
| | | | | |
Louisiana 2.2% | | | | | | | | | | | | |
Calcasieu Parish, Inc., Ind. Dev. Brd. Rev., Rfdg. Olin Corp. Proj. | | Ba1 | | 6.625 | | 02/01/16 | | | 2,500 | | | 2,490,950 |
Louisiana Loc. Govt. Woman’s Hospital Foundation | | A3 | | 6.000 | | 10/01/44 | | | 2,000 | | | 1,996,980 |
Louisiana Pub. Facs. Auth. Hosp. Rev., Franciscan Missionaries | | A2 | | 6.750 | | 07/01/39 | | | 2,000 | | | 2,191,540 |
Louisiana St. Citizens Ppty. Ins. Assmt. Rev., Ser. C, A.G.C. | | Aa3 | | 6.750 | | 06/01/26 | | | 2,000 | | | 2,291,600 |
Tobacco Settlement Fing. Corp. Rev., Asset Bkd., Ser. 2001B | | Baa3 | | 5.875 | | 05/15/39 | | | 3,000 | | | 2,892,780 |
| | | | | | | | | | | | |
| | | | | | | | | | | | 11,863,850 |
Maryland 0.3% | | | | | | | | | | | | |
Maryland Econ. Dev. Corp., Potomac Elect. Pwr. Co. | | A3 | | 6.200 | | 09/01/22 | | | 1,000 | | | 1,140,750 |
See Notes to Financial Statements.
| | |
| Prudential Muni High Income Fund | | 21 |
Portfolio of Investments
as of April 30, 2010 continued
| | | | | | | | | | | | |
| Description (a) | | Moody’s
Rating*†
(Unaudited) | | Interest
Rate | | Maturity
Date | | Principal
Amount (000) | | Value (Note 1) |
| | | | | | | | | | | | |
Maryland (cont’d.) | | | | | | | | | | | | |
Maryland St. Indl. Dev. Fin. Auth. Rev., Rfdg. Synagro. Baltimore, Ser. A, A.M.T. | | NR | | 5.250% | | 12/01/13 | | $ | 700 | | $ | 705,880 |
| | | | | | | | | | | | |
| | | | | | | | | | | | 1,846,630 |
| | | | | |
Massachusetts 2.7% | | | | | | | | | | | | |
Massachusetts St. Coll. Bldg., Auth. Rev., Proj. & Rfdg. Bonds, Ser. A | | Aa1 | | 7.500 | | 05/01/14 | | | 1,750 | | | 2,012,063 |
Massachusetts St. Dev. Fin. Agcy. Rev.,
Alliance Hlth., Ser. A | | NR | | 7.100 | | 07/01/32 | | | 3,830 | | | 3,506,480 |
Carleton Willard Vlg. | | A–(b) | | 5.625 | | 12/01/30 | | | 400 | | | 399,688 |
Groves in Lincoln-Deacone, Sr. Living Fac. Rev., Ser. B1 | | NR | | 7.250 | | 06/01/16 | | | 1,000 | | | 1,005,580 |
Linden Ponds, Inc. Fac., Ser. A (original cost $1,020,130; purchased 7/20/07)(h)(i) | | NR | | 5.750 | | 11/15/42 | | | 1,000 | | | 712,830 |
Solid Wste. Disp. Rev., Dominion Energy Brayton (Mandatory put date 5/1/19) | | Baa2 | | 5.750 | | 12/01/42 | | | 1,000 | | | 1,070,290 |
Massachusetts St. Hlth. & Edl. Facs. Auth. Rev.,
Caregroup, Ser. E-1 | | A3 | | 5.125 | | 07/01/38 | | | 750 | | | 716,093 |
Caritas Christi Oblig. Group, Rfdg., Ser. A | | Baa2 | | 5.750 | | 07/01/28 | | | 2,000 | | | 1,861,340 |
Caritas Christi Oblig. Group, Rfdg., Ser. B | | Baa2 | | 6.750 | | 07/01/16 | | | 3,595 | | | 3,755,552 |
| | | | | | | | | | | | |
| | | | | | | | | | | | 15,039,916 |
| | | | | |
Michigan 4.2% | | | | | | | | | | | | |
Detroit Mich. Distr. St. Aid, G.O. | | Aa3 | | 5.250 | | 11/01/35 | | | 500 | | | 500,000 |
Detroit Mich. Sewer Disp. Rev., Sr. Lien Ser. B, A.G.C. | | Aa3 | | 7.500 | | 07/01/33 | | | 1,000 | | | 1,200,760 |
Kalamazoo Hosp. Fin. Auth. Borgess Hosp. Fac. Rev., E.T.M., N.A.T.L.(e)(h)(j) | | Aaa | | 9.665 | | 06/01/11 | | | 500 | | | 503,840 |
Kent Hosp. Fin. Auth. Rev., Metro. Hosp. Proj., Ser. A | | BB+(b) | | 6.250 | | 07/01/40 | | | 3,000 | | | 2,739,449 |
See Notes to Financial Statements.
| | |
| 22 | | Visit our website at www.prudentialfunds.com |
| | | | | | | | | | | | |
| Description (a) | | Moody’s
Rating*†
(Unaudited) | | Interest
Rate | | Maturity
Date | | Principal
Amount (000) | | Value (Note 1) |
| | | | | | | | | | | | |
Michigan (cont’d.) | | | | | | | | | | | | |
Michigan Pub. Edl. Facs. Auth. Rev., Rfdg. Ltd. Oblig.-Black River Sch. | | NR | | 5.800% | | 09/01/30 | | $ | 1,250 | | $ | 1,018,750 |
Michigan St. Hosp. Fin. Auth. Rev.,
Henry Ford Hlth. | | A1 | | 5.750 | | 11/15/39 | | | 1,000 | | | 985,990 |
Henry Ford Hlth. Sys. Rfdg., Ser. A | | A1 | | 5.250 | | 11/15/46 | | | 3,000 | | | 2,736,330 |
McLaren Healthcare Corp. | | Aa3 | | 5.750 | | 05/15/38 | | | 1,500 | | | 1,535,805 |
Michigan St. Strategic Fd. Ltd. Oblig. Rev.,
Detroit Ed. Rmkt. | | A2 | | 5.625 | | 07/01/20 | | | 1,000 | | | 1,072,770 |
Dow Chemical, Ser. A-1, A.M.T. | | | | | | | | | | | | |
(Mandatory put date 6/2/14) | | Baa3 | | 6.750 | | 12/01/28 | | | 1,000 | | | 1,115,670 |
Dow Chemical, Ser. B-1 | | Baa3 | | 6.250 | | 06/01/14 | | | 1,000 | | | 1,123,670 |
Michigan Strategic Fund Solid Wste. Disp. Rev., Wste. Mgmt., Inc., A.M.T. | | BBB(b) | | 4.500 | | 12/01/13 | | | 1,000 | | | 1,036,130 |
Royal Oak Mich. Hosp. Fin. Auth. Hosp. Rev.,
William Beaumont Hosp. | | A1 | | 8.250 | | 09/01/39 | | | 2,150 | | | 2,537,710 |
William Beaumont Hosp., Ser. W | | A1 | | 6.000 | | 08/01/39 | | | 1,000 | | | 1,008,360 |
Summit Academy North Pub. Sch., Academy Rev., Rfdg. | | BB+(b) | | 5.500 | | 11/01/30 | | | 1,500 | | | 1,162,470 |
Summit Academy Pub. Sch., Academy Rev., Rfdg. | | BB+(b) | | 6.250 | | 11/01/25 | | | 2,060 | | | 1,838,406 |
Wayne Charter Cnty. Mich. Bldg. Impt., Ser. A, G.O. | | A2 | | 6.750 | | 11/01/39 | | | 1,000 | | | 1,054,750 |
| | | | | | | | | | | | |
| | | | | | | | | | | | 23,170,860 |
| | | | | |
Minnesota 0.3% | | | | | | | | | | | | |
St. Paul Hsg. & Redev. Auth. Healthcare Rev., Allina Health Sys., Ser A-1 | | A1 | | 5.250 | | 11/15/29 | | | 750 | | | 760,658 |
St. Paul Hsg. & Redev. Auth. Hosp. Rev., Health East Proj. | | Ba1 | | 6.000 | | 11/15/35 | | | 1,000 | | | 926,360 |
| | | | | | | | | | | | |
| | | | | | | | | | | | 1,687,018 |
See Notes to Financial Statements.
| | |
| Prudential Muni High Income Fund | | 23 |
Portfolio of Investments
as of April 30, 2010 continued
| | | | | | | | | | | | |
| Description (a) | | Moody’s
Rating*†
(Unaudited) | | Interest
Rate | | Maturity
Date | | Principal
Amount (000) | | Value (Note 1) |
| | | | | | | | | | | | |
Mississippi 0.2% | | | | | | | | | | | | |
Warren County Gulf Opportunity Zone, Intl. Paper, Ser. A | | Baa3 | | 6.500% | | 09/01/32 | | $ | 1,000 | | $ | 1,037,630 |
| | | | | |
Missouri 0.3% | | | | | | | | | | | | |
Manchester Tax Increment & Transn. Rev., Rfdg. Hwy 141, Manchester Rd. Proj. | | NR | | 6.875 | | 11/01/39 | | | 1,500 | | | 1,509,855 |
| | | | | |
Nevada 1.5% | | | | | | | | | | | | |
Clark Cnty. Impvt. Dist. Rev., Spec. Impvt. Dist. No. 142, Loc. Impvt. | | NR | | 6.100 | | 08/01/18 | | | 1,890 | | | 1,833,867 |
Clark Cnty. Ind. Dev. Rev., Nevada Pwr. Co. Proj. Rfdg., Ser. C | | BB+(b) | | 5.500 | | 10/01/30 | | | 4,500 | | | 4,323,825 |
Clark Cnty. Arpt. Rev., Jet Aviation Fuel Tax, | | | | | | | | | | | | |
Ser. C, A.M.B.A.C., A.M.T. | | A1 | | 5.375 | | 07/01/16 | | | 1,000 | �� | | 1,040,340 |
Ser. C, A.M.B.A.C., A.M.T. | | A1 | | 5.375 | | 07/01/17 | | | 1,000 | | | 1,029,080 |
| | | | | | | | | | | | |
| | | | | | | | | | | | 8,227,112 |
| | | | | |
New Hampshire 0.5% | | | | | | | | | | | | |
New Hampshire Hlth. & Ed. Facs. Auth. Rev., Dartmouth-Hitchcock | | A+(b) | | 6.000 | | 08/01/38 | | | 1,750 | | | 1,855,595 |
New Hampshire St. Business Fin. Auth. Poll. Ctrl. Rev., United Illuminating Co. Proj., A.M.T. (Mandatory put date 2/1/12) | | Baa2 | | 7.125 | | 07/01/27 | | | 1,000 | | | 1,056,960 |
| | | | | | | | | | | | |
| | | | | | | | | | | | 2,912,555 |
| | | | | |
New Jersey 7.1% | | | | | | | | | | | | |
Burlington Cnty. Bridge Commn. Econ. Dev. Rev., The Evergreens Proj. | | NR | | 5.625 | | 01/01/38 | | | 1,000 | | | 858,670 |
New Jersey St. Transn. Tr. Fd. Sys. Auth., Ser. A | | Aa3 | | 5.875 | | 12/15/38 | | | 2,000 | | | 2,194,660 |
See Notes to Financial Statements.
| | |
| 24 | | Visit our website at www.prudentialfunds.com |
| | | | | | | | | | | | |
| Description (a) | | Moody’s
Rating*†
(Unaudited) | | Interest
Rate | | Maturity
Date | | Principal
Amount (000) | | Value (Note 1) |
| | | | | | | | | | | | |
New Jersey (cont’d.) | | | | | | | | | | | | |
New Jersey Econ. Dev. Auth. Rev.,
Cigarette Tax | | Baa2 | | 5.625% | | 06/15/19 | | $ | 1,250 | | $ | 1,250,400 |
Cigarette Tax | | Baa2 | | 5.750 | | 06/15/34 | | | 750 | | | 726,195 |
Continental Airlines, Inc., A.M.T. | | B3 | | 6.400 | | 09/15/23 | | | 2,000 | | | 1,919,260 |
Continental Airlines, Inc., Proj., Spec. Facs. Rev., A.M.T. | | B3 | | 6.250 | | 09/15/29 | | | 6,530 | | | 6,125,792 |
Cranes Mill Proj. First Mtge., Ser. A | | NR | | 5.875 | | 07/01/28 | | | 1,000 | | | 947,060 |
Franciscan Oaks Proj. First Mtge. Rfdg., | | NR | | 5.700 | | 10/01/17 | | | 165 | | | 164,027 |
Gloucester Marine, Ser. B, A.M.T. | | NR | | 6.875 | | 01/01/37 | | | 3,000 | | | 2,554,590 |
New Jersey Healthcare Facs. Fin. Auth. Rev.,
Cherry Hill Proj. | | NR | | 8.000 | | 07/01/27 | | | 2,000 | | | 1,670,200 |
St. Josephs Healthcare Sys. | | Ba1 | | 6.625 | | 07/01/38 | | | 3,000 | | | 3,076,560 |
St. Peters Univ. Hosp., Ser. A | | Baa2 | | 6.875 | | 07/01/30 | | | 2,250 | | | 2,251,868 |
Virtua Hlth. | | A(b) | | 5.750 | | 07/01/33 | | | 2,000 | | | 2,100,080 |
New Jersey St. Ed. Facs. Auth. UMDNJ | | Baa2 | | 7.500 | | 12/01/32 | | | 1,000 | | | 1,145,310 |
New Jersey St. Tpke. Auth. Tpke. Rev., Growth & Income. Secs., Ser. B, A.M.B.A.C., C.A.B.S., (Converts to 5.15% on 1/1/15) | | A3 | | 5.000(k) | | 01/01/35 | | | 4,000 | | | 3,205,760 |
New Jersey St. Transn. Tr. Fd. Sys. Auth., Ser. A | | Aa3 | | 5.500 | | 12/15/23 | | | 2,000 | | | 2,258,900 |
Tobacco Settlement Fin. Corp., NJ Rev., | | | | | | | | | | | | |
Ser. 1A | | Baa3 | | 4.500 | | 06/01/23 | | | 425 | | | 405,935 |
Ser.1A | | Baa3 | | 4.625 | | 06/01/26 | | | 2,500 | | | 2,127,600 |
Ser. 1A | | Baa3 | | 5.000 | | 06/01/41 | | | 6,000 | | | 4,148,940 |
| | | | | | | | | | | | |
| | | | | | | | | | | | 39,131,807 |
| | | | | |
New Mexico 0.5% | | | | | | | | | | | | |
New Mexico Mtge. Fin. Auth. Rev., Sngl. Fam. Mtge., Ser. E, A.M.T., G.N.M.A., F.N.M.A., F.H.L.M.C. | | AAA(b) | | 5.500 | | 07/01/35 | | | 1,325 | | | 1,407,402 |
See Notes to Financial Statements.
| | |
| Prudential Muni High Income Fund | | 25 |
Portfolio of Investments
as of April 30, 2010 continued
| | | | | | | | | | | | |
| Description (a) | | Moody’s
Rating*†
(Unaudited) | | Interest
Rate | | Maturity
Date | | Principal
Amount (000) | | Value (Note 1) |
| | | | | | | | | | | | |
New Mexico (cont’d.) | | | | | | | | | | | | |
New Mexico St. Hosp. Equip. Ln. Council Hosp. Rev., Presbyterian Healthcare | | Aa3 | | 5.000% | | 08/01/39 | | $ | 1,250 | | $ | 1,253,575 |
| | | | | | | | | | | | |
| | | | | | | | | | | | 2,660,977 |
| | | | | |
New York 3.5% | | | | | | | | | | | | |
Brookhaven Indl. Dev. Agcy. Civic Facs. Rev., Brooks Mem. Hosp. Med. Ctr., Inc., Ser. A (Prerefunded 11/15/10)(e) | | NR | | 8.250 | | 11/15/30 | | | 2,000 | | | 2,099,260 |
Brooklyn Arena Local Dev. Corp., Barclays Ctr. Proj. | | Baa3 | | 6.375 | | 07/15/43 | | | 1,250 | | | 1,280,275 |
Chautauqua Cnty. Indl. Devagy. Exempt Fac. Rev., Dunkirk Pwr. Proj. | | Baa3 | | 5.875 | | 04/01/42 | | | 500 | | | 508,335 |
Erie Cnty. Tob. Asset Securitization Corp. Cap. Apprec.,
Asset Bkd.-1st Sub., Ser. B, C.A.B.S. | | NR | | 7.040(k) | | 06/01/47 | | | 5,000 | | | 191,000 |
Asset Bkd.-2nd Sub., Ser. C, C.A.B.S. | | NR | | 9.499(k) | | 06/01/50 | | | 4,000 | | | 96,880 |
Long Island Pwr. Auth. Elec. Sys. Rev., | | | | | | | | | | | | |
Ser. A | | A3 | | 6.000 | | 05/01/33 | | | 1,500 | | | 1,697,070 |
Ser. A | | A3 | | 6.250 | | 04/01/33 | | | 500 | | | 577,590 |
New York City Indl. Dev. Agcy., Civic Fac. Rev., Staten Island Univ. Hosp. Proj., Ser. B | | Ba2 | | 6.375 | | 07/01/31 | | | 960 | | | 956,026 |
Spl. Fac. Rev., American Airlines, JFK Int’l. Arpt., | | | | | | | | | | | | |
A.M.T. | | B–(b) | | 7.125 | | 08/01/11 | | | 2,595 | | | 2,614,773 |
A.M.T. | | B–(b) | | 7.500 | | 08/01/16 | | | 1,500 | | | 1,513,395 |
A.M.T. | | B–(b) | | 7.750 | | 08/01/31 | | | 2,000 | | | 2,044,780 |
Spl. Fac. Rev., Terminal One Group Assn. Proj., A.M.T. | | A3 | | 5.500 | | 01/01/24 | | | 2,450 | | | 2,493,929 |
New York Liberty Dev. Corp. Rev., National Sports Museum Proj. A (original cost $1,099,998; purchased 8/7/07)(c)(h)(i) | | NR | | 6.125 | | 02/15/19 | | | 1,100 | | | 11 |
See Notes to Financial Statements.
| | |
| 26 | | Visit our website at www.prudentialfunds.com |
| | | | | | | | | | | | |
| Description (a) | | Moody’s
Rating*†
(Unaudited) | | Interest
Rate | | Maturity
Date | | Principal
Amount (000) | | Value (Note 1) |
| | | | | | | | | | | | |
New York (cont’d.) | | | | | | | | | | | | |
New York St. Dorm. Auth. Rev., Orange Reg.-Med. Ctr. | | Ba1 | | 6.250% | | 12/01/37 | | $ | 1,500 | | $ | 1,440,960 |
Suffolk Cnty. Indl. Dev. Agcy. Rev., Keyspan, Port Jefferson | | Baa1 | | 5.250 | | 06/01/27 | | | 1,500 | | | 1,466,850 |
| | | | | | | | | | | | |
| | | | | | | | | | | | 18,981,134 |
| | | | | |
North Carolina 0.2% | | | | | | | | | | | | |
North Carolina Eastn. Mun. Pwr. Agcy. Pwr. Sys. Rev., Ser. C | | Baa1 | | 6.750 | | 01/01/24 | | | 1,000 | | | 1,172,510 |
| | | | | |
North Dakota 0.4% | | | | | | | | | | | | |
Ward Cnty. Healthcare Facs. Rev., Trinity Oblig. Rfdg., Group B | | BBB+(b) | | 6.250 | | 07/01/21 | | | 2,000 | | | 2,001,100 |
| | | | | |
Ohio 2.7% | | | | | | | | | | | | |
Buckeye Tob. Settlement Fin. Auth., Asset Bkd. Sr. Turbo, | | | | | | | | | | | | |
Ser. A-2 | | Baa3 | | 5.125 | | 06/01/24 | | | 4,000 | | | 3,680,840 |
Ser. A-2 | | Baa3 | | 5.875 | | 06/01/47 | | | 1,000 | | | 746,940 |
Ser. A-2 | | Baa3 | | 6.500 | | 06/01/47 | | | 2,500 | | | 2,051,600 |
Cuyahoga Cnty. Hosp. Facs. Rev., Canton, Inc. Proj. | | Baa1 | | 7.500 | | 01/01/30 | | | 3,000 | | | 3,034,140 |
Montgomery Cnty. Ohio Rev., Miami Valley Hosp., Ser. A | | Aa3 | | 6.250 | | 11/15/39 | | | 1,500 | | | 1,577,160 |
Ohio St. Air Quality Dev. Auth. Rev., Poll. FirstEnergy Generation, | | | | | | | | | | | | |
Ser. A | | Baa1 | | 5.700 | | 02/01/14 | | | 1,500 | | | 1,622,700 |
Ser. C | | Baa1 | | 5.625 | | 06/01/18 | | | 500 | | | 530,795 |
Ohio St. Wtr. Dev. Auth. Poll. Ctrl. Facs. Rev., | | | | | | | | | | | | |
Allied Solid Wste. N.A., Inc., Ser. A, A.M.T. | | BBB(b) | | 5.150 | | 07/15/15 | | | 1,250 | | | 1,260,275 |
FirstEnergy Generation, Ser. A (Mandatory put date 6/1/16) | | Baa1 | | 5.875 | | 06/01/33 | | | 500 | | | 545,470 |
| | | | | | | | | | | | |
| | | | | | | | | | | | 15,049,920 |
See Notes to Financial Statements.
| | |
| Prudential Muni High Income Fund | | 27 |
Portfolio of Investments
as of April 30, 2010 continued
| | | | | | | | | | | | |
| Description (a) | | Moody’s
Rating*†
(Unaudited) | | Interest
Rate | | Maturity
Date | | Principal
Amount (000) | | Value (Note 1) |
| | | | | | | | | | | | |
Oklahoma 0.6% | | | | | | | | | | | | |
Chickasaw Nation Hlth. Sys. | | NR | | 6.250% | | 12/01/32 | | $ | 1,340 | | $ | 1,344,315 |
Tulsa Cnty. Indl. Auth. Sr. Living Cmnty Rev., Montereau, Inc. Proj., Ser. A | | NR | | 7.125 | | 11/01/30 | | | 1,000 | | | 996,580 |
Tulsa Arpts. Impt. Tr. Gen. Rev., Ser. A | | A3 | | 5.375 | | 06/01/24 | | | 1,000 | | | 1,018,860 |
| | | | | | | | | | | | |
| | | | | | | | | | | | 3,359,755 |
| | | | | |
Pennsylvania 5.4% | | | | | | | | | | | | |
Allegheny Cnty. Hosp. Dev. Auth. Rev.,
Hlth. Sys., Ser. B (Prerefunded 11/15/10)(e) | | AAA(b) | | 9.250 | | 11/15/15 | | | 770 | | | 812,219 |
West Penn, Ser. A | | Ba3 | | 5.000 | | 11/15/17 | | | 1,975 | | | 1,872,596 |
West Penn, Ser. A | | Ba3 | | 5.000 | | 11/15/28 | | | 1,000 | | | 843,010 |
Butler Cnty. Hosp. Auth. Rev., Butler Hlth. Sys. Proj. | | Baa1 | | 7.250 | | 07/01/39 | | | 1,000 | | | 1,129,990 |
Cumberland Cnty. Mun. Auth. Ret. Cmnty. Rev.,
Wesley Affiliated Svcs., | | | | | | | | | | | | |
Ser. A (Prerefunded 1/1/13)(e) | | NR | | 7.250 | | 01/01/35 | | | 1,110 | | | 1,288,621 |
Ser. A (Prerefunded 1/1/13)(e) | | NR | | 7.250 | | 01/01/35 | | | 2,890 | | | 3,355,059 |
Cumberland Cnty. Mun. Auth. Rev., Diakon Lutheran | | NR | | 6.375 | | 01/01/39 | | | 2,000 | | | 2,014,980 |
Fulton Cnty. Indl. Dev. Auth. Hosp. Rev., Med. Ctr. Proj. | | NR | | 5.900 | | 07/01/40 | | | 1,000 | | | 863,570 |
Lycoming Cnty. Auth. Hlth. Sys. Rev., Susquehanna Hlth. Sys. Proj., Ser. A | | BBB+(b) | | 5.750 | | 07/01/39 | | | 2,000 | | | 2,023,960 |
Northampton Cnty. Gen. Purp. Auth. Hosp. Rev., St. Lukes Hosp. Proj., Ser. A | | A3 | | 5.500 | | 08/15/35 | | | 1,000 | | | 991,810 |
Pennsylvania Econ. Dev. Fin. Auth. | | | | | | | | | | | | |
Res. Recov. Rfdg., Sub, Colver Proj., Ser. G, A.M.T. | | NR | | 5.125 | | 12/01/15 | | | 1,800 | | | 1,727,730 |
Res. Recov. Rfdg., Colver Proj., Ser. F, A.M.B.A.C., A.M.T. | | Ba1 | | 4.625 | | 12/01/18 | | | 1,500 | | | 1,308,795 |
Sew Sludge Disp. Rev., Philadelphia Biosolids | | Baa3 | | 6.250 | | 01/01/32 | | | 750 | | | 783,668 |
See Notes to Financial Statements.
| | |
| 28 | | Visit our website at www.prudentialfunds.com |
| | | | | | | | | | | | | |
| Description (a) | | Moody’s
Rating*†
(Unaudited) | | Interest
Rate | | Maturity
Date | | | Principal
Amount (000) | | Value (Note 1) |
| | | | | | | | | | | | | |
Pennsylvania (cont’d.) | | | | | | | | | | | | | |
Philadelphia Auth. For Indl. Dev. Rev., Please Touch Museum Proj. | | BBB–(b) | | 5.250% | | 09/01/31 | | | $ | 1,500 | | $ | 1,324,425 |
Philadelphia Hosp. & Higher Ed. Facs. Auth. Rev., | | | | | | | | | | | | | |
Grad. Hlth. Sys. (original cost $915,255; purchased 1/22/98)(c)(h)(i) | | NR | | 7.000 | | 07/01/10 | | | | 908 | | | 9 |
Grad. Hlth. Sys. (original cost $1,264,342; purchased
1/22/98-6/23/98)(c)(h)(i) | | NR | | 7.250 | | 07/01/18 | | | | 1,248 | | | 12 |
Grad. Hlth. Sys., Ser. A (original cost $1,039,576; purchased 1/21/98-7/6/98)(c)(h)(i) | | NR | | 6.250 | | 07/01/13 | | | | 1,108 | | | 11 |
Philadelphia, PA, G.O., Ser. B, A.G.C. | | Aa3 | | 7.125 | | 07/15/38 | | | | 1,500 | | | 1,696,350 |
Somerset Cnty. Hosp. Auth. Rev., | | | | | | | | | | | | | |
GF Somerset Healthcare First Mtge. (original cost $8,898,687; purchased 2/10/97)(d)(h)(i) | | NR | | 8.400 | | 06/01/24 | | | | 8,805 | | | 5,203,491 |
GF Somerset Healthcare First Mtge. (original cost $1,106,647; purchased 2/10/97)(d)(h)(i) | | NR | | 8.500 | | 06/01/09 | ** | | | 1,095 | | | 649,554 |
Susquehanna Area Regional Arpt. Auth., A.M.T. | | Baa3 | | 6.500 | | 01/01/38 | | | | 1,500 | | | 1,473,750 |
| | | | | | | | | | | | | |
| | | | | | | | | | | | | 29,363,610 |
| | | | | |
Puerto Rico 2.8% | | | | | | | | | | | | | |
Puerto Rico Comwlth. Govt. Dev. Bank Sr. Notes., Ser. C, A.M.T. | | A3 | | 5.250 | | 01/01/15 | | | | 2,000 | | | 2,081,200 |
Puerto Rico Comwlth. Hwy. & Transn. Auth. Hwy. Rev., Ser. CC | | A2 | | 5.500 | | 07/01/28 | | | | 2,500 | | | 2,608,275 |
Puerto Rico Comwlth., Rfdg. Pub. Impt., Ser. C, G.O. | | A3 | | 6.000 | | 07/01/39 | | | | 800 | | | 842,560 |
Puerto Rico Elec. Pwr. Auth. Pwr. Rev., Ser. XX | | A3 | | 5.250 | | 07/01/40 | | | | 2,000 | | | 2,023,420 |
See Notes to Financial Statements.
| | |
| Prudential Muni High Income Fund | | 29 |
Portfolio of Investments
as of April 30, 2010 continued
| | | | | | | | | | | | |
| Description (a) | | Moody’s
Rating*†
(Unaudited) | | Interest
Rate | | Maturity
Date | | Principal
Amount (000) | | Value (Note 1) |
| | | | | | | | | | | | |
Puerto Rico (cont’d.) | | | | | | | | | | | | |
Puerto Rico Pub. Bldg. Auth. Rev.,
Govt. Facs., Ser. P | | A3 | | 6.750% | | 07/01/36 | | $ | 750 | | $ | 833,858 |
Gtd. Rfdg. Govt. Facs., Ser. M | | A3 | | 6.000 | | 07/01/20 | | | 2,500 | | | 2,727,400 |
Puerto Rico Sales Tax Fin. Corp. Sales Tax Rev., | | | | | | | | | | | | |
First Sub., Ser. A | | A1 | | 5.500 | | 08/01/42 | | | 1,500 | | | 1,561,905 |
First Sub., Ser. A | | A1 | | 5.750 | | 08/01/37 | | | 1,000 | | | 1,060,250 |
First Sub., Ser. A | | A1 | | 6.000 | | 08/01/42 | | | 1,500 | | | 1,622,595 |
| | | | | | | | | | | | |
| | | | | | | | | | | | 15,361,463 |
| | | | | |
Rhode Island 0.4% | | | | | | | | | | | | |
Rhode Island St. Hlth. & Edl. Bldg. Corp. Rev., Hosp. Fing., Lifespan Oblig., Ser. A | | A3 | | 7.000 | | 05/15/39 | | | 2,000 | | | 2,164,040 |
| | | | | |
South Carolina 0.1% | | | | | | | | | | | | |
South Carolina Jobs Econ. Dev. Auth. Hosp. Facs. Rev., Palmetto Hlth., Rfdg. & Impt. | | Baa1 | | 5.750 | | 08/01/39 | | | 500 | | | 495,060 |
| | | | | |
South Dakota 0.6% | | | | | | | | | | | | |
Educational Enhancement Funding Corp., Tobacco, Ser. B | | Baa3 | | 6.500 | | 06/01/32 | | | 2,555 | | | 2,556,916 |
South Dakota St. Hlth. & Edl. Facs. Auth. Rev., Sanford Hlth. | | A1 | | 5.500 | | 11/01/40 | | | 625 | | | 645,544 |
| | | | | | | | | | | | |
| | | | | | | | | | | | 3,202,460 |
| | | | | |
Tennessee 3.3% | | | | | | | | | | | | |
Bradley Cnty. Ind. Dev. Brd. Rev., Rfdg. Olin Corp. Proj., Ser. C | | Ba1 | | 6.625 | | 11/01/17 | | | 2,000 | | | 1,970,140 |
Johnson City Hlth. & Edl. Facs. Brd. Hosp. Rev.,
Mountain States Hlth. Alliance | | Baa1 | | 6.000 | | 07/01/38 | | | 1,000 | | | 1,007,470 |
Rfdg. First Mtge., Mountain States Hlth., Ser. A, N.A.T.L., E.T.M.(e) | | Baa1 | | 6.750 | | 07/01/17 | | | 2,000 | | | 2,341,100 |
See Notes to Financial Statements.
| | |
| 30 | | Visit our website at www.prudentialfunds.com |
| | | | | | | | | | | | |
| Description (a) | | Moody’s
Rating*†
(Unaudited) | | Interest
Rate | | Maturity
Date | | Principal
Amount (000) | | Value (Note 1) |
| | | | | | | | | | | | |
Tennessee (cont’d.) | | | | | | | | | | | | |
Knox Cnty. Hlth. Edl. & Hsg. Facs. Brd. Hosp. Facs. Rev., Covenant Health, Ser. A, C.A.B.S. | | A–(b) | | 6.200%(k) | | 01/01/35 | | $ | 1,000 | | $ | 226,780 |
Memphis Ctr. City Rev., Fin. Corp., Red Birds, Ser. B (original cost $26,000,000; purchased 12/30/98)(h)(i)(m) | | NR | | 6.500 | | 09/01/28 | | | 26,000 | | | 7,020,000 |
Rutherford Cnty. Hlth. & Edl. Facs., First Mtge. Rev., Group Homes, Inc. | | NR | | 9.500 | | 12/01/19 | | | 3,600 | | | 3,605,040 |
Tennessee Energy Acquisition Corp. Gas Rev., Ser. C | | Baa1 | | 5.000 | | 02/01/18 | | | 2,000 | | | 1,997,300 |
| | | | | | | | | | | | |
| | | | | | | | | | | | 18,167,830 |
| | | | | |
Texas 12.3% | | | | | | | | | | | | |
Alliance Arpt. Auth. Inc. Tex. Spl. Facs. Rev., American Airlines Inc. Proj., A.M.T. | | CCC+(b) | | 5.750 | | 12/01/29 | | | 2,500 | | | 1,849,375 |
Austin Convention Enterprises, Inc., Convention Ctr., Rfdg. | | | | | | | | | | | | |
Second Tier, Ser. B | | Ba2 | | 5.750 | | 01/01/24 | | | 1,000 | | | 921,920 |
Second Tier, Ser. B | | Ba2 | | 5.750 | | 01/01/34 | | | 1,000 | | | 849,240 |
Brazos River Auth. Poll. Ctrl. Rev.,
TXU Energy Co. LLC Proj., Ser. D (Mandatory put date 10/1/14) | | Caa3 | | 5.400 | | 10/01/29 | | | 1,000 | | | 718,110 |
TXU Energy Co. LLC, Rfdg., A.M.T. | | Caa3 | | 5.400 | | 05/01/29 | | | 2,000 | | | 941,800 |
TXU Energy Rfdg. Elec. Rmkt., A.M.T., | | Caa3 | | 8.250 | | 10/01/30 | | | 3,000 | | | 1,860,210 |
Capital Area Cultural Ed. Facs. Fin. Corp. Rev., Roman Catholic Diocese, Ser. B, Rmkt. | | Baa2 | | 6.125 | | 04/01/45 | | | 2,000 | | | 2,003,560 |
Central Tex. Regl. Mobility Auth. Rev., Sr. Lien | | Baa3 | | 5.750 | | 01/01/25 | | | 1,000 | | | 1,010,250 |
See Notes to Financial Statements.
| | |
| Prudential Muni High Income Fund | | 31 |
Portfolio of Investments
as of April 30, 2010 continued
| | | | | | | | | | | | | |
| Description (a) | | Moody’s
Rating*†
(Unaudited) | | Interest
Rate | | Maturity
Date | | Principal
Amount (000) | | | Value (Note 1) |
| | | | | | | | | | | | | |
Texas (cont’d.) | | | | | | | | | | | | | |
Clifton Higher Ed. Fin. Corp. Rev.,
Tejano Ctr. Cmnty. | | NR | | 9.000% | | 02/15/38 | | $ | 2,000 | | | $ | 2,336,220 |
Uplift Ed., Ser. A | | BBB–(b) | | 6.125 | | 12/01/40 | | | 1,000 | | | | 987,010 |
Dallas Fort Worth Int’l. Arpt. Fac. Impvt. Corp. Rev., Rfdg.
American Airlines, Inc., A.M.T. | | CCC+(b) | | 5.500 | | 11/01/30 | | | 2,000 | | | | 1,450,160 |
American Airlines, Inc., A.M.T. | | Caa2 | | 6.375 | | 05/01/35 | | | 3,000 | | | | 2,343,570 |
Decatur Hosp. Auth. Rev., Wise Reg. Hlth. Sys., Ser. A | | NR | | 7.125 | | 09/01/34 | | | 3,000 | | | | 3,003,780 |
Harris Cnty. Cultural Ed. Fac. Fin. Corp. Rev.,
Methodist Hosp. Sys., Ser. B | | AA(b) | | 5.500 | | 12/01/18 | | | 500 | | | | 562,540 |
Tex. Childrens Hosp. Proj. | | Aa2 | | 5.500 | | 10/01/39 | | | 1,000 | | | | 1,040,200 |
Harris Cnty. Indl. Dev. Corp. Solid Wste. Disp. Rev., Deer Park Refining Proj. | | A2 | | 5.000 | | 02/01/23 | | | 750 | | | | 760,118 |
Houston Hlth. Facs. Dev. Corp. Ret. Fac. Rev., Buckingham Sr. Living Cmnty., Ser. A (Prerefunded 2/15/14)(e) | | AAA(b) | | 7.125 | | 02/15/34 | | | 1,250 | | | | 1,505,200 |
Katy Dev. Auth. Rev., Tax Increment Contract, Ser. B | | NR | | 6.000 | | 06/01/18 | | | 1,600 | | | | 1,523,168 |
La Vernia Higher Ed. Fin. Corp. Ed. Rev., Kipp Inc., Ser. A | | NR | | 6.375 | | 08/15/44 | | | 1,000 | | | | 1,031,690 |
Lamar Cons. Indpt. Sch. Dist., Rfdg. Sch. House, G.O., P.S.F.G. | | Aaa | | 5.000 | | 02/15/21 | | | 1,000 | (f) | | | 1,108,920 |
Lower Colorado Riv. Auth. Rev., Rfdg. & Impt., Ser. A | | A1 | | 7.250 | | 05/15/37 | | | 5,000 | | | | 5,582,899 |
Lufkin Hlth. Facs. Dev. Corp. Hlth. Sys. Rev., Memorial Hlth. Syst. of East Tex. | | Baa2 | | 6.250 | | 02/15/37 | | | 3,000 | | | | 3,025,860 |
Matagorda Cnty. Nav. Dist. No. 1, Poll. Ctrl. Rev., Bnds. AEP Texas Proj., Rfdg. Ser. B, Rmkt., A.M.B.A.C., A.M.T. | | Baa2 | | 4.550 | | 05/01/30 | | | 2,000 | | | | 1,630,600 |
Cent. Pwr. & Lt. Co. Proj., Ser. A | | Baa2 | | 6.300 | | 11/01/29 | | | 1,000 | | | | 1,082,520 |
See Notes to Financial Statements.
| | |
| 32 | | Visit our website at www.prudentialfunds.com |
| | | | | | | | | | | | |
| Description (a) | | Moody’s
Rating*†
(Unaudited) | | Interest
Rate | | Maturity
Date | | Principal
Amount (000) | | Value (Note 1) |
| | | | | | | | | | | | |
Texas (cont’d.) | | | | | | | | | | | | |
Mission Econ. Dev. Corp., Allied Wste., Inc., Proj. A, A.M.T. | | Baa3 | | 5.200% | | 04/01/18 | | $ | 2,000 | | $ | 2,004,100 |
North Tex. Twy. Auth. Rev.,
First Tier, Ser. A | | A2 | | 5.750 | | 01/01/40 | | | 3,500 | | | 3,662,995 |
First Tier, Ser. A | | A2 | | 6.250 | | 01/01/39 | | | 1,500 | | | 1,657,125 |
First Tier, Ser. C | | A2 | | 5.250 | | 01/01/44 | | | 2,500 | | | 2,513,650 |
Second Tier Rfdg., Ser. F | | A3 | | 5.750 | | 01/01/38 | | | 2,500 | | | 2,618,025 |
Pharr Higher Ed. Fin. Auth. Ed. Rev., Idea Pub. Sch., Ser. A | | BBB(b) | | 6.500 | | 08/15/39 | | | 1,000 | | | 1,027,220 |
Sabine River Auth. Poll. Ctrl. Rev., TXU Energy Co. LLC Proj., Ser. B | | Caa3 | | 6.150 | | 08/01/22 | | | 1,000 | | | 601,320 |
San Leanna Ed. Facs. Corp. Higher Ed. Rev., Rfdg., Saint Edwards Univ. Proj. | | Baa2 | | 4.750 | | 06/01/32 | | | 2,750 | | | 2,417,718 |
Tarrant Cnty. Cultural Ed. Facs. Fin. Corp., Retirement Fac.Temps.,
75-Mirador Proj., Ser. B-1 | | NR | | 7.250 | | 11/15/16 | | | 1,000 | | | 1,001,260 |
Sr. Living Ctr. Proj., Ser. C-1 | | NR | | 7.500 | | 11/15/16 | | | 1,000 | | | 1,000,510 |
Texas Mun. Gas Acquisition & Supply Corp. I Gas Supply Rev., Sr. Lien, Ser. A | | A2 | | 5.250 | | 12/15/26 | | | 3,900 | | | 3,797,273 |
Texas Mun. Pwr. Agcy. Rev., N.A.T.L., E.T.M., C.A.B.S.(e) | | A2 | | 2.350(k) | | 09/01/15 | | | 50 | | | 44,130 |
Texas Private Activity Surface Transportation Corp., Sr. Lien, NTE Mobility | | Baa2 | | 6.875 | | 12/31/39 | | | 2,000 | | | 2,089,440 |
Texas St. Pub. Fin. Auth. Charter Sch. Fin. Corp. Rev., Ed.
Cosmos Fndtn., Ser. A | | NR | | 5.375 | | 02/15/37 | | | 1,000 | | | 809,610 |
Cosmos Fndtn., Ser. A | | BBB(b) | | 6.200 | | 02/15/40 | | | 1,000 | | | 1,000,000 |
Idea Pub. Sch. Proj., Ser. A, A.C.A. | | BBB(b) | | 5.000 | | 08/15/30 | | | 2,000 | | | 1,756,280 |
| | | | | | | | | | | | |
| | | | | | | | | | | | 67,129,576 |
| | | | | |
Utah 0.3% | | | | | | | | | | | | |
Riverton Utah Hosp. Rev., IHC Hlth. Svcs., Inc. | | Aa1 | | 5.000 | | 08/15/41 | | | 1,500 | | | 1,525,545 |
See Notes to Financial Statements.
| | |
| Prudential Muni High Income Fund | | 33 |
Portfolio of Investments
as of April 30, 2010 continued
| | | | | | | | | | | | |
| Description (a) | | Moody’s
Rating*†
(Unaudited) | | Interest
Rate | | Maturity
Date | | Principal
Amount (000) | | Value (Note 1) |
| | | | | | | | | | | | |
Virgin Islands 0.2% | | | | | | | | | | | | |
Virgin Islands Pub. Fin. Auth. Rev., Matching Fd. Ln. Diageo, Ser. A | | Baa3 | | 6.750% | | 10/01/37 | | $ | 750 | | $ | 814,028 |
| | | | | |
Virginia 1.8% | | | | | | | | | | | | |
Gloucester Cnty. Ind. Dev. Auth. Solid Wste. Disp. Rev., Wste. Mgmt. Svcs., Ser. A, A.M.T. (Mandatory put date 5/1/14) | | BBB(b) | | 5.125 | | 09/01/38 | | | 2,700 | | | 2,889,621 |
Norfolk Redev. & Hsg. Auth. Multi-Fam. Rental Hsg. Fac. Rev., Sussex Apts., A.M.T. | | NR | | 8.000 | | 09/01/26 | | | 5,165 | | | 5,174,194 |
Sussex Cnty. Ind. Dev. Auth. Solid Wste. Disp. Rev., Atlantic Wste., Ser. A, A.M.T. (Mandatory put date 5/1/14) | | BBB(b) | | 5.125 | | 06/01/28 | | | 1,600 | | | 1,712,368 |
| | | | | | | | | | | | |
| | | | | | | | | | | | 9,776,183 |
| | | | | |
Washington 1.8% | | | | | | | | | | | | |
FYI Properties Wash. Lease Rev., Washington St. Dist. Proj. | | AA(b) | | 5.500 | | 06/01/39 | | | 1,000 | | | 1,060,080 |
Skagit Cnty. Pub. Hosp. Dist. No. 001 Rev.,
Skagit Valley Hosp. | | Baa2 | | 5.375 | | 12/01/22 | | | 1,190 | | | 1,190,797 |
Skagit Valley Hosp. | | Baa2 | | 5.500 | | 12/01/30 | | | 1,250 | | | 1,199,400 |
Skagit Valley Hosp. | | Baa2 | | 5.750 | | 12/01/32 | | | 1,000 | | | 974,060 |
Tobacco Settlement Fin. Corp. Auth. Tobacco Settlement Rev., Asset Bkd. | | Baa3 | | 6.500 | | 06/01/26 | | | 2,125 | | | 2,159,765 |
Washington St. Healthcare Fac. Auth. Rev.,
Overlake Hosp. Med. Ctr. | | A3 | | 5.500 | | 07/01/30 | | | 1,115 | | | 1,113,562 |
Seattle Childrens Hosp. | | Aa3 | | 5.625 | | 10/01/38 | | | 1,250 | | | 1,297,600 |
Swedish Hlth. Svcs., Ser. A | | A2 | | 6.500 | | 11/15/33 | | | 1,000 | | | 1,047,030 |
| | | | | | | | | | | | |
| | | | | | | | | | | | 10,042,294 |
See Notes to Financial Statements.
| | |
| 34 | | Visit our website at www.prudentialfunds.com |
| | | | | | | | | | | | |
| Description (a) | | Moody’s
Rating*†
(Unaudited) | | Interest
Rate | | Maturity
Date | | Principal
Amount (000) | | Value (Note 1) |
| | | | | | | | | | | | |
West Virginia 1.3% | | | | | | | | | | | | |
West Virginia St. Hosp. Fin. Auth. Hosp. Rev., Oak Hill Hosp., Ser. B. (Prerefunded 9/1/10)(e) | | A2 | | 6.750% | | 09/01/30 | | $ | 7,000 | | $ | 7,220,010 |
| | | | | |
Wisconsin 0.6% | | | | | | | | | | | | |
Milwaukee Redev. Auth. Redev. Rev., Science Ed. Consortium Proj., Ser. A | | BBB–(b) | | 5.750 | | 08/01/35 | | | 1,500 | | | 1,260,510 |
Wisconsin Hlth. & Edl. Facs. Auth. Rev.,
Eastcastle Place, Inc. Proj. | | NR | | 6.125 | | 12/01/34 | | | 1,000 | | | 852,700 |
Beaver Dam Cmnty. Hosp., Inc., Ser. A (Mandatory put date 8/15/16) | | NR | | 6.750 | | 08/15/34 | | | 1,250 | | | 1,252,125 |
| | | | | | | | | | | | |
| | | | | | | | | | | | 3,365,335 |
| | | | | |
Wyoming 0.1% | | | | | | | | | | | | |
Campbell Cnty. Solid Wste. Facs. Rev., Basin Elec. Pwr. Coop., Ser. A | | A1 | | 5.750 | | 07/15/39 | | | 500 | | | 535,365 |
| | | | | | | | | | | | |
Total long-term investments
(cost $560,631,703) | | | | | | | | | | | | 532,933,767 |
| | | | | | | | | | | | |
SHORT-TERM INVESTMENTS 1.7% | | | | | | | | | | |
| | | | | |
Alabama 0.2% | | | | | | | | | | | | |
Mobile Cnty. Indl. Dev. Auth. Pollution Ctrl. Rev., Rfdg. ExxonMobil Proj., F.R.D.D.(g) | | VMIG1 | | 0.220 | | 05/03/10 | | | 1,000 | | | 1,000,000 |
| | | | | |
Alaska 0.2% | | | | | | | | | | | | |
Valdez Alaska Marine Term Rev., Exxon Pipline Co., Proj., F.R.D.D.(g) | | VMIG1 | | 0.220 | | 05/03/10 | | | 900 | | | 900,000 |
| | | | | |
California 1.2% | | | | | | | | | | | | |
California St. Dept. Wtr. Res. Pwr. Supply Rev., Var. Sub. Ser. F-4, F.R.D.D.(g) | | VMIG1 | | 0.240 | | 05/03/10 | | | 1,075 | | | 1,075,000 |
See Notes to Financial Statements.
| | |
| Prudential Muni High Income Fund | | 35 |
Portfolio of Investments
as of April 30, 2010 continued
| | | | | | | | | | | | |
| Description (a) | | Moody’s
Rating*†
(Unaudited) | | Interest
Rate | | Maturity
Date | | Principal
Amount (000) | | Value (Note 1) |
| | | | | | | | | | | | |
| | | | | | | | | | | | |
California (cont’d.) | | | | | | | | | | | | |
Sacramento Cnty. Santn. Dist. Fing. Auth. Rev., F.R.D.D.(g) | | VMIG1 | | 0.250% | | 05/03/10 | | $ | 5,300 | | $ | 5,300,000 |
| | | | | | | | | | | | |
| | | | | | | | | | | | 6,375,000 |
| | | | | |
Massachusetts 0.1% | | | | | | | | | | | | |
Massachusetts St. Hlth. & Edl. Rev., F.R.D.D.(g) | | VMIG1 | | 0.210 | | 05/03/10 | | | 600 | | | 600,000 |
| | | | | |
Texas | | | | | | | | | | | | |
Dallas Tex. Performing Arts Cultural Facs. Corp. Cultural, Var. Dallas Arts Ctr. Fdtn., Ser. B, F.R.D.D.(g) | | VMIG1 | | 0.250 | | 05/03/10 | | | 200 | | | 200,000 |
| | | | | | | | | | | | |
Total short-term investments
(cost $9,075,000) | | | | | | | | | | | | 9,075,000 |
| | | | | | | | | | | | |
Total Investments 98.9%
(cost $569,706,703; Note 5)(l) | | | | | | | | | | 542,008,767 |
Other assets in excess of liabilities(n) 1.1% | | | | | | | | | | | | 5,870,498 |
| | | | | | | | | | | | |
Net Assets 100.0% | | | | | | | | | | | $ | 547,879,265 |
| | | | | | | | | | | | |
| * | The Fund’s current Statement of Additional Information contains a description of Moody’s and Standard & Poor’s ratings. |
| ** | The 2009 bonds remain an outstanding obligation of Somerset. Revised maturity date to be determined. |
| † | The ratings reflected are as of April 30, 2010. Ratings of certain bonds may have changed subsequent to that date. |
| (a) | The following abbreviations are used in portfolio descriptions: |
144A—Securities were purchased pursuant to Rule 144A under the Securities Act of 1933 and may not be resold subject to that rule except to qualified institutional buyers. Unless otherwise noted, 144A securities are deemed to be liquid.
A.C.A.—ACA Financial Guaranty Corporation.
A.G.C.—Assured Guaranty Corporation.
A.M.B.A.C.—American Municipal Bond Assurance Corporation.
A.M.T.—Alternative Minimum Tax.
C.A.B.S.—Capital Appreciation Bonds.
E.T.M.—Escrowed to Maturity.
F.H.L.M.C.—Federal Home Loan Mortgage Corporation.
F.N.M.A.—Federal National Mortgage Association.
F.R.D.D.—Floating Rate Daily Demand Note.
See Notes to Financial Statements.
| | |
| 36 | | Visit our website at www.prudentialfunds.com |
G.N.M.A.—Government National Mortgage Association.
G.O.—General Obligation.
I.D.B.—Industrial Development Bond.
LLC—Limited Liability Corporation.
N.A.T.L.—National Public Finance Guaranty Corp.
NR—Not Rated by Moody’s or Standard & Poor’s.
P.C.R.—Pollution Control Revenue.
P.S.F.G.—Permanent School Fund Guaranty.
R.I.B.S.—Residual Interest Bearing Securities.
S.A.V.R.S.—Select Auction Variable Rate Securities.
| (b) | Standard & Poor’s rating. |
| (c) | Represents issuer in default of interest payments; non-income producing security. |
| (d) | Represents issuer in default of interest payments; stated rate does not reflect the current yield. |
| (e) | All or partial escrowed to maturity and pre-refunded issues are secured by escrowed cash and/or U.S. guaranteed obligations. |
| (f) | All or partial principal amount segregated as initial margin on financial futures contracts. |
| (g) | Indicates a variable rate security. The maturity date presented for these instruments is the later of the next date on which the security can be redeemed at par or the next date on which the rate of interest is adjusted. The interest rate shown reflects the rate in effect at April 30, 2010. |
| (h) | Indicates a security that has been deemed illiquid. |
| (i) | Indicates a security restricted to resale. The aggregate original cost of such securities is $42,704,635. The aggregate value of $13,803,518 is approximately 2.5% of net assets. |
| (j) | Inverse floating rate bond. The coupon is inversely indexed to a floating interest rate. The rate shown is the rate as of April 30, 2010. |
| (k) | Represents a zero coupon or step bond. Rate shown reflects the effective yield at April 30, 2010. |
| (l) | As of April 30, 2010, 2 securities representing $7,020,011 and 1.3% of net assets were fair valued in accordance with the policies adopted by the Board of Trustees. |
| (m) | Represents issuer in default of interest payments. |
| (n) | Other assets in excess of liabilities include net unrealized depreciation on financial futures as follows: |
Open futures contracts outstanding at April 30, 2010:
| | | | | | | | | | | | | | |
Number of
Contracts | | Type | | Expiration
Date | | Value at
April 30,
2010 | | Value at
Trade
Date | | Unrealized
Depreciation | |
| | Short Position: | | | | | | | | | | | | |
| 60 | | U.S. Long Bond | | Jun. 2010 | | $ | 7,143,750 | | $ | 6,984,731 | | $ | (159,019 | ) |
| | | | | | | | | | | | | | |
See Notes to Financial Statements.
| | |
| Prudential Muni High Income Fund | | 37 |
Portfolio of Investments
as of April 30, 2010 continued
Various inputs are used in determining the value of the Fund’s investments. These inputs are summarized in the three broad levels listed below.
Level 1—quoted prices in active markets for identical securities
Level 2—other significant observable inputs (including quoted prices for similar securities, interest rates, prepayment speeds, credit risk, etc.)
Level 3—significant unobservable inputs (including the Fund’s own assumptions in determining the fair value of investments)
The following is a summary of the inputs used as of April 30, 2010 in valuing the Fund’s assets carried at fair value:
| | | | | | | | | | |
| | | Level 1 | | | Level 2 | | Level 3 |
Investments in Securities | | | | | | | | | | |
Municipal Bonds | | $ | — | | | $ | 534,988,756 | | $ | 7,020,011 |
Other Financial Instruments* | | | | | | | | | | |
Futures Contracts | | | (159,019 | ) | | | — | | | — |
| | | | | | | | | | |
Total | | $ | (159,019 | ) | | $ | 534,988,756 | | $ | 7,020,011 |
| | | | | | | | | | |
| * | Other financial instruments are derivative instruments not reflected in the Portfolio of Investments, such as futures, forwards and swap contracts, which are valued at the unrealized appreciation/depreciation on the instrument. |
The following is a reconciliation of assets in which significant unobservable inputs (Level 3) were used in determining fair value:
| | | | |
| | | Municipal
Bonds | |
Balance as of 4/30/09 | | $ | 7,671,744 | |
Realized gain (loss) | | | — | |
Change in unrealized appreciation (depreciation) | | | (1,089 | ) |
Net purchases (sales) | | | — | |
Transfers in and/or out of Level 3 | | | (650,644 | ) |
| | | | |
Balance as of 4/30/10 | | $ | 7,020,011 | |
| | | | |
See Notes to Financial Statements.
| | |
| 38 | | Visit our website at www.prudentialfunds.com |
The industry classification of long-term portfolio holdings, short-term investments and other assets in excess of liabilities shown as a percentage of net assets as of April 30, 2010 was as follows:
| | | |
Healthcare | | 28.2 | % |
Corporate Backed I.D.B. & P.C.R. | | 18.8 | |
Other | | 7.4 | |
Transportation | | 7.4 | |
Special Tax/Assessment District | | 7.2 | |
Education | | 5.4 | |
Pre-Refunded | | 5.3 | |
Tobacco | | 5.0 | |
Power | | 4.7 | |
General Obligation | | 3.2 | |
Short-Term Investments | | 1.7 | |
Lease Backed Certificate of Participation | | 1.4 | |
Housing | | 1.3 | |
Solid Waste/Resource Recovery | | 1.1 | |
Water & Sewer | | 0.6 | |
Tobacco Appropriated | | 0.2 | |
| | | |
| | 98.9 | |
Other assets in excess of liabilities | | 1.1 | |
| | | |
Net Assets | | 100.0 | % |
| | | |
Industry classification is subject to change.
See Notes to Financial Statements.
| | |
| Prudential Muni High Income Fund | | 39 |
Portfolio of Investments
as of April 30, 2010 continued
The Fund invested in derivative instruments during the reporting period. The primary types of risk associated with these derivative instruments are commodity risk, credit risk, equity risk, foreign exchange risk and interest rate risk. The effect of such derivative instruments on the Fund’s financial position and financial performance as reflected in the Statement of Assets and Liabilities and Statement of Operations is presented in the summary below.
Fair values of derivative instruments as of April 30, 2010 as presented in the Statement of Assets and Liabilities:
| | | | | | | | | | |
Derivatives not designated
as hedging instruments,
carried at fair value | | Asset Derivatives | | Liability Derivatives | |
| | Balance
Sheet Location | | Fair
Value | | Balance
Sheet Location | | Fair
Value | |
| Interest rate contracts | | N/A | | N/A | | Due to broker—variation margin | | $ | 159,019 | * |
| | | | | | | | | | |
| * | Includes cumulative appreciation/depreciation on futures contracts as reported in Portfolio of Investments. Only unsettled variation margin receivable (payable) is reported within the Statement of Assets and Liabilities. |
The effects of derivative instruments on the Statement of Operations for the year ended April 30, 2010 are as follows:
| | | | |
Amount of Realized Gain or (Loss) on Derivatives Recognized in Income | |
Derivatives not designated as hedging instruments, carried at fair value | | Futures | |
| |
| |
Interest rate contracts | | $ | (112,736 | ) |
| | | | |
| | | | |
Change in Unrealized Appreciation or (Depreciation) on Derivatives Recognized in Income | |
Derivatives not designated as hedging instruments, carried at fair value | | Futures | |
| |
| |
Interest rate contracts | | $ | (126,789 | ) |
| | | | |
For the year ended April 30, 2010, the average value at trade date for futures long positions was $7,922,995 and the average value at trade date for futures short positions was $3,425,125.
See Notes to Financial Statements.
| | |
| 40 | | Visit our website at www.prudentialfunds.com |
Financial Statements
| | |
| APRIL 30, 2010 | | ANNUAL REPORT |
Prudential Muni High Income Fund
Statement of Assets and Liabilities
as of April 30, 2010
| | | | |
Assets | | | | |
Unaffiliated investments, at value (cost $569,706,703) | | $ | 542,008,767 | |
Cash | | | 32,538 | |
Interest receivable | | | 10,448,756 | |
Receivable for Fund shares sold | | | 2,287,477 | |
Prepaid expenses | | | 3,109 | |
| | | | |
Total assets | | | 554,780,647 | |
| | | | |
| |
Liabilities | | | | |
Payable for investments purchased | | | 4,937,760 | |
Dividends payable | | | 740,467 | |
Payable for Fund shares reacquired | | | 659,197 | |
Management fee payable | | | 221,528 | |
Distribution fee payable | | | 138,502 | |
Accrued expenses | | | 129,258 | |
Due to broker—variation margin | | | 50,625 | |
Deferred trustees’ fees | | | 14,041 | |
Affiliated transfer agent fee payable | | | 10,004 | |
| | | | |
Total liabilities | | | 6,901,382 | |
| | | | |
| |
Net Assets | | $ | 547,879,265 | |
| | | | |
| | | | | |
Net assets were comprised of: | | | | |
Shares of beneficial interest, at par | | $ | 572,795 | |
Paid-in capital in excess of par | | | 585,053,180 | |
| | | | |
| | | 585,625,975 | |
Undistributed net investment income | | | 1,792,748 | |
Accumulated net realized loss on investments | | | (11,682,503 | ) |
Net unrealized depreciation on investments | | | (27,856,955 | ) |
| | | | |
Net assets, April 30, 2010 | | $ | 547,879,265 | |
| | | | |
See Notes to Financial Statements.
| | |
| 42 | | Visit our website at www.prudentialfunds.com |
| | | |
Class A | | | |
Net asset value and redemption price per share | | | |
($403,864,085 ÷ 42,224,820 shares of beneficial interest issued and outstanding) | | $ | 9.56 |
Maximum sales charge (4% of offering price) | | | .40 |
| | | |
Maximum offering price to public | | $ | 9.96 |
| | | |
| |
Class B | | | |
Net asset value, offering price and redemption price per share | | | |
($32,237,960 ÷ 3,368,435 shares of beneficial interest issued and outstanding) | | $ | 9.57 |
| | | |
| |
Class C | | | |
Net asset value, offering price and redemption price per share | | | |
($72,569,754 ÷7,583,519 shares of beneficial interest issued and outstanding) | | $ | 9.57 |
| | | |
| |
Class Z | | | |
Net asset value, offering price and redemption price per share | | | |
($39,207,466 ÷4,102,759 shares of beneficial interest issued and outstanding) | | $ | 9.56 |
| | | |
See Notes to Financial Statements.
| | |
| Prudential Muni High Income Fund | | 43 |
Statement of Operations
Year Ended April 30, 2010
| | | | |
Net Investment Income | | | | |
Income | | | | |
Unaffiliated interest | | $ | 32,522,595 | |
| | | | |
| |
Expenses | | | | |
Management fee | | | 2,450,036 | |
Distribution fee—Class A | | | 945,851 | |
Distribution fee—Class B | | | 145,750 | |
Distribution fee—Class C | | | 410,767 | |
Transfer agent’s fees and expenses (including affiliated expense of $111,000) | | | 247,000 | |
Custodian’s fees and expenses | | | 100,000 | |
Registration fees | | | 68,000 | |
Reports to shareholders | | | 42,000 | |
Audit fee | | | 32,000 | |
Trustees’ fees | | | 29,000 | |
Legal fees and expenses | | | 26,000 | |
Insurance | | | 12,000 | |
Miscellaneous | | | 14,522 | |
| | | | |
Total expenses | | | 4,522,926 | |
Less: Custodian fee credit (Note 1) | | | (44 | ) |
| | | | |
Net expenses | | | 4,522,882 | |
| | | | |
Net investment income | | | 27,999,713 | |
| | | | |
| |
Realized And Unrealized Gain (Loss) On Investments | | | | |
Net realized gain (loss) on: | | | | |
Investment transactions | | | 196,450 | |
Financial futures transactions | | | (112,736 | ) |
| | | | |
| | | 83,714 | |
| | | | |
Net change in unrealized appreciation (depreciation) on: | | | | |
Investments | | | 54,235,468 | |
Financial futures transactions | | | (126,789 | ) |
| | | | |
| | | 54,108,679 | |
| | | | |
Net gain on investments | | | 54,192,393 | |
| | | | |
Net Increase In Net Assets Resulting From Operations | | $ | 82,192,106 | |
| | | | |
See Notes to Financial Statements.
| | |
| 44 | | Visit our website at www.prudentialfunds.com |
Statement of Changes in Net Assets
| | | | | | | | |
| | | Year Ended April 30, | |
| | | 2010 | | | 2009 | |
Increase (Decrease) In Net Assets | | | | | | | | |
Operations | | | | | | | | |
Net investment income | | $ | 27,999,713 | | | $ | 25,646,993 | |
Net realized gain on investments | | | 83,714 | | | | 1,283,867 | |
Net change in unrealized appreciation (depreciation) on investments | | | 54,108,679 | | | | (64,291,683 | ) |
| | | | | | | | |
Net increase (decrease) in net assets resulting from operations | | | 82,192,106 | | | | (37,360,823 | ) |
| | | | | | | | |
| | |
Dividends from net investment income (Note 1) | | | | | | | | |
Class A | | | (21,010,059 | ) | | | (20,654,762 | ) |
Class B | | | (1,545,732 | ) | | | (1,817,063 | ) |
Class C | | | (2,753,468 | ) | | | (1,660,280 | ) |
Class Z | | | (1,603,833 | ) | | | (793,958 | ) |
| | | | | | | | |
| | | (26,913,092 | ) | | | (24,926,063 | ) |
| | | | | | | | |
| | |
Fund share transactions (Net of share conversions) (Note 6) | | | | | | | | |
Net proceeds from shares sold | | | 130,805,040 | | | | 71,005,125 | |
Net asset value of shares issued in reinvestment of dividends | | | 18,803,399 | | | | 14,292,107 | |
Cost of shares reacquired | | | (79,106,753 | ) | | | (69,007,379 | ) |
| | | | | | | | |
Net increase in net assets from Fund share transactions | | | 70,501,686 | | | | 16,289,853 | |
| | | | | | | | |
| | |
Capital Contributions (Note 6) | | | | | | | | |
Proceeds from regulatory settlement | | | 4,034 | | | | — | |
| | | | | | | | |
Total increase (decrease) | | | 125,784,734 | | | | (45,997,033 | ) |
| | |
Net Assets | | | | | | | | |
Beginning of year | | | 422,094,531 | | | | 468,091,564 | |
| | | | | | | | |
End of year(a) | | $ | 547,879,265 | | | $ | 422,094,531 | |
| | | | | | | | |
(a) Includes undistributed net investment income of: | | $ | 1,792,748 | | | $ | 1,660,252 | |
| | | | | | | | |
See Notes to Financial Statements.
| | |
| Prudential Muni High Income Fund | | 45 |
Notes to Financial Statements
Prudential Investment Portfolios 4—Prudential Muni High Income Fund (the “Fund”) (formerly Dryden Municipal Bond Fund) is registered under the Investment Company Act of 1940 as a diversified, open-end management investment company. The Fund was organized as an unincorporated business trust in Massachusetts on November 3, 1986 and currently consists of one series: the Prudential Muni High Income Fund (formerly the High Income Series).
The investment objective of the Fund is to provide the maximum amount of income that is eligible for exclusion from federal income taxes. The ability of issuers of debt securities held by the Fund to meet their obligations may be affected by economic and political developments in a specific state, region or industry.
Note 1. Accounting Policies
The following is a summary of significant accounting policies followed by the Fund in the preparation of its financial statements.
Securities Valuation: The Fund values municipal securities (including commitments to purchase such securities on a “when-issued” basis) as of the normal close of trading on the New York Stock Exchange, on the basis of prices provided by a pricing service which uses information with respect to transactions in comparable securities and various relationships between securities in determining values. Securities listed on a securities exchange (other than options on securities and indices) are valued at the last sale price on such exchange on the day of valuation or, if there was no sale on such day, at the mean between the last reported bid and asked prices, or at the last bid price on such day in the absence of an asked price. Securities that are actively traded in the over-the-counter market, including listed securities for which the primary market is believed by Prudential Investments LLC (“PI” or “Manager”) in consultation with the subadvisor, to be over-the-counter, are valued at market value using prices provided, by an independent pricing agent or principal market maker. Futures contracts and options thereon traded on a commodities exchange or board of trade are valued at the last sale price at the close of trading on such exchange or board of trade or, if there was no sale on the applicable commodities exchange or board of trade on such day, at the mean between the most recently quoted prices on such exchange or board of trade or at the last bid price in the absence of an asked price. Securities for which reliable market quotations are not readily available or for which the pricing service does not provide a valuation methodology, or does not
| | |
| 46 | | Visit our website at www.prudentialfunds.com |
present fair value, are valued at fair value in accordance with Board of Trustees’ approved fair valuation procedures. When determining the fair valuation of securities some of the factors influencing the valuation include, the nature of any restrictions on disposition of the securities; assessment of the general liquidity of the securities; the issuer’s financial condition and the markets in which it does business; the cost of the investment; the size of the holding and the capitalization of issuer; the prices of any recent transactions or bids/offers for such securities or any comparable securities; any available analyst media or other reports or information deemed reliable by the investment adviser regarding the issuer or the markets or industry in which it operates. Using fair value to price securities may result in a value that is different from a security’s most recent closing price and from the price used by other mutual funds to calculate their net asset values. Investments in mutual funds are valued at their net asset value as of the close of the New York Stock Exchange on the date of valuation.
Short-term debt securities of sufficient credit quality which mature in sixty days or less are valued at amortized cost, which approximates fair value. The amortized cost method involves valuing a security at its cost on the date of purchase and thereafter assuming a constant amortization to maturity of the difference between the principal amount due at maturity and cost. Short-term debt securities which mature in more than sixty days are valued at current market quotations.
Restricted Securities: The Fund may hold up to 15% of its net assets in illiquid securities, including those which are restricted as to disposition under securities law (“restricted securities”). Restricted securities held by the Fund at the end of the fiscal period may include registration rights under which the Fund may demand registration by the issuers, of which the Fund may bear the cost of such registration. Restricted securities, are valued pursuant to the valuation procedures noted above.
Financial Futures Contracts: A financial futures contract is an agreement to purchase (long) or sell (short) an agreed amount of securities at a set price for delivery on a future date. Upon entering into a financial futures contract, the Fund is required to pledge to the broker an amount of cash and/or other assets equal to a certain percentage of the contract amount. This amount is known as the “initial margin”. Subsequent payments, known as “variation margin”, are made or received by the Fund each day, depending on the daily fluctuations in the value of the underlying security. Such variation margin is recorded for financial statement purposes on a daily basis as unrealized gain or loss. When the contract expires or is closed, the gain or loss is realized and is presented in the Statement of Operations as net realized gain or loss on financial futures contracts.
| | |
| Prudential Muni High Income Fund | | 47 |
Notes to Financial Statements
continued
The Fund invests in financial futures contracts in order to hedge its existing portfolio securities, or securities the Fund intends to purchase, against fluctuations in value caused by changes in prevailing interest rates or market conditions. Should interest rates move unexpectedly, the Fund may not achieve the anticipated benefits of the financial futures contracts and may realize a loss. The use of futures transactions involves the risk of imperfect correlation in movements in the price of futures contracts, interest rates and the underlying hedged assets. Financial Futures contracts involve elements of risk in excess of the amounts reflected on the Statement of Assets and Liabilities.
With exchange-traded futures, there is a minimal counterparty credit risk to the Fund since the exchanges’ clearinghouse acts as counterparty to all exchange traded futures and guarantees the futures contracts against default.
Futures contracts involve elements of both market and credit risk in excess of the amounts reflected in the Statement of Assets and Liabilities.
Floating-Rate Notes Issued in Conjunction with Securities Held: The Fund invests in inverse floating rate securities (“inverse floaters”) that pay interest at a rate that varies inversely with short-term interest rates. Certain of these securities may be leveraged, whereby the interest rate varies inversely at a multiple of the change in short-term rates. As interest rates rise, inverse floaters produce less current income. The price of such securities is more volatile than comparable fixed rate securities.
When the Fund enters into agreements to create inverse floaters and floater note securities (also known as Tender Option Bond Transactions), the Fund transfers a fixed rate bond to a broker for cash. At the same time the Fund buys (receives) a residual interest in a trust (the “trust”) set up by the broker, often referred to as an inverse floating rate obligation (inverse floaters). Generally, the broker deposits a fixed rate bond (the “fixed rate bond”) into the trust with the same CUSIP number as the fixed rate bond sold to the broker by the Fund. The “trust” also issues floating rate notes (“floating rate notes”), which are sold to third parties. The floating rate notes have interest rates that reset weekly. The inverse floater held by the Fund gives the Fund the right (1) to cause the holders of the floating rate notes to tender their notes at par, and (2) to have the broker transfer the fixed rate bond held by the trust to the Fund thereby collapsing the trust. In accordance with FAS Statement No. 140, the Fund accounts for the transaction described above as funded leverage by including
| | |
| 48 | | Visit our website at www.prudentialfunds.com |
the fixed rate bond in its Portfolio of Investments, and accounts for the floating rate notes as a liability under the caption “payable for floating rate notes issued” in the Fund’s “Statement of Assets and Liabilities.” Interest expense related to the Fund’s liability in connection with the floating rate notes held by third parties is recorded as incurred. The interest expense is under the caption “interest expenses and fees related to inverse floaters” in the Fund’s “Statement of Operations” and is also included in the Fund’s expense ratio. For the year ended April 30, 2010, the Fund did not enter into any Tender Option Bond Transactions.
The Fund may also invest in inverse floaters without transferring a fixed rate bond into a trust, which is not accounted for as funded leverage. The interest rates on these securities have an inverse relationship to the interest rate of other securities or the value of an index. Changes in interest rates on the other security or index inversely affect the rate paid on the inverse floater, and the inverse floater’s price will be more volatile than that of a fixed-rate bond. Additionally, some of these securities contain a “leverage factor” whereby the interest rate moves inversely by a “factor” to the benchmark rate. Certain interest rate movements and other market factors can substantially affect the liquidity of inverse floating rate notes.
The Fund’s investment policies and restrictions permit investments in inverse floating rate securities. Inverse floaters held by the Fund are securities exempt from registration under Rule 144A of the Securities Act of 1933.
When-Issued/Delayed Delivery Securities: Securities purchased or sold on a when-issued or delayed-delivery basis may be settled a month or more after trade date; interest income is not accrued until settlement date. At the time a Fund enters into such transactions, it instructs the custodian to segregate assets with a current value at least equal to the amount of its when-issued or delayed-delivery purchase commitments.
Securities Transactions and Net Investment Income: Securities transactions are recorded on the trade date. Realized gains or losses on sales of investments are calculated on the identified cost basis. Interest income, including amortization of premium and accretion of discount on debt securities, as required, is recorded on the accrual basis as an adjustment to interest income.
Net investment income or loss (other than distribution fees, which are charged directly to the respective Class) and unrealized and realized gains or losses, are allocated daily to each class of shares based upon the relative proportion of net assets of each class at the beginning of the day.
| | |
| Prudential Muni High Income Fund | | 49 |
Notes to Financial Statements
continued
Dividends and Distributions: The Fund declares dividends from net investment income daily and payment is made monthly. Distributions of net realized capital and currency gains, if any, annually. Dividends and distributions to shareholders, which are determined in accordance with federal income tax regulations and which may differ from generally accepted accounting principles, are recorded on the ex-dividend date. Permanent book/tax differences relating to income and gains are reclassified amongst undistributed net investment income, accumulated net realized gain or loss and paid-in capital in excess of par, as appropriate.
Federal Income Taxes: For federal income tax purposes, the Fund is treated as a separate taxpaying entity. It is the Fund’s policy to continue to meet the requirements of the Internal Revenue Code applicable to regulated investment companies and to distribute all of its taxable net income and capital gains, if any, to its shareholders. Therefore, no federal income tax provision is required.
Custody Fee Credits: The Fund has an arrangement with its custodian bank, whereby uninvested cash earn credits which reduce the fees charged by the custodian. Such custody fee credits, if any, are presented as a reduction of gross expenses in the accompanying Statement of Operations.
Estimates: The preparation of the financial statements requires management to make estimates and assumptions that affect the reported amounts and disclosures in the financial statements. Actual results could differ from those estimates.
Note 2. Agreements
The Fund has a management agreement with PI. Pursuant to this agreement, PI has responsibility for all investment advisory services and supervises the subadviser’s performance of such services. PI has entered into a subadvisory agreement with Prudential Investment Management (“PIM”). The subadvisory agreement provides that PIM will furnish investment advisory services in connection with the management of the Fund. PI pays for the services of PIM, the cost of compensation of officers for the Fund, occupancy and certain clerical and bookkeeping cost of the Fund. The Fund bears all other costs and expenses.
The management fee paid to PI is computed daily and payable monthly at an annual rate of 0.50% of the Fund’s average daily net assets of up to $1 billion and 0.45% of
| | |
| 50 | | Visit our website at www.prudentialfunds.com |
the average daily net assets in excess of $1 billion. The effective management fee rate was 0.50% for the year ended April 30, 2010.
The Fund has a distribution agreement with Prudential Investment Management Services LLC (“PIMS”) which acts as the distributor of the Fund. The Fund compensates PIMS for distributing and servicing the Fund’s Class A, Class B and Class C shares, pursuant to plans of distribution (the “Class A, B and C Plans”), regardless of expenses actually incurred by it. The distribution fees are accrued daily and payable monthly. No distribution or service fees are paid to PIMS as distributor of the Class Z shares of the Fund.
Pursuant to the Class A, B and C Plans, the Fund compensates PIMS for distribution related activities at an annual rate of up to 0.30%, 0.50% and 1%, of the average daily net assets of the Class A, B and C shares, respectively. PIMS contractually agreed to limit such fees to 0.25% and 0.75% of the average daily net assets of the Class A shares and Class C shares, respectively.
PIMS has advised the Fund that it received $416,730 for Class A shares in front-end sales charges during the year ended April 30, 2010. From these fees, PIMS paid such sales charges to affiliated broker-dealers, which in turn paid commissions to salespersons and incurred other distribution costs.
PIMS has advised the Fund that for the year ended April 30, 2010, it received $1,613, $40,906 and $19,807 in contingent deferred sales charges imposed upon certain redemptions by Class A, Class B and C shareholders, respectively.
PI, PIM and PIMS are indirect wholly owned subsidiaries of Prudential Financial, Inc. (“Prudential”).
Note 3. Other Transactions With Affiliates
Prudential Mutual Fund Services LLC (“PMFS”), an affiliate of PI and an indirect, wholly-owned subsidiary of Prudential, serves as the Fund’s transfer agent. Transfer agent’s fees and expenses in the Statement of Operations include certain out-of-pocket expenses paid to non-affiliates, where applicable.
The Fund pays networking fees to affiliated and unaffiliated broker/dealers, including fees relating to the services of Wells Fargo Advisors, LLC (“Wells Fargo”) and First Clearing, LLC (“First Clearing”), affiliates of PI through December 31, 2009. These networking fees are payments made to broker/dealers that clear mutual fund
| | |
| Prudential Muni High Income Fund | | 51 |
Notes to Financial Statements
continued
transactions through a national clearing system. For the year ended April 30, 2010, the Fund incurred approximately $127,600 in total networking fees, of which approximately $14,300 and $18,600 were paid to First Clearing and Wells Fargo, respectively, through December 31, 2009. These amounts are included in transfer agent’s fees and expenses in the Statement of Operations.
Note 4. Portfolio Securities
Purchases and sales of portfolio securities, other than short-term investments, for the year ended April 30, 2010, were $187,705,166 and $125,439,155, respectively.
Note 5. Distributions and Tax Information
Distributions to shareholders, which are determined in accordance with federal income tax regulations and which may differ from generally accepted accounting principles, are recorded on the ex-dividend date. In order to present undistributed net investment income, accumulated net realized loss on investments and paid-in capital in excess of par on the Statement of Assets and Liabilities that more closely represent their tax character, certain adjustments have been made to paid-in capital in excess of par, undistributed net investment income and accumulated net realized loss on investments. For the year ended April 30, 2010, the adjustments were to decrease undistributed net investment income by $954,125, to decrease accumulated net realized loss on investments by $14,380,463 and to decrease paid-in capital in excess of par by $13,426,338 due to the difference in the treatment of accreting market discount between financial and tax reporting, expiration of capital loss carryforward and other book to tax differences. Net investment income, net realized gains and net assets were not affected by this change.
For the year ended April 30, 2010, the tax character of dividends paid was $26,913,092 from tax-exempt income. For the year ended April 30, 2009, the tax character of dividends paid was $24,926,063 from tax-exempt income.
As of April 30, 2010, the components of distributable earnings on a tax basis were $3,755,582 of tax-exempt income (includes timing difference of $740,467 for dividends payable) and $166,778 of ordinary income, respectively. This differs from the amount shown on the Statement of Assets and Liabilities primarily due to cumulative timing differences between financial and tax reporting.
| | |
| 52 | | Visit our website at www.prudentialfunds.com |
The United States federal income tax basis of the Fund’s investments and net unrealized depreciation as of April 30, 2010 were as follows:
| | | | | | |
Tax Basis | | Appreciation | | Depreciation | | Net
Unrealized
Depreciation |
| $567,402,120 | | $27,196,212 | | $(52,589,565) | | $(25,393,353) |
The difference between book and tax basis were primarily due to the difference between financial and tax reporting with respect to accretion of market discount and other adjustments.
For federal income tax purposes, the Fund has a capital loss carryforward as of April 30, 2010 of approximately $15,521,000 of which $4,457,000 expires in 2011 and $11,064,000 expires in 2014. During the fiscal year ended April 30, 2010, the Fund utilized approximately of $60,000 of its capital loss carryforward to offset net realized taxable gains. As of April 30, 2010, approximately $13,452,000 of the capital loss carryforward was written-off due to expiration. Accordingly, no capital gain distributions are expected to be paid to shareholders until net gains have been realized in excess of such carryforwards. It is uncertain if the Fund will be able to realize the full benefit of the remaining carryforwards prior to the expiration date.
Management has analyzed the Fund’s tax positions taken on federal income tax returns for all open tax years and has concluded that as of April 30, 2010, no provision for income tax would be required in the Fund’s financial statements. The Fund’s federal and state income and federal excise tax returns for tax years for which the applicable statutes of limitations have not expired are subject to examination by the Internal Revenue Service and state departments of revenue.
Note 6. Capital
The Fund offers Class A, Class B, Class C and Class Z shares. Class A shares were sold with a front-end sales charge of up to 4%. All investors who purchase Class A shares in the amount of $1 million or more and sell these shares within 12 months of purchase are subject to a contingent deferred sales charge (CDSC) of 1%, including investors who purchase their shares through broker dealers affiliated with Prudential. Class B shares are sold with a contingent deferred sales charge which declines from 5% to zero depending on the period of time the shares are held. Class C shares are sold with a contingent deferred sales charge of 1% during the first 12 months. Class B shares automatically convert to Class A shares on a quarterly basis approximately seven years after purchase. A special exchange privilege is also available for
| | |
| Prudential Muni High Income Fund | | 53 |
Notes to Financial Statements
continued
shareholders who qualify to purchase Class A shares at net asset value. Class Z shares are not subject to any sales or redemption charge and are offered exclusively for sale to a limited group of investors.
For the year ended April 30, 2010, the Fund received $4,034 related to an affiliate’s settlement of regulatory proceedings involving allegations of improper trading. This amount is presented in the Fund’s Statement of Changes in Net Assets. The Fund was not involved in the proceedings or the calculation of the payment.
The Fund has authorized an unlimited number of shares of beneficial interest of each class at $.01 par value per share. Transactions in shares of beneficial interest were as follows:
| | | | | | | |
Class A | | Shares | | | Amount | |
Year ended April 30, 2010: | | | | | | | |
Shares sold | | 5,762,593 | | | $ | 53,124,764 | |
Shares issued in reinvestment of dividends | | 1,621,407 | | | | 14,964,843 | |
Shares reacquired | | (5,546,346 | ) | | | (51,289,337 | ) |
| | | | | | | |
Net increase (decrease) in shares outstanding before conversion | | 1,837,654 | | | | 16,800,270 | |
Shares issued upon conversion from Class B | | 435,876 | | | | 3,931,349 | |
| | | | | | | |
Net increase (decrease) in shares outstanding | | 2,273,530 | | | $ | 20,731,619 | |
| | | | | | | |
Year ended April 30, 2009: | | | | | | | |
Shares sold | | 3,598,668 | | | $ | 31,751,924 | |
Shares issued in reinvestment of dividends | | 1,332,745 | | | | 11,804,044 | |
Shares reacquired | | (5,891,454 | ) | | | (52,467,916 | ) |
| | | | | | | |
Net increase (decrease) in shares outstanding before conversion | | (960,041 | ) | | | (8,911,948 | ) |
Shares issued upon conversion from Class B | | 1,297,538 | | | | 11,548,569 | |
| | | | | | | |
Net increase (decrease) in shares outstanding | | 337,497 | | | $ | 2,636,621 | |
| | | | | | | |
| | |
| 54 | | Visit our website at www.prudentialfunds.com |
| | | | | | | |
Class B | | Shares | | | Amount | |
Year ended April 30, 2010: | | | | | | | |
Shares sold | | 1,407,631 | | | $ | 12,981,323 | |
Shares issued in reinvestment of dividends | | 119,577 | | | | 1,105,161 | |
Shares reacquired | | (756,056 | ) | | | (7,031,110 | ) |
| | | | | | | |
Net increase (decrease) in shares outstanding before conversion | | 771,152 | | | | 7,055,374 | |
Shares reacquired upon conversion into Class A | | (434,877 | ) | | | (3,931,349 | ) |
| | | | | | | |
Net increase (decrease) in shares outstanding | | 336,275 | | | $ | 3,124,025 | |
| | | | | | | |
Year ended April 30, 2009: | | | | | | | |
Shares sold | | 685,400 | | | $ | 6,130,979 | |
Shares issued in reinvestment of dividends | | 109,439 | | | | 975,541 | |
Shares reacquired | | (754,855 | ) | | | (6,751,608 | ) |
| | | | | | | |
Net increase (decrease) in shares outstanding before conversion | | 39,984 | | | | 354,912 | |
Shares reacquired upon conversion into Class A | | (1,295,358 | ) | | | (11,548,569 | ) |
| | | | | | | |
Net increase (decrease) in shares outstanding | | (1,255,374 | ) | | $ | (11,193,657 | ) |
| | | | | | | |
Class C | | | | | | |
Year ended April 30, 2010: | | | | | | | |
Shares sold | | 4,157,626 | | | $ | 38,342,141 | |
Shares issued in reinvestment of dividends | | 184,541 | | | | 1,706,572 | |
Shares reacquired | | (1,042,814 | ) | | | (9,681,458 | ) |
| | | | | | | |
Net increase (decrease) in shares outstanding | | 3,299,353 | | | $ | 30,367,255 | |
| | | | | | | |
Year ended April 30, 2009: | | | | | | | |
Shares sold | | 2,019,904 | | | $ | 17,947,217 | |
Shares issued in reinvestment of dividends | | 107,106 | | | | 942,918 | |
Shares reacquired | | (602,180 | ) | | | (5,318,906 | ) |
| | | | | | | |
Net increase (decrease) in shares outstanding | | 1,524,830 | | | $ | 13,571,229 | |
| | | | | | | |
Class Z | | | | | | |
Year ended April 30, 2010: | | | | | | | |
Shares sold | | 2,859,554 | | | $ | 26,356,812 | |
Shares issued in reinvestment of dividends | | 111,469 | | | | 1,026,823 | |
Shares reacquired | | (1,201,928 | ) | | | (11,104,848 | ) |
| | | | | | | |
Net increase (decrease) in shares outstanding | | 1,769,095 | | | $ | 16,278,787 | |
| | | | | | | |
Year ended April 30, 2009: | | | | | | | |
Shares sold | | 1,760,332 | | | $ | 15,175,005 | |
Shares issued in reinvestment of dividends | | 64,779 | | | | 569,604 | |
Shares reacquired | | (514,786 | ) | | | (4,468,949 | ) |
| | | | | | | |
Net increase (decrease) in shares outstanding | | 1,310,325 | | | $ | 11,275,660 | |
| | | | | | | |
Note 7. Borrowings
The Fund, along with other affiliated registered investment companies (the “Funds”), is a party to a Syndicated Credit Agreement (“SCA”) with two banks. The SCA
| | |
| Prudential Muni High Income Fund | | 55 |
Notes to Financial Statements
continued
provides for a commitment of $500 million. Interest on any borrowings under the SCA is incurred at contracted market rates and a commitment fee for the unused amount is accrued daily and paid quarterly. Effective October 22, 2009, the Funds renewed the SCA with the banks. The commitment under the renewed SCA continues to be $500 million. The Funds pay a commitment fee of 0.15% of the unused portion of the renewed SCA. The expiration date of the renewed SCA is October 20, 2010. For the period from October 24, 2008 through October 21, 2009, the Funds paid a commitment fee of 0.13% of the unused portion of the agreement. The purpose of the SCA is to provide an alternative source of temporary funding for capital share redemptions. The Fund did not borrow any amounts pursuant to the SCA during the year ended April 30, 2010.
Note 8. New Accounting Pronouncement
In January 2010, the Financial Accounting Standards Board (“FASB”) issued Accounting Standards Update (“ASU”) No. 2010-06 “Improving Disclosures about Fair Value Measurements”. ASU 2010-06 will require reporting entities to make new disclosures about amounts and reasons for significant transfers in and out of Level 1 and Level 2 fair value measurements and input and valuation techniques used to measure fair value for both recurring and nonrecurring fair value measurements that fall in either Level 2 or Level 3, and information on purchases, sales, issuances, and settlements in the roll forward of activity in Level 3 fair value measurements. The new and revised disclosures are effective for interim and annual reporting periods beginning after December 15, 2009 except for the disclosures about purchases, sales, issuances, and settlements in the roll forward of activity in Level 3 fair value measurements, which are effective for interim and annual reporting periods beginning after December 15, 2010. At this time, management is evaluating the implications of ASU No. 2010-06 and its impact on the financial statements has not been determined.
Note 9. Subsequent Events
Management has evaluated the impact of all subsequent events on the Fund through the date the financial statements were issued, and has determined that there were no subsequent events requiring recognition or disclosure in the financial statements.
| | |
| 56 | | Visit our website at www.prudentialfunds.com |
Financial Highlights
| | |
| APRIL 30, 2010 | | ANNUAL REPORT |
Prudential Muni High Income Fund
Financial Highlights
| | | | |
| | | Class A | �� |
| | | Year Ended
April 30, 2010 | |
Per Share Operating Performance: | | | | |
Net Asset Value, Beginning Of Year | | $ | 8.51 | |
| | | | |
Income (loss) from investment operations: | | | | |
Net investment income | | | .53 | |
Net realized and unrealized gain (loss) on investment transactions | | | 1.03 | |
| | | | |
Total from investment operations | | | 1.56 | |
| | | | |
Less Dividends: | | | | |
Dividends from net investment income | | | (.51 | ) |
| | | | |
Capital Contributions | | | — | (f) |
| | | | |
Net asset value, end of year | | $ | 9.56 | |
| | | | |
Total Return(a): | | | 18.75 | % |
Ratios/Supplemental Data: | | | | |
Net assets, end of year (000) | | $ | 403,864 | |
Average net assets (000) | | $ | 378,340 | |
Ratios to average net assets: | | | | |
Expenses, including distribution and service (12b-1) fees(b) | | | .87 | % |
Expenses, excluding distribution and service (12b-1) fees | | | .62 | % |
Net investment income | | | 5.77 | % |
For Class A, B, C and Z shares: | | | | |
Portfolio turnover rate | | | 26 | %(e) |
| (a) | Total return does not consider the effects of sales loads. Total return is calculated assuming a purchase of a share on the first day and a sale on the last day of each year reported, and includes reinvestment of dividends and distributions. Total investment returns may reflect adjustments to conform to generally accepted accounting principles. |
| (b) | The distributor of the Fund has contractually agreed to limit its distribution and service (12b-1) fees to .25% of the average daily net assets of the Class A shares. |
| (c) | Calculated based upon average shares outstanding during the year. |
| (d) | The expense ratio reflects the interest and fees expense related to the liability for the floating rate notes issued in conjunction with the inverse floater securities. The total expense ratio excluding interest and fees expense and the expense ratio excluding 12b-1 and interest and fees expense is .85% and .60% for the year ended April 30, 2009, .84% and .59% for the year ended April 30, 2008 and .85% and .60% for the year ended April 30, 2007, respectively. |
| (e) | The portfolio turnover rate including variable rate demand notes was 51% for the year ended April 30, 2010 and 50% for the year ended April 30, 2009. |
| (f) | Less than $0.005 per share. |
See Notes to Financial Statements.
| | |
| 58 | | Visit our website at www.prudentialfunds.com |
| | | | | | | | | | | | | | |
| Class A | |
| Year Ended April 30, | |
| 2009(c) | | | 2008 | | | 2007(c) | | | 2006(c) | |
| | | | | | | | | | | | | | |
| $ | 9.82 | | | $ | 10.53 | | | $ | 10.32 | | | $ | 10.33 | |
| | | | | | | | | | | | | | | |
| | | | | | | | | | | | | | |
| | .54 | | | | .50 | | | | .53 | | | | .53 | |
| | (1.33 | ) | | | (.72 | ) | | | .18 | | | | (.05 | ) |
| | | | | | | | | | | | | | | |
| | (.79 | ) | | | (.22 | ) | | | .71 | | | | .48 | |
| | | | | | | | | | | | | | | |
| | | | | | | | | | | | | | |
| | (.52 | ) | | | (.49 | ) | | | (.50 | ) | | | (.49 | ) |
| | | | | | | | | | | | | | | |
| | — | | | | — | | | | — | | | | — | |
| | | | | | | | | | | | | | | |
| $ | 8.51 | | | $ | 9.82 | | | $ | 10.53 | | | $ | 10.32 | |
| | | | | | | | | | | | | | | |
| | (8.08 | )% | | | (2.11 | )% | | | 6.94 | % | | | 4.84 | % |
| | | | | | | | | | | | | | |
| $ | 339,959 | | | $ | 388,838 | | | $ | 444,751 | | | $ | 451,785 | |
| $ | 354,290 | | | $ | 411,884 | | | $ | 451,239 | | | $ | 458,445 | |
| | | | | | | | | | | | | | |
| | .87 | %(d) | | | .87 | %(d) | | | .89 | %(d) | | | .87 | % |
| | .62 | %(d) | | | .62 | %(d) | | | .64 | %(d) | | | .62 | % |
| | 6.00 | % | | | 4.96 | % | | | 5.00 | % | | | 5.14 | % |
| | | | | | | | | | | | | | |
| | 23 | %(e) | | | 41 | % | | | 33 | % | | | 32 | % |
See Notes to Financial Statements.
| | |
| Prudential Muni High Income Fund | | 59 |
Financial Highlights
continued
| | | | |
| | | Class B | |
| | | Year Ended
April 30, 2010 | |
Per Share Operating Performance: | | | | |
Net Asset Value, Beginning Of Year | | $ | 8.52 | |
| | | | |
Income (loss) from investment operations: | | | | |
Net investment income | | | .50 | |
Net realized and unrealized gain (loss) on investment transactions | | | 1.04 | |
| | | | |
Total from investment operations | | | 1.54 | |
| | | | |
Less Dividends: | | | | |
Dividends from net investment income | | | (.49 | ) |
| | | | |
Capital Contributions | | | — | (d) |
| | | | |
Net asset value, end of year | | $ | 9.57 | |
| | | | |
Total Return(a): | | | 18.45 | % |
Ratios/Supplemental Data: | | | | |
Net assets, end of year (000) | | $ | 32,238 | |
Average net assets (000) | | $ | 29,152 | |
Ratios to average net assets: | | | | |
Expenses, including distribution and service (12b-1) fees | | | 1.12 | % |
Expenses, excluding distribution and service (12b-1) fees | | | .62 | % |
Net investment income | | | 5.52 | % |
| (a) | Total return does not consider the effects of sales loads. Total return is calculated assuming a purchase of a share on the first day and a sale on the last day of each year reported, and includes reinvestment of dividends and distributions. Total investment returns may reflect adjustments to conform to generally accepted accounting principles. |
| (b) | Calculated based upon average shares outstanding during the year. |
| (c) | The expense ratio reflects the interest and fees expense related to the liability for the floating rate notes issued in conjunction with the inverse floater securities. The total expense ratio excluding interest and fees expense and the expense ratio excluding 12b-1 and interest and fees expense is 1.10% and .60% for the year ended April 30, 2009, 1.09% and .59% for the year ended April 30, 2008 and 1.10% and .60% for the year ended April 30, 2007, respectively. |
| (d) | Less than $0.005 per share. |
See Notes to Financial Statements.
| | |
| 60 | | Visit our website at www.prudentialfunds.com |
| | | | | | | | | | | | | | |
| Class B | |
| Year Ended April 30, | |
| 2009(b) | | | 2008 | | | 2007(b) | | | 2006(b) | |
| | | | | | | | | | | | | | |
| $ | 9.82 | | | $ | 10.53 | | | $ | 10.33 | | | $ | 10.34 | |
| | | | | | | | | | | | | | | |
| | | | | | | | | | | | | | |
| | .51 | | | | .49 | | | | .50 | | | | .51 | |
| | (1.31 | ) | | | (.73 | ) | | | .18 | | | | (.06 | ) |
| | | | | | | | | | | | | | | |
| | (.80 | ) | | | (.24 | ) | | | .68 | | | | .45 | |
| | | | | | | | | | | | | | | |
| | | | | | | | | | | | | | |
| | (.50 | ) | | | (.47 | ) | | | (.48 | ) | | | (.46 | ) |
| | | | | | | | | | | | | | | |
| | — | | | | — | | | | — | | | | — | |
| | | | | | | | | | | | | | | |
| $ | 8.52 | | | $ | 9.82 | | | $ | 10.53 | | | $ | 10.33 | |
| | | | | | | | | | | | | | | |
| | (8.19 | )% | | | (2.35 | )% | | | 6.67 | % | | | 4.48 | % |
| | | | | | | | | | | | | | |
| $ | 25,820 | | | $ | 42,119 | | | $ | 58,278 | | | $ | 85,179 | |
| $ | 33,111 | | | $ | 50,205 | | | $ | 70,145 | | | $ | 112,213 | |
| | | | | | | | | | | | | | |
| | 1.12 | %(c) | | | 1.12 | %(c) | | | 1.14 | %(c) | | | 1.12 | % |
| | .62 | %(c) | | | .62 | %(c) | | | .64 | %(c) | | | .62 | % |
| | 5.66 | % | | | 4.70 | % | | | 4.74 | % | | | 4.90 | % |
See Notes to Financial Statements.
| | |
| Prudential Muni High Income Fund | | 61 |
Financial Highlights
continued
| | | | |
| | | Class C | |
| | | Year Ended
April 30, 2010 | |
Per Share Operating Performance: | | | | |
Net Asset Value, Beginning Of Year | | $ | 8.51 | |
| | | | |
Income (loss) from investment operations: | | | | |
Net investment income | | | .48 | |
Net realized and unrealized gain (loss) on investment transactions | | | 1.05 | |
| | | | |
Total from investment operations | | | 1.53 | |
| | | | |
Less Dividends: | | | | |
Dividends from net investment income | | | (.47 | ) |
| | | | |
Capital Contributions | | | — | (e) |
| | | | |
Net asset value, end of year | | $ | 9.57 | |
| | | | |
Total Return(a): | | | 18.33 | % |
Ratios/Supplemental Data: | | | | |
Net assets, end of year (000) | | $ | 72,570 | |
Average net assets (000) | | $ | 54,768 | |
Ratios to average net assets: | | | | |
Expenses, including distribution and service (12b-1) fees(b) | | | 1.37 | % |
Expenses, excluding distribution and service (12b-1) fees | | | .62 | % |
Net investment income | | | 5.25 | % |
| (a) | Total return does not consider the effects of sales loads. Total return is calculated assuming a purchase of a share on the first day and a sale on the last day of each year reported, and includes reinvestment of dividends and distributions. Total investment returns may reflect adjustments to conform to generally accepted accounting principles. |
| (b) | The distributor of the Fund has contractually agreed to limit its distribution and service (12b-1) fees to .75% of the average daily net assets of the Class C shares. |
| (c) | Calculated based upon average shares outstanding during the year. |
| (d) | The expense ratio reflects the interest and fees expense related to the liability for the floating rate notes issued in conjunction with the inverse floater securities. The total expense ratio excluding interest and fees expense and the expense ratio excluding 12b-1 and interest and fees expense is 1.35% and .60% for the year ended April 30, 2009, 1.34% and .59% for the year ended April 30, 2008 and 1.35% and .60% for the year ended April 30, 2007, respectively. |
| (e) | Less than $0.005 per share. |
See Notes to Financial Statements.
| | |
| 62 | | Visit our website at www.prudentialfunds.com |
| | | | | | | | | | | | | | |
| Class C | |
| Year Ended April 30, | |
| 2009(c) | | | 2008 | | | 2007(c) | | | 2006(c) | |
| | | | | | | | | | | | | | |
| $ | 9.82 | | | $ | 10.53 | | | $ | 10.33 | | | $ | 10.34 | |
| | | | | | | | | | | | | | | |
| | | | | | | | | | | | | | |
| | .50 | | | | .45 | | | | .47 | | | | .48 | |
| | (1.33 | ) | | | (.72 | ) | | | .18 | | | | (.05 | ) |
| | | | | | | | | | | | | | | |
| | (.83 | ) | | | (.27 | ) | | | .65 | | | | .43 | |
| | | | | | | | | | | | | | | |
| | | | | | | | | | | | | | |
| | (.48 | ) | | | (.44 | ) | | | (.45 | ) | | | (.44 | ) |
| | | | | | | | | | | | | | | |
| | — | | | | — | | | | — | | | | — | |
| | | | | | | | | | | | | | | |
| $ | 8.51 | | | $ | 9.82 | | | $ | 10.53 | | | $ | 10.33 | |
| | | | | | | | | | | | | | | |
| | (8.51 | )% | | | (2.59 | )% | | | 6.41 | % | | | 4.23 | % |
| | | | | | | | | | | | | | |
| $ | 36,474 | | | $ | 27,097 | | | $ | 30,256 | | | $ | 26,611 | |
| $ | 30,512 | | | $ | 28,247 | | | $ | 28,519 | | | $ | 25,219 | |
| | | | | | | | | | | | | | |
| | 1.37 | %(d) | | | 1.37 | %(d) | | | 1.39 | %(d) | | | 1.37 | % |
| | .62 | %(d) | | | .62 | %(d) | | | .64 | %(d) | | | .62 | % |
| | 5.61 | % | | | 4.46 | % | | | 4.50 | % | | | 4.64 | % |
See Notes to Financial Statements.
| | |
| Prudential Muni High Income Fund | | 63 |
Financial Highlights
continued
| | | | |
| | | Class Z | |
| | | Year Ended
April 30, 2010 | |
Per Share Operating Performance: | | | | |
Net Asset Value, Beginning Of Year | | $ | 8.50 | |
| | | | |
Income (loss) from investment operations: | | | | |
Net investment income | | | .55 | |
Net realized and unrealized gain (loss) on investment transactions | | | 1.05 | |
| | | | |
Total from investment operations | | | 1.60 | |
| | | | |
Less Dividends: | | | | |
Dividends from net investment income | | | (.54 | ) |
| | | | |
Capital Contributions | | | — | (d) |
| | | | |
Net asset value, end of year | | $ | 9.56 | |
| | | | |
Total Return(a): | | | 19.22 | % |
Ratios/Supplemental Data: | | | | |
Net assets, end of year (000) | | $ | 39,207 | |
Average net assets (000) | | $ | 27,751 | |
Ratios to average net assets: | | | | |
Expenses, including distribution and service (12b-1) fees | | | .62 | % |
Expenses, excluding distribution and service (12b-1) fees | | | .62 | % |
Net investment income | | | 6.00 | % |
| (a) | Total return is calculated assuming a purchase of a share on the first day and a sale on the last day of each year reported, and includes reinvestment of dividends and distributions. Total investment returns may reflect adjustments to conform to generally accepted accounting principles. |
| (b) | Calculated based upon average shares outstanding during the year. |
| (c) | The expense ratio reflects the interest and fees expense related to the liability for the floating rate notes issued in conjunction with the inverse floater securities. The total expense ratio excluding interest and fees expense and the expense ratio excluding 12b-1 and interest and fees expense is .60% and .60% for the year ended April 30, 2009, .59% and .59% for the year ended April 30, 2008 and .60% and .60% for the year ended April 30, 2007, respectively. |
| (d) | Less than $0.005 per share. |
See Notes to Financial Statements.
| | |
| 64 | | Visit our website at www.prudentialfunds.com |
| | | | | | | | | | | | | | |
| Class Z | |
| Year Ended April 30, | |
| 2009(b) | | | 2008 | | | 2007(b) | | | 2006(b) | |
| | | | | | | | | | | | | | |
| $ | 9.81 | | | $ | 10.52 | | | $ | 10.31 | | | $ | 10.32 | |
| | | | | | | | | | | | | | | |
| | | | | | | | | | | | | | |
| | .57 | | | | .53 | | | | .55 | | | | .56 | |
| | (1.33 | ) | | | (.72 | ) | | | .19 | | | | (.06 | ) |
| | | | | | | | | | | | | | | |
| | (.76 | ) | | | (.19 | ) | | | .74 | | | | .50 | |
| | | | | | | | | | | | | | | |
| | | | | | | | | | | | | | |
| | (.55 | ) | | | (.52 | ) | | | (.53 | ) | | | (.51 | ) |
| | | | | | | | | | | | | | | |
| | — | | | | — | | | | — | | | | — | |
| | | | | | | | | | | | | | | |
| $ | 8.50 | | | $ | 9.81 | | | $ | 10.52 | | | $ | 10.31 | |
| | | | | | | | | | | | | | | |
| | (7.81 | )% | | | (1.86 | )% | | | 7.21 | % | | | 5.08 | % |
| | | | | | | | | | | | | | |
| $ | 19,842 | | | $ | 10,037 | | | $ | 9,878 | | | $ | 8,547 | |
| $ | 12,544 | | | $ | 9,246 | | | $ | 9,335 | | | $ | 10,650 | |
| | | | | | | | | | | | | | |
| | .62 | %(c) | | | .62 | %(c) | | | .64 | %(c) | | | .62 | % |
| | .62 | %(c) | | | .62 | %(c) | | | .64 | %(c) | | | .62 | % |
| | 6.50 | % | | | 5.22 | % | | | 5.25 | % | | | 5.39 | % |
See Notes to Financial Statements.
| | |
| Prudential Muni High Income Fund | | 65 |
Report of Independent Registered Public Accounting Firm
The Board of Trustees and Shareholders
Prudential Investment Portfolios 4:
We have audited the accompanying statement of assets and liabilities of the Prudential Muni High Income Fund of Prudential Investment Portfolios 4 (formerly Dryden Municipal Bond Fund) (hereafter referred to as the “Fund”), including the portfolio of investments, as of April 30, 2010, and the related statement of operations for the year then ended, the statement of changes in net assets for each of the years in the two-year period then ended and the financial highlights for each of the years in the five-year period then ended. These financial statements and financial highlights are the responsibility of the Fund’s management. Our responsibility is to express an opinion on these financial statements and financial highlights based on our audit.
We conducted our audits in accordance with the standards of the Public Company Accounting Oversight Board (United States). Those standards require that we plan and perform the audit to obtain reasonable assurance about whether the financial statements and financial highlights are free of material misstatement. An audit includes examining, on a test basis, evidence supporting the amounts and disclosures in the financial statements. Our procedures included confirmation of securities owned as of April 30, 2010, by correspondence with the custodian, transfer agent and brokers or by other appropriate auditing procedures when replies from brokers were not received. An audit also includes assessing the accounting principles used and significant estimates made by management, as well as evaluating the overall financial statement presentation. We believe that our audits provide a reasonable basis for our opinion.
In our opinion, the financial statements and financial highlights referred to above present fairly, in all material respects, the financial position of the Fund as of April 30, 2010, and the results of its operations for the year then ended, the changes in its net assets for each of the years in the two-year period then ended and the financial highlights for each of the years in the five-year period then ended, in conformity with U.S. generally accepted accounting principles.
New York, New York
June 24, 2010
| | |
| 66 | | Visit our website at www.prudentialfunds.com |
Tax Information
(Unaudited)
We are required by the Internal Revenue Code of 1986, as amended (the “Code”), to advise you within 60 days of the Fund’s fiscal year end (April 30, 2010) as to the federal tax status of dividends paid by the Fund during such fiscal year.
During the fiscal year ended April 30, 2010, the Fund designates the maximum amount allowable per share but not less than the following amounts as exempt-interest dividends in accordance with Section 852(b)(5) of the Internal Revenue Code:
| | | | | | | | | | | | |
| | | Dividends per share |
| | | Class A | | Class B | | Class C | | Class Z |
| | | | |
Tax-Exempt Income | | $ | .5110 | | $ | .4895 | | $ | .4685 | | $ | .5357 |
| | | | | | | | | | | | |
In January 2011, you will be advised on IRS Form 1099 DIV and/or 1099 INT, if applicable, or substitute forms as to the federal tax status of the dividends received in calendar year 2010. In addition, you will be advised at that time as to the portion of your dividends which may be subject to the Alternative Minimum Tax (AMT) as well as information with respect to state taxability.
For more detailed information regarding your state and local taxes, you should contact your tax adviser or the state/local taxing authorities.
| | |
| Prudential Muni High Income Fund | | 67 |
Results of Proxy Voting
(Unaudited)
At a special meeting of shareholders held on March 9, 2010, Fund shareholders approved a proposal to elect Trustees.
The individuals listed in the table below were elected as trustees of the Fund. All trustees, with the exception of Mr. Benjamin, served as trustees to the Fund prior to the shareholder meeting.
| | | | |
Trustee | | For | | Withheld |
Kevin J. Bannon | | 48,460,286.520 | | 786,744.052 |
| | |
Linda W. Bynoe | | 48,423,901.064 | | 823,129.508 |
| | |
Michael S. Hyland | | 48,434,176.662 | | 812,853.910 |
| | |
Douglas H. McCorkindale | | 48,350,114.747 | | 896,915.825 |
| | |
Stephen P. Munn | | 48,403,120.796 | | 843,909.776 |
| | |
Richard A. Redeker | | 48,410,748.488 | | 836,282.084 |
| | |
Robin B. Smith | | 48,431,916.442 | | 815,114.130 |
| | |
Stephen G. Stoneburn | | 48,414,451.984 | | 832,578.588 |
| | |
Judy A. Rice | | 48,412,899.212 | | 834,131.360 |
| | |
Scott E. Benjamin | | 48,438,818.263 | | 808,212.309 |
| | |
| 68 | | Visit our website at www.prudentialfunds.com |
MANAGEMENT OF THE FUND
(Unaudited)
Information about Fund Directors/Trustees (referred to herein as “Board Members”) and Fund Officers is set forth below. Board Members who are not deemed to be “interested persons,” as defined in the 1940 Act, are referred to as “Independent Board Members.” Board Members who are deemed to be “interested persons” are referred to as “Interested Board Members.” The Board Members are responsible for the overall supervision of the operations of the Fund and perform the various duties imposed on the directors or trustees of investment companies by the 1940 Act.
| | | | | | | | |
Independent Board Members (1) |
Name, Address, Age
Position(s) Portfolios
Overseen | | | | Principal Occupation(s) During Past Five Years | | | | Other Directorships Held |
Kevin J. Bannon (57) Board Member Portfolios Overseen: 56 | | | | Managing Director (since April 2008) and Chief Investment Officer (since October 2008) of Highmount Capital LLC (registered investment adviser); formerly Executive Vice President and Chief Investment Officer (April 1993-August 2007) of Bank of New York Company; President (May 2003-May 2007) of BNY Hamilton Family of Mutual Funds. | | | | Director of Urstadt Biddle Properties (since September 2008). |
Linda W. Bynoe (57) Board Member Portfolios Overseen: 56 | | | | President and Chief Executive Officer (since March 1995) and formerly Chief Operating Officer (December 1989- February 1995) of Telemat Ltd. (management consulting); formerly Vice President (January 1985-June 1989) at Morgan Stanley & Co (broker-dealer). | | | | Director of Simon Property Group, Inc. (retail real estate) (since May 2003); Anixter International, Inc. (communication products distributor) (since January 2006); Director of Northern Trust Corporation (financial services) (since April 2006); Trustee of Equity Residential (residential real estate) (since December 2009); formerly Director of Dynegy Inc. (power generation) (September 2002-May 2006), CitiStreet Funds, Inc. (mutual funds) (May 1993-February 2005), AM- CH, Inc. (restaurant holding company) (November 2004-February 2005). |
Michael S. Hyland, CFA (64) Board Member Portfolios Overseen: 56 | | | | Independent Consultant (since February 2005); formerly Senior Managing Director (July 2001-February 2005) of Bear Stearns & Co, Inc.; Global Partner, INVESCO (1999-2001); Managing Director and President of Salomon Brothers Asset Management (1989-1999). | | | | None. |
| | | | |
| | | | Prudential Muni High Income Fund |
| | | | | | | | |
Douglas H. McCorkindale (70) Board Member Portfolios Overseen: 56 | | | | Formerly Chairman (February 2001-June 2006), Chief Executive Officer (June 2000-July 2005), President (September 1997-July 2005) and Vice Chairman (March 1984-May 2000) of Gannett Co. Inc. (publishing and media). | | | | Director of Continental Airlines, Inc. (since May 1993); Director of Lockheed Martin Corp. (aerospace and defense) (since May 2001). |
Stephen P. Munn (67) Board Member Portfolios Overseen: 56 | | | | Lead Director (since 2007) and formerly Chairman (1993-2007) of Carlisle Companies Incorporated (manufacturer of industrial products). | | | | Lead Director (since 2007) of Carlisle Companies Incorporated (manufacturer of industrial products). |
Richard A. Redeker (66) Board Member Portfolios Overseen: 56 | | | | Retired Mutual Fund Senior Executive (42 years); Management Consultant; Independent Directors Council (organization of 2,800 Independent Mutual Fund Directors)-Executive Committee, Chair of Policy Steering Committee, Governing Council. | | | | None. |
Robin B. Smith (70) Board Member & Independent Chair Portfolios Overseen: 56 | | | | Chairman of the Board (since January 2003) of Publishers Clearing House (direct marketing); formerly Chairman and Chief Executive Officer (August 1996-January 2003) of Publishers Clearing House. | | | | Formerly Director of BellSouth Corporation (telecommunications) (1992-2006). |
Stephen G. Stoneburn (66) Board Member Portfolios Overseen: 56 | | | | President and Chief Executive Officer (since June 1996) of Quadrant Media Corp. (publishing company); formerly President (June 1995-June 1996) of Argus Integrated Media, Inc.; Senior Vice President and Managing Director (January 1993-1995) of Cowles Business Media; Senior Vice President of Fairchild Publications, Inc (1975-1989). | | | | None. |
| | |
| Visit our website at www.prudentialfunds.com | | |
| | | | | | | | |
Interested Board Members (1) | | | | | | | | |
Judy A. Rice (62) Board Member & President Portfolios Overseen: 56 | | | | President, Chief Executive Officer, Chief Operating Officer and Officer-In-Charge (since February 2003) of Prudential Investments LLC; President, Chief Executive Officer and Officer-In-Charge (since April 2003) of Prudential Mutual Fund Services LLC; Executive Vice President (since December 2008) of Prudential Investment Management Services LLC; formerly Vice President (February 1999-April 2006) of Prudential Investment Management Services LLC; formerly President, Chief Executive Officer, Chief Operating Officer and Officer- In-Charge (May 2003-June 2005) and Director (May 2003-March 2006) and Executive Vice President (June 2005-March 2006) of AST Investment Services, Inc.; Member of Board of Governors of the Investment Company Institute. | | | | None. |
Scott E. Benjamin (37) Board Member & Vice President Portfolios Overseen: 56 | | | | Executive Vice President (since June 2009) of Prudential Investments LLC and Prudential Investment Management Services LLC; Senior Vice President of Product Development and Marketing, Prudential Investments (since February 2006); Vice President of Product Development and Product Management, Prudential Investments (2003-2006). | | | | None. |
(1) The year that each Board Member joined the Funds’ Board is as follows:
Kevin J. Bannon, 2008; Linda W. Bynoe, 2005; Michael S. Hyland, 2008; Douglas H. McCorkindale, 2003; Stephen P. Munn, 2008; Richard A. Redeker; 1993; Robin B. Smith, 2003; Stephen G. Stoneburn, 2003; Judy A Rice, Board Member since 2000 and President since 2003; Scott E. Benjamin, Board Member since 2010 and Vice President since 2009.
| | | | |
| | | | Prudential Muni High Income Fund |
| | |
Fund Officers (a)(1) | | |
Name, Address and Age Position
with Fund | | Principal Occupation(s) During Past Five Years |
Kathryn L. Quirk (57) Chief Legal Officer | | Vice President and Corporate Counsel (since September 2004) of Prudential; Executive Vice President, Chief Legal Officer and Secretary (since July 2005) of PI and Prudential Mutual Fund Services LLC; Vice President and Corporate Counsel (since June 2005) and Secretary (since February 2006) of AST Investment Services, Inc.; formerly Senior Vice President and Assistant Secretary (November 2004-August 2005) of PI; formerly Assistant Secretary (June 2005-February 2006) of AST Investment Services, Inc.; formerly Managing Director, General Counsel, Chief Compliance Officer, Chief Risk Officer and Corporate Secretary (1997-2002) of Zurich Scudder Investments, Inc. |
Deborah A. Docs (52) Secretary | | Vice President and Corporate Counsel (since January 2001) of Prudential; Vice President (since December 1996) and Assistant Secretary (since March 1999) of PI; formerly Vice President and Assistant Secretary (May 2003-June 2005) of AST Investment Services, Inc. |
Jonathan D. Shain (51) Assistant Secretary | | Vice President and Corporate Counsel (since August 1998) of Prudential; Vice President and Assistant Secretary (since May 2001) of PI; Vice President and Assistant Secretary (since February 2001) of PMFS; formerly Vice President and Assistant Secretary (May 2003-June 2005) of AST Investment Services, Inc. |
Claudia DiGiacomo (35) Assistant Secretary | | Vice President and Corporate Counsel (since January 2005) of Prudential; Vice President and Assistant Secretary of PI (since December 2005); Associate at Sidley Austin Brown & Wood LLP (1999-2004). |
John P. Schwartz (39) Assistant Secretary | | Vice President and Corporate Counsel (since April 2005) of Prudential; Vice President and Assistant Secretary of PI (since December 2005); Associate at Sidley Austin Brown & Wood LLP (1997-2005). |
Andrew R. French (47) Assistant Secretary | | Vice President and Corporate Counsel (since February 2010) of Prudential; formerly Director and Corporate Counsel (2006-2010) of Prudential; Vice President and Assistant Secretary (since January 2007) of PI; Vice President and Assistant Secretary (since January 2007) of PMFS; formerly Senior Legal Analyst of Prudential Mutual Fund Law Department (1997-2006). |
Timothy J. Knierim (51) Chief Compliance Officer | | Chief Compliance Officer of Prudential Investment Management, Inc. (since July 2007); formerly Chief Risk Officer of PIM and PI (2002-2007) and formerly Chief Ethics Officer of PIM and PI (2006-2007). |
Valerie M. Simpson (51) Deputy Chief Compliance Officer | | Chief Compliance Officer (since April 2007) of PI and AST Investment Services, Inc.; formerly Vice President-Financial Reporting (June 1999-March 2006) for Prudential Life and Annuities Finance. |
Theresa C. Thompson (47) Deputy Chief Compliance Officer | | Vice President, Compliance, PI (since April 2004); and Director, Compliance, PI (2001-2004). |
| | |
| Visit our website at www.prudentialfunds.com | | |
| | |
Noreen M. Fierro (45) Anti-Money Laundering Compliance Officer | | Vice President, Corporate Compliance (since May 2006) of Prudential; formerly Corporate Vice President, Associate General Counsel (April 2002-May 2005) of UBS Financial Services, Inc., in their Money Laundering Prevention Group; Senior Manager (May 2005-May 2006) of Deloitte Financial Advisory Services, LLP, in their Forensic and Dispute Services, Anti-Money Laundering Group. |
Grace C. Torres (50) Treasurer and Principal Financial and Accounting Officer | | Assistant Treasurer (since March 1999) and Senior Vice President (since September 1999) of PI; Assistant Treasurer (since May 2003) and Vice President (since June 2005) of AST Investment Services, Inc.; Senior Vice President and Assistant Treasurer (since May 2003) of Prudential Annuities Advisory Services, Inc.; formerly Senior Vice President (May 2003-June 2005) of AST Investment Services, Inc. |
M. Sadiq Peshimam (46) Assistant Treasurer | | Vice President (since 2005) of Prudential Investments LLC. |
Peter Parrella (51) Assistant Treasurer | | Vice President (since 2007) and Director (2004-2007) within Prudential Mutual Fund Administration; formerly Tax Manager at SSB Citi Fund Management LLC (1997-2004). |
(a) Excludes Ms. Rice and Mr. Benjamin, interested Board Members who also serve as President and Vice President, respectively.
(1) The year that each individual became an officer of the Fund is as follows:
Kathryn L. Quirk, 2005; Deborah A. Docs, 1996; Jonathan D. Shain, 2004; Claudia DiGiacomo, 2005; John P. Schwartz, 2006; Andrew R. French, 2006; Timothy Knierim, 2007; Valerie M. Simpson, 2007; Theresa C. Thompson, 2008; Noreen M. Fierro, 2006; Grace C. Torres, 1996, M. Sadiq Peshimam, 2006; Peter Parrella, 2007.
Explanatory Notes
° Board Members are deemed to be “Interested,” as defined in the 1940 Act, by reason of their affiliation with Prudential Investments LLC and/or an affiliate of Prudential Investments LLC.
° Unless otherwise noted, the address of all Board Members and Officers is c/o Prudential Investments LLC, Gateway Center Three, 100 Mulberry Street, Newark, New Jersey 07102.
° There is no set term of office for Board Members or Officers. The Board Members have adopted a retirement policy, which calls for the retirement of Board Members on December 31st of the year in which they reach the age of 75.
° “Other Directorships Held” includes only directorships of companies required to register or file reports with the SEC under the Securities Exchange Act of 1934 (that is, “public companies”) or other investment companies registered under the 1940 Act.
° “Portfolios Overseen” includes all investment companies managed by Prudential Investments LLC. The investment companies for which PI serves as manager include the Prudential Investments Mutual Funds, The Prudential Variable Contract Accounts, Target Mutual Funds, The Prudential Series Fund, Prudential’s Gibraltar Fund, Inc. and the Advanced Series Trust.
| | | | |
| | | | Prudential Muni High Income Fund |
| | | | |
| n MAIL | | n TELEPHONE | | n WEBSITE |
Gateway Center Three 100 Mulberry Street Newark, NJ 07102 | | (800) 225-1852 | | www.prudentialfunds.com |
|
| PROXY VOTING |
| The Board of Trustees of the Fund has delegated to the Fund’s investment subadviser the responsibility for voting any proxies and maintaining proxy recordkeeping with respect to the Fund. A description of these proxy voting policies and procedures is available without charge, upon request, by calling (800) 225-1852 or by visiting the Securities and Exchange Commission’s website at www.sec.gov. Information regarding how the Fund voted proxies relating to portfolio securities during the most recent 12-month period ended June 30 is available on the Fund’s website and on the Commission’s website. |
|
| TRUSTEES |
| Kevin J. Bannon • Scott E. Benjamin • Linda W. Bynoe • Michael S. Hyland • Douglas H. McCorkindale • Stephen P. Munn • Richard A. Redeker • Judy A. Rice • Robin B. Smith • Stephen G. Stoneburn |
|
| OFFICERS |
| Judy A. Rice, President • Scott E. Benjamin, Vice President • Grace C. Torres, Treasurer and Principal Financial and Accounting Officer • Kathryn L. Quirk, Chief Legal Officer • Deborah A. Docs, Secretary • Timothy J. Knierim, Chief Compliance Officer • Valerie M. Simpson, Deputy Chief Compliance Officer • Theresa C. Thompson, Deputy Chief Compliance Officer • Noreen M. Fierro, Anti-Money Laundering Compliance Officer • Jonathan D. Shain, Assistant Secretary • Claudia DiGiacomo, Assistant Secretary • John P. Schwartz, Assistant Secretary • Andrew R. French, Assistant Secretary • M. Sadiq Peshimam, Assistant Treasurer • Peter Parrella, Assistant Treasurer |
| | | | |
| MANAGER | | Prudential Investments LLC | | Gateway Center Three
100 Mulberry Street
Newark, NJ 07102 |
|
| INVESTMENT SUBADVISER | | Prudential Investment
Management, Inc. | | Gateway Center Two
100 Mulberry Street
Newark, NJ 07102 |
|
| DISTRIBUTOR | | Prudential Investment
Management Services LLC | | Gateway Center Three
100 Mulberry Street
Newark, NJ 07102 |
|
| CUSTODIAN | | The Bank of New York Mellon | | One Wall Street
New York, NY 10286 |
|
| TRANSFER AGENT | | Prudential Mutual Fund
Services LLC | | PO Box 9658
Providence, RI 02940 |
|
INDEPENDENT REGISTERED
PUBLIC ACCOUNTING FIRM | | KPMG LLP | | 345 Park Avenue
New York, NY 10154 |
|
| FUND COUNSEL | | Willkie Farr & Gallagher LLP | | 787 Seventh Avenue
New York, NY 10019 |
|
| An investor should consider the investment objectives, risks, charges, and expenses of the Fund carefully before investing. The prospectus for the Fund contains this and other information about the Fund. An investor may obtain a prospectus by visiting our website at www.prudentialfunds.com or by calling (800) 225-1852. The prospectus should be read carefully before investing. |
|
| E-DELIVERY |
To receive your mutual fund documents online, go to www.prudentialfunds.com/edelivery
and enroll. Instead of receiving printed documents by mail, you will receive notification via e-mail when new materials are available. You can cancel your enrollment or change your e-mail address at any time by visiting the website address above. |
|
| SHAREHOLDER COMMUNICATIONS WITH TRUSTEES |
| Shareholders can communicate directly with the Board of Trustees by writing to the Chair of the Board, Prudential Muni High Income Fund, Prudential Investments, Attn: Board of Trustees, 100 Mulberry Street, Gateway Center Three, Newark, NJ 07102. Shareholders can communicate directly with an individual Trustee by writing to the same address. Communications are not screened before being delivered to the addressee. |
|
| AVAILABILITY OF PORTFOLIO SCHEDULE |
| The Fund files its complete schedule of portfolio holdings with the Securities and Exchange Commission for the first and third quarters of each fiscal year on Form N-Q. The Fund’s Forms N-Q are available on the Commission’s website at www.sec.gov. The Fund’s Forms N-Q may also be reviewed and copied at the Commission’s Public Reference Room in Washington, D.C. Information on the operation and location of the Public Reference Room may be obtained by calling (202) 551-8090. The Fund’s schedule of portfolio holdings is also available on the Fund’s website as of the end of each fiscal quarter. |
|
| The Fund’s Statement of Additional Information contains additional information about the Fund’s Trustees and is available without charge, upon request, by calling (800) 225-1852. |
Mutual Funds:
| | | | |
| ARE NOT INSURED BY THE FDIC OR ANY FEDERAL GOVERNMENT AGENCY | | MAY LOSE VALUE | | ARE NOT A DEPOSIT OF OR GUARANTEED BY ANY BANK OR ANY BANK AFFILIATE |

| | | | | | | | | | | | |
| | | Prudential Muni High Income Fund |
| | | Share Class | | A | | B | | C | | Z | | |
| | NASDAQ | | PRHAX | | PMHYX | | PHICX | | PHIZX | | |
| | CUSIP | | 7440M104 | | 7440M203 | | 7440M302 | | 7440M401 | | |
| | | | | | | | | | | | |
MF133E 0181264-00001-00
Item 2 – Code of Ethics – See Exhibit (a)
As of the end of the period covered by this report, the registrant has adopted a code of ethics (the “Section 406 Standards for Investment Companies – Ethical Standards for Principal Executive and Financial Officers”) that applies to the registrant’s Principal Executive Officer and Principal Financial Officer; the registrant’s Principal Financial Officer also serves as the Principal Accounting Officer.
The registrant hereby undertakes to provide any person, without charge, upon request, a copy of the code of ethics. To request a copy of the code of ethics, contact the registrant 800-225-1852, and ask for a copy of the Section 406 Standards for Investment Companies - Ethical Standards for Principal Executive and Financial Officers.
Item 3 – Audit Committee Financial Expert –
The registrant’s Board has determined that Mr. Stephen P. Munn, member of the Board’s Audit Committee is an “audit committee financial expert,” and that he is “independent,” for purposes of this Item.
Item 4 – Principal Accountant Fees and Services –
(a) Audit Fees
For the fiscal years ended April 30, 2010 and April 30, 2009, KPMG LLP (“KPMG”), the Registrant’s principal accountant, billed the Registrant $32,000 and $46,366, respectively, for professional services rendered for the audit of the Registrant’s annual financial statements or services that are normally provided in connection with statutory and regulatory filings.
(b) Audit-Related Fees
Not applicable for the fiscal year ended April 30, 2010. During the fiscal year ended April 30, 2009 KPMG, the Registrant’s principal accountant, billed the Registrant $3,115 for professional services rendered in connection with agreed upon procedures performed related to a custody conversion.
(c) Tax Fees
None.
(d) All Other Fees
None.
(e) (1) Audit Committee Pre-Approval Policies and Procedures
THE PRUDENTIAL MUTUAL FUNDS
AUDIT COMMITTEE POLICY
on
Pre-Approval of Services Provided by the Independent Accountants
The Audit Committee of each Prudential Mutual Fund is charged with the responsibility to monitor the independence of the Fund’s independent accountants. As part of this responsibility, the Audit Committee must pre-approve any independent accounting firm’s engagement to render audit and/or permissible non-audit services, as required by law. In evaluating a proposed engagement of the independent accountants, the Audit Committee will assess the effect that the engagement might reasonably be expected to have on the accountant’s independence. The Committee’s evaluation will be based on:
| | • | | a review of the nature of the professional services expected to be provided, |
| | • | | a review of the safeguards put into place by the accounting firm to safeguard independence, and |
| | • | | periodic meetings with the accounting firm. |
Policy for Audit and Non-Audit Services Provided to the Funds
On an annual basis, the scope of audits for each Fund, audit fees and expenses, and audit-related and non-audit services (and fees proposed in respect thereof) proposed to be performed by the Fund’s independent accountants will be presented by the Treasurer and the independent accountants to the Audit Committee for review and, as appropriate, approval prior to the initiation of such services. Such presentation shall be accompanied by confirmation by both the Treasurer and the independent accountants that the proposed services will not adversely affect the independence of the independent accountants. Proposed services shall be described in sufficient detail to enable the Audit Committee to assess the appropriateness of such services and fees, and the compatibility of the provision of such services with the auditor’s independence. The Committee shall receive periodic reports on the progress of the audit and other services which are approved by the Committee or by the Committee Chair pursuant to authority delegated in this Policy.
The categories of services enumerated under “Audit Services”, “Audit-related Services”, and “Tax Services” are intended to provide guidance to the Treasurer and the independent accountants as to those categories of services which the Committee believes are generally consistent with the independence of the independent accountants and which the Committee (or the Committee Chair) would expect upon the presentation of specific proposals to pre-approve. The enumerated categories are not intended as an exclusive list of audit, audit-related or tax services, which the Committee (or the Committee Chair) would consider for pre-approval.
Audit Services
The following categories of audit services are considered to be consistent with the role of the Fund’s independent accountants:
| | • | | Annual Fund financial statement audits |
| | • | | Seed audits (related to new product filings, as required) |
| | • | | SEC and regulatory filings and consents |
Audit-related Services
The following categories of audit-related services are considered to be consistent with the role of the Fund’s independent accountants:
| | • | | Accounting consultations |
| | • | | Fund merger support services |
| | • | | Agreed Upon Procedure Reports |
| | • | | Other Internal Control Reports |
Individual audit-related services that fall within one of these categories and are not presented to the Audit Committee as part of the annual pre-approval process will be subject to pre-approval by the Committee Chair (or any other Committee member on whom this responsibility has been delegated) so long as the estimated fee for those services does not exceed $50,000.
Tax Services
The following categories of tax services are considered to be consistent with the role of the Fund’s independent accountants:
| | • | | Tax compliance services related to the filing or amendment of the following: |
| | • | | Federal, state and local income tax compliance; and, |
| | • | | Sales and use tax compliance |
| | • | | Timely RIC qualification reviews |
| | • | | Tax distribution analysis and planning |
| | • | | Tax authority examination services |
| | • | | Tax appeals support services |
| | • | | Accounting methods studies |
| | • | | Fund merger support services |
| | • | | Tax consulting services and related projects |
Individual tax services that fall within one of these categories and are not presented to the Audit Committee as part of the annual pre-approval process will be subject to pre-approval by the Committee Chair (or any other Committee member on whom this responsibility has been delegated) so long as the estimated fee for those services does not exceed $50,000.
Other Non-audit Services
Certain non-audit services that the independent accountants are legally permitted to render will be subject to pre-approval by the Committee or by one or more Committee members to whom the Committee has delegated this authority and who will report to the full Committee any pre-approval
decisions made pursuant to this Policy. Non-audit services presented for pre-approval pursuant to this paragraph will be accompanied by a confirmation from both the Treasurer and the independent accountants that the proposed services will not adversely affect the independence of the independent accountants.
Proscribed Services
The Fund’s independent accountants will not render services in the following categories of non-audit services:
| | • | | Bookkeeping or other services related to the accounting records or financial statements of the Fund |
| | • | | Financial information systems design and implementation |
| | • | | Appraisal or valuation services, fairness opinions, or contribution-in-kind reports |
| | • | | Internal audit outsourcing services |
| | • | | Management functions or human resources |
| | • | | Broker or dealer, investment adviser, or investment banking services |
| | • | | Legal services and expert services unrelated to the audit |
| | • | | Any other service that the Public Company Accounting Oversight Board determines, by regulation, is impermissible. |
Pre-approval of Non-Audit Services Provided to Other Entities Within the Prudential Fund Complex
Certain non-audit services provided to Prudential Investments LLC or any of its affiliates that also provide ongoing services to the Prudential Mutual Funds will be subject to pre-approval by the Audit Committee. The only non-audit services provided to these entities that will require pre-approval are those related directly to the operations and financial reporting of the Funds. Individual projects that are not presented to the Audit Committee as part of the annual pre-approval process will be subject to pre-approval by the Committee Chair (or any other Committee member on whom this responsibility has been delegated) so long as the estimated fee for those services does not exceed $50,000. Services presented for pre-approval pursuant to this paragraph will be accompanied by a confirmation from both the Treasurer and the independent accountants that the proposed services will not adversely affect the independence of the independent accountants.
Although the Audit Committee will not pre-approve all services provided to Prudential Investments LLC and its affiliates, the Committee will receive an annual report from the Fund’s independent accounting firm showing the aggregate fees for all services provided to Prudential Investments and its affiliates.
(e) (2) Percentage of services referred to in 4(b) – 4(d) that were approved by the audit committee –
One hundred percent of the services described in Item 4(b) was approved by the audit committee.
(f) Percentage of hours expended attributable to work performed by other than full time employees of principal accountant if greater than 50%.
The percentage of hours expended on the principal accountant’s engagement to audit the registrant’s financial statements for the most recent fiscal year that were attributed to work performed by persons other than the principal accountant’s full-time, permanent employees was 0%.
(g) Non-Audit Fees
Not applicable to Registrant for the fiscal years 2010 and 2009. The aggregate non-audit fees billed by KPMG for services rendered to the registrant’s investment adviser and any entity controlling, controlled by, or under common control with the investment adviser that provides ongoing services to the registrant for the fiscal years 2010 and 2009 was $0 and $0, respectively.
(h) Principal Accountant’s Independence
Not applicable as KPMG has not provided non-audit services to the registrant’s investment adviser and any entity controlling, controlled by, or under common control with the investment adviser that provides ongoing services to the registrant that were not pre-approved pursuant to Rule 2-01(c)(7)(ii) of Regulation S-X.
Item 5 – Audit Committee of Listed Registrants – Not applicable.
Item 6 – Schedule of Investments – The schedule is included as part of the report to shareholders filed under Item 1 of this Form.
Item 7 – Disclosure of Proxy Voting Policies and Procedures for Closed-End Management Investment Companies – Not applicable.
Item 8 – Portfolio Managers of Closed-End Management Investment Companies – Not applicable.
Item 9 – Purchases of Equity Securities by Closed-End Management Investment Company and Affiliated Purchasers – Not applicable.
Item 10 – Submission of Matters to a Vote of Security Holders – Not applicable.
Item 11 – Controls and Procedures
| | (a) | It is the conclusion of the registrant’s principal executive officer and principal financial officer that the effectiveness of the registrant’s current disclosure controls and procedures (such disclosure controls and procedures having been evaluated within 90 days of the date of this filing) provide reasonable assurance that the information required to be disclosed by the registrant has been recorded, processed, summarized and reported within the time period specified in the Commission’s rules and forms and that the information required to be disclosed by the registrant has been accumulated and communicated to the registrant’s principal executive officer and principal financial officer in order to allow timely decisions regarding required disclosure. |
| | (b) | There has been no significant change in the registrant’s internal control over financial reporting that occurred during the registrant’s most recent fiscal quarter of the period covered by this report that has materially affected, or is likely to materially affect, the registrant’s internal control over financial reporting. |
Item 12 – Exhibits
| | (a) | (1) Code of Ethics – Attached hereto as Exhibit EX-99.CODE-ETH |
| | (2) | Certifications pursuant to Section 302 of the Sarbanes-Oxley Act – Attached hereto as Exhibit EX-99.CERT. |
| | (3) | Any written solicitation to purchase securities under Rule 23c-1. – Not applicable. |
| | (b) | Certifications pursuant to Section 906 of the Sarbanes-Oxley Act – Attached hereto as Exhibit EX-99.906CERT. |
SIGNATURES
Pursuant to the requirements of the Securities Exchange Act of 1934 and the Investment Company Act of 1940, the registrant has duly caused this report to be signed on its behalf by the undersigned, thereunto duly authorized.
| | |
| Registrant: Prudential Investment Portfolios 4 |
| |
| By: | | /S/ DEBORAH A. DOCS |
| | Deborah A. Docs |
| | Secretary |
|
| Date: June 24, 2010 |
Pursuant to the requirements of the Securities Exchange Act of 1934 and the Investment Company Act of 1940, this report has been signed below by the following persons on behalf of the registrant and in the capacities and on the dates indicated.
| | |
| By: | | /S/ JUDY A. RICE |
| | Judy A. Rice |
| | President and Principal Executive Officer |
|
| Date: June 24, 2010 |
| |
| By: | | /S/ GRACE C. TORRES |
| | Grace C. Torres |
| | Treasurer and Principal Financial Officer |
|
| Date: June 24, 2010 |