UNITED STATES
SECURITIES AND EXCHANGE COMMISSION
Washington, D.C. 20549
FORM N-CSR
CERTIFIED SHAREHOLDER REPORT OF REGISTERED
MANAGEMENT INVESTMENT COMPANIES
| | |
| Investment Company Act file number: | | 811-04930 |
| |
| Exact name of registrant as specified in charter: | | Dryden Municipal Bond Fund |
| |
| Address of principal executive offices: | | Gateway Center 3, |
| | 100 Mulberry Street, |
| | Newark, New Jersey 07102 |
| |
| Name and address of agent for service: | | Deborah A. Docs |
| | Gateway Center 3, |
| | 100 Mulberry Street, |
| | Newark, New Jersey 07102 |
| |
| Registrant’s telephone number, including area code: | | 800-225-1852 |
| |
| Date of fiscal year end: | | 4/30/2009 |
| |
| Date of reporting period: | | 4/30/2009 |
Item 1 – Reports to Stockholders


| | |
| APRIL 30, 2009 | | ANNUAL REPORT |
Dryden Municipal Bond Fund/
High Income Series
FUND TYPE
Municipal bond
OBJECTIVE
Maximum amount of income that is eligible for exclusion from federal income taxes
This report is not authorized for distribution to prospective investors unless preceded or accompanied by a current prospectus.
The views expressed in this report and information about the Fund’s portfolio holdings are for the period covered by this report and are subject to change thereafter.
JennisonDryden, Dryden, Prudential Financial and the Rock Prudential logo are registered service marks of The Prudential Insurance Company of America, Newark, NJ, and its affiliates.

June 15, 2009
Dear Shareholder:
We hope you find the annual report for the Dryden Municipal Bond Fund informative and useful. Because of ongoing market volatility, we understand that this is a difficult time to be an investor. While it is impossible to predict what the future holds, we continue to believe a prudent response to uncertainty is to maintain a diversified portfolio, including stock and bond mutual funds consistent with your tolerance for risk, time horizon, and financial goals.
A diversified asset allocation offers two potential advantages: it limits your exposure to any particular asset class, plus it provides a better opportunity to invest some of your assets in the right place at the right time. Your financial professional can help you create a diversified investment plan that may include mutual funds covering all the basic asset classes and that reflects your personal investor profile and risk tolerance. Keep in mind that diversification and asset allocation strategies do not assure a profit or protect against loss in declining markets.
JennisonDryden Mutual Funds give you a wide range of choices that can help you make progress toward your financial goals. Our funds offer the experience, resources, and professional discipline of four leading asset managers. JennisonDryden equity funds are advised by Jennison Associates LLC, Quantitative Management Associates LLC (QMA), or PREI® (Prudential Real Estate Investors). Prudential Investment Management, Inc. (PIM) advises the JennisonDryden fixed income and money market funds through its unit Prudential Fixed Income Management. Jennison Associates, QMA, and PIM are registered investment advisers and Prudential Financial companies. PREI is a unit of PIM.
Thank you for choosing JennisonDryden Mutual Funds.
Sincerely,

Judy A. Rice, President
Dryden Municipal Bond Fund/High Income Series
| | |
| Dryden Municipal Bond Fund | | 1 |
Your Fund’s Performance
Fund objective
The investment objective of the Dryden Municipal Bond Fund/High Income Series is to seek the maximum amount of income that is eligible for exclusion from federal income taxes. There can be no assurance that the Fund will achieve its investment objective.
Performance data quoted represent past performance. Past performance does not guarantee future results. The investment return and principal value of an investment will fluctuate, so that an investor’s shares, when redeemed, may be worth more or less than their original cost. Current performance may be lower or higher than the past performance data quoted. An investor may obtain performance data as of the most recent month-end by visiting our website at www.jennisondryden.com or by calling (800) 225-1852. The maximum initial sales charge is 4.00% (Class A shares). Gross operating expenses: Class A, 0.92%; Class B, 1.12%; Class C, 1.62%; Class Z, 0.62%. Net operating expenses apply to: Class A, 0.87%; Class B, 1.12%; Class C, 1.37%; Class Z, 0.62%, after contractual reduction through 8/31/2010.
| | | | | | | | | |
| Cumulative Total Returns as of 4/30/09 | |
| | | One Year | | | Five Years | | | Ten Years | |
Class A | | –8.08 | % | | 9.74 | % | | 29.85 | % |
Class B | | –8.19 | | | 8.40 | | | 26.78 | |
Class C | | –8.40 | | | 7.11 | | | 23.73 | |
Class Z | | –7.71 | | | 11.28 | | | 33.35 | |
Barclays Capital Muni Bond Index1 | | 3.11 | | | 22.34 | | | 59.47 | |
Barclays Capital Non-Investment-Grade Muni Bond Index2 | | –17.72 | | | 2.16 | | | 28.45 | |
Lipper Average3 | | –15.61 | | | –2.46 | | | 16.50 | |
| | | | | | | | | |
| Average Annual Total Returns4 as of 3/31/09 | |
| | | One Year | | | Five Years | | | Ten Years | |
Class A | | –13.81 | % | | 0.08 | % | | 1.96 | % |
Class B | | –14.68 | | | 0.51 | | | 2.13 | |
Class C | | –11.48 | | | 0.43 | | | 1.88 | |
Class Z | | –9.95 | | | 1.18 | | | 2.64 | |
Barclays Capital Muni Bond Index1 | | 2.27 | | | 3.21 | | | 4.60 | |
Barclays Capital Non-Investment-Grade Muni Bond Index2 | | –19.16 | | | –0.22 | | | 2.37 | |
Lipper Average3 | | –17.40 | | | –1.54 | | | 1.18 | |
| | |
| 2 | | Visit our website at www.jennisondryden.com |
| | | | | | | | | | | | |
| Distribution and Yields as of 4/30/09 | |
| | | Total Distributions
Paid for 12 Months | | 30-Day
SEC Yield | | | Taxable Equivalent Yield5
at Tax Rates of | |
| | | | | 33% | | | 35% | |
Class A | | $ | 0.52 | | 5.74 | % | | 9.05 | % | | 9.32 | % |
Class B | | | 0.50 | | 5.72 | | | 9.02 | | | 9.29 | |
Class C | | | 0.48 | | 5.47 | | | 8.62 | | | 8.89 | |
Class Z | | | 0.55 | | 6.23 | | | 9.82 | | | 10.12 | |
The cumulative total returns do not reflect the deduction of applicable sales charges. If reflected, the applicable sales charges would reduce the cumulative total returns performance quoted. The average annual total returns assume the payment of the maximum applicable sales charge. Class A shares are subject to a maximum front-end sales charge of 4.00%. Under certain circumstances, Class A shares may be subject to a contingent deferred sales charge (CDSC) of 1%. Class B and Class C shares are subject to a maximum CDSC of 5% and 1%, respectively. Class Z shares are not subject to a sales charge.
Source: Prudential Investments LLC and Lipper Inc. Performance figures may reflect fee waivers and/or expense reimbursements. In the absence of such fee waivers and/or expense reimbursements, total returns would be lower.
1The Barclays Capital Municipal (Muni) Bond Index is an unmanaged index of over 39,000 long-term investment-grade municipal bonds. It gives a broad look at how long-term investment-grade municipal bonds have performed.
2The Barclays Capital Non-Investment-Grade Municipal (Muni) Bond Index is an unmanaged index of non-rated or Ba1 or below-rated municipal bonds. It gives a broad look at how non-investment-grade municipal bonds have performed. The bonds in this index must have an outstanding par value of at least $3 million and be issued as part of a transaction of at least $20 million. The bonds must also have a dated date after December 31, 1990, and must be at least one year from their maturity date. The inception date of the Barclays Capital Non-Investment-Grade Muni Bond Index is October 1995.
3The Lipper High Yield Municipal Debt Funds Average (Lipper Average) represents returns based on an average return of all funds in the Lipper High Yield Municipal Debt Funds category for the periods noted. Funds in the Lipper Average invest at least 50% of their assets in lower-rated municipal debt issues.
4The average annual total returns take into account applicable sales charges. Class A, Class B, and Class C shares are subject to an annual distribution and service (12b-1) fee of up to 0.30%, 0.50%, and 1.00%, respectively. Approximately seven years after purchase, Class B shares will automatically convert to Class A shares on a quarterly basis. Class Z shares are not subject to a 12b-1 fee. The returns in the tables do not reflect the deduction of taxes that a shareholder would pay on Fund distributions or following the redemption of Fund shares.
5Some investors may be subject to the federal alternative minimum tax and/or state and local taxes. Taxable equivalent yields reflect federal taxes only.
Investors cannot invest directly in an index. The returns for the Barclays Capital Indexes and the Lipper Average would be lower if they included the effects of sales charges, operating expenses of a mutual fund, or taxes. Returns for the Lipper Average reflect the deduction of operating expenses, but not sales charges or taxes.
| | |
| Dryden Municipal Bond Fund | | 3 |
Your Fund’s Performance (continued)
| | | |
| Five Largest Holdings expressed as a percentage of net assets as of 4/30/09 | |
West Virginia (WV) St. Hosp. Fin. Auth. Hosp. Rev., Oak Hill Hosp., Ser. B, (Prerefunded 09/01/10),
6.75%, 09/01/30 | | 1.8 | % |
Orange Cnty. (CA) Loc. Trans. Auth. Sales Tax Rev., Linked, S.A.V.R.S, R.I.B.S., 6.20%, 02/14/11 | | 1.7 | |
Memphis (TN) Ctr. City Rev., Fin. Corp., Red Birds, Ser. B, 6.50%, 09/01/28 | | 1.7 | |
Metro Pier & Expo. (IL) Auth. Dedicated St. Tax Rev., McCormick Place Expansion, Ser. A, M.B.I.A.,
5.25%, 06/15/42 | | 1.4 | |
Gilberts (IL) Spec. Svcs. Rev., Area No. 9, Spec. Tax, Big Timber Proj. (Prerefunded 03/01/11),
7.75%, 03/01/27 | | 1.3 | |
Holdings are subject to change.
| | | |
| Credit Quality* expressed as a percentage of net assets as of 4/30/09 | |
Aaa | | 4.2 | % |
Aa | | 7.2 | |
A | | 24.9 | |
Baa | | 31.8 | |
Ba | | 5.0 | |
B | | 2.3 | |
Caa | | 1.7 | |
Not Rated | | 21.9 | |
Total Investments | | 99.0 | |
Other assets in excess of liabilities | | 1.0 | |
Net Assets | | 100.0 | % |
| | | |
*Source: Moody’s rating, defaulting to S&P when not rated by Moody’s.
Credit Quality is subject to change.
| | |
| 4 | | Visit our website at www.jennisondryden.com |
Strategy and Performance Overview
How did the Fund perform?
The Fund’s Class A shares posted an 8.08% loss for the 12 months ended April 30, 2009. This decline was less than the 15.61% drop in the Lipper High Yield Municipal Debt Funds Average and the 17.72% drop in the Barclays Capital Non-Investment-Grade Municipal Bond Index, which tracks bonds that are non-rated or rated below investment grade. Yet the Fund’s Class A shares underperformed the 3.11% positive total return of the Barclays Capital Municipal Bond Index, the Fund’s benchmark, which consists entirely of investment-grade bonds.
How is the Fund managed?
The Fund is managed by Prudential Fixed Income Management, which employs a team-based approach in which research plays a crucial role. Senior investment professionals develop a quarterly market outlook that provides an overall view on the economy, interest rates, risk levels in the major bond markets, and yield curves in the major bond markets. A yield curve shows the relationship between yields on bonds of the same quality from the shortest to the longest maturities.
The quarterly market outlook helps set broad investment strategies for the Fund. In deciding which municipal bonds to buy and sell, portfolio managers work with a team of four credit research analysts, each with more than 15 years of experience analyzing municipal bonds. Portfolio managers allocate the Fund’s investments between non-investment-grade municipal bonds that provide comparatively higher yields and investment-grade municipal bonds that are more liquid. Amid the challenging market conditions that characterized the reporting period, the Fund’s allocation shifted more in favor of investment-grade municipal bonds. This proved beneficial as investment-grade municipal bonds easily outperformed lower-quality municipal bonds for the reporting period.
How did the credit crisis affect the municipal bond market?
The tax-exempt bond market experienced unprecedented volatility during the reporting period that began May 1, 2008. A global credit crisis, which had begun in the United States during 2007, went from bad to worse in 2008. A bursting housing bubble continued to push up delinquencies and foreclosures on subprime mortgages and on higher-quality loans known as “Alternative-A” mortgages. Home sales plunged, U.S. exports shrank, personal spending tumbled, and companies laid off millions of workers. The U.S. economy, the world’s largest, continued to plummet, sinking into its longest recession since the Great Depression of the 1930s.
September of 2008 proved to be one of the most difficult months, particularly after Wall Street investment bank Lehman Brothers Holdings Inc. filed for bankruptcy
| | |
| Dryden Municipal Bond Fund | | 5 |
Strategy and Performance Overview (continued)
protection. Credit markets seized up and risk-averse investors fled to the safety and liquidity of U.S. Treasury securities, driving prices of Treasury securities higher and yields lower, as bond prices move inversely to yields. In contrast, prices of municipal bonds and other debt securities that carry greater credit risk than Treasury securities generally declined.
The sell-off in the tax-exempt market, which continued in October, November, and December of 2008, was particularly hard on municipal bonds rated below investment grade. For example, the Barclays Capital Non-Investment-Grade Municipal Bond Index declined 9.58% in October, while the Barclays Capital Municipal Bond Index only fell 1.02%. Mutual funds that invest in below investment-grade municipal bonds were forced to sell some of their holdings to meet shareholder redemptions. To make matters worse, liquidity in the municipal bond market declined after the bankruptcy of Lehman Brothers, which had been a key participant in the market.
The Federal Reserve (the Fed) and the U.S. Department of the Treasury employed aggressive and unconventional measures to counteract the destructive effects of the credit crisis. For example, the Fed repeatedly cut short-term rates to help jumpstart the nation’s economy. As a result, its target for the federal funds rate charged on overnight loans between banks declined from 2.00% in May to a range of zero to 0.25% in December 2008, a record low.
Conditions in the municipal bond market generally improved during the first four months of 2009. Tax-exempt bond prices gained in January as bondholders reinvested monies received from coupon payments and debt securities that matured. Bargain hunters seeking attractive investment opportunities helped drive prices of below investment-grade municipal bonds sharply higher during this time. Overall, below investment-grade municipal bonds posted a double-digit gain for the four-month period that easily outperformed investment-grade municipal bonds. However, despite this late rally, below investment-grade municipal bonds on the whole still ended the 12-month reporting period in negative territory.
A $787 billion economic stimulus plan signed into law in early 2009 was generally viewed as positive for the municipal bond market because it included measures to aid state governments. The plan also allows state and local governments looking to finance construction of schools, roads, and other capital projects to issue a new type of debt security called Build America Bonds, which are taxable. Build America Bonds aim to lower municipal borrowing costs by paying issuers a 35% federal rebate on the interest costs of these securities. Issuance of Build America Bonds began to cut into the amount of new debt securities issued in the tax-exempt municipal bond market.
| | |
| 6 | | Visit our website at www.jennisondryden.com |
This dwindling supply of tax-exempt municipal bonds met with strong investor demand, which helped support their prices.
How did municipal bond market sectors perform?
There was a wide variation in sector performance among investment-grade municipal bonds over the 12-month period. General obligation bonds, which are backed by the taxing authority of issuers, posted the largest gain, a 5.50% total return. Corporate-backed municipal bonds tied to pollution control or industrial development facilities posted the largest loss, a 13.16% decline. Tobacco-related bonds and hospital bonds were the other two sectors that finished in the red. The water and sewer, electric, housing, transportation, education, resource recovery, leasing, and special tax sectors all ended in the black.
All below investment-grade municipal bond sectors finished the 12-month period in negative territory. The 60.21% decline of the tobacco-related sector was the largest loss, while the 3.18% decline of the water and sewer sector was the smallest. Other sectors that posted double-digit declines included special tax, resource recovery, education, transportation, airline, housing, electric, hospital, and general obligation bonds.
What detracted most from the Fund’s return?
Bonds issued by the Memphis Center City Revenue Financing Corp. for the Memphis Redbirds, a minor league baseball team located in Tennessee, remained one of the Fund’s largest holdings. Amid continued deterioration in economic conditions in late 2008, the St. Louis Cardinals, a major league team, withdrew its letter of intent to purchase the Memphis Redbirds. This development hurt the value of the bonds, which were the largest detractor from the Fund’s return.
How did sector allocation affect performance?
The Fund continued to hold a diversified portfolio of municipal bonds drawn from various sectors of the market such as transportation and education. Healthcare remained its largest sector concentration. Healthcare bond prices rallied with the broader municipal bond market late in the reporting period, but both the investment-grade and below investment-grade healthcare sectors still finished the reporting period in negative territory, detracting from the Fund’s overall performance.
On the other hand, key components of the Fund’s sector allocation strategy proved beneficial. The Fund had underweight exposures to airline-backed and tobacco-related municipal bonds compared to an index of tax-exempt debt securities of which 50% are investment grade and 50% are below investment grade. This strategy helped the
| | |
| Dryden Municipal Bond Fund | | 7 |
Strategy and Performance Overview (continued)
Fund’s performance versus the Barclays Capital Non-Investment-Grade Municipal Bond Index and the Barclays Capital Municipal Bond Index because airline-backed and tobacco-related municipal bonds posted losses for the reporting period, even though their prices had begun to improve in 2009.
How did yield curve strategy affect performance?
The municipal bond yield curve is usually positively sloped because shorter-term bonds typically yield less than longer-term bonds. Prudential Fixed Income Management expected the municipal bond yield curve to become significantly steeper, as yields on short-term municipal bonds declined in anticipation of further cuts in short-term rates by the Fed. Therefore, early in the reporting period, it employed a “yield curve steepener” strategy in the Fund that emphasized shorter-term municipal bonds over long-term municipal bonds.
The slope of the municipal bond yield curve became significantly steeper as anticipated, benefiting the Fund. Afterwards, Prudential Fixed Income Management shifted its yield curve strategy to a more neutral stance.
What else had a significant impact on performance?
The Fund continued to maintain a considerable exposure to prerefunded municipal bonds. Bonds become prerefunded and their maturities shorten when their issuer takes advantage of a decline in yields by issuing new bonds at lower interest rates. Proceeds of the new bonds are used to purchase special federal government securities held in an escrow account. Cash flow from these securities pays interest on the prerefunded bonds until a predetermined date when the bonds are retired prior to their original maturity. This process may reduce the issuer’s costs, and the prerefunded bonds often become rated triple-A. The Fund benefited from its exposure to prerefunded bonds, which performed better than the broader municipal bond market for the reporting period.
In the difficult investment environment, avoiding municipal bonds of issuers whose financial health deteriorated was just as important as selecting municipal bonds of issuers that remained financially fit. The Fund’s performance versus the Barclays Capital Non-Investment-Grade Municipal Bond Index benefited from the portfolio managers’ decision to avoid municipal bonds that had been issued on behalf of troubled automakers Ford Motor Company and General Motors Corporation. The latter filed for bankruptcy protection after the reporting period ended. Similarly, the Fund’s relative performance benefited from the decision to avoid municipal bonds that had been issued on behalf of Smurfit Stone Container Corporation, a maker of cardboard packaging materials that declared bankruptcy in early 2009.
| | |
| 8 | | Visit our website at www.jennisondryden.com |
Fees and Expenses (Unaudited)
As a shareholder of a Fund, you incur two types of costs: (1) transaction costs, including sales charges (loads) on purchase payments and redemptions, as applicable, and (2) ongoing costs, including management fees, distribution and/or service (12b-1) fees, and other Fund expenses, as applicable. This example is intended to help you understand your ongoing costs (in dollars) of investing in each Fund and to compare these costs with the ongoing costs of investing in other mutual funds.
The example is based on an investment of $1,000 invested on November 1, 2008, at the beginning of the period, and held through the six-month period ended April 30, 2009. The example is for illustrative purposes only; you should consult the Prospectus for information on initial and subsequent minimum investment requirements.
The Fund’s transfer agent may charge additional fees to holders of certain accounts that are not included in the expenses shown in the table on the following page. These fees apply to individual retirement accounts (IRAs) and Section 403(b) accounts. As of the close of the six-month period covered by the table, IRA fees included an annual maintenance fee of $15 per account (subject to a maximum annual maintenance fee of $25 for all accounts held by the same shareholder). Section 403(b) accounts are charged an annual $25 fiduciary maintenance fee. Some of the fees may vary in amount, or may be waived, based on your total account balance or the number of JennisonDryden funds, including the Fund, that you own. You should consider the additional fees that were charged to your Fund account over the six-month period when you estimate the total ongoing expenses paid over the period and the impact of these fees on your ending account value, as these additional expenses are not reflected in the information provided in the expense table. Additional fees have the effect of reducing investment returns.
Actual Expenses
The first line for each share class in the tables on the following pages provides information about actual account values and actual expenses. You may use the information on this line, together with the amount you invested, to estimate the expenses that you paid over the period. Simply divide your account value by $1,000 (for example, an $8,600 account value ÷ $1,000 = 8.6), then multiply the result by the number on the first line under the heading “Expenses Paid During the Six-Month Period” to estimate the expenses you paid on your account during this period.
Hypothetical Example for Comparison Purposes
The second line for each share class in the tables on the following pages provides information about hypothetical account values and hypothetical expenses based on the Fund’s actual expense ratio and an assumed rate of return of 5% per year before
| | |
| Dryden Municipal Bond Fund | | 9 |
Fees and Expenses (continued)
expenses, which is not the Fund’s actual return. The hypothetical account values and expenses may not be used to estimate the actual ending account balance or expenses you paid for the period. You may use this information to compare the ongoing costs of investing in the Fund and other funds. To do so, compare this 5% hypothetical example with the 5% hypothetical examples that appear in the shareholder reports of the other funds.
Please note that the expenses shown in the tables are meant to highlight your ongoing costs only and do not reflect any transactional costs such as sales charges (loads). Therefore, the second line for each share class in the table is useful in comparing ongoing costs only and will not help you determine the relative total costs of owning different funds. In addition, if these transactional costs were included, your costs would have been higher.
| | | | | | | | | | | | | | |
Dryden Municipal Bond
Fund/High Income Series | | Beginning Account
Value
November 1, 2008 | | Ending Account
Value April 30, 2009 | | Annualized
Expense Ratio
Based on the
Six-Month Period | | | Expenses Paid
During the
Six-Month Period* |
| | | | | | | | | | | | | | |
| Class A | | Actual | | $ | 1,000.00 | | $ | 1,028.90 | | 0.84 | % | | $ | 4.23 |
| | | Hypothetical | | $ | 1,000.00 | | $ | 1,020.63 | | 0.84 | % | | $ | 4.21 |
| | | | | | | | | | | | | | |
| Class B | | Actual | | $ | 1,000.00 | | $ | 1,029.00 | | 1.09 | % | | $ | 5.48 |
| | | Hypothetical | | $ | 1,000.00 | | $ | 1,019.39 | | 1.09 | % | | $ | 5.46 |
| | | | | | | | | | | | | | |
| Class C | | Actual | | $ | 1,000.00 | | $ | 1,027.80 | | 1.34 | % | | $ | 6.74 |
| | | Hypothetical | | $ | 1,000.00 | | $ | 1,018.15 | | 1.34 | % | | $ | 6.71 |
| | | | | | | | | | | | | | |
| Class Z | | Actual | | $ | 1,000.00 | | $ | 1,031.70 | | 0.59 | % | | $ | 2.97 |
| | | Hypothetical | | $ | 1,000.00 | | $ | 1,021.87 | | 0.59 | % | | $ | 2.96 |
* Fund expenses (net of fee waivers or subsidies, if any) for each share class are equal to the annualized expense ratio for each share class (provided in the table), multiplied by the average account value over the period, multiplied by the 181 days in the six-month period ended April 30, 2009, and divided by the 365 days in the Fund’s fiscal year ended April 30, 2009 (to reflect the six-month period). Expenses presented in the table include the expenses of any underlying portfolios in which the Fund may invest.
| | |
| 10 | | Visit our website at www.jennisondryden.com |
Portfolio of Investments
as of April 30, 2009
| | | | | | | | | | | | |
| Description (a) | | Moody’s
Rating*†
(Unaudited) | | Interest
Rate | | Maturity
Date | | Principal
Amount (000) | | Value (Note 1) |
| | | | | | | | | | | | |
LONG-TERM INVESTMENTS 98.6% | | | | | | | | | | |
| | | | | |
Alabama 1.7% | | | | | | | | | | | | |
Alabama Spl. Care Facs.
Fing. Auth. Mobile Rev., Ascension Health
Sr. Credit, Ser. D | | Aa1 | | 5.00% | | 11/15/39 | | $ | 3,000 | | $ | 2,880,240 |
Camden Ind. Dev. Brd. Facs. Rev., Rfdg. Weyerhaeuser,
Ser. A (Prerefunded 12/1/13)(e) | | BBB-(b) | | 6.125 | | 12/01/24 | | | 1,000 | | | 1,176,040 |
Ser. B, A.M.T. (Prerefunded 12/1/13)(e) | | BBB-(b) | | 6.375 | | 12/01/24 | | | 1,000 | | | 1,163,120 |
Mobile Indl. Dev. Brd., AL Pwr. Co. (Mandatory put date 3/19/12) | | A2 | | 4.75 | | 06/01/34 | | | 1,000 | | | 1,026,610 |
Mobile Indl. Dev. Brd. Poll. Ctl. Rev., Paper Co. Proj. | | Baa3 | | 4.75 | | 04/01/10 | | | 1,100 | | | 1,082,741 |
| | | | | | | | | | | | |
| | | | | | | | | | | | 7,328,751 |
| | | | | |
Arizona 3.8% | | | | | | | | | | | | |
Arizona Hlth. Facs. Auth. Rev., Banner Hlth., Ser. D | | AA-(b) | | 5.50 | | 01/01/38 | | | 2,500 | | | 2,378,850 |
Coconino Cnty. Poll. Ctrl. Corp. Rev., Tucson Elec. Pwr., Navajo,
Ser. A, A.M.T. | | Baa3 | | 7.125 | | 10/01/32 | | | 5,000 | | | 4,633,900 |
Ser. B | | Baa3 | | 7.00 | | 10/01/32 | | | 1,700 | | | 1,593,427 |
Maricopa Cnty. Indl. Dev. Auth. Hlth. Facs. Rev., Catholic Hlthcare. West, Ser. A | | A2 | | 5.25 | | 07/01/32 | | | 2,500 | | | 2,193,125 |
Maricopa Cnty. Poll. Ctrl. Corp., Rev., El Paso Elec. Co., Ser. B | | Baa2 | | 7.25 | | 04/01/40 | | | 1,500 | | | 1,556,775 |
Pima Cnty. Indl. Dev. Auth. Ed. Rev., Fac.-P.L.C. Charter Schs. Proj. | | NR | | 6.75 | | 04/01/36 | | | 1,500 | | | 1,114,350 |
Pinal Cnty. Correct. Facs. Rev., Florence West Prison Proj.,
Ser. A, A.C.A. | | BBB(b) | | 5.25 | | 10/01/19 | | | 3,135 | | | 2,733,751 |
| | | | | | | | | | | | |
| | | | | | | | | | | | 16,204,178 |
See Notes to Financial Statements.
| | |
| Dryden Municipal Bond Fund | | 11 |
Portfolio of Investments
as of April 30, 2009 continued
| | | | | | | | | | | | |
| Description (a) | | Moody’s
Rating*†
(Unaudited) | | Interest
Rate | | Maturity
Date | | Principal
Amount (000) | | Value (Note 1) |
| | | | | | | | | | | | |
California 10.1% | | | | | | | | | | | | |
California Poll. Ctrl. Fin. Auth. Solid Wste. Disp. Rev., Wste. Mgmt., Inc. PJ-Ser. B, A.M.T. | | BBB(b) | | 5.00% | | 07/01/27 | | $ | 1,000 | | $ | 836,640 |
California St., G.O. | | A2 | | 6.00 | | 04/01/38 | | | 3,500 | | | 3,621,415 |
California Statewide Cmntys. Dev. Auth. Rev., Kaiser Permanente,
Ser. C
(Mandatory put date 6/1/12) | | A+(b) | | 3.85 | | 11/01/29 | | | 2,000 | | | 2,002,600 |
Ser. C
Rmkt. on 8/1/06 | | A+(b) | | 5.25 | | 08/01/31 | | | 1,280 | | | 1,145,485 |
Capistrano Uni. Sch. Dist. Cmnty. Facs., Rev., Talega Cmnty. Facs. Dist. #90-2 | | NR | | 6.00 | | 09/01/33 | | | 1,000 | | | 829,350 |
City of Chula Vista Indl. Dev. Rev., San Diego Gas, A.M.T. | | A1 | | 5.00 | | 12/01/27 | | | 1,000 | | | 888,830 |
Foothill/Eastern Trans. Corridor Agcy. Toll Rd. Rev., C.A.B.S. (Converts to 5.875% on 7/15/09) | | Baa3 | | 7.56(k) | | 01/15/28 | | | 6,700 | | | 5,423,315 |
Golden St. Tob. Secur. Corp., Tob. Settlement Rev., Asset Bkd. Sr., Ser. A-1 | | Baa3 | | 5.75 | | 06/01/47 | | | 2,000 | | | 1,146,980 |
Lake Elsinore Spl. Tax Cmnty. Facs. Dist.-2-Area A-A | | NR | | 5.45 | | 09/01/36 | | | 1,500 | | | 982,575 |
Lincoln Impvt. Bond Act 1915, Pub. Fin. Auth. Rev., Twelve Bridges | | NR | | 6.20 | | 09/02/25 | | | 3,375 | | | 2,897,235 |
Los Angeles Regional Arpts. Impt. Corp. Lse. Rev., American Airlines, Inc., A.M.T. | | Caa2 | | 7.50 | | 12/01/24 | | | 2,000 | | | 1,507,220 |
Murrieta Cmnty. Facs. Dist. Spl. Tax., No. 2, The Oaks Impt. Area, Ser. A | | NR | | 5.90 | | 09/01/27 | | | 1,000 | | | 798,050 |
Orange Cnty., Loc. Trans. Auth. Sales Tax Rev., Linked, S.A.V.R.S., R.I.B.S. | | Aa2 | | 6.20 | | 02/14/11 | | | 7,000 | | | 7,086,589 |
Perris Cmnty. Facs. Dist., Spec. Tax, No. 01- 2, Avalon Ser. A | | NR | | 6.25 | | 09/01/23 | | | 3,000 | | | 2,554,230 |
Port of Oakland,
Ser. K (Prerefunded 5/1/10)(e) | | A1 | | 5.875 | | 11/01/30 | | | 40 | | | 41,800 |
See Notes to Financial Statements.
| | |
| 12 | | Visit our website at www.jennisondryden.com |
| | | | | | | | | | | | |
| Description (a) | | Moody’s
Rating*†
(Unaudited) | | Interest
Rate | | Maturity
Date | | Principal
Amount (000) | | Value (Note 1) |
| | | | | | | | | | | | |
California (cont’d.) | | | | | | | | | | | | |
Unrefunded Balance, Ser. K, F.G.I.C. | | A1 | | 5.875% | | 11/01/30 | | $ | 4,960 | | $ | 4,486,866 |
Rancho Cordova Cmnty. Facs. Dist., Spec. Tax No. 2003-1, Sunridge Anatolia | | NR | | 6.00 | | 09/01/33 | | | 1,000 | | | 753,550 |
Sunridge Anatolia | | NR | | 6.10 | | 09/01/37 | | | 1,980 | | | 1,483,515 |
Saugus Uni. Sch. Dist. Spl. Tax Cmnty. Facs. Dist. No. 2002-1 | | NR | | 6.00 | | 09/01/33 | | | 1,800 | | | 1,356,390 |
Valley Hlth. Sys. Hosp. Rev., Rfdg. & Impvt. Proj., Ser. A(h) | | C(b) | | 6.50 | | 05/15/25 | | | 130 | | | 82,251 |
Vernon Nat. Gas Fin. Auth., M.B.I.A. (Mandatory put date 8/3/09) | | A3 | | 5.00 | | 08/01/21 | | | 1,890 | | | 1,890,378 |
Wm. S. Hart Unif. High Sch. Dist., Spl. Tax Cmnty. Fac. Dist. No. 2005-1 | | NR | | 5.30 | | 09/01/36 | | | 1,000 | | | 660,870 |
| | | | | | | | | | | | |
| | | | | | | | | | | | 42,476,134 |
| | | | | |
Colorado 4.2% | | | | | | | | | | | | |
Black Hawk Bus. Impvt. Dist. Utl. G.O. (Prerefunded 12/1/09)(e) | | NR | | 7.75 | | 12/01/19 | | | 4,980 | | | 5,258,980 |
Colorado Hlth. Facs. Auth. Rev., Christian Living Cmntys. Proj., Ser. A | | NR | | 5.75 | | 01/01/37 | | | 1,500 | | | 971,415 |
Poudre Valley Hlthcare., Rfdg. | | Baa1 | | 5.00 | | 03/01/25 | | | 5,560 | | | 4,669,510 |
Valley View Assn. Proj. | | BBB(b) | | 5.125 | | 05/15/37 | | | 1,240 | | | 895,987 |
Colorado Springs Memorial Hosp. Rev.,
Unrefunded balance | | A3 | | 6.375 | | 12/15/30 | | | 1,260 | | | 1,195,576 |
Denver City & Cnty. Co. Arpt. Rev., A.M.T. (Mandatory put date 5/15/11) | | A1 | | 5.25 | | 11/15/32 | | | 2,000 | | | 2,030,420 |
E-470 Pub. Hwy. Auth. Rev.,
Ser. A2, M.B.I.A. (Mandatory put date 9/1/11) | | Baa1 | | 5.00 | | 09/01/39 | | | 1,500 | | | 1,502,295 |
Pub. Auth. Energy Nat. Gas Pur. Rev. | | A2 | | 6.50 | | 11/15/38 | | | 1,500 | | | 1,246,395 |
| | | | | | | | | | | | |
| | | | | | | | | | | | 17,770,578 |
See Notes to Financial Statements.
| | |
| Dryden Municipal Bond Fund | | 13 |
Portfolio of Investments
as of April 30, 2009 continued
| | | | | | | | | | | | |
| Description (a) | | Moody’s
Rating*†
(Unaudited) | | Interest
Rate | | Maturity
Date | | Principal
Amount (000) | | Value (Note 1) |
| | | | | | | | | | | | |
Connecticut 0.6% | | | | | | | | | | | | |
Connecticut St. Dev. Auth. Pollutn. Rev., Conn. Lt. &
Pwr. B, A.M.T. | | Baa1 | | 5.95% | | 09/01/28 | | $ | 1,500 | | $ | 1,394,970 |
Connecticut St. Dev. Auth. Solid Waste Disp. Facs. Rev., Pseg. Pwr. LLC Proj., Ser. A, A.M.T. | | Baa1 | | 5.75 | | 11/01/37 | | | 1,600 | | | 1,275,568 |
| | | | | | | | | | | | |
| | | | | | | | | | | | 2,670,538 |
| | | | | |
Delaware 0.3% | | | | | | | | | | | | |
Delaware St. Health Facs. Auth. Rev., Beebe Med. Ctr. Proj., Ser. A | | Baa1 | | 5.00 | | 06/01/30 | | | 2,000 | | | 1,426,540 |
| | | | | |
District of Columbia 0.8% | | | | | | | | | | | | |
Dist. of Columbia Rev., George Washington Univ., Ser. A, M.B.I.A. | | A1 | | 5.125 | | 09/15/31 | | | 2,000 | | | 1,964,600 |
Metropolitan Washington D.C. Arpt. Auth. Sys. Rev., Ser. A, A.M.T. | | Aa3 | | 5.25 | | 10/01/27 | | | 1,500 | | | 1,426,845 |
| | | | | | | | | | | | |
| | | | | | | | | | | | 3,391,445 |
| | | | | |
Florida 4.7% | | | | | | | | | | | | |
Greater Orlando Aviation Auth., Orlando Arpt. Fac. Rev.,
Spl. Purp.-Jetblue Airways Corp., A.M.T. | | NR | | 6.375 | | 11/15/26 | | | 2,000 | | | 1,260,260 |
Spl. Purp.-Jetblue Airways Corp., A.M.T. | | NR | | 6.50 | | 11/15/36 | | | 2,000 | | | 1,186,100 |
Highlands Cmnty. Dev. Dist. Spl. Assmt. | | NR | | 5.55 | | 05/01/36 | | | 500 | | | 269,070 |
Hillsborough Cnty. Industrial Dev. Auth., Tampa Electric | | Baa2 | | 5.65 | | 05/15/18 | | | 1,000 | | | 1,003,900 |
Indigo Cmnty. Dev. Dist. Cap. Impvt. Rev. | | NR | | 5.75 | | 05/01/36 | | | 1,950 | | | 1,021,683 |
Jacksonville Aviation Auth. Rev., A.M.B.A.C., A.M.T. | | A2 | | 5.00 | | 10/01/26 | | | 2,000 | | | 1,785,600 |
See Notes to Financial Statements.
| | |
| 14 | | Visit our website at www.jennisondryden.com |
| | | | | | | | | | | | |
| Description (a) | | Moody’s
Rating*†
(Unaudited) | | Interest
Rate | | Maturity
Date | | Principal
Amount (000) | | Value (Note 1) |
| | | | | | | | | | | | |
Florida (cont’d.) | | | | | | | | | | | | |
Jacksonville Econ. Dev., Anheuser Busch Co., Ser. B, A.M.T. | | Baa2 | | 4.75% | | 03/01/47 | | $ | 2,500 | | $ | 1,572,775 |
Gerdau Ameristeel U.S., Inc., A.M.T. | | Ba1 | | 5.30 | | 05/01/37 | | | 2,000 | | | 1,021,340 |
Miami Beach Hlth. Facs. Auth. Hosp. Rev., Mount Sinai Med. Ctr., Ser. A | | Ba2 | | 6.70 | | 11/15/19 | | | 1,000 | | | 780,270 |
Orange Cnty. Hlth. Facs. Auth. Rev., Hosp. Orlando Regl. Hlthcare., Ser. C | | A2 | | 5.25 | | 10/01/35 | | | 1,500 | | | 1,213,320 |
Orlando Util. Cmnty. Wtr. & Elec. Rev., Ser. D, E.T.M.(e) | | AA(b) | | 6.75 | | 10/01/17 | | | 2,000 | | | 2,409,560 |
Palm Beach Cnty. Pub. Impvt. Rev., Convention Ctr. Proj., F.G.I.C. (Mandatory put date 11/1/11) | | Aa1 | | 5.00 | | 11/01/30 | | | 2,500 | | | 2,691,300 |
Paseo Cmnty. Dev. Dist. Cap. Impvt. Rev., Ser. A | | NR | | 5.40 | | 05/01/36 | | | 1,360 | | | 666,604 |
Reunion West Cmnty. Dev. Dist. Spec. Assmt. | | NR | | 6.25 | | 05/01/36 | | | 1,450 | | | 705,628 |
Seminole Tribe Spl. Oblig. Rev., Ser. A, 144A (original cost $1,013,820; purchased 9/27/07)(i) | | Ba1 | | 5.50 | | 10/01/24 | | | 1,000 | | | 735,800 |
St. Petersburg Hlth. Facs. Auth. Rev., All Childrens Hosp. | | A1 | | 6.50 | | 11/15/39 | | | 1,500 | | | 1,512,465 |
| | | | | | | | | | | | |
| | | | | | | | | | | | 19,835,675 |
| | | | | |
Georgia 0.9% | | | | | | | | | | | | |
Burke Cnty. Dev. Auth. Pollutn. Rev., Oglethorpe Pwr.-Vogtle Proj., Ser B | | A3 | | 5.50 | | 01/01/33 | | | 1,000 | | | 935,940 |
Fulton Cnty. Residential Care Facs. Rev., Canterbury Court Proj., Ser. A | | NR | | 6.125 | | 02/15/34 | | | 1,200 | | | 794,952 |
Henry Cnty. Wtr. & Swr. Auth. Rev., A.M.B.A.C. | | Aa3 | | 6.15 | | 02/01/20 | | | 1,000 | | | 1,144,130 |
Marietta Development Auth. Rev., Life Univ. | | Ba3 | | 7.00 | | 06/15/39 | | | 1,000 | | | 737,540 |
| | | | | | | | | | | | |
| | | | | | | | | | | | 3,612,562 |
See Notes to Financial Statements.
| | |
| Dryden Municipal Bond Fund | | 15 |
Portfolio of Investments
as of April 30, 2009 continued
| | | | | | | | | | | | |
| Description (a) | | Moody’s
Rating*†
(Unaudited) | | Interest
Rate | | Maturity
Date | | Principal
Amount (000) | | Value (Note 1) |
| | | | | | | | | | | | |
Idaho 0.5% | | | | | | | | | | | | |
Idaho Hlth. Facs. Auth. Rev., St. Lukes Hlth. Sys. Proj., Ser. A | | A2 | | 6.75% | | 11/01/37 | | $ | 1,000 | | $ | 1,035,420 |
Idaho Hsg. & Fin. Assn. Rev., North Star Charter Sch. Proj. | | BB(b) | | 9.50 | | 07/01/39 | | | 1,000 | | | 1,006,860 |
| | | | | | | | | | | | |
| | | | | | | | | | | | 2,042,280 |
| | | | | |
Illinois 10.2% | | | | | | | | | | | | |
Cary Spec. Tax Svcs. Rev., Area No. 1, Cambridge, Ser. A (Prerefunded 3/1/10)(e) | | NR | | 7.625 | | 03/01/30 | | | 3,115 | | | 3,348,500 |
Cary Spec. Tax Svcs. Rev., Area No. 2, Foxford Hill (Prerefunded 3/1/10)(e) | | NR | | 7.50 | | 03/01/30 | | | 4,572 | | | 4,866,162 |
Gilberts Spec. Svcs. Area No. 9, Spec. Tax, Big Timber Proj. (Prerefunded 3/1/11)(e) | | AAA(b) | | 7.75 | | 03/01/27 | | | 5,000 | | | 5,685,850 |
Illinois Fin. Auth. Rev., | | | | | | | | | | | | |
Friendship Vlg. Schaumburg, Ser. A | | NR | | 5.625 | | 02/15/37 | | | 1,000 | | | 564,220 |
Illinois Inst. of Technology, Ser. A | | Baa2 | | 5.00 | | 04/01/31 | | | 2,500 | | | 1,889,075 |
Illinois Inst. of Technology, Ser. A | | Baa2 | | 5.00 | | 04/01/36 | | | 5,000 | | | 3,662,200 |
NorthWestern Mem. Hosp., Ser. A | | Aa2 | | 6.00 | | 08/15/39 | | | 1,500 | | | 1,531,005 |
Rush Univ. Med. Ctr. Oblig. Grp. A | | A3 | | 7.25 | | 11/01/38 | | | 3,405 | | | 3,547,227 |
Student Hsg., Rfdg. Edl. | | | | | | | | | | | | |
Advancement Fd., Inc. Ser. B | | Baa3 | | 5.00 | | 05/01/30 | | | 5,000 | | | 3,517,250 |
Illinois Hlth. Facs. Auth. Rev., Lake Forest Hosp., Ser. A | | A3 | | 6.25 | | 07/01/22 | | | 4,200 | | | 4,227,048 |
Kane & De Kalb Cntys. Sch. Dist., No. 301, A.M.B.A.C., C.A.B.S., G.O. | | A(b) | | 3.03(k) | | 12/01/11 | | | 3,360 | | | 3,108,605 |
Metro. Pier & Expo. Auth. Dedicated St. Tax Rev., McCormick Place Expansion, Ser. A, M.B.I.A. | | A2 | | 5.25 | | 06/15/42 | | | 6,000 | | | 6,012,841 |
See Notes to Financial Statements.
| | |
| 16 | | Visit our website at www.jennisondryden.com |
| | | | | | | | | | | | |
| Description (a) | | Moody’s
Rating*†
(Unaudited) | | Interest
Rate | | Maturity
Date | | Principal
Amount (000) | | Value (Note 1) |
| | | | | | | | | | | | |
Illinois (cont’d.) | | | | | | | | | | | | |
Round Lake Rev., Lakewood Spl. Tax #1 (Prerefunded 3/1/13)(e) | | NR | | 6.70% | | 03/01/33 | | $ | 1,000 | | $ | 1,173,100 |
| | | | | | | | | | | | |
| | | | | | | | | | | | 43,133,083 |
| | | | | |
Indiana 1.4% | | | | | | | | | | | | |
Indiana Hlth. & Edl. Fac. Fin. Auth. Hosp. Rev.,
Cmnty. Foundation Northwest Ind. | | BBB(b) | | 5.50 | | 03/01/37 | | | 2,000 | | | 1,550,360 |
Cmnty. Foundation Northwest Ind., Ser. A | | BBB(b) | | 6.00 | | 03/01/34 | | | 3,000 | | | 2,490,180 |
Indiana St. Hsg. Fin. Auth. Singl. Fam. Mtge. Rev., Ser. B2, A.M.T., G.N.M.A./F.N.M.A. | | Aaa | | 4.00 | | 01/01/34 | | | 795 | | | 773,042 |
Vigo Cnty. Hosp. Auth. Rev., Union Hosp., Inc. | | NR | | 5.80 | | 09/01/47 | | | 1,500 | | | 965,190 |
| | | | | | | | | | | | |
| | | | | | | | | | | | 5,778,772 |
| | | | | |
Iowa 1.0% | | | | | | | | | | | | |
Altoona Iowa Urban Renewal Tax Rev., Annual Appr. | | BBB+(b) | | 6.00 | | 06/01/43 | | | 1,000 | | | 881,470 |
Iowa Fin. Auth. Sr. Living Fac. Rev.,
Deerfield Ret. Cmnty. Inc., Ser. A | | NR | | 5.50 | | 11/15/37 | | | 1,250 | | | 697,750 |
Mercy Hlth. Initiatives Proj. (Prerefunded 7/1/11)(e) | | AAA(b) | | 9.25 | | 07/01/25 | | | 2,110 | | | 2,480,263 |
| | | | | | | | | | | | |
| | | | | | | | | | | | 4,059,483 |
| | | | | |
Louisiana 1.2% | | | | | | | | | | | | |
Calcasieu Parish, Inc., Ind. Dev. Brd. Rev., Rfdg. Olin Corp. Proj. | | Ba1 | | 6.625 | | 02/01/16 | | | 3,500 | | | 3,112,865 |
Louisiana St. Citizens Ppty. Ins. Assmt. Rev., Ser. C, A.G.C. | | Aa2 | | 6.75 | | 06/01/26 | | | 2,000 | | | 2,143,540 |
| | | | | | | | | | | | |
| | | | | | | | | | | | 5,256,405 |
| | | | | |
Maryland 0.5% | | | | | | | | | | | | |
Maryland Econ. Dev. Corp. | | Baa1 | | 6.20 | | 09/01/22 | | | 1,000 | | | 1,060,340 |
See Notes to Financial Statements.
| | |
| Dryden Municipal Bond Fund | | 17 |
Portfolio of Investments
as of April 30, 2009 continued
| | | | | | | | | | | | |
| Description (a) | | Moody’s
Rating*†
(Unaudited) | | Interest
Rate | | Maturity
Date | | Principal
Amount (000) | | Value (Note 1) |
| | | | | | | | | | | | |
Maryland (cont’d.) | | | | | | | | | | | | |
Maryland St. Hlth. & Higher Edl. Facs. Auth. Rev.,
Medstar Health | | A3 | | 5.25% | | 05/15/46 | | $ | 500 | | $ | 431,735 |
Maryland St. Indl. Dev. Fin. Auth. Rev., Rfdg. Synagro. Baltimore, Ser. A, A.M.T. | | NR | | 5.25 | | 12/01/13 | | | 700 | | | 653,380 |
| | | | | | | | | | | | |
| | | | | | | | | | | | 2,145,455 |
| | | | | |
Massachusetts 2.7% | | | | | | | | | | | | |
Massachusetts St. Coll. Bldg., Auth. Rev. Proj. & Rfdg. Bonds, Ser. A | | Aa2 | | 7.50 | | 05/01/14 | | | 1,750 | | | 2,042,215 |
Massachusetts St. Dev. Fin. Agcy. Rev., Alliance Hlth., Ser. A | | NR | | 7.10 | | 07/01/32 | | | 3,930 | | | 3,034,196 |
Linden Ponds, Inc. Fac., Ser. A | | NR | | 5.75 | | 11/15/42 | | | 1,000 | | | 555,630 |
Massachusetts St. Hlth. & Edl. Facs. Auth. Rev.,
Caregroup, Ser. E-1 | | A3 | | 5.125 | | 07/01/38 | | | 750 | | | 573,773 |
Caritas Christi Oblig. Group, Rfdg., Ser. A | | Baa3 | | 5.75 | | 07/01/28 | | | 2,000 | | | 1,544,540 |
Caritas Christi Oblig. Group, Rfdg., Ser. B | | Baa3 | | 6.75 | | 07/01/16 | | | 3,595 | | | 3,491,463 |
| | | | | | | | | | | | |
| | | | | | | | | | | | 11,241,817 |
| | | | | |
Michigan 3.7% | | | | | | | | | | | | |
Kalamazoo Hosp. Fin. Auth. Borgess Hosp. Fac. Rev., E.T.M., F.G.I.C.(e)(h)(j) | | Aaa | | 9.07 | | 06/01/11 | | | 1,300 | | | 1,308,450 |
Kent Hosp. Fin. Auth. Rev., Metro. Hosp. Proj., Ser. A | | BB+(b) | | 6.25 | | 07/01/40 | | | 3,000 | | | 2,175,060 |
Spectrum Hlth. (Mandatory put date 1/15/15) | | Aa3 | | 5.50 | | 01/15/47 | | | 1,000 | | | 1,029,990 |
Michigan Pub. Edl. Facs. Auth. Rev., Rfdg. Ltd. Oblig.-Black River Sch. | | NR | | 5.80 | | 09/01/30 | | | 1,250 | | | 827,688 |
Michigan St. Hosp Fin. Auth. Rev.,
Henry Ford Hlth. Sys. Rfdg., Ser. A | | A1 | | 5.25 | | 11/15/46 | | | 3,000 | | | 2,244,780 |
See Notes to Financial Statements.
| | |
| 18 | | Visit our website at www.jennisondryden.com |
| | | | | | | | | | | | |
| Description (a) | | Moody’s
Rating*†
(Unaudited) | | Interest
Rate | | Maturity
Date | | Principal
Amount (000) | | Value (Note 1) |
| | | | | | | | | | | | |
Michigan (cont’d.) | | | | | | | | | | | | |
McLaren Hlthcare. | | A1 | | 5.75% | | 05/15/38 | | $ | 1,500 | | $ | 1,368,390 |
McLaren Hlthcare. Corp. | | A1 | | 5.00 | | 06/01/19 | | | 1,000 | | | 970,670 |
Michigan Strategic Fund Solid Waste Disp. Rev., A.M.T. | | BBB(b) | | 4.50 | | 12/01/13 | | | 1,000 | | | 925,830 |
Royal Oak Mich. Hosp. Fin. Auth. Hosp. Rev., William
Beaumont Hosp. | | A1 | | 8.25 | | 09/01/39 | | | 2,150 | | | 2,392,433 |
Summit Academy North Pub. Sch., Academy Rev., Rfdg. | | BB+(b) | | 5.50 | | 11/01/30 | | | 1,500 | | | 905,130 |
Summit Academy Pub. Sch., Academy Rev., Rfdg. | | BB+(b) | | 6.25 | | 11/01/25 | | | 2,060 | | | 1,504,892 |
| | | | | | | | | | | | |
| | | | | | | | | | | | 15,653,313 |
| | | | | |
Minnesota 0.2% | | | | | | | | | | | | |
St. Paul Hsg. & Redev. Auth. Hosp. Rev., Healtheast Proj. | | Ba1 | | 6.00 | | 11/15/35 | | | 1,000 | | | 727,560 |
| | | | | |
Mississippi 0.2% | | | | | | | | | | | | |
Warren County Gulf Opportunity Zone, Ser. A | | BBB(b) | | 6.50 | | 09/01/32 | | | 1,000 | | | 784,100 |
| | | | | |
Missouri 0.3% | | | | | | | | | | | | |
Missouri St. Hlth. & Ed. Facs. Auth. Rev., Cox Hlth. | | A2 | | 5.50 | | 11/15/33 | | | 1,500 | | | 1,379,040 |
| | | | | |
Nevada 1.2% | | | | | | | | | | | | |
Clark Cnty. Impvt. Dist. Rev., Spec. Impvt. Dist. No. 142, Loc. Impvt. | | NR | | 6.10 | | 08/01/18 | | | 1,940 | | | 1,554,852 |
Clark Cnty. Ind. Dev. Rev., Nevada Pwr. Co. Proj. Rfdg., Ser. C | | BB+(b) | | 5.50 | | 10/01/30 | | | 4,500 | | | 3,547,575 |
| | | | | | | | | | | | |
| | | | | | | | | | | | 5,102,427 |
| | | | | |
New Hampshire 0.2% | | | | | | | | | | | | |
New Hampshire St. Business Fin. Auth. Pollutn. Ctl. Rev., United Illuminating Co. Proj. (Mandatory put date 2/1/12) | | Baa2 | | 7.125 | | 07/01/27 | | | 1,000 | | | 1,004,290 |
See Notes to Financial Statements.
| | |
| Dryden Municipal Bond Fund | | 19 |
Portfolio of Investments
as of April 30, 2009 continued
| | | | | | | | | | | | |
| Description (a) | | Moody’s
Rating*†
(Unaudited) | | Interest
Rate | | Maturity
Date | | Principal
Amount (000) | | Value (Note 1) |
| | | | | | | | | | | | |
New Jersey 6.8% | | | | | | | | | | | | |
Burlington Cnty. Bridge Commn. Econ. Dev. Rev., The Evergreens Proj. | | NR | | 5.625% | | 01/01/38 | | $ | 1,000 | | $ | 599,080 |
New Jersey Econ. Dev. Auth. Rev.,
Cigarette Tax | | Baa2 | | 5.625 | | 06/15/19 | | | 1,250 | | | 1,097,775 |
Cigarette Tax | | Baa2 | | 5.75 | | 06/15/34 | | | 750 | | | 533,685 |
Continental Air., Inc. Proj., Spec. Facs. Rev., A.M.T. | | B3 | | 6.25 | | 09/15/29 | | | 5,530 | | | 3,536,435 |
Proj., Spec. Facs. Rev., A.M.T. | | B3 | | 6.40 | | 09/15/23 | | | 2,000 | | | 1,386,780 |
Cranes Mill Proj. First Mtge., Ser. A | | NR | | 5.875 | | 07/01/28 | | | 1,000 | | | 811,700 |
Franciscan Oaks Proj. First Mtge. Rfdg., | | NR | | 5.70 | | 10/01/17 | | | 165 | | | 139,470 |
Gloucester Marine, Ser. B, A.M.T. | | NR | | 6.875 | | 01/01/37 | | | 3,000 | | | 2,239,320 |
New Jersey Hlthcare. Facs. Fin. Auth. Rev.,
Cherry Hill Proj. | | NR | | 8.00 | | 07/01/27 | | | 2,000 | | | 1,565,540 |
St. Josephs Hlthcare. Sys. | | Ba1 | | 6.625 | | 07/01/38 | | | 1,000 | | | 775,260 |
St. Peters Univ. Hosp., Ser. A | | Baa2 | | 6.875 | | 07/01/30 | | | 2,250 | | | 2,101,635 |
Virtua Hlth. | | A(b) | | 5.75 | | 07/01/33 | | | 2,000 | | | 1,951,380 |
New Jersey St. Ed. Facs. Auth. | | Baa2 | | 7.50 | | 12/01/32 | | | 1,000 | | | 1,019,010 |
New Jersey St. Tpke. Auth. Tpke. Rev., Growth & Income. Secs., Ser. B, A.M.B.A.C., C.A.B.S., (Converts to 5.15% on 1/1/15) | | A3 | | 5.44(k) | | 01/01/35 | | | 4,000 | | | 2,857,160 |
New Jersey St. Transn. Tr. Fd. Auth., Ser. A | | A1 | | 5.875 | | 12/15/38 | | | 2,000 | | | 2,143,320 |
Transn. Sys., Ser. A | | A1 | | 5.50 | | 12/15/23 | | | 2,000 | | | 2,161,120 |
Tobacco Settlement Fin. Corp., NJ Rev.,
Ser. 1A | | Baa3 | | 4.50 | | 06/01/23 | | | 500 | | | 420,055 |
Ser. 1A | | Baa3 | | 5.00 | | 06/01/41 | | | 6,000 | | | 3,163,500 |
| | | | | | | | | | | | |
| | | | | | | | | | | | 28,502,225 |
See Notes to Financial Statements.
| | |
| 20 | | Visit our website at www.jennisondryden.com |
| | | | | | | | | | | | |
| Description (a) | | Moody’s
Rating*†
(Unaudited) | | Interest
Rate | | Maturity
Date | | Principal
Amount (000) | | Value (Note 1) |
| | | | | | | | | | | | |
New Mexico 0.8% | | | | | | | | | | | | |
Farmington Poll. Ctrl. Rev., El Paso Elec. Co. Proj., Ser. A, F.G.I.C. (Mandatory put date 8/1/12) | | Baa2 | | 4.00% | | 06/01/32 | | $ | 2,000 | | $ | 1,922,880 |
New Mexico Mtge. Fin. Auth. Rev., Sngl. Fam. Mtge., Ser. E, A.M.T., G.N.M.A., F.N.M.A., F.H.L.M.C. | | AAA(b) | | 5.50 | | 07/01/35 | | | 1,450 | | | 1,441,837 |
| | | | | | | | | | | | |
| | | | | | | | | | | | 3,364,717 |
| | | | | |
New York 3.1% | | | | | | | | | | | | |
Brookhaven Indl. Dev. Agcy. Civic Facs. Rev., Brooks Mem. Hosp. Med. Ctr., Inc., Ser. A (Prerefunded 11/15/10)(e) | | NR | | 8.25 | | 11/15/30 | | | 2,000 | | | 2,235,500 |
Erie Cnty. Tob. Asset Securitization Corp. Cap. Apprec.,
Asset Bkd.-1st Sub., Ser. B, C.A.B.S. | | NR | | 10.61(k) | | 06/01/47 | | | 5,000 | | | 97,500 |
Asset Bkd.-2nd Sub.,
Ser. C, C.A.B.S. | | NR | | 11.91(k) | | 06/01/50 | | | 4,000 | | | 48,840 |
Long Island Pwr. Auth. Elec. Sys. Rev.,
Ser. A | | A3 | | 6.00 | | 05/01/33 | | | 1,500 | | | 1,603,545 |
Ser. A | | A3 | | 6.25 | | 04/01/33 | | | 500 | | | 548,510 |
New York City Indl. Dev. Agcy., Civic Fac. Rev., Staten Island Univ. Hosp. Proj., Ser. B | | Ba2 | | 6.375 | | 07/01/31 | | | 970 | | | 671,473 |
Spl. Fac. Rev., American Airlines-JFK Int’l. Arpt., A.M.T. | | B-(b) | | 7.125 | | 08/01/11 | | | 3,495 | | | 3,250,315 |
Spl. Fac. Rev., American Airlines-JFK Int’l. Arpt., A.M.T. | | B-(b) | | 7.75 | | 08/01/31 | | | 2,000 | | | 1,495,660 |
Spl. Fac. Rev., Terminal One Group Assn. Proj., A.M.T. | | A3 | | 5.50 | | 01/01/24 | | | 2,450 | | | 2,163,203 |
New York Liberty Dev. Corp. Rev., National Sports Museum Proj. A (original cost $1,099,998; purchased 8/7/07)(h)(i) | | NR | | 6.125 | | 02/15/19 | | | 1,100 | | | 1,100 |
NY ST Dorm. Auth., Orange Reg.-Med. Ctr. | | Ba1 | | 6.25 | | 12/01/37 | | | 1,500 | | | 1,083,195 |
| | | | | | | | | | | | |
| | | | | | | | | | | | 13,198,841 |
See Notes to Financial Statements.
| | |
| Dryden Municipal Bond Fund | | 21 |
Portfolio of Investments
as of April 30, 2009 continued
| | | | | | | | | | | | |
| Description (a) | | Moody’s
Rating*†
(Unaudited) | | Interest
Rate | | Maturity
Date | | Principal
Amount (000) | | Value (Note 1) |
| | | | | | | | | | | | |
North Carolina 0.3% | | | | | | | | | | | | |
North Carolina Eastn. Mun. Pwr. Agcy. Pwr. Sys. Rev., Ser. C | | Baa1 | | 6.75% | | 01/01/24 | | $ | 1,000 | | $ | 1,063,360 |
| | | | | |
North Dakota 0.4% | | | | | | | | | | | | |
Ward Cnty. Hlthcare. Facs. Rev., Trinity Oblig. Rfdg., Group B | | BBB+(b) | | 6.25 | | 07/01/21 | | | 2,000 | | | 1,827,780 |
| | | | | |
Ohio 2.7% | | | | | | | | | | | | |
Buckeye Tob. Settlement Fin. Auth. Asset Bkd. Sr. Turbo, Ser. A-2 | | Baa3 | | 5.875 | | 06/01/47 | | | 1,000 | | | 559,610 |
Ser. A-2 | | Baa3 | | 6.50 | | 06/01/47 | | | 2,500 | | | 1,544,250 |
Cuyahoga Cnty. Hosp. Facs. Rev., Canton, Inc. Proj. | | Baa2 | | 7.50 | | 01/01/30 | | | 3,000 | | | 2,953,170 |
Montgomery Cnty. Ohio Rev., Miami Valley Hosp., Ser. A | | Aa3 | | 6.25 | | 11/15/39 | | | 1,500 | | | 1,520,220 |
Ohio St. Air Quality Dev. Auth. 5.7% 02/01/2014 | | Baa1 | | 5.70 | | 02/01/14 | | | 1,500 | | | 1,538,130 |
Ohio St. Wtr. Dev. Auth. Solid Wste. Disp. Rev., Wste. Mgmt. Proj., A.M.T. (Mandatory put date 7/1/09) | | BBB(b) | | 4.50 | | 07/01/21 | | | 1,000 | | | 999,020 |
Ohio St. Wtr. Solid Allied Wste. N.A., Inc., Ser. A, A.M.T. | | BBB(b) | | 5.15 | | 07/15/15 | | | 1,250 | | | 1,140,900 |
Richland Cnty. Ohio Hosp. Facs. Rev.,
Medcentral Hlth. Ser. A (Prerefunded 11/15/10)(e) | | A-(b) | | 6.125 | | 11/15/16 | | | 665 | | | 723,606 |
Medcentral Hlth. Sys., Unref. balance, Ser. A, | | A-(b) | | 6.125 | | 11/15/16 | | | 335 | | | 343,144 |
| | | | | | | | | | | | |
| | | | | | | | | | | | 11,322,050 |
| | | | | |
Oklahoma 0.6% | | | | | | | | | | | | |
Chickasaw Nation Okla.
Hlth. Sys. | | NR | | 6.25 | | 12/01/32 | | | 1,340 | | | 1,088,026 |
Norman Regional
Hospital Authority Rev. | | BBB-(b) | | 5.375 | | 09/01/36 | | | 2,000 | | | 1,301,080 |
| | | | | | | | | | | | |
| | | | | | | | | | | | 2,389,106 |
See Notes to Financial Statements.
| | |
| 22 | | Visit our website at www.jennisondryden.com |
| | | | | | | | | | | | |
| Description (a) | | Moody’s
Rating*†
(Unaudited) | | Interest
Rate | | Maturity
Date | | Principal
Amount (000) | | Value (Note 1) |
| | | | | | | | | | | | |
Pennsylvania 5.9% | | | | | | | | | | | | |
Allegheny Cnty. Hosp. Dev. Auth. Rev., Hlth. Sys., Ser. B (Prerefunded 11/15/10)(e) | | AAA(b) | | 9.25% | | 11/15/15 | | $ | 845 | | $ | 950,938 |
Ohio Valley Gen. Hosp. Proj., Ser. A | | Baa2 | | 5.125 | | 04/01/35 | | | 1,335 | | | 908,267 |
Butler Cnty. Hosp. Auth. Rev., Butler Hlth. Sys. Proj. | | Baa1 | | 7.25 | | 07/01/39 | | | 1,000 | | | 1,015,650 |
Cumberland Cnty. Mun. Auth. Ret. Cmnty. Rev., Wesley Affiliated Svcs., | | | | | | | | | | | | |
Ser. A (Prerefunded 1/01/13)(e) | | NR | | 7.25 | | 01/01/35 | | | 1,110 | | | 1,323,287 |
Ser. A (Prerefunded 1/01/13)(e) | | NR | | 7.25 | | 01/01/35 | | | 2,890 | | | 3,445,314 |
Fulton Cnty. Indl. Dev. Auth. Hosp. Rev., Med. Ctr. Proj. | | NR | | 5.90 | | 07/01/40 | | | 1,000 | | | 619,490 |
Lancaster Cnty. Hosp. Auth. Rev., Gen. Hosp. Proj. Woods Sch. (Prerefunded 9/15/13)(e) | | NR | | 5.50 | | 03/15/26 | | | 780 | | | 901,836 |
Northampton Cnty. PA Gen. Purp. Auth. Hosp. Rev., St. Lukes Hosp. Proj., Ser. A | | Baa1 | | 5.50 | | 08/15/35 | | | 1,000 | | | 822,770 |
Pennsylvania Econ. Dev. Fin. Auth. Res. Recov. Rfdg., Sub, Colver Proj., | | | | | | | | | | | | |
Ser F, A.M.B.A.C., A.M.T. | | Baa3 | | 4.625 | | 12/01/18 | | | 1,500 | | | 1,240,785 |
Ser. G, A.M.T. | | NR | | 5.125 | | 12/01/15 | | | 2,000 | | | 1,608,100 |
Philadelphia Hosp. & Higher Ed. Facs. Auth. Rev., | | | | | | | | | | | | |
Grad. Hlth. Sys. (original cost $915,255; purchased 1/22/98)(c)(h)(i) | | NR | | 7.00 | | 07/01/10 | | | 908 | | | 9 |
Grad. Hlth. Sys. (original cost $1,264,342; purchased
1/22/98-6/23/98)(c)(h)(i) | | NR | | 7.25 | | 07/01/18 | | | 1,248 | | | 12 |
Grad. Hlth. Sys., Ser. A (original cost $1,039,576; purchased 1/21/98-7/6/98)(c)(h)(i) | | NR | | 6.25 | | 07/01/13 | | | 1,108 | | | 11 |
Temple Univ. Hlth. Sys., Ser. B | | Baa3 | | 5.50 | | 07/01/26 | | | 3,000 | | | 2,319,870 |
See Notes to Financial Statements.
| | |
| Dryden Municipal Bond Fund | | 23 |
Portfolio of Investments
as of April 30, 2009 continued
| | | | | | | | | | | | |
| Description (a) | | Moody’s
Rating*†
(Unaudited) | | Interest
Rate | | Maturity
Date | | Principal
Amount (000) | | Value (Note 1) |
| | | | | | | | | | | | |
Pennsylvania (cont’d.) | | | | | | | | | | | | |
Philadelphia PA Auth. For Indl. Dev. Revs., Please Touch Museum Proj. | | BBB-(b) | | 5.25% | | 09/01/31 | | $ | 1,500 | | $ | 1,130,175 |
Philadelphia, PA, Ser. B, A.G.C. | | Aa2 | | 7.125 | | 07/15/38 | | | 1,500 | | | 1,659,810 |
Somerset Cnty. Hosp. Auth. Rev., GF Somers Hlthcare. | | | | | | | | | | | | |
First Mtge. (original cost $1,106,647; purchased 2/10/97)(d)(h)(i) | | NR | | 8.40 | | 06/01/09 | | | 1,095 | | | 651,744 |
First Mtge. (original cost $8,898,687; purchased 2/10/97)(d)(h)(i) | | NR | | 8.50 | | 06/01/24 | | | 8,805 | | | 5,214,585 |
Susquehanna Area Regional Arpt. Auth., A.M.T. | | Baa3 | | 6.50 | | 01/01/38 | | | 1,500 | | | 1,034,160 |
| | | | | | | | | | | | |
| | | | | | | | | | | | 24,846,813 |
| | | | | |
Puerto Rico 2.6% | | | | | | | | | | | | |
Puerto Rico Comwlth. Govt. Dev. Bank Sr. Notes, | | | | | | | | | | | | |
Ser. B | | Baa3 | | 5.00 | | 12/01/15 | | | 2,715 | | | 2,621,523 |
Ser. C, A.M.T. | | Baa3 | | 5.25 | | 01/01/15 | | | 3,000 | | | 2,833,740 |
Puerto Rico Comwlth. Hwy. & Transn. Auth. Hwy.
Rev., Ser. CC | | Baa2 | | 5.50 | | 07/01/28 | | | 2,500 | | | 2,213,000 |
Puerto Rico Elec. Pwr. Auth. Pwr. Rev., Ser. TT | | A3 | | 5.00 | | 07/01/22 | | | 1,000 | | | 946,780 |
Puerto Rico Pub. Bldg. Auth. Rev., Gtd. Rfdg. Govt. Facs., Ser. M | | Baa3 | | 6.00 | | 07/01/20 | | | 2,500 | | | 2,508,825 |
| | | | | | | | | | | | |
| | | | | | | | | | | | 11,123,868 |
| | | | | |
Rhode Island 0.5% | | | | | | | | | | | | |
Rhode Island St. Hlth. & Edl. Bldg. Corp. Rev., Hosp. Fing., Lifespan Oblig., Ser. A | | A3 | | 7.00 | | 05/15/39 | | | 2,000 | | | 2,027,220 |
| | | | | |
South Carolina 1.3% | | | | | | | | | | | | |
South Carolina Jobs Econ. Dev. Auth. Hosp. Facs. Rev., Palmetto Hlth. Rfdg., Ser. C (Prerefunded 8/1/13)(e) | | Baa1 | | 6.875 | | 08/01/27 | | | 540 | | | 636,925 |
See Notes to Financial Statements.
| | |
| 24 | | Visit our website at www.jennisondryden.com |
| | | | | | | | | | | | |
| Description (a) | | Moody’s
Rating*†
(Unaudited) | | Interest
Rate | | Maturity
Date | | Principal
Amount (000) | | Value (Note 1) |
| | | | | | | | | | | | |
South Carolina (cont’d.) | | | | | | | | | | | | |
Tobacco Settlement Auth.
Rev., Mgt. Rfdg. | | Baa3 | | 5.00% | | 06/01/18 | | $ | 5,000 | | $ | 4,930,200 |
| | | | | | | | | | | | |
| | | | | | | | | | | | 5,567,125 |
Tennessee 4.3% | | | | | | | | | | | | |
Bradley Cnty. Ind. Dev. Brd. Rev., Rfdg. Olin Corp. Proj., Ser. C | | Ba1 | | 6.625 | | 11/01/17 | | | 2,000 | | | 1,754,220 |
Johnson City Hlth. & Edl. Facs. Brd. Hosp. Rev., Rfdg. First Mtge., Mountain States Hlth., Ser. A, M.B.I.A., E.T.M.(e) | | Baa1 | | 6.75 | | 07/01/17 | | | 2,000 | | | 2,275,720 |
Knox Cnty. Hlth. Edl. & Hsg. Facs. Brd. Hosp. Facs. Rev., Covenant Hlth.
Ser. A, C.A.B.S. | | A-(b) | | 7.68(k) | | 01/01/35 | | | 1,000 | | | 149,730 |
Memphis Ctr. City Rev., Fin. Corp., Red Birds, Ser. B (original cost $26,000,000; purchased 5/10/05)(h)(i) | | NR | | 6.50 | | 09/01/28 | | | 26,000 | | | 7,020,000 |
Rutherford Cnty. Hlth. & Edl. Facs., First Mtge. Rev., Group Homes, Inc. | | NR | | 9.50 | | 12/01/19 | | | 5,100 | | | 5,100,969 |
Tennessee Energy Acquisition Corp. Gas Rev., Ser. C | | Baa1 | | 5.00 | | 02/01/18 | | | 2,000 | | | 1,727,080 |
| | | | | | | | | | | | |
| | | | | | | | | | | | 18,027,719 |
| | | | | |
Texas 10.6% | | | | | | | | | | | | |
Alliance Arpt. Auth. Inc. Tex. Spl. Facs. Rev., American Airlines Inc. Proj., A.M.T. | | CCC+(b) | | 5.75 | | 12/01/29 | | | 2,500 | | | 950,025 |
Austin Covention Enterprises Inc., Convention Ctr., Rfdg. Second Tier, Ser. B | | Ba2 | | 5.75 | | 01/01/24 | | | 1,000 | | | 724,450 |
Brazos River Auth. Poll. Ctrl. Rev.,
TXU Energy Co. LLC Proj.,
Ser. D (Mandatory put date 10/1/14) | | Caa2 | | 5.40 | | 10/01/29 | | | 1,000 | | | 480,000 |
TXU Energy Co. LLC, Rfdg., A.M.T. | | Caa2 | | 5.40 | | 05/01/29 | | | 2,000 | | | 761,080 |
See Notes to Financial Statements.
| | |
| Dryden Municipal Bond Fund | | 25 |
Portfolio of Investments
as of April 30, 2009 continued
| | | | | | | | | | | | |
| Description (a) | | Moody’s
Rating*†
(Unaudited) | | Interest
Rate | | Maturity
Date | | Principal
Amount (000) | | Value (Note 1) |
| | | | | | | | | | | | |
Texas (cont’d.) | | | | | | | | | | | | |
TXU Energy Rfdg. Elec. Rmk., A.M.T., | | Caa2 | | 8.25% | | 10/01/30 | | $ | 3,000 | | $ | 1,290,600 |
Clifton Higher Ed. Fin. Corp. Rev., Tejano Ctr. Cmnty. | | BBB-(b) | | 9.00 | | 02/15/38 | | | 2,000 | | | 1,959,300 |
Dallas Fort Worth Int’l. Arpt. Fac. Impvt. Corp. Rev. Rfdg. | | | | | | | | | | | | |
American Airlines, Inc., A.M.T. | | Caa2 | | 6.375 | | 05/01/35 | | | 3,000 | | | 1,229,970 |
American Airlines, Inc., Rfdg., A.M.T. | | CCC+(b) | | 5.50 | | 11/01/30 | | | 2,000 | | | 760,000 |
Decatur Hosp. Auth. Rev., Wise Reg. Hlth. Sys., Ser. A | | NR | | 7.125 | | 09/01/34 | | | 3,000 | | | 2,287,020 |
Harris County Cultural Ed. Fac. Fin. Corp., Rev., Methodist Hosp. Sys., Ser. B | | AA(b) | | 5.50 | | 12/01/18 | | | 500 | | | 540,585 |
Houston Hlth. Facs. Dev. Corp. Ret. Fac. Rev., Buckingham Sr. Living Cmnty., Ser. A (Prerefunded 2/15/14)(e) | | AAA(b) | | 7.125 | | 02/15/34 | | | 1,250 | | | 1,498,163 |
Katy Dev. Auth. Rev., Tax Increment Contract, Ser. B | | NR | | 6.00 | | 06/01/18 | | | 4,000 | | | 3,452,759 |
Lamar Cons. Indpt. Sch. Dist., Rfdg. Sch. House, G.O.,
P.S.F., Gtd.(f) | | Aaa | | 5.00 | | 02/15/21 | | | 1,000 | | | 1,100,970 |
Lower Colorado Riv. Auth. Rev., Rfdg. & Impt., Ser. A | | A1 | | 7.25 | | 05/15/37 | | | 5,000 | | | 5,447,699 |
Matagorda Cnty. Nav. Dist. No. 1, Pollution Ctl. Rev., Rfdg. Bnds. (AEP Texas Proj.), Ser. B, Remarketed, A.M.B.A.C., A.M.T. | | Baa2 | | 4.55 | | 05/01/30 | | | 2,000 | | | 1,422,060 |
Mission Econ. Dev. Corp., Allied Waste, Inc., Proj. A, A.M.T. | | Baa3 | | 5.20 | | 04/01/18 | | | 2,000 | | | 1,776,200 |
North Tex Twy. Auth. Rev., Rfdg. Sys.
First Tier, Ser. A (Mandatory put date 1/1/13) | | A2 | | 5.75 | | 01/01/40 | | | 3,500 | | | 3,411,135 |
First Tier, Ser. H | | A2 | | 5.00 | | 01/01/42 | | | 3,000 | | | 3,010,770 |
Second Tier Rfdg., Ser. F | | A3 | | 5.75 | | 01/01/38 | | | 2,500 | | | 2,346,650 |
Sabine River Auth. Poll. Ctrl. Rev., TXU Energy Co. LLC Proj., Ser. B | | Caa2 | | 6.15 | | 08/01/22 | | | 1,000 | | | 400,710 |
See Notes to Financial Statements.
| | |
| 26 | | Visit our website at www.jennisondryden.com |
| | | | | | | | | | | | |
| Description (a) | | Moody’s
Rating*†
(Unaudited) | | Interest
Rate | | Maturity
Date | | Principal
Amount (000) | | Value (Note 1) |
| | | | | | | | | | | | |
Texas (cont’d.) | | | | | | | | | | | | |
San Leanna Ed. Facs. Corp. Higher Ed. Rev. Rfdg., Saint Edwards Univ. Proj. | | Baa2 | | 4.75% | | 06/01/32 | | $ | 2,750 | | $ | 2,025,403 |
Tarrant Cnty. Cultural Ed. Facs. Fin. Corp. Retirement Fac. C.C. Young Mem. Home Proj. | | NR | | 5.75 | | 02/15/25 | | | 1,150 | | | 810,520 |
Texas Mun. Gas Acquisition & Supply Corp. I Gas Supply Rev., Sr. Lien, Ser. A | | A2 | | 5.25 | | 12/15/26 | | | 3,900 | | | 2,970,942 |
Texas Mun. Pwr. Agcy. Rev., M.B.I.A., E.T.M., C.A.B.S.(e) | | A2 | | 2.77(k) | | 09/01/15 | | | 50 | | | 41,994 |
Texas St. Pub. Fin. Auth. Charter Sch. Fin. Corp. Rev., Ed. Cosmos Fndtn., Ser. A | | NR | | 5.375 | | 02/15/37 | | | 1,000 | | | 596,650 |
Ed. Idea Pub. Sch. Proj., Ser. A, A.C.A. | | BBB-(b) | | 5.00 | | 08/15/30 | | | 2,000 | | | 1,232,820 |
Texas Trans. Comm. Cent. Tex. Tpk. Sys. Rev. (Mandatory put date 2/15/11) | | Baa1 | | 5.00 | | 08/15/42 | | | 2,000 | | | 2,019,640 |
| | | | | | | | | | | | |
| | | | | | | | | | | | 44,548,115 |
| | | | | |
Virginia 3.4% | | | | | | | | | | | | |
Chesapeake Hosp. Auth. Fac. Rev., Rfdg. Chesapeake Gen. Hosp., Ser. A | | A3 | | 5.25 | | 07/01/17 | | | 3,445 | | | 3,519,309 |
Chesterfield Cnty. Ind. Dev. Auth. Poll. Ctrl. Rev., Virginia Elec. & Pwr., Ser. A | | Baa1 | | 5.875 | | 06/01/17 | | | 2,000 | | | 2,068,980 |
Gloucester Cnty. Ind. Dev. Auth. Solid Wste. Disp. Rev., Wste. Mgmt. Svcs., Ser. A, A.M.T. (Mandatory put date 5/1/14) | | BBB(b) | | 5.125 | | 09/01/38 | | | 2,700 | | | 2,539,188 |
Norfolk Redev. & Hsg. Auth. Multi-Fam. Rental Hsg. Fac. Rev., Sussex Apts., A.M.T. | | NR | | 8.00 | | 09/01/26 | | | 5,315 | | | 4,926,101 |
Sussex Cnty. Ind. Dev. Auth. Solid Wste. Disp. Rev., Atlantic Wste., Ser. A, A.M.T. (Mandatory put date 5/1/14) | | BBB(b) | | 5.125 | | 06/01/28 | | | 1,600 | | | 1,504,704 |
| | | | | | | | | | | | |
| | | | | | | | | | | | 14,558,282 |
See Notes to Financial Statements.
| | |
| Dryden Municipal Bond Fund | | 27 |
Portfolio of Investments
as of April 30, 2009 continued
| | | | | | | | | | | | |
| Description (a) | | Moody’s
Rating*†
(Unaudited) | | Interest
Rate | | Maturity
Date | | Principal
Amount (000) | | Value (Note 1) |
| | | | | | | | | | | | |
Washington 1.6% | | | | | | | | | | | | |
Bellevue Conv. Ctr. Auth., King City, Spec. Oblig. Rev., M.B.I.A., C.A.B.S. | | Baa1 | | 1.49(k)% | | 02/01/10 | | $ | 870 | | $ | 860,282 |
Skagit Cnty. Pub. Hosp. Dist. No. 001 Rev.,
Skagit Valley Hosp. | | Baa2 | | 5.375 | | 12/01/22 | | | 1,190 | | | 981,167 |
Skagit Valley Hosp. | | Baa2 | | 5.50 | | 12/01/30 | | | 1,250 | | | 896,225 |
Skagit Valley Hosp. | | Baa2 | | 5.75 | | 12/01/32 | | | 1,000 | | | 760,320 |
Tobacco Settlement Fin. Corp. Auth. Tobacco Settlement Rev., Asset Bkd. | | Baa3 | | 6.50 | | 06/01/26 | | | 2,325 | | | 2,232,325 |
Washington Hlthcare. Fac. Auth. Rev., Swedish Hlth. Svcs., Ser. A | | A2 | | 6.50 | | 11/15/33 | | | 1,000 | | | 995,100 |
Washington St. Pub. Pwr. Sup. Sys. Rev., Nuclear Proj. No. 1, Ser. B, E.T.M.(e) | | Aaa | | 7.25 | | 07/01/09 | | | 180 | | | 182,063 |
| | | | | | | | | | | | |
| | | | | | | | | | | | 6,907,482 |
| | | | | |
West Virginia 2.1% | | | | | | | | | | | | |
Monongalia Cnty. Bldg. Commn. Hosp. Rev., General Hosp., Ser. A | | BBB+(b) | | 5.25 | | 07/01/25 | | | 1,500 | | | 1,229,250 |
West Virginia St. Hosp. Fin. Auth. Hosp. Rev., Oak Hill Hosp., Ser. B. (Prerefunded 9/1/10)(e) | | A2 | | 6.75 | | 09/01/30 | | | 7,000 | | | 7,594,510 |
| | | | | | | | | | | | |
| | | | | | | | | | | | 8,823,760 |
| | | | | |
Wisconsin 1.2% | | | | | | | | | | | | |
Badger Tobacco Asset Secur. Corp., Rev. Asset Bkd. | | Aaa | | 6.125 | | 06/01/27 | | | 2,340 | | | 2,508,503 |
Milwaukee Redev. Auth. Redev. Rev. Science Ed. Consortium Proj., Ser. A | | BBB-(b) | | 5.75 | | 08/01/35 | | | 1,500 | | | 1,049,010 |
Wisconsin Hlth. & Edl. Facs. Auth. Rev., Eastcastle Place, Inc. Proj. | | NR | | 6.125 | | 12/01/34 | | | 1,000 | | | 653,370 |
Beaver Dam Cmnty. Hosp., Inc., Ser. A | | NR | | 6.75 | | 08/15/34 | | | 1,250 | | | 885,688 |
| | | | | | | | | | | | |
| | | | | | | | | | | | 5,096,571 |
| | | | | | | | | | | | |
Total long-term investments
(cost $498,152,864) | | | | | | | | | | | | 416,219,460 |
| | | | | | | | | | | | |
See Notes to Financial Statements.
| | |
| 28 | | Visit our website at www.jennisondryden.com |
| | | | | | | | | | | | |
| Description (a) | | Moody’s
Rating*†
(Unaudited) | | Interest
Rate | | Maturity
Date | | Principal
Amount (000) | | Value (Note 1) |
| | | | | | | | | | | | |
SHORT-TERM INVESTMENTS 0.4% | | | | | | | | | | |
| | | | | |
Alabama 0.2% | | | | | | | | | | | | |
Mobile Ala. Indl. Dev. Brd. Pollution. Ctl. Rev., Alabama Pwr Co. Proj., F.R.D.D.(g) | | VMIG1 | | .50% | | 05/01/09 | | $ | 750 | | $ | 750,000 |
| | | | | |
California 0.2% | | | | | | | | | | | | |
Sacramento Cnty. Santn. Dist. Fing. Auth. Rev., F.R.D.D.(g) | | VMIG1 | | .40 | | 05/01/09 | | | 100 | | | 100,000 |
Sacramento Cnty. Santn. Dist. Fing. Auth. Rev., F.R.D.D.(g) | | VMIG1 | | .40 | | 05/01/09 | | | 300 | | | 300,000 |
Santa Clara Elec.
Rev., F.R.D.D.(g) | | VMIG1 | | .40 | | 05/01/09 | | | 300 | | | 300,000 |
| | | | | | | | | | | | |
| | | | | | | | | | | | 700,000 |
| | | | | | | | | | | | |
Total short-term investments
(cost $1,450,000) | | | | | | | | | | | | 1,450,000 |
| | | | | | | | | | | | |
Total Investments 99.0%
(cost $499,602,864; Note 5)(l) | | | | | | | | | | | | 417,669,460 |
Other assets in excess of liabilities(m) 1.0% | | | | | | | | | | | | 4,425,071 |
| | | | | | | | | | | | |
Net Assets 100.0% | | | | | | | | | | | $ | 422,094,531 |
| | | | | | | | | | | | |
| * | The Series’ current Statement of Additional Information contains a description of Moody’s and Standard & Poor’s ratings. |
| † | The ratings reflected are as of April 30, 2009. Ratings of certain bonds may have changed subsequent to that date. |
| (a) | The following abbreviations are used in portfolio descriptions: |
144A—Securities were purchased pursuant to Rule 144A under the Securities Act of 1933 and may not be resold subject to that rule except to qualified institutional buyers. Unless otherwise noted, 144A securities are deemed to be liquid
A.C.A.—ACA Financial Guaranty Corporation.
A.G.C.—Assured Guaranty Corporation.
A.M.B.A.C.—American Municipal Bond Assurance Corporation.
A.M.T.—Alternative Minimum Tax.
C.A.B.S.—Capital Appreciation Bonds.
E.T.M.—Escrowed to Maturity.
F.G.I.C.—Financial Guaranty Insurance Company.
F.H.L.M.C.—Federal Home Loan Mortgage Corporation.
F.N.M.A.—Federal National Mortgage Association.
See Notes to Financial Statements.
| | |
| Dryden Municipal Bond Fund | | 29 |
Portfolio of Investments
as of April 30, 2009 continued
F.R.D.D.—Floating Rate Daily Demand Note.
G.N.M.A.—Government National Mortgage Association.
G.O.—General Obligation.
I.D.B.—Industrial Development Bond.
LLC—Limited Liability Corporation.
M.B.I.A.—Municipal Bond Investors Assurance Company.
NR—Not Rated by Moody’s or Standard & Poor’s.
P.C.R.—Pollution Control Revenue.
P.S.F.G.—Permanent School Fund Guaranty.
R.I.B.S.—Residual Interest Bearing Securities.
S.A.V.R.S.—Select Auction Variable Rate Securities.
| (b) | Standard & Poor’s rating. |
| (c) | Represents issuer in default of interest payments; non-income producing security. |
| (d) | Represents issuer in default of interest payments; stated rate does not reflect the current yield. |
| (e) | All or partial escrowed to maturity and pre-refunded issues are secured by escrowed cash and/or U.S. guaranteed obligations. |
| (f) | All or partial principal amount segregated as initial margin on financial futures contracts. |
| (g) | Indicates a variable rate security. The maturity date presented for these instruments is the later of the next date on which the security can be redeemed at par or the next date on which the rate of interest is adjusted. The interest rate shown reflects the rate in effect at April 30, 2009. |
| (h) | Indicates a security that has been deemed illiquid. |
| (i) | Indicates a security restricted to resale. The aggregate original cost of such securities is $41,338,325. The aggregate value of $13,623,261 is approximately 3.2% of net assets. |
| (j) | Inverse floating rate bond. The coupon is inversely indexed to a floating interest rate. The rate shown is the rate as of April 30, 2009. |
| (k) | Represents a zero coupon or step bond. Rate shown reflects the effective yield at April 30, 2009. |
| (l) | As of April 30, 2009, 2 securities representing $7,671,744 and 1.8% of the net assets were fair valued in accordance with the policies adopted by the Board of Trustees. |
| (m) | Other assets in excess of liabilities include net unrealized depreciation on financial futures as follows: |
Open futures contracts outstanding at April 30, 2009:
| | | | | | | | | | | | | | |
Number of
Contracts | | Type | | Expiration
Date | | Value at
April 30,
2009 | | Value at
Trade
Date | | Unrealized
Appreciation/
(Depreciation) | |
| | Long Positions: | | | | | | | | | | | | |
| 26 | | U.S. Treasury 2 Yr. Notes | | Jun. 09 | | $ | 5,656,219 | | $ | 5,635,549 | | $ | 20,670 | |
| 40 | | U.S. Treasury 5 Yr. Notes | | Jun. 09 | | | 4,685,625 | | | 4,697,346 | | | (11,721 | ) |
| 68 | | U.S. Treasury 10 Yr. Notes | | Jun. 09 | | | 8,223,750 | | | 8,238,289 | | | (14,539 | ) |
| 37 | | U.S. Long Bond | | Jun. 09 | | | 4,534,812 | | | 4,561,452 | | | (26,640 | ) |
| | | | | | | | | | | | | | |
| . | | | | | | | | | | | | $ | (32,230 | ) |
| | | | | | | | | | | | | | |
See Notes to Financial Statements.
| | |
| 30 | | Visit our website at www.jennisondryden.com |
Various inputs are used in determining the value of the Series’ investments. These inputs are summarized in the three broad levels listed below.
Level 1—quoted prices in active markets for identical securities
Level 2—other significant observable inputs (including quoted prices for similar securities, interest rates, prepayment speeds, credit risk, etc.)
Level 3—significant unobservable inputs (including the Series’ own assumptions in determining the fair value of investments)
The following is a summary of the inputs used as of April 30, 2009 in valuing the Series’ assets carried at fair value:
| | | | | | | |
Valuation inputs | | Investments
in Securities | | Other Financial
Instruments* | |
Level 1—Quoted Prices | | $ | — | | $ | (32,230 | ) |
Level 2—Other Significant Observable Inputs | | | 409,997,716 | | | — | |
Level 3—Significant Unobservable Inputs | | | 7,671,744 | | | — | |
| | | | | | | |
Total | | $ | 417,669,460 | | $ | (32,230 | ) |
| | | | | | | |
| * | Other financial instruments are derivative instruments not reflected in the Portfolio of Investments, such as futures, forwards and swap contracts, which are valued at the unrealized appreciation/depreciation on the instrument. |
The following is a reconciliation of assets in which significant unobservable inputs (Level 3) were used in determining fair value:
| | | | |
| | | Investments
in Securities | |
Balance as of 4/30/08 | | $ | 22,619,999 | |
Realized gain (loss) | | | — | |
Change in unrealized appreciation (depreciation) | | | (15,761,293 | ) |
Net purchases (sales) | | | — | |
Transfers in and/or out of Level 3 | | | 813,038 | |
| | | | |
Balance as of 4/30/09 | | $ | 7,671,744 | |
| | | | |
See Notes to Financial Statements.
| | |
| Dryden Municipal Bond Fund | | 31 |
Portfolio of Investments
as of April 30, 2009 continued
The industry classification of long-term portfolio holdings, short-term investments and other assets in excess of liabilities shown as a percentage of net assets as of April 30, 2009 was as follows:
| | | |
Healthcare | | 25.5 | % |
Corporate Backed I.D.B. & P.C.R. | | 16.3 | |
Pre-Refunded | | 12.6 | |
Other | | 9.8 | |
Special Tax/Assessment District | | 8.0 | |
Transportation | | 7.9 | |
Education | | 5.1 | |
Power | | 4.4 | |
Tobacco | | 3.4 | |
General Obligation | | 2.2 | |
Housing | | 1.7 | |
Solid Waste/Resource Recovery | | 0.8 | |
Lease Backed Certificate of Participation | | 0.6 | |
Short-Term Investments | | 0.4 | |
Water & Sewer | | 0.3 | |
| | | |
| | 99.0 | |
Other assets in excess of liabilities | | 1.0 | |
| | | |
Net Assets | | 100.0 | % |
| | | |
Industry classification is subject to change.
See Notes to Financial Statements.
| | |
| 32 | | Visit our website at www.jennisondryden.com |
Financial Statements
| | |
| APRIL 30, 2009 | | ANNUAL REPORT |
Dryden Municipal Bond Fund
High Income Series
Statement of Assets and Liabilities
as of April 30, 2009
| | | | |
Assets | | | | |
Unaffiliated investments, at value (cost $499,602,864) | | $ | 417,669,460 | |
Cash | | | 27,235 | |
Interest receivable | | | 8,449,519 | |
Receivable for Series shares sold | | | 949,984 | |
Prepaid expenses | | | 3,997 | |
| | | | |
Total assets | | | 427,100,195 | |
| | | | |
| |
Liabilities | | | | |
Payable for investments purchased | | | 3,454,622 | |
Dividends payable | | | 705,681 | |
Payable for Series shares reacquired | | | 397,314 | |
Management fee payable | | | 169,743 | |
Accrued expenses | | | 122,494 | |
Distribution fee payable | | | 100,460 | |
Affiliated transfer agent fee payable | | | 23,935 | |
Due to broker—variation margin | | | 17,063 | |
Deferred trustees’ fees | | | 14,352 | |
| | | | |
Total liabilities | | | 5,005,664 | |
| | | | |
| |
Net Assets | | $ | 422,094,531 | |
| | | | |
| | | | | |
Net assets were comprised of: | | | | |
Shares of beneficial interest, at par | | $ | 496,013 | |
Paid-in capital in excess of par | | | 528,050,580 | |
| | | | |
| | | 528,546,593 | |
Undistributed net investment income | | | 1,660,252 | |
Accumulated net realized loss on investments | | | (26,146,680 | ) |
Net unrealized depreciation on investments | | | (81,965,634 | ) |
| | | | |
Net assets, April 30, 2009 | | $ | 422,094,531 | |
| | | | |
See Notes to Financial Statements.
| | |
| 34 | | Visit our website at www.jennisondryden.com |
| | | |
Class A | | | |
Net asset value and redemption price per share
($339,959,443 ÷ 39,951,290 shares of beneficial interest issued and outstanding) | | $ | 8.51 |
Maximum sales charge (4% of offering price) | | | .35 |
| | | |
Maximum offering price to public | | $ | 8.86 |
| | | |
| |
Class B | | | |
Net asset value, offering price and redemption price per share
($25,819,517 ÷ 3,032,160 shares of beneficial interest issued and outstanding) | | $ | 8.52 |
| | | |
| |
Class C | | | |
Net asset value, offering price and redemption price per share
($36,473,882 ÷ 4,284,166 shares of beneficial interest issued and outstanding) | | $ | 8.51 |
| | | |
| |
Class Z | | | |
Net asset value, offering price and redemption price per share
($19,841,689 ÷ 2,333,664 shares of beneficial interest issued and outstanding) | | $ | 8.50 |
| | | |
See Notes to Financial Statements.
| | |
| Dryden Municipal Bond Fund | | 35 |
Statement of Operations
Year Ended April 30, 2009
| | | | |
Net Investment Income | | | | |
Income | | | | |
Unaffiliated interest | | $ | 29,576,717 | |
| | | | |
| |
Expenses | | | | |
Management fee | | | 2,152,333 | |
Distribution fee—Class A | | | 885,743 | |
Distribution fee—Class B | | | 165,560 | |
Distribution fee—Class C | | | 228,843 | |
Transfer agent’s fees and expenses (including affiliated expense of $119,200) | | | 174,000 | |
Custodian’s fees and expenses | | | 95,000 | |
Interest expense and fees related to inverse floaters (Note 1) | | | 76,396 | |
Registration fees | | | 45,000 | |
Audit fee | | | 29,000 | |
Trustees’ fees | | | 24,000 | |
Reports to shareholders | | | 20,000 | |
Legal fees and expenses | | | 18,000 | |
Insurance | | | 7,000 | |
Miscellaneous | | | 9,295 | |
| | | | |
Total expenses | | | 3,930,170 | |
Less: Custodian fee credit (Note 1) | | | (446 | ) |
| | | | |
Net expenses | | | 3,929,724 | |
| | | | |
Net investment income | | | 25,646,993 | |
| | | | |
| |
Realized And Unrealized Gain (Loss) On Investments | | | | |
Net realized gain (loss) on: | | | | |
Investment transactions | | | (1,691,609 | ) |
Financial futures transactions | | | 2,975,476 | |
| | | | |
| | | 1,283,867 | |
| | | | |
Net change in unrealized appreciation (depreciation) on: | | | | |
Investments | | | (64,381,825 | ) |
Financial futures contracts | | | 90,142 | |
| | | | |
| | | (64,291,683 | ) |
| | | | |
Net loss on investments | | | (63,007,816 | ) |
| | | | |
Net Decrease In Net Assets Resulting From Operations | | $ | (37,360,823 | ) |
| | | | |
See Notes to Financial Statements.
| | |
| 36 | | Visit our website at www.jennisondryden.com |
Statement of Changes in Net Assets
| | | | | | | | |
| | | Year Ended April 30, | |
| | | 2009 | | | 2008 | |
Increase (Decrease) In Net Assets | | | | | | | | |
Operations | | | | | | | | |
Net investment income | | $ | 25,646,993 | | | $ | 24,540,919 | |
Net realized gain (loss) on investments | | | 1,283,867 | | | | (93,279 | ) |
Net change in unrealized appreciation (depreciation) on investments | | | (64,291,683 | ) | | | (35,489,346 | ) |
| | | | | | | | |
Net decrease in net assets resulting from operations | | | (37,360,823 | ) | | | (11,041,706 | ) |
| | | | | | | | |
Dividends from net investment income (Note 1) | | | | | | | | |
Class A | | | (20,654,762 | ) | | | (20,030,582 | ) |
Class B | | | (1,817,063 | ) | | | (2,310,157 | ) |
Class C | | | (1,660,280 | ) | | | (1,231,816 | ) |
Class Z | | | (793,958 | ) | | | (473,249 | ) |
| | | | | | | | |
| | | (24,926,063 | ) | | | (24,045,804 | ) |
| | | | | | | | |
| | |
Series share transactions (Net of share conversions) (Note 6) | | | | | | | | |
Net proceeds from shares sold | | | 71,005,125 | | | | 35,741,799 | |
Net asset value of shares issued in reinvestment of dividends | | | 14,292,107 | | | | 13,250,524 | |
Cost of shares reacquired | | | (69,007,379 | ) | | | (88,976,896 | ) |
| | | | | | | | |
Net increase (decrease) in net assets from Series share transactions | | | 16,289,853 | | | | (39,984,573 | ) |
| | | | | | | | |
Total decrease | | | (45,997,033 | ) | | | (75,072,083 | ) |
| | |
Net Assets | | | | | | | | |
Beginning of year | | | 468,091,564 | | | | 543,163,647 | |
| | | | | | | | |
End of year(a) | | $ | 422,094,531 | | | $ | 468,091,564 | |
| | | | | | | | |
(a) Includes undistributed net investment income of: | | $ | 1,660,252 | | | $ | 2,126,816 | |
| | | | | | | | |
See Notes to Financial Statements.
| | |
| Dryden Municipal Bond Fund | | 37 |
Notes to Financial Statements
Dryden Municipal Bond Fund (the “Fund”) is registered under the Investment Company Act of 1940 as a diversified, open-end management investment company. The Fund was organized as an unincorporated business trust in Massachusetts on November 3, 1986 and formerly consisted of two series: the High Income Series (the “Series”) and the “Insured Series”. These financial statements relate only to the Series. The Insured Series completed a reorganization on April 19, 2009 as detailed below.
The Board of Trustees of the Fund and the Board of Directors of Dryden National Municipals Fund, Inc. (“Dryden National”) recently approved the reorganization of the Insured Series into Dryden National. Pursuant to this reorganization, the assets and liabilities of Insured Series were exchanged for shares of Dryden National. The Dryden National shares received by the Insured Series shareholders in the reorganization were equal in value, were of the same class, and were subject to the same distribution fees, account maintenance fees, and sales charges, including contingent deferred sales charges, if any, as the Insured Series shares held by such shareholders immediately prior to the reorganization. Insured Series shareholders became shareholders of Dryden National. No sales charges were imposed in connection with the transaction. The reorganization transaction did not result in any adverse federal income tax consequences to Dryden National, Insured Series, or their respective shareholders.
The investment objective of the Series is to provide the maximum amount of income that is eligible for exclusion from federal income taxes. The ability of issuers of debt securities held by the Fund to meet their obligations may be affected by economic and political developments in a specific state, region or industry.
Note 1. Accounting Policies
The following is a summary of significant accounting policies followed by the Fund in the preparation of its financial statements.
Securities Valuation: The Fund values municipal securities (including commitments to purchase such securities on a “when-issued” basis) as of the normal close of trading on the New York Stock Exchange, on the basis of prices provided by a pricing service which uses information with respect to transactions in comparable securities and various relationships between securities in determining values. Securities listed on a securities exchange (other than options on securities and indices) are valued at the
| | |
| 38 | | Visit our website at www.jennisondryden.com |
last sale price on such exchange on the day of valuation or, if there was no sale on such day, at the mean between the last reported bid and asked prices, or at the last bid price on such day in the absence of an asked price. Securities that are actively traded in the over-the-counter market, including listed securities for which the primary market is believed by Prudential Investments LLC (“PI” or “Manager”) in consultation with the subadvisor, to be over-the-counter, are valued at market value using prices provided, by an independent pricing agent or principal market maker. Futures contracts and options thereon traded on a commodities exchange or board of trade are valued at the last sale price at the close of trading on such exchange or board of trade or, if there was no sale on the applicable commodities exchange or board of trade on such day, at the mean between the most recently quoted prices on such exchange or board of trade or at the last bid price in the absence of an asked price. Securities for which reliable market quotations are not readily available or for which the pricing service does not provide a valuation methodology, or does not present fair value, are valued at fair value in accordance with Board of Trustees’ approved fair valuation procedures. When determining the fair valuation of securities some of the factors influencing the valuation include, the nature of any restrictions on disposition of the securities; assessment of the general liquidity of the securities; the issuer’s financial condition and the markets in which it does business; the cost of the investment; the size of the holding and the capitalization of issuer; the prices of any recent transactions or bids/offers for such securities or any comparable securities; any available analyst media or other reports or information deemed reliable by the investment adviser regarding the issuer or the markets or industry in which it operates. Using fair value to price securities may result in a value that is different from a security’s most recent closing price and from the price used by other mutual funds to calculate their net asset values. Investments in mutual funds are valued at their net asset value as of the close of the New York Stock Exchange on the date of valuation.
Short-term debt securities which mature in sixty days or less are valued at amortized cost, which approximates market value. The amortized cost method involves valuing a security at its cost on the date of purchase and thereafter assuming a constant amortization to maturity of the difference between the principal amount due at maturity and cost. Short-term debt securities which mature in more than sixty days are valued at current market quotations.
Restricted Securities: The Fund may hold up to 15% of its net assets in illiquid securities, including those which are restricted as to disposition under securities law (“restricted securities”). Restricted securities held by the Fund at the end of the fiscal period may include registration rights under which the Fund may demand registration by the issuers, of which the Fund may bear the cost of such registration. Restricted securities, are valued pursuant to the valuation procedures noted above.
| | |
| Dryden Municipal Bond Fund | | 39 |
Notes to Financial Statements
continued
Financial Futures Contracts: A financial futures contract is an agreement to purchase (long) or sell (short) an agreed amount of securities at a set price for delivery on a future date. Upon entering into a financial futures contract, the Fund is required to pledge to the broker an amount of cash and/or other assets equal to a certain percentage of the contract amount. This amount is known as the “initial margin”. Subsequent payments, known as “variation margin”, are made or received by the Fund each day, depending on the daily fluctuations in the value of the underlying security. Such variation margin is recorded for financial statement purposes on a daily basis as unrealized gain or loss. When the contract expires or is closed, the gain or loss is realized and is presented in the Statement of Operations as net realized gain or loss on financial futures contracts.
The Fund invests in financial futures contracts in order to hedge its existing portfolio securities, or securities the Fund intends to purchase, against fluctuations in value caused by changes in prevailing interest rates or market conditions. Should interest rates move unexpectedly, the Fund may not achieve the anticipated benefits of the financial futures contracts and may realize a loss. The use of futures transactions involves the risk of imperfect correlation in movements in the price of futures contracts, interest rates and the underlying hedged assets.
Options: The Fund may either purchase or write options in order to hedge against adverse market movements or fluctuations in value caused by changes in prevailing interest rates with respect to securities which the Fund currently owns or intends to purchase. The Fund’s principal reason for writing options is to realize, through receipt of premiums, a greater current return than would be realized on the underlying security alone. When the Fund purchases an option, it pays a premium and an amount equal to that premium is recorded as an asset. When the Fund writes an option, it receives a premium and an amount equal to that premium is recorded as a liability. The asset or liability is adjusted daily to reflect the current market value of the option.
If an option expires unexercised, the Fund realizes a gain or loss to the extent of the premium received or paid. If an option is exercised, the premium received or paid is an adjustment to the proceeds from the sale or the cost of the purchase in determining whether the Fund has realized a gain or loss. The difference between the premium and the amount received or paid on effecting a closing purchase or sale transaction is also treated as a realized gain or loss. Gain or loss on purchased options is included
| | |
| 40 | | Visit our website at www.jennisondryden.com |
in net realized gain or loss on investment transactions. Gain or loss on written options is presented separately as net realized gain or loss on written options.
The Fund, as writer of an option, has no control over whether the underlying securities may be sold (called) or purchased (put). As a result, the Fund bears the market risk of an unfavorable change in the price of the security underlying the written option. The Fund, as purchaser of an option that is traded in the over-the counter market, bears the risk of the potential inability of the counterparties to meet the terms of their contracts.
Interest Rate Swap: The Fund may enter into interest rate swaps. In a simple interest rate swap, one investor pays a floating rate of interest on a notional amount and receives a fixed rate of interest on the same notional principal amount for a specified period of time. Alternatively, an investor may pay a fixed rate and receive a floating rate. Interest rate swaps were developed as asset/liability management tools. In more complex swaps, the notional principal may decline (or amortize) over time.
During the term of the swap, changes in the value of the swap are recorded as unrealized gains or losses by “marking-to-market” to reflect the market value of the swap. When the swap is terminated, the Fund will record a realized gain or loss equal to the difference between the proceeds from (or cost of) the closing transaction and the Fund’s basis in the contract, if any. The Fund is exposed to credit loss in the event of non-performance by the other party to the interest rate swap. However, the Fund does not anticipate non-performance by any counterparty.
Written options, future contracts and swap contracts involve elements of both market and credit risk in excess of the amounts reflected in the Statement of Assets and Liabilities.
Floating-Rate Notes Issued in Conjunction with Securities Held: The Fund invests in inverse floating rate securities (“inverse floaters”) that pay interest at a rate that varies inversely with short-term interest rates. Certain of these securities may be leveraged, whereby the interest rate varies inversely at a multiple of the change in short-term rates. As interest rates rise, inverse floaters produce less current income. The price of such securities is more volatile than comparable fixed rate securities.
When the Fund enters into agreements to create inverse floaters and floater note securities (also known as Tender Option Bond Transactions), the Fund transfers a fixed rate bond to a broker for cash. At the same time the Fund buys (receives) a residual interest in a trust (the “trust”) set up by the broker, often referred to as an inverse floating rate obligation (inverse floaters). Generally, the broker deposits a fixed
| | |
| Dryden Municipal Bond Fund | | 41 |
Notes to Financial Statements
continued
rate bond (the “fixed rate bond”) into the trust with the same CUSIP number as the fixed rate bond sold to the broker by the Fund. The “trust” also issues floating rate notes (“floating rate notes”), which are sold to third parties. The floating rate notes have interest rates that reset weekly. The inverse floater held by the Fund gives the Fund the right (1) to cause the holders of the floating rate notes to tender their notes at par, and (2) to have the broker transfer the fixed rate bond held by the trust to the Fund thereby collapsing the trust. In accordance with FAS Statement No. 140, the Fund accounts for the transaction described above as funded leverage by including the fixed rate bond in its Portfolio of Investments, and accounts for the floating rate notes as a liability under the caption “payable for floating rate notes issued” in the Fund’s “Statement of Assets and Liabilities.” Interest expense related to the Fund’s liability in connection with the floating rate notes held by third parties is recorded as incurred. The interest expense is under the caption “interest expenses and fees related to inverse floaters” in the Fund’s “Statement of Operations” and is also included in the Fund’s expense ratio.
The Fund may also invest in inverse floaters without transferring a fixed rate bond into a trust, which is not accounted for as funded leverage. The interest rates on these securities have an inverse relationship to the interest rate of other securities or the value of an index. Changes in interest rates on the other security or index inversely affect the rate paid on the inverse floater, and the inverse floater’s price will be more volatile than that of a fixed-rate bond. Additionally, some of these securities contain a “leverage factor” whereby the interest rate moves inversely by a “factor” to the benchmark rate. Certain interest rate movements and other market factors can substantially affect the liquidity of inverse floating rate notes.
The Fund’s investment policies and restrictions permit investments in inverse floating rate securities. Inverse floaters held by the Fund are securities exempt from registration under Rule 144A of the Securities Act of 1933.
When-Issued/Delayed Delivery Securities: Securities purchased or sold on a when-issued or delayed-delivery basis may be settled a month or more after trade date; interest income is not accrued until settlement date. At the time a Fund enters into such transactions, it instructs the custodian to segregate assets with a current value at least equal to the amount of its when-issued or delayed-delivery purchase commitments.
Securities Transactions and Net Investment Income: Securities transactions are recorded on the trade date. Realized gains or losses on sales of investments are
| | |
| 42 | | Visit our website at www.jennisondryden.com |
calculated on the identified cost basis. Interest income, including amortization of premium and accretion of discount on debt securities, as required, is recorded on the accrual basis as an adjustment to interest income.
Net investment income or loss (other than distribution fees, which are charged directly to the respective Class) and unrealized and realized gains or losses, are allocated daily to each class of shares based upon the relative proportion of net assets of each class at the beginning of the day.
Dividends and Distributions: The Fund declares dividends from net investment income daily and payment is made monthly. Distributions of net realized capital and currency gains, if any, annually. Dividends and distributions to shareholders, which are determined in accordance with federal income tax regulations and which may differ from generally accepted accounting principles, are recorded on the ex-dividend date. Permanent book/tax differences relating to income and gains are reclassified amongst undistributed net investment income, accumulated net realized gain or loss and paid- in capital in excess of par, as appropriate.
Federal Income Taxes: For federal income tax purposes, the Series is treated as a separate taxpaying entity. It is the Fund’s policy to continue to meet the requirements of the Internal Revenue Code applicable to regulated investment companies and to distribute all of its taxable net income and capital gains, if any, to its shareholders. Therefore, no federal income tax provision is required.
Custody Fee Credits: The Fund has an arrangement with its custodian bank, whereby uninvested cash earn credits which reduce the fees charged by the custodian. Such custody fee credits, if any, are presented as a reduction of gross expenses in the accompanying Statement of Operations.
Estimates: The preparation of the financial statements requires management to make estimates and assumptions that affect the reported amounts and disclosures in the financial statements. Actual results could differ from those estimates.
Note 2. Agreements
The Fund has a management agreement with PI. Pursuant to this agreement, PI has responsibility for all investment advisory services and supervises the subadviser’s performance of such services. PI has entered into a subadvisory agreement with Prudential Investment Management (“PIM”). The Subadvisory Agreement provides that PIM will furnish investment advisory services in connection with the
| | |
| Dryden Municipal Bond Fund | | 43 |
Notes to Financial Statements
continued
management of the Fund. PI pays for the services of PIM, the cost of compensation of officers for the Fund, occupancy and certain clerical and bookkeeping cost of the Fund. The Fund bears all other costs and expenses.
The management fee paid to PI is computed daily and payable monthly at an annual rate of .50 of 1% of the Series’ average daily net assets of up to $1 billion and .45 of 1% of the average daily net assets in excess of $1 billion. The effective management fee rate was .50 of 1% for the year ended April 30, 2009.
The Fund has a distribution agreement with Prudential Investment Management Services LLC (“PIMS”) which acts as the distributor of the Fund. The Fund compensates PIMS for distributing and servicing the Fund’s Class A, Class B and Class C shares, pursuant to plans of distribution (the “Class A, B and C Plans”), regardless of expenses actually incurred by it. The distribution fees are accrued daily and payable monthly. No distribution or service fees are paid to PIMS as distributor of the Class Z shares of the Fund.
Pursuant to the Class A, B and C Plans, the Fund compensates PIMS for distribution related activities at an annual rate of up to .30 of 1%, .50 of 1% and 1%, of the average daily net assets of the Class A, B and C shares, respectively. PIMS contractually agreed to limit such fees to .25 of 1% and .75 of 1% average daily net assets of the Class A shares and Class C shares, respectively.
PIMS has advised the Series that it received approximately $213,700 for Class A shares in front-end sales charges during the year ended April 30, 2009. From these fees, PIMS paid such sales charges to affiliated broker-dealers, which in turn paid commissions to salespersons and incurred other distribution costs.
PIMS has advised the Series that for the year ended April 30, 2009, it received approximately $200, $65,500 and $16,500 in contingent deferred sales charges imposed upon certain redemptions by Class A, Class B and C shareholders, respectively.
PI, PIM and PIMS are indirect wholly owned subsidiaries of Prudential Financial, Inc. (“Prudential”).
The Series, along with other affiliated registered investment companies (the “Funds”), is a party to a Syndicated Credit Agreement (“SCA”) with two banks. The SCA
| | |
| 44 | | Visit our website at www.jennisondryden.com |
provides for a commitment of $500 million. Interest on any borrowings under the SCA is incurred at contracted market rates and a commitment fee for the unused amount is accrued daily and paid quarterly. Effective October 24, 2008, the Funds renewed the SCA with the banks. The commitment under the renewed SCA continues to be $500 million. The Funds pay a commitment fee of .13 of 1% of the unused portion of the renewed SCA. The expiration date of the renewed SCA will be October 23, 2009. For the period from October 26, 2007 through October 23, 2008, the Funds paid a commitment fee of .06 of 1% of the unused portion of the agreement. The purpose of the SCA is to provide an alternative source of temporary funding for capital share redemptions. The Series did not utilize the line of credit during the year ended April 30, 2009.
Note 3. Other Transactions With Affiliates
Prudential Mutual Fund Services LLC (“PMFS”), an affiliate of PI and an indirect, wholly-owned subsidiary of Prudential, serves as the Fund’s transfer agent. Transfer agent’s fees and expenses in the Statement of Operations include certain out-of-pocket expenses paid to non-affiliates, where applicable.
The Series pays networking fees to affiliated and unaffiliated broker/dealers including fees relating to the services of First Clearing, LLC (“First Clearing”), an affiliate of PI. These networking fees are payments made to broker/dealers that clear mutual fund transactions through a national clearing system. For the year ended April 30, 2009, the Series incurred approximately $79,300 in total networking fees of which approximately $35,900 was paid to First Clearing. These amounts are included in transfer agent’s fees and expenses in the Statement of Operations.
Note 4. Portfolio Securities
Purchases and sales of portfolio securities, other than short-term investments, for the year ended April 30, 2009, were $129,573,756 and $97,389,810, respectively.
Note 5. Distributions and Tax Information
In order to present undistributed net investment income, accumulated net realized loss on investments and paid-in capital in excess of par on the Statement of Assets and Liabilities that more closely represent their tax character, certain adjustments have been made to paid-in capital in excess of par, undistributed net investment income and accumulated net realized loss on investments. For the year ended April 30, 2009, the adjustments were to decrease undistributed net investment
| | |
| Dryden Municipal Bond Fund | | 45 |
Notes to Financial Statements
continued
income by $1,187,494, to decrease accumulated net realized loss on investments by $19,567,552 and to decrease paid-in capital in excess of par by $18,380,058 due to the difference in the treatment of accreting market discount between financial and tax reporting, expiration of capital loss carryforward and other book to tax differences. Net investment income, net realized gains and net assets were not affected by this change.
For the year ended April 30, 2009, the tax character of dividends paid was $24,926,063 from tax-exempt income. For the year ended April 30, 2008, the tax character of dividends paid was $23,963,657 from tax-exempt income and $82,147 from taxable ordinary income.
As of April 30, 2009, the components of distributable earnings on a tax basis of $2,380,290 from tax-exempt income. This amount includes a dividends payable timing difference of $705,681 as of April 30, 2009.
The United States federal income tax basis of the Series’ investments and net unrealized depreciation as of April 30, 2009 were as follows:
| | | | | | |
Tax Basis | | Appreciation | | (Depreciation) | | Net
Unrealized
(Depreciation) |
| $496,748,923 | | $12,063,329 | | $(91,142,792) | | $(79,079,463 ) |
The difference between book and tax basis were primarily due to the difference between financial and tax reporting with respect to accretion of market discount and accrued income on defaulted securities.
For federal income tax purposes, the Series has a capital loss carryforward as of April 30, 2009 of approximately $29,033,000 of which $13,512,000 expires in 2010, $4,457,000 expires in 2011 and $11,064,000 expires in 2014. During the fiscal year ended April 30, 2009, the Series utilized approximately of $1,715,000 of its capital loss carryforward to offset net taxable gains. Also, approximately $18,380,000 of its capital loss carryforward expired/unused in the fiscal year ended April 30, 2009. Accordingly, no capital gains distributions are expected to be paid to shareholders until net gains have been realized in excess of such carryforwards.
| | |
| 46 | | Visit our website at www.jennisondryden.com |
Management has analyzed the Fund’s tax positions taken on federal income tax returns for all open tax years and has concluded that as of April 30, 2009, no provision for income tax would be required in the Fund’s financial statements. The Fund’s federal and state income and federal excise tax returns for tax years for which the applicable statutes of limitations have not expired are subject to examination by the Internal Revenue Service and state departments of revenue.
Note 6. Capital
The Series offers Class A, Class B, Class C and Class Z shares. Class A shares were sold with a front-end sales charge of up to 4%. All investors who purchase Class A shares in the amount of $1 million or more and sell these shares within 12 months of purchase are subject to a contingent deferred sales charge (CDSC) of 1%, including investors who purchase their shares through broker dealers affiliated with Prudential. Class B shares are sold with a contingent deferred sales charge which declines from 5% to zero depending on the period of time the shares are held. Class C shares are sold with a contingent deferred sales charge of 1% during the first 12 months. Class B shares automatically convert to Class A shares on a quarterly basis approximately seven years after purchase. A special exchange privilege is also available for shareholders who qualify to purchase Class A shares at net asset value. Class Z shares are not subject to any sales or redemption charge and are offered exclusively for sale to a limited group of investors.
The Fund has authorized an unlimited number of shares of beneficial interest of each class at $.01 par value per share. Transactions in shares of beneficial interest were as follows:
| | | | | | | |
Class A | | Shares | | | Amount | |
Year ended April 30, 2009: | | | | | | | |
Shares sold | | 3,598,668 | | | $ | 31,751,924 | |
Shares issued in reinvestment of dividends | | 1,332,745 | | | | 11,804,044 | |
Shares reacquired | | (5,891,454 | ) | | | (52,467,916 | ) |
| | | | | | | |
Net increase (decrease) in shares outstanding before conversion | | (960,041 | ) | | | (8,911,948 | ) |
Shares issued upon conversion from Class B | | 1,297,538 | | | | 11,548,569 | |
| | | | | | | |
Net increase (decrease) in shares outstanding | | 337,497 | | | $ | 2,636,621 | |
| | | | | | | |
Year ended April 30, 2008: | | | | | | | |
Shares sold | | 1,975,627 | | | $ | 19,884,445 | |
Shares issued in reinvestment of dividends | | 1,079,001 | | | | 10,961,426 | |
Shares reacquired | | (6,634,428 | ) | | | (67,479,426 | ) |
| | | | | | | |
Net increase (decrease) in shares outstanding before conversion | | (3,579,800 | ) | | | (36,633,555 | ) |
Shares issued upon conversion from Class B | | 952,059 | | | | 9,633,566 | |
| | | | | | | |
Net increase (decrease) in shares outstanding | | (2,627,741 | ) | | $ | (26,999,989 | ) |
| | | | | | | |
| | |
| Dryden Municipal Bond Fund | | 47 |
Notes to Financial Statements
continued
| | | | | | | |
Class B | | Shares | | | Amount | |
Year ended April 30, 2009: | | | | | | | |
Shares sold | | 685,400 | | | $ | 6,130,979 | |
Shares issued in reinvestment of dividends | | 109,439 | | | | 975,541 | |
Shares reacquired | | (754,855 | ) | | | (6,751,608 | ) |
| | | | | | | |
Net increase (decrease) in shares outstanding before conversion | | 39,984 | | | | 354,912 | |
Shares reacquired upon conversion into Class A | | (1,295,358 | ) | | | (11,548,569 | ) |
| | | | | | | |
Net increase (decrease) in shares outstanding | | (1,255,374 | ) | | $ | (11,193,657 | ) |
| | | | | | | |
Year ended April 30, 2008: | | | | | | | |
Shares sold | | 536,681 | | | $ | 5,465,112 | |
Shares issued in reinvestment of dividends | | 113,529 | | | | 1,155,434 | |
Shares reacquired | | (944,231 | ) | | | (9,607,849 | ) |
| | | | | | | |
Net increase (decrease) in shares outstanding before conversion | | (294,021 | ) | | | (2,987,303 | ) |
Shares reacquired upon conversion into Class A | | (951,258 | ) | | | (9,633,566 | ) |
| | | | | | | |
Net increase (decrease) in shares outstanding | | (1,245,279 | ) | | $ | (12,620,869 | ) |
| | | | | | | |
Class C | | | | | | |
Year ended April 30, 2009: | | | | | | | |
Shares sold | | 2,019,904 | | | $ | 17,947,217 | |
Shares issued in reinvestment of dividends | | 107,106 | | | | 942,918 | |
Shares reacquired | | (602,180 | ) | | | (5,318,906 | ) |
| | | | | | | |
Net increase (decrease) in shares outstanding | | 1,524,830 | | | $ | 13,571,229 | |
| | | | | | | |
Year ended April 30, 2008: | | | | | | | |
Shares sold | | 627,780 | | | $ | 6,324,718 | |
Shares issued in reinvestment of dividends | | 69,082 | | | | 702,287 | |
Shares reacquired | | (809,992 | ) | | | (8,209,881 | ) |
| | | | | | | |
Net increase (decrease) in shares outstanding | | (113,130 | ) | | $ | (1,182,876 | ) |
| | | | | | | |
Class Z | | | | | | |
Year ended April 30, 2009: | | | | | | | |
Shares sold | | 1,760,332 | | | $ | 15,175,005 | |
Shares issued in reinvestment of dividends | | 64,779 | | | | 569,604 | |
Shares reacquired | | (514,786 | ) | | | (4,468,949 | ) |
| | | | | | | |
Net increase (decrease) in shares outstanding | | 1,310,325 | | | $ | 11,275,660 | |
| | | | | | | |
Year ended April 30, 2008: | | | | | | | |
Shares sold | | 409,234 | | | $ | 4,067,524 | |
Shares issued in reinvestment of dividends | | 42,466 | | | | 431,377 | |
Shares reacquired | | (367,417 | ) | | | (3,679,740 | ) |
| | | | | | | |
Net increase (decrease) in shares outstanding | | 84,283 | | | $ | 819,161 | |
| | | | | | | |
| | |
| 48 | | Visit our website at www.jennisondryden.com |
Note 7. New Accounting Pronouncements
In March 2008, the Financial Accounting Standards Board (“FASB”) released Statement of Financial Accounting Standards No. 161, “Disclosures about Derivative Instruments and Hedging Activities” (“FAS 161”). FAS 161 requires qualitative disclosures about objectives and strategies for using derivatives, quantitative disclosures about fair value amounts of and gains and losses on derivative instruments, and disclosures about credit-risk-related contingent features in derivative agreements. The application of FAS 161 is required for any reporting period beginning after November 15, 2008 and interim periods within those fiscal years. At this time, management is evaluating the implications of FAS 161 and its impact on the financial statements has not yet been determined.
In April 2009, the FASB issued FASB Staff Position 157-4, “Determining Fair Value When the Volume and Level of Activity for the Asset or Liability Have Significantly Decreased and Identifying Transactions That Are Not Orderly” (“FSP 157-4”) and is effective for interim and annual periods ending after June 15, 2009. FSP 157-4 provides guidance on determining whether the volume and activity in a market has decreased significantly and whether such a decrease in activity results in transactions that are not orderly. The FSP also indicates that entities should consider and evaluate the impact of decreased market activity and whether transactions are orderly in arriving at a fair value for its assets and liabilities, including evaluating whether values provided by pricing services are based on current information that reflects orderly transactions. FSP 157-4 requires enhanced disclosures around valuation inputs and techniques used during annual and interim periods. Management is currently evaluating the impact the adoption of FSP 157-4 will have on the Series’ financial statement disclosures.
| | |
| Dryden Municipal Bond Fund | | 49 |
Financial Highlights
| | | | |
| | | Class A | |
| | | Year Ended
April 30, 2009(c) | |
Per Share Operating Performance: | | | | |
Net Asset Value, Beginning Of Year | | $ | 9.82 | |
| | | | |
Income (loss) from investment operations: | | | | |
Net investment income | | | .54 | |
Net realized and unrealized gain (loss) on investment transactions | | | (1.33 | ) |
| | | | |
Total from investment operations | | | (.79 | ) |
| | | | |
Less Dividends: | | | | |
Dividends from net investment income | | | (.52 | ) |
| | | | |
Net asset value, end of year | | $ | 8.51 | |
| | | | |
Total Return(a): | | | (8.08 | )% |
Ratios/Supplemental Data: | | | | |
Net assets, end of year (000) | | $ | 339,959 | |
Average net assets (000) | | $ | 354,290 | |
Ratios to average net assets: | | | | |
Expenses, including distribution and service (12b-1) fees(b) | | | .87 | %(d) |
Expenses, excluding distribution and service (12b-1) fees | | | .62 | %(d) |
Net investment income | | | 6.00 | % |
For Class A, B, C and Z shares: | | | | |
Portfolio turnover rate | | | 23 | %(e) |
| (a) | Total return does not consider the effects of sales loads. Total return is calculated assuming a purchase of a share on the first day and a sale on the last day of each year reported, and includes reinvestment of dividends and distributions. Total investment returns may reflect adjustments to conform to generally accepted accounting principles. |
| (b) | The distributor of the Series has contractually agreed to limit its distribution and service (12b-1) fees to .25 of 1% of the average daily net assets of the Class A shares. |
| (c) | Calculated based upon average shares outstanding during the year. |
| (d) | The expense ratio reflects the interest and fees expense related to the liability for the floating rate notes issued in conjunction with the inverse floater securities. The total expense ratio excluding interest and fees expense and the expense ratio excluding 12b-1 and interest and fees expense is .85% and .60% for the year ended April 30, 2009, .84% and .59% for the year ended April 30, 2008 and .85% and .60% for the year ended April 30, 2007, respectively. |
| (e) | The portfolio turnover rate including variable rate demand notes was 50% for the year ended April 30, 2009. |
See Notes to Financial Statements.
| | |
| 50 | | Visit our website at www.jennisondryden.com |
| | | | | | | | | | | | | | |
| Class A | |
| Year Ended April 30, | |
| 2008 | | | 2007(c) | | | 2006(c) | | | 2005 | |
| | | | | | | | | | | | | | |
| $ | 10.53 | | | $ | 10.32 | | | $ | 10.33 | | | $ | 9.99 | |
| | | | | | | | | | | | | | | |
| | | | | | | | | | | | | | |
| | .50 | | | | .53 | | | | .53 | | | | .51 | |
| | (.72 | ) | | | .18 | | | | (.05 | ) | | | .35 | |
| | | | | | | | | | | | | | | |
| | (.22 | ) | | | .71 | | | | .48 | | | | .86 | |
| | | | | | | | | | | | | | | |
| | | | | | | | | | | | | | |
| | (.49 | ) | | | (.50 | ) | | | (.49 | ) | | | (.52 | ) |
| | | | | | | | | | | | | | | |
| $ | 9.82 | | | $ | 10.53 | | | $ | 10.32 | | | $ | 10.33 | |
| | | | | | | | | | | | | | | |
| | (2.11 | )% | | | 6.94 | % | | | 4.84 | % | | | 8.81 | % |
| | | | | | | | | | | | | | |
| $ | 388,838 | | | $ | 444,751 | | | $ | 451,785 | | | $ | 459,598 | |
| $ | 411,884 | | | $ | 451,239 | | | $ | 458,445 | | | $ | 458,739 | |
| | | | | | | | | | | | | | |
| | .87 | %(d) | | | .89 | %(d) | | | .87 | % | | | .86 | % |
| | .62 | %(d) | | | .64 | %(d) | | | .62 | % | | | .61 | % |
| | 4.96 | % | | | 5.00 | % | | | 5.14 | % | | | 5.03 | % |
| | | | | | | | | | | | | | |
| | 41 | % | | | 33 | % | | | 32 | % | | | 29 | % |
See Notes to Financial Statements.
| | |
| Dryden Municipal Bond Fund | | 51 |
Financial Highlights
continued
| | | | |
| | | Class B | |
| | | Year Ended
April 30, 2009(b) | |
Per Share Operating Performance: | | | | |
Net Asset Value, Beginning Of Year | | $ | 9.82 | |
| | | | |
Income (loss) from investment operations: | | | | |
Net investment income | | | .51 | |
Net realized and unrealized gain (loss) on investment transactions | | | (1.31 | ) |
| | | | |
Total from investment operations | | | (.80 | ) |
| | | | |
Less Dividends: | | | | |
Dividends from net investment income | | | (.50 | ) |
| | | | |
Net asset value, end of year | | $ | 8.52 | |
| | | | |
Total Return(a): | | | (8.19 | )% |
Ratios/Supplemental Data: | | | | |
Net assets, end of year (000) | | $ | 25,820 | |
Average net assets (000) | | $ | 33,111 | |
Ratios to average net assets: | | | | |
Expenses, including distribution and service (12b-1) fees | | | 1.12 | %(c) |
Expenses, excluding distribution and service (12b-1) fees | | | .62 | %(c) |
Net investment income | | | 5.66 | % |
| (a) | Total return does not consider the effects of sales loads. Total return is calculated assuming a purchase of a share on the first day and a sale on the last day of each year reported, and includes reinvestment of dividends and distributions. Total investment returns may reflect adjustments to conform to generally accepted accounting principles. |
| (b) | Calculated based upon average shares outstanding during the year. |
| (c) | The expense ratio reflects the interest and fees expense related to the liability for the floating rate notes issued in conjunction with the inverse floater securities. The total expense ratio excluding interest and fees expense and the expense ratio excluding 12b-1 and interest and fees expense is 1.10% and .60% for the year ended April 30, 2009, 1.09% and .59% for the year ended April 30, 2008 and 1.10% and .60% for the year ended April 30, 2007, respectively. |
See Notes to Financial Statements.
| | |
| 52 | | Visit our website at www.jennisondryden.com |
| | | | | | | | | | | | | | |
| Class B | |
| Year Ended April 30, | |
| 2008 | | | 2007(b) | | | 2006(b) | | | 2005 | |
| | | | | | | | | | | | | | |
| $ | 10.53 | | | $ | 10.33 | | | $ | 10.34 | | | $ | 10.00 | |
| | | | | | | | | | | | | | | |
| | | | | | | | | | | | | | |
| | .49 | | | | .50 | | | | .51 | | | | .49 | |
| | (.73 | ) | | | .18 | | | | (.06 | ) | | | .34 | |
| | | | | | | | | | | | | | | |
| | (.24 | ) | | | .68 | | | | .45 | | | | .83 | |
| | | | | | | | | | | | | | | |
| | | | | | | | | | | | | | |
| | (.47 | ) | | | (.48 | ) | | | (.46 | ) | | | (.49 | ) |
| | | | | | | | | | | | | | | |
| $ | 9.82 | | | $ | 10.53 | | | $ | 10.33 | | | $ | 10.34 | |
| | | | | | | | | | | | | | | |
| | (2.35 | )% | | | 6.67 | % | | | 4.48 | % | | | 8.53 | % |
| | | | | | | | | | | | | | |
| $ | 42,119 | | | $ | 58,278 | | | $ | 85,179 | | | $ | 141,832 | |
| $ | 50,205 | | | $ | 70,145 | | | $ | 112,213 | | | $ | 165,596 | |
| | | | | | | | | | | | | | |
| | 1.12 | %(c) | | | 1.14 | %(c) | | | 1.12 | % | | | 1.11 | % |
| | .62 | %(c) | | | .64 | %(c) | | | .62 | % | | | .61 | % |
| | 4.70 | % | | | 4.74 | % | | | 4.90 | % | | | 4.78 | % |
See Notes to Financial Statements.
| | |
| Dryden Municipal Bond Fund | | 53 |
Financial Highlights
continued
| | | | |
| | | Class C | |
| | | Year Ended
April 30, 2009(c) | |
Per Share Operating Performance: | | | | |
Net Asset Value, Beginning Of Year | | $ | 9.82 | |
| | | | |
Income (loss) from investment operations: | | | | |
Net investment income | | | .50 | |
Net realized and unrealized gain (loss) on investment transactions | | | (1.33 | ) |
| | | | |
Total from investment operations | | | (.83 | ) |
| | | | |
Less Dividends: | | | | |
Dividends from net investment income | | | (.48 | ) |
| | | | |
Net asset value, end of year | | $ | 8.51 | |
| | | | |
Total Return(a): | | | (8.51 | )% |
Ratios/Supplemental Data: | | | | |
Net assets, end of year (000) | | $ | 36,474 | |
Average net assets (000) | | $ | 30,512 | |
Ratios to average net assets: | | | | |
Expenses, including distribution and service (12b-1) fees(b) | | | 1.37 | %(d) |
Expenses, excluding distribution and service (12b-1) fees | | | .62 | %(d) |
Net investment income | | | 5.61 | % |
| (a) | Total return does not consider the effects of sales loads. Total return is calculated assuming a purchase of a share on the first day and a sale on the last day of each year reported, and includes reinvestment of dividends and distributions. Total investment returns may reflect adjustments to conform to generally accepted accounting principles. |
| (b) | The distributor of the Series has contractually agreed to limit its distribution and service (12b-1) fees to .75 of 1% of the average daily net assets of the Class C shares. |
| (c) | Calculated based upon average shares outstanding during the year. |
| (d) | The expense ratio reflects the interest and fees expense related to the liability for the floating rate notes issued in conjunction with the inverse floater securities. The total expense ratio excluding interest and fees expense and the expense ratio excluding 12b-1 and interest and fees expense is 1.35% and .60% for the year ended April 30, 2009, 1.34% and .59% for the year ended April 30, 2008 and 1.35% and .60% for the year ended April 30, 2007, respectively. |
See Notes to Financial Statements.
| | |
| 54 | | Visit our website at www.jennisondryden.com |
| | | | | | | | | | | | | | |
| Class C | |
| Year Ended April 30, | |
| 2008 | | | 2007(c) | | | 2006(c) | | | 2005 | |
| | | | | | | | | | | | | | |
| $ | 10.53 | | | $ | 10.33 | | | $ | 10.34 | | | $ | 10.00 | |
| | | | | | | | | | | | | | | |
| | | | | | | | | | | | | | |
| | .45 | | | | .47 | | | | .48 | | | | .46 | |
| | (.72 | ) | | | .18 | | | | (.05 | ) | | | .35 | |
| | | | | | | | | | | | | | | |
| | (.27 | ) | | | .65 | | | | .43 | | | | .81 | |
| | | | | | | | | | | | | | | |
| | | | | | | | | | | | | | |
| | (.44 | ) | | | (.45 | ) | | | (.44 | ) | | | (.47 | ) |
| | | | | | | | | | | | | | | |
| $ | 9.82 | | | $ | 10.53 | | | $ | 10.33 | | | $ | 10.34 | |
| | | | | | | | | | | | | | | |
| | (2.59 | )% | | | 6.41 | % | | | 4.23 | % | | | 8.26 | % |
| | | | | | | | | | | | | | |
| $ | 27,097 | | | $ | 30,256 | | | $ | 26,611 | | | $ | 22,033 | |
| $ | 28,247 | | | $ | 28,519 | | | $ | 25,219 | | | $ | 23,042 | |
| | | | | | | | | | | | | | |
| | 1.37 | %(d) | | | 1.39 | %(d) | | | 1.37 | % | | | 1.36 | % |
| | .62 | %(d) | | | .64 | %(d) | | | .62 | % | | | .61 | % |
| | 4.46 | % | | | 4.50 | % | | | 4.64 | % | | | 4.53 | % |
See Notes to Financial Statements.
| | |
| Dryden Municipal Bond Fund | | 55 |
Financial Highlights
continued
| | | | |
| | | Class Z | |
| | | Year Ended
April 30, 2009(b) | |
Per Share Operating Performance: | | | | |
Net Asset Value, Beginning Of Year | | $ | 9.81 | |
| | | | |
Income (loss) from investment operations: | | | | |
Net investment income | | | .57 | |
Net realized and unrealized gain (loss) on investment transactions | | | (1.33 | ) |
| | | | |
Total from investment operations | | | (.76 | ) |
| | | | |
Less Dividends: | | | | |
Dividends from net investment income | | | (.55 | ) |
| | | | |
Net asset value, end of year | | $ | 8.50 | |
| | | | |
Total Return(a): | | | (7.81 | )% |
Ratios/Supplemental Data: | | | | |
Net assets, end of year (000) | | $ | 19,842 | |
Average net assets (000) | | $ | 12,544 | |
Ratios to average net assets: | | | | |
Expenses, including distribution and service (12b-1) fees | | | .62 | %(c) |
Expenses, excluding distribution and service (12b-1) fees | | | .62 | %(c) |
Net investment income | | | 6.50 | % |
| (a) | Total return is calculated assuming a purchase of a share on the first day and a sale on the last day of each year reported, and includes reinvestment of dividends and distributions. Total investment returns may reflect adjustments to conform to generally accepted accounting principles. |
| (b) | Calculated based upon average shares outstanding during the year. |
| (c) | The expense ratio reflects the interest and fees expense related to the liability for the floating rate notes issued in conjunction with the inverse floater securities. The total expense ratio excluding interest and fees expense and the expense ratio excluding 12b-1 and interest and fees expense is .60% and .60% for the year ended April 30, 2009, .59% and .59% for the year ended April 30, 2008 and .60% and .60% for the year ended April 30, 2007, respectively. |
See Notes to Financial Statements.
| | |
| 56 | | Visit our website at www.jennisondryden.com |
| | | | | | | | | | | | | | |
| Class Z | |
| Year Ended April 30, | |
| 2008 | | | 2007(b) | | | 2006(b) | | | 2005 | |
| | | | | | | | | | | | | | |
| $ | 10.52 | | | $ | 10.31 | | | $ | 10.32 | | | $ | 9.98 | |
| | | | | | | | | | | | | | | |
| | | | | | | | | | | | | | |
| | .53 | | | | .55 | | | | .56 | | | | .54 | |
| | (.72 | ) | | | .19 | | | | (.06 | ) | | | .34 | |
| | | | | | | | | | | | | | | |
| | (.19 | ) | | | .74 | | | | .50 | | | | .88 | |
| | | | | | | | | | | | | | | |
| | | | | | | | | | | | | | |
| | (.52 | ) | | | (.53 | ) | | | (.51 | ) | | | (.54 | ) |
| | | | | | | | | | | | | | | |
| $ | 9.81 | | | $ | 10.52 | | | $ | 10.31 | | | $ | 10.32 | |
| | | | | | | | | | | | | | | |
| | (1.86 | )% | | | 7.21 | % | | | 5.08 | % | | | 9.09 | % |
| | | | | | | | | | | | | | |
| $ | 10,037 | | | $ | 9,878 | | | $ | 8,547 | | | $ | 12,379 | |
| $ | 9,246 | | | $ | 9,335 | | | $ | 10,650 | | | $ | 11,451 | |
| | | | | | | | | | | | | | |
| | .62 | %(c) | | | .64 | %(c) | | | .62 | % | | | .61 | % |
| | .62 | %(c) | | | .64 | %(c) | | | .62 | % | | | .61 | % |
| | 5.22 | % | | | 5.25 | % | | | 5.39 | % | | | 5.29 | % |
See Notes to Financial Statements.
| | |
| Dryden Municipal Bond Fund | | 57 |
Report of Independent Registered Public Accounting Firm
The Board of Trustees and Shareholders
Dryden Municipal Bond Fund:
We have audited the accompanying statement of assets and liabilities of the High Income Series (constituting the Dryden Municipal Bond Fund; hereafter referred to as the “Fund”) including the portfolio of investments, as of April 30, 2009, and the related statement of operations for the year then ended, the statement of changes in net assets for each of the years in the two-year period then ended, and the financial highlights for each of the years in the five-year period then ended. These financial statements and financial highlights are the responsibility of the Fund’s management. Our responsibility is to express an opinion on these financial statements and financial highlights based on our audit.
We conducted our audits in accordance with the standards of the Public Company Accounting Oversight Board (United States). Those standards require that we plan and perform the audit to obtain reasonable assurance about whether the financial statements and financial highlights are free of material misstatement. An audit includes examining, on a test basis, evidence supporting the amounts and disclosures in the financial statements. Our procedures included confirmation of securities owned as of April 30, 2009, by correspondence with the custodian and brokers or by other appropriate auditing procedures when replies from brokers were not received. An audit also includes assessing the accounting principles used and significant estimates made by management, as well as evaluating the overall financial statement presentation. We believe that our audits provide a reasonable basis for our opinion.
In our opinion, the financial statements and financial highlights referred to above present fairly, in all material respects, the financial position of the Fund as of April 30, 2009, and the results of its operations for the year then ended, the changes in its net assets for each of the years in the two-year period then ended, and the financial highlights for each of the years in the five-year period then ended, in conformity with U.S. generally accepted accounting principles.

New York, New York
June 26, 2009
| | |
| 58 | | Visit our website at www.jennisondryden.com |
Tax Information
(Unaudited)
We are required by the Internal Revenue Code to advise you within 60 days of the Fund’s fiscal year end (April 30, 2009) as to the federal tax status of dividends and distributions paid by the Fund during such fiscal year.
During its fiscal year ended April 30, 2009, the Fund paid aggregate dividends as follows:
| | | | | | | | | | | | |
| | | Dividends per share |
| | | Class A | | Class B | | Class C | | Class Z |
| | | | |
Tax-Exempt Income | | $ | .5212 | | $ | .4995 | | $ | .4793 | | $ | .5477 |
| | | | | | | | | | | | |
In January 2010, you will be advised as to the federal tax status of the dividends and distributions received in calendar year 2009. In addition, you will be advised at that time as to the portion of your dividends which may be subject to the Alternative Minimum Tax (AMT) as well as information with respect to state taxability.
For more detailed information regarding your state and local taxes, you should contact your tax adviser or the state/local taxing authorities.
| | |
| Dryden Municipal Bond Fund | | 59 |
MANAGEMENT OF THE FUND
(Unaudited)
Information about Fund Directors/Trustees (referred to herein as “Board Members”) and Fund Officers is set forth below. Board Members who are not deemed to be “interested persons,” as defined in the 1940 Act, are referred to as “Independent Board Members.” Board Members who are deemed to be “interested persons” are referred to as “Interested Board Members.” The Board Members are responsible for the overall supervision of the operations of the Fund and perform the various duties imposed on the directors or trustees of investment companies by the 1940 Act.
| | | | |
Independent Board Members (1) |
Name, Address, Age Position(s) Portfolios Overseen | | Principal Occupation(s) During Past Five Years | | Other Directorships Held |
Kevin J. Bannon (56) Board Member Portfolios Overseen: 59 | | Managing Director (since April 2008) of Highmount Capital LLC (registered investment adviser); formerly Executive Vice President and Chief Investment Officer (April 1993-August 2007) of Bank of New York Company; President (May 2003-May 2007) of BNY Hamilton Family of Mutual Funds. | | Director of Urstadt Biddle Properties (since September 2008). |
Linda W. Bynoe (56) Board Member Portfolios Overseen: 59 | | President and Chief Executive Officer (since March 1995) of Telemat Ltd. (management consulting); formerly Vice President at Morgan Stanley Co (broker-dealer). | | Director of Simon Property Group, Inc. (real estate investment trust) (since May 2003); Anixter International (communication products distributor) (since January 2006); Director of Northern Trust Corporation (banking) (since April 2006). |
David E.A. Carson (74) Board Member Portfolios Overseen: 59 | | Director (since May 2008) of Liberty Bank; Director (since October 2007) of ICI Mutual Insurance Company; formerly President, Chairman and Chief Executive Officer of People’s Bank (1987 – 2000). | | None. |
Michael S. Hyland, CFA (63) Board Member Portfolios Overseen: 59 | | Independent Consultant (since February 2005); formerly Senior Managing Director (July 2001-February 2005) of Bear Stearns Co, Inc.; Global Partner, INVESCO (1999-2001); Managing Director and President Salomon Brothers Asset Management (1989-1999). | | None. |
Robert E. La Blanc (75) Board Member Portfolios Overseen: 59 | | President (since 1981) of Robert E. La Blanc Associates, Inc. (telecommunications). | | Director of CA, Inc. (since 2002) (software company); FiberNet Telecom Group, Inc. (since 2003) (telecom company). |
Visit our website at www.jennisondryden.com
| | | | |
Douglas H. McCorkindale (70) Board Member Portfolios Overseen: 59 | | Formerly Chairman (February 2001-June 2006), Chief Executive Officer (June 2000-July 2005), President (September 1997-July 2005) and Vice Chairman (March 1984-May 2000) of Gannett Co. Inc. (publishing and media). | | Director of Continental Airlines, Inc. (since May 1993); Director of Lockheed Martin Corp. (aerospace and defense) (since May 2001). |
Stephen P. Munn (66) Board Member Portfolios Overseen: 59 | | Lead Director (since 2007) and formerly Chairman (1993-2007) of Carlisle Companies Incorporated (manufacturer of industrial products). | | None. |
Richard A. Redeker (65) Board Member Portfolios Overseen: 59 | | Retired Mutual Fund Executive (36 years); Management Consultant; Director of Penn Tank Lines, Inc. (since 1999). | | None. |
Robin B. Smith (69) Board Member & Independent Chair Portfolios Overseen: 59 | | Chairman of the Board (since January 2003) of Publishers Clearing House (direct marketing); formerly Chairman and Chief Executive Officer (August 1996-January 2003) of Publishers Clearing House. | | Formerly Director of BellSouth Corporation (telecommunications) (1992-2006). |
Stephen G. Stoneburn (65) Board Member Portfolios Overseen: 59 | | President and Chief Executive Officer (since June 1996) of Quadrant Media Corp. (publishing company); formerly President (June 1995-June 1996) of Argus Integrated Media, Inc.; Senior Vice President and Managing Director (January 1993-1995) of Cowles Business Media; Senior Vice President of Fairchild Publications, Inc (1975-1989). | | None. |
| | | | |
Interested Board Members (1) |
Judy A. Rice (61) Board Member & President Portfolios Overseen: 59 | | President, Chief Executive Officer, Chief Operating Officer and Officer-In-Charge (since February 2003) of Prudential Investments LLC; President, Chief Executive Officer and Officer-In-Charge (since April 2003) of Prudential Mutual Fund Services LLC; Executive Vice President (since December 2008) of Prudential Investment Management Services LLC; formerly Vice President (February 1999-April 2006) of Prudential Investment Management Services LLC; formerly President, Chief Executive Officer, Chief Operating Officer and Officer-In-Charge (May 2003-June 2005) and Director (May 2003-March 2006) and Executive Vice President (June 2005- March 2006) of AST Investment Services, Inc.; Member of Board of Governors of the Investment Company Institute. | | None. |
Dryden Municipal Bond Fund
| | | | |
| Robert F. Gunia (62) Board Member & Vice President Portfolios Overseen: 145 | | Chief Administrative Officer (since September 1999) and Executive Vice President (since December 1996) of Prudential Investments LLC; President (April 1999-December 2008) and Executive Vice President and Chief Operating Officer (since December 2008) of Prudential Investment Management Services LLC; Executive Vice President (since March 1999) and Treasurer (since May 2000) of Prudential Mutual Fund Services LLC; Chief Administrative Officer, Executive Vice President and Director (since May 2003) of AST Investment Services, Inc. | | Director (since May 1989) of The Asia Pacific Fund, Inc. |
| 1 | The year that each Board Member joined the Funds’ Board is as follows: |
Kevin J. Bannon, 2008; Linda W. Bynoe, 2005; David E.A. Carson, 2003; Michael S. Hyland, 2008; Robert E. La Blanc, 2003; Douglas H. McCorkindale, 2003; Stephen P. Munn, 2008; Richard A. Redeker; 1993; Robin B. Smith, 2003; Stephen G. Stoneburn, 2003; Judy A Rice, Board Member since 2000 and President since 2003; Robert F. Gunia, Board Member since 1996 and Vice President since 1999.
Visit our website at www.jennisondryden.com
| | |
Fund Officers (a)(1) |
Name, Address and Age Position with Fund | | Principal Occupation(s) During Past Five Years |
Scott E. Benjamin (36) Vice President | | Senior Vice President Product Development and Marketing, Prudential Investments (since February 2006); Vice President Product Development and Product Management, Prudential Investments (2003 - 2006). |
Kathryn L. Quirk (56) Chief Legal Officer | | Vice President and Corporate Counsel (since September 2004) of Prudential; Executive Vice President, Chief Legal Officer and Secretary (since July 2005) of PI and Prudential Mutual Fund Services LLC; Vice President and Corporate Counsel (since June 2005) and Secretary (since February 2006) of AST Investment Services, Inc.; formerly Senior Vice President and Assistant Secretary (November 2004-August 2005) of PI; formerly Assistant Secretary (June 2005-February 2006) of AST Investment Services, Inc.; formerly Managing Director, General Counsel, Chief Compliance Officer, Chief Risk Officer and Corporate Secretary (1997-2002) of Zurich Scudder Investments, Inc. |
Deborah A. Docs (51) Secretary | | Vice President and Corporate Counsel (since January 2001) of Prudential; Vice President (since December 1996) and Assistant Secretary (since March 1999) of PI; formerly Vice President and Assistant Secretary (May 2003-June 2005) of AST Investment Services, Inc. |
Jonathan D. Shain (50) Assistant Secretary | | Vice President and Corporate Counsel (since August 1998) of Prudential; Vice President and Assistant Secretary (since May 2001) of PI; Vice President and Assistant Secretary (since February 2001) of PMFS; formerly Vice President and Assistant Secretary (May 2003-June 2005) of AST Investment Services, Inc. |
Claudia DiGiacomo (34) Assistant Secretary | | Vice President and Corporate Counsel (since January 2005) of Prudential; Vice President and Assistant Secretary of PI (since December 2005); Associate at Sidley Austin Brown Wood LLP (1999-2004). |
John P. Schwartz (38) Assistant Secretary | | Vice President and Corporate Counsel (since April 2005) of Prudential; Vice President and Assistant Secretary of PI (since December 2005); Associate at Sidley Austin Brown Wood LLP (1997-2005). |
Andrew R. French (46) Assistant Secretary | | Director and Corporate Counsel (since May 2006) of Prudential; Vice President and Assistant Secretary (since January 2007) of PI; Vice President and Assistant Secretary (since January 2007) of PMFS; formerly Senior Legal Analyst of Prudential Mutual Fund Law Department (1997-2006). |
Timothy J. Knierim (50) Chief Compliance Officer | | Chief Compliance Officer of Prudential Investment Management, Inc. (since July 2007); formerly Chief Risk Officer of PIM and PI (2002-2007) and formerly Chief Ethics Officer of PIM and PI (2006-2007). |
Valerie M. Simpson (50) Deputy Chief Compliance Officer | | Chief Compliance Officer (since April 2007) of PI and AST Investment Services, Inc.; formerly Vice President-Financial Reporting (June 1999-March 2006) for Prudential Life and Annuities Finance. |
Theresa C. Thompson (46) Deputy Chief Compliance Officer | | Vice President, Compliance, PI (since April 2004); and Director, Compliance, PI (2001-2004). |
Dryden Municipal Bond Fund
| | |
Noreen M. Fierro (44) Anti-Money Laundering Compliance Officer | | Vice President, Corporate Compliance (since May 2006) of Prudential; formerly Corporate Vice President, Associate General Counsel (April 2002-May 2005) of UBS Financial Services, Inc., in their Money Laundering Prevention Group; Senior Manager (May 2005-May 2006) of Deloitte Financial Advisory Services, LLP, in their Forensic and Dispute Services, Anti-Money Laundering Group. |
Grace C. Torres (50) Treasurer and Principal Financial and Accounting Officer | | Assistant Treasurer (since March 1999) and Senior Vice President (since September 1999) of PI; Assistant Treasurer (since May 2003) and Vice President (since June 2005) of AST Investment Services, Inc.; Senior Vice President and Assistant Treasurer (since May 2003) of Prudential Annuities Advisory Services, Inc.; formerly Senior Vice President (May 2003-June 2005) of AST Investment Services, Inc. |
M. Sadiq Peshimam (45) Assistant Treasurer | | Vice President (since 2005) and Director (2000-2005) within Prudential Mutual Fund Administration. |
Peter Parrella (50) Assistant Treasurer | | Vice President (since 2007) and Director (2004-2007) within Prudential Mutual Fund Administration; formerly Tax Manager at SSB Citi Fund Management LLC (1997-2004). |
| (a) | Excludes interested Board Members who also serve as President or Vice President. |
| 1 | The year that each individual became an officer of the Fund is as follows: |
Scott E. Benjamin, 2009; Kathryn L. Quirk, 2005; Deborah A. Docs, 1996; Jonathan D. Shain, 2004; Claudia DiGiacomo, 2005; John P. Schwartz, 2006; Andrew R. French, 2006; Timothy Knierim, 2007; Valerie M. Simpson, 2007; Theresa C. Thompson, 2008; Noreen M. Fierro, 2006; Grace C. Torres, 1996, M. Sadiq Peshimam, 2006; Peter Parrella, 2007.
Explanatory Notes
| | • | | Board Members are deemed to be “Interested,” as defined in the 1940 Act, by reason of their affiliation with Prudential Investments LLC and/or an affiliate of Prudential Investments LLC. |
| | • | | Unless otherwise noted, the address of all Board Members and Officers is c/o Prudential Investments LLC, Gateway Center Three, 100 Mulberry Street, Newark, New Jersey 07102. |
| | • | | There is no set term of office for Board Members or Officers. The Board Members have adopted a retirement policy, which calls for the retirement of Board Members on December 31st of the year in which they reach the age of 75. |
| | • | | “Other Directorships Held” includes only directorships of companies required to register or file reports with the SEC under the Securities Exchange Act of 1934 (that is, “public companies”) or other investment companies registered under the 1940 Act. |
| | • | | “Portfolios Overseen” includes all investment companies managed by Prudential Investments LLC. The investment companies for which PI serves as manager include the JennisonDryden Funds, Strategic Partners Funds, The Prudential Variable Contract Accounts, The Target Portfolio Trust, The Prudential Series Fund, The High Yield Income Fund, Inc., The High Yield Plus Fund, Inc., Nicholas-Applegate Fund, Inc., Prudential’s Gibraltar Fund, Inc. and the Advanced Series Trust. |
Visit our website at www.jennisondryden.com
Growth of a $10,000 Investment
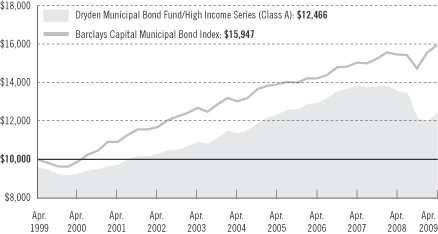
| | | | | | | | | |
| Average Annual Total Returns (With Sales Charges) as of 4/30/09 | | | | |
| | | One Year | | | Five Years | | | Ten Years | |
Class A | | –11.75 | % | | 1.05 | % | | 2.23 | % |
Class B | | –12.53 | | | 1.47 | | | 2.40 | |
Class C | | –9.27 | | | 1.38 | | | 2.15 | |
Class Z | | –7.71 | | | 2.16 | | | 2.92 | |
| | | | | | | | | |
| Average Annual Total Returns (Without Sales Charges) as of 4/30/09 | | | | |
| | | One Year | | | Five Years | | | Ten Years | |
Class A | | –8.08 | % | | 1.88 | % | | 2.65 | % |
Class B | | –8.19 | | | 1.63 | | | 2.40 | |
Class C | | –8.40 | | | 1.38 | | | 2.15 | |
Class Z | | –7.71 | | | 2.16 | | | 2.92 | |
Performance data quoted represent past performance. Past performance does not guarantee future results. The investment return and principal value of an investment will fluctuate, so that an investor’s shares, when redeemed, may be worth more or less than their original cost. Current performance may be lower or higher than the past performance data quoted. The returns in the graph and the tables do not reflect the deduction of taxes that a shareholder would pay on Fund distributions or following the redemption of Fund shares. An investor may obtain performance data current to the most recent month-end by visiting our website at www.jennisondryden.com or by calling (800) 225-1852. The maximum initial sales charge is 4.00% (Class A shares). Gross operating expenses: Class A, 0.92%;
| | |
| | Visit our website at www.jennisondryden.com |
Class B, 1.12%; Class C, 1.62%; Class Z, 0.62%. Net operating expenses apply to: Class A, 0.87%; Class B, 1.12%; Class C, 1.37%; Class Z, 0.62%, after contractual reduction through 8/31/2010.
Source: Prudential Investments LLC and Lipper Inc.
The graph compares a $10,000 investment in the Dryden Municipal Bond Fund/High Income Series (Class A shares) with a similar investment in the Barclays Capital Municipal Bond Index by portraying the initial account values at the beginning of the 10-year period for Class A shares (April 30, 1999) and the account values at the end of the current fiscal year (April 30, 2009) as measured on a quarterly basis. For purposes of the graph, and unless otherwise indicated, it has been assumed that (a) the maximum applicable front-end sales charge was deducted from the initial $10,000 investment in Class A shares; (b) all recurring fees (including management fees) were deducted; and (c) all dividends and distributions were reinvested. The line graph provides information for Class A shares only. As indicated in the tables provided earlier, performance for Class B, Class C, and Class Z shares will vary due to the differing charges and expenses applicable to each share class (as indicated in the following paragraphs). Without a distribution and service (12b-1) fee waiver of 0.05% for Class A shares through April 30, 2009, the returns shown in the graph and for Class A shares in the tables would have been lower.
The Barclays Capital Municipal Bond Index (Index) is an unmanaged index of over 39,000 long-term investment-grade municipal bonds. It gives a broad look at how long-term investment-grade municipal bonds have performed. The Index’s total returns include the reinvestment of all dividends, but do not include the effects of sales charges, operating expenses of a mutual fund, or taxes. The returns for the Index would be lower if they included the effects of sales charges, operating expenses, or taxes. The securities that comprise the Index may differ substantially from the securities in the Fund. This is not the only index that may be used to characterize performance of municipal bond funds. Other indexes may portray different comparative performance. Investors cannot invest directly in an index.
Through March 14, 2004, the Fund charged a maximum front-end sales charge of 3.00% for Class A shares and a 12b-1 fee of up to 0.30% annually. Effective March 15, 2004, Class A shares are subject to a maximum front-end sales charge of 4.00% and a 12b-1 fee of up to 0.30% annually. Investors who purchase Class A shares in an amount of $1 million or more do not pay a front-end sales charge, but are subject to a contingent deferred sales charge (CDSC) of 1% for shares sold within 12 months of purchase. Class B shares are subject to a declining CDSC of 5%, 4%, 3%, 2%, 1%, and 1%, respectively, for the first six years after the purchase and a 12b-1 fee of up to 0.50% annually. Approximately seven years after purchase, Class B shares will automatically convert to Class A shares on a quarterly basis. Through February 1, 2004, Class C shares were subject to a front-end sales charge of 1%, a CDSC of 1% for shares redeemed within 18 months of purchase, and a 12b-1 fee of 1% annually. Class C shares purchased on or after February 2, 2004, are not subject to a front-end sales charge, the CDSC of 1% for Class C shares purchased on or after that date will apply for 12 months from the date of purchase, and the annual 12b-1 fee will remain 1%. Class Z shares are not subject to a sales charge or 12b-1 fee. The returns on investment in the graph and the returns in the tables do not reflect the deduction of taxes that a shareholder would pay on Fund distributions or following the redemption of Fund shares. Without waiver of fees and/or expense subsidization, the Fund’s returns would have been lower.
| | |
| Dryden Municipal Bond Fund | | |
| | | | |
| n MAIL | | n TELEPHONE | | n WEBSITE |
Gateway Center Three 100 Mulberry Street Newark, NJ 07102 | | (800) 225-1852 | | www.jennisondryden.com |
|
| PROXY VOTING |
| The Board of Trustees of the Fund has delegated to the Fund’s investment subadviser the responsibility for voting any proxies and maintaining proxy recordkeeping with respect to the Fund. A description of these proxy voting policies and procedures is available without charge, upon request, by calling (800) 225-1852 or by visiting the Securities and Exchange Commission’s website at www.sec.gov. Information regarding how the Fund voted proxies relating to portfolio securities during the most recent 12-month period ended June 30 is available on the Fund’s website and on the Commission’s website. |
|
| TRUSTEES |
| Kevin J. Bannon • Linda W. Bynoe • David E.A. Carson • Robert F. Gunia • Michael S. Hyland • Robert E. La Blanc • Douglas H. McCorkindale • Stephen P. Munn • Richard A. Redeker • Judy A. Rice • Robin B. Smith • Stephen G. Stoneburn |
|
| OFFICERS |
| Judy A. Rice, President • Robert F. Gunia, Vice President • Scott Benjamin, Vice President • Grace C. Torres, Treasurer and Principal Financial and Accounting Officer • Kathryn L. Quirk, Chief Legal Officer • Deborah A. Docs, Secretary • Timothy J. Knierim, Chief Compliance Officer • Valerie M. Simpson, Deputy Chief Compliance Officer • Theresa C. Thompson, Deputy Chief Compliance Officer • Noreen M. Fierro, Anti-Money Laundering Compliance Officer • Jonathan D. Shain, Assistant Secretary • Claudia DiGiacomo, Assistant Secretary • John P. Schwartz, Assistant Secretary • Andrew R. French, Assistant Secretary • M. Sadiq Peshimam, Assistant Treasurer • Peter Parrella, Assistant Treasurer |
| | | | |
| MANAGER | | Prudential Investments LLC | | Gateway Center Three
100 Mulberry Street
Newark, NJ 07102 |
|
| INVESTMENT SUBADVISER | | Prudential Investment
Management, Inc. | | Gateway Center Two
100 Mulberry Street
Newark, NJ 07102 |
|
| DISTRIBUTOR | | Prudential Investment
Management Services LLC | | Gateway Center Three
100 Mulberry Street
Newark, NJ 07102 |
|
| CUSTODIAN | | The Bank of New York Mellon | | One Wall Street
New York, NY 10286 |
|
| TRANSFER AGENT | | Prudential Mutual Fund
Services LLC | | PO Box 9658
Providence, RI 02940 |
|
INDEPENDENT REGISTERED
PUBLIC ACCOUNTING FIRM | | KPMG LLP | | 345 Park Avenue
New York, NY 10154 |
|
| FUND COUNSEL | | Willkie Farr & Gallagher LLP | | 787 Seventh Avenue
New York, NY 10019 |
|
| An investor should consider the investment objectives, risks, charges, and expenses of the Fund carefully before investing. The prospectus for the Fund contains this and other information about the Fund. An investor may obtain a prospectus by visiting our website at www.jennisondryden.com or by calling (800) 225-1852. The prospectus should be read carefully before investing. |
|
| E-DELIVERY |
To receive your mutual fund documents online, go to www.prudential.com/edelivery/mutualfunds
and enroll. Instead of receiving printed documents by mail, you will receive notification via email when new materials are available. You can cancel your enrollment or change your email address at any time by visiting the website address above. |
|
| SHAREHOLDER COMMUNICATIONS WITH TRUSTEES |
| Shareholders can communicate directly with the Board of Trustees by writing to the Chair of the Board, Dryden Municipal Bond Fund/High Income Series, Prudential Investments, Attn: Board of Trustees, 100 Mulberry Street, Gateway Center Three, Newark, NJ 07102. Shareholders can communicate directly with an individual Trustee by writing to the same address. Communications are not screened before being delivered to the addressee. |
|
| AVAILABILITY OF PORTFOLIO SCHEDULE |
| The Fund files its complete schedule of portfolio holdings with the Securities and Exchange Commission for the first and third quarters of each fiscal year on Form N-Q. The Fund’s Forms N-Q are available on the Commission’s website at www.sec.gov. The Fund’s Forms N-Q may also be reviewed and copied at the Commission’s Public Reference Room in Washington, D.C. Information on the operation and location of the Public Reference Room may be obtained by calling (202) 551-8090. The Fund’s schedule of portfolio holdings is also available on the Fund’s website as of the end of each fiscal quarter. |
|
| The Fund’s Statement of Additional Information contains additional information about the Fund’s Trustees and is available without charge, upon request, by calling (800) 225-1852. |
Mutual Funds:
| | | | |
| ARE NOT INSURED BY THE FDIC OR ANY FEDERAL GOVERNMENT AGENCY | | MAY LOSE VALUE | | ARE NOT A DEPOSIT OF OR GUARANTEED BY ANY BANK OR ANY BANK AFFILIATE |

| | | | | | | | | | | | |
| | | Dryden Municipal Bond Fund/High Income Series |
| | | Share Class | | A | | B | | C | | Z | | |
| | NASDAQ | | PRHAX | | PMHYX | | PHICX | | PHIZX | | |
| | CUSIP | | 262467103 | | 262467202 | | 262467301 | | 262467400 | | |
| | | | | | | | | | | | |
MF133E 0154352-00001-00

Item 2 – Code of Ethics – See Exhibit (a)
As of the end of the period covered by this report, the registrant has adopted a code of ethics (the “Section 406 Standards for Investment Companies – Ethical Standards for Principal Executive and Financial Officers”) that applies to the registrant’s Principal Executive Officer and Principal Financial Officer; the registrant’s Principal Financial Officer also serves as the Principal Accounting Officer.
The registrant hereby undertakes to provide any person, without charge, upon request, a copy of the code of ethics. To request a copy of the code of ethics, contact the registrant 800-225-1852, and ask for a copy of the Section 406 Standards for Investment Companies – Ethical Standards for Principal Executive and Financial Officers.
Item 3 – Audit Committee Financial Expert –
The registrant’s Board has determined that Mr. David E. A. Carson, member of the Board’s Audit Committee is an “audit committee financial expert,” and that he is “independent,” for purposes of this Item.
Item 4 – Principal Accountant Fees and Services –
(a) Audit Fees
For the fiscal years ended April 30, 2009 and April 30, 2008, KPMG LLP (“KPMG”), the Registrant’s principal accountant, billed the Registrant $46,366 and $58,732, respectively, for professional services rendered for the audit of the Registrant’s annual financial statements or services that are normally provided in connection with statutory and regulatory filings.
(b) Audit-Related Fees
During the fiscal year ended April 30, 2009, KPMG, the Registrant’s principal accountant, billed the Registrant $3,115 for professional services rendered in connection with agreed upon procedures performed related to a custody conversion. Not applicable for the fiscal year ended April 30, 2008.
(c) Tax Fees
None.
(d) All Other Fees
Not applicable for the fiscal year ended April 30, 2009. During the fiscal year ended April 30, 2008, KPMG, the Registrant’s principal accountant, billed the Registrant $6,167 for professional services rendered in connection with work performed related to inverse floating rate securities.
(e) (1) Audit Committee Pre-Approval Policies and Procedures
THE PRUDENTIAL MUTUAL FUNDS
AUDIT COMMITTEE POLICY
on
Pre-Approval of Services Provided by the Independent Accountants
The Audit Committee of each Prudential Mutual Fund is charged with the responsibility to monitor the independence of the Fund’s independent accountants. As part of this responsibility, the Audit Committee must pre-approve any independent accounting firm’s engagement to render audit and/or permissible non-audit services, as required by law. In evaluating a proposed engagement of the independent accountants, the Audit Committee will assess the effect that the engagement might reasonably be expected to have on the accountant’s independence. The Committee’s evaluation will be based on:
| | • | | a review of the nature of the professional services expected to be provided, |
| | • | | a review of the safeguards put into place by the accounting firm to safeguard independence, and |
| | • | | periodic meetings with the accounting firm. |
Policy for Audit and Non-Audit Services Provided to the Funds
On an annual basis, the scope of audits for each Fund, audit fees and expenses, and audit-related and non-audit services (and fees proposed in respect thereof) proposed to be performed by the Fund’s independent accountants will be presented by the Treasurer and the independent accountants to the Audit Committee for review and, as appropriate, approval prior to the initiation of such services. Such presentation shall be accompanied by confirmation by both the Treasurer and the independent accountants that the proposed services will not adversely affect the independence of the independent accountants. Proposed services shall be described in sufficient detail to enable the Audit Committee to assess the appropriateness of such services and fees, and the compatibility of the provision of such services with the auditor’s independence. The Committee shall receive periodic reports on the progress of the audit and other services which are approved by the Committee or by the Committee Chair pursuant to authority delegated in this Policy.
The categories of services enumerated under “Audit Services”, “Audit-related Services”, and “Tax Services” are intended to provide guidance to the Treasurer and the independent accountants as to those categories of services which the Committee believes are generally consistent with the independence of the independent accountants and which the Committee (or the Committee Chair) would expect upon the presentation of specific proposals to pre-approve.
The enumerated categories are not intended as an exclusive list of audit, audit-related or tax services, which the Committee (or the Committee Chair) would consider for pre-approval.
Audit Services
The following categories of audit services are considered to be consistent with the role of the Fund’s independent accountants:
| | • | | Annual Fund financial statement audits |
| | • | | Seed audits (related to new product filings, as required) |
| | • | | SEC and regulatory filings and consents |
Audit-related Services
The following categories of audit-related services are considered to be consistent with the role of the Fund’s independent accountants:
| | • | | Accounting consultations |
| | • | | Fund merger support services |
| | • | | Agreed Upon Procedure Reports |
| | • | | Other Internal Control Reports |
Individual audit-related services that fall within one of these categories and are not presented to the Audit Committee as part of the annual pre-approval process will be subject to pre-approval by the Committee Chair (or any other Committee member on whom this responsibility has been delegated) so long as the estimated fee for those services does not exceed $50,000.
Tax Services
The following categories of tax services are considered to be consistent with the role of the Fund’s independent accountants:
| | • | | Tax compliance services related to the filing or amendment of the following: |
| | • | | Federal, state and local income tax compliance; and, |
| | • | | Sales and use tax compliance |
| | • | | Timely RIC qualification reviews |
| | • | | Tax distribution analysis and planning |
| | • | | Tax authority examination services |
| | • | | Tax appeals support services |
| | • | | Accounting methods studies |
| | • | | Fund merger support services |
| | • | | Tax consulting services and related projects |
Individual tax services that fall within one of these categories and are not presented to the Audit Committee as part of the annual pre-approval process will be subject to pre-approval by the Committee Chair (or any other Committee member on whom this responsibility has been delegated) so long as the estimated fee for those services does not exceed $50,000.
Other Non-audit Services
Certain non-audit services that the independent accountants are legally permitted to render will be subject to pre-approval by the Committee or by one or more Committee members to whom the Committee has delegated this authority and who will report to the full Committee any pre-approval decisions made pursuant to this Policy. Non-audit services presented for pre-approval pursuant to this paragraph will be accompanied by a confirmation from both the Treasurer and the independent accountants that the proposed services will not adversely affect the independence of the independent accountants.
Proscribed Services
The Fund’s independent accountants will not render services in the following categories of non-audit services:
| | • | | Bookkeeping or other services related to the accounting records or financial statements of the Fund |
| | • | | Financial information systems design and implementation |
| | • | | Appraisal or valuation services, fairness opinions, or contribution-in-kind reports |
| | • | | Internal audit outsourcing services |
| | • | | Management functions or human resources |
| | • | | Broker or dealer, investment adviser, or investment banking services |
| | • | | Legal services and expert services unrelated to the audit |
| | • | | Any other service that the Public Company Accounting Oversight Board determines, by regulation, is impermissible. |
Pre-approval of Non-Audit Services Provided to Other Entities Within the Prudential Fund Complex
Certain non-audit services provided to Prudential Investments LLC or any of its affiliates that also provide ongoing services to the Prudential Mutual Funds will be subject to pre-approval by the Audit Committee. The only non-audit services provided to these entities that will require pre-approval are those related directly to the operations and financial reporting of the Funds. Individual projects that are not presented to the Audit Committee as part of the annual pre-approval process will be subject to pre-approval by the Committee Chair (or any other Committee member on whom this responsibility has been delegated) so long as the estimated fee for those services does not exceed $50,000. Services presented for pre-approval pursuant to this paragraph will be accompanied by a confirmation from both the Treasurer and the independent accountants that the proposed services will not adversely affect the independence of the independent accountants.
Although the Audit Committee will not pre-approve all services provided to Prudential Investments LLC and its affiliates, the Committee will receive an annual report from the Fund’s independent accounting firm showing the aggregate fees for all services provided to Prudential Investments and its affiliates.
| (e) | (2) Percentage of services referred to in 4(b) – 4(d) that were approved by the audit committee – |
One hundred percent of the services described in Item 4(b) was approved by the audit committee.
(f) Percentage of hours expended attributable to work performed by other than full time employees of principal accountant if greater than 50%.
The percentage of hours expended on the principal accountant’s engagement to audit the registrant’s financial statements for the most recent fiscal year that were attributed to work performed by persons other than the principal accountant’s full-time, permanent employees was 0%.
(g) Non-Audit Fees
Not applicable to Registrant for the fiscal years 2009 and 2008. The aggregate non-audit fees billed by KPMG for services rendered to the registrant’s investment adviser and any entity controlling, controlled by, or under common control with the investment adviser that provides ongoing services to the registrant for the fiscal years 2009 and 2008 was $0 and $26,200, respectively.
(h) Principal Accountant’s Independence
Not applicable as KPMG has not provided non-audit services to the registrant’s investment adviser and any entity controlling, controlled by, or under common control with the investment adviser that provides ongoing services to the registrant that were not pre-approved pursuant to Rule 2-01(c)(7)(ii) of Regulation S-X.
Item 5 – Audit Committee of Listed Registrants – Not applicable.
Item 6 – Schedule of Investments – The schedule is included as part of the report to shareholders filed under Item 1 of this Form.
Item 7 – Disclosure of Proxy Voting Policies and Procedures for Closed-End Management Investment Companies – Not applicable.
Item 8 – Portfolio Managers of Closed-End Management Investment Companies – Not applicable.
Item 9 – Purchases of Equity Securities by Closed-End Management Investment Company and Affiliated Purchasers – Not applicable.
Item 10 – Submission of Matters to a Vote of Security Holders – Not applicable.
Item 11 – Controls and Procedures
| | (a) | It is the conclusion of the registrant’s principal executive officer and principal financial officer that the effectiveness of the registrant’s current disclosure controls and procedures (such disclosure controls and procedures having been evaluated within 90 days of the date of this filing) provide reasonable assurance that the information required to be |
| | disclosed by the registrant has been recorded, processed, summarized and reported within the time period specified in the Commission’s rules and forms and that the information required to be disclosed by the registrant has been accumulated and communicated to the registrant’s principal executive officer and principal financial officer in order to allow timely decisions regarding required disclosure. |
| | (b) | There has been no significant change in the registrant’s internal control over financial reporting that occurred during the registrant’s most recent fiscal quarter of the period covered by this report that has materially affected, or is likely to materially affect, the registrant’s internal control over financial reporting. |
Item 12 – Exhibits
| | | | |
| (a) | | (1) | | Code of Ethics – Attached hereto as Exhibit EX-99.CODE-ETH |
| | |
| | (2) | | Certifications pursuant to Section 302 of the Sarbanes-Oxley Act – Attached hereto as Exhibit EX-99.CERT. |
| | |
| | (3) | | Any written solicitation to purchase securities under Rule 23c-1. – Not applicable. |
|
(b) Certifications pursuant to Section 906 of the Sarbanes-Oxley Act – Attached hereto as Exhibit EX-99.906CERT. |
SIGNATURES
Pursuant to the requirements of the Securities Exchange Act of 1934 and the Investment Company Act of 1940, the registrant has duly caused this report to be signed on its behalf by the undersigned, thereunto duly authorized.
(Registrant) Dryden Municipal Bond Fund
| | |
| |
| By (Signature and Title)* | | /s/ Deborah A. Docs |
| | Deborah A. Docs |
| | Secretary |
Date June 22, 2009
Pursuant to the requirements of the Securities Exchange Act of 1934 and the Investment Company Act of 1940, this report has been signed below by the following persons on behalf of the registrant and in the capacities and on the dates indicated.
| | |
| By (Signature and Title)* | | /s/ Judy A. Rice |
| | Judy A. Rice |
| | President and Principal Executive Officer |
Date June 22, 2009
| | |
| By (Signature and Title)* | | /s/ Grace C. Torres |
| | Grace C. Torres |
| | Treasurer and Principal Financial Officer |
Date June 22, 2009
| * | Print the name and title of each signing officer under his or her signature. |