Item 1: Report to Shareholders| Spectrum Funds | December 31, 2006 |
The views and opinions in this report were current as of December 31, 2006. They are not guarantees of performance or investment results and should not be taken as investment advice. Investment decisions reflect a variety of factors, and the managers reserve the right to change their views about individual stocks, sectors, and the markets at any time. As a result, the views expressed should not be relied upon as a forecast of the fund’s future investment intent. The report is certified under the Sarbanes-Oxley Act, which requires mutual funds and other public companies to affirm that, to the best of their knowledge, the information in their financial reports is fairly and accurately stated in all material respects.
REPORTS ON THE WEB
Sign up for our E-mail Program, and you can begin to receive updated fund reports and prospectuses online rather than through the mail. Log in to your account at troweprice.com for more information.
Fellow Shareholders
The year 2006 was a banner year for global financial markets, which generated considerable momentum in the last six months after a sluggish start. The strong results reflected the supportive environment for economic and corporate profit growth worldwide. As the performance of the Spectrum Funds illustrates, both international and domestic stocks enjoyed double-digit returns, while bonds posted more muted gains.
MARKET ENVIRONMENT
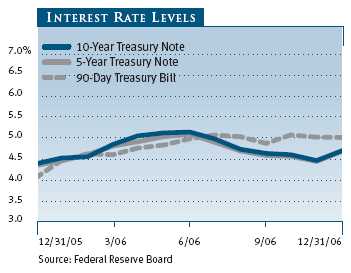
Global economies continued to expand in 2006, though the most significant increases in the rate of growth occurred outside the U.S. European economies showed significant improvement, while India and China led the robust growth in Asia. The main exceptions were Japan, where an apparent economic turnaround stalled in the second half of the year, and the U.S., which saw economic growth decelerate after several years of expansion. While central banks around the world continued to raise interest rates throughout the year, the Federal Reserve ended its program of rate hikes in June, holding rates steady during the last six months after 17 rate increases between June 2004 and June 2006.
The rising economic tide lifted corporate profit growth around the world. Even in the U.S., where economic growth slowed markedly, corporate earnings consistently exceeded expectations. Another global trend was a sharp increase in mergers and acquisitions; globally, M&A deals totaled a record-high $4 trillion in 2006. Private-equity firms played a substantial role in some of the largest transactions.
HIGHLIGHTS
• International and domestic stocks enjoyed double-digit returns in 2006, while bonds posted more muted gains.
• Each of the three Spectrum Funds performed better than its benchmark in the second half of the year. The Spectrum Growth and Spectrum Income funds also outperformed their benchmarks for the entire year.
• Broad diversification among multiple T. Rowe Price funds is at the heart of each fund’s long-term investment strategy.
• Economic conditions remain favorable for global equity markets. An easing of inflationary pressures should augur well for bonds, while overseas markets could benefit from a weaker U.S. dollar.
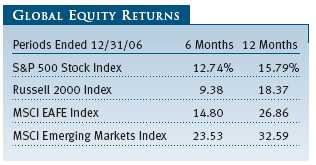
The combination of strong corporate earnings growth, record-setting merger activity, and a stable Fed monetary policy provided the backdrop for a solid rally in the U.S. stock market. As the accompanying table shows, most of the gains occurred in the second half of the year, when energy prices fell and the Fed was on hold. Based on Russell indexes, small-cap stocks outperformed large-company issues for the year, while value shares won out over growth by a substantial margin.
International stocks posted higher returns than the domestic market. The same factors supporting U.S. stocks also contributed to outsized returns in overseas markets. Nearly every region produced gains in excess of 25% for the year, with emerging markets leading the way, especially in Latin America. Among developed countries, European and Asian markets delivered very similar returns, gaining more than 30% for the year. The laggard was Japan, which posted single-digit gains amid a softer-than-expected economy.
U.S. bonds also produced positive results in 2006, though returns were more modest than in the equity markets. Bonds declined during the first half of the year, but the decelerating economic environment and the shift in Fed rate policy helped set the stage for a bond market rally in the last six months. For the year, the broad Lehman Brothers U.S. Aggregate Index returned 4.33%. High-yield corporate bonds were the best performers, benefiting from strong investor demand for higher-yielding investments. Mortgage-backed securities also posted strong gains, while Treasury bonds lagged.
International bonds outperformed domestic fixed-income securities for the year; returns were enhanced by the U.S. dollar’s weakness versus European and some Asian currencies. The J.P. Morgan Non-U.S. Dollar Government Bond Index returned 6.84% in 2006, while the J.P. Morgan Emerging Markets Bond Index Plus returned 10.49%.
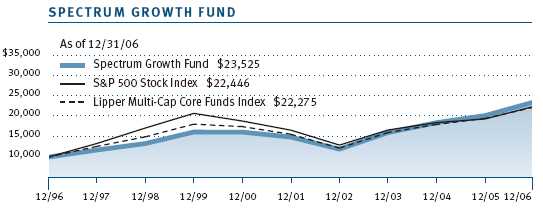
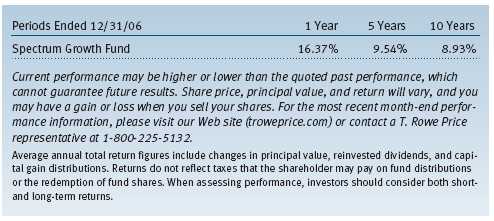
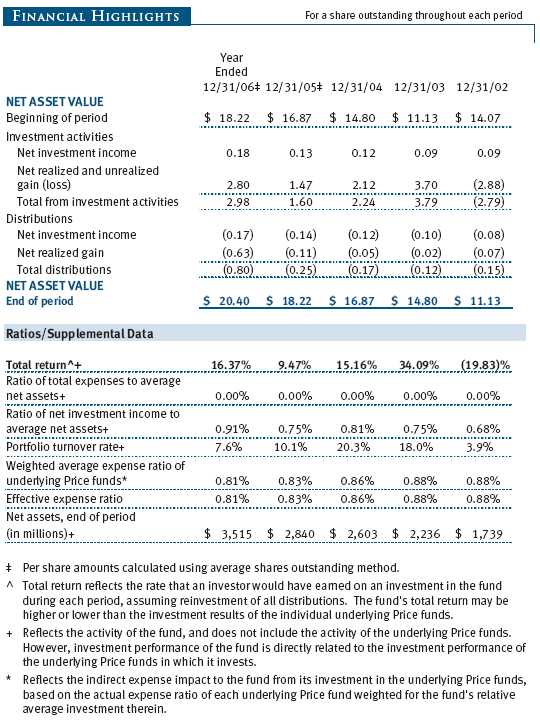
SPECTRUM GROWTH FUND
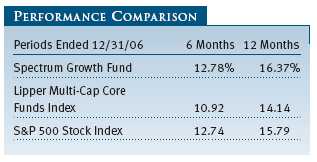
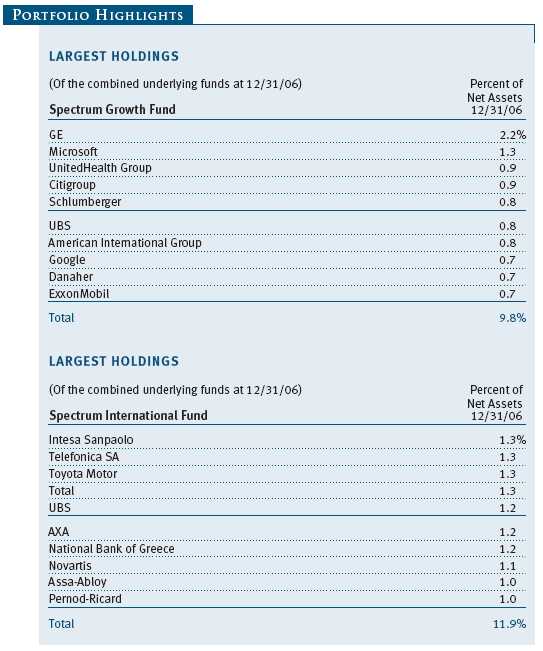
In 2006, your fund posted a double-digit gain and outperformed its benchmark. As shown in the accompanying table, Spectrum Growth returned 16.37% for the year, surpassing the performance of both the S&P 500 Stock Index and the fund’s Lipper peer group index. The fund’s 12.78% return in the last six months was also better than the performance of the S&P 500 and Lipper benchmarks. The portfolio’s strong results in 2006 resulted primarily from its exposure to foreign issues and value stocks.
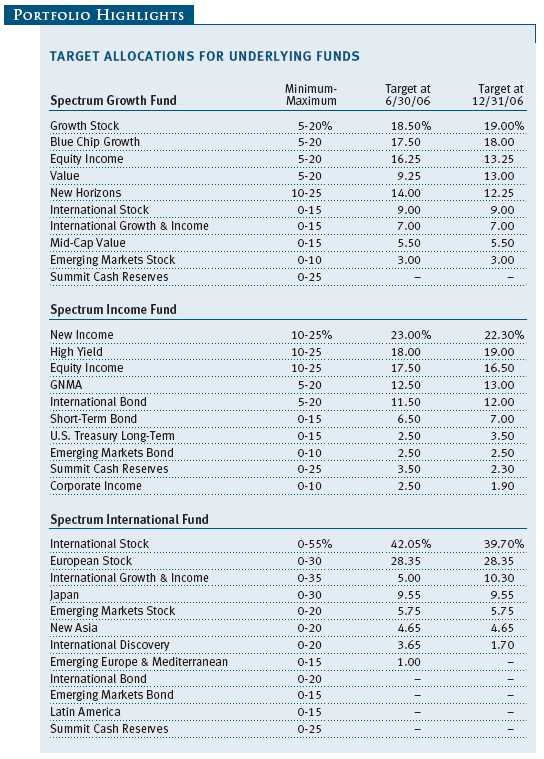
Every holding in the portfolio produced positive returns during the year. The fund’s underlying international stock portfolios, which composed about 20% of the fund as of December 31, 2006, were the top performers. The smallest position in the portfolio, Emerging Markets Stock, posted the best return, gaining more than 30%. We maintained neutral weightings in foreign stocks throughout the year and are optimistic about their prospects in 2007.
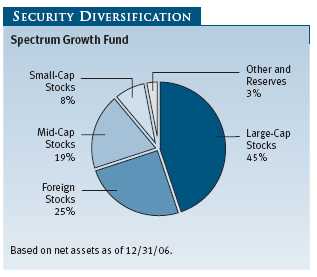
On the domestic side, the fund’s value holdings—Mid-Cap Value, Value, and Equity Income (a dividend-oriented holding with a value element)—also performed well, benefiting from the broad outperformance of value stocks. We shuffled some assets among our value holdings, trimming our position in Equity Income and adding to our position in Value, in order to achieve greater balance in this segment of the portfolio.
The growth components of the portfolio lagged, particularly Blue Chip Growth and New Horizons, which were the only holdings to post single-digit gains for the year. We continued to overweight large-cap growth stocks, adding to our positions in Growth Stock and Blue Chip Growth throughout the year. In an environment of solid but slower earnings growth, high-quality large-cap companies could benefit if they are able to produce more dependable earnings growth. The underperformance of large-cap growth stocks in 2006 reinforced their attractive valuations.
We cut back on our position in New Horizons, the lone small-cap holding in the portfolio. Small-cap valuations remain high relative to large-cap issues, and small-cap stocks may face a more challenging profit environment in an economic slowdown.
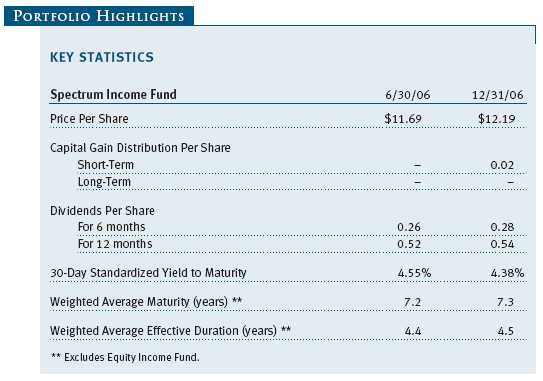
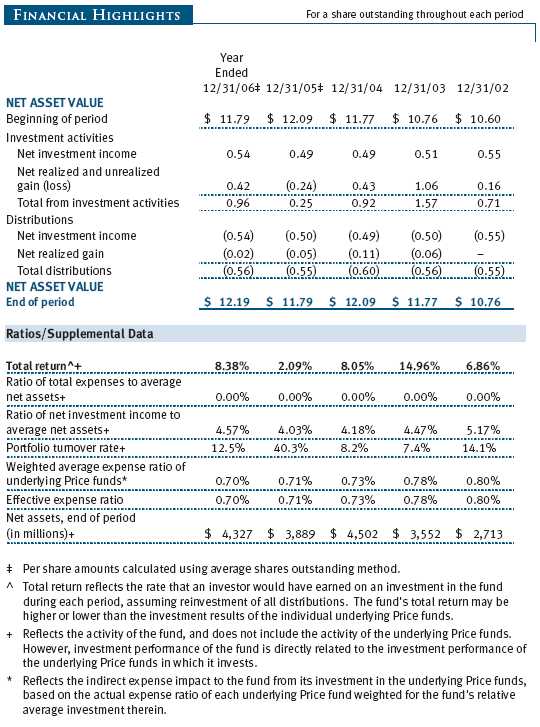
SPECTRUM INCOME FUND
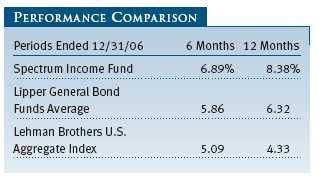
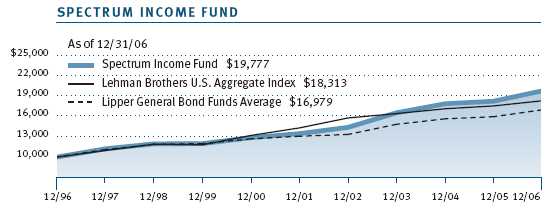
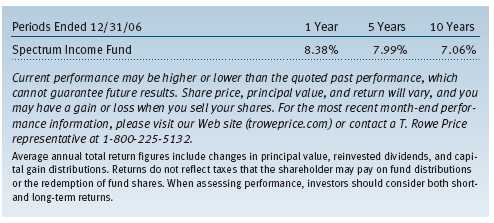
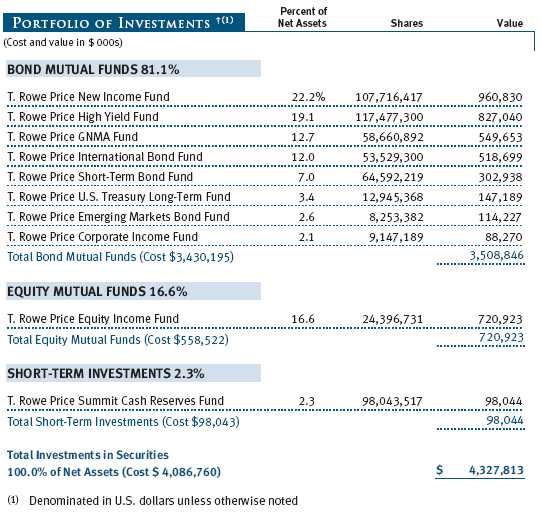
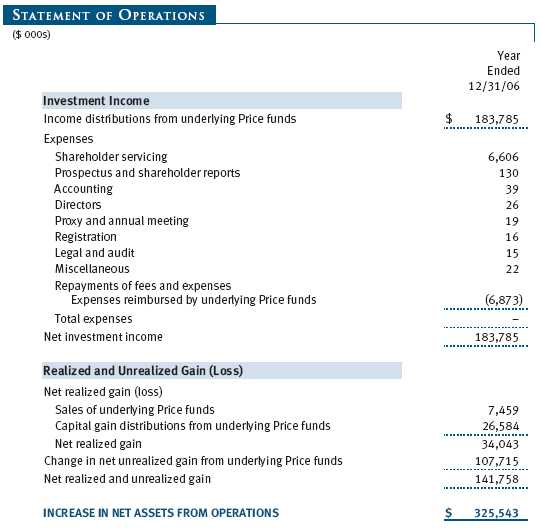
As the accompanying table indicates, your fund delivered a solid return in 2006. Spectrum Income’s 8.38% return for the year was ahead of both the Lehman Brothers U.S. Aggregate Index and its Lipper peer group average. The fund’s 6.89% return for the last six months also outpaced the index and peer group. Spectrum Income continued to benefit from its broad diversification, as the fund’s positions in high-yield corporate bonds, dividend-paying stocks, and international bonds were all top contributors to performance in 2006.
All portfolio holdings gained ground for the year. The best performer was Equity Income, which derives its income from dividend-paying stocks. Equity Income gained nearly 20% as the stock market staged a strong rally in 2006. High Yield and Emerging Markets Bond were also top contributors; both benefited from strong investor demand for the highest yields available in the bond market. Rising interest rates weighed on U.S. Treasury Long-Term, which has the greatest sensitivity to interest rate fluctuations. However, it was also one of the smallest positions in the portfolio.
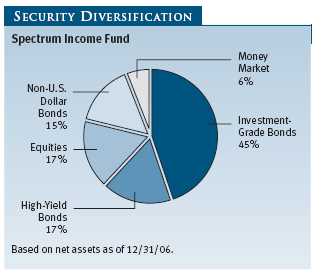
We reallocated some assets during the year to take advantage of valuation disparities and broaden our diversification. With the Fed on hold, we shifted assets from Summit Cash Reserves to Short-Term Bond. We also reduced our positions in areas that have outperformed in recent years—including Equity Income (value stocks), New Income (investment-grade bonds), and Corporate Income (primarily investment-grade corporate bonds)—and added to holdings that have lagged, such as U.S. Treasury Long-Term.
Earlier in the period, we increased our weighting in High Yield, as the sector benefited from strong fundamentals thanks to strong corporate profit growth and low default levels. Toward the end of the year, we began to lower our exposure as the difference between yields of high-and low-quality bonds narrowed to historically low levels following several years of strong returns.
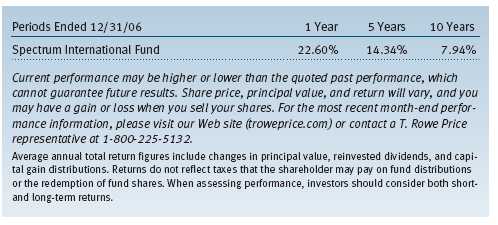
SPECTRUM INTERNATIONAL FUND
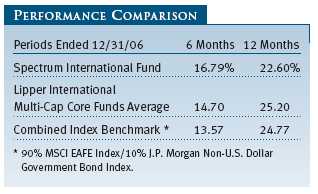
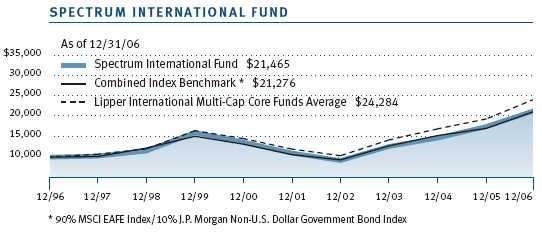
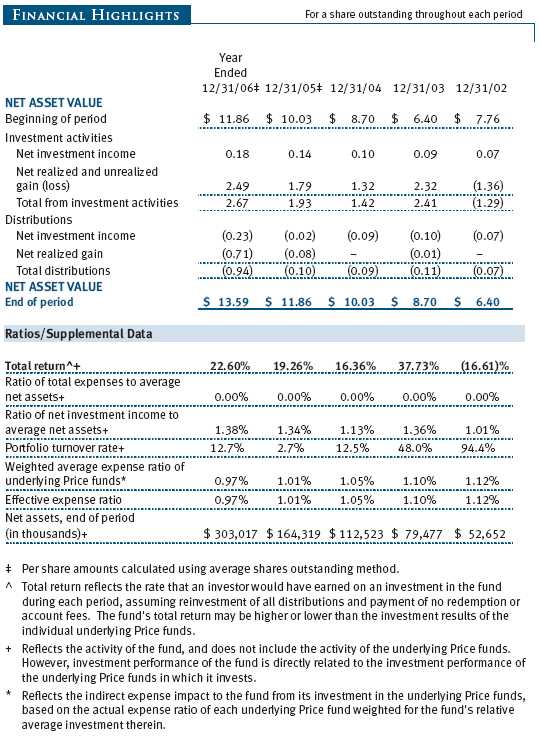
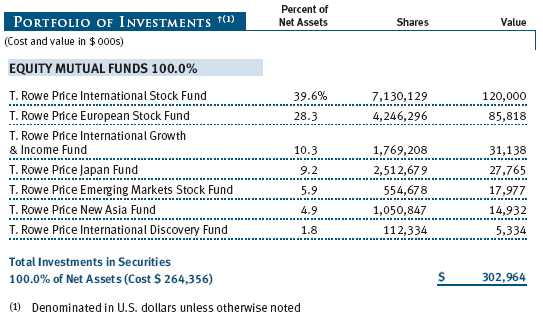
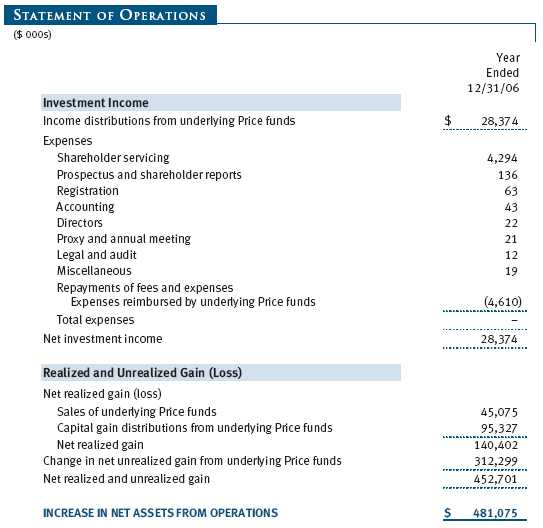
Despite a very strong return in 2006, your fund lagged its benchmark and peer group average. As the accompanying table shows, Spectrum International’s 22.60% return for the year came up short of its combined index benchmark and Lipper peer group average. All of the underperformance occurred in the first half of the year—Spectrum International returned 16.79% for the six months ended December 31, 2006, well ahead of the combined benchmark and Lipper group returns. A meaningful position in Japan and a reduction in emerging markets exposure contributed to the portfolio’s underperformance for the year.
The portfolio’s best performer in 2006 was New Asia, which gained more than 35% as Asian markets surged during the year. European Stock, one of the largest positions in the portfolio, also produced strong results. We added International Growth & Income to the portfolio early in the year to provide further diversification, and it ended up being a noteworthy contributor to performance. By the end of the year, we had increased our position in International Growth & Income to 10% of the portfolio.
Our two emerging markets holdings, Emerging Markets Stock and Emerging Europe & Mediterranean, continued to be strong performers. However, given the outperformance of emerging markets in recent years, we reduced our holdings in 2006, eliminating Emerging Europe & Mediterranean entirely from the portfolio in the last six months of the year. We shifted the assets into New Asia and International Growth & Income.
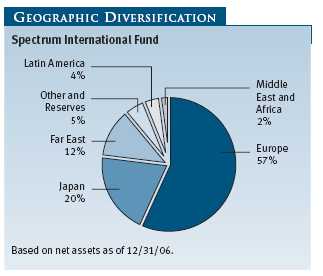
The only holding in the portfolio to decline was Japan, reflecting the weakness in the Japanese stock market in 2006. International Stock, the fund’s largest holding, also underperformed the broad international stock indexes. We lowered our weighting in International Stock during the year from 46% to 40% of the portfolio to make room for International Growth & Income. We also scaled back our position in International Discovery following several years of outperformance in small-cap stocks worldwide.
OUTLOOK
Looking ahead to 2007, we expect global economic growth to moderate as the year progresses. Central banks around the world are likely to follow the Federal Reserve’s lead and bring an end to their recent cycle of interest rate increases, while the Fed itself looks ahead to the possibility of cutting interest rates in the second half of the year.
Despite the expected slowdown, economic conditions remain favorable for the global financial markets. Corporate profit growth, although slowing from the torrid pace of recent years, is still expected to be above the long-term historical average and the strength of corporate balance sheets should be supportive for stock prices. An easing of inflationary pressures should augur well for bonds, while overseas markets could benefit from a weaker U.S. dollar and improving productivity.
Nonetheless, a host of unforeseen challenges—from an unexpectedly sharp economic downturn to a commodity price spike to an adverse geopolitical event—could lead to a dramatic change in the market environment. As a result, broad diversification remains a critical investment precept—one that we follow adamantly in the Spectrum Funds.
Respectfully submitted,

Edmund M. Notzon III
President of the Spectrum Funds and chairman of the Investment Advisory Committee
January 23, 2007
The committee has day-to-day responsibility for managing the portfolios and works with committee members in developing and executing the funds’ investment program.
RISKS OF INVESTING
As with all stock and bond mutual funds, each fund’s share price can fall because of weakness in the stock or bond markets, a particular industry, or specific holdings. Stock markets can decline for many reasons, including adverse political or economic developments, changes in investor psychology, or heavy institutional selling. The prospects for an industry or company may deteriorate because of a variety of factors, including disappointing earnings or changes in the competitive environment. In addition, the investment manager’s assessment of companies held in a fund may prove incorrect, resulting in losses or poor performance even in rising markets.
Bonds are subject to interest rate risk, the decline in bond prices that usually accompanies a rise in interest rates, and credit risk, the chance that any fund holding could have its credit rating downgraded or that a bond issuer will default (fail to make timely payments of interest or principal), potentially reducing the fund’s income level and share price. High-yield corporate bonds could have greater price declines than funds that invest primarily in high-quality bonds. Companies issuing high-yield bonds are not as strong financially as those with higher credit ratings, so the bonds are usually considered speculative investments.
Funds that invest overseas may carry more risk than funds that invest strictly in U.S. assets. Risks can result from varying stages of economic and political development, differing regulatory environments, trading days, and accounting standards, and higher transaction costs of non-U.S. markets. Non-U.S. investments are also subject to currency risk, or a decline in the value of a foreign currency versus the U.S. dollar, which reduces the dollar value of securities denominated in that currency.
GLOSSARY
J.P. Morgan Non-U.S. Dollar Government Bond Index: An unmanaged index that tracks the performance of major non-U.S. bond markets.
J.P. Morgan Emerging Markets Bond Index: An unmanaged index that tracks dollar-denominated bonds issued by emerging-market countries.
Lehman Brothers U.S. Aggregate Index: An unmanaged index that tracks investment-grade corporate and government bonds.
MSCI EAFE Index: An unmanaged index that tracks the stocks of more than 1,000 companies in Europe, Australasia, and the Far East (EAFE).
MSCI Emerging Markets Index: An unmanaged index that tracks stocks in 25 emerging-market countries.
Russell 2000 Index: An unmanaged index that tracks the smallest 2,000 of the largest 3,000 U.S. stocks.
S&P 500 Stock Index: An unmanaged index that tracks the stocks of 500 U.S. primarily large-cap companies.
This chart shows the value of a hypothetical $10,000 investment in the fund over the past 10 fiscal year periods or since inception (for funds lacking 10-year records). The result is compared with benchmarks, which may include a broad-based market index and a peer group average or index. Market indexes do not include expenses, which are deducted from fund returns as well as mutual fund averages and indexes.
| AVERAGE ANNUAL COMPOUND TOTAL RETURN |
This table shows how the fund would have performed each year if its actual (or cumulative) returns had been earned at a constant rate.
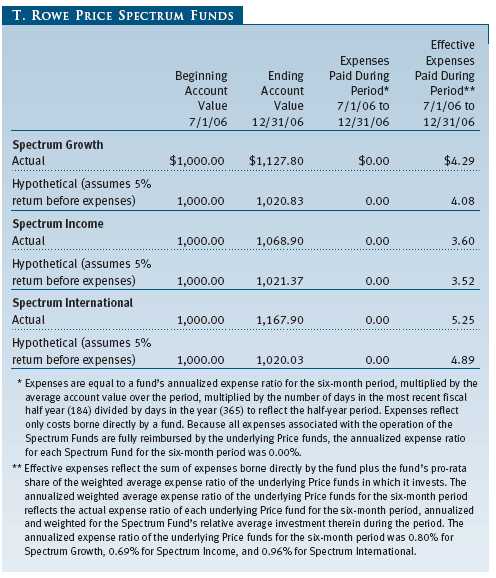
As a mutual fund shareholder, you may incur two types of costs: (1) transaction costs, such as redemption fees or sales loads, and (2) ongoing costs, including management fees, distribution and service (12b-1) fees, and other fund expenses. The following example is intended to help you understand your ongoing costs (in dollars) of investing in the fund and to compare these costs with the ongoing costs of investing in other mutual funds. The example is based on an investment of $1,000 invested at the beginning of the most recent six-month period and held for the entire period.
Actual Expenses
The first line of the following table (“Actual”) provides information about actual account values and expenses based on the fund’s actual returns. You may use the information in this line, together with your account balance, to estimate the expenses that you paid over the period. Simply divide your account value by $1,000 (for example, an $8,600 account value divided by $1,000 = 8.6), then multiply the result by the number in the first line under the heading “Expenses Paid During Period” to estimate the expenses you paid on your account during this period.
Hypothetical Example for Comparison Purposes
The information on the second line of the table (“Hypothetical”) is based on hypothetical account values and expenses derived from the fund’s actual expense ratio and an assumed 5% per year rate of return before expenses (not the fund’s actual return). You may compare the ongoing costs of investing in the fund with other funds by contrasting this 5% hypothetical example and the 5% hypothetical examples that appear in the shareholder reports of the other funds. The hypothetical account values and expenses may not be used to estimate the actual ending account balance or expenses you paid for the period.
Note: T. Rowe Price charges an annual small-account maintenance fee of $10, generally for accounts with less than $2,000 ($500 for UGMA/UTMA). The fee is waived for any investor whose T. Rowe Price mutual fund accounts total $25,000 or more, accounts employing automatic investing, and IRAs and other retirement plan accounts that utilize a prototype plan sponsored by T. Rowe Price (although a separate custodial or administrative fee may apply to such accounts). This fee is not included in the accompanying table. If you are subject to the fee, keep it in mind when you are estimating the ongoing expenses of investing in the fund and when comparing the expenses of this fund with other funds.
You should also be aware that the expenses shown in the table highlight only your ongoing costs and do not reflect any transaction costs, such as redemption fees or sales loads. Therefore, the second line of the table is useful in comparing ongoing costs only and will not help you determine the relative total costs of owning different funds. To the extent a fund charges transaction costs, however, the total cost of owning that fund is higher.
T. ROWE PRICE SPECTRUM GROWTH FUND
The accompanying notes are an integral part of these financial statements.
T. ROWE PRICE SPECTRUM INCOME FUND
The accompanying notes are an integral part of these financial statements.
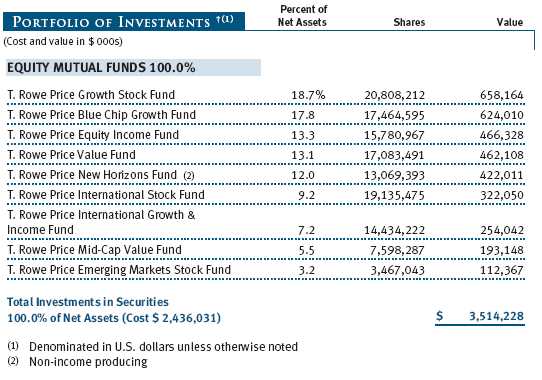
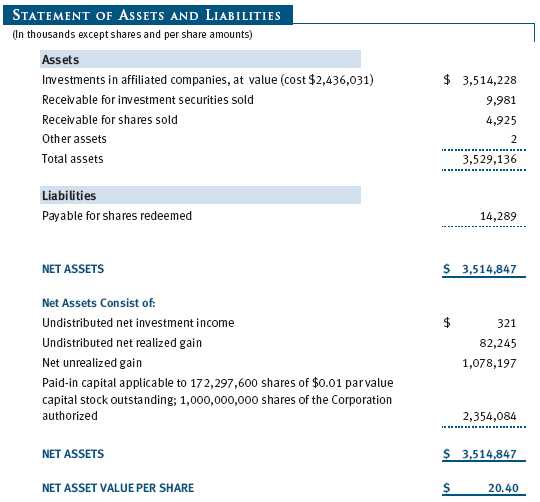
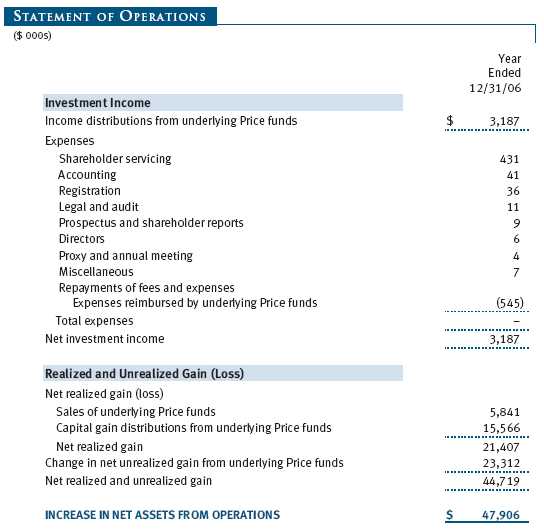
T. ROWE PRICE SPECTRUM INTERNATIONAL FUND
The accompanying notes are an integral part of these financial statements.
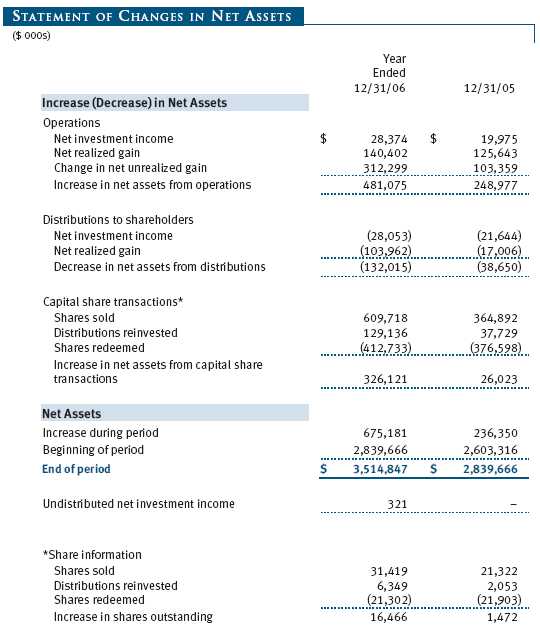
T. ROWE PRICE SPECTRUM GROWTH FUND
The accompanying notes are an integral part of these financial statements.
The accompanying notes are an integral part of these financial statements.
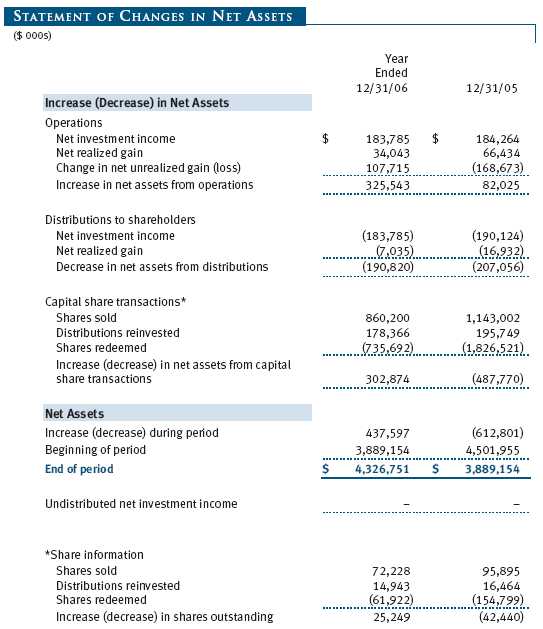
T. ROWE PRICE SPECTRUM INCOME FUND
The accompanying notes are an integral part of these financial statements.
The accompanying notes are an integral part of these financial statements.
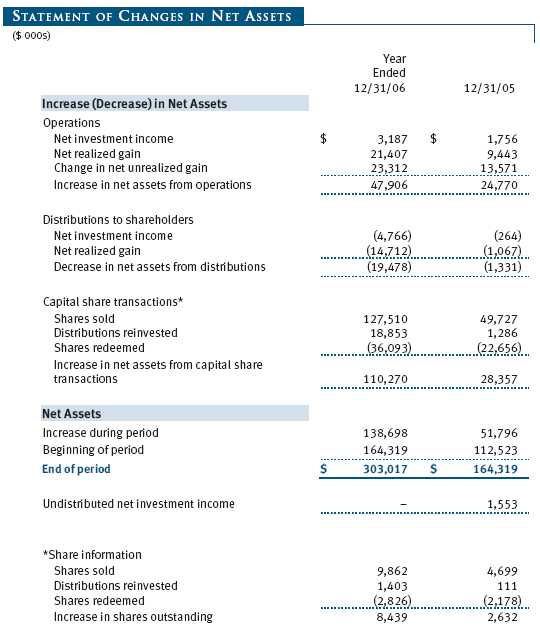
T. ROWE PRICE SPECTRUM INTERNATIONAL FUND
The accompanying notes are an integral part of these financial statements.
The accompanying notes are an integral part of these financial statements.
T. ROWE PRICE SPECTRUM GROWTH FUND
The accompanying notes are an integral part of these financial statements.
T. ROWE PRICE SPECTRUM INCOME FUND
The accompanying notes are an integral part of these financial statements.
T. ROWE PRICE SPECTRUM INTERNATIONAL FUND
The accompanying notes are an integral part of these financial statements.
| NOTES TO FINANCIAL STATEMENTS |
T. Rowe Price Spectrum Fund, Inc. (the corporation), is registered under the Investment Company Act of 1940 (the 1940 Act) as a nondiversified, open-end management investment company. Spectrum Growth Fund, Spectrum Income Fund, and Spectrum International Fund (collectively, the Spectrum Funds) are three portfolios established by the corporation. Spectrum Growth and Spectrum Income commenced operations on June 29, 1990, and Spectrum International commenced operations on December 31, 1996.
Each Spectrum Fund diversifies its assets within set limits among specific underlying T. Rowe Price funds (underlying Price funds). Spectrum Growth seeks long-term capital appreciation and growth of income with current income a secondary objective. Spectrum Income seeks a high level of current income with moderate share price fluctuation. Spectrum International seeks long-term capital appreciation.
NOTE 1 - SIGNIFICANT ACCOUNTING POLICIES
Basis of Preparation The accompanying financial statements were prepared in accordance with accounting principles generally accepted in the United States of America, which require the use of estimates made by fund management.
Valuation Each fund values its investments and computes its net asset value per share at the close of the New York Stock Exchange (NYSE), normally 4 p.m. ET, each day that the NYSE is open for business. Investments in the underlying Price funds are valued at their closing net asset value per share on the day of valuation. One of the underlying Price funds held by Spectrum International, the T. Rowe Price Japan Fund, is not open on certain days when Spectrum International is open. On such days, a net asset value per share is computed for the Japan Fund solely for purposes of valuing Spectrum International. The net asset value is computed in the normal manner using the most recent yen-denominated closing prices and exchange rates on the day of valuation. Investments for which these valuation procedures are inappropriate or are deemed not to reflect fair value are stated at fair value as determined in good faith by the T. Rowe Price Valuation Committee, established by the funds’ Board of Directors.
Redemption Fees A 2% fee is assessed on redemptions of Spectrum International fund shares held less than 90 days to deter short-term trading and to protect the interests of long-term shareholders. Redemption fees are withheld from proceeds that shareholders receive from the sale or exchange of fund shares and are paid to the fund. Redemption fees received by the fund are allocated to each underlying Price fund in proportion to the average daily value of its shares owned by the fund. Accordingly, redemption fees have no effect on the net assets of the fund.
Investment Transactions, Investment Income, and Distributions Income is recorded on the accrual basis. Income and capital gain distributions from the underlying Price funds are recorded on the ex-dividend date. Purchases and sales of the underlying Price funds are accounted for on the trade date. Realized gains and losses are reported on the identified cost basis. Distributions to the Spectrum Funds’ shareholders are recorded on the ex-dividend date. Income distributions are declared by Spectrum Income on a daily basis and paid monthly. Income distributions are declared and paid by Spectrum Growth and Spectrum International on an annual basis. Capital gain distributions, if any, are declared and paid by the fund, typically on an annual basis.
New Accounting Pronouncements In June 2006, the Financial Accounting Standards Board (“FASB”) issued FASB Interpretation No. 48 (“FIN 48”), Accounting for Uncertainty in Income Taxes, a clarification of FASB Statement No. 109, Accounting for Income Taxes. FIN 48 establishes financial reporting rules regarding recognition and measurement of tax positions taken or expected to be taken on a tax return. Management is evaluating the anticipated impact, if any, that FIN 48 will have on the funds upon adoption, which, pursuant to a delay granted by the U.S. Securities and Exchange Commission, is expected to be on the last business day of the funds’ semi-annual period, June 29, 2006.
In September 2006, the FASB released the Statement of Financial Accounting Standard No. 157 (“FAS 157”), Fair Value Measurements. FAS 157 clarifies the definition of fair value and establishes the framework for measuring fair value, as well as proper disclosure of this methodology in the financial statements. It will be effective for the funds’ fiscal year beginning January 1, 2008. Management is evaluating the effects of FAS 157; however, it is not expected to have a material impact on the funds’ net assets or results of operations.
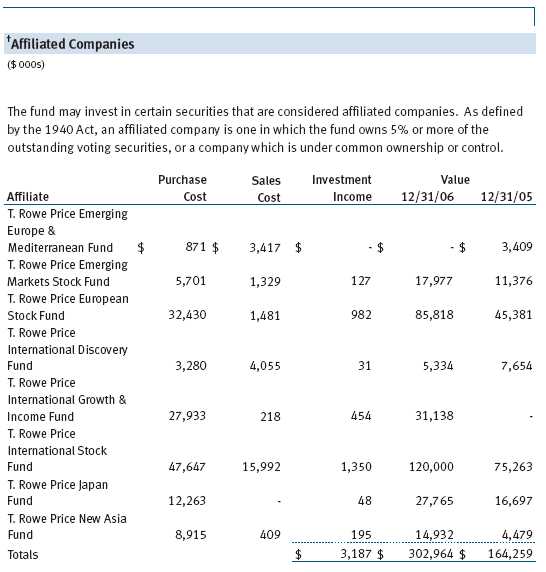
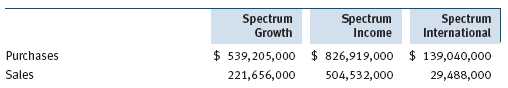
NOTE 2 - INVESTMENTS IN UNDERLYING PRICE FUNDS
Purchases and sales of the underlying Price funds for the year ended December 31, 2006, were as follows:
NOTE 3 - FEDERAL INCOME TAXES
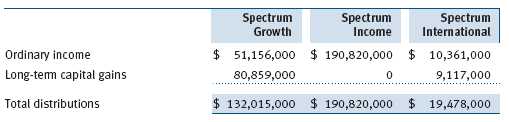
No provision for federal income taxes is required since each fund intends to continue to qualify as a regulated investment company under Subchapter M of the Internal Revenue Code and distribute to shareholders all of its taxable income and gains. Federal income tax regulations differ from generally accepted accounting principles; therefore, distributions determined in accordance with tax regulations may differ significantly in amount or character from net investment income and realized gains for financial reporting purposes. Financial reporting records are adjusted for permanent book/tax differences to reflect tax character. Financial records are not adjusted for temporary differences.
Distributions during the year ended December 31, 2006, were characterized as follows for tax purposes:
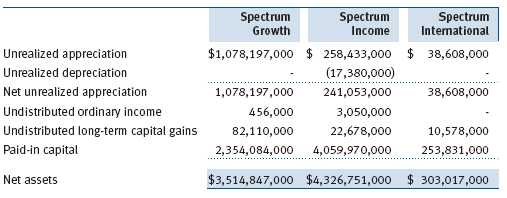
At December 31, 2006, the tax-basis components of net assets were as follows:
Each fund intends to retain realized gains to the extent of available capital loss carryforwards. During the year ended December 31, 2006, the Spectrum Income Fund utilized $8,781,000 of capital loss carryforwards.
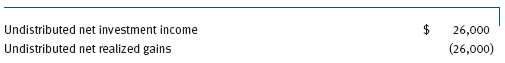
For the year ended December 31, 2006, the Spectrum International Fund recorded the following permanent reclassifications to reflect tax character. Reclassifications between income and gain relate primarily to the character of distributions from the underlying funds. Results of operations and net assets were not affected by these reclassifications.
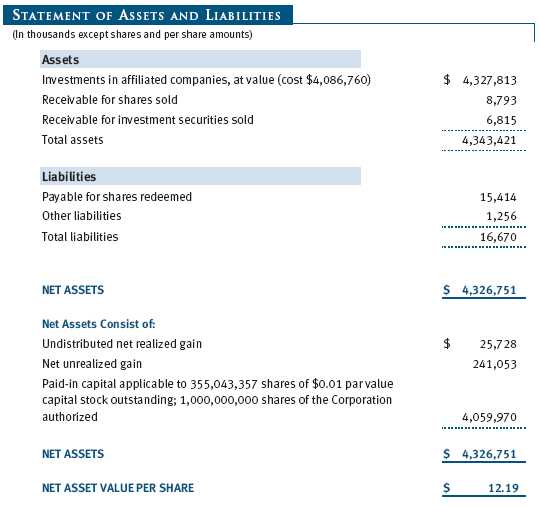
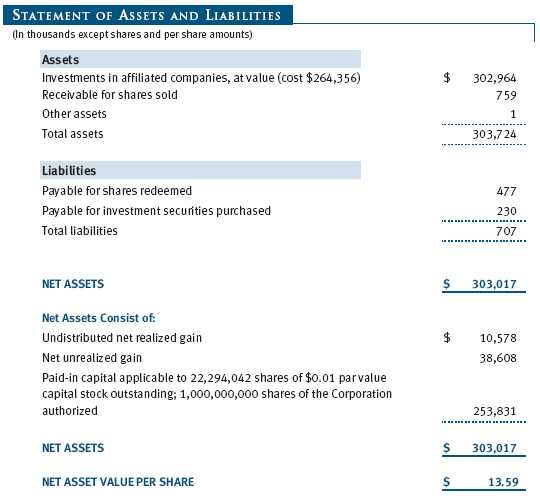
At December 31, 2006, the cost of investments for federal income tax purposes was $2,436,031,000 for Spectrum Growth, $4,086,760,000 for Spectrum Income, and $264,356,000 for Spectrum International.
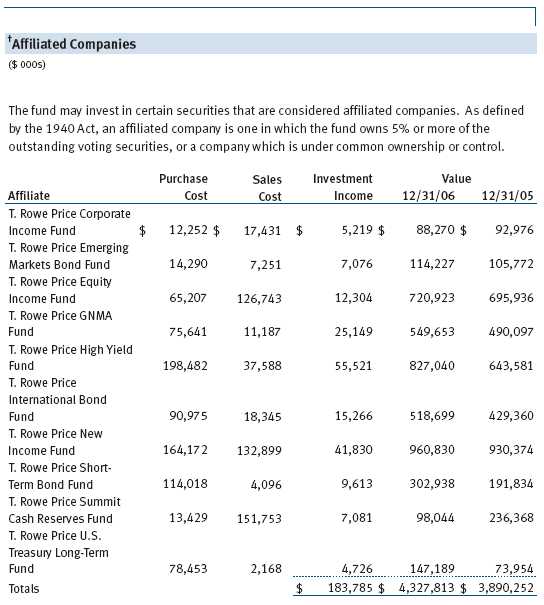
NOTE 4 - RELATED PARTIES
T. Rowe Price Associates, Inc. (Price Associates), a wholly owned subsidiary of T. Rowe Price Group, Inc., is the investment manager for Spectrum Growth and Spectrum Income, and also serves as manager for the domestic underlying Price funds. T. Rowe Price International, Inc. (Price International), a wholly owned subsidiary of Price Associates, is the investment manager for Spectrum International and also serves as manager for the international underlying Price funds. Pursuant to various service agreements, Price Associates and its wholly owned subsidiaries provide shareholder servicing and administrative, transfer and dividend disbursing, accounting, marketing, and certain other services to the Spectrum Funds. Certain officers and directors of the Spectrum Funds are also officers and directors of Price Associates and its subsidiaries, and of the underlying Price funds.
The Spectrum Funds pay no management fees; however, Price Associates and Price International receive management fees from the underlying Price funds. The Spectrum Funds operate in accordance with the investment management and special servicing agreements between and among the corporation, the underlying Price funds, Price Associates, and, in the case of Spectrum International, Price International. Pursuant to these agreements, expenses associated with the operation of the Spectrum Funds are reimbursed by each underlying Price fund to the extent of estimated savings to it and in proportion to the average daily value of its shares owned by the Spectrum Funds. Therefore, each Spectrum Fund operates at a zero expense ratio. However, each Spectrum Fund indirectly bears its proportionate share of the management fees and operating costs of the underlying Price funds in which it invests.
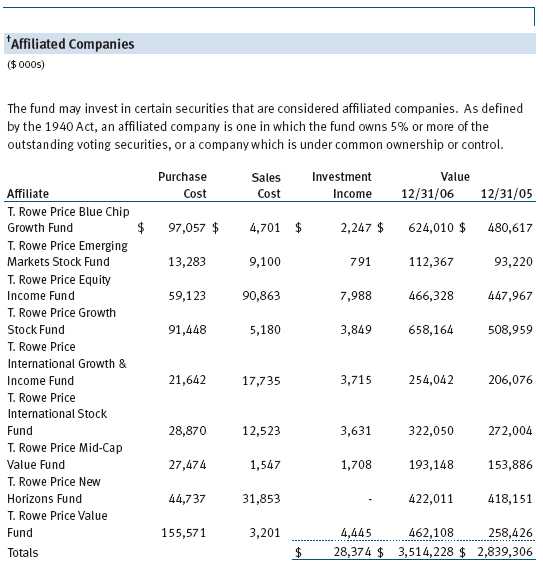
The Spectrum Funds do not invest in the underlying Price funds for the purpose of exercising management or control; however, investments by the Spectrum Funds may represent a significant portion of an underlying Price fund’s net assets. At December 31, 2006, Spectrum Growth and Spectrum International Funds each held less than 25% of the outstanding shares of any underlying Price fund; Spectrum Income Fund held approximately 50.4% of the outstanding shares of the U.S. Treasury Long-Term Fund, 43.5% of the GNMA Fund, 43.0% of the Corporate Income Fund, and 25.6% of the International Bond Fund.
Additionally, Spectrum Income Fund is one of several mutual funds in which certain college savings plans managed by Price Associates may invest. Shareholder servicing costs associated with each college savings plan are allocated to Spectrum Income Fund in proportion to the average daily value of its shares owned by the college savings plan and, in turn, are borne by the underlying Price funds in accordance with the terms of the investment management and special servicing agreements. At December 31, 2006, approximately 16% of the outstanding shares of Spectrum Income Fund were held by the college savings plans.
As of December 31, 2006, T. Rowe Price Group, Inc., and/or its wholly owned subsidiaries owned 2,341,284 shares of the Spectrum Growth Fund, representing 1% of the fund’s net assets.
| REPORT OF INDEPENDENT REGISTERED PUBLIC ACCOUNTING FIRM |
To the Board of Directors of T. Rowe Price Spectrum Funds, Inc. and Shareholders of T. Rowe Price Spectrum Growth Fund, Spectrum Income Fund, and Spectrum International Fund
In our opinion, the accompanying statements of assets and liabilities, including the portfolios of investments, and the related statements of operations and of changes in net assets and the financial highlights present fairly, in all material respects, the financial position of T. Rowe Price Spectrum Growth Fund, Spectrum Income Fund and Spectrum International Fund (the funds comprising T. Rowe Price Spectrum Funds, Inc., hereafter referred to collectively as the “Funds”) at December 31, 2006, the results of each of their operations for the year then ended, the changes in each of their net assets for each of the two years in the period then ended and the financial highlights for each of the five years in the period then ended, in conformity with accounting principles generally accepted in the United States of America. These financial statements and financial highlights (hereafter referred to as “financial statements”) are the responsibility of the Funds’ management; our responsibility is to express an opinion on these financial statements based on our audits. We conducted our audits of these financial statements in accordance with the auditing standards of the Public Company Accounting Oversight Board (United States). Those standards require that we plan and perform the audit to obtain reasonable assurance about whether the financial statements are free of material misstatement. An audit includes examining, on a test basis, evidence supporting the amounts and disclosures in the financial statements, assessing the accounting principles used and significant estimates made by management, and evaluating the overall financial statement presentation. We believe that our audits, which included confirmation of securities at December 31, 2006 by agreement to the underlying ownership records for T. Rowe Price Blue Chip Growth Fund, T. Rowe Price Corporate Income Fund, T. Rowe Price Emerging Markets Bond Fund, T. Rowe Price Emerging Markets Stock Fund, T. Rowe Price Equity Income Fund, T. Rowe Price European Stock Fund, T. Rowe Price GNMA Fund, T. Rowe Price Growth Stock Fund, T. Rowe Price High Yield Fund, T. Rowe Price International Bond Fund, T. Rowe Price International Discovery Fund, T. Rowe Price International Growth & Income Fund, T. Rowe Price International Stock Fund, T. Rowe Price Japan Fund, T. Rowe Price Mid-Cap Value Fund, T. Rowe Price New Asia Fund, T. Rowe Price New Horizons Fund, T. Rowe Price New Income Fund, T. Rowe Price Short-Term Bond Fund, T. Rowe Price Summit Cash Reserves Fund, T. Rowe Price U.S. Treasury Long-Term Fund, and T. Rowe Price Value Fund provide a reasonable basis for our opinion.
PricewaterhouseCoopers LLP
Baltimore, Maryland
February 12, 2007
| TAX INFORMATION (UNAUDITED) FOR THE TAX YEAR ENDED 12/31/06 |
SPECTRUM GROWTH FUND
We are providing this information as required by the Internal Revenue Code. The amounts shown may differ from those elsewhere in this report because of differences between tax and financial reporting requirements.
The fund’s distributions to shareholders included:
• $23,103,000 from short-term capital gains,
• $80,859,000 from long-term capital gains, subject to the 15% rate gains category.
For taxable non-corporate shareholders, $32,299,000 of the fund’s income represents qualified dividend income subject to the 15% rate category.
For corporate shareholders, $24,525,000 of the fund’s income qualifies for the dividends-received deduction.
SPECTRUM INCOME FUND
We are providing this information as required by the Internal Revenue Code. The amounts shown may differ from those elsewhere in this report because of differences between tax and financial reporting requirements.
The fund’s distributions to shareholders included $7,035,000 from short-term capital gains.
For taxable non-corporate shareholders, $14,448,000 of the fund’s income represents qualified dividend income subject to the 15% rate category.
For corporate shareholders, $14,388,000 of the fund’s income qualifies for the dividends-received deduction.
SPECTRUM INTERNATIONAL FUND
We are providing this information as required by the Internal Revenue Code. The amounts shown may differ from those elsewhere in this report because of differences between tax and financial reporting requirements.
The fund’s distributions to shareholders included:
• $5,515,000 from short-term capital gains,
• $9,224,000 from long-term capital gains, subject to the 15% rate gains category
For taxable non-corporate shareholders, $2,439,000 of the fund’s income represents qualified dividend income subject to the 15% rate category.
| INFORMATION ON PROXY VOTING POLICIES, PROCEDURES, AND RECORDS |
A description of the policies and procedures used by T. Rowe Price funds and portfolios to determine how to vote proxies relating to portfolio securities is available in each fund’s Statement of Additional Information, which you may request by calling 1-800-225-5132 or by accessing the SEC’s Web site, www.sec.gov. The description of our proxy voting policies and procedures is also available on our Web site, www.troweprice.com. To access it, click on the words “Company Info” at the top of our homepage for individual investors. Then, in the window that appears, click on the “Proxy Voting Policy” navigation button in the top left corner.
Each fund’s most recent annual proxy voting record is available on our Web site and through the SEC’s Web site. To access it through our Web site, follow the directions above, then click on the words “Proxy Voting Record” at the bottom of the Proxy Voting Policy page.
| HOW TO OBTAIN QUARTERLY PORTFOLIO HOLDINGS |
The fund files a complete schedule of portfolio holdings with the Securities and Exchange Commission for the first and third quarters of each fiscal year on Form N-Q. The fund’s Form N-Q is available electronically on the SEC’s Web site (www.sec.gov); hard copies may be reviewed and copied at the SEC’s Public Reference Room, 450 Fifth St. N.W., Washington, DC 20549. For more information on the Public Reference Room, call 1-800-SEC-0330.
| ABOUT THE FUNDS’ DIRECTORS AND OFFICERS |
Your funds are governed by a Board of Directors that meets regularly to review a wide variety of matters affecting the funds, including performance, investment programs, compliance matters, advisory fees and expenses, service providers, and other business affairs. The Board of Directors elects the funds’ officers, who are listed in the final table. At least 75% of Board members are independent of T. Rowe Price Associates, Inc. (T. Rowe Price), and T. Rowe Price International, Inc. (T. Rowe Price International); “inside” or “interested” directors are officers of T. Rowe Price. The business address of each director and officer is 100 East Pratt Street, Baltimore, Maryland 21202. The Statement of Additional Information includes additional information about the fund directors and is available without charge by calling a T. Rowe Price representative at 1-800-225-5132.
| Independent Directors | |
| |
| Name | |
| (Year of Birth) | Principal Occupation(s) During Past 5 Years |
| Year Elected* | and Directorships of Other Public Companies |
| |
| Jeremiah E. Casey | Director, Allfirst Financial Inc. (previously First Maryland Bankcorp) |
| (1940) | (1983 to 2002); Director, National Life Insurance (2001 to 2005); |
| 2005 | Director, The Rouse Company, real estate developers (1990 to 2004) |
| |
| Anthony W. Deering | Chairman, Exeter Capital, LLC, a private investment firm (2004 to |
| (1945) | present); Director, Vornado Real Estate Investment Trust (3/04 |
| 2001 | to present); Director, Mercantile Bankshares (4/03 to present); |
| | Member, Advisory Board, Deutsche Bank North America (2004 |
| | to present); Director, Chairman of the Board, and Chief Executive |
| | Officer, The Rouse Company, real estate developers (1997 to 2004) |
| |
| Donald W. Dick, Jr. | Principal, EuroCapital Advisors, LLC, an acquisition and management |
| (1943) | advisory firm; Chairman, President, and Chief Executive Officer, |
| 1999 | The Haven Group, a custom manufacturer of modular homes |
| | (1/04 to present) |
| |
| David K. Fagin | Chairman and President, Nye Corporation (6/88 to present); |
| (1938) | Director, Canyon Resources Corp., Golden Star Resources Ltd. |
| 1999 | (5/92 to present), and Pacific Rim Mining Corp. (2/02 to present) |
| |
| Karen N. Horn | Director, Federal National Mortgage Association (9/06 to present); |
| (1943) | Managing Director and President, Global Private Client Services, |
| 2003 | Marsh Inc. (1999 to 2003); Director, Georgia Pacific (5/04 to 12/05), |
| | Eli Lilly and Company, and Simon Property Group |
| Theo C. Rodgers | President, A&R Development Corporation |
| (1941) | |
| 2005 | |
| |
| John G. Schreiber | Owner/President, Centaur Capital Partners, Inc., a real estate |
| (1946) | investment company; Partner, Blackstone Real Estate Advisors, L.P. |
| 2001 | |
| * Each independent director oversees 115 T. Rowe Price portfolios and serves until retirement, resignation, |
| or election of a successor. |
| Inside Directors | |
| |
| Name | |
| (Year of Birth) | |
| Year Elected* | |
| [Number of T. Rowe Price | Principal Occupation(s) During Past 5 Years |
| Portfolios Overseen] | and Directorships of Other Public Companies |
| |
| Edward C. Bernard | Director and Vice President, T. Rowe Price and T. Rowe Price Group, |
| (1956) | Inc.; Chairman of the Board, Director, and President, T. Rowe Price |
| 2006 | Investment Services, Inc.; Chairman of the Board and Director, |
| [115] | T. Rowe Price International, Inc., T. Rowe Price Retirement Plan |
| | Services, Inc., T. Rowe Price Services, Inc., and T. Rowe Price Savings |
| | Bank; Director, T. Rowe Price Global Asset Management Limited and |
| | T. Rowe Price Global Investment Services Limited; Chief Executive |
| | Officer, Chairman of the Board, Director, and President, |
| | T. Rowe Price Trust Company; Chairman of the Board, all funds |
| |
| Brian C. Rogers, CFA, CIC | Chief Investment Officer, Director, and Vice President, T. Rowe Price |
| (1955) | and T. Rowe Price Group, Inc.; Vice President, T. Rowe Price Trust |
| 2006 | Company; Vice President, Spectrum Funds |
| [62] | |
| |
| * Each inside director serves until retirement, resignation, or election of a successor. |
| Officers | |
| |
| Name (Year of Birth) | |
| Title and Fund(s) Served | Principal Occupation(s) |
| |
| Mark C.J. Bickford-Smith (1962) | Vice President, T. Rowe Price Group, Inc., and |
| Vice President, Spectrum Funds | T. Rowe Price International, Inc. |
| |
| Joseph A. Carrier, CPA (1960) | Vice President, T. Rowe Price, T. Rowe Price |
| Treasurer, Spectrum Funds | Group, Inc., T. Rowe Price Investment Services, |
| | Inc., and T. Rowe Price Trust Company |
| |
| Roger L. Fiery III, CPA (1959) | Vice President, T. Rowe Price, T. Rowe Price |
| Vice President, Spectrum Funds | Group, Inc., T. Rowe Price International, Inc., |
| | and T. Rowe Price Trust Company |
| |
| Kenneth D. Fuller (1958) | Vice President, T. Rowe Price and T. Rowe Price |
| Vice President, Spectrum Funds | Group, Inc. |
| |
| John R. Gilner (1961) | Chief Compliance Officer and Vice President, |
| Chief Compliance Officer, Spectrum Funds | T. Rowe Price; Vice President, T. Rowe Price |
| | Group, Inc., and T. Rowe Price Investment |
| | Services, Inc. |
| |
| Gregory S. Golczewski (1966) | Vice President, T. Rowe Price and T. Rowe Price |
| Vice President, Spectrum Funds | Trust Company |
| |
| Henry H. Hopkins (1942) | Director and Vice President, T. Rowe Price |
| Vice President, Spectrum Funds | Investment Services, Inc., T. Rowe Price |
| | Services, Inc., and T. Rowe Price Trust Company; |
| | Vice President, T. Rowe Price, T. Rowe Price |
| | Group, Inc., T. Rowe Price International, Inc., |
| | and T. Rowe Price Retirement Plan Services, Inc. |
| |
| John H. Laporte, CFA (1945) | Vice President, T. Rowe Price, T. Rowe Price |
| Executive Vice President, Spectrum Funds | Group, Inc., and T. Rowe Price Trust Company |
| |
| Patricia B. Lippert (1953) | Assistant Vice President, T. Rowe Price and |
| Secretary, Spectrum Funds | T. Rowe Price Investment Services, Inc. |
| |
| Mary J. Miller, CFA (1955) | Director and Vice President, T. Rowe Price; Vice |
| Executive Vice President, Spectrum Funds | President, T. Rowe Price Group, Inc. |
| |
| Raymond A. Mills, Ph.D., CFA (1960) | Vice President, T. Rowe Price, T. Rowe Price |
| Vice President, Spectrum Funds | Group, Inc., and T. Rowe Price International, |
| | Inc. |
| Edmund M. Notzon III, Ph.D., CFA (1945) | Vice President, T. Rowe Price, T. Rowe Price |
| President, Spectrum Funds | Group, Inc., T. Rowe Price Investment Services, |
| | Inc., and T. Rowe Price Trust Company |
| |
| Charles M. Shriver, CFA (1967) | Vice President, T. Rowe Price |
| Vice President, Spectrum Funds | |
| |
| Robert W. Smith (1961) | Vice President, T. Rowe Price, T. Rowe Price |
| Vice President, Spectrum Funds | Group, Inc., and T. Rowe Price Trust Company |
| |
| Julie L. Waples (1970) | Vice President, T. Rowe Price |
| Vice President, Spectrum Funds | |
| |
| David J.L. Warren (1957) | Director, T. Rowe Price, T. Rowe Price Global |
| Executive Vice President, Spectrum Funds | Asset Management Limited, and T. Rowe Price |
| | Global Investment Services Limited; Vice |
| | President, T. Rowe Price Group, Inc.; Chief |
| | Executive Officer, Director, and President, |
| | T. Rowe Price International, Inc. |
| |
| Unless otherwise noted, officers have been employees of T. Rowe Price or T. Rowe Price International for at |
| least five years. | |
Item 2. Code of Ethics.The registrant has adopted a code of ethics, as defined in Item 2 of Form N-CSR, applicable to its principal executive officer, principal financial officer, principal accounting officer or controller, or persons performing similar functions. A copy of this code of ethics is filed as an exhibit to this Form N-CSR. No substantive amendments were approved or waivers were granted to this code of ethics during the period covered by this report.
Item 3. Audit Committee Financial Expert.
The registrant’s Board of Directors/Trustees has determined that Mr. Donald W. Dick Jr. qualifies as an audit committee financial expert, as defined in Item 3 of Form N-CSR. Mr. Dick is considered independent for purposes of Item 3 of Form N-CSR.
Item 4. Principal Accountant Fees and Services.
(a) – (d) Aggregate fees billed to the registrant for the last two fiscal years for professional services rendered by the registrant’s principal accountant were as follows:
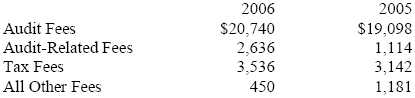
Audit fees include amounts related to the audit of the registrant’s annual financial statements and services normally provided by the accountant in connection with statutory and regulatory filings. Audit-related fees include amounts reasonably related to the performance of the audit of the registrant’s financial statements and specifically include the issuance of a report on internal controls and, if applicable for 2006, agreed-upon procedures related to fund acquisitions. Tax fees include amounts related to services for tax compliance, tax planning, and tax advice. The nature of these services specifically includes the review of distribution calculations and the preparation of Federal, state, and excise tax returns. Reclassification from tax fees to audit fees of fiscal 2005 amounts related to the auditing of tax disclosures within the registrant’s annual financial statements has been made in order to conform to fiscal 2006 presentation. All other fees include the registrant’s pro-rata share of amounts for agreed-upon procedures in conjunction with service contract approvals by the registrant’s Board of Directors/Trustees.
(e)(1) The registrant’s audit committee has adopted a policy whereby audit and non-audit services performed by the registrant’s principal accountant for the registrant, its investment adviser, and any entity controlling, controlled by, or under common control with the investment adviser that provides ongoing services to the registrant require pre-approval in advance at regularly scheduled audit committee meetings. If such a service is required between regularly scheduled audit committee meetings, pre-approval may be authorized by one audit committee member with ratification at the next scheduled audit committee meeting. Waiver of pre-approval for audit or non-audit services requiring fees of a de minimis amount is not permitted.
(2) No services included in (b) – (d) above were approved pursuant to paragraph (c)(7)(i)(C) of Rule 2-01 of Regulation S-X.
(f) Less than 50 percent of the hours expended on the principal accountant’s engagement to audit the registrant’s financial statements for the most recent fiscal year were attributed to work performed by persons other than the principal accountant’s full-time, permanent employees.
(g) The aggregate fees billed for the most recent fiscal year and the preceding fiscal year by the registrant’s principal accountant for non-audit services rendered to the registrant, its investment adviser, and any entity controlling, controlled by, or under common control with the investment adviser that provides ongoing services to the registrant were $1,401,000 and $883,000, respectively, and were less than the aggregate fees billed for those same periods by the registrant’s principal accountant for audit services rendered to the T. Rowe Price Funds. Preceding fiscal year amount reflects the reclassification of tax fees described in (a) – (d) above.
(h) All non-audit services rendered in (g) above were pre-approved by the registrant’s audit committee. Accordingly, these services were considered by the registrant’s audit committee in maintaining the principal accountant’s independence.Item 5. Audit Committee of Listed Registrants.
Not applicable.
Item 6. Schedule of Investments.
Not applicable. The complete schedule of investments is included in Item 1 of this Form N-CSR.
Item 7. Disclosure of Proxy Voting Policies and Procedures for Closed-End Management Investment Companies.
Not applicable.
Item 8. Portfolio Managers of Closed-End Management Investment Companies.
Not applicable.
Item 9. Purchases of Equity Securities by Closed-End Management Investment Company and Affiliated Purchasers.
Not applicable.
Item 10. Submission of Matters to a Vote of Security Holders.
Not applicable.
Item 11. Controls and Procedures.
(a) The registrant’s principal executive officer and principal financial officer have evaluated the registrant’s disclosure controls and procedures within 90 days of this filing and have concluded that the registrant’s disclosure controls and procedures were effective, as of that date, in ensuring that information required to be disclosed by the registrant in this Form N-CSR was recorded, processed, summarized, and reported timely.
(b) The registrant’s principal executive officer and principal financial officer are aware of no change in the registrant’s internal control over financial reporting that occurred during the registrant’s second fiscal quarter covered by this report that has materially affected, or is reasonably likely to materially affect, the registrant’s internal control over financial reporting.
Item 12. Exhibits.
(a)(1) The registrant’s code of ethics pursuant to Item 2 of Form N-CSR is attached.
(2) Separate certifications by the registrant's principal executive officer and principal financial officer, pursuant to Section 302 of the Sarbanes-Oxley Act of 2002 and required by Rule 30a-2(a) under the Investment Company Act of 1940, are attached.
(3) Written solicitation to repurchase securities issued by closed-end companies: not applicable.
(b) A certification by the registrant's principal executive officer and principal financial officer, pursuant to Section 906 of the Sarbanes-Oxley Act of 2002 and required by Rule 30a-2(b) under the Investment Company Act of 1940, is attached.
| | |
SIGNATURES |
| |
| | Pursuant to the requirements of the Securities Exchange Act of 1934 and the Investment |
| Company Act of 1940, the registrant has duly caused this report to be signed on its behalf by the |
| undersigned, thereunto duly authorized. |
| |
| T. Rowe Price Spectrum Fund, Inc. |
| |
| |
| |
| By | /s/ Edward C. Bernard |
| | Edward C. Bernard |
| | Principal Executive Officer |
| |
| Date | February 16, 2007 |
| |
| |
| | Pursuant to the requirements of the Securities Exchange Act of 1934 and the Investment |
| Company Act of 1940, this report has been signed below by the following persons on behalf of |
| the registrant and in the capacities and on the dates indicated. |
| |
| |
| By | /s/ Edward C. Bernard |
| | Edward C. Bernard |
| | Principal Executive Officer |
| |
| Date | February 16, 2007 |
| |
| |
| |
| By | /s/ Joseph A. Carrier |
| | Joseph A. Carrier |
| | Principal Financial Officer |
| |
| Date | February 16, 2007 |