Item 1: Report to Shareholders| Spectrum Funds | December 31, 2007 |
The views and opinions in this report were current as of December 31, 2007. They are not guarantees of performance or investment results and should not be taken as investment advice. Investment decisions reflect a variety of factors, and the managers reserve the right to change their views about individual stocks, sectors, and the markets at any time. As a result, the views expressed should not be relied upon as a forecast of the fund’s future investment intent. The report is certified under the Sarbanes-Oxley Act, which requires mutual funds and other public companies to affirm that, to the best of their knowledge, the information in their financial reports is fairly and accurately stated in all material respects.
REPORTS ON THE WEB
Sign up for our E-mail Program, and you can begin to receive updated fund reports and prospectuses online rather than through the mail. Log in to your account at troweprice.com for more information.
Manager’s Letter
Fellow Shareholders
Despite some upheaval in recent months, the global financial markets produced generally positive returns in 2007. Stock markets worldwide enjoyed solid gains in the first half of the year, then rode out a significant increase in volatility over the last six months. The bond market, in contrast, was relatively muted in the first six months, then put together a robust rally in the latter part of the year. As the performance of the Spectrum Funds illustrates, foreign stocks delivered double-digit returns in 2007, while U.S. stocks and bonds posted moderate gains.
HIGHLIGHTS
• International stocks produced double-digit returns, while U.S. stocks and bonds posted modest gains in 2007.
• The Spectrum Funds generally reflected these performance patterns, and Spectrum Growth and Spectrum International outpaced their broad market benchmarks for the year, while Spectrum Income modestly lagged.
• Broad diversification among multiple T. Rowe Price funds is at the heart of each fund’s long-term investment strategy.
• The credit crunch and housing debacle are putting increasing strains on the U.S. economy. Interest rates should continue to decline in the first part of the year, which would favor U.S. bonds. Overseas markets, particularly emerging markets, show signs of continued expansion.
MARKET ENVIRONMENT
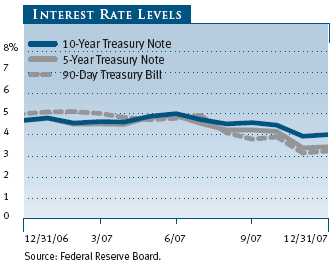
The linchpin event for the global economy and financial markets was the implosion of the U.S. subprime lending industry and the credit crunch that followed. In the U.S., the debacle led to higher mortgage delinquencies and defaults, tighter lending standards, a lack of liquidity in the credit markets, and substantial losses from structured securities backed by subprime mortgages. It also increased the odds of a recession in the U.S. economy, leading the Federal Reserve to cut the fed funds rate three times in the last four months of the year—even as record energy and commodity prices were contributing to a higher inflation rate. On January 22, 2008, following the end of the Spectrum Funds’ 2007 reporting period, the Fed took the aggressive action of cutting rates by 75 basis points, citing the “increasing downside risks to growth.”
The challenging credit environment had a deleterious effect on economic activity elsewhere in the world. European economies generally improved in 2007, boosted by higher consumer spending and industrial output, but a combination of tighter credit and a stronger euro prompted European central banks to stop raising interest rates in the last six months of the year. The Japanese economy, already struggling with weak domestic consumption, was squeezed further by expectations of slowing growth in the U.S., its largest export market. The only exception was developing markets, where economic growth remained on a strong upward trajectory, with China and India as the largest, most visible examples.
Despite the difficulties created by the subprime crisis, U.S. stocks managed to gain ground for the fifth straight year in 2007. Two brief subprime-related dips in February and June were the only interruptions in a steady stock market rally during the first half of the year as corporate profit growth exceeded expectations and merger activity remained strong. In the wake of the subprime market collapse, market volatility increased markedly, and stocks closed the year on a pessimistic note, declining broadly in the final quarter. Nonetheless, the major stock indexes advanced overall for the year, led by large-cap issues, while small-cap shares declined modestly. For the first time since 2000, growth stocks outperformed value across all market capitalizations.
International stocks also registered their fifth consecutive year of positive performance, outpacing the domestic market. Emerging markets generated the best returns, continuing to rise smartly in the second half of the year, despite the turbulence elsewhere in the world. Among developed markets, Pacific Rim countries were the best performers, followed by Europe, while Japan was one of the few markets worldwide to decline in 2007.
The U.S. bond market enjoyed its best year since 2002. Bonds were volatile but largely unchanged in the first half of the year amid mixed economic and inflation data. However, investment-grade bonds staged an impressive rally in the last six months as the subprime disaster led to a “flight to quality,” with investors fleeing riskier investments for the relative safety of U.S. Treasuries. The Federal Reserve’s first interest rate cuts in four years also contributed to the favorable bond environment. Overall, the broad Lehman Brothers U.S. Aggregate Index returned 6.97% for the year. Treasury bonds were the best performers, while high-yield corporate bonds lagged, weighed down by credit concerns.
Overseas bonds outperformed domestic fixed-income securities, primarily because of weakness in the U.S. dollar. The J.P. Morgan Non-U.S. Dollar Government Bond Index returned 11.30% in 2007, while the J.P. Morgan Emerging Markets Bond Index Plus returned 6.45%.
SPECTRUM GROWTH FUND
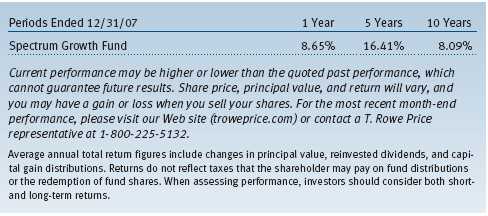
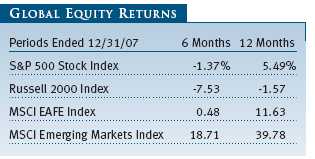
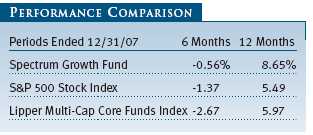
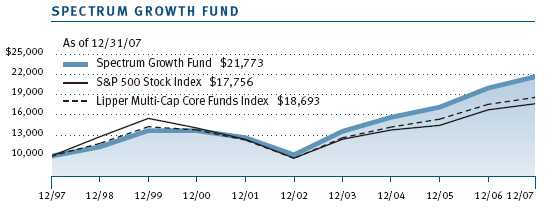
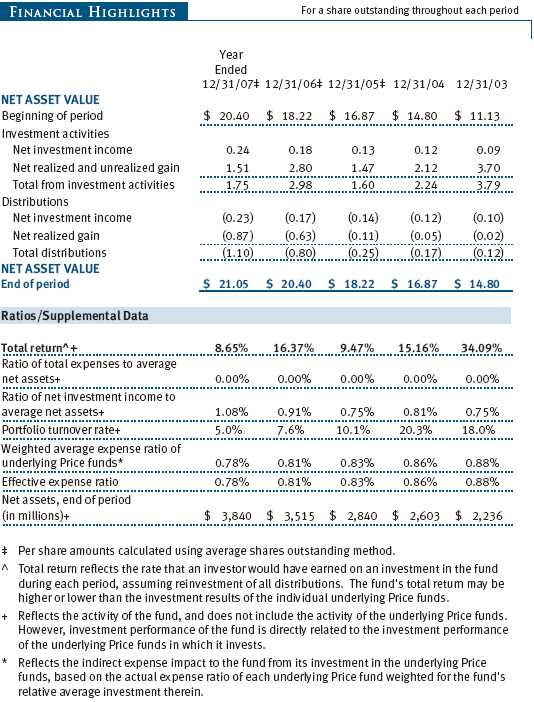
Your fund posted good relative results in 2007, outperforming its benchmark and peer group for both the full year and the last six months. Looking at the accompanying table, Spectrum Growth’s –0.56% return for the six months ended December 31, 2007, and its 8.65% return for all of 2007 outpaced the returns of both the S&P 500 Stock Index and the Lipper Multi-Cap Core Funds Index over the same time periods. Diversification was the key behind the fund’s outperformance, particularly its exposure to international stocks and large, growth-oriented companies.
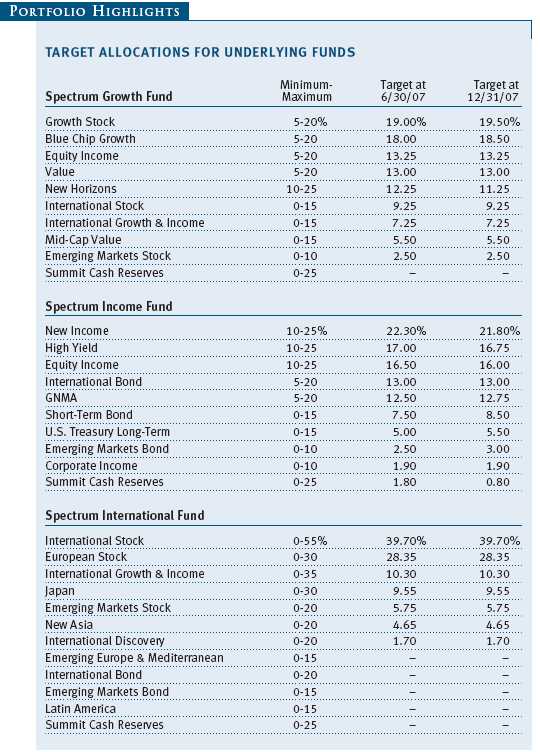
The fund’s international holdings, which made up approximately 26% of the portfolio as of December 31, 2007, produced the best returns. In particular, Emerging Markets Stock was the top performer, returning 43% in 2007. We modestly reduced our position in Emerging Markets Stock early in the year, moving the assets into our two other international components, International Stock and International Growth & Income.
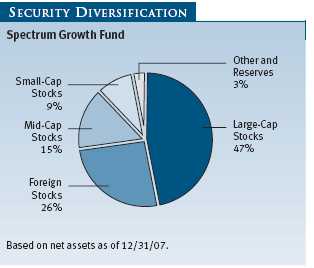
Among domestic holdings, the portfolio’s large-cap growth funds—Blue Chip Growth and Growth Stock—were the best performers, generating double-digit gains. The two largest positions in the portfolio, Blue Chip Growth and Growth Stock had lagged in recent years as large-cap growth stocks underperformed other segments of the market. We remain confident that large growth will continue to outperform as the economy remains weak in 2008, so we have increased our overweights in Blue Chip Growth and Growth Stock while trimming our holdings of New Horizons, a small-cap growth fund.
The portfolio’s value holdings lagged in 2007, reflecting the broad underperformance of value stocks after seven years of market leadership. Value and Mid-Cap Value were the two weakest performers, posting barely positive returns for the year after declining sharply over the last six months. Equity Income, which emphasizes dividend-paying stocks, held up somewhat better but underperformed the broad stock market indexes.
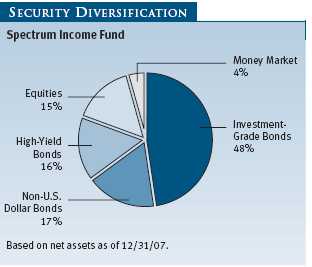
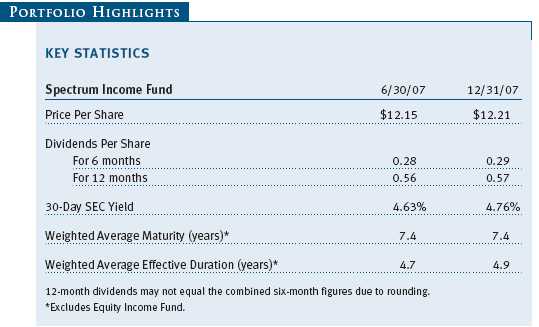
SPECTRUM INCOME FUND
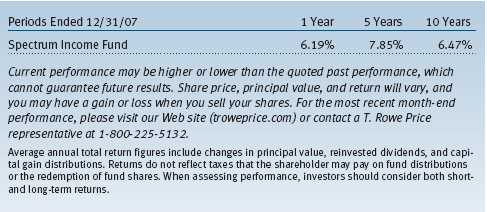
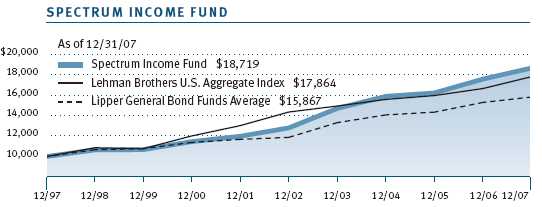
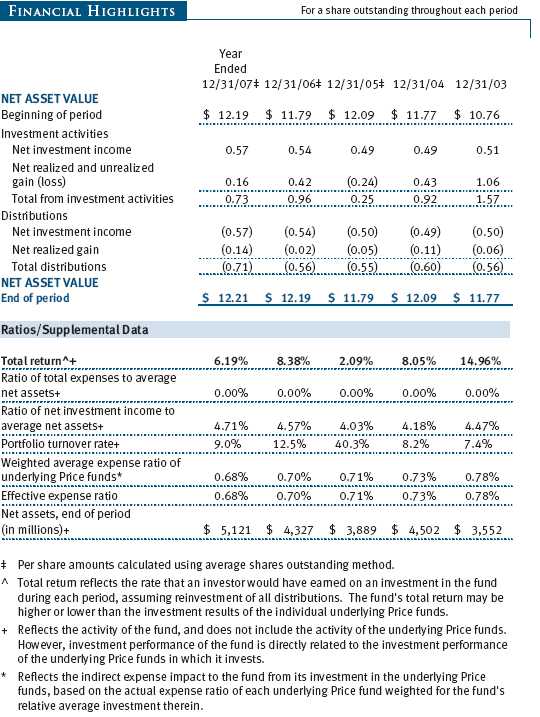
As the accompanying table shows, your fund advanced for the six and 12 months ended December 31, 2007. Spectrum Income returned 3.51% over the last six months of 2007 and 6.19% for the full year, well ahead of the Lipper General Bond Funds Average but trailing the Lehman Brothers U.S. Aggregate Index. Spectrum Income’s underperformance of its benchmark index resulted primarily from significant weightings in non-benchmark holdings such as high-yield corporate bonds and dividend-paying stocks, both of which declined in the second half of the year.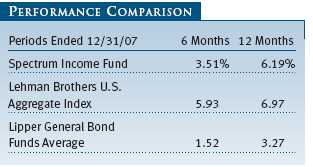
The top performers in the portfolio were International Bond and U.S. Treasury Long-Term. Both holdings returned approximately 10% in 2007, with virtually all of the gains coming in the last six months of the year. We increased our positions in these two funds in the first half of the year, which proved beneficial for performance, and we added further to U.S. Treasury Long-Term in the last six months.
Among the remaining positions in the portfolio, the best performers were GNMA, which invests in high-quality mortgage-backed securities, and New Income, a diversified bond fund and the portfolio’s largest holding. We lowered our position in GNMA early in the year as the housing market continued to deteriorate, but we moved some assets back into GNMA late in the year as the subprime fiasco boosted demand for high-quality mortgage-backed securities.
Equity Income, which earns income from dividend-paying stocks, and High Yield were the laggards in the portfolio. These two holdings have been strong performers and valuable diversifiers over the past several years, and they continued this role in the first half of the year. However, both positions lost ground in the last six months as the equities and credit-related sectors underperformed. We cut back on our holdings of both Equity Income and High Yield during the year, but they remained the second- and third-largest positions in the portfolio.
In addition to the adjustments mentioned above, we shifted nearly all of the assets out of Summit Cash Reserves and into Short-Term Bond, which has historically provided better results when the Fed is cutting short-term interest rates.SPECTRUM INTERNATIONAL FUND
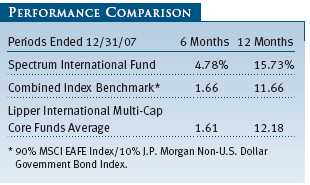
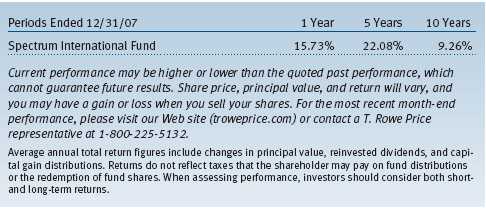
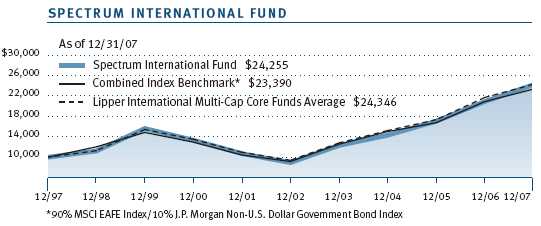
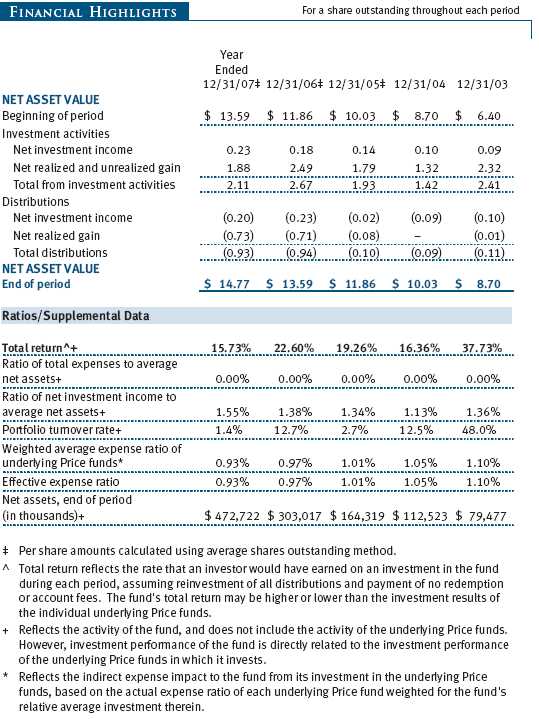
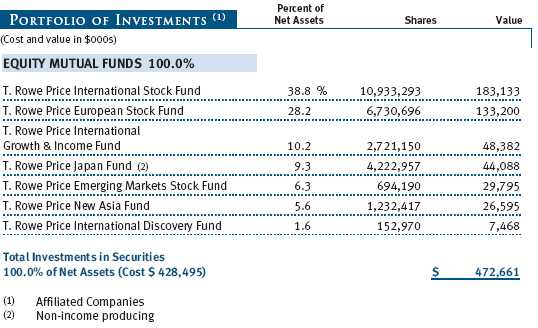
Your fund generated strong returns and outperformed its benchmarks in 2007. As the accompanying table illuminates, Spectrum International returned 15.73% for the year, ahead of its combined index benchmark and the Lipper International Multi-Cap Core Funds Average. Much of this outperformance was derived from the last six months of the year when Spectrum International returned 4.78%, surpassing the narrow advances of the combined benchmark and the Lipper group average. Strong results from Asian markets helped the portfolio outperform the benchmarks in 2007.
For the second straight year, New Asia was the portfolio’s best performer, returning 66.38% in 2007 after a 36.12% gain in 2006. New Asia, which invests in Asian markets other than Japan, benefited from its significant exposure to China and India. Emerging Markets Stock also produced strong results, returning 43% for the year.
Among the remaining holdings, International Discovery, European Stock, and International Stock were the top performers. International Discovery, which focuses on small-cap foreign equities, and International Stock, the portfolio’s largest holding, both benefited from increased exposure to non-Japan Asia. Robust European equity returns in the first half of the year helped lift European Stock.
The only position in the portfolio to decline in 2007 was Japan, reflecting the weakness in the Japanese equity market. International Growth & Income—a diverse, value-oriented foreign holding—fell in the second half of the year as value stocks underperformed on a global basis.
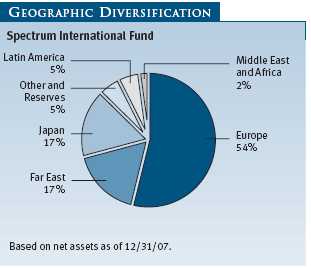
We made no material changes to the portfolio’s individual weightings in 2007. Spectrum International’s primary focus remained on developed markets, with modest but meaningful exposure to emerging markets.
OUTLOOK
The continuing credit crunch brought on by the subprime housing debacle is putting increasing pressure on the U.S. economy. In a slowing economic environment, corporate profits growth rates are likely to slow, putting a premium on companies that can deliver steady increases in earnings. International companies that are heavily dependent on exports to the U.S. would also be adversely affected by slower U.S. growth. Nonetheless, many overseas economies remain poised for continued expansion, particularly in emerging markets.
The Federal Reserve took the rare step of lowering interest rates by 75 basis points on January 22, 2008. The decision came one week before a regularly scheduled board meeting. It served to underscore the fragility of the economy. Indeed, further rate cuts were expected, as the Fed appears ready to lower interest rates to forestall a contraction, which would generally be favorable for U.S. bonds. In addition, certain high-quality sectors of the bond market that have been harmed by the mortgage crisis may begin to look attractive, though risks of further subprime fallout remain.
We believe that uncertainty about the economy and the potential for market turbulence underscores the value of the Spectrum Funds’ broadly diversified portfolios.
Respectfully submitted,

Edmund M. Notzon III
President of the Spectrum Funds and chairman of the Investment
Advisory Committee
January 23, 2008
The committee chairman has day-to-day responsibility for managing the portfolios and works with committee members in developing and executing the funds’ investment programs.
RISKS OF INVESTING
As with all stock and bond mutual funds, each fund’s share price can fall because of weakness in the stock or bond markets, a particular industry, or specific holdings. Stock markets can decline for many reasons, including adverse political or economic developments, changes in investor psychology, or heavy institutional selling. The prospects for an industry or company may deteriorate because of a variety of factors, including disappointing earnings or changes in the competitive environment. In addition, the investment manager’s assessment of companies held in a fund may prove incorrect, resulting in losses or poor performance even in rising markets.
Bonds are subject to interest rate risk, the decline in bond prices that usually accompanies a rise in interest rates, and credit risk, the chance that any fund holding could have its credit rating downgraded, or that a bond issuer will default (fail to make timely payments of interest or principal), potentially reducing the fund’s income level and share price. High-yield corporate bonds could have greater price declines than funds that invest primarily in high-quality bonds. Companies issuing high-yield bonds are not as strong financially as those with higher credit ratings, so the bonds are usually considered speculative investments.
Funds that invest overseas may carry more risk than funds that invest strictly in U.S. assets. Risks can result from varying stages of economic and political development; differing regulatory environments, trading days, and accounting standards; and higher transaction costs of non-U.S. markets. Non-U.S. investments are also subject to currency risk, or a decline in the value of a foreign currency versus the U.S. dollar, which reduces the dollar value of securities denominated in that currency.
GLOSSARY
J.P. Morgan Non-U.S. Dollar Government Bond Index: An unmanaged index that tracks the performance of major non-U.S. bond markets.
J.P. Morgan Emerging Markets Bond Index: An unmanaged index that tracks dollar-denominated bonds issued by emerging market countries.
Lehman Brothers U.S. Aggregate Index: An unmanaged index that tracks investment-grade corporate and government bonds.
MSCI EAFE Index: An unmanaged index that tracks the stocks of about 1,000 companies in Europe, Australasia, and the Far East (EAFE).
MSCI Emerging Markets Free Index: An unmanaged index that tracks stocks in 26 emerging market countries.
Russell 2000 Index: An unmanaged index that tracks the smallest 2,000 of the largest 3,000 U.S. stocks.
S&P 500 Stock Index: An unmanaged index that tracks the stocks of 500 U.S. primarily large-cap companies.
Performance and Expenses
This chart shows the value of a hypothetical $10,000 investment in the fund over the past 10 fiscal year periods or since inception (for funds lacking 10-year records). The result is compared with benchmarks, which may include a broad-based market index and a peer group average or index. Market indexes do not include expenses, which are deducted from fund returns as well as mutual fund averages and indexes.
| AVERAGE ANNUAL COMPOUND TOTAL RETURN |
This table shows how the fund would have performed each year if its actual (or cumulative) returns had been earned at a constant rate.
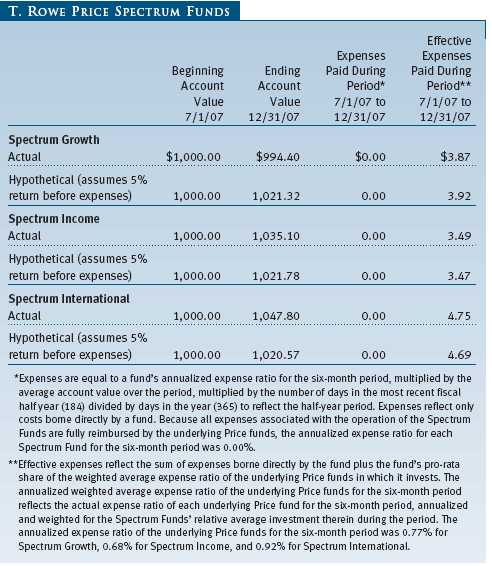
As a mutual fund shareholder, you may incur two types of costs: (1) transaction costs, such as redemption fees or sales loads, and (2) ongoing costs, including management fees, distribution and service (12b-1) fees, and other fund expenses. The following example is intended to help you understand your ongoing costs (in dollars) of investing in the fund and to compare these costs with the ongoing costs of investing in other mutual funds. The example is based on an investment of $1,000 invested at the beginning of the most recent six-month period and held for the entire period.
Actual Expenses
The first line of the following table (“Actual”) provides information about actual account values and expenses based on the fund’s actual returns. You may use the information in this line, together with your account balance, to estimate the expenses that you paid over the period. Simply divide your account value by $1,000 (for example, an $8,600 account value divided by $1,000 = 8.6), then multiply the result by the number in the first line under the heading “Expenses Paid During Period” to estimate the expenses you paid on your account during this period.
Hypothetical Example for Comparison Purposes
The information on the second line of the table (“Hypothetical”) is based on hypothetical account values and expenses derived from the fund’s actual expense ratio and an assumed 5% per year rate of return before expenses (not the fund’s actual return). You may compare the ongoing costs of investing in the fund with other funds by contrasting this 5% hypothetical example and the 5% hypothetical examples that appear in the shareholder reports of the other funds. The hypothetical account values and expenses may not be used to estimate the actual ending account balance or expenses you paid for the period.
Note: T. Rowe Price charges an annual small-account maintenance fee of $10, generally for accounts with less than $2,000 ($500 for UGMA/UTMA). The fee is waived for any investor whose T. Rowe Price mutual fund accounts total $25,000 or more, accounts employing automatic investing, and IRAs and other retirement plan accounts that utilize a prototype plan sponsored by T. Rowe Price (although a separate custodial or administrative fee may apply to such accounts). This fee is not included in the accompanying table. If you are subject to the fee, keep it in mind when you are estimating the ongoing expenses of investing in the fund and when comparing the expenses of this fund with other funds.
You should also be aware that the expenses shown in the table highlight only your ongoing costs and do not reflect any transaction costs, such as redemption fees or sales loads. Therefore, the second line of the table is useful in comparing ongoing costs only and will not help you determine the relative total costs of owning different funds. To the extent a fund charges transaction costs, however, the total cost of owning that fund is higher.
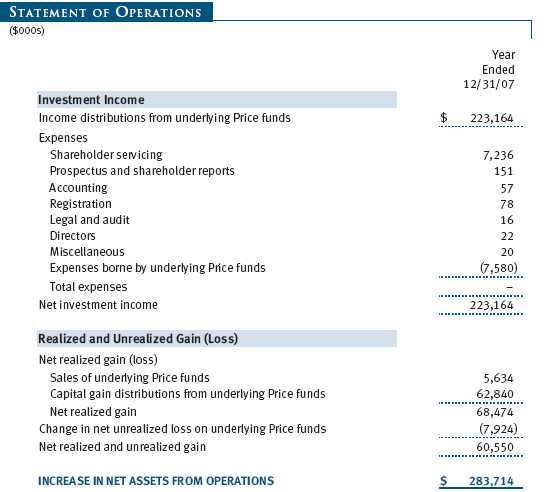
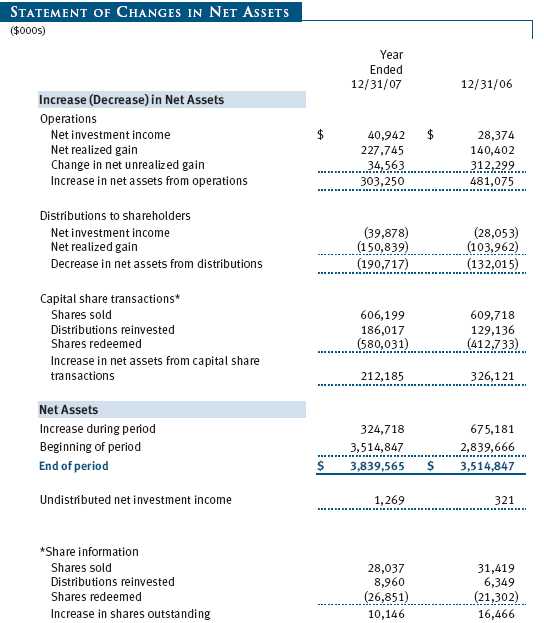
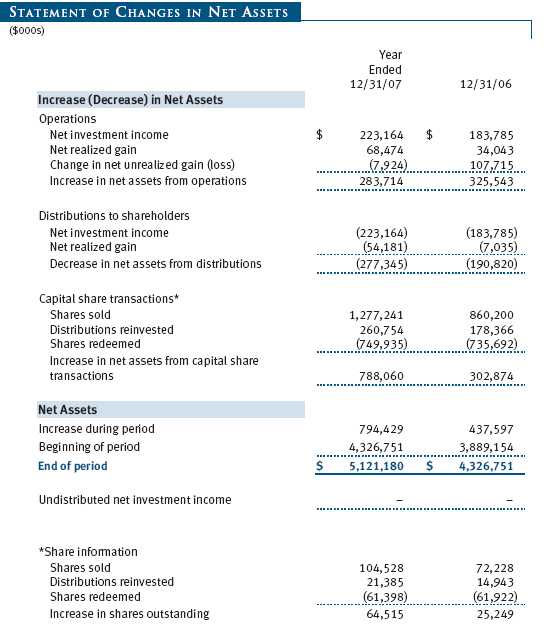
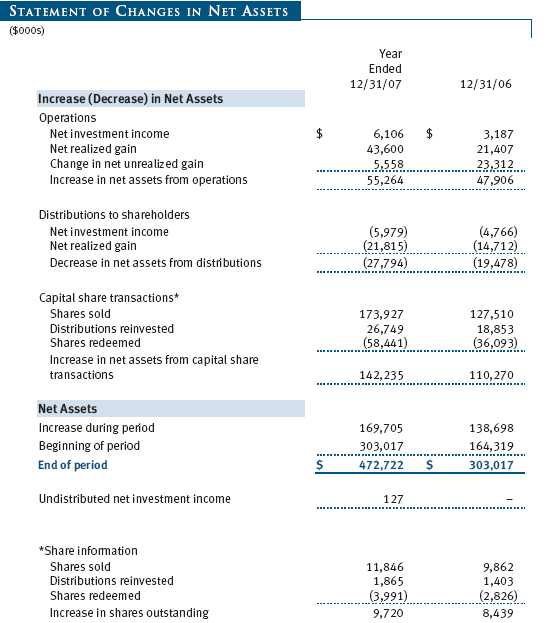
The accompanying notes are an integral part of these financial statements.
The accompanying notes are an integral part of these financial statements.
The accompanying notes are an integral part of these financial statements.
The accompanying notes are an integral part of these financial statements.
The accompanying notes are an integral part of these financial statements.

The accompanying notes are an integral part of these financial statements.
The accompanying notes are an integral part of these financial statements.
The accompanying notes are an integral part of these financial statements.
The accompanying notes are an integral part of these financial statements.
The accompanying notes are an integral part of these financial statements.
The accompanying notes are an integral part of these financial statements.

The accompanying notes are an integral part of these financial statements.
The accompanying notes are an integral part of these financial statements.
The accompanying notes are an integral part of these financial statements.
The accompanying notes are an integral part of these financial statements.
| NOTES TO FINANCIAL STATEMENTS |
T. Rowe Price Spectrum Fund, Inc. (the corporation), is registered under the Investment Company Act of 1940 (the 1940 Act) as a nondiversified, open-end management investment company. Spectrum Growth Fund, Spectrum Income Fund, and Spectrum International Fund (collectively, the Spectrum Funds) are three portfolios established by the corporation. Spectrum Growth and Spectrum Income commenced operations on June 29, 1990, and Spectrum International commenced operations on December 31, 1996.
Each Spectrum Fund diversifies its assets within set limits among specific underlying T. Rowe Price funds (underlying Price funds). Spectrum Growth seeks long-term capital appreciation and growth of income with current income a secondary objective. Spectrum Income seeks a high level of current income with moderate share price fluctuation. Spectrum International seeks long-term capital appreciation.
NOTE 1 - SIGNIFICANT ACCOUNTING POLICIES
Basis of Preparation The accompanying financial statements were prepared in accordance with accounting principles generally accepted in the United States of America, which require the use of estimates made by fund management.
Valuation Each fund values its investments and computes its net asset value per share at the close of the New York Stock Exchange (NYSE), normally 4 p.m. ET, each day that the NYSE is open for business. Investments in the underlying Price funds are valued at their closing net asset value per share on the day of valuation. Investments for which these valuation procedures are inappropriate or are deemed not to reflect fair value are stated at fair value as determined in good faith by the T. Rowe Price Valuation Committee, established by the funds’ Board of Directors.
Redemption Fees A 2% fee is assessed on redemptions of Spectrum International fund shares held for 90 days or less to deter short-term trading and to protect the interests of long-term shareholders. Redemption fees are withheld from proceeds that shareholders receive from the sale or exchange of fund shares and are paid to the fund. Redemption fees received by the fund are allocated to each underlying Price fund in proportion to the average daily value of its shares owned by the fund. Accordingly, redemption fees have no effect on the net assets of the fund.
Investment Transactions, Investment Income, and Distributions Income is recorded on the accrual basis. Income and capital gain distributions from the underlying Price funds are recorded on the ex-dividend date. Purchases and sales of the underlying Price funds are accounted for on the trade date. Income tax-related interest and penalties, if incurred, would be recorded as income tax expense. Realized gains and losses are reported on the identified cost basis. Distributions to the Spectrum Funds’ shareholders are recorded on the ex-dividend date. Income distributions are declared by Spectrum Income on a daily basis and paid monthly. Income distributions are declared and paid by Spectrum Growth and Spectrum International on an annual basis. Capital gain distributions, if any, are declared and paid by the funds, typically on an annual basis.
New Accounting Pronouncements Effective June 29, 2007, the funds adopted Financial Accounting Standards Board (FASB) Interpretation No. 48 (FIN 48), Accounting for Uncertainty in Income Taxes, a clarification of FASB Statement No. 109, Accounting for Income Taxes. FIN 48 establishes financial accounting and disclosure requirements for recognition and measurement of tax positions taken or expected to be taken on an income tax return. The adoption of FIN 48 had no impact on the funds’ net assets or results of operations.
In September 2006, the FASB released the Statement of Financial Accounting Standard No. 157 (FAS 157), Fair Value Measurements. FAS 157 clarifies the definition of fair value and establishes the framework for measuring fair value, as well as proper disclosure of this methodology in the financial statements. It will be effective for the funds’ fiscal years beginning January 1, 2008. Management is evaluating the effects of FAS 157; however, it is not expected to have a material impact on the funds’ net assets or results of operations.
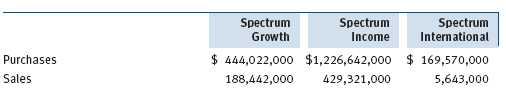
NOTE 2 - INVESTMENTS IN UNDERLYING PRICE FUNDS
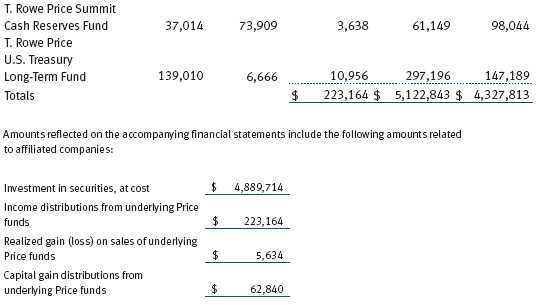
Purchases and sales of the underlying Price funds for the year ended December 31, 2007, were as follows:
NOTE 3 - FEDERAL INCOME TAXES
No provision for federal income taxes is required since each fund intends to continue to qualify as a regulated investment company under Subchapter M of the Internal Revenue Code and distribute to shareholders all of its taxable income and gains. Federal income tax regulations differ from generally accepted accounting principles; therefore, distributions determined in accordance with tax regulations may differ significantly in amount or character from net investment income and realized gains for financial reporting purposes. Financial reporting records are adjusted for permanent book/tax differences to reflect tax character. Financial records are not adjusted for temporary differences.
Distributions during the year ended December 31, 2007, were characterized as follows for tax purposes:
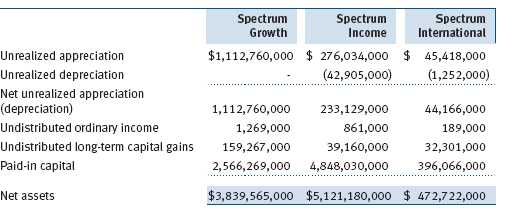
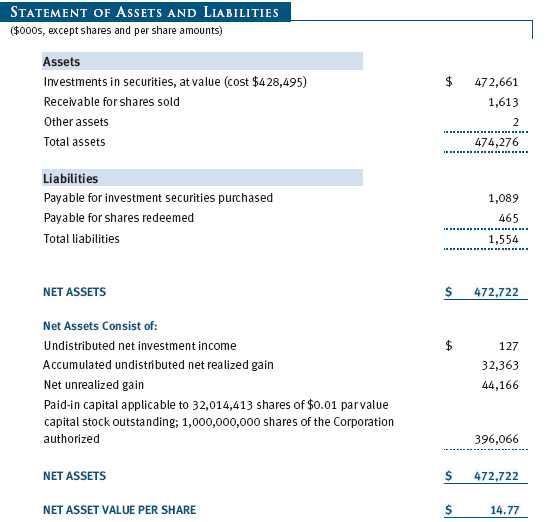
At December 31, 2007, the tax-basis components of net assets were as follows:
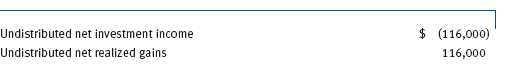
For the year ended December 31, 2007, the Spectrum Growth Fund recorded the following permanent reclassifications to reflect tax character. Reclassifications between income and gain relate primarily to per-share rounding of distributions. Results of operations and net assets were not affected by these reclassifications.
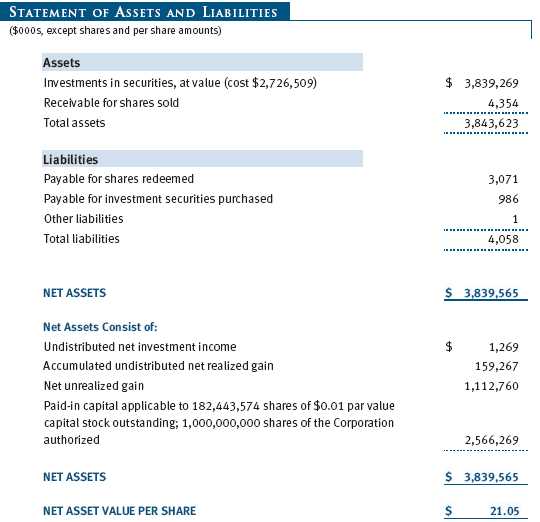
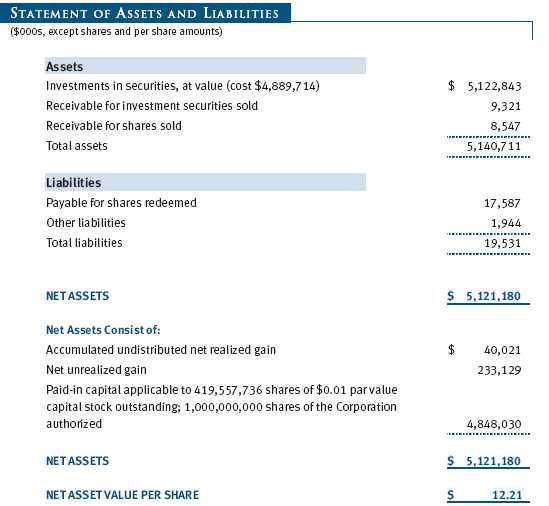
At December 31, 2007, the cost of investments for federal income tax purposes was $2,726,509,000 for Spectrum Growth, $4,889,714,000 for Spectrum Income, and $428,495,000 for Spectrum International.
NOTE 4 - RELATED PARTIES
T. Rowe Price Associates, Inc. (Price Associates), a wholly owned subsidiary of T. Rowe Price Group, Inc., is the investment manager for Spectrum Growth and Spectrum Income, and also serves as manager for the domestic underlying Price funds. T. Rowe Price International, Inc. (Price International), a wholly owned subsidiary of Price Associates, is the investment manager for Spectrum International and also serves as manager for the international underlying Price funds. Pursuant to various service agreements, Price Associates and its wholly owned subsidiaries provide shareholder servicing and administrative, transfer and dividend disbursing, accounting, marketing, and certain other services to the Spectrum Funds. Certain officers and directors of the Spectrum Funds are also officers and directors of Price Associates and its subsidiaries, and of the underlying Price funds.
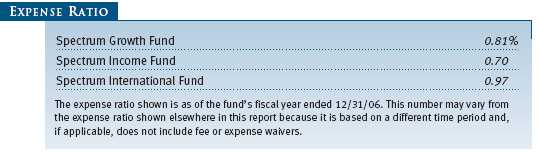
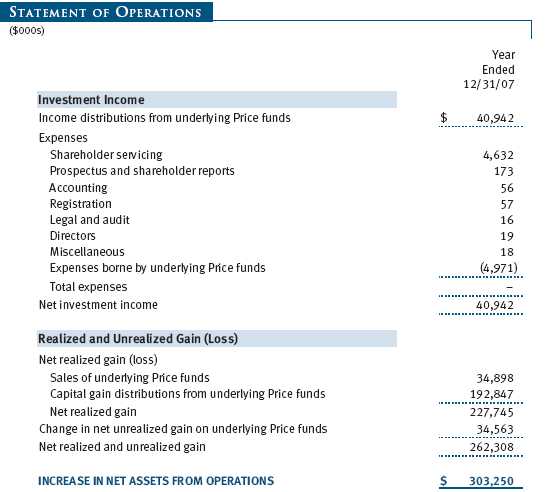
The Spectrum Funds pay no management fees; however, Price Associates and Price International receive management fees from the underlying Price funds. The Spectrum Funds operate in accordance with the investment management and special servicing agreements between and among the corporation, the underlying Price funds, Price Associates, and, in the case of Spectrum International, Price International. Pursuant to these agreements, expenses associated with the operation of the Spectrum Funds are borne by each underlying Price fund to the extent of estimated savings to it and in proportion to the average daily value of its shares owned by the Spectrum Funds. Therefore, each Spectrum Fund operates at a zero expense ratio. However, each Spectrum Fund indirectly bears its proportionate share of the management fees and operating costs of the underlying Price funds in which it invests.
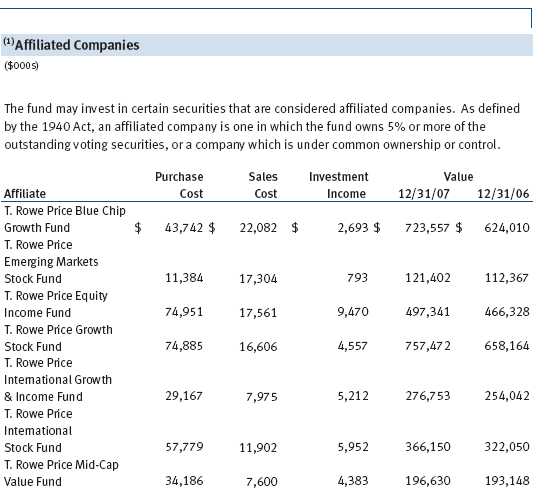
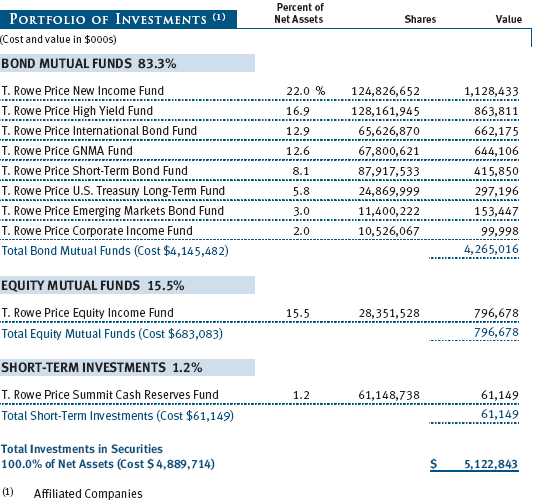
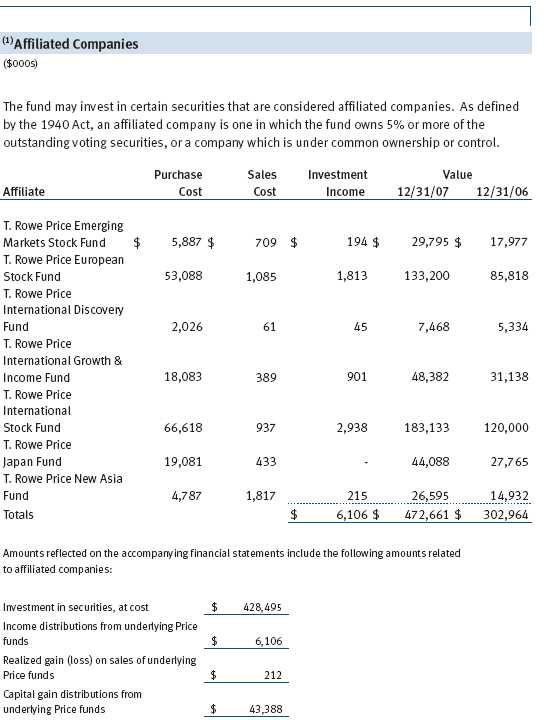
The Spectrum Funds do not invest in the underlying Price funds for the purpose of exercising management or control; however, investments by the Spectrum Funds may represent a significant portion of an underlying Price fund’s net assets. At December 31, 2007, Spectrum Growth and Spectrum International Funds each held less than 25% of the outstanding shares of any underlying Price fund; Spectrum Income Fund held approximately 64% of the outstanding shares of the U.S. Treasury Long-Term Fund, 48% of the GNMA Fund, 45% of the Corporate Income Fund, 28% of the International Bond Fund, and 27% of the Short-Term Bond Fund.
Additionally, Spectrum Income Fund is one of several mutual funds in which certain college savings plans managed by Price Associates may invest. Shareholder servicing costs associated with each college savings plan are allocated to Spectrum Income Fund in proportion to the average daily value of its shares owned by the college savings plan and, in turn, are borne by the underlying Price funds in accordance with the terms of the investment management and special servicing agreements. At December 31, 2007, approximately 18% of the outstanding shares of Spectrum Income Fund were held by the college savings plans.
As of December 31, 2007, T. Rowe Price Group, Inc., and/or its wholly owned subsidiaries owned 2,465,341 shares of the Spectrum Growth Fund, representing 1% of the fund’s net assets.
| REPORT OF INDEPENDENT REGISTERED PUBLIC ACCOUNTING FIRM |
To the Board of Directors of T. Rowe Price Spectrum Fund, Inc. and
Shareholders of T. Rowe Price Spectrum Growth Fund, Spectrum Income
Fund, and Spectrum International Fund
In our opinion, the accompanying statement of assets and liabilities, including the portfolio of investments, and the related statements of operations and of changes in net assets and the financial highlights present fairly, in all material respects, the financial position of T. Rowe Price Spectrum Growth Fund, Spectrum Income Fund and Spectrum International Fund (the funds comprising T. Rowe Price Spectrum Fund, Inc., hereafter referred to collectively as the “Funds”) at December 31, 2007, the results of their operations for the year then ended, the changes in their net assets for each of the two years in the period then ended and the financial highlights for each of the five years in the period then ended, in conformity with accounting principles generally accepted in the United States of America. These financial statements and financial highlights (hereafter referred to as “financial statements”) are the responsibility of the Funds’ management; our responsibility is to express an opinion on these financial statements based on our audits. We conducted our audits of these financial statements in accordance with the auditing standards of the Public Company Accounting Oversight Board (United States). Those standards require that we plan and perform the audit to obtain reasonable assurance about whether the financial statements are free of material misstatement. An audit includes examining, on a test basis, evidence supporting the amounts and disclosures in the financial statements, assessing the accounting principles used and significant estimates made by management, and evaluating the overall financial statement presentation. We believe that our audits, which included confirmation of the underlying funds at December 31, 2007, by correspondence with the transfer agent, provide a reasonable basis for our opinion.
PricewaterhouseCoopers LLP
Baltimore, Maryland
February 12, 2008
| TAX INFORMATION (UNAUDITED) FOR THE TAX YEAR ENDED 12/31/07 |
SPECTRUM GROWTH FUND
We are providing this information as required by the Internal Revenue Code. The amounts shown may differ from those elsewhere in this report because of differences between tax and financial reporting requirements.
The fund’s distributions to shareholders included:
• $31,092,000 from short-term capital gains,
• $119,631,000 from long-term capital gains, subject to the 15% rate gains category.
For taxable non-corporate shareholders, $44,268,000 of the fund’s income represents qualified dividend income subject to the 15% rate category.
For corporate shareholders, $31,538,000 of the fund’s income qualifies for the dividends-received deduction.
SPECTRUM INCOME FUND
We are providing this information as required by the Internal Revenue Code. The amounts shown may differ from those elsewhere in this report because of differences between tax and financial reporting requirements.
The fund’s distributions to shareholders included:
• $16,616,000 from short-term capital gains,
• $37,565,000 from long-term capital gains, subject to the 15% rate gains category.
For taxable non-corporate shareholders, $17,439,000 of the fund’s income represents qualified dividend income subject to the 15% rate category.
For corporate shareholders, $17,218,000 of the fund’s income qualifies for the dividends-received deduction.
SPECTRUM INTERNATIONAL FUND
We are providing this information as required by the Internal Revenue Code. The amounts shown may differ from those elsewhere in this report because of differences between tax and financial reporting requirements.
The fund’s distributions to shareholders included:
• $10,758,000 from short-term capital gains,
• $11,057,000 from long-term capital gains, subject to the 15% rate gains category.
For taxable non-corporate shareholders, $4,452,000 of the fund’s income represents qualified dividend income subject to the 15% rate category.
| INFORMATION ON PROXY VOTING POLICIES, PROCEDURES, AND RECORDS |
A description of the policies and procedures used by T. Rowe Price funds and portfolios to determine how to vote proxies relating to portfolio securities is available in each fund’s Statement of Additional Information, which you may request by calling 1-800-225-5132 or by accessing the SEC’s Web site, www.sec.gov. The description of our proxy voting policies and procedures is also available on our Web site, www.troweprice.com. To access it, click on the words “Company Info” at the top of our homepage for individual investors. Then, in the window that appears, click on the “Proxy Voting Policy” navigation button in the top left corner.
Each fund’s most recent annual proxy voting record is available on our Web site and through the SEC’s Web site. To access it through our Web site, follow the directions above, then click on the words “Proxy Voting Record” at the bottom of the Proxy Voting Policy page.
| HOW TO OBTAIN QUARTERLY PORTFOLIO HOLDINGS |
The fund files a complete schedule of portfolio holdings with the Securities and Exchange Commission for the first and third quarters of each fiscal year on Form N-Q. The fund’s Form N-Q is available electronically on the SEC’s Web site (www.sec.gov); hard copies may be reviewed and copied at the SEC’s Public Reference Room, 450 Fifth St. N.W., Washington, DC 20549. For more information on the Public Reference Room, call 1-800-SEC-0330.
| ABOUT THE FUNDS’ DIRECTORS AND OFFICERS |
Your funds are governed by a Board of Directors (Board) that meets regularly to review a wide variety of matters affecting the funds, including performance, investment programs, compliance matters, advisory fees and expenses, service providers, and other business affairs. The Board elects the funds’ officers, who are listed in the final table. At least 75% of Board members are independent of T. Rowe Price Associates, Inc. (T. Rowe Price), and T. Rowe Price International, Inc. (T. Rowe Price International); “inside” or “interested” directors are employees or officers of T. Rowe Price. The business address of each director and officer is 100 East Pratt Street, Baltimore, Maryland 21202. The Statement of Additional Information includes additional information about the directors and is available without charge by calling a T. Rowe Price representative at 1-800-225-5132.
| Independent Directors | |
| |
| Name | |
| (Year of Birth) | Principal Occupation(s) During Past 5 Years and |
| Year Elected* | Directorships of Other Public Companies |
| |
| Jeremiah E. Casey | Director, National Life Insurance (2001 to 2005); Director, The Rouse |
| (1940) | Company, real estate developers (1990 to 2004); Director, Allfirst |
| 2005 | Financial Inc. (previously First Maryland Bancorp) (1983 to 2002) |
| |
| Anthony W. Deering | Chairman, Exeter Capital, LLC, a private investment firm (2004 to |
| (1945) | present); Director, Vornado Real Estate Investment Trust (3/04 to |
| 2001 | present); Member, Advisory Board, Deutsche Bank North America |
| | (2004 to present); Director, Chairman of the Board, and Chief Executive |
| | Officer, The Rouse Company, real estate developers (1997 to 2004) |
| |
| Donald W. Dick, Jr. | Principal, EuroCapital Advisors, LLC, an acquisition and management |
| (1943) | advisory firm; Chairman, The Haven Group, a custom manufacturer of |
| 1999 | modular homes (1/04 to present) |
| |
| David K. Fagin | Chairman and President, Nye Corporation (6/88 to present); |
| (1938) | Chairman, Canyon Resources Corp. (8/07 to present); Director, |
| 1999 | Golden Star Resources Ltd. (5/92 to present); Director, Pacific Rim |
| | Mining Corp. (2/02 to present) |
| |
| Karen N. Horn | Director, Federal National Mortgage Association (9/06 to present); |
| (1943) | Managing Director and President, Global Private Client Services, |
| 2003 | Marsh Inc. (1999 to 2003); Director, Georgia Pacific (5/04 to 12/05), |
| | Eli Lilly and Company, and Simon Property Group |
| Theo C. Rodgers | President, A&R Development Corporation (1977 to present) |
| (1941) | |
| 2005 | |
| |
| John G. Schreiber | Owner/President, Centaur Capital Partners, Inc., a real estate invest- |
| (1946) | ment company; Partner, Blackstone Real Estate Advisors, L.P. |
| 2001 | |
| |
| *Each independent director oversees 121 T. Rowe Price portfolios and serves until retirement, resignation, or |
| election of a successor. | |
| Inside Directors | |
| |
| Name | |
| (Year of Birth) | |
| Year Elected* | |
| [Number of T. Rowe Price | Principal Occupation(s) During Past 5 Years and |
| Portfolios Overseen] | Directorships of Other Public Companies |
| |
| Edward C. Bernard | Director and Vice President, T. Rowe Price; Vice Chairman of the |
| (1956) | Board, Director, and Vice President, T. Rowe Price Group, Inc.; |
| 2006 | Chairman of the Board, Director, and President, T. Rowe Price |
| [121] | Investment Services, Inc.; Chairman of the Board and Director, |
| | T. Rowe Price Global Asset Management Limited, T. Rowe Price |
| | Global Investment Services Limited, T. Rowe Price Retirement Plan |
| | Services, Inc., T. Rowe Price Savings Bank, and T. Rowe Price |
| | Services, Inc.; Director, T. Rowe Price International, Inc.; Chief |
| | Executive Officer, Chairman of the Board, Director, and President, |
| | T. Rowe Price Trust Company; Chairman of the Board, all funds |
| |
| Brian C. Rogers, CFA, CIC | Chief Investment Officer, Director, and Vice President, T. Rowe Price; |
| (1955) | Chairman of the Board, Chief Investment Officer, Director, and Vice |
| 2006 | President, T. Rowe Price Group, Inc.; Vice President, T. Rowe Price |
| [68] | Trust Company; Vice President, Spectrum Funds |
| |
| *Each inside director serves until retirement, resignation, or election of a successor. |
| Officers | |
| |
| Name (Year of Birth) | |
| Title and Fund(s) Served | Principal Occupation(s) |
| |
| Mark C.J. Bickford-Smith (1962) | Vice President, T. Rowe Price Group, Inc., and |
| Vice President, Spectrum Funds | T. Rowe Price International, Inc. |
| |
| Joseph A. Carrier, CPA (1960) | Vice President, T. Rowe Price, T. Rowe Price |
| Treasurer, Spectrum Funds | Group, Inc., T. Rowe Price Investment Services, |
| | Inc., and T. Rowe Price Trust Company |
| |
| Roger L. Fiery III, CPA (1959) | Vice President, T. Rowe Price, T. Rowe Price |
| Vice President, Spectrum Funds | Group, Inc., T. Rowe Price International, Inc., |
| | and T. Rowe Price Trust Company |
| |
| Kenneth D. Fuller (1958) | Vice President, T. Rowe Price and T. Rowe Price |
| Vice President, Spectrum Funds | Group, Inc. |
| |
| John R. Gilner (1961) | Chief Compliance Officer and Vice President, |
| Chief Compliance Officer, Spectrum Funds | T. Rowe Price; Vice President, T. Rowe Price |
| | Group, Inc., and T. Rowe Price Investment |
| | Services, Inc. |
| |
| Gregory S. Golczewski (1966) | Vice President, T. Rowe Price and T. Rowe Price |
| Vice President, Spectrum Funds | Trust Company |
| |
| Henry H. Hopkins (1942) | Director and Vice President, T. Rowe Price |
| Vice President, Spectrum Funds | Investment Services, Inc., T. Rowe Price |
| | Services, Inc., and T. Rowe Price Trust Company; |
| | Vice President, T. Rowe Price, T. Rowe Price |
| | Group, Inc., T. Rowe Price International, Inc., and |
| | T. Rowe Price Retirement Plan Services, Inc. |
| |
| John H. Laporte, CFA (1945) | Vice President, T. Rowe Price, T. Rowe Price |
| Executive Vice President, Spectrum Funds | Group, Inc., and T. Rowe Price Trust Company |
| |
| Patricia B. Lippert (1953) | Assistant Vice President, T. Rowe Price and |
| Secretary, Spectrum Funds | T. Rowe Price Investment Services, Inc. |
| |
| Mary J. Miller, CFA (1955) | Director, T. Rowe Price Trust Company; Director |
| Executive Vice President, Spectrum Funds | and Vice President, T. Rowe Price; Vice |
| | President, T. Rowe Price Group, Inc. |
| |
| Raymond A. Mills, Ph.D., CFA (1960) | Vice President, T. Rowe Price, T. Rowe Price |
| Vice President, Spectrum Funds | Group, Inc., and T. Rowe Price International, Inc. |
| Edmund M. Notzon III, Ph.D., CFA (1945) | Vice President, T. Rowe Price, T. Rowe Price |
| President, Spectrum Funds | Group, Inc., T. Rowe Price Investment Services, |
| | Inc., and T. Rowe Price Trust Company |
| |
| Charles M. Shriver, CFA (1967) | Vice President, T. Rowe Price and T. Rowe Price |
| Vice President, Spectrum Funds | Group, Inc. |
| |
| Robert W. Smith (1961) | Vice President, T. Rowe Price, T. Rowe Price |
| Vice President, Spectrum Funds | Group, Inc., and T. Rowe Price Trust Company |
| |
| Julie L. Waples (1970) | Vice President, T. Rowe Price |
| Vice President, Spectrum Funds | |
| |
| David J.L. Warren (1957) | Director, T. Rowe Price, T. Rowe Price Global |
| Executive Vice President, Spectrum Funds | Asset Management Limited, and T. Rowe Price |
| | Global Investment Services Limited; Vice |
| | President, T. Rowe Price Group, Inc.; Chief |
| | Executive Officer, Director, and President, |
| | T. Rowe Price International, Inc. |
| |
| Unless otherwise noted, officers have been employees of T. Rowe Price or T. Rowe Price International for at least |
| five years. | |
Item 2. Code of Ethics.
The registrant has adopted a code of ethics, as defined in Item 2 of Form N-CSR, applicable to its principal executive officer, principal financial officer, principal accounting officer or controller, or persons performing similar functions. A copy of this code of ethics is filed as an exhibit to this Form N-CSR. No substantive amendments were approved or waivers were granted to this code of ethics during the period covered by this report.
Item 3. Audit Committee Financial Expert.
The registrant’s Board of Directors/Trustees has determined that Ms. Karen N. Horn qualifies as an audit committee financial expert, as defined in Item 3 of Form N-CSR. Ms. Horn is considered independent for purposes of Item 3 of Form N-CSR.
Item 4. Principal Accountant Fees and Services.
(a) – (d) Aggregate fees billed to the registrant for the last two fiscal years for professional services rendered by the registrant’s principal accountant were as follows:

Audit fees include amounts related to the audit of the registrant’s annual financial statements and services normally provided by the accountant in connection with statutory and regulatory filings. Audit-related fees include amounts reasonably related to the performance of the audit of the registrant’s financial statements and specifically include the issuance of a report on internal controls and, if applicable, agreed-upon procedures related to fund acquisitions. Tax fees include amounts related to services for tax compliance, tax planning, and tax advice. The nature of these services specifically includes the review of distribution calculations and the preparation of Federal, state, and excise tax returns. All other fees include the registrant’s pro-rata share of amounts for agreed-upon procedures in conjunction with service contract approvals by the registrant’s Board of Directors/Trustees.
(e)(1) The registrant’s audit committee has adopted a policy whereby audit and non-audit services performed by the registrant’s principal accountant for the registrant, its investment adviser, and any entity controlling, controlled by, or under common control with the investment adviser that provides ongoing services to the registrant require pre-approval in advance at regularly scheduled audit committee meetings. If such a service is required between regularly scheduled audit committee meetings, pre-approval may be authorized by one audit committee member with ratification at the next scheduled audit committee meeting. Waiver of pre-approval for audit or non-audit services requiring fees of a de minimis amount is not permitted.
(2) No services included in (b) – (d) above were approved pursuant to paragraph (c)(7)(i)(C) of Rule 2-01 of Regulation S-X.
(f) Less than 50 percent of the hours expended on the principal accountant’s engagement to audit the registrant’s financial statements for the most recent fiscal year were attributed to work performed by persons other than the principal accountant’s full-time, permanent employees.
(g) The aggregate fees billed for the most recent fiscal year and the preceding fiscal year by the registrant’s principal accountant for non-audit services rendered to the registrant, its investment adviser, and any entity controlling, controlled by, or under common control with the investment adviser that provides ongoing services to the registrant were $1,486,000 and $1,401,000, respectively, and were less than the aggregate fees billed for those same periods by the registrant’s principal accountant for audit services rendered to the T. Rowe Price Funds.
(h) All non-audit services rendered in (g) above were pre-approved by the registrant’s audit committee. Accordingly, these services were considered by the registrant’s audit committee in maintaining the principal accountant’s independence.
Item 5. Audit Committee of Listed Registrants.
Not applicable.
Item 6. Schedule of Investments.
Not applicable. The complete schedule of investments is included in Item 1 of this Form N-CSR.
Item 7. Disclosure of Proxy Voting Policies and Procedures for Closed-End Management Investment Companies.
Not applicable.
Item 8. Portfolio Managers of Closed-End Management Investment Companies.
Not applicable.
Item 9. Purchases of Equity Securities by Closed-End Management Investment Company and Affiliated Purchasers.
Not applicable.
Item 10. Submission of Matters to a Vote of Security Holders.
Not applicable.
Item 11. Controls and Procedures.
(a) The registrant’s principal executive officer and principal financial officer have evaluated the registrant’s disclosure controls and procedures within 90 days of this filing and have concluded that the registrant’s disclosure controls and procedures were effective, as of that date, in ensuring that information required to be disclosed by the registrant in this Form N-CSR was recorded, processed, summarized, and reported timely.
(b) The registrant’s principal executive officer and principal financial officer are aware of no change in the registrant’s internal control over financial reporting that occurred during the registrant’s second fiscal quarter covered by this report that has materially affected, or is reasonably likely to materially affect, the registrant’s internal control over financial reporting.
Item 12. Exhibits.
(a)(1) The registrant’s code of ethics pursuant to Item 2 of Form N-CSR is attached.
(2) Separate certifications by the registrant's principal executive officer and principal financial officer, pursuant to Section 302 of the Sarbanes-Oxley Act of 2002 and required by Rule 30a-2(a) under the Investment Company Act of 1940, are attached.
(3) Written solicitation to repurchase securities issued by closed-end companies: not applicable.
(b) A certification by the registrant's principal executive officer and principal financial officer, pursuant to Section 906 of the Sarbanes-Oxley Act of 2002 and required by Rule 30a-2(b) under the Investment Company Act of 1940, is attached.
| | |
SIGNATURES |
| |
| | Pursuant to the requirements of the Securities Exchange Act of 1934 and the Investment |
| Company Act of 1940, the registrant has duly caused this report to be signed on its behalf by the |
| undersigned, thereunto duly authorized. |
| |
| T. Rowe Price Spectrum Fund, Inc. |
| |
| |
| By | /s/ Edward C. Bernard |
| | Edward C. Bernard |
| | Principal Executive Officer |
| |
| Date | February 19, 2008 |
| |
| |
| |
| | Pursuant to the requirements of the Securities Exchange Act of 1934 and the Investment |
| Company Act of 1940, this report has been signed below by the following persons on behalf of |
| the registrant and in the capacities and on the dates indicated. |
| |
| |
| By | /s/ Edward C. Bernard |
| | Edward C. Bernard |
| | Principal Executive Officer |
| |
| Date | February 19, 2008 |
| |
| |
| |
| By | /s/ Joseph A. Carrier |
| | Joseph A. Carrier |
| | Principal Financial Officer |
| |
| Date | February 19, 2008 |