UNITED STATES
SECURITIES AND EXCHANGE COMMISSION
Washington, D.C. 20549
FORM N-CSR
CERTIFIED SHAREHOLDER REPORT OF REGISTERED
MANAGEMENT INVESTMENT COMPANIES
Investment Company Act File Number: 811-04998
| T. Rowe Price Spectrum Fund, Inc. |
|
| (Exact name of registrant as specified in charter) |
| |
| 100 East Pratt Street, Baltimore, MD 21202 |
|
| (Address of principal executive offices) |
| |
| David Oestreicher |
| 100 East Pratt Street, Baltimore, MD 21202 |
|
| (Name and address of agent for service) |
Registrant’s telephone number, including area code: (410) 345-2000
Date of fiscal year end: December 31
Date of reporting period: June 30, 2016
Item 1. Report to Shareholders
| Spectrum Fund | June 30, 2016 |
The views and opinions in this report were current as of June 30, 2016. They are not guarantees of performance or investment results and should not be taken as investment advice. Investment decisions reflect a variety of factors, and the managers reserve the right to change their views about individual stocks, sectors, and the markets at any time. As a result, the views expressed should not be relied upon as a forecast of the fund’s future investment intent. The report is certified under the Sarbanes-Oxley Act, which requires mutual funds and other public companies to affirm that, to the best of their knowledge, the information in their financial reports is fairly and accurately stated in all material respects.
REPORTS ON THE WEB
Sign up for our Email Program, and you can begin to receive updated fund reports and prospectuses online rather than through the mail. Log in to your account at troweprice.com for more information.
Manager’s Letter
Fellow Shareholders
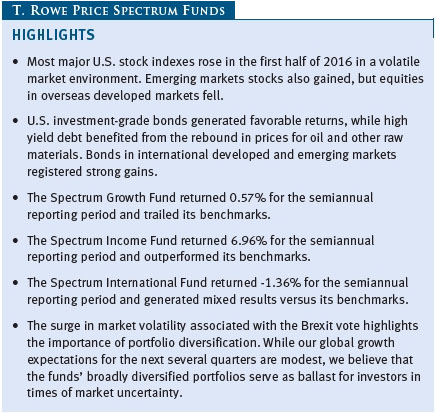
U.S. stocks rose in the first half of 2016, a turbulent period for global financial markets that culminated in the UK’s decision to leave the European Union (Brexit). Stocks in international markets declined amid steep losses across Europe after the Brexit vote. Emerging markets stocks were broadly higher, driven by a rebound in energy prices and indications that the Federal Reserve would adopt a patient approach to U.S. interest rate normalization. In fixed income, U.S. investment-grade bonds rose as Treasuries rallied, driven by sluggish global growth, accommodative monetary policies worldwide, and comments from the Federal Reserve signaling a fewer-than-expected number of interest rate increases this year. High yield bonds advanced as commodity prices rebounded, led by an upturn in oil prices from 13-year lows reached in February. Bonds in developed international markets produced excellent returns in dollar terms in the first half of 2016, aided by expectations that global growth would decelerate because of Brexit and that central banks would respond by staying accommodative or possibly easing monetary policy further. Emerging markets bonds also produced strong returns, with local currency bonds outperforming dollar-denominated debt. The U.S. dollar weakened against most major currencies. Against this backdrop, the Spectrum Income Fund, which focuses on fixed income investments, gained from diversifying investments in international bonds and high yield. The Spectrum Growth Fund, which focuses on equities from the U.S. and international markets, advanced slightly. The Spectrum International Fund, a portfolio that focuses on overseas developed and emerging markets stocks, fell modestly.
MARKET ENVIRONMENT
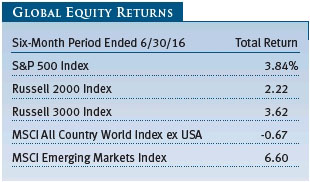
The S&P 500 Index added 3.84% in the first half of 2016, but the advance belied considerable turmoil over the period. Stocks and oil prices dropped in the first six weeks of the year as investors worried about a worldwide recession resulting from China’s economic slowdown and a global oversupply of oil, but turned around starting in February after concerns about the oil glut receded and the Fed reduced its expectations for interest rate increases this year. The June 23 Brexit vote derailed the U.S. market’s advance, causing a two-day global stock sell-off and considerable volatility in the currency market. However, stocks rallied in the last three days of June, pushing the major domestic stock indices into positive territory for the year.
Stocks in developed European markets fell as uneven global growth, slowdowns in several emerging markets, and Brexit-induced uncertainty weighed on the region’s outlook. Annual economic growth in the eurozone edged up 1.7% in the first quarter, though the Brexit vote caused many private economists to reduce their European and global growth forecasts for next year. European Central Bank (ECB) officials warned that Brexit would hurt the eurozone’s recovery but signaled that fresh stimulus measures were unlikely after the ECB already expanded its stimulus program in March. Japanese stocks retreated as the country’s economy stayed weak despite more than three years of sustained stimulus. Japan’s economy rebounded in this year’s first quarter after contracting in the final quarter of 2015, but the tenuous recovery led the government to delay a long-planned sales tax increase until 2019.
Emerging markets stocks rose in the first half of the year and generally outperformed U.S. shares. Latin American markets surged in response to higher commodity prices. Brazilian shares were particularly strong, benefiting from the suspension of scandal-plagued President Dilma Rousseff, whose replacement is pursuing reforms to help lift the country out of a deep recession. Chinese shares declined, however, especially A shares for domestic investors.
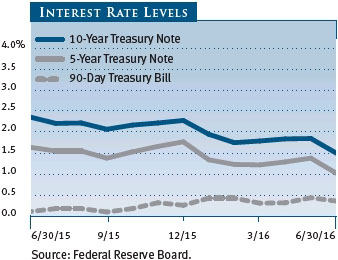
Fixed income markets were strong across the board. U.S. investment-grade bonds rose. Intermediate- and long-term bond prices rose, and interest rates tumbled as the Fed refrained from raising short-term rates due to mixed economic data, global risks to the U.S. economy, and continued low inflation. Long-term Treasuries surged as investors fled to safety after the Brexit decision, pushing the yield on the benchmark 10-year note down to a near-record low at the end of June. Treasuries also benefited from strong foreign demand for U.S. government debt, which offered relatively higher yields compared with the negative-yielding sovereign bonds in many developed countries. High yield bonds outpaced investment-grade debt, as credit spreads narrowed and the rally in oil and other commodities lifted bonds issued by natural resources companies.
Bonds in developed international markets produced excellent returns in dollar terms as the dollar weakened versus most major currencies. A flight to quality and expectations of additional monetary and fiscal stimulus amid Brexit-related uncertainty were particularly supportive at the end of the reporting period. UK government bonds soared in price after the Brexit referendum, but a sharp loss in the value of the sterling eroded gains to U.S. investors. Emerging markets bonds also produced strong returns. Bonds denominated in local currencies outperformed dollar-denominated bonds, helped by strength in key currencies such as the Brazilian real and the South African rand. Bonds issued by countries that depend on commodity exports benefited from the brisk commodity price rebound since mid-February.
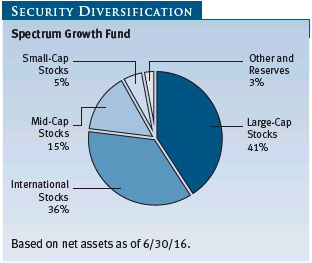
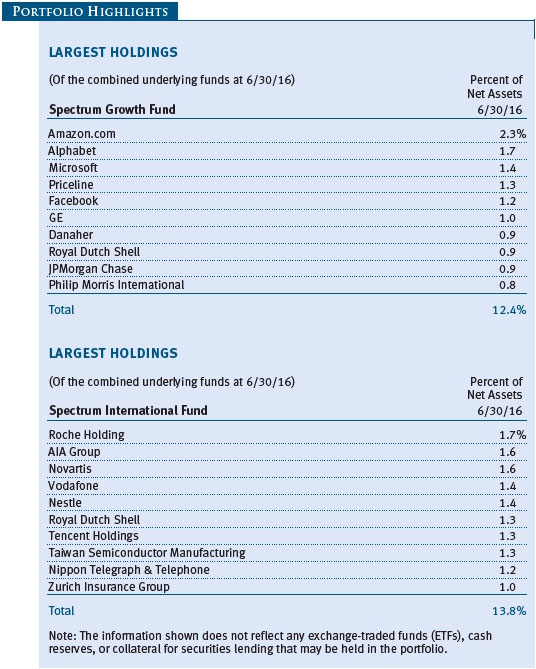
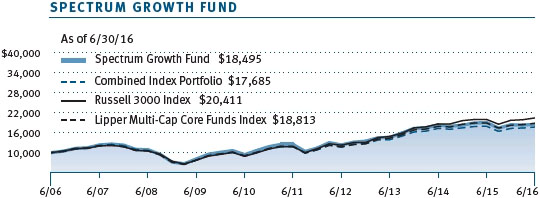
SPECTRUM GROWTH FUND
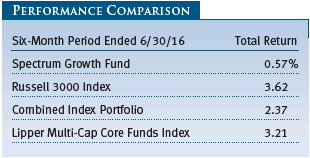
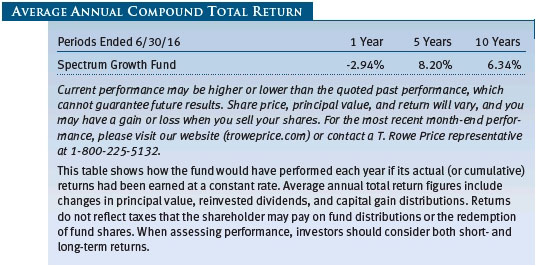
As shown in the Performance Comparison table, the Spectrum Growth Fund returned 0.57% for the six months ended June 30, 2016. The fund trailed the Russell 3000 Index and the Lipper Multi-Cap Core Funds Index for the reporting period.
Portfolio Performance
Security selection among the underlying funds weighed on results versus the Russell 3000 Index over the reporting period. Results were particularly weak in two of our U.S. large-cap growth portfolios: the Blue Chip Growth Fund and the Growth Stock Fund. This was only partially offset by positive security selection in several of our international stock funds, led by the value-oriented International Growth & Income Fund, the growth-oriented International Stock Fund, and the Emerging Markets Stock Fund.
Strategic allocations to diversifying asset classes weighed modestly on the fund’s results. Our inclusion of equities from international developed markets detracted heavily on results as they underperformed U.S. equities in aggregate. This was partially offset by our portfolio of real assets stocks, which gained as prices for oil and other commodities rallied from a prolonged downturn. Emerging markets equities were also beneficial, and our real estate stocks saw strong gains in an environment of solid demand and limited supply, particularly in the world’s developed markets.
Tactical decisions to overweight and underweight underlying funds had a slightly negative impact. An overweight to large-cap international developed markets equities weighed on results, as did an underweight to real assets equities, which significantly outperformed the broad U.S. equities market. These negative impacts were mitigated somewhat by a positive contribution from an underweight position in U.S. small-cap growth stocks.
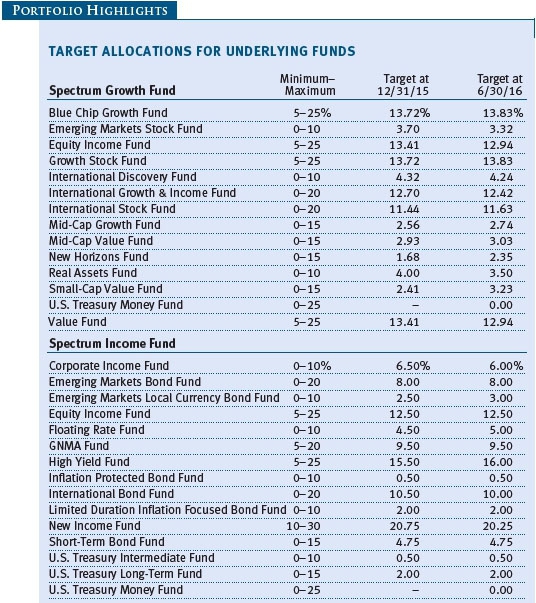
Portfolio Positioning
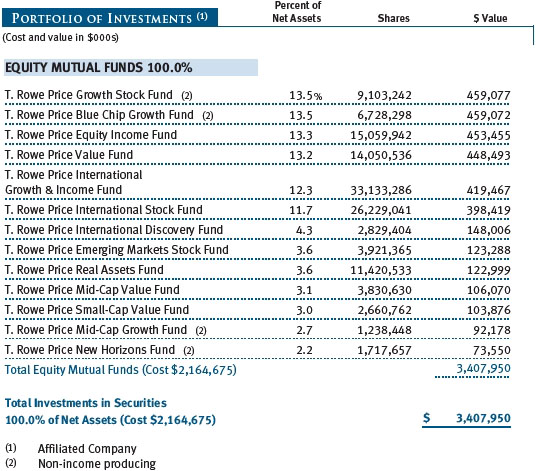
The Spectrum Growth Fund invests in a range of underlying funds that focus on U.S. equities across the full range of market capitalizations and international stocks in both developing and emerging markets.
We favor international over U.S. stocks, though we reduced our international stocks overweight in June to reflect the impact of our reduced global growth expectations on lower earnings growth. The Brexit vote will likely weigh on corporate and consumer spending in Europe as well as its trading partners, and has raised the prospect that other member countries could seek to exit the bloc. Furthermore, low and negative bond yields in many countries after Brexit have highlighted concerns about credit growth and profitability for developed markets banks.
We anticipate greater volatility in global financial markets in the coming months following the recent uptick in political uncertainty and our subdued growth expectations. In this uncertain environment, we believe that the fund’s broad diversification combined with T. Rowe Price’s longstanding strengths in fundamental research can serve as ballast for portfolios in volatile markets.
Among international equities, we favor emerging markets equities over international developed markets but took advantage of a recent market rally in emerging markets to reduce the size of our overweight. Emerging markets valuations remain below long-term historical averages relative to valuations in developed markets, but weak global trade and continued oversupply in the global commodities market pose near-term risks. Persistently low prices for oil and other raw materials should continue to weigh on commodity-dependent economies, while they benefit consumer-driven and service-oriented economies. Expectations for a slower pace of U.S. Fed interest rate increases could provide near-term support and lessen concerns about weaker currencies and capital outflows. We favor international value stocks over growth as valuations in more defensive growth sectors, such as consumer staples, have become increasingly expensive.
However, we took the opportunity to trim our overweight to value stocks following the rally led by energy and commodity-related equities. Additionally, we are modestly overweight overseas small-cap stocks versus large-caps where we see opportunities to add value through active management supported by fundamental research.
We further reduced our underweight to U.S. small-cap stocks relative to large-caps as relative valuations have moved closer to their historical averages following protracted underperformance by small-caps. While relative valuations are now more attractive, heightened market volatility and expectations for weaker relative earnings growth may present headwinds for small-cap stocks. We opened the period with a neutral position in U.S. growth stocks versus U.S. value stocks but have since moved to a modest overweight to growth. Growth stocks feature more attractive valuations and should benefit more from expectations for a protracted period of low economic growth. Growth sectors tend to be less dependent on broader economic cycles and have historically outperformed when growth is scarce. Additionally, fundamentals are likely to remain challenged for many cyclical sectors within value, particularly energy and financials, which can be more dependent on stronger economic growth, higher interest rates, and commodity demand.
We increased our existing underweight to real assets stocks relative to global equities. Despite a rally in energy prices in the latter half of the reporting period, we remain cautious on the prospects for energy and commodity prices given our concerns about long-term global supply and demand imbalance and the impacts of weak global growth and trade. The recent rally in energy prices may prove temporary as suppliers respond with increased production, reigniting global oversupply concerns. Real estate valuations are in line with broader equities and fundamentals are broadly positive. Although sensitive to rising interest rates, valuations in real estate investment trusts (REITs) are supported by expectations of a gradual pace for U.S. rate hikes.
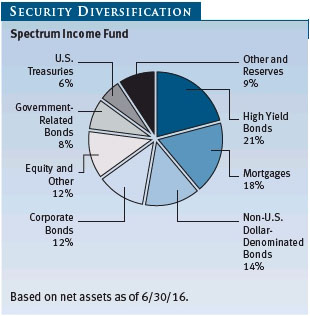
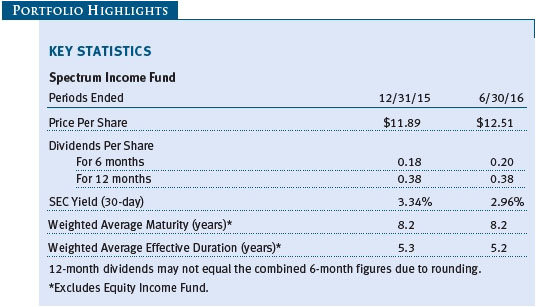
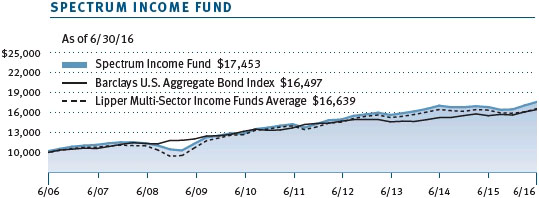
SPECTRUM INCOME FUND
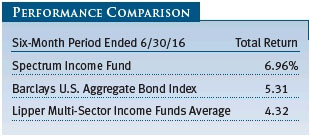
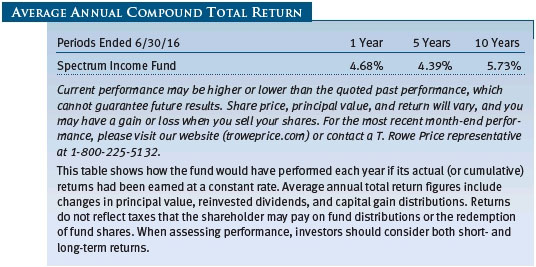
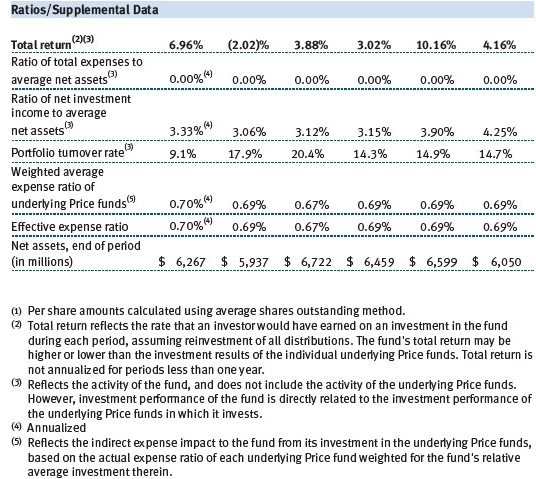
As shown in the Performance Comparison table, the Spectrum Income Fund returned 6.96% for the six months ended June 30, 2016. The fund outperformed the Barclays U.S. Aggregate Bond Index and its Lipper peer group average for the reporting period.
Portfolio Performance
Strategic allocations to diversifying asset classes not included in the fund’s broad market benchmark provided a significant boost to the fund’s relative performance. Bonds in developed international markets produced strong returns in dollar terms in the first half of 2016 as the dollar weakened versus most major currencies. Expectations of slower global growth resulting from Brexit and the potential for expanded monetary stimulus contributed to the rally. Emerging markets bonds denominated in both U.S. dollars and local currencies also saw strong gains. Our exposure to high yield bonds proved beneficial as the rebound in commodities prices helped the sector, which has a significant number of energy- and materials-related issuers.
Tactical decisions to overweight and underweight underlying funds had a minimal overall impact on the fund’s results. A decision to underweight longer-term U.S. Treasuries detracted as this segment performed well. This was partially offset by positive contributions from tactical shifts in our allocation to high yield and emerging markets local currency bonds.
Security selection among the underlying funds weighed on performance for the six-month reporting period. Holdings in the High Yield Fund detracted from results as the fund’s bias toward higher-quality issuers hurt during a period when lower-quality issues outperformed. This was partially offset by positive selection in the Emerging Markets Bond Fund and the Equity Income Fund, which focuses on dividend-paying domestic stocks.
Portfolio Positioning
The Spectrum Income Fund invests primarily in fixed income securities through a diversified mix of U.S.-focused and international T. Rowe Price mutual funds. The fund also has an allocation to dividend-paying U.S. stocks.
We made a number of adjustments to our high yield bonds allocation over the past 12 months. We moved from a modest underweight allocation late last year as risks within the high yield market increased, taking an overweight position as credit spreads widened to levels that have historically signaled a favorable long-term buying opportunity. We recently pared our high yield allocation back to neutral following a rally in high yield fueled by a rebound in commodity prices affecting a large proportion of high yield bond issuers.
We have a neutral position in dollar-denominated emerging markets bonds versus U.S. investment-grade debt. After their recent rally, emerging markets bonds appear fairly valued in the current global growth environment. There is considerable disparity, however, between emerging markets countries’ fiscal positions, political stability, and progress toward reforms, with the potential for an extended period of low commodity prices to further the divide.
We are neutral to nondollar bonds relative to U.S. investment-grade bonds as the prospects for the U.S. dollar versus other developed currencies appears balanced. Upside to the U.S. dollar may be limited as the pace of U.S. Fed interest rate increases has moderated; however, interest rates in the U.S. remain among the highest in the developed world, which should provide support. We have a preference for emerging markets bonds denominated in local currencies due to their relatively attractive yields and a stabilizing currency environment.
We have a neutral position in dividend-paying stocks. While equity valuations are above historical averages by several measures, with limited support from earnings growth, dividend yields on equities are competitive relative to the yields available on many fixed income investments.
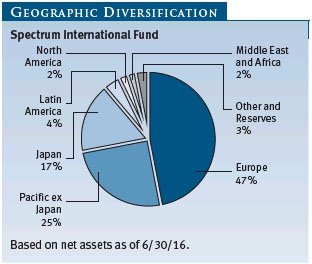
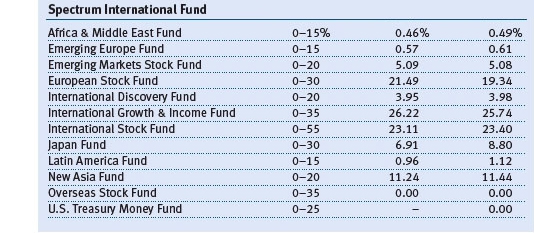
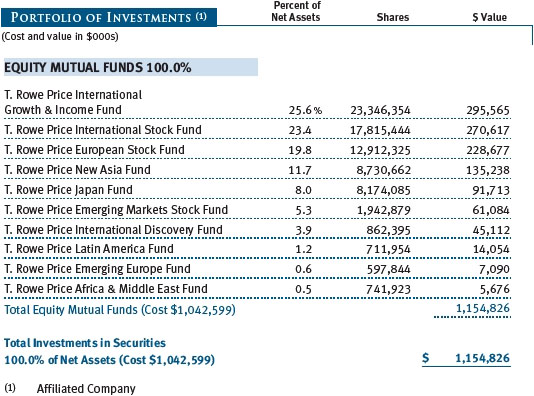
SPECTRUM INTERNATIONAL FUND
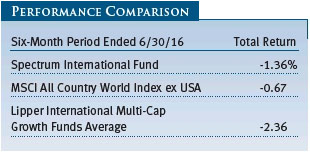
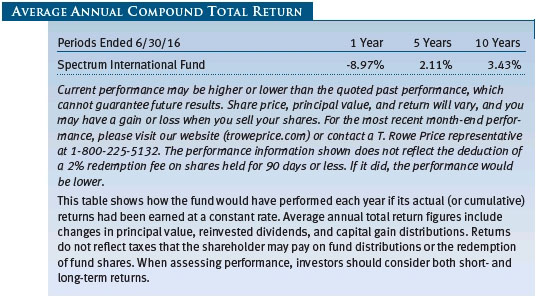
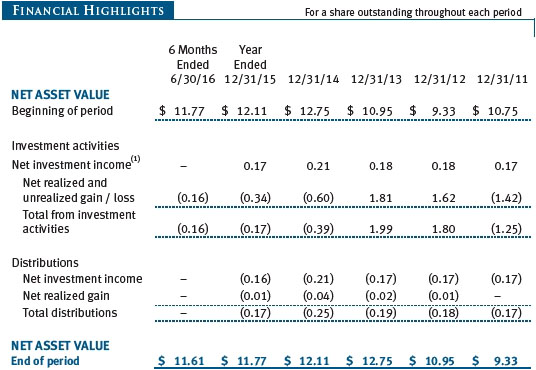
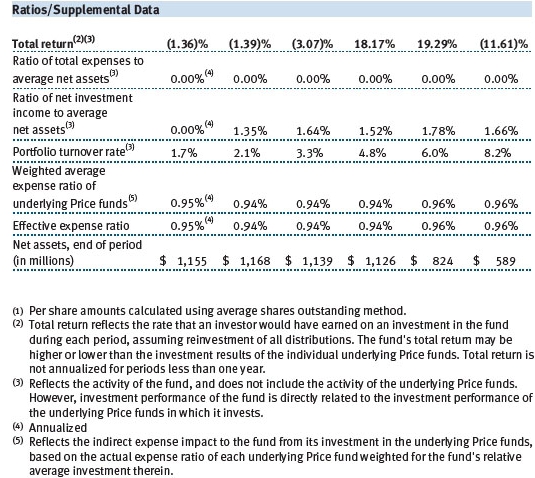
As shown in the Performance Comparison table, the Spectrum International Fund returned -1.36% for the six months ended June 30, 2016. The fund trailed the MSCI All Country World Index ex USA but outpaced the Lipper International Multi-Cap Growth Funds Average.
Portfolio Performance
On a regional basis, the fund benefited from its allocation to Latin American stocks, as well as emerging markets, more broadly over the six-month reporting period. The advance in Latin American stocks was driven largely by the rebound in commodity prices that helped many economies and signs of political stabilization in regional heavyweight Brazil. Holdings in Japan and other Asian markets rose modestly, but our European shares outside the UK declined amid concerns about still sluggish growth, challenges in Italy’s banking sector, and Brexit uncertainty. Brexit’s impact on the UK was particularly sharp, and shares tumbled.
On a sector basis, energy stocks generated exceptional gains for the fund. Our consumer staples, materials, and utilities stocks rose solidly, while information technology advanced modestly. Telecommunication services, health care, and industrials and business services shares declined moderately, while financials and consumer discretionary registered the steepest losses. Security selection was a modestly positive contributor to performance versus the MSCI benchmark, but sector overweight/underweights detracted.
Portfolio Positioning
The Spectrum International Fund offers investors diversified exposure to international equities. We favor emerging markets equities over international developed markets but took advantage of a recent market rally in emerging markets to reduce the size of our overweight. Emerging markets valuations remain below long-term historical averages relative to valuations in developed markets, but weak global trade and continued oversupply in the global commodities market pose near-term risks. Persistently low prices for oil and other raw materials should continue to weigh on commodity-dependent economies, while they benefit consumer-driven and service-oriented economies. Expectations for a slower pace of U.S. Fed interest rate increases could provide near-term support and lessen concerns about capital outflows.
We favor international value stocks over growth as valuations in more defensive growth sectors, such as consumer staples, have become increasingly expensive. However, we took the opportunity to trim our overweight to value stocks following the rally led by energy and commodity-related equities. Additionally, we are modestly overweight overseas small-cap stocks versus large-caps where we see opportunities to add value through active management supported by fundamental research.
OUTLOOK
Increased global uncertainty following Brexit has weighed on our global growth expectations, which remain modest for the next several quarters. The U.S. and other developed market economies are expanding at a subdued pace, while major emerging economies are struggling with weak growth. Monetary policy around the world is showing signs of convergence. Central banks in Europe, the UK, and Japan are expected to expand their stimulus measures given low growth and to contain potential Brexit-related risks. Meanwhile, the Fed is not expected to start normalizing interest rates until December at the earliest.
The U.S. economy is gradually improving thanks to solid private sector demand, an improving job market, and rising wages. However, our outlook for overseas developed markets is more cautious. Brexit has increased the likelihood that other countries will challenge their inclusion in the European Union, raising the near-term growth risks for the region. Even before Brexit, Europe was struggling with structural problems such as high debt, persistent low inflation, and high unemployment. Growth remains fragile in Japan, which is still trying to overcome weak consumption and deflationary pressures despite more than three years of Abenomics. The yen’s surge this year has created another headwind by increasing pressure on Japan’s exports and making it harder for the Bank of Japan to reach its 2% inflation target.
Our emerging markets outlook is also mixed given the disparity in fiscal conditions across the developing world. Russia and Brazil are both in recession, though this year’s commodities rebound and low interest rates globally should help support them in the near term. Looking ahead, China will continue to exert an outsized influence on investor sentiment. Given China’s importance to the world economy, how its government manages the country’s slowest growth in 25 years will have significant repercussions on commodity prices, trade, and the pace of global growth.
Key risks to our outlook include heightened instability within Europe, global monetary policy actions, and greater currency volatility. The rise of populism around the world, and its harmful impact on trade, is another risk to global growth that has increased following the Brexit vote. However, we believe that the broad diversification of our portfolio across asset classes, regions, and countries, coupled with active management in portfolio positioning and security selection, should help us generate attractive risk-adjusted returns in an uncertain market environment.
Respectfully submitted,

Charles M. Shriver
Portfolio manager, Spectrum Growth, Spectrum Income, and Spectrum International Funds
July 21, 2016
RISKS OF INVESTING
As with all stock and bond mutual funds, each fund’s share price can fall because of weakness in the stock or bond markets, a particular industry, or specific holdings. Stock markets can decline for many reasons, including adverse political or economic developments, changes in investor psychology, or heavy institutional selling. The prospects for an industry or company may deteriorate because of a variety of factors, including disappointing earnings or changes in the competitive environment. In addition, the investment manager’s assessment of companies held in a fund may prove incorrect, resulting in losses or poor performance even in rising markets.
Bonds are subject to interest rate risk, the decline in bond prices that usually accompanies a rise in interest rates, and credit risk, the chance that any fund holding could have its credit rating downgraded or that a bond issuer will default (fail to make timely payments of interest or principal), potentially reducing the fund’s income level and share price. High yield corporate bonds could have greater price declines than funds that invest primarily in high-quality bonds. Companies issuing high yield bonds are not as strong financially as those with higher credit ratings, so the bonds are usually considered speculative investments.
Funds that invest overseas may carry more risk than funds that invest strictly in U.S. assets. Risks can result from varying stages of economic and political development; differing regulatory environments, trading days, and accounting standards; and higher transaction costs of non-U.S. markets. Non-U.S. investments are also subject to currency risk, or a decline in the value of a foreign currency versus the U.S. dollar, which reduces the dollar value of securities denominated in that currency.
GLOSSARY
Barclays U.S. Aggregate Bond Index: An unmanaged index that tracks investment-grade corporate and government bonds.
J.P. Morgan Non-U.S. Dollar Government Bond Index: An unmanaged index that tracks the performance of major non-U.S. bond markets.
Lipper averages: The averages of available mutual fund performance returns for specified time periods in categories defined by Lipper Inc.
Lipper indexes: Fund benchmarks that consist of a small number of the largest mutual funds in a particular category as tracked by Lipper Inc.
MSCI All Country World Index ex USA: An unmanaged index that measures equity market performance of developed and emerging countries, excluding the U.S.
MSCI EAFE Index: An unmanaged index that tracks the stocks of about 1,000 companies in Europe, Australasia, and the Far East (EAFE).
MSCI Emerging Markets Index: An unmanaged index that tracks stocks in 26 emerging market countries.
Russell 2000 Index: An unmanaged index that tracks the stocks of 2,000 small U.S. companies.
Russell 3000 Index: An unmanaged index that tracks the performance of the 3,000 largest U.S. companies, representing approximately 98% of the investable U.S. equity market.
S&P 500 Index: An unmanaged index that tracks the stocks of 500 U.S. primarily large-cap companies.
Weighted average effective duration (years): A measure of a security’s price sensitivity to changes in interest rates. Securities with longer durations are more sensitive to changes in interest rates than securities of shorter durations.
Weighted average maturity: A measure of a fund’s sensitivity to interest rates. In general, the longer the average maturity, the greater the fund’s sensitivity to interest rate changes. The weighted average maturity may take into account interest rate readjustment dates for certain securities. Money funds must maintain a weighted average maturity of less than 60 days.
Note: MSCI makes no express or implied warranties or representations and shall have no liability whatsoever with respect to any MSCI data contained herein. The MSCI data may not be further redistributed or used as a basis for other indices or any securities or financial products. This report is not approved, reviewed, or produced by MSCI.
Note: Russell Investment Group is the source and owner of the trademarks, service marks, and copyrights related to the Russell indexes. Russell® is a trademark of Russell Investment Group.
Performance and Expenses
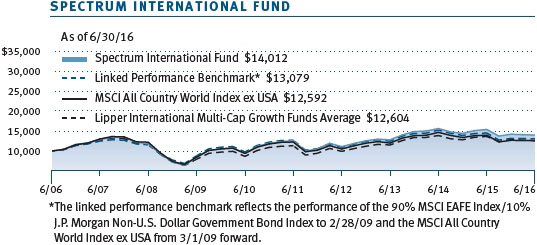
This chart shows the value of a hypothetical $10,000 investment in the fund over the past 10 fiscal year periods or since inception (for funds lacking 10-year records). The result is compared with benchmarks, which may include a broad-based market index and a peer group average or index. Market indexes do not include expenses, which are deducted from fund returns as well as mutual fund averages and indexes.
This chart shows the value of a hypothetical $10,000 investment in the fund over the past 10 fiscal year periods or since inception (for funds lacking 10-year records). The result is compared with benchmarks, which may include a broad-based market index and a peer group average or index. Market indexes do not include expenses, which are deducted from fund returns as well as mutual fund averages and indexes.
This chart shows the value of a hypothetical $10,000 investment in the fund over the past 10 fiscal year periods or since inception (for funds lacking 10-year records). The result is compared with benchmarks, which may include a broad-based market index and a peer group average or index. Market indexes do not include expenses, which are deducted from fund returns as well as mutual fund averages and indexes.
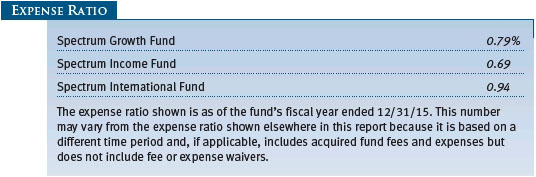
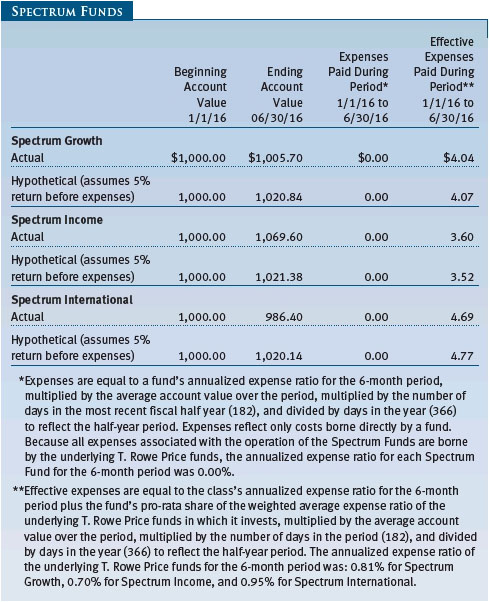
As a mutual fund shareholder, you may incur two types of costs: (1) transaction costs, such as redemption fees or sales loads, and (2) ongoing costs, including management fees, distribution and service (12b-1) fees, and other fund expenses. The following example is intended to help you understand your ongoing costs (in dollars) of investing in the fund and to compare these costs with the ongoing costs of investing in other mutual funds. The example is based on an investment of $1,000 invested at the beginning of the most recent six-month period and held for the entire period.
Actual Expenses
The first line of the following table (Actual) provides information about actual account values and expenses based on the fund’s actual returns. You may use the information on this line, together with your account balance, to estimate the expenses that you paid over the period. Simply divide your account value by $1,000 (for example, an $8,600 account value divided by $1,000 = 8.6), then multiply the result by the number on the first line under the heading “Expenses Paid During Period” to estimate the expenses you paid on your account during this period.
Hypothetical Example for Comparison Purposes
The information on the second line of the table (Hypothetical) is based on hypothetical account values and expenses derived from the fund’s actual expense ratio and an assumed 5% per year rate of return before expenses (not the fund’s actual return). You may compare the ongoing costs of investing in the fund with other funds by contrasting this 5% hypothetical example and the 5% hypothetical examples that appear in the shareholder reports of the other funds. The hypothetical account values and expenses may not be used to estimate the actual ending account balance or expenses you paid for the period.
Note: T. Rowe Price charges an annual account service fee of $20, generally for accounts with less than $10,000. The fee is waived for any investor whose T. Rowe Price mutual fund accounts total $50,000 or more; accounts electing to receive electronic delivery of account statements, transaction confirmations, prospectuses, and shareholder reports; or accounts of an investor who is a T. Rowe Price Preferred Services, Personal Services, or Enhanced Personal Services client (enrollment in these programs generally requires T. Rowe Price assets of at least $100,000). This fee is not included in the accompanying table. If you are subject to the fee, keep it in mind when you are estimating the ongoing expenses of investing in the fund and when comparing the expenses of this fund with other funds.
You should also be aware that the expenses shown in the table highlight only your ongoing costs and do not reflect any transaction costs, such as redemption fees or sales loads. Therefore, the second line of the table is useful in comparing ongoing costs only and will not help you determine the relative total costs of owning different funds. To the extent a fund charges transaction costs, however, the total cost of owning that fund is higher.
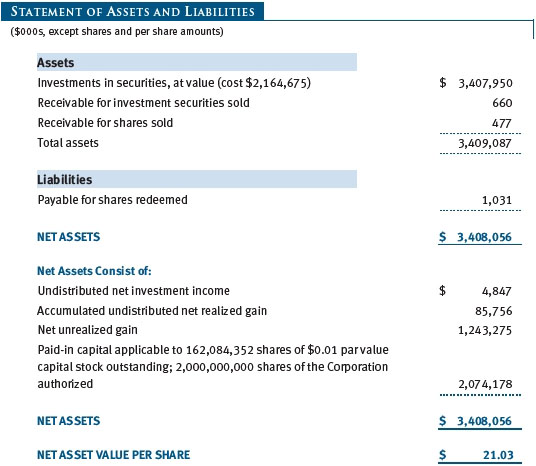
| T. Rowe Price Spectrum Growth Fund |
|
Unaudited
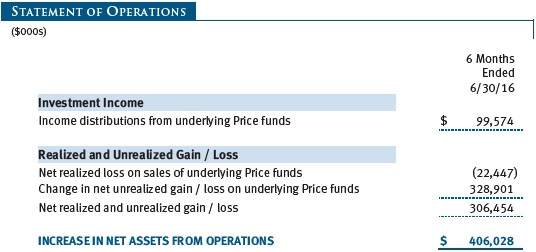
The accompanying notes are an integral part of these financial statements.
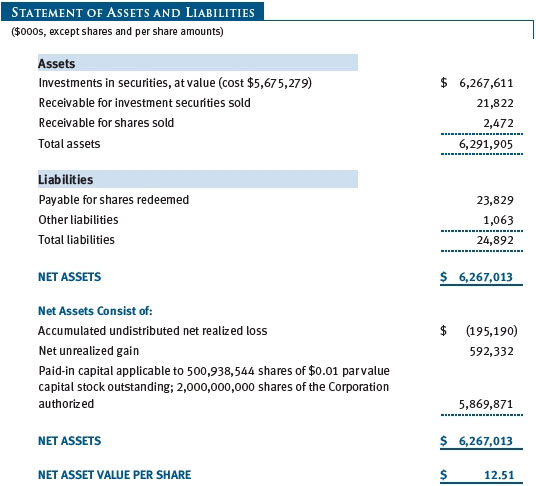
| T. Rowe Price Spectrum Income Fund |
|
Unaudited
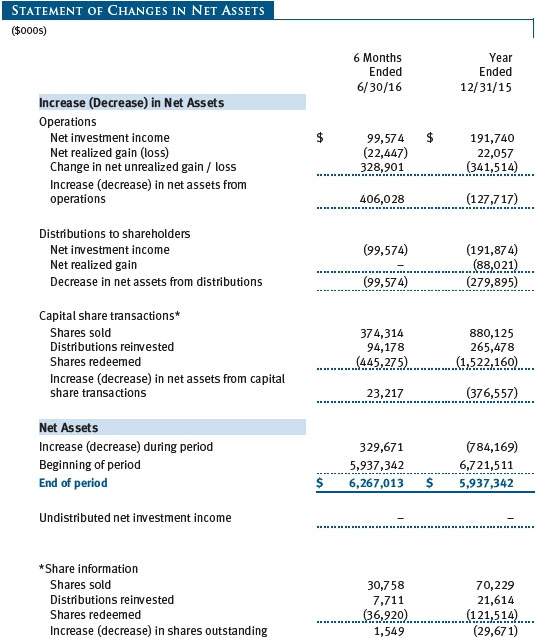
The accompanying notes are an integral part of these financial statements.
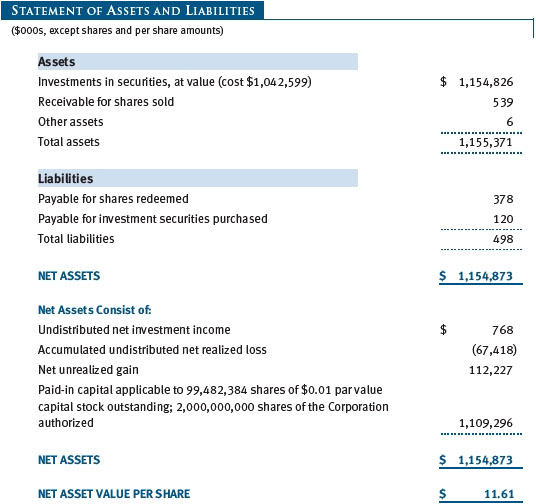
| T. Rowe Price Spectrum International Fund |
|
Unaudited
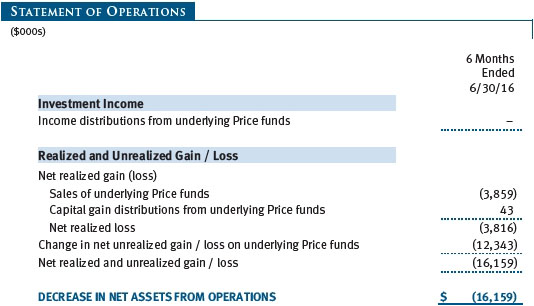
The accompanying notes are an integral part of these financial statements.
| T. Rowe Price Spectrum Growth Fund |
|
Unaudited
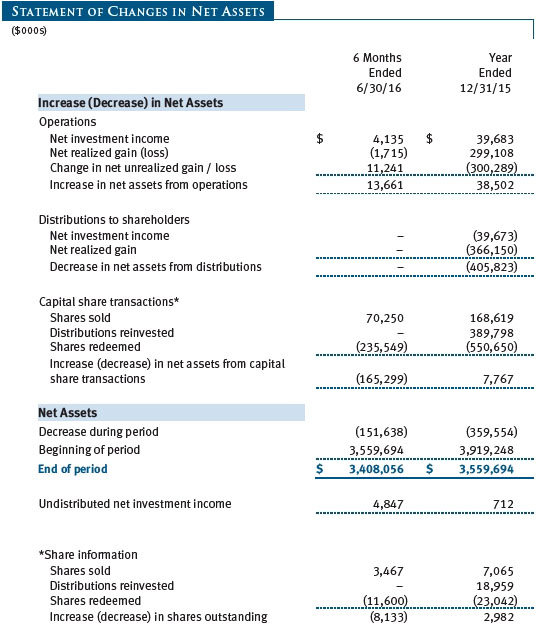
The accompanying notes are an integral part of these financial statements.
| T. Rowe Price Spectrum Income Fund |
|
Unaudited
The accompanying notes are an integral part of these financial statements.
| T. Rowe Price Spectrum International Fund |
|
Unaudited
The accompanying notes are an integral part of these financial statements.
| T. Rowe Price Spectrum Growth Fund |
|
Unaudited
The accompanying notes are an integral part of these financial statements.
| T. Rowe Price Spectrum Income Fund |
|
Unaudited
The accompanying notes are an integral part of these financial statements.
| T. Rowe Price Spectrum International Fund |
|
Unaudited

The accompanying notes are an integral part of these financial statements.
| T. Rowe Price Spectrum Funds |
|
Unaudited
| Notes to Financial Statements |
T. Rowe Price Spectrum Fund, Inc. (the corporation), is registered under the Investment Company Act of 1940 (the 1940 Act) as an open-end management investment company. Spectrum Growth Fund, Spectrum Income Fund, and Spectrum International Fund (collectively, the Spectrum Funds) are three portfolios established by the corporation. Spectrum Growth and Spectrum Income incepted on June 29, 1990, and Spectrum International incepted on December 31, 1996.
Each Spectrum Fund diversifies its assets within specified ranges among a set of T. Rowe Price mutual funds (underlying Price funds) representing specific market segments. Each Spectrum Fund is nondiversified for purposes of the 1940 Act, due to its limited number of investments; however, its investments in underlying Price funds are selected to provide exposure to a diversified portfolio of securities. Spectrum Growth seeks long-term capital appreciation and growth of income with current income as a secondary objective. Spectrum Income seeks a high level of current income with moderate share price fluctuation. Spectrum International seeks long-term capital appreciation.
NOTE 1 - SIGNIFICANT ACCOUNTING POLICIES
Basis of Preparation Each fund is an investment company and follows accounting and reporting guidance in the Financial Accounting Standards Board Accounting Standards Codification Topic 946 (ASC 946). The accompanying financial statements were prepared in accordance with accounting principles generally accepted in the United States of America (GAAP), including, but not limited to ASC 946. GAAP requires the use of estimates made by management. Management believes that estimates and valuations of the underlying Price funds are appropriate; however, actual results may differ from those estimates, and the valuations reflected in the accompanying financial statements may differ from the value ultimately realized upon sale of the underlying Price funds.
Investment Transactions, Investment Income, and Distributions Income is recorded on the accrual basis. Income and capital gain distributions from the underlying Price funds are recorded on the ex-dividend date. Dividends received from underlying Price fund investments are reflected as dividend income; capital gain distributions, if any, are reflected as realized gain/loss. Purchases and sales of the underlying Price funds are accounted for on the trade date. Gains and losses realized on sales of the underlying Price funds are reported on the identified cost basis. Income tax-related interest and penalties, if incurred, would be recorded as income tax expense. Distributions to shareholders are recorded on the ex-dividend date. Income distributions are declared by Spectrum Income daily and paid monthly. Income distributions are declared and paid by Spectrum Growth and Spectrum International annually. Capital gain distributions, if any, generally are declared and paid by each fund annually.
Redemption Fees A 2% fee is assessed on redemptions of Spectrum International shares held for 90 days or less to deter short-term trading and to protect the interests of long-term shareholders. Redemption fees are withheld from proceeds that shareholders receive from the sale or exchange of fund shares and are paid to the fund. Redemption fees received by Spectrum International are allocated to each underlying Price fund in proportion to the average daily value of its shares owned by the fund. Accordingly, redemption fees have no effect on the net assets of Spectrum International. The fees may cause the redemption price per share to differ from the net asset value per share.
NOTE 2 - VALUATION
Each fund’s financial instruments are valued, and its net asset value (NAV) per share is computed at the close of the New York Stock Exchange (NYSE), normally 4 p.m. ET, each day the NYSE is open for business. Each fund’s financial instruments are reported at fair value, which GAAP defines as the price that would be received to sell an asset or paid to transfer a liability in an orderly transaction between market participants at the measurement date. Investments in the underlying Price funds are valued at their closing NAV per share on the day of valuation. Assets and liabilities other than financial instruments, including short-term receivables and payables, are carried at cost, or estimated realizable value, if less, which approximates fair value.
The T. Rowe Price Valuation Committee (the Valuation Committee) has been established by the funds’ Board of Directors (the Board) to ensure that financial instruments are appropriately priced at fair value in accordance with GAAP and the 1940 Act. Subject to oversight by the Board, the Valuation Committee develops and oversees pricing-related policies and procedures and approves all fair value determinations. Specifically, the Valuation Committee establishes procedures to value securities; determines pricing techniques, sources, and persons eligible to effect fair value pricing actions; oversees the selection, services, and performance of pricing vendors; oversees valuation-related business continuity practices; and provides guidance on internal controls and valuation-related matters. The Valuation Committee reports to the Board and has representation from legal, portfolio management and trading, operations, risk management, and the funds’ treasurer.
Various valuation techniques and inputs are used to determine the fair value of financial instruments. GAAP establishes the following fair value hierarchy that categorizes the inputs used to measure fair value:
Level 1 – quoted prices (unadjusted) in active markets for identical financial instruments that the fund can access at the reporting date
Level 2 – inputs other than Level 1 quoted prices that are observable, either directly or indirectly (including, but not limited to, quoted prices for similar financial instruments in active markets, quoted prices for identical or similar financial instruments in inactive markets, interest rates and yield curves, implied volatilities, and credit spreads)
Level 3 – unobservable inputs
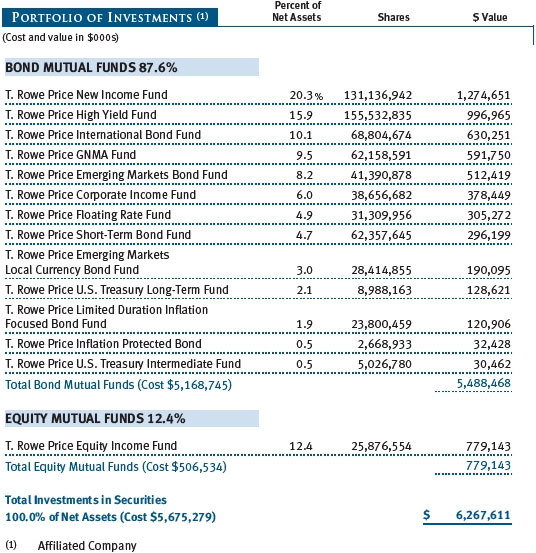
Observable inputs are developed using market data, such as publicly available information about actual events or transactions, and reflect the assumptions that market participants would use to price the financial instrument. Unobservable inputs are those for which market data are not available and are developed using the best information available about the assumptions that market participants would use to price the financial instrument. GAAP requires valuation techniques to maximize the use of relevant observable inputs and minimize the use of unobservable inputs. When multiple inputs are used to derive fair value, the financial instrument is assigned to the level within the fair value hierarchy based on the lowest-level input that is significant to the fair value of the financial instrument. Input levels are not necessarily an indication of the risk or liquidity associated with financial instruments at that level but rather the degree of judgment used in determining those values. On June 30, 2016, all of the investments in underlying Price funds were classified as Level 1, based on the inputs used to determine their fair values.
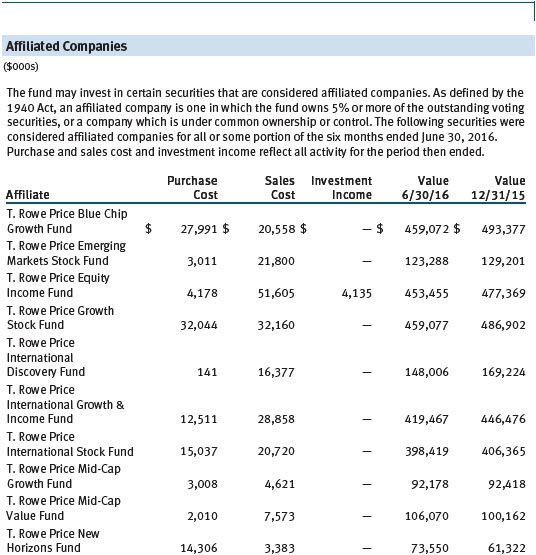
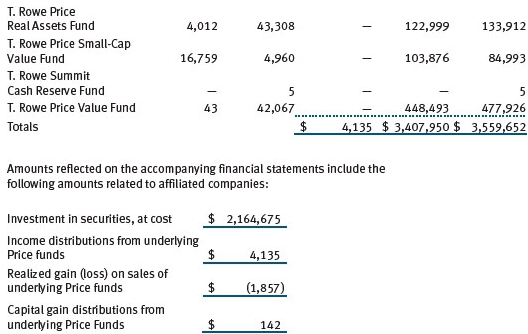
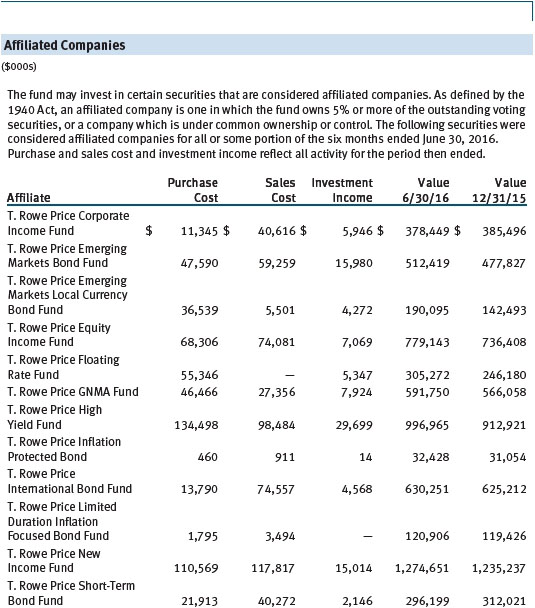
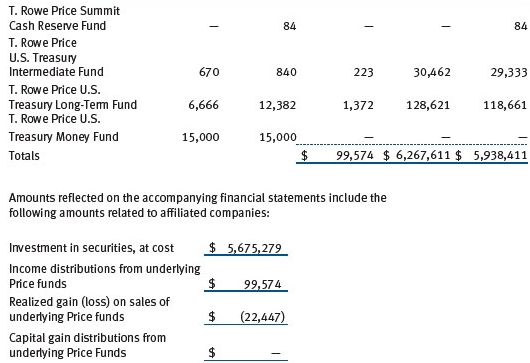
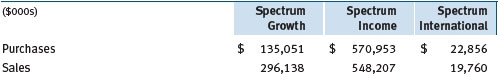
NOTE 3 - INVESTMENTS IN UNDERLYING PRICE FUNDS
Purchases and sales of the underlying Price funds during the six months ended June 30, 2016, were as follows:
NOTE 4 - FEDERAL INCOME TAXES
No provision for federal income taxes is required since each fund intends to continue to qualify as a regulated investment company under Subchapter M of the Internal Revenue Code and distribute to shareholders all of its taxable income and gains. Distributions determined in accordance with federal income tax regulations may differ in amount or character from net investment income and realized gains for financial reporting purposes. Financial reporting records are adjusted for permanent book/tax differences to reflect tax character but are not adjusted for temporary differences. The amount and character of tax-basis distributions and composition of net assets are finalized at fiscal year-end; accordingly, tax-basis balances have not been determined as of the date of this report.
Each fund intends to retain realized gains to the extent of available capital loss carryforwards. Because capital loss carryforwards that do not expire are required to be used before capital loss carryforwards with expiration dates, it is possible that all or a portion of Spectrum International’s capital loss carryforwards subject to expiration could ultimately go unused. As of December 31, 2015, Spectrum Growth had no available capital loss carryforwards. Spectrum Income had no available capital loss carryforwards as of December 31, 2015. Additionally, as of December 31, 2015, Spectrum International had $2,786,000 of available capital loss carryforwards, which all expire in 2018.
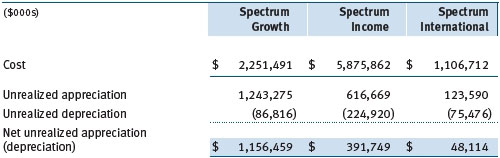
At June 30, 2016, the cost of investments for federal income tax purposes and net unrealized gain (loss) on investments was as follows:
NOTE 5 - RELATED PARTY TRANSACTIONS
The Spectrum Funds are managed by T. Rowe Price Associates, Inc. (Price Associates), a wholly owned subsidiary of T. Rowe Price Group, Inc. (Price Group). Price Associates, directly or through sub-advisory agreements with its wholly owned subsidiaries, also provides investment management services to all the underlying Price funds. Pursuant to various service agreements, Price Associates and its wholly owned subsidiaries provide shareholder servicing and administrative services as well as certain accounting, marketing, and other services to the Spectrum Funds. Certain officers and directors of the Spectrum Funds are also officers and directors of Price Associates and its subsidiaries and of the underlying Price funds.
The Spectrum Funds pay no management fees; however, Price Associates receives management fees from the underlying Price funds. The Spectrum Funds operate in accordance with the investment management and special servicing agreements between and among the corporation, the underlying Price funds and Price Associates. Pursuant to these agreements, expenses associated with the operation of the Spectrum Funds are borne by each underlying Price fund to the extent of estimated savings to it and in proportion to the average daily value of its shares owned by the Spectrum Funds. Therefore, each Spectrum Fund operates at a zero expense ratio. However, each Spectrum Fund indirectly bears its proportionate share of the management fees and operating costs of the underlying Price funds in which it invests.
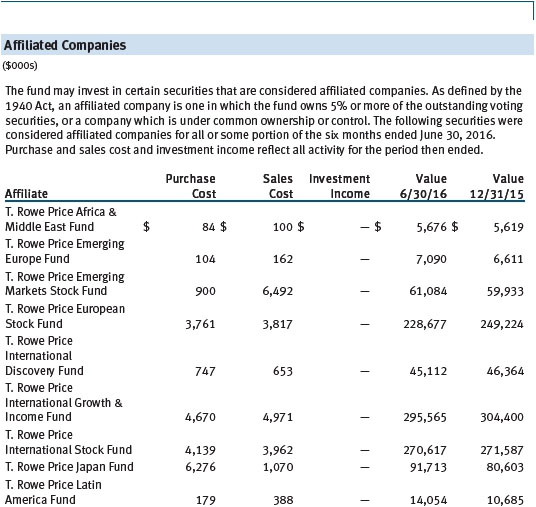
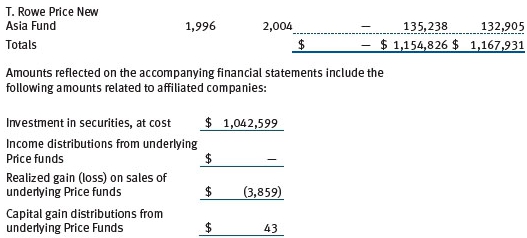
The Spectrum Funds do not invest in the underlying Price funds for the purpose of exercising management or control; however, investments by the Spectrum Funds may represent a significant portion of an underlying Price fund’s net assets. At June 30, 2016, Spectrum Growth Fund and Spectrum International Fund each held less than 25% of the outstanding shares of any underlying Price fund; Spectrum Income Fund held approximately 44% of the outstanding shares of the Corporate Income Fund, 82% of the Emerging Markets Local Currency Bond Fund, 43% of the Floating Rate Fund, 38% of the GNMA fund, 29% of the U.S. Treasury Long-Term Fund, and less than 25% of any other underlying Price fund.
Additionally, Spectrum Income Fund is one of several mutual funds in which certain college savings plans managed by Price Associates may invest. Shareholder servicing costs associated with each college savings plan are allocated to Spectrum Income Fund in proportion to the average daily value of its shares owned by the college savings plan and, in turn, are borne by the underlying Price funds in accordance with the terms of the investment management and special servicing agreements. At June 30, 2016, approximately 32% of the outstanding shares of Spectrum Income Fund were held by the college savings plans.
As of June 30, 2016, T. Rowe Price Group, Inc., or its wholly owned subsidiaries owned 2,061,790 shares of the Spectrum Growth Fund, representing 1% of the fund’s net assets.
| Information on Proxy Voting Policies, Procedures, and Records |
A description of the policies and procedures used by T. Rowe Price funds and portfolios to determine how to vote proxies relating to portfolio securities is available in each fund’s Statement of Additional Information. You may request this document by calling 1-800-225-5132 or by accessing the SEC’s website, sec.gov.
The description of our proxy voting policies and procedures is also available on our corporate website. To access it, please visit the following Web page
https://www3.troweprice.com/usis/corporate/en/utility/policies.html
and scroll down to the section near the bottom of the page that says, “Proxy Voting Policies.” Click on the Proxy Voting Policies link in the shaded box.
Each fund’s most recent annual proxy voting record is available on our website and through the SEC’s website. To access it through T. Rowe Price, visit the website location shown above, and scroll down to the section near the bottom of the page that says, “Proxy Voting Records.” Click on the Proxy Voting Records link in the shaded box.
| How to Obtain Quarterly Portfolio Holdings |
The fund files a complete schedule of portfolio holdings with the Securities and Exchange Commission for the first and third quarters of each fiscal year on Form N-Q. The fund’s Form N-Q is available electronically on the SEC’s website (sec.gov); hard copies may be reviewed and copied at the SEC’s Public Reference Room, 100 F St. N.E., Washington, DC 20549. For more information on the Public Reference Room, call 1-800-SEC-0330.
| T. Rowe Price Spectrum Growth Fund |
|
| Approval of Investment Management Agreement |
On March 11, 2016, the fund’s Board of Directors (Board), including a majority of the fund’s independent directors, approved the continuation of the investment management agreement (Advisory Contract) between the fund and its investment advisor, T. Rowe Price Associates, Inc. (Advisor), as well as a Special Servicing Agreement among the fund, the Advisor and each of the underlying funds in which it invests (Special Servicing Agreement). The Special Servicing Agreement allows the T. Rowe Price Spectrum Funds (Spectrum Funds) to pass through their operating expenses to the underlying funds in which they invest if the benefit to the underlying funds equals or exceeds the costs of absorbing these expenses and provides that the Advisor will be responsible for bearing any expenses that would result from an underlying fund’s share of the aggregate expenses of the Spectrum Funds exceeding the estimated savings to the underlying fund from the operation of the Spectrum Funds. In connection with its deliberations, the Board requested, and the Advisor provided, such information as the Board (with advice from independent legal counsel) deemed reasonably necessary. The Board considered a variety of factors in connection with its review of the Advisory Contract and Special Servicing Agreement, also taking into account information provided by the Advisor during the course of the year, as discussed below:
Services Provided by the Advisor
The Board considered the nature, quality, and extent of the services provided to the fund by the Advisor. These services included, but were not limited to, directing the fund’s investments in accordance with its investment program and the overall management of the fund’s portfolio, as well as a variety of related activities such as financial, investment operations, and administrative services; compliance; maintaining the fund’s records and registrations; and shareholder communications. The Board also reviewed the background and experience of the Advisor’s senior management team and investment personnel involved in the management of the fund, as well as the Advisor’s compliance record. The Board concluded that it was satisfied with the nature, quality, and extent of the services provided by the Advisor.
Investment Performance of the Fund
The Board reviewed the fund’s three-month, one-year, and year-by-year returns, as well as the fund’s average annualized total returns over the 3-, 5-, and 10-year periods, and compared these returns with a wide variety of comparable performance measures and market data, including those supplied by Lipper and Morningstar, which are independent providers of mutual fund data.
On the basis of this evaluation and the Board’s ongoing review of investment results, and factoring in the relative market conditions during certain of the performance periods, the Board concluded that the fund’s performance was satisfactory.
Costs, Benefits, Profits, and Economies of Scale
The Advisor does not receive management fees from the fund, and operating expenses of the fund are borne by the underlying T. Rowe Price funds in which it invests pursuant to the Special Servicing Agreement. In connection with its review of the Special Servicing Agreement, the Board reviewed various cost/benefit analyses to demonstrate the benefits to the underlying funds versus the costs they incur, which illustrate the primary benefit provided by the Spectrum Funds to the underlying funds is the reduction in expenses associated with the consolidation of shareholder accounts that would otherwise be invested directly in the underlying funds.
The Advisor receives management fees from other T. Rowe Price funds in which the fund invests. However, since the Advisor does not receive any management fees directly from the fund, the Board did not review information relating to revenues received by the Advisor under the Advisory Contract. The Board did review information regarding benefits that the Advisor (and its affiliates) may have realized from its relationship with the fund or other T. Rowe Price funds in which the fund invests, including any research received under “soft dollar” agreements and commission-sharing arrangements with broker-dealers. The Board considered that the Advisor may receive some benefit from its soft-dollar arrangements pursuant to which it receives research from broker-dealers that execute the applicable fund’s portfolio transactions. The Board also received information on the estimated costs incurred and profits realized by the Advisor and its affiliates from advising T. Rowe Price mutual funds and concluded that the Advisor’s profits were reasonable. Because the Advisor does not receive fees from the fund, the Board did not consider whether the fund or other funds benefit under the fee levels set forth in the Advisory Contract from any economies of scale realized by the Advisor. Because the Advisor does not receive a management fee from the fund and the fund does not have an explicit expense ratio, the Board did not review fees and expenses of other comparable funds or of institutional accounts of the Advisor and its affiliates.
Approval of the Advisory Contract and Special Servicing Agreement
As noted, the Board approved the continuation of the Advisory Contract as well as the Special Servicing Agreement. No single factor was considered in isolation or to be determinative to the decision. Rather, the Board concluded, in light of a weighting and balancing of all factors considered, that it was in the best interests of the fund and its shareholders for the Board to approve the continuation of the Advisory Contract and that there is a reasonable basis to conclude that the benefits to the underlying funds exceed the costs they incur and that it was in the best interests of the fund and its underlying funds to approve continuation of the Special Servicing Agreement. The independent directors were advised throughout the process by independent legal counsel.
| T. Rowe Price Spectrum Income Fund |
|
| Approval of Investment Management Agreement |
On March 11, 2016, the fund’s Board of Directors (Board), including a majority of the fund’s independent directors, approved the continuation of the investment management agreement (Advisory Contract) between the fund and its investment advisor, T. Rowe Price Associates, Inc. (Advisor), as well as a Special Servicing Agreement among the fund, the Advisor and each of the underlying funds in which it invests (Special Servicing Agreement). The Special Servicing Agreement allows the T. Rowe Price Spectrum Funds (Spectrum Funds) to pass through their operating expenses to the underlying funds in which they invest if the benefit to the underlying funds equals or exceeds the costs of absorbing these expenses and provides that the Advisor will be responsible for bearing any expenses that would result from an underlying fund’s share of the aggregate expenses of the Spectrum Funds exceeding the estimated savings to the underlying fund from the operation of the Spectrum Funds. In connection with its deliberations, the Board requested, and the Advisor provided, such information as the Board (with advice from independent legal counsel) deemed reasonably necessary. The Board considered a variety of factors in connection with its review of the Advisory Contract and Special Servicing Agreement, also taking into account information provided by the Advisor during the course of the year, as discussed below:
Services Provided by the Advisor
The Board considered the nature, quality, and extent of the services provided to the fund by the Advisor. These services included, but were not limited to, directing the fund’s investments in accordance with its investment program and the overall management of the fund’s portfolio, as well as a variety of related activities such as financial, investment operations, and administrative services; compliance; maintaining the fund’s records and registrations; and shareholder communications. The Board also reviewed the background and experience of the Advisor’s senior management team and investment personnel involved in the management of the fund, as well as the Advisor’s compliance record. The Board concluded that it was satisfied with the nature, quality, and extent of the services provided by the Advisor.
Investment Performance of the Fund
The Board reviewed the fund’s three-month, one-year, and year-by-year returns, as well as the fund’s average annualized total returns over the 3-, 5-, and 10-year periods, and compared these returns with a wide variety of comparable performance measures and market data, including those supplied by Lipper and Morningstar, which are independent providers of mutual fund data.
On the basis of this evaluation and the Board’s ongoing review of investment results, and factoring in the relative market conditions during certain of the performance periods, the Board concluded that the fund’s performance was satisfactory.
Costs, Benefits, Profits, and Economies of Scale
The Advisor does not receive management fees from the fund, and operating expenses of the fund are borne by the underlying T. Rowe Price funds in which it invests pursuant to the Special Servicing Agreement. In connection with its review of the Special Servicing Agreement, the Board reviewed various cost/benefit analyses to demonstrate the benefits to the underlying funds versus the costs they incur, which illustrate the primary benefit provided by the Spectrum Funds to the underlying funds is the reduction in expenses associated with the consolidation of shareholder accounts that would otherwise be invested directly in the underlying funds.
The Advisor receives management fees from other T. Rowe Price funds in which the fund invests. However, since the Advisor does not receive any management fees directly from the fund, the Board did not review information relating to revenues received by the Advisor under the Advisory Contract. The Board did review information regarding benefits that the Advisor (and its affiliates) may have realized from its relationship with the fund or other T. Rowe Price funds in which the fund invests, including any research received under “soft dollar” agreements and commission-sharing arrangements with broker-dealers. The Board considered that the Advisor may receive some benefit from its soft-dollar arrangements pursuant to which it receives research from broker-dealers that execute the applicable fund’s portfolio transactions. The Board also received information on the estimated costs incurred and profits realized by the Advisor and its affiliates from advising T. Rowe Price mutual funds and concluded that the Advisor’s profits were reasonable. Because the Advisor does not receive fees from the fund, the Board did not consider whether the fund or other funds benefit under the fee levels set forth in the Advisory Contract from any economies of scale realized by the Advisor. Because the Advisor does not receive a management fee from the fund and the fund does not have an explicit expense ratio, the Board did not review fees and expenses of other comparable funds or of institutional accounts of the Advisor and its affiliates.
Approval of the Advisory Contract and Special Servicing Agreement
As noted, the Board approved the continuation of the Advisory Contract as well as the Special Servicing Agreement. No single factor was considered in isolation or to be determinative to the decision. Rather, the Board concluded, in light of a weighting and balancing of all factors considered, that it was in the best interests of the fund and its shareholders for the Board to approve the continuation of the Advisory Contract and that there is a reasonable basis to conclude that the benefits to the underlying funds exceed the costs they incur and that it was in the best interests of the fund and its underlying funds to approve continuation of the Special Servicing Agreement. The independent directors were advised throughout the process by independent legal counsel.
| T. Rowe Price Spectrum International Fund |
|
| Approval of Investment Management Agreement |
On March 11, 2016, the fund’s Board of Directors (Board), including a majority of the fund’s independent directors, approved the continuation of the investment management agreement (Advisory Contract) between the fund and its investment advisor, T. Rowe Price Associates, Inc. (Advisor), as well as a Special Servicing Agreement among the fund, the Advisor and each of the underlying funds in which it invests (Special Servicing Agreement). The Special Servicing Agreement allows the T. Rowe Price Spectrum Funds (Spectrum Funds) to pass through their operating expenses to the underlying funds in which they invest if the benefit to the underlying funds equals or exceeds the costs of absorbing these expenses and provides that the Advisor will be responsible for bearing any expenses that would result from an underlying fund’s share of the aggregate expenses of the Spectrum Funds exceeding the estimated savings to the underlying fund from the operation of the Spectrum Funds. In connection with its deliberations, the Board requested, and the Advisor provided, such information as the Board (with advice from independent legal counsel) deemed reasonably necessary. The Board considered a variety of factors in connection with its review of the Advisory Contract and Special Servicing Agreement, also taking into account information provided by the Advisor during the course of the year, as discussed below:
Services Provided by the Advisor
The Board considered the nature, quality, and extent of the services provided to the fund by the Advisor. These services included, but were not limited to, directing the fund’s investments in accordance with its investment program and the overall management of the fund’s portfolio, as well as a variety of related activities such as financial, investment operations, and administrative services; compliance; maintaining the fund’s records and registrations; and shareholder communications. The Board also reviewed the background and experience of the Advisor’s senior management team and investment personnel involved in the management of the fund, as well as the Advisor’s compliance record. The Board concluded that it was satisfied with the nature, quality, and extent of the services provided by the Advisor.
Investment Performance of the Fund
The Board reviewed the fund’s three-month, one-year, and year-by-year returns, as well as the fund’s average annualized total returns over the 3-, 5-, and 10-year periods, and compared these returns with a wide variety of comparable performance measures and market data, including those supplied by Lipper and Morningstar, which are independent providers of mutual fund data.
On the basis of this evaluation and the Board’s ongoing review of investment results, and factoring in the relative market conditions during certain of the performance periods, the Board concluded that the fund’s performance was satisfactory.
Costs, Benefits, Profits, and Economies of Scale
The Advisor does not receive management fees from the fund, and operating expenses of the fund are borne by the underlying T. Rowe Price funds in which it invests pursuant to the Special Servicing Agreement. In connection with its review of the Special Servicing Agreement, the Board reviewed various cost/benefit analyses to demonstrate the benefits to the underlying funds versus the costs they incur, which illustrate the primary benefit provided by the Spectrum Funds to the underlying funds is the reduction in expenses associated with the consolidation of shareholder accounts that would otherwise be invested directly in the underlying funds.
The Advisor receives management fees from other T. Rowe Price funds in which the fund invests. However, since the Advisor does not receive any management fees directly from the fund, the Board did not review information relating to revenues received by the Advisor under the Advisory Contract. The Board did review information regarding benefits that the Advisor (and its affiliates) may have realized from its relationship with the fund or other T. Rowe Price funds in which the fund invests, including any research received under “soft dollar” agreements and commission-sharing arrangements with broker-dealers. The Board considered that the Advisor may receive some benefit from its soft-dollar arrangements pursuant to which it receives research from broker-dealers that execute the applicable fund’s portfolio transactions. The Board also received information on the estimated costs incurred and profits realized by the Advisor and its affiliates from advising T. Rowe Price mutual funds and concluded that the Advisor’s profits were reasonable. Because the Advisor does not receive fees from the fund, the Board did not consider whether the fund or other funds benefit under the fee levels set forth in the Advisory Contract from any economies of scale realized by the Advisor. Because the Advisor does not receive a management fee from the fund and the fund does not have an explicit expense ratio, the Board did not review fees and expenses of other comparable funds or of institutional accounts of the Advisor and its affiliates.
Approval of the Advisory Contract and Special Servicing Agreement
As noted, the Board approved the continuation of the Advisory Contract as well as the Special Servicing Agreement. No single factor was considered in isolation or to be determinative to the decision. Rather, the Board concluded, in light of a weighting and balancing of all factors considered, that it was in the best interests of the fund and its shareholders for the Board to approve the continuation of the Advisory Contract and that there is a reasonable basis to conclude that the benefits to the underlying funds exceed the costs they incur and that it was in the best interests of the fund and its underlying funds to approve continuation of the Special Servicing Agreement. The independent directors were advised throughout the process by independent legal counsel.
Item 2. Code of Ethics.
A code of ethics, as defined in Item 2 of Form N-CSR, applicable to its principal executive officer, principal financial officer, principal accounting officer or controller, or persons performing similar functions is filed as an exhibit to the registrant’s annual Form N-CSR. No substantive amendments were approved or waivers were granted to this code of ethics during the registrant’s most recent fiscal half-year.
Item 3. Audit Committee Financial Expert.
Disclosure required in registrant’s annual Form N-CSR.
Item 4. Principal Accountant Fees and Services.
Disclosure required in registrant’s annual Form N-CSR.
Item 5. Audit Committee of Listed Registrants.
Not applicable.
Item 6. Investments.
(a) Not applicable. The complete schedule of investments is included in Item 1 of this Form N-CSR.
(b) Not applicable.
Item 7. Disclosure of Proxy Voting Policies and Procedures for Closed-End Management Investment Companies.
Not applicable.
Item 8. Portfolio Managers of Closed-End Management Investment Companies.
Not applicable.
Item 9. Purchases of Equity Securities by Closed-End Management Investment Company and Affiliated Purchasers.
Not applicable.
Item 10. Submission of Matters to a Vote of Security Holders.
Not applicable.
Item 11. Controls and Procedures.
(a) The registrant’s principal executive officer and principal financial officer have evaluated the registrant’s disclosure controls and procedures within 90 days of this filing and have concluded that the registrant’s disclosure controls and procedures were effective, as of that date, in ensuring that information required to be disclosed by the registrant in this Form N-CSR was recorded, processed, summarized, and reported timely.
(b) The registrant’s principal executive officer and principal financial officer are aware of no change in the registrant’s internal control over financial reporting that occurred during the registrant’s second fiscal quarter covered by this report that has materially affected, or is reasonably likely to materially affect, the registrant’s internal control over financial reporting.
Item 12. Exhibits.
(a)(1) The registrant’s code of ethics pursuant to Item 2 of Form N-CSR is filed with the registrant’s annual Form N-CSR.
(2) Separate certifications by the registrant's principal executive officer and principal financial officer, pursuant to Section 302 of the Sarbanes-Oxley Act of 2002 and required by Rule 30a-2(a) under the Investment Company Act of 1940, are attached.
(3) Written solicitation to repurchase securities issued by closed-end companies: not applicable.
(b) A certification by the registrant's principal executive officer and principal financial officer, pursuant to Section 906 of the Sarbanes-Oxley Act of 2002 and required by Rule 30a-2(b) under the Investment Company Act of 1940, is attached.
SIGNATURES
Pursuant to the requirements of the Securities Exchange Act of 1934 and the Investment Company Act of 1940, the registrant has duly caused this report to be signed on its behalf by the undersigned, thereunto duly authorized.
T. Rowe Price Spectrum Fund, Inc.
| | By | /s/ Edward C. Bernard |
| | Edward C. Bernard |
| | Principal Executive Officer |
| |
| Date August 17, 2016 | | |
Pursuant to the requirements of the Securities Exchange Act of 1934 and the Investment Company Act of 1940, this report has been signed below by the following persons on behalf of the registrant and in the capacities and on the dates indicated.
| | By | /s/ Edward C. Bernard |
| | Edward C. Bernard |
| | Principal Executive Officer |
| |
| Date August 17, 2016 | | |
| |
| |
| By | /s/ Catherine D. Mathews |
| | Catherine D. Mathews |
| | Principal Financial Officer |
| |
| Date August 17, 2016 | | |