UNITED STATES
SECURITIES AND EXCHANGE COMMISSION
Washington, D.C. 20549
FORM N-CSR
CERTIFIED SHAREHOLDER REPORT OF REGISTERED
MANAGEMENT INVESTMENT COMPANIES
Investment Company Act File Number: 811-04998
| T. Rowe Price Spectrum Fund, Inc. |
|
| (Exact name of registrant as specified in charter) |
| |
| 100 East Pratt Street, Baltimore, MD 21202 |
|
| (Address of principal executive offices) |
| |
| David Oestreicher |
| 100 East Pratt Street, Baltimore, MD 21202 |
|
| (Name and address of agent for service) |
Registrant’s telephone number, including area code: (410) 345-2000
Date of fiscal year end: December 31
Date of reporting period: June 30, 2019
Item 1. Reports to Shareholders
(a) Report pursuant to Rule 30e-1.
| Spectrum Funds | June 30, 2019 |
| PRSGX | Investor Class |
| RPSIX | Investor Class |
| PSILX | Investor Class |
Beginning on January 1, 2021, as permitted by SEC regulations, paper copies of the T. Rowe Price funds’ annual and semiannual shareholder reports will no longer be mailed, unless you specifically request them. Instead, shareholder reports will be made available on the funds’ website (troweprice.com/prospectus), and you will be notified by mail with a website link to access the reports each time a report is posted to the site.
If you already elected to receive reports electronically, you will not be affected by this change and need not take any action. At any time, shareholders who invest directly in T. Rowe Price funds may generally elect to receive reports or other communications electronically by enrolling attroweprice.com/paperlessor, if you are a retirement plan sponsor or invest in the funds through a financial intermediary (such as an investment advisor, broker-dealer, insurance company, or bank), by contacting your representative or your financial intermediary.
You may elect to continue receiving paper copies of future shareholder reports free of charge. To do so, if you invest directly with T. Rowe Price, please call T. Rowe Price as follows: IRA, nonretirement account holders, and institutional investors,1-800-225-5132; small business retirement accounts,1-800-492-7670. If you are a retirement plan sponsor or invest in the T. Rowe Price funds through a financial intermediary, please contact your representative or financial intermediary or follow additional instructions if included with this document. Your election to receive paper copies of reports will apply to all funds held in your account with your financial intermediary or, if you invest directly in the T. Rowe Price funds, with T. Rowe Price. Your election can be changed at any time in the future.
| T. ROWE PRICE SPECTRUM FUNDS |
|
HIGHLIGHTS
| ■ | The Spectrum Funds posted positive returns for the six-month period ended June 30, 2019. The Spectrum Income Fund and Spectrum International Fund both outperformed their benchmarks, while the Spectrum Growth Fund lagged its benchmark. Performance relative to their respective Lipper peer groups was mixed. |
| |
| ■ | Global equity markets surged in the first half of the year, despite a sharp pullback in May after U.S.-China trade negotiations unexpectedly broke down. Fixed income markets also advanced, as bond yields in many developed markets declined and prices rose after central banks turned more accommodative following a period of tightening monetary policy. |
| |
| ■ | We seek value in segments where we feel that market weakness has created attractive risk/reward opportunities. During the reporting period, changes to the Spectrum International and Spectrum Growth Funds included reducing our allocation to international equities and shifting to an overweight to international growth stocks versus value stocks. Within the Spectrum Income Fund, we moved to an overweight in high yield bonds. |
| |
| ■ | Near-term risks to global markets include repercussions from potential monetary policy missteps and an escalation in trade tensions. In our view, recent flare-ups in volatility against a backdrop filled with geopolitical and policy risks underscore the value of our strategic investment approach. |

Log in to your account attroweprice.comfor more information.
*Certain mutual fund accounts that are assessed an annual account service fee can also save money by switching to e-delivery.
CIO Market Commentary
Dear Shareholder
Markets overcame a bout of volatility in May and recorded exceptional returns in the six months ended June 30, 2019. The large-cap S&P 500 Index reached record highs and notched its best start to a year in over two decades. Overseas equity markets were also strong, while bond prices rose as longer-term interest rates fell to their lowest levels since late 2016.
Markets rebounded to start the year, as many of the worries behind the sell-off in late 2018 receded. Investors seemed most relieved by a dovish pivot in monetary policy. The S&P 500 scored its best daily gain for the period on January 4, after Federal Reserve Chair Jerome Powell pledged that the central bank would respond with all the tools at its disposal to counteract an economic downturn or financial turmoil. The Fed soon paused and kept rates steady following a series of quarterly hikes stretching back to late 2017.
Investors also seemed comforted by progress in U.S.-China trade relations. In March, President Donald Trump postponed a threatened tariff increase on Chinese goods and remarked that the two sides were “getting very close” to a deal. Encouraging statements continued to flow from the White House, and speculation grew that Chinese President Xi Jinping would soon visit Washington to sign an agreement.
Hopes for a deal were dashed in early May, however, sending stocks sharply lower. With negotiations at a standstill, on May 10, the administration increased the tariff rate to 25% from 10% on $200 billion in Chinese goods, as the president had long threatened. China soon retaliated with its own tariffs. A technological “cold war” also seemed to be developing, with both sides taking measures to cut off the other’s access to key components and raw materials. Stocks fell sharply in response, and the small- and mid-cap indexes moved back into correction territory, or down more than 10% from the highs they established late in the previous summer.
Another turn in trade policy in June helped stocks recover their losses. The White House abandoned an earlier threat to put tariffs on Mexican imports in response to immigration issues, and President Trump again softened his stance on China. Markets were closed on the final weekend of the month, when the president announced that he and President Xi had agreed to resume trade negotiations and arranged a truce that would at least temporarily prevent the imposition of further tariffs.
An even bigger factor in the June rebound appeared to be growing confidence that the Fed would cut interest rates rather than merely keep them steady. Fed Chair Powell pledged that policymakers were paying close attention to the impact of trade tensions on the economy and would “act as appropriate to sustain the expansion.” Policymakers also dropped references to being “patient” in adjusting monetary policy. By the end of the month, futures markets were pricing in 75 basis points (0.75 percentage point) of cuts in the second half of the year, with a reasonable chance of more to come in 2020.
The dovish shift in Fed policy has been driven by accumulating evidence of slowing global growth. Rising trade barriers have taken a heavy toll on the global manufacturing sector, and business investment has pulled back as managers confront additional sources of uncertainty, such as the possibility of a disorderly Brexit this October. As a result, corporate earnings growth has stalled in the U.S. and turned negative in other major markets. On the positive side, consumers remain in much better shape, particularly domestically.
We see little evidence to suggest a recession is on the horizon. Indeed, with markets at all-time highs, investors seem willing to bet that this decade-long economic recovery still has legs. We will keep a close eye on developments and rely on our careful fundamental research to avoid pitfalls; I am confident our strategic investing approach will continue to serve our shareholders well.
Thank you for your continued confidence in T. Rowe Price.
Sincerely,

Robert Sharps
Group Chief Investment Officer
Management’s Discussion of Fund Performance
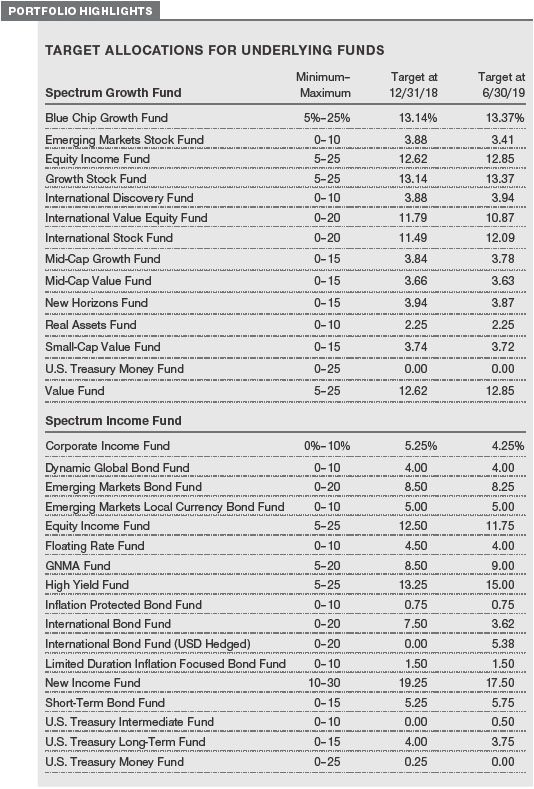
SPECTRUM GROWTH FUND
INVESTMENT OBJECTIVE
The fund seeks long-term capital appreciation and growth of income with current income a secondary objective.
FUND COMMENTARY
How did the fund perform in the past six months?
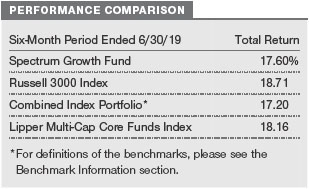
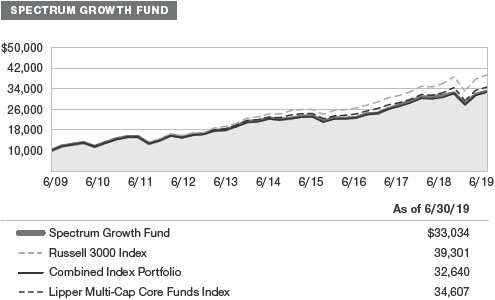
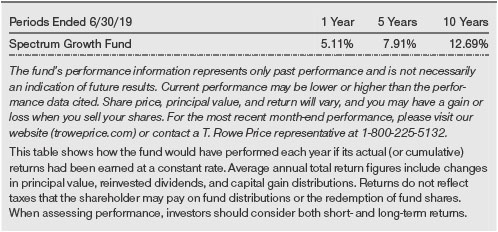
The Spectrum Growth Fund returned 17.60% for the six-month period ended June 30, 2019, underperforming the Russell 3000 Index and the Lipper Multi-Cap Core Funds Index. The fund, however, outperformed its combined index portfolio, a custom benchmark composed of indexes that represent the asset classes in which the fund invests.
What factors influenced the fund’s performance?
The fund’s benchmark—the Russell 3000 Index—tracks the performance of U.S.-traded stocks, while theSpectrum Growth Fund invests in both U.S. and international equities. While global equities posted double-digit gains during the reporting period, the fund’s exposure to international and emerging markets stocks, which underperformed U.S. stocks, was the top detractor relative to the benchmark. The inclusion of real assets equities also hurt relative results, as the sector trailed global equities.
Tactical decisions to overweight or underweight various asset classes marginally detracted. An overweight to international value stocks weighed on relative returns, as they lagged international growth equities. While valuations are compelling for international value stocks, we moved to underweight over the period as slowing global growth could be a headwind for international value stocks. An overweight to U.S. mid-cap growth equities, which outpaced U.S. mid-cap value stocks, proved beneficial.
Overall, security selection in our underlying funds was positive. Results were particularly strong in our U.S. small-cap, emerging markets, developed international value, and U.S. large-cap value equity allocations. However, stock selection in the U.S. mid-cap value and U.S. large-cap growth equity portfolios detracted from relative results.
How is the fund positioned?
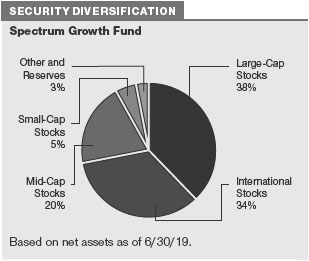
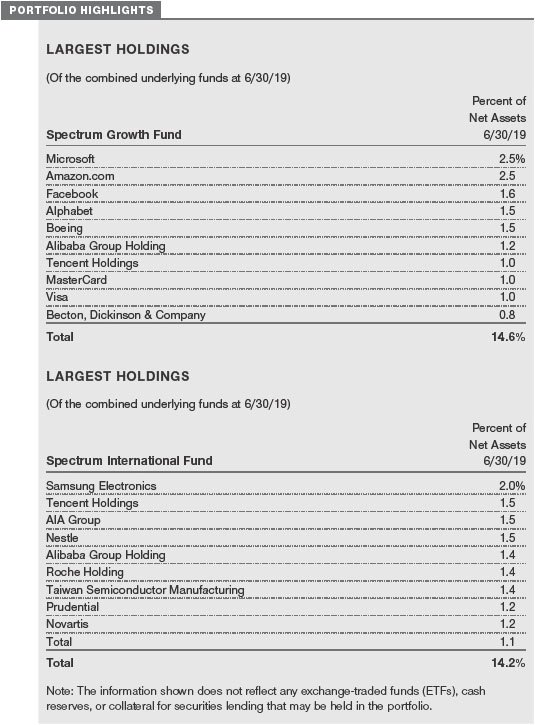
The Spectrum Growth Fund invests in several underlying T. Rowe Price funds that focus on U.S. and international equities across the full range of market capitalizations and style, as well as in emerging markets.
During the period, we reduced our underweight to U.S. equities and trimmed our overweight to international equity markets. In our view, the U.S. market is less vulnerable to fading global economic growth, but diminishing earnings growth, prolonged tradeuncertainty, and elevated valuations pose headwinds. While international equities have attractive valuations, trade risks and softening economic growth trajectories could present challenges.
We favor U.S. growth stocks relative to U.S. value stocks. Although the technology sector is vulnerable to potentially tighter regulation and supply chain disruptions due to unresolved trade tensions, we believe thatsecular growth companies may still benefit in a slowing economic environment. On the other hand, U.S. value stocks are cheaper, but they lack a catalyst to advance. We are overweight U.S. small-cap stocks relative to U.S. large-caps. With their domestic focus, small-cap stocks were early beneficiaries from trade-related concerns, but we recognize that they are not immune to other headwinds that have also weighed on large-cap stocks, including a possible shift toward risk-off sentiment and supply disruptions.
Among international equities, we prefer growth stocks over value stocks. Slowing global growth presents a headwind for international value stocks, and valuations for international growth stocks have moderated and are now in line with history. Value stocks outside the U.S. are cheaper but face pressure from persistently low interest rates and softer economic growth, given their cyclical orientation. Trade disputes, a resurgence in political uncertainty, and fundamental weakness among European financials—a key barometer of the value sector—also pose headwinds.
We are overweight emerging markets equities, which offer compelling valuations supported by rising consumption, lower interest rates in developed markets, and softer U.S. dollar expectations. With many developing countries less reliant on U.S. dollar funding than in the past, idiosyncratic and political risks are unlikely to become a widespread crisis across the asset class.
We continue to be underweight inflation-sensitive real assets equities because we expect slower global growth in the near term and longer-term imbalances between energy supply and demand.
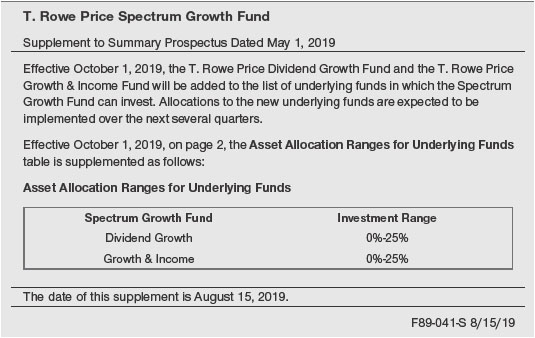
We will be introducing two new U.S. equity strategies to the Spectrum Growth Fund investment lineup—the T. Rowe Price Growth & Income Fund and the Dividend Growth Fund. These new allocations will be funded from both U.S. and international equities and will result in a higher allocation to U.S. equities and a lower allocation to international equities. The Spectrum Growth Fund is predominantly a U.S. equity strategy and is part of a suite of Spectrum Funds, which also include the Spectrum Income Fund and Spectrum International Fund. The three Spectrum Funds can be combined to achieve an investor’s desired exposure to stocks and bonds, as well as U.S. and international equities.
As we implement this enhancement in the Spectrum Growth Fund, there will be a comparable transition in the fund’s combined index portfolio from 70% Russell 3000 Index and 30% MSCI All-Country World ex-USA IMI to 85% Russell 3000 Index and 15% MSCI All-Country World ex-USA IMI. Additionally, with the higher allocation to U.S. equities, the Spectrum Growth Fund’s geographic investment profile will be more similar to the Russell 3000 Index and the Lipper Multi-Cap Core Funds Index of peer strategies. The change will be initiated around October 1, 2019, and the transition is expected to occur over several quarters.
SPECTRUM INCOME FUND
INVESTMENT OBJECTIVE
The fund seeks a high level of current income with moderate share price fluctuation.
FUND COMMENTARY
How did the fund perform in the past six months?
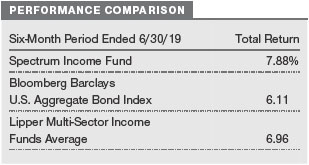
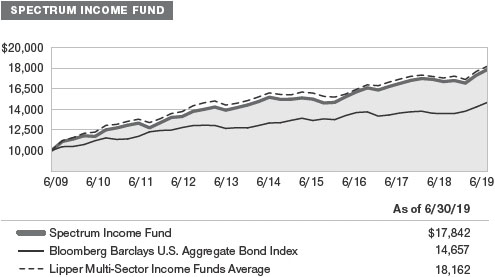
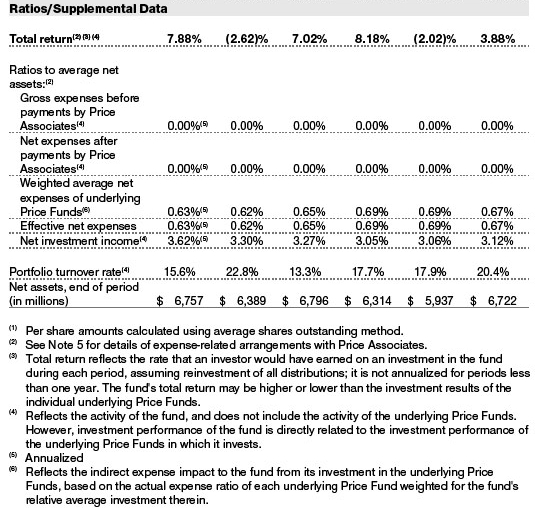
The Spectrum Income Fund returned 7.88% for the six-month period ended June 30, 2019. The fund outperformed the Bloomberg Barclays U.S. Aggregate Bond Index and the Lipper Multi-Sector Income Funds Average.
What factors influenced the fund’s performance?
Exposure to sectors and asset classes that are not included in the fund’s benchmark drove relative outperformance. The inclusion of U.S. dividend-paying equities, which significantly outperformed fixed income securities, contributed the most torelative returns. Despite marked volatility in the second half of the reporting period, U.S. equities posted their best start to the year since 1997 and the fund’s exposure to the equity sector proved beneficial. Within fixed income diversifiers, high yield bonds and dollar-denominated emerging markets bonds outpaced U.S. investment-grade issues and added value. However, an allocation to the absolute return-oriented fixed income strategy hurt relative results.
Security selection and tactical allocation decisions marginally detracted from relative performance. Positive selection within investment-grade bonds, nondollar bonds, and emerging markets bonds was offset by the U.S. dividend-paying equity strategy, which trailed its style-specific benchmark despite posting strong absolute returns. An underweight allocation to these equities relative to fixed income securities also weighed on results, but an underweight to nondollar bonds, which lagged U.S. investment-grade bonds, helped to counter the negative impact.
How is the fund positioned?
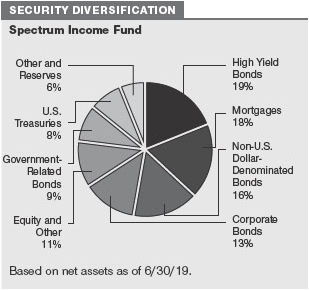
The Spectrum Income Fund invests primarily in fixed income securities through a diversified mix of U.S. and international T. Rowe Price mutual funds. Underlying investments also include a fund focused on dividend-paying U.S. large-cap stocks.
We are underweight to U.S. investment-grade bonds as their yields are expected to remain low for the near future, given the Fed’s accommodative stance. A sharp sell-off in risk assets late in 2018 created attractive opportunities to add to our high yield exposure. The yield carry on high yield bonds is attractive,and the sector is supported by broadly positive corporate fundamentals and low default expectations. We are neutral to floating rate bank loans, which have become less attractive in a declining interest rate environment.
We are underweight international bonds. Developed markets investment-grade bonds outside the U.S. have a less attractive outlook due to their relatively extended duration (a measure of a bond’s sensitivity to interest rate changes). While the Fedseems poised to cut interest rates in 2019, persistent risks are likely to stoke investor demand for safe-haven assets, which would provide a tailwind that should stabilize the U.S. dollar relative to major currencies.
We are overweight to both U.S. dollar-denominated and local currency emerging markets bonds. Yields remain attractive, but heightened political uncertainty and idiosyncratic risks in key markets could dampen returns. Lower U.S. economic growth and the potential for Fed rate cuts could lead to a stable or softer U.S. dollar, which may be supportive for emerging markets debt.
We scaled back our allocation to dividend-paying equities from a neutral position. Equity valuations are extended, and we anticipate greater market volatility, given persistent geopolitical and rising policy uncertainties.
As outlined in our last annual letter, we initiated an allocation to currency-hedged international bonds in the first quarter of 2019. These hedged bonds are less vulnerable to changes in currency valuations and, therefore, aregenerally less volatile than unhedged bonds. Depending on the relative interest rate environment, there may be a cost or benefit associated with hedging the currency. The allocation is being implemented in the Spectrum Income Fund in an effort to reduce overall portfolio risk and improve the fund’s risk/return profile.
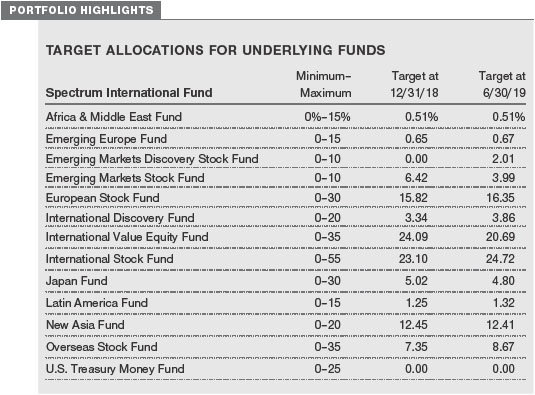
SPECTRUM INTERNATIONAL FUND
INVESTMENT OBJECTIVE
The fund seeks long-term capital appreciation.
FUND COMMENTARY
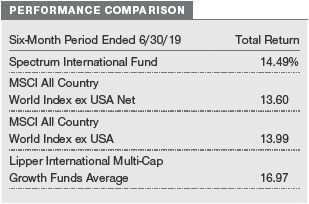
How did the fund perform in the past six months?
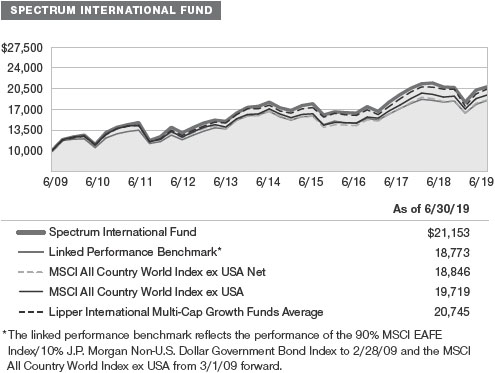
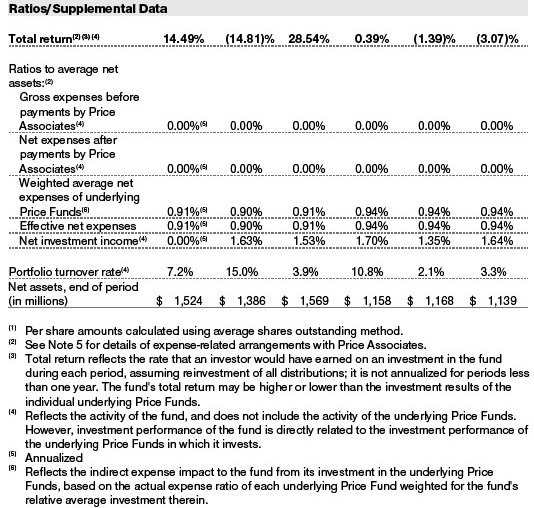
The Spectrum International Fund returned 14.49% for the six-month period ended June 30, 2019. The fund outperformed its benchmark, the MSCI All Country World Index ex USA Net, and the MSCI All Country World Index ex USA but lagged the Lipper International Multi-Cap Growth Funds Average.
Effective June 1, 2019, the MSCI All Country World Index ex USA Net became the fund’s primary benchmark. The new index assumes the reinvestment of dividends after the deduction of withholding taxes applicable to the country where the dividend is paid; as such, the returns of the new benchmark are more representative of the returns experienced by investors in foreign issuers.
What factors influenced the fund’s performance?
Strong security selection within several underlying strategies drove relative outperformance. The NewAsia Fund, which invests in Asian companies (excluding Japan), and the International Value Equity Fund were the top contributors to relative returns. Stocks in the consumer staples, financials, and health care sectors posted strong gains and meaningfully contributed to results across multiple portfolios. On a regional basis, holdings in Pacific Asia and Japan were among the bestperformers. While moderating global growth and the unresolved U.S-China trade dispute have weighed on export-driven economies outside the U.S., accommodative monetary policy and a dovish stance from key central banks have supported global equity markets. Countries in Europe, developed Asia-Pacific, and emerging markets are also indirectly benefiting from China’s stimulus measures to spur domestic demand.
Conversely, security selection in the Overseas Stock Fund—which invests in developed international core equities—detracted from relative performance. Within the fund, stocks in the consumer discretionary and industrials and business services sectors were notable laggards. The International Stock Fund also weighed on relative returns, particularly names in the communication services and energy sectors.
How is the fund positioned?
The Spectrum International Fund offers investors broadly diversified exposure to international equities in developed and emerging markets.
We are overweight emerging markets equities, which offer compelling valuations supported by rising consumption, lower interest rates in developed markets, and softer U.S. dollar expectations. With many developing countries less reliant on U.S. dollarfunding than in the past, idiosyncratic and political risks are unlikely to become more widespread.
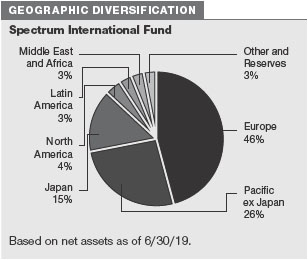
Among developed markets, we remain neutral to Japanese equities. While valuations remain attractive and monetary policy is a tailwind, Japan’s dependence on global trade could prove detrimental as global growth momentum fades and trade tensions linger. We are neutral to Europe. The regionmay benefit from still-supportive monetary policies and higher operating leverage; however, stress on European banks resulting from low interest rates, rising trade protectionism, and Brexit-related political uncertainty pose significant risks.
We prefer international growth stocks over international value stocks. Slowing global growth presents a headwind to the international value sector, and valuations for growth stocks have also moderated and are now in line with history. Value stocks outside the U.S. are cheaper but face pressure from persistently low interest rates and softer economic growth, given their cyclical orientation. Trade disputes, a resurgence in political uncertainty, and fundamental weakness among European financials—a key sector for value investors—also pose headwinds.
What is portfolio management’s outlook?
Risk assets recorded a strong start to 2019 as many fears that led to the late-2018 sell-off receded. Despite some volatility driven by the resurgence of U.S.-China trade tensions and a moderating outlook for global growth, the Fed’s dovish pivot and overall optimism helped to fuel an equity market rally. With the tailwind from U.S. fiscal stimulus fading, the anticipated boost to long-term growth through capital expenditure has failed to materialize as uncertainty has discouraged spending. In Europe, monetary policy remains supportive with an accommodative European Central Bank; however, unresolved Brexit negotiations and the region’s vulnerability to trade risks and China’s slowing economy pose potential headwinds. China’s stimulus measures (though domestically focused) and a more stable U.S. dollar should help support emerging markets economies.
The shift in Fed policy and a broader easing of financial and liquidity conditions have reduced the near-term likelihood of a recession, but the accommodative stance leaves global central banks ill-equipped to respond to a more pronounced downturn. While a step back from tightening policies may help to stabilize global growth, it is unlikely that it will be sufficient to ignite an economic reacceleration. Near-term risks to global markets include repercussions from potential monetary policy missteps and an escalation in trade tensions.
In our view, recent flare-ups in volatility coupled with above-average valuations in many asset classes—against a backdrop filled with geopolitical and monetary policy risks—underscore the value of our strategic investment approach. Given the confluence of positive and negative forces that can drive global financial markets, we believe that the Spectrum Funds’ broad diversification across asset classes, investment styles, and geography, combined with T. Rowe Price’s strengths in fundamental research, are conducive to generating attractive risk-adjusted returns over time in a variety of market environments.
The views expressed reflect the opinions of T. Rowe Price as of the date of this report and are subject to change based on changes in market, economic, or other conditions. These views are not intended to be a forecast of future events and are no guarantee of future results.
RISKS OF INVESTING
As with all stock and bond mutual funds, each fund’s share price can fall because of weakness in the stock or bond markets, a particular industry, or specific holdings. Stock markets can decline for many reasons, including adverse political or economic developments, changes in investor psychology, or heavy institutional selling. The prospects for an industry or company may deteriorate because of a variety of factors, including disappointing earnings or changes in the competitive environment. In addition, the investment manager’s assessment of companies held in a fund may prove incorrect, resulting in losses or poor performance even in rising markets.
Bonds are subject to interest rate risk, the decline in bond prices that usually accompanies a rise in interest rates, and credit risk, the chance that any fund holding could have its credit rating downgraded or that a bond issuer will default (fail to make timely payments of interest or principal), potentially reducing the fund’s income level and share price. High yield corporate bonds could have greater price declines than funds that invest primarily in high-quality bonds. Companies issuing high yield bonds are not as strong financially as those with higher credit ratings, so the bonds are usually considered speculative investments.
Funds that invest overseas may carry more risk than funds that invest strictly in U.S. assets. Risks can result from varying stages of economic and political development; differing regulatory environments, trading days, and accounting standards; and higher transaction costs of non-U.S. markets. Non-U.S. investments are also subject to currency risk, or a decline in the value of a foreign currency versus the U.S. dollar, which reduces the dollar value of securities denominated in that currency.
BENCHMARK INFORMATION
Combined Index Portfolio:An unmanaged blended index portfolio created as a custom benchmark for the Spectrum Growth Fund consisting of 70% Russell 3000 Index and 30% MSCI All Country World ex USA Investable Market Index.
Note: Bloomberg Index Services Ltd. Copyright © 2019, Bloomberg Index Services Ltd. Used with permission.
Note: Information has been obtained from sources believed to be reliable but J.P. Morgan does not warrant its completeness or accuracy. The index is used with permission. The index may not be copied, used, or distributed without J.P. Morgan’s prior written approval. Copyright 2019, J.P. Morgan Chase & Co. All rights reserved.
Note: MSCI makes no express or implied warranties or representations and shall have no liability whatsoever with respect to any MSCI data contained herein. The MSCI data may not be further redistributed or used as a basis for other indices or any securities or financial products. This report is not approved, reviewed, or produced by MSCI.
Note: Frank Russell Company (Russell) is the source and owner of the Russell index data contained or reflected in these materials and all trademarks andcopyrights related thereto. Russell® is a registered trademark of Russell. Russellis not responsible for the formatting or configuration of these materials or for any inaccuracy in T. Rowe Price Associates’ presentation thereof.
GROWTH OF $10,000
This chart shows the value of a hypothetical $10,000 investment in the fund over the past 10 fiscal year periods or since inception (for funds lacking 10-year records). The result is compared with benchmarks, which include a broad-based market index and may also include a peer group average or index. Market indexes do not include expenses, which are deducted from fund returns as well as mutual fund averages and indexes.
AVERAGE ANNUAL COMPOUND TOTAL RETURN
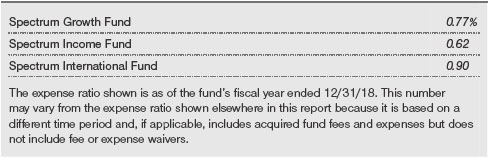
EXPENSE RATIO
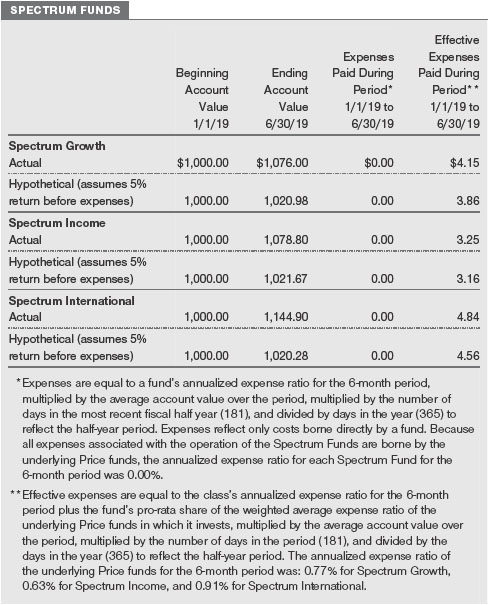
FUND EXPENSE EXAMPLE
As a mutual fund shareholder, you may incur two types of costs: (1) transaction costs, such as redemption fees or sales loads, and (2) ongoing costs, including management fees, distribution and service (12b-1) fees, and other fund expenses. The following example is intended to help you understand your ongoing costs (in dollars) of investing in the fund and to compare these costs with the ongoing costs of investing in other mutual funds. The example is based on an investment of $1,000 invested at the beginning of the most recent six-month period and held for the entire period.
Actual Expenses
The first line of the following table (Actual) provides information about actual account values and expenses based on the fund’s actual returns. You may use the information on this line, together with your account balance, to estimate the expenses that you paid over the period. Simply divide your account value by $1,000 (for example, an $8,600 account value divided by $1,000 = 8.6), then multiply the result by the number on the first line under the heading “Expenses Paid During Period” to estimate the expenses you paid on your account during this period.
Hypothetical Example for Comparison Purposes
The information on the second line of the table (Hypothetical) is based on hypothetical account values and expenses derived from the fund’s actual expense ratio and an assumed 5% per year rate of return before expenses (not the fund’s actual return). You may compare the ongoing costs of investing in the fund with other funds by contrasting this 5% hypothetical example and the 5% hypothetical examples that appear in the shareholder reports of the other funds. The hypothetical account values and expenses may not be used to estimate the actual ending account balance or expenses you paid for the period.
Note:T. Rowe Price charges an annual account service fee of $20, generally for accounts with less than $10,000. The fee is waived for any investor whose T. Rowe Price mutual fund accounts total $50,000 or more; accounts electing to receive electronic delivery of account statements, transaction confirmations, prospectuses, and shareholder reports; or accounts of an investor who is a T. Rowe Price Personal Services or Enhanced Personal Services client (enrollment in these programs generally requires T. Rowe Price assets of at least $250,000). This fee is not included in the accompanying table. If you are subject to the fee, keep it in mind when you are estimating the ongoing expenses of investing in the fund and when comparing the expenses of this fund with other funds.
You should also be aware that the expenses shown in the table highlight only your ongoing costs and do not reflect any transaction costs, such as redemption fees or sales loads. Therefore, the second line of the table is useful in comparing ongoing costs only and will not help you determine the relative total costs of owning different funds. To the extent a fund charges transaction costs, however, the total cost of owning that fund is higher.
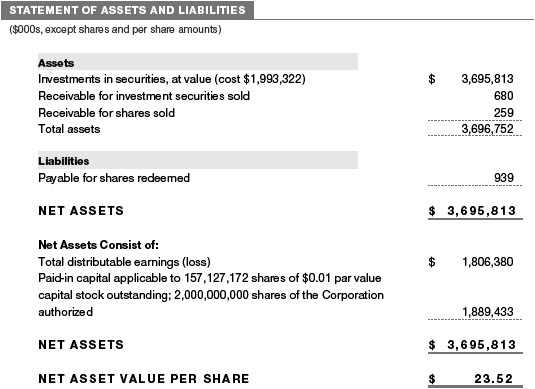
| T. ROWE PRICE SPECTRUM GROWTH FUND |
|
Unaudited
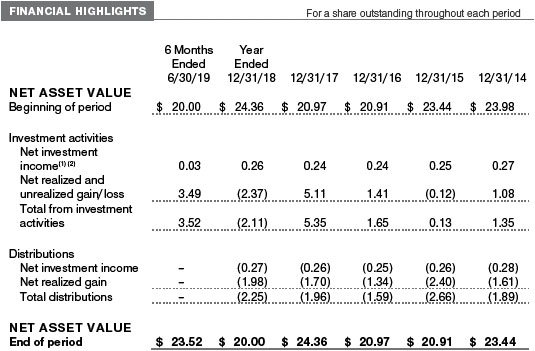

The accompanying notes are an integral part of these financial statements.
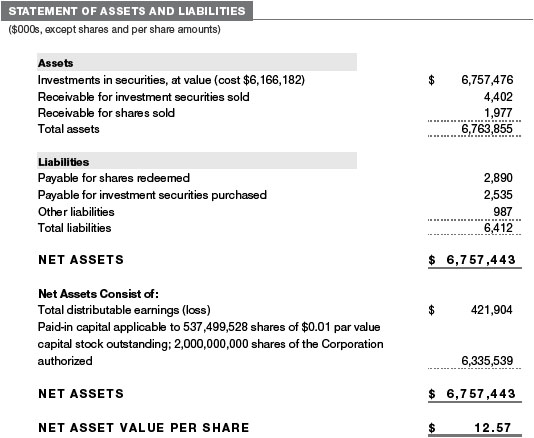
| T. ROWE PRICE SPECTRUM INCOME FUND |
|
Unaudited
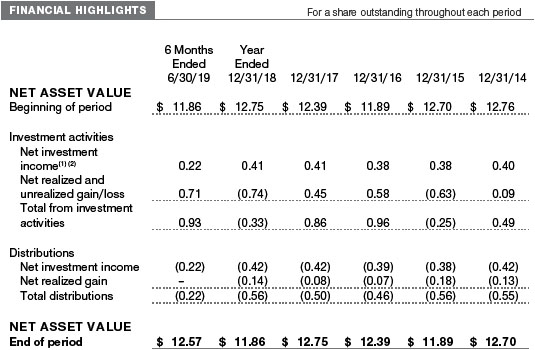
The accompanying notes are an integral part of these financial statements.
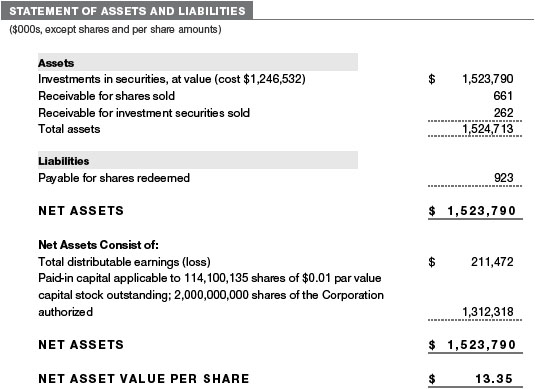
| T. ROWE PRICE SPECTRUM INTERNATIONAL FUND |
|
Unaudited
The accompanying notes are an integral part of these financial statements.
| T. ROWE PRICE SPECTRUM GROWTH FUND |
|
Unaudited
The accompanying notes are an integral part of these financial statements.
| T. ROWE PRICE SPECTRUM INCOME FUND |
|
Unaudited
The accompanying notes are an integral part of these financial statements.
| T. ROWE PRICE SPECTRUM INTERNATIONAL FUND |
|
Unaudited
The accompanying notes are an integral part of these financial statements.
| T. ROWE PRICE SPECTRUM FUNDS |
|
Unaudited
| NOTES TO FINANCIAL STATEMENTS |
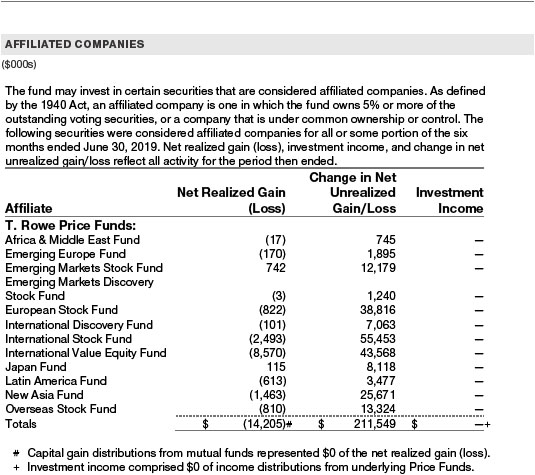
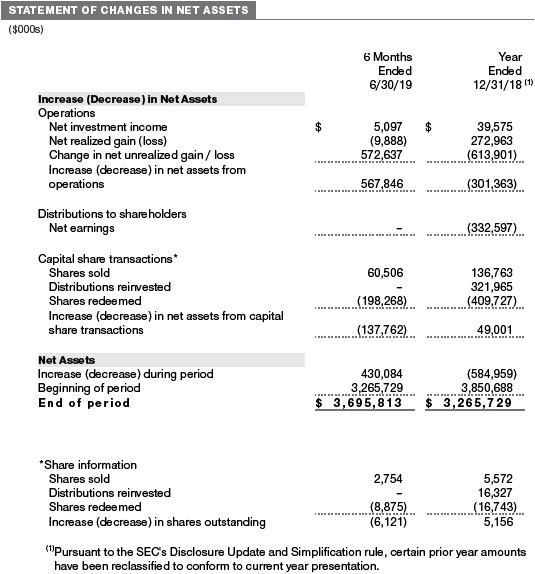
T. Rowe Price Spectrum Fund, Inc. (the corporation) is registered under the Investment Company Act of 1940 (the 1940 Act) as a diversified, open-end management investment company. Spectrum Growth Fund, Spectrum Income Fund, and Spectrum International Fund (collectively, the Spectrum Funds) are three portfolios established by the corporation.
Each Spectrum Fund broadly diversifies its assets within specified ranges among a set of T. Rowe Price mutual funds (underlying Price Funds) representing specific market segments. Spectrum Growth seeks long-term capital appreciation and growth of income with current income as a secondary objective. Spectrum Income seeks a high level of current income with moderate share price fluctuation. Spectrum International seeks long-term capital appreciation.
NOTE 1 - SIGNIFICANT ACCOUNTING POLICIES
Basis of PreparationEach fund is an investment company and follows accounting and reporting guidance in the Financial Accounting Standards BoardAccounting Standards CodificationTopic 946 (ASC 946). The accompanying financial statements were prepared in accordance with accounting principles generally accepted in the United States of America (GAAP), including, but not limited to, ASC 946. GAAP requires the use of estimates made by management. Management believes that estimates and valuations of the underlying Price Funds are appropriate; however, actual results may differ from those estimates, and the valuations reflected in the accompanying financial statements may differ from the value ultimately realized upon sale of the underlying Price Funds. Certain prior year amounts in the accompanying financial statements and financial highlights have been restated to conform to current year presentation.
Investment Transactions, Investment Income, and DistributionsPurchases and sales of the underlying Price Funds are accounted for on the trade date basis. Income is recorded on the accrual basis. Gains and losses realized on sales of the underlying Price Funds are reported on the identified cost basis. Income tax-related interest and penalties, if incurred, are recorded as income tax expense. Dividends received from underlying Price Fund investments are reflected as dividend income; capital gain distributions are reflected as realized gain/loss. Income and capital gain distributions from the underlying Price Funds are recorded on the ex-dividend date. Distributions to shareholders are recorded on the ex-dividend date. Income distributions are declared by Spectrum Income daily and paid monthly. Income distributions, if any, are declared and paid by Spectrum Growth and Spectrum International annually. A capital gain distribution may also be declared and paid by each fund annually.
Redemption FeesPrior to April 1, 2019, a 2% fee was assessed on redemptions of Spectrum International shares held for 90 days or less to deter short-term trading and to protect the interests of long-term shareholders. Redemption fees were withheld from proceeds that shareholders receive from the sale or exchange of fund shares and were paid to the fund. Redemption fees received by Spectrum International were allocated to each underlying Price Fund in proportion to the average daily value of its shares owned by the fund. Accordingly, redemption fees had no effect on the net assets of Spectrum International. The fees may have caused the redemption price per share to differ from the net asset value per share.
IndemnificationIn the normal course of business, the funds may provide indemnification in connection with their officers and directors, service providers and/or private company investments. Each fund’s maximum exposure under these arrangements is unknown; however, the risk of material loss is currently considered to be remote.
NOTE 2 - VALUATION
Each fund’s financial instruments are valued and its net asset value (NAV) per share is computed at the close of the New York Stock Exchange (NYSE), normally 4 p.m. ET, each day the NYSE is open for business. However, the NAV per share may be calculated at a time other than the normal close of the NYSE if trading on the NYSE is restricted, if the NYSE closes earlier, or as may be permitted by the SEC. Each fund’s financial instruments are reported at fair value, which GAAP defines as the price that would be received to sell an asset or paid to transfer a liability in an orderly transaction between market participants at the measurement date. Investments in the underlying Price Funds are valued at their closing NAV per share on the day of valuation. Assets and liabilities other than financial instruments, including short-term receivables and payables, are carried at cost, or estimated realizable value, if less, which approximates fair value.
The T. Rowe Price Valuation Committee (the Valuation Committee) is an internal committee that has been delegated certain responsibilities by the funds’ Board of Directors (the Board) to ensure that financial instruments are appropriately priced at fair value in accordance with GAAP and the 1940 Act. Subject to oversight by the Board, the Valuation Committee develops and oversees pricing-related policies and procedures and approves all fair value determinations. Specifically, the Valuation Committee establishes procedures to value securities; determines pricing techniques, sources, and persons eligible to effect fair value pricing actions; oversees the selection, services, and performance of pricing vendors; oversees valuation-related business continuity practices; and provides guidance on internal controls and valuation-related matters. The Valuation Committee reports to the Board and has representation from legal, portfolio management and trading, operations, risk management, and the funds’ treasurer.
Various valuation techniques and inputs are used to determine the fair value of financial instruments. GAAP establishes the following fair value hierarchy that categorizes the inputs used to measure fair value:
Level 1 – quoted prices (unadjusted) in active markets for identical financial instruments that the fund can access at the reporting date
Level 2 – inputs other than Level 1 quoted prices that are observable, either directly or indirectly (including, but not limited to, quoted prices for similar financial instruments in active markets, quoted prices for identical or similar financial instruments in inactive markets, interest rates and yield curves, implied volatilities, and credit spreads)
Level 3 – unobservable inputs
Observable inputs are developed using market data, such as publicly available information about actual events or transactions, and reflect the assumptions that market participants would use to price the financial instrument. Unobservable inputs are those for which market data are not available and are developed using the best information available about the assumptions that market participants would use to price the financial instrument. GAAP requires valuation techniques to maximize the use of relevant observable inputs and minimize the use of unobservable inputs. When multiple inputs are used to derive fair value, the financial instrument is assigned to the level within the fair value hierarchy based on the lowest-level input that is significant to the fair value of the financial instrument. Input levels are not necessarily an indication of the risk or liquidity associated with financial instruments at that level but rather the degree of judgment used in determining those values. On June 30, 2019, all of the investments in underlying Price Funds were classified as Level 1, based on the inputs used to determine their fair values.
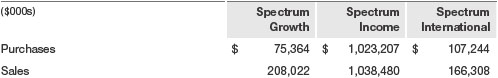
NOTE 3 - INVESTMENTS IN UNDERLYING PRICE FUNDS
Purchases and sales of the underlying Price Funds during the six months ended June 30, 2019, were as follows:
NOTE 4 - FEDERAL INCOME TAXES
No provision for federal income taxes is required since each fund intends to continue to qualify as a regulated investment company under Subchapter M of the Internal Revenue Code and distribute to shareholders all of its taxable income and gains. Distributions determined in accordance with federal income tax regulations may differ in amount or character from net investment income and realized gains for financial reporting purposes. Financial reporting records are adjusted for permanent book/tax differences to reflect tax character but are not adjusted for temporary differences. The amount and character of tax-basis distributions and composition of net assets are finalized at fiscal year-end; accordingly, tax-basis balances have not been determined as of the date of this report.
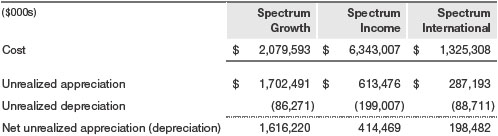
At June 30, 2019, the cost of investments for federal income tax purposes and net unrealized gain (loss) on investments was as follows:
NOTE 5 - RELATED PARTY TRANSACTIONS
The Spectrum Funds are managed by T. Rowe Price Associates, Inc. (Price Associates), a wholly owned subsidiary of T. Rowe Price Group, Inc. Price Associates, directly or through sub-advisory agreements with its wholly owned subsidiaries, also provides investment management services to all the underlying Price Funds. Pursuant to various service agreements, Price Associates and its wholly owned subsidiaries provide shareholder servicing and administrative services as well as certain accounting, marketing, and other services to the Spectrum Funds. Certain officers and directors of the Spectrum Funds are also officers and directors of Price Associates and its subsidiaries and of the underlying Price Funds.
The Spectrum Funds pay no management fees; however, Price Associates receives management fees from the underlying Price Funds. The Spectrum Funds operate in accordance with the investment management and special servicing agreements between and among the corporation, the underlying Price Funds, and Price Associates. Pursuant to these agreements, expenses associated with the operation of the Spectrum Funds are borne by each underlying Price Fund to the extent of estimated savings to it and in proportion to the average daily value of its shares owned by the Spectrum Funds. Therefore, each Spectrum Fund operates at a zero expense ratio. However, each Spectrum Fund indirectly bears its proportionate share of the management fees and operating costs of the underlying Price Funds in which it invests.
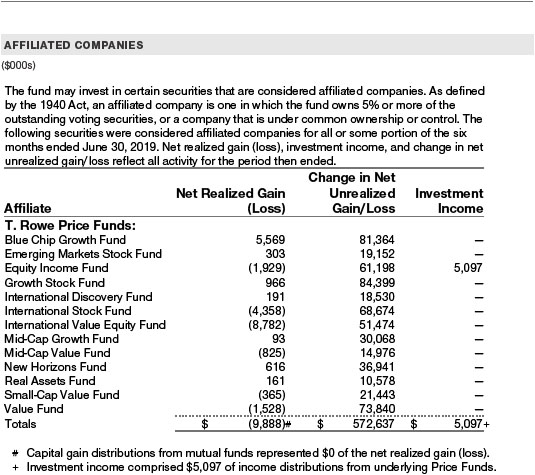
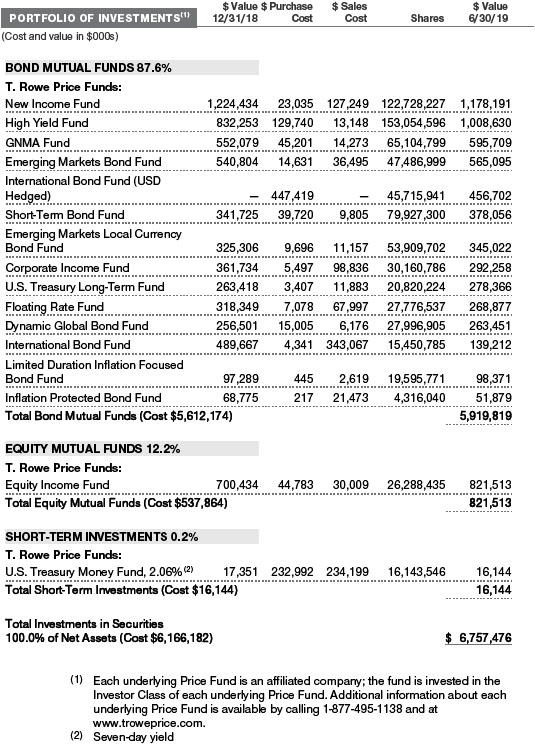
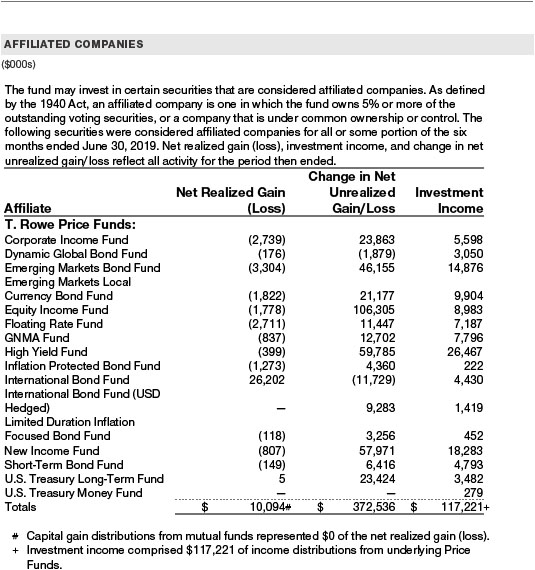
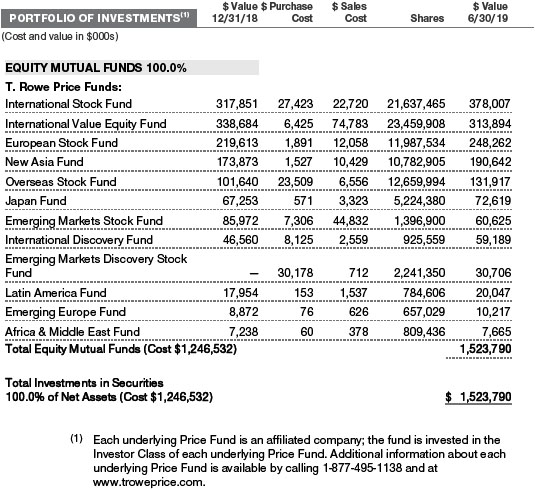
The Spectrum Funds do not invest in the underlying Price Funds for the purpose of exercising management or control; however, investments by the Spectrum Funds may represent a significant portion of an underlying Price Fund’s net assets. At June 30, 2019, Spectrum Growth held less than 25% of the outstanding shares of any underlying Price Fund; Spectrum International held approximately 28% of the outstanding shares of the Emerging Markets Discovery Stock Fund, 26% of the outstanding shares of the European Stock Fund, and less than 25% of any other underlying Price Fund; and Spectrum Income held approximately 43% of the outstanding shares of the Corporate Income Fund, 87% of the Emerging Markets Local Currency Bond Fund, 46% of the GNMA Fund, and less than 25% of any other underlying Price Fund.
Additionally, Spectrum Income Fund is one of several mutual funds in which certain college savings plans managed by Price Associates may invest. Shareholder servicing costs associated with each college savings plan are allocated to Spectrum Income Fund in proportion to the average daily value of its shares owned by the college savings plan and, in turn, are borne by the underlying Price Funds in accordance with the terms of the investment management and special servicing agreements. At June 30, 2019, approximately 38% of the outstanding shares of Spectrum Income Fund were held by the college savings plans.
As of June 30, 2019, T. Rowe Price Group, Inc., or its wholly owned subsidiaries owned 2,215,330 shares of the Spectrum Growth Fund, representing 1% of the fund’s net assets.
INFORMATION ON PROXY VOTING POLICIES, PROCEDURES, AND RECORDS
A description of the policies and procedures used by T. Rowe Price funds and portfolios to determine how to vote proxies relating to portfolio securities is available in each fund’s Statement of Additional Information. You may request this document by calling 1-800-225-5132 or by accessing the SEC’s website, sec.gov.
The description of our proxy voting policies and procedures is also available on our corporate website. To access it, please visit the following Web page:
https://www3.troweprice.com/usis/corporate/en/utility/policies.html
Scroll down to the section near the bottom of the page that says, “Proxy Voting Policies.” Click on the Proxy Voting Policies link in the shaded box.
Each fund’s most recent annual proxy voting record is available on our website and through the SEC’s website. To access it through T. Rowe Price, visit the website location shown above, and scroll down to the section near the bottom of the page that says, “Proxy Voting Records.” Click on the Proxy Voting Records link in the shaded box.
HOW TO OBTAIN QUARTERLY PORTFOLIO HOLDINGS
Effective for reporting periods on or after March 1, 2019, a fund, except a money market fund, files a complete schedule of portfolio holdings with the Securities and Exchange Commission (SEC) for the first and third quarters of each fiscal year as an exhibit to its reports on Form N-PORT. Prior to March 1, 2019, a fund, including a money market fund, filed a complete schedule of portfolio holdings with the SEC for the first and third quarters of each fiscal year on Form N-Q. A money market fund files detailed month-end portfolio holdings information on Form N-MFP with the SEC each month and posts a complete schedule of portfolio holdings on its website (troweprice.com) as of each month-end for the previous six months. A fund’s Forms N-PORT, N-MFP and N-Q are available electronically on the SEC’s website (sec.gov).
| T. ROWE PRICE SPECTRUM GROWTH FUND |
|
APPROVAL OF INVESTMENT MANAGEMENT AGREEMENT
Each year, the fund’s Board of Directors (Board) considers the continuation of the investment management agreement (Advisory Contract) between the fund and its investment advisor, T. Rowe Price Associates, Inc. (Advisor), as well as a Special Servicing Agreement among the fund, the Advisor, and each of the underlying funds in which it invests (Special Servicing Agreement). The Special Servicing Agreement allows the T. Rowe Price Spectrum Funds (Spectrum Funds) to pass through their operating expenses to the underlying funds in which they invest if the benefit to the underlying funds equals or exceeds the costs of absorbing these expenses, and provides that the Advisor will be responsible for bearing any expenses that would result from an underlying fund’s share of the aggregate expenses of the Spectrum Funds exceeding the estimated savings to the underlying fund from the operation of the Spectrum Funds. In that regard, at an in-person meeting held on March 11–12, 2019 (Meeting), the Board, including a majority of the fund’s independent directors, approved the continuation of the fund’s Advisory Contract and Special Servicing Agreement. At the Meeting, the Board considered the factors and reached the conclusions described below relating to the selection of the Advisor and approval of the Advisory Contract and the continuation of the Special Servicing Agreement. The independent directors were assisted in their evaluation of the Advisory Contract and Special Servicing Agreement by independent legal counsel from whom they received separate legal advice and with whom they met separately.
In providing information to the Board, the Advisor was guided by a detailed set of requests for information submitted by independent legal counsel on behalf of the independent directors. In considering and approving the Advisory Contract and Special Servicing Agreement, the Board considered the information it believed was relevant, including, but not limited to, the information discussed below. The Board considered not only the specific information presented in connection with the Meeting but also the knowledge gained over time through interaction with the Advisor about various topics. The Board meets regularly and, at each of its meetings, covers an extensive agenda of topics and materials and considers factors that are relevant to its annual consideration of the renewal of the T. Rowe Price funds’ advisory contracts, including performance and the services and support provided to the funds and their shareholders.
Services Provided by the Advisor
The Board considered the nature, quality, and extent of the services provided to the fund by the Advisor. These services included, but were not limited to, directing the fund’s investments in accordance with its investment program and the overall management of the fund’s portfolio, as well as a variety of related activities such as financial, investment operations, and administrative services; compliance; maintaining the fund’s records and registrations; and shareholder communications. The Board also reviewed the background and experience of the Advisor’s senior management team and investment personnel involved in the management of the fund, as well as the Advisor’s compliance record. The Board concluded that it was satisfied with the nature, quality, and extent of the services provided by the Advisor.
Investment Performance of the Fund
The Board took into account discussions with the Advisor and reports that it receives throughout the year relating to fund performance. In connection with the Meeting, the Board reviewed the fund’s net annualized total returns for the 1-, 2-, 3-, 4-, 5-, and 10-year periods as of September 30, 2018, and compared these returns with the performance of a peer group of funds with similar investment programs and a wide variety of other previously agreed-upon comparable performance measures and market data, including those supplied by Broadridge, which is an independent provider of mutual fund data.
On the basis of this evaluation and the Board’s ongoing review of investment results, and factoring in the relative market conditions during certain of the performance periods, the Board concluded that the fund’s performance was satisfactory.
Costs, Benefits, Profits, and Economies of Scale
The Advisor does not receive management fees from the fund, and operating expenses of the fund are borne by the underlying T. Rowe Price funds in which it invests pursuant to the Special Servicing Agreement. In connection with its review of the Special Servicing Agreement, the Board reviewed various cost/benefit analyses to demonstrate the benefits to the underlying funds versus the costs they incur, which illustrate that the primary benefit provided by the Spectrum Funds to the underlying funds is the reduction in expenses associated with the consolidation of shareholder accounts that would otherwise be invested directly in the underlying funds.
The Advisor receives management fees from other T. Rowe Price funds in which the fund invests. However, since the Advisor does not receive any management fees directly from the fund, the Board did not review information relating to revenues received by the Advisor under the Advisory Contract. The Board did review information regarding benefits that the Advisor (and its affiliates) may have realized from its relationship with the fund or other T. Rowe Price funds in which the fund invests, including any research received under “soft dollar” agreements and commission-sharing arrangements with broker-dealers. The Board considered that the Advisor may receive some benefit from its soft-dollar arrangements pursuant to which it receives research from broker-dealers that execute the applicable fund’s portfolio transactions. The Board also received information on the estimated costs incurred and profits realized by the Advisor and its affiliates from advising T. Rowe Price funds and concluded that the Advisor’s profits were reasonable. Although the Advisor does not receive management fees directly from the fund under the Advisory Contract, the fund’s shareholders benefit from potential economies of scale through a decline in the fund’s total expense ratio as the fund and underlying funds grow in size.
Fees and Expenses
The Board was provided with information regarding industry trends in management fees and expenses. Among other things, the Board reviewed data for peer groups that were compiled by Broadridge, which compared: (i) total expenses, actual management fees, and nonmanagement expenses of the fund with a group of competitor funds selected by Broadridge (Expense Group) and (ii) total expenses, actual management fees, and nonmanagement expenses of the fund with a broader set of funds within the Lipper investment classification (Expense Universe). The Board considered the fund’s actual management fee rate (which reflects that the Advisor does not receive any management fees directly from the fund), operating expenses, and total expenses (which reflect the net total expense ratio of the fund, including acquired fund fees and expenses associated with the underlying funds, after any waivers, reductions, or reimbursements) in comparison with the information for the Broadridge peer groups. Broadridge generally constructed the peer groups by seeking the most comparable funds based on similar investment classifications and objectives, expense structure, asset size, and operating components and attributes and ranked funds into quintiles, with the first quintile representing the funds with the lowest relative expenses and the fifth quintile representing the funds with the highest relative expenses. The information provided to the Board indicated that the fund’s actual management fee rate ranked in the first quintile (Expense Group and Expense Universe) and the fund’s total expenses ranked in the first quintile (Expense Group and Expense Universe).
The Board also reviewed the fee schedules for institutional accounts and private accounts with similar mandates that are advised or subadvised by the Advisor and its affiliates. Management provided the Board with information about the Advisor’s responsibilities and services provided to subadvisory and other institutional account clients, including information about how the requirements and economics of the institutional business are fundamentally different from those of the mutual fund business. The Board considered information showing that the Advisor’s mutual fund business is generally more complex from a business and compliance perspective than its institutional account business and considered various relevant factors, such as the broader scope of operations and oversight, more extensive shareholder communication infrastructure, greater asset flows, heightened business risks, and differences in applicable laws and regulations associated with the Advisor’s proprietary mutual fund business. In assessing the reasonableness of the fund’s management fee rate, the Board considered the differences in the nature of the services required for the Advisor to manage its mutual fund business versus managing a discrete pool of assets as a subadvisor to another institution’s mutual fund or for an institutional account and that the Advisor generally performs significant additional services and assumes greater risk in managing the fund and other T. Rowe Price funds than it does for institutional account clients.
On the basis of the information provided and the factors considered, the Board concluded that the fees paid by the fund under the Advisory Contract are reasonable.
Approval of the Advisory Contract and Special Servicing Agreement
As noted, the Board approved the continuation of the Advisory Contract as well as the Special Servicing Agreement. No single factor was considered in isolation or to be determinative to the decision. Rather, the Board concluded, in light of a weighting and balancing of all factors considered, that it was in the best interests of the fund and its shareholders for the Board to approve the continuation of the Advisory Contract, and that there is a reasonable basis to conclude that the benefits to the underlying funds exceed the costs they incur and that it was in the best interests of the fund and its underlying funds to approve continuation of the Special Servicing Agreement.
| T. ROWE PRICE SPECTRUM INCOME FUND |
|
APPROVAL OF INVESTMENT MANAGEMENT AGREEMENT
Each year, the fund’s Board of Directors (Board) considers the continuation of the investment management agreement (Advisory Contract) between the fund and its investment advisor, T. Rowe Price Associates, Inc. (Advisor), as well as a Special Servicing Agreement among the fund, the Advisor, and each of the underlying funds in which it invests (Special Servicing Agreement). The Special Servicing Agreement allows the T. Rowe Price Spectrum Funds (Spectrum Funds) to pass through their operating expenses to the underlying funds in which they invest if the benefit to the underlying funds equals or exceeds the costs of absorbing these expenses, and provides that the Advisor will be responsible for bearing any expenses that would result from an underlying fund’s share of the aggregate expenses of the Spectrum Funds exceeding the estimated savings to the underlying fund from the operation of the Spectrum Funds. In that regard, at an in-person meeting held on March 11–12, 2019 (Meeting), the Board, including a majority of the fund’s independent directors, approved the continuation of the fund’s Advisory Contract and Special Servicing Agreement. At the Meeting, the Board considered the factors and reached the conclusions described below relating to the selection of the Advisor and approval of the Advisory Contract and the continuation of the Special Servicing Agreement. The independent directors were assisted in their evaluation of the Advisory Contract and Special Servicing Agreement by independent legal counsel from whom they received separate legal advice and with whom they met separately.
In providing information to the Board, the Advisor was guided by a detailed set of requests for information submitted by independent legal counsel on behalf of the independent directors. In considering and approving the Advisory Contract and Special Servicing Agreement, the Board considered the information it believed was relevant, including, but not limited to, the information discussed below. The Board considered not only the specific information presented in connection with the Meeting but also the knowledge gained over time through interaction with the Advisor about various topics. The Board meets regularly and, at each of its meetings, covers an extensive agenda of topics and materials and considers factors that are relevant to its annual consideration of the renewal of the T. Rowe Price funds’ advisory contracts, including performance and the services and support provided to the funds and their shareholders.
Services Provided by the Advisor
The Board considered the nature, quality, and extent of the services provided to the fund by the Advisor. These services included, but were not limited to, directing the fund’s investments in accordance with its investment program and the overall management of the fund’s portfolio, as well as a variety of related activities such as financial, investment operations, and administrative services; compliance; maintaining the fund’s records and registrations; and shareholder communications. The Board also reviewed the background and experience of the Advisor’s senior management team and investment personnel involved in the management of the fund, as well as the Advisor’s compliance record. The Board concluded that it was satisfied with the nature, quality, and extent of the services provided by the Advisor.
Investment Performance of the Fund
The Board took into account discussions with the Advisor and reports that it receives throughout the year relating to fund performance. In connection with the Meeting, the Board reviewed the fund’s net annualized total returns for the 1-, 2-, 3-, 4-, 5-, and 10-year periods as of September 30, 2018, and compared these returns with the performance of a peer group of funds with similar investment programs and a wide variety of other previously agreed-upon comparable performance measures and market data, including those supplied by Broadridge, which is an independent provider of mutual fund data.
On the basis of this evaluation and the Board’s ongoing review of investment results, and factoring in the relative market conditions during certain of the performance periods, the Board concluded that the fund’s performance was satisfactory.
Costs, Benefits, Profits, and Economies of Scale
The Advisor does not receive management fees from the fund, and operating expenses of the fund are borne by the underlying T. Rowe Price funds in which it invests pursuant to the Special Servicing Agreement. In connection with its review of the Special Servicing Agreement, the Board reviewed various cost/benefit analyses to demonstrate the benefits to the underlying funds versus the costs they incur, which illustrate that the primary benefit provided by the Spectrum Funds to the underlying funds is the reduction in expenses associated with the consolidation of shareholder accounts that would otherwise be invested directly in the underlying funds.
The Advisor receives management fees from other T. Rowe Price funds in which the fund invests. However, since the Advisor does not receive any management fees directly from the fund, the Board did not review information relating to revenues received by the Advisor under the Advisory Contract. The Board did review information regarding benefits that the Advisor (and its affiliates) may have realized from its relationship with the fund or other T. Rowe Price funds in which the fund invests, including any research received under “soft dollar” agreements and commission-sharing arrangements with broker-dealers. The Board considered that the Advisor may receive some benefit from its soft-dollar arrangements pursuant to which it receives research from broker-dealers that execute the applicable fund’s portfolio transactions. The Board also received information on the estimated costs incurred and profits realized by the Advisor and its affiliates from advising T. Rowe Price funds and concluded that the Advisor’s profits were reasonable. Although the Advisor does not receive management fees directly from the fund under the Advisory Contract, the fund’s shareholders benefit from potential economies of scale through a decline in the fund’s total expense ratio as the fund and underlying funds grow in size.
Fees and Expenses
The Board was provided with information regarding industry trends in management fees and expenses. Among other things, the Board reviewed data for peer groups that were compiled by Broadridge, which compared: (i) total expenses, actual management fees, and nonmanagement expenses of the fund with a group of competitor funds selected by Broadridge (Expense Group) and (ii) total expenses, actual management fees, and nonmanagement expenses of the fund with a broader set of funds within the Lipper investment classification (Expense Universe). The Board considered the fund’s actual management fee rate (which reflects that the Advisor does not receive any management fees directly from the fund), operating expenses, and total expenses (which reflect the net total expense ratio of the fund, including acquired fund fees and expenses associated with the underlying funds, after any waivers, reductions, or reimbursements) in comparison with the information for the Broadridge peer groups. Broadridge generally constructed the peer groups by seeking the most comparable funds based on similar investment classifications and objectives, expense structure, asset size, and operating components and attributes and ranked funds into quintiles, with the first quintile representing the funds with the lowest relative expenses and the fifth quintile representing the funds with the highest relative expenses. However, there were not sufficient comparable funds to meaningfully rank within quintiles. For the Expense Group, the information provided to the Board indicated that the fund’s actual management fee rate and total expenses both ranked first out of three funds. For the Expense Universe, the information provided to the Board indicated that the fund’s actual management fee rate ranked first out of five funds and the fund’s total expenses ranked first out of five funds and second out of five funds.
The Board also reviewed the fee schedules for institutional accounts and private accounts with similar mandates that are advised or subadvised by the Advisor and its affiliates. Management provided the Board with information about the Advisor’s responsibilities and services provided to subadvisory and other institutional account clients, including information about how the requirements and economics of the institutional business are fundamentally different from those of the mutual fund business. The Board considered information showing that the Advisor’s mutual fund business is generally more complex from a business and compliance perspective than its institutional account business and considered various relevant factors, such as the broader scope of operations and oversight, more extensive shareholder communication infrastructure, greater asset flows, heightened business risks, and differences in applicable laws and regulations associated with the Advisor’s proprietary mutual fund business. In assessing the reasonableness of the fund’s management fee rate, the Board considered the differences in the nature of the services required for the Advisor to manage its mutual fund business versus managing a discrete pool of assets as a subadvisor to another institution’s mutual fund or for an institutional account and that the Advisor generally performs significant additional services and assumes greater risk in managing the fund and other T. Rowe Price funds than it does for institutional account clients.
On the basis of the information provided and the factors considered, the Board concluded that the fees paid by the fund under the Advisory Contract are reasonable.
Approval of the Advisory Contract and Special Servicing Agreement
As noted, the Board approved the continuation of the Advisory Contract as well as the Special Servicing Agreement. No single factor was considered in isolation or to be determinative to the decision. Rather, the Board concluded, in light of a weighting and balancing of all factors considered, that it was in the best interests of the fund and its shareholders for the Board to approve the continuation of the Advisory Contract, and that there is a reasonable basis to conclude that the benefits to the underlying funds exceed the costs they incur and that it was in the best interests of the fund and its underlying funds to approve continuation of the Special Servicing Agreement.
| T. ROWE PRICE SPECTRUM INTERNATIONAL FUND |
|
APPROVAL OF INVESTMENT MANAGEMENT AGREEMENT
Each year, the fund’s Board of Directors (Board) considers the continuation of the investment management agreement (Advisory Contract) between the fund and its investment advisor, T. Rowe Price Associates, Inc. (Advisor), as well as a Special Servicing Agreement among the fund, the Advisor, and each of the underlying funds in which it invests (Special Servicing Agreement). The Special Servicing Agreement allows the T. Rowe Price Spectrum Funds (Spectrum Funds) to pass through their operating expenses to the underlying funds in which they invest if the benefit to the underlying funds equals or exceeds the costs of absorbing these expenses, and provides that the Advisor will be responsible for bearing any expenses that would result from an underlying fund’s share of the aggregate expenses of the Spectrum Funds exceeding the estimated savings to the underlying fund from the operation of the Spectrum Funds. In that regard, at an in-person meeting held on March 11–12, 2019 (Meeting), the Board, including a majority of the fund’s independent directors, approved the continuation of the fund’s Advisory Contract and Special Servicing Agreement. At the Meeting, the Board considered the factors and reached the conclusions described below relating to the selection of the Advisor and approval of the Advisory Contract and the continuation of the Special Servicing Agreement. The independent directors were assisted in their evaluation of the Advisory Contract and Special Servicing Agreement by independent legal counsel from whom they received separate legal advice and with whom they met separately.
In providing information to the Board, the Advisor was guided by a detailed set of requests for information submitted by independent legal counsel on behalf of the independent directors. In considering and approving the Advisory Contract and Special Servicing Agreement, the Board considered the information it believed was relevant, including, but not limited to, the information discussed below. The Board considered not only the specific information presented in connection with the Meeting but also the knowledge gained over time through interaction with the Advisor about various topics. The Board meets regularly and, at each of its meetings, covers an extensive agenda of topics and materials and considers factors that are relevant to its annual consideration of the renewal of the T. Rowe Price funds’ advisory contracts, including performance and the services and support provided to the funds and their shareholders.
Services Provided by the Advisor
The Board considered the nature, quality, and extent of the services provided to the fund by the Advisor. These services included, but were not limited to, directing the fund’s investments in accordance with its investment program and the overall management of the fund’s portfolio, as well as a variety of related activities such as financial, investment operations, and administrative services; compliance; maintaining the fund’s records and registrations; and shareholder communications. The Board also reviewed the background and experience of the Advisor’s senior management team and investment personnel involved in the management of the fund, as well as the Advisor’s compliance record. The Board concluded that it was satisfied with the nature, quality, and extent of the services provided by the Advisor.
Investment Performance of the Fund
The Board took into account discussions with the Advisor and reports that it receives throughout the year relating to fund performance. In connection with the Meeting, the Board reviewed the fund’s net annualized total returns for the 1-, 2-, 3-, 4-, 5-, and 10-year periods as of September 30, 2018, and compared these returns with the performance of a peer group of funds with similar investment programs and a wide variety of other previously agreed-upon comparable performance measures and market data, including those supplied by Broadridge, which is an independent provider of mutual fund data.
On the basis of this evaluation and the Board’s ongoing review of investment results, and factoring in the relative market conditions during certain of the performance periods, the Board concluded that the fund’s performance was satisfactory.
Costs, Benefits, Profits, and Economies of Scale
The Advisor does not receive management fees from the fund, and operating expenses of the fund are borne by the underlying T. Rowe Price funds in which it invests pursuant to the Special Servicing Agreement. In connection with its review of the Special Servicing Agreement, the Board reviewed various cost/benefit analyses to demonstrate the benefits to the underlying funds versus the costs they incur, which illustrate that the primary benefit provided by the Spectrum Funds to the underlying funds is the reduction in expenses associated with the consolidation of shareholder accounts that would otherwise be invested directly in the underlying funds.
The Advisor receives management fees from other T. Rowe Price funds in which the fund invests. However, since the Advisor does not receive any management fees directly from the fund, the Board did not review information relating to revenues received by the Advisor under the Advisory Contract. The Board did review information regarding benefits that the Advisor (and its affiliates) may have realized from its relationship with the fund or other T. Rowe Price funds in which the fund invests, including any research received under “soft dollar” agreements and commission-sharing arrangements with broker-dealers. The Board considered that the Advisor may receive some benefit from its soft-dollar arrangements pursuant to which it receives research from broker-dealers that execute the applicable fund’s portfolio transactions. The Board also received information on the estimated costs incurred and profits realized by the Advisor and its affiliates from advising T. Rowe Price funds and concluded that the Advisor’s profits were reasonable. Although the Advisor does not receive management fees directly from the fund under the Advisory Contract, the fund’s shareholders benefit from potential economies of scale through a decline in the fund’s total expense ratio as the fund and underlying funds grow in size.
Fees and Expenses
The Board was provided with information regarding industry trends in management fees and expenses. Among other things, the Board reviewed data for peer groups that were compiled by Broadridge, which compared: (i) total expenses, actual management fees, and nonmanagement expenses of the fund with a group of competitor funds selected by Broadridge (Expense Group) and (ii) total expenses, actual management fees, and nonmanagement expenses of the fund with a broader set of funds within the Lipper investment classification (Expense Universe). The Board considered the fund’s actual management fee rate (which reflects that the Advisor does not receive any management fees directly from the fund), operating expenses, and total expenses (which reflect the net total expense ratio of the fund, including acquired fund fees and expenses associated with the underlying funds, after any waivers, reductions, or reimbursements) in comparison with the information for the Broadridge peer groups. Broadridge generally constructed the peer groups by seeking the most comparable funds based on similar investment classifications and objectives, expense structure, asset size, and operating components and attributes and ranked funds into quintiles, with the first quintile representing the funds with the lowest relative expenses and the fifth quintile representing the funds with the highest relative expenses. The information provided to the Board indicated that the fund’s actual management fee rate ranked in the first quintile (Expense Group and Expense Universe) and the fund’s total expenses ranked in the first quintile (Expense Group and Expense Universe).
The Board also reviewed the fee schedules for institutional accounts and private accounts with similar mandates that are advised or subadvised by the Advisor and its affiliates. Management provided the Board with information about the Advisor’s responsibilities and services provided to subadvisory and other institutional account clients, including information about how the requirements and economics of the institutional business are fundamentally different from those of the mutual fund business. The Board considered information showing that the Advisor’s mutual fund business is generally more complex from a business and compliance perspective than its institutional account business and considered various relevant factors, such as the broader scope of operations and oversight, more extensive shareholder communication infrastructure, greater asset flows, heightened business risks, and differences in applicable laws and regulations associated with the Advisor’s proprietary mutual fund business. In assessing the reasonableness of the fund’s management fee rate, the Board considered the differences in the nature of the services required for the Advisor to manage its mutual fund business versus managing a discrete pool of assets as a subadvisor to another institution’s mutual fund or for an institutional account and that the Advisor generally performs significant additional services and assumes greater risk in managing the fund and other T. Rowe Price funds than it does for institutional account clients.
On the basis of the information provided and the factors considered, the Board concluded that the fees paid by the fund under the Advisory Contract are reasonable.
Approval of the Advisory Contract and Special Servicing Agreement
As noted, the Board approved the continuation of the Advisory Contract as well as the Special Servicing Agreement. No single factor was considered in isolation or to be determinative to the decision. Rather, the Board concluded, in light of a weighting and balancing of all factors considered, that it was in the best interests of the fund and its shareholders for the Board to approve the continuation of the Advisory Contract, and that there is a reasonable basis to conclude that the benefits to the underlying funds exceed the costs they incur and that it was in the best interests of the fund and its underlying funds to approve continuation of the Special Servicing Agreement.
Item 1. (b) Notice pursuant to Rule 30e-3.
Not applicable.
Item 2. Code of Ethics.
A code of ethics, as defined in Item 2 of Form N-CSR, applicable to its principal executive officer, principal financial officer, principal accounting officer or controller, or persons performing similar functions is filed as an exhibit to the registrant’s annual Form N-CSR. No substantive amendments were approved or waivers were granted to this code of ethics during the registrant’s most recent fiscal half-year.
Item 3. Audit Committee Financial Expert.
Disclosure required in registrant’s annual Form N-CSR.
Item 4. Principal Accountant Fees and Services.
Disclosure required in registrant’s annual Form N-CSR.
Item 5. Audit Committee of Listed Registrants.
Not applicable.
Item 6. Investments.
(a) Not applicable. The complete schedule of investments is included in Item 1 of this Form N-CSR.
(b) Not applicable.
Item 7. Disclosure of Proxy Voting Policies and Procedures for Closed-End Management Investment Companies.
Not applicable.
Item 8. Portfolio Managers of Closed-End Management Investment Companies.
Not applicable.
Item 9. Purchases of Equity Securities by Closed-End Management Investment Company and Affiliated Purchasers.
Not applicable.
Item 10. Submission of Matters to a Vote of Security Holders.
Not applicable.
Item 11. Controls and Procedures.
(a) The registrant’s principal executive officer and principal financial officer have evaluated the registrant’s disclosure controls and procedures within 90 days of this filing and have concluded that the registrant’s disclosure controls and procedures were effective, as of that date, in ensuring that information required to be disclosed by the registrant in this Form N-CSR was recorded, processed, summarized, and reported timely.
(b) The registrant’s principal executive officer and principal financial officer are aware of no change in the registrant’s internal control over financial reporting that occurred during the period covered by this report that has materially affected, or is reasonably likely to materially affect, the registrant’s internal control over financial reporting.
Item 12. Disclosure of Securities Lending Activities for Closed-End Management Investment Companies.
Not applicable.
Item 13. Exhibits.
(a)(1) The registrant’s code of ethics pursuant to Item 2 of Form N-CSR is filed with the registrant’s annual Form N-CSR.
(2) Separate certifications by the registrant's principal executive officer and principal financial officer, pursuant to Section 302 of the Sarbanes-Oxley Act of 2002 and required by Rule 30a-2(a) under the Investment Company Act of 1940, are attached.
(3) Written solicitation to repurchase securities issued by closed-end companies: not applicable.
(b) A certification by the registrant's principal executive officer and principal financial officer, pursuant to Section 906 of the Sarbanes-Oxley Act of 2002 and required by Rule 30a-2(b) under the Investment Company Act of 1940, is attached.
SIGNATURES
Pursuant to the requirements of the Securities Exchange Act of 1934 and the Investment Company Act of 1940, the registrant has duly caused this report to be signed on its behalf by the undersigned, thereunto duly authorized.
T. Rowe Price Spectrum Fund, Inc.
| By | | /s/ David Oestreicher |
| | | David Oestreicher |
| | | Principal Executive Officer |
| |
| Date | | August 16, 2019 | | | | |
Pursuant to the requirements of the Securities Exchange Act of 1934 and the Investment Company Act of 1940, this report has been signed below by the following persons on behalf of the registrant and in the capacities and on the dates indicated.
| By | | /s/ David Oestreicher |
| | | David Oestreicher |
| | | Principal Executive Officer |
| |
| Date | | August 16, 2019 | | | | |
| |
| |
| By | | /s/ Catherine D. Mathews |
| | | Catherine D. Mathews |
| | | Principal Financial Officer |
| |
| Date | | August 16, 2019 | | | | |