UNITED STATES
SECURITIES AND EXCHANGE COMMISSION
Washington, D.C. 20549
FORM N-CSR
CERTIFIED SHAREHOLDER REPORT OF REGISTERED
MANAGEMENT INVESTMENT COMPANIES
Investment Company Act File Number: 811-04998
| T. Rowe Price Spectrum Fund, Inc. |
|
| (Exact name of registrant as specified in charter) |
| |
| 100 East Pratt Street, Baltimore, MD 21202 |
|
| (Address of principal executive offices) |
| |
| David Oestreicher |
| 100 East Pratt Street, Baltimore, MD 21202 |
|
| (Name and address of agent for service) |
Registrant’s telephone number, including area code: (410) 345-2000
Date of fiscal year end: December 31
Date of reporting period: June 30, 2020
Item 1. Reports to Shareholders
(a) Report pursuant to Rule 30e-1.
| Spectrum Funds | June 30, 2020 |
| PRSGX | Investor Class |
| RPSIX | Investor Class |
| PSILX | Investor Class |
Beginning on January 1, 2021, as permitted by SEC regulations, paper copies of the T. Rowe Price funds’ annual and semiannual shareholder reports will no longer be mailed, unless you specifically request them. Instead, shareholder reports will be made available on the funds’ website (troweprice.com/prospectus), and you will be notified by mail with a website link to access the reports each time a report is posted to the site.
If you already elected to receive reports electronically, you will not be affected by this change and need not take any action. At any time, shareholders who invest directly in T. Rowe Price funds may generally elect to receive reports or other communications electronically by enrolling at troweprice.com/paperless or, if you are a retirement plan sponsor or invest in the funds through a financial intermediary (such as an investment advisor, broker-dealer, insurance company, or bank), by contacting your representative or your financial intermediary.
You may elect to continue receiving paper copies of future shareholder reports free of charge. To do so, if you invest directly with T. Rowe Price, please call T. Rowe Price as follows: IRA, nonretirement account holders, and institutional investors, 1-800-225-5132; small business retirement accounts, 1-800-492-7670. If you are a retirement plan sponsor or invest in the T. Rowe Price funds through a financial intermediary, please contact your representative or financial intermediary or follow additional instructions if included with this document. Your election to receive paper copies of reports will apply to all funds held in your account with your financial intermediary or, if you invest directly in the T. Rowe Price funds, with T. Rowe Price. Your election can be changed at any time in the future.
| T. ROWE PRICE SPECTRUM FUNDS |
|
HIGHLIGHTS
| ■ | During the six-month period ended June 30, 2020, the Spectrum International Fund outperformed its benchmark, but the Spectrum Growth Fund and Spectrum Income Fund both lagged their benchmarks. The funds all underperformed their respective Lipper peer groups. |
| |
| ■ | Global markets started the year on a positive note given stabilizing growth and progress on U.S.-China trade negotiations. However, investor sentiment turned sharply negative as the coronavirus pandemic spread worldwide, although markets rebounded sharply in the second half of the reporting period. |
| |
| ■ | Strong security selection drove relative outperformance in the Spectrum International Fund. In the Spectrum Growth Fund and Spectrum Income Fund, exposure to diversifying sectors—especially during the first half of the reporting period—detracted from relative results. |
| |
| ■ | The aggressive measures taken by the Federal Reserve and other major central banks have helped to stem the impacts of the pandemic on the global economy. A resurgence of the coronavirus pandemic, policy implications from the looming U.S. election, and reemerging tensions between the U.S. and China could potentially derail a sustained recovery. |

Log in to your account at troweprice.com for more information.
*Certain mutual fund accounts that are assessed an annual account service fee can also save money by switching to e-delivery.
CIO Market Commentary
Dear Shareholder
Financial markets recorded widely mixed results during the first half of 2020 as the spread of the coronavirus disrupted global economies. Although stocks and bonds experienced extraordinary volatility, historic levels of fiscal and monetary stimulus helped mitigate the losses.
Market sentiment was positive as we entered the year, and the S&P 500 Index advanced to a record high on February 19. However, stocks began falling as the coronavirus spread in Italy and other countries outside China. The major indexes continued their slide as cases mounted in the U.S. and New York City became the epicenter of the pandemic. Governments throughout the world issued stay-at-home orders to contain the virus, and some sectors, such as travel, restaurants, and shopping malls, nearly came to a halt.
According to the National Bureau of Economic Research, a recession officially began in February, ending the longest expansion in U.S. history. Over 22 million Americans lost their jobs in March and April, and many measures of economic activity, including retail sales and industrial production, experienced record-setting declines. By March 23, the S&P 500 Index had fallen by about a third from the start of the year.
In response to the rapid economic contraction, global central banks took bold accommodative steps, and many governments around the world passed emergency spending packages. The Federal Reserve cut its short-term lending rate to near zero and began massive purchases of government and corporate bonds to stimulate the economy and supply liquidity in the fixed income market.
The federal government also provided trillions of dollars in fiscal help in the form of direct payments to many Americans, expanded unemployment insurance, and subsidies to sectors such as transportation and health care that had been directly impacted by the pandemic. As lockdowns eased late in the period, there were signs of economic recovery, especially in stronger-than-expected payroll data, but surges in new virus cases in some states remained a concern.
Boosted by the stimulus and indications that the economy was mending faster than many expected, nearly all sectors recouped some of their losses by the end of June, and some segments were back in positive territory. For the six-month period, the tech-heavy Nasdaq Composite Index reached record highs and easily outperformed other benchmarks as the pandemic appeared to accelerate trends in retail, social media, and content streaming that benefited the large technology platforms. Large- and mid-cap growth stocks also produced positive returns and outperformed small-caps and value shares, which lost ground.
The S&P 500 Index finished the period with modest losses overall. Within the benchmark, tech and consumer discretionary stocks rallied, but energy shares were down more than 35% (including dividends) amid tumbling oil prices, and the financials sector struggled in a low-yield environment. Non-U.S. equity markets were generally negative and lagged the U.S. benchmarks.
In the fixed income universe, Treasuries were the top performers as yields dropped to record lows during the period, and other U.S. investment-grade bonds were also generally positive. High yield and emerging markets bonds were particularly hard hit during the market sell-off in March, but the sectors staged a strong recovery as investors sought out higher-yielding securities. Emerging markets debt denominated in U.S. dollars outperformed local currency issues, as weakness in certain currencies weighed on local bond performance in U.S. dollar terms.
As we enter the second half of the year, we expect markets to remain volatile. The scale of the stimulus and the potential for medical breakthroughs create the potential for stocks to move higher, but much depends on the course of the virus. Rising tensions between the U.S. and China, social unrest, and the U.S. elections in November could also drive market performance.
Our investment teams will be carefully monitoring these developments, and I believe that our disciplined fundamental research and strategic investing approach will continue to serve our shareholders well in this uncertain environment.
Thank you for your continued confidence in T. Rowe Price.
Sincerely,

Robert Sharps
Group Chief Investment Officer
Management’s Discussion of Fund Performance
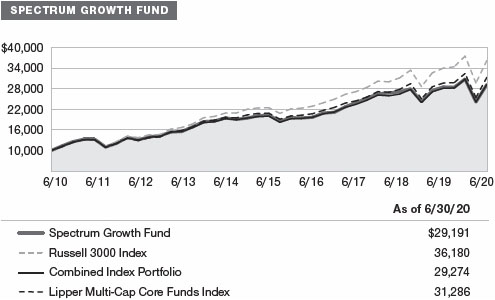
SPECTRUM GROWTH FUND
INVESTMENT OBJECTIVE
The fund seeks long-term capital appreciation and growth of income with current income a secondary objective.
FUND COMMENTARY
How did the fund perform in the past six months?
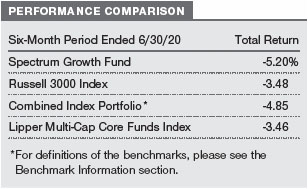
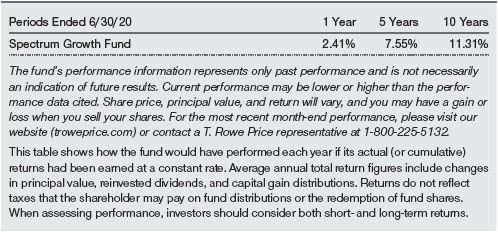
The Spectrum Growth Fund returned -5.20% for the six-month period ended June 30, 2020. The fund underperformed the Russell 3000 Index, the Lipper Multi-Cap Core Funds Index, and its combined index portfolio, a custom-weighted benchmark composed of indexes that represent the asset classes in which the fund invests. (Past performance cannot guarantee future results.)
What factors influenced the fund’s performance?
During the past six months, the Spectrum Growth Fund posted double-digit losses in the first quarter and then generated double-digit gains in the second quarter. Within the fund, exposure to asset classes that are not included in the fund’s benchmark detracted from relative performance, while security selection and tactical decisions added value.
Structurally, the inclusion of real assets equities weighed on relative results as they significantly underperformed global equities. Although commodities rebounded in the second quarter, pronounced losses early in the period—driven by demand shocks due to the coronavirus pandemic and an oil price war—were difficult to overcome. However, a favorable underweight to real assets helped to partly mitigate the negative impact.
Strong security selection contributed to relative performance as many of our underlying strategies outperformed their respective benchmarks. Most notably, our U.S. small-cap growth and international small-cap stock strategies meaningfully outpaced their benchmarks during both the sell-off and rally.
The positive contribution was, however, somewhat offset by underperformance in both dividend-focused large-cap equity strategies and the developed international growth stock allocation.
Tactical decisions to overweight or underweight various asset classes added value. As previously mentioned, the underweight allocation to real assets equities proved beneficial, as did an overweight to U.S. large-cap growth equities, which significantly outperformed U.S. large-cap value equites for the six-month period. Conversely, an overweight to international equities—which lagged U.S. stocks—weighed on relative performance.
How is the fund positioned?
The Spectrum Growth Fund invests in several underlying T. Rowe Price funds that focus on U.S. and international equities across the full range of market capitalizations and styles, as well as in emerging markets.
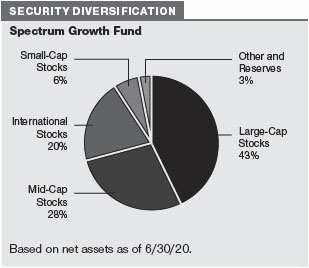
We shifted from an underweight to U.S. equities to a neutral position relative to international stocks, given the more uncertain global growth environment. The U.S. market has a more defensive sector profile, given higher exposure to the technology and communications sectors that have proven to be more resilient in the current environment. Outside the U.S., more cyclically oriented economies are beginning to show signs of life as economic activity rebounds from depressed levels, although the pandemic presents a persistent headwind to growth. Aggressive stimulus measures and the rebound in Chinese demand after coronavirus-related shutdowns could support international stocks.
We remain overweight to U.S. growth stocks over value stocks. Growth stocks are less sensitive to the broad macroeconomic environment, and the pandemic has accelerated secular growth trends in key industries. Value equities were hard-hit amid the sell-off, leaving their valuations more attractive should economic growth stabilize over the near term. We are overweight to U.S. small-cap equities as they have typically outperformed during recovery periods, but they are vulnerable to high debt levels. Larger companies may be better positioned to weather an economic downturn, but potential global supply chain disruption could be problematic.
Among international equities, we moved to a neutral allocation between growth stocks and value stocks. International growth stocks have benefited from their higher quality and defensive characteristics, but trade and supply chain disruptions are concerns. Despite their cheap valuations, international value stocks face headwinds given pandemic-related weakness, low interest rates, and commodities oversupply.
We are overweight to emerging markets stocks relative to developed market stocks as a weaker U.S. dollar could be broadly supportive. Emerging markets could also benefit from rebounding demand from China, although commodity-driven economies face challenges as prices are under pressure. However, many emerging markets countries may struggle to contain the coronavirus, and they have limited tools to support growth.
We continue to underweight real assets equities as inflation expectations remain low. Despite the recent rally in oil prices, storage capacity constraints, unfavorable supply dynamics, and still tepid demand for energy due to the pandemic could temper oil prices for a while. Further, real estate demand trends—especially for retail and office space—are also vulnerable to lingering impacts of the coronavirus.
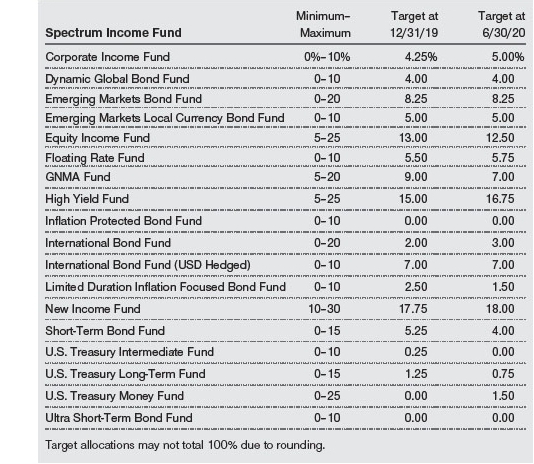
SPECTRUM INCOME FUND
INVESTMENT OBJECTIVE
The fund seeks a high level of current income with moderate share price fluctuation.
FUND COMMENTARY
How did the fund perform in the past six months?
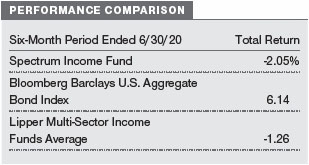
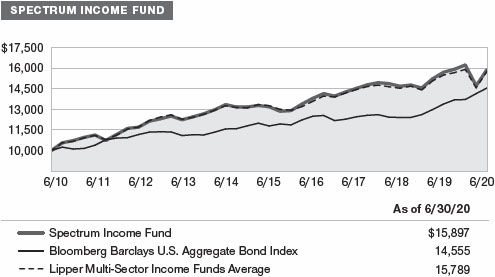
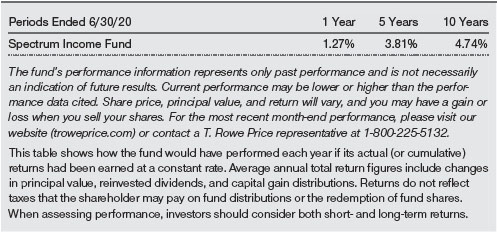
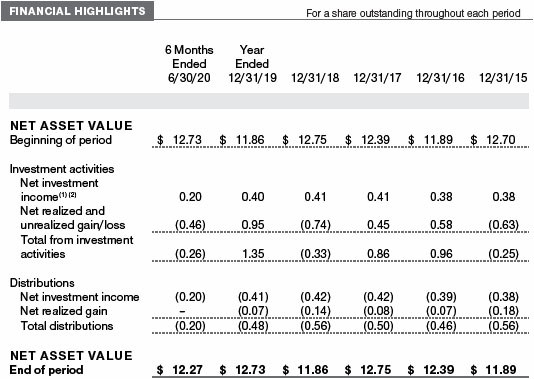
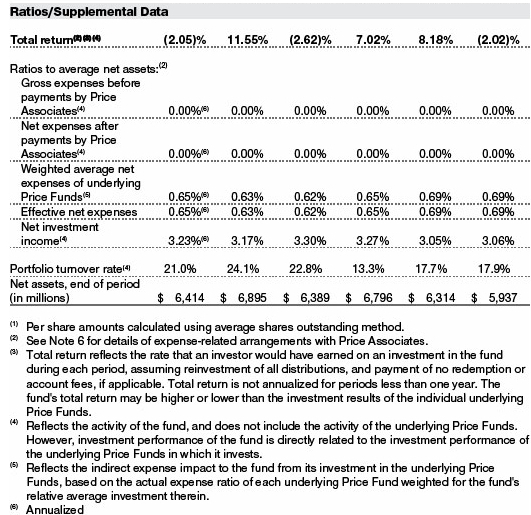
The Spectrum Income Fund returned -2.05% for the six-month period ended June 30, 2020. The fund underperformed the Bloomberg Barclays U.S. Aggregate Bond Index and the Lipper Multi-Sector Income Funds Average. (Past performance cannot guarantee future results.)
What factors influenced the fund’s performance?
The Spectrum Income Fund’s performance during the past six months can be best described as a “tale of two quarters.” The fund posted steep losses in the first quarter and then generated meaningful gains in the second quarter. Overall, most of the underlying asset classes that declined during the indiscriminate sell-off that plagued markets in late February into March rebounded strongly in the second half of the reporting period.
Within the fund, exposure to sectors and asset classes that are not included in the fund’s benchmark detracted from relative returns. Dividend-paying equities, in particular, declined precipitously with the market downturn in the first quarter. Our exposure to the asset class, coupled with security selection within the strategy, hurt relative performance. The overall impact was, however, partly mitigated as equities rallied in the second quarter.
Most of the fixed income diversifiers—especially high yield and emerging markets bonds—weighed on relative results amid investor preference for perceived safe-haven assets. Although exposure to these sectors was negative early in the period, they added value during the rally in risk assets. Notably, exposure to long-term U.S. Treasuries, which delivered strong double-digit returns during a period of extreme market volatility, contributed to relative performance.
Security selection also hurt relative results. In addition to the U.S. dividend-paying equity strategy, the investment-grade bond and emerging markets bond strategies also lagged their style-specific benchmarks. These impacts mostly reversed course in the latter half of the period. Positive selection within the absolute return-oriented bond strategy, however, contributed to relative returns as the strategy managed downside risk successfully during a period of risk aversion and was also well positioned to participate in the market rebound.
Tactical allocation decisions to overweight or underweight various asset classes detracted. An underweight to long-term U.S. Treasuries weighed on performance, as these bonds significantly outperformed investment-grade issues. Treasuries performed strongly as risk assets sold off, becoming increasingly expensive, and we used the gains as a funding source for lower-quality issues with higher upside potential and to increase our allocation to dividend-paying stocks as equity markets sold off. An overweight to emerging markets local currency bonds—which trailed the dollar-denominated bonds—also hurt relative returns.
How is the fund positioned?
The Spectrum Income Fund invests primarily in fixed income securities through a diversified mix of U.S. and international T. Rowe Price mutual funds. Underlying investments also include a fund focused on dividend-paying U.S. large-cap stocks.
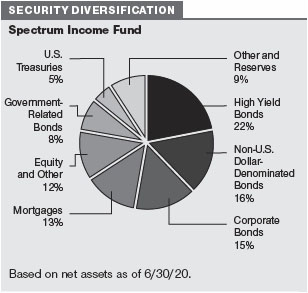
Yields for U.S. investment-grade bonds remain near record lows despite the rally in risk assets. Credit sectors are attractive as spreads (the yield differences between bonds with higher and lower credit quality) have narrowed amid liquidity stabilization. We added to corporate bonds by paring our allocations to higher-quality issues in the Ginnie Mae and short-term bond allocations.
We increased our position in high yield bonds, as credit spreads remain at attractive levels. High yield bonds could potentially deliver equity-like returns postcrisis with lower overall volatility, but potential downgrades and/or default risks are a concern. The impacts of the coronavirus pandemic could also weigh on consumer-related and energy sectors. We increased our overweight to floating rate bank loans, which sold off, leaving spreads at historically attractive levels. Floating rate loans also have less exposure to the energy sector and a higher standing in the capital structure.
We modestly increased our exposure to currency-hedged nondollar bonds prior to the sell-off and are now neutral. While still attractive for U.S.-based investors, the hedged-yield advantage has moderated as short-term interest rate differentials have narrowed. The yields are anchored by aggressive central bank policies in response to the pandemic. We also increased our allocation to unhedged nondollar bonds, given the potential of a less dominant U.S. dollar.
We are overweight to emerging markets dollar-denominated and emerging markets local currency bonds, as their attractive valuations and accommodative developed market monetary policies should be supportive. There is also potential upside for local currency bonds from cheap currencies, although idiosyncratic and political risks remain sources of uncertainty.
We are underweight to long-term U.S. Treasury bonds. Treasuries have reached extreme valuations as yields have fallen to record-low levels, given that the current uncertain environment has increased demand for safe-haven investments and the Federal Reserve is expected to pause rate moves for an extended period. We are neutral to inflation-linked securities. With a muted outlook for growth, inflation expectations are modest and are not likely to move significantly higher.
Late in the reporting period, we reduced our allocation to dividend-paying equities to a neutral position. Entering the year, we had increased our allocation against a backdrop of stabilizing global growth and improving U.S.-China trade negotiations. As equity markets sold off due to the coronavirus pandemic, we took advantage of attractive valuations and incrementally added to our exposure. However, given the velocity of the recent rebound, we have moderated our overweight as the stock market rally has, in our view, outpaced the still uncertain economic recovery.
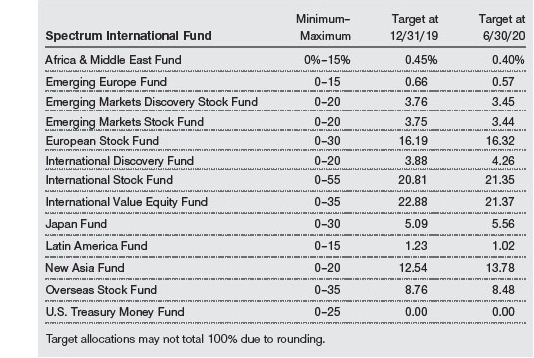
SPECTRUM INTERNATIONAL FUND
INVESTMENT OBJECTIVE
The fund seeks long-term capital appreciation.
FUND COMMENTARY
How did the fund perform in the past six months?
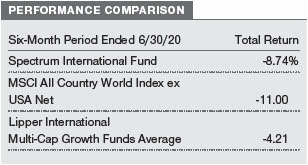
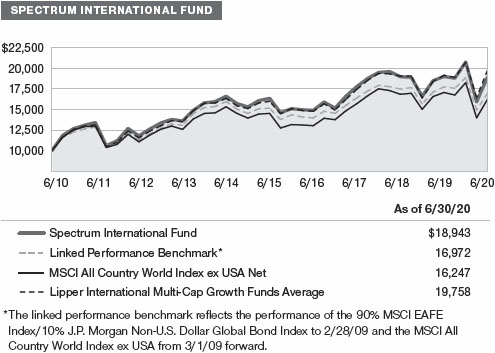
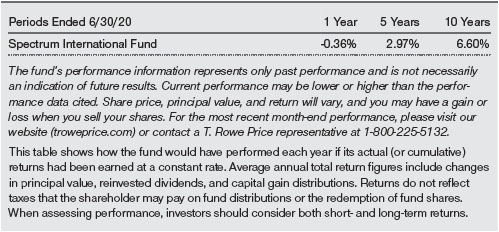
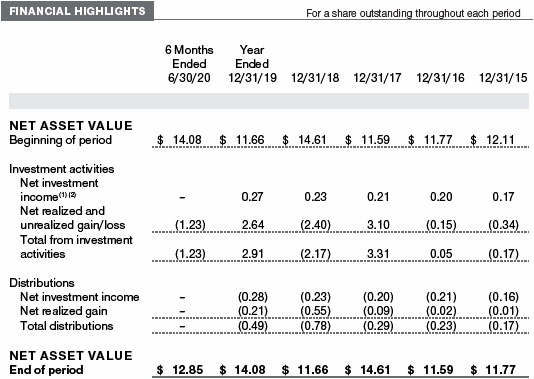
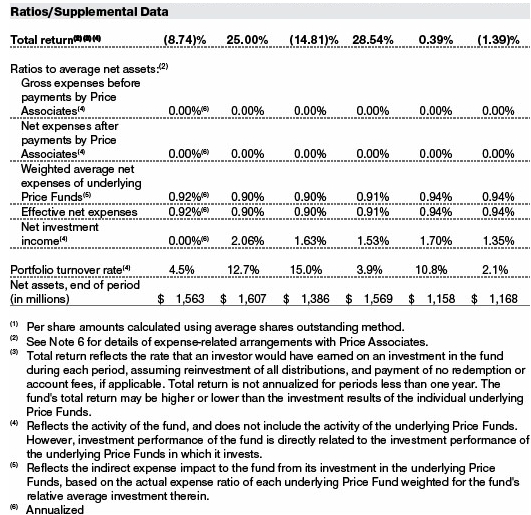
The Spectrum International Fund returned -8.74% for the six-month period ended June 30, 2020. The fund outperformed its benchmark, the MSCI All Country World Index ex USA Net, but lagged the Lipper International Multi-Cap Growth Funds Average. (Past performance cannot guarantee future results.)
What factors influenced the fund’s performance?
During the past six months, the Spectrum International Fund posted double-digit losses in the first quarter and then generated double-digit gains in the second quarter. Strong security selection within most of the underlying strategies drove relative outperformance in these contrasting environments. The European Stock Fund, International Value Equity Fund, and International Discovery Fund were the top contributors to relative results, while the International Stock Fund detracted.
Sector performance was mixed across the various regions; however, across multiple portfolios, stocks in the consumer discretionary and communications services sectors meaningfully outpaced benchmark peers. In the information technology (IT) sector, names within semiconductors and semiconductor equipment—coupled with a favorable overweight in the industry—contributed to relative performance. Among our health care holdings, an overweight to pharmaceuticals also proved beneficial. On a regional basis, holdings in developed Europe, Pacific Asia, and Japan were among the best performers. Within the New Asia Fund, names in consumer staples contributed to results, while in the Japan Fund, stocks in the information technology and industrials and business services sectors added the most value.
Conversely, security selection in the International Stock Fund detracted from relative performance. Within the fund, names in banks and IT services were notable laggards. The global pandemic exacerbated weakness in the banking sector outside the U.S., which was already struggling going into the crisis as near zero or negative interest rates weighed on profit margins. The European region also has a lower share of secularly advantaged companies, which have proven to be more resilient in the current environment.
How is the fund positioned?
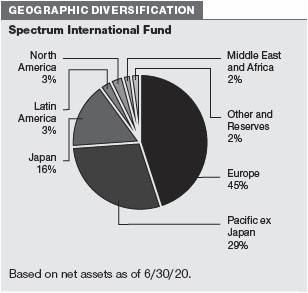
The Spectrum International Fund offers investors broadly diversified exposure to international equities in developed and emerging markets.
We are overweight to emerging markets stocks relative to developed market stocks as a weaker U.S. dollar could be broadly supportive. Emerging markets could also benefit from rebounding demand from China, although commodity-driven economies face challenges as prices are under pressure. However, many emerging markets countries may struggle to contain the coronavirus, and they have limited tools to support growth.
Among developed markets, we reduced our overweight to Japanese equities and are now neutral as Japan ramps up fiscal support amid the fallout it faces from the coronavirus outbreak. Economic activity in the broader Asia Pacific region may also be supportive amid Chinese stimulus measures. While accommodative monetary policy remains a tailwind, the region is highly sensitive to global industrial production and trade trends.
We also pared our overweight to European equities to neutral. Virus containment and reopening strategies have been largely successful so far, and the European Central Bank remains supportive with an increased probability for fiscal stimulus on the horizon. While previous idiosyncratic risks have somewhat waned, the region struggled with weak economic growth going into the crisis, and potential central bank stimulus may be limited in scope.
We moved to a neutral allocation between growth stocks and value stocks. International growth stocks have benefited from their higher quality and defensive characteristics, but trade and supply chain disruptions are concerns. Despite their cheap valuations, international value stocks face headwinds given pandemic-related weakness, low interest rates, and commodities oversupply.
What is portfolio management’s outlook?
The financial impact of the coronavirus pandemic reverberated across asset classes and regions in recent months. The economic effect of extensive government-enforced social distancing measures and the subsequent halt in global economic activity led to extreme market volatility. The velocity of the market decline and subsequent rebound is, however, unparalleled as global markets have shrugged off alarming economic data with the hopes that a swift recovery will ensue as commercial activities resume. Optimistic investor sentiment has been reflected in the continued recovery of risk assets. However, we believe caution is warranted. While today’s economy is not plagued by the same structural challenges of prior recessions, it is unclear whether markets will continue to disregard the negative data should further shocks materialize. Policy implications from the looming U.S. presidential election and resurgent tensions between the U.S. and China also bear monitoring, as geopolitical risks may emerge as a potential obstacle to a sustained recovery.
In our view, the myriad risks facing a return to global growth have been balanced so far by an effective and coordinated policy response. The aggressive measures taken by the Federal Reserve and other major central banks have helped to stem the impacts of the pandemic on the global economy. Low interest rates and renewed quantitative easing have buttressed the market rally, while fiscal stimulus measures in the U.S. and several other countries have forestalled worse economic damage. We believe further stimulus would likely be a boon to equity markets, though the scope and timing of these measures remains unclear as policymakers evaluate the trajectory of the recovery.
The current heightened levels of volatility and uncertainty in global markets underscore the value of our thoughtful strategic investing approach. Given the many crosscurrents that can influence global financial markets, we believe that broad diversification—as well as our ability to actively adjust allocations to enhance the Spectrum Funds’ risk/return profile—should benefit our investors over time across a range of market and economic environments.
The views expressed reflect the opinions of T. Rowe Price as of the date of this report and are subject to change based on changes in market, economic, or other conditions. These views are not intended to be a forecast of future events and are no guarantee of future results.
RISKS OF INVESTING
As with all stock and bond mutual funds, each fund’s share price can fall because of weakness in the stock or bond markets, a particular industry, or specific holdings. Stock markets can decline for many reasons, including adverse political or economic developments, changes in investor psychology, or heavy institutional selling. The prospects for an industry or company may deteriorate because of a variety of factors, including disappointing earnings or changes in the competitive environment. In addition, the investment manager’s assessment of companies held in a fund may prove incorrect, resulting in losses or poor performance even in rising markets.
Bonds are subject to interest rate risk, the decline in bond prices that usually accompanies a rise in interest rates, and credit risk, the chance that any fund holding could have its credit rating downgraded or that a bond issuer will default (fail to make timely payments of interest or principal), potentially reducing the fund’s income level and share price. High yield corporate bonds could have greater price declines than funds that invest primarily in high-quality bonds. Companies issuing high yield bonds are not as strong financially as those with higher credit ratings, so the bonds are usually considered speculative investments.
Funds that invest overseas may carry more risk than funds that invest strictly in U.S. assets. Risks can result from varying stages of economic and political development; differing regulatory environments, trading days, and accounting standards; and higher transaction costs of non-U.S. markets. Non-U.S. investments are also subject to currency risk, or a decline in the value of a foreign currency versus the U.S. dollar, which reduces the dollar value of securities denominated in that currency.
BENCHMARK INFORMATION
Combined index portfolio: An unmanaged blended index portfolio created as a custom benchmark for the Spectrum Growth Fund consisting of 70% Russell 3000 Index and 30% MSCI All Country World ex-USA IMI.
Note: Bloomberg Index Services Ltd. Copyright © 2020, Bloomberg Index Services Ltd. Used with permission.
Note: Lipper, a Thomson Reuters Company, is the source for all Lipper content reflected in these materials. Copyright 2020 © Refinitiv. All rights reserved. Any copying, republication or redistribution of Lipper content is expressly prohibited without the prior written consent of Lipper. Lipper shall not be liable for any errors or delays in the content, or for any actions taken in reliance thereon.
Note: Information has been obtained from sources believed to be reliable, but J.P. Morgan does not warrant its completeness or accuracy. The index is used with permission. The index may not be copied, used, or distributed without J.P. Morgan’s prior written approval. Copyright 2020, J.P. Morgan Chase & Co. All rights reserved.
Note: MSCI makes no express or implied warranties or representations and shall have no liability whatsoever with respect to any MSCI data contained herein. The MSCI data may not be further redistributed or used as a basis for other indices or any securities or financial products. This report is not approved, reviewed, or produced by MSCI.
Note: Frank Russell Company (Russell) is the source and owner of the Russell index data contained or reflected in these materials and all trademarks and copyrights related thereto. Russell® is a registered trademark of Russell. Russell is not responsible for the formatting or configuration of these materials or for any inaccuracy in T. Rowe Price Associates’ presentation thereof.
GROWTH OF $10,000
This chart shows the value of a hypothetical $10,000 investment in the fund over the past 10 fiscal year periods or since inception (for funds lacking 10-year records). The result is compared with benchmarks, which include a broad-based market index and may also include a peer group average or index. Market indexes do not include expenses, which are deducted from fund returns as well as mutual fund averages and indexes.
AVERAGE ANNUAL COMPOUND TOTAL RETURN
EXPENSE RATIO
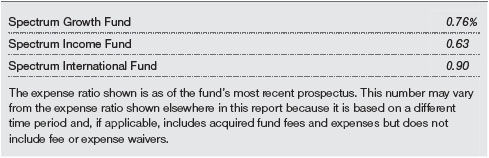
FUND EXPENSE EXAMPLE
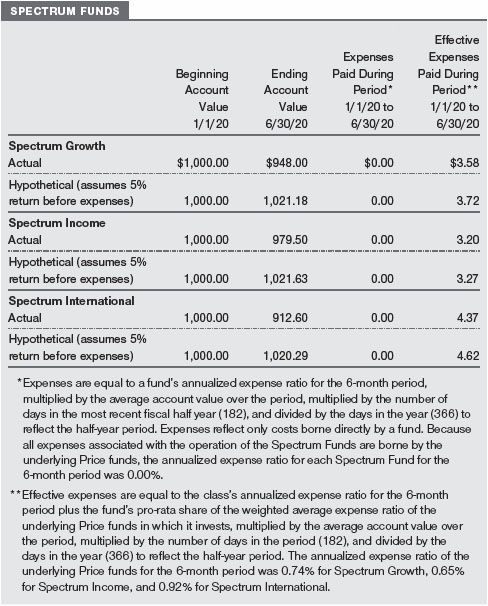
As a mutual fund shareholder, you may incur two types of costs: (1) transaction costs, such as redemption fees or sales loads, and (2) ongoing costs, including management fees, distribution and service (12b-1) fees, and other fund expenses. The following example is intended to help you understand your ongoing costs (in dollars) of investing in the fund and to compare these costs with the ongoing costs of investing in other mutual funds. The example is based on an investment of $1,000 invested at the beginning of the most recent six-month period and held for the entire period.
Actual Expenses
The first line of the following table (Actual) provides information about actual account values and expenses based on the fund’s actual returns. You may use the information on this line, together with your account balance, to estimate the expenses that you paid over the period. Simply divide your account value by $1,000 (for example, an $8,600 account value divided by $1,000 = 8.6), then multiply the result by the number on the first line under the heading “Expenses Paid During Period” to estimate the expenses you paid on your account during this period.
Hypothetical Example for Comparison Purposes
The information on the second line of the table (Hypothetical) is based on hypothetical account values and expenses derived from the fund’s actual expense ratio and an assumed 5% per year rate of return before expenses (not the fund’s actual return). You may compare the ongoing costs of investing in the fund with other funds by contrasting this 5% hypothetical example and the 5% hypothetical examples that appear in the shareholder reports of the other funds. The hypothetical account values and expenses may not be used to estimate the actual ending account balance or expenses you paid for the period.
Note: T. Rowe Price charges an annual account service fee of $20, generally for accounts with less than $10,000. The fee is waived for any investor whose T. Rowe Price mutual fund accounts total $50,000 or more; accounts electing to receive electronic delivery of account statements, transaction confirmations, prospectuses, and shareholder reports; or accounts of an investor who is a T. Rowe Price Personal Services or Enhanced Personal Services client (enrollment in these programs generally requires T. Rowe Price assets of at least $250,000). This fee is not included in the accompanying table. If you are subject to the fee, keep it in mind when you are estimating the ongoing expenses of investing in the fund and when comparing the expenses of this fund with other funds.
You should also be aware that the expenses shown in the table highlight only your ongoing costs and do not reflect any transaction costs, such as redemption fees or sales loads. Therefore, the second line of the table is useful in comparing ongoing costs only and will not help you determine the relative total costs of owning different funds. To the extent a fund charges transaction costs, however, the total cost of owning that fund is higher.
| T. ROWE PRICE SPECTRUM GROWTH FUND |
|
Unaudited
The accompanying notes are an integral part of these financial statements.
| T. ROWE PRICE SPECTRUM INCOME FUND |
|
Unaudited
The accompanying notes are an integral part of these financial statements.
| T. ROWE PRICE SPECTRUM INTERNATIONAL FUND |
|
Unaudited
The accompanying notes are an integral part of these financial statements.
| T. ROWE PRICE SPECTRUM GROWTH FUND |
|
June 30, 2020 (Unaudited)
The accompanying notes are an integral part of these financial statements.
| T. ROWE PRICE SPECTRUM INCOME FUND |
|
June 30, 2020 (Unaudited)
The accompanying notes are an integral part of these financial statements.
| T. ROWE PRICE SPECTRUM INTERNATIONAL FUND |
|
June 30, 2020 (Unaudited)
The accompanying notes are an integral part of these financial statements.
| T. ROWE PRICE SPECTRUM GROWTH FUND |
|
June 30, 2020 (Unaudited)

The accompanying notes are an integral part of these financial statements.
| T. ROWE PRICE SPECTRUM INCOME FUND |
|
June 30, 2020 (Unaudited)
The accompanying notes are an integral part of these financial statements.
| T. ROWE PRICE SPECTRUM INTERNATIONAL FUND |
|
June 30, 2020 (Unaudited)
The accompanying notes are an integral part of these financial statements.
| T. ROWE PRICE SPECTRUM GROWTH FUND |
|
Unaudited
The accompanying notes are an integral part of these financial statements.
| T. ROWE PRICE SPECTRUM INCOME FUND |
|
Unaudited
The accompanying notes are an integral part of these financial statements.
| T. ROWE PRICE SPECTRUM INTERNATIONAL FUND |
|
Unaudited
The accompanying notes are an integral part of these financial statements.
Unaudited
| NOTES TO FINANCIAL STATEMENTS |
T. Rowe Price Spectrum Fund, Inc. (the corporation) is registered under the Investment Company Act of 1940 (the 1940 Act) as a diversified, open-end management investment company. Spectrum Growth Fund, Spectrum Income Fund, and Spectrum International Fund (collectively, the Spectrum Funds) are three portfolios established by the corporation.
Each Spectrum Fund broadly diversifies its assets within specified ranges among a set of T. Rowe Price mutual funds (underlying Price Funds) representing specific market segments. Spectrum Growth seeks long-term capital appreciation and growth of income with current income as a secondary objective. Spectrum Income seeks a high level of current income with moderate share price fluctuation. Spectrum International seeks long-term capital appreciation.
NOTE 1 - SIGNIFICANT ACCOUNTING POLICIES
Basis of Preparation Each fund is an investment company and follows accounting and reporting guidance in the Financial Accounting Standards Board Accounting Standards Codification Topic 946 (ASC 946). The accompanying financial statements were prepared in accordance with accounting principles generally accepted in the United States of America (GAAP), including, but not limited to, ASC 946. GAAP requires the use of estimates made by management. Management believes that estimates and valuations of the underlying Price Funds are appropriate; however, actual results may differ from those estimates, and the valuations reflected in the accompanying financial statements may differ from the value ultimately realized upon sale of the underlying Price Funds.
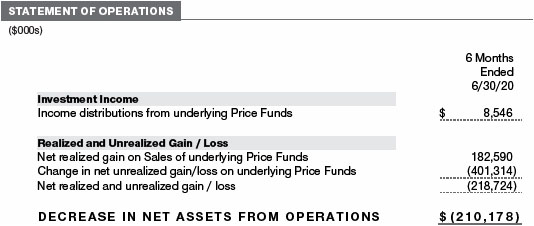
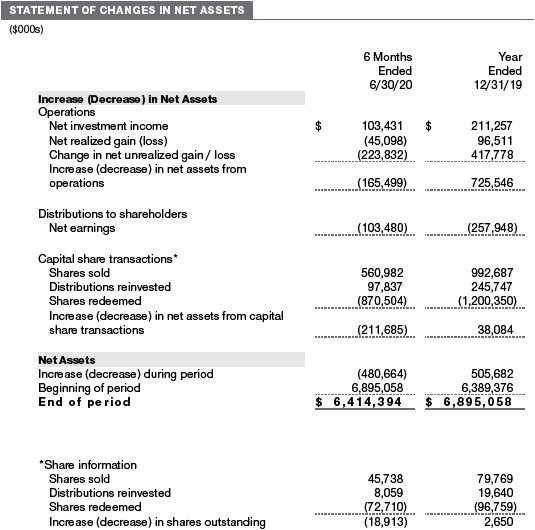
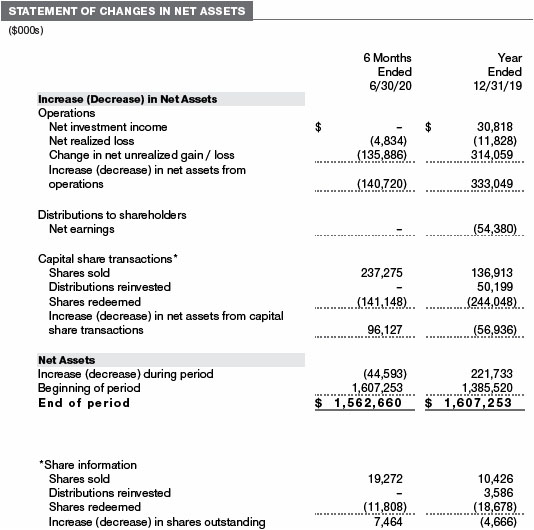
Investment Transactions, Investment Income, and Distributions Purchases and sales of the underlying Price Funds are accounted for on the trade date basis. Income is recorded on the accrual basis. Gains and losses realized on sales of the underlying Price Funds are reported on the identified cost basis. Income tax-related interest and penalties, if incurred, are recorded as income tax expense. Dividends received from underlying Price Fund investments are reflected as dividend income; capital gain distributions are reflected as realized gain/loss. Income and capital gain distributions from the underlying Price Funds are recorded on the ex-dividend date. Distributions to shareholders are recorded on the ex-dividend date. Income distributions are declared by Spectrum Income daily and paid monthly. Income distributions, if any, are declared and paid by Spectrum Growth and Spectrum International annually. A capital gain distribution may also be declared and paid by each fund annually.
Indemnification In the normal course of business, the funds may provide indemnification in connection with their officers and directors, service providers and/or private company investments. Each fund’s maximum exposure under these arrangements is unknown; however, the risk of material loss is currently considered to be remote.
NOTE 2 - VALUATION
Each fund’s financial instruments are valued and its net asset value (NAV) per share is computed at the close of the New York Stock Exchange (NYSE), normally 4 p.m. ET, each day the NYSE is open for business. However, the NAV per share may be calculated at a time other than the normal close of the NYSE if trading on the NYSE is restricted, if the NYSE closes earlier, or as may be permitted by the SEC. Each fund’s financial instruments are reported at fair value, which GAAP defines as the price that would be received to sell an asset or paid to transfer a liability in an orderly transaction between market participants at the measurement date. Investments in the underlying Price Funds are valued at their closing NAV per share on the day of valuation. Assets and liabilities other than financial instruments, including short-term receivables and payables, are carried at cost, or estimated realizable value, if less, which approximates fair value.
The T. Rowe Price Valuation Committee (the Valuation Committee) is an internal committee that has been delegated certain responsibilities by the funds’ Board of Directors (the Board) to ensure that financial instruments are appropriately priced at fair value in accordance with GAAP and the 1940 Act. Subject to oversight by the Board, the Valuation Committee develops and oversees pricing-related policies and procedures and approves all fair value determinations. Specifically, the Valuation Committee establishes procedures to value securities; determines pricing techniques, sources, and persons eligible to effect fair value pricing actions; oversees the selection, services, and performance of pricing vendors; oversees valuation-related business continuity practices; and provides guidance on internal controls and valuation-related matters. The Valuation Committee reports to the Board and has representation from legal, portfolio management and trading, operations, risk management, and the funds’ treasurer.
Various valuation techniques and inputs are used to determine the fair value of financial instruments. GAAP establishes the following fair value hierarchy that categorizes the inputs used to measure fair value:
Level 1 – quoted prices (unadjusted) in active markets for identical financial instruments that the fund can access at the reporting date
Level 2 – inputs other than Level 1 quoted prices that are observable, either directly or indirectly (including, but not limited to, quoted prices for similar financial instruments in active markets, quoted prices for identical or similar financial instruments in inactive markets, interest rates and yield curves, implied volatilities, and credit spreads)
Level 3 – unobservable inputs
Observable inputs are developed using market data, such as publicly available information about actual events or transactions, and reflect the assumptions that market participants would use to price the financial instrument. Unobservable inputs are those for which market data are not available and are developed using the best information available about the assumptions that market participants would use to price the financial instrument. GAAP requires valuation techniques to maximize the use of relevant observable inputs and minimize the use of unobservable inputs. When multiple inputs are used to derive fair value, the financial instrument is assigned to the level within the fair value hierarchy based on the lowest-level input that is significant to the fair value of the financial instrument. Input levels are not necessarily an indication of the risk or liquidity associated with financial instruments at that level but rather the degree of judgment used in determining those values. On June 30, 2020, all of the fund’s financial instruments were classified as Level 1, based on the inputs used to determine their fair values.
NOTE 3 - DERIVATIVE INSTRUMENTS
The funds may use derivatives in an effort to manage cash flows efficiently, remain fully invested, or facilitate asset allocation and rebalancing. As defined by GAAP, a derivative is a financial instrument whose value is derived from an underlying security price, foreign exchange rate, interest rate, index of prices or rates, or other variable; it requires little or no initial investment and permits or requires net settlement. The funds invest in derivatives only if the expected risks and rewards are consistent with its investment objectives, policies, and overall risk profile, as described in its prospectus and Statement of Additional Information. The risks associated with the use of derivatives are different from, and potentially much greater than, the risks associated with investing directly in the instruments on which the derivatives are based. The funds at all times maintain sufficient cash reserves, liquid assets, or other SEC-permitted asset types to cover their settlement obligations under open derivative contracts.
The funds value their derivatives at fair value and recognizes changes in fair value currently in their results of operations. Accordingly, the funds do not follow hedge accounting, even for derivatives employed as economic hedges. Generally, the funds account for their derivatives on a gross basis. They do not offset the fair value of derivative liabilities against the fair value of derivative assets on their financial statements, nor do they offset the fair value of derivative instruments against the right to reclaim or obligation to return collateral.
As of June 30, 2020, the Spectrum Growth Fund, Spectrum Income Fund and Spectrum International Fund held no derivative instruments.
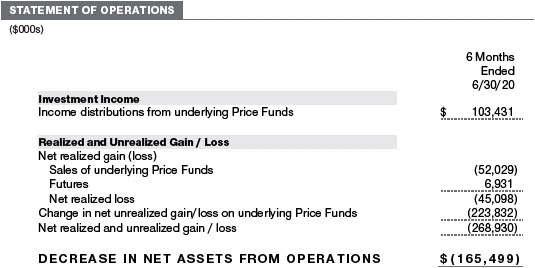
The amount of gains and losses on futures recognized in fund earnings during the six months ended June 30, 2020, and the related location on the accompanying Statement of Operations is summarized in the following table by primary underlying risk exposure:
Spectrum Income Fund
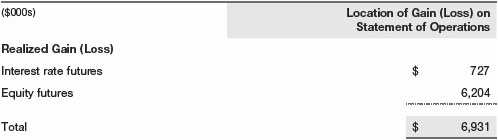
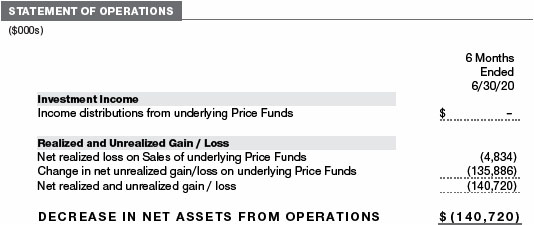
During the six months ended June 30, 2020, the Spectrum Growth Fund and Spectrum International Fund recognized no gains or losses on futures.
Futures Contracts A futures contract provides for the future sale by one party and purchase by another of a specified amount of a specific underlying financial instrument at an agreed upon price, date, time, and place. The funds currently invest only in exchange-traded futures, which generally are standardized as to maturity date, underlying financial instrument, and other contract terms. Payments are made or received by the fund each day to settle daily fluctuations in the value of the contract (variation margin), which reflect changes in the value of the underlying financial instrument. Variation margin is recorded as unrealized gain or loss until the contract is closed. The value of a futures contract included in net assets is the amount of unsettled variation margin; net variation margin receivable is reflected as an asset and net variation margin payable is reflected as a liability on the accompanying Statement of Assets and Liabilities. Risks related to the use of futures contracts include possible illiquidity of the futures markets, contract prices that can be highly volatile and imperfectly correlated to movements in hedged security values and/or interest rates, and potential losses in excess of the fund’s initial investment. During the six months ended June 30, 2020, the volume of activity in futures, based on underlying notional amounts, was generally less than 1% of net assets for the Spectrum Income Fund.
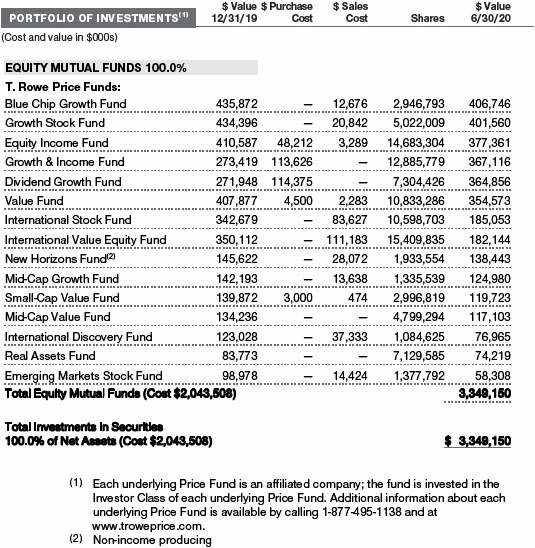
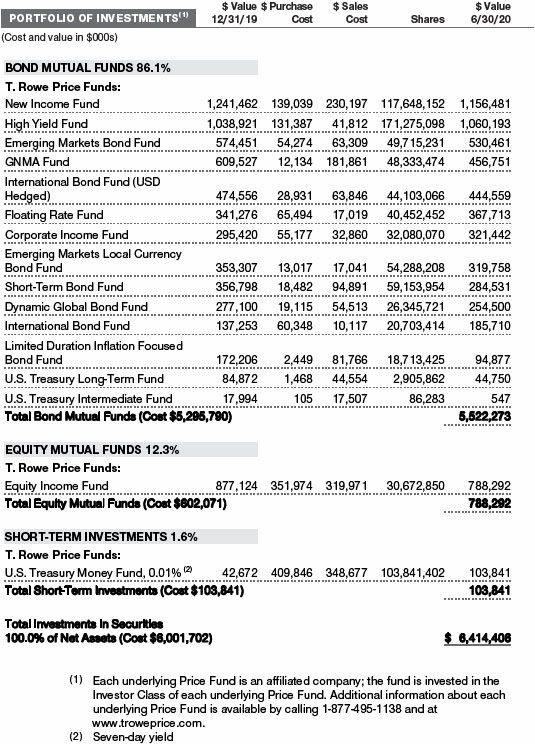
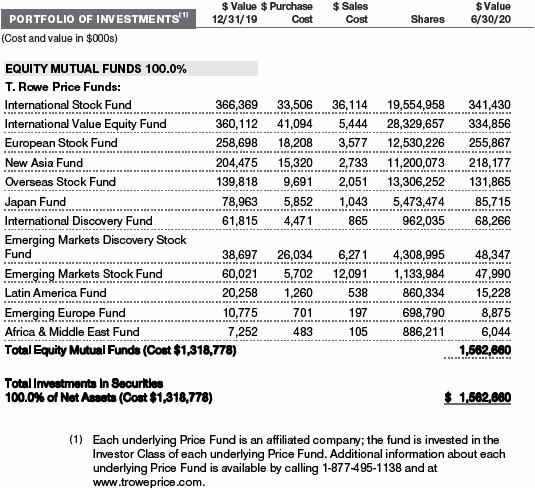
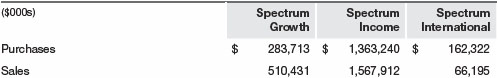
NOTE 4 - INVESTMENTS IN UNDERLYING PRICE FUNDS
Purchases and sales of the underlying Price Funds during the six months ended June 30, 2020, were as follows:
NOTE 5 - FEDERAL INCOME TAXES
No provision for federal income taxes is required since each fund intends to continue to qualify as a regulated investment company under Subchapter M of the Internal Revenue Code and distribute to shareholders all of its taxable income and gains. Distributions determined in accordance with federal income tax regulations may differ in amount or character from net investment income and realized gains for financial reporting purposes. Financial reporting records are adjusted for permanent book/tax differences to reflect tax character but are not adjusted for temporary differences. The amount and character of tax-basis distributions and composition of net assets are finalized at fiscal year-end; accordingly, tax-basis balances have not been determined as of the date of this report.
Each fund intends to retain realized gains to the extent of available capital loss carry-forwards. Net realized capital losses may be carried forward indefinitely to offset future realized capital gains. As of December 31, 2019, Spectrum Growth had no available capital loss carryforwards, Spectrum Income had no available capital loss carryforwards, and Spectrum International had $9,599,000 of available capital loss carryforwards.
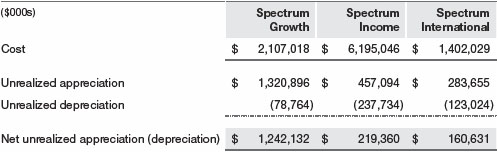
At June 30, 2020, the cost of investments for federal income tax purposes and net unrealized gain (loss) on investments was as follows:
NOTE 6 - RELATED PARTY TRANSACTIONS
The Spectrum Funds are managed by T. Rowe Price Associates, Inc. (Price Associates), a wholly owned subsidiary of T. Rowe Price Group, Inc. Price Associates, directly or through sub-advisory agreements with its wholly owned subsidiaries, also provides investment management services to all the underlying Price Funds. Pursuant to various service agreements, Price Associates and its wholly owned subsidiaries provide shareholder servicing and administrative services as well as certain accounting, marketing, and other services to the Spectrum Funds. Certain officers and directors of the Spectrum Funds are also officers and directors of Price Associates and its subsidiaries and of the underlying Price Funds.
The Spectrum Funds pay no management fees; however, Price Associates receives management fees from the underlying Price Funds. The Spectrum Funds operate in accordance with the investment management and special servicing agreements between and among the corporation, the underlying Price Funds, and Price Associates. Pursuant to these agreements, expenses associated with the operation of the Spectrum Funds are borne by each underlying Price Fund to the extent of estimated savings to it and in proportion to the average daily value of its shares owned by the Spectrum Funds. Therefore, each Spectrum Fund operates at a zero expense ratio. However, each Spectrum Fund indirectly bears its proportionate share of the management fees and operating costs of the underlying Price Funds in which it invests.
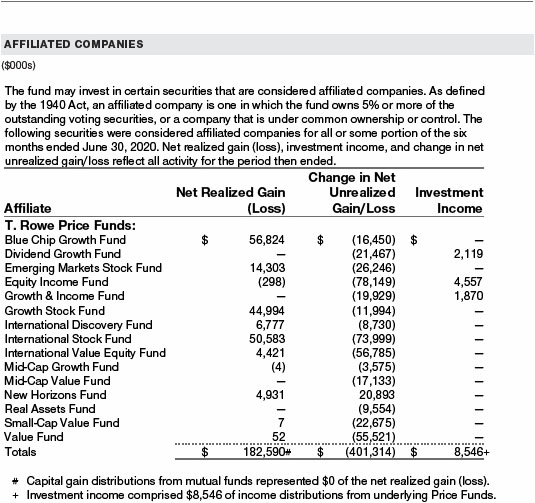
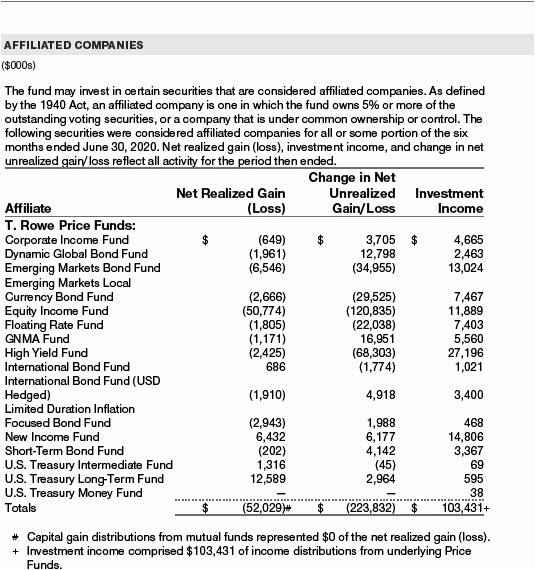
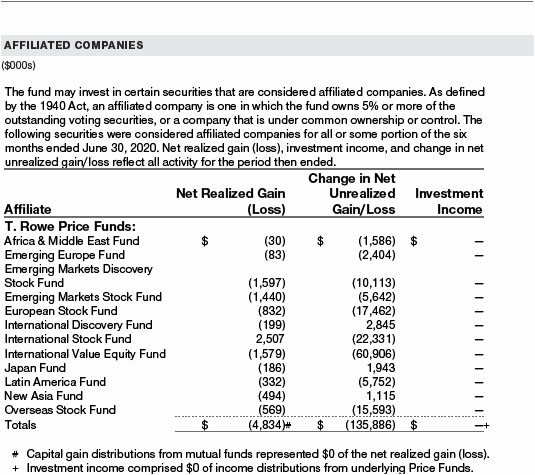
The Spectrum Funds do not invest in the underlying Price Funds for the purpose of exercising management or control; however, investments by the Spectrum Funds may represent a significant portion of an underlying Price Fund’s net assets. At June 30, 2020, Spectrum Growth held less than 25% of the outstanding shares of any underlying Price Fund; Spectrum International held approximately 44% of the outstanding shares of the Emerging Markets Discovery Stock Fund, 30% of the International Value Equity Fund, 28% of the European Stock Fund, and less than 25% of any other underlying Price Fund; and Spectrum Income held approximately 88% of the outstanding shares of the Emerging Markets Local Currency Bond Fund, 72% of the International Bond Fund (USD Hedged), 68% of the Dynamic Global Bond Fund, 43% of the Corporate Income Fund, 42% of the Floating Rate Fund, 38% of the GNMA Fund, 32% of the Emerging Markets Bond Fund, 32% of the High Yield Fund, 27% of the International Bond Fund, 25% of the New Income Fund, and less than 25% of any other underlying Price Fund.
Additionally, Spectrum Income Fund is one of several mutual funds in which certain college savings plans managed by Price Associates may invest. Shareholder servicing costs associated with each college savings plan are allocated to Spectrum Income Fund in proportion to the average daily value of its shares owned by the college savings plan and, in turn, are borne by the underlying Price Funds in accordance with the terms of the investment management and special servicing agreements. At June 30, 2020, approximately 38% of the outstanding shares of Spectrum Income Fund were held by the college savings plans.
NOTE 7 - OTHER MATTERS
Unpredictable events such as environmental or natural disasters, war, terrorism, pandemics, outbreaks of infectious diseases, and similar public health threats may significantly affect the economy and the markets and issuers in which a fund invests. Certain events may cause instability across global markets, including reduced liquidity and disruptions in trading markets, while some events may affect certain geographic regions, countries, sectors, and industries more significantly than others, and exacerbate other pre-existing political, social, and economic risks.
These types of events may also cause widespread fear and uncertainty, and result in, among other things: quarantines and travel restrictions, including border closings; disruptions to business operations and supply chains; exchange trading suspensions and closures, and overall reduced liquidity of securities, derivatives, and commodities trading markets; reductions in consumer demand and economic output; and significant challenges in healthcare service preparation and delivery. The funds could be negatively impacted if the value of a portfolio holding were harmed by such political or economic conditions or events. In addition, the operations of the funds, their investment advisers, and the funds’ service providers may be significantly impacted, or even temporarily halted, as a result of extensive employee illnesses or unavailability, government quarantine measures, and restrictions on travel or meetings and other factors related to public emergencies. Recently, a novel strain of coronavirus (COVID-19) has resulted in disruptions to global business activity and caused significant volatility and declines in global financial markets.
Governmental and quasi-governmental authorities and regulators have in the past responded to major economic disruptions with a variety of significant fiscal and monetary policy changes, including but not limited to, direct capital infusions into companies, new monetary programs, and dramatically lower interest rates. An unexpected or quick reversal of these policies, or the ineffectiveness of these policies, could negatively impact overall investor sentiment and further increase volatility in securities markets.
INFORMATION ON PROXY VOTING POLICIES, PROCEDURES, AND RECORDS
A description of the policies and procedures used by T. Rowe Price funds and portfolios to determine how to vote proxies relating to portfolio securities is available in each fund’s Statement of Additional Information. You may request this document by calling 1-800-225-5132 or by accessing the SEC’s website, sec.gov.
The description of our proxy voting policies and procedures is also available on our corporate website. To access it, please visit the following Web page:
https://www.troweprice.com/corporate/en/utility/policies.html
Scroll down to the section near the bottom of the page that says, “Proxy Voting Policies.” Click on the Proxy Voting Policies link in the shaded box.
Each fund’s most recent annual proxy voting record is available on our website and through the SEC’s website. To access it through T. Rowe Price, visit the website location shown above, and scroll down to the section near the bottom of the page that says, “Proxy Voting Records.” Click on the Proxy Voting Records link in the shaded box.
HOW TO OBTAIN QUARTERLY PORTFOLIO HOLDINGS
Effective for reporting periods on or after March 1, 2019, a fund, except a money market fund, files a complete schedule of portfolio holdings with the Securities and Exchange Commission (SEC) for the first and third quarters of each fiscal year as an exhibit to its reports on Form N-PORT. Prior to March 1, 2019, a fund, including a money market fund, filed a complete schedule of portfolio holdings with the SEC for the first and third quarters of each fiscal year on Form N-Q. A money market fund files detailed month-end portfolio holdings information on Form N-MFP with the SEC each month and posts a complete schedule of portfolio holdings on its website (troweprice.com) as of each month-end for the previous six months. A fund’s Forms N-PORT, N-MFP, and N-Q are available electronically on the SEC’s website (sec.gov).
| T. ROWE PRICE SPECTRUM GROWTH FUND |
|
APPROVAL OF INVESTMENT MANAGEMENT AGREEMENT
Each year, the fund’s Board of Directors (Board) considers the continuation of the investment management agreement (Advisory Contract) between the fund and its investment advisor, T. Rowe Price Associates, Inc. (Advisor), as well as a Special Servicing Agreement among the fund, the Advisor, and each of the underlying funds in which it invests (Special Servicing Agreement). The Special Servicing Agreement allows the T. Rowe Price Spectrum Funds (Spectrum Funds) to pass through their operating expenses to the underlying funds in which they invest if the benefit to the underlying funds equals or exceeds the costs of absorbing these expenses and provides that the Advisor will be responsible for bearing any expenses that would result from an underlying fund’s share of the aggregate expenses of the Spectrum Funds exceeding the estimated savings to the underlying fund from the operation of the Spectrum Funds. In that regard, at a meeting held on March 9–10, 2020 (Meeting), the Board, including all of the fund’s independent directors, approved the continuation of the fund’s Advisory Contract and Special Servicing Agreement. At the Meeting, the Board considered the factors and reached the conclusions described below relating to the selection of the Advisor and approval of the Advisory Contract and the continuation of the Special Servicing Agreement. The independent directors were assisted in their evaluation of the Advisory Contract and Special Servicing Agreement by independent legal counsel from whom they received separate legal advice and with whom they met separately.
In providing information to the Board, the Advisor was guided by a detailed set of requests for information submitted by independent legal counsel on behalf of the independent directors. In considering and approving the Advisory Contract and Special Servicing Agreement, the Board considered the information it believed was relevant, including, but not limited to, the information discussed below. The Board considered not only the specific information presented in connection with the Meeting but also the knowledge gained over time through interaction with the Advisor about various topics. The Board meets regularly and, at each of its meetings, covers an extensive agenda of topics and materials and considers factors that are relevant to its annual consideration of the renewal of the T. Rowe Price funds’ advisory contracts, including performance and the services and support provided to the funds and their shareholders.
Services Provided by the Advisor
The Board considered the nature, quality, and extent of the services provided to the fund by the Advisor. These services included, but were not limited to, directing the fund’s investments in accordance with its investment program and the overall management of the fund’s portfolio, as well as a variety of related activities such as financial, investment operations, and administrative services; compliance; maintaining the fund’s records and registrations; and shareholder communications. The Board also reviewed the background and experience of the Advisor’s senior management team and investment personnel involved in the management of the fund, as well as the Advisor’s compliance record. The Board concluded that it was satisfied with the nature, quality, and extent of the services provided by the Advisor.
Investment Performance of the Fund
The Board took into account discussions with the Advisor and reports that it receives throughout the year relating to fund performance. In connection with the Meeting, the Board reviewed the fund’s net annualized total returns for the 1-, 2-, 3-, 4-, 5-, and 10-year periods as of September 30, 2019, and compared these returns with the performance of a peer group of funds with similar investment programs and a wide variety of other previously agreed-upon comparable performance measures and market data, including those supplied by Broadridge, which is an independent provider of mutual fund data.
On the basis of this evaluation and the Board’s ongoing review of investment results, and factoring in the relative market conditions during certain of the performance periods, the Board concluded that the fund’s performance was satisfactory.
Costs, Benefits, Profits, and Economies of Scale
The Advisor does not receive management fees from the fund, and operating expenses of the fund are borne by the underlying T. Rowe Price funds in which it invests pursuant to the Special Servicing Agreement. In connection with its review of the Special Servicing Agreement, the Board reviewed various cost/benefit analyses to demonstrate the benefits to the underlying funds versus the costs they incur, which illustrate that the primary benefit provided by the Spectrum Funds to the underlying funds is the reduction in expenses associated with the consolidation of shareholder accounts that would otherwise be invested directly in the underlying funds.
The Advisor receives management fees from other T. Rowe Price funds in which the fund invests. However, since the Advisor does not receive any management fees directly from the fund, the Board did not review information relating to revenues received by the Advisor under the Advisory Contract. The Board did review information regarding benefits that the Advisor (and its affiliates) may have realized from its relationship with the fund or other T. Rowe Price funds in which the fund invests, including any research received under “soft dollar” agreements and commission-sharing arrangements with broker-dealers. The Board considered that the Advisor may have received some benefit from its soft-dollar arrangements pursuant to which it receives research from broker-dealers that execute the applicable fund’s portfolio transactions. However, the Board also considered that, effective January 2020, the Advisor began bearing the cost of research services for all client accounts that it advises, including the T. Rowe Price funds. The Board also received information on the estimated costs incurred and profits realized by the Advisor and its affiliates from advising T. Rowe Price funds and concluded that the Advisor’s profits were reasonable. Although the Advisor does not receive management fees directly from the fund under the Advisory Contract, the fund’s shareholders benefit from potential economies of scale through a decline in the fund’s total expense ratio as the fund and underlying funds grow in size.
Fees and Expenses
The Board was provided with information regarding industry trends in management fees and expenses. Among other things, the Board reviewed data for peer groups that were compiled by Broadridge, which compared: (i) total expenses, actual management fees, and nonmanagement expenses of the fund with a group of competitor funds selected by Broadridge (Expense Group) and (ii) total expenses, actual management fees, and nonmanagement expenses of the fund with a broader set of funds within the Lipper investment classification (Expense Universe). The Board considered the fund’s actual management fee rate (which reflects that the Advisor does not receive any management fees directly from the fund), operating expenses, and total expenses (which reflect the net total expense ratio of the fund, including acquired fund fees and expenses associated with the underlying funds, after any waivers, reductions, or reimbursements) in comparison with the information for the Broadridge peer groups. Broadridge generally constructed the peer groups by seeking the most comparable funds based on similar investment classifications and objectives, expense structure, asset size, and operating components and attributes and ranked funds into quintiles, with the first quintile representing the funds with the lowest relative expenses and the fifth quintile representing the funds with the highest relative expenses. The information provided to the Board indicated that the fund’s actual management fee rate ranked in the first quintile (Expense Group and Expense Universe), and the fund’s total expenses ranked in the first quintile (Expense Group and Expense Universe).
The Board also reviewed the fee schedules for other investment portfolios with similar mandates that are advised or subadvised by the Advisor and its affiliates, including separately managed accounts for institutional and individual investors; subadvised funds; and other sponsored investment portfolios, including collective investment trusts and pooled vehicles organized and offered to investors outside the United States. Management provided the Board with information about the Advisor’s responsibilities and services provided to subadvisory and other institutional account clients, including information about how the requirements and economics of the institutional business are fundamentally different from those of the mutual fund business. The Board considered information showing that the Advisor’s mutual fund business is generally more complex from a business and compliance perspective than its institutional account business and considered various relevant factors, such as the broader scope of operations and oversight, more extensive shareholder communication infrastructure, greater asset flows, heightened business risks, and differences in applicable laws and regulations associated with the Advisor’s proprietary mutual fund business. In assessing the reasonableness of the fund’s management fee rate, the Board considered the differences in the nature of the services required for the Advisor to manage its mutual fund business versus managing a discrete pool of assets as a subadvisor to another institution’s mutual fund or for an institutional account and that the Advisor generally performs significant additional services and assumes greater risk in managing the fund and other T. Rowe Price funds than it does for institutional account clients.
On the basis of the information provided and the factors considered, the Board concluded that the fees paid by the fund under the Advisory Contract are reasonable.
Approval of the Advisory Contract and Special Servicing Agreement
As noted, the Board approved the continuation of the Advisory Contract as well as the Special Servicing Agreement. No single factor was considered in isolation or to be determinative to the decision. Rather, the Board concluded, in light of a weighting and balancing of all factors considered, that it was in the best interests of the fund and its shareholders for the Board to approve the continuation of the Advisory Contract and that there is a reasonable basis to conclude that the benefits to the underlying funds exceed the costs they incur and that it was in the best interests of the fund and its underlying funds to approve continuation of the Special Servicing Agreement.
LIQUIDITY RISK MANAGEMENT PROGRAM
In accordance with Rule 22e-4 (Liquidity Rule) under the Investment Company Act of 1940, as amended, the fund has established a liquidity risk management program (Liquidity Program) reasonably designed to assess and manage the fund’s liquidity risk, which generally represents the risk that the fund would not be able to meet redemption requests without significant dilution of remaining investors’ interests in the fund. The fund’s Board of Directors (Board) has appointed the fund’s investment advisor, T. Rowe Price Associates, Inc. (Price Associates), as the administrator of the Liquidity Program. As administrator, Price Associates is responsible for overseeing the day-to-day operations of the Liquidity Program and, among other things, is responsible for assessing, managing, and reviewing with the Board at least annually the liquidity risk of each T. Rowe Price fund. Price Associates has delegated oversight of the Liquidity Program to a Liquidity Risk Committee (LRC), which is a cross-functional committee composed of personnel from multiple departments within Price Associates.
The Liquidity Program’s principal objectives include supporting the T. Rowe Price funds’ compliance with limits on investments in illiquid assets and mitigating the risk that the fund will be unable to timely meet its redemption obligations. The Liquidity Program also includes a number of elements that support the management and assessment of liquidity risk, including an annual assessment of factors that influence the fund’s liquidity and the periodic classification and reclassification of a fund’s investments into categories that reflect the LRC’s assessment of their relative liquidity under current market conditions. Under the Liquidity Program, every investment held by the fund is classified at least monthly into one of four liquidity categories based on estimations of the investment’s ability to be sold during designated time frames in current market conditions without significantly changing the investment’s market value.
As required by the Liquidity Rule, at a meeting held on May 4, 2020, the Board was presented with an annual assessment prepared by the LRC, on behalf of Price Associates, that addressed the operation of the Liquidity Program and assessed its adequacy and effectiveness of implementation, including any material changes to the Liquidity Program and the determination of each fund’s Highly Liquid Investment Minimum (HLIM). The annual assessment included consideration of the following factors, as applicable: the fund’s investment strategy and liquidity of portfolio investments during normal and reasonably foreseeable stressed conditions, including whether the investment strategy is appropriate for an open-end fund, the extent to which the strategy involves a relatively concentrated portfolio or large positions in particular issuers, and the use of borrowings for investment purposes and derivatives; short-term and long-term cash flow projections covering both normal and reasonably foreseeable stressed conditions; and holdings of cash and cash equivalents, as well as available borrowing arrangements.
For the fund and other T. Rowe Price funds, the annual assessment incorporated a report related to a fund’s holdings, shareholder and portfolio concentration, any borrowings during the period, cash flow projections, and other relevant data for the period of June 1, 2019, through March 31, 2020. The report described the methodology for classifying a fund’s investments (including derivative transactions) into one of four liquidity categories, as well as the percentage of a fund’s investments assigned to each category. It also explained the methodology for establishing a fund’s HLIM and noted that the LRC reviews the HLIM assigned to each fund no less frequently than annually.
Certain provisions of the Liquidity Program initially became effective on December 1, 2018, and the full Liquidity Program was formally approved by the Board in April 2019. During the period covered by the annual assessment, the LRC has concluded, and reported to the Board, that the Liquidity Program since its implementation has operated adequately and effectively and is reasonably designed to assess and manage the fund’s liquidity risk.
| T. ROWE PRICE SPECTRUM INCOME FUND |
|
APPROVAL OF INVESTMENT MANAGEMENT AGREEMENT
Each year, the fund’s Board of Directors (Board) considers the continuation of the investment management agreement (Advisory Contract) between the fund and its investment advisor, T. Rowe Price Associates, Inc. (Advisor), as well as a Special Servicing Agreement among the fund, the Advisor, and each of the underlying funds in which it invests (Special Servicing Agreement). The Special Servicing Agreement allows the T. Rowe Price Spectrum Funds (Spectrum Funds) to pass through their operating expenses to the underlying funds in which they invest if the benefit to the underlying funds equals or exceeds the costs of absorbing these expenses and provides that the Advisor will be responsible for bearing any expenses that would result from an underlying fund’s share of the aggregate expenses of the Spectrum Funds exceeding the estimated savings to the underlying fund from the operation of the Spectrum Funds. In that regard, at a meeting held on March 9–10, 2020 (Meeting), the Board, including all of the fund’s independent directors, approved the continuation of the fund’s Advisory Contract and Special Servicing Agreement. At the Meeting, the Board considered the factors and reached the conclusions described below relating to the selection of the Advisor and approval of the Advisory Contract and the continuation of the Special Servicing Agreement. The independent directors were assisted in their evaluation of the Advisory Contract and Special Servicing Agreement by independent legal counsel from whom they received separate legal advice and with whom they met separately.
In providing information to the Board, the Advisor was guided by a detailed set of requests for information submitted by independent legal counsel on behalf of the independent directors. In considering and approving the Advisory Contract and Special Servicing Agreement, the Board considered the information it believed was relevant, including, but not limited to, the information discussed below. The Board considered not only the specific information presented in connection with the Meeting but also the knowledge gained over time through interaction with the Advisor about various topics. The Board meets regularly and, at each of its meetings, covers an extensive agenda of topics and materials and considers factors that are relevant to its annual consideration of the renewal of the T. Rowe Price funds’ advisory contracts, including performance and the services and support provided to the funds and their shareholders.
Services Provided by the Advisor
The Board considered the nature, quality, and extent of the services provided to the fund by the Advisor. These services included, but were not limited to, directing the fund’s investments in accordance with its investment program and the overall management of the fund’s portfolio, as well as a variety of related activities such as financial, investment operations, and administrative services; compliance; maintaining the fund’s records and registrations; and shareholder communications. The Board also reviewed the background and experience of the Advisor’s senior management team and investment personnel involved in the management of the fund, as well as the Advisor’s compliance record. The Board concluded that it was satisfied with the nature, quality, and extent of the services provided by the Advisor.
Investment Performance of the Fund
The Board took into account discussions with the Advisor and reports that it receives throughout the year relating to fund performance. In connection with the Meeting, the Board reviewed the fund’s net annualized total returns for the 1-, 2-, 3-, 4-, 5-, and 10-year periods as of September 30, 2019, and compared these returns with the performance of a peer group of funds with similar investment programs and a wide variety of other previously agreed-upon comparable performance measures and market data, including those supplied by Broadridge, which is an independent provider of mutual fund data.
On the basis of this evaluation and the Board’s ongoing review of investment results, and factoring in the relative market conditions during certain of the performance periods, the Board concluded that the fund’s performance was satisfactory.
Costs, Benefits, Profits, and Economies of Scale
The Advisor does not receive management fees from the fund, and operating expenses of the fund are borne by the underlying T. Rowe Price funds in which it invests pursuant to the Special Servicing Agreement. In connection with its review of the Special Servicing Agreement, the Board reviewed various cost/benefit analyses to demonstrate the benefits to the underlying funds versus the costs they incur, which illustrate that the primary benefit provided by the Spectrum Funds to the underlying funds is the reduction in expenses associated with the consolidation of shareholder accounts that would otherwise be invested directly in the underlying funds.
The Advisor receives management fees from other T. Rowe Price funds in which the fund invests. However, since the Advisor does not receive any management fees directly from the fund, the Board did not review information relating to revenues received by the Advisor under the Advisory Contract. The Board did review information regarding benefits that the Advisor (and its affiliates) may have realized from its relationship with the fund or other T. Rowe Price funds in which the fund invests, including any research received under “soft dollar” agreements and commission-sharing arrangements with broker-dealers. The Board considered that the Advisor may have received some benefit from its soft-dollar arrangements pursuant to which it receives research from broker-dealers that execute the applicable fund’s portfolio transactions. However, the Board also considered that, effective January 2020, the Advisor began bearing the cost of research services for all client accounts that it advises, including the T. Rowe Price funds. The Board also received information on the estimated costs incurred and profits realized by the Advisor and its affiliates from advising T. Rowe Price funds and concluded that the Advisor’s profits were reasonable. Although the Advisor does not receive management fees directly from the fund under the Advisory Contract, the fund’s shareholders benefit from potential economies of scale through a decline in the fund’s total expense ratio as the fund and underlying funds grow in size.
Fees and Expenses
The Board was provided with information regarding industry trends in management fees and expenses. Among other things, the Board reviewed data for peer groups that were compiled by Broadridge, which compared: (i) total expenses, actual management fees, and nonmanagement expenses of the fund with a group of competitor funds selected by Broadridge (Expense Group) and (ii) total expenses, actual management fees, and nonmanagement expenses of the fund with a broader set of funds within the Lipper investment classification (Expense Universe). The Board considered the fund’s actual management fee rate (which reflects that the Advisor does not receive any management fees directly from the fund), operating expenses, and total expenses (which reflect the net total expense ratio of the fund, including acquired fund fees and expenses associated with the underlying funds, after any waivers, reductions, or reimbursements) in comparison with the information for the Broadridge peer groups. Broadridge generally constructed the peer groups by seeking the most comparable funds based on similar investment classifications and objectives, expense structure, asset size, and operating components and attributes and ranked funds into quintiles, with the first quintile representing the funds with the lowest relative expenses and the fifth quintile representing the funds with the highest relative expenses. However, there were not sufficient comparable funds to meaningfully rank within quintiles. For the Expense Group, the information provided to the Board indicated that the fund’s actual management fee rate and total expenses both ranked first out of three funds. For the Expense Universe, the information provided to the Board indicated that the fund’s actual management fee rate ranked first out of five funds, and the fund’s total expenses ranked first out of five funds and second out of five funds.
The Board also reviewed the fee schedules for other investment portfolios with similar mandates that are advised or subadvised by the Advisor and its affiliates, including separately managed accounts for institutional and individual investors; subadvised funds; and other sponsored investment portfolios, including collective investment trusts and pooled vehicles organized and offered to investors outside the United States. Management provided the Board with information about the Advisor’s responsibilities and services provided to subadvisory and other institutional account clients, including information about how the requirements and economics of the institutional business are fundamentally different from those of the mutual fund business. The Board considered information showing that the Advisor’s mutual fund business is generally more complex from a business and compliance perspective than its institutional account business and considered various relevant factors, such as the broader scope of operations and oversight, more extensive shareholder communication infrastructure, greater asset flows, heightened business risks, and differences in applicable laws and regulations associated with the Advisor’s proprietary mutual fund business. In assessing the reasonableness of the fund’s management fee rate, the Board considered the differences in the nature of the services required for the Advisor to manage its mutual fund business versus managing a discrete pool of assets as a subadvisor to another institution’s mutual fund or for an institutional account and that the Advisor generally performs significant additional services and assumes greater risk in managing the fund and other T. Rowe Price funds than it does for institutional account clients.
On the basis of the information provided and the factors considered, the Board concluded that the fees paid by the fund under the Advisory Contract are reasonable.
Approval of the Advisory Contract and Special Servicing Agreement
As noted, the Board approved the continuation of the Advisory Contract as well as the Special Servicing Agreement. No single factor was considered in isolation or to be determinative to the decision. Rather, the Board concluded, in light of a weighting and balancing of all factors considered, that it was in the best interests of the fund and its shareholders for the Board to approve the continuation of the Advisory Contract and that there is a reasonable basis to conclude that the benefits to the underlying funds exceed the costs they incur and that it was in the best interests of the fund and its underlying funds to approve continuation of the Special Servicing Agreement.
LIQUIDITY RISK MANAGEMENT PROGRAM
In accordance with Rule 22e-4 (Liquidity Rule) under the Investment Company Act of 1940, as amended, the fund has established a liquidity risk management program (Liquidity Program) reasonably designed to assess and manage the fund’s liquidity risk, which generally represents the risk that the fund would not be able to meet redemption requests without significant dilution of remaining investors’ interests in the fund. The fund’s Board of Directors (Board) has appointed the fund’s investment advisor, T. Rowe Price Associates, Inc. (Price Associates), as the administrator of the Liquidity Program. As administrator, Price Associates is responsible for overseeing the day-to-day operations of the Liquidity Program and, among other things, is responsible for assessing, managing, and reviewing with the Board at least annually the liquidity risk of each T. Rowe Price fund. Price Associates has delegated oversight of the Liquidity Program to a Liquidity Risk Committee (LRC), which is a cross-functional committee composed of personnel from multiple departments within Price Associates.
The Liquidity Program’s principal objectives include supporting the T. Rowe Price funds’ compliance with limits on investments in illiquid assets and mitigating the risk that the fund will be unable to timely meet its redemption obligations. The Liquidity Program also includes a number of elements that support the management and assessment of liquidity risk, including an annual assessment of factors that influence the fund’s liquidity and the periodic classification and reclassification of a fund’s investments into categories that reflect the LRC’s assessment of their relative liquidity under current market conditions. Under the Liquidity Program, every investment held by the fund is classified at least monthly into one of four liquidity categories based on estimations of the investment’s ability to be sold during designated time frames in current market conditions without significantly changing the investment’s market value.
As required by the Liquidity Rule, at a meeting held on May 4, 2020, the Board was presented with an annual assessment prepared by the LRC, on behalf of Price Associates, that addressed the operation of the Liquidity Program and assessed its adequacy and effectiveness of implementation, including any material changes to the Liquidity Program and the determination of each fund’s Highly Liquid Investment Minimum (HLIM). The annual assessment included consideration of the following factors, as applicable: the fund’s investment strategy and liquidity of portfolio investments during normal and reasonably foreseeable stressed conditions, including whether the investment strategy is appropriate for an open-end fund, the extent to which the strategy involves a relatively concentrated portfolio or large positions in particular issuers, and the use of borrowings for investment purposes and derivatives; short-term and long-term cash flow projections covering both normal and reasonably foreseeable stressed conditions; and holdings of cash and cash equivalents, as well as available borrowing arrangements.
For the fund and other T. Rowe Price funds, the annual assessment incorporated a report related to a fund’s holdings, shareholder and portfolio concentration, any borrowings during the period, cash flow projections, and other relevant data for the period of June 1, 2019, through March 31, 2020. The report described the methodology for classifying a fund’s investments (including derivative transactions) into one of four liquidity categories, as well as the percentage of a fund’s investments assigned to each category. It also explained the methodology for establishing a fund’s HLIM and noted that the LRC reviews the HLIM assigned to each fund no less frequently than annually.
Certain provisions of the Liquidity Program initially became effective on December 1, 2018, and the full Liquidity Program was formally approved by the Board in April 2019. During the period covered by the annual assessment, the LRC has concluded, and reported to the Board, that the Liquidity Program since its implementation has operated adequately and effectively and is reasonably designed to assess and manage the fund’s liquidity risk.
| T. ROWE PRICE SPECTRUM INTERNATIONAL FUND |
|
APPROVAL OF INVESTMENT MANAGEMENT AGREEMENT
Each year, the fund’s Board of Directors (Board) considers the continuation of the investment management agreement (Advisory Contract) between the fund and its investment advisor, T. Rowe Price Associates, Inc. (Advisor), as well as a Special Servicing Agreement among the fund, the Advisor, and each of the underlying funds in which it invests (Special Servicing Agreement). The Special Servicing Agreement allows the T. Rowe Price Spectrum Funds (Spectrum Funds) to pass through their operating expenses to the underlying funds in which they invest if the benefit to the underlying funds equals or exceeds the costs of absorbing these expenses and provides that the Advisor will be responsible for bearing any expenses that would result from an underlying fund’s share of the aggregate expenses of the Spectrum Funds exceeding the estimated savings to the underlying fund from the operation of the Spectrum Funds. In that regard, at a meeting held on March 9–10, 2020 (Meeting), the Board, including all of the fund’s independent directors, approved the continuation of the fund’s Advisory Contract and Special Servicing Agreement. At the Meeting, the Board considered the factors and reached the conclusions described below relating to the selection of the Advisor and approval of the Advisory Contract and the continuation of the Special Servicing Agreement. The independent directors were assisted in their evaluation of the Advisory Contract and Special Servicing Agreement by independent legal counsel from whom they received separate legal advice and with whom they met separately.
In providing information to the Board, the Advisor was guided by a detailed set of requests for information submitted by independent legal counsel on behalf of the independent directors. In considering and approving the Advisory Contract and Special Servicing Agreement, the Board considered the information it believed was relevant, including, but not limited to, the information discussed below. The Board considered not only the specific information presented in connection with the Meeting but also the knowledge gained over time through interaction with the Advisor about various topics. The Board meets regularly and, at each of its meetings, covers an extensive agenda of topics and materials and considers factors that are relevant to its annual consideration of the renewal of the T. Rowe Price funds’ advisory contracts, including performance and the services and support provided to the funds and their shareholders.
Services Provided by the Advisor
The Board considered the nature, quality, and extent of the services provided to the fund by the Advisor. These services included, but were not limited to, directing the fund’s investments in accordance with its investment program and the overall management of the fund’s portfolio, as well as a variety of related activities such as financial, investment operations, and administrative services; compliance; maintaining the fund’s records and registrations; and shareholder communications. The Board also reviewed the background and experience of the Advisor’s senior management team and investment personnel involved in the management of the fund, as well as the Advisor’s compliance record. The Board concluded that it was satisfied with the nature, quality, and extent of the services provided by the Advisor.
Investment Performance of the Fund
The Board took into account discussions with the Advisor and reports that it receives throughout the year relating to fund performance. In connection with the Meeting, the Board reviewed the fund’s net annualized total returns for the 1-, 2-, 3-, 4-, 5-, and 10-year periods as of September 30, 2019, and compared these returns with the performance of a peer group of funds with similar investment programs and a wide variety of other previously agreed-upon comparable performance measures and market data, including those supplied by Broadridge, which is an independent provider of mutual fund data.
On the basis of this evaluation and the Board’s ongoing review of investment results, and factoring in the relative market conditions during certain of the performance periods, the Board concluded that the fund’s performance was satisfactory.
Costs, Benefits, Profits, and Economies of Scale
The Advisor does not receive management fees from the fund, and operating expenses of the fund are borne by the underlying T. Rowe Price funds in which it invests pursuant to the Special Servicing Agreement. In connection with its review of the Special Servicing Agreement, the Board reviewed various cost/benefit analyses to demonstrate the benefits to the underlying funds versus the costs they incur, which illustrate that the primary benefit provided by the Spectrum Funds to the underlying funds is the reduction in expenses associated with the consolidation of shareholder accounts that would otherwise be invested directly in the underlying funds.
The Advisor receives management fees from other T. Rowe Price funds in which the fund invests. However, since the Advisor does not receive any management fees directly from the fund, the Board did not review information relating to revenues received by the Advisor under the Advisory Contract. The Board did review information regarding benefits that the Advisor (and its affiliates) may have realized from its relationship with the fund or other T. Rowe Price funds in which the fund invests, including any research received under “soft dollar” agreements and commission-sharing arrangements with broker-dealers. The Board considered that the Advisor may have received some benefit from its soft-dollar arrangements pursuant to which it receives research from broker-dealers that execute the applicable fund’s portfolio transactions. However, the Board also considered that, effective January 2020, the Advisor began bearing the cost of research services for all client accounts that it advises, including the T. Rowe Price funds. The Board also received information on the estimated costs incurred and profits realized by the Advisor and its affiliates from advising T. Rowe Price funds and concluded that the Advisor’s profits were reasonable. Although the Advisor does not receive management fees directly from the fund under the Advisory Contract, the fund’s shareholders benefit from potential economies of scale through a decline in the fund’s total expense ratio as the fund and underlying funds grow in size.
Fees and Expenses
The Board was provided with information regarding industry trends in management fees and expenses. Among other things, the Board reviewed data for peer groups that were compiled by Broadridge, which compared: (i) total expenses, actual management fees, and nonmanagement expenses of the fund with a group of competitor funds selected by Broadridge (Expense Group) and (ii) total expenses, actual management fees, and nonmanagement expenses of the fund with a broader set of funds within the Lipper investment classification (Expense Universe). The Board considered the fund’s actual management fee rate (which reflects that the Advisor does not receive any management fees directly from the fund), operating expenses, and total expenses (which reflect the net total expense ratio of the fund, including acquired fund fees and expenses associated with the underlying funds, after any waivers, reductions, or reimbursements) in comparison with the information for the Broadridge peer groups. Broadridge generally constructed the peer groups by seeking the most comparable funds based on similar investment classifications and objectives, expense structure, asset size, and operating components and attributes and ranked funds into quintiles, with the first quintile representing the funds with the lowest relative expenses and the fifth quintile representing the funds with the highest relative expenses. The information provided to the Board indicated that the fund’s actual management fee rate ranked in the first quintile (Expense Group and Expense Universe), and the fund’s total expenses ranked in the first quintile (Expense Group and Expense Universe).
The Board also reviewed the fee schedules for other investment portfolios with similar mandates that are advised or subadvised by the Advisor and its affiliates, including separately managed accounts for institutional and individual investors; subadvised funds; and other sponsored investment portfolios, including collective investment trusts and pooled vehicles organized and offered to investors outside the United States. Management provided the Board with information about the Advisor’s responsibilities and services provided to subadvisory and other institutional account clients, including information about how the requirements and economics of the institutional business are fundamentally different from those of the mutual fund business. The Board considered information showing that the Advisor’s mutual fund business is generally more complex from a business and compliance perspective than its institutional account business and considered various relevant factors, such as the broader scope of operations and oversight, more extensive shareholder communication infrastructure, greater asset flows, heightened business risks, and differences in applicable laws and regulations associated with the Advisor’s proprietary mutual fund business. In assessing the reasonableness of the fund’s management fee rate, the Board considered the differences in the nature of the services required for the Advisor to manage its mutual fund business versus managing a discrete pool of assets as a subadvisor to another institution’s mutual fund or for an institutional account and that the Advisor generally performs significant additional services and assumes greater risk in managing the fund and other T. Rowe Price funds than it does for institutional account clients.
On the basis of the information provided and the factors considered, the Board concluded that the fees paid by the fund under the Advisory Contract are reasonable.
Approval of the Advisory Contract and Special Servicing Agreement
As noted, the Board approved the continuation of the Advisory Contract as well as the Special Servicing Agreement. No single factor was considered in isolation or to be determinative to the decision. Rather, the Board concluded, in light of a weighting and balancing of all factors considered, that it was in the best interests of the fund and its shareholders for the Board to approve the continuation of the Advisory Contract and that there is a reasonable basis to conclude that the benefits to the underlying funds exceed the costs they incur and that it was in the best interests of the fund and its underlying funds to approve continuation of the Special Servicing Agreement.
LIQUIDITY RISK MANAGEMENT PROGRAM
In accordance with Rule 22e-4 (Liquidity Rule) under the Investment Company Act of 1940, as amended, the fund has established a liquidity risk management program (Liquidity Program) reasonably designed to assess and manage the fund’s liquidity risk, which generally represents the risk that the fund would not be able to meet redemption requests without significant dilution of remaining investors’ interests in the fund. The fund’s Board of Directors (Board) has appointed the fund’s investment advisor, T. Rowe Price Associates, Inc. (Price Associates), as the administrator of the Liquidity Program. As administrator, Price Associates is responsible for overseeing the day-to-day operations of the Liquidity Program and, among other things, is responsible for assessing, managing, and reviewing with the Board at least annually the liquidity risk of each T. Rowe Price fund. Price Associates has delegated oversight of the Liquidity Program to a Liquidity Risk Committee (LRC), which is a cross-functional committee composed of personnel from multiple departments within Price Associates.
The Liquidity Program’s principal objectives include supporting the T. Rowe Price funds’ compliance with limits on investments in illiquid assets and mitigating the risk that the fund will be unable to timely meet its redemption obligations. The Liquidity Program also includes a number of elements that support the management and assessment of liquidity risk, including an annual assessment of factors that influence the fund’s liquidity and the periodic classification and reclassification of a fund’s investments into categories that reflect the LRC’s assessment of their relative liquidity under current market conditions. Under the Liquidity Program, every investment held by the fund is classified at least monthly into one of four liquidity categories based on estimations of the investment’s ability to be sold during designated time frames in current market conditions without significantly changing the investment’s market value.
As required by the Liquidity Rule, at a meeting held on May 4, 2020, the Board was presented with an annual assessment prepared by the LRC, on behalf of Price Associates, that addressed the operation of the Liquidity Program and assessed its adequacy and effectiveness of implementation, including any material changes to the Liquidity Program and the determination of each fund’s Highly Liquid Investment Minimum (HLIM). The annual assessment included consideration of the following factors, as applicable: the fund’s investment strategy and liquidity of portfolio investments during normal and reasonably foreseeable stressed conditions, including whether the investment strategy is appropriate for an open-end fund, the extent to which the strategy involves a relatively concentrated portfolio or large positions in particular issuers, and the use of borrowings for investment purposes and derivatives; short-term and long-term cash flow projections covering both normal and reasonably foreseeable stressed conditions; and holdings of cash and cash equivalents, as well as available borrowing arrangements.
For the fund and other T. Rowe Price funds, the annual assessment incorporated a report related to a fund’s holdings, shareholder and portfolio concentration, any borrowings during the period, cash flow projections, and other relevant data for the period of June 1, 2019, through March 31, 2020. The report described the methodology for classifying a fund’s investments (including derivative transactions) into one of four liquidity categories, as well as the percentage of a fund’s investments assigned to each category. It also explained the methodology for establishing a fund’s HLIM and noted that the LRC reviews the HLIM assigned to each fund no less frequently than annually.
Certain provisions of the Liquidity Program initially became effective on December 1, 2018, and the full Liquidity Program was formally approved by the Board in April 2019. During the period covered by the annual assessment, the LRC has concluded, and reported to the Board, that the Liquidity Program since its implementation has operated adequately and effectively and is reasonably designed to assess and manage the fund’s liquidity risk.
Item 1. (b) Notice pursuant to Rule 30e-3.
Not applicable.
Item 2. Code of Ethics.
A code of ethics, as defined in Item 2 of Form N-CSR, applicable to its principal executive officer, principal financial officer, principal accounting officer or controller, or persons performing similar functions is filed as an exhibit to the registrant’s annual Form N-CSR. No substantive amendments were approved or waivers were granted to this code of ethics during the registrant’s most recent fiscal half-year.
Item 3. Audit Committee Financial Expert.
Disclosure required in registrant’s annual Form N-CSR.
Item 4. Principal Accountant Fees and Services.
Disclosure required in registrant’s annual Form N-CSR.
Item 5. Audit Committee of Listed Registrants.
Not applicable.
Item 6. Investments.
(a) Not applicable. The complete schedule of investments is included in Item 1 of this Form N-CSR.
(b) Not applicable.
Item 7. Disclosure of Proxy Voting Policies and Procedures for Closed-End Management Investment Companies.
Not applicable.
Item 8. Portfolio Managers of Closed-End Management Investment Companies.
Not applicable.
Item 9. Purchases of Equity Securities by Closed-End Management Investment Company and Affiliated Purchasers.
Not applicable.
Item 10. Submission of Matters to a Vote of Security Holders.
There has been no change to the procedures by which shareholders may recommend nominees to the registrant’s board of directors.
Item 11. Controls and Procedures.
(a) The registrant’s principal executive officer and principal financial officer have evaluated the registrant’s disclosure controls and procedures within 90 days of this filing and have concluded that the registrant’s disclosure controls and procedures were effective, as of that date, in ensuring that information required to be disclosed by the registrant in this Form N-CSR was recorded, processed, summarized, and reported timely.
(b) The registrant’s principal executive officer and principal financial officer are aware of no change in the registrant’s internal control over financial reporting that occurred during the period covered by this report that has materially affected, or is reasonably likely to materially affect, the registrant’s internal control over financial reporting.
Item 12. Disclosure of Securities Lending Activities for Closed-End Management Investment Companies.
Not applicable.
Item 13. Exhibits.
(a)(1) The registrant’s code of ethics pursuant to Item 2 of Form N-CSR is filed with the registrant’s annual Form N-CSR.
(2) Separate certifications by the registrant's principal executive officer and principal financial officer, pursuant to Section 302 of the Sarbanes-Oxley Act of 2002 and required by Rule 30a-2(a) under the Investment Company Act of 1940, are attached.
(3) Written solicitation to repurchase securities issued by closed-end companies: not applicable.
(b) A certification by the registrant's principal executive officer and principal financial officer, pursuant to Section 906 of the Sarbanes-Oxley Act of 2002 and required by Rule 30a-2(b) under the Investment Company Act of 1940, is attached.
SIGNATURES
Pursuant to the requirements of the Securities Exchange Act of 1934 and the Investment Company Act of 1940, the registrant has duly caused this report to be signed on its behalf by the undersigned, thereunto duly authorized.
T. Rowe Price Spectrum Fund, Inc.
| By | | /s/ David Oestreicher |
| | | David Oestreicher |
| | | Principal Executive Officer |
| |
| Date | | August 18, 2020 | | | | |
Pursuant to the requirements of the Securities Exchange Act of 1934 and the Investment Company Act of 1940, this report has been signed below by the following persons on behalf of the registrant and in the capacities and on the dates indicated.
| By | | /s/ David Oestreicher |
| | | David Oestreicher |
| | | Principal Executive Officer |
| |
| Date | | August 18, 2020 | | | | |
| |
| |
| By | | /s/ Alan S. Dupski |
| | | Alan S. Dupski |
| | | Principal Financial Officer |
| |
| Date | | August 18, 2020 | | | | |