UNITED STATES
SECURITIES AND EXCHANGE COMMISSION
Washington, D.C. 20549
FORM N-CSR
CERTIFIED SHAREHOLDER REPORT OF REGISTERED
MANAGEMENT INVESTMENT COMPANIES
Investment Company Act File Number: 811-04998
| T. Rowe Price Spectrum Fund, Inc. |
|
| (Exact name of registrant as specified in charter) |
| |
| 100 East Pratt Street, Baltimore, MD 21202 |
|
| (Address of principal executive offices) |
| |
| David Oestreicher |
| 100 East Pratt Street, Baltimore, MD 21202 |
|
| (Name and address of agent for service) |
Registrant’s telephone number, including area code: (410) 345-2000
Date of fiscal year end: December 31
Date of reporting period: December 31, 2020
Item 1. Reports to Shareholders
(a) Report pursuant to Rule 30e-1.
| Spectrum Funds | December 31, 2020 |
| PRSGX | Investor Class |
| RPSIX | Investor Class |
| PSILX | Investor Class |
| T. ROWE PRICE SPECTRUM FUNDS |
|
HIGHLIGHTS
| ■ | During the 12-month period ended December 31, 2020, the Spectrum International Equity Fund (formerly known as the Spectrum International Fund) outperformed its benchmark, but the Spectrum Diversified Equity Fund (formerly known as the Spectrum Growth Fund) and Spectrum Income Fund both lagged their benchmarks. The funds’ performance relative to their respective Lipper peer groups was mixed. |
| |
| ■ | The coronavirus pandemic and efforts to contain its spread dominated global markets in 2020. After a steep sell-off in the first quarter, the firm response by governments and central banks around the world was a key factor in supporting the economic and market recovery. Later in the year, positive vaccine developments and their rollouts raised hopes for a broader recovery and boosted sectors that had been hard hit in the initial phases of the pandemic. |
| |
| ■ | Strong security selection drove relative outperformance in the Spectrum International Equity Fund. In the Spectrum Diversified Equity Fund and Spectrum Income Fund, exposure to diversifying sectors detracted from relative results. |
| |
| ■ | Given the uncertain impact of positive and negative forces driving global financial markets, we believe that the Spectrum Funds’ broad diversification and the strength of T. Rowe Price’s fundamental research platform should benefit our investors over time across a range of market and economic environments. |

Log in to your account at troweprice.com for more information.
*Certain mutual fund accounts that are assessed an annual account service fee can also save money by switching to e-delivery.
CIO Market Commentary
Dear Shareholder
Nearly all major stock and bond indexes produced positive results during 2020 as markets recovered from the steep sell-off that resulted from the spread of the coronavirus. Extraordinary fiscal and monetary support from global governments and central banks helped spur the rebound, although the pandemic continued to pose significant public health and economic challenges as the year came to an end.
In the U.S., the large-cap Dow Jones Industrial Average and S&P 500 Index reached record highs, as did the technology-heavy Nasdaq Composite Index—a result that few would have predicted in late March after the benchmarks tumbled more than 30% as governments instituted lockdowns to try to halt the spread of the virus. Large-cap information technology and internet-related firms helped lead the rebound as they benefited from the work-from-home environment and an acceleration in demand for online services.
Within the S&P 500, the technology and consumer discretionary sectors were the top performers, and communication services and materials stocks also outperformed. Despite a late rally, the energy sector trailed with significant losses due to a plunge in oil prices.
Most equity markets outside the U.S. also performed well. Emerging markets outpaced developed markets, and Asian shares delivered strong results as China and other countries in the region proved relatively successful in containing the coronavirus.
Growth stocks significantly outpaced their value counterparts for the full year; however, value shares rallied late in the period. Positive vaccine news in November raised hopes for a return to normalcy in 2021 and boosted sectors that had been beaten down in the initial phases of the pandemic.
Within the fixed income universe, corporate bonds delivered strong results as the market easily absorbed a torrent of new issuance. After falling to record lows in March, intermediate- and longer-term Treasury yields ticked higher later in the year but remained very low by historical standards, a factor that encouraged investors to seek out riskier securities with higher return potential.
While investors had reason to cheer the market’s recovery, the global economic outlook remained unclear as the year came to an end. Most notable on the positive side was the start of vaccine distributions, which provided hope that the pandemic was in its final phase. In addition, Congress passed a $900 billion coronavirus relief package, supplementing the $2.4 trillion allocated to address the crisis earlier in the year, and the Fed continued to pledge very accommodative monetary policies for the foreseeable future. Meanwhile, political uncertainty diminished with Joe Biden’s victory in the U.S. presidential election and the completion of a Brexit trade deal between the UK and the European Union.
On the negative side, concerns about a resurgence in virus hospitalizations led to new lockdowns and business restrictions in many countries, which in turn appeared to threaten economic recoveries. In the U.S., after a strong recovery in the summer and fall, the pace of hiring slowed late in the year, and household spending declined in November for the first time since April.
It was a remarkable 12-month period in many ways, but as far as markets are concerned, I can recall no calendar year that so starkly displayed evidence of both fear and greed. Fear emerged during the March sell-off and again in April as oil futures briefly traded in negative territory. Greed surfaced later as some assets seemed to continue to rally without fundamental support. Bitcoin rocketed to a record high of $29,000 by year-end, and the amount of money raised by initial public offerings also climbed to historic levels. While valuations are still attractive in some areas of the market, other sectors appear to have already priced in a strong rebound in earnings and are trading at elevated levels.
There are both risks and potential rewards in this environment, and we believe strong fundamental analysis and skilled active security selection will remain critical components of investment success.
Thank you for your continued confidence in T. Rowe Price.
Sincerely,

Robert Sharps
Group Chief Investment Officer
Management’s Discussion of Fund Performance
SPECTRUM DIVERSIFIED EQUITY FUND
INVESTMENT OBJECTIVE
The fund seeks long-term capital appreciation and growth of income with current income a secondary objective.
FUND COMMENTARY
How did the fund perform in the past 12 months?
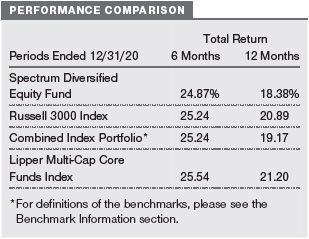
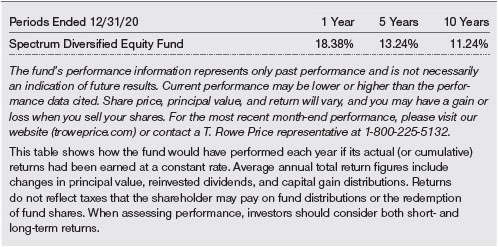
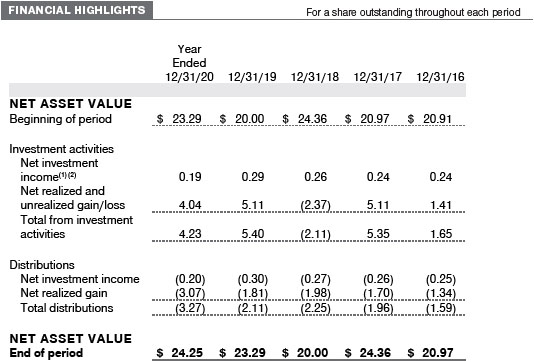
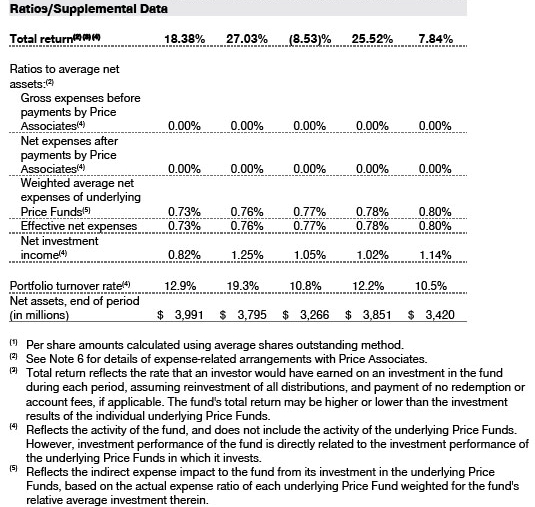
The Spectrum Diversified Equity Fund returned 18.38% for the 12-month period ended December 31, 2020. The fund underperformed the Russell 3000 Index and its combined index portfolio, a custom-weighted benchmark composed of indexes that represent the asset classes in which the fund invests. It also trailed the Lipper Multi-Cap Core Funds Index of peer funds. (Past performance cannot guarantee future results.)
What factors influenced the fund’s performance?
The Spectrum Diversified Equity Fund posted double-digit gains for the year, overcoming losses incurred during the coronavirus-induced sell-off in the spring. Despite strong absolute returns, the fund lagged its benchmark. Exposure to asset classes that are not included in the fund’s benchmark (such as real assets equities) detracted, while security selection and tactical decisions added value.
The inclusion of real assets equities weighed on relative performance, although this negative impact was partly offset by a tactical underweight allocation and positive stock selection in the sector. Led by the names levered to energy, real assets equities gained ground late in the period, driven by optimism that progress in the fight against the coronavirus would lead to normalized demand. However, while commodity prices mostly recovered by year-end, the sector lagged global equities.
Conversely, strong security selection contributed to relative performance as several underlying funds outperformed their respective benchmarks. Despite relatively modest absolute returns, our U.S. large-cap value equity strategy significantly outpaced its benchmark and was a notable contributor to performance. Overall, names in the information technology and health care sectors added value. Strong positive results and outperformance among the U.S. small-cap growth and international small-cap equity strategies also added value. However, underperformance among U.S. and international large-cap growth equity strategies was a drag.
Decisions to overweight or underweight various asset classes worked in our favor. As previously mentioned, the underweight allocation to real assets equities proved beneficial. Tactical allocations between U.S. growth and U.S. value stocks added further to performance. An overweight to U.S. growth stocks for much of the period helped performance, driven by secular tailwinds supporting growth-oriented sectors—such as consumer discretionary and communication services—that proved well suited for the stay-at-home world. As valuations for growth stocks became extended, we pared back our overweight in favor of U.S. value stocks, which benefited from a cyclical rally later in the period due to promising vaccine news and diminishing political uncertainty in the U.S. Over the period, our overweight to international equities weighed on relative returns as they lagged U.S. equities earlier in the period.
How is the fund positioned?
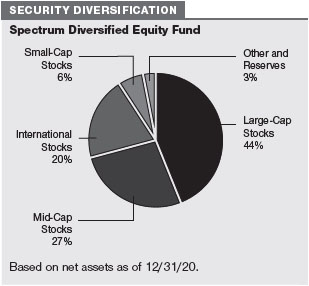
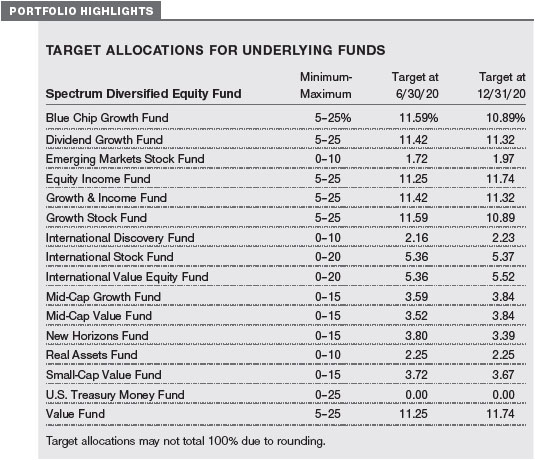
The Spectrum Diversified Equity Fund invests in several underlying T. Rowe Price funds that focus on U.S. and international equities across the full range of market capitalizations and styles, as well as in emerging markets.
We are currently tilted to an overweight to international stocks relative to U.S. stocks. International equities offer relatively attractive valuations, and their more cyclical profile could be beneficial as the outlook for global growth in 2021 has improved. Aggressive stimulus measures and stable Chinese demand could also provide tailwinds for international stocks. Conversely, the U.S.’s more defensive sector profile now appears relatively less supportive in the context of a cyclical recovery. Additionally, expectations for potential weakness in the U.S. dollar should benefit international investments. Outside the U.S., we are overweight to emerging markets stocks, as their exposure to global trade and favorable currency trends offer strong tailwinds for the sector.
We have a modest overweight in U.S. value-oriented equities, as they may benefit from the gradual recovery in economic growth and have attractive valuations versus growth stocks. As the recovery progresses, the potential for rising rates and inflation could also provide a favorable backdrop for value stocks. Secular growth companies in the U.S. have been the greatest beneficiaries of the current recovery, and their extended valuations leave them vulnerable to negative shocks. We are overweight to U.S. small-cap equities, as they offer upside potential and could outpace larger companies in an economic recovery. Fiscal stimulus and the release of pent-up demand post-pandemic could also be supportive for small-caps.
Among international equities, we also increased our position in value stocks, as valuations for growth stocks became more expensive. Value stocks with more compelling valuations could also benefit from a cyclical economic recovery. Among value-oriented sectors, financials could face continued headwinds from low interest rates. International growth stocks, which have a more defensive profile, could lag their value peers in an improving economic backdrop.
We are underweight to inflation-sensitive real assets equities, as we balance expectations for modestly higher inflation against structural headwinds facing the real estate and energy sectors. Inflation expectations have risen on an improving outlook for growth and the perception that central banks will be more tolerant of inflation as they prioritize growth and employment. However, commercial real estate remains under pressure from structural headwinds that have been exacerbated by the pandemic, including work-from-home and online retail trends. Despite the expected recovery in demand, the energy sector still faces longer-term supply and demand imbalances and a growing emphasis on renewable energy.
SPECTRUM INCOME FUND
INVESTMENT OBJECTIVE
The fund seeks a high level of current income with moderate share price fluctuation.
FUND COMMENTARY
How did the fund perform in the past 12 months?
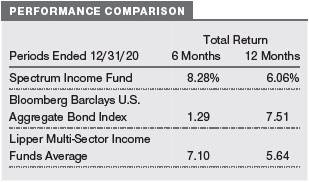
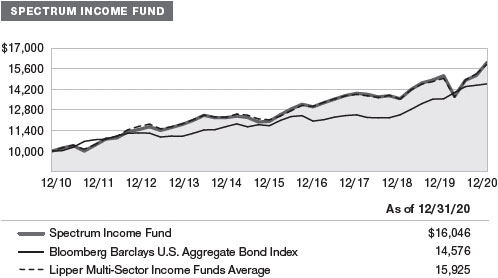
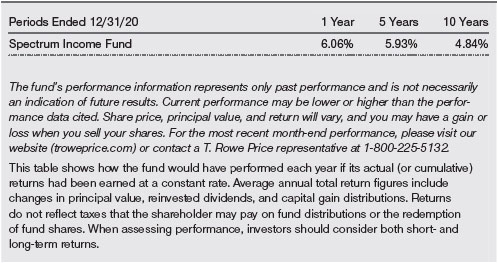
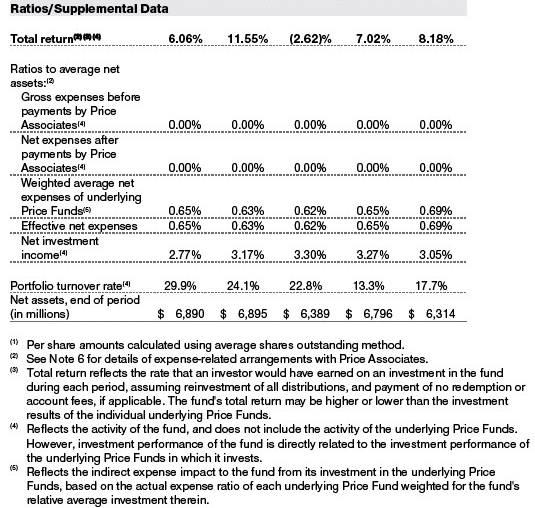
The Spectrum Income Fund returned 6.06% for the 12-month period ended December 31, 2020. The fund outperformed its peer Lipper Multi-Sector Income Funds Average benchmark but trailed the Bloomberg Barclays U.S. Aggregate Bond Index. (Past performance cannot guarantee future results.)
What factors influenced the fund’s performance?
The Spectrum Income Fund posted gains for the year but lagged its benchmark. Exposure to diversifying sectors (such as high yield and dividend-paying equities) detracted, while tactical decisions and security selection marginally added value.
Within the fund, exposure to sectors and asset classes that are not included in the fund’s benchmark detracted from relative returns. Dividend-paying equities, in particular, declined precipitously with the market downturn in the spring. While equity markets enjoyed a sharp recovery, value stocks struggled and dividend yield was a headwind. Our exposure to the asset class hurt relative performance, but the overall impact was partly mitigated as these equities significantly outpaced investment-grade bonds in the latter half of the year.
Fixed income diversifiers, for the most part, weighed on relative results, as they lagged investment-grade issues. Exposure to high yield bonds, coupled with security selection in the sector, hurt relative returns. With a high concentration of issuers in the energy sector, these bonds plunged as the coronavirus sharply curtailed economic activity and destroyed demand for oil and other commodities. Although high yield bonds were strong contributors during the recovery from the market sell-off, they trailed investment-grade issues over the full period and hindered performance.
Notably, exposure to long-term U.S. Treasuries—which delivered strong double-digit returns for the year—contributed to relative returns, but a tactical underweight partly offset the gains. Treasuries performed strongly as risk assets sold off, becoming increasingly expensive, and we used the gains as a funding source for lower-quality issues with higher upside potential and to increase our allocation to dividend-paying stocks as equity markets sold off.
Security selection was mixed. The investment-grade bond strategy underperformed its benchmark and detracted for the period. Early in the year, the strategy was positioned for a cyclical rebound and was punished as markets sharply sold off in the spring. Although the strategy subsequently gained ground for most of the year, the steep losses proved difficult to overcome. Conversely, positive selection within the absolute return-oriented bond strategy contributed as the strategy managed downside risk successfully during a period of risk aversion and was also well positioned to participate in the market rebound and the cyclical rally late in the year.
How is the fund positioned?
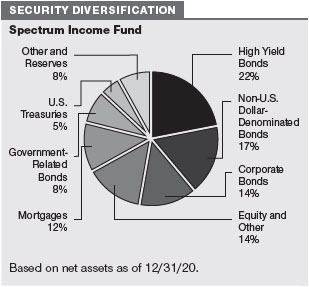
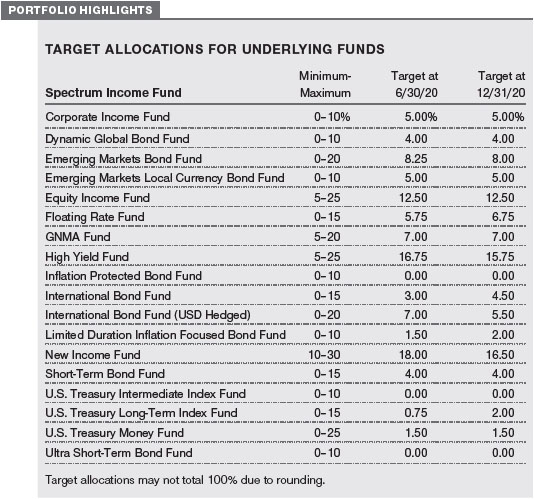
The Spectrum Income Fund invests primarily in fixed income securities through a diversified mix of U.S. and international T. Rowe Price mutual funds. Underlying investments also include a fund focused on dividend-paying U.S. large-cap stocks.
Yields for U.S. investment-grade bonds remain near record lows and anchored at low levels amid strong support from central banks, although attractive idiosyncratic opportunities in certain credit sectors persist. We added to corporate bonds by paring our allocations to higher-quality issues in the Ginnie Mae and short-term bond allocations.
We are overweight to high yield bonds as credit spreads (the yield differences between bonds with higher and lower credit quality) remain at attractive levels relative to investment-grade bonds. However, the pandemic could weigh on consumer-related and energy sectors—which make up a significant portion of the high yield sector—and we are cautious of downgrade and default risks. Within the noninvestment-grade sector, we added to floating rate bank loans, which sold off earlier this year, leaving spreads at historically attractive levels. Floating rate loans also have less exposure to the energy sector and have a higher standing in the capital structure.
We are underweight to currency-hedged nondollar bonds, as yields are anchored at low levels by aggressive central bank policies in response to the pandemic. Additionally, the hedged yield advantage is less pronounced given narrowing short-term interest rate differentials between the U.S. and other developed markets. We are overweight to nondollar bonds. A weaker dollar over the intermediate term and narrowing of the growth differential for the U.S. relative to the rest of the world are tailwinds, while low bond yields and extended duration profiles outside the U.S. continue to be a headwind. We are neutral to dollar-denominated emerging markets bonds as we balance valuations and idiosyncratic country risks. We are overweight to local currency emerging markets bonds given attractive valuations, potential support from low interest rates offered by developed central banks, and the likelihood of a weaker U.S. dollar.
We modestly added back to long-term U.S. Treasury bonds but remain underweight. Treasuries continue to suffer from extreme valuations as yields have fallen to record-low levels with expectations that the Federal Reserve will pause on raising rates indefinitely. Treasuries also remain vulnerable to steepening at the long end of the yield curve should growth expectations improve. However, given current low yields, the long end is the only portion of the yield curve with room to rally in a potential risk-off environment. While we do not see significant negative shocks as likely, a modest allocation to long-term Treasuries offers ballast should significant volatility return to equity markets.
We are neutral to dividend-paying equities. Entering the year, we had increased our allocation against a backdrop of stabilizing global growth and improving U.S.-China trade negotiations. As equity markets sold off due to the coronavirus pandemic, we took advantage of attractive valuations and incrementally added to our exposure. However, stock markets have rebounded from March’s lows and—while we have a balanced view of the risks facing global markets—equity valuations appear extended.
SPECTRUM INTERNATIONAL EQUITY FUND
INVESTMENT OBJECTIVE
The fund seeks long-term capital appreciation.
FUND COMMENTARY
How did the fund perform in the past 12 months?
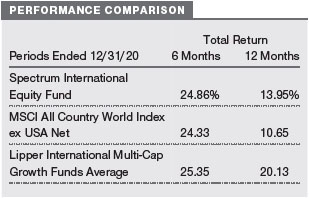
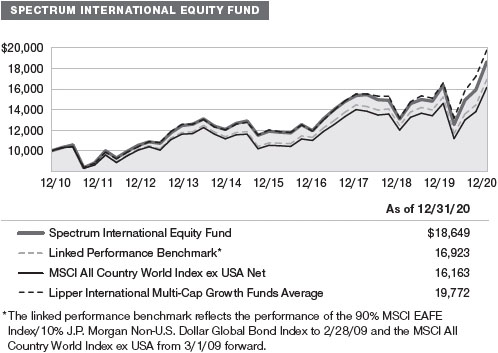
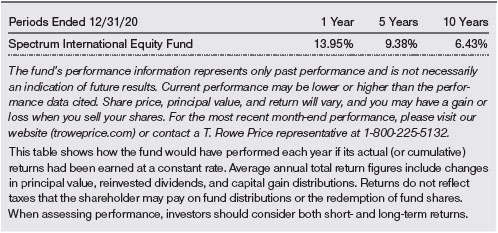
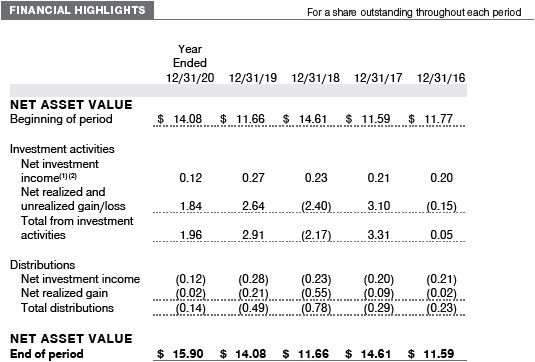
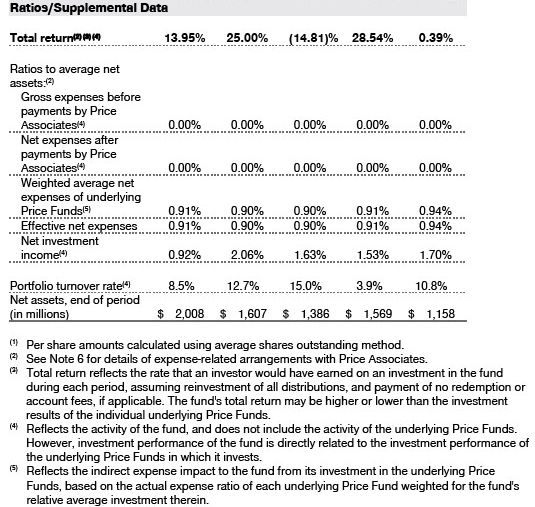
The Spectrum International Equity Fund returned 13.95% for the 12-month period ended December 31, 2020. The fund outperformed its benchmark, the MSCI All Country World Index ex USA Net, but lagged the Lipper International Multi-Cap Growth Funds Average. (Past performance cannot guarantee future results.)
What factors influenced the fund’s performance?
During the reporting period, the Spectrum International Equity Fund overcame steep losses from the first quarter and generated double-digit gains for the year. Strong security selection within most of the underlying strategies drove relative outperformance in a turbulent environment.
Despite modest fund allocations, the Japan Fund and International Discovery Fund were notable contributors to relative performance, as they both generated strong positive returns and significantly outperformed their benchmarks. The European Stock Fund and International Value Equity Fund also boosted results. Sector performance was mostly positive across the various regions. In multiple portfolios, a favorable overweight and stock selection in the information technology sector, especially names within semiconductors and semiconductor equipment, worked in our favor. Holdings in the consumer discretionary and communication services sectors, well suited for the stay-at-home world, also benefited from secular tailwinds. Among our health care stocks, names in health care equipment and suppliers and biotechnology added value. On a regional basis, holdings in Japan and Pacific Asia were among the best performers.
Conversely, security selection in the International Stock Fund detracted from relative performance. Within the fund, names in industrials and business services, financials, and energy were notable laggards. The coronavirus pandemic sharply curtailed economic activity and exacerbated weakness in these industries. Although several holdings gained ground late in the fourth quarter, as promising vaccine news reinvigorated investor hopes for a “return to normal” and economic growth, steep losses incurred early in the year proved difficult to overcome.
How is the fund positioned?
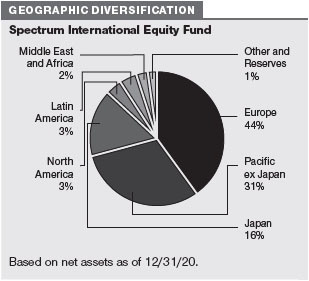
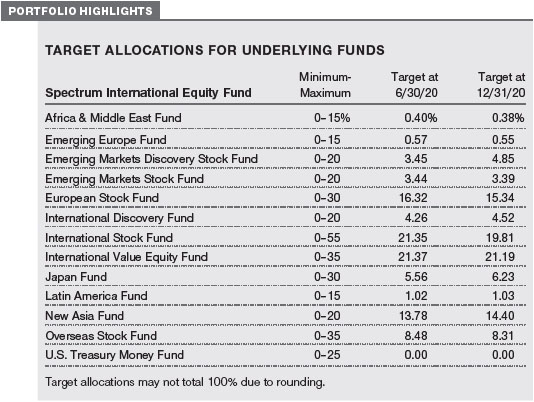
The Spectrum International Equity Fund offers investors broadly diversified exposure to international equities in developed and emerging markets.
We are overweight to emerging markets stocks relative to developed market stocks, favoring cyclical sectors—such as financials and industrials and business services—and the Latin America and emerging Europe and Asia regions. Exposure to global trade and favorable currency trends offer strong tailwinds for emerging markets stocks.
Among developed markets, we added to Japanese equities and are now overweight. Fiscal and monetary stimulus continue to provide a solid backdrop for the nation’s economic recovery, and with the election of new Prime Minister Yoshihide Suga, it is likely the pro-business policies of his predecessor, Shinzo Abe, will continue along with an increased emphasis on productivity-enhancing initiatives. In our view, the cyclical recovery in global markets should provide a sustained catalyst for Japanese stocks. Economic activity in the broader Asia Pacific region may also be supportive, given the region’s resilience during the coronavirus pandemic and ongoing Chinese stimulus measures.
We pared our exposure to European equities and are now slightly underweight. Regional economies continue to be heavily impacted by the coronavirus pandemic, and there are growing indications of a possible second wave of infections. Concerns over the pandemic notwithstanding, the region has been supported by accommodative actions from both the European Central Bank and the European Union. With risks stemming from a possible no-deal Brexit fading, we believe more cyclically oriented European equities are well positioned to benefit from a global recovery as the effects of the pandemic wane.
We are overweight to value stocks, as valuations for growth stocks have become more expensive. Value stocks with more compelling valuations could also benefit from a cyclical economic recovery. Among value-oriented sectors, financials could face continued headwinds from low interest rates. International growth stocks, which have a more defensive profile, could lag their value peers in an improving economic backdrop.
What is portfolio management’s outlook?
Aggressive monetary and fiscal stimulus measures from central banks and governments around the world have helped fuel a rally that saw major indices bounce back from March lows to new highs late in the reporting period. Financial markets have become increasingly dependent on stimulus measures, and the recent additional round of fiscal stimulus has largely been priced into the markets. Meanwhile, the coronavirus pandemic has proven difficult to contain in the U.S., and a second wave in Europe has also sparked fears of further economic damage and led to new lockdown measures. Although the pandemic has continued to weigh on the global economy and has contributed to a period of sustained volatility for risk assets, investor sentiment has been bolstered by positive news about the development of vaccines and therapeutics.
Economic risks receded late in the period as the UK and the European Union reached a trade agreement, although the impacts of this new financial relationship remain to be seen. As 2020 closed, markets seemed to celebrate the prospects of a divided government—a Democrat-controlled House of Representatives with a Joe Biden presidency and Republicans maintaining control of the Senate. However, with Democratic challengers unseating Republican incumbents in both Georgia Senate runoff races and Vice President-elect Kamala Harris holding the deciding vote in an evenly split Senate, markets may begin to factor in the likelihood of more progressive policies on taxes and tighter regulation, which could result in a negative market shock.
The elevated levels of volatility and uncertainty in global markets underscore the value of our thoughtful strategic investing approach. Given the uncertain impact of positive and negative forces driving global financial markets, we believe that the Spectrum Funds’ broad diversification and the strength of T. Rowe Price’s fundamental research platform should benefit our investors over time across a range of market and economic environments.
The views expressed reflect the opinions of T. Rowe Price as of the date of this report and are subject to change based on changes in market, economic, or other conditions. These views are not intended to be a forecast of future events and are no guarantee of future results.
RISKS OF INVESTING
As with all stock and bond mutual funds, each fund’s share price can fall because of weakness in the stock or bond markets, a particular industry, or specific holdings. Stock markets can decline for many reasons, including adverse political or economic developments, changes in investor psychology, or heavy institutional selling. The prospects for an industry or company may deteriorate because of a variety of factors, including disappointing earnings or changes in the competitive environment. In addition, the investment manager’s assessment of companies held in a fund may prove incorrect, resulting in losses or poor performance even in rising markets.
Bonds are subject to interest rate risk, the decline in bond prices that usually accompanies a rise in interest rates, and credit risk, the chance that any fund holding could have its credit rating downgraded or that a bond issuer will default (fail to make timely payments of interest or principal), potentially reducing the fund’s income level and share price. High yield corporate bonds could have greater price declines than funds that invest primarily in high-quality bonds. Companies issuing high yield bonds are not as strong financially as those with higher credit ratings, so the bonds are usually considered speculative investments.
Funds that invest overseas may carry more risk than funds that invest strictly in U.S. assets. Risks can result from varying stages of economic and political development; differing regulatory environments, trading days, and accounting standards; and higher transaction costs of non-U.S. markets. Non-U.S. investments are also subject to currency risk, or a decline in the value of a foreign currency versus the U.S. dollar, which reduces the dollar value of securities denominated in that currency.
BENCHMARK INFORMATION
Combined index portfolio: An unmanaged blended index portfolio created as a custom benchmark for the Spectrum Diversified Equity Fund consisting of 70% Russell 3000 Index and 30% MSCI All Country World ex-USA IMI.
Note: Bloomberg Index Services Ltd. Copyright © 2021, Bloomberg Index Services Ltd. Used with permission.
Note: Lipper, a Thomson Reuters Company, is the source for all Lipper content reflected in these materials. Copyright 2021 © Refinitiv. All rights reserved. Any copying, republication or redistribution of Lipper content is expressly prohibited without the prior written consent of Lipper. Lipper shall not be liable for any errors or delays in the content, or for any actions taken in reliance thereon.
Note: Information has been obtained from sources believed to be reliable, but J.P. Morgan does not warrant its completeness or accuracy. The index is used with permission. The index may not be copied, used, or distributed without J.P. Morgan’s prior written approval. Copyright 2021, J.P. Morgan Chase & Co. All rights reserved.
Note: MSCI makes no express or implied warranties or representations and shall have no liability whatsoever with respect to any MSCI data contained herein. The MSCI data may not be further redistributed or used as a basis for other indices or any securities or financial products. This report is not approved, reviewed, or produced by MSCI.
Note: Frank Russell Company (Russell) is the source and owner of the Russell index data contained or reflected in these materials and all trademarks and copyrights related thereto. Russell® is a registered trademark of Russell. Russell is not responsible for the formatting or configuration of these materials or for any inaccuracy in T. Rowe Price Associates’ presentation thereof.
GROWTH OF $10,000
This chart shows the value of a hypothetical $10,000 investment in the fund over the past 10 fiscal year periods or since inception (for funds lacking 10-year records). The result is compared with benchmarks, which include a broad-based market index and may also include a peer group average or index. Market indexes do not include expenses, which are deducted from fund returns as well as mutual fund averages and indexes.
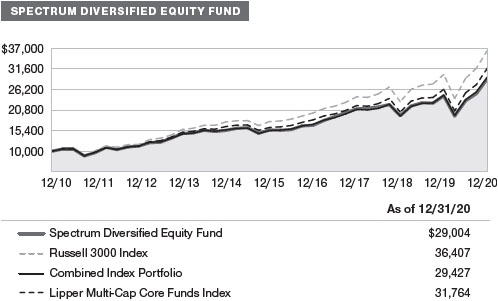
AVERAGE ANNUAL COMPOUND TOTAL RETURN
GROWTH OF $10,000
This chart shows the value of a hypothetical $10,000 investment in the fund over the past 10 fiscal year periods or since inception (for funds lacking 10-year records). The result is compared with benchmarks, which include a broad-based market index and may also include a peer group average or index. Market indexes do not include expenses, which are deducted from fund returns as well as mutual fund averages and indexes.
AVERAGE ANNUAL COMPOUND TOTAL RETURN
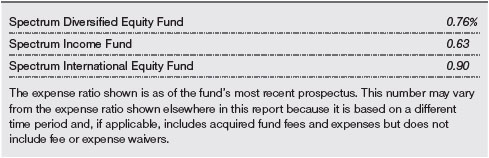
EXPENSE RATIO
FUND EXPENSE EXAMPLE
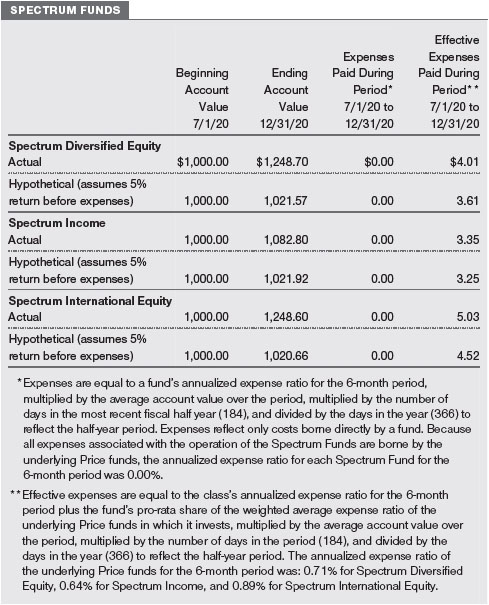
As a mutual fund shareholder, you may incur two types of costs: (1) transaction costs, such as redemption fees or sales loads, and (2) ongoing costs, including management fees, distribution and service (12b-1) fees, and other fund expenses. The following example is intended to help you understand your ongoing costs (in dollars) of investing in the fund and to compare these costs with the ongoing costs of investing in other mutual funds. The example is based on an investment of $1,000 invested at the beginning of the most recent six-month period and held for the entire period.
Actual Expenses
The first line of the following table (Actual) provides information about actual account values and expenses based on the fund’s actual returns. You may use the information on this line, together with your account balance, to estimate the expenses that you paid over the period. Simply divide your account value by $1,000 (for example, an $8,600 account value divided by $1,000 = 8.6), then multiply the result by the number on the first line under the heading “Expenses Paid During Period” to estimate the expenses you paid on your account during this period.
Hypothetical Example for Comparison Purposes
The information on the second line of the table (Hypothetical) is based on hypothetical account values and expenses derived from the fund’s actual expense ratio and an assumed 5% per year rate of return before expenses (not the fund’s actual return). You may compare the ongoing costs of investing in the fund with other funds by contrasting this 5% hypothetical example and the 5% hypothetical examples that appear in the shareholder reports of the other funds. The hypothetical account values and expenses may not be used to estimate the actual ending account balance or expenses you paid for the period.
Note: T. Rowe Price charges an annual account service fee of $20, generally for accounts with less than $10,000. The fee is waived for any investor whose T. Rowe Price mutual fund accounts total $50,000 or more; accounts electing to receive electronic delivery of account statements, transaction confirmations, prospectuses, and shareholder reports; or accounts of an investor who is a T. Rowe Price Personal Services or Enhanced Personal Services client (enrollment in these programs generally requires T. Rowe Price assets of at least $250,000). This fee is not included in the accompanying table. If you are subject to the fee, keep it in mind when you are estimating the ongoing expenses of investing in the fund and when comparing the expenses of this fund with other funds.
You should also be aware that the expenses shown in the table highlight only your ongoing costs and do not reflect any transaction costs, such as redemption fees or sales loads. Therefore, the second line of the table is useful in comparing ongoing costs only and will not help you determine the relative total costs of owning different funds. To the extent a fund charges transaction costs, however, the total cost of owning that fund is higher.
| T. ROWE PRICE SPECTRUM DIVERSIFIED EQUITY FUND |
|
The accompanying notes are an integral part of these financial statements.
| T. ROWE PRICE SPECTRUM INCOME FUND |
|

The accompanying notes are an integral part of these financial statements.
| T. ROWE PRICE SPECTRUM INTERNATIONAL EQUITY FUND |
|
The accompanying notes are an integral part of these financial statements.
| T. ROWE PRICE SPECTRUM DIVERSIFIED EQUITY FUND |
|
December 31, 2020
The accompanying notes are an integral part of these financial statements.
| T. ROWE PRICE SPECTRUM INCOME FUND |
|
December 31, 2020
The accompanying notes are an integral part of these financial statements.
| T. ROWE PRICE SPECTRUM INTERNATIONAL EQUITY FUND |
|
December 31, 2020
The accompanying notes are an integral part of these financial statements.
| T. ROWE PRICE SPECTRUM DIVERSIFIED EQUITY FUND |
|
December 31, 2020
The accompanying notes are an integral part of these financial statements.
| T. ROWE PRICE SPECTRUM INCOME FUND |
|
December 31, 2020
The accompanying notes are an integral part of these financial statements.
| T. ROWE PRICE SPECTRUM INTERNATIONAL EQUITY FUND |
|
December 31, 2020

The accompanying notes are an integral part of these financial statements.
| T. ROWE PRICE SPECTRUM DIVERSIFIED EQUITY FUND |
|
The accompanying notes are an integral part of these financial statements.
| T. ROWE PRICE SPECTRUM INCOME FUND |
|
The accompanying notes are an integral part of these financial statements.
| T. ROWE PRICE SPECTRUM INTERNATIONAL EQUITY FUND |
|
The accompanying notes are an integral part of these financial statements.
| NOTES TO FINANCIAL STATEMENTS |
T. Rowe Price Spectrum Fund, Inc. (the corporation) is registered under the Investment Company Act of 1940 (the 1940 Act). Spectrum Diversified Equity Fund, formerly the Spectrum Growth Fund, Spectrum Income Fund, and Spectrum International Equity Fund, formerly the Spectrum International Fund (collectively, the Spectrum Funds) are diversified open-end management investment companies established by the corporation.
Each Spectrum Fund broadly diversifies its assets within specified ranges among a set of T. Rowe Price mutual funds (underlying Price Funds) representing specific market segments. Spectrum Diversified Equity seeks long-term capital appreciation and growth of income with current income as a secondary objective. Spectrum Income seeks a high level of current income with moderate share price fluctuation. Spectrum International Equity seeks long-term capital appreciation.
NOTE 1 - SIGNIFICANT ACCOUNTING POLICIES
Basis of Preparation Each fund is an investment company and follows accounting and reporting guidance in the Financial Accounting Standards Board Accounting Standards Codification Topic 946 (ASC 946). The accompanying financial statements were prepared in accordance with accounting principles generally accepted in the United States of America (GAAP), including, but not limited to, ASC 946. GAAP requires the use of estimates made by management. Management believes that estimates and valuations of the underlying Price Funds are appropriate; however, actual results may differ from those estimates, and the valuations reflected in the accompanying financial statements may differ from the value ultimately realized upon sale of the underlying Price Funds.
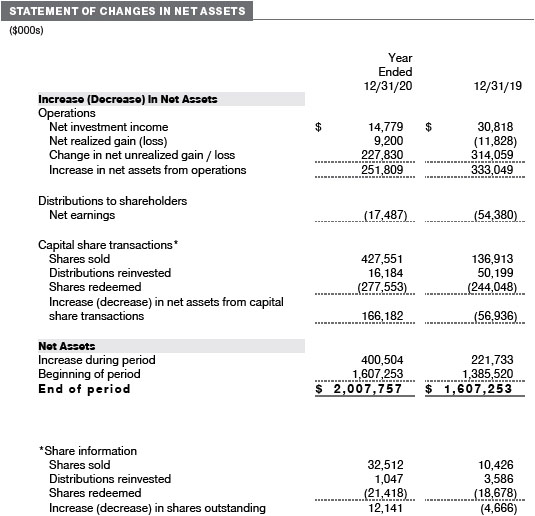
Investment Transactions, Investment Income, and Distributions Purchases and sales of the underlying Price Funds are accounted for on the trade date basis. Income is recorded on the accrual basis. Gains and losses realized on sales of the underlying Price Funds are reported on the identified cost basis. Income tax-related interest and penalties, if incurred, are recorded as income tax expense. Dividends received from underlying Price Fund investments are reflected as dividend income; capital gain distributions are reflected as realized gain/loss. Income and capital gain distributions from the underlying Price Funds are recorded on the ex-dividend date. Distributions to shareholders are recorded on the ex-dividend date. Income distributions are declared by Spectrum Income daily and paid monthly. Income distributions, if any, are declared and paid by Spectrum Diversified Equity and Spectrum International Equity annually. A capital gain distribution may also be declared and paid by each fund annually.
Capital Transactions Each investor’s interest in the net assets of each fund is represented by fund shares. Each fund’s net asset value (NAV) per share is computed at the close of the New York Stock Exchange (NYSE), normally 4 p.m. ET, each day the NYSE is open for business. However, the NAV per share may be calculated at a time other than the normal close of the NYSE if trading on the NYSE is restricted, if the NYSE closes earlier, or as may be permitted by the SEC. Purchases and redemptions of fund shares are transacted at the next-computed NAV per share, after receipt of the transaction order by T. Rowe Price Associates, Inc., or its agents.
Indemnification In the normal course of business, the funds may provide indemnification in connection with their officers and directors, service providers and/or private company investments. Each fund’s maximum exposure under these arrangements is unknown; however, the risk of material loss is currently considered to be remote.
NOTE 2 - VALUATION
Each fund’s financial instruments are valued at the close of the NYSE and are reported at fair value, which GAAP defines as the price that would be received to sell an asset or paid to transfer a liability in an orderly transaction between market participants at the measurement date. Investments in the underlying Price Funds are valued at their closing NAV per share on the day of valuation. Futures contracts, if any, are valued at closing settlement prices. Assets and liabilities other than financial instruments, including short-term receivables and payables, are carried at cost, or estimated realizable value, if less, which approximates fair value.
The T. Rowe Price Valuation Committee (the Valuation Committee) is an internal committee that has been delegated certain responsibilities by the funds’ Board of Directors (the Board) to ensure that financial instruments are appropriately priced at fair value in accordance with GAAP and the 1940 Act. Subject to oversight by the Board, the Valuation Committee develops and oversees pricing-related policies and procedures and approves all fair value determinations. Specifically, the Valuation Committee establishes policies and procedures used in valuing financial instruments; determines pricing techniques, sources, and persons eligible to effect fair value pricing actions; evaluates the service and performance of the pricing vendors; oversees the pricing process to ensure policies and procedures are being followed; and provides guidance on internal controls and valuation-related matters. The Valuation Committee provides periodic reporting to the Board on valuation matters.
Various valuation techniques and inputs are used to determine the fair value of financial instruments. GAAP establishes the following fair value hierarchy that categorizes the inputs used to measure fair value:
Level 1 – quoted prices (unadjusted) in active markets for identical financial instruments that the fund can access at the reporting date
Level 2 – inputs other than Level 1 quoted prices that are observable, either directly or indirectly (including, but not limited to, quoted prices for similar financial instruments in active markets, quoted prices for identical or similar financial instruments in inactive markets, interest rates and yield curves, implied volatilities, and credit spreads)
Level 3 – unobservable inputs (including each fund’s own assumptions in determining fair value)
Observable inputs are developed using market data, such as publicly available information about actual events or transactions, and reflect the assumptions that market participants would use to price the financial instrument. Unobservable inputs are those for which market data are not available and are developed using the best information available about the assumptions that market participants would use to price the financial instrument. GAAP requires valuation techniques to maximize the use of relevant observable inputs and minimize the use of unobservable inputs. When multiple inputs are used to derive fair value, the financial instrument is assigned to the level within the fair value hierarchy based on the lowest-level input that is significant to the fair value of the financial instrument. Input levels are not necessarily an indication of the risk or liquidity associated with financial instruments at that level but rather the degree of judgment used in determining those values. On December 31, 2020, all of each fund’s financial instruments were classified as Level 1, based on the inputs used to determine their fair values.
NOTE 3 - DERIVATIVE INSTRUMENTS
The funds may use derivatives in an effort to manage cash flows efficiently, remain fully invested, or facilitate asset allocation and rebalancing. As defined by GAAP, a derivative is a financial instrument whose value is derived from an underlying security price, foreign exchange rate, interest rate, index of prices or rates, or other variable; it requires little or no initial investment and permits or requires net settlement. The funds invest in derivatives only if the expected risks and rewards are consistent with its investment objectives, policies, and overall risk profile, as described in its prospectus and Statement of Additional Information. The risks associated with the use of derivatives are different from, and potentially much greater than, the risks associated with investing directly in the instruments on which the derivatives are based. The funds at all times maintain sufficient cash reserves, liquid assets, or other SEC-permitted asset types to cover their settlement obligations under open derivative contracts.
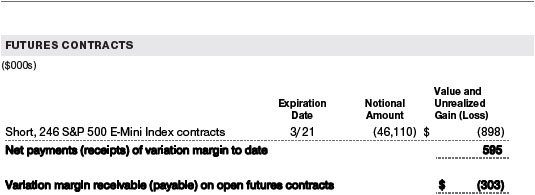
The funds value their derivatives at fair value and recognizes changes in fair value currently in their results of operations. Accordingly, the funds do not follow hedge accounting, even for derivatives employed as economic hedges. Generally, the funds account for their derivatives on a gross basis. They do not offset the fair value of derivative liabilities against the fair value of derivative assets on their financial statements, nor do they offset the fair value of derivative instruments against the right to reclaim or obligation to return collateral. As of December 31, 2020, the Spectrum Income Fund held equity futures with cumulative unrealized loss of $898,000; the value reflected on the accompanying Statement of Assets and Liabilities is the related unsettled variation margin. As of December 31, 2020, the Spectrum Diversified Equity Fund and Spectrum International Equity Fund held no derivative instruments.
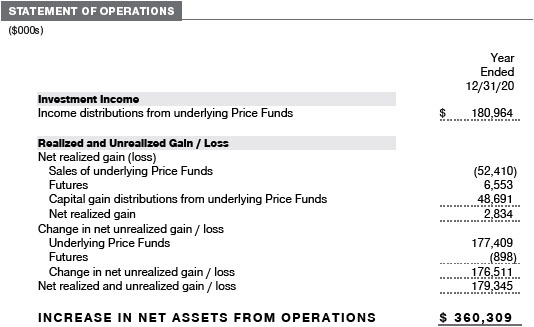
Additionally, the amount of gains and losses on futures recognized in fund earnings during the year ended December 31, 2020, and the related location on the accompanying Statement of Operations is summarized in the following table by primary underlying risk exposure:
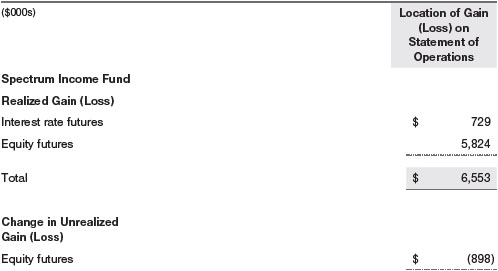
During the year ended December 31, 2020, the Spectrum Diversified Equity Fund and Spectrum International Equity Fund recognized no gains or losses on futures.
Counterparty Risk and Collateral The funds invest in exchange-traded futures. Counterparty risk on such derivatives is minimal because the clearinghouse provides protection against counterparty defaults. For futures, funds are each required to deposit collateral in an amount specified by the clearinghouse and the clearing firm (margin requirement) and the margin requirement must be maintained over the life of the contract. Each clearinghouse and clearing firm, in its sole discretion, may adjust the margin requirements applicable to the fund.
Collateral may be in the form of cash or debt securities issued by the U.S. government or related agencies. Cash posted by the fund is reflected as cash deposits in the accompanying financial statements and generally is restricted from withdrawal by the fund; securities posted by the fund are so noted in the accompanying Portfolio of Investments; both remain in the fund’s assets. While typically not sold in the same manner as equity or fixed income securities, exchange-traded derivatives may be closed out only on the exchange or clearinghouse where the contracts were traded. This ability is subject to the liquidity of underlying positions. As of December 31, 2020, cash of $2,706,000 had been posted by Spectrum Income Fund for exchange-traded derivatives.
Futures Contracts A futures contract provides for the future sale by one party and purchase by another of a specified amount of a specific underlying financial instrument at an agreed upon price, date, time, and place. The funds currently invest only in exchange-traded futures, which generally are standardized as to maturity date, underlying financial instrument, and other contract terms. Payments are made or received by the fund each day to settle daily fluctuations in the value of the contract (variation margin), which reflect changes in the value of the underlying financial instrument. Variation margin is recorded as unrealized gain or loss until the contract is closed. The value of a futures contract included in net assets is the amount of unsettled variation margin; net variation margin receivable is reflected as an asset and net variation margin payable is reflected as a liability on the accompanying Statement of Assets and Liabilities. Risks related to the use of futures contracts include possible illiquidity of the futures markets, contract prices that can be highly volatile and imperfectly correlated to movements in hedged security values, and potential losses in excess of the fund’s initial investment. During the year ended December 31, 2020, the volume of the fund’s activity in futures, based on underlying notional amounts, was generally less than 1% of net assets.
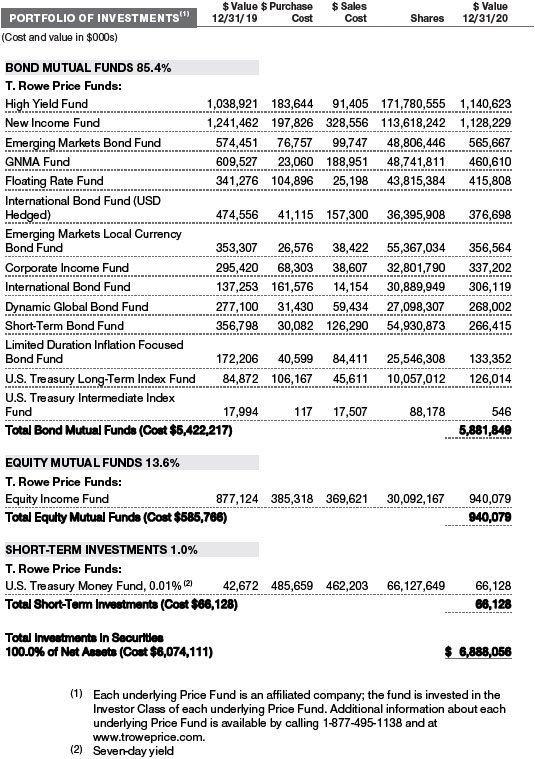
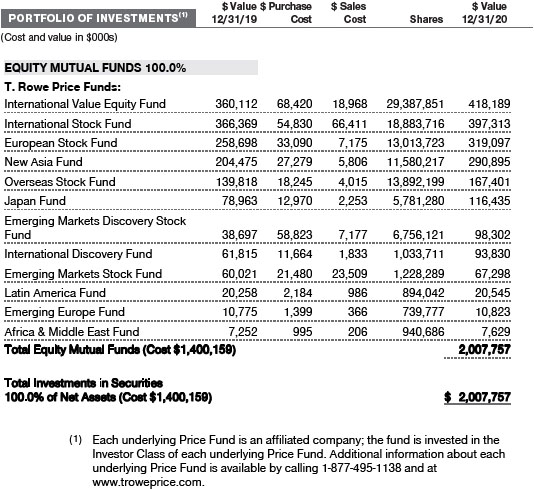
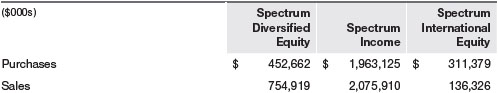
NOTE 4 - INVESTMENTS IN UNDERLYING PRICE FUNDS
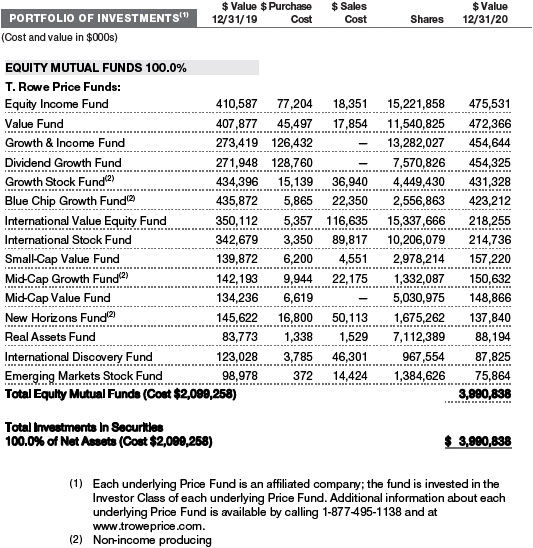
Purchases and sales of the underlying Price Funds during the year ended December 31, 2020, were as follows:
NOTE 5 - FEDERAL INCOME TAXES
Generally, no provision for federal income taxes is required since each fund intends to continue to qualify as a regulated investment company under Subchapter M of the Internal Revenue Code and distribute to shareholders all of its taxable income and gains. Distributions determined in accordance with federal income tax regulations may differ in amount or character from net investment income and realized gains for financial reporting purposes.
Each fund files U.S. federal, state, and local tax returns as required. Each fund’s tax returns are subject to examination by the relevant tax authorities until expiration of the applicable statute of limitations, which is generally three years after the filing of the tax return but which can be extended to six years in certain circumstances. Tax returns for open years have incorporated no uncertain tax positions that require a provision for income taxes.
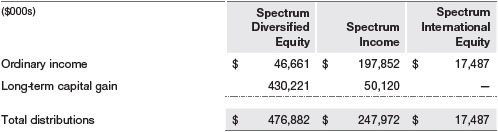
Financial reporting records are adjusted for permanent book/tax differences to reflect tax character but are not adjusted for temporary differences. The permanent book/tax adjustments have no impact on results of operations or net assets and relate primarily to the character of distributions from the underlying Price Funds.
Distributions during the year ended December 31, 2020, were characterized for tax purposes as follows:
Distributions during the prior year ended December 31, 2019, were characterized for tax purposes as follows:

At December 31, 2020, the tax-basis cost of investments, including derivatives, and components of net assets were as follows:

The difference between book-basis and tax-basis net unrealized appreciation (depreciation) is attributable to the deferral of losses from wash sales for tax purposes. During the year ended December 31, 2020, Spectrum International Equity utilized $9,571,000 of capital loss carryforwards.
NOTE 6 - RELATED PARTY TRANSACTIONS
The Spectrum Funds are managed by T. Rowe Price Associates, Inc. (Price Associates), a wholly owned subsidiary of T. Rowe Price Group, Inc. Price Associates, directly or through sub-advisory agreements with its wholly owned subsidiaries, also provides investment management services to all the underlying Price Funds. Pursuant to various service agreements, Price Associates and its wholly owned subsidiaries provide shareholder servicing and administrative services as well as certain accounting, marketing, and other services to the Spectrum Funds. Certain officers and directors of the Spectrum Funds are also officers and directors of Price Associates and its subsidiaries and of the underlying Price Funds.
The Spectrum Funds pay no management fees; however, Price Associates receives management fees from the underlying Price Funds. The Spectrum Funds operate in accordance with the investment management and special servicing agreements between and among the corporation, the underlying Price Funds, and Price Associates. Pursuant to these agreements, expenses associated with the operation of the Spectrum Funds are borne by each underlying Price Fund to the extent of estimated savings to it and in proportion to the average daily value of its shares owned by the Spectrum Funds. Therefore, each Spectrum Fund operates at a zero expense ratio. However, each Spectrum Fund indirectly bears its proportionate share of the management fees and operating costs of the underlying Price Funds in which it invests.
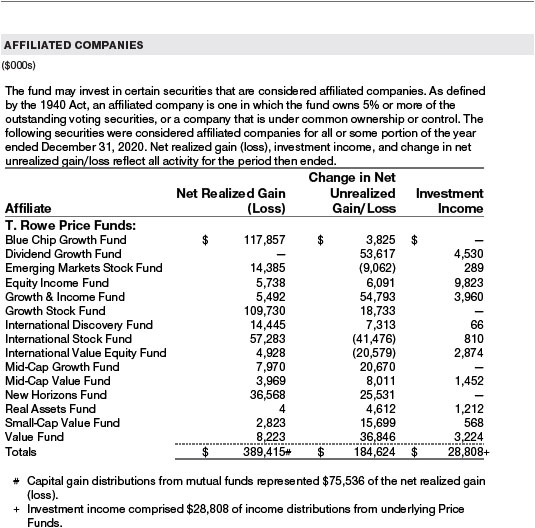
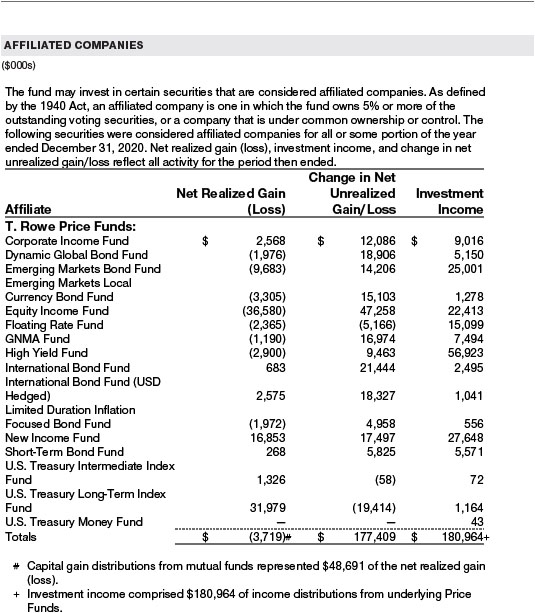
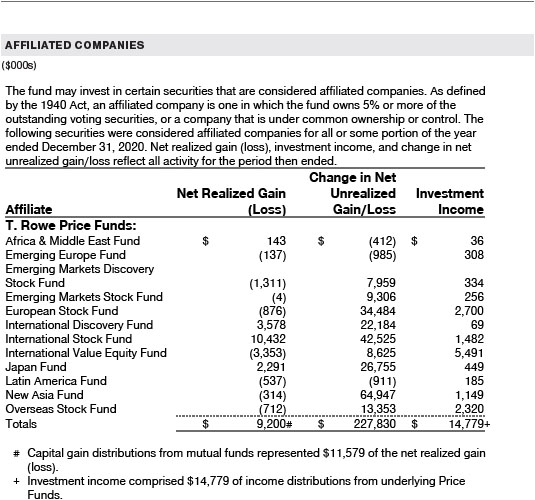
The Spectrum Funds do not invest in the underlying Price Funds for the purpose of exercising management or control; however, investments by the Spectrum Funds may represent a significant portion of an underlying Price Fund’s net assets. At December 31, 2020, Spectrum Diversified Equity held approximately 26% of the outstanding shares of the Real Assets Fund and less than 25% of any other underlying Price Fund; Spectrum International Equity held approximately 51% of the outstanding shares of the Emerging Markets Discovery Stock Fund, 46% of the International Value Equity Fund, 28% of the European Stock Fund, and less than 25% of any other underlying Price Fund; and Spectrum Income held approximately 86% of the outstanding shares of the Emerging Markets Local Currency Bond Fund, 66% of the Dynamic Global Bond Fund, 65% of the International Bond Fund (USD Hedged), 43% of the Corporate Income Fund, 42% of the Floating Rate Fund, 38% of the GNMA Fund, 36% of the International Bond Fund, 33% of the Emerging Markets Bond Fund, 32% of the High Yield Fund, 28% of the New Income Fund, and less than 25% of any other underlying Price Fund.
Additionally, Spectrum Income Fund is one of several mutual funds in which certain college savings plans managed by Price Associates may invest. Shareholder servicing costs associated with each college savings plan are allocated to Spectrum Income Fund in proportion to the average daily value of its shares owned by the college savings plan and, in turn, are borne by the underlying Price Funds in accordance with the terms of the investment management and special servicing agreements. At December 31, 2020, approximately 39% of the outstanding shares of Spectrum Income Fund were held by the college savings plans.
NOTE 7 - OTHER MATTERS
Unpredictable events such as environmental or natural disasters, war, terrorism, pandemics, outbreaks of infectious diseases, and similar public health threats may significantly affect the economy and the markets and issuers in which a fund invests. Certain events may cause instability across global markets, including reduced liquidity and disruptions in trading markets, while some events may affect certain geographic regions, countries, sectors, and industries more significantly than others, and exacerbate other pre-existing political, social, and economic risks. During 2020, a novel strain of coronavirus (COVID-19) resulted in disruptions to global business activity and caused significant volatility and declines in global financial markets.
These types of events, such as the global pandemic caused by COVID-19, may also cause widespread fear and uncertainty, and result in, among other things: enhanced health screenings, quarantines, cancellations, and travel restrictions, including border closings; disruptions to business operations, supply chains and customer activity; exchange trading suspensions and closures, and overall reduced liquidity of securities, derivatives, and commodities trading markets; reductions in consumer demand and economic output; and significant challenges in healthcare service preparation and delivery. The fund could be negatively impacted if the value of a portfolio holding were harmed by such political or economic conditions or events. In addition, the operations of the fund, its investment advisers, and the fund’s service providers may be significantly impacted, or even temporarily halted, as a result of any impairment to their information technology and other operational systems, extensive employee illnesses or unavailability, government quarantine measures, and restrictions on travel or meetings and other factors related to public emergencies.
Governmental and quasi-governmental authorities and regulators have in the past responded to major economic disruptions with a variety of significant fiscal and monetary policy changes, including but not limited to, direct capital infusions into companies, new monetary programs, and dramatically lower interest rates. An unexpected or quick reversal of these policies, or the ineffectiveness of these policies, could negatively impact overall investor sentiment and further increase volatility in securities markets. The impact of this outbreak has adversely affected the economies of many nations and the entire global economy and may impact individual issuers and capital markets in ways that cannot be foreseen. Other infectious illness outbreaks that may arise in the future could have similar or other unforeseen effects. The duration of this outbreak or others and their effects cannot be determined with certainty.
NOTE 8 - SUBSEQUENT EVENT
At a shareholder meeting held February 10, 2021, each fund’s shareholders approved an amended and restated investment management agreement to become effective during March 2021, on the date that each fund begins charging an all-inclusive management fee, ends the pass-through of its direct operating expenses to its underlying funds, and converts its Investor Class shares of each underlying fund to Z Class shares. The amended and restated investment management agreements will provide for an all-inclusive annual investment management fee of 0.73%, 0.62%, and 0.89% for the Spectrum Diversified Equity Fund, Spectrum Income Fund, and Spectrum International Equity Fund, respectively, which will be computed daily and paid monthly. The all-inclusive management fee will cover investment management and all of the fund’s operating expenses except for interest expense; expenses related to borrowings, taxes, and brokerage; and nonrecurring expenses. With respect to the Z Class shares of the underlying funds, Price Associates is contractually obligated to waive and/or bear all of the Z Class’ expenses, other than interest; expenses related to borrowings, taxes, and brokerage; and nonrecurring expenses. As a result, the proportionate share of the management fees and operating costs of the underlying Price Funds borne by each Spectrum Fund is expected to be less than 0.01%.
REPORT OF INDEPENDENT REGISTERED PUBLIC ACCOUNTING FIRM
To the Board of Directors of T. Rowe Price Spectrum Fund, Inc. and Shareholders
of T. Rowe Price Spectrum Diversified Equity Fund (formerly known as
T. Rowe Price Spectrum Growth Fund), T. Rowe Price Spectrum Income Fund,
and T. Rowe Price Spectrum International Equity Fund (formerly known as
T. Rowe Price Spectrum International Fund)
Opinion on the Financial Statements
We have audited the accompanying statement of assets and liabilities, including the portfolio of investments, of T. Rowe Price Spectrum Diversified Equity Fund (formerly known as T. Rowe Price Spectrum Growth Fund), T. Rowe Price Spectrum Income Fund, and T. Rowe Price Spectrum International Equity Fund (formerly known as T. Rowe Price Spectrum International Fund) (constituting T. Rowe Price Spectrum Fund, Inc., hereafter collectively referred to as the “Funds”) as of December 31, 2020, the related statement of operations for the year ended December 31, 2020, the statement of changes in net assets for each of the two years in the period ended December 31, 2020, including the related notes, and the financial highlights for each of the five years in the period ended December 31, 2020 (collectively referred to as the “financial statements”). In our opinion, the financial statements present fairly, in all material respects, the financial position of each of the Funds as of December 31, 2020, the results of each of their operations for the year then ended, the changes in each of their net assets for each of the two years in the period ended December 31, 2020 and each of the financial highlights for each of the five years in the period ended December 31, 2020 in conformity with accounting principles generally accepted in the United States of America.
Basis for Opinion
These financial statements are the responsibility of the Funds’ management. Our responsibility is to express an opinion on the Funds’ financial statements based on our audits. We are a public accounting firm registered with the Public Company Accounting Oversight Board (United States) (PCAOB) and are required to be independent with respect to the Funds in accordance with the U.S. federal securities laws and the applicable rules and regulations of the Securities and Exchange Commission and the PCAOB.
We conducted our audits of these financial statements in accordance with the standards of the PCAOB. Those standards require that we plan and perform the audit to obtain reasonable assurance about whether the financial statements are free of material misstatement, whether due to error or fraud.
Our audits included performing procedures to assess the risks of material misstatement of the financial statements, whether due to error or fraud, and performing procedures that respond to those risks. Such procedures included examining, on a test basis, evidence regarding the amounts and disclosures in the financial statements. Our audits also included evaluating the accounting principles used and significant estimates made by management, as well as evaluating the overall presentation of the financial statements. Our procedures included confirmation of securities owned as of December 31, 2020 by correspondence with the transfer agent and brokers; when replies were not received from brokers, we performed other auditing procedures. We believe that our audits provide a reasonable basis for our opinion.
PricewaterhouseCoopers LLP
Baltimore, Maryland
February 17, 2021
We have served as the auditor of one or more investment companies in the T. Rowe Price group of investment companies since 1973.
TAX INFORMATION (UNAUDITED) FOR THE TAX YEAR ENDED 12/31/20
We are providing this information as required by the Internal Revenue Code. The amounts shown may differ from those elsewhere in this report because of differences between tax and financial reporting requirements.
The funds’ distributions to shareholders included amounts as follows:
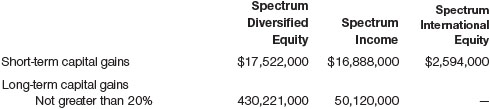
For taxable non-corporate shareholders, income represents qualified dividend income subject to a long-term capital gains tax rate of not greater than 20% as follows:

For corporate shareholders, income qualifies for the dividends-received deduction as follows:

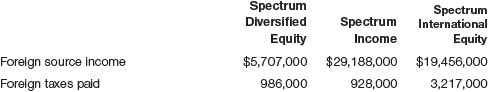
The funds will pass through foreign source income and foreign taxes paid, as follows:
For individuals and certain trusts and estates which are entitled to claim a deduction of up to 20% of their combined qualified real estate investment trust (REIT) dividends, $13,000 of Spectrum Diversified Equity’s income qualifies as qualified real estate investment trust (REIT) dividends.
INFORMATION ON PROXY VOTING POLICIES, PROCEDURES, AND RECORDS
A description of the policies and procedures used by T. Rowe Price funds and portfolios to determine how to vote proxies relating to portfolio securities is available in each fund’s Statement of Additional Information. You may request this document by calling 1-800-225-5132 or by accessing the SEC’s website, sec.gov.
The description of our proxy voting policies and procedures is also available on our corporate website. To access it, please visit the following Web page:
https://www.troweprice.com/corporate/en/utility/policies.html
Scroll down to the section near the bottom of the page that says, “Proxy Voting Policies.” Click on the Proxy Voting Policies link in the shaded box.
Each fund’s most recent annual proxy voting record is available on our website and through the SEC’s website. To access it through T. Rowe Price, visit the website location shown above, and scroll down to the section near the bottom of the page that says, “Proxy Voting Records.” Click on the Proxy Voting Records link in the shaded box.
HOW TO OBTAIN QUARTERLY PORTFOLIO HOLDINGS
Effective for reporting periods on or after March 1, 2019, a fund, except a money market fund, files a complete schedule of portfolio holdings with the Securities and Exchange Commission (SEC) for the first and third quarters of each fiscal year as an exhibit to its reports on Form N-PORT. Prior to March 1, 2019, a fund, including a money market fund, filed a complete schedule of portfolio holdings with the SEC for the first and third quarters of each fiscal year on Form N-Q. A money market fund files detailed month-end portfolio holdings information on Form N-MFP with the SEC each month and posts a complete schedule of portfolio holdings on its website (troweprice.com) as of each month-end for the previous six months. A fund’s Forms N-PORT, N-MFP, and N-Q are available electronically on the SEC’s website (sec.gov).
ABOUT THE FUNDS’ DIRECTORS AND OFFICERS
Your fund is overseen by a Board of Directors (Board) that meets regularly to review a wide variety of matters affecting or potentially affecting the fund, including performance, investment programs, compliance matters, advisory fees and expenses, service providers, and business and regulatory affairs. The Board elects the fund’s officers, who are listed in the final table. At least 75% of the Board’s members are considered to be independent, i.e., not “interested persons” as defined in Section 2(a)(19) of the 1940 Act, of the Boards of T. Rowe Price Associates, Inc. (T. Rowe Price), and its affiliates; “interested” directors and officers are employees of T. Rowe Price. The business address of each director and officer is 100 East Pratt Street, Baltimore, Maryland 21202. The Statement of Additional Information includes additional information about the fund directors and is available without charge by calling a T. Rowe Price representative at 1-800-638-5660.
| INDEPENDENT DIRECTORS(a) |
| | | |
Name
(Year of Birth)
Year Elected
[Number of T. Rowe Price
Portfolios Overseen] | | Principal Occupation(s) and Directorships of Public Companies and Other Investment Companies During the Past Five Years |
| | | |
Teresa Bryce Bazemore
(1959)
2018
[190] | | President, Radian Guaranty (2008 to 2017); Chief Executive Officer, Bazemore Consulting LLC (2018 to present); Director, Chimera Investment Corporation (2017 to present); Director, First Industrial Realty Trust (2020 to present); Director, Federal Home Loan Bank of Pittsburgh (2017 to 2019) |
| | | |
Ronald J. Daniels
(1959)
2018
[190] | | President, The Johns Hopkins University(b) and Professor, Political Science Department, The Johns Hopkins University (2009 to present); Director, Lyndhurst Holdings (2015 to present); Director, BridgeBio Pharma, Inc. (2020 to present) |
| | | |
Bruce W. Duncan
(1951)
2013
[190] | | President, Chief Executive Officer, and Director, CyrusOne, Inc. (2020 to present); Chief Executive Officer and Director (2009 to 2016), Chairman of the Board (2016 to 2020), and President (2009 to 2016), First Industrial Realty Trust, owner and operator of industrial properties; Chairman of the Board (2005 to 2016) and Director (1999 to 2016), Starwood Hotels & Resorts, a hotel and leisure company; Member, Investment Company Institute Board of Governors (2017 to 2019); Member, Independent Directors Council Governing Board (2017 to 2019); Senior Advisor, KKR (2018 to present); Director, Boston Properties (2016 to present); Director, Marriott International, Inc. (2016 to 2020) |
| | | |
Robert J. Gerrard, Jr.
(1952)
2012
[190] | | Advisory Board Member, Pipeline Crisis/Winning Strategies, a collaborative working to improve opportunities for young African Americans (1997 to 2016); Chairman of the Board, all funds (since July 2018) |
| | | |
Paul F. McBride
(1956)
2013
[190] | | Advisory Board Member, Vizzia Technologies (2015 to present); Board Member, Dunbar Armored (2012 to 2018) |
| | | |
Cecilia E. Rouse, Ph.D.
(1963)
2012
[190] | | Dean, Princeton School of Public and International Affairs (2012 to present); Professor and Researcher, Princeton University (1992 to present); Director of Education Studies Committee, MDRC, a nonprofit education and social policy research organization (2011 to 2020); Member, National Academy of Education (2010 to present); Board Member, National Bureau of Economic Research (2011 to present); Board Member of the Council on Foreign Relations (2018 to present); Board Member, The Pennington School (2017 to present); Board Member, the University of Rhode Island (2020 to present); Chair of Committee on the Status of Minority Groups in the Economic Profession of the American Economic Association (2012 to 2018); Vice President (2015 to 2016) and Board Member (2018 to present), American Economic Association |
| | | |
John G. Schreiber
(1946)
2001
[190] | | Owner/President, Centaur Capital Partners, Inc., a real estate investment company (1991 to present); Cofounder, Partner, and Cochairman of the Investment Committee, Blackstone Real Estate Advisors, L.P. (1992 to 2015); Director, Blackstone Mortgage Trust, a real estate finance company (2012 to 2016); Director and Chairman of the Board, Brixmor Property Group, Inc. (2013 to present); Director, Hilton Worldwide (2007 to present); Director, Hudson Pacific Properties (2014 to 2016); Director, Invitation Homes (2014 to 2017); Director, JMB Realty Corporation (1980 to present) |
| | | |
| (a)All information about the independent directors was current as of December 31, 2019, unless otherwise indicated, except for the number of portfolios overseen, which is current as of the date of this report. |
| (b)William J. Stromberg, president and chief executive officer of T. Rowe Price Group, Inc., the parent company of the Price Funds’ investment advisor, has served on the Board of Trustees of Johns Hopkins University since 2014. |
| INTERESTED DIRECTORS(a) | | |
| | | |
Name
(Year of Birth)
Year Elected
[Number of T. Rowe Price
Portfolios Overseen] | | Principal Occupation(s) and Directorships of Public Companies and Other Investment Companies During the Past Five Years |
| | | |
David Oestreicher
(1967)
2018
[190] | | General Counsel, Vice President, and Secretary, T. Rowe Price Group, Inc.; Chairman of the Board, Chief Executive Officer, President, and Secretary, T. Rowe Price Trust Company; Director, Vice President, and Secretary, T. Rowe Price, T. Rowe Price Investment Services, Inc., T. Rowe Price Retirement Plan Services, Inc., and T. Rowe Price Services, Inc.; Vice President and Secretary, T. Rowe Price International; Vice President, T. Rowe Price Hong Kong (Price Hong Kong), T. Rowe Price Japan (Price Japan), and T. Rowe Price Singapore (Price Singapore); Principal Executive Officer and Executive Vice President, all funds |
| | | |
Robert W. Sharps, CFA, CPA
(1971)
2017
[190] | | Director and Vice President, T. Rowe Price; Vice President, T. Rowe Price Group, Inc., and T. Rowe Price Trust Company; Vice President, Spectrum Funds |
| | | |
| (a)All information about the interested directors was current as of December 31, 2019, unless otherwise indicated, except for the number of portfolios overseen, which is current as of the date of this report. |
| OFFICERS |
| | | |
Name (Year of Birth)
Position Held With Spectrum Funds | | Principal Occupation(s) |
| | | |
Christopher D. Alderson (1962)
Vice President | | Director and Vice President, T. Rowe Price International; Vice President, Price Hong Kong, Price Singapore, and T. Rowe Price Group, Inc. |
| | | |
Francisco M. Alonso (1978)
Vice President | | Vice President, T. Rowe Price, T. Rowe Price Group, Inc., and T. Rowe Price Trust Company |
| | | |
Stephen L. Bartolini, CFA (1977)
Vice President | | Vice President, T. Rowe Price, T. Rowe Price Group, Inc., and T. Rowe Price Trust Company |
| | | |
Darrell N. Braman (1963)
Vice President | | Vice President, Price Hong Kong, Price Singapore, T. Rowe Price, T. Rowe Price Group, Inc., T. Rowe Price International, T. Rowe Price Investment Services, Inc., and T. Rowe Price Services, Inc. |
| | | |
Jerome A. Clark, CFA (1961)
Vice President | | Vice President, T. Rowe Price, T. Rowe Price Group, Inc., T. Rowe Price Investment Services, Inc., and T. Rowe Price Trust Company |
| | | |
Kimberly E. DeDominicis (1976)
Vice President | | Vice President, T. Rowe Price, T. Rowe Price Group, Inc., T. Rowe Price International, and T. Rowe Price Trust Company |
| | | |
Alan S. Dupski, CPA (1982)
Principal Financial Officer, Vice President, and
Treasurer | | Vice President, T. Rowe Price, T. Rowe Price Group, Inc., and T. Rowe Price Trust Company |
| | | |
David J. Eiswert, CFA (1972)
Vice President | | Vice President, T. Rowe Price and T. Rowe Price Group, Inc. |
| | | |
Mark S. Finn, CFA, CPA (1963)
Vice President | | Vice President, T. Rowe Price, T. Rowe Price Group, Inc., and T. Rowe Price Trust Company |
| | | |
John R. Gilner (1961)
Chief Compliance Officer | | Chief Compliance Officer and Vice President, T. Rowe Price; Vice President, T. Rowe Price Group, Inc., and T. Rowe Price Investment Services, Inc. |
| | | |
David R. Giroux, CFA (1975)
Vice President | | Vice President, T. Rowe Price, T. Rowe Price Group, Inc., and T. Rowe Price Trust Company |
| | | |
Gary J. Greb (1961)
Vice President | | Vice President, T. Rowe Price, T. Rowe Price International, and T. Rowe Price Trust Company |
| | | |
Arif Husain, CFA (1972)
Vice President | | Vice President, T. Rowe Price Group, Inc., and T. Rowe Price International |
| | | |
Paul J. Krug, CPA (1964)
Vice President | | Vice President, T. Rowe Price, T. Rowe Price Group, Inc., and T. Rowe Price Trust Company |
| | | |
Wyatt A. Lee, CFA (1971)
Vice President | | Vice President, T. Rowe Price, T. Rowe Price Group, Inc., and T. Rowe Price Trust Company |
| | | |
Sébastien Page (1977)
Vice President | | Vice President, T. Rowe Price and T. Rowe Price Group, Inc. |
| | | |
Robert A. Panariello (1983)
Vice President | | Vice President, T. Rowe Price and T. Rowe Price Group, Inc. |
| | | |
Fran M. Pollack-Matz (1961)
Vice President and Secretary | | Vice President, T. Rowe Price and T. Rowe Price Group, Inc. |
| | | |
Shannon H. Rauser (1987)
Assistant Secretary | | Assistant Vice President, T. Rowe Price |
| | | |
Charles M. Shriver, CFA (1967)
Co-president | | Vice President, T. Rowe Price, T. Rowe Price Group, Inc., T. Rowe Price International, and T. Rowe Price Trust Company |
| | | |
Guido F. Stubenrauch, CFA (1970)
Vice President | | Vice President, T. Rowe Price and T. Rowe Price Group, Inc. |
| | | |
Toby M. Thompson, CAIA, CFA (1971)
Co-president | | Vice President, T. Rowe Price, T. Rowe Price Group, Inc., T. Rowe Price International, and T. Rowe Price Trust Company |
| | | |
Justin Thomson (1968)
Vice President | | Vice President, T. Rowe Price Group, Inc., and T. Rowe Price International |
| | | |
J. David Wagner, CFA (1974)
Vice President | | Vice President, T. Rowe Price, T. Rowe Price Group, Inc., and T. Rowe Price Trust Company |
| | | |
Megan Warren (1968)
Vice President | | Vice President, T. Rowe Price, T. Rowe Price Group, Inc., T. Rowe Price Retirement Plan Services, Inc., T. Rowe Price Services, Inc., and T. Rowe Price Trust Company; formerly, Executive Director, JPMorgan Chase (to 2017) |
| | | |
| Unless otherwise noted, officers have been employees of T. Rowe Price or T. Rowe Price International for at least 5 years. |
Item 1. (b) Notice pursuant to Rule 30e-3.
Not applicable.
Item 2. Code of Ethics.
The registrant has adopted a code of ethics, as defined in Item 2 of Form N-CSR, applicable to its principal executive officer, principal financial officer, principal accounting officer or controller, or persons performing similar functions. A copy of this code of ethics is filed as an exhibit to this Form N-CSR. No substantive amendments were approved or waivers were granted to this code of ethics during the period covered by this report.
Item 3. Audit Committee Financial Expert.
The registrant’s Board of Directors/Trustees has determined that Mr. Bruce W. Duncan qualifies as an audit committee financial expert, as defined in Item 3 of Form N-CSR. Mr. Duncan is considered independent for purposes of Item 3 of Form N-CSR.
Item 4. Principal Accountant Fees and Services.
(a) – (d) Aggregate fees billed for the last two fiscal years for professional services rendered to, or on behalf of, the registrant by the registrant’s principal accountant were as follows:
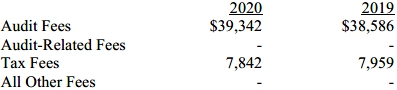
Audit fees include amounts related to the audit of the registrant’s annual financial statements and services normally provided by the accountant in connection with statutory and regulatory filings. Audit-related fees include amounts reasonably related to the performance of the audit of the registrant’s financial statements and specifically include the issuance of a report on internal controls and, if applicable, agreed-upon procedures related to fund acquisitions. Tax fees include amounts related to services for tax compliance, tax planning, and tax advice. The nature of these services specifically includes the review of distribution calculations and the preparation of Federal, state, and excise tax returns. All other fees include the registrant’s pro-rata share of amounts for agreed-upon procedures in conjunction with service contract approvals by the registrant’s Board of Directors/Trustees.
(e)(1) The registrant’s audit committee has adopted a policy whereby audit and non-audit services performed by the registrant’s principal accountant for the registrant, its investment adviser, and any entity controlling, controlled by, or under common control with the investment adviser that provides ongoing services to the registrant require pre-approval in advance at regularly scheduled audit committee meetings. If such a service is required between regularly scheduled audit committee meetings, pre-approval may be authorized by one audit committee member with ratification at the next scheduled audit committee meeting. Waiver of pre-approval for audit or non-audit services requiring fees of a de minimis amount is not permitted.
(2) No services included in (b) – (d) above were approved pursuant to paragraph (c)(7)(i)(C) of Rule 2-01 of Regulation S-X.
(f) Less than 50 percent of the hours expended on the principal accountant’s engagement to audit the registrant’s financial statements for the most recent fiscal year were attributed to work performed by persons other than the principal accountant’s full-time, permanent employees.
(g) The aggregate fees billed for the most recent fiscal year and the preceding fiscal year by the registrant’s principal accountant for non-audit services rendered to the registrant, its investment adviser, and any entity controlling, controlled by, or under common control with the investment adviser that provides ongoing services to the registrant were $3,781,000 and $3,227,000, respectively.
(h) All non-audit services rendered in (g) above were pre-approved by the registrant’s audit committee. Accordingly, these services were considered by the registrant’s audit committee in maintaining the principal accountant’s independence.
Item 5. Audit Committee of Listed Registrants.
Not applicable.
Item 6. Investments.
(a) Not applicable. The complete schedule of investments is included in Item 1 of this Form N-CSR.
(b) Not applicable.
Item 7. Disclosure of Proxy Voting Policies and Procedures for Closed-End Management Investment Companies.
Not applicable.
Item 8. Portfolio Managers of Closed-End Management Investment Companies.
Not applicable.
Item 9. Purchases of Equity Securities by Closed-End Management Investment Company and Affiliated Purchasers.
Not applicable.
Item 10. Submission of Matters to a Vote of Security Holders.
There has been no change to the procedures by which shareholders may recommend nominees to the registrant’s board of directors.
Item 11. Controls and Procedures.
(a) The registrant’s principal executive officer and principal financial officer have evaluated the registrant’s disclosure controls and procedures within 90 days of this filing and have concluded that the registrant’s disclosure controls and procedures were effective, as of that date, in ensuring that information required to be disclosed by the registrant in this Form N-CSR was recorded, processed, summarized, and reported timely.
(b) The registrant’s principal executive officer and principal financial officer are aware of no change in the registrant’s internal control over financial reporting that occurred during the period covered by this report that has materially affected, or is reasonably likely to materially affect, the registrant’s internal control over financial reporting.
Item 12. Disclosure of Securities Lending Activities for Closed-End Management Investment Companies.
Not applicable.
Item 13. Exhibits.
(a)(1) The registrant’s code of ethics pursuant to Item 2 of Form N-CSR is attached.
(2) Separate certifications by the registrant's principal executive officer and principal financial officer, pursuant to Section 302 of the Sarbanes-Oxley Act of 2002 and required by Rule 30a-2(a) under the Investment Company Act of 1940, are attached.
(3) Written solicitation to repurchase securities issued by closed-end companies: not applicable.
(b) A certification by the registrant’s principal executive officer and principal financial officer, pursuant to Section 906 of the Sarbanes-Oxley Act of 2002 and required by Rule 30a-2(b) under the Investment Company Act of 1940, is attached.
SIGNATURES
Pursuant to the requirements of the Securities Exchange Act of 1934 and the Investment Company Act of 1940, the registrant has duly caused this report to be signed on its behalf by the undersigned, thereunto duly authorized.
T. Rowe Price Spectrum Fund, Inc.
| By | | /s/ David Oestreicher |
| | | David Oestreicher |
| | | Principal Executive Officer |
| |
| Date | | February 17, 2021 | | | | |
Pursuant to the requirements of the Securities Exchange Act of 1934 and the Investment Company Act of 1940, this report has been signed below by the following persons on behalf of the registrant and in the capacities and on the dates indicated.
| By | | /s/ David Oestreicher |
| | | David Oestreicher |
| | | Principal Executive Officer |
| |
| Date | | February 17, 2021 | | | | |
| |
| |
| By | | /s/ Alan S. Dupski |
| | | Alan S. Dupski |
| | | Principal Financial Officer |
| |
| Date | | February 17, 2021 | | | | |