UNITED STATES
SECURITIES AND EXCHANGE COMMISSION
Washington, D.C. 20549
FORM N-CSR
CERTIFIED SHAREHOLDER REPORT OF REGISTERED MANAGEMENT INVESTMENT COMPANIES
| | |
| Investment Company Act file number: | | 811-01612 |
| |
| Exact name of registrant as specified in charter: | | The Prudential Variable Contract Account - 2 |
| |
| Address of principal executive offices: | | 655 Broad Street, 6th Floor |
| | Newark, New Jersey 07102 |
| |
| Name and address of agent for service: | | Andrew R. French |
| | 655 Broad Street, 6th Floor |
| | Newark, New Jersey 07102 |
| |
| Registrant’s telephone number, including area code: | | 800-225-1852 |
| |
| Date of fiscal year end: | | 12/31/2022 |
| |
| Date of reporting period: | | 12/31/2022 |
Item 1 – Reports to Stockholders
The Prudential Variable Contract Account-2
| | |
| ANNUAL REPORT | | December 31, 2022 |

This report is for the information of persons participating in The Prudential Variable Contract Account-2 (VCA 2, or the “Account”). VCA 2 is a group annuity insurance product issued by The Prudential Insurance Company of America, 751 Broad Street, Newark, NJ 07102-3714, and is distributed by Prudential Investment Management Services LLC (PIMS), member SIPC, 655 Broad Street, Newark, NJ 07102. Both are Prudential Financial companies. All are Prudential Financial companies and each is solely responsible for its financial condition and contractual obligations.
The views expressed in this report and information about the Account’s portfolio holdings are for the period covered by this report and are subject to change thereafter.
Please note that this report may include prospectus supplements that are separate from and not a part of this report

| | | | |
The Prudential Variable Contract Account-2 Table of Contents | | Annual Report | | December 31, 2022 |
| | | | | |
| | ∎ | | REPORT OF THE INVESTMENT MANAGERS AND PRESENTATION OF PORTFOLIO HOLDINGS |
| | | | | | | | |
| | Section A | | Statement of Net Assets, Other Financial Statements, and
Financial Highlights | | | | |
| | Section B | | Notes to Financial Statements | | | | |
| | | |
| | Section C | | Report of Independent Registered Public Accounting Firm | | | | |
| | | |
| | Section D | | Information about the Committee and Officers | | | | |
| | | | |
The Prudential Variable Contract Account-2 Letter to Participants | | Annual Report | | December 31, 2022 |
At Prudential, our primary objective is to help investors achieve and maintain long-term financial success. Despite today’s uncertainties, we remain strong and ready to serve and support you. This Prudential Variable Contract Account-2 annual report outlines our efforts to achieve this goal. We hope you find it informative and useful.
Prudential has been building on a heritage of success for more than 145 years. You can count on our history of financial stability. We are diversified for endurance. Our balanced mix of risks and businesses positions us well to manage through any economic environment. We’ve applied the lessons from decades of challenges to be stronger because we are committed to keeping our promises to you.
Your financial professional is the best resource to help you make the most informed investment decisions. Together, you can build a diversified investment portfolio that aligns with your long-term financial goals. Please keep in mind that diversification and asset allocation strategies do not assure a profit or protect against loss in declining markets.
Thank you for selecting Prudential as one of your financial partners. A strong sense of social responsibility for our clients, our employees, and our communities has been embedded in the company since our founding. It guides our efforts to help our customers achieve peace of mind through financial wellness.
We value your trust and appreciate the opportunity to help you achieve financial security.
Sincerely,

| | |
Stuart Parker | | |
President, | | |
The Prudential Variable Contract Account-2 | | January 31, 2023 |
| | | | |
| Market Overview — unaudited | | Annual Report | | December 31, 2022 |
| | | | |
Equity Market Overview
Across the majority of asset classes and regions, equities posted losses in 2022. Recession fears—spurred by the highest inflation in decades and aggressive central bank interest-rate hikes—were the main headwinds. Bond markets also suffered as yields spiked and the US Treasury yield curve inverted. Yield inversion is when the yield on a shorter-term bond is higher than a longer-term bond. However, commodities gained as oil and gas prices benefited from supply-chain woes following the onset of Russia’s invasion of Ukraine.
Equities end the year lower
US equity losses were widespread, as the large-cap S&P 500 Index fell 18.10%, the broad-based Russell 3000 Index declined 19.21%, and the tech-heavy Nasdaq Composite Index plummeted 33.10% during the year. Internationally, the MSCI ACWI Ex-US Index, a gauge of stock performance in developed and emerging markets outside the US, slid 15.57%. (Performance is based on net returns in US dollars unless stated otherwise and assumes reinvestment of dividends.)
Central bank activity dominates market sentiments
The US equity market suffered its worst year since 2008 as the US Federal Reserve (the Fed) aggressively tightened monetary policy in an attempt to lower inflation. The Fed raised its federal funds rate, which began the year at around 0%, seven times throughout 2022 to close the year in a range of 4.25% to 4.50%. The impact of higher rates punished the housing market, as housing starts and building permits declined, largely in response to rising mortgage rates. While inflation remained high for most of 2022, markets cheered by year-end as both the Consumer Price Index and the Personal Consumption Expenditures Price Index had slowed. During the same period, unemployment remained historically low.
Energy prices and the US dollar both posted gains for the year. Oil prices spiked in the first half of 2022, at one point rising above $100 per barrel for the first time since 2014. Supply concerns were exacerbated by Russia’s invasion of Ukraine and resulting sanctions against Russia. The US dollar benefited from rising rates, climbing 7.87% against a basket of developed market currencies.
US stocks swoon as inflation soars
Stocks started 2022 on solid ground, with the S&P 500 hitting a record high in January, but quickly retreated and spent the rest of the year in negative territory. Inflationary pressures reached multi-decade highs and the Fed began raising interest rates, sending markets lower. Geopolitical woes were heightened when Russia invaded Ukraine in February, creating new supply-chain issues. Economic data was disappointing, with US gross domestic product declining in both the first and second quarters.
As inflation increased and central banks worldwide hiked interest rates, equity markets briefly fell into bear market territory, defined as a drop of 20% or more from a recent high. Earnings expectations were revised downward as inflation began to crimp profit margins. Toward the end of 2022, equity markets began to slowly recover as inflation moderated.
Energy sector up, all other sectors down
In 2022, the top-performing sector in the S&P 500 Index was energy, rising 65.72% amid tight supply and rising demand. Other sectors posted negative returns, most significantly communication services (-39.89%) and consumer discretionary (-37.03%).
Tech darlings fall out of favor as value stocks lead
Recession fears drove large-cap technology equities sharply lower in 2022, as investors shifted away from the mega-cap tech stocks that they favored during the COVID-19 pandemic to more economically sensitive value stocks. Worries about slowing earnings growth led value stocks to significantly outperform growth stocks across market capitalizations.
During the year, the Russell 3000 Value Index declined 7.98%, significantly outperforming the Russell 3000 Growth Index, which fell 28.97%. The large-cap Russell 1000 Index fell 19.13%, the Russell Midcap Index slipped 17.32%, and the small-cap Russell 2000 Index dropped 20.44%.
Rising inflation and energy pressures sink international developed stocks
Central banks outside the US also tightened monetary policy in response to rising inflation, including the European Central Bank, which raised rates for the first time in more than 10 years. In addition to inflationary pressures, European markets faced energy-supply issues due to Russia’s invasion of Ukraine. A tax-cutting plan to shore up the economy in the United Kingdom backfired, causing a near collapse of the British pound sterling and requiring central bank intervention. In December, Japan jolted global financial markets when it loosened the tight limits it had been imposing on bond yields.
Developed equity markets outside the US and Canada, as measured by the MSCI EAFE Index, declined 14.45% during the year, and the MSCI Europe Index dropped 15.06%. The MSCI Japan Index dipped 16.65%.
| | | | |
| Market Overview — unaudited (continued) | | Annual Report | | December 31, 2022 |
| | | | |
Emerging market stocks suffer
A surging US dollar, spiking food and fuel prices, and Russia’s invasion of Ukraine hurt high-risk assets, including emerging market stocks, during 2022. The MSCI Emerging Markets Index declined 20.09%. While many emerging market countries began raising rates before their developed market counterparts, China—the world’s second-largest economy—was forced to trim key rates in response to slowing growth caused by its zero-COVID policy, and its lockdown measures were dropped by the end of the year. The MSCI China Index declined 21.93%.
Fixed Income Market Overview
In response to rampant inflation, central banks hiked interest rates aggressively in 2022, sending bond yields higher and prices significantly lower. Bonds failed to provide a safe haven for investors as carnage spread across most sectors, including government bonds, high yield issues, and emerging-market fixed income.
US Treasury yields increased dramatically during the year, sending the Bloomberg US Aggregate Bond Index lower by 13.01%—one of the worst years ever for US investment-grade fixed income. Bonds issued by the US government and indexed to inflation, or TIPS, declined 11.85%. High yield bonds (i.e., debt rated below investment grade) as measured by the Bloomberg US Corporate High Yield Index, fell 11.19%, outperforming their investment-grade counterparts. Emerging market debt, based on the J.P. Morgan EMBI Global Diversified Index, declined 17.78%. (All returns cited are in US dollars unless stated otherwise.)
Central banks shift gears to fight record-high inflation
Across most of the world, inflationary pressures intensified in 2022, leading central banks to begin tightening monetary policy after injecting aggressive stimulus into their economies in 2020 and 2021. Consumer prices, particularly food and fuel, spiked and remained elevated throughout the year, as inflation rose to a 40-year high in many countries.
The US Federal Reserve raised the federal funds rate seven times in 2022. The rate began the year at around 0% and ended it in a range between 4.25% and 4.50%. While the Bank of England began raising rates in late 2021, the European Central Bank held steadfast until July 2022, when it raised rates for the first time in 11 years. Even Japan, which had kept interest rates below zero since 2016, altered its bond policy in December 2022, allowing 10-year yields to rise.
Labor markets remain robust despite slowing economic growth
Economic growth was uneven during 2022. US gross domestic product declined in the first and second quarters. While growth resumed in the third quarter, it was boosted by the largest rise in real net exports in over 40 years, which many economists do not consider sustainable. However, the labor market remained shielded, as unemployment remained low and hourly earnings steadily increased.
Commodities gain
Crude oil prices rocketed above $100 per barrel following the onset of Russia’s invasion of Ukraine in February. However, gains were muted by year-end as recession fears increased. Further impacting energy prices was the decision by the Organization of the Petroleum Exporting Countries and its major allies to cut oil production in the fall, as well as efforts to cap the price of Russian oil.
Falling bond prices lead to yield curve inversion
Longer-term US Treasuries were one of the worst-performing sectors of the bond market in 2022, as the Bloomberg US 10+ Year Corporate Index dropped 25.62%, significantly underperforming its 1-5 year counterpart, which fell 5.56%.
The impact of rising rates sent bond prices lower across the spectrum. However, the negative impact was particularly strong for longer-dated debt, resulting in an inversion in Treasury yields. The 10-year US Treasury yield began the year at 1.51% and spiked over 4% before ending the year at 3.88%. Meanwhile, the shorter-dated 2-year Treasury note traded at around 4.42% at year-end. Yield inversion has been a historical harbinger of a recession.
Rising dollar pressures emerging market bonds
Emerging-market central banks began tightening monetary policy in early 2021, nearly a full year before the Fed, in their battle against surging food and fuel costs. However, Russia’s invasion of Ukraine increased pricing pressures further, and the surging US dollar—which had one of its best performances in years—threatened many emerging economies by making foreign debt payments more difficult.
| | | | |
| The Prudential Variable Contract Account-2 | | | | December 31, 2022 |
| | | | |
Report of the Investment Manager - As of December 31, 2022 (Unaudited)
| | | | | | | | |
| | | | |
| Average Annual Total Returns | | 1 Year | | 5 Years | | 10 Years | | 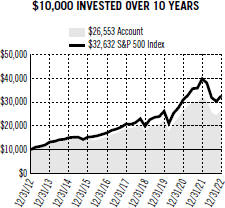
|
Accumulation Account (without sales charges) | | -17.46% | | 6.96% | | 10.26% |
S&P 500 Index | | -18.10 | | 9.42 | | 12.55 |
Past performance does not guarantee future returns. The Account performance without sales charges is shown after the deduction of all expenses, including investment management and mortality and expense charges, but does not include the effect of any sales charge or annual account charge. The performance would be lower if they included the effects of sales charges and an annual account charge. |
|
For the year ended December 31, 2022, the Prudential Variable Contract Account-2 returned -17.46%. The Account underperformed the S&P 500 Index.
What were the market conditions during the reporting period?
Calendar-year 2022 (the reporting period) was challenging for equity markets, with major indices closing at or near their lows for the reporting period. Uncertainty and volatility were enduring constants.
In response to signs of an economic slowdown, around the world and across industries, many companies that had benefited most from the COVID-19 pandemic began to reduce headcount and take operational steps to mitigate expected weakness. Commodity prices continued their retreat into the end of the reporting period, despite the lingering impact of Russia’s invasion of Ukraine. China took steps to ease its restrictive “zero-COVID” policy, resulting in a wave of infections, hospitalizations, and further economic dislocation as the reporting period ended.
Economic data reflected a mix of contrasting trends, with strength in employment, wages, and savings largely offsetting the effects of consumer price inflation, falling house prices, and waning spending by lower-income households. The persistence of labor-market tightness kept the US Federal Reserve (the Fed) on a tightening path, with the federal funds rate closing the reporting period in the range of 4.25% to 4.50%, levels last seen in 2007. Inflation was a global phenomenon, and central banks in many countries followed a path similar to that of the Fed, leading to a partial retracement of the US dollar’s significant appreciation since the end of 2021.
The S&P 500 Index declined 18.10% in the reporting period. Communication services, consumer discretionary, information technology, and real estate saw the biggest declines. The energy sector posted, by far, the largest gain. The utilities sector managed modestly positive returns, while other defensive value sectors such as consumer staples and healthcare were down slightly but held up better than the S&P 500 Index overall.
What strategies or holdings affected the Portfolio’s performance?*
In absolute terms, the Portfolio’s positions in energy and healthcare added the most to performance during the reporting period, while positions in information technology and consumer discretionary added the least.
Relative to the Portfolio’s benchmark index, an overweight allocation to energy and underweight allocations to information technology and communication services, along with stock selection in healthcare, contributed the most positively to the Portfolio’s performance.
Stock selection in information technology and communication services detracted the most from relative results. The stocks that added most to the Portfolio’s relative performance included Eli Lilly and Co., Chevron Corp., ConocoPhillips Co., Hess Corp., and AbbVie Inc. Top detractors for the period included Tesla, Inc., Alphabet Inc., Amazon.com, Inc., Microsoft Corp., and Apple Inc.
*This strategy and performance overview, which discusses what strategies or holdings (including derivatives, if applicable) affected the Portfolio’s performance, is compiled based on how the Portfolio performed relative to the Portfolio’s assigned index and is viewed for performance attribution purposes at the aggregate Portfolio level, which in most instances will not directly correlate to the amounts disclosed in the Statement of Operations which conform to U.S. generally accepted accounting principles.
For a complete list of holdings, please refer to the Statement of Net Assets section of this report. Holdings reflect only long-term investments.
| | | | |
| The Prudential Variable Contract Account-2 | | | | December 31, 2022 |
| | | | |
Report of the Investment Manager - As of December 31, 2022 (Unaudited) (Continued)
Presentation of Portfolio Holdings — unaudited
| | | | | | |
| | |
VCA-2 (As of 12/31/2022) | | | | | |
| | |
Ten Largest Holdings | | Line of Business | | | % of Net Assets | |
Eli Lilly & Co. | | Pharmaceuticals | | | 3.7% | |
Chevron Corp. | | Oil, Gas & Consumable Fuels | | | 2.9% | |
Microsoft Corp. | | Software | | | 2.8% | |
Apple, Inc. | | Technology Hardware, Storage & Peripherals | | | 2.7% | |
Bristol-Myers Squibb Co. | | Pharmaceuticals | | | 2.5% | |
JPMorgan Chase & Co. | | Banks | | | 2.4% | |
Chubb Ltd. | | Insurance | | | 2.3% | |
ConocoPhillips | | Oil, Gas & Consumable Fuels | | | 2.1% | |
Alphabet, Inc. (Class A Stock) | | Interactive Media & Services | | | 2.0% | |
AbbVie, Inc. | | Biotechnology | | | 2.0% | |
For a complete listing of holdings, refer to the Statement of Net Assets section of this report. Holdings reflect only long-term investments.
| | |
The Prudential Variable Contract Account-2 Benchmark Glossary — unaudited | | December 31, 2022 |
| | |
The indexes are unmanaged and include reinvestment of any income or distributions. They do not reflect any fees, expenses or sales charges. Investors cannot invest directly in a market index.
S&P 500 Index is an unmanaged, market value-weighted index of over 500 stocks generally representative of the broad stock market
The S&P 500 index is a product of S&P Dow Jones Indices LLC and/or its affiliates and has been licensed for use by PGIM, Inc. and/or its affiliates. Copyright © 2023 S&P Dow Jones Indices LLC, a division of S&P Global, Inc., and/or its affiliates. All rights reserved. Redistribution or reproduction in whole or in part are prohibited without written permission of S&P Dow Jones Indices LLC. For more information on any of S&P Dow Jones Indices LLC’s indices please visit www.spdji.com. S&P® is a registered trademark of S&P Global and Dow Jones® is a registered trademark of Dow Jones Trademark Holdings LLC.
FINANCIAL STATEMENTS OF
VCA-2
| | | | | | | | |
LONG-TERM INVESTMENTS — 96.7% | |
| COMMON STOCKS | | Shares | | | Value | |
Aerospace & Defense — 2.6% | | | | | | | | |
Airbus SE (France) | | | 16,295 | | | $ | 1,931,724 | |
Raytheon Technologies Corp. | | | 31,155 | | | | 3,144,163 | |
| | | | | | | | |
| | |
| | | | | | | 5,075,887 | |
| | | | | | | | |
Airlines — 0.9% | | | | | | | | |
Delta Air Lines, Inc.* | | | 54,666 | | | | 1,796,325 | |
| | | | | | | | |
Automobiles — 1.6% | | | | | | | | |
Dr. Ing. h.c. F. Porsche AG (Germany)* | | | 3,057 | | | | 307,570 | |
General Motors Co. | | | 44,628 | | | | 1,501,286 | |
Tesla, Inc.* | | | 11,421 | | | | 1,406,839 | |
| | | | | | | | |
| | |
| | | | | | | 3,215,695 | |
| | | | | | | | |
Banks — 7.1% | | | | | | | | |
Bank of America Corp. | | | 101,245 | | | | 3,353,235 | |
JPMorgan Chase & Co. | | | 35,071 | | | | 4,703,021 | |
PNC Financial Services Group, Inc. (The) | | | 19,695 | | | | 3,110,628 | |
Truist Financial Corp. | | | 65,636 | | | | 2,824,317 | |
| | | | | | | | |
| | |
| | | | | | | 13,991,201 | |
| | | | | | | | |
Beverages — 1.4% | | | | | | | | |
PepsiCo, Inc. | | | 15,664 | | | | 2,829,858 | |
| | | | | | | | |
Biotechnology — 3.7% | | | | | | | | |
AbbVie, Inc. | | | 23,969 | | | | 3,873,630 | |
Amgen, Inc. | | | 8,560 | | | | 2,248,198 | |
Vertex Pharmaceuticals, Inc.* | | | 4,051 | | | | 1,169,848 | |
| | | | | | | | |
| | |
| | | | | | | 7,291,676 | |
| | | | | | | | |
Building Products — 1.3% | | | | | | | | |
Johnson Controls International PLC | | | 39,298 | | | | 2,515,072 | |
| | | | | | | | |
Capital Markets — 2.2% | | | | | | | | |
Blackstone, Inc. | | | 14,322 | | | | 1,062,549 | |
Goldman Sachs Group, Inc. (The) | | | 9,813 | | | | 3,369,588 | |
| | | | | | | | |
| | |
| | | | | | | 4,432,137 | |
| | | | | | | | |
Chemicals — 2.6% | | | | | | | | |
DuPont de Nemours, Inc. | | | 25,499 | | | | 1,749,996 | |
Linde PLC (United Kingdom) | | | 10,645 | | | | 3,472,186 | |
| | | | | | | | |
| | |
| | | | | | | 5,222,182 | |
| | | | | | | | |
Communications Equipment — 1.1% | | | | | | | | |
Cisco Systems, Inc. | | | 43,859 | | | | 2,089,443 | |
| | | | | | | | |
Consumer Finance — 0.9% | | | | | | | | |
SLM Corp. | | | 109,823 | | | | 1,823,062 | |
| | | | | | | | |
Containers & Packaging — 0.9% | | | | | | | | |
Crown Holdings, Inc. | | | 21,736 | | | | 1,786,917 | |
| | | | | | | | |
Electric Utilities — 1.3% | | | | | | | | |
NextEra Energy, Inc. | | | 30,141 | | | | 2,519,788 | |
| | | | | | | | |
Entertainment — 0.6% | | | | | | | | |
Netflix, Inc.* | | | 3,856 | | | | 1,137,057 | |
| | | | | | | | |
Equity Real Estate Investment Trusts (REITs) — 1.6% | | | | | |
Alexandria Real Estate Equities, Inc. | | | 14,923 | | | | 2,173,833 | |
SBA Communications Corp. | | | 3,319 | | | | 930,349 | |
| | | | | | | | |
| | |
| | | | | | | 3,104,182 | |
| | | | | | | | |
| | | | | | | | |
COMMON STOCKS | |
| (continued) | | Shares | | | Value | |
Food & Staples Retailing — 2.4% | | | | | | | | |
Costco Wholesale Corp. | | | 3,642 | | | $ | 1,662,573 | |
Walmart, Inc. | | | 22,026 | | | | 3,123,067 | |
| | | | | | | | |
| | |
| | | | | | | 4,785,640 | |
| | | | | | | | |
Food Products — 1.0% | | | | | | | | |
Mondelez International, Inc.
(Class A Stock) | | | 29,807 | | | | 1,986,637 | |
| | | | | | | | |
Health Care Equipment & Supplies — 1.7% | | | | | | | | |
Abbott Laboratories | | | 22,159 | | | | 2,432,836 | |
Dexcom, Inc.* | | | 8,212 | | | | 929,927 | |
| | | | | | | | |
| | |
| | | | | | | 3,362,763 | |
| | | | | | | | |
Health Care Providers & Services — 3.1% | | | | | | | | |
Centene Corp.* | | | 25,329 | | | | 2,077,231 | |
Cigna Corp. | | | 6,007 | | | | 1,990,360 | |
UnitedHealth Group, Inc. | | | 3,796 | | | | 2,012,563 | |
| | | | | | | | |
| | |
| | | | | | | 6,080,154 | |
| | | | | | | | |
Hotels, Restaurants & Leisure — 1.9% | | | | | | | | |
Airbnb, Inc. (Class A Stock)* | | | 5,079 | | | | 434,254 | |
McDonald’s Corp. | | | 12,479 | | | | 3,288,591 | |
| | | | | | | | |
| | |
| | | | | | | 3,722,845 | |
| | | | | | | | |
Household Products — 1.7% | | | | | | | | |
Procter & Gamble Co. (The) | | | 21,773 | | | | 3,299,916 | |
| | | | | | | | |
Insurance — 5.5% | | | | | | | | |
Chubb Ltd. (Switzerland) | | | 20,562 | | | | 4,535,977 | |
Marsh & McLennan Cos., Inc. | | | 11,891 | | | | 1,967,723 | |
MetLife, Inc. | | | 36,276 | | | | 2,625,294 | |
RenaissanceRe Holdings Ltd. (Bermuda) | | | 9,147 | | | | 1,685,152 | |
| | | | | | | | |
| | |
| | | | | | | 10,814,146 | |
| | | | | | | | |
Interactive Media & Services — 3.2% | | | | | | | | |
Alphabet, Inc. (Class A Stock)* | | | 44,974 | | | | 3,968,056 | |
Alphabet, Inc. (Class C Stock)* | | | 13,361 | | | | 1,185,522 | |
Meta Platforms, Inc. (Class A Stock)* | | | 9,013 | | | | 1,084,624 | |
ZoomInfo Technologies, Inc.* | | | 6,220 | | | | 187,284 | |
| | | | | | | | |
| | |
| | | | | | | 6,425,486 | |
| | | | | | | | |
Internet & Direct Marketing Retail — 2.0% | | | | | | | | |
Amazon.com, Inc.* | | | 30,480 | | | | 2,560,320 | |
MercadoLibre, Inc. (Uruguay)* | | | 1,729 | | | | 1,463,149 | |
| | | | | | | | |
| | |
| | | | | | | 4,023,469 | |
| | | | | | | | |
IT Services — 1.6% | | | | | | | | |
Adyen NV (Netherlands), 144A* | | | 355 | | | | 491,355 | |
Mastercard, Inc. (Class A Stock) | | | 6,618 | | | | 2,301,277 | |
Snowflake, Inc. (Class A Stock)* | | | 2,766 | | | | 397,032 | |
| | | | | | | | |
| | |
| | | | | | | 3,189,664 | |
| | | | | | | | |
Life Sciences Tools & Services — 1.8% | | | | | | | | |
Danaher Corp. | | | 11,717 | | | | 3,109,926 | |
Lonza Group AG (Switzerland) | | | 761 | | | | 373,334 | |
| | | | | | | | |
| | |
| | | | | | | 3,483,260 | |
| | | | | | | | |
SEE NOTES TO FINANCIAL STATEMENTS.
A1
FINANCIAL STATEMENTS OF
VCA-2
| | | | | | | | |
COMMON STOCKS | |
| (continued) | | Shares | | | Value | |
Machinery — 3.4% | | | | | | | | |
Deere & Co. | | | 5,718 | | | $ | 2,451,650 | |
Fortive Corp. | | | 30,823 | | | | 1,980,378 | |
Otis Worldwide Corp. | | | 29,030 | | | | 2,273,339 | |
| | | | | | | | |
| | |
| | | | | | | 6,705,367 | |
| | | | | | | | |
Multi-Utilities — 2.4% | | | | | | | | |
Ameren Corp. | | | 33,246 | | | | 2,956,234 | |
CenterPoint Energy, Inc. | | | 63,349 | | | | 1,899,837 | |
| | | | | | | | |
| | |
| | | | | | | 4,856,071 | |
| | | | | | | | |
Oil, Gas & Consumable Fuels — 8.3% | | | | | | | | |
Chevron Corp. | | | 32,206 | | | | 5,780,655 | |
ConocoPhillips | | | 35,340 | | | | 4,170,120 | |
Hess Corp. | | | 22,416 | | | | 3,179,037 | |
Williams Cos., Inc. (The) | | | 100,142 | | | | 3,294,672 | |
| | | | | | | | |
| | |
| | | | | | | 16,424,484 | |
| | | | | | | | |
Personal Products — 0.6% | | | | | | | | |
Estee Lauder Cos., Inc. (The)
(Class A Stock) | | | 2,416 | | | | 599,434 | |
L’Oreal SA (France) | | | 1,456 | | | | 519,831 | |
| | | | | | | | |
| | |
| | | | | | | 1,119,265 | |
| | | | | | | | |
Pharmaceuticals — 8.9% | | | | | | | | |
AstraZeneca PLC (United Kingdom), ADR | | | 45,332 | | | | 3,073,510 | |
Bristol-Myers Squibb Co. | | | 67,890 | | | | 4,884,686 | |
Eli Lilly & Co. | | | 20,237 | | | | 7,403,504 | |
Novo Nordisk A/S (Denmark), ADR | | | 16,001 | | | | 2,165,575 | |
| | | | | | | | |
| | |
| | | | | | | 17,527,275 | |
| | | | | | | | |
Road & Rail — 0.9% | | | | | | | | |
Union Pacific Corp. | | | 8,795 | | | | 1,821,181 | |
| | | | | | | | |
Semiconductors & Semiconductor Equipment — 5.4% | | | | | |
ASML Holding NV (Netherlands) | | | 2,567 | | | | 1,402,609 | |
Broadcom, Inc. | | | 4,102 | | | | 2,293,551 | |
Lam Research Corp. | | | 3,659 | | | | 1,537,878 | |
NVIDIA Corp. | | | 14,076 | | | | 2,057,067 | |
NXP Semiconductors NV (Netherlands) | | | 10,712 | | | | 1,692,817 | |
QUALCOMM, Inc. | | | 16,346 | | | | 1,797,079 | |
| | | | | | | | |
| | |
| | | | | | | 10,781,001 | |
| | | | | | | | |
Software — 4.2% | | | | | | | | |
Cadence Design Systems, Inc.* | | | 2,887 | | | | 463,768 | |
| | | | | | | | |
Crowdstrike Holdings, Inc. (Class A Stock)* | | | 2,580 | | | | 271,648 | |
Microsoft Corp. | | | 23,534 | | | | 5,643,924 | |
Palo Alto Networks, Inc.* | | | 1,549 | | | | 216,147 | |
Salesforce, Inc.* | | | 13,351 | | | | 1,770,209 | |
| | | | | | | | |
| | |
| | | | | | | 8,365,696 | |
| | | | | | | | |
Specialty Retail — 0.7% | | | | | | | | |
Lowe’s Cos., Inc. | | | 7,209 | | | | 1,436,321 | |
| | | | | | | | |
Technology Hardware, Storage & Peripherals — 2.7% | | | | | |
Apple, Inc. | | | 41,616 | | | | 5,407,167 | |
| | | | | | | | |
| | | | | | | | |
COMMON STOCKS | |
| (continued) | | Shares | | | Value | |
Textiles, Apparel & Luxury Goods — 2.2% | | | | | |
Lululemon Athletica, Inc. (Canada)* | | | 4,062 | | | $ | 1,301,384 | |
LVMH Moet Hennessy Louis Vuitton SE (France) | | | 3,434 | | | | 2,491,428 | |
NIKE, Inc. (Class B Stock) | | | 5,683 | | | | 664,968 | |
| | | | | | | | |
| | |
| | | | | | | 4,457,780 | |
| | | | | | | | |
Wireless Telecommunication Services — 1.3% | | | | | |
T-Mobile US, Inc.* | | | 18,215 | | | | 2,550,100 | |
| | | | | | | | |
TOTAL COMMON STOCKS
(cost $135,170,446) | | | | | | | 191,456,170 | |
| | | | | | | | |
|
SHORT-TERM INVESTMENT — 3.2% | |
Affiliated Mutual Fund | | | | | | | | |
PGIM Core Ultra Short Bond Fund
(cost $6,339,353)(a) | | | 6,339,353 | | | | 6,339,353 | |
| | | | | | | | |
TOTAL INVESTMENTS — 99.9%
(cost $141,509,799) | | | | 197,795,523 | |
| | | | | | | | |
OTHER ASSETS IN EXCESS OF LIABILITIES — 0.1% | |
Dividends and Interests Receivable | | | | | | | 158,056 | |
Tax Reclaim Receivable | | | | | | | 9,553 | |
Payable for Pending Capital Transactions | | | | | | | (5,091 | ) |
Payable for Securities Purchased | | | | | | | (18,209 | ) |
| | | | | | | | |
OTHER ASSETS IN EXCESS OF LIABILITIES | | | | 144,309 | |
| | | | | | | | |
NET ASSETS — 100.0% | | | | | | $ | 197,939,832 | |
| | | | | | | | |
| | |
NET ASSETS, representing: | | | | | | | | |
Equity of Participants —
1,778,471 Accumulation Units at an Accumulation Unit Value of $109.6553 | | | | | | $ | 195,018,729 | |
Equity of Annuitants | | | | | | | 2,695,496 | |
Equity of The Prudential Insurance Company of America | | | | | | | 225,607 | |
| | | | | | | | |
| | |
| | | | | | $ | 197,939,832 | |
| | | | | | | | |
The following abbreviations are used in the annual report:
| | | | |
| | | 144A | | Security exempt from registration under Rule 144A of the Securities Act of 1933. These securities may be resold in transactions exempt from registration, typically only to qualified institutional buyers. |
| | |
| | ADR | | American Depositary Receipt |
| |
| * | | Non-income producing security. |
| |
| (a) | | PGIM Investments LLC, the manager of the Account, also serves as manager of the PGIM Core Ultra Short Bond Fund. |
SEE NOTES TO FINANCIAL STATEMENTS.
A2
FINANCIAL STATEMENTS OF
VCA-2
| | | | |
| | STATEMENT OF NET ASSETS | | |
| | | | December 31, 2022 |
Fair Value Measurements:
Various inputs are used in determining the value of the Account’s investments. These inputs are summarized in the three broad levels listed below.
Level 1—unadjusted quoted prices generally in active markets for identical securities.
Level 2—quoted prices for similar securities, interest rates and yield curves, prepayment speeds, foreign currency exchange rates, and other observable inputs.
Level 3—unobservable inputs for securities valued in accordance with the Account’s Committee approved fair valuation procedures.
The following is a summary of the inputs used as of December 31, 2022 in valuing such portfolio securities:
| | | | | | | | | | | | |
| | | Level 1 | | | Level 2 | | | Level 3 | |
Investments In Securities | | | | | | | | | | | | |
Assets | | | | | | | | | | | | |
Long-Term Investments | | | | | | | | | | | | |
Common Stocks | | | | | | | | | | | | |
Aerospace & Defense | | $ | 3,144,163 | | | $ | 1,931,724 | | | $ | — | |
Airlines | | | 1,796,325 | | | | — | | | | — | |
Automobiles | | | 2,908,125 | | | | 307,570 | | | | — | |
Banks | | | 13,991,201 | | | | — | | | | — | |
Beverages | | | 2,829,858 | | | | — | | | | — | |
Biotechnology | | | 7,291,676 | | | | — | | | | — | |
Building Products | | | 2,515,072 | | | | — | | | | — | |
Capital Markets | | | 4,432,137 | | | | — | | | | — | |
Chemicals | | | 5,222,182 | | | | — | | | | — | |
Communications Equipment | | | 2,089,443 | | | | — | | | | — | |
Consumer Finance | | | 1,823,062 | | | | — | | | | — | |
Containers & Packaging | | | 1,786,917 | | | | — | | | | — | |
Electric Utilities | | | 2,519,788 | | | | — | | | | — | |
Entertainment | | | 1,137,057 | | | | — | | | | — | |
Equity Real Estate Investment Trusts (REITs) | | | 3,104,182 | | | | — | | | | — | |
Food & Staples Retailing | | | 4,785,640 | | | | — | | | | — | |
Food Products | | | 1,986,637 | | | | — | | | | — | |
Health Care Equipment & Supplies | | | 3,362,763 | | | | — | | | | — | |
Health Care Providers & Services | | | 6,080,154 | | | | — | | | | — | |
Hotels, Restaurants & Leisure | | | 3,722,845 | | | | — | | | | — | |
Household Products | | | 3,299,916 | | | | — | | | | — | |
Insurance | | | 10,814,146 | | | | — | | | | — | |
Interactive Media & Services | | | 6,425,486 | | | | — | | | | — | |
Internet & Direct Marketing Retail | | | 4,023,469 | | | | — | | | | — | |
IT Services | | | 2,698,309 | | | | 491,355 | | | | — | |
Life Sciences Tools & Services | | | 3,109,926 | | | | 373,334 | | | | — | |
Machinery | | | 6,705,367 | | | | — | | | | — | |
Multi-Utilities | | | 4,856,071 | | | | — | | | | — | |
Oil, Gas & Consumable Fuels | | | 16,424,484 | | | | — | | | | — | |
Personal Products | | | 599,434 | | | | 519,831 | | | | — | |
Pharmaceuticals | | | 17,527,275 | | | | — | | | | — | |
Road & Rail | | | 1,821,181 | | | | — | | | | — | |
Semiconductors & Semiconductor Equipment | | | 10,781,001 | | | | — | | | | — | |
Software | | | 8,365,696 | | | | — | | | | — | |
Specialty Retail | | | 1,436,321 | | | | — | | | | — | |
Technology Hardware, Storage & Peripherals | | | 5,407,167 | | | | — | | | | — | |
Textiles, Apparel & Luxury Goods | | | 1,966,352 | | | | 2,491,428 | | | | — | |
Wireless Telecommunication Services | | | 2,550,100 | | | | — | | | | — | |
Short-Term Investment | | | | | | | | | | | | |
Affiliated Mutual Fund | | | 6,339,353 | | | | — | | | | — | |
| | | | | | | | | | | | |
Total | | $ | 191,680,281 | | | $ | 6,115,242 | | | $ | — | |
| | | | | | | | | | | | |
SEE NOTES TO FINANCIAL STATEMENTS.
A3
FINANCIAL STATEMENTS OF
VCA-2
Industry Classification:
The industry classification of investments and other assets in excess of liabilities shown as a percentage of net assets as of December 31, 2022 were as follows:
| | | | |
Pharmaceuticals | | | 8.9 | % |
Oil, Gas & Consumable Fuels | | | 8.3 | |
Banks | | | 7.1 | |
Insurance | | | 5.5 | |
Semiconductors & Semiconductor Equipment | | | 5.4 | |
Software | | | 4.2 | |
Biotechnology | | | 3.7 | |
Machinery | | | 3.4 | |
Interactive Media & Services | | | 3.2 | |
Affiliated Mutual Fund | | | 3.2 | |
Health Care Providers & Services | | | 3.1 | |
Technology Hardware, Storage & Peripherals | | | 2.7 | |
Chemicals | | | 2.6 | |
Aerospace & Defense | | | 2.6 | |
Multi-Utilities | | | 2.4 | |
Food & Staples Retailing | | | 2.4 | |
Textiles, Apparel & Luxury Goods | | | 2.2 | |
Capital Markets | | | 2.2 | |
Internet & Direct Marketing Retail | | | 2.0 | |
Hotels, Restaurants & Leisure | | | 1.9 | |
Life Sciences Tools & Services | | | 1.8 | |
Health Care Equipment & Supplies | | | 1.7 | |
| | | | |
Household Products | | | 1.7 | % |
Automobiles | | | 1.6 | |
IT Services | | | 1.6 | |
Equity Real Estate Investment Trusts (REITs) | | | 1.6 | |
Beverages | | | 1.4 | |
Wireless Telecommunication Services | | | 1.3 | |
Electric Utilities | | | 1.3 | |
Building Products | | | 1.3 | |
Communications Equipment | | | 1.1 | |
Food Products | | | 1.0 | |
Consumer Finance | | | 0.9 | |
Road & Rail | | | 0.9 | |
Airlines | | | 0.9 | |
Containers & Packaging | | | 0.9 | |
Specialty Retail | | | 0.7 | |
Entertainment | | | 0.6 | |
Personal Products | | | 0.6 | |
| | | | |
| | | 99.9 | |
Other assets in excess of liabilities | | | 0.1 | |
| | | | |
| | | 100.0 | % |
| | | | |
SEE NOTES TO FINANCIAL STATEMENTS.
A4
FINANCIAL STATEMENTS OF
VCA-2
Year Ended December 31, 2022
| | | | |
| | | | |
INVESTMENT INCOME | | | | |
Unaffiliated Dividend Income (net of $17,551 foreign withholding tax) | | $ | 3,839,716 | |
Affiliated Dividend Income | | | 101,146 | |
Total Income | | | 3,940,862 | |
EXPENSES | | | | |
Fees Charged to Participants and Annuitants for Investment Management Services | | | (278,402 | ) |
Fees Charged to Participants (other than Annuitants) for Assuming Mortality and Expense Risks | | | (817,656 | ) |
Total Expenses | | | (1,096,058 | ) |
NET INVESTMENT INCOME | | | 2,844,804 | |
REALIZED AND UNREALIZED GAIN (LOSS) ON INVESTMENT AND FOREIGN CURRENCY TRANSACTIONS | | | | |
Net Realized Gain (Loss) on: | | | | |
Investment Transactions | | | 4,968,712 | |
Foreign Currency Transactions | | | (1,319 | ) |
| | | | 4,967,393 | |
Net Change in Unrealized Appreciation (Depreciation) on: | | | | |
Investments | | | (53,657,619 | ) |
Foreign Currencies | | | 2 | |
| | | | (53,657,617 | ) |
NET LOSS ON INVESTMENT AND FOREIGN CURRENCY TRANSACTIONS | | | (48,690,224 | ) |
NET DECREASE IN NET ASSETS RESULTING FROM OPERATIONS | | $ | (45,845,420 | ) |
| | | | |
| | |
| | STATEMENT OF CHANGES IN NET ASSETS | | |
| | | | | | | | |
| | | Year Ended December 31, | |
| | | 2022 | | | 2021 | |
OPERATIONS | | | | | | | | |
Net Investment Income | | $ | 2,844,804 | | | $ | 2,416,341 | |
Net Realized Gain on Investment and Foreign Currency Transactions | | | 4,967,393 | | | | 27,828,520 | |
Net Change in Unrealized Appreciation (Depreciation) on Investments and Foreign Currencies | | | (53,657,617 | ) | | | 20,454,971 | |
NET INCREASE (DECREASE) IN NET ASSETS RESULTING FROM OPERATIONS | | | (45,845,420 | ) | | | 50,699,832 | |
CAPITAL TRANSACTIONS | | | | | | | | |
Purchase Payments and Transfers In (939 and 19,087 units, respectively) | | | 117,999 | | | | 2,339,213 | |
Withdrawals and Transfers Out (206,538 and 230,354 units, respectively) | | | (23,536,060 | ) | | | (28,698,477 | ) |
Mortality and Expense Risk Charges Deducted from Annuitants’ Accounts | | | (17,552 | ) | | | (20,710 | ) |
Variable Annuity Payments | | | (521,309 | ) | | | (654,166 | ) |
NET DECREASE IN NET ASSETS RESULTING FROM CAPITAL TRANSACTIONS | | | (23,956,922 | ) | | | (27,034,140 | ) |
NET DECREASE IN NET ASSETS RESULTING FROM SURPLUS TRANSFERS | | | (66,936 | ) | | | (402,303 | ) |
TOTAL INCREASE (DECREASE) IN NET ASSETS | | | (69,869,278 | ) | | | 23,263,389 | |
NET ASSETS | | | | | | | | |
Beginning of year | | | 267,809,110 | | | | 244,545,721 | |
End of year | | $ | 197,939,832 | | | $ | 267,809,110 | |
SEE NOTES TO FINANCIAL STATEMENTS.
A5
FINANCIAL STATEMENTS OF
VCA-2
| | | | |
| | INCOME PER ACCUMULATION UNIT* | | |
(For an Accumulation Unit outstanding throughout the year)
| | | | | | | | | | | | | | | | | | | | |
| | | Year Ended December 31, | |
| | | 2022 | | | 2021 | | | 2020 | | | 2019 | | | 2018 | |
Investment Income | | $ | 2.0390 | | | $ | 1.7378 | | | $ | 1.6913 | | | $ | 1.6743 | | | $ | 1.4886 | |
Expenses | | | | | | | | | | | | | | | | | | | | |
Investment management fee | | | (0.1432 | ) | | | (0.1542 | ) | | | (0.1146 | ) | | | (0.1045 | ) | | | (0.1008 | ) |
Assuming mortality and expense risks | | | (0.4291 | ) | | | (0.4620 | ) | | | (0.3433 | ) | | | (0.3132 | ) | | | (0.3021 | ) |
Net Investment Income | | | 1.4667 | | | | 1.1216 | | | | 1.2334 | | | | 1.2566 | | | | 1.0857 | |
Net realized and unrealized gain (loss) on investment and foreign currency transactions | | | (24.6685 | ) | | | 22.3587 | | | | 15.6857 | | | | 18.6403 | | | | (6.8449 | ) |
Net Increase (Decrease) in Accumulation Unit Value | | | (23.2018 | ) | | | 23.4803 | | | | 16.9191 | | | | 19.8969 | | | | (5.7592 | ) |
Accumulation Unit Value | | | | | | | | | | | | | | | | | | | | |
Beginning of year | | | 132.8571 | | | | 109.3768 | | | | 92.4577 | | | | 72.5608 | | | | 78.3200 | |
End of year | | | 109.6553 | | | | 132.8571 | | | | 109.3768 | | | | 92.4577 | | | | 72.5608 | |
Total Return** | | | (17.46 | )% | | | 21.47 | % | | | 18.30 | % | | | 27.39 | % | | | (7.35 | )% |
Ratio of Expenses to Average Net Assets*** | | | 0.50 | % | | | 0.50 | % | | | 0.50 | % | | | 0.50 | % | | | 0.50 | % |
Ratio of Net Investment Income to Average Net Assets*** | | | 1.27 | % | | | 0.92 | % | | | 1.35 | % | | | 1.51 | % | | | 1.35 | % |
Portfolio Turnover Rate | | | 31 | % | | | 35 | % | | | 58 | % | | | 48 | % | | | 36 | % |
Number of Accumulation Units Outstanding
For Participants at end of year (000’s omitted) | | | 1,778 | | | | 1,984 | | | | 2,195 | | | | 2,392 | | | | 2,607 | |
| * | Calculated by accumulating the actual per unit amounts daily. |
| ** | Total return does not consider the effects of sales loads. Total return is calculated assuming a purchase of a share on the first day and a sale on the last day of each period reported. Total returns may reflect adjustments to conform to generally accepted accounting principles. Total returns for periods less than one full year are not annualized. |
| *** | These calculations exclude PICA’s equity in VCA-2. |
The above table does not reflect the annual administration charge, which does not affect the Accumulation Unit Value. This charge is made by reducing Participants’ Accumulation Accounts by a number of Accumulation Units equal in value to the charge.
SEE NOTES TO FINANCIAL STATEMENTS.
A6
NOTES TO FINANCIAL STATEMENTS OF
VCA-2
The Prudential Variable Contract Account-2 (“VCA-2” or the “Account”) was established on January 9, 1968 by The Prudential Insurance Company of America (“PICA”) under the laws of the State of New Jersey and is registered as an open-end, diversified management investment company under the Investment Company Act of 1940 (“1940 Act”), as amended. VCA-2 has been designed for use by employers (“Contractholders”) in making retirement arrangements on behalf of their employees (“Participants”). The investment objective of the Account is long-term growth of capital.
| Note 2: | | Accounting Policies |
The Account follows investment company accounting and reporting guidance of the Financial Accounting Standards Board (“FASB”) Accounting Standard Codification (“ASC”) Topic 946 Financial Services — Investment Companies. The following accounting policies conform to U.S. generally accepted accounting principles (“GAAP”). The Account consistently follows such policies in the preparation of its financial statements.
Securities Valuation: The Account holds securities and other assets and liabilities that are fair valued at the close of each day (generally, 4:00 PM Eastern time) the New York Stock Exchange (“NYSE”) is open for trading. Fair value is the price that would be received to sell an asset or paid to transfer a liability in an orderly transaction between market participants on the measurement date. The Account’s Committee Members (the “Committee”) have adopted valuation procedures for security valuation under which fair valuation responsibilities have been delegated to PGIM Investments LLC (“PGIM Investments” or the “Manager”). Pursuant to the Committee’s delegation, the Manager has established a Valuation Committee responsible for supervising the fair valuation of portfolio securities and other assets and liabilities. The valuation procedures permit the Account to utilize independent pricing vendor services, quotations from market makers, and alternative valuation methods when market quotations are either not readily available or not deemed representative of fair value. A record of the Valuation Committee’s actions is subject to the Committee’s review, approval, and ratification at its next regularly scheduled quarterly meeting.
For the fiscal reporting year-end, securities and other assets and liabilities were fair valued at the close of the last U.S. business day. Trading in certain foreign securities may occur when the NYSE is closed (including weekends and holidays). Because such foreign securities trade in markets that are open on weekends and U.S. holidays, the values of some of the Account’s foreign investments may change on days when investors cannot purchase or redeem Account shares.
Various inputs determine how the Account’s investments are valued, all of which are categorized according to the three broad levels (Level 1, 2, or 3) detailed in the table following the Account’s Statement of Net Assets and referred to herein as the “fair value hierarchy” in accordance with FASB ASC Topic 820 — Fair Value Measurement.
Common or preferred stocks, exchange-traded funds, and derivative instruments, if applicable, that are traded on a national securities exchange are valued at the last sale price as of the close of trading on the applicable exchange where the security principally trades. Securities traded via NASDAQ are valued at the NASDAQ official closing price. To the extent these securities are valued at the last sale price or NASDAQ official closing price, they are classified as Level 1 in the fair value hierarchy. In the event that no sale or official closing price on valuation date exists, these securities are generally valued at the mean between the last reported bid and ask prices, or at the last bid price in the absence of an ask price. These securities are classified as Level 2 in the fair value hierarchy.
Foreign equities traded on foreign securities exchanges are valued using pricing vendor services that provide model prices derived using adjustment factors based on information such as local closing price, relevant general and sector indices, currency fluctuations, depositary receipts, and futures, as applicable. Securities valued using such model prices are classified as Level 2 in the fair value hierarchy. The models generate an evaluated adjustment factor for each security, which is applied to the local closing price to adjust it for post-closing market movements up to the time the Account is valued. Utilizing that evaluated adjustment factor, the vendor provides an evaluated price for each security. If the vendor does not provide an evaluated price, securities are valued in accordance with exchange-traded common and preferred stock valuation policies discussed above.
B1
Investments in open-end (other than exchange-traded funds) are valued at their net asset values as of the close of the NYSE on the date of valuation. These securities are classified as Level 1 in the fair value hierarchy since they may be purchased or sold at their net asset values on the date of valuation.
Securities and other assets that cannot be priced according to the methods described above are valued based on pricing methodologies approved by the Committee. In the event that unobservable inputs are used when determining such valuations, the securities will be classified as Level 3 in the fair value hierarchy. Altering one or more unobservable inputs may result in a significant change to a Level 3 security’s fair value measurement.
When determining the fair value of securities, some of the factors influencing the valuation include: the nature of any restrictions on disposition of the securities; assessment of the general liquidity of the securities; the issuer’s financial condition and the markets in which it does business; the cost of the investment; the size of the holding and the capitalization of the issuer; the prices of any recent transactions or bids/offers for such securities or any comparable securities; any available analyst media or other reports or information deemed reliable by the Manager regarding the issuer or the markets or industry in which it operates. Using fair value to price securities may result in a value that is different from a security’s most recent closing price and from the price used by other mutual funds to calculate their net asset values.
Foreign Currency Translation: The books and records of the Account are maintained in U.S. dollars. Foreign currency amounts are translated into U.S. dollars on the following basis:
(i) market value of investment securities, other assets and liabilities — at the current rates of exchange;
(ii) purchases and sales of investment securities, income and expenses — at the rates of exchange prevailing on the respective dates of such transactions.
Although the net assets of the Account are presented at the foreign exchange rates and market values at the close of the period, the Account does not generally isolate that portion of the results of operations arising as a result of changes in the foreign exchange rates from the fluctuations arising from changes in the market prices of long-term portfolio securities held at the end of the period. Similarly, the Account does not isolate the effect of changes in foreign exchange rates from the fluctuations arising from changes in the market prices of long-term portfolio securities sold during the period. Accordingly, holding period realized foreign currency gains (losses) are included in the reported net realized gains (losses) on investment transactions.
Net realized gains (losses) on foreign currency transactions represent net foreign exchange gains (losses) from holdings of foreign currencies, currency gains (losses) realized between the trade and settlement dates on securities transactions, and the difference between the amounts of interest, dividends and foreign withholding taxes recorded on the Account’s books and the U.S. dollar equivalent amounts actually received or paid. Net unrealized currency gains (losses) from valuing foreign currency denominated assets and liabilities (other than investments) at period end exchange rates are reflected as a component of net unrealized appreciation (depreciation) on foreign currencies.
Securities Transactions and Net Investment Income: Securities transactions are recorded on the trade date. Realized gains (losses) from investment and currency transactions are calculated on the specific identification method. Dividend income is recorded on the ex-date, or for certain foreign securities, when the Account becomes aware of such dividends. Interest income, including amortization of premium and accretion of discount on debt securities, as required, is recorded on the accrual basis. Expenses are recorded on the accrual basis, which may require the use of certain estimates by management that may differ from actual. Net investment income and realized and unrealized gain (losses) (other than administrative fees) are allocated to the Participants and PICA on a daily basis in proportion to their respective ownership in VCA-2.
Estimates: The preparation of financial statements requires management to make estimates and assumptions that affect the reported amounts and disclosures in the financial statements. Actual results could differ from those estimates.
Federal Income Taxes: The operations of VCA-2 are part of, and are taxed with, the operations of PICA. Under the current provisions of the Internal Revenue Code, PICA does not expect to incur federal income taxes on earnings of VCA-2 to the extent the earnings are credited under the Contracts. As a result, the Unit Value of VCA-2 has not been reduced by federal income taxes.
Annuity Reserves: Reserves are computed for purchased annuities using the Prudential 1950 Group Annuity Valuation (GAV) Table, adjusted, and a valuation interest rate related to the Assumed Investment
B2
Result (AIR). The valuation interest rate is equal to the AIR less 0.50% in contract charges defined in Note 3. The AIRs are selected by each Contractholder and are described in the prospectus. Such amounts are included in Equity of annuitants in the Statement of Net Assets.
| Note 3: | | Investment Management Agreement and Charges |
The Account has a management agreement with PGIM Investments. Pursuant to this agreement, PGIM Investments has responsibility for all investment advisory services and supervises the subadviser’s performance of such services. PGIM Investments has entered into a subadvisory agreement with Jennison Associates LLC (“Jennison”). The subadvisory agreement provides that Jennison will furnish investment advisory services in connection with management of the Account. PGIM Investments pays for the services of Jennison.
A daily charge, at an effective annual rate of 0.125% of the current value of the Participant’s (other than annuitants’ and PICA’s) account in VCA-2, is charged to the Account and paid to PGIM Investments for investment management services.
A daily charge, paid to PICA for assuming mortality and expense risks, is calculated at an effective annual rate of 0.375% of the current value of the Participant’s (other than annuitants’ and PICA’s) account in VCA-2.
An annual administration charge of not more than $30 annually is deducted from the accumulation account of certain Participants either at the time of withdrawal of the value of the entire Participant’s account or on the last business day of each calendar year. Such amounts are reflected as a withdrawal on the Statements of Changes in Net Assets. This deduction may be made from a fixed-dollar annuity contract if the Participant is enrolled under such a contract.
No sales charge is deducted from Participants’ purchase payments and/or contributions. However, PICA has reserved the right in the future to impose or deduct a maximum sales charge of 2.50% from purchase payments and/or contributions.
PICA, PGIM Investments and Jennison are indirect, wholly-owned subsidiaries of Prudential Financial, Inc.
| Note 4: | | Other Transactions with Affiliates |
During the year ended December 31, 2022, the Account invested in the PGIM Core Ultra Short Bond Fund (the “Core Fund”), a portfolio of Prudential Investment Portfolios 2, registered under the 1940 Act, and managed by PGIM Investments. Through the Account’s investment in the mentioned underlying fund, PGIM Investments and/or its affiliates are paid fees or compensated for providing their services. Earnings from the Core Fund are disclosed on the Statement of Operations as “Affiliated Dividend Income”.
The Account may enter into certain securities purchase or sale transactions under Committee approved Rule 17a-7 procedures. Rule 17a-7 is an exemptive rule under the 1940 Act, that subject to certain conditions, permits purchase and sale transactions among affiliated investment companies, or between an investment company and a person that is affiliated solely by reason of having a common (or affiliated) investment adviser, common directors, and/or common officers. Such transactions are subject to ratification by the Committee. For the year ended December 31, 2022, no 17a-7 transactions were entered into by the Account.
| Note 5: | | Portfolio Securities |
For the year ended December 31, 2022, the aggregate cost of purchases and the proceeds from sales of securities, excluding short-term investments, were $67,206,461 and $93,225,471, respectively.
A summary of the cost of purchases and proceeds from sales of shares of an affiliated mutual fund for the year ended December 31, 2022, is presented as follows:
| | | | | | | | | | | | | | | | | | | | | | | | | | | | |
Value, Beginning
of Year | | Cost of
Purchases | | | Proceeds
from Sales | | | Change in
Unrealized
Gain(Loss) | | | Realized
Gain(Loss) | | | Value, End of Year | | | Shares, End of Year | | | Income | |
| Short-Term Investments — Affiliated Mutual Fund: | |
PGIM Core Ultra Short Bond Fund(1)(a) | |
| $2,101,943 | | $ | 47,332,873 | | | $ | (43,095,463 | ) | | $ | — | | | $ | — | | | $ | 6,339,353 | | | | 6,339,353 | | | $ | 101,146 | |
| | | | | | | | | | | | | | | | | | | | | | | | | | | | |
| | (1) | The Account did not have any capital gain distributions during the reporting period. |
| | (a) | PGIM Investments LLC, the manager of the Account, also serves as manager of the PGIM Core Ultra Short Bond Fund. |
B3
| Note 6: | | Net Increase (Decrease) In Net Assets Resulting From Surplus Transfers |
The increase (decrease) in net assets resulting from surplus transfers represents the net increase to/ (reductions from) PICA’s investment in the Account.
| Note 7: | | Participant Loans |
Participant loan initiations are not permitted in VCA-2. However, participants who initiated loans in other accounts are permitted to direct loan repayments into VCA-2.
For the years ended December 31, 2022 and December 31, 2021, $0 and $0 of participant loan principal and interest have been paid to VCA-2, respectively.
| Note 8: | | Risks of Investing in the Account |
The Account’s risks include, but are not limited to, some or all of the risks discussed below. For further information on the Account’s risk, please refer to the Account’s Prospectus and Statement of Additional Information.
Risks Associated with Variable Investment Options: You take all the investment risk for amounts allocated to VCA-2, which invest in a portfolio primarily consisting of equity securities of major, established corporations. If VCA-2’s assets increase in value, then your Unit Value goes up; if they decrease in value, your Unit Value goes down. How much your Unit Value goes up or down depends on the performance of VCA-2’s portfolio. We do not guarantee the investment results of VCA-2. An investment in the Contract is subject to the risk of poor investment performance, and the value of your investment can vary depending on the performance of VCA-2.
Insurance Company Risk: No company other than PICA has any legal responsibility to pay amounts that PICA owes under the Contract. You should look to the financial strength of PICA for its claims-paying ability. PICA is also subject to risks related to disasters and other events, such as storms, earthquakes, fires, outbreaks of infectious diseases (such as COVID-19), utility failures, terrorist acts, including cybersecurity attacks, political and social developments, and military and governmental actions. These risks are often collectively referred to as “business continuity” risks. These events could adversely affect PICA and our ability to conduct business and process transactions. Although PICA has business continuity plans, it is possible that the plans may not operate as intended or required and that PICA may not be able to provide required services, process transactions, deliver documents or calculate values. It is also possible that service levels may decline as a result of such events.
Annuitization: Once you annuitize your interest under the Contract, your decision is irreversible. The impacts of this decision are:
| | • | | Your Unit Value is no longer available to you to allocate among investment options (to the extent allowed under the Contract) or make further withdrawals. Instead, you will be paid a stream of annuity payments. |
| | • | | You generally cannot change the payment stream you chose once it has begun. |
| | • | | The Death Benefit terminates upon annuitization. |
Possible Adverse Tax Consequences: The tax considerations associated with the Contract vary and can be complicated. The tax considerations discussed in this prospectus are general in nature and describe only federal income tax law (not state, local, foreign or other federal tax laws). The effect of federal taxation depends largely upon the type of retirement plan, so we can provide only a generalized description. Before payments are made under the Contract for your benefit or taking other action related to your Contract, you should consult with a qualified tax adviser for complete information and advice.
Not a Short-Term Investment: The Contract is not a short-term investment vehicle and is not an appropriate investment for an investor who needs ready access to cash. The Contract is designed to provide benefits on a long-term basis. Consequently, you should not use the Contract as a short-term investment or savings vehicle. Because of the long-term nature of the Contract, you should consider whether investing Contributions in the Contract is consistent with the purpose for which the investment is being considered.
B4
Risk of Loss: All investments have risks to some degree and it is possible that you could lose money by investing in the Contract. An investment in the Contract is not a deposit with a bank and is not insured or guaranteed by the Federal Deposit Insurance Corporation or any other government agency.
At the March 2022 Meeting, the Committee approved the restructuring of VCA-2. Effective January 5, 2023, VCA-2 was converted from a management investment company overseen by the Committee to a unit investment trust invested solely in shares of an underlying fund — the Fidelity VIP index 500 Portfolio.
B5
REPORT OF INDEPENDENT REGISTERED PUBLIC ACCOUNTING FIRM
To the Board of Directors and Participants of The Prudential Variable Contract Account-2
Opinion on the Financial Statements
We have audited the accompanying statement of net assets of The Prudential Variable Contract Account-2 (the “Account”) as of December 31, 2022, the related statement of operations for the year ended December 31, 2022, the statement of changes in net assets for each of the two years in the period ended December 31, 2022, including the related notes, and the financial highlights for each of the three years in the period ended December 31, 2022 (collectively referred to as the “financial statements”). In our opinion, the financial statements present fairly, in all material respects, the financial position of the Account as of December 31, 2022, the results of its operations for the year then ended, the changes in its net assets for each of the two years in the period ended December 31, 2022 and the financial highlights for each of the three years in the period ended December 31, 2022 in conformity with accounting principles generally accepted in the United States of America.
The financial statements of the Account as of and for the year ended December 31, 2019 and the financial highlights for each of the periods ended on or prior to December 31, 2019 (not presented herein, other than the financial highlights) were audited by other auditors whose report dated February 19, 2020 expressed an unqualified opinion on those financial statements and financial highlights.
Basis for Opinion
These financial statements are the responsibility of the Account’s management. Our responsibility is to express an opinion on the Account’s financial statements based on our audits. We are a public accounting firm registered with the Public Company Accounting Oversight Board (United States) (PCAOB) and are required to be independent with respect to the Account in accordance with the U.S. federal securities laws and the applicable rules and regulations of the Securities and Exchange Commission and the PCAOB.
We conducted our audits of these financial statements in accordance with the standards of the PCAOB. Those standards require that we plan and perform the audit to obtain reasonable assurance about whether the financial statements are free of material misstatement, whether due to error or fraud.
Our audits included performing procedures to assess the risks of material misstatement of the financial statements, whether due to error or fraud, and performing procedures that respond to those risks. Such procedures included examining, on a test basis, evidence regarding the amounts and disclosures in the financial statements. Our audits also included evaluating the accounting principles used and significant estimates made by management, as well as evaluating the overall presentation of the financial statements. Our procedures included confirmation of securities owned as of December 31, 2022 by correspondence with the custodian and transfer agent. We believe that our audits provide a reasonable basis for our opinion.
/s/PricewaterhouseCoopers LLP
New York, New York
February 24, 2023
We have served as the auditor of one or more investment companies in the Prudential Variable Contract Accounts complex since 2020.
C1
THE VCA 2 COMMITTEE AND OFFICERS
MANAGEMENT OF VCA 2
VCA 2 has a Committee—similar to a board of directors—that provides general supervision and manages VCA 2. The members of the VCA 2 Committee are elected for indefinite terms by the persons having voting rights in respect of the VCA 2 Account. The affairs of VCA 2 are conducted in accordance with the Rules and Regulations of the Fund. A majority of the members of the VCA 2 Committee are not “interested persons” of Prudential Financial or its affiliates, as defined by the Investment Company Act.
The members of the VCA 2 Committee oversee the operations of the VCA 2 Account and appoint officers who are responsible for day-to-day business decisions based on policies set by the members of the VCA 2 Committee.
Information pertaining to the members of the VCA 2 Committee (hereafter referred to as “Committee Members” or “Board Members”) is set forth below. Board Members who are not deemed to be “interested persons” of VCA 2 as defined in the Investment Company Act are referred to as “Independent Board Members.” Board Members who are deemed to be “interested persons” of VCA 2 are referred to as “Interested Board Members.” “Fund Complex” consists of VCA 2 and any other investment companies managed by PGIM Investments. Information pertaining to the Officers of VCA 2 is also set forth below. VCA 2 is also referred to as the “Fund.”
| | | | | | |
| | | |
| Independent Board Members | | | | |
Name Year of Birth Position(s) Portfolios Overseen | | Principal Occupation(s) During Past Five Years | | Other Directorships
Held During Past Five Years | | Length of
Board Service |
| | | | |
Ellen S. Alberding 1958 Board Member Portfolios Overseen: 96 | | Chief Executive Officer (CEO) and President, The Joyce Foundation (charitable foundation) (since 2002); formerly Vice Chair, City Colleges of Chicago (community college system) (2011-2015); formerly Trustee, National Park Foundation (charitable foundation for national park system) (2009-2018); formerly Trustee, Economic Club of Chicago (2009-2016); Trustee, Loyola University (since 2018). | | None. | | Since September 2013 |
| | | | |
Kevin J. Bannon 1952 Board Member Portfolios Overseen: 97 | | Retired; formerly Managing Director (April 2008-May 2015) and Chief Investment Officer (October 2008-November 2013) of Highmount Capital LLC (registered investment adviser); formerly Executive Vice President and Chief Investment Officer (April 1993-August 2007) of Bank of New York Company; formerly President (May 2003-May 2007) of BNY Hamilton Family of Mutual Funds. | | Director of Urstadt Biddle Properties (equity real estate investment trust) (since September 2008). | | Since July 2008 |
| | | | |
Linda W. Bynoe 1952 Board Member Portfolios Overseen: 94 | | President and Chief Executive Officer (since March 1995) and formerly Chief Operating Officer (December 1989-February 1995) of Telemat Limited LLC (formerly Telemat Ltd) (management consulting); formerly Vice President (January 1985-June 1989) at Morgan Stanley & Co. (broker-dealer). | | Trustee of Equity Residential (residential real estate) (since December 2009); Director of Northern Trust Corporation (financial services) (since April 2006); formerly Director of Anixter International, Inc. (communication products distributor) (January 2006-June 2020). | | Since March 2005 |
| | | | |
Barry H. Evans 1960 Board Member Portfolios Overseen: 97 | | Retired; formerly President (2005-2016), Global Chief Operating Officer (2014-2016), Chief Investment Officer - Global Head of Fixed Income (1998-2014), and various portfolio manager roles (1986-2006), Manulife Asset Management (asset management). | | Formerly Director, Manulife Trust Company (2011-2018); formerly Director, Manulife Asset Management Limited (2015-2017); formerly Chairman of the Board of Directors of Manulife Asset Management U.S. (2005-2016); formerly Chairman of the Board, Declaration Investment Management and Research (2008-2016). | | Since September 2017 |
| | | | |
Keith F. Hartstein 1956 Board Member & Independent Chair Portfolios Overseen: 97 | | Retired; formerly Member (November 2014-September 2022) of the Governing Council of the Independent Directors Council (IDC) (organization of independent mutual fund directors); formerly Executive Committee of the IDC Board of Governors (October 2019-December 2021); formerly President and Chief Executive Officer (2005-2012), Senior Vice President (2004-2005), Senior Vice President of Sales and Marketing (1997-2004), and various executive management positions (1990-1997), John Hancock Funds, LLC (asset management); formerly Chairman, Investment Company Institute’s Sales Force Marketing Committee (2003-2008). | | None. | | Since September 2013 |
D1
| | | | | | |
| | | |
| Independent Board Members | | | | |
Name Year of Birth Position(s) Portfolios Overseen | | Principal Occupation(s) During Past Five Years | | Other Directorships
Held During Past Five Years | | Length of
Board Service |
| | | | |
Laurie Simon Hodrick 1962 Board Member Portfolios Overseen: 94 | | A. Barton Hepburn Professor Emerita of Economics in the Faculty of Business, Columbia Business School (since 2018); Visiting Fellow at the Hoover Institution, Stanford University (since 2015); Sole Member, ReidCourt LLC (since 2008) (a consulting firm); formerly Visiting Professor of Law, Stanford Law School (2015-2021); formerly A. Barton Hepburn Professor of Economics in the Faculty of Business, Columbia Business School (1996-2017); formerly Managing Director, Global Head of Alternative Investment Strategies, Deutsche Bank (2006-2008). | | Independent Director, Andela (since January 2022) (global talent network); Independent Director, Roku (since December 2020) (communication services); formerly Independent Director, Synnex Corporation (2019-2021) (information technology); formerly Independent Director, Kabbage, Inc. (2018-2020) (financial services); formerly Independent Director, Corporate Capital Trust (2017-2018) (a business development company). | | Since September 2017 |
| | | | |
Brian K. Reid 1961 Board Member Portfolios Overseen: 97 | | Retired; formerly Chief Economist for the Investment Company Institute (ICI) (2005-2017); formerly Senior Economist and Director of Industry and Financial Analysis at the ICI (1998-2004); formerly Senior Economist, Industry and Financial Analysis at the ICI (1996-1998); formerly Staff Economist at the Federal Reserve Board (1989-1996); formerly Director, ICI Mutual Insurance Company (2012-2017). | | None. | | Since March 2018 |
| | | | |
Grace C. Torres 1959 Board Member Portfolios Overseen: 97 | | Retired; formerly Treasurer and Principal Financial and Accounting Officer of the PGIM Funds, Target Funds, Advanced Series Trust, Prudential Variable Contract Accounts and The Prudential Series Fund (1998-June 2014); Assistant Treasurer (March 1999-June 2014) and Senior Vice President (September 1999-June 2014) of PGIM Investments LLC; Assistant Treasurer (May 2003-June 2014) and Vice President (June 2005-June 2014) of AST Investment Services, Inc.; Senior Vice President and Assistant Treasurer (May 2003-June 2014) of Prudential Annuities Advisory Services, Inc. | | Director (since January 2018) of OceanFirst Financial Corp. and OceanFirst Bank; formerly Director (July 2015-January 2018) of Sun Bancorp, Inc. N.A. and Sun National Bank. | | Since November 2014 |
| | | | | | |
| | | |
| Interested Board Members | | | | |
Name Year of Birth Position(s) Portfolios Overseen | | Principal Occupation(s) During Past Five Years | | Other Directorships Held During Past Five Years | | Length of
Board Service |
| | | | |
Stuart S. Parker 1962 Board Member & President Portfolios Overseen: 97 | | President, Chief Executive Officer, Chief Operating Officer and Officer in Charge of PGIM Investments LLC (formerly known as Prudential Investments LLC) (since January 2012); President and Principal Executive Officer (“PEO”) (since September 2022) of the PGIM Private Credit Fund; President and PEO (since March 2022) of the PGIM Private Real Estate Fund, Inc.; formerly Executive Vice President of Jennison Associates LLC and Head of Retail Distribution of PGIM Investments LLC (June 2005-December 2011); Investment Company Institute - Board of Governors (since May 2012). | | None. | | Since January 2012 |
| | | | |
Scott E. Benjamin 1973 Board Member & Vice President Portfolios Overseen: 97 | | Executive Vice President (since May 2009) of PGIM Investments LLC; Vice President (since June 2012) of Prudential Investment Management Services LLC; Executive Vice President (since September 2009) of AST Investment Services, Inc.; Senior Vice President of Product Development and Marketing, PGIM Investments (since February 2006); Vice President (since September 2022) of the PGIM Private Credit Fund; Vice President (since March 2022) of the PGIM Private Real Estate Fund, Inc.; formerly Vice President of Product Development and Product Management, PGIM Investments LLC (2003-2006). | | None. | | Since March 2010 |
D2
| | | | |
| | |
| Fund Officers(a) | | |
Name Year of Birth Fund Position | | Principal Occupation(s) During Past Five Years | | Length of
Service as Fund Officer |
| | | |
Claudia DiGiacomo 1974 Chief Legal Officer | | Chief Legal Officer (since September 2022) of the PGIM Private Credit Fund; Chief Legal Officer (since July 2022) of the PGIM Private Real Estate Fund, Inc.; Chief Legal Officer, Executive Vice President and Secretary of PGIM Investments LLC (since August 2020); Chief Legal Officer of Prudential Mutual Fund Services LLC (since August 2020); Chief Legal Officer of PIFM Holdco, LLC (since August 2020); Vice President and Corporate Counsel (since January 2005) of Prudential; and Corporate Counsel of AST Investment Services, Inc. (since August 2020); formerly Vice President and Assistant Secretary of PGIM Investments LLC (2005-2020); formerly Associate at Sidley Austin Brown & Wood LLP (1999-2004). | | Since December 2005 |
| | | |
Isabelle Sajous 1976 Chief Compliance Officer | | Chief Compliance Officer (since April 2022) of PGIM Investments LLC, the PGIM Funds, Target Funds, PGIM ETF Trust, PGIM Global High Yield Fund, Inc., PGIM High Yield Bond Fund, Inc., PGIM Short Duration High Yield Opportunities Fund, Advanced Series Trust, The Prudential Series Fund and Prudential’s Gibraltar Fund, Inc.; Chief Compliance Officer (since September 2022) of the PGIM Private Credit Fund; Chief Compliance Officer (since March 2022) of the PGIM Private Real Estate Fund, Inc.; Vice President, Compliance of PGIM Investments LLC (since December 2020); formerly Director, Compliance (July 2018-December 2020) of Credit Suisse Asset Management LLC; and Vice President, Associate General Counsel & Deputy Chief Compliance Officer of Cramer Rosenthal McGlynn, LLC (August 2014-July 2018). | | Since April 2022 |
| | | |
Andrew R. French 1962 Secretary | | Vice President (since December 2018) of PGIM Investments LLC; Secretary (since September 2022) of the PGIM Private Credit Fund; Secretary (since March 2022) of the PGIM Private Real Estate Fund, Inc.; formerly Vice President and Corporate Counsel (2010-2018) of Prudential; formerly Director and Corporate Counsel (2006-2010) of Prudential; Vice President and Assistant Secretary (since January 2007) of PGIM Investments LLC; Vice President and Assistant Secretary (since January 2007) of Prudential Mutual Fund Services LLC. | | Since October 2006 |
| | | |
Melissa Gonzalez 1980
Assistant Secretary | | Vice President and Corporate Counsel (since September 2018) of Prudential; Vice President and Assistant Secretary (since August 2020) of PGIM Investments LLC; Assistant Secretary (since September 2022) of the PGIM Private Credit Fund; Assistant Secretary (since March 2022) of the PGIM Private Real Estate Fund, Inc.; formerly Director and Corporate Counsel (March 2014-September 2018) of Prudential. | | Since March 2020 |
| | | |
Patrick E. McGuinness 1986
Assistant Secretary | | Vice President and Assistant Secretary (since August 2020) of PGIM Investments LLC; Director and Corporate Counsel (since February 2017) of Prudential; Assistant Secretary (since September 2022) of the PGIM Private Credit Fund; Assistant Secretary (since March 2022) of the PGIM Private Real Estate Fund, Inc. | | Since June 2020 |
| | | |
Debra Rubano 1975
Assistant Secretary | | Vice President and Corporate Counsel (since November 2020) of Prudential; Assistant Secretary (since September 2022) of the PGIM Private Credit Fund; Assistant Secretary (since March 2022) of the PGIM Private Real Estate Fund, Inc; formerly Director and Senior Counsel of Allianz Global Investors U.S. Holdings LLC (2010-2020) and Assistant Secretary of numerous funds in the Allianz fund complex (2015-2020). | | Since December 2020 |
| | | |
Kelly A. Coyne 1968
Assistant Secretary | | Director, Investment Operations of Prudential Mutual Fund Services LLC (since 2010); Assistant Secretary (since September 2022) of the PGIM Private Credit Fund; Assistant Secretary (since March 2022) of the PGIM Private Real Estate Fund, Inc. | | Since March 2015 |
| | | |
Christian J. Kelly 1975 Treasurer and Principal Financial and Accounting Officer | | Vice President, Head of Fund Administration of PGIM Investments LLC (since November 2018); Principal Financial Officer (since September 2022) of the PGIM Private Credit Fund; Principal Financial Officer (since March 2022) of the PGIM Private Real Estate Fund, Inc.; formerly, Treasurer and Principal Accounting Officer (March 2022- July 2022) of the PGIM Private Real Estate Fund, Inc.; formerly Director of Fund Administration of Lord Abbett & Co. LLC (2009-2018), Treasurer and Principal Accounting Officer of the Lord Abbett Family of Funds (2017-2018); Director of Accounting, Avenue Capital Group (2008-2009); Senior Manager, Investment Management Practice of Deloitte & Touche LLP (1998-2007). | | Since January 2019 |
| | | |
Lana Lomuti 1967 Assistant Treasurer | | Vice President (since 2007) within PGIM Investments Fund Administration; formerly Assistant Treasurer (December 2007-February 2014) of The Greater China Fund, Inc.; formerly Director (2005-2007) within PGIM Investments Fund Administration. | | Since April 2014 |
| | | |
Russ Shupak 1973 Assistant Treasurer | | Vice President (since 2017) within PGIM Investments Fund Administration; Treasurer and Principal Accounting Officer (since July 2022) of the PGIM Private Real Estate Fund, Inc.; Assistant Treasurer (since September 2022) of the PGIM Private Credit Fund; formerly Assistant Treasurer (March 2022 – July 2022) of the PGIM Private Real Estate Fund, Inc.; formerly Director (2013-2017) within PGIM Investments Fund Administration. | | Since October 2019 |
D3
| | | | |
| | |
| Fund Officers(a) | | |
Name Year of Birth Fund Position | | Principal Occupation(s) During Past Five Years | | Length of
Service as Fund Officer |
| | | |
Deborah Conway 1969 Assistant Treasurer | | Vice President (since 2017) within PGIM Investments Fund Administration; Assistant Treasurer (since September 2022) of the PGIM Private Credit Fund; Assistant Treasurer (since March 2022) of the PGIM Private Real Estate Fund, Inc.; formerly Director (2007-2017) within PGIM Investments Fund Administration. | | Since October 2019 |
| | | |
Elyse M. McLaughlin 1974 Assistant Treasurer | | Vice President (since 2017) within PGIM Investments Fund Administration; Treasurer and Principal Accounting Officer (since September 2022) of the PGIM Private Credit Fund; Assistant Treasurer (since March 2022) of the PGIM Private Real Estate Fund, Inc.; formerly Director (2011-2017) within PGIM Investments Fund Administration. | | Since October 2019 |
| | | |
Kelly Florio 1978 Anti-Money Laundering Compliance Officer | | Vice President, Corporate Compliance, Global Compliance Programs and Compliance Risk Management (since December 2021) of Prudential; formerly, Head of Fraud Risk Management (October 2019 to December 2021) at New York Life Insurance Company; formerly, Head of Key Risk Area Operations (November 2018 to October 2019), Director of the US Anti-Money Laundering Compliance Unit (2009-2018) and Bank Loss Prevention Associate (2006 -2009) at MetLife. | | Since June 2022 |
| (a) | Excludes Mr. Parker and Mr. Benjamin, interested Board Members who also serve as President and Vice President, respectively. |
Explanatory Notes to Tables:
| ∎ | Board Members are deemed to be “Interested,” as defined in the 1940 Act, by reason of their affiliation with PGIM Investments LLC and/or an affiliate of PGIM Investments LLC. |
| ∎ | Unless otherwise noted, the address of all Board Members and Officers is c/o PGIM Investments LLC, 655 Broad Street, Newark, New Jersey 07102-4410. |
| ∎ | There is no set term of office for Board Members or Officers. The Board Members have adopted a retirement policy, which calls for the retirement of Board Members on December 31 of the year in which they reach the age of 75. |
| ∎ | “Other Directorships Held” includes all directorships of companies required to register or file reports with the SEC under the 1934 Act (that is, “public companies”) or other investment companies registered under the 1940 Act. |
| ∎ | “Portfolios Overseen” includes all investment companies managed by PGIM Investments LLC. The investment companies for which PGIM Investments LLC serves as manager include the PGIM Mutual Funds, Target Funds, PGIM ETF Trust, PGIM Private Real Estate Fund, Inc., PGIM Private Credit Fund, PGIM High Yield Bond Fund, Inc., PGIM Global High Yield Fund, Inc., PGIM Short Duration High Yield Opportunities Fund, The Prudential Series Fund, Prudential’s Gibraltar Fund, Inc. and the Advanced Series Trust. |
| ∎ | As used in the Fund Officers table “Prudential” means The Prudential Insurance Company of America. |
D4
The toll-free number shown below can be used to make transfers and reallocations, review how your premiums are being allocated, and receive current investment option values in your contract. Unit values for each investment option are available to all participants from the toll-free number. Please be sure to have your contract number available when you call.
(800) 458-6333
The prospectus for VCA 2 contains information on the investment objectives, risks, charges, and expenses of VCA 2 and should be read carefully. This and other important information is contained in the prospectus that can be obtained from your financial professional. You should read the prospectus carefully before investing.
Annuity contracts contain exclusions, limitations, reductions of benefits, and terms for keeping them in force. Your plan sponsor or licensed financial professional can provide you with costs and complete details. Contract guarantees are based on the claims-paying ability of the issuing company.
Information regarding how the Account voted proxies relating to portfolio securities during the most recent
12-month period ended June 30 is available on the website of the Securities and Exchange Commission (Commission) at www.sec.gov.
The Account’s Statement of Additional Information contains additional information about the members of the Account’s Committee and is available without charge upon request by calling (800) 458-6333.
The Account will file with the Commission a complete listing of portfolio holdings as of its first and third quarter-end on Form N-PORT. Form N-PORT will be available on the Commission’s website at www.sec.gov or call (800) SEC-0330. Participants may obtain copies of Form N-PORT filings by calling (800) 458-6333.

The Prudential Insurance Company of America
751 Broad Street
Newark, NJ 07102-3714
©2023 Prudential Financial, Inc. and its related entities. PGIM Investments, the Prudential logo, and the Rock symbol are service marks of Prudential Financial, Inc. and its related entities, registered in many jurisdictions worldwide.
LT.RS.001
Item 2 – Code of Ethics — See Exhibit (a)
As of the end of the period covered by this report, the registrant has adopted a code of ethics (the “Section 406 Standards for Investment Companies – Ethical Standards for Principal Executive and Financial Officers”) that applies to the registrant’s Principal Executive Officer and Principal Financial Officer; the registrant’s Principal Financial Officer also serves as the Principal Accounting Officer.
The registrant hereby undertakes to provide any person, without charge, upon request, a copy of the code of ethics. To request a copy of the code of ethics, contact the registrant 800-225-1852, and ask for a copy of the Section 406 Standards for Investment Companies - Ethical Standards for Principal Executive and Financial Officers.
Item 3 – Audit Committee Financial Expert –
The registrant’s Board has determined that Ms. Grace C. Torres, member of the Board’s Audit Committee is an “audit committee financial expert,” and that she is “independent,” for purposes of this item.
Item 4 – Principal Accountant Fees and Services –
(a) Audit Fees
For the fiscal years ended December 31, 2022 and December 31, 2021, PricewaterhouseCoopers LLP (“PwC”), the Registrant’s principal accountant, billed the Registrant $24,000 and $24,000, respectively, for professional services rendered for the audit of the Registrant’s annual financial statements or services that are normally provided in connection with statutory and regulatory filings.
(b) Audit-Related Fees
For the fiscal years ended December 31, 2022 and December 31, 2021: none.
(c) Tax Fees
For the fiscal years ended December 31, 2022 and December 31, 2021: none.
(d) All Other Fees
For the fiscal years ended December 31, 2022 and December 31, 2021: none.
(e) (1) Audit Committee Pre-Approval Policies and Procedures
THE PGIM MUTUAL FUNDS
AUDIT COMMITTEE POLICY
on
Pre-Approval of Services Provided by the Independent
Accountants
The Audit Committee of each PGIM Mutual Fund is charged with the responsibility to monitor the independence of the Fund’s independent accountants. As part of this responsibility, the Audit Committee must pre-approve the independent accounting firm’s engagement to render audit and/or permissible non-audit services, as required by law. In evaluating a proposed engagement of the independent accountants, the Audit Committee will assess the effect that the engagement might reasonably be expected to have on the accountant’s independence. The Committee’s evaluation will be based on:
| | • | | a review of the nature of the professional services expected to be provided, |
| | • | | a review of the safeguards put into place by the accounting firm to safeguard independence, and |
| | • | | periodic meetings with the accounting firm. |
Policy for Audit and Non-Audit Services Provided to the Funds
On an annual basis, the scope of audits for each Fund, audit fees and expenses, and audit-related and non-audit services (and fees proposed in respect thereof) proposed to be performed by the Fund’s independent accountants will be presented by the Treasurer and the independent accountants to the Audit Committee for review and, as appropriate, approval prior to the initiation of such services.
Such presentation shall be accompanied by confirmation by both the Treasurer and the independent accountants that the proposed non-audit services will not adversely affect the independence of the independent accountants. Such proposed non-audit services shall be described in sufficient detail to enable the Audit Committee to assess the appropriateness of such services and fees, and the compatibility of the provision of such services with the auditor’s independence. The Committee shall receive periodic reports on the progress of the audit and other services which are approved by the Committee or by the Committee Chair pursuant to authority delegated in this Policy.
The categories of services enumerated under “Audit Services”, “Audit-related Services”, and “Tax Services” are intended to provide guidance to the Treasurer and the independent accountants as to those categories of services which the Committee believes are generally consistent with the independence of the independent accountants and which the Committee (or the Committee Chair) would expect upon the presentation of specific proposals to pre-approve. The enumerated categories are not intended as an exclusive list of audit, audit-related or tax services, which the Committee (or the Committee Chair) would consider for pre-approval.
Audit Services
The following categories of audit services are considered to be consistent with the role of the Fund’s independent accountants:
| | • | | Annual Fund financial statement audits |
| | • | | Seed audits (related to new product filings, as required) |
| | • | | SEC and regulatory filings and consents |
Audit-related Services
The following categories of audit-related services are considered to be consistent with the role of the Fund’s independent accountants:
| | • | | Accounting consultations |
| | • | | Fund merger support services |
| | • | | Agreed Upon Procedure Reports |
| | • | | Other Internal Control Reports |
Individual audit-related services that fall within one of these categories (except for fund merger support services) and are not
presented to the Audit Committee as part of the annual pre-approval process are subject to an authorized pre-approval by the Audit Committee so long as the estimated fee for those services does not exceed $30,000. Any services provided under such pre-approval will be reported to the Audit Committee at its next regular meeting. Should the amount of such services exceed $30,000 any additional fees will be subject to pre-approval by the Committee Chair (or any other Committee member on whom this responsibility has been delegated). Fees related to fund merger support services are subject to a separate authorized pre-approval by the Audit Committee with fees determined on a per occurrence and merger complexity basis.
Tax Services
The following categories of tax services are considered to be consistent with the role of the Fund’s independent accountants:
| | • | | Tax compliance services related to the filing or amendment of the following: |
| | • | | Federal, state and local income tax compliance; and, |
| | • | | Sales and use tax compliance |
| | • | | Timely RIC qualification reviews |
| | • | | Tax distribution analysis and planning |
| | • | | Tax authority examination services |
| | • | | Tax appeals support services |
| | • | | Accounting methods studies |
| | • | | Fund merger support services |
| | • | | Tax consulting services and related projects |
Individual tax services that fall within one of these categories and are not presented to the Audit Committee as part of the annual pre-approval process are subject to an authorized pre-approval by the Audit Committee so long as the estimated fee for those services does not exceed $30,000. Any services provided under such pre-approval will be reported to the Audit Committee at its next regular meeting. Should the amount of such services exceed $30,000 any additional fees will be subject to pre-approval by the Committee Chair (or any other Committee member on whom this responsibility has been delegated).
Other Non-Audit Services
Certain non-audit services that the independent accountants are legally permitted to render will be subject to pre-approval by the Committee or by one or more Committee members to whom the Committee has delegated this authority and who will report to the full Committee any pre-approval decisions made pursuant to this Policy. Non-audit services presented for pre-approval pursuant to this paragraph will be accompanied by a confirmation from both the Treasurer and the independent accountants that the proposed services will not adversely affect the independence of the independent accountants.
Proscribed Services
The Fund’s independent accountants will not render services in the following categories of non-audit services:
| | • | | Bookkeeping or other services related to the accounting records or financial statements of the Fund |
| | • | | Financial information systems design and implementation |
| | • | | Appraisal or valuation services, fairness opinions, or contribution-in-kind reports |
| | • | | Internal audit outsourcing services |
| | • | | Management functions or human resources |
| | • | | Broker or dealer, investment adviser, or investment banking services |
| | • | | Legal services and expert services unrelated to the audit |
| | • | | Any other service that the Public Company Accounting Oversight Board determines, by regulation, is impermissible. |
Pre-approval of Non-Audit Services Provided to Other Entities Within the PGIM Fund Complex
Certain non-audit services provided to PGIM Investments LLC or any of its affiliates that also provide ongoing services to the PGIM Mutual Funds will be subject to pre-approval by the Audit Committee. The only non-audit services provided to these entities that will require pre-approval are those related directly to the operations and financial reporting of the Funds. Individual projects that are not presented to the Audit Committee as part of the annual pre-approval process will be subject to pre-approval by the Committee Chair (or any other Committee member on whom this responsibility has been delegated) so long as the estimated fee for those services does not exceed $30,000. Services presented for pre-approval pursuant to this paragraph will be accompanied by a confirmation from both the Treasurer and the independent accountants that the proposed services will not adversely affect the independence of the independent accountants.
Although the Audit Committee will not pre-approve all services provided to PGIM Investments LLC and its affiliates, the Committee will receive an annual report from the Fund’s independent accounting firm showing the aggregate fees for all services provided to PGIM Investments and its affiliates.
(e) (2) Percentage of services described in each of paragraphs (b) through (d) of this Item that were approved by the audit committee pursuant to paragraph (c)(7)(i)(C) of Rule 2-01 of Regulation S-X –
| | | | |
| | Fiscal Year Ended December 31, 2022 | | Fiscal Year Ended December 31, 2021 |
| 4(b) | | Not applicable. | | Not applicable. |
| 4(c) | | Not applicable. | | Not applicable. |
| 4(d) | | Not applicable. | | Not applicable. |
(f) Percentage of hours expended attributable to work performed by other than full time employees of principal accountant if greater than 50%.
The percentage of hours expended on the principal accountant’s engagement to audit the registrant’s financial statements for the most recent fiscal year that were attributed to work performed by persons other than the principal accountant’s full-time, permanent employees was 0%.
(g) Non-Audit Fees
The aggregate non-audit fees billed by the Registrant’s principal accountant for services rendered to the registrant’s investment adviser and any entity controlling, controlled by, or under common control with the investment adviser that provides ongoing services to the registrant for the fiscal years ended December 31, 2022 and December 31, 2021 was $0 and $0, respectively.
(h) Principal Accountant’s Independence
Not applicable as the Registrant’s principal accountant has not provided non-audit services to the registrant’s investment adviser and any entity controlling, controlled by, or under common control with the investment adviser that provides ongoing services to the registrant that were not pre-approved pursuant to Rule 2-01(c)(7)(ii) of Regulation S-X.
(i) Not applicable.
(j) Not applicable.
| Item 5 – | Audit Committee of Listed Registrants – Not applicable. |
| Item 6 – | Schedule of Investments – The schedule is included as part of the report to shareholders filed under Item 1 of this Form. |
| Item 7 – | Disclosure of Proxy Voting Policies and Procedures for Closed-End Management Investment Companies – Not |
applicable.
| Item 8 – | Portfolio Managers of Closed-End Management Investment Companies – Not applicable. |
| Item 9 – | Purchases of Equity Securities by Closed-End Management Investment Company and Affiliated Purchasers – Not applicable. |
| Item 10 – | Submission of Matters to a Vote of Security Holders – There have been no material changes to these procedures. |
| Item 11 – | Controls and Procedures |
| | (a) | It is the conclusion of the registrant’s principal executive officer and principal financial officer that the effectiveness of the registrant’s current disclosure controls and procedures (such disclosure controls and procedures having been evaluated within 90 days of the date of this filing) provide reasonable assurance that the information required to be disclosed by the registrant has been recorded, processed, summarized and reported within the time period specified in the Commission’s rules and forms and that the information required to be disclosed by the registrant has been accumulated and communicated to the registrant’s principal executive officer and principal financial officer in order to allow timely decisions regarding required disclosure. |
| | (b) | There has been no significant change in the registrant’s internal control over financial reporting (as defined in Rule 30a-3(d) under the Act (17 CFR 270.30a-3(d)) that occurred during the period covered by this report that has materially affected, or is reasonably likely to materially affect, the registrant’s internal control over financial reporting. |
Item 12 – Controls and Procedures - Disclosure of Securities Lending Activities for Closed-End Management Investment Companies – Not applicable.
(a)(1) Code of Ethics – Attached hereto as Exhibit EX-99.CODE-ETH.
(a)(2) Certifications pursuant to Section 302 of the Sarbanes-Oxley Act – Attached hereto as Exhibit EX-99.CERT.
(a)(2)(1) Any written solicitation to purchase securities under Rule 23c-1 – Not applicable.
(a)(2)(2) Change in the registrant’s independent public accountant – Not applicable.
(b) Certifications pursuant to Section 906 of the Sarbanes-Oxley Act – Attached hereto as Exhibit EX-99.906CERT.
SIGNATURES
Pursuant to the requirements of the Securities Exchange Act of 1934 and the Investment Company Act of 1940, the registrant has duly caused this report to be signed on its behalf by the undersigned, thereunto duly authorized.
Registrant: The Prudential Variable Contract Account-2
| | |
| By: | | /s/ Andrew R. French |
| | Andrew R. French |
| | Secretary |
| |
| Date: | | February 24, 2023 |
Pursuant to the requirements of the Securities Exchange Act of 1934 and the Investment Company Act of 1940, this report has been signed below by the following persons on behalf of the registrant and in the capacities and on the dates indicated.
| | |
| By: | | /s/ Stuart S. Parker |
| | Stuart S. Parker |
| | President and Principal Executive Officer |
| |
| Date: | | February 24, 2023 |
| |
| By: | | /s/ Christian J. Kelly |
| | Christian J. Kelly |
| | Treasurer and Principal Financial and Accounting Officer |
| |
| Date: | | February 24, 2023 |