UNITED STATES
SECURITIES AND EXCHANGE COMMISSION
Washington, D.C. 20549
FORM N-CSR
CERTIFIED SHAREHOLDER REPORT OF REGISTERED MANAGEMENT INVESTMENT
COMPANIES
| | |
| Investment Company Act file number: | | 811-01612 |
| |
| Exact name of registrant as specified in charter: | | The Prudential Variable Contract Account – 2 |
| |
| Address of principal executive offices: | | 655 Broad Street, 17th Floor Newark, New Jersey 07102 |
| |
| Name and address of agent for service: | | Andrew R. French 655 Broad Street, 17th Floor Newark, New Jersey 07102 |
| |
| Registrant’s telephone number, including area code: | | 800-225-1852 |
| |
| Date of fiscal year end: | | 12/31/2020 |
| |
| Date of reporting period: | | 12/31/2020 |
Item 1 – Reports to Stockholders
The Prudential Variable Contract Account-2
| | |
| ANNUAL REPORT | | December 31, 2020 |

This report is for the information of persons participating in The Prudential Variable Contract Account-2 (VCA-2, or the “Account”). VCA-2 is a group annuity insurance product issued by The Prudential Insurance Company of America, 751 Broad Street, Newark, NJ 07102-3777, and is distributed by Prudential Investment Management Services LLC (PIMS), member SIPC, 655 Broad Street, 19th Floor, Newark, NJ 07102. Both are Prudential Financial companies and each is solely responsible for its financial condition and contractual obligations.
The views expressed in this report and information about the Account’s portfolio holdings are for the period covered by this report and are subject to change thereafter.
Please note that this report may include prospectus supplements that are separate from and not a part of this report.

| | | | |
The Prudential Variable Contract Account-2 Table of Contents | | Annual Report | | December 31, 2020 |
| | ∎ | | REPORT OF THE INVESTMENT MANAGERS AND PRESENTATION OF PORTFOLIO HOLDINGS |
| | | | |
| Section A | | Statement of Net Assets and Other Financial Statements | | |
| Section B | | Financial Highlights | | |
| Section C | | Notes to Financial Statements | | |
| Section D | | Report of Independent Registered Public Accounting Firm | | |
| Section E | | Information about Trustees and Officers | | |
| | |
The Prudential Variable Contract Account-2 Letter to Participants | | December 31, 2020 |
At Prudential, our primary objective is to help investors achieve and maintain long-term financial success. Despite today’s uncertainties, we remain strong and ready to serve and support you. This Prudential Variable Contract Account-2 annual report outlines our efforts to achieve this goal. We hope you find it informative and useful.
Prudential has been building on a heritage of success for more than 145 years. You can count on our history of financial stability. We are diversified for endurance. Our balanced mix of risks and businesses positions us well to manage through any economic environment. We’ve applied the lessons from decades of challenges to be stronger, because we are committed to keeping our promises to you.
Your financial professional is the best resource to help you make the most informed investment decisions. Together, you can build a diversified investment portfolio that aligns with your long-term financial goals. Please keep in mind that diversification and asset allocation strategies do not assure a profit or protect against loss in declining markets.
Thank you for selecting Prudential as one of your financial partners. A strong sense of social responsibility for our clients, our employees, and our communities has been embedded in the company since our founding. It guides our efforts to help our customers achieve peace of mind through financial wellness.
We value your trust and appreciate the opportunity to help you achieve financial security.
Sincerely,

Stuart Parker
President,
The Prudential Variable Contract Account-2 | January 31, 2021 |
| | | | |
| Market Overview — unaudited | | Annual Report | | December 31, 2020 |
Equity Market Overview
A global pandemic caused by a novel coronavirus—followed by massive monetary and fiscal stimulus packages implemented by central banks and governments worldwide—whipsawed equity markets in 2020. When the chaos subsided, stocks in general closed the year higher, with several US indexes setting record highs as investors responded favorably to the stimulus and to new vaccines that they hoped would speed up the recovery.
Performance varied notably by investing style, market capitalization, geography, and sector. While some industries such as travel struggled during the pandemic, others such as online technology benefited from consumers working from home.
In the US, the broad-based Russell 3000 Index and the large-cap S&P 500 Index rose 20.89% and 18.40%, respectively, for the year. Meanwhile, the Dow Jones Industrial Average (Dow) surpassed 30,000 points with a return of 9.92%, and the tech-heavy Nasdaq Composite Index returned 43.64%. Internationally, the MSCI ACWI Ex-US Index, a broad measure of stock performance in developed and emerging markets outside the US, returned 10.65%. (All returns cited are in US dollars unless stated otherwise and assume reinvestment of dividends.)
Economies crashed, nations responded
When the year began, the outlook for the global economy and equity markets was generally upbeat. Sentiment swiftly shifted south in February and into March as concerns about the spread of COVID-19, the disease caused by the coronavirus, alarmed the markets. Many governments throughout the world rolled out restrictions such as stay-at-home orders, travel bans, and temporary business closures to help reduce transmission of COVID-19. These moves took a toll on the global economy, thrusting many countries into recession and sending stock markets sharply lower.
Lawmakers and central banks worldwide quickly implemented extraordinary stimulus to shore up liquidity. In the US, the Federal Reserve (the Fed) cut its federal funds rate target to a range of 0.00%-0.25%. Congress and the Fed rolled out trillions of dollars in combined stimulus. Real gross domestic product (GDP) in the US dropped at an annualized rate of 31.4% over the second quarter, and the national unemployment rate spiked to 14.7% in April. However, the economy responded favorably to the stimulus and reversed course, with GDP vaulting 33.4% over the third quarter.
Stocks retreated, rebounded, and rallied to record highs
Stock markets plunged in the first quarter as investors worried the recession would hamper growth and corporate profits, with the Dow posting its worst first-quarter performance in history. Stocks rebounded in the second quarter as national and state governments reopened their economies, and the Dow recorded its best performance for any quarter since 1987. Over the third quarter and through the end of the year, equity markets fluctuated yet continued their ascent, due in part to regulatory approval of two COVID-19 vaccines and better-than-expected economic data.
In December, the Fed committed to continue buying bonds until the US economy achieves full employment, provided that inflation stays at 2%, and the central bank also maintained its near-zero federal funds rate target. That same month, Congress approved $900 billion of additional fiscal stimulus, and the national unemployment rate dropped to 6.7%. A large number of countries outside the US also remained supportive of the markets. Many stock indexes closed the year at or near all-time highs.
S&P 500: leaders and laggards
Over the period, the top-performing sectors in the S&P 500 were information technology (+43.89%) and consumer discretionary (+33.30%). Many companies in the technology arena benefited from stronger demand for online shopping and delivery services as a result of the pandemic. Other sectors that posted gains were communication services (+23.61%), materials (+20.73%), health care (+13.45%), industrials (+11.06%), consumer staples (+10.75%), and utilities (+0.48%). Sectors that posted negative returns included financials (-1.69%), real estate (-2.17%), and energy (-33.68%). Energy stocks were dragged down by plunging oil prices during the first half of the year. Prices fell due to the onset of a price war between Russia and Saudi Arabia and lower oil demand after travel declined during the pandemic. Prices eventually stabilized but ended lower for the year.
| | | | |
| Market Overview — unaudited (continued) | | Annual Report | | December 31, 2020 |
Growth outshined value, large caps edged out small caps
Over the year, the Russell 3000 Growth Index returned 38.26%, far surpassing the Russell 3000 Value Index, which rose 2.87%. The large-cap Russell 1000 Index gained 20.96%, the Russell Midcap Index returned 17.10%, and the small-cap Russell 2000 Index returned 19.96%. Although large caps outperformed smaller caps, the small-cap index topped its large-cap counterpart over the third and fourth quarters, with the indexes returning 37.85% and 24.46%, respectively, during that time.
Emerging market equities posted robust overall gains
Emerging market equities, as measured by the MSCI Emerging Markets Investable Market Index, dropped sharply in the first quarter but rebounded to return 18.40% for the year. The recovery was driven by a pickup in China’s economy fueled by aggressive stimulus and a surge in exports. Top-performing markets included Korea, Taiwan, China, and India, all of which posted double-digit returns. Latin American markets, Russia, and South Africa finished lower.
International developed market stocks rose, but regional results were mixed
For the year, stocks in developed markets outside the US and Canada, as measured by the MSCI EAFE Index, lagged those in emerging markets but advanced 7.82%. The MSCI Japan Index returned 14.48%, aided by substantial fiscal and monetary stimulus. The Japanese yen, often perceived as a “safe haven” currency, gained 5.3% against the US dollar. European equities, as measured by the MSCI Europe Index, ended in negative territory in local-currency terms yet returned 5.38% in US dollars. Concerns about the economy eased as the year ended after the European Union and the United Kingdom (UK) agreed to a post-Brexit trade deal. (Brexit refers to the UK’s exit from the European Union.) The MSCI UK Index returned -10.47%.
Fixed Income Market Overview
Government bond markets worldwide collectively rose in 2020 as central banks aggressively cut interest rates, amplified bond-buying programs, and enacted other stimulus measures to support their economies in response to a disruptive global pandemic caused by a novel coronavirus.
Higher-rated credits performed particularly well early in the year but gave back some gains later as investors gravitated toward riskier assets such as higher-yielding bonds, which plunged early in the year but rallied in the fourth quarter.
The global investment-grade bond market, as measured by the Bloomberg Barclays Global Aggregate Bond Index (unhedged), rose 9.20% for the year. Emerging market debt, based on the J.P. Morgan EMBI Global Diversified Index, returned 5.26%. In the US, the investment-grade Bloomberg Barclays US Aggregate Bond Index rose 7.51%, and high yield bonds (i.e., debt rated below investment grade), as measured by the ICE BofAML US Cash High Yield Index, returned 6.20%. (All returns cited are in US dollars unless stated otherwise.)
Massive stimulus supported global markets and economies
During the first few months of the year, many governments worldwide began to impose travel restrictions, stay-at-home orders, and social distancing guidelines to reduce the spread of COVID-19, the disease caused by the coronavirus. Many of these remedies crippled the travel, restaurant, energy, leisure, and various services industries.
To help buoy markets and local economies, policymakers and central banks responded with unprecedented levels of stimulus, beginning in the first quarter. In the US, the Federal Reserve (the Fed) slashed its federal funds rate target to virtually zero. Lawmakers and the Fed then rolled out trillions of dollars in combined stimulus. The central bank also implemented emergency lending facilities, expanded its asset-purchase program to include individual corporate bonds, and unveiled other bold initiatives. Although real gross domestic product (GDP) fell at an annualized rate of 31.4% in the second quarter and national unemployment spiked to 14.7% in April, the economy rebounded in the second half of the year. GDP rose 33.4% in the third quarter, and unemployment closed December at 6.7%—far below April’s peak but still above pre-pandemic levels. The dollar, as measured by the US Dollar Index, dropped 6.7%. Inflation remained subdued.
| | | | |
| Market Overview — unaudited (continued) | | Annual Report | | December 31, 2020 |
Elsewhere, China’s economy weathered the COVID-19 crisis better than many other regional markets, largely due to severe lockdowns, stimulus packages, and a sharp rise in exports. The country’s exports soared almost 20% during the pandemic, surpassing exports of countries outside the region, including the US and eurozone. Latin America’s economy was a laggard, and many developed nations fell into recession as a result of the pandemic.
In December, the Fed maintained its near-zero federal funds rate target, and the central bank committed to continue buying bonds until the US economy achieves full employment, provided that inflation stays at 2%. Congress also approved $900 billion of additional fiscal stimulus. Outside the US, many nations maintained a stimulus mindset as they continued to deal with pandemic-related challenges.
A banner year for investment-grade bonds
During the first quarter, US investment-grade bond yields, which move opposite to bond prices, dropped in reaction to substantial monetary easing and a “flight to quality” from stocks and other riskier securities. At the time, investors favored higher-quality credits, particularly US Treasuries with longer maturities.
As investors’ risk appetite increased during the second half of year, yields on higher-rated debt such as Treasuries rose on worries that the implemented stimulus packages could lead to higher inflation. Higher-yielding assets fell into favor. The yield on the 10-year US Treasury dropped from approximately 1.88% at the beginning of 2020 to 0.70% at the end of the first quarter, and fell further to 0.58% during late April on strong demand. However, the yield subsequently rose to close 2020 at 0.93%, albeit notably lower than where it started the year.
Over the year, longer-dated US Treasury bonds returned 17.70%, while US Treasuries in general returned 8.00%. Treasury inflation-protected securities rose 10.99%. (Returns of US investment-grade bonds noted are based on Bloomberg Barclays bond indexes unless stated otherwise.)
Investment-grade corporate bonds delivered a stellar return of 9.89%. Central banks’ extraordinary moves to support markets, investors’ reaction to stimulus, expectations that US interest rates will remain low for some time, regulatory approval of two COVID-19 vaccines, and better-than-expected corporate earnings results fueled demand for corporates in the latter part of the year. Other notable performers included commercial mortgage-backed securities, which returned 8.11%, and municipal bonds, which rose 5.21%.
High yield bonds rebounded after a rocky start
As mentioned earlier, US high yield bonds returned 6.20% in 2020, thanks to a rebound late in the year. Earlier in 2020, high yield bond prices tumbled when concerns about the pandemic’s potential economic consequences were intensifying and crude oil prices were plunging. Prices fell due to the onset of a price war between Russia and Saudi Arabia and lower oil demand after travel declined during the pandemic. The lower prices hurt oil exporters, which constitute a significant chunk of the high yield issuer market.
Oil prices eventually stabilized but ended lower over the year. The price of a barrel of West Texas Intermediate crude oil traded above $61 when 2020 began and closed the year slightly above $48. The high yield market staged a comeback later in the year as investors applauded approval of the two COVID-19-vaccines. High yield bonds returned 6.50% over the fourth quarter.
Emerging market debt also rallied in the final quarter
Emerging market debt ended 2020 in positive territory, rising 5.26% for the year as mentioned earlier, including 5.80% in the fourth quarter. Like many high yield bond issuers, emerging market debt issuers include many exporters of crude oil.
| | |
The Prudential Variable Contract Account-2 | | December 31, 2020 |
Report of the Investment Manager - As of December 31, 2020 (Unaudited)
| | | | | | | | | | | | |
| Average Annual Total Returns | | 1 Year | | | 5 Years | | | 10 Years | |
Accumulation Account (without sales charges) | | | 18.30 | % | | | 12.83 | % | | | 10.74 | % |
S&P 500 Index | | | 18.40 | | | | 15.21 | | | | 13.87 | |
Past performance does not guarantee future returns. The Account performance without sales charges is shown after the deduction of all expenses, including investment management and mortality and expense charges, but does not include the effect of any sales charge or annual account charge. The performance would be lower if they included the effects of sales charges and an annual account charge.
$10,000 INVESTED OVER 10 YEARS
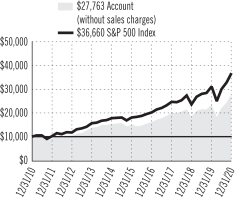
For the year ended December 31, 2020, the Prudential Variable Contract Account-2 returned 18.30%. The Account underperformed the S&P 500 Index.
What were the market conditions during the reporting period?
US equities experienced periods of elevated volatility in calendar-year 2020 (the reporting period), but generally posted strong returns. After reaching an all-time high in mid-February 2020, equity markets abruptly reversed course, falling sharply later that month as the rapidly spreading COVID-19 virus and efforts to contain its spread took a toll on the global economy. Stocks rebounded from late March through the end of the period after aggressive monetary policy was implemented by the Federal Reserve, meaningful and significant fiscal stimulus was passed by the US Congress, the November presidential election was resolved, and two COVID-19 vaccines received regulatory approval in December. These factors eclipsed a resurgence of COVID-19 infections that threatened the economy late in the period.
The S&P 500 Index (the Index) gained 18.40% during the period. By sector, performance was mixed as seven sectors in the Index posted positive returns while four declined. Index gains were led by the information technology, consumer discretionary, and communication services sectors, all of which rose more than 20% over the period. In contrast, the energy, real estate, and financials sectors were the worst-performing sectors. Individual stocks that were the Index’s top contributors to performance during the period included Apple, Inc., Amazon.com, Inc., and Microsoft Corp. Conversely, Exxon Mobil Corp., Wells Fargo & Co., and AT&T, Inc. were among its top detractors.
What strategies or holdings affected the Portfolio’s performance?
The Portfolio’s positions among automobile manufacturers were the dominant driver of absolute gains during the reporting period, while holdings in the semiconductors and data processing & outsourced services industries contributed to a lesser degree. Meanwhile, positions in the diversified banks, aerospace defense, and trucking sectors hampered the Portfolio’s absolute gains.
Relative to the Index, the Portfolio’s security selection in data processing & outsourced services added the most value. Stock selection and an overweight position in automobile manufacturers, along with security selection among software names, also were beneficial. Conversely, stock selection in diversified banks was the largest detractor from relative performance. An underweight position in technology hardware storage & peripherals and security selection in health care equipment also detracted from relative performance.
The most notable individual stocks contributors to the Portfolio’s overall performance included electric car manufacturer Tesla, Inc., multinational technology company Apple, and technology company NVIDIA Corp. Tesla posted impressive financial results throughout the period, made possible by solid production, increased capacity, and strong execution. With its huge installed base, Apple continued to benefit from rapid growth in service business subscriptions, a key source of recurring revenue. Nvidia announced a new generation of products called data processing units, which offload critical networking, storage, and security tasks from central processing units (CPUs). This rollout signaled the company’s pursuit of the highly profitable data center CPU business.
Top detractors for the period included ride-sharing company Uber Technologies, Inc., diversified bank JPMorgan Chase & Co., and Canadian integrated energy company Suncor Energy, Inc. Uber was hit hard by the pandemic and stay-at-home mandates, which led to sharply falling revenues. JPMorgan Chase was dragged down along with the overall financials sector. Financials was one of the worst-performing sectors during the period, as the contraction in the global economy triggered meaningfully diminished loan growth and payment transaction volumes. In addition, this
For a complete list of holdings, refer to the Statement of Net Assets section of this report. Holdings reflect only long-term investments.
1
| | |
The Prudential Variable Contract Account-2 | | December 31, 2020 |
Report of the Investment Manager - As of December 31, 2020 (Unaudited) (Continued)
sector experienced interest rate and credit-risk headwinds. Suncor Energy’s stock declined as investors reacted negatively to its weakening fundamentals, as the company’s balance sheet added a significant amount of debt.
Presentation of Portfolio Holdings — unaudited
| | | | | | |
| VCA-2 (As of 12/31/2020) | |
| Ten Largest Holdings | | Line of Business | | | % of Net Assets | |
| Apple, Inc. | | Technology Hardware, Storage & Peripherals | | | 3.7% | |
| Alphabet, Inc. (Class A Stock) | | Interactive Media & Services | | | 2.9% | |
| Amazon.com, Inc. | | Internet & Direct Marketing Retail | | | 2.5% | |
| JPMorgan Chase & Co. | | Banks | | | 2.2% | |
| Tesla, Inc. | | Automobiles | | | 2.2% | |
| Walt Disney Co. (The) | | Entertainment | | | 1.8% | |
| Facebook, Inc. (Class A Stock) | | Interactive Media & Services | | | 1.8% | |
| PayPal Holdings, Inc. | | IT Services | | | 1.8% | |
| Shopify, Inc. (Class A Stock) | | IT Services | | | 1.7% | |
| Adyen NV, 144A | | IT Services | | | 1.7% | |
For a complete list of holdings, please refer to the Statement of Net Assets section of this report. Holdings reflect only long-term investments.
2
| | |
The Prudential Variable Contract Account-2 Benchmark Glossary — unaudited | | December 31, 2020 |
The indexes are unmanaged and include reinvestment of any income or distributions. They do not reflect any fees, expenses or sales charges. Investors cannot invest directly in a market index.
S&P 500 Index is an unmanaged, market value-weighted index of over 500 stocks generally representative of the broad stock market.
The S&P 500 index is a product of S&P Dow Jones Indices LLC and/or its affiliates and has been licensed for use by PGIM, Inc. and/or its affiliates. Copyright © 2020 S&P Dow Jones Indices LLC, a division of S&P Global, Inc., and/or its affiliates. All rights reserved. Redistribution or reproduction in whole or in part are prohibited without written permission of S&P Dow Jones Indices LLC. For more information on any of S&P Dow Jones Indices LLC’s indices please visit www.spdji.com. S&P® is a registered trademark of S&P Global and Dow Jones® is a registered trademark of Dow Jones Trademark Holdings LLC.
FINANCIAL STATEMENTS OF VCA-2
December 31, 2020
| | | | | | | | |
| LONG-TERM INVESTMENTS — 97.9% | | | | |
| COMMON STOCKS | | Shares | | | Value | |
Aerospace & Defense — 2.1% | | | | | | | | |
Airbus SE (France) | | | 11,494 | | | $ | 1,263,362 | |
Northrop Grumman Corp. | | | 3,694 | | | | 1,125,636 | |
Raytheon Technologies Corp. | | | 37,364 | | | | 2,671,899 | |
| | | | | | | | |
| | | | | | | 5,060,897 | |
| | | | | | | | |
Air Freight & Logistics — 0.6% | | | | | | | | |
FedEx Corp. | | | 5,687 | | | | 1,476,459 | |
| | | | | | | | |
Automobiles — 3.6% | | | | | | | | |
General Motors Co. | | | 81,046 | | | | 3,374,755 | |
Tesla, Inc.* | | | 7,561 | | | | 5,335,571 | |
| | | | | | | | |
| | | | | | | 8,710,326 | |
| | | | | | | | |
Banks — 7.0% | | | | | | | | |
Bank of America Corp. | | | 123,213 | | | | 3,734,586 | |
Citigroup, Inc. | | | 45,404 | | | | 2,799,610 | |
JPMorgan Chase & Co. | | | 42,410 | | | | 5,389,039 | |
PNC Financial Services Group, Inc. (The) | | | 18,579 | | | | 2,768,271 | |
Truist Financial Corp. | | | 50,318 | | | | 2,411,742 | |
| | | | | | | | |
| | | | | | | 17,103,248 | |
| | | | | | | | |
Beverages — 1.1% | | | | | | | | |
PepsiCo, Inc. | | | 17,787 | | | | 2,637,812 | |
| | | | | | | | |
Biotechnology — 0.9% | | | | | | | | |
AbbVie, Inc. | | | 20,416 | | | | 2,187,574 | |
| | | | | | | | |
Building Products — 1.4% | | | | | | | | |
Johnson Controls International PLC | | | 74,768 | | | | 3,483,441 | |
| | | | | | | | |
Capital Markets — 2.0% | | | | | | | | |
Blackstone Group, Inc. (The) | | | 21,540 | | | | 1,396,007 | |
Goldman Sachs Group, Inc. (The) | | | 13,569 | | | | 3,578,281 | |
| | | | | | | | |
| | | | | | | 4,974,288 | |
| | | | | | | | |
Chemicals — 3.8% | | | | | | | | |
Dow, Inc. | | | 50,089 | | | | 2,779,939 | |
FMC Corp. | | | 23,230 | | | | 2,669,824 | |
Linde PLC (United Kingdom) | | | 14,586 | | | | 3,843,557 | |
| | | | | | | | |
| | | | | | | 9,293,320 | |
| | | | | | | | |
Communications Equipment — 0.4% | | | | | | | | |
Cisco Systems, Inc. | | | 24,482 | | | | 1,095,569 | |
| | | | | | | | |
Consumer Finance — 1.9% | | | | | | | | |
Capital One Financial Corp. | | | 25,352 | | | | 2,506,045 | |
SLM Corp. | | | 172,389 | | | | 2,135,900 | |
| | | | | | | | |
| | | | | | | 4,641,945 | |
| | | | | | | | |
Containers & Packaging — 1.0% | | | | | | | | |
Crown Holdings, Inc.* | | | 24,237 | | | | 2,428,547 | |
| | | | | | | | |
Diversified Telecommunication Services — 1.4% | |
Verizon Communications, Inc. | | | 58,464 | | | | 3,434,760 | |
| | | | | | | | |
Electric Utilities — 0.7% | | | | | | | | |
American Electric Power Co., Inc. | | | 21,950 | | | | 1,827,776 | |
| | | | | | | | |
Electrical Equipment — 0.9% | | | | | | | | |
Emerson Electric Co. | | | 28,746 | | | | 2,310,316 | |
| | | | | | | | |
| | | | | | | | |
COMMON STOCKS
(continued) | | Shares | | | Value | |
Entertainment — 3.7% | | | | | | | | |
Netflix, Inc.* | | | 5,605 | | | $ | 3,030,792 | |
Spotify Technology S.A. (Sweden)* | | | 4,699 | | | | 1,478,587 | |
Walt Disney Co. (The)* | | | 24,431 | | | | 4,426,409 | |
| | | | | | | | |
| | | | | | | 8,935,788 | |
| | | | | | | | |
Equity Real Estate Investment Trusts (REITs) — 1.8% | |
Alexandria Real Estate Equities, Inc. | | | 7,343 | | | | 1,308,670 | |
American Campus Communities, Inc. | | | 36,030 | | | | 1,541,003 | |
American Tower Corp. | | | 7,298 | | | | 1,638,109 | |
| | | | | | | | |
| | | | | | | 4,487,782 | |
| | | | | | | | |
Food & Staples Retailing — 1.6% | | | | | | | | |
Walmart, Inc. | | | 26,413 | | | | 3,807,434 | |
| | | | | | | | |
Food Products — 1.1% | | | | | | | | |
Mondelez International, Inc. (Class A Stock) | | | 44,666 | | | | 2,611,621 | |
| | | | | | | | |
Health Care Equipment & Supplies — 1.1% | |
Zimmer Biomet Holdings, Inc. | | | 17,405 | | | | 2,681,936 | |
| | | | | | | | |
Health Care Providers & Services — 1.7% | |
Cigna Corp. | | | 10,657 | | | | 2,218,574 | |
Laboratory Corp. of America Holdings* | | | 9,052 | | | | 1,842,535 | |
| | | | | | | | |
| | | | | | | 4,061,109 | |
| | | | | | | | |
Hotels, Restaurants & Leisure — 1.3% | | | | | | | | |
McDonald’s Corp. | | | 9,530 | | | | 2,044,948 | |
Royal Caribbean Cruises Ltd. | | | 14,157 | | | | 1,057,386 | |
| | | | | | | | |
| | | | | | | 3,102,334 | |
| | | | | | | | |
Household Durables — 0.7% | | | | | | | | |
DR Horton, Inc. | | | 24,325 | | | | 1,676,479 | |
| | | | | | | | |
Household Products — 0.7% | | | | | | | | |
Procter & Gamble Co. (The) | | | 12,794 | | | | 1,780,157 | |
| | | | | | | | |
Insurance — 3.5% | | | | | | | | |
Chubb Ltd. (Switzerland) | | | 22,958 | | | | 3,533,695 | |
Marsh & McLennan Cos., Inc. | | | 12,829 | | | | 1,500,993 | |
MetLife, Inc. | | | 49,550 | | | | 2,326,373 | |
RenaissanceRe Holdings Ltd. (Bermuda) | | | 7,729 | | | | 1,281,623 | |
| | | | | | | | |
| | | | | | | 8,642,684 | |
| | | | | | | | |
Interactive Media & Services — 6.1% | | | | | | | | |
Alphabet, Inc. (Class A Stock)* | | | 4,054 | | | | 7,105,203 | |
Facebook, Inc. (Class A Stock)* | | | 15,964 | | | | 4,360,726 | |
Match Group, Inc.* | | | 22,431 | | | | 3,391,343 | |
| | | | | | | | |
| | | | | | | 14,857,272 | |
| | | | | | | | |
Internet & Direct Marketing Retail — 3.9% | |
Amazon.com, Inc.* | | | 1,879 | | | | 6,119,772 | |
Farfetch Ltd. (United Kingdom)* | | | 22,347 | | | | 1,425,962 | |
MercadoLibre, Inc. (Argentina)* | | | 1,114 | | | | 1,866,195 | |
| | | | | | | | |
| | | | | | | 9,411,929 | |
| | | | | | | | |
IT Services — 7.9% | | | | | | | | |
Adyen NV (Netherlands), 144A* | | | 1,811 | | | | 4,214,479 | |
PayPal Holdings, Inc.* | | | 18,314 | | | | 4,289,139 | |
SEE NOTES TO FINANCIAL STATEMENTS.
A1
FINANCIAL STATEMENTS OF VCA-2
December 31, 2020
| | | | | | | | |
COMMON STOCKS
(continued) | | Shares | | | Value | |
IT Services (continued) | | | | | | | | |
Shopify, Inc. (Canada) (Class A Stock)* | | | 3,774 | | | $ | 4,271,979 | |
Snowflake, Inc.* | | | 4,587 | | | | 1,290,782 | |
Square, Inc. (Class A Stock)* | | | 10,308 | | | | 2,243,433 | |
Twilio, Inc.* | | | 9,201 | | | | 3,114,538 | |
| | | | | | | | |
| | | | | | | 19,424,350 | |
| | | | | | | | |
Leisure Products — 0.4% | | | | | | | | |
Peloton Interactive, Inc.* | | | 6,406 | | | | 971,918 | |
| | | | | | | | |
Machinery — 2.1% | | | | | | | | |
Deere & Co. | | | 6,155 | | | | 1,656,003 | |
Fortive Corp. | | | 20,489 | | | | 1,451,031 | |
Otis Worldwide Corp. | | | 31,544 | | | | 2,130,797 | |
| | | | | | | | |
| | | | | | | 5,237,831 | |
| | | | | | | | |
Media — 0.7% | | | | | | | | |
Comcast Corp. (Class A Stock) | | | 34,227 | | | | 1,793,495 | |
| | | | | | | | |
Multi-Utilities — 2.2% | | | | | | | | |
Ameren Corp. | | | 32,417 | | | | 2,530,471 | |
Dominion Energy, Inc. | | | 38,600 | | | | 2,902,720 | |
| | | | | | | | |
| | | | | | | 5,433,191 | |
| | | | | | | | |
Oil, Gas & Consumable Fuels — 3.1% | | | | | | | | |
Chevron Corp. | | | 42,165 | | | | 3,560,834 | |
ConocoPhillips | | | 37,714 | | | | 1,508,183 | |
Suncor Energy, Inc. (Canada) | | | 69,354 | | | | 1,163,760 | |
Williams Cos., Inc. (The) | | | 72,969 | | | | 1,463,029 | |
| | | | | | | | |
| | | | | | | 7,695,806 | |
| | | | | | | | |
Pharmaceuticals — 2.9% | | | | | | | | |
AstraZeneca PLC (United Kingdom), ADR | | | 38,569 | | | | 1,928,064 | |
Bristol-Myers Squibb Co. | | | 39,425 | | | | 2,445,533 | |
Eli Lilly & Co. | | | 15,784 | | | | 2,664,971 | |
| | | | | | | | |
| | | | | | | 7,038,568 | |
| | | | | | | | |
Road & Rail — 1.7% | | | | | | | | |
Union Pacific Corp. | | | 19,494 | | | | 4,059,041 | |
| | | | | | | | |
Semiconductors & Semiconductor Equipment — 5.5% | |
Broadcom, Inc. | | | 8,537 | | | | 3,737,925 | |
NVIDIA Corp. | | | 6,479 | | | | 3,383,334 | |
QUALCOMM, Inc. | | | 23,891 | | | | 3,639,555 | |
Texas Instruments, Inc. | | | 16,163 | | | | 2,652,833 | |
| | | | | | | | |
| | | | | | | 13,413,647 | |
| | | | | | | | |
Software — 5.0% | | | | | | | | |
Adobe, Inc.* | | | 8,317 | | | | 4,159,498 | |
Microsoft Corp. | | | 12,297 | | | | 2,735,099 | |
PTC, Inc.* | | | 13,391 | | | | 1,601,698 | |
RingCentral, Inc.* | | | 5,896 | | | | 2,234,407 | |
SAP SE (Germany), ADR | | | 10,960 | | | | 1,429,074 | |
| | | | | | | | |
| | | | | | | 12,159,776 | |
| | | | | | | | |
Specialty Retail — 2.8% | | | | | | | | |
Advance Auto Parts, Inc. | | | 7,965 | | | | 1,254,567 | |
Lowe’s Cos., Inc. | | | 18,272 | | | | 2,932,839 | |
Ross Stores, Inc. | | | 21,099 | | | | 2,591,168 | |
| | | | | | | | |
| | | | | | | 6,778,574 | |
| | | | | | | | |
| | | | | | | | |
COMMON STOCKS
(continued) | | Shares | | | Value | |
Technology Hardware, Storage & Peripherals — 3.7% | |
Apple, Inc. | | | 68,607 | | | $ | 9,103,463 | |
| | | | | | | | |
Textiles, Apparel & Luxury Goods — 2.9% | |
LVMH Moet Hennessy Louis Vuitton SE (France) | | | 4,776 | | | | 2,994,433 | |
NIKE, Inc. (Class B Stock) | | | 28,623 | | | | 4,049,296 | |
| | | | | | | | |
| | | | | | | 7,043,729 | |
| | | | | | | | |
Trading Companies & Distributors — 1.0% | |
United Rentals, Inc.* | | | 10,315 | | | | 2,392,152 | |
| | | | | | | | |
TOTAL COMMON STOCKS
(cost $149,780,149) | | | | 239,268,344 | |
| | | | | | | | |
|
| SHORT-TERM INVESTMENT — 1.6% | |
AFFILIATED MUTUAL FUND | | | | | | | | |
PGIM Core Ultra Short Bond Fund
(cost $3,967,847)(a) | | | 3,967,847 | | | | 3,967,847 | |
| | | | | | | | |
TOTAL INVESTMENTS — 99.5%
(cost $153,747,996) | | | | 243,236,191 | |
| | | | | | | | |
OTHER ASSETS IN EXCESS OF LIABILITIES — 0.5% | |
Receivable for Securities Sold | | | | 1,599,119 | |
Dividends and Interests Receivable | | | | 141,235 | |
Tax Reclaim Receivable | | | | 4,699 | |
Payable for Pending Capital Transactions | | | | (6,774 | ) |
Payable for Securities Purchased | | | | (428,749 | ) |
| | | | | | | | |
OTHER ASSETS IN EXCESS OF LIABILITIES | | | | 1,309,530 | |
| | | | | | | | |
NET ASSETS — 100.0%. | | | $ | 244,545,721 | |
| | | | | | | | |
NET ASSETS, representing: | | | | | | | | |
Equity of Participants — 2,195,337 Accumulation Units at an Accumulation Unit Value of $109.3768 | | | $ | 240,118,904 | |
Equity of Annuitants | | | | 4,611,452 | |
Equity of The Prudential Insurance Company of America | | | | (184,635 | ) |
| | | | | | | | |
| | | | | | $ | 244,545,721 | |
| | | | | | | | |
The following abbreviations are used in the annual report:
| | |
| 144A | | Security exempt from registration under Rule 144A of the Securities Act of 1933. These securities may be resold in transactions exempt from registration, typically only to qualified institutional buyers. |
| ADR | | American Depositary Receipt |
| * | Non-income producing security. |
| (a) | PGIM Investments LLC, the manager of the Account, also serves as manager of the PGIM Core Ultra Short Bond Fund. |
SEE NOTES TO FINANCIAL STATEMENTS.
A2
FINANCIAL STATEMENTS OF VCA-2
December 31, 2020
Fair Value Measurements:
Various inputs are used in determining the value of the Account’s investments. These inputs are summarized in the three broad levels listed below.
| Level 1—unadjusted | quoted prices generally in active markets for identical securities. |
| Level 2—quoted | prices for similar securities, interest rates and yield curves, prepayment speeds, foreign currency exchange rates, and other observable inputs. |
| Level 3—unobservable | inputs for securities valued in accordance with the Account’s Committee approved fair valuation procedures. |
The following is a summary of the inputs used as of December 31, 2020 in valuing such portfolio securities:
| | | | | | | | | | | | |
| | | Level 1 | | | Level 2 | | | Level 3 | |
Investments In Securities | | | | | | | | | | | | |
Assets | | | | | | | | | | | | |
Common Stocks | | | | | | | | | | | | |
Aerospace & Defense | | $ | 3,797,535 | | | $ | 1,263,362 | | | $ | — | |
Air Freight & Logistics | | | 1,476,459 | | | | — | | | | — | |
Automobiles | | | 8,710,326 | | | | — | | | | — | |
Banks | | | 17,103,248 | | | | — | | | | — | |
Beverages | | | 2,637,812 | | | | — | | | | — | |
Biotechnology | | | 2,187,574 | | | | — | | | | — | |
Building Products | | | 3,483,441 | | | | — | | | | — | |
Capital Markets | | | 4,974,288 | | | | — | | | | — | |
Chemicals | | | 9,293,320 | | | | — | | | | — | |
Communications Equipment | | | 1,095,569 | | | | — | | | | — | |
Consumer Finance | | | 4,641,945 | | | | — | | | | — | |
Containers & Packaging | | | 2,428,547 | | | | — | | | | — | |
Diversified Telecommunication Services | | | 3,434,760 | | | | — | | | | — | |
Electric Utilities | | | 1,827,776 | | | | — | | | | — | |
Electrical Equipment | | | 2,310,316 | | | | — | | | | — | |
Entertainment | | | 8,935,788 | | | | — | | | | — | |
Equity Real Estate Investment Trusts (REITs) | | | 4,487,782 | | | | — | | | | — | |
Food & Staples Retailing | | | 3,807,434 | | | | — | | | | — | |
Food Products | | | 2,611,621 | | | | — | | | | — | |
Health Care Equipment & Supplies | | | 2,681,936 | | | | — | | | | — | |
Health Care Providers & Services | | | 4,061,109 | | | | — | | | | — | |
Hotels, Restaurants & Leisure | | | 3,102,334 | | | | — | | | | — | |
Household Durables | | | 1,676,479 | | | | — | | | | — | |
Household Products | | | 1,780,157 | | | | — | | | | — | |
Insurance | | | 8,642,684 | | | | — | | | | — | |
Interactive Media & Services | | | 14,857,272 | | | | — | | | | — | |
Internet & Direct Marketing Retail | | | 9,411,929 | | | | — | | | | — | |
IT Services | | | 15,209,871 | | | | 4,214,479 | | | | — | |
Leisure Products | | | 971,918 | | | | — | | | | — | |
Machinery | | | 5,237,831 | | | | — | | | | — | |
Media | | | 1,793,495 | | | | — | | | | — | |
Multi-Utilities | | | 5,433,191 | | | | — | | | | — | |
Oil, Gas & Consumable Fuels | | | 7,695,806 | | | | — | | | | — | |
Pharmaceuticals | | | 7,038,568 | | | | — | | | | — | |
Road & Rail | | | 4,059,041 | | | | — | | | | — | |
Semiconductors & Semiconductor Equipment | | | 13,413,647 | | | | — | | | | — | |
Software | | | 12,159,776 | | | | — | | | | — | |
Specialty Retail | | | 6,778,574 | | | | — | | | | — | |
Technology Hardware, Storage & Peripherals | | | 9,103,463 | | | | — | | | | — | |
Textiles, Apparel & Luxury Goods | | | 4,049,296 | | | | 2,994,433 | | | | — | |
Trading Companies & Distributors | | | 2,392,152 | | | | — | | | | — | |
Affiliated Mutual Fund | | | 3,967,847 | | | | — | | | | — | |
| | | | | | | | | | | | |
Total | | $ | 234,763,917 | | | $ | 8,472,274 | | | $ | — | |
| | | | | | | | | | | | |
SEE NOTES TO FINANCIAL STATEMENTS.
A3
FINANCIAL STATEMENTS OF VCA-2
December 31, 2020
Industry Classification:
The industry classification of investments and other assets in excess of liabilities shown as a percentage of net assets as of December 31, 2020 were as follows (unaudited):
| | | | |
IT Services | | | 7.9 | % |
Banks | | | 7.0 | |
Interactive Media & Services | | | 6.1 | |
Semiconductors & Semiconductor Equipment | | | 5.5 | |
Software | | | 5.0 | |
Internet & Direct Marketing Retail. | | | 3.9 | |
Chemicals. | | | 3.8 | |
Technology Hardware, Storage & Peripherals | | | 3.7 | |
Entertainment | | | 3.7 | |
Automobiles | | | 3.6 | |
Insurance | | | 3.5 | |
Oil, Gas & Consumable Fuels | | | 3.1 | |
Textiles, Apparel & Luxury Goods | | | 2.9 | |
Pharmaceuticals | | | 2.9 | |
Specialty Retail | | | 2.8 | |
Multi-Utilities | | | 2.2 | |
Machinery | | | 2.1 | |
Aerospace & Defense | | | 2.1 | |
Capital Markets | | | 2.0 | |
Consumer Finance | | | 1.9 | |
Equity Real Estate Investment Trusts (REITs) | | | 1.8 | |
Health Care Providers & Services | | | 1.7 | |
Road & Rail | | | 1.7 | |
| | | | |
Affiliated Mutual Fund | | | 1.6 | % |
Food & Staples Retailing | | | 1.6 | |
Building Products | | | 1.4 | |
Diversified Telecommunication Services | | | 1.4 | |
Hotels, Restaurants & Leisure | | | 1.3 | |
Health Care Equipment & Supplies | | | 1.1 | |
Beverages | | | 1.1 | |
Food Products | | | 1.1 | |
Containers & Packaging | | | 1.0 | |
Trading Companies & Distributors | | | 1.0 | |
Electrical Equipment | | | 0.9 | |
Biotechnology | | | 0.9 | |
Electric Utilities | | | 0.7 | |
Media | | | 0.7 | |
Household Products | | | 0.7 | |
Household Durables | | | 0.7 | |
Air Freight & Logistics | | | 0.6 | |
Communications Equipment | | | 0.4 | |
Leisure Products | | | 0.4 | |
| | | | |
| | | 99.5 | |
Other assets in excess of liabilities | | | 0.5 | |
| | | | |
| | | 100.0 | % |
| | | | |
SEE NOTES TO FINANCIAL STATEMENTS.
A4
FINANCIAL STATEMENTS OF VCA-2
Year Ended December 31, 2020
| | | | |
| | | | |
INVESTMENT INCOME | | | | |
Unaffiliated Dividend Income (net of $16,772 foreign withholding tax) | | $ | 3,875,922 | |
Affiliated Dividend Income | | | 38,062 | |
Total Income | | | 3,913,984 | |
EXPENSES | | | | |
Fees Charged to Participants and Annuitants for Investment Management Services | | | (263,343 | ) |
Fees Charged to Participants (other than Annuitants) for Assuming Mortality and Expense Risks | | | (771,902 | ) |
Total Expenses | | | (1,035,245 | ) |
NET INVESTMENT INCOME | | | 2,878,739 | |
REALIZED AND UNREALIZED GAIN (LOSS) ON INVESTMENT AND FOREIGN CURRENCY TRANSACTIONS | | | | |
Net Realized Gain (Loss) on: | | | | |
Investment Transactions | | | 21,380,017 | |
Foreign Currency Transactions | | | 1,966 | |
| | | | 21,381,983 | |
Net Change in Unrealized Appreciation (Depreciation) on: | | | | |
Investments | | | 12,769,075 | |
Foreign Currencies | | | 80 | |
| | | | 12,769,155 | |
NET GAIN ON INVESTMENT AND FOREIGN CURRENCY TRANSACTIONS | | | 34,151,138 | |
NET INCREASE IN NET ASSETS RESULTING FROM OPERATIONS | | $ | 37,029,877 | |
| | | | | | |
| | |
| | STATEMENT OF CHANGES IN NET ASSETS | | |
| | | | | | | | |
| | | Year Ended December 31, 2020 | | | Year Ended December 31, 2019 | |
OPERATIONS | | | | | | | | |
Net Investment Income | | $ | 2,878,739 | | | $ | 3,231,417 | |
Net Realized Gain on Investment and Foreign Currency Transactions | | | 21,381,983 | | | | 18,926,000 | |
Net Change in Unrealized Appreciation (Depreciation) on Investments and Foreign Currencies | | | 12,769,155 | | | | 29,075,353 | |
NET INCREASE IN NET ASSETS RESULTING FROM OPERATIONS | | | 37,029,877 | | | | 51,232,770 | |
CAPITAL TRANSACTIONS | | | | | | | | |
Purchase Payments and Transfers In (67,352 and 46,345 units, respectively) | | | 6,172,263 | | | | 4,059,714 | |
Withdrawals and Transfers Out (264,363 and 260,881 units, respectively) | | | (23,662,720 | ) | | | (21,931,389 | ) |
Mortality and Expense Risk Charges Deducted from Annuitants’ Accounts | | | (18,129 | ) | | | (16,917 | ) |
Variable Annuity Payments | | | (563,922 | ) | | | (613,419 | ) |
NET DECREASE IN NET ASSETS RESULTING FROM CAPITAL TRANSACTIONS | | | (18,072,508 | ) | | | (18,502,011 | ) |
NET INCREASE (DECREASE) IN NET ASSETS RESULTING FROM SURPLUS TRANSFERS | | | (1,363,192 | ) | | | 22,401 | |
TOTAL INCREASE IN NET ASSETS | | | 17,594,177 | | | | 32,753,160 | |
NET ASSETS | | | | | | | | |
Beginning of year | | | 226,951,544 | | | | 194,198,384 | |
End of year | | $ | 244,545,721 | | | $ | 226,951,544 | |
SEE NOTES TO FINANCIAL STATEMENTS.
A5
FINANCIAL HIGHLIGHTS FOR VCA-2
| | | | | | |
| | |
| | INCOME PER ACCUMULATION UNIT* | | |
(For an Accumulation Unit outstanding throughout the year)
| | | | | | | | | | | | | | | | | | | | |
| | | Year Ended December 31, | |
| | | 2020 | | | 2019 | | | 2018 | | | 2017 | | | 2016 | |
Investment Income | | $ | 1.6913 | | | $ | 1.6743 | | | $ | 1.4886 | | | $ | 1.1756 | | | $ | 1.1021 | |
Expenses | | | | | | | | | | | | | | | | | | | | |
Investment management fee | | | (0.1146 | ) | | | (0.1045 | ) | | | (0.1008 | ) | | | (0.0883 | ) | | | (0.0735 | ) |
Assuming mortality and expense risks | | | (0.3433 | ) | | | (0.3132 | ) | | | (0.3021 | ) | | | (0.2647 | ) | | | (0.2203 | ) |
Net Investment Income | | | 1.2334 | | | | 1.2566 | | | | 1.0857 | | | | 0.8266 | | | | 0.8083 | |
Net realized and unrealized gain (loss) on investment and foreign currency transactions. | | | 15.6857 | | | | 18.6403 | | | | (6.8449 | ) | | | 13.7979 | | | | 3.1300 | |
Net Increase (Decrease) in Accumulation Unit Value | | | 16.9191 | | | | 19.8969 | | | | (5.7592 | ) | | | 14.6205 | | | | 3.9383 | |
Accumulation Unit Value | | | | | | | | | | | | | | | | | | | | |
Beginning of year | | | 92.4577 | | | | 72.5608 | | | | 78.3200 | | | | 63.6995 | | | | 59.7612 | |
End of year | | | 109.3768 | | | | 92.4577 | | | | 72.5608 | | | | 78.3200 | | | | 63.6995 | |
Total Return** | | | 18.30 | % | | | 27.39 | % | | | (7.35 | )% | | | 22.95 | % | | | 6.59 | % |
Ratio of Expenses to Average Net Assets*** | | | 0.50 | % | | | 0.50 | % | | | 0.50 | % | | | 0.50 | % | | | 0.50 | % |
Ratio of Net Investment Income to Average Net Assets*** | | | 1.35 | % | | | 1.51 | % | | | 1.35 | % | | | 1.16 | % | | | 1.37 | % |
Portfolio Turnover Rate | | | 58 | % | | | 48 | % | | | 36 | % | | | 48 | % | | | 40 | % |
Number of Accumulation Units Outstanding
For Participants at end of year (000’s omitted) | | | 2,195 | | | | 2,392 | | | | 2,607 | | | | 3,000 | | | | 3,384 | |
| * | Calculated by accumulating the actual per unit amounts daily. |
| ** | Total return does not consider the effects of sales loads. Total return is calculated assuming a purchase of a share on the first day and a sale on the last day of each period reported. Total returns may reflect adjustments to conform to generally accepted accounting principles. Total returns for periods less than one full year are not annualized. |
| *** | These calculations exclude PICA’s equity in VCA-2. |
The above table does not reflect the annual administration charge, which does not affect the Accumulation Unit Value. This charge is made by reducing Participants’ Accumulation Accounts by a number of Accumulation Units equal in value to the charge.
SEE NOTES TO FINANCIAL STATEMENTS.
B1
NOTES TO FINANCIAL STATEMENTS OF
VCA-2
The Prudential Variable Contract Account-2 (“VCA-2” or the “Account”) was established on January 9, 1968 by The Prudential Insurance Company of America (“PICA”) under the laws of the State of New Jersey and is registered as an open-end, diversified management investment company under the Investment Company Act of 1940 (“1940 Act”), as amended. VCA-2 has been designed for use by employers (“Contractholders”) in making retirement arrangements on behalf of their employees (“Participants”). The investment objective of the Account is long-term growth of capital.
| Note 2: | | Accounting Policies |
The Account follows investment company accounting and reporting guidance of the Financial Accounting Standards Board (“FASB”) Accounting Standard Codification (“ASC”) Topic 946 Financial Services — Investment Companies. The following accounting policies conform to U.S. generally accepted accounting principles (“GAAP”). The Account consistently follows such policies in the preparation of its financial statements.
Securities Valuation: The Account holds securities and other assets and liabilities that are fair valued at the close of each day (generally, 4:00 PM Eastern time) the New York Stock Exchange (“NYSE”) is open for trading. Fair value is the price that would be received to sell an asset or paid to transfer a liability in an orderly transaction between market participants on the measurement date. The Account’s Committee Members (the “Committee”) have adopted valuation procedures for security valuation under which fair valuation responsibilities have been delegated to PGIM Investments LLC (“PGIM Investments” or the “Manager”). Pursuant to the Committee’s delegation, the Manager has established a Valuation Committee responsible for supervising the fair valuation of portfolio securities and other assets and liabilities. The valuation procedures permit the Account to utilize independent pricing vendor services, quotations from market makers, and alternative valuation methods when market quotations are either not readily available or not deemed representative of fair value. A record of the Valuation Committee’s actions is subject to the Committee’s review, approval, and ratification at its next regularly scheduled quarterly meeting.
For the fiscal reporting year-end, securities and other assets and liabilities were fair valued at the close of the last U.S. business day. Trading in certain foreign securities may occur when the NYSE is closed (including weekends and holidays). Because such foreign securities trade in markets that are open on weekends and U.S. holidays, the values of some of the Account’s foreign investments may change on days when investors cannot purchase or redeem Account shares.
Various inputs determine how the Account’s investments are valued, all of which are categorized according to the three broad levels (Level 1, 2, or 3) detailed in the table following the Account’s Statement of Net Assets and referred to herein as the “fair value hierarchy” in accordance with FASB ASC Topic 820 — Fair Value Measurements and Disclosures.
Common or preferred stocks, exchange-traded funds, and derivative instruments, if applicable, that are traded on a national securities exchange are valued at the last sale price as of the close of trading on the applicable exchange where the security principally trades. Securities traded via NASDAQ are valued at the NASDAQ official closing price. To the extent these securities are valued at the last sale price or NASDAQ official closing price, they are classified as Level 1 in the fair value hierarchy. In the event that no sale or official closing price on valuation date exists, these securities are generally valued at the mean between the last reported bid and ask prices, or at the last bid price in the absence of an ask price. These securities are classified as Level 2 in the fair value hierarchy.
Foreign equities traded on foreign securities exchanges are valued using pricing vendor services that provide model prices derived using adjustment factors based on information such as local closing price, relevant general and sector indices, currency fluctuations, depositary receipts, and futures, as applicable. Securities valued using such model prices are classified as Level 2 in the fair value hierarchy. The models generate an evaluated adjustment factor for each security, which is applied to the local closing price to adjust it for post-closing market movements up to the time the Account is valued. Utilizing that evaluated adjustment factor, the vendor provides an evaluated price for each security. If the vendor does not provide an evaluated price, securities are valued in accordance with exchange-traded common and preferred stock valuation policies discussed above.
C1
Investments in open-end (other than exchange-traded funds) are valued at their net asset values as of the close of the NYSE on the date of valuation. These securities are classified as Level 1 in the fair value hierarchy since they may be purchased or sold at their net asset values on the date of valuation.
Securities and other assets that cannot be priced according to the methods described above are valued based on pricing methodologies approved by the Committee. In the event that unobservable inputs are used when determining such valuations, the securities will be classified as Level 3 in the fair value hierarchy. Altering one or more unobservable inputs may result in a significant change to a Level 3 security’s fair value measurement.
When determining the fair value of securities, some of the factors influencing the valuation include: the nature of any restrictions on disposition of the securities; assessment of the general liquidity of the securities; the issuer’s financial condition and the markets in which it does business; the cost of the investment; the size of the holding and the capitalization of the issuer; the prices of any recent transactions or bids/offers for such securities or any comparable securities; any available analyst media or other reports or information deemed reliable by the Manager regarding the issuer or the markets or industry in which it operates. Using fair value to price securities may result in a value that is different from a security’s most recent closing price and from the price used by other mutual funds to calculate their net asset values.
Foreign Currency Translation: The books and records of the Account are maintained in U.S. dollars. Foreign currency amounts are translated into U.S. dollars on the following basis:
(i) market value of investment securities, other assets and liabilities — at the current rates of exchange;
(ii) purchases and sales of investment securities, income and expenses — at the rates of exchange prevailing on the respective dates of such transactions.
Although the net assets of the Account are presented at the foreign exchange rates and market values at the close of the period, the Account does not generally isolate that portion of the results of operations arising as a result of changes in the foreign exchange rates from the fluctuations arising from changes in the market prices of long-term portfolio securities held at the end of the period. Similarly, the Account does not isolate the effect of changes in foreign exchange rates from the fluctuations arising from changes in the market prices of long-term portfolio securities sold during the period. Accordingly, holding period realized foreign currency gains (losses) are included in the reported net realized gains (losses) on investment transactions.
Net realized gains (losses) on foreign currency transactions represent net foreign exchange gains (losses) from holdings of foreign currencies, currency gains (losses) realized between the trade and settlement dates on securities transactions, and the difference between the amounts of interest, dividends and foreign withholding taxes recorded on the Account’s books and the U.S. dollar equivalent amounts actually received or paid. Net unrealized currency gains (losses) from valuing foreign currency denominated assets and liabilities (other than investments) at period end exchange rates are reflected as a component of net unrealized appreciation (depreciation) on foreign currencies.
Securities Transactions and Net Investment Income: Securities transactions are recorded on the trade date. Realized gains (losses) from investment and currency transactions are calculated on the specific identification method. Dividend income is recorded on the ex-date, or for certain foreign securities, when the Account becomes aware of such dividends. Interest income, including amortization of premium and accretion of discount on debt securities, as required, is recorded on the accrual basis. Expenses are recorded on the accrual basis, which may require the use of certain estimates by management that may differ from actual. Net investment income and realized and unrealized gain (losses) (other than administrative fees) are allocated to the Participants and PICA on a daily basis in proportion to their respective ownership in VCA-2.
Estimates: The preparation of financial statements requires management to make estimates and assumptions that affect the reported amounts and disclosures in the financial statements. Actual results could differ from those estimates.
Federal Income Taxes: The operations of VCA-2 are part of, and are taxed with, the operations of PICA. Under the current provisions of the Internal Revenue Code, PICA does not expect to incur federal income taxes on earnings of VCA-2 to the extent the earnings are credited under the Contracts. As a result, the Unit Value of VCA-2 has not been reduced by federal income taxes.
Annuity Reserves: Reserves are computed for purchased annuities using the Prudential 1950 Group Annuity Valuation (GAV) Table, adjusted, and a valuation interest rate related to the Assumed Investment
C2
Result (AIR). The valuation interest rate is equal to the AIR less 0.50% in contract charges defined in Note 3. The AIRs are selected by each Contractholder and are described in the prospectus. Such amounts are included in Equity of annuitants in the Statement of Net Assets.
| Note 3: | | Investment Management Agreement and Charges |
The Account has a management agreement with PGIM Investments. Pursuant to this agreement, PGIM Investments has responsibility for all investment advisory services and supervises the subadviser’s performance of such services. PGIM Investments has entered into a subadvisory agreement with Jennison Associates LLC (“Jennison”). The subadvisory agreement provides that Jennison will furnish investment advisory services in connection with management of the Account. PGIM Investments pays for the services of Jennison.
A daily charge, at an effective annual rate of 0.125% of the current value of the Participant’s (other than annuitants’ and PICA’s) account in VCA-2, is charged to the Account and paid to PGIM Investments for investment management services.
A daily charge, paid to PICA for assuming mortality and expense risks, is calculated at an effective annual rate of 0.375% of the current value of the Participant’s (other than annuitants’ and PICA’s) account in VCA-2.
An annual administration charge of not more than $30 annually is deducted from the accumulation account of certain Participants either at the time of withdrawal of the value of the entire Participant’s account or on the last business day of each calendar year. Such amounts are reflected as a withdrawal on the Statements of Changes in Net Assets. This deduction may be made from a fixed-dollar annuity contract if the Participant is enrolled under such a contract.
No sales charge is deducted from Participants’ purchase payments and/or contributions. However, PICA has reserved the right in the future to impose or deduct a maximum sales charge of 2.50% from purchase payments and/or contributions.
PICA, PGIM Investments and Jennison are indirect, wholly-owned subsidiaries of Prudential Financial, Inc.
| Note 4: | | Other Transactions with Affiliates |
The Account may enter into certain securities purchase or sale transactions under Committee approved Rule 17a-7 procedures. Rule 17a-7 is an exemptive rule under the 1940 Act, that permits purchase and sale transactions among affiliated investment companies, or between an investment company and a person that is affiliated solely by reason of having a common (or affiliated) investment adviser, common directors, and/or common officers. Such transactions are subject to ratification by the Committee. For the year ended December 31, 2020, no such transactions were entered into by the Account.
During the year ended December 31, 2020, the Account invested in the PGIM Core Ultra Short Bond Fund (the “Core Fund”), a portfolio of Prudential Investment Portfolios 2, registered under the 1940 Act, and managed by PGIM Investments. Through the Account’s investment in the mentioned underlying fund, PGIM Investments and/or its affiliates are paid fees or compensated for providing their services. Earnings from the Core Fund are disclosed on the Statement of Operations as “Affiliated Dividend Income”.
| Note 5: | | Portfolio Securities |
For the year ended December 31, 2020, the aggregate cost of purchases and the proceeds from sales of securities, excluding short-term investments, were $120,826,110 and $138,858,101, respectively.
A summary of the cost of purchases and proceeds from sales of shares of an affiliated mutual fund for the year ended December 31, 2020, is presented as follows:
| | | | | | | | | | | | | | | | | | | | | | | | | | | | |
Value,
Beginning
of Year | | Cost of
Purchases | | | Proceeds
from Sales | | | Change in
Unrealizd
Gain(Loss) | | | Realized
Gain(Loss) | | | Value, End
of Year | | | Shares, End
of Year | | | Income | |
PGIM Core Ultra Short Bond Fund* | |
| $3,821,041 | | $ | 61,946,224 | | | $ | (61,799,418 | ) | | $ | — | | | $ | — | | | $ | 3,967,847 | | | | 3,967,847 | | | $ | 38,062 | |
| | | | | | | | | | | | | | | | | | | | | | | | | | | | |
| | * | The Account did not have any capital gain distributions during reporting period. |
C3
| Note 6: | | Net Increase (Decrease) In Net Assets Resulting From Surplus Transfers |
The increase (decrease) in net assets resulting from surplus transfers represents the net increase to/(reductions from) PICA’s investment in the Account.
| Note 7: | | Participant Loans |
Participant loan initiations are not permitted in VCA-2. However, participants who initiated loans in other accounts are permitted to direct loan repayments into VCA-2.
For the years ended December 31, 2020 and December 31, 2019, $0 and $0 of participant loan principal and interest have been paid to VCA-2, respectively.
| Note 8: | | Risks of Investing in the Account |
The Account’s risks include, but are not limited to, some or all of the risks discussed below. For further information on the Account’s risk, please refer to the Account’s Prospectus and Statement of Additional Information.
Equity and Equity-Related Securities Risks: The value of a particular security could go down and you could lose money. In addition to an individual security losing value, the value of the equity markets or a sector in which the Account invests could go down. The Account’s holdings can vary significantly from broad market indexes and the performance of the Account can deviate from the performance of these indexes. Different parts of a market can react differently to adverse issuer, market, regulatory, political and economic developments.
Foreign Market Disruption and Geopolitical Risks: International wars or conflicts and geopolitical developments in foreign countries, along with instability in regions such as Asia, Eastern Europe, and the Middle East, possible terrorist attacks in the United States or around the world, public health emergencies (such as the spread of infectious diseases, epidemics or pandemics), natural disasters and other similar events, or widespread fear that such events may occur, could negatively affect the global economy, as well as the economies of individual countries, the financial performance of individual companies and sectors, and the markets in general in significant and unforeseen ways. Recent examples of such health emergencies include the outbreak of the coronavirus globally and the 2014 -2016 outbreak in West Africa of the Ebola virus, which could adversely affect the U.S. and foreign financial markets and may cause further long-term economic uncertainties in the United States and worldwide generally. The coronavirus pandemic and the related governmental and public responses have had and may continue to have an impact on the Account’s investments and net asset value and have led and may continue to lead to increased market volatility and the potential for illiquidity in certain classes of securities and sectors of the market. Preventative or protective actions that governments may take in respect of pandemic or epidemic diseases may result in periods of business disruption, business closures, inability to obtain raw materials, supplies and component parts, and reduced or disrupted operations for the issuers in which the Account invests. Government intervention in markets may impact interest rates, market volatility and security pricing. The occurrence, reoccurrence and pendency of such diseases could adversely affect the economies (including through changes in business activity and increased unemployment) and financial markets either in specific countries or worldwide.
Foreign Securities Risk: The Account’s investments in securities of foreign issuers or issuers with significant exposure to foreign markets involve additional risk. Foreign countries in which the Account may invest may have markets that are less liquid, less regulated and more volatile than US markets. The value of the Account’s investments may decline because of factors affecting the particular issuer as well as foreign markets and issuers generally, such as unfavorable government actions, and political or financial instability.
Market and Credit Risks: Securities markets may be volatile and the market prices of the Account’s securities may move up and down, sometimes rapidly and unpredictably. Securities fluctuate in price based on changes in an issuer’s financial condition and overall market and economic conditions. If the market prices of the securities owned by the Account fall, the value of an investment in the Account will decline. Additionally, the Account may also be exposed to credit risk in the event that an issuer or guarantor fails to perform or that an institution or entity with which the Account has unsettled or open transactions defaults.
C4
| Note 9: | | Recent Regulatory Developments |
On December 3, 2020, the SEC announced that it voted to adopt a new rule that establishes an updated regulatory framework for valuation practices (the “Rule”). The Rule, in part, provides (i) a framework for determining fair value in good faith and (ii) provides for the Account Committee’s assignment of its responsibility for the execution of valuation-related activities to the Account’s investment adviser. Further, the SEC is rescinding previously issued guidance on related issues. The Rule will become effective 60 days after publication in the Federal Register, and will have a compliance date 18 months following the effective date. Management is currently evaluating the Rule and its impact to the Account.
C5
REPORT OF INDEPENDENT REGISTERED PUBLIC ACCOUNTING FIRM
To the Members of the VCA 2 Committee and Participants of The Prudential Variable Contract Account-2
Opinion on the Financial Statements
We have audited the accompanying statement of net assets of The Prudential Variable Contract Account-2 (the “Account”) as of December 31, 2020, and the related statements of operations and changes in net assets, including the related notes, and the financial highlights for the year then ended (collectively referred to as the “financial statements”). In our opinion, the financial statements present fairly, in all material respects, the financial position of the Account as of December 31, 2020, and the results of its operations, changes in its net assets, and the financial highlights for the year then ended in conformity with accounting principles generally accepted in the United States of America.
The financial statements of the Account as of and for the year ended December 31, 2019 and the financial highlights for each of the periods ended on or prior to December 31, 2019 (not presented herein, other than the statement of changes in net assets and the financial highlights) were audited by other auditors whose report dated February 19, 2020 expressed an unqualified opinion on those financial statements and financial highlights.
Basis for Opinion
These financial statements are the responsibility of the Account’s management. Our responsibility is to express an opinion on the Account’s financial statements based on our audit. We are a public accounting firm registered with the Public Company Accounting Oversight Board (United States) (PCAOB) and are required to be independent with respect to the Account in accordance with the U.S. federal securities laws and the applicable rules and regulations of the Securities and Exchange Commission and the PCAOB.
We conducted our audit of these financial statements in accordance with the standards of the PCAOB. Those standards require that we plan and perform the audit to obtain reasonable assurance about whether the financial statements are free of material misstatement, whether due to error or fraud.
Our audit included performing procedures to assess the risks of material misstatement of the financial statements, whether due to error or fraud, and performing procedures that respond to those risks. Such procedures included examining, on a test basis, evidence regarding the amounts and disclosures in the financial statements. Our audit also included evaluating the accounting principles used and significant estimates made by management, as well as evaluating the overall presentation of the financial statements. Our procedures included confirmation of securities owned as of December 31, 2020 by correspondence with the custodian, transfer agent and brokers; when replies were not received from brokers, we performed other auditing procedures. We believe that our audit provides a reasonable basis for our opinion.
/s/ PricewaterhouseCoopers LLP
New York, New York
February 24, 2021
We have served as the auditor of one or more investment companies in the Prudential Variable Contract Accounts complex since 2020.
D1
INFORMATION ABOUT COMMITTEE MEMBERS AND OFFICERS
VCA 2 is managed by the VCA 2 Committee. The members of the VCA 2 Committee are elected by the persons having voting rights in respect of the VCA 2 Account. The affairs of VCA 2 are conducted in accordance with the Rules and Regulations of VCA 2. Information pertaining to the members of the VCA 2 Committee (hereafter referred to as “Committee Members”) is set forth below. Committee Members who are not deemed to be “interested persons” of VCA 2 as defined in the Investment Company Act of 1940, as amended (the 1940 Act) are referred to as “Independent Committee Members.” Committee Members who are deemed to be “interested persons” of VCA 2 are referred to as “Independent Committee Members.” Information pertaining to the Officers of VCA 2 is also set forth below.
| | | | | | |
| |
| Independent Committee Members |
Name
Year of Birth
Position(s)
Portfolios Overseen | | Principal Occupation(s)
During Past Five Years | | Other Directorships Held During
Past Five Years | | Length of Board Service |
Ellen S. Alberding
1958
Committee Member
Portfolios Overseen: 95 | | President and Board Member, The Joyce Foundation (charitable foundation) (since 2002); Vice Chair, City Colleges of Chicago (community college system) (2011-2015); Trustee, National Park Foundation (charitable foundation for national park system) (2009-2018); Trustee, Economic Club of Chicago (2009-2016); Trustee, Loyola University (since 2018). | | None. | | Since September 2013 |
Kevin J. Bannon
1952
Committee Member
Portfolios Overseen: 95 | | Retired; Managing Director (April 2008-May 2015) and Chief Investment Officer (October 2008-November 2013) of Highmount Capital LLC (registered investment adviser); formerly Executive Vice President and Chief Investment Officer (April 1993-August 2007) of Bank of New York Company; President (May 2003-May 2007) of BNY Hamilton Family of Mutual Funds. | | Director of Urstadt Biddle Properties (equity real estate investment trust) (since September 2008). | | Since July 2008 |
Linda W. Bynoe
1952
Committee Member
Portfolios Overseen: 95 | | President and Chief Executive Officer (since March 1995) and formerly Chief Operating Officer (December 1989-February 1995) of Telemat Limited LLC (formerly, Telemat Ltd). (management consulting); formerly Vice President (January 1985-June 1989) at Morgan Stanley & Co. (broker-dealer). | | Director of Anixter International, Inc. (communication products distributor) (January 2006-June 2020); Director of Northern Trust Corporation (financial services) (since April 2006); Trustee of Equity Residential (residential real estate) (since December 2009). | | Since March 2005 |
Barry H. Evans
1960
Committee Member
Portfolios Overseen: 94 | | Retired; formerly President (2005-2016), Global Chief Operating Officer (2014- 2016), Chief Investment Officer-Global Head of Fixed Income (1998-2014), and various portfolio manager roles (1986-2006), Manulife Asset Management U.S. | | Formerly Director, Manulife Trust Company (2011-2018); formerly Director, Manulife Asset Management Limited (2015-2017); formerly Chairman of the Board of Directors of Manulife Asset Management U.S. (2005-2016); formerly Chairman of the Board, Declaration Investment Management and Research (2008-2016). | | Since September 2017 |
Keith F. Hartstein
1956
Committee Member & Independent Chair
Portfolios Overseen: 95 | | Executive Committee of the Independent Directors Council (IDC) Board of Governors (since October 2019); Retired; Member (since November 2014) of the Governing Council of the IDC (organization of independent mutual fund directors); formerly President and Chief Executive Officer (2005-2012), Senior Vice President (2004-2005), Senior Vice President of Sales and Marketing (1997-2004), and various executive management positions (1990-1997), John Hancock Funds, LLC (asset management); Chairman, Investment Company Institute’s Sales Force Marketing Committee (2003-2008). | | None. | | Since September 2013 |
E1
| | | | | | |
| |
| Independent Committee Members |
Name
Year of Birth
Position(s)
Portfolios Overseen | | Principal Occupation(s)
During Past Five Years | | Other Directorships Held During
Past Five Years | | Length of Board Service |
Laurie Simon Hodrick
1962
Committee Member
Portfolios Overseen: 94 | | A. Barton Hepburn Professor Emerita of Economics in the Faculty of Business, Columbia Business School (since 2018); Visiting Professor of Law, Stanford Law School (since 2015); Visiting Fellow at the Hoover Institution, Stanford University (since 2015); Sole Member, ReidCourt LLC (since 2008) (a consulting firm); formerly A. Barton Hepburn Professor of Economics in the Faculty of Business, Columbia Business School (1996-2017); formerly Managing Director, Global Head of Alternative Investment Strategies, Deutsche Bank (2006-2008). | | Independent Director, Roku, Inc. (since 2020) (communication services); Independent Director, Synnex Corporation (since 2019) (information technology); Independent Director, Kabbage, Inc. (2018-2020) (financial services); Independent Director, Corporate Capital Trust (2017-2018) (a business development company). | | Since September 2017 |
Michael S. Hyland, CFA 1945 Committee Member* Portfolios Overseen: 95 *Retired 12/31/2020 | | Retired (since February 2005); formerly Senior Managing Director (July 2001-February 2005) of Bear Stearns & Co, Inc.; Global Partner, INVESCO (1999-2001); Managing Director and President of Salomon Brothers Asset Management (1989-1999). | | None. | | Since July 2008 |
Brian K. Reid
1961
Committee Member
Portfolios Overseen: 94 | | Retired; formerly Chief Economist for the Investment Company Institute (ICI) (2005-2017); formerly Senior Economist and Director of Industry and Financial Analysis at the ICI (1998-2004); formerly Senior Economist, Industry and Financial Analysis at the ICI (1996-1998); formerly Staff Economist at the Federal Reserve Board (1989-1996); Director, ICI Mutual Insurance Company (2012-2017). | | None. | | Since March 2018 |
Grace C. Torres
1959
Committee Member
Portfolios Overseen: 94 | | Retired; formerly Treasurer and Principal Financial and Accounting Officer of the PGIM Funds, Target Funds, Advanced Series Trust, Prudential Variable Contract Accounts and The Prudential Series Fund (1998-June 2014); Assistant Treasurer (March 1999-June 2014) and Senior Vice President (September 1999-June 2014) of PGIM Investments LLC; Assistant Treasurer (May 2003-June 2014) and Vice President (June 2005-June 2014) of AST Investment Services, Inc.; Senior Vice President and Assistant Treasurer (May 2003-June 2014) of Prudential Annuities Advisory Services, Inc. | | Formerly Director (July 2015-January 2018) of Sun Bancorp, Inc. N.A. and Sun National Bank; Director (since January 2018) of OceanFirst Financial Corp. and OceanFirst Bank. | | Since November 2014 |
| | | | | | |
| |
| Interested Committee Members |
Name
Year of Birth
Position(s)
Portfolios Overseen | | Principal Occupation(s)
During Past Five Years | | Other Directorships Held During
Past Five Years | | Length of Board Service |
Stuart S. Parker
1962
Committee Member & President
Portfolios Overseen: 95 | | Chief Executive Officer, Chief Operating Officer and Officer in Charge of PGIM Investments LLC (formerly known as Prudential Investments LLC) (since January 2012); Executive Vice President of Prudential Investment Management Services LLC (since December 2012); formerly Executive Vice President of Jennison Associates LLC and Head of Retail Distribution of PGIM Investments LLC (June 2005-December 2011); Investment Company Institute-Board of Governors (since May 2012). | | None. | | Since January 2012 |
E2
| | | | | | |
| |
| Interested Committee Members |
Name
Year of Birth
Position(s)
Portfolios Overseen | | Principal Occupation(s)
During Past Five Years | | Other Directorships Held During
Past Five Years | | Length of Board Service |
Scott E. Benjamin
1973
Committee Member & Vice President
Portfolios Overseen: 95 | | Executive Vice President (since May 2009) of PGIM Investments LLC; Vice President (since June 2012) of Prudential Investment Management Services LLC; Executive Vice President (since September 2009) of AST Investment Services, Inc.; Senior Vice President of Product Development and Marketing, PGIM Investments (since February 2006); formerly Vice President of Product Development and Product Management, PGIM Investments LLC (2003-2006). | | None. | | Since March 2010 |
| | | | |
| |
| VCA 2 Officers(a) |
Name
Year of Birth
Position with VCA 2 | | Principal Occupation(s) During Past Five Years | | Length of Service as Fund Officer |
Claudia DiGiacomo
1974
Chief Legal Officer | | Chief Legal Officer, Executive Vice President and Secretary of PGIM Investments LLC (since August 2020); Chief Legal Officer of Prudential Mutual Fund Services LLC (since August 2020); Chief Legal Officer of PIFM Holdco, LLC (since August 2020); Vice President and Corporate Counsel (since January 2005) of Prudential; and Corporate Counsel of AST Investment Services, Inc. (since August 2020); formerly Vice President and Assistant Secretary of PGIM Investments LLC (2005-2020); formerly Associate at Sidley Austin Brown & Wood LLP (1999-2004). | | Since December 2005 |
Dino Capasso
1974
Chief Compliance Officer | | Chief Compliance Officer (July 2019-Present) of PGIM Investments LLC; Chief Compliance Officer (July 2019-Present) of the PGIM Funds, Target Funds, Advanced Series Trust, The Prudential Series Fund, Prudential’s Gibraltar Fund, Inc., PGIM Global High Yield Fund, Inc., and PGIM High Yield Bond Fund, Inc.; Vice President and Deputy Chief Compliance Officer (June 2017-2019) of PGIM Investments LLC; formerly, Senior Vice President and Senior Counsel (January 2016-June 2017), and Vice President and Counsel (February 2012-December 2015) of Pacific Investment Management Company LLC. | | Since March 2018 |
| | | | |
| |
| Fund Officers(a) |
Name
Year of Birth
Fund Position | | Principal Occupation(s) During Past Five Years | | Length of Service as Fund Officer |
Andrew R. French
1962
Secretary | | Vice President (since December 2018-present) of PGIM Investments LLC; formerly, Vice President and Corporate Counsel (2010-2018) of Prudential; formerly Director and Corporate Counsel (2006-2010) of Prudential; Vice President and Assistant Secretary (since January 2007) of PGIM Investments LLC; Vice President and Assistant Secretary (since January 2007) of Prudential Mutual Fund Services LLC. | | Since October 2006 |
Diana N. Huffman
1982
Assistant Secretary | | Vice President and Corporate Counsel (since September 2015) of Prudential; Vice President and Assistant Secretary (since August 2020) of PGIM Investments LLC; formerly Associate at Willkie Farr & Gallagher LLP (2009-2015). | | Since March 2019 |
Melissa Gonzalez
1980
Assistant Secretary | | Vice President and Corporate Counsel (since September 2018) of Prudential; Vice President and Assistant Secretary (since August 2020) of PGIM Investments LLC; formerly Director and Corporate Counsel (March 2014-September 2018) of Prudential. | | Since March 2020 |
Patrick E. McGuinness
1986
Assistant Secretary | | Vice President and Assistant Secretary (since August 2020) of PGIM Investments LLC; Director and Corporate Counsel (since February 2017) of Prudential; and Corporate Counsel (2012-2017) of IIL, Inc. | | Since June 2020 |
E3
| | | | |
| |
| Fund Officers(a) |
Name
Year of Birth
Fund Position | | Principal Occupation(s) During Past Five Years | | Length of Service as Fund Officer |
Debra Rubano
1975
Assistant Secretary | | Vice President and Corporate Counsel (since November 2020) of Prudential; formerly Director and Senior Counsel of Allianz Global Investors U.S. Holdings LLC (2010-2020) and Assistant Secretary of numerous funds in the Allianz fund complex (2015-2020). | | Since December 2020 |
Kelly A. Coyne
1968
Assistant Secretary | | Director, Investment Operations of Prudential Mutual Fund Services LLC (since 2010). | | Since March 2015 |
Christian J. Kelly
1975
Treasurer and Principal Financial
and Accounting Officer | | Vice President, Head of Fund Administration of PGIM Investments LLC (since November 2018); formerly, Director of Fund Administration of Lord Abbett & Co. LLC (2009-2018), Treasurer and Principal Accounting Officer of the Lord Abbett Family of Funds (2017-2018); Director of Accounting, Avenue Capital Group (2008-2009); Senior Manager, Investment Management Practice of Deloitte & Touche LLP (1998-2007). | | Since January 2019 |
Lana Lomuti
1967
Assistant Treasurer | | Vice President (since 2007) and Director (2005-2007), within PGIM Investments Fund Administration; formerly Assistant Treasurer (December 2007-February 2014) of The Greater China Fund, Inc. | | Since April 2014 |
Russ Shupak
1973
Assistant Treasurer | | Vice President (since 2017) and Director (2013-2017), within PGIM Investments Fund Administration. | | Since October 2019 |
Deborah Conway
1969
Assistant Treasurer | | Vice President (since 2017) and Director (2007-2017), within PGIM Investments Fund Administration. | | Since October 2019 |
Elyse M. McLaughlin
1974
Assistant Treasurer | | Vice President (since 2017) and Director (2011-2017), within PGIM Investments Fund Administration. | | Since October 2019 |
Charles H. Smith
1973
Anti-Money Laundering
Compliance Officer | | Vice President, Corporate Compliance, Anti-Money Laundering Unit (since January 2015) of Prudential; committee member of the American Council of Life Insurers Anti-Money Laundering and Critical Infrastructure Committee (since January 2016); formerly Global Head of Economic Sanctions Compliance at AIG Property Casualty (February 2007-December 2014); Assistant Attorney General at the New York State Attorney General’s Office, Division of Public Advocacy. (August 1998-January 2007). | | Since January 2017 |
(a) Excludes Mr. Parker and Mr. Benjamin, interested Committee Members who also serve as President and Vice President, respectively.
Explanatory Notes to Tables:
| | • | | Committee Members are deemed to be “Interested,” as defined in the 1940 Act, by reason of their affiliation with PGIM Investments LLC and/or an affiliate of PGIM Investments LLC. |
| | • | | Unless otherwise noted, the address of all Committee Members and Officers is c/o PGIM Investments LLC, 655 Broad Street, Newark, New Jersey 07102-4410. |
| | • | | There is no set term of office for Committee Members or Officers. The Committee Members have adopted a retirement policy, which calls for the retirement of Committee Members on December 31 of the year in which they reach the age of 75. |
| | • | | “Other Directorships Held” includes all directorships of companies required to register or file reports with the SEC under the 1934 Act (that is, “public companies”) or other investment companies registered under the 1940 Act. |
| | • | | “Portfolios Overseen” includes all investment companies managed by PGIM Investments LLC. The investment companies for which PGIM Investments LLC serves as manager include the PGIM Funds, The Prudential Variable Contract Accounts, PGIM ETF Trust, PGIM High Yield Bond Fund, Inc., PGIM Global High Yield Fund, Inc., PGIM Short Duration High Yield Opportunities Fund, The Prudential Series Fund, Prudential’s Gibraltar Fund, Inc. and the Advanced Series Trust. |
| | • | | As used in the Fund Officers table “Prudential” means The Prudential Insurance Company of America. |
E4
The toll-free number shown below can be used to make transfers and reallocations, review how your premiums are being allocated, and receive current investment option values in your contract. Unit values for each investment option are available to all participants from the toll-free number. Please be sure to have your contract number available when you call.
(800) 458-6333
Investors should consider the contract and VCA-2’s investment objectives, risks, charges and expenses carefully before investing. This and other important information is contained in the prospectus that can be obtained from your financial professional. You should read the prospectus carefully before investing.
Annuity contracts contain exclusions, limitations, reductions of benefits, and terms for keeping them in force. Your plan sponsor or licensed financial professional can provide you with costs and complete details. Contract guarantees are based on the claims-paying ability of the issuing company.
Information regarding how the Account voted proxies relating to portfolio securities during the most recent 12-month period ended June 30 is available on the website of the Securities and Exchange Commission (Commission), at www.sec.gov.
The Account’s Statement of Additional Information contains additional information about the members of the Account’s Committee and is available without charge upon request by calling (800) 458-6333.
The Account will file with the Commission a complete listing of portfolio holdings as of its first and third quarter-end on Form N-PORT. Form N-PORT will be available on the Commission’s website at www.sec.gov or call (800) SEC-0330. Participants may obtain copies of Form N-PORT filings by calling (800) 458-6333.
The Prudential Insurance Company of America
751 Broad Street
Newark, NJ 07102-3714
Presorted
Standard
U.S. Postage
PAID
Prudential
©2021 Prudential Financial, Inc. and its related entities. PGIM Investments, the Prudential logo, the Rock symbol, and Bring Your Challenges are service marks of Prudential Financial, Inc. and its related entities, registered in many jurisdictions worldwide.
LT.RS.001
Item 2 – Code of Ethics — See Exhibit (a)
As of the end of the period covered by this report, the registrant has adopted a code of ethics (the “Section 406 Standards for Investment Companies – Ethical Standards for Principal Executive and Financial Officers”) that applies to the registrant’s Principal Executive Officer and Principal Financial Officer; the registrant’s Principal Financial Officer also serves as the Principal Accounting Officer.
The registrant hereby undertakes to provide any person, without charge, upon request, a copy of the code of ethics. To request a copy of the code of ethics, contact the registrant 800-225-1852, and ask for a copy of the Section 406 Standards for Investment Companies - Ethical Standards for Principal Executive and Financial Officers.
Item 3 – Audit Committee Financial Expert –
The registrant’s Board has determined that Ms. Grace C. Torres, member of the Board’s Audit Committee is an “audit committee financial expert,” and that she is “independent,” for purposes of this item.
Item 4 – Principal Accountant Fees and Services –
(a) Audit Fees
For the fiscal year ended December 31, 2020, the registrant’s principal accountant was PricewaterhouseCoopers LLP (“PwC”). For the fiscal year ended December 31, 2020, PwC billed the registrant $24,000 for professional services rendered for the audit of the registrant’s annual financial statements or services that are normally provided in connection with statutory and regulatory filings.
For the fiscal year ended December 31, 2019, the registrant’s principal accountant was KPMG LLP (“KPMG”). For the fiscal year ended December 31, 2019, KPMG billed the registrant $24,651 for professional services rendered for the audit of the registrant’s annual financial statements or services that are normally provided in connection with statutory and regulatory filings.
(b) Audit-Related Fees
For the fiscal year ended December 31, 2020, PwC did not bill the registrant for audit-related services.
For the fiscal year ended December 31, 2020, fees of $4,952 were billed to the registrant for services rendered by KPMG in connection with the auditor transition.
For the fiscal year ended December 31, 2019, KPMG did not bill the registrant for audit-related services.
(c) Tax Fees
For the fiscal years ended December 31, 2020 and December 31, 2019: none.
(d) All Other Fees
For the fiscal years ended December 31, 2020 and December 31, 2019: none.
(e) (1) Audit Committee Pre-Approval Policies and Procedures
THE PGIM MUTUAL FUNDS
AUDIT COMMITTEE POLICY
on
Pre-Approval of Services Provided by the Independent
Accountants
The Audit Committee of each PGIM Mutual Fund is charged with the responsibility to monitor the independence of the Fund’s independent accountants. As part of this responsibility, the Audit Committee must pre-approve the independent accounting firm’s engagement to render audit and/or permissible non-audit services, as required by law. In evaluating a proposed engagement of the independent accountants, the Audit Committee will assess the effect that the engagement might reasonably be expected to have on the accountant’s independence. The Committee’s evaluation will be based on:
| | • | | a review of the nature of the professional services expected to be provided, |
| | • | | a review of the safeguards put into place by the accounting firm to safeguard independence, and |
| | • | | periodic meetings with the accounting firm. |
Policy for Audit and Non-Audit Services Provided to the Funds
On an annual basis, the scope of audits for each Fund, audit fees and expenses, and audit-related and non-audit services (and fees proposed in respect thereof) proposed to be performed by the Fund’s independent accountants will be presented by the Treasurer and the independent accountants to the Audit Committee for review and, as appropriate, approval prior to the initiation of such services.
Such presentation shall be accompanied by confirmation by both the Treasurer and the independent accountants that the proposed
non-audit services will not adversely affect the independence of the independent accountants. Such proposed non-audit services shall be described in sufficient detail to enable the Audit Committee to assess the appropriateness of such services and fees, and the compatibility of the provision of such services with the auditor’s independence. The Committee shall receive periodic reports on the progress of the audit and other services which are approved by the Committee or by the Committee Chair pursuant to authority delegated in this Policy.
The categories of services enumerated under “Audit Services”, “Audit-related Services”, and “Tax Services” are intended to provide guidance to the Treasurer and the independent accountants as to those categories of services which the Committee believes are generally consistent with the independence of the independent accountants and which the Committee (or the Committee Chair) would expect upon the presentation of specific proposals to pre-approve. The enumerated categories are not intended as an exclusive list of audit, audit-related or tax services, which the Committee (or the Committee Chair) would consider for pre-approval.
Audit Services
The following categories of audit services are considered to be consistent with the role of the Fund’s independent accountants:
| | • | | Annual Fund financial statement audits |
| | • | | Seed audits (related to new product filings, as required) |
| | • | | SEC and regulatory filings and consents |
Audit-related Services
The following categories of audit-related services are considered to be consistent with the role of the Fund’s independent accountants:
| | • | | Accounting consultations |
| | • | | Fund merger support services |
| | • | | Agreed Upon Procedure Reports |
| | • | | Other Internal Control Reports |
Individual audit-related services that fall within one of these categories (except for fund merger support services) and are not presented to the Audit Committee as part of the annual pre-approval process are subject to an authorized pre-approval by the Audit Committee so long as the estimated fee for those services does not exceed $30,000. Any services provided under such pre-approval will be reported to the Audit Committee at its next regular meeting. Should the amount of such services exceed $30,000 any additional fees will be subject to pre-approval by the Committee Chair (or any other Committee member on whom this responsibility has been delegated). Fees related to fund merger support services are subject to a separate authorized pre-approval by the Audit Committee with fees determined on a per occurrence and merger complexity basis.
Tax Services
The following categories of tax services are considered to be consistent with the role of the Fund’s independent accountants:
| | • | | Tax compliance services related to the filing or amendment of the following: |
| | • | | Federal, state and local income tax compliance; and, |
| | • | | Sales and use tax compliance |
| | • | | Timely RIC qualification reviews |
| | • | | Tax distribution analysis and planning |
| | • | | Tax authority examination services |
| | • | | Tax appeals support services |
| | • | | Accounting methods studies |
| | • | | Fund merger support services |
| | • | | Tax consulting services and related projects |
Individual tax services that fall within one of these categories and are not presented to the Audit Committee as part of the annual pre-approval process are subject to an authorized pre-approval by the Audit Committee so long as the estimated fee for those services does not exceed $30,000. Any services provided under such pre-approval will be reported to the Audit Committee at its next regular meeting. Should the amount of such services exceed $30,000 any additional fees will be subject to pre-approval by the Committee Chair (or any other Committee member on whom this responsibility has been delegated).
Other Non-Audit Services
Certain non-audit services that the independent accountants are legally permitted to render will be subject to pre-approval by the Committee or by one or more Committee members to whom the Committee has delegated this authority and who will report to the full Committee any pre-approval decisions made pursuant to this Policy. Non-audit services presented for pre-approval pursuant to this paragraph will be accompanied by a confirmation from both the Treasurer and the independent accountants that the proposed services will not adversely affect the independence of the independent accountants.
Proscribed Services
The Fund’s independent accountants will not render services in the following categories of non-audit services:
| | • | | Bookkeeping or other services related to the accounting records or financial statements of the Fund |
| | • | | Financial information systems design and implementation |
| | • | | Appraisal or valuation services, fairness opinions, or contribution-in-kind reports |
| | • | | Internal audit outsourcing services |
| | • | | Management functions or human resources |
| | • | | Broker or dealer, investment adviser, or investment banking services |
| | • | | Legal services and expert services unrelated to the audit |
| | • | | Any other service that the Public Company Accounting Oversight Board determines, by regulation, is impermissible. |
Pre-approval of Non-Audit Services Provided to Other Entities Within the PGIM Fund Complex
Certain non-audit services provided to PGIM Investments LLC or any of its affiliates that also provide ongoing services to the PGIM Mutual Funds will be subject to pre-approval by the Audit Committee. The only non-audit services provided to these entities that will require pre-approval are those related directly to the operations and financial reporting of the Funds. Individual projects that are not presented to the Audit Committee as part of the annual pre-approval process will be subject to pre-approval by the Committee Chair (or any other Committee member on whom this responsibility has been delegated) so long as the estimated fee for those services does not exceed $30,000. Services presented for pre-approval pursuant to this paragraph will be accompanied by a confirmation from both the Treasurer and the independent accountants that the proposed services will not adversely affect the independence of the independent accountants.
Although the Audit Committee will not pre-approve all services provided to PGIM Investments LLC and its affiliates, the Committee will receive an annual report from the Fund’s independent accounting firm showing the aggregate fees for all services provided to PGIM Investments and its affiliates.
(e) (2) Percentage of services referred to in 4(b) – 4(d) that were approved by the audit committee –
For the fiscal years ended December 31, 2020 and December 31, 2019, 100% of the services referred to in Item 4(b) was approved by the audit committee.
(f) Percentage of hours expended attributable to work performed by other than full time employees of principal accountant if greater than 50%.
The percentage of hours expended on the principal accountant’s engagement to audit the registrant’s financial statements for the most recent fiscal year that were attributed to work performed by persons other than the principal accountant’s full-time, permanent employees was 0%.
(g) Non-Audit Fees
The aggregate non-audit fees billed by the registrant’s principal accountant for services rendered to the registrant’s investment adviser and any entity controlling, controlled by, or under common control with the investment adviser that provides ongoing services to the registrant for the fiscal years ended December 31, 2020 and December 31, 2019 was $0 and $0, respectively.
(h) Principal Accountant’s Independence
Not applicable as the registrant’s principal accountant has not provided non-audit services to the registrant’s investment adviser and any entity controlling, controlled by, or under common control with the investment adviser that provides ongoing services to the registrant that were not pre-approved pursuant to Rule 2-01(c)(7)(ii) of Regulation S-X.
Item 5 – Audit Committee of Listed Registrants – Not applicable.
Item 6 – Schedule of Investments – The schedule is included as part of the report to shareholders filed under Item 1 of this Form.
Item 7 – Disclosure of Proxy Voting Policies and Procedures for Closed-End Management Investment Companies – Not applicable.
Item 8 – Portfolio Managers of Closed-End Management Investment Companies – Not applicable.
Item 9 – Purchases of Equity Securities by Closed-End Management Investment Company and Affiliated Purchasers – Not applicable.
Item 10 – Submission of Matters to a Vote of Security Holders – There have been no material changes to these procedures.
Item 11 – Controls and Procedures
| | (a) | It is the conclusion of the registrant’s principal executive officer and principal financial officer that the effectiveness of the registrant’s current disclosure controls and procedures (such disclosure controls and procedures having been evaluated within 90 days of the date of this filing) provide reasonable assurance that the information required to be disclosed by the registrant has been recorded, processed, summarized and reported within the time period specified in the Commission’s rules and forms and that the information required to be disclosed by the registrant has been accumulated and communicated to the registrant’s principal executive officer and principal financial officer in order to allow timely decisions regarding required disclosure. |
| | (b) | There has been no significant change in the registrant’s internal control over financial reporting that occurred during the registrant’s most recent fiscal quarter of the period covered by this report that has materially affected, or is likely to materially affect, the registrant’s internal control over financial reporting. |
Item 12 – Controls and Procedures - Disclosure of Securities Lending Activities for Closed-End Management Investment Companies – Not applicable.
Item 13 – Exhibits
(2) Certifications pursuant to Section 302 of the Sarbanes-Oxley Act – Attached hereto as Exhibit EX-99.CERT.
(3) Any written solicitation to purchase securities under Rule 23c-1 – Not applicable.
SIGNATURES
Pursuant to the requirements of the Securities Exchange Act of 1934 and the Investment Company Act of 1940, the registrant has duly caused this report to be signed on its behalf by the undersigned, thereunto duly authorized.
Registrant: The Prudential Variable Contract Account-2
| | |
By: | | /s/ Andrew R. French |
| | Andrew R. French Secretary |
| |
| Date: | | February 24, 2021 |
Pursuant to the requirements of the Securities Exchange Act of 1934 and the Investment Company Act of 1940, this report has been signed below by the following persons on behalf of the registrant and in the capacities and on the dates indicated.
| | |
| By: | | /s/ Stuart S. Parker |
| | Stuart S. Parker President and Principal Executive Officer |
| |
| Date: | | February 24, 2021 |
| |
By: | | /s/ Christian J. Kelly |
| | Christian J. Kelly Treasurer and Principal Financial and Accounting Officer |
| |
Date: | | February 24, 2021 |