UNITED STATES
SECURITIES AND EXCHANGE COMMISSION
Washington, D.C. 20549
FORM N-CSR
CERTIFIED SHAREHOLDER REPORT OF REGISTERED MANAGEMENT
INVESTMENT COMPANIES
| | |
| Investment Company Act file number: | | 811-01612 |
| |
| Exact name of registrant as specified in charter: | | The Prudential Variable Contract Account-2 |
| |
| Address of principal executive offices: | | 655 Broad Street, 17th Floor |
| | Newark, New Jersey 07102 |
| |
| Name and address of agent for service: | | Deborah A. Docs |
| | 655 Broad Street, 17th Floor |
| | Newark, New Jersey 07102 |
| |
| Registrant’s telephone number, including area code: | | 973-367-7521 |
| |
| Date of fiscal year end: | | 12/31/2017 |
| |
| Date of reporting period: | | 12/31/2017 |
Item 1 – Reports to Stockholders
The Prudential Variable Contract Account-2
| | |
| ANNUAL REPORT | | December 31, 2017 |

This report is for the information of persons participating in The Prudential Variable Contract Account-2 (VCA-2, or the “Account”). VCA-2 is a group annuity insurance product issued by The Prudential Insurance Company of America, 751 Broad Street, Newark, NJ 07102-3777, and is distributed by Prudential Investment Management Services LLC (PIMS), member SIPC, 655 Broad Street, 19th Floor, Newark, NJ 07102. Both are Prudential Financial companies.
All are Prudential Financial companies and each is solely responsible for its financial condition and contractual obligations.
The views expressed in this report and information about the Account’s portfolio holdings are for the period covered by this report and are subject to change thereafter.
Please note that this document may include prospectus supplements that are separate from and not a part of this report.

Investors should consider the contract and VCA-2’s investment objectives, risks, charges and expenses carefully before investing. This and other important information is contained in the prospectus that can be obtained from your financial professional. You should read the prospectus carefully before investing.
Annuity contracts contain exclusions, limitations, reductions of benefits, and terms for keeping them in force. Your plan sponsor or licensed financial professional can provide you with costs and complete details. Contract guarantees are based on the claims-paying ability of the issuing company.
A description of the Account’s proxy voting policies and procedures is available, without charge, upon request. Owners of variable annuity contracts should call (800) 458-6333 to obtain descriptions of the Account’s proxy voting policies and procedures. Information regarding how the Account voted proxies relating to portfolio securities during the most recent 12-month period ended June 30 is available on the website of the Securities and Exchange Commission (Commission), at www.sec.gov.
The Account’s Statement of Additional Information contains additional information about the members of the Account’s Committee and is available without charge upon request by calling (800) 458-6333.
The Account files with the Commission a complete listing of portfolio holdings as of its first and third quarter-end on Form N-Q. Form N-Q is available on the Commission’s website at www.sec.gov or by visiting the Commission’s Public Reference Room. For more information on the Commission’s Public Reference Room, please visit the Commission’s website or call (800) SEC-0330. Participants may obtain copies of Form N-Q filings by calling (800) 458-6333.
| | | | |
The Prudential Variable Contract Account-2 Table of Contents | | Annual Report | | December 31, 2017 |
| ∎ | | REPORT OF THE INVESTMENT MANAGER |
| ∎ | | PRESENTATION OF PORTFOLIO HOLDINGS |
| | | | |
| Section A | | Statement of Net Assets and Other Financial Statements | | |
| Section B | | Financial Highlights | | |
| Section C | | Notes to Financial Statements | | |
| Section D | | Report of Independent Registered Public Accounting Firm | | |
| Section E | | Information about Committee Members and Officers | | |
| | |
The Prudential Variable Contract Account-2 Letter to Participants | | December 31, 2017 |
At Prudential, our primary objective is to help investors achieve and maintain long-term financial success. This Variable Contract Account-2 annual report outlines our efforts to achieve this goal. We hope you find it informative and useful.
Prudential has been building on a heritage of success for more than 135 years. We believe the array of our products provides a highly attractive value proposition to clients like you who are focused on financial security.
Your financial professional is the best resource to help you make the most informed investment decisions. Together, you can build a diversified investment portfolio that aligns with your long-term financial goals. Please keep in mind that diversification and asset allocation strategies do not assure a profit or protect against loss in declining markets.
Thank you for selecting Prudential as one of your financial partners. We value your trust and appreciate the opportunity to help you achieve financial security.
Sincerely,

Stuart Parker
President,
The Prudential Variable Contract Account-2 | January 31, 2018 |
| | | | |
| Market Overview — unaudited | | Annual Report | | December 31, 2017 |
Equity Market Overview
Stocks markets around the world rallied in 2017 bolstered by reports of accelerating global economic growth. Equities in emerging markets posted the best returns. In the United States, the S&P 500® Index rose 21.82% and generated positive returns every month of the period.
Market and economic highlights
U.S. stocks performed well in the first quarter driven by investors’ hopes for tax cuts, a rise in consumer spending and corporate profits, and regulatory reforms. Positive economic news abroad also increased appetite for equities. In March, the Federal Reserve raised its target for the short-term federal funds rate by 0.25%, and would proceed to do so again in June and December. Central banks in several other countries scaled back their quantitative-easing efforts.
Second-quarter corporate profits were strong. In August, stocks retreated in reaction to mounting tensions between the U.S. and North Korea, but the pullback was short-lived. During the fourth quarter, stocks advanced again on positive corporate earnings, and in anticipation of tax reform. Corporate earnings rose at double-digit levels in Europe and Japan in the third quarter.
In late December, President Donald J. Trump signed the Tax Cuts and Jobs Act into law, reducing the corporate tax rate from 35% to 21% (effective 2018).
Following a sluggish first quarter, Gross Domestic Product (GDP) growth rose above 3% in the second and third quarters, yet inflation remained tame. The unemployment rate fell to 4.1% — its lowest level since 2000, and investment by businesses picked up. Unemployment also dropped in many other nations including Germany, the United Kingdom, and Japan. The U.S. dollar closed the year sharply lower against other major currencies.
Information technology stocks soar
For the 12 months, nine of the S&P 500’s 11 sectors turned in double-digit returns, and only two ended in negative territory. Information technology led with a return of 38.83%. Demand for cyclical stocks was strong. The materials sector was the second-best performer, rising 23.84%, followed by consumer discretionary, up 22.98%. Next in line was the financial sector, which gained 22.18%. Rising interest rates, which increase lenders’ profit margins; solid earnings, and a loosening of regulations boosted demand for this group. Investors snapped up health care stocks, which rose 22.08% in anticipation of health care reform. The industrials and consumer staples sectors followed, returning 21.03% and 13.49%, respectively.
Despite their favorable dividends, the defensive utilities and real estate sectors lagged but returned an impressive 12.11% and 10.85%, respectively. Telecommunications stocks, facing competitive pressures from cable companies, ended down 1.25%. Energy stocks finished down 1.01%. Their prices fell sharply during the first half of the year as oil prices tumbled, although both the sector and oil prices rebounded later in the year.
Growth and large-cap stocks outperform in Russell Indexes
The Russell US indexes, which measure equity performance with respect to stock-specific styles (value and growth) and capitalization levels (small-, mid-, and large-cap), ended 2017 higher. For the year, the Russell 1000 Growth Index returned 30.21%, more than doubling the Russell 1000 Value Index’s 13.66% return. Growth outperformed due in part to huge gains of large-cap tech stocks. By contrast, the energy sector detracted from value stocks’ performance. Large-cap equities, as measured by the Russell 1000® Index, gained 21.69%. The sector was bolstered by a pickup in economic activity abroad, U.S. dollar weakness, and rising short-term rates The Russell Midcap® Index returned 18.52%. Small-caps, as measured by the Russell 2000® Index, returned 14.65%.
Emerging markets lead international markets
Equities trading in emerging markets, particularly technology and financial issues, soared on reports of improving earnings and fundamentals. The MSCI Emerging Markets Index, net of dividends, rose 37.28% in U.S. dollars and 30.55% in local-currency terms. In U.S. dollars, Far East and Asian stocks rallied 43.53% and 42.83%, respectively. The Brazil, Russia, India, and China (BRIC) group advanced 41.75%, EMEA returned 24.54%. Latin America rose 23.74%, and Europe returned 20.54%.
On a country basis, Poland led with a return of 54.72%. China followed posting a return of 54.07%, and South Korea advanced 47.30%. Conversely, Pakistan, in contrast to its stellar performance in 2016, finished down 24.44%. Qatar dropped 11.51%.
The MSCI-EAFE Index, which measures the performance of developed markets excluding the United States and Canada, returned (net of dividends) 25.03% in U.S dollars and 15.23% in local-currency terms. In U.S. dollars, the best-performing markets were Austria, which returned 58.31%; Hong Kong, which rose 36.17%, and Denmark, which advanced 34.69%.
In the Pacific region, Singapore followed Hong Kong with a gain of 35.57%. Japan rose 23.99% driven by reports of explosive corporate earnings, increased trade, and monetary stimulus. Eurozone equities benefitted from a rise in consumer confidence and diminishing political uncertainty. “Heavy weights” in this group that performed well included France, which rose 28.75%; Italy, which advanced 28.43%; Germany, which returned 27.70%; and the United Kingdom, which gained 22.30%. Israel bucked the trend, returning merely 2.06%.
| | |
The Prudential Variable Contract Account-2 | | December 31, 2017 |
Report of the Investment Manager - As of December 31, 2017 (Unaudited)
| | | | | | | | | | | | |
| Average Annual Total Returns | | 1-Year | | | 5-Years | | | 10-Years | |
Accumulation Account (without sales charges) | | | 22.95 | % | | | 13.65 | % | | | 6.44 | % |
S&P 500 Index | | | 21.82 | | | | 15.78 | | | | 8.49 | |
Past performance does not guarantee future returns. The Account performance without sales charges is shown after the deduction of all expenses, including investment management and mortality and expense charges, but does not include the effect of any sales charge or annual account charge. The returns would be lower if they included the effects of sales charges and an annual account charge.
$10,000 INVESTED OVER 10 YEARS
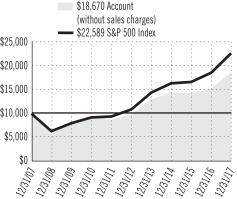
For the year ended December 31, 2017, the Prudential Variable Contract Account-2 returned 22.95%.
The net assets of the Account at December 31, 2017 were $241.1 million.
The Account’s investment objective is long-term growth of capital. It is subadvised by Jennison Associates LLC.
What were market conditions during the reporting period?
Equity markets posted a solid finish to a strong 2017. Gains were broad, but particularly notable among companies with above-average earnings growth. US GDP expansion accelerated, surpassing 3% for the second quarter in a row, and most leading economic indicators and sentiment gauges reflected expectations for economic activity to continue to strengthen. Short-term interest rates continued to push higher after the Fed raised interest rates three times. Longer-term US yields rallied, leaving the Treasury yield curve at its flattest level in more than a decade. US dollar weakness continued as global growth expanded and accelerated.
Major tax legislation was the most significant win for the Trump administration’s inaugural year. The tax package includes a substantial reduction in the tax rate paid by corporations on domestically earned income. Abroad, Europe’s economic recovery continued, and emerging markets posted the best annual performance since the aftermath of the financial crisis.
What strategies or holdings affected the Account’s performance?
The S&P 500 (the Index) returned 21.82% in 2017, led by information technology, materials, consumer discretionary, and financials. Telecom services and energy were the only negative sectors, both declining less than 2.0%. While value names performed well, growth names outperformed value.
The Account outperformed the Index. Positions in information technology were the primary drivers of overall return, specifically within the Internet software and services industry and software providers. Positions in consumer discretionary, industrials, and financials also positively contributed as the Fed raised interest rates.
Notable holdings were Alibaba, one of the world’s largest e-commerce companies, where the company reported September-quarter financial results that beat consensus expectations on most key metrics. Tencent, China’s largest and most visited Internet service portal, continues to perform well, its fundamentals driven by a dominant position in China’s online gaming and instant messaging markets, and growing advertising and payment service efforts. Among the industrials sector, Boeing Company, the world’s largest aerospace firm, performed well following a renewed focus on free cash flow (FCF) and capital returns (increasing dividends and returning 100% of FCF to shareholders). The company appears to be exceeding FCF expectations despite some pricing pressures and declining 777 aircraft production.
The Account’s allocations to the energy sector detracted from both relative and absolute performance as oil prices fell during the first half of 2017, hitting a one-year low before rebounding over 40% in the second half. Oil and gas exploration and production (E&P) company Hess detracted from the Account’s overall performance. The management team initially favored Hess after its two-year restructuring, believing that its balance sheet would allow it to develop its interests in offshore Guyana, possibly the premier oil discovery for some time to come. The development could provide upwardly revised volume guidance and deliver meaningful cash flow to the bottom line. However, despite oil prices rebounding, E&P names lagged commodity performance and did not participate in the upside as was expected. The position was eliminated in order to reduce overall energy sector allocation and to deploy capital in more favorable areas.
Shares of General Electric (GE) underperformed as the multi-industry company exited its GE Capital business as part of efforts to simplify the company’s business model. Former CEO Immelt lost credibility with overly aggressive targets, weak free cash flow, and poorly timed mergers and acquisition. New CEO John Flannery focused on cost reductions, improved cash flow, and shaping the product portfolio. The stock subsequently lagged in anticipation of the impact of these changes on EPS and cash flow. The Account no longer holds the position.
Consumer discretionary company Newell Brands underperformed. The company lowered its fiscal year 2017 earnings guidance following resin supply disruptions following Hurricane Harvey in August. Supply of a specific type of resin used in the company’s food saver and consumer and commercial Rubbermaid products comes from the affected area, and it is anticipated that resin prices will rise and supply will be curtailed. However, in the management team’s opinion, cost reduction initiatives and the recently completed acquisition of Jarden should generate over $1 billion of savings and could help fuel a solid earnings growth profile over the coming years.
For a complete list of holdings, refer to the Statement of Net Assets section of this report.
1
| | |
The Prudential Variable Contract Account-2 Benchmark Glossary — unaudited | | December 31, 2017 |
The indexes are unmanaged and include reinvestment of any income or distributions. They do not reflect any fees, expenses or sales charges. Investors cannot invest directly in a market index.
S&P 500 Index is an unmanaged, market value-weighted index of over 500 stocks generally representative of the broad stock market.
| | |
The Prudential Variable Contract Account-2 (VCA-2) Presentation of Portfolio Holdings — unaudited | | December 31, 2017 |
| | | | |
| VCA-2 | |
| Five Largest Holdings | | | (% of Net Assets | ) |
| JPMorgan Chase & Co. | | | 3.6% | |
| Boeing Co. (The) | | | 3.1% | |
| Apple, Inc. | | | 2.9% | |
| Goldman Sachs Group, Inc. (The) | | | 2.8% | |
| Microsoft Corp. | | | 2.7% | |
For a complete listing of holdings, refer to the Statement of Net Assets section of this report. Holdings reflect only long-term investments. Holdings/Issues/Industries/Sectors are subject to change.
FINANCIAL STATEMENTS OF VCA-2
December 31, 2017
| | | | | | | | |
| LONG-TERM INVESTMENTS — 99.0% | |
| COMMON STOCKS | | Shares
| | | Value
| |
Aerospace & Defense — 4.3% | | | | | | | | |
Boeing Co. (The) | | | 25,652 | | | $ | 7,565,031 | |
United Technologies Corp. | | | 22,886 | | | | 2,919,567 | |
| | | | | | |
|
|
|
| | | | | | | | 10,484,598 | |
| | | | | | |
|
|
|
Air Freight & Logistics — 0.9% | | | | | | | | |
Fedex Corp. | | | 8,943 | | | | 2,231,636 | |
| | | | | | |
|
|
|
Banks — 11.6% | | | | | | | | |
Bank of America Corp. | | | 196,482 | | | | 5,800,149 | |
BB&T Corp. | | | 64,082 | | | | 3,186,157 | |
Citigroup, Inc. | | | 58,141 | | | | 4,326,272 | |
JPMorgan Chase & Co. | | | 80,534 | | | | 8,612,306 | |
PNC Financial Services Group, Inc. (The) | | | 25,630 | | | | 3,698,153 | |
Wells Fargo & Co. | | | 39,097 | | | | 2,372,015 | |
| | | | | | |
|
|
|
| | | | | | | | 27,995,052 | |
| | | | | | |
|
|
|
Biotechnology — 1.3% | | | | | | | | |
Shire PLC, ADR | | | 11,826 | | | | 1,834,449 | |
Vertex Pharmaceuticals, Inc.* | | | 8,347 | | | | 1,250,881 | |
| | | | | | |
|
|
|
| | | | | | | | 3,085,330 | |
| | | | | | |
|
|
|
Building Products — 0.7% | | | | | | | | |
Johnson Controls International PLC | | | 44,646 | | | | 1,701,459 | |
| | | | | | |
|
|
|
Capital Markets — 2.8% | | | | | | | | |
Goldman Sachs Group, Inc. (The) | | | 26,774 | | | | 6,820,944 | |
| | | | | | |
|
|
|
Chemicals — 2.2% | | | | | | | | |
DowDuPont, Inc. | | | 37,743 | | | | 2,688,056 | |
FMC Corp. | | | 27,270 | | | | 2,581,378 | |
| | | | | | |
|
|
|
| | | | | | | | 5,269,434 | |
| | | | | | |
|
|
|
Communications Equipment — 1.1% | | | | | | | | |
Cisco Systems, Inc. | | | 70,571 | | | | 2,702,869 | |
| | | | | | |
|
|
|
Consumer Finance — 2.5% | | | | | | | | |
Capital One Financial Corp. | | | 34,781 | | | | 3,463,492 | |
SLM Corp.* | | | 225,002 | | | | 2,542,523 | |
| | | | | | |
|
|
|
| | | | | | | | 6,006,015 | |
| | | | | | |
|
|
|
Containers & Packaging — 0.9% | | | | | | | | |
Sealed Air Corp. | | | 44,023 | | | | 2,170,334 | |
| | | | | | |
|
|
|
Electric Utilities — 2.3% | | | | | | | | |
American Electric Power Co., Inc. | | | 31,886 | | | | 2,345,853 | |
Exelon Corp. | | | 79,998 | | | | 3,152,721 | |
| | | | | | |
|
|
|
| | | | | | | | 5,498,574 | |
| | | | | | |
|
|
|
Electrical Equipment — 1.0% | | | | | | | | |
Eaton Corp. PLC | | | 30,804 | | | | 2,433,824 | |
| | | | | | |
|
|
|
Electronic Equipment, Instruments & Components — 1.1% | |
Flex Ltd.* | | | 147,578 | | | | 2,654,928 | |
| | | | | | |
|
|
|
Energy Equipment & Services — 1.2% | | | | | | | | |
Halliburton Co. | | | 59,687 | | | | 2,916,904 | |
| | | | | | |
|
|
|
Equity Real Estate Investment Trust (REITs) — 1.1% | |
American Tower Corp. | | | 17,896 | | | | 2,553,222 | |
| | | | | | |
|
|
|
| | | | | | | | |
COMMON STOCKS
(continued) | | Shares
| | | Value
| |
Food & Staples Retailing — 2.6% | | | | | | | | |
Costco Wholesale Corp. | | | 15,355 | | | $ | 2,857,873 | |
Wal-Mart Stores, Inc. | | | 34,030 | | | | 3,360,463 | |
| | | | | | |
|
|
|
| | | | | | | | 6,218,336 | |
| | | | | | |
|
|
|
Food Products — 1.8% | | | | | | | | |
Conagra Brands, Inc. | | | 69,041 | | | | 2,600,774 | |
Mondelez International, Inc. (Class A Stock) | | | 39,580 | | | | 1,694,024 | |
| | | | | | |
|
|
|
| | | | | | | | 4,294,798 | |
| | | | | | |
|
|
|
Health Care Equipment & Supplies — 1.1% | |
Zimmer Biomet Holdings, Inc. | | | 21,520 | | | | 2,596,818 | |
| | | | | | |
|
|
|
Health Care Providers & Services — 3.2% | |
Cigna Corp. | | | 11,990 | | | | 2,435,049 | |
Laboratory Corp. of America Holdings* | | | 15,359 | | | | 2,449,914 | |
UnitedHealth Group, Inc. | | | 12,580 | | | | 2,773,387 | |
| | | | | | |
|
|
|
| | | | | | | | 7,658,350 | |
| | | | | | |
|
|
|
Hotels, Restaurants & Leisure — 4.1% | | | | | | | | |
Carnival Corp. | | | 26,624 | | | | 1,767,035 | |
Hyatt Hotels Corp. (Class A Stock)* | | | 41,073 | | | | 3,020,508 | |
Marriott International, Inc. (Class A Stock) | | | 23,015 | | | | 3,123,826 | |
McDonald's Corp. | | | 11,805 | | | | 2,031,877 | |
| | | | | | |
|
|
|
| | | | | | | | 9,943,246 | |
| | | | | | |
|
|
|
Household Durables — 0.5% | | | | | | | | |
Newell Brands, Inc. | | | 40,598 | | | | 1,254,478 | |
| | | | | | |
|
|
|
Household Products — 1.6% | | | | | | | | |
Procter & Gamble Co. (The) | | | 43,011 | | | | 3,951,851 | |
| | | | | | |
|
|
|
Insurance — 3.1% | | | | | | | | |
Brighthouse Financial, Inc.* | | | 20,159 | | | | 1,182,124 | |
Chubb Ltd. (Switzerland) | | | 23,938 | | | | 3,498,060 | |
MetLife, Inc. | | | 53,934 | | | | 2,726,903 | |
| | | | | | |
|
|
|
| | | | | | | | 7,407,087 | |
| | | | | | |
|
|
|
Internet & Direct Marketing Retail — 2.5% | |
Amazon.com, Inc.* | | | 2,906 | | | | 3,398,480 | |
Netflix, Inc.* | | | 13,590 | | | | 2,608,736 | |
| | | | | | |
|
|
|
| | | | | | | | 6,007,216 | |
| | | | | | |
|
|
|
Internet Software & Services — 7.1% | | | | | | | | |
Alibaba Group Holding Ltd. (China), ADR* | | | 21,428 | | | | 3,694,830 | |
Alphabet, Inc. (Class A Stock)* | | | 5,424 | | | | 5,713,642 | |
eBay, Inc.* | | | 41,301 | | | | 1,558,700 | |
Facebook, Inc. (Class A Stock)* | | | 19,978 | | | | 3,525,318 | |
Tencent Holdings Ltd. (China), ADR | | | 50,931 | | | | 2,644,338 | |
| | | | | | |
|
|
|
| | | | | | | | 17,136,828 | |
| | | | | | |
|
|
|
IT Services — 3.7% | | | | | | | | |
DXC Technology Co. | | | 20,605 | | | | 1,955,415 | |
PayPal Holdings, Inc.* | | | 46,741 | | | | 3,441,072 | |
Visa, Inc. (Class A Stock) | | | 31,075 | | | | 3,543,172 | |
| | | | | | |
|
|
|
| | | | | | | | 8,939,659 | |
| | | | | | |
|
|
|
SEE NOTES TO FINANCIAL STATEMENTS.
A1
FINANCIAL STATEMENTS OF VCA-2
December 31, 2017
| | | | | | | | |
COMMON STOCKS
(continued) | | Shares
| | | Value
| |
Media — 2.9% | | | | | | | | |
Comcast Corp. (Class A Stock) | | | 78,993 | | | $ | 3,163,670 | |
Liberty Global PLC (United Kingdom) (Class C Stock)* | | | 56,292 | | | | 1,904,921 | |
Twenty-First Century Fox, Inc. (Class A Stock) | | | 58,578 | | | | 2,022,698 | |
| | | | | | |
|
|
|
| | | | | | | | 7,091,289 | |
| | | | | | |
|
|
|
Oil, Gas & Consumable Fuels — 5.9% | | | | | | | | |
Anadarko Petroleum Corp. | | | 24,012 | | | | 1,288,004 | |
Chevron Corp. | | | 34,224 | | | | 4,284,503 | |
Noble Energy, Inc. | | | 43,264 | | | | 1,260,713 | |
Royal Dutch Shell PLC (Netherlands) (Class A Stock), ADR | | | 69,798 | | | | 4,656,219 | |
Suncor Energy, Inc. (Canada) | | | 72,580 | | | | 2,665,138 | |
| | | | | | |
|
|
|
| | | | | | | | 14,154,577 | |
| | | | | | |
|
|
|
Pharmaceuticals — 5.7% | | | | | | | | |
Allergan PLC | | | 12,580 | | | | 2,057,836 | |
Bristol-Myers Squibb Co. | | | 52,866 | | | | 3,239,628 | |
Eli Lilly & Co. | | | 28,509 | | | | 2,407,870 | |
Merck & Co., Inc. | | | 39,281 | | | | 2,210,342 | |
Pfizer, Inc. | | | 101,984 | | | | 3,693,860 | |
| | | | | | |
|
|
|
| | | | | | | | 13,609,536 | |
| | | | | | |
|
|
|
Road & Rail — 1.3% | | | | | | | | |
Union Pacific Corp. | | | 22,761 | | | | 3,052,250 | |
| | | | | | |
|
|
|
Semiconductors & Semiconductor Equipment — 3.8% | |
Broadcom Ltd. | | | 12,911 | | | | 3,316,836 | |
Texas Instruments, Inc. | | | 56,056 | | | | 5,854,489 | |
| | | | | | |
|
|
|
| | | | | | | | 9,171,325 | |
| | | | | | |
|
|
|
Software — 6.9% | | | | | | | | |
Adobe Systems, Inc.* | | | 21,167 | | | | 3,709,305 | |
Microsoft Corp. | | | 77,021 | | | | 6,588,376 | |
PTC, Inc.* | | | 39,464 | | | | 2,398,227 | |
salesforce.com, Inc.* | | | 39,251 | | | | 4,012,630 | |
| | | | | | |
|
|
|
| | | | | | | | 16,708,538 | |
| | | | | | |
|
|
|
Specialty Retail — 1.2% | | | | | | | | |
Home Depot, Inc. | | | 15,146 | | | | 2,870,621 | |
| | | | | | |
|
|
|
Technology Hardware, Storage & Peripherals — 2.9% | |
Apple, Inc. | | | 41,573 | | | | 7,035,399 | |
| | | | | | |
|
|
|
Textiles, Apparel & Luxury Goods — 0.9% | |
Tapestry, Inc. | | | 51,441 | | | | 2,275,235 | |
| | | | | | |
|
|
|
Wireless Telecommunication Services — 1.2% | |
Vodafone Group PLC (United Kingdom), ADR | | | 90,778 | | | | 2,895,818 | |
| | | | | | |
|
|
|
TOTAL COMMON STOCKS
(cost $161,022,496) | | | | 238,798,378 | |
| | | | | | |
|
|
|
| | | | | | | | |
SHORT-TERM
INVESTMENT —1.1% | | Shares
| | | Value
| |
AFFILIATED MUTUAL FUND | | | | | | | | |
Prudential Investment Portfolios 2 — Prudential Core Ultra Short Bond Fund (cost $2,554,392)(a) | | | 2,554,392 | | | $ | 2,554,392 | |
| | | | | | |
|
|
|
TOTAL INVESTMENTS — 100.1%
(cost $163,576,888) | | | | 241,352,770 | |
| | | | | | |
|
|
|
LIABILITIES IN EXCESS OF OTHER ASSETS — (0.1)% | |
Dividends Receivable | | | | 176,173 | |
Tax Reclaim Receivable | | | | 18,418 | |
Payable Pending Capital Transactions | | | | (143,174 | ) |
Payable for Securities Purchased | | | | (300,135 | ) |
| | | | | | |
|
|
|
LIABILITIES IN EXCESS OF OTHER ASSETS | | | | (248,718 | ) |
| | | | | | |
|
|
|
NET ASSETS — 100% | | | $ | 241,104,052 | |
| | | | | | |
|
|
|
NET ASSETS, representing: | | | | | | | | |
Equity of Participants —
3,000,182 Accumulation Units at an Accumulation Unit Value of $78.3200 | | | $ | 234,974,329 | |
Equity of Annuitants | | | | 5,058,841 | |
Equity of The Prudential Insurance Company of America | | | | 1,070,882 | |
| | | | | | |
|
|
|
| | | | | | | $ | 241,104,052 | |
| | | | | | |
|
|
|
The following abbreviations is used in the annual report:
| | |
| ADR | | American Depositary Receipt |
| * | Non-income producing security. |
| (a) | PGIM Investments LLC, the manager of the Account, also serves as manager of the Prudential Investment Portfolios 2 — Prudential Core Ultra Short Bond Fund. |
SEE NOTES TO FINANCIAL STATEMENTS.
A2
FINANCIAL STATEMENTS OF VCA-2
December 31, 2017
Fair Value Measurements:
Various inputs are used in determining the value of the Account's investments. These inputs are summarized in the three broad levels listed below.
| Level 1—unadjusted | quoted prices generally in active markets for identical securities. |
| Level 2—quoted | prices for similar securities, interest rates and yield curves, prepayment speeds, foreign currency exchange rates, and other observable inputs. |
| Level 3—unobservable | inputs for securities valued in accordance with the Account's Committee approved fair valuation procedures. |
The following is a summary of the inputs used as of December 31, 2017 in valuing such portfolio securities:
| | | | | | | | | | | | |
| | | Level 1
| | | Level 2
| | | Level 3
| |
Investments in Securities | | | | | | | | | | | | |
Common Stocks | | | | | | | | | | | | |
Aerospace & Defense | | $ | 10,484,598 | | | $ | — | | | $ | — | |
Affiliated Mutual Fund | | | 2,554,392 | | | | — | | | | — | |
Air Freight & Logistics | | | 2,231,636 | | | | — | | | | — | |
Banks | | | 27,995,052 | | | | — | | | | — | |
Biotechnology | | | 3,085,330 | | | | — | | | | — | |
Building Products | | | 1,701,459 | | | | — | | | | — | |
Capital Markets | | | 6,820,944 | | | | — | | | | — | |
Chemicals | | | 5,269,434 | | | | — | | | | — | |
Communications Equipment | | | 2,702,869 | | | | — | | | | — | |
Consumer Finance | | | 6,006,015 | | | | — | | | | — | |
Containers & Packaging | | | 2,170,334 | | | | — | | | | — | |
Electric Utilities | | | 5,498,574 | | | | — | | | | — | |
Electrical Equipment | | | 2,433,824 | | | | — | | | | — | |
Electronic Equipment, Instruments & Components | | | 2,654,928 | | | | — | | | | — | |
Energy Equipment & Services | | | 2,916,904 | | | | — | | | | — | |
Equity Real Estate Investment Trust (REITs) | | | 2,553,222 | | | | — | | | | — | |
Food & Staples Retailing | | | 6,218,336 | | | | — | | | | — | |
Food Products | | | 4,294,798 | | | | — | | | | — | |
Health Care Equipment & Supplies | | | 2,596,818 | | | | — | | | | — | |
Health Care Providers & Services | | | 7,658,350 | | | | — | | | | — | |
Hotels, Restaurants & Leisure | | | 9,943,246 | | | | — | | | | — | |
Household Durables | | | 1,254,478 | | | | — | | | | — | |
Household Products | | | 3,951,851 | | | | — | | | | — | |
Insurance | | | 7,407,087 | | | | — | | | | — | |
Internet & Direct Marketing Retail | | | 6,007,216 | | | | — | | | | — | |
Internet Software & Services | | | 17,136,828 | | | | — | | | | — | |
IT Services | | | 8,939,659 | | | | — | | | | — | |
Media | | | 7,091,289 | | | | — | | | | — | |
Oil, Gas & Consumable Fuels | | | 14,154,577 | | | | — | | | | — | |
Pharmaceuticals | | | 13,609,536 | | | | — | | | | — | |
Road & Rail | | | 3,052,250 | | | | — | | | | — | |
Semiconductors & Semiconductor Equipment | | | 9,171,325 | | | | — | | | | — | |
Software | | | 16,708,538 | | | | — | | | | — | |
Specialty Retail | | | 2,870,621 | | | | — | | | | — | |
Technology Hardware, Storage & Peripherals | | | 7,035,399 | | | | — | | | | — | |
Textiles, Apparel & Luxury Goods | | | 2,275,235 | | | | — | | | | — | |
Wireless Telecommunications Services | | | 2,895,818 | | | | — | | | | — | |
| | |
|
|
| |
|
|
| |
|
|
|
Total | | $ | 241,352,770 | | | $ | — | | | $ | — | |
| | |
|
|
| |
|
|
| |
|
|
|
During the period, there were no transfers between Level 1, Level 2 and Level 3 to report
SEE NOTES TO FINANCIAL STATEMENTS.
A3
FINANCIAL STATEMENTS OF VCA-2
December 31, 2017
Industry Classification:
The industry classification of investments and liabilities in excess of other assets shown as a percentage of net assets as of December 31, 2017 were as follows (unaudited):
| | | | |
Banks | | | 11.6 | % |
Internet Software & Services | | | 7.1 | |
Software | | | 6.9 | |
Oil, Gas & Consumable Fuels | | | 5.9 | |
Pharmaceuticals | | | 5.7 | |
Aerospace & Defense | | | 4.3 | |
Hotels, Restaurants & Leisure | | | 4.1 | |
Semiconductors & Semiconductor Equipment | | | 3.8 | |
IT Services | | | 3.7 | |
Health Care Providers & Services | | | 3.2 | |
Insurance | | | 3.1 | |
Media | | | 2.9 | |
Technology Hardware, Storage & Peripherals | | | 2.9 | |
Capital Markets | | | 2.8 | |
Food & Staples Retailing | | | 2.6 | |
Consumer Finance | | | 2.5 | |
Internet & Direct Marketing Retail | | | 2.5 | |
Electric Utilities | | | 2.3 | |
Chemicals | | | 2.2 | |
Food Products | | | 1.8 | |
Household Products | | | 1.6 | |
| | | | |
Biotechnology | | | 1.3 | % |
Road & Rail | | | 1.3 | |
Energy Equipment & Services | | | 1.2 | |
Specialty Retail | | | 1.2 | |
Wireless Telecommunications Services | | | 1.2 | |
Affiliated Mutual Fund | | | 1.1 | |
Communications Equipment | | | 1.1 | |
Electronic Equipment, Instruments & Components | | | 1.1 | |
Equity Real Estate Investment Trust (REITs) | | | 1.1 | |
Health Care Equipment & Supplies | | | 1.1 | |
Electrical Equipment | | | 1.0 | |
Air Freight & Logistics | | | 0.9 | |
Containers & Packaging | | | 0.9 | |
Textiles, Apparel & Luxury Goods | | | 0.9 | |
Building Products | | | 0.7 | |
Household Durables | | | 0.5 | |
| | |
|
|
|
| | | | 100.1 | |
Liabilities in excess of other assets | | | (0.1 | ) |
| | |
|
|
|
| | | | 100.0 | % |
| | |
|
|
|
SEE NOTES TO FINANCIAL STATEMENTS.
A4
FINANCIAL STATEMENTS OF VCA-2
Year Ended December 31, 2017
| | | | |
| | | | |
INVESTMENT INCOME | | | | |
Unaffiliated Dividend Income (net of $7,349 foreign withholding tax) | | $ | 3,781,495 | |
Affiliated Dividend Income | | | 43,319 | |
Total Income | | | 3,824,814 | |
EXPENSES | | | | |
Fees Charged to Participants and Annuitants for Investment Management Services | | | (288,840 | ) |
Fees Charged to Participants (other than Annuitants) for Assuming Mortality and Expense Risks | | | (846,244 | ) |
Total Expenses | | | (1,135,084 | ) |
NET INVESTMENT INCOME | | | 2,689,730 | |
REALIZED AND UNREALIZED GAIN (LOSS) ON INVESTMENT AND FOREIGN CURRENCY TRANSACTIONS | | | | |
Net Realized Gain (Loss) on: | | | | |
Investment Transactions | | | 23,112,727 | |
Foreign Currency Transactions | | | 1,058 | |
| | | | 23,113,785 | |
Net Change in Unrealized Appreciation (Depreciation) on: | | | | |
Investments | | | 21,798,121 | |
Foreign Currencies | | | 296 | |
| | | | 21,798,417 | |
NET GAIN ON INVESTMENT AND FOREIGN CURRENCY TRANSACTIONS | | | 44,912,202 | |
NET INCREASE IN NET ASSETS RESULTING FROM OPERATIONS | | $ | 47,601,932 | |
| | | | | | |
| | | STATEMENTS OF CHANGES IN NET ASSETS | | |
| | | | | | | | |
| | | Year Ended
December 31, 2017 | | | Year Ended
December 31, 2016 | |
OPERATIONS | | | | | | | | |
Net Investment Income | | $ | 2,689,730 | | | $ | 3,076,830 | |
Net Realized Gain on Investment and Foreign Currency Transactions | | | 23,113,785 | | | | 9,798,879 | |
Net Change In Unrealized Appreciation (Depreciation) on Investments and Foreign Currencies | | | 21,798,417 | | | | 416,555 | |
NET INCREASE IN NET ASSETS RESULTING FROM OPERATIONS | | | 47,601,932 | | | | 13,292,265 | |
CAPITAL TRANSACTIONS | | | | | | | | |
Purchase Payments and Transfers In (16,389 and 10,962 units, respectively) | | | 1,184,726 | | | | 649,580 | |
Withdrawals and Transfers Out (400,618 and 578,400 units, respectively) | | | (28,165,279 | ) | | | (34,103,734 | ) |
Mortality and Expense Risk Charges Deducted from Annuitants’ Accounts | | | (20,276 | ) | | | (19,069 | ) |
Variable Annuity Payments | | | (736,309 | ) | | | (768,375 | ) |
NET DECREASE IN NET ASSETS RESULTING FROM CAPITAL TRANSACTIONS | | | (27,737,138 | ) | | | (34,241,598 | ) |
NET INCREASE (DECREASE) IN NET ASSETS RESULTING FROM SURPLUS TRANSFERS | | | 4,396 | | | | (861,027 | ) |
TOTAL INCREASE (DECREASE) IN NET ASSETS | | | 19,869,190 | | | | (21,810,361 | ) |
NET ASSETS | | | | | | | | |
Beginning of year | | | 221,234,862 | | | | 243,045,223 | |
End of year | | $ | 241,104,052 | | | $ | 221,234,862 | |
SEE NOTES TO FINANCIAL STATEMENTS.
A5
FINANCIAL HIGHLIGHTS FOR
VCA-2
| | | | | | |
| | | INCOME AND CAPITAL CHANGES PER ACCUMULATION UNIT* | | |
(For an Accumulation Unit outstanding throughout the year)
| | | | | | | | | | | | | | | | | | | | |
| | | Year Ended December 31,
| |
| | | 2017 | | | 2016 | | | 2015 | | | 2014 | | | 2013 | |
Investment Income | | $ | 1.1756 | | | $ | 1.1021 | | | $ | 0.9469 | | | $ | 0.7348 | | | $ | 0.7032 | |
Expenses | | | | | | | | | | | | | | | | | | | | |
Investment management fee | | | (0.0883 | ) | | | (0.0735 | ) | | | (0.0763 | ) | | | (0.0718 | ) | | | (0.0596 | ) |
Assuming mortality and expense risks | | | (0.2647 | ) | | | (0.2203 | ) | | | (0.2284 | ) | | | (0.2151 | ) | | | (0.1786 | ) |
Net Investment Income | | | 0.8226 | | | | 0.8083 | | | | 0.6422 | | | | 0.4479 | | | | 0.4650 | |
Capital Changes | | | | | | | | | | | | | | | | | | | | |
Net realized and unrealized gain (loss) on investment and foreign currency transactions | | | 13.7979 | | | | 3.1300 | | | | (1.3303 | ) | | | 5.6719 | | | | 12.5785 | |
Net Increase (Decrease) in Accumulation Unit Value | | | 14.6205 | | | | 3.9383 | | | | (0.6881 | ) | | | 6.1198 | | | | 13.0435 | |
Accumulation Unit Value | | | | | | | | | | | | | | | | | | | | |
Beginning of year | | | 63.6995 | | | | 59.7612 | | | | 60.4493 | | | | 54.3295 | | | | 41.2860 | |
End of year | | $ | 78.3200 | | | $ | 63.6995 | | | $ | 59.7612 | | | $ | 60.4493 | | | $ | 54.3295 | |
Total Return** | | | 22.95 | % | | | 6.59 | % | | | (1.14 | )% | | | 11.26 | % | | | 31.59 | % |
Ratio of Expenses To Average Net Assets*** | | | 0.50 | % | | | 0.50 | % | | | 0.50 | % | | | 0.50 | % | | | 0.50 | % |
Ratio of Net Investment Income To Average Net Assets*** | | | 1.16 | % | | | 1.37 | % | | | 1.06 | % | | | 0.78 | % | | | 0.98 | % |
Portfolio Turnover Rate | | | 48 | % | | | 40 | % | | | 47 | % | | | 70 | % | | | 69 | % |
Number of Accumulation Units Outstanding
For Participants at end of year (000 omitted) | | | 3,000 | | | | 3,384 | | | | 3,952 | | | | 4,579 | | | | 5,046 | |
| * | Calculated by accumulating the actual per unit amounts daily. |
| ** | Total return does not consider the effects of sales loads. Total return is calculated assuming a purchase of a share on the first day and a sale on the last day of each period reported. Total returns may reflect adjustments to conform to generally accepted accounting principles. |
| *** | These calculations exclude PICA’s equity in VCA-2. |
The above table does not reflect the annual administration charge, which does not affect the Accumulation Unit Value. This charge is made by reducing Participants’ Accumulation Accounts by a number of Accumulation Units equal in value to the charge.
SEE NOTES TO FINANCIAL STATEMENTS.
B1
NOTES TO FINANCIAL STATEMENTS OF
VCA-2
The Prudential Variable Contract Account-2 (VCA-2 or the Account) was established on January 9, 1968 by The Prudential Insurance Company of America (“PICA”) under the laws of the State of New Jersey and is registered as an open-end, diversified management investment company under the Investment Company Act of 1940 (“1940 Act”), as amended. VCA-2 has been designed for use by public school systems and certain tax-exempt organizations to provide for the purchase and payment of tax-deferred variable annuities. The investment objective of the Account is long-term growth of capital. Its investments are composed primarily of common stocks. Variable annuity payments differ according to the investment performance of the Account.
| Note 2: | | Accounting Policies |
The Account follows investment company accounting and reporting guidance of the Financial Accounting Standards Board (“FASB”) Accounting Standard Codification Topic 946 Financial Services-Investment Companies. The following accounting policies conform to U.S. generally accepted accounting principles. The Account consistently follows such policies in the preparation of its financial statements.
Securities Valuation: The Account holds securities and other assets and liabilities that are fair valued at the close of each day (generally, 4:00 PM Eastern time) the New York Stock Exchange (“NYSE”) is open for trading. Fair value is the price that would be received to sell an asset or paid to transfer a liability in an orderly transaction between market participants on the measurement date. The Account’s Committee Members (the “Committee”) has adopted valuation procedures for security valuation under which fair valuation responsibilities have been delegated to PGIM Investments LLC (“PGIM Investments” or “the Manager”) (formerly known as Prudential Investments LLC). Under the current valuation procedures, the Valuation Committee is responsible for supervising the valuation of portfolio securities and other assets and liabilities. The valuation procedures permit the Account to utilize independent pricing vendor services, quotations from market makers, and alternative valuation methods when market quotations are either not readily available or not deemed representative of fair value. A record of the Valuation Committee’s actions is subject to the Committee’s review, approval, and ratification at its next regularly-scheduled quarterly meeting.
Various inputs determine how the Account’s investments are valued, all of which are categorized according to the three broad levels (Level 1, 2, or 3) detailed in the table following the Account’s Statement of Net Assets.
Common and preferred stocks, exchange-traded funds, and derivative instruments, such as futures or options, that are traded on a national securities exchange are valued at the last sale price as of the close of trading on the applicable exchange where the security principally trades. Securities traded via NASDAQ are valued at the NASDAQ official closing price. To the extent these securities are valued at the last sale price or NASDAQ official closing price, they are classified as Level 1 in the fair value hierarchy. In the event that no sale or official closing price on valuation date exists, these securities are generally valued at the mean between the last reported bid and asked prices, or at the last bid price in the absence of an ask price. These securities are classified as Level 2 in the fair value hierarchy.
Foreign equities traded on foreign securities exchanges are valued using pricing vendor services that provide model prices derived using adjustment factors based on information such as local closing price, relevant general and sector indices, currency fluctuations, depositary receipts, and futures, as applicable. Securities valued using such model prices are classified as Level 2 in the fair value hierarchy. The models generate an evaluated adjustment factor for each security, which is applied to the local closing price to adjust it for post closing market movements. Utilizing that evaluated adjustment factor, the vendor provides an evaluated price for each security. If the vendor does not provide an evaluated price, securities are valued in accordance with exchange-traded common and preferred stock valuation policies discussed above.
Investments in open-end, non-exchange-traded mutual funds are valued at their net asset values as of the close of the NYSE on the date of valuation. These securities are classified as Level 1 in the fair value hierarchy since they may be purchased or sold at their net asset values on the date of valuation.
C1
Account Securities and other assets that cannot be priced according to the methods described above are valued based on pricing methodologies approved by the Committee. In the event that unobservable inputs are used when determining such valuations, the securities will be classified as Level 3 in the fair value hierarchy.
When determining the fair value of securities, some of the factors influencing the valuation include: the nature of any restrictions on disposition of the securities; assessment of the general liquidity of the securities; the issuer’s financial condition and the markets in which it does business; the cost of the investment; the size of the holding and the capitalization of the issuer; the prices of any recent transactions or bids/offers for such securities or any comparable securities; any available analyst media or other reports or information deemed reliable by the investment adviser regarding the issuer or the markets or industry in which it operates. Using fair value to price securities may result in a value that is different from a security’s most recent closing price and from the price used by other mutual funds to calculate their net asset values.
Restricted and Illiquid Securities: Subject to guidelines adopted by the Committee, the Account may invest up to 15% of its net assets in illiquid securities, including those which are restricted as to disposition under securities law (“restricted securities”). Restricted securities are valued pursuant to the valuation procedures noted above. Illiquid securities are those that, because of the absence of a readily available market or due to legal or contractual restrictions on resale, cannot be sold within seven days in the ordinary course of business at approximately the amount at which the Account has valued the investment. Therefore, the Account may find it difficult to sell illiquid securities at the time considered most advantageous by its subadviser and may incur expenses that would not be incurred in the sale of securities that were freely marketable. Certain securities that would otherwise be considered illiquid because of legal restrictions on resale to the general public may be traded among qualified institutional buyers under Rule 144A of the Securities Act of 1933. These Rule 144A securities, as well as commercial paper that is sold in private placements under Section 4(2) of the Securities Act, may be deemed liquid by the Account’s subadviser under the guidelines adopted by the Committee Members of the Account. However, the liquidity of the Account’s investments in Rule 144A securities could be impaired if trading does not develop or declines.
Foreign Currency Translation: The books and records of the Account are maintained in U.S. dollars. Foreign currency amounts are translated into U.S. dollars on the following basis:
(i) market value of investment securities, other assets and liabilities—at the current rates of exchange;
(ii) purchases and sales of investment securities, income and expenses—at the rates of exchange prevailing on the respective dates of such transactions.
Although the net assets of the Account are presented at the foreign exchange rates and market values at the close of the period, the Account does not generally isolate that portion of the results of operations arising as a result of changes in the foreign exchange rates from the fluctuations arising from changes in the market prices of long-term portfolio securities held at the end of the period. Similarly, the Account does not isolate the effect of changes in foreign exchange rates from the fluctuations arising from changes in the market prices of long-term portfolio securities sold during the period. Accordingly, holding period realized foreign currency gains (losses) are included in the reported net realized gains (losses) on investment transactions.
Net realized gains (losses) on foreign currency transactions represent net foreign exchange gains (losses) from holdings of foreign currencies, currency gains (losses) realized between the trade and settlement dates on securities transactions, and the difference between the amounts of interest, dividends and foreign withholding taxes recorded on the Account’s books and the U.S. dollar equivalent amounts actually received or paid. Net unrealized currency gains (losses) from valuing foreign currency denominated assets and liabilities (other than investments) at period end exchange rates are reflected as a component of net unrealized appreciation (depreciation) on foreign currencies.
Securities Transactions and Net Investment Income: Securities transactions are recorded on the trade date. Realized gains or (losses) from investment and currency transactions are calculated on the identified cost basis. Dividend income is recorded on the ex-dividend date. Interest income, including amortization of premium and accretion of discount on debt securities, as required, is recorded on the accrual basis. Expenses are recorded on the accrual basis, which may require the use of certain estimates by management that may differ from actual. Income and realized and unrealized gains and (losses) are allocated to the Participants and PICA on a daily basis in proportion to their respective ownership in VCA-2.
C2
Estimates: The preparation of the financial statements requires management to make estimates and assumptions that affect the reported amounts and disclosures in the financial statements. Actual results could differ from those estimates.
Federal Income Taxes: The operations of VCA-2 are part of, and are taxed with, the operations of PICA. Under the current provisions of the Internal Revenue Code, PICA does not expect to incur federal income taxes on earnings of VCA-2 to the extent the earnings are credited under the Contracts. As a result, the Unit Value of VCA-2 has not been reduced by federal income taxes.
Annuity Reserves: Reserves are computed for purchased annuities using the Prudential 1950 Group Annuity Valuation (GAV) Table, adjusted, and a valuation interest rate related to the Assumed Investment Result (AIR). The valuation interest rate is equal to the AIR less 0.50% in contract charges defined in Note 3. The AIRs are selected by each Contract-holder and are described in the prospectus.
| Note 3: | | Investment Management Agreement and Charges |
The Account has a management agreement with PGIM Investments. Pursuant to this agreement, PGIM Investments has responsibility for all investment advisory services and supervises the subadviser’s performance of such services. PGIM Investments has entered into a subadvisory agreement with Jennison Associates LLC (“Jennison”). The subadvisory agreement provides that Jennison will furnish investment advisory services in connection with management of the Account. PGIM Investments pays for the services of Jennison.
A daily charge, at an effective annual rate of 0.125% of the current value of the Participant’s (other than Annuitants’ and PICA’s) equity in VCA-2, is charged to the Account and paid to PGIM Investments for investment management services. An equivalent charge is deducted monthly in determining the amount of Annuitants’ payments.
A daily charge, paid to PGIM Investments for assuming mortality and expense risks, is calculated at an effective annual rate of 0.375% of the current value of the Participant’s (other than Annuitants’ and PICA’s) equity in VCA-2. A one-time equivalent charge is deducted when the Annuity Units for Annuitants are determined.
An annual administration charge of not more than $30 annually is deducted from the accumulation account of certain Participants either at the time of withdrawal of the value of the entire Participant’s account or on the last business day of each calendar year such amounts are reflected as a withdrawal on the Statements of Changes in Net Assets. This deduction may be made from a fixed-dollar annuity contract if the Participant is enrolled under such a contract.
A charge of 2.5% for sales and other marketing expenses is deducted from certain Participant’s purchase payments. For the year ended December 31, 2017, PICA has advised the Account it has not received any sales charges.
PICA, PGIM Investments and Jennison are indirect, wholly-owned subsidiaries of Prudential Financial, Inc. (“Prudential”).
| Note 4: | | Other Transactions with Affiliates |
The Account may enter into certain securities purchase or sale transactions under Committee approved Rule 17a-7 procedures. Rule 17a-7 is an exemptive rule under the 1940 Act, that permits purchase and sale transactions among affiliated investment companies, or between an investment company and a person that is affiliated solely by reason of having a common (or affiliated) investment adviser, common directors, and/or common officers. Such transactions are subject to ratification by the Committee. For the year ended December 31, 2017 no such transactions were entered into by the Account.
During the year ended December 31, 2017 the Account invested in the Prudential Core Ultra Short Bond Fund (the “Core Fund”), a portfolio of the Prudential Investment Portfolios 2, registered under the 1940 Act, and managed by PGIM Investments. Earnings from the Core Fund are disclosed on the Statement of Operations as, “Affiliated dividend income”.
| Note 5: | | Purchases and Sales of Portfolio Securities |
For the year ended December 31, 2017, the aggregate cost of purchases and the proceeds from sales of securities, excluding short-term investments, were $109,238,170 and $134,099,432, respectively.
C3
| Note 6: | | Net Increase (Decrease) In Net Assets Resulting From Surplus Transfers |
The increase (decrease) in net assets resulting from surplus transfers represents the net increases to/(reductions from) PICA’s investment Account. The increase (decrease) includes reserve adjustments for mortality and expense risks assumed by PICA.
| Note 7: | | Participant Loans |
Participant loan initiations are not permitted in VCA-2. However, participants who initiated loans in other accounts are permitted to direct loan repayments into VCA-2.
For the year ended December 31, 2017 and year ended December 31, 2016, $0 and $1,068 of participant loan principal and interest have been paid to VCA-2, respectively. The participant loan principal and interest repayments are included in purchase payments and transfers in within the Statement of Changes in Net Assets.
C4
REPORT OF INDEPENDENT REGISTERED PUBLIC ACCOUNTING FIRM
TO THE COMMITTEE AND PARTICIPANTS OF
THE PRUDENTIAL VARIABLE CONTRACT ACCOUNT-2:
Opinion on the Financial Statements
We have audited the accompanying statement of net assets of The Prudential Variable Contract Account-2: (the “Account”), as of December 31, 2017, the related statement of operations for the year then ended, the statements of changes in net assets for each of the years in the two-year period then ended, and the related notes (collectively, the “financial statements”) and the financial highlights for accumulation units (the “financial highlights”) for each of the years in the five-year period then ended. In our opinion, the financial statements and financial highlights referred to above present fairly, in all material respects, the financial position of the Account as of December 31, 2017, the results of its operations for the year then ended, the changes in its net assets for each of the years in the two-year period then ended, and the financial highlights for each of the years in the five-year period then ended, in conformity with U.S. generally accepted accounting principles.
Basis for Opinion
These financial statements and financial highlights are the responsibility of the Account’s management. Our responsibility is to express an opinion on these financial statements and financial highlights based on our audits. We are a public accounting firm registered with the Public Company Accounting Oversight Board (United States) (“PCAOB”) and are required to be independent with respect to the Account in accordance with the U.S. federal securities laws and the applicable rules and regulations of the Securities and Exchange Commission and the PCAOB.
We conducted our audits in accordance with the standards of the PCAOB. Those standards require that we plan and perform the audit to obtain reasonable assurance about whether the financial statements and financial highlights are free of material misstatement, whether due to error or fraud. Our audits included performing procedures to assess the risks of material misstatement of the financial statements and financial highlights, whether due to error or fraud, and performing procedures that respond to those risks. Such procedures included examining, on a test basis, evidence supporting the amounts and disclosures in the financial statements and financial highlights. Such procedures also included confirmation of securities owned as of December 31, 2017, by correspondence with the custodian, transfer agent and brokers or by other appropriate auditing procedures when replies from brokers were not received. Our audits also included evaluating the accounting principles used and significant estimates made by management, as well as evaluating the overall presentation of the financial statements and financial highlights. We believe that our audits provide a reasonable basis for our opinion.

We have served as the auditor of one or more Prudential Variable Contract Accounts since 2003.
New York, New York
February 20, 2018
D1
INFORMATION ABOUT COMMITTEE MEMBERS AND OFFICERS
VCA 2 is managed by the VCA 2 Committee. The members of the VCA 2 Committee are elected by the persons having voting rights in respect of the VCA 2 Account. The affairs of VCA 2 are conducted in accordance with the Rules and Regulations of VCA 2. Information pertaining to the members of the VCA 2 Committee (hereafter referred to as “Committee Members”) is set forth below. Committee Members who are not deemed to be “interested persons” of VCA 2 as defined in the Investment Company Act of 1940, as amended (the 1940 Act) are referred to as “Independent Committee Members.” Committee Members who are deemed to be “interested persons” of VCA 2 are referred to as “Independent Committee Members.” Information pertaining to the Officers of VCA 2 is also set forth below.
| | | | | | |
| Independent Committee Members |
Name, Address, Age
Position(s)
Portfolios Overseen | | Principal Occupation(s)
During Past Five Years | | Other Directorships
Held During
Past Five Years | | Length of
Committee Service |
Ellen S. Alberding (59)
Committee Member
Portfolios Overseen: 90 | | President and Board Member, The Joyce Foundation (charitable foundation) (since 2002); Vice Chair, City Colleges of Chicago (community college system) (since 2011); Trustee, Skills for America’s Future (national initiative to connect employers to community colleges) (since 2011); Trustee, National Park Foundation (charitable foundation for national park system) (since 2009); Trustee, Economic Club of Chicago (since 2009). | | None. | | Since September 2013 |
Kevin J. Bannon (65)
Committee Member
Portfolios Overseen: 90 | | Retired; Managing Director (April 2008-May 2015) and Chief Investment Officer (October 2008-November 2013) of Highmount Capital LLC (registered investment adviser); formerly Executive Vice President and Chief Investment Officer (April 1993-August 2007) of Bank of New York Company; President (May 2003-May 2007) of BNY Hamilton Family of Mutual Funds. | | Director of Urstadt Biddle Properties (equity real estate investment trust) (since September 2008). | | Since July 2008 |
Linda W. Bynoe (65)
Committee Member
Portfolios Overseen: 90 | | President and Chief Executive Officer (since March 1995) and formerly Chief Operating Officer (December 1989-February 1995) of Telemat Ltd. (management consulting); formerly Vice President (January 1985-June 1989) at Morgan Stanley & Co. (broker-dealer). | | Director of Simon Property Group, Inc. (retail real estate) (May 2003-May 2012); Director of Anixter International, Inc. (communication products distributor) (since January 2006); Director of Northern Trust Corporation (financial services) (since April 2006); Trustee of Equity Residential (residential real estate) (since December 2009). | | Since March 2005 |
Barry H. Evans (57)±
Committee Member
Portfolios Overseen: 90 | | Retired; Formerly President (2005-2016), Global Chief Operating Officer (2014-2016), Chief Investment Officer – Global Head of Fixed Income (1998-2014), and various portfolio manager roles (1986-2006), Manulife Asset Management U.S. | | Director, Manulife Trust Company (2011- present); Director, Manulife Asset Management Limited (2015-present); Formerly Chairman of the Board of Directors of Manulife Asset Management U.S. (2005-2016); Formerly Chairman of the Board, Declaration Investment Management and Research (2008-2016). | | Since September 2017 |
Keith F. Hartstein (61)
Committee Member & Independent Chair
Portfolios Overseen: 90 | | Retired; Member (since November 2014) of the Governing Council of the Independent Directors Council (organization of independent mutual fund directors); formerly President and Chief Executive Officer (2005-2012), Senior Vice President (2004-2005), Senior Vice President of Sales and Marketing (1997-2004), and various executive management positions (1990-1997), John Hancock Funds, LLC (asset management); Chairman, Investment Company Institute’s Sales Force Marketing Committee (2003-2008). | | None. | | Since September 2013 |
E1
| | | | | | |
| Independent Committee Members |
Name, Address, Age
Position(s)
Portfolios Overseen | | Principal Occupation(s)
During Past Five Years | | Other Directorships
Held During
Past Five Years | | Length of
Committee Service |
Laurie Simon Hodrick (55)±
Committee Member
Portfolios Overseen: 90 | | Professor Emerita of Business (since 2018), Columbia Business School; Visiting Fellow at the Hoover Institution, Stanford University (since 2015); Visiting Professor of Law, Stanford Law School (since 2015); formerly Professor of Business (1996-2017), Columbia Business School; formerly Managing Director, Global Head of Alternative Investment Strategies (2006-2008), Deutsche Bank. | | Independent Director, Corporate Capital Trust (since April 2017) (a business development company). | | Since September 2017 |
Michael S. Hyland, CFA (72)
Committee Member
Portfolios Overseen: 90 | | Retired (since February 2005); formerly Senior Managing Director (July 2001-February 2005) of Bear Stearns & Co, Inc.; Global Partner, INVESCO (1999-2001); Managing Director and President of Salomon Brothers Asset Management (1989-1999). | | None. | | Since July 2008 |
Richard A. Redeker (74)
Committee Member & Independent Vice Chair
Portfolios Overseen: 90 | | Retired Mutual Fund Senior Executive (47 years); Management Consultant; Director, Mutual Fund Directors Forum (since 2014); Independent Directors Council (organization of independent mutual fund directors)-Executive Committee, Chair of Policy Steering Committee, Governing Council. | | None. | | Since October 1993 |
Stephen G. Stoneburn (74)
Committee Member
Portfolios Overseen: 90 | | Chairman (since July 2011), President and Chief Executive Officer (since June 1996) of Frontline Medical Communications (publishing company); formerly President (June 1995-June 1996) of Argus Integrated Media, Inc.; Senior Vice President and Managing Director (January 1993-1995) of Cowles Business Media; Senior Vice President of Fairchild Publications, Inc. (1975-1989). | | None. | | Since July 2003 |
±Mr. Evans and Ms. Hodrick joined the Committee effective as of September 1, 2017.
| | | | | | |
| Interested Committee Members |
Name, Address, Age
Position(s)
Portfolios Overseen | | Principal Occupation(s)
During Past Five Years | | Other Directorships
Held During
Past Five Years | | Length of
Committee Service |
Stuart S. Parker (55)
Committee Member & President
Portfolios Overseen: 90 | | President of PGIM Investments LLC (formerly known as Prudential Investments LLC) (since January 2012); Executive Vice President of Prudential Investment Management Services LLC (since December 2012); Executive Vice President of Jennison Associates LLC and Head of Retail Distribution of PGIM Investments LLC (June 2005-December 2011). | | None. | | Since January 2012 |
E2
| | | | | | |
| Interested Committee Members |
Name, Address, Age
Position(s)
Portfolios Overseen | | Principal Occupation(s)During Past Five
Years | | Other Directorships
Held During
Past Five Years | | Length of
Committee Service |
Scott E. Benjamin (44)
Committee Member & Vice President
Portfolios Overseen: 90 | | Executive Vice President (since June 2009) of PGIM Investments LLC; Executive Vice President (June 2009-June 2012) and Vice President (since June 2012) of Prudential Investment Management Services LLC; Executive Vice President (since September 2009) of AST Investment Services, Inc.; Senior Vice President of Product Development and Marketing, PGIM Investments (since February 2006); Vice President of Product Development and Product Management, PGIM Investments LLC (2003-2006). | | None. | | Since March 2010 |
Grace C. Torres*
(58)
Committee Member
Portfolios Overseen: 89 | | Retired; formerly Treasurer and Principal Financial and Accounting Officer of the Prudential Funds, Target Funds, Advanced Series Trust, Prudential Variable Contract Accounts and The Prudential Series Fund (1998-June 2014); Assistant Treasurer (March 1999-June 2014) and Senior Vice President (September 1999-June 2014) of PGIM Investments LLC; Assistant Treasurer (May 2003-June 2014) and Vice President (June 2005-June 2014) of AST Investment Services, Inc.; Senior Vice President and Assistant Treasurer (May 2003-June 2014) of Prudential Annuities Advisory Services, Inc. | | Director (since July 2015) of Sun Bancorp, Inc. N.A. and Sun National Bank | | Since November 2014 |
* Note: Prior to her retirement in 2014, Ms. Torres was employed by PGIM Investments LLC. Due to her prior employment, she is considered to be an “interested person” under the 1940 Act. Ms. Torres is a Non-Management Interested Committee Member.
| | | | |
| VCA 2 Officers(a) |
Name, Address and Age
Position with VCA 2 | | Principal Occupation(s) During Past Five Years | | Length of Service as VCA 2 Officer |
Raymond A. O’Hara (62)
Chief Legal Officer | | Vice President and Corporate Counsel (since July 2010) of Prudential Insurance Company of America (Prudential); Vice President (March 2011-Present) of Pruco Life Insurance Company and Pruco Life Insurance Company of New Jersey; Vice President and Corporate Counsel (March 2011-Present) of Prudential Annuities Life Assurance Corporation; Chief Legal Officer of PGIM Investments LLC (since June 2012); Chief Legal Officer of Prudential Mutual Fund Services LLC (since June 2012) and Corporate Counsel of AST Investment Services, Inc. (since June 2012); formerly Assistant Vice President and Corporate Counsel (September 2008-July 2010) of The Hartford Financial Services Group, Inc.; formerly Associate (September 1980-December 1987) and Partner (January 1988-August 2008) of Blazzard & Hasenauer, P.C. (formerly, Blazzard, Grodd & Hasenauer, P.C.). | | Since June 2012 |
E3
| | | | |
| VCA 2 Officers(a) |
Name, Address and Age
Position with VCA 2 | | Principal Occupation(s) During Past Five Years | | Length of Service as VCA 2 Officer |
Chad A. Earnst (42)
Chief Compliance Officer | | Chief Compliance Officer (September 2014-Present) of PGIM Investments LLC; Chief Compliance Officer (September 2014-Present) of the Prudential Funds, Target Funds, Advanced Series Trust, The Prudential Series Fund, Prudential’s Gibraltar Fund, Inc., Prudential Global Short Duration High Yield Income Fund, Inc., Prudential Short Duration High Yield Fund, Inc. and Prudential Jennison MLP Income Fund, Inc.; formerly Assistant Director (March 2010-August 2014) of the Asset Management Unit, Division of Enforcement, US Securities & Exchange Commission; Assistant Regional Director (January 2010-August 2014), Branch Chief (June 2006-December 2009) and Senior Counsel (April 2003-May 2006) of the Miami Regional Office, Division of Enforcement, US Securities & Exchange Commission. | | Since September 2014 |
Deborah A. Docs (60)
Secretary | | Vice President and Corporate Counsel (since January 2001) of Prudential; Vice President (since December 1996) and Assistant Secretary (since March 1999) of PGIM Investments LLC; formerly Vice President and Assistant Secretary (May 2003-June 2005) of AST Investment Services, Inc. | | Since May 2004 |
Jonathan D. Shain (59)
Assistant Secretary | | Vice President and Corporate Counsel (since August 1998) of Prudential; Vice President and Assistant Secretary (since May 2001) of PGIM Investments LLC; Vice President and Assistant Secretary (since February 2001) of Prudential Mutual Fund Services LLC; formerly Vice President and Assistant Secretary (May 2003-June 2005) of AST Investment Services, Inc. | | Since May 2005 |
Claudia DiGiacomo (43)
Assistant Secretary | | Vice President and Corporate Counsel (since January 2005) of Prudential; Vice President and Assistant Secretary of PGIM Investments LLC (since December 2005); Associate at Sidley Austin Brown & Wood LLP (1999-2004). | | Since December 2005 |
Andrew R. French (55)
Assistant Secretary | | Vice President and Corporate Counsel (since February 2010) of Prudential; formerly Director and Corporate Counsel (2006-2010) of Prudential; Vice President and Assistant Secretary (since January 2007) of PGIM Investments LLC; Vice President and Assistant Secretary (since January 2007) of Prudential Mutual Fund Services LLC. | | Since October 2006 |
Charles H. Smith (45)
Anti-Money Laundering
Compliance Officer | | Vice President, Corporate Compliance, Anti-Money Laundering Unit (since January 2015) of Prudential; committee member of the American Council of Life Insurers Anti-Money Laundering and Critical Infrastructure Committee (since January 2016); formerly Global Head of Economic Sanctions Compliance at AIG Property Casualty (February 2007-December 2014); Assistant Attorney General at the New York State Attorney General’s Office, Division of Public Advocacy. (August 1998-January 2007). | | Since January 2017 |
M. Sadiq Peshimam (54)
Treasurer and Principal Financial
and Accounting Officer | | Vice President (since 2005) of PGIM Investments LLC; formerly Assistant Treasurer of funds in the Prudential Mutual Fund Complex (2006-2014). | | Since February 2006 |
Peter Parrella (59)
Assistant Treasurer | | Vice President (since 2007) and Director (2004-2007) within Prudential Mutual Fund Administration; formerly Tax Manager at SSB Citi Fund Management LLC (1997-2004). | | Since June 2007 |
Lana Lomuti (50)
Assistant Treasurer | | Vice President (since 2007) and Director (2005-2007), within Prudential Mutual Fund Administration; formerly Assistant Treasurer (December 2007-February 2014) of The Greater China Fund, Inc. | | Since April 2014 |
Linda McMullin (56)
Assistant Treasurer | | Vice President (since 2011) and Director (2008-2011) within Prudential Mutual Fund Administration. | | Since April 2014 |
Kelly A. Coyne (49)
Assistant Treasurer | | Director, Investment Operations of Prudential Mutual Fund Services LLC (since 2010). | | Since March 2015 |
(a) Excludes Mr. Parker and Mr. Benjamin, interested Committee Members who also serve as President and Vice President, respectively.
E4
Explanatory Notes to Tables:
Committee Members are deemed to be “Interested,” as defined in the 1940 Act, by reason of their affiliation with PGIM Investments LLC and/or an affiliate of PGIM Investments LLC.
Unless otherwise noted, the address of all Committee Members and Officers is c/o PGIM Investments LLC, 655 Broad Street, Newark, New Jersey 07102.
There is no set term of office for Committee Members or Officers. The Committee Members have adopted a retirement policy, which calls for the retirement of Committee Members on December 31 of the year in which they reach the age of 75.
“Other Directorships Held” includes only directorships of companies required to register or file reports with the SEC under the Securities and Exchange Act of 1934 (that is, “public companies”) or other investment companies registered under the 1940 Act.
“Portfolios Overseen” includes all investment companies managed by PGIM Investments LLC. The investment companies for which PGIM Investments LLC serves as manager include the Prudential Mutual Funds, The Prudential Variable Contract Accounts, Target Mutual Funds, Prudential Short Duration High Yield Fund, Inc., Prudential Global Short Duration High Yield Fund, Inc., The Prudential Series Fund, Prudential’s Gibraltar Fund, Inc. and the Advanced Series Trust.
E5
The toll-free number shown below can be used to make transfers and reallocations, review how your premiums are being allocated, and receive current investment option values in your contract. Unit values for each investment option are available to all participants from the toll-free number. Please be sure to have your contract number available when you call.
(800) 458-6333
The Prudential Insurance Company of America
751 Broad Street
Newark, NJ 07102-3714
Presorted
Standard
U.S. Postage
PAID
Prudential
©2018 Prudential Financial, Inc. and its related entities. PGIM Investments, the Prudential logo, the Rock symbol, and Bring Your Challenges are service marks of Prudential Financial, Inc. and its related entities, registered in many jurisdictions worldwide.
LT.RS.001
Item 2 – Code of Ethics – – See Exhibit (a)
As of the end of the period covered by this report, the registrant has adopted a code of ethics (the “Section 406 Standards for Investment Companies – Ethical Standards for Principal Executive and Financial Officers”) that applies to the registrant’s Principal Executive Officer and Principal Financial Officer; the registrant’s Principal Financial Officer also serves as the Principal Accounting Officer. During the period covered by the report, there have been no amendments to any provisions of the code of ethics nor have any waivers been granted from any provision of the code of ethics.
The registrant hereby undertakes to provide any person, without charge, upon request, a copy of the code of ethics. To request a copy of the code of ethics, contact the registrant 973-367-7521, and ask for a copy of the Section 406 Standards for Investment Companies - Ethical Standards for Principal Executive and Financial Officers.
Item 3 – Audit Committee Financial Expert –
The registrant’s Board has determined that Mr. Kevin J. Bannon, member of the Board’s Audit Committee is an “audit committee financial expert,” and that he is “independent,” for purposes of this Item.
Item 4 – Principal Accountant Fees and Services –
(a) Audit Fees
For the fiscal years ended December 31, 2017 and December 31, 2016, KPMG LLP (“KPMG”), the Registrant’s principal accountant, billed the Registrant $24,165 and $19,961, respectively, for professional services rendered for the audit of the Registrant’s annual financial statements or services that are normally provided in connection with statutory and regulatory filings.
(b) Audit-Related Fees
For the fiscal years ended December 31, 2017 and December 31, 2016: none.
(c) Tax Fees
For the fiscal years ended December 31, 2017 and December 31, 2016: none.
(d) All Other Fees
For the fiscal years ended December 31, 2017 and December 31, 2016: none.
(e) (1) Audit Committee Pre-Approval Policies and Procedures
THE PRUDENTIAL MUTUAL FUNDS
AUDIT COMMITTEE POLICY
on
Pre-Approval of Services Provided by the Independent Accountants
The Audit Committee of each Prudential Mutual Fund is charged with the responsibility to monitor the independence of the Fund’s independent accountants. As part of this responsibility, the Audit Committee must pre-approve the independent accounting firm’s engagement to render audit and/or permissible non-audit services, as required by law. In evaluating a proposed engagement of the independent accountants, the Audit Committee will assess the effect that the engagement might reasonably be expected to have on the accountant’s independence. The Committee’s evaluation will be based on:
| | • | | a review of the nature of the professional services expected to be provided, |
| | • | | a review of the safeguards put into place by the accounting firm to safeguard independence, and |
| | • | | periodic meetings with the accounting firm. |
Policy for Audit and Non-Audit Services Provided to the Funds
On an annual basis, the scope of audits for each Fund, audit fees and expenses, and audit-related and non-audit services (and fees proposed in respect thereof) proposed to be performed by the Fund’s independent accountants will be presented by the Treasurer and the independent accountants to the Audit Committee for review and, as appropriate, approval prior to the initiation of such services. Such presentation shall be accompanied by confirmation by both the Treasurer and the independent accountants that the proposed non-audit services will not adversely affect the independence of the independent accountants. Such proposed non-audit services shall be described in sufficient detail to enable the Audit Committee to assess the appropriateness of such services and fees, and the compatibility of the provision of such services with the auditor’s independence. The Committee shall receive periodic reports on the progress of the audit and other services which are approved by the Committee or by the Committee Chair pursuant to authority delegated in this Policy.
The categories of services enumerated under “Audit Services”, “Audit-related Services”, and “Tax Services” are intended to provide guidance to the Treasurer and the independent accountants as to those categories of services which the Committee believes are generally consistent with the independence of the independent accountants and which the Committee (or the Committee Chair) would expect upon the presentation of specific proposals to pre-approve. The enumerated categories are not intended as an exclusive list of audit, audit-related or tax services, which the Committee (or the Committee Chair) would consider for pre-approval.
Audit Services
The following categories of audit services are considered to be consistent with the role of the Fund’s independent accountants:
| | ➣ | Annual Fund financial statement audits |
| | ➣ | Seed audits (related to new product filings, as required) |
| | ➣ | SEC and regulatory filings and consents |
Audit-related Services
The following categories of audit-related services are considered to be consistent with the role of the Fund’s independent accountants:
| | ➣ | Accounting consultations |
| | ➣ | Fund merger support services |
| | ➣ | Agreed Upon Procedure Reports |
| | ➣ | Other Internal Control Reports |
Individual audit-related services that fall within one of these categories (except for fund merger support services) and are not presented to the Audit Committee as part of the annual pre-approval process are subject to an authorized pre-approval by the Audit Committee so long as the estimated fee for those services does not exceed $30,000. Any services provided under such pre-approval will be reported to the Audit Committee at its next regular meeting. Should the amount of such services exceed $30,000 any additional fees will be subject to pre-approval by the Committee Chair (or any other Committee member on whom this responsibility has been delegated). Fees related to fund merger support services are subject to a separate authorized pre-approval by the Audit Committee with fees determined on a per occurrence and merger complexity basis.
Tax Services
The following categories of tax services are considered to be consistent with the role of the Fund’s independent accountants:
| | ➣ | Tax compliance services related to the filing or amendment of the following: |
| | ◾ | | Federal, state and local income tax compliance; and, |
| | ◾ | | Sales and use tax compliance |
| | ➣ | Timely RIC qualification reviews |
| | ➣ | Tax distribution analysis and planning |
| | ➣ | Tax authority examination services |
| | ➣ | Tax appeals support services |
| | ➣ | Accounting methods studies |
| | ➣ | Fund merger support services |
| | ➣ | Tax consulting services and related projects |
Individual tax services that fall within one of these categories and are not presented to the Audit
Committee as part of the annual pre-approval process are subject to an authorized pre-approval by the Audit Committee so long as the estimated fee for those services does not exceed $30,000. Any services provided under such pre-approval will be reported to the Audit Committee at its next regular meeting. Should the amount of such services exceed $30,000 any additional fees will
be subject to pre-approval by the Committee Chair (or any other Committee member on whom this responsibility has been delegated).
Other Non-Audit Services
Certain non-audit services that the independent accountants are legally permitted to render will be subject to pre-approval by the Committee or by one or more Committee members to whom the Committee has delegated this authority and who will report to the full Committee any pre-approval decisions made pursuant to this Policy. Non-audit services presented for pre-approval pursuant to this paragraph will be accompanied by a confirmation from both the Treasurer and the independent accountants that the proposed services will not adversely affect the independence of the independent accountants.
Proscribed Services
The Fund’s independent accountants will not render services in the following categories of non-audit services:
| | |
| Ø | | Bookkeeping or other services related to the accounting records or financial statements of the Fund |
| Ø | | Financial information systems design and implementation |
| Ø | | Appraisal or valuation services, fairness opinions, or contribution-in-kind reports |
| Ø | | Actuarial services |
| Ø | | Internal audit outsourcing services |
| Ø | | Management functions or human resources |
| Ø | | Broker or dealer, investment adviser, or investment banking services |
| Ø | | Legal services and expert services unrelated to the audit |
| Ø | | Any other service that the Public Company Accounting Oversight Board determines, by regulation, is impermissible. |
Pre-approval of Non-Audit Services Provided to Other Entities Within the Prudential Fund Complex
Certain non-audit services provided to PGIM Investments LLC or any of its affiliates that also provide ongoing services to the Prudential Mutual Funds will be subject to pre-approval by the Audit Committee. The only non-audit services provided to these entities that will require pre-approval are those related directly to the operations and financial reporting of the Funds. Individual projects that are not presented to the Audit Committee as part of the annual pre-approval process will be subject to pre-approval by the Committee Chair (or any other Committee member on whom this responsibility has been delegated) so long as the estimated fee for those services does not exceed $30,000. Services presented for pre-approval pursuant to this paragraph will be accompanied by a confirmation from both the Treasurer and the independent accountants that the proposed services will not adversely affect the independence of the independent accountants.
Although the Audit Committee will not pre-approve all services provided to PGIM Investments LLC and its affiliates, the Committee will receive an annual report from the Fund’s independent
accounting firm showing the aggregate fees for all services provided to Prudential Investments and its affiliates.
(e) (2) Percentage of services referred to in 4(b) – 4(d) that were approved by the audit committee –
For the fiscal years ended December 31, 2017 and December 31, 2016: none.
(f) Percentage of hours expended attributable to work performed by other than full time employees of principal accountant if greater than 50%.
The percentage of hours expended on the principal accountant’s engagement to audit the registrant’s financial statements for the most recent fiscal year that were attributed to work performed by persons other than the principal accountant’s full-time, permanent employees was 0%.
(g) Non-Audit Fees
The aggregate non-audit fees billed by KPMG for services rendered to the registrant’s investment adviser and any entity controlling, controlled by, or under common control with the investment adviser that provides ongoing services to the registrant for the fiscal years ended December 31, 2017 and December 31, 2016 was $0 and $0, respectively.
(h) Principal Accountant’s Independence
Not applicable as KPMG has not provided non-audit services to the registrant’s investment adviser and any entity controlling, controlled by, or under common control with the investment adviser that provides ongoing services to the registrant that were not pre-approved pursuant to Rule 2-01(c)(7)(ii) of Regulation S-X.
| | |
Item 5 – | | Audit Committee of Listed Registrants – Not applicable. |
| |
Item 6 – | | Schedule of Investments – The schedule is included as part of the report to shareholders filed under Item 1 of this Form. |
| |
Item 7 – | | Disclosure of Proxy Voting Policies and Procedures for Closed-End Management Investment Companies – Not applicable. |
| |
Item 8 – | | Portfolio Managers of Closed-End Management Investment Companies – Not applicable. |
| |
Item 9 – | | Purchases of Equity Securities by Closed-End Management Investment Company and Affiliated Purchasers – Not applicable. |
| | |
| |
Item 10 – | | Submission of Matters to a Vote of Security Holders – Not applicable. |
| |
Item 11 – | | Controls and Procedures |
| | (a) | It is the conclusion of the registrant’s principal executive officer and principal financial officer that the effectiveness of the registrant’s current disclosure controls and procedures (such disclosure controls and procedures having been evaluated within 90 days of the date of this filing) provide reasonable assurance that the information required to be disclosed by the registrant has been recorded, processed, summarized and reported within |
| | the time period specified in the Commission’s rules and forms and that the information required to be disclosed by the registrant has been accumulated and communicated to the registrant’s principal executive officer and principal financial officer in order to allow timely decisions regarding required disclosure. |
| | (b) | There has been no significant change in the registrant’s internal control over financial reporting that occurred during the registrant’s most recent fiscal quarter of the period covered by this report that has materially affected, or is likely to materially affect, the registrant’s internal control over financial reporting. |
Item 12 – Exhibits
| | | | | | |
| | (a) | | (1) | | Code of Ethics – Attached hereto as Exhibit EX-99.CODE-ETH |
| | | | (2) | | Certifications pursuant to Section 302 of the Sarbanes-Oxley Act – Attached hereto as
Exhibit EX-99.CERT. |
| | | | (3) | | Any written solicitation to purchase securities under Rule 23c-1. – Not applicable. |
| | (b) | | Certifications pursuant to Section 906 of the Sarbanes-Oxley Act – Attached hereto as
Exhibit EX-99.906CERT. |
SIGNATURES
Pursuant to the requirements of the Securities Exchange Act of 1934 and the Investment Company Act of 1940, the registrant has duly caused this report to be signed on its behalf by the undersigned, thereunto duly authorized.
| | |
| Registrant: | | The Prudential Variable Contract Account-2 |
| |
| By: | | /s/ Deborah A. Docs |
| | Deborah A. Docs |
| | Secretary |
| |
| Date: | | February 21, 2018 |
Pursuant to the requirements of the Securities Exchange Act of 1934 and the Investment Company Act of 1940, this report has been signed below by the following persons on behalf of the registrant and in the capacities and on the dates indicated.
| | |
| By: | | /s/ Stuart S. Parker |
| | Stuart S. Parker |
| | President and Principal Executive Officer |
| |
| Date: | | February 21, 2018 |
| |
| By: | | /s/ M. Sadiq Peshimam |
| | M. Sadiq Peshimam |
| | Treasurer and Principal Financial and Accounting Officer |
| |
| Date: | | February 21, 2018 |