UNITED STATES
SECURITIES AND EXCHANGE COMMISSION
Washington, D.C. 20549
FORM N-CSR
CERTIFIED SHAREHOLDER REPORT OF REGISTERED MANAGEMENT
INVESTMENT COMPANIES
| Investment Company Act file number: | 811-01612 | |
| Exact name of registrant as specified in charter: | The Prudential Variable Contract Account-2 | |
| Address of principal executive offices: | 655 Broad Street, 17th Floor | |
| Newark, New Jersey 07102 | ||
| Name and address of agent for service: | Deborah A. Docs | |
| 655 Broad Street, 17th Floor | ||
| Newark, New Jersey 07102 | ||
| Registrant’s telephone number, including area code: | 973-367-7521 | |
| Date of fiscal year end: | 12/31/2015 | |
| Date of reporting period: | 12/31/2015 | |
Item 1 – Reports to Stockholders

The Prudential Variable Contract Account-2
ANNUAL REPORT • DECEMBER 31, 2015
This report is for the information of persons participating in The Prudential Variable Contract Account-2 (VCA-2, Long-Term Growth Account, or the Account). VCA-2 is a group annuity insurance product issued by The Prudential Insurance Company of America, 751 Broad Street, Newark, NJ 07102-3777, and is distributed by Prudential Investment Management Services LLC (PIMS), member SIPC, 655 Broad Street, 19th Floor, Newark, NJ 07102. Both are Prudential Financial companies.
All are Prudential Financial companies and each is solely responsible for its financial condition and contractual obligations.
The views expressed in this report and information about the Account’s portfolio holdings are for the period covered by this report and are subject to change thereafter.
Please note that this document may include prospectus supplements that are separate from and not a part of this report.

This report is not authorized for distribution to prospective investors unless preceded or accompanied by a current prospectus for VCA-2. Investors should consider the contract and VCA-2’s investment objectives, risks, charges and expenses carefully before investing. This and other important information is contained in the prospectus that can be obtained from your financial professional. You should read the prospectus carefully before investing.
Annuity contracts contain exclusions, limitations, reductions of benefits, and terms for keeping them in force. Your plan sponsor or licensed financial professional can provide you with costs and complete details. Contract guarantees are based on the claims-paying ability of the issuing company.
A description of the Account’s proxy voting policies and procedures is available, without charge, upon request. Owners of variable annuity contracts should call 800-458-6333 to obtain descriptions of the Account’s proxy voting policies and procedures. Information regarding how the Account voted proxies relating to portfolio securities during the most recent 12-month period ended June 30 is available on the website of the Securities and Exchange Commission (Commission), at www.sec.gov.
The Account’s Statement of Additional Information contains additional information about the members of the Account’s Committee and is available without charge upon request by calling 800-458-6333.
The Account files with the Commission a complete listing of portfolio holdings as of its first and third quarter-end on Form N-Q. Form N-Q is available on the Commission’s website at www.sec.gov or by visiting the Commission’s Public Reference Room. For more information on the Commission’s Public Reference Room, please visit the Commission’s website or call 1-800-SEC-0330. Participants may obtain copies of Form N-Q filings by calling 800-458-6333.
The Prudential Variable Contract Account-2
Table of Contents | Annual Report | December 31, 2015 |
| n | LETTER TO PARTICIPANTS |
| n | MARKET OVERVIEW |
| n | REPORT OF THE INVESTMENT MANAGER |
| n | PRESENTATION OF PORTFOLIO HOLDINGS |
| n | FINANCIAL REPORTS |
| Section A | Statement of Net Assets and Financial Statements | |||
| Section B | Financial Highlights | |||
| Section C | Notes to Financial Statements | |||
| Section D | Report of Independent Registered Public Accounting Firm | |||
| Section E | Information about Directors and Officers |
The Prudential Variable Contract Account-2
Letter to Participants | December 31, 2015 |
| n | DEAR PARTICIPANT, |
At Prudential, our primary objective is to help investors achieve and maintain long-term financial success. This Variable Contract Account-2 annual report outlines our efforts to achieve this goal. We hope you find it informative and useful.
Prudential has been building on a heritage of success for more than 135 years. The quality of our businesses and risk diversification has enabled us to manage effectively through volatile markets over time. We believe the array of our products provides a highly attractive value proposition to clients like you who are focused on financial security.
Your financial professional is the best resource to help you make the most informed investment decisions. Together, you can build a diversified investment portfolio that aligns with your long-term financial goals. Please keep in mind that diversification and asset allocation strategies do not assure a profit or protect against loss in declining markets.
Thank you for selecting Prudential as one of your financial partners. We value your trust and appreciate the opportunity to help you achieve financial security.
Sincerely,

Stuart Parker
President,
The Prudential Variable Contract Account-2 | January 29, 2016 |
Market Overview — unaudited | Annual Report | December 31, 2015 |
Equity Market Overview
After experiencing heightened volatility in late 2015, the S&P 500 Index recorded a 1.39% gain.
Events that affected market performance during the year included the ongoing Greek fiscal crisis, low energy prices, a strong US dollar, slowing growth in China, and the timing of the Federal Reserve Bank’s (Fed) interest rate hike.
Stocks stumbled early in the year over concerns about US economic growth, but rebounded in the second quarter on more upbeat forecasts, reaching highs in May. More uncertainty hit the market as oil prices continued lower. However, domestic equities advanced cautiously on earnings reports and news of moderate growth in the US economy on encouraging employment numbers.
In late August, in order to “pre-empt” an expected rate hike by the Fed in September, China surprised global markets by devaluing its currency, the yuan, in order to shield its flagging exports against a more expensive dollar. Subsequently, Chinese stocks plunged and weighed on virtually all equity markets. US equities experienced a correction and rebounded in October.
Jitters over the timing of the Fed’s first interest rate rise in nearly a decade loomed over equity markets until mid December, as the Fed hiked rates by 0.25%. Markets rose immediately after the news, but then hit more turbulence through the end of the year on concerns over economic conditions in China.
Sector performance was mixed, with five in positive territory and five falling into negative territory. Consumer discretionary topped all sectors with a 10.11% increase on powerful gains in the Internet, retail, and catalogue, and strong gains in the hotels, restaurants, and leisure industry. Health care posted a solid 6.89% gain for the year with help from the life sciences, tools, and services industries, and from gains in health care providers and services industries. Consumer staples rose by 6.60%, driven by the tobacco, food products, and personal products industries. Internet technology, with high returns in internet software and services, propelled the sector to a 5.92% gain. Telecommunications, hit by weakness in the diversified telecommunication industry, landed a 3.40% return.
On the downside, financials fell slightly, returning -1.53%, hurt by heavy losses in consumer finance and capital markets, while real estate showed positive returns. Industrials returned -2.53% on significant declines in road and rail products, trading companies, and distributors. Utilities returned -4.85% on severe weakness in independent power generators, while gas utilities were strong. Materials returned -8.38% on sharp declines in mining and metals. Price destruction in oil drove energy down to a return of -21.12%.
The Russell US Indexes, which measure equity performance with respect to stock-specific styles (value and growth) and capitalization levels (small-, mid-, and large-cap), were mixed, as growth style stocks generally outpaced value style. Small-cap stocks, as measured by the Russell 2000® Index, fell -4.41%. The Russell Midcap® Index returned -2.44%. In large-cap stocks, the Russell 1000® Value Index fell, returning -3.83% against the positive 5.67% return of the Russell 1000® Growth Index.
The Morgan Stanley Capital International Europe Australasia and Far East Index (MSCI-EAFE), which measures the performance of developed markets excluding the United States and Canada, returned -0.81%, net of dividends, for the year.
International equities were pressured by geopolitical events, falling commodity prices, ongoing economic weakness in Europe, and a sustained manufacturing decline in China. European countries posted mixed performance, with heavily weighted countries struggling. Germany returned -1.89%, and France was marginally in the red with a -0.11% return. Oil producer Norway tumbled to a return of -14.99%. Stocks in the UK skidded to a -7.56% return. On the upside, Denmark led all countries, returning 23.43%.
In Asia, stocks were mixed on falling commodity prices and uncertainty over China’s weakening economic health. Japan returned 9.57% on higher corporate profits but a weaker economy. Countries with close links to China declined. Hong Kong returned -0.54% and Singapore stumbled, returning -17.71%. Commodity producer Australia returned -9.95% and New Zealand fell by -6.26%.
The MSCI Emerging Markets Index returned -14.92%. The Brazil, Russia, India, and China (BRIC) group returned -13.46%. Brazil, which is mired in a deep recession, plunged to a -41.37% return. Russia gained 4.21%. India returned -6.12% and China, hit by rollercoaster volatility, returned -7.82%.
Sources: Morgan Stanley Capital International, Standard & Poor’s, Frank Russell Company, and Prudential. All indexes are unmanaged and provide a broad indication of stock price movements. Russell indexes and Russell are service marks of the Frank Russell Company. Standard & Poor’s 500 Index comprises over 500 large, established, publicly traded stocks. The Russell 1000® Growth Index includes those Russell 1000® companies with higher price-to-book ratios and higher expected growth values. The Russell 1000® Value Index includes those Russell 1000® companies with lower price-to-book ratios and lower expected growth values. The Russell 2000® Index is a subset of the Russell 3000® Index, representing about 10% of the total market capitalization of that index. It includes about 2,000 of the smallest securities based on a combination of their market cap and current index membership. The Russell Midcap® Index is a subset of the Russell 1000® Index. It includes about 800 of the smallest securities based on a combination of their market cap and current index membership. The Russell Midcap® Index represents about 31% of the total market capitalization of the Russell 1000® companies. The MSCI EAFE Index is a free float-adjusted market capitalization index of performance that reflects stock price movements in Europe, Australasia, and the Far East. The MSCI Emerging Markets Index is a free float-adjusted market capitalization index that is designed to measure equity market performance of emerging markets. These indexes are calculated in U.S. dollars, without dividends reinvested. Investors cannot directly invest in an index. Past performance does not guarantee future results.
The Prudential Variable Contract Account-2
| December 31, 2015 |
Report of the Investment Manager - As of December 31, 2015 (Unaudited)
| Average Annual Total Returns | 1-Year | 5-Year | 10-Year | |||||||||
Account (without sales charges) | -1.14 | % | 8.69 | % | 5.70 | % | ||||||
S&P 500 Index | 1.39 | 12.55 | 7.30 | |||||||||
Past performance does not guarantee future returns. The Account performance without sales charges is shown after the deduction of all expenses, including investment management and mortality and expense charges, but does not include the effect of any sales charge or annual account charge. The returns would be lower if they included the effects of sales charges and an annual account charge.
$10,000 INVESTED OVER 10 YEARS
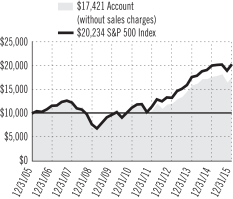
For the year ended December 31, 2015, the Prudential Variable Contract Account-2 returned -1.14%.
The net assets of the Portfolio at December 31, 2015 were $243.0 million.
The Account’s investment objective is long-term growth of capital. It is subadvised by Jennison Associates LLC (Jennison).
What were market conditions during the reporting period?
Weak energy prices, a strong US dollar, and slowing economic growth in China were key influences on the global economic landscape in 2015. Overall it was an environment with volatility in global financial markets, sluggish economic expansion, and below-average market earnings growth. Merger and acquisition activity continued at a torrid pace, and 2015 was set to challenge records for the number and size of transactions announced.
In 2015, large-cap value stocks trailed large-cap growth stocks by the widest margin since 2009 and the seventh time in 10 years that the asset class has lagged.
What strategies or holdings affected the Account’s performance?
While the S&P 500 Index (the Index) returned 1.39%, there was significant performance disparity across sectors and capitalizations. Consumer discretionary posted the largest gain and health care, consumer staples, telecommunications services, and information technology also advanced. Energy and materials suffered the largest declines.
The Account meaningfully trailed the Index. Stock selection in industrials, financials, information technology, and consumer discretionary proved detrimental to relative results. SLM and Navient were laggards in financials and the overall Account. Negative sentiment weighed on shares of SLM. Jennison believes that the business model remains strong and, at the current valuation, the reward to risk is very attractive. The Account no longer holds a position in Navient.
Marathon Oil and Hertz were other notable detractors. Marathon was hurt along with other exploration and production companies amid plummeting oil prices. Prudential Investments continues to like the company’s healthy balance sheet and improving resource base, while finding it attractively valued relative to peers. Hertz Global Holdings suffered from a number of operational challenges. Jennison believes the “low-expectations” profile of the company fits its contrarian thinking, especially given the multiple options that Hertz has to improve business performance and free cash flow generation.
Key contributors were diverse and found across sectors. Prudential Investments continues to like Alphabet’s (formerly Google) solid competitive position, strong advertising revenue, and YouTube income-generating opportunities. Revenue continued to grow strongly, margins improved, and capital expenditure growth slowed. In health care, Cigna continued to benefit from increasing enrollments and global expansion plans. Jennison likes the company’s consistent growth and finds its valuation attractive. In consumer discretionary, Carnival continues to benefit from better pricing control and expansion into China. In information technology, Jennison believes Microsoft has renewed potential to increase earnings. The company has a firmly installed base, strong account control, and minimal competition in two primary areas that are shifting to a subscription profile — Office and Windows.
While the Account’s holdings trailed the Index, the materials sector was a source of relative gain due to an underweight stance.
The S&P 500 Index is an unmanaged, market value-weighted index of over 500 stocks generally representative of the broad stock market. Investors cannot invest directly in an index. For a complete list of holdings, refer to the Statement of Net Assets section of this report.
Jennison Associates LLC is a registered investment adviser and a Prudential Financial Company.
1
Prudential Variable Contract Account-2 (VCA-2)
Presentation of Portfolio Holdings — unaudited | December 31, 2015 |
| VCA-2 | ||||
| Five Largest Holdings | (% of Net Assets | ) | ||
| Alphabet, Inc. (Class A Stock) | 3.1% | |||
| Amazon.com, Inc. | 2.5% | |||
| JPMorgan Chase & Co. | 2.5% | |||
| Facebook, Inc. (Class A Stock) | 2.4% | |||
| Wells Fargo & Co. | 2.4% | |||
For a complete listing of holdings, refer to the Statement of Net Assets section of this report. Holdings reflect only long-term investments. Holdings/Issues/Industries/Sectors are subject to change.
FINANCIAL STATEMENTS OF VCA-2
| STATEMENT OF NET ASSETS | ||||||
December 31, 2015
| LONG-TERM INVESTMENTS — 99.4% | ||||||||
| COMMON STOCKS | Shares | Value (Note 2) | ||||||
Aerospace & Defense — 2.4% | ||||||||
Boeing Co. (The) | 28,296 | $ | 4,091,319 | |||||
United Technologies Corp. | 19,143 | 1,839,068 | ||||||
| 5,930,387 | ||||||||
Auto Components — 1.2% | ||||||||
Lear Corp. | 22,993 | 2,824,230 | ||||||
Automobiles — 1.1% | ||||||||
Tesla Motors, Inc.(a) | 11,282 | 2,707,793 | ||||||
Banks — 10.2% | ||||||||
Bank of America Corp. | 300,887 | 5,063,928 | ||||||
Citigroup, Inc. | 95,120 | 4,922,460 | ||||||
JPMorgan Chase & Co. | 91,803 | 6,061,752 | ||||||
PNC Financial Services Group, Inc. | 30,159 | 2,874,454 | ||||||
Wells Fargo & Co. | 108,743 | 5,911,269 | ||||||
| 24,833,863 | ||||||||
Biotechnology — 3.1% | ||||||||
AbbVie, Inc. | 29,213 | 1,730,578 | ||||||
Alexion Pharmaceuticals, Inc.(a) | 15,721 | 2,998,781 | ||||||
Celgene Corp.(a) | 23,890 | 2,861,066 | ||||||
| 7,590,425 | ||||||||
Capital Markets — 2.8% | ||||||||
Goldman Sachs Group, Inc. (The) | 24,862 | 4,480,878 | ||||||
Morgan Stanley | 70,764 | 2,251,003 | ||||||
| 6,731,881 | ||||||||
Chemicals — 0.8% | ||||||||
FMC Corp. | 48,415 | 1,894,479 | ||||||
Communications Equipment — 0.7% | ||||||||
Brocade Communications Systems, Inc. | 187,575 | 1,721,939 | ||||||
Consumer Finance — 2.5% | ||||||||
Capital One Financial Corp. | 39,431 | 2,846,130 | ||||||
SLM Corp.(a) | 494,025 | 3,221,043 | ||||||
| 6,067,173 | ||||||||
Diversified Financial Services — 1.0% |
| |||||||
Voya Financial, Inc. | 64,066 | 2,364,676 | ||||||
Electric Utilities — 1.6% | ||||||||
FirstEnergy Corp. | 124,883 | 3,962,538 | ||||||
Electrical Equipment — 0.9% | ||||||||
Eaton Corp. PLC | 41,413 | 2,155,133 | ||||||
Electronic Equipment & Instruments — 0.8% |
| |||||||
Flextronics International Ltd.(a) | 167,098 | 1,873,169 | ||||||
Energy Equipment & Services — 1.0% | ||||||||
Halliburton Co. | 67,933 | 2,312,439 | ||||||
Food Products — 2.8% | ||||||||
ConAgra Foods, Inc. | 67,180 | 2,832,309 | ||||||
Mondelez International, Inc. | 89,414 | 4,009,324 | ||||||
| 6,841,633 | ||||||||
| COMMON STOCKS (continued) | | Shares | |
| Value (Note 2) |
| ||
Health Care Equipment & Supplies — 1.0% |
| |||||||
Zimmer Biomet Holdings, Inc. | 24,801 | $ | 2,544,335 | |||||
Health Care Providers & Services — 2.5% |
| |||||||
Cigna Corp. | 14,063 | 2,057,839 | ||||||
Express Scripts Holding Co. | 20,592 | 1,799,947 | ||||||
Laboratory Corp. Of America Holdings(a) | 18,231 | 2,254,081 | ||||||
| 6,111,867 | ||||||||
Hotels, Restaurants & Leisure — 5.4% |
| |||||||
Carnival Corp. | 81,976 | 4,466,052 | ||||||
Hyatt Hotels Corp.(a) | 45,268 | 2,128,501 | ||||||
McDonald’s Corp. | 24,123 | 2,849,891 | ||||||
Starbucks Corp. | 59,683 | 3,582,771 | ||||||
| 13,027,215 | ||||||||
Industrial Conglomerates — 1.1% | ||||||||
General Electric Co. | 88,970 | 2,771,416 | ||||||
Insurance — 2.9% | ||||||||
ACE Ltd. (Switzerland) | 28,239 | 3,299,727 | ||||||
MetLife, Inc. | 78,306 | 3,775,132 | ||||||
| 7,074,859 | ||||||||
Internet & Catalog Retail — 3.6% | ||||||||
Amazon.com, Inc.(a) | 8,902 | 6,016,773 | ||||||
Netflix, Inc.(a) | 24,588 | 2,812,375 | ||||||
| 8,829,148 | ||||||||
Internet Software & Services — 10.7% | ||||||||
Alibaba Group Holding Ltd. (China), | 27,846 | 2,263,044 | ||||||
Alphabet, Inc. (Class A Stock)(a) | 9,753 | 7,587,932 | ||||||
Alphabet, Inc. (Class C Stock) | 4,498 | 3,413,442 | ||||||
Facebook, Inc. (Class A Stock)(a) | 56,827 | 5,947,514 | ||||||
LinkedIn Corp.(a) | 15,631 | 3,518,225 | ||||||
Tencent Holdings Ltd. (China), ADR | 172,158 | 3,377,740 | ||||||
| 26,107,897 | ||||||||
IT Services — 2.6% | ||||||||
MasterCard, Inc. (Class A Stock) | 22,643 | 2,204,522 | ||||||
Visa, Inc. (Class A Stock) | 52,439 | 4,066,644 | ||||||
| 6,271,166 | ||||||||
Media — 5.3% | ||||||||
Comcast Corp. (Class A Stock) | 60,083 | 3,390,484 | ||||||
Liberty Global PLC (Series C) (United Kingdom)(a) | 71,207 | 2,903,109 | ||||||
Viacom, Inc. | 29,980 | 1,233,977 | ||||||
Vivendi SA (France), ADR | 97,402 | 2,079,533 | ||||||
Walt Disney Co. (The) | 30,055 | 3,158,179 | ||||||
| 12,765,282 | ||||||||
Multiline Retail — 1.4% | ||||||||
Target Corp. | 45,422 | 3,298,091 | ||||||
Multi-Utilities — 1.2% | ||||||||
PG&E Corp. | 54,678 | 2,908,323 | ||||||
SEE NOTES TO FINANCIAL STATEMENTS.
A1
FINANCIAL STATEMENTS OF VCA-2
| STATEMENT OF NET ASSETS | ||||||
December 31, 2015
| COMMON STOCKS | ||||||||
| (continued) | Shares | Value (Note 2) | ||||||
Oil, Gas & Consumable Fuels — 5.4% |
| |||||||
Anadarko Petroleum Corp. | 32,452 | $ | 1,576,518 | |||||
Chevron Corp. | 28,520 | 2,565,659 | ||||||
Marathon Oil Corp. | 100,103 | 1,260,297 | ||||||
Noble Energy, Inc. | 66,550 | 2,191,492 | ||||||
Occidental Petroleum Corp. | 41,253 | 2,789,115 | ||||||
Suncor Energy, Inc. (Canada) | 105,617 | 2,724,919 | ||||||
| 13,108,000 | ||||||||
Pharmaceuticals — 9.4% | ||||||||
Allergan PLC(a) | 11,985 | 3,745,313 | ||||||
Bayer AG (Germany), ADR | 6,605 | 824,535 | ||||||
Bristol-Myers Squibb Co. | 39,474 | 2,715,416 | ||||||
Merck & Co., Inc. | 64,611 | 3,412,753 | ||||||
Pfizer, Inc. | 131,479 | 4,244,142 | ||||||
Shire PLC (Ireland), ADR | 22,272 | 4,565,760 | ||||||
Teva Pharmaceuticals Industries Ltd., (Israel), ADR | 51,634 | 3,389,256 | ||||||
| 22,897,175 | ||||||||
Road & Rail — 1.4% | ||||||||
Hertz Global Holdings, Inc.(a) | 125,697 | 1,788,668 | ||||||
Union Pacific Corp. | 20,978 | 1,640,480 | ||||||
| 3,429,148 | ||||||||
Semiconductors & Semiconductor Equipment — 1.1% |
| |||||||
Texas Instruments, Inc. | 47,799 | 2,619,863 | ||||||
Software — 6.1% | ||||||||
Adobe Systems, Inc.(a) | 30,259 | 2,842,530 | ||||||
Microsoft Corp. | 82,294 | 4,565,671 | ||||||
PTC, Inc.(a) | 71,609 | 2,479,820 | ||||||
Salesforce.com, Inc.(a) | 62,198 | 4,876,323 | ||||||
| 14,764,344 | ||||||||
Technology Hardware, Storage & Peripherals — 1.2% |
| |||||||
Apple, Inc. | 14,475 | 1,523,639 | ||||||
HP, Inc. | 115,098 | 1,362,760 | ||||||
| 2,886,399 | ||||||||
Textiles, Apparel & Luxury Goods — 3.1% |
| |||||||
Coach, Inc. | 49,665 | 1,625,535 | ||||||
NIKE, Inc. | 55,348 | 3,459,250 | ||||||
Under Armour, Inc. (Class A Stock)(a) | 31,875 | 2,569,444 | ||||||
| 7,654,229 | ||||||||
Wireless Telecommunication Services — 1.1% |
| |||||||
Vodafone Group PLC | 80,736 | 2,604,543 | ||||||
TOTAL COMMON STOCKS | ||||||||
(cost $185,923,852) | 241,485,058 | |||||||
| SHORT-TERM INVESTMENT — 0.2% | ||||||||
| Shares | Value (Note 2) | |||||||
Affiliated Money Market Mutual Fund |
| |||||||
Prudential Investment Portfolios 2 — Prudential Core Taxable Money Market Fund (cost $541,004)(b) | 541,004 | $ | 541,004 | |||||
TOTAL INVESTMENTS — 99.6% |
| 242,026,062 | ||||||
OTHER ASSETS, LESS LIABILITIES — 0.4% |
| |||||||
Receivable for Securities Sold |
| $ | 2,635,725 | |||||
Dividends Receivable |
| 278,301 | ||||||
Tax Reclaim Receivable |
| 20,135 | ||||||
Payable Pending Capital Transactions |
| (158,202 | ) | |||||
Payable for Securities Purchased |
| (1,756,798 | ) | |||||
OTHER ASSETS IN EXCESS OF LIABILITIES |
| 1,019,161 | ||||||
NET ASSETS — 100% |
| $ | 243,045,223 | |||||
NET ASSETS, representing: | ||||||||
Equity of Participants — | ||||||||
3,951,849 Accumulation Units at an Accumulation Unit Value of $59.7612 |
| $ | 236,167,335 | |||||
Equity Of Annuitants |
| 5,437,910 | ||||||
Equity of The Prudential Insurance Company |
| 1,439,978 | ||||||
| $ | 243,045,223 | |||||||
The following abbreviation is used in the annual report:
| ADR | American Depositary Receipt |
| (a) | Non-income producing security. |
| (b) | Prudential Investments LLC, the Manager of the Account, also serves as Manager of the Prudential Investment Portfolios 2 — Prudential Core Taxable Money Market Fund. |
SEE NOTES TO FINANCIAL STATEMENTS.
A2
FINANCIAL STATEMENTS OF VCA-2
| STATEMENT OF NET ASSETS | ||||||
December 31, 2015
Various inputs are used in determining the value of the Account’s investments. These inputs are summarized in the three broad levels listed below.
| Level 1— | quoted prices generally in active markets for identical securities. |
| Level 2— | quoted prices for similar securities, interest rates and yield curves, prepayment speeds, foreign currency exchange rates, and other observable inputs. |
| Level 3— | unobservable inputs for securities valued in accordance with the Account’s Committee approved fair valuation procedures. |
The following is a summary of the inputs used as of December 31, 2015 in valuing such portfolio securities:
Investments in Securities | Level 1 | Level 2 | Level 3 | |||||||||
Common Stocks | ||||||||||||
Aerospace & Defense | $ | 5,930,387 | $ | — | $ | — | ||||||
Auto Components | 2,824,230 | — | — | |||||||||
Automobiles | 2,707,793 | — | — | |||||||||
Banks | 24,833,863 | — | — | |||||||||
Biotechnology | 7,590,425 | — | — | |||||||||
Capital Markets | 6,731,881 | — | — | |||||||||
Chemicals | 1,894,479 | — | — | |||||||||
Communications Equipment | 1,721,939 | — | — | |||||||||
Consumer Finance | 6,067,173 | — | — | |||||||||
Diversified Financial Services | 2,364,676 | — | — | |||||||||
Electric Utilities | 3,962,538 | — | — | |||||||||
Electrical Equipment | 2,155,133 | — | — | |||||||||
Electronic Equipment & Instruments | 1,873,169 | — | — | |||||||||
Energy Equipment & Services | 2,312,439 | — | — | |||||||||
Food Products | 6,841,633 | — | — | |||||||||
Health Care Equipment & Supplies | 2,544,335 | — | — | |||||||||
Health Care Providers & Services | 6,111,867 | — | — | |||||||||
Hotels, Restaurants & Leisure | 13,027,215 | — | — | |||||||||
Industrial Conglomerates | 2,771,416 | — | — | |||||||||
Insurance | 7,074,859 | — | — | |||||||||
Internet & Catalog Retail | 8,829,148 | — | — | |||||||||
Internet Software & Services | 26,107,897 | — | — | |||||||||
IT Services | 6,271,166 | — | — | |||||||||
Media | 12,765,282 | — | — | |||||||||
Multiline Retail | 3,298,091 | — | — | |||||||||
Multi-Utilities | 2,908,323 | — | — | |||||||||
Oil, Gas & Consumable Fuels | 13,108,000 | — | — | |||||||||
Pharmaceuticals | 22,897,175 | — | — | |||||||||
Road & Rail | 3,429,148 | — | — | |||||||||
Semiconductors & Semiconductor Equipment | 2,619,863 | — | — | |||||||||
Software | 14,764,344 | — | — | |||||||||
Technology Hardware, Storage & Peripherals | 2,886,399 | — | — | |||||||||
Textiles, Apparel & Luxury Goods | 7,654,229 | — | — | |||||||||
Wireless Telecommunication Services | 2,604,543 | — | — | |||||||||
Affiliated Money Market Mutual Fund | 541,004 | — | — | |||||||||
Total | $ | 242,026,062 | $ | — | $ | — | ||||||
SEE NOTES TO FINANCIAL STATEMENTS.
A3
FINANCIAL STATEMENTS OF VCA-2
| STATEMENT OF NET ASSETS | ||||||
December 31, 2015
The industry classification of investments and other assets in excess of liabilities shown as a percentage of net assets as of December 31, 2015 was as follows (Unaudited):
Internet Software & Services | 10.7 | % | ||
Banks | 10.2 | |||
Pharmaceuticals | 9.4 | |||
Software | 6.1 | |||
Oil, Gas & Consumable Fuels | 5.4 | |||
Hotels, Restaurants & Leisure | 5.4 | |||
Media | 5.3 | |||
Internet & Catalog Retail | 3.6 | |||
Biotechnology | 3.1 | |||
Textiles, Apparel & Luxury Goods | 3.1 | |||
Insurance | 2.9 | |||
Capital Markets | 2.8 | |||
Food Products | 2.8 | |||
IT Services | 2.6 | |||
Consumer Finance | 2.5 | |||
Health Care Providers & Services | 2.5 | |||
Aerospace & Defense | 2.4 | |||
Electric Utilities | 1.6 | |||
Road & Rail | 1.4 | |||
Multiline Retail | 1.4 |
Technology Hardware, Storage & Peripherals | 1.2 | % | ||
Auto Components | 1.2 | |||
Multi-Utilities | 1.2 | |||
Automobiles | 1.1 | |||
Semiconductors & Semiconductor Equipment | 1.1 | |||
Wireless Telecommunications Services | 1.1 | |||
Industrial Conglomerates | 1.1 | |||
Diversified Financial Services | 1.0 | |||
Energy Equipment & Services | 1.0 | |||
Health Care Equipment & Supplies | 1.0 | |||
Electrical Equipment | 0.9 | |||
Chemicals | 0.8 | |||
Electronic Equipment & Instruments | 0.8 | |||
Communications Equipment | 0.7 | |||
Affiliated Money Market Mutual Fund | 0.2 | |||
| 99.6 | ||||
Other assets in excess of liabilities | 0.4 | |||
| 100.0 | % | |||
The Account invested in derivative instruments (rights offerings) during the reporting period. The primary type of risk associated with these derivative instruments is equity risk. The effect of such derivative instruments on the Account’s financial position and financial performance as reflected in the Statement of Net Assets and Statement of Operations is presented in the summary below.
For the year ended December 31, 2015, the Account did not have any realized gain or (loss) or change in unrealized appreciation or (depreciation) on derivatives recognized in income on the Statement of Operations.
SEE NOTES TO FINANCIAL STATEMENTS.
A4
FINANCIAL STATEMENTS OF VCA-2
| STATEMENT OF OPERATIONS | ||||||
Year Ended December 31, 2015
INVESTMENT INCOME | ||||
Unaffiliated Dividend Income (net of $111,488 foreign withholding tax) | $ | 4,247,675 | ||
Affiliated Dividend Income | 11,212 | |||
Total Income | 4,258,887 | |||
EXPENSES | ||||
Fees Charged to Participants and Annuitants for Investment Management Services | (338,543 | ) | ||
Fees Charged to Participants (other than Annuitants) for Assuming Mortality and Expense Risks | (993,258 | ) | ||
Total Expenses | (1,331,801 | ) | ||
NET INVESTMENT INCOME | 2,927,086 | |||
REALIZED AND UNREALIZED GAIN (LOSS) ON INVESTMENTS | ||||
Net Realized Gain on Investment Transactions | 12,603,533 | |||
Net Change in Unrealized Appreciation (Depreciation) on Investments | (18,213,367 | ) | ||
NET LOSS ON INVESTMENTS | (5,609,834 | ) | ||
NET DECREASE IN NET ASSETS RESULTING FROM OPERATIONS | $ | (2,682,748 | ) | |
| STATEMENT OF CHANGES IN NET ASSETS | ||||||
| Year Ended December 31, | ||||||||
| 2015 | 2014 | |||||||
OPERATIONS | ||||||||
Net Investment Income | $ | 2,927,086 | $ | 2,264,114 | ||||
Net Realized Gain on Investment Transactions | 12,603,533 | 26,046,456 | ||||||
Net Change In Unrealized Appreciation (Depreciation) on Investments | (18,213,367 | ) | 2,584,419 | |||||
NET INCREASE (DECREASE) IN NET ASSETS RESULTING FROM OPERATIONS | (2,682,748 | ) | 30,894,989 | |||||
CAPITAL TRANSACTIONS | ||||||||
Purchase Payments and Transfers In | 731,752 | 1,290,974 | ||||||
Withdrawals and Transfers Out | (38,694,894 | ) | (28,656,778 | ) | ||||
Mortality and Expense Risk Charges Deducted from Annuitants’ Accounts | (22,371 | ) | (22,610 | ) | ||||
Variable Annuity Payments | (981,061 | ) | (1,119,971 | ) | ||||
NET DECREASE IN NET ASSETS RESULTING FROM CAPITAL TRANSACTIONS | (38,966,574 | ) | (28,508,385 | ) | ||||
NET INCREASE (DECREASE) IN NET ASSETS RESULTING FROM SURPLUS TRANSFERS | 744 | (21,414 | ) | |||||
TOTAL INCREASE (DECREASE) IN NET ASSETS | (41,648,578 | ) | 2,365,190 | |||||
NET ASSETS | ||||||||
Beginning of year | 284,693,801 | 282,328,611 | ||||||
End of year | $ | 243,045,223 | $ | 284,693,801 | ||||
SEE NOTES TO FINANCIAL STATEMENTS.
A5
FINANCIAL HIGHLIGHTS FOR
VCA-2
| INCOME AND CAPITAL CHANGES PER ACCUMULATION UNIT* | ||||||
(For an Accumulation Unit outstanding throughout the year)
| Year Ended December 31, | ||||||||||||||||||||
| 2015 | 2014 | 2013 | 2012 | 2011 | ||||||||||||||||
Investment Income | $ | .9469 | $ | .7348 | $ | .7032 | $ | .7051 | $ | .5578 | ||||||||||
Expenses | ||||||||||||||||||||
Investment management fee | (.0763 | ) | (.0718 | ) | (.0596 | ) | (.0493 | ) | (.0488 | ) | ||||||||||
Assuming mortality and expense risks | (.2284 | ) | (.2151 | ) | (.1786 | ) | (.1476 | ) | (.1463 | ) | ||||||||||
Net Investment Income | .6422 | .4479 | .4650 | .5082 | .3627 | |||||||||||||||
Capital Changes | ||||||||||||||||||||
Net realized and unrealized gain (loss) on investment transactions | (1.3303 | ) | 5.6719 | 12.5785 | 4.1824 | (3.1568 | ) | |||||||||||||
Net Increase (Decrease) in Accumulation Unit Value | (.6881 | ) | 6.1198 | 13.0435 | 4.6906 | (2.7941 | ) | |||||||||||||
Accumulation Unit Value | ||||||||||||||||||||
Beginning of period | 60.4493 | 54.3295 | 41.2860 | 36.5954 | 39.3895 | |||||||||||||||
End of period | $ | 59.7612 | $ | 60.4493 | $ | 54.3295 | $ | 41.2860 | $ | 36.5954 | ||||||||||
Total Return** | (1.14 | %) | 11.26 | % | 31.59 | % | 12.82 | % | (7.09 | %) | ||||||||||
Ratio of Expenses To Average Net Assets*** | .50 | % | .50 | % | .50 | % | .50 | % | .50 | % | ||||||||||
Ratio of Net Investment Income To Average Net Assets*** | 1.06 | % | .78 | % | .98 | % | 1.29 | % | .92 | % | ||||||||||
Portfolio Turnover Rate | 47 | % | 70 | % | 69 | % | 45 | % | 56 | % | ||||||||||
Number of Accumulation Units Outstanding | 3,952 | 4,579 | 5,046 | 5,495 | 6,219 | |||||||||||||||
| * | Calculated by accumulating the actual per unit amounts daily. |
| ** | Total return does not consider the effects of sales loads. Total return is calculated assuming a purchase of a share on the first day and a sale on the last day of each year reported. Total returns may reflect adjustments to conform to generally accepted accounting principles. |
| *** | These calculations exclude PICA’s equity in VCA-2. |
The above table does not reflect the annual administration charge, which does not affect the Accumulation Unit Value. This charge is made by reducing Participants’ Accumulation Accounts by a number of Accumulation Units equal in value to the charge.
SEE NOTES TO FINANCIAL STATEMENTS.
B1
NOTES TO THE FINANCIAL STATEMENTS OF
VCA-2
| Note 1: | General |
The Prudential Variable Contract Account-2 (VCA-2 or the Account) was established on January 9, 1968 by The Prudential Insurance Company of America (“PICA”) under the laws of the State of New Jersey and is registered as an open-end, diversified management investment company under the Investment Company Act of 1940 (“1940 Act”), as amended. VCA-2 has been designed for use by public school systems and certain tax-exempt organizations to provide for the purchase and payment of tax-deferred variable annuities. The investment objective of the Account is long-term growth of capital. Its investments are composed primarily of common stocks. Although variable annuity payments differ according to the investment performance of the Account, they are not affected by mortality or expense experience because PICA assumes the expense risk and the mortality risk under the contracts.
| Note 2: | Accounting Policies |
The Account follows investment company accounting and reporting guidance of the Financial Accounting Standards Board (“FASB”) Accounting Standard Codification Topic 946 Financial Services-Investment Companies. The following accounting policies conform to U.S. generally accepted accounting principles. The Account consistently follows such policies in the preparation of its financial statements.
Security Valuation: The Account holds securities and other assets that are fair valued at the close of each day the New York Stock Exchange (“NYSE”) is open for trading. Fair value is the price that would be received to sell an asset or paid to transfer a liability in an orderly transaction between market participants on the measurement date. The Account’s Committee Members (the “Committee”) has adopted Valuation Procedures for security valuation under which fair valuation responsibilities have been delegated to Prudential Investments LLC (“PI” or “Manager”). Under the current Valuation Procedures, the established Valuation Committee is responsible for supervising the valuation of portfolio securities and other assets. The Valuation Procedures permit the Account to utilize independent pricing vendor services, quotations from market makers, and alternative valuation methods when market quotations are either not readily available or not deemed representative of fair value. A record of the Valuation Committee’s actions is subject to the Committee’s review, approval, and ratification at its next regularly-scheduled quarterly meeting.
Various inputs determine how the Account’s investments are valued, all of which are categorized according to the three broad levels (Level 1, 2, or 3) detailed in the table following the Account’s Schedule of Investments.
Common and preferred stocks, exchange-traded funds, and derivative instruments, such as futures or options, that are traded on a national securities exchange are valued at the last sale price as of the close of trading on the applicable exchange where the security principally trades. Securities traded via NASDAQ are valued at the NASDAQ official closing price. To the extent these securities are valued at the last sale price or NASDAQ official closing price, they are classified as Level 1 in the fair value hierarchy.
In the event that no sale or official closing price on valuation date exists, these securities are generally valued at the mean between the last reported bid and asked prices, or at the last bid price in the absence of an ask price. These securities are classified as Level 2 in the fair value hierarchy, as the inputs are observable.
Common and preferred stocks traded on foreign securities exchanges are valued using pricing vendor services that provide model prices derived using adjustment factors based on information such as local closing price, relevant general and sector indices, currency fluctuations, depositary receipts, and futures, as applicable. Securities valued using such model prices are classified as Level 2 in the fair value hierarchy, as the adjustment factors are observable. Such securities are valued using model prices to the extent that the valuation meets the established confidence level for each security. If the confidence level is not met or the vendor does not provide a model price, securities are valued in accordance with exchange-traded common and preferred stocks discussed above.
Investments in open-end, non-exchange-traded mutual funds are valued at their net asset values as of the close of the NYSE on the date of valuation. These securities are classified as Level 1 in the fair value hierarchy since they may be purchased or sold at their net asset values on the date of valuation.
C1
Fixed income securities traded in the over-the-counter (“OTC”) market are generally valued at prices provided by approved independent pricing vendors. The pricing vendors provide these prices after evaluating observable inputs including, but not limited to yield curves, yield spreads, credit ratings, deal terms, tranche level attributes, default rates, cash flows, prepayment speeds, broker/dealer quotations, and reported trades. Securities valued using such vendor prices are classified as Level 2 in the fair value hierarchy.
OTC derivative instruments are generally valued using pricing vendor services, which derive the valuation based on inputs such as underlying asset prices, indices, spreads, interest rates, and exchange rates. These instruments are categorized as Level 2 in the fair value hierarchy.
Account Securities and other assets that cannot be priced according to the methods described above are valued based on pricing methodologies approved by the Committee. In the event that unobservable inputs are used when determining such valuations, the securities will be classified as Level 3 in the fair value hierarchy.
When determining the fair value of securities, some of the factors influencing the valuation include: the nature of any restrictions on disposition of the securities; assessment of the general liquidity of the securities; the issuer’s financial condition and the markets in which it does business; the cost of the investment; the size of the holding and the capitalization of the issuer; the prices of any recent transactions or bids/offers for such securities or any comparable securities; any available analyst media or other reports or information deemed reliable by the investment adviser regarding the issuer or the markets or industry in which it operates. Using fair value to price securities may result in a value that is different from a security’s most recent closing price and from the price used by other mutual funds to calculate their net asset values.
Rights: The Account may hold rights acquired either through a direct purchase, including as part of private placement, or pursuant to corporate actions. Rights entitle the holder to buy a proportionate amount of common stock at a specific price and time through the expiration dates. Such rights are held as long positions by the Account until exercised, sold or expired. Rights are valued at fair value in accordance with the Committee Members’ approved fair valuation procedures.
Restricted and Illiquid Securities: The Account may hold up to 15% of its net assets in illiquid securities, including those that are restricted as to disposition under securities law (“restricted securities”). Restricted securities, sometimes referred to as private placements are valued pursuant to the valuation procedures noted above.
Securities Transactions and Net Investment Income: Securities transactions are recorded on the trade date. Realized gains or losses from investment and currency transactions are calculated on the identified cost basis. Dividend income is recorded on the ex-dividend date. Interest income, including amortization of premium and accretion of discount on debt securities, as required, is recorded on the accrual basis. Expenses are recorded on the accrual basis, which may require the use of certain estimates by management that may differ from actual. Income and realized and unrealized gains and losses are allocated to the Participants and PICA on a daily basis in proportion to their respective ownership in VCA-2.
Estimates: The preparation of the financial statements requires management to make estimates and assumptions that affect the reported amounts and disclosures in the financial statements. Actual results could differ from those estimates.
Federal Income Taxes: The operations of VCA-2 are part of, and are taxed with, the operations of PICA. Under the current provisions of the Internal Revenue Code, PICA does not expect to incur federal income taxes on earnings of VCA-2 to the extent the earnings are credited under the Contracts. As a result, the Unit Value of VCA-2 has not been reduced by federal income taxes.
Annuity Reserves: Reserves are computed for purchased annuities using the Prudential 1950 Group Annuity Valuation (GAV) Table, adjusted, and a valuation interest rate related to the Assumed Investment Result (AIR). The valuation interest rate is equal to the AIR less 0.50% in contract charges defined in Note 3. The AIRs are selected by each Contract-holder and are described in the prospectus.
| Note 3: | Investment Management Agreement and Charges |
The Account has a management agreement with PI. Pursuant to this agreement, PI has responsibility for all investment advisory services and supervises the subadviser’s performance of such services. PI has entered into a subadvisory agreement with Jennison Associates LLC (“Jennison”). The subadvisory agreement
C2
provides that Jennison will furnish investment advisory services in connection with management of the Account. PI pays for the services of Jennison.
A daily charge, at an effective annual rate of 0.125% of the current value of the Participant’s (other than Annuitants’ and PICA’s) equity in VCA-2, is charged to the Account and paid to PI for investment management services. An equivalent charge is deducted monthly in determining the amount of Annuitants’ payments.
A daily charge, paid to PI for assuming mortality and expense risks, is calculated at an effective annual rate of 0.375% of the current value of the Participant’s (other than Annuitants’ and PICA’s) equity in VCA-2. A one-time equivalent charge is deducted when the Annuity Units for Annuitants are determined.
PICA, PI and Jennison are indirect, wholly-owned subsidiaries of Prudential Financial, Inc. (“Prudential”).
An annual administration charge of not more than $30 annually is deducted from the accumulation account of certain Participants either at the time of withdrawal of the value of the entire Participant’s account or at the end of the fiscal year by canceling Accumulation Units. This deduction may be made from a fixed-dollar annuity contract if the Participant is enrolled under such a contract.
A charge of 2.5% for sales and other marketing expenses is deducted from certain Participant’s purchase payments. For the year ended December 31, 2015, PICA has advised the Account it has not received any sales charges.
| Note 4: | Other Transactions with Affiliates |
The Account may enter into certain securities purchase or sale transactions under Board approved Rule 17a-7 procedures. Rule 17a-7 is an exemptive rule under the 1940 Act, that permits purchase and sale transactions among affiliated investment companies, or between an investment company and a person that is affiliated solely by reason of having a common (or affiliated) investment adviser, common directors, and/or common officers. Such transactions are subject to ratification by the Board.
During the year ended December 31, 2015, the Account invested in the Prudential Core Taxable Money Market Fund (the “Core Fund”), a portfolio of the Prudential Investment Portfolios 2, registered under the 1940 Act, and managed by PI. Earnings from the Core Fund are disclosed on the Statement of Operations as affiliated dividend income.
| Note 5: | Purchases and Sales of Portfolio Securities |
For the year ended December 31, 2015, the aggregate cost of purchases and the proceeds from sales of securities, excluding short-term investments, were $124,398,528 and $156,359,562, respectively.
| Note 6: | Unit Transactions |
The number of Accumulation Units issued and redeemed for the year ended December 31, 2015 and the year ended December 31, 2014, respectively, are as follows:
| Year Ended December 31, | ||||||||
| 2015 | 2014 | |||||||
Units issued | 12,094 | 22,635 | ||||||
Units redeemed | (638,920 | ) | (490,060 | ) | ||||
Net decrease | (626,826 | ) | (467,425 | ) | ||||
| Note 7: | Net Increase (Decrease) In Net Assets Resulting From Surplus Transfers |
The increase (decrease) in net assets resulting from surplus transfers represents the net increases to/(reductions from) PICA’s investment Account. The increase (decrease) includes reserve adjustments for mortality and expense risks assumed by PICA.
| Note 8: | Participant Loans |
Participant loan initiations are not permitted in VCA-2. However, participants who initiated loans in other accounts are permitted to direct loan repayments into VCA-2.
C3
For the year ended December 31, 2015 and year ended December 31, 2014, $2,119 and $2,166 of participant loan principal and interest have been paid to VCA-2, respectively. The participant loan principal and interest repayments are included in purchase payments and transfers in within the Statement of Changes in Net Assets.
| Note 9: | New Accounting Pronouncements |
In January 2016, the FASB issued ASU No. 2016-01 regarding “Recognition and Measurement of Financial Assets and Financial Liabilities”. The new guidance is intended to enhance the reporting model for financial instruments to provide users of financial statements with more decision-useful information and addresses certain aspects of the recognition, measurement, presentation, and disclosure of financial instruments. The new standard affects all entities that hold financial assets or owe financial liabilities. The new guidance is effective for public companies for fiscal years beginning after December 15, 2017, including interim periods within those fiscal years. At this time, management is evaluating the implications of ASU No. 2016-01 and its impact on the financial statements and disclosures has not yet been determined.
In May 2015, the FASB issued ASU No. 2015-07 regarding “Disclosures for Investments in Certain Entities That Calculate Net Asset Value per Share”. The amendments in this update are effective for the Account for fiscal years beginning after December 15, 2015, and interim periods within those fiscal years. ASU No. 2015-07 will eliminate the requirement to categorize investments in the fair value hierarchy if their fair value is measured at net asset value (“NAV”) per share (or its equivalent) using the practical expedient in the FASB’s fair value measurement guidance. Management has evaluated the implications of ASU No. 2015-07 and has determined that there is no impact on the financial statement disclosures.
C4
REPORT OF INDEPENDENT REGISTERED PUBLIC ACCOUNTING FIRM
THE COMMITTEE AND PARTICIPANTS OF
THE PRUDENTIAL VARIABLE CONTRACT ACCOUNT-2:
We have audited the accompanying statement of net assets of The Prudential Variable Contract Account-2 (hereafter referred to as the “Account”) as of December 31, 2015, and the related statement of operations for the year then ended, the statements of changes in net assets for each of the years in the two-year period then ended, and the financial highlights for each of the years in the five-year period then ended. These financial statements and financial highlights are the responsibility of the Account’s management. Our responsibility is to express an opinion on these financial statements and financial highlights based on our audits.
We conducted our audits in accordance with the standards of the Public Company Accounting Oversight Board (United States). Those standards require that we plan and perform the audit to obtain reasonable assurance about whether the financial statements and financial highlights are free of material misstatement. An audit includes examining, on a test basis, evidence supporting the amounts and disclosures in the financial statements. Our procedures included confirmation of securities owned as of December 31, 2015, by correspondence with the custodian and brokers or by other appropriate auditing procedures where replies from brokers were not received. An audit also includes assessing the accounting principles used and significant estimates made by management, as well as evaluating the overall financial statement presentation. We believe that our audits provide a reasonable basis for our opinion.
In our opinion, the financial statements and financial highlights referred to above present fairly, in all material respects, the financial position of the Account as of December 31, 2015, the results of its operations, the changes in its net assets and the financial highlights for the years or periods described in the first paragraph above, in conformity with U.S. generally accepted accounting principles.

New York, New York
February 26, 2016
D1
COMMITTEE MEMBERS AND OFFICERS OF VCA 2 (Unaudited)
VCA 2 is managed by the VCA 2 Committee. The members of the VCA 2 Committee are elected by the persons having voting rights in respect of the VCA 2 Account. The affairs of the VCA 2 Account are conducted in accordance with the Rules and Regulations of the Account. Information pertaining to the members of the VCA 2 Committee (hereafter referred to as “Committee Members”) is set forth below. Committee Members who are not deemed to be “interested persons” of VCA 2 as defined in the Investment Company Act of 1940, as amended (the “1940 Act”) are referred to as “Independent Committee Members.” Committee Members who are deemed to be “interested persons” of VCA 2 are referred to as “Interested Committee Members.” Information pertaining to the Officers of VCA 2 is also set forth below.
| Independent Committee Members(1) | ||||
Name, Address, Age Position(s) Portfolios Overseen | Principal Occupation(s) During Past Five Years | Other Directorships Held | ||
Ellen S. Alberding (57) Committee Member Portfolios Overseen: 67 | President and Board Member, The Joyce Foundation (charitable foundation) (since 2002); Vice Chair, City Colleges of Chicago (community college system) (since 2011); Trustee, Skills for America’s Future (national initiative to connect employers to community colleges) (since 2011); Trustee, National Park Foundation (charitable foundation for national park system) (since 2009); Trustee, Economic Club of Chicago (since 2009). | None. | ||
Kevin J. Bannon (63) Committee Member Portfolios Overseen: 67 | Managing Director (since April 2008) and Chief Investment Officer (October 2008-November 2013) of Highmount Capital LLC (registered investment adviser); formerly Executive Vice President and Chief Investment Officer (April 1993-August 2007) of Bank of New York Company; President (May 2003-May 2007) of BNY Hamilton Family of Mutual Funds. | Director of Urstadt Biddle Properties (equity real estate investment trust) (since September 2008). | ||
Linda W. Bynoe (63) Committee Member Portfolios Overseen: 67 | President and Chief Executive Officer (since March 1995) and formerly Chief Operating Officer (December 1989-February 1995) of Telemat Ltd. (management consulting); formerly Vice President (January 1985-June 1989) at Morgan Stanley & Co. (broker-dealer). | Director of Simon Property Group, Inc. (retail real estate) (May 2003-May 2012); Director of Anixter International, Inc. (communication products distributor) (since January 2006); Director of Northern Trust Corporation (financial services) (since April 2006); Trustee of Equity Residential (residential real estate) (since December 2009). | ||
Keith F. Hartstein (59) Committee Member Portfolios Overseen: 67 | Retired; Member (since November 2014) of the Governing Council of the Independent Directors Council (organization of independent mutual fund directors); formerly President and Chief Executive Officer (2005-2012), Senior Vice President (2004-2005), Senior Vice President of Sales and Marketing (1997-2004), and various executive management positions (1990-1997), John Hancock Funds, LLC (asset management); Chairman, Investment Company Institute’s Sales Force Marketing Committee (2003-2008). | None. | ||
Michael S. Hyland, CFA (70) Committee Member Portfolios Overseen: 67 | Retired (since February 2005); formerly Senior Managing Director (July 2001-February 2005) of Bear Stearns & Co, Inc.; Global Partner, INVESCO (1999-2001); Managing Director and President of Salomon Brothers Asset Management (1989-1999). | None. | ||
Richard A. Redeker (72) Committee Member & Independent Chair Portfolios Overseen: 67 | Retired Mutual Fund Senior Executive (47 years); Management Consultant; Director, Mutual Fund Directors Forum (since 2014); Independent Directors Council (organization of independent mutual fund directors)-Executive Committee, Chair of Policy Steering Committee, Governing Council. | None. | ||
Stephen G. Stoneburn (72) Committee Member Portfolios Overseen: 67 | Chairman (since July 2011), President and Chief Executive Officer (since June 1996) of Quadrant Media Corp. (publishing company); formerly President (June 1995-June 1996) of Argus Integrated Media, Inc.; Senior Vice President and Managing Director (January 1993-1995) of Cowles Business Media; Senior Vice President of Fairchild Publications, Inc. (1975-1989). | None. | ||
E1
| Interested Committee Members(1) | ||||
Name, Address, Age Position(s) Portfolios Overseen | Principal Occupation(s) During Past Five Years | Other Directorships Held | ||
Stuart S. Parker (53) Committee Member & President Portfolios Overseen: 67 | President of Prudential Investments LLC (since January 2012); Executive Vice President of Prudential Investment Management Services LLC (since December 2012); Executive Vice President of Jennison Associates LLC and Head of Retail Distribution of Prudential Investments LLC (June 2005-December 2011). | |||
Scott E. Benjamin (42) Committee Member & Vice President Portfolios Overseen: 67 | Executive Vice President (since June 2009) of Prudential Investments LLC; Executive Vice President (June 2009-June 2012) and Vice President (since June 2012) of Prudential Investment Management Services LLC; Executive Vice President (since September 2009) of AST Investment Services, Inc.; Senior Vice President of Product Development and Marketing, Prudential Investments (since February 2006); Vice President of Product Development and Product Management, Prudential Investments (2003-2006). | |||
Grace C. Torres* (56) Committee Member Portfolios Overseen: 65 | Retired; formerly Treasurer and Principal Financial and Accounting Officer of the Prudential Investments Funds, Target Funds, Advanced Series Trust, Prudential Variable Contract Accounts and The Prudential Series Fund (1998-June 2014); Assistant Treasurer (March 1999-June 2014) and Senior Vice President (September 1999-June 2014) of Prudential Investments LLC; Assistant Treasurer (May 2003-June 2014) and Vice President (June 2005-June 2014) of AST Investment Services, Inc.; Senior Vice President and Assistant Treasurer (May 2003-June 2014) of Prudential Annuities Advisory Services, Inc. | Director (since July 2015) of Sun Bancorp, Inc. N.A. | ||
* Note: Prior to her retirement in 2014, Ms. Torres was employed by Prudential Investments LLC. Due to her prior employment, she is considered to be an “interested person” under the 1940 Act. Ms. Torres is a non-management Interested Committee Member.
(1) The year that each Committee Member joined the VCA 2 Committee is as follows: Ellen S. Alberding, 2013; Kevin J. Bannon, 2008; Linda W. Bynoe, 2008; Keith F. Hartstein, 2013; Michael S. Hyland, 2008; Richard A. Redeker, 2008; Stephen G. Stoneburn, 2008; Grace C. Torres, 2015; Stuart S. Parker, Committee Member since 2015 and President since 2012; Scott E. Benjamin, Committee Member since 2010 and Vice President since 2009.
| VCA 2 Officers(a) | ||||
Name, Address and Age Position with Account | Principal Occupation(s) During Past Five Years | Length of Service as Officer | ||
Raymond A. O’Hara (60) Chief Legal Officer | Vice President and Corporate Counsel (since July 2010) of Prudential Insurance Company of America (Prudential); Vice President (March 2011-Present) of Pruco Life Insurance Company and Pruco Life Insurance Company of New Jersey; Vice President and Corporate Counsel (March 2011-Present) of Prudential Annuities Life Assurance Corporation; Chief Legal Officer of Prudential Investments LLC (since June 2012); Chief Legal Officer of Prudential Mutual Fund Services LLC (since June 2012) and Corporate Counsel of AST Investment Services, Inc. (since June 2012); formerly Assistant Vice President and Corporate Counsel (September 2008-July 2010) of The Hartford Financial Services Group, Inc.; formerly Associate (September 1980-December 1987) and Partner (January 1988–August 2008) of Blazzard & Hasenauer, P.C. (formerly, Blazzard, Grodd & Hasenauer, P.C.). | Since 2012 | ||
Chad A. Earnst (40) Chief Compliance Officer | Chief Compliance Officer (September 2014-Present) of Prudential Investments LLC; Chief Compliance Officer (September 2014-Present) of the Prudential Investments Funds, Target Funds, Advanced Series Trust, The Prudential Series Fund, Prudential’s Gibraltar Fund, Inc., Prudential Global Short Duration High Yield Income Fund, Inc., Prudential Short Duration High Yield Fund, Inc. and Prudential Jennison MLP Income Fund, Inc.; formerly Assistant Director (March 2010-August 2014) of the Asset Management Unit, Division of Enforcement, US Securities & Exchange Commission; Assistant Regional Director (January 2010-August 2014), Branch Chief (June 2006–December 2009) and Senior Counsel (April 2003-May 2006) of the Miami Regional Office, Division of Enforcement, US Securities & Exchange Commission. | Since 2014 | ||
Deborah A. Docs (58) Secretary | Vice President and Corporate Counsel (since January 2001) of Prudential; Vice President (since December 1996) and Assistant Secretary (since March 1999) of Prudential Investments LLC; formerly Vice President and Assistant Secretary (May 2003-June 2005) of AST Investment Services, Inc. | Since 2004 | ||
Jonathan D. Shain (57) Assistant Secretary | Vice President and Corporate Counsel (since August 1998) of Prudential; Vice President and Assistant Secretary (since May 2001) of Prudential Investments LLC; Vice President and Assistant Secretary (since February 2001) of Prudential Mutual Fund Services LLC; formerly Vice President and Assistant Secretary (May 2003-June 2005) of AST Investment Services, Inc. | Since 2005 | ||
Claudia DiGiacomo (41) Assistant Secretary | Vice President and Corporate Counsel (since January 2005) of Prudential; Vice President and Assistant Secretary of Prudential Investments LLC (since December 2005); Associate at Sidley Austin Brown & Wood LLP (1999-2004). | Since 2005 | ||
E2
| VCA 2 Officers(a) | ||||
Name, Address and Age Position with Account | Principal Occupation(s) During Past Five Years | Length of Service as Officer | ||
Andrew R. French (53) Assistant Secretary | Vice President and Corporate Counsel (since February 2010) of Prudential; formerly Director and Corporate Counsel (2006-2010) of Prudential; Vice President and Assistant Secretary (since January 2007) of Prudential Investments LLC; Vice President and Assistant Secretary (since January 2007) of Prudential Mutual Fund Services LLC. | Since 2006 | ||
Amanda S. Ryan (38) Assistant Secretary | Director and Corporate Counsel (since March 2012) of Prudential; Director and Assistant Secretary (since June 2012) of Prudential Investments LLC; Associate at Ropes & Gray LLP (2008-2012). | Since 2012 | ||
Theresa C. Thompson (53) Deputy Chief Compliance Officer | Vice President, Compliance, Prudential Investments LLC (since April 2004); and Director, Compliance, Prudential Investments LLC (2001-2004). | Since 2008 | ||
Richard W. Kinville (47) Anti-Money Laundering Compliance Officer | Vice President, Corporate Compliance, Anti-Money Laundering Unit (since January 2005) of Prudential; committee member of the American Council of Life Insurers Anti-Money Laundering and Critical Infrastructure Committee (since January 2007); formerly Investigator and Supervisor in the Special Investigations Unit for the New York Central Mutual Fire Insurance Company (August 1994-January 1999); Investigator in AXA Financial’s Internal Audit Department and Manager in AXA’s Anti-Money Laundering Office (January 1999-January 2005); first chair of the American Council of Life Insurers Anti-Money Laundering and Critical Infrastructure Committee (June 2007-December 2009). | Since 2011 | ||
M. Sadiq Peshimam (52) Treasurer and Principal Financial and Accounting Officer | Assistant Treasurer of funds in the Prudential Mutual Fund Complex (2006-2014); Vice President (since 2005) of Prudential Investments LLC. | Since 2006 | ||
Peter Parrella (57) Assistant Treasurer | Vice President (since 2007) and Director (2004-2007) within Prudential Mutual Fund Administration; formerly Tax Manager at SSB Citi Fund Management LLC (1997-2004). | Since 2007 | ||
Lana Lomuti (48) Assistant Treasurer | Vice President (since 2007) and Director (2005-2007), within Prudential Mutual Fund Administration; formerly Assistant Treasurer (December 2007-February 2014) of The Greater China Fund, Inc. | Since 2014 | ||
Linda McMullin (54) Assistant Treasurer | Vice President (since 2011) and Director (2008-2011) within Prudential Mutual Fund Administration. | Since 2014 | ||
(a) Excludes Mr. Parker and Mr. Benjamin, Interested Committee Members who also serve as President and Vice President, respectively.
Explanatory Notes to Tables:
| • | Committee Members are deemed to be “Interested,” as defined in the 1940 Act, by reason of their affiliation with Prudential Investments LLC and/or an affiliate of Prudential Investments LLC. |
| • | Unless otherwise noted, the address of all Committee Members and Officers is c/o Prudential Investments LLC, 655 Broad Street, Newark, New Jersey 07102-4077. |
| • | There is no set term of office for Committee Members or Officers. The Committee Members have adopted a retirement policy, which calls for the retirement of Committee Members on December 31 of the year in which they reach the age of 75. |
| • | “Other Directorships Held” includes only directorships of companies required to register or file reports with the SEC under the 1934 Act (that is, “public companies”) or other investment companies registered under the 1940 Act. |
| • | “Portfolios Overseen” includes all investment companies managed by Prudential Investments LLC. The investment companies for which Prudential Investments LLC serves as manager include the Prudential Investments Mutual Funds, The Prudential Variable Contract Accounts, Target Mutual Funds, Prudential Short Duration High Yield Fund, Inc., Prudential Global Short Duration High Yield Fund, Inc., The Prudential Series Fund, Prudential’s Gibraltar Fund, Inc. and the Advanced Series Trust. |
E3
The toll-free number shown below can be used to make transfers and reallocations, review how your premiums are being allocated, and receive current investment option values in your contract. Unit values for each investment option are available to all participants from the toll-free number. Please be sure to have your contract number available when you call.
(800) 458-6333
The Prudential Insurance Company of America 751 Broad Street Newark, NJ 07102-3777
| Presorted Standard U.S. Postage PAID Prudential | |||
©2016 Prudential Financial, Inc. and its related entities. Prudential Retirement, Prudential, the Prudential logo, the Rock symbol, and Bring Your Challenges are service marks of Prudential Financial, Inc. and its related entities, registered in many jurisdictions worldwide.
0239312-00004-00 LT.RS.001
Item 2 – Code of Ethics – – See Exhibit (a)
As of the end of the period covered by this report, the registrant has adopted a code of ethics (the “Section 406 Standards for Investment Companies – Ethical Standards for Principal Executive and Financial Officers”) that applies to the registrant’s Principal Executive Officer and Principal Financial Officer; the registrant’s Principal Financial Officer also serves as the Principal Accounting Officer.
The registrant hereby undertakes to provide any person, without charge, upon request, a copy of the code of ethics. To request a copy of the code of ethics, contact the registrant 973-367-7521, and ask for a copy of the Section 406 Standards for Investment Companies – Ethical Standards for Principal Executive and Financial Officers.
Item 3 – Audit Committee Financial Expert –
The registrant’s Board has determined that Mr. Kevin J. Bannon, member of the Board’s Audit Committee is an “audit committee financial expert,” and that he is “independent,” for purposes of this Item.
Item 4 – Principal Accountant Fees and Services –
(a) Audit Fees
For the fiscal years ended December 31, 2015 and December 31, 2014, KPMG LLP (“KPMG”), the Registrant’s principal accountant, billed the Registrant $19,570 and $19,570, respectively, for professional services rendered for the audit of the Registrant’s annual financial statements or services that are normally provided in connection with statutory and regulatory filings.
(b) Audit-Related Fees
For the fiscal years ended December 31, 2015 and December 31, 2014: none.
(c) Tax Fees
For the fiscal years ended December 31, 2015 and December 31, 2014: none.
(d) All Other Fees
For the fiscal years ended December 31, 2015 and December 31, 2014: none.
(e) (1) Audit Committee Pre-Approval Policies and Procedures
THE PRUDENTIAL MUTUAL FUNDS
AUDIT COMMITTEE POLICY
on
Pre-Approval of Services Provided by the Independent Accountants
The Audit Committee of each Prudential Mutual Fund is charged with the responsibility to monitor the independence of the Fund’s independent accountants. As part of this responsibility, the Audit Committee must pre-approve any independent accounting firm’s engagement to render audit and/or permissible non-audit services, as required by law. In evaluating a proposed engagement of the independent accountants, the Audit Committee will assess the effect that the engagement might reasonably be expected to have on the accountant’s independence. The Committee’s evaluation will be based on:
| ● | a review of the nature of the professional services expected to be provided, |
| ● | a review of the safeguards put into place by the accounting firm to safeguard independence, and |
| ● | periodic meetings with the accounting firm. |
Policy for Audit and Non-Audit Services Provided to the Funds
On an annual basis, the scope of audits for each Fund, audit fees and expenses, and audit-related and non-audit services (and fees proposed in respect thereof) proposed to be performed by the Fund’s independent accountants will be presented by the Treasurer and the independent accountants to the Audit Committee for review and, as appropriate, approval prior to the initiation of such services. Such presentation shall be accompanied by confirmation by both the Treasurer and the independent accountants that the proposed services will not adversely affect the independence of the independent accountants. Proposed services shall be described in sufficient detail to enable the Audit Committee to assess the appropriateness of such services and fees, and the compatibility of the provision of such services with the auditor’s independence. The Committee shall receive periodic reports on the progress of the audit and other services which are approved by the Committee or by the Committee Chair pursuant to authority delegated in this Policy.
The categories of services enumerated under “Audit Services”, “Audit-related Services”, and “Tax Services” are intended to provide guidance to the Treasurer and the independent accountants as to those categories of services which the Committee believes are generally consistent with the independence of the independent accountants and which the Committee (or the Committee Chair) would expect upon the presentation of specific proposals to pre-approve. The enumerated categories are not intended as an exclusive list of audit, audit-related or tax services, which the Committee (or the Committee Chair) would consider for pre-approval.
Audit Services
The following categories of audit services are considered to be consistent with the role of the Fund’s independent accountants:
| Ø | Annual Fund financial statement audits |
| Ø | Seed audits (related to new product filings, as required) |
| Ø | SEC and regulatory filings and consents |
Audit-related Services
The following categories of audit-related services are considered to be consistent with the role of the Fund’s independent accountants:
| Ø | Accounting consultations |
| Ø | Fund merger support services |
| Ø | Agreed Upon Procedure Reports |
| Ø | Attestation Reports |
| Ø | Other Internal Control Reports |
Individual audit-related services that fall within one of these categories and are not presented to the Audit Committee as part of the annual pre-approval process will be subject to pre-approval by the Committee Chair (or any other Committee member on whom this responsibility has been delegated) so long as the estimated fee for those services does not exceed $30,000.
Tax Services
The following categories of tax services are considered to be consistent with the role of the Fund’s independent accountants:
| Ø | Tax compliance services related to the filing or amendment of the following: |
| ¡ | Federal, state and local income tax compliance; and, |
| ¡ | Sales and use tax compliance |
| Ø | Timely RIC qualification reviews |
| Ø | Tax distribution analysis and planning |
| Ø | Tax authority examination services |
| Ø | Tax appeals support services |
| Ø | Accounting methods studies |
| Ø | Fund merger support services |
| Ø | Tax consulting services and related projects |
Individual tax services that fall within one of these categories and are not presented to the Audit Committee as part of the annual pre-approval process will be subject to pre-approval by the Committee Chair (or any other Committee member on whom this responsibility has been delegated) so long as the estimated fee for those services does not exceed $30,000.
Other Non-audit Services
Certain non-audit services that the independent accountants are legally permitted to render will be subject to pre-approval by the Committee or by one or more Committee members to whom the Committee has delegated this authority and who will report to the full Committee any pre-approval decisions made pursuant to this Policy. Non-audit services presented for pre-approval pursuant to this paragraph will be accompanied by a confirmation from both the Treasurer and the independent accountants that the proposed services will not adversely affect the independence of the independent accountants.
Proscribed Services
The Fund’s independent accountants will not render services in the following categories of non-audit services:
| Ø | Bookkeeping or other services related to the accounting records or financial statements of the Fund |
| Ø | Financial information systems design and implementation |
| Ø | Appraisal or valuation services, fairness opinions, or contribution-in-kind reports |
| Ø | Actuarial services |
| Ø | Internal audit outsourcing services |
| Ø | Management functions or human resources |
| Ø | Broker or dealer, investment adviser, or investment banking services |
| Ø | Legal services and expert services unrelated to the audit |
| Ø | Any other service that the Public Company Accounting Oversight Board determines, by regulation, is impermissible. |
Pre-approval of Non-Audit Services Provided to Other Entities Within the Prudential Fund Complex
Certain non-audit services provided to Prudential Investments LLC or any of its affiliates that also provide ongoing services to the Prudential Mutual Funds will be subject to pre-approval by the Audit Committee. The only non-audit services provided to these entities that will require pre-approval are those related directly to the operations and financial reporting of the Funds. Individual projects that are not presented to the Audit Committee as part of the annual pre-approval process will be subject to pre-approval by the Committee Chair (or any other Committee member on whom this responsibility has been delegated) so long as the estimated fee for those services does not exceed $30,000. Services presented for pre-approval pursuant to this paragraph will be accompanied by a confirmation from both the Treasurer and the independent accountants that the proposed services will not adversely affect the independence of the independent accountants.
Although the Audit Committee will not pre-approve all services provided to Prudential Investments LLC and its affiliates, the Committee will receive an annual report from the Fund’s independent accounting firm showing the aggregate fees for all services provided to Prudential Investments and its affiliates.
| (e) (2) | Percentage of services referred to in 4(b) – 4(d) that were approved by the audit committee – |
For the fiscal years ended December 31, 2015 and December 31, 2014: none.
| (f) | Percentage of hours expended attributable to work performed by other than full time employees of principal accountant if greater than 50%. |
The percentage of hours expended on the principal accountant’s engagement to audit the registrant’s financial statements for the most recent fiscal year that were attributed to work performed by persons other than the principal accountant’s full-time, permanent employees was 0%.
| (g) | Non-Audit Fees |
The aggregate non-audit fees billed by KPMG for services rendered to the registrant’s investment adviser and any entity controlling, controlled by, or under common control with the investment adviser that provides ongoing services to the registrant for the fiscal years ended December 31, 2015 and December 31, 2014 was $0 and $0, respectively.
| (h) | Principal Accountant’s Independence |
Not applicable as KPMG has not provided non-audit services to the registrant’s investment adviser and any entity controlling, controlled by, or under common control with the investment adviser that provides ongoing services to the registrant that were not pre-approved pursuant to Rule 2-01(c)(7)(ii) of Regulation S-X.
| Item 5 – | Audit Committee of Listed Registrants – Not applicable. |
| Item 6 – | Schedule of Investments – The schedule is included as part of the report to shareholders filed under Item 1 of this Form. |
| Item 7 – | Disclosure of Proxy Voting Policies and Procedures for Closed-End Management Investment Companies – Not applicable. |
| Item 8 – | Portfolio Managers of Closed-End Management Investment Companies – Not applicable. |
| Item 9 – | Purchases of Equity Securities by Closed-End Management Investment Company and Affiliated Purchasers – Not applicable. |
| Item 10 – | Submission of Matters to a Vote of Security Holders – Not applicable. |
| Item 11 – | Controls and Procedures |
| (a) | It is the conclusion of the registrant’s principal executive officer and principal financial officer that the effectiveness of the registrant’s current disclosure controls and procedures (such disclosure controls and procedures having been evaluated within 90 days of the date of this filing) provide reasonable assurance that the information required to be disclosed by the registrant has been recorded, processed, summarized and reported within the time period specified in the Commission’s rules and forms and that the information required to be disclosed by the registrant has been accumulated and communicated to the registrant’s principal executive officer and principal financial officer in order to allow timely decisions regarding required disclosure. |
| (b) | There has been no significant change in the registrant’s internal control over financial reporting that occurred during the registrant’s most recent fiscal quarter of the period covered by this report that has materially affected, or is likely to materially affect, the registrant’s internal control over financial reporting. |
| Item 12 – | Exhibits |
| (a) | (1) Code of Ethics – Attached hereto as Exhibit EX-99.CODE-ETH |
| (2) | Certifications pursuant to Section 302 of the Sarbanes-Oxley Act – Attached hereto as Exhibit EX-99.CERT. |
| (3) | Any written solicitation to purchase securities under Rule 23c-1. – Not applicable. |
| (b) | Certifications pursuant to Section 906 of the Sarbanes-Oxley Act – Attached hereto as Exhibit EX-99.906CERT. |
SIGNATURES
Pursuant to the requirements of the Securities Exchange Act of 1934 and the Investment Company Act of 1940, the registrant has duly caused this report to be signed on its behalf by the undersigned, thereunto duly authorized.
Registrant: The Prudential Variable Contract Account-2
| By: | /s/Deborah A. Docs | |
| Deborah A. Docs | ||
| Secretary | ||
| Date: | February 29, 2016 | |
Pursuant to the requirements of the Securities Exchange Act of 1934 and the Investment Company Act of 1940, this report has been signed below by the following persons on behalf of the registrant and in the capacities and on the dates indicated.
| By: | /s/Stuart S. Parker | |
| Stuart S. Parker | ||
| President and Principal Executive Officer | ||
| Date: | February 29, 2016 | |
| By: | /s/M. Sadiq Peshimam | |
| M. Sadiq Peshimam | ||
| Treasurer and Principal Financial and Accounting Officer | ||
| Date: | February 29, 2016 | |