UNITED STATES
SECURITIES AND EXCHANGE COMMISSION
Washington, D.C. 20549
FORMN-CSR
CERTIFIED SHAREHOLDER REPORT OF REGISTERED MANAGEMENT INVESTMENT
COMPANIES
| | |
| Investment Company Act file number: | | 811-01612 |
| |
| Exact name of registrant as specified in charter: | | The Prudential Variable Contract Account - 2 |
| |
| Address of principal executive offices: | | 655 Broad Street, 17th Floor |
| | Newark, New Jersey 07102 |
| |
| Name and address of agent for service: | | Andrew R. French |
| | 655 Broad Street, 17th Floor |
| | Newark, New Jersey 07102 |
| |
| Registrant’s telephone number, including area code: | | 800-225-1852 |
| |
| Date of fiscal year end: | | 12/31/2018 |
| |
| Date of reporting period: | | 12/31/2018 |
Item 1 – Reports to Stockholders
The Prudential Variable Contract Account-2
| | |
| ANNUAL REPORT | | December 31, 2018 |

This report is for the information of persons participating in The Prudential Variable Contract Account-2 (VCA-2, or the “Account”). VCA-2 is a group annuity insurance product issued by The Prudential Insurance Company of America, 751 Broad Street, Newark, NJ 07102-3777, and is distributed by Prudential Investment Management Services LLC (PIMS), member SIPC, 655 Broad Street, 19th Floor, Newark, NJ 07102. Both are Prudential Financial companies.
All are Prudential Financial companies and each is solely responsible for its financial condition and contractual obligations.
The views expressed in this report and information about the Account’s portfolio holdings are for the period covered by this report and are subject to change thereafter.
Please note that this document may include prospectus supplements that are separate from and not a part of this report.

Investors should consider the contract and VCA-2’s investment objectives, risks, charges and expenses carefully before investing. This and other important information is contained in the prospectus that can be obtained from your financial professional. You should read the prospectus carefully before investing.
Annuity contracts contain exclusions, limitations, reductions of benefits, and terms for keeping them in force. Your plan sponsor or licensed financial professional can provide you with costs and complete details. Contract guarantees are based on the claims-paying ability of the issuing company.
Information regarding how the Account voted proxies relating to portfolio securities during the most recent12-month period ended June 30 is available on the website of the Securities and Exchange Commission (Commission), at www.sec.gov.
The Account’s Statement of Additional Information contains additional information about the members of the Account’s Committee and is available without charge upon request by calling (800)458-6333.
The Account will file with the Commission a complete listing of portfolio holdings as of its first and third quarter-end onForm N-PORT.Form N-PORT will be available on the Commission’s website atwww.sec.gov or call(800) SEC-0330. Participants may obtain copies of Form N-PORT filings by calling(800) 458-6333.
| | | | |
The Prudential Variable Contract Account-2 Table of Contents | | Annual Report | | December 31, 2018 |
| ∎ | | REPORT OF THE INVESTMENT MANAGERS |
| ∎ | | PRESENTATION OF PORTFOLIO HOLDINGS |
| | | | |
| Section A | | Statement of Net Assets and Other Financial Statements | | |
| Section B | | Financial Highlights | | |
| Section C | | Notes to Financial Statements | | |
| Section D | | Report of Independent Registered Public Accounting Firm | | |
| Section E | | Information about Trustees and Officers | | |
| | |
The Prudential Variable Contract Account-2 Letter to Participants | | December 31, 2018 |
At Prudential, our primary objective is to help investors achieve and maintain long-term financial success. This Variable Contract Account-2 annual report outlines our efforts to achieve this goal. We hope you find it informative and useful.
Prudential has been building on a heritage of success for more than 135 years. We believe the array of our products provides a highly attractive value proposition to clients like you who are focused on financial security.
Your financial professional is the best resource to help you make the most informed investment decisions. Together, you can build a diversified investment portfolio that aligns with your long-term financial goals. Please keep in mind that diversification and asset allocation strategies do not assure a profit or protect against loss in declining markets.
Thank you for selecting Prudential as one of your financial partners. We value your trust and appreciate the opportunity to help you achieve financial security.
Sincerely,

Stuart Parker
President,
The Prudential Variable Contract Account-2 | January 31, 2019 |
| | | | |
| Market Overview — unaudited | | Annual Report | | December 31, 2018 |
Equity Market Overview
Stock markets worldwide retreated in 2018 and volatility spiked late in the year, triggered by uncertainties regarding interest rates, a potential trade war, slowing global economic growth, geopolitical issues, and other challenges.
In the US, the broad-based Russell 3000® Index and the S&P 500® Index returned-5.24% and-4.38%, respectively, for the year but held up better than international stocks in general. Equities trading in developed markets outside the US and Canada, as measured by the MSCI EAFE Index, fell 13.79%. Stocks in emerging markets reversed course. After posting strong gains in 2017, the MSCI Emerging Markets Index finished down 14.58%. (Returns are in US dollars, excluding dividends.)
Global economy and interest rates
In contrast to 2017’s global synchronized growth, 2018 saw global divergence characterized by strength in the US and weakness in many other parts of the world. In the US, economic growth remained healthy but decelerated slightly in the third quarter. Corporate earnings were generally solid, companies continued to hire at a strong pace, and inflation remained benign. The US dollar strengthened against most other currencies, and oil prices declined.
Several emerging markets economies, such as Argentina and Turkey, faced severe challenges in 2018, and the performance of other countries ran somewhere in between. In China, economic activity weakened and imports slowed, which had a negative impact on other economies, particularly in Europe. In the United Kingdom, wage growth improved, but uncertainty regarding negotiations to leave the European Union (known as Brexit) created a drag on stock prices. The European political backdrop became a bit more volatile late in the period, spurred by concerns over cohesion in the eurozone after the election of an anti-establishment coalition government in Italy that is skeptical of the European Union and widespread protests over stagnant wage growth in France.
Against this backdrop of decelerating economic activity and rising global tensions, many central banks continued to tighten monetary policy. In December, the Federal Reserve (the Fed) raised its target range for the short-term federal funds rate to2.25%-2.50%, following three rate hikes earlier in the year. The Fed also moderated its median projection for additional hikes going forward. A number of other central banks raised rates or took other measures to reduce stimulus during the period. For example, the European Central Bank ended its quantitative-easing bond-purchase program. China, however, moved to stimulate its economy, but these efforts did not gain much traction.
Equity markets fluctuated sharply
Volatility picked up significantly in 2018. The CBOE Volatility Index (VIX) average annual level rose sharply in 2018 from 2017.
After kicking off the new year with a rally, stocks declined in early February in reaction to reports of a sharp rise in average hourly earnings, which triggered concerns about inflation and that the Fed might raise rates more quickly than expected. Stocks recovered but sold off again in March, driven by the prospects of a tariff trade war between the US and China. US companies continued to report strong earnings, fueled in part by tax cuts, and stocks advanced throughout the spring and summer.
In the fall, sentiment shifted again in reaction to Fed comments perceived by many as hawkish, weaker growth in China, and rising trade tensions. The price of a42-gallon barrel of Current West Texas Intermediate Crude Oil, which had risen to $76.41 per barrel in October, plunged to $45.41 at the end of the period. The year closed with a US government shutdown due to a stalemate over border wall funding. Many of these factors exerted pressure on European, Japanese, and US stock markets.
Strong earnings growth, combined with the market decline, brought US equity valuations down from elevated levels to multiples more in line with long-term averages. For the fourth quarter, the Russell 3000 returned -14.30% and the MSCI EAFE Index returned-12.54%, although the MSCI Emerging Markets Index held up better, declining 7.47%.
Investors’ desire for less-risky assets prompted a rally in US Treasuries in December. The yield on the10-year note, which moves opposite to its price, ended the year up 28 basis points (0.28%) at approximately 2.68%.
S&P 500: leaders and laggards
Three of the S&P 500’s 11 sectors finished higher during the period. They were Health Care (+6.5%) and Utilities (+4.1%), which include defensive stocks less correlated to the economy, and Consumer Discretionary (+0.8%). Five sectors posted double-digit losses. Energy performed worst(-18.1%), hurt by the sharp drop in oil prices. The next worst-performing sectors were Materials(-14.7%), Industrials(-13.3%), Financials(-13.0%), Communication Services(-12.5%), Consumer Staples(-8.4%), Real Estate(-2.2%), and Information Technology(-0.3%).
| | | | |
| Market Overview — unaudited(continued) | | Annual Report | | December 31, 2018 |
Growth andlarger-cap stocks outperformed their counterparts
During the period, the Russell 3000 Growth Index fell 2.1%, while the Russell 3000 Value Index dropped 8.6%. Stocks with large market capitalizations, as measured by the Russell 1000® Index, held up best, finishing down 4.8%. The Russell Midcap® Index fell 9.1%, and the Russell 2000® Index, which reflects the performance ofsmall-cap stocks, dropped 11.0%. Smaller-capitalized companies often have more debt, making them more susceptible to rising rates.
International equity markets: best and worst performers
For the 12 months, the best-performing countries making up the MSCI Emerging Markets Index were Russia (+0.2%), Brazil(-0.1%), and Malaysia(-6.0%). The worst performers were South Africa(-24.3%), South Korea(-20.5%), and China(-18.7%). For the fourth quarter, Brazil’s market outperformed, returning 13.6%.
For the 12 months, the best-performing developed markets making up the MSCI EAFE Index were Switzerland(-8.2%), Australia(-11.8%), and France(-11.9%). The worst performers were Germany(-21.6%), Italy(-17.0%), and Spain(-15.7%).
Fixed Income Market Overview
Financial markets experienced a volatile year in 2018, particularly riskier assets. The total returns and excess returns on bonds relative to US Treasuries were generally low or negative.
Over the12-month period, the Bloomberg Barclays US Aggregate Bond Index, a broad measure of the US investment-grade bond market, finished virtually flat with a return of 0.01%. Among key sectors, US agency mortgage-backed securities returned 0.99%, US Treasuries advanced 0.86%, commercial mortgage-backed securities (CMBS) rose 0.78%, Treasury inflation protected securities (TIPS) dropped 1.26%, and investment-grade corporate bonds declined 2.51%.
Municipal bonds rose 1.28%. High yield municipal issues (rated below investment grade) rose 4.76% for the year. However, high yield corporate bonds fell 2.08%.
The Bloomberg Barclays Global Aggregate Bond Index (USD), which reflects performance of investment-grade bonds in developing and emerging markets, declined 0.03%. Emerging markets bonds, as measured by the J.P. Morgan EMBI Global Diversified Index (hard currency), finished down 4.26% for the year.
Bond market highlights
Early in the reporting period, hawkish rhetoric from the Federal Reserve (the Fed), anticipated fiscal stimulus from tax cuts, an increased supply of US Treasuries (particularly shorter-dated issues), and concerns about inflation exerted pressure on the prices of US bonds. These factors sent bond yields, which move in the opposite direction, higher. Later in the first quarter, concerns about trade friction between the US and China put pressure on riskier assets.
In the second quarter, rates diverged. Signs that the US economy was growing at a strong pace sparked concerns that inflation could pick up. The yield on the10-year US Treasury note rose above 3%. Meanwhile, growth in many other economies weakened. Rising rates in the US and a strong dollar, coupled with trade uncertainty and geopolitical concerns, helped expose structural weaknesses in several emerging markets, and prices of emerging market bonds fell sharply. Yields on Italian bonds rose significantly in reaction to political concerns in Italy.
Although the US economy grew at a healthy pace during the year, growth decelerated in the third quarter and economic activity in the eurozone slowed.
Risk aversion rose late in the period
In the fourth quarter, following a sharp spike in US Treasury bond yields in November, demand for higher-quality US bonds rose — driving their prices higher and yields down — as a result of a flight to quality, whereas riskier US assets such as high yield bonds sold off. The shift in sentiment was triggered by uncertainties regarding the economy amid growing concerns about a potential trade war, Great Britain’s negotiations to leave the European Union (known as Brexit), and perceptions of a hawkish Fed.
In December, the Fed raised its federal funds rate target for the fourth time in 2018 but moderated its median projection for future additional rate hikes. The European Central Bank (ECB) halted its quantitative-easing asset purchases and issued guidance that it does not anticipate raising interest rates at least until after the summer of 2019. The yield on the10-year US Treasury note fell during the quarter to close the period at 2.68%.
For the fourth quarter, based on returns of the Bloomberg Barclays indexes, US Treasuries returned 2.6%. Agency mortgage-backed securities returned 2.1%, as their spreads widened amid the broadrisk-off sentiment and higher net supply. CMBS advanced 1.7%.
| | | | |
| Market Overview — unaudited(continued) | | Annual Report | | December 31, 2018 |
US corporate bonds — excluding energy — remained supported by robust earnings, strong cash flows, positive economic growth, and tailwinds from tax reform, but underperformed US government securities. For the quarter, US investment-grade corporates returned-0.2%. High yield bonds declined 4.53%, as they were hurt by a drop in oil prices. The municipal bonds sector rose 1.20%. Yields on debt carrying atriple-A rating ended lower on the heels of the rally in US Treasuries.
Emerging markets closed the year at varying stages of economic and political cycles. For the fourth quarter, emerging markets bonds declined 1.26%, based on the return of the J.P. Morgan EMBI Global Diversified Index (hard currency), benefiting in part from a weakening US dollar following its strong rise during the year. Yields on China’s government bonds dropped significantly in November in anticipation of further monetary stimulus. Global investment-grade bonds, based on the Bloomberg Barclays Global Aggregate Bond Index (USD), gained 1.55% in the fourth quarter.
| | |
The Prudential Variable Contract Account-2 | | December 31, 2018 |
Report of the Investment Manager - As of December 31, 2018 (Unaudited)
| | | | | | | | | | | | |
| Average Annual Total Returns | | 1-Year | | | 5-Years | | | 10-Years | |
Accumulation Account (without sales charges) | | | -7.35 | % | | | 5.96 | % | | | 11.82 | % |
S&P 500 Index | | | -4.38 | | | | 8.49 | | | | 13.11 | |
Past performance does not guarantee future returns. The Account performance without sales charges is shown after the deduction of all expenses, including investment management and mortality and expense charges, but does not include the effect of any sales charge or annual account charge. The performance would be lower if they included the effects of sales charges and an annual account charge.
$10,000 INVESTED OVER 10 YEARS
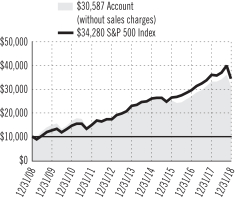
For the year ended December 31, 2018, the Prudential Variable Contract Account-2 returned-7.35%. The Account underperformed the S&P 500 Index.
The Account’s investment objective is long-term growth of capital.
What were market conditions during the reporting period?
Market concerns surrounding rising inflation expectations and monetary tightening, along with uncertainty about the Trump administration’s policy initiatives, caused equity markets to decline early in 2018. Those concerns seemed to subside, as most major indices continued their march upward until October. Early in the fourth calendar quarter, market fears surrounding rising interest rates, deteriorating growth prospects in the US and emerging markets, and the escalating odds of a trade war combined to unsettle both domestic and global equity markets.
Volatility returned with a vengeance in 2018, having been muted over the past few years, with the CBOE Volatility Index (the VIX) higher by a sharp 130% during the 12-month period. The energy sector was among the worst-performing sectors within the broad S&P 500 Index, likely a result of West Texas Intermediate (WTI) oil prices falling 24.84% during the year. Prices for most industrial metals also saw double-digit declines, hurting the performance of the materials sector, while health care and utilities were among the few bright spots in 2018.
The S&P 500 (the Index) fell 4.38% in 2018, with the energy, materials, industrials, and financials sectors all posting double-digit declines. Health care, utilities, information technology, and consumer discretionary were the only sectors in the Index that gained during the year.
Despite the narrowing differential between styles toward the end of the year, growth stocks, as measured by the Russell 1000 Growth Index, outperformed their value peers, as measured by the Russell 1000 Value Index, by over 775 basis points for the period overall. A basis point is 0.01%. Meanwhile large-cap stocks, as measured by the Russell 1000 Index, outperformed the small-cap-based Russell 2000 Index.
What strategies or holdings affected the Account’s performance?
The Account underperformed the Index during the period. On an absolute basis, positions in information technology were the primary drivers of overall return, specifically within application software. The movies & entertainment and pharmaceuticals sectors also contributed. Conversely, financial holdings were among the primary detractors, particularly the diversified banks and consumer finance stocks. The Account’s semiconductor holdings also hurt performance.
Notable Account contributors includedEli Lilly and Co. after it reported solid quarterly earnings and beat consensus estimates during the period. Eli Lilly’s diabetes team generated a series of positive news in October after showing robust phase 2 results for its GIP/GLP-1 co-agonist (LY’176) for the treatment of diabetes, supporting its decision to roll out eight phase 3 clinical trials in late 2018 and early 2019. Shares ofsalesforce.com, Inc. rose as the company benefited from secular growth drivers, including the shift to cloud computing, increasing corporate focus on customer-facing applications, emergence of mobile as a primary user interface into enterprise applications, and increasing demand for analytical capabilities to optimize business decisions and processes. Application software makerMicrosoft Corp. performed well, as the company posted solid earnings while beating consensus expectations during the past several quarters. This was driven in part by its Commercial Cloud and Azure segments and by a steady personal computer business. Additionally, its Office 365 software drove operating income improvements in the company’s productivity and business process segment. Jennison believes improving top-line growth and expanding profit margins should drive multiple years of accelerated earnings-per-share growth.
For a complete list of holdings, refer to the Statement of Net Assets section of this report.
1
| | |
The Prudential Variable Contract Account-2 | | December 31, 2018 |
Report of the Investment Manager - As of December 31, 2018 (Unaudited) (Continued)
Among the notable detractors in the Account was the semiconductor firmNVIDIA Corp. Its shares declined in November, reflecting lower-than-anticipated third-quarter revenue from low- and mid-end gaming graphics-processing units. An underlying inventory issue was anticipated to result in a revenue shortfall in the fourth quarter, as the company would not ship more product until the channel had been cleared. Jennison reduced its estimates to reflect the company’s temporary inventory challenge. Further, based on the company’s third-quarter revenue miss and its inability to anticipate the inventory/demand problem, the position was sold during the fourth quarter for what Jennison saw as more attractive investment opportunities.
Conagra Brands, Inc. lost ground during the reporting period as the company was weighed down by higher-than-expected cost inflation, higher interest rates, and pricing pressures from retailers. Additionally, the company’s acquisition ofPinnacle Foods, Inc., while potentially beneficial for the long term, caused concerns over the short term given Pinnacle’s slowdown in revenue. Investors had become more defensive, as companies with levered balance sheets fell out of favor with the market.
Goldman Sachs Group, Inc. underperformed after its shares declined when the firm was issued a limit on shareholder payouts as a result of its “conditional non-objection” grade on the quantitative portion of the Federal Reserve’s annual stress test of capital levels during the period. Additionally, the market negatively reacted to potential repercussions from the indictment of two senior Goldman Sachs executives. While many investors were aware of this indictment, the timing of any settlement and potential charge to the company’s bottom line was unclear. However, at the end of the reporting period, Jennison favored the company for its valuation and multiple businesses that can generate profits, in its view.
For a complete list of holdings, please refer to the Schedule of Investments section of this report.
2
| | |
The Prudential Variable Contract Account-2 Benchmark Glossary — unaudited | | December 31, 2018 |
The indexes are unmanaged and include reinvestment of any income or distributions. They do not reflect any fees, expenses or sales charges. Investors cannot invest directly in a market index.
S&P 500 Index is an unmanaged, market value-weighted index of over 500 stocks generally representative of the broad stock market.
| | |
The Prudential Variable Contract Account-2 (VCA-2) Presentation of Portfolio Holdings — unaudited | | December 31, 2018 |
| | | | |
| VCA-2 | |
| Five Largest Holdings | | | (% of Net Assets | ) |
| Boeing Co. (The) | | | 3.5% | |
| JPMorgan Chase & Co. | | | 3.4% | |
| Merck & Co., Inc. | | | 3.1% | |
| Alphabet, Inc. | | | 3.0% | |
| Microsoft Corp. | | | 2.9% | |
For a complete listing of holdings, refer to the Statement of Net Assets section of this report. Holdings reflect only long-term investments. Holdings/Issues/Industries/Sectors are subject to change.
FINANCIAL STATEMENTS OF VCA-2
December 31, 2018
| | | | | | | | |
| LONG-TERM INVESTMENTS — 96.5% | |
| COMMON STOCKS | | Shares | | | Value | |
Aerospace & Defense — 4.5% | |
Boeing Co. (The) | | | 21,089 | | | $ | 6,801,202 | |
United Technologies Corp. | | | 18,182 | | | | 1,936,019 | |
| | | | | | | | |
| | | | | | | 8,737,221 | |
| | | | | | | | |
Automobiles — 1.2% | |
Tesla Inc.* | | | 6,930 | | | | 2,306,304 | |
| | | | | | | | |
Banks — 10.2% | |
Bank of America Corp. | | | 159,224 | | | | 3,923,279 | |
BB&T Corp. | | | 48,607 | | | | 2,105,655 | |
Citigroup, Inc. | | | 42,536 | | | | 2,214,424 | |
JPMorgan Chase & Co. | | | 66,740 | | | | 6,515,159 | |
PNC Financial Services Group, Inc. (The) | | | 18,841 | | | | 2,202,701 | |
SunTrust Banks Inc. | | | 22,711 | | | | 1,145,543 | |
Wells Fargo & Co. | | | 38,466 | | | | 1,772,513 | |
| | | | | | | | |
| | | | | | | 19,879,274 | |
| | | | | | | | |
Biotechnology — 0.5% | |
Celgene Corp.* | | | 15,675 | | | | 1,004,611 | |
| | | | | | | | |
Building Products — 0.6% | |
Johnson Controls International PLC | | | 40,790 | | | | 1,209,424 | |
| | | | | | | | |
Capital Markets — 0.8% | |
Goldman Sachs Group, Inc. (The) | | | 9,199 | | | | 1,536,693 | |
| | | | | | | | |
Chemicals — 2.2% | |
DowDuPont, Inc. | | | 13,605 | | | | 727,595 | |
FMC Corp. | | | 24,743 | | | | 1,829,992 | |
Linde PLC (United Kingdom) | | | 11,213 | | | | 1,749,677 | |
| | | | | | | | |
| | | | | | | 4,307,264 | |
| | | | | | | | |
Communication Equipment — 1.5% | |
Cisco Systems, Inc. | | | 68,251 | | | | 2,957,316 | |
| | | | | | | | |
Consumer Finance — 2.0% | |
Capital One Financial Corp. | | | 29,849 | | | | 2,256,286 | |
SLM Corp.* | | | 194,999 | | | | 1,620,442 | |
| | | | | | | | |
| | | | | | | 3,876,728 | |
| | | | | | | | |
Diversified Telecommunication Services — 1.6% | |
Verizon Communications, Inc. | | | 54,514 | | | | 3,064,777 | |
| | | | | | | | |
Electric Utilities — 3.6% | |
American Electric Power Co., Inc. | | | 48,195 | | | | 3,602,094 | |
Exelon Corp. | | | 74,135 | | | | 3,343,488 | |
| | | | | | | | |
| | | | | | | 6,945,582 | |
| | | | | | | | |
Electrical Equipment — 0.7% | |
Emerson Electric Co. | | | 22,759 | | | | 1,359,850 | |
| | | | | | | | |
Energy Equipment & Services — 0.3% | |
Schlumberger Ltd. | | | 15,579 | | | | 562,090 | |
| | | | | | | | |
Entertainment — 2.3% | |
Netflix, Inc.* | | | 9,386 | | | | 2,512,257 | |
Twenty-First Century Fox, Inc. (Class A Stock) | | | 42,118 | | | | 2,026,718 | |
| | | | | | | | |
| | | | | | | 4,538,975 | |
| | | | | | | | |
| | | | | | | | |
COMMON STOCKS
(continued) | | Shares | | | Value | |
Equity Real Estate Investment Trust (REITs) — 2.6% | |
American Campus Communities Inc. | | | 32,184 | | | $ | 1,332,096 | |
American Tower Corp. | | | 23,908 | | | | 3,782,007 | |
| | | | | | | | |
| | | | | | | 5,114,103 | |
| | | | | | | | |
Food & Staples Retailing — 1.6% | |
Wal-Mart Stores, Inc. | | | 32,911 | | | | 3,065,660 | |
| | | | | | | | |
Food Products — 1.7% | |
Conagra Brands, Inc. | | | 45,792 | | | | 978,117 | |
Mondelez International, Inc. (Class A Stock) | | | 57,750 | | | | 2,311,732 | |
| | | | | | | | |
| | | | | | | 3,289,849 | |
| | | | | | | | |
Health Care Equipment & Supplies — 1.1% | |
Zimmer Biomet Holdings, Inc. | | | 20,813 | | | | 2,158,724 | |
| | | | | | | | |
Health Care Providers & Service — 2.9% | |
Cigna Corp. | | | 9,496 | | | | 1,803,480 | |
Laboratory Corp. of America Holdings* | | | 12,293 | | | | 1,553,343 | |
UnitedHealth Group, Inc. | | | 9,514 | | | | 2,370,128 | |
| | | | | | | | |
| | | | | | | 5,726,951 | |
| | | | | | | | |
Hotels, Restaurants & Leisure — 0.9% | |
McDonald’s Corp. | | | 10,248 | | | | 1,819,737 | |
| | | | | | | | |
Household Products — 1.5% | |
Procter & Gamble Co. (The) | | | 31,289 | | | | 2,876,085 | |
| | | | | | | | |
Insurance — 2.9% | |
Brighthouse Financial, Inc.* | | | 26,727 | | | | 814,639 | |
Chubb Ltd. (Switzerland) | | | 20,357 | | | | 2,629,717 | |
MetLife, Inc. | | | 52,027 | | | | 2,136,229 | |
| | | | | | | | |
| | | | | | | 5,580,585 | |
| | | | | | | | |
Interactive Media & Services — 5.9% | |
Alphabet, Inc.* | | | 5,603 | | | | 5,854,911 | |
Facebook, Inc. (Class A Stock)* | | | 17,576 | | | | 2,304,038 | |
Tencent Holdings Ltd. (China), ADR | | | 81,900 | | | | 3,232,593 | |
| | | | | | | | |
| | | | | | | 11,391,542 | |
| | | | | | | | |
Internet & Direct Marketing Retail — 3.7% | |
Alibaba Group Holding Ltd. (China), ADR* | | | 20,215 | | | | 2,770,870 | |
Amazon.com, Inc.* | | | 2,419 | | | | 3,633,265 | |
eBay, Inc.* | | | 26,568 | | | | 745,764 | |
| | | | | | | | |
| | | | | | | 7,149,899 | |
| | | | | | | | |
IT Services — 3.3% | |
Adyen NV (Netherlands)* | | | 2,550 | | | | 1,374,485 | |
Mastercard Inc. | | | 19,707 | | | | 3,717,726 | |
PayPal Holdings, Inc.* | | | 14,934 | | | | 1,255,800 | |
| | | | | | | | |
| | | | | | | 6,348,011 | |
| | | | | | | | |
Life Sciences Tools & Services — 1.3% | |
Illumina Inc.* | | | 8,695 | | | | 2,607,891 | |
| | | | | | | | |
SEE NOTES TO FINANCIAL STATEMENTS.
A1
FINANCIAL STATEMENTS OF VCA-2
December 31, 2018
| | | | | | | | |
COMMON STOCKS
(continued) | | Shares | | | Value | |
Media — 2.2% | |
Comcast Corp. (Class A Stock) | | | 79,831 | | | $ | 2,718,246 | |
Liberty Global PLC (United Kingdom) (Class C Stock)* | | | 73,150 | | | | 1,509,816 | |
| | | | | | | | |
| | | | | | | 4,228,062 | |
| | | | | | | | |
Multi-Utilities — 1.1% | |
Ameren Corp. | | | 31,685 | | | | 2,066,813 | |
| | | | | | | | |
Oil, Gas & Consumable Fuels — 5.5% | |
Anadarko Petroleum Corp. | | | 18,689 | | | | 819,326 | |
Chevron Corp. | | | 35,496 | | | | 3,861,610 | |
Noble Energy, Inc. | | | 49,602 | | | | 930,534 | |
Royal Dutch Shell PLC (Netherlands) (Class A Stock), ADR | | | 54,039 | | | | 3,148,853 | |
Suncor Energy, Inc. (Canada) | | | 67,788 | | | | 1,896,030 | |
| | | | | | | | |
| | | | | | | 10,656,353 | |
| | | | | | | | |
Pharmaceuticals — 11.6% | |
Allergan PLC | | | 10,628 | | | | 1,420,538 | |
AstraZeneca PLC (United Kingdom), ADR | | | 139,475 | | | | 5,297,260 | |
Bristol-Myers Squibb Co. | | | 27,604 | | | | 1,434,856 | |
Elanco Animal Health, Inc.* | | | 22,054 | | | | 695,363 | |
Eli Lilly & Co. | | | 28,441 | | | | 3,291,193 | |
Merck & Co., Inc. | | | 79,573 | | | | 6,080,173 | |
Pfizer, Inc. | | | 97,392 | | | | 4,251,161 | |
| | | | | | | | |
| | | | | | | 22,470,544 | |
| | | | | | | | |
Road & Rail — 1.2% | |
Union Pacific Corp. | | | 17,391 | | | | 2,403,958 | |
| | | | | | | | |
Semiconductors & Semiconductor Equipment — 1.9% | |
Broadcom Ltd. | | | 8,569 | | | | 2,178,925 | |
Texas Instruments, Inc. | | | 15,664 | | | | 1,480,248 | |
| | | | | | | | |
| | | | | | | 3,659,173 | |
| | | | | | | | |
Software — 7.4% | |
Adobe Systems, Inc.* | | | 14,915 | | | | 3,374,370 | |
Microsoft Corp. | | | 55,294 | | | | 5,616,212 | |
PTC, Inc.* | | | 17,844 | | | | 1,479,268 | |
salesforce.com, Inc.* | | | 27,999 | | | | 3,835,023 | |
| | | | | | | | |
| | | | | | | 14,304,873 | |
| | | | | | | | |
Specialty Retail — 2.4% | |
Home Depot, Inc. | | | 8,889 | | | | 1,527,308 | |
Lowe’s Cos, Inc. | | | 15,506 | | | | 1,432,134 | |
Ross Stores Inc. | | | 20,551 | | | | 1,709,843 | |
| | | | | | | | |
| | | | | | | 4,669,285 | |
| | | | | | | | |
Technology Hardware, Storage & Peripheral — 0.9% | |
Apple, Inc. | | | 11,305 | | | | 1,783,251 | |
| | | | | | | | |
Textiles, Apparel & Luxury Goods — 0.9% | |
Tapestry, Inc. | | | 49,750 | | | | 1,679,062 | |
| | | | | | | | |
TOTAL COMMON STOCKS
(cost $139,692,316) | | | | 187,336,520 | |
| | | | | | | | |
| | | | | | | | |
SHORT-TERM INVESTMENT — 3.2% | | Shares | | | Value | |
AFFILIATED MUTUAL FUND | |
PGIM Core Ultra Short Bond Fund (cost $6,188,145)(a) | | | 6,188,145 | | | $ | 6,188,145 | |
| | | | | | | | |
TOTAL INVESTMENTS — 99.7%
(cost $145,880,461) | | | | 193,524,665 | |
| | | | | | | | |
OTHER ASSETS IN EXCESS OF LIABILITIES — 0.3% | |
Receivable for Securities Sold | | | | 2,121,421 | |
Dividends and Interests Receivable | | | | 153,623 | |
Tax Reclaim Receivable | | | | 7,936 | |
Payable for Pending Capital Transactions | | | | (20,060 | ) |
Payable for Securities Purchased | | | | (1,589,201 | ) |
| | | | | | | | |
OTHER ASSETS IN EXCESS OF LIABILITIES | | | | 673,719 | |
| | | | | | | | |
NET ASSETS — 100% | | | $ | 194,198,384 | |
| | | | | | | | |
NET ASSETS, representing: | | | | | |
Equity of Participants —
2,606,884 Accumulation Units at an Accumulation Unit Value of $72.5608 | | | $ | 189,157,612 | |
Equity of Annuitants | | | | 3,707,549 | |
Equity of The Prudential Insurance Company of America | | | | 1,333,223 | |
| | | | | | | | |
| | | | | | $ | 194,198,384 | |
| | | | | | | | |
The following abbreviation is used in the annual report:
| | |
| ADR | | American Depositary Receipt |
| * | Non-income producing security. |
| (a) | PGIM Investments LLC, the manager of the Account, also serves as manager of the PGIM Core Ultra Short Bond Fund. |
SEE NOTES TO FINANCIAL STATEMENTS.
A2
FINANCIAL STATEMENTS OF VCA-2
December 31, 2018
Fair Value Measurements:
Various inputs are used in determining the value of the Account’s investments. These inputs are summarized in the three broad levels listed below.
| Level 1— | unadjusted quoted prices generally in active markets for identical securities. |
| Level 2— | quoted prices for similar securities, interest rates and yield curves, prepayment speeds, foreign currency exchange rates, and other observable inputs. |
| Level 3— | unobservable inputs for securities valued in accordance with the Account’s Committee approved fair valuation procedures. |
The following is a summary of the inputs used as of December 31, 2018 in valuing such portfolio securities:
| | | | | | | | | | | | |
| | | Level 1 | | | Level 2 | | | Level 3 | |
Investments in Securities | | | | | | | | | | | | |
Common Stocks | | | | | | | | | | | | |
Aerospace & Defense | | $ | 8,737,221 | | | $ | — | | | $ | — | |
Automobiles | | | 2,306,304 | | | | — | | | | — | |
Banks | | | 19,879,274 | | | | — | | | | — | |
Biotechnology | | | 1,004,611 | | | | — | | | | — | |
Building Products | | | 1,209,424 | | | | — | | | | — | |
Capital Markets | | | 1,536,693 | | | | — | | | | — | |
Chemicals | | | 4,307,264 | | | | — | | | | — | |
Communications Equipment | | | 2,957,316 | | | | — | | | | — | |
Consumer Finance | | | 3,876,728 | | | | — | | | | — | |
Diversified Telecommunication Services | | | 3,064,777 | | | | — | | | | — | |
Electric Utilities | | | 6,945,582 | | | | — | | | | — | |
Electrical Equipment | | | 1,359,850 | | | | — | | | | — | |
Energy Equipment & Services | | | 562,090 | | | | — | | | | — | |
Entertainment | | | 4,538,975 | | | | — | | | | — | |
Equity Real Estate Investment Trusts (REITs) | | | 5,114,103 | | | | — | | | | — | |
Food & Staples Retailing | | | 3,065,660 | | | | — | | | | — | |
Food Products | | | 3,289,849 | | | | — | | | | — | |
Health Care Equipment & Supplies | | | 2,158,724 | | | | — | | | | — | |
Health Care Providers & Services | | | 5,726,951 | | | | — | | | | — | |
Hotels, Restaurants & Leisure | | | 1,819,737 | | | | — | | | | — | |
Household Products | | | 2,876,085 | | | | — | | | | — | |
Insurance | | | 5,580,585 | | | | — | | | | — | |
Interactive Media & Services | | | 11,391,542 | | | | — | | | | — | |
Internet & Direct Marketing Retail | | | 7,149,899 | | | | — | | | | — | |
IT Services | | | 4,973,526 | | | | 1,374,485 | | | | — | |
Life Sciences Tools & Services | | | 2,607,891 | | | | — | | | | — | |
Media | | | 4,228,062 | | | | — | | | | — | |
Multi-Utilities | | | 2,066,813 | | | | — | | | | — | |
Oil, Gas & Consumable Fuels | | | 10,656,353 | | | | — | | | | — | |
Pharmaceuticals | | | 22,470,544 | | | | — | | | | — | |
Road & Rail | | | 2,403,958 | | | | — | | | | — | |
Semiconductors & Semiconductor Equipment | | | 3,659,173 | | | | — | | | | — | |
Software | | | 14,304,873 | | | | — | | | | — | |
Specialty Retail | | | 4,669,285 | | | | — | | | | — | |
Technology Hardware, Storage & Peripherals | | | 1,783,251 | | | | — | | | | — | |
Textiles, Apparel & Luxury Goods | | | 1,679,062 | | | | — | | | | — | |
Affiliated Mutual Fund | | | 6,188,145 | | | | — | | | | — | |
| | | | | | | | | | | | |
Total | | $ | 192,150,180 | | | $ | 1,374,485 | | | $ | — | |
| | | | | | | | | | | | |
SEE NOTES TO FINANCIAL STATEMENTS.
A3
FINANCIAL STATEMENTS OF VCA-2
December 31, 2018
Industry Classification:
The industry classification of investments and other assets in excess of other liabilities shown as a percentage of net assets as of December 31, 2018 were as follows (unaudited):
| | | | |
Pharmaceuticals | | | 11.6 | % |
Banks | | | 10.2 | |
Software | | | 7.4 | |
Interactive Media & Services | | | 5.9 | |
Oil, Gas & Consumable Fuels | | | 5.5 | |
Aerospace & Defense | | | 4.5 | |
Internet & Direct Marketing Retail | | | 3.7 | |
Electric Utilities | | | 3.6 | |
IT Services | | | 3.3 | |
Affiliated Mutual Fund | | | 3.2 | |
Health Care Providers & Services | | | 2.9 | |
Insurance | | | 2.9 | |
Equity Real Estate Investment Trusts (REITs) | | | 2.6 | |
Specialty Retail | | | 2.4 | |
Entertainment | | | 2.3 | |
Chemicals | | | 2.2 | |
Media | | | 2.2 | |
Consumer Finance | | | 2.0 | |
Semiconductors & Semiconductor Equipment | | | 1.9 | |
Food Products | | | 1.7 | |
Food & Staples Retailing | | | 1.6 | |
| | | | |
Diversified Telecommunication Services | | | 1.6 | % |
Communications Equipment | | | 1.5 | |
Household Products | | | 1.5 | |
Life Sciences Tools & Services | | | 1.3 | |
Road & Rail | | | 1.2 | |
Automobiles | | | 1.2 | |
Health Care Equipment & Supplies | | | 1.1 | |
Multi-Utilities | | | 1.1 | |
Hotels, Restaurants & Leisure | | | 0.9 | |
Technology Hardware, Storage & Peripherals | | | 0.9 | |
Textiles, Apparel & Luxury Goods | | | 0.9 | |
Capital Markets | | | 0.8 | |
Electrical Equipment | | | 0.7 | |
Building Products | | | 0.6 | |
Biotechnology | | | 0.5 | |
Energy Equipment & Services | | | 0.3 | |
| | | | |
| | | 99.7 | |
Other assets in excess of liabilities | | | 0.3 | |
| | | | |
| | | 100.0 | % |
| | | | |
SEE NOTES TO FINANCIAL STATEMENTS.
A4
FINANCIAL STATEMENTS OF VCA-2
Year Ended December 31, 2018
| | | | |
| | | | |
INVESTMENT INCOME | | | | |
Unaffiliated Dividend Income (net of $54,041 foreign withholding tax) | | $ | 4,227,458 | |
Affiliated Dividend Income | | | 96,122 | |
Total Income | | | 4,323,580 | |
EXPENSES | | | | |
Fees Charged to Participants and Annuitants for Investment Management Services | | | (291,319 | ) |
Fees Charged to Participants (other than Annuitants) for Assuming Mortality and Expense Risks | | | (855,655 | ) |
Total Expenses | | | (1,146,974 | ) |
NET INVESTMENT INCOME | | | 3,176,606 | |
REALIZED AND UNREALIZED GAIN (LOSS) ON INVESTMENT AND FOREIGN CURRENCY TRANSACTIONS | | | | |
Net Realized Gain (Loss) on: | | | | |
Investment Transactions | | | 11,783,891 | |
Foreign Currency Transactions | | | (1,231 | ) |
| | | | 11,782,660 | |
Net Change in Unrealized Appreciation (Depreciation) on: | | | | |
Investments | | | (30,131,678 | ) |
Foreign Currencies | | | (810 | ) |
| | | | (30,132,488 | ) |
NET LOSS ON INVESTMENT AND FOREIGN CURRENCY TRANSACTIONS | | | (18,349,828 | ) |
NET DECREASE IN NET ASSETS RESULTING FROM OPERATIONS | | ($ | 15,173,222 | ) |
| | | | | | |
| | |
| | STATEMENTS OF CHANGES IN NET ASSETS | | |
| | | | | | | | |
| | | Year Ended December 31, | |
| | | 2018 | | | 2017 | |
OPERATIONS | | | | | | | | |
Net Investment Income | | $ | 3,176,606 | | | $ | 2,689,730 | |
Net Realized Gain on Investment and Foreign Currency Transactions | | | 11,782,660 | | | | 23,113,785 | |
Net Change In Unrealized Appreciation (Depreciation) on Investments and Foreign Currencies | | | (30,132,488 | ) | | | 21,798,417 | |
NET INCREASE (DECREASE) IN NET ASSETS RESULTING FROM OPERATIONS | | | (15,173,222 | ) | | | 47,601,932 | |
CAPITAL TRANSACTIONS | | | | | | | | |
Purchase Payments and Transfers In (57,645 and 16,389 units, respectively) | | | 4,624,266 | | | | 1,184,726 | |
Withdrawals and Transfers Out (450,943 and 400,618 units, respectively) | | | (35,629,772 | ) | | | (28,165,279 | ) |
Mortality and Expense Risk Charges Deducted from Annuitants’ Accounts | | | (18,303 | ) | | | (20,276 | ) |
Variable Annuity Payments | | | (714,983 | ) | | | (736,309 | ) |
NET DECREASE IN NET ASSETS RESULTING FROM CAPITAL TRANSACTIONS | | | (31,738,792 | ) | | | (27,737,138 | ) |
NET INCREASE IN NET ASSETS RESULTING FROM SURPLUS TRANSFERS | | | 6,346 | | | | 4,396 | |
TOTAL INCREASE (DECREASE) IN NET ASSETS | | | (46,905,668 | ) | | | 19,869,190 | |
NET ASSETS | | | | | | | | |
Beginning of year | | | 241,104,052 | | | | 221,234,862 | |
End of year | | $ | 194,198,384 | | | $ | 241,104,052 | |
SEE NOTES TO FINANCIAL STATEMENTS.
A5
FINANCIAL HIGHLIGHTS FOR VCA-2
| | | | | | |
| | |
| | INCOME AND CAPITAL CHANGES PER ACCUMULATION UNIT* | | |
(For an Accumulation Unit outstanding throughout the year)
| | | | | | | | | | | | | | | | | | | | |
| | | Year Ended December 31, | |
| | | 2018 | | | 2017 | | | 2016 | | | 2015 | | | 2014 | |
Investment Income | | $ | 1.4886 | | | $ | 1.1756 | | | $ | 1.1021 | | | $ | 0.9469 | | | $ | 0.7348 | |
Expenses | | | | | | | | | | | | | | | | | | | | |
Investment management fee | | | (0.1008 | ) | | | (0.0883 | ) | | | (0.0735 | ) | | | (0.0763 | ) | | | (0.0718 | ) |
Assuming mortality and expense risks | | | (0.3021 | ) | | | (0.2647 | ) | | | (0.2203 | ) | | | (0.2284 | ) | | | (0.2151 | ) |
Net Investment Income | | | 1.0857 | | | | 0.8226 | | | | 0.8083 | | | | 0.6422 | | | | 0.4479 | |
Capital Changes | | | | | | | | | | | | | | | | | | | | |
Net realized and unrealized gain (loss) on investment and foreign currency transactions | | | (6.8449 | ) | | | 13.7979 | | | | 3.13 | | | | (1.3303 | ) | | | 5.6719 | |
Net Increase (Decrease) in Accumulation Unit Value | | $ | (5.7592 | ) | | | 14.6205 | | | | 3.9383 | | | | (0.6881 | ) | | | 6.1198 | |
Accumulation Unit Value | | | | | | | | | | | | | | | | | | | | |
Beginning of year | | | 78.3200 | | | | 63.6995 | | | | 59.7612 | | | | 60.4493 | | | | 54.3295 | |
End of year | | $ | 72.5608 | | | $ | 78.3200 | | | $ | 63.6995 | | | $ | 59.7612 | | | $ | 60.4493 | |
Total Return** | | | (7.35 | )% | | | 22.95 | % | | | 6.59 | % | | | (1.14 | )% | | | 11.26 | % |
Ratio of Expenses To Average Net Assets*** | | | 0.50 | % | | | 0.50 | % | | | 0.50 | % | | | 0.50 | % | | | 0.50 | % |
Ratio of Net Investment Income To Average Net Assets*** | | | 1.35 | % | | | 1.16 | % | | | 1.37 | % | | | 1.06 | % | | | 0.78 | % |
Portfolio Turnover Rate | | | 36 | % | | | 48 | % | | | 40 | % | | | 47 | % | | | 70 | % |
Number of Accumulation Units Outstanding
For Participants at end of year (000 omitted) | | | 2,607 | | | | 3,000 | | | | 3,384 | | | | 3,952 | | | | 4,579 | |
| * | Calculated by accumulating the actual per unit amounts daily. |
| ** | Total return does not consider the effects of sales loads. Total return is calculated assuming a purchase of a share on the first day and a sale on the last day of each period reported. Total returns may reflect adjustments to conform to generally accepted accounting principles. Total returns for periods less than one full year are not annualized. |
| *** | These calculations exclude PICA’s equity inVCA-2. |
The above table does not reflect the annual administration charge, which does not affect the Accumulation Unit Value. This charge is made by reducing Participants’ Accumulation Accounts by a number of Accumulation Units equal in value to the charge.
SEE NOTES TO FINANCIAL STATEMENTS.
B1
NOTES TO FINANCIAL STATEMENTS OF
VCA-2
The Prudential Variable ContractAccount-2(“VCA-2” or the “Account”) was established on January 9, 1968 by The Prudential Insurance Company of America (“PICA”) under the laws of the State of New Jersey and is registered as anopen-end, diversified management investment company under the Investment Company Act of 1940 (“1940 Act”), as amended.VCA-2 has been designed for use with retirement arrangements qualified under Section 403(b) of the Internal Revenue Code. The investment objective of the Account is long-term growth of capital.
| Note 2: | | Accounting Policies |
The Account follows investment company accounting and reporting guidance of the Financial Accounting Standards Board (“FASB”) Accounting Standard Codification (“ASC”) Topic 946 Financial Services —Investment Companies. The following accounting policies conform to U.S. generally accepted accounting principles. The Account consistently follows such policies in the preparation of its financial statements.
Securities Valuation: The Account holds securities and other assets and liabilities that are fair valued at the close of each day (generally, 4:00 PM Eastern time) the New York Stock Exchange (“NYSE”) is open for trading. Fair value is the price that would be received to sell an asset or paid to transfer a liability in an orderly transaction between market participants on the measurement date. The Account’s Committee Members (the “Committee”) have adopted valuation procedures for security valuation under which fair valuation responsibilities have been delegated to PGIM Investments LLC (“PGIM Investments” or the “Manager”). Pursuant to the Committee’s delegation, the Manager has established a Valuation Committee responsible for supervising the fair valuation of portfolio securities and other assets and liabilities. The valuation procedures permit the Account to utilize independent pricing vendor services, quotations from market makers, and alternative valuation methods when market quotations are either not readily available or not deemed representative of fair value. A record of the Valuation Committee’s actions is subject to the Committee’s review, approval, and ratification at its next regularly-scheduled quarterly meeting.
For the fiscal reportingperiod-end, securities and other assets and liabilities were fair valued at the close of the last U.S. business day. Trading in certain foreign securities may occur when the NYSE is closed (including weekends and holidays). Because such foreign securities trade in markets that are open on weekends and U.S. holidays, the values of some of the Account’s foreign investments may change on days when investors cannot purchase or redeem Account shares.
Various inputs determine how the Account’s investments are valued, all of which are categorized according to the three broad levels (Level 1, 2, or 3) detailed in the table following the Account’s Statement of Net Assets and referred to herein as the “fair value hierarchy” in accordance with FASB ASC Topic 820 — Fair Value Measurements and Disclosures.
Common and preferred stocks, exchange-traded funds, and derivative instruments, such as futures or options, that are traded on a national securities exchange are valued at the last sale price as of the close of trading on the applicable exchange where the security principally trades. Securities traded via NASDAQ are valued at the NASDAQ official closing price. To the extent these securities are valued at the last sale price or NASDAQ official closing price, they are classified as Level 1 in the fair value hierarchy. In the event that no sale or official closing price on valuation date exists, these securities are generally valued at the mean between the last reported bid and asked prices, or at the last bid price in the absence of an ask price. These securities are classified as Level 2 in the fair value hierarchy.
Foreign equities traded on foreign securities exchanges are valued using pricing vendor services that provide model prices derived using adjustment factors based on information such as local closing price, relevant general and sector indices, currency fluctuations, depositary receipts, and futures, as applicable. Securities valued using such model prices are classified as Level 2 in the fair value hierarchy. The models generate an evaluated adjustment factor for each security, which is applied to the local closing price to adjust it for post-closing market movements up to the time the Account is valued. Utilizing that evaluated adjustment factor, the vendor provides an evaluated price for each security. If the vendor does not provide an evaluated price, securities are valued in accordance with exchange-traded common and preferred stock valuation policies discussed above.
C1
Investments inopen-end,non-exchange-traded mutual funds are valued at their net asset values as of the close of the NYSE on the date of valuation. These securities are classified as Level 1 in the fair value hierarchy since they may be purchased or sold at their net asset values on the date of valuation.
Securities and other assets that cannot be priced according to the methods described above are valued based on pricing methodologies approved by the Committee. In the event that unobservable inputs are used when determining such valuations, the securities will be classified as Level 3 in the fair value hierarchy.
When determining the fair value of securities, some of the factors influencing the valuation include: the nature of any restrictions on disposition of the securities; assessment of the general liquidity of the securities; the issuer’s financial condition and the markets in which it does business; the cost of the investment; the size of the holding and the capitalization of the issuer; the prices of any recent transactions or bids/offers for such securities or any comparable securities; any available analyst media or other reports or information deemed reliable by the investment adviser regarding the issuer or the markets or industry in which it operates. Using fair value to price securities may result in a value that is different from a security’s most recent closing price and from the price used by other mutual funds to calculate their net asset values.
Restricted and Illiquid Securities: Subject to guidelines adopted by the Committee, the Account may invest up to 15% of its net assets in illiquid securities, including those which are restricted as to disposition under securities law (“restricted securities”). Restricted securities are valued pursuant to the valuation procedures noted above. Illiquid securities are those that, because of the absence of a readily available market or due to legal or contractual restrictions on resale, cannot be sold within seven days in the ordinary course of business at approximately the amount at which the Account has valued the investment. Therefore, the Account may find it difficult to sell illiquid securities at the time considered most advantageous by its subadviser and may incur expenses that would not be incurred in the sale of securities that were freely marketable. Certain securities that would otherwise be considered illiquid because of legal restrictions on resale to the general public may be traded among qualified institutional buyers under Rule 144A of the Securities Act of 1933. These Rule 144A securities, as well as commercial paper that is sold in private placements under Section 4(2) of the Securities Act, may be deemed liquid by the Account’s subadviser under the guidelines adopted by the Committee Members of the Account. However, the liquidity of the Account’s investments in Rule 144A securities could be impaired if trading does not develop or declines.
Foreign Currency Translation: The books and records of the Account are maintained in U.S. dollars. Foreign currency amounts are translated into U.S. dollars on the following basis:
(i) market value of investment securities, other assets and liabilities — at the current rates of exchange;
(ii) purchases and sales of investment securities, income and expenses — at the rates of exchange prevailing on the respective dates of such transactions.
Although the net assets of the Account are presented at the foreign exchange rates and market values at the close of the period, the Account does not generally isolate that portion of the results of operations arising as a result of changes in the foreign exchange rates from the fluctuations arising from changes in the market prices of long-term portfolio securities held at the end of the period. Similarly, the Account does not isolate the effect of changes in foreign exchange rates from the fluctuations arising from changes in the market prices of long-term portfolio securities sold during the period. Accordingly, holding period realized foreign currency gains (losses) are included in the reported net realized gains (losses) on investment transactions.
Net realized gains (losses) on foreign currency transactions represent net foreign exchange gains (losses) from holdings of foreign currencies, currency gains (losses) realized between the trade and settlement dates on securities transactions, and the difference between the amounts of interest, dividends and foreign withholding taxes recorded on the Account’s books and the U.S. dollar equivalent amounts actually received or paid. Net unrealized currency gains (losses) from valuing foreign currency denominated assets and liabilities (other than investments) at period end exchange rates are reflected as a component of net unrealized appreciation (depreciation) on foreign currencies.
Securities Transactions and Net Investment Income: Securities transactions are recorded on the trade date. Realized gains (losses) from investment and currency transactions are calculated on the identified cost basis. Dividend income is recorded on theex-date, or for certain foreign securities, when the Account becomes aware of such dividends. Interest income, including amortization of premium and accretion of discount on debt securities, as required, is recorded on the accrual basis. Expenses are recorded on the accrual basis,
C2
which may require the use of certain estimates by management that may differ from actual. Net investment income and realized and unrealized gain (losses) (other than administrative fees) are allocated to the Participants and PICA on a daily basis in proportion to their respective ownership inVCA-2.
Estimates: The preparation of the financial statements requires management to make estimates and assumptions that affect the reported amounts and disclosures in the financial statements. Actual results could differ from those estimates.
Federal Income Taxes: The operations ofVCA-2 are part of, and are taxed with, the operations of PICA. Under the current provisions of the Internal Revenue Code, PICA does not expect to incur federal income taxes on earnings ofVCA-2 to the extent the earnings are credited under the Contracts. As a result, the Unit Value ofVCA-2 has not been reduced by federal income taxes.
Annuity Reserves: Reserves are computed for purchased annuities using the Prudential 1950 Group Annuity Valuation (GAV) Table, adjusted, and a valuation interest rate related to the Assumed Investment Result (AIR). The valuation interest rate is equal to the AIR less 0.50% in contract charges defined in Note 3. The AIRs are selected by each Contract-holder and are described in the prospectus. Such amounts are included in Equity of Annuitants in the Statement of Net Assets.
| Note 3: | | Investment Management Agreement and Charges |
The Account has a management agreement with PGIM Investments. Pursuant to this agreement, PGIM Investments has responsibility for all investment advisory services and supervises the subadviser’s performance of such services. PGIM Investments has entered into a subadvisory agreement with Jennison Associates LLC (“Jennison”). The subadvisory agreement provides that Jennison will furnish investment advisory services in connection with management of the Account. PGIM Investments pays for the services of Jennison.
A daily charge, at an effective annual rate of 0.125% of the current value of the Participant’s (other than Annuitants’ and PICA’s) account inVCA-2, is charged to the Account and paid to PGIM Investments for investment management services.
A daily charge, paid to PICA Investments for assuming mortality and expense risks, is calculated at an effective annual rate of 0.375% of the current value of the Participant’s (other than Annuitants’ and PICA’s) account inVCA-2.
An annual administration charge of not more than $30 annually is deducted from the accumulation account of certain Participants either at the time of withdrawal of the value of the entire Participant’s account or on the last business day of each calendar year such amounts are reflected as a withdrawal on the Statements of Changes in Net Assets. This deduction may be made from a fixed-dollar annuity contract if the Participant is enrolled under such a contract.
No sales charge is deducted from Participants’ purchase payments and/or contributions. However, PICA has reserved the right in the future to impose or deduct a maximum sales charge of 2.50% from purchase payments and/or contributions.
PICA, PGIM Investments and Jennison are indirect, wholly-owned subsidiaries of Prudential Financial, Inc. (“Prudential”).
| Note 4: | | Other Transactions with Affiliates |
The Account may enter into certain securities purchase or sale transactions under Committee approvedRule 17a-7 procedures. Rule17a-7 is an exemptive rule under the 1940 Act, that permits purchase and sale transactions among affiliated investment companies, or between an investment company and a person that is affiliated solely by reason of having a common (or affiliated) investment adviser, common directors, and/or common officers. Such transactions are subject to ratification by the Committee. For the year ended December 31, 2018 no such transactions were entered into by the Account.
During the year ended December 31, 2018, the Account invested in the PGIM Core Ultra Short Bond Fund (the “Core Fund”), a portfolio of Prudential Investment Portfolios 2, registered under the 1940 Act, and managed by PGIM Investments. Through the Account’s investment in the mentioned underlying fund, PGIM Investments and/or its affiliates are paid fees or compensated for providing their services. Earnings from the Core Fund are disclosed on the Statement of Operations as “Affiliated dividend income”.
C3
| Note 5: | | Portfolio Securities |
For the year ended December 31, 2018, the aggregate cost of purchases and the proceeds from sales of securities, excluding short-term investments, were $81,321,597 and $114,435,916, respectively.
A summary of the cost of purchases and proceeds from sales of shares of an affiliated mutual fund for the year ended December 31, 2018, is presented as follows:
| | | | | | | | | | | | | | | | | | | | | | | | | | | | | | |
Value,
Beginning
of Year | | | Cost of
Purchases | | | Proceeds
from Sales | | | Change in
Unrealized
Gain(Loss) | | | Realized
Gain(Loss) | | | Value,
End of Year | | | Shares,
End of Year | | | Income | |
| | PGIM Core Ultra Short Bond Fund* | |
| | $2,554,392 | | | $ | 59,018,240 | | | $ | 55,384,487 | | | $ | — | | | $ | — | | | $ | 6,188,145 | | | | 6,188,145 | | | $ | 96,122 | |
| | | | | | | | | | | | | | | | | | | | | | | | | | | | | | |
| | * | The Account did not have any capital gain distributions during reporting period. |
| Note 6: | | Net Increase (Decrease) In Net Assets Resulting From Surplus Transfers |
The increase (decrease) in net assets resulting from surplus transfers represents the net increase to/(reductions from) PICA’s investment in the Account.
| Note 7: | | Participant Loans |
Participant loan initiations are not permitted inVCA-2. However, participants who initiated loans in other accounts are permitted to direct loan repayments intoVCA-2.
For the years ended December 31, 2018 and 2017, $0 and $0 of participant loan principal and interest have been paid toVCA-2, respectively.
| Note 8: | | Risks of Investing in the Account |
The Account’s risks include, but are not limited to, some or all of the risks discussed below:
Equity and Equity-Related Securities Risks: The value of a particular security could go down and you could lose money. In addition to an individual security losing value, the value of the equity markets or a sector in which the Account invests could go down. The Account’s holdings can vary significantly from broad market indexes and the performance of the Account can deviate from the performance of these indexes. Different parts of a market can react differently to adverse issuer, market, regulatory, political and economic developments.
Foreign Securities Risk: The Account’s investments in securities of foreign issuers or issuers with significant exposure to foreign markets involve additional risk. Foreign countries in which the Account may invest may have markets that are less liquid, less regulated and more volatile than US markets. The value of the Account’s investments may decline because of factors affecting the particular issuer as well as foreign markets and issuers generally, such as unfavorable government actions, and political or financial instability.
Market and Credit Risks: Securities markets may be volatile and the market prices of the Account’s securities may decline. Securities fluctuate in price based on changes in an issuer’s financial condition and overall market and economic conditions. If the market prices of the securities owned by the Account fall, the value of an investment in the Account will decline. Additionally, the Account may also be exposed to credit risk in the event that an issuer or guarantor fails to perform or that an institution or entity with which the Account has unsettled or open transactions defaults.
| Note 9. | | Recent Accounting Pronouncements and Reporting Updates |
In August 2018, the FASB issued Accounting Standards Update (“ASU”) No. 2018-13, which changes certain fair value measurement disclosure requirements. The new ASU, in addition to other modifications and additions, removes the requirement to disclose the amount and reasons for transfers between Level 1 and Level 2 of the fair value hierarchy, and the Account’s policy for the timing of transfers between levels. The amendments are effective for financial statements issued for fiscal years beginning after December 15, 2019, and interim periods within those fiscal years. The Manager has evaluated the implications of certain provisions of the ASU and has determined to early adopt aspects related to the removal and modification of certain fair value measurement disclosures under the ASU effective immediately. At this time, the Manager is evaluating the implications of certain other provisions of the ASU related to new disclosure requirements and any impact on the financial statement disclosures has not yet been determined.
C4
REPORT OF INDEPENDENT REGISTERED PUBLIC ACCOUNTING FIRM
TO THE COMMITTEE AND PARTICIPANTS OF
THE PRUDENTIAL VARIABLE CONTRACTACCOUNT-2:
Opinion on the Financial Statements
We have audited the accompanying statement of net assets of The Prudential Variable ContractAccount-2 (the Account), as of December 31, 2018, the related statement of operations for the year then ended, the statements of changes in net assets for each of the years in thetwo-year period then ended, and the related notes (collectively, the financial statements) and the financial highlights for accumulation units (the financial highlights) for each of the years indicated therein. In our opinion, the financial statements and financial highlights present fairly, in all material respects, the financial position of the Account as of December 31, 2018, the results of its operations for the year then ended, changes in its net assets for each of the years in thetwo-year period then ended, and the financial highlights for each of the years indicated therein, in conformity with U.S. generally accepted accounting principles.
Basis for Opinion
These financial statements and financial highlights are the responsibility of the Account’s management. Our responsibility is to express an opinion on these financial statements and financial highlights based on our audits. We are a public accounting firm registered with the Public Company Accounting Oversight Board (United States) (PCAOB) and are required to be independent with respect to the Account in accordance with the U.S. federal securities laws and the applicable rules and regulations of the Securities and Exchange Commission and the PCAOB.
We conducted our audits in accordance with the standards of the PCAOB. Those standards require that we plan and perform the audit to obtain reasonable assurance about whether the financial statements and financial highlights are free of material misstatement, whether due to error or fraud. Our audits included performing procedures to assess the risks of material misstatement of the financial statements and financial highlights, whether due to error or fraud, and performing procedures that respond to those risks. Such procedures included examining, on a test basis, evidence regarding the amounts and disclosures in the financial statements and financial highlights. Such procedures also included confirmation of securities owned as of December 31, 2018, by correspondence with the custodian, transfer agent, or brokers, or by other appropriate auditing procedures when replies were not received. Our audits also included evaluating the accounting principles used and significant estimates made by management, as well as evaluating the overall presentation of the financial statements and financial highlights. We believe that our audits provide a reasonable basis for our opinion.

We have served as the auditor of one or more Prudential Variable Contract Accounts since 2003.
New York, New York
February 20, 2019
D1
INFORMATION ABOUT COMMITTEE MEMBERS AND OFFICERS
VCA-2 is managed by the VCA-2 Committee. The members of the VCA-2 Committee are elected by the persons having voting rights in respect of the VCA-2 Account. The affairs of VCA-2 are conducted in accordance with the Rules and Regulations of VCA-2. Information pertaining to the members of the VCA-2 Committee (hereafter referred to as “Committee Members”) is set forth below. Committee Members who are not deemed to be “interested persons” of VCA-2 as defined in the Investment Company Act of 1940, as amended (the 1940 Act) are referred to as “Independent Committee Members.” Committee Members who are deemed to be “interested persons” of VCA-2 are referred to as “Independent Committee Members.” Information pertaining to the Officers of VCA-2 is also set forth below.
| | | | | | |
| |
| Independent Committee Members |
Name, Address, Age
Position(s)
Portfolios Overseen | | Principal Occupation(s) During
Past Five Years | | Other Directorships Held During
Past Five Years | | Length of Committee Service |
Ellen S. Alberding (60)
Committee Member
Portfolios Overseen: 96 | | President and Board Member, The Joyce Foundation (charitable foundation) (since 2002); Vice Chair, City Colleges of Chicago (community college system) (2011-2015); Trustee, National Park Foundation (charitable foundation for national park system) (2009-2018); Trustee, Economic Club of Chicago (since 2009); Trustee, Loyola University (since 2018). | | None. | | Since September 2013 |
Kevin J. Bannon (66)
Committee Member
Portfolios Overseen: 96 | | Retired; Managing Director (April2008-May 2015) and Chief Investment Officer (October 2008-November 2013) of Highmount Capital LLC (registered investment adviser); formerly Executive Vice President and Chief Investment Officer (April 1993-August 2007) of Bank of New York Company; President (May2003-May 2007) of BNY Hamilton Family of Mutual Funds. | | Director of Urstadt Biddle Properties (equity real estate investment trust) (since September 2008). | | Since July 2008 |
Linda W. Bynoe (66)
Committee Member
Portfolios Overseen: 96 | | President and Chief Executive Officer (since March 1995) and formerly Chief Operating Officer (December 1989-February 1995) of Telemat Ltd. (management consulting); formerly Vice President (January 1985-June 1989) at Morgan Stanley & Co. (broker-dealer). | | Director of Anixter International, Inc. (communication products distributor) (since January 2006); Director of Northern Trust Corporation (financial services) (since April 2006); Trustee of Equity Residential (residential real estate) (since December 2009). | | Since March 2005 |
Barry H. Evans (58)
Committee Member
Portfolios Overseen: 95 | | Retired; Formerly President (2005-2016), Global Chief Operating Officer(2014-2016), Chief Investment Officer – Global Head of Fixed Income (1998-2014), and various portfolio manager roles (1986-2006), Manulife Asset Management U.S. | | Director, Manulife Trust Company (2011- present); Director, Manulife Asset Management Limited (2015-present); Formerly Chairman of the Board of Directors of Manulife Asset Management U.S. (2005-2016); Formerly Chairman of the Board, Declaration Investment Management and Research (2008-2016). | | Since September 2017 |
Keith F. Hartstein (62)
Committee Member & Independent Chair
Portfolios Overseen: 96 | | Retired; Member (since November 2014) of the Governing Council of the Independent Directors Council (organization of independent mutual fund directors); formerly President and Chief Executive Officer (2005-2012), Senior Vice President (2004-2005), Senior Vice President of Sales and Marketing (1997-2004), and various executive management positions (1990-1997), John Hancock Funds, LLC (asset management); Chairman, Investment Company Institute’s Sales Force Marketing Committee (2003-2008). | | None. | | Since September 2013 |
E1
| | | | | | |
| |
| Independent Committee Members |
Name, Address, Age
Position(s)
Portfolios Overseen | | Principal Occupation(s) During
Past Five Years | | Other Directorships Held During
Past Five Years | | Length of Committee Service |
Laurie Simon Hodrick (56)
Committee Member
Portfolios Overseen: 95 | | A. Barton Hepburn Professor Emerita of Economics in the Faculty of Business, Columbia Business School (since 2018); Visiting Professor of Law, Stanford Law School (since 2015); Visiting Fellow at the Hoover Institution, Stanford University (since 2015); Sole Member, ReidCourt LLC (since 2008) (a consulting firm); formerly A. Barton Hepburn Professor of Economics in the Faculty of Business, Columbia Business School (1996-2017); formerly Managing Director, Global Head of Alternative Investment Strategies, Deutsche Bank (2006-2008). | | Independent Director, Kabbage, Inc. (since July 2018) (financial services); Independent Director, Corporate Capital Trust (2017-2018) (a business development company). | | Since September 2017 |
Michael S. Hyland, CFA (73)
Committee Member
Portfolios Overseen: 96 | | Retired (since February 2005); formerly Senior Managing Director (July 2001-February 2005) of Bear Stearns & Co, Inc.; Global Partner, INVESCO (1999-2001); Managing Director and President of Salomon Brothers Asset Management (1989-1999). | | None. | | Since July 2008 |
Brian K. Reid (56)
Committee Member
Portfolios Overseen: 95 | | Retired; formerly Chief Economist for the Investment Company Institute (ICI)(2005-2017); formerly Senior Economist and Director of Industry and Financial Analysis at the ICI (1998-2004); formerly Senior Economist, Industry and Financial Analysis at the ICI (1996-1998); formerly Staff Economist at the Federal Reserve Board (1989-1996); Director, ICI Mutual Insurance Company (2012-2017). | | None. | | Since March 2018 |
| | | | | | |
| |
| Interested Committee Members |
Name, Address, Age
Position(s)
Portfolios Overseen | | Principal Occupation(s) During
Past Five Years | | Other Directorships Held During
Past Five Years | | Length of Committee Service |
Stuart S. Parker (56)
Committee Member & President
Portfolios Overseen: 96 | | President of PGIM Investments LLC (formerly known as Prudential Investments LLC) (since January 2012); Executive Vice President of Prudential Investment Management Services LLC (since December 2012); Executive Vice President of Jennison Associates LLC and Head of Retail Distribution of PGIM Investments LLC (June 2005-December 2011). | | None. | | Since January 2012 |
Scott E. Benjamin (45)
Committee Member & Vice President
Portfolios Overseen: 96 | | Executive Vice President (since June 2009) of PGIM Investments LLC; Executive Vice President (June 2009-June 2012) and Vice President (since June 2012) of Prudential Investment Management Services LLC; Executive Vice President (since September 2009) of AST Investment Services, Inc.; Senior Vice President of Product Development and Marketing, PGIM Investments (since February 2006); Vice President of Product Development and Product Management, PGIM Investments LLC (2003-2006). | | None. | | Since March 2010 |
E2
| | | | | | |
| |
| Interested Committee Members |
Name, Address, Age
Position(s)
Portfolios Overseen | | Principal Occupation(s) During
Past Five Years | | Other Directorships Held During
Past Five Years | | Length of Committee Service |
Grace C. Torres* (59)
Committee Member
Portfolios Overseen: 95 | | Retired; formerly Treasurer and Principal Financial and Accounting Officer of the Prudential Funds, Target Funds, Advanced Series Trust, Prudential Variable Contract Accounts and The Prudential Series Fund (1998-June 2014); Assistant Treasurer (March 1999-June 2014) and Senior Vice President (September 1999-June 2014) of PGIM Investments LLC; Assistant Treasurer (May 2003-June 2014) and Vice President (June 2005-June 2014) of AST Investment Services, Inc.; Senior Vice President and Assistant Treasurer (May 2003-June 2014) of Prudential Annuities Advisory Services, Inc. | | Formerly Director (July 2015-January 2018) of Sun Bancorp, Inc. N.A. and Sun National Bank; Director (since January 2018) of OceanFirst Financial Corp. and OceanFirst Bank. | | Since November 2014 |
* Note: Prior to her retirement in 2014, Ms. Torres was employed by PGIM Investments LLC. Due to her prior employment, she is considered to be an “interested person” under the 1940 Act. Ms. Torres is aNon-Management Interested Committee Member.
| | | | |
| |
| VCA-2 Officers(a) |
Name, Address and Age
Position with VCA-2 | | Principal Occupation(s) During Past Five Years | | Length of Service as VCA-2 Officer |
Raymond A. O’Hara (63)
Chief Legal Officer | | Vice President and Corporate Counsel (since July 2010) of Prudential Insurance Company of America (Prudential); Vice President (March 2011-Present) of Pruco Life Insurance Company and Pruco Life Insurance Company of New Jersey; Vice President and Corporate Counsel (March 2011-Present) of Prudential Annuities Life Assurance Corporation; Chief Legal Officer of PGIM Investments LLC (since June 2012); Chief Legal Officer of Prudential Mutual Fund Services LLC (since June 2012) and Corporate Counsel of AST Investment Services, Inc. (since June 2012); formerly Assistant Vice President and Corporate Counsel (September 2008-July 2010) of The Hartford Financial Services Group, Inc.; formerly Associate (September 1980-December 1987) and Partner (January 1988-August 2008) of Blazzard & Hasenauer, P.C. (formerly, Blazzard, Grodd & Hasenauer, P.C.). | | Since June 2012 |
Chad A. Earnst (43)
Chief Compliance Officer | | Chief Compliance Officer (September 2014-Present) of PGIM Investments LLC; Chief Compliance Officer (September 2014-Present) of the Prudential Funds, Target Funds, Advanced Series Trust, The Prudential Series Fund, Prudential’s Gibraltar Fund, Inc., Prudential Global Short Duration High Yield Income Fund, Inc., Prudential Short Duration High Yield Fund, Inc. and Prudential Jennison MLP Income Fund, Inc.; formerly Assistant Director (March 2010-August 2014) of the Asset Management Unit, Division of Enforcement, US Securities & Exchange Commission; Assistant Regional Director (January 2010-August 2014), Branch Chief (June 2006-December 2009) and Senior Counsel (April2003-May 2006) of the Miami Regional Office, Division of Enforcement, US Securities & Exchange Commission. | | Since September 2014 |
Dino Capasso (44)
Deputy Chief Compliance Officer | | Vice President and Deputy Chief Compliance Officer (June 2017-Present) of PGIM Investments LLC; formerly, Senior Vice President and Senior Counsel (January 2016-June 2017), and Vice President and Counsel (February 2012-December 2015) of Pacific Investment Management Company LLC. | | Since March 2018 |
Andrew R. French (56)
Secretary | | Vice President and Corporate Counsel (since February 2010) of Prudential; formerly Director and Corporate Counsel (2006-2010) of Prudential; Vice President and Assistant Secretary (since January 2007) of PGIM Investments LLC; Vice President and Assistant Secretary (since January 2007) of Prudential Mutual Fund Services LLC. | | Since October 2006 |
E3
| | | | |
| |
| VCA-2 Officers(a) |
Name, Address and Age
Position with VCA-2 | | Principal Occupation(s) During Past Five Years | | Length of Service as VCA-2 Officer |
Jonathan D. Shain (60)
Assistant Secretary | | Vice President and Corporate Counsel (since August 1998) of Prudential; Vice President and Assistant Secretary (since May 2001) of PGIM Investments LLC; Vice President and Assistant Secretary (since February 2001) of Prudential Mutual Fund Services LLC; formerly Vice President and Assistant Secretary (May 2003-June 2005) of AST Investment Services, Inc. | | Since May 2005 |
Claudia DiGiacomo (44)
Assistant Secretary | | Vice President and Corporate Counsel (since January 2005) of Prudential; Vice President and Assistant Secretary of PGIM Investments LLC (since December 2005); Associate at Sidley Austin Brown & Wood LLP (1999-2004). | | Since December 2005 |
Charles H. Smith (46)
Anti-Money Laundering
Compliance Officer | | Vice President, Corporate Compliance, Anti-Money Laundering Unit (since January 2015) of Prudential; committee member of the American Council of Life Insurers Anti-Money Laundering and Critical Infrastructure Committee (since January 2016); formerly Global Head of Economic Sanctions Compliance at AIG Property Casualty (February 2007-December 2014); Assistant Attorney General at the New York State Attorney General’s Office, Division of Public Advocacy. (August 1998-January 2007). | | Since January 2017 |
Christian J. Kelly (43)
Treasurer and Principal Financial
and Accounting Officer | | Vice President, Head of Fund Administration of PGIM Investments LLC (since November 2018); formerly, Director of Fund Administration of Lord Abbett & Co. LLC (2009-2018), Treasurer and Principal Accounting Officer of the Lord Abbett Family of Funds (2017-2018); Director of Accounting, Avenue Capital Group (2008-2009); Senior Manager, Investment Management Practice of Deloitte & Touche LLP (1998-2007). | | Since January 2019 |
Peter Parrella (60)
Assistant Treasurer | | Vice President (since 2007) and Director (2004-2007) within Prudential Mutual Fund Administration; formerly Tax Manager at SSB Citi Fund Management LLC (1997-2004). | | Since June 2007 |
Lana Lomuti (51)
Assistant Treasurer | | Vice President (since 2007) and Director (2005-2007), within Prudential Mutual Fund Administration; formerly Assistant Treasurer (December 2007-February 2014) of The Greater China Fund, Inc. | | Since April 2014 |
Linda McMullin (57)
Assistant Treasurer | | Vice President (since 2011) and Director (2008-2011) within Prudential Mutual Fund Administration. | | Since April 2014 |
Kelly A. Coyne (50)
Assistant Treasurer | | Director, Investment Operations of Prudential Mutual Fund Services LLC (since 2010). | | Since March 2015 |
(a) Excludes Mr. Parker and Mr. Benjamin, interested Committee Members who also serve as President and Vice President, respectively.
Explanatory Notes to Tables:
| | • | | Committee Members are deemed to be “Interested,” as defined in the 1940 Act, by reason of their affiliation with PGIM Investments LLC and/or an affiliate of PGIM Investments LLC. |
| | • | | Unless otherwise noted, the address of all Committee Members and Officers is c/o PGIM Investments LLC, 655 Broad Street, Newark, New Jersey 07102. |
| | • | | There is no set term of office for Committee Members or Officers. The Committee Members have adopted a retirement policy, which calls for the retirement of Committee Members on December 31 of the year in which they reach the age of 75. |
| | • | | “Other Directorships Held” includes only directorships of companies required to register or file reports with the SEC under the Securities and Exchange Act of 1934 (that is, “public companies”) or other investment companies registered under the 1940 Act. |
| | • | | “Portfolios Overseen” includes all investment companies managed by PGIM Investments LLC. The investment companies for which PGIM Investments LLC serves as manager include the PGIM ETF Trust, PGIM Funds, The Prudential Variable Contract Accounts, PGIM Short Duration High Yield Fund, Inc., PGIM Global Short Duration High Yield Fund, Inc., The Prudential Series Fund, Prudential’s Gibraltar Fund, Inc. and the Advanced Series Trust. |
E4
The toll-free number shown below can be used to make transfers and reallocations, review how your premiums are being allocated, and receive current investment option values in your contract. Unit values for each investment option are available to all participants from the toll-free number. Please be sure to have your contract number available when you call.
(800) 458-6333
The Prudential Insurance Company of America
751 Broad Street
Newark, NJ 07102-3714
Presorted
Standard
U.S. Postage
PAID
Prudential
©2019 Prudential Financial, Inc. and its related entities. PGIM Investments, the Prudential logo, the Rock symbol, and Bring Your Challenges are service marks of Prudential Financial, Inc. and its related entities, registered in many jurisdictions worldwide.
LT.RS.001
Item 2 – Code of Ethics —See Exhibit (a)
As of the end of the period covered by this report, the registrant has adopted a code of ethics (the “Section 406 Standards for Investment Companies – Ethical Standards for Principal Executive and Financial Officers”) that applies to the registrant’s Principal Executive Officer and Principal Financial Officer; the registrant’s Principal Financial Officer also serves as the Principal Accounting Officer.
The registrant hereby undertakes to provide any person, without charge, upon request, a copy of the code of ethics. To request a copy of the code of ethics, contact the registrant800-225-1852, and ask for a copy of the Section 406 Standards for Investment Companies - Ethical Standards for Principal Executive and Financial Officers.
Item 3 – Audit Committee Financial Expert –
The registrant’s Board has determined that Mr. Kevin J. Bannon, member of the Board’s Audit Committee is an “audit committee financial expert,” and that he is “independent,” for purposes of this Item.
Item 4 – Principal Accountant Fees and Services –
(a) Audit Fees
For the fiscal years ended December 31, 2018 and December 31, 2017, KPMG LLP (“KPMG”), the Registrant’s principal accountant, billed the Registrant $24,407, and $24,165 respectively, for professional services rendered for the audit of the Registrant’s annual financial statements or services that are normally provided in connection with statutory and regulatory filings.
(b) Audit-Related Fees
For the fiscal years ended December 31, 2018 and December 31, 2017: none.
(c) Tax Fees
For the fiscal years ended December 31, 2018 and December 31, 2017: none.
(d)All Other Fees
For the fiscal years ended December 31, 2018 and December 31, 2017: none.
(e) (1)Audit CommitteePre-Approval Policies and Procedures
THE PRUDENTIAL MUTUAL FUNDS
AUDIT COMMITTEE POLICY
on
Pre-Approval of Services Provided by the Independent Accountants
The Audit Committee of each Prudential Mutual Fund is charged with the responsibility to monitor the independence of the Fund’s independent accountants. As part of this responsibility, the Audit Committee mustpre-approve the independent accounting firm’s engagement to render audit and/or permissiblenon-audit services, as required by law. In evaluating a proposed engagement of the independent accountants, the Audit Committee will assess the effect that the engagement might reasonably be expected to have on the accountant’s independence. The Committee’s evaluation will be based on:
| | • | | a review of the nature of the professional services expected to be provided, |
| | • | | a review of the safeguards put into place by the accounting firm to safeguard independence, and |
| | • | | periodic meetings with the accounting firm. |
Policy for Audit andNon-Audit Services Provided to the Funds
On an annual basis, the scope of audits for each Fund, audit fees and expenses, and audit-related andnon-audit services (and fees proposed in respect thereof) proposed to be performed by the Fund’s independent accountants will be presented by the Treasurer and the independent accountants to the Audit Committee for review and, as appropriate, approval prior to the initiation of such services. Such presentation shall be accompanied by confirmation by both the Treasurer and the independent accountants that the proposednon-audit services will not adversely affect the independence of the independent accountants. Such proposednon-audit services shall be described in sufficient detail to enable the Audit Committee to assess the appropriateness of such services and fees, and the compatibility of the provision of such services with the auditor’s independence. The Committee shall receive periodic reports on the progress of the audit and other services which are approved by the Committee or by the Committee Chair pursuant to authority delegated in this Policy.
The categories of services enumerated under “Audit Services”, “Audit-related Services”, and “Tax Services” are intended to provide guidance to the Treasurer and the independent accountants as to those categories of services which the Committee believes are generally consistent with the independence of the independent accountants and which the Committee (or the Committee Chair) would expect upon the presentation of specific proposals topre-approve. The enumerated categories are not intended as an exclusive list of audit, audit-related or tax services, which the Committee (or the Committee Chair) would consider forpre-approval.
Audit Services
The following categories of audit services are considered to be consistent with the role of the Fund’s independent accountants:
| | Ø | Annual Fund financial statement audits |
| | Ø | Seed audits (related to new product filings, as required) |
| | Ø | SEC and regulatory filings and consents |
Audit-related Services
The following categories of audit-related services are considered to be consistent with the role of the Fund’s independent accountants:
| | Ø | Accounting consultations |
| | Ø | Fund merger support services |
| | Ø | Agreed Upon Procedure Reports |
| | Ø | Other Internal Control Reports |
Individual audit-related services that fall within one of these categories (except for fund merger support services) and are not presented to the Audit Committee as part of the annualpre-approval process are subject to an authorizedpre-approval by the Audit Committee so long as the estimated fee for those services does not exceed $30,000. Any services provided under suchpre-approval will be reported to the Audit Committee at its next regular meeting. Should the amount of such services exceed $30,000 any additional fees will be subject topre-approval by the Committee Chair (or any other Committee member on whom this responsibility has been delegated). Fees related to fund merger support services are subject to a separate authorizedpre-approval by the Audit Committee with fees determined on a per occurrence and merger complexity basis.
Tax Services
The following categories of tax services are considered to be consistent with the role of the Fund’s independent accountants:
| | Ø | Tax compliance services related to the filing or amendment of the following: |
| | ◾ | Federal, state and local income tax compliance; and, |
| | ◾ | Sales and use tax compliance |
| | Ø | Timely RIC qualification reviews |
| | Ø | Tax distribution analysis and planning |
| | Ø | Tax authority examination services |
| | Ø | Tax appeals support services |
| | Ø | Accounting methods studies |
| | Ø | Fund merger support services |
| | Ø | Tax consulting services and related projects |
Individual tax services that fall within one of these categories and are not presented to the Audit
Committee as part of the annualpre-approval process are subject to an authorizedpre-approval by the Audit Committee so long as the estimated fee for those services does not exceed $30,000. Any services provided under suchpre-approval will be reported to the Audit Committee at its next regular meeting. Should the amount of such services exceed $30,000 any additional fees will be subject topre-approval by the Committee Chair (or any other Committee member on whom this responsibility has been delegated).
OtherNon-Audit Services
Certainnon-audit services that the independent accountants are legally permitted to render will be subject topre-approval by the Committee or by one or more Committee members to whom the Committee has delegated this authority and who will report to the full Committee anypre-approval decisions made pursuant to this Policy.Non-audit services presented forpre-approval pursuant to this paragraph will be accompanied by a confirmation from both the Treasurer and the independent accountants that the proposed services will not adversely affect the independence of the independent accountants.
Proscribed Services
The Fund’s independent accountants will not render services in the following categories ofnon-audit services:
| | |
| Ø | | Bookkeeping or other services related to the accounting records or financial statements of the Fund |
| Ø | | Financial information systems design and implementation |
| Ø | | Appraisal or valuation services, fairness opinions, orcontribution-in-kind reports |
| Ø | | Actuarial services |
| Ø | | Internal audit outsourcing services |
| Ø | | Management functions or human resources |
| Ø | | Broker or dealer, investment adviser, or investment banking services |
| Ø | | Legal services and expert services unrelated to the audit |
| Ø | | Any other service that the Public Company Accounting Oversight Board determines, by regulation, is impermissible. |
Pre-approval ofNon-Audit Services Provided to Other Entities Within the Prudential Fund Complex
Certainnon-audit services provided to PGIM Investments LLC or any of its affiliates that also provide ongoing services to the Prudential Mutual Funds will be subject topre-approval by the Audit Committee. The onlynon-audit services provided to these entities that will requirepre-approval are thoserelated directly to the operations and financial reporting of the Funds. Individual projects that are not presented to the Audit Committee as part of the annualpre-approval process will be subject topre-approval by the Committee Chair (or any other Committee member on whom this responsibility has been delegated) so long as the estimated fee for those services does not exceed $30,000. Services presented forpre-approval pursuant to this paragraph will be accompanied by a confirmation from both the Treasurer and the independent accountants that the proposed services will not adversely affect the independence of the independent accountants.
Although the Audit Committee will notpre-approve all services provided to PGIM Investments LLC and its affiliates, the Committee will receive an annual report from the Fund’s independent accounting firm showing the aggregate fees for all services provided to PGIM Investments and its affiliates.
(e) (2)Percentage of services referred to in 4(b) – 4(d) that were approved by the audit committee –
For the fiscal years ended December 31, 2018 and December 31, 2017: none.
| (f) | Percentage of hours expended attributable to work performed by other than full time employees of principal accountant if greater than 50%. |
The percentage of hours expended on the principal accountant’s engagement to audit the registrant’s financial statements for the most recent fiscal year that were attributed to work performed by persons other than the principal accountant’s full-time, permanent employees was 0%.
(g)Non-Audit Fees
The aggregatenon-audit fees billed by KPMG for services rendered to the registrant’s investment adviser and any entity controlling, controlled by, or under common control with the investment adviser that provides ongoing services to the registrant for the fiscal years ended December 31, 2018 and December 31, 2017 was $0 and $0, respectively.
(h)Principal Accountant’s Independence
Not applicable as KPMG has not providednon-audit services to the registrant’s investment adviser and any entity controlling, controlled by, or under common control with the investment adviser that provides ongoing services to the registrant that were notpre-approved pursuant toRule 2-01(c)(7)(ii) ofRegulation S-X.
| Item 5 – | Audit Committee of Listed Registrants – Not applicable. |
| Item 6 – | Schedule of Investments – The schedule is included as part of the report to shareholders filed under Item 1 of this Form. |
| Item 7 – | Disclosure of Proxy Voting Policies and Procedures forClosed-End Management Investment Companies – Not applicable. |
| Item 8 – | Portfolio Managers ofClosed-End Management Investment Companies – Not applicable. |
| Item 9 – | Purchases of Equity Securities byClosed-End Management Investment Company and Affiliated Purchasers – Not applicable. |
| Item 10 – | Submission of Matters to a Vote of Security Holders – Not applicable. |
| Item 11 – | Controls and Procedures |
| | (a) | It is the conclusion of the registrant’s principal executive officer and principal financial officer that the effectiveness of the registrant’s current disclosure controls and procedures (such disclosure controls and procedures having been evaluated within 90 days of the date of this filing) provide reasonable assurance that the information required to be disclosed by the registrant has been recorded, processed, summarized and reported within the time period specified in the Commission’s rules and forms and that the information required to be disclosed by the registrant has been accumulated and communicated to the registrant’s principal executive officer and principal financial officer in order to allow timely decisions regarding required disclosure. |
| | (b) | There has been no significant change in the registrant’s internal control over financial reporting that occurred during the registrant’s most recent fiscal quarter of the period covered by this report that has materially affected, or is likely to materially affect, the registrant’s internal control over financial reporting. |
Item 12 – Exhibits
| | (a) (1) | Code of Ethics – Attached hereto as ExhibitEX-99.CODE-ETH |
| | (2) | Certifications pursuant to Section 302 of the Sarbanes-Oxley Act – Attached hereto as ExhibitEX-99.CERT. |
| | (3) | Any written solicitation to purchase securities under Rule23c-1. – Not applicable. |
| | (b) | Certifications pursuant to Section 906 of the Sarbanes-Oxley Act – Attached hereto as ExhibitEX-99.906CERT. |
SIGNATURES
Pursuant to the requirements of the Securities Exchange Act of 1934 and the Investment Company Act of 1940, the registrant has duly caused this report to be signed on its behalf by the undersigned, thereunto duly authorized.
Registrant: The Prudential Variable ContractAccount-2
| | |
| By: | | /s/ Andrew R. French |
| | Andrew R. French |
| | Secretary |
| |
| Date: | | February 20, 2019 |
Pursuant to the requirements of the Securities Exchange Act of 1934 and the Investment Company Act of 1940, this report has been signed below by the following persons on behalf of the registrant and in the capacities and on the dates indicated.
| | |
| By: | | /s/ Stuart S. Parker |
| | Stuart S. Parker |
| | President and Principal Executive Officer |
| |
| Date: | | February 20, 2019 |
| |
| By: | | /s/ Christian J. Kelly |
| | Christian J. Kelly |
| | Treasurer and Principal Financial and Accounting Officer |
| |
| Date: | | February 20, 2019 |