UNITED STATES
SECURITIES AND EXCHANGE COMMISSION
Washington, D.C. 20549
FORM N-CSR
CERTIFIED SHAREHOLDER REPORT OF REGISTERED
MANAGEMENT INVESTMENT COMPANIES
| | |
| Investment Company Act file number: | | 811-01660 |
| |
| Exact name of registrant as specified in charter: | | Prudential’s Gibraltar Fund, Inc. |
| |
| Address of principal executive offices: | | Gateway Center 3, |
| | 100 Mulberry Street, |
| | Newark, New Jersey 07102 |
| |
| Name and address of agent for service: | | Deborah A. Docs |
| | Gateway Center 3, |
| | 100 Mulberry Street, |
| | Newark, New Jersey 07102 |
| |
| Registrant’s telephone number, including area code: | | 973-367-7521 |
| |
| Date of fiscal year end: | | 12/31/2011 |
| |
| Date of reporting period: | | 12/31/2011 |
Item 1 – Reports to Stockholders

PRUDENTIAL’S GIBRALTAR FUND, INC.
ANNUAL REPORT Ÿ DECEMBER 31, 2011
This report is authorized for distribution to prospective investors only when preceded or accompanied by a current prospectus and current performance results. Investors should carefully consider the contract and the Fund’s investment objective, risks, and charges and expenses before investing. The contract and the Fund prospectus contain information relating to investment objectives, risks, and charges and expenses, as well as other important information. Read them carefully before investing or sending money.
This report must be preceded or accompanied by the current prospectuses for the Prudential Gibraltar Fund and the applicable variable annuity contract. The prospectuses contain information on the investment objectives, risks, and charges and expenses of the portfolios, and the contract and should be read carefully.
A description of the Fund’s proxy voting policies and procedures is available, without charge, upon request. Owners of variable annuity contracts should call (888)778-2888, to obtain descriptions of the Fund’s proxy voting policies and procedures. Information regarding how the Fund voted proxies relating to portfolio securities during the most recent 12-month period ended June 30 is available on the website of the Securities and Exchange Commission (the Commission) at www.sec.gov and on the Fund’s website at www.prudential.com.
The Fund files with the Commission a complete listing of portfolio holdings as of its first and third quarter-end on Form N-Q. Form N-Q is available on the Commission’s website at www.sec.gov or by visiting the Commission’s Public Reference Room. For more information on the Commission’s Public Reference Room, please visit the Commission’s website or call (800)SEC-0330. Form N-Q is also available on the Fund’s website or by calling the telephone numbers referenced above, for variable annuity and variable life insurance contract owners.
The Fund’s Statement of Additional Information contains additional information about the Fund’s Trustees and is available without charge upon request by calling (888)778-2888.
| | | | |
Prudential’s Gibraltar Fund, Inc. Table of Contents | | Annual Report | | December 31, 2011 |
| n | | PRESENTATION OF PORTFOLIO HOLDINGS |
| n | | FEES AND EXPENSES TABLE |
| | | | |
| |
| Section A | | Schedule of Investments and Financial Statements |
| Section B | | Notes to Financial Statements |
| Section C | | Financial Highlights |
| Section D | | Report of Independent Registered Public Accounting Firm |
| Section E | | Information about Trustees and Officers |
| | | | |
Prudential’s Gibraltar Fund, Inc. Letter to Planholders | | Annual Report | | December 31, 2011 |
At Prudential, our primary objective is to help investors achieve and maintain long-term financial success. This Gibraltar annual report outlines our efforts to achieve this goal. We hope you find it informative and useful.
Prudential has been building on a heritage of success for more than 135 years. The quality of our businesses and risk diversification has enabled us to manage effectively through volatile markets over time. We believe the array of our products provides a highly attractive value proposition to clients like you who are focused on financial security.
Your financial professional is the best resource to help you make the most informed investment decisions. Together, you can build a diversified investment portfolio that aligns with your long-term financial goals. Please keep in mind that diversification and asset allocation strategies do not assure a profit or protect against loss in declining markets.
Thank you for selecting Prudential as one of your financial partners. We value your trust and appreciate the opportunity to help you achieve financial security.
Sincerely,

Stephen Pelletier
President,
Prudential’s Gibraltar Fund, Inc.
January 31, 2012

PRESIDENT
STEPHEN PELLETIER
| | |
Prudential’s Gibraltar Fund, Inc. | | December 31, 2011 |
Investment Manager’s Report - As of December 31, 2011
| | | | | | | | | | | | |
Average Annual Total
Returns | | 1-Year | | | 5-Year | | | 10-Year | |
Fund | | | 1.57 | % | | | 1.88 | % | | | 3.26 | % |
S&P 500 Index | | | 2.09 | | | | -0.25 | | | | 2.92 | |
Past performance is no guarantee of future returns. The investment return and principal value of an investment will fluctuate, so that an investor’s shares, when redeemed, may be worth more or less than their original cost. Current performance may be lower or higher than the past performance data quoted.
Fund performance is net of investment fees and fund expenses, but not product charges, which, if included, would significantly lower the performance quoted.
$10,000 INVESTED OVER 10 YEARS
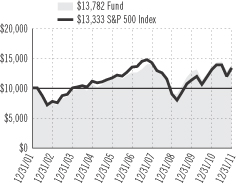
For the year ended December 31, 2011, the Gibraltar Fund returned 1.57%.
The investment objective of the Fund is growth of capital to the extent compatible with a concern for preservation of principal by investing in common stocks and other securities convertible into common stock. The Fund is subadvised by Jennison Associates LLC.
The Fund is built from the bottom up, with stocks selected one at a time, based on fundamental analysis of individual companies. Jennison looks for companies with sufficient liquidity, adequate capitalization, and fundamental characteristics consistent with the strategy’s investment objectives, including superior absolute and relative earnings growth; high levels of unit, revenue, and cash flow growth; improving sales momentum; high or improving profitability; and a robust balance sheet with high or improving return on equity, assets, or invested capital.
Stock selection was strong in information technology, where MasterCard, Apple, and International Business Machines (IBM) advanced. MasterCard’s revenues and earnings exceeded consensus forecasts. The company received an additional boost when the Federal Reserve limited debit-transaction fees charged by banks less onerously than had been feared. Apple’s financial results beat consensus forecasts, as sales of iPhones and iPads continued to impress. IBM climbed on better-than-expected revenue and earnings, growth across global geographies, and strong cash flow.
Stock selection and an overweight position benefited performance in consumer discretionary, where Starbucks and Ralph Lauren advanced. Starbucks benefited from strong domestic and international growth and enthusiasm about its expanded presence in the premium single-cup coffee market. Ralph Lauren reported better-than-projected earnings on stronger-than-expected revenues and above-consensus gross and operating margins. Jennison believes the company has attractive opportunities in Europe and Asia, in categories such as accessories and shoes, and in the online channel.
Consumer staples holdings generated the Fund’s largest absolute returns, although an underweight position in the sector hurt performance relative to the benchmark. Natural foods retailer Whole Foods Market climbed on strong sales trends and market share gains.
Stock selection was detrimental in energy, healthcare, and financials. In energy, oil services company Schlumberger was adversely affected by falling energy prices. In healthcare, Agilent Technologies was hurt by indications of a slowdown in its aerospace and defense, U.S. pharmaceuticals, and oscilloscope businesses. Although the company, the world’s biggest maker of scientific-testing equipment, is not immune to economic weakness, Jennison likes its long-term revenue and profitability growth potential.
In the financials sector, Goldman Sachs’ decline reflected concerns about potential litigation against the company related to allegations it misled clients by not disclosing its proprietary interest in certain collateralized debt transactions.
The S&P 500 Index is an unmanaged, market value-weighted index of 500 stocks generally representative of the broad stock market. These returns do not include the effect of any investment management expenses. These returns would have been lower if they included the effect of these expenses. Investors cannot invest directly in a market index or average. For a complete list of holdings, refer to the Schedule of Investments section of this report.
Jennison Associates LLC is a registered investment advisor and a Prudential Financial Company.
| | |
Prudential’s Gibraltar Fund, Inc. Presentation of Portfolio Holdings — unaudited | | December 31, 2011 |
| | | | |
| Prudential’s Gibraltar Fund, Inc. | |
| Five Largest Holdings | | | (% of Net Assets | ) |
| Apple, Inc. | | | 6.3% | |
| NIKE, Inc. (Class B Stock) | | | 5.5% | |
| Google, Inc. (Class A Stock) | | | 4.8% | |
| Amazon.com, Inc. | | | 4.4% | |
| American Tower Corp. | | | 3.6% | |
For a complete listing of holdings, refer to the Schedule of Investments section of this report. Holdings reflect only long-term investments. Holdings/Issues/Industries/Sectors are subject to change.
| | |
Prudential’s Gibraltar Fund, Inc. Fees and Expenses — unaudited | | December 31, 2011 |
As a Planholder investing in the Fund through a variable contract, you incur ongoing costs, including management fees, and other Fund expenses. This example is intended to help you understand your ongoing costs (in dollars) of investing in the Fund and to compare these costs with the ongoing costs of investing in other investment options. This example does not reflect fees and charges under your contract. If contract charges were included, the costs shown below would be higher. Please consult your contract for more information about contract fees and charges.
The example is based on an investment of $1,000 invested at the beginning of the period and held for the entire period July 1, 2011 through December 31, 2011.
Actual Expenses
The first line of the table below provides information about actual account values and actual expenses. You may use this information, together with the amount you invested, to estimate the Fund expenses that you paid over the period. Simply divide your account value by $1,000 (for example, an $8,600 account value divided by $1,000 = 8.6), then multiply the result by the number in the first line under the heading entitled “Expenses Paid During the Six-Month Period” to estimate the Fund expenses you paid on your account during this period. As noted above, the table does not reflect variable contract fees and charges.
Hypothetical Example for Comparison Purposes
The second line of the table below provides information about hypothetical account values and hypothetical expenses based on the Fund’s actual expense ratio and an assumed rate of return of 5% per year before expenses, which is not the Fund’s actual return. The hypothetical account values and expenses may not be used to estimate the actual ending account balance or expenses you paid for the period. You may use this information to compare the ongoing costs of investing in the Fund and other investment options. To do so, compare this 5% hypothetical example with the 5% hypothetical examples that appear in the shareholder reports of the other investment options.
Please note that the expenses shown in the table are meant to highlight your ongoing Fund costs only and do not reflect any contract fees and charges, such as sales charges (loads), insurance charges or administrative charges. Therefore the second line of the table is useful to compare ongoing investment option costs only, and will not help you determine the relative total costs of owning different contracts. In addition, if these contract fees and charges were included, your costs would have been higher.
| | | | | | | | | | | | | | | | | | |
| Prudential’s Gibraltar Fund, Inc. | | Beginning
Account Value
July 1, 2011 | | | Ending
Account Value
December 31, 2011 | | | Annualized Expense
Ratio based on the
Six-Month period | | | Expenses Paid
During the
Six-Month period* | |
| Prudential’s Gibraltar Fund, Inc. | | Actual | | $ | 1,000.00 | | | $ | 958.40 | | | | 0.63 | % | | $ | 3.11 | |
| | | Hypothetical | | $ | 1,000.00 | | | $ | 1,022.03 | | | | 0.63 | % | | $ | 3.21 | |
* Portfolio expenses (net of fee waivers or subsidies, if any) for each share class are equal to the annualized expense ratio for each share class (provided in the table), multiplied by the average account value over the period, multiplied by the 184 days in the six-month period ended December 31, 2011, and divided by the 365 days in the Portfolio’s fiscal year ended December 31, 2011 (to reflect the six-month period). Expenses presented in the table include the expenses of any underlying portfolios in which the Portfolio may invest.
| | | | | | |
| | | PRUDENTIAL’S GIBRALTAR FUND, INC. | | |
| |
| SCHEDULE OF INVESTMENTS | | December 31, 2011 |
| | | | | | | | |
| LONG-TERM INVESTMENTS — 98.6% | |
| COMMON STOCKS | | Shares
| | | Value
(Note 1)
| |
| | | | | | | | | |
Aerospace & Defense — 6.5% | |
Precision Castparts Corp. | | | 26,593 | | | $ | 4,382,261 | |
United Technologies Corp. | | | 54,926 | | | | 4,014,541 | |
| | | | | | |
|
|
|
| | | | | | | | 8,396,802 | |
| | | | | | |
|
|
|
Air Freight & Logistics — 1.9% | |
Expeditors International of Washington, Inc. | | | 60,676 | | | | 2,485,289 | |
| | | | | | |
|
|
|
Automobiles — 2.8% | |
Harley-Davidson, Inc. | | | 92,408 | | | | 3,591,899 | |
| | | | | | |
|
|
|
Biotechnology — 1.1% | |
Vertex Pharmaceuticals, Inc.* | | | 44,817 | | | | 1,488,373 | |
| | | | | | |
|
|
|
Capital Markets — 2.9% | |
Goldman Sachs Group, Inc. (The) | | | 27,447 | | | | 2,482,032 | |
Morgan Stanley | | | 82,771 | | | | 1,252,325 | |
| | | | | | |
|
|
|
| | | | | | | | 3,734,357 | |
| | | | | | |
|
|
|
Chemicals — 2.3% | |
Monsanto Co. | | | 42,573 | | | | 2,983,090 | |
| | | | | | |
|
|
|
Communications Equipment — 1.9% | |
Juniper Networks, Inc.* | | | 119,936 | | | | 2,447,894 | |
| | | | | | |
|
|
|
Computers & Peripherals — 8.7% | |
Apple, Inc.* | | | 20,095 | | | | 8,138,475 | |
EMC Corp.* | | | 147,891 | | | | 3,185,572 | |
| | | | | | |
|
|
|
| | | | | | | | 11,324,047 | |
| | | | | | |
|
|
|
Diversified Financial Services — 1.5% | |
JPMorgan Chase & Co. | | | 57,699 | | | | 1,918,492 | |
| | | | | | |
|
|
|
Energy Equipment & Services — 3.0% | |
Schlumberger Ltd. | | | 56,761 | | | | 3,877,344 | |
| | | | | | |
|
|
|
Food & Staples Retailing — 4.3% | |
Costco Wholesale Corp. | | | 41,040 | | | | 3,419,453 | |
Whole Foods Market, Inc. | | | 30,922 | | | | 2,151,553 | |
| | | | | | |
|
|
|
| | | | | | | | 5,571,006 | |
| | | | | | |
|
|
|
Food Products — 2.6% | |
Mead Johnson Nutrition Co. | | | 49,148 | | | | 3,377,942 | |
| | | | | | |
|
|
|
Healthcare Providers & Services — 1.9% | |
Express Scripts, Inc.* | | | 55,627 | | | | 2,485,971 | |
| | | | | | |
|
|
|
Hotels, Restaurants & Leisure — 2.5% | |
Starbucks Corp. | | | 71,525 | | | | 3,290,865 | |
| | | | | | |
|
|
|
Internet & Catalog Retail — 4.4% | |
Amazon.com, Inc.* | | | 32,972 | | | | 5,707,453 | |
| | | | | | |
|
|
|
Internet Software & Services — 4.8% | |
Google, Inc. (Class A Stock)* | | | 9,622 | | | | 6,214,850 | |
| | | | | | |
|
|
|
IT Services — 7.9% | |
International Business Machines Corp. | | | 23,121 | | | | 4,251,490 | |
Mastercard, Inc. (Class A Stock) | | | 10,821 | | | | 4,034,285 | |
Visa, Inc. (Class A Stock) | | | 18,734 | | | | 1,902,063 | |
| | | | | | |
|
|
|
| | | | | | | | 10,187,838 | |
| | | | | | |
|
|
|
Life Sciences Tools & Services — 1.9% | |
Agilent Technologies, Inc.* | | | 69,860 | | | | 2,440,210 | |
| | | | | | |
|
|
|
Media — 2.8% | |
Walt Disney Co. (The) | | | 97,417 | | | | 3,653,137 | |
| | | | | | |
|
|
|
| | | | | | | | |
COMMON STOCKS
(continued) | | Shares
| | | Value
(Note 1)
| |
| | | | | | | | | |
Oil, Gas & Consumable Fuels — 3.9% | |
Occidental Petroleum Corp. | | | 21,310 | | | $ | 1,996,747 | |
Southwestern Energy Co.* | | | 96,759 | | | | 3,090,482 | |
| | | | | | |
|
|
|
| | | | | | | | 5,087,229 | |
| | | | | | |
|
|
|
Pharmaceuticals — 8.6% | |
Johnson & Johnson | | | 62,982 | | | | 4,130,359 | |
Novo Nordisk A/S (Denmark), ADR | | | 34,842 | | | | 4,015,889 | |
Shire PLC (Ireland), ADR | | | 28,470 | | | | 2,958,033 | |
| | | | | | |
|
|
|
| | | | | | | | 11,104,281 | |
| | | | | | |
|
|
|
Road & Rail — 2.0% | |
Union Pacific Corp. | | | 24,362 | | | | 2,580,910 | |
| | | | | | |
|
|
|
Semiconductors & Semiconductor Equipment — 3.3% | |
Altera Corp. | | | 70,517 | | | | 2,616,181 | |
Maxim Integrated Products, Inc. | | | 62,779 | | | | 1,634,765 | |
| | | | | | |
|
|
|
| | | | | | | | 4,250,946 | |
| | | | | | |
|
|
|
Software — 3.5% | |
Oracle Corp. | | | 119,391 | | | | 3,062,379 | |
Red Hat, Inc.* | | | 37,605 | | | | 1,552,711 | |
| | | | | | |
|
|
|
| | | | | | | | 4,615,090 | |
| | | | | | |
|
|
|
Textiles, Apparel & Luxury Goods — 8.0% | |
NIKE, Inc. (Class B Stock) | | | 73,964 | | | | 7,127,910 | |
Ralph Lauren Corp. | | | 23,284 | | | | 3,215,055 | |
| | | | | | |
|
|
|
| | | | | | | | 10,342,965 | |
| | | | | | |
|
|
|
Wireless Telecommunication Services — 3.6% | |
American Tower Corp. | | | 77,610 | | | | 4,657,376 | |
| | | | | | |
|
|
|
TOTAL LONG-TERM INVESTMENTS
(cost $93,146,845) | | | | | | | 127,815,656 | |
| | | | | | |
|
|
|
| SHORT-TERM INVESTMENT — 1.4% | |
Affiliated Money Market Mutual Fund | | | | | | | | |
Prudential Investment Portfolios 2 — Prudential Core Taxable Money Market Fund
(cost $1,726,830; Note 3)(a) | | | 1,726,830 | | | | 1,726,830 | |
| | | | | | |
|
|
|
TOTAL INVESTMENTS — 100.0%
(cost $94,873,675; Note 5) | | | | | | | 129,542,486 | |
OTHER ASSETS IN EXCESS OF LIABILITIES | | | | | | | 51,488 | |
| | | | | | |
|
|
|
NET ASSETS — 100.0% | | | | | | $ | 129,593,974 | |
| | | | | | |
|
|
|
The following abbreviations are used in portfolio descriptions:
| | |
| ADR | | American Depositary Receipt |
| PLC | | Public Limited Co. |
| * | Non-income producing security. |
| (a) | Prudential Investments LLC, the Manager of the Fund, also serves as Manager of the Prudential Investment Portfolios 2 — Prudential Core Taxable Money Market Fund. |
SEE NOTES TO FINANCIAL STATEMENTS.
A1
| | | | | | |
| | | PRUDENTIAL’S GIBRALTAR FUND, INC. (continued) | | |
| |
| SCHEDULE OF INVESTMENTS | | December 31, 2011 |
Various inputs are used in determining the value of the Fund’s investments. These inputs are summarized in the three broad levels listed below.
| Level 1— | quoted prices generally for securities actively traded on a regulated securities exchange and for open-end mutual funds which trade at daily net asset value. |
| Level 2— | other significant observable inputs (including, but not limited to, quoted prices for similar securities, interest rates, prepayment speeds, foreign currency exchange rates, and amortized cost) generally for debt securities, swaps, forward foreign currency contracts and for foreign stocks priced using vendor modeling tools. |
| Level 3— | significant unobservable inputs for securities valued in accordance with Board approved fair valuation procedures. |
The following is a summary of the inputs used as of December 31, 2011 in valuing such portfolio securities:
| | | | | | | | | | | | |
| | | Level 1
| | | Level 2
| | | Level 3
| |
Investments in Securities | | | | | | | | | | | | |
Common Stocks | | $ | 127,815,656 | | | $ | — | | | $ | — | |
Affiliated Money Market Mutual Fund | | | 1,726,830 | | | | — | | | | — | |
| | |
|
|
| |
|
|
| |
|
|
|
Total | | $ | 129,542,486 | | | $ | — | | | $ | — | |
| | |
|
|
| |
|
|
| |
|
|
|
The industry classification of portfolio holdings and other assets in excess of liabilities shown as a percentage of net assets as of December 31, 2011 were as follows:
| | | | |
Computers & Peripherals | | | 8.7 | % |
Pharmaceuticals | | | 8.6 | |
Textiles, Apparel & Luxury Goods | | | 8.0 | |
IT Services | | | 7.9 | |
Aerospace & Defense | | | 6.5 | |
Internet Software & Services | | | 4.8 | |
Internet & Catalog Retail | | | 4.4 | |
Food & Staples Retailing | | | 4.3 | |
Oil, Gas & Consumable Fuels | | | 3.9 | |
Wireless Telecommunication Services | | | 3.6 | |
Software | | | 3.5 | |
Semiconductors & Semiconductor Equipment | | | 3.3 | |
Energy Equipment & Services | | | 3.0 | |
Capital Markets | | | 2.9 | |
Automobiles | | | 2.8 | |
Media | | | 2.8 | |
Food Products | | | 2.6 | |
Hotels, Restaurants & Leisure | | | 2.5 | |
Chemicals | | | 2.3 | |
Road & Rail | | | 2.0 | |
Air Freight & Logistics | | | 1.9 | |
Communications Equipment | | | 1.9 | |
Healthcare Providers & Services | | | 1.9 | |
Life Sciences Tools & Services | | | 1.9 | |
Diversified Financial Services | | | 1.5 | |
Affiliated Money Market Mutual Fund | | | 1.4 | |
Biotechnology | | | 1.1 | |
| | |
|
|
|
| | | | 100.0 | |
Other assets in excess of liabilities | | | 0.0 | |
| | |
|
|
|
| | | | 100.0 | % |
| | |
|
|
|
SEE NOTES TO FINANCIAL STATEMENTS.
A2
| | | | | | |
| | | PRUDENTIAL’S GIBRALTAR FUND, INC. (continued) | | |
STATEMENT OF ASSETS AND LIABILITIES
as of December 31, 2011
| | | | |
| ASSETS | | | | |
Unaffiliated investments (cost $93,146,845) | | $ | 127,815,656 | |
Affiliated investments (cost $1,726,830) | | | 1,726,830 | |
Dividends receivable | | | 142,104 | |
Foreign tax reclaim receivable | | | 8,815 | |
Prepaid expenses | | | 920 | |
| | |
|
|
|
Total assets | | | 129,694,325 | |
| | |
|
|
|
| LIABILITIES | | | | |
Management fee payable | | | 61,376 | |
Accrued expenses and other liabilities | | | 38,908 | |
Payable to custodian | | | 67 | |
| | |
|
|
|
Total liabilities | | | 100,351 | |
| | |
|
|
|
| NET ASSETS | | $ | 129,593,974 | |
| | |
|
|
|
Net assets were comprised of: | | | | |
Common stock, at $ 0.01 par value | | $ | 127,569 | |
Paid-in capital in excess of par | | | 120,912,868 | |
| | |
|
|
|
| | | | 121,040,437 | |
Undistributed net investment income | | | 70,339 | |
Accumulated net realized loss on investment transactions | | | (26,185,613 | ) |
Net unrealized appreciation on investments | | | 34,668,811 | |
| | |
|
|
|
Net assets, December 31, 2011 | | $ | 129,593,974 | |
| | |
|
|
|
Net asset value and redemption price per share, 12,756,880 outstanding shares of common stock (authorized 75,000,000 shares) | | $ | 10.16 | |
| | |
|
|
|
STATEMENT OF OPERATIONS
Year Ended December 31, 2011
| | | | |
| INVESTMENT INCOME | | | | |
Dividends (net of $1,063 foreign withholding tax) | | $ | 1,373,053 | |
Affiliated dividend income | | | 11,103 | |
| | |
|
|
|
| | | | 1,384,156 | |
| | |
|
|
|
| EXPENSES | | | | |
Management fee | | | 769,329 | |
Custodian’s fees | | | 52,000 | |
Audit fee | | | 19,000 | |
Directors’ fees | | | 11,000 | |
Legal fees and expenses | | | 7,000 | |
Insurance expenses | | | 2,000 | |
Miscellaneous | | | 12,079 | |
| | |
|
|
|
Total expenses | | | 872,408 | |
| | |
|
|
|
| NET INVESTMENT INCOME | | | 511,748 | |
| | |
|
|
|
NET REALIZED AND UNREALIZED GAIN (LOSS) ON INVESTMENTS | | | | |
Net realized gain on investment transactions | | | 6,240,624 | |
Net change in unrealized appreciation (depreciation) on investments | | | (4,458,213 | ) |
| | |
|
|
|
| NET GAIN ON INVESTMENTS | | | 1,782,411 | |
| | |
|
|
|
NET INCREASE IN NET ASSETS RESULTING
FROM OPERATIONS | | $ | 2,294,159 | |
| | |
|
|
|
STATEMENT OF CHANGES IN NET ASSETS
| | | | | | | | |
| | | Year Ended December 31,
| |
| | | 2011
| | | 2010
| |
INCREASE (DECREASE) IN NET ASSETS OPERATIONS: | | | | | | | | |
Net investment income | | $ | 511,748 | | | $ | 657,640 | |
Net realized gain on investment transactions | | | 6,240,624 | | | | 13,448,483 | |
Net change in unrealized appreciation (depreciation) on investments | | | (4,458,213 | ) | | | (5,666,807 | ) |
| | |
|
|
| |
|
|
|
NET INCREASE IN NET ASSETS RESULTING FROM OPERATIONS | | | 2,294,159 | | | | 8,439,316 | |
| | |
|
|
| |
|
|
|
| DIVIDENDS: | | | | | | | | |
Dividends from net investment income | | | (480,000 | ) | | | (657,000 | ) |
| | |
|
|
| |
|
|
|
| CAPITAL STOCK TRANSACTIONS: | | | | | | | | |
Capital stock sold [0 and 2,679 shares, respectively] | | | — | | | | 25,911 | |
Capital stock issued in reinvestment of dividends [47,497 and 73,677 shares, respectively] | | | 480,000 | | | | 657,000 | |
Capital stock repurchased [1,771,185 and 2,230,769 shares, respectively] | | | (18,022,548 | ) | | | (20,735,630 | ) |
| | |
|
|
| |
|
|
|
NET DECREASE IN NET ASSETS RESULTING FROM CAPITAL STOCK TRANSACTIONS | | | (17,542,548 | ) | | | (20,052,719 | ) |
| | |
|
|
| |
|
|
|
| TOTAL DECREASE IN NET ASSETS | | | (15,728,389 | ) | | | (12,270,403 | ) |
| NET ASSETS: | | | | | | | | |
Beginning of year | | | 145,322,363 | | | | 157,592,766 | |
| | |
|
|
| |
|
|
|
End of year(a) | | $ | 129,593,974 | | | $ | 145,322,363 | |
| | |
|
|
| |
|
|
|
(a) Includes undistributed net investment income of: | | $ | 70,339 | | | $ | 38,591 | |
| | |
|
|
| |
|
|
|
SEE NOTES TO FINANCIAL STATEMENTS.
A3
NOTES TO THE FINANCIAL STATEMENTS OF
PRUDENTIAL’S GIBRALTAR FUND, INC.
Prudential’s Gibraltar Fund, Inc. (the “Fund”) was originally incorporated in the State of Delaware on March 14, 1968 and was reincorporated in the State of Maryland effective May 1, 1997. It is registered as an open-end, diversified management investment company under the Investment Company Act of 1940, as amended (“1940 Act”). The investment objective of the Fund is growth of capital to the extent compatible with a concern for preservation of principal by investing in common stocks and other securities convertible into common stock. The Fund was organized by The Prudential Insurance Company of America (“PICA”) to serve as the investment medium for the variable contract accounts of The Prudential Financial Security Program (“FSP”). The Fund does not sell its shares to the public. The accounts will redeem shares of the Fund to the extent necessary to provide benefits under the contracts or for such other purposes as may be consistent with the contracts.
| Note 1: | | Accounting Policies |
The following is a summary of significant accounting policies followed by the Fund in the preparation of its financial statements.
Securities Valuation: Securities listed on a securities exchange (other than options on securities and indices) are valued at the last sale price on such exchange on the day of valuation or, if there was no sale on such day, at the mean between the last reported bid and asked prices, or at the last bid price on such day in the absence of an asked price. Securities traded via NASDAQ are valued at the NASDAQ Official Closing Price (“NOCP”) on the day of valuation, or if there was no NOCP, at the last sale price. Securities traded in the over-the-counter market, including listed securities for which the primary market is believed by Prudential Investments LLC (“PI” or “Manager”), in consultation with the subadvisor, to be over-the-counter, are valued at market value using prices provided by an independent pricing agent or principal market maker. Securities for which quotations are not readily available, or whose values have been affected by events occurring after the close of the security’s foreign market and before the Fund’s normal pricing time, are valued at fair value in accordance with the Board of Directors’ approved fair valuation procedures. When determining the fair value of securities some of the factors influencing the valuation include, the nature of any restrictions on disposition of the securities; assessment of the general liquidity of the securities; the issuer’s financial condition and the markets in which it does business; the cost of the investment; the size of the holding and the capitalization of issuer; the prices of any recent transactions or bids/offers for such securities or any comparable securities; any available analyst media or other reports or information deemed reliable by the investment advisor regarding the issuer or the markets or industry in which it operates. Using fair value to price securities may result in a value that is different from a security’s most recent closing price and from the price used by other mutual funds to calculate the net asset values.
Investments in open-end, non-exchange-traded mutual funds are valued at their net asset value as of the close of the New York Stock Exchange on the date of valuation.
Securities Transactions and Net Investment Income: Securities transactions are recorded on the trade date. Realized and unrealized gains and losses from security and currency transactions are calculated on the identified cost basis. Dividend income is recorded on the ex-dividend date. Interest income, including amortization of premium and accretion of discount on debt securities, as required, is recorded on the accrual basis. Expenses are recorded on the accrual basis.
Dividends and Distributions: The Fund expects to pay dividends of net investment income semi-annually and distributions of net realized capital gains, if any, at least annually. Dividends and distributions to shareholders, which are determined in accordance with federal income tax regulations and which may differ from generally accepted accounting principles, are recorded on the ex-dividend date. Permanent book/tax differences relating to income and gains are reclassified amongst undistributed net investment income, accumulated net realized gain or loss and paid-in-capital in excess of par, as appropriate.
Taxes: It is the Fund’s policy to continue to meet the requirements of the Internal Revenue Code applicable to regulated investment companies and to distribute all of its taxable net income and capital gains, if any, to its shareholders. Therefore, no federal income tax provision is required. Withholding taxes on foreign dividends are recorded net of reclaimable amounts, at the time the related income is earned.
B1
Estimates: The preparation of the financial statements requires management to make estimates and assumptions that affect the reported amounts and disclosures in the financial statements. Actual results could differ from these estimates.
The Fund has a management agreement with Prudential Investments LLC (“PI”). Pursuant to this agreement, PI has responsibility for all investment advisory services and supervises the subadvisor’s performance of such services. PI has entered into a subadvisory agreement with Jennison Associates LLC (“Jennison”). The subadvisory agreement provides that Jennison will furnish investment advisory services in connection with the management of the Fund. PI pays for the services of Jennison, compensation of officers of the Fund, costs related to shareholder reporting, occupancy and certain clerical and administrative expenses of the Fund. The Fund bears all other costs and expenses.
The management fee paid to PI is computed daily and payable monthly, at an annual rate of 0.55% of the Fund’s average daily net assets.
The Fund has a distribution agreement with Prudential Investment Management Services LLC (“PIMS”) which acts as distributor of the shares of the Fund. No distribution or service fees are paid to PIMS as distributor of shares of the Fund.
PI, PICA, PIMS and Jennison are indirect, wholly-owned subsidiaries of Prudential Financial, Inc. (“Prudential”).
| Note 3: | | Other Transactions with Affiliates |
The Fund invests in the Prudential Core Taxable Money Market Fund (the “Core Fund”), a portfolio of the Prudential Investment Portfolios 2, registered under the 1940 Act and managed by PI. Earnings from the Core Fund are disclosed on the Statement of Operations as affiliated dividend income.
| Note 4: | | Portfolio Securities |
Purchases and sales of portfolio securities, other than short-term investments, for the year ended December 31, 2011, were $37,918,174 and $51,187,833, respectively.
| Note 5: | | Distributions and Tax Information |
Distributions to shareholders, which are determined in accordance with federal income tax regulations and which may differ from generally accepted accounting principles, are recorded on the ex-dividend date. In order to present undistributed net investment income, accumulated net realized loss on investment transactions and paid-in capital in excess of par on the Statement of Assets and Liabilities that more closely represent their tax character, certain adjustments have been made to accumulated net realized loss on investment transactions and paid-in capital in excess of par. For the year ended December 31, 2011, the adjustments were to decrease accumulated net realized loss on investment transactions and to decrease paid-in capital in excess of par by $7,907,664 primarily due to write off of capital loss carryforward due to expiration. Net investment income, net realized gain on investment transactions and net assets were not affected by this change.
For the years ended December 31, 2011 and 2010, the tax character of dividends paid as reflected in the Statement of Changes in Net Assets were $480,000 and $657,000 of ordinary income, respectively.
As of December 31, 2011, the accumulated undistributed earnings on a tax basis was $55,878 of ordinary income. This differs from the amount on the Statement of Assets and Liabilities primarily due to cumulative timing differences.
The United States federal income tax basis of the Fund’s investments and the net unrealized appreciation as of December 31, 2011 were as follows:
| | | | | | | | | | | | |
Tax Basis
| | Appreciation
| | | Depreciation
| | | Net Unrealized
Appreciation
| |
| $95,308,586 | | $ | 37,670,351 | | | $ | (3,436,451 | ) | | $ | 34,233,900 | |
B2
The difference between book basis and tax basis is attributable to deferred losses on wash sales and investments in partnerships.
For federal income tax purposes, the Fund had a capital loss carryforward at December 31, 2011 of approximately $25,736,000 of which $20,999,000 expires in 2016 and $4,737,000 expires in 2017. As of December 31, 2011, approximately $7,908,000 of its capital loss carryforward was written off due to expiration. The Fund utilized approximately $5,028,000 of its capital loss carryforward to offset net taxable gains realized in the year ended December 31, 2011. Accordingly, no capital gains distributions are expected to be paid to shareholders until net gains have been realized in excess of such carryforward. Under the recently enacted Regulated Investment Company Modernization Act of 2010 (“the Act”), the Fund is permitted to carryforward capital losses incurred in taxable years beginning after December 22, 2010 (“post-enactment losses”) for an unlimited period. However, any post-enactment losses are required to be utilized before the utilization of losses incurred prior to the effective date of the Act. As a result of this ordering rule, capital loss carryforwards related to the taxable years beginning prior to the effective date of the Act may have an increased likelihood to expire unused. Additionally, post-enactment capital losses that are carried forward will retain their character as either short-term or long-term capital losses rather than being considered all short-term as under previous law.
Management has analyzed the Fund’s tax positions taken on federal income tax returns for all open tax years and has concluded that no provision for income tax is required in the Fund’s financial statements for the current reporting period. The Fund’s federal and state income and federal excise tax returns for tax years for which the applicable statutes of limitations have not expired are subject to examination by the Internal Revenue Service and state departments of revenue.
The Fund, along with other affiliated registered investment companies (the “Funds”), is a party to a Syndicated Credit Agreement (“SCA”) with a group of banks. The purpose of the SCA is to provide an alternative source of temporary funding for capital share redemptions. The SCA provides for a commitment of $900 million for the period December 16, 2011 through December 14, 2012. The Funds pay an annualized commitment fee of 0.08% of the unused portion of the SCA. Prior to December 16, 2011, the Funds had another Syndicated Credit Agreement of a $750 million commitment with an annualized commitment fee of 0.10% of the unused portion. Interest on any borrowings under the SCA is paid at contracted market rates. The commitment fee for the unused amount is accrued daily and paid quarterly.
The Fund did not utilize the SCA during the year ended December 31, 2011.
| Note 7: | | New Accounting Pronouncements |
In April 2011, the Financial Accounting Standards Board (“FASB”) issued Accounting Standards Update (“ASU”) No. 2011-03 “Reconsideration of Effective Control for Repurchase Agreements”. The objective of ASU No. 2011-03 is to improve the accounting for repurchase agreements and other agreements that both entitle and obligate a transferor to repurchase or redeem financial assets before their maturity. Under previous guidance, whether or not to account for a transaction as a sale was based on, in part, if the entity maintained effective control over the transferred financial assets. ASU No. 2011-03 removes the transferor’s ability criterion from the effective control assessment. This guidance is effective prospectively for interim and annual reporting periods beginning on or after December 15, 2011. At this time, management is evaluating the implications of ASU No. 2011-03 and its impact on the financial statements has not been determined.
In May 2011, the FASB issued ASU No. 2011-04 “Amendments to Achieve Common Fair Value Measurement and Disclosure Requirements in U.S. GAAP and IFRSs”. ASU No. 2011-04 includes common requirements for measurement of and disclosure about fair value between U.S. GAAP and IFRS. ASU No. 2011-04 will require reporting entities to disclose quantitative information about the unobservable inputs used in the fair value measurements categorized within Level 3 of the fair value hierarchy. In addition, ASU No. 2011-04 will require reporting entities to make disclosures about amounts and reasons for all transfers in and out of Level 1 and Level 2 fair value measurements. The new and revised disclosures are effective for interim and annual reporting periods beginning after December 15, 2011. At this time, management is evaluating the implications of ASU No. 2011-04 and its impact on the financial statements has not been determined.
B3
Financial Highlights
| | | | | | | | | | | | | | | | | | | | |
| | | Year Ended December 31,
| |
| | | 2011
| | | 2010
| | | 2009
| | | 2008
| | | 2007
| |
Per Share Operating Performance: | | | | | | | | | | | | | | | | | | | | |
Net Asset Value, beginning of year | | $ | 10.04 | | | $ | 9.47 | | | $ | 6.79 | | | $ | 10.56 | | | $ | 9.53 | |
| | |
|
|
| |
|
|
| |
|
|
| |
|
|
| |
|
|
|
Income (Loss) From Investment Operations: | | | | | | | | | | | | | | | | | | | | |
Net investment income | | | .04 | | | | .04 | | | | .04 | | | | .06 | | | | .09 | |
Net realized and unrealized gain (loss) on investments | | | .12 | | | | .57 | | | | 2.68 | | | | (3.76 | ) | | | 1.02 | |
| | |
|
|
| |
|
|
| |
|
|
| |
|
|
| |
|
|
|
Total from investment operations | | | .16 | | | | .61 | | | | 2.72 | | | | (3.70 | ) | | | 1.11 | |
| | |
|
|
| |
|
|
| |
|
|
| |
|
|
| |
|
|
|
Less Dividends: | | | | | | | | | | | | | | | | | | | | |
Dividends from net investment income | | | (.04 | ) | | | (.04 | ) | | | (.04 | ) | | | (.07 | ) | | | (.08 | ) |
| | |
|
|
| |
|
|
| |
|
|
| |
|
|
| |
|
|
|
Net Asset Value, end of year | | $ | 10.16 | | | $ | 10.04 | | | $ | 9.47 | | | $ | 6.79 | | | $ | 10.56 | |
| | |
|
|
| |
|
|
| |
|
|
| |
|
|
| |
|
|
|
Total Return(a) | | | 1.57 | % | | | 6.54 | % | | | 40.15 | % | | | (35.21 | )% | | | 11.72 | % |
Ratios/Supplemental Data: | | | | | | | | | | | | | | | | | | | | |
Net assets, end of year (in millions) | | $ | 129.6 | | | $ | 145.3 | | | $ | 157.6 | | | $ | 130.0 | | | $ | 223.5 | |
Ratios to average net assets(b): | | | | | | | | | | | | | | | | | | | | |
Expenses | | | .62 | % | | | .62 | % | | | .61 | % | | | .60 | % | | | .59 | % |
Net investment income | | | .37 | % | | | .45 | % | | | .54 | % | | | .65 | % | | | .83 | % |
Portfolio turnover rate | | | 28 | % | | | 61 | % | | | 56 | % | | | 67 | % | | | 57 | % |
| (a) | Total return is calculated assuming a purchase of a share on the first day and a sale on the last day of each year reported and includes reinvestment of dividends and distributions. Past performance is no guarantee of future results. Total returns may reflect adjustments to conform to generally accepted accounting principles. |
| (b) | Does not include expenses of the underlying portfolio in which the Fund invests. |
SEE NOTES TO FINANCIAL STATEMENTS.
C1
REPORT OF INDEPENDENT REGISTERED PUBLIC ACCOUNTING FIRM
THE BOARD OF DIRECTORS AND SHAREHOLDERS
PRUDENTIAL’S GIBRALTAR FUND, INC.:
We have audited the accompanying statement of assets and liabilities of Prudential’s Gibraltar Fund, Inc. (hereafter referred to as the “Fund”), including the schedule of investments, as of December 31, 2011, and the related statement of operations for the year then ended, the statement of changes in net assets for each of the years in the two-year period then ended and the financial highlights for each of the years in the five-year period then ended. These financial statements and financial highlights are the responsibility of the Fund’s management. Our responsibility is to express an opinion on these financial statements and financial highlights based on our audits.
We conducted our audits in accordance with the standards of the Public Company Accounting Oversight Board (United States). Those standards require that we plan and perform the audit to obtain reasonable assurance about whether the financial statements and financial highlights are free of material misstatement. An audit includes examining, on a test basis, evidence supporting the amounts and disclosures in the financial statements. Our procedures included confirmation of securities owned as of December 31, 2011, by correspondence with the custodian, transfer agent and brokers or by other appropriate auditing procedures where replies from brokers were not received. An audit also includes assessing the accounting principles used and significant estimates made by management, as well as evaluating the overall financial statement presentation. We believe that our audits provide a reasonable basis for our opinion.
In our opinion, the financial statements and financial highlights referred to above present fairly, in all material respects, the financial position of the Fund as of December 31, 2011, and the results of its operations, the changes in its net assets and the financial highlights for the periods described in the first paragraph above, in conformity with U.S. generally accepted accounting principles.

New York, New York
February 15, 2012
D1
Federal Income Tax Information (Unaudited)
For the year ended December 31, 2011, the Fund designates the maximum amount allowable under Section 854 of the Internal Revenue Code but not less than the following percentages of the ordinary income distributions paid as: 1) qualified dividend income (QDI); and 2) eligible for the corporate dividends received deduction (DRD):
| | | | | | | | |
| | | QDI
| | | DRD
| |
Prudential’s Gibraltar Fund, Inc. | | | 100 | % | | | 100 | % |
D2
MANAGEMENT OF THE FUND (Unaudited)
Information pertaining to the Directors of the Fund (hereafter referred to as “Trustees” or “Directors” or “Board Members”) is set forth below. Information pertaining to the Officers of the Fund is also set forth below. Trustees who are not deemed to be interested persons of the Fund as defined in the Investment Company Act of 1940, as amended (the Investment Company Act or the 1940 Act) are referred to as “Independent Trustees.” Trustees who are deemed to be “interested persons” of the Fund are referred to as “Interested Trustees.” “Fund Complex” consists of the Fund and any other investment companies managed by Prudential Investments LLC (PI) or the “Manager.”
| | | | |
| Independent Trustees(1) | | | | |
Name, Address, Age
No. of Portfolios Overseen | | Principal Occupation(s) During Past Five Years | | Other Directorships Held |
Susan Davenport Austin (44) No. of Portfolios Overseen: 84 | | Senior Vice President and Chief Financial Officer (Since 2007) and Vice President of Strategic Planning and Treasurer (2002-2007) of Sheridan Broadcasting Corporation; President of Sheridan Gospel Network (Since 2004); Vice President, Goldman, Sachs & Co. (2000-2001); Associate Director, Bear, Stearns & Co. Inc (1997-2000); Vice President, Salomon Brothers Inc (1993-1997); President of the Board, The MacDowell Colony (Since 2010); Chairman of the Board of Directors, Broadcast Music, Inc. (Since 2007); Member of the Board of Directors, Hubbard Radio, LLC (Since 2011); formerly Member of the Board of Directors, National Association of Broadcasters (2004-2010). | | None |
Saul K. Fenster, Ph.D. (78) No. of Portfolios Overseen: 84 | | President Emeritus of New Jersey Institute of Technology (since 2002); formerly President (1978-2002) of New Jersey Institute of Technology; Commissioner (1998-2002) of the Middle States Association Commission on Higher Education; Commissioner (1985-2002) of the New Jersey Commission on Science and Technology; formerly Director (1998-2005) of Society of Manufacturing Engineering Education Foundation; formerly Director of Prosperity New Jersey; formerly a director or trustee of Liberty Science Center, Research and Development Council of New Jersey, New Jersey State Chamber of Commerce, and National Action Council for Minorities in Engineering. | | Formerly Director (2000-2006) of IDT Corporation. |
Delayne Dedrick Gold (73) No. of Portfolios Overseen: 84 | | Marketing Consultant (1982-present); formerly Senior Vice President and Member of the Board of Directors, Prudential Bache Securities, Inc. | | None |
W. Scott McDonald, Jr., Ph.D. (74) No. of Portfolios Overseen: 84 | | Formerly Management Consultant (1997-2004) and of Counsel (2004-2005) at Kaludis Consulting Group, Inc. (company serving higher education); formerly principal (1995-1997), Scott McDonald Associates; Chief Operating Officer (1991-1995), Fairleigh Dickinson University; Executive Vice President and Chief Operating Officer (1975-1991), Drew University; interim President (1988-1990), Drew University; formerly Director of School, College and University Underwriters Ltd. | | None |
Thomas T. Mooney (70) No. of Portfolios Overseen: 84 | | Formerly Chief Executive Officer, Excell Partners, Inc. (2005-2007) formerly President of the Greater Rochester Metro Chamber of Commerce (1976-2004) formerly Rochester City Manager (1973); formerly Deputy Monroe County Executive (1974-1976). | | None |
| | | | |
Thomas M. O’Brien (61) No. of Portfolios Overseen: 84 | | President and COO (since November 2006) and CEO (since April 2007) of State Bancorp, Inc. and State Bank; formerly Vice Chairman (January 1997-April 2000) of North Fork Bank; formerly President and Chief Executive Officer (December 1984-December 1996) of North Side Savings Bank; formerly President and Chief Executive Officer (May 2000-June 2006) Atlantic Bank of New York. | | Director (since April 2008) of Federal Home Loan Bank of New York; formerly Director (December 1996-May 2000) of North Fork Bancorporation, Inc.; formerly Director (May 2000-April 2006) of Atlantic Bank of New York; Director (since November 2006) of State Bancorp, Inc. (NASDAQ: STBC) and State Bank of Long Island. |
F. Don Schwartz (76) No. of Portfolios Overseen: 84 | | Independent Management/Marketing Consultant (since 2002); formerly CEO and President of AceCo, Inc. (1985-2001) (consulting firm specializing in universal/variable life and variable annuity products); formerly Vice President of The Equitable Life Assurance Society; formerly Guest Insurance Professor at the American College, Louisiana State University, Alabama State University and the Insurance Marketing Institute; Advisor to several state insurance commissioners; a Chartered Life Underwriter, Chartered Financial Consultant and Fellow of the Life Insurance Management Institute. | | None. |
E1
| | | | |
| Interested Trustees(1) | | | | |
Name, Address, Age
No. of Portfolios Overseen | | Principal Occupation(s) During Past Five Years | | Other Directorships Held |
Stephen Pelletier (58) No. of Portfolios Overseen: 84 | | President of Prudential Annuities (since September 2008); Chairman and CEO, International Investments, Prudential Financial (since January 1998). | | None |
Robert F. Gunia (65) No. of Portfolios Overseen: 84 | | Independent Consultant (since October 2009); formerly Chief Administrative Officer (September 1999-September 2009) and Executive Vice President (December 1996-September 2009) of Prudential Investments LLC; formerly Executive Vice President (March 1999-September 2009) and Treasurer (May 2000-September 2009) of Prudential Mutual Fund Services LLC; formerly President (April 1999-December 2008) and Executive Vice President and Chief Operating Officer (December 2008-December 2009) of Prudential Investment Management Services LLC; formerly Chief Administrative Officer, Executive Vice President and Director (May 2003-September 2009) of AST Investment Services, Inc. | | Director (since May 1989) of The Asia Pacific Fund, Inc. |
Timothy S. Cronin (46) Number of Portfolios Overseen: 84 | | Chief Investment Officer and Strategist of Prudential Annuities (since January 2004); Director of Investment & Research Strategy (since February 1998); President of AST Investment Services, Inc. (since June 2005). | | None. |
(1) The year that each Trustee joined the Fund’s Board is as follows: Susan Davenport Austin, 2011; Timothy S. Cronin, 2009; Saul K. Fenster, 1985; Delayne Dedrick Gold, 2003; Robert F. Gunia, 2003; W. Scott McDonald, 1985; Thomas T. Mooney, 2003; Thomas M. O’Brien, 2003; Stephen Pelletier, 2008; F. Don Schwartz, 2003.
| | |
| Fund Officers(a)(1) | | |
Name, Address and Age Position with the Fund | | Principal Occupation(s) During the Past Five Years |
Kathryn L. Quirk (59) Chief Legal Officer | | Vice President and Corporate Counsel (since September 2004) of Prudential; Executive Vice President, Chief Legal Officer and Secretary (since July 2005) of PI and Prudential Mutual Fund Services LLC; Vice President and Corporate Counsel (since June 2005) and Secretary (since February 2006) of AST Investment Services, Inc.; formerly Senior Vice President and Assistant Secretary (November 2004-August 2005) of PI; formerly Assistant Secretary (June 2005-February 2006) of AST Investment Services, Inc.; formerly Managing Director, General Counsel, Chief Compliance Officer, Chief Risk Officer and Corporate Secretary (1997-2002) of Zurich Scudder Investments, Inc. |
| | |
Deborah A. Docs (54) Secretary | | Vice President and Corporate Counsel (since January 2001) of Prudential; Vice President (since December 1996) and Assistant Secretary (since March 1999) of PI; formerly Vice President and Assistant Secretary (May 2003-June 2005) of AST Investment Services, Inc. |
Jonathan D. Shain (53) Assistant Secretary | | Vice President and Corporate Counsel (since August 1998) of Prudential; Vice President and Assistant Secretary (since May 2001) of PI; Vice President and Assistant Secretary (since February 2001) of PMFS; formerly Vice President and Assistant Secretary (May 2003-June 2005) of AST Investment Services, Inc. |
Claudia DiGiacomo (37) Assistant Secretary | | Vice President and Corporate Counsel (since January 2005) of Prudential; Vice President and Assistant Secretary of PI (since December 2005); Associate at Sidley Austin Brown Wood LLP (1999-2004). |
John P. Schwartz (40) Assistant Secretary | | Vice President and Corporate Counsel (since April 2005) of Prudential; Vice President and Assistant Secretary of PI (since December 2005); Associate at Sidley Austin Brown Wood LLP (1997-2005). |
Andrew R. French (49) Assistant Secretary | | Vice President and Corporate Counsel (since February 2010) of Prudential; formerly Director and Corporate Counsel (2006-2010) of Prudential; Vice President and Assistant Secretary (since January 2007) of PI; Vice President and Assistant Secretary (since January 2007) of PMFS. |
Timothy J. Knierim (53) Chief Compliance Officer | | Chief Compliance Officer of Prudential Investment Management, Inc. (since July 2007); formerly Chief Risk Officer of PIM and PI (2002-2007) and formerly Chief Ethics Officer of PIM and PI (2006-2007). |
Valerie M. Simpson (53) Deputy Chief Compliance Officer | | Chief Compliance Officer (since April 2007) of PI and AST Investment Services, Inc.; formerly Vice President-Financial Reporting (June 1999-March 2006) for Prudential Life and Annuities Finance. |
Theresa C. Thompson (49) Deputy Chief Compliance Officer | | Vice President, Compliance, PI (since April 2004); and Director, Compliance, PI (2001-2004). |
Richard W. Kinville (43) Anti-Money Laundering Compliance Officer | | Vice President, Corporate Compliance, Anti-Money Laundering Unit (since January 2005) of Prudential; committee member of the American Council of Life Insurers Anti-Money Laundering and Critical Infrastructure Committee (since January 2007); formerly Investigator and Supervisor in the Special Investigations Unit for the New York Central Mutual Fire Insurance Company (August 1994-January 1999); Investigator in AXA Financial’s Internal Audit Department and Manager in AXA’s Anti-Money Laundering Office (January 1999-January 2005); first chair of the American Council of Life Insurers Anti-Money Laundering and Critical Infrastructure Committee (June 2007-December 2009 ). |
Grace C. Torres (52) Treasurer and Principal Financial and Accounting Officer | | Assistant Treasurer (since March 1999) and Senior Vice President (since September 1999) of PI; Assistant Treasurer (since May 2003) and Vice President (since June 2005) of AST Investment Services, Inc.; Senior Vice President and Assistant Treasurer (since May 2003) of Prudential Annuities Advisory Services, Inc.; formerly Senior Vice President (May 2003-June 2005) of AST Investment Services, Inc. |
E2
| | |
| Fund Officers(a)(1) | | |
Name, Address and Age Position with the Fund | | Principal Occupation(s) During the Past Five Years |
M. Sadiq Peshimam (48) Assistant Treasurer | | Vice President (since 2005) of Prudential Investments LLC. |
Peter Parrella (53) Assistant Treasurer | | Vice President (since 2007) and Director (2004-2007) within Prudential Mutual Fund Administration; formerly Tax Manager at SSB Citi Fund Management LLC (1997-2004). |
Alan Fu (55) Assistant Treasurer | | Vice President and Corporate Counsel - Tax, Prudential Financial, Inc. (since October 2003). |
(a) Excludes Mr. Pelletier and Mr. Cronin, interested Board Members who also serve as President and Vice President, respectively.
(1) The year in which each individual became an Officer of the Fund is as follows: Kathryn L. Quirk, 2005; Deborah A. Docs, 2005; Jonathan D. Shain, 2005; Claudia DiGiacomo, 2005; John P. Schwartz, 2006; Andrew R. French, 2006; Timothy J. Kneirim, 2007; Valerie M. Simpson, 2007; Theresa C. Thompson, 2008; Grace C. Torres, 1997; Peter Parrella, 2007; M. Sadiq Peshimam, 2006; Alan Fu, 2006; Richard W. Kinville, 2011.
Explanatory Notes to Tables:
Trustees are deemed to be “Interested”, as defined in the 1940 Act, by reason of their affiliation with Prudential Investments LLC and/or an affiliate of Prudential Investments LLC. Stephen Pelletier and Timothy Cronin are Interested Trustees because they are employed by an affiliate of the Manager of the Fund. Robert F. Gunia will be considered an Interested Trustee for at least two years after his retirement from employment by the Manager and its affiliates (which was on or about October 21, 2009). He will also be an Interested Trustee as long as he holds a beneficial interest in securities issued by the Manager or its affiliates.
Unless otherwise noted, the address of all Trustees and Officers is c/o Prudential Investments LLC, Gateway Center Three, 100 Mulberry Street, Newark, New Jersey 07102.
There is no set term of office for Trustees or Officers. The Independent Trustees have adopted a retirement policy, which calls for the retirement of Trustees on December 31 of the year in which they reach the age of 78, provided that the Board may extend the retirement age on a year-by-year basis for a Trustee.
“Other Directorships Held” includes only directorships of companies required to register or file reports with the SEC under the Securities Exchange Act of 1934 (that is, “public companies”) or other investment companies registered under the 1940 Act.
“No. of Portfolios Overseen” includes all investment companies managed by Prudential Investments LLC (PI) and/or AST Investment Services, Inc. (ASTI) (collectively, the Manager) that are overseen by the Trustee. The investment companies for which PI and/or ASTI serves as Manager include The Prudential Variable Contract Accounts, The Prudential Series Fund, Advanced Series Trust and Prudential’s Gibraltar Fund, Inc.
E3
Variable contracts contain exclusions, limitations, reductions of benefits, and terms for keeping them in force. For costs and complete details, refer to your contract or contact your licensed financial professional. Contract guarantees are based on the claims-paying ability of the issuing company.
Prudential’s Financial Security Program is issued by The Prudential Insurance Company of America, 751 Broad Street, Newark, NJ 07102-3777. Prudential’s Gibraltar Fund, Inc. is distributed by Prudential Investment Management Services LLC (PIMS), Three Gateway Center, 14th Floor, Newark, NJ 07102-4077, member SIPC. Both are Prudential Financial companies. Each is solely responsible for its own financial condition and contractual obligations.
| | | | |

The Prudential Insurance Company of America 751 Broad Street Newark, NJ 07102-3777 | | | | Presorted Standard U.S. Postage PAID Prudential |
| | | | |
| | | | |
| | | | |
The Audited Financial Statements of The Prudential Insurance Company of America are available upon request. You may call 888-778-2888 to obtain a free copy of the Audited Financial Statements.
For service-related questions, please contact the Annuity Service Center at 888-778-2888.
Prudential Investments, Prudential, the Prudential logo and the Rock symbol are service marks of Prudential Financial, Inc. and its related entities, registered in many jurisdictions worldwide.
To learn more about Prudential Financial, go to www.prudential.com, or scan the code below.

0172334-00003-00 FSP-AR
Item 2 – Code of Ethics — See Exhibit (a)
As of the end of the period covered by this report, the registrant has adopted a code of ethics (the ��Section 406 Standards for Investment Companies – Ethical Standards for Principal Executive and Financial Officers”) that applies to the registrant’s Principal Executive Officer and Principal Financial Officer; the registrant’s Principal Financial Officer also serves as the Principal Accounting Officer.
The registrant hereby undertakes to provide any person, without charge, upon request, a copy of the code of ethics. To request a copy of the code of ethics, contact the registrant 973-367-7521, and ask for a copy of the Section 406 Standards for Investment Companies—Ethical Standards for Principal Executive and Financial Officers.
Item 3 – Audit Committee Financial Expert –
The registrant’s Board has determined that Mr. Thomas M. O’Brien, member of the Board’s Audit Committee is an “audit committee financial expert,” and that he is “independent,” for purposes of this Item.
Item 4 – Principal Accountant Fees and Services –
(a) Audit Fees
For the fiscal years ended December 31, 2011 and December 31, 2010, KPMG LLP (“KPMG”), the Registrant’s principal accountant, billed the Registrant $19,000 and $18,500, respectively, for professional services rendered for the audit of the Registrant’s annual financial statements or services that are normally provided in connection with statutory and regulatory filings.
(b) Audit-Related Fees
None.
(c) Tax Fees
None.
(d) All Other Fees
None.
(e) (1) Audit Committee Pre-Approval Policies and Procedures
THE PRUDENTIAL MUTUAL FUNDS
AUDIT COMMITTEE POLICY
on
Pre-Approval of Services Provided by the Independent Accountants
The Audit Committee of each Prudential Mutual Fund is charged with the responsibility to monitor the independence of the Fund’s independent accountants. As part of this responsibility, the Audit Committee must pre-approve any independent accounting firm’s engagement to render audit and/or permissible non-audit services, as required by law. In evaluating a proposed engagement of the independent accountants, the Audit Committee will assess the effect that the engagement might reasonably be expected to have on the accountant’s independence. The Committee’s evaluation will be based on:
| | • | | a review of the nature of the professional services expected to be provided, |
| | • | | a review of the safeguards put into place by the accounting firm to safeguard independence, and |
| | • | | periodic meetings with the accounting firm. |
Policy for Audit and Non-Audit Services Provided to the Funds
On an annual basis, the scope of audits for each Fund, audit fees and expenses, and audit-related and non-audit services (and fees proposed in respect thereof) proposed to be performed by the Fund’s independent accountants will be presented by the Treasurer and the independent accountants to the Audit Committee for review and, as appropriate, approval prior to the initiation of such services. Such presentation shall be accompanied by confirmation by both the Treasurer and the independent accountants that the proposed services will not adversely affect the independence of the independent accountants. Proposed services shall be described in sufficient detail to enable the Audit Committee to assess the appropriateness of such services and fees, and the compatibility of the provision of such services with the auditor’s independence. The Committee shall receive periodic reports on the progress of the audit and other services which are approved by the Committee or by the Committee Chair pursuant to authority delegated in this Policy.
The categories of services enumerated under “Audit Services”, “Audit-related Services”, and “Tax Services” are intended to provide guidance to the Treasurer and the independent accountants as to those categories of services which the Committee believes are generally consistent with the independence of the independent accountants and which the Committee (or the Committee Chair) would expect upon the presentation of specific proposals to pre-approve. The enumerated categories are not intended as an exclusive list of audit, audit-related or tax services, which the Committee (or the Committee Chair) would consider for pre-approval.
Audit Services
The following categories of audit services are considered to be consistent with the role of the Fund’s independent accountants:
| | • | | Annual Fund financial statement audits |
| | • | | Seed audits (related to new product filings, as required) |
| | • | | SEC and regulatory filings and consents |
Audit-related Services
The following categories of audit-related services are considered to be consistent with the role of the Fund’s independent accountants:
| | • | | Accounting consultations |
| | • | | Fund merger support services |
| | • | | Agreed Upon Procedure Reports |
| | • | | Other Internal Control Reports |
Individual audit-related services that fall within one of these categories and are not presented to the Audit Committee as part of the annual pre-approval process will be subject to pre-approval by the Committee Chair (or any other Committee member on whom this responsibility has been delegated) so long as the estimated fee for those services does not exceed $50,000.
Tax Services
The following categories of tax services are considered to be consistent with the role of the Fund’s independent accountants:
| | • | | Tax compliance services related to the filing or amendment of the following: |
| | • | | Federal, state and local income tax compliance; and, |
| | • | | Sales and use tax compliance |
| | • | | Timely RIC qualification reviews |
| | • | | Tax distribution analysis and planning |
| | • | | Tax authority examination services |
| | • | | Tax appeals support services |
| | • | | Accounting methods studies |
| | • | | Fund merger support services |
| | • | | Tax consulting services and related projects |
Individual tax services that fall within one of these categories and are not presented to the Audit Committee as part of the annual pre-approval process will be subject to pre-approval by the Committee Chair (or any other Committee member on whom this responsibility has been delegated) so long as the estimated fee for those services does not exceed $50,000.
Other Non-audit Services
Certain non-audit services that the independent accountants are legally permitted to render will be subject to pre-approval by the Committee or by one or more Committee members to whom the Committee has delegated this authority and who will report to the full Committee any pre-approval decisions made pursuant to this Policy. Non-audit services presented for pre-approval pursuant to this paragraph will be accompanied by a confirmation from both the Treasurer and the independent accountants that the proposed services will not adversely affect the independence of the independent accountants.
Proscribed Services
The Fund’s independent accountants will not render services in the following categories of non-audit services:
| | • | | Bookkeeping or other services related to the accounting records or financial statements of the Fund |
| | • | | Financial information systems design and implementation |
| | • | | Appraisal or valuation services, fairness opinions, or contribution-in-kind reports |
| | • | | Internal audit outsourcing services |
| | • | | Management functions or human resources |
| | • | | Broker or dealer, investment adviser, or investment banking services |
| | • | | Legal services and expert services unrelated to the audit |
| | • | | Any other service that the Public Company Accounting Oversight Board determines, by regulation, is impermissible. |
Pre-approval of Non-Audit Services Provided to Other Entities Within the Prudential Fund Complex
Certain non-audit services provided to Prudential Investments LLC or any of its affiliates that also provide ongoing services to the Prudential Mutual Funds will be subject to pre-approval by the Audit Committee. The only non-audit services provided to these entities that will require pre-approval are those related directly to the operations and financial reporting of the Funds. Individual projects that are not presented to the Audit Committee as part of the annual pre-approval process will be subject to pre-approval by the Committee Chair (or any other Committee member on whom this responsibility has been delegated) so long as the estimated fee for those services does not exceed $50,000. Services presented for pre-approval pursuant to this paragraph will be accompanied by a confirmation from both the Treasurer and the independent accountants that the proposed services will not adversely affect the independence of the independent accountants.
Although the Audit Committee will not pre-approve all services provided to Prudential Investments LLC and its affiliates, the Committee will receive an annual report from the Fund’s independent accounting firm showing the aggregate fees for all services provided to Prudential Investments and its affiliates.
| (e) | (2) Percentage of services referred to in 4(b) – 4(d) that were approved by the audit committee – |
Not applicable.
(f) Percentage of hours expended attributable to work performed by other than full time employees of principal accountant if greater than 50%.
The percentage of hours expended on the principal accountant’s engagement to audit the registrant’s financial statements for the most recent fiscal year that were attributed to work performed by persons other than the principal accountant’s full-time, permanent employees was 0%.
(g) Non-Audit Fees
Not applicable to Registrant for the fiscal years 2011 and 2010. The aggregate non-audit fees billed by KPMG for services rendered to the registrant’s investment adviser and any entity controlling, controlled by, or under common control with the investment adviser that provides ongoing services to the registrant for the fiscal years 2011 and 2010 was $0 and $0, respectively.
(h) Principal Accountant’s Independence
Not applicable as KPMG has not provided non-audit services to the registrant’s investment adviser and any entity controlling, controlled by, or under common control with the investment adviser that provides ongoing services to the registrant that were not pre-approved pursuant to Rule 2-01(c)(7)(ii) of Regulation S-X.
Item 5 – Audit Committee of Listed Registrants – Not applicable.
Item 6 – Schedule of Investments – The schedule is included as part of the report to shareholders filed under Item 1 of this Form.
Item 7 – Disclosure of Proxy Voting Policies and Procedures for Closed-End Management Investment Companies – Not applicable.
Item 8 – Portfolio Managers of Closed-End Management Investment Companies – Not applicable.
Item 9 – Purchases of Equity Securities by Closed-End Management Investment Company and Affiliated Purchasers – Not
applicable.
Item 10 – Submission of Matters to a Vote of Security Holders – Not applicable.
Item 11 – Controls and Procedures
| | (a) | It is the conclusion of the registrant’s principal executive officer and principal financial officer that the effectiveness of the registrant’s current disclosure controls and procedures (such disclosure controls and procedures having been evaluated within 90 days of the date of this filing) provide reasonable assurance that the information required to be disclosed by the registrant has been recorded, processed, summarized and reported within the time period specified in the Commission’s rules and forms and that the information required to be disclosed by the registrant has been accumulated and communicated to the registrant’s principal executive officer and principal financial officer in order to allow timely decisions regarding required disclosure. |
| | (b) | There has been no significant change in the registrant’s internal control over financial reporting that occurred during the registrant’s most recent fiscal quarter of the period covered by this report that has materially affected, or is likely to materially affect, the registrant’s internal control over financial reporting. |
Item 12 – Exhibits
| | (a) | (1) Code of Ethics – Attached hereto as Exhibit EX-99.CODE-ETH |
(2) Certifications pursuant to Section 302 of the Sarbanes-Oxley Act – Attached hereto as Exhibit EX-99.CERT.
(3) Any written solicitation to purchase securities under Rule 23c-1. – Not applicable.
| | (b) | Certifications pursuant to Section 906 of the Sarbanes-Oxley Act – Attached hereto as Exhibit EX-99.906CERT. |
SIGNATURES
Pursuant to the requirements of the Securities Exchange Act of 1934 and the Investment Company Act of 1940, the registrant has duly caused this report to be signed on its behalf by the undersigned, thereunto duly authorized.
| | |
| Registrant: | | Prudential’s Gibraltar Fund, Inc. |
| |
| By: | | /s/ Deborah A. Docs |
| | Deborah A. Docs |
| | Secretary |
| |
| Date: | | February 15, 2012 |
Pursuant to the requirements of the Securities Exchange Act of 1934 and the Investment Company Act of 1940, this report has been signed below by the following persons on behalf of the registrant and in the capacities and on the dates indicated.
| | |
| By: | | /s/ Stephen Pelletier |
| | Stephen Pelletier |
| | President and Principal Executive Officer |
| |
| Date: | | February 15, 2012 |
| |
| By: | | /s/ Grace C. Torres |
| | Grace C. Torres |
| | Treasurer and Principal Financial Officer |
| |
| Date: | | February 15, 2012 |