UNITED STATES
SECURITIES AND EXCHANGE COMMISSION
Washington, D.C. 20549
FORM N-CSR
CERTIFIED SHAREHOLDER REPORT OF REGISTERED
MANAGEMENT INVESTMENT COMPANIES
| | |
| Investment Company Act file number: | | 811-01660 |
| |
| Exact name of registrant as specified in charter: | | Prudential’s Gibraltar Fund, Inc. |
| |
| Address of principal executive offices: | | Gateway Center 3, 100 Mulberry Street, Newark, New Jersey 07102 |
| |
| Name and address of agent for service: | | Deborah A. Docs Gateway Center 3, 100 Mulberry Street, Newark, New Jersey 07102 |
| |
| Registrant’s telephone number, including area code: | | 973-367-7521 |
| |
| Date of fiscal year end: | | 12/31/2013 |
| |
| Date of reporting period: | | 12/31/2013 |
Item 1 – Reports to Stockholders

PRUDENTIAL’S GIBRALTAR FUND, INC.
ANNUAL REPORT Ÿ DECEMBER 31, 2013
This report provides financial information about Prudential’s Gibraltar Fund, Inc. (the Fund), an investment option under your variable contract.
The views expressed in this report and information about the Fund’s portfolio holdings are for the period covered by this report and are subject to change thereafter.

This report is authorized for distribution to prospective investors only when preceded or accompanied by a current prospectus and current performance results. Investors should carefully consider the contract and the Fund’s investment objective, risks, and charges and expenses before investing. The contract and the Fund prospectus contain information relating to investment objectives, risks, and charges and expenses, as well as other important information. Read them carefully before investing or sending money.
A description of the Fund’s proxy voting policies and procedures is available, without charge, upon request. Planholders should call (888)778-2888, to obtain descriptions of the Fund’s proxy voting policies and procedures. Information regarding how the Fund voted proxies relating to portfolio securities during the most recent 12-month period ended June 30 is available on the website of the Securities and Exchange Commission (the Commission) at www.sec.gov and on the Fund’s website at www.prudential.com/variableinsuranceportfolios.
The Fund files with the Commission a complete listing of portfolio holdings as of its first and third quarter-end on Form N-Q. Form N-Q is available on the Commission’s website at www.sec.gov or by visiting the Commission’s Public Reference Room. For more information on the Commission’s Public Reference Room, please visit the Commission’s website or call (800)SEC-0330. Form N-Q is also available on the Fund’s website or by calling the telephone numbers referenced above, for variable annuity and variable life insurance contract owners.
The Fund’s Statement of Additional Information contains additional information about the Fund’s Directors and is available without charge upon request by calling (888)778-2888.
| | | | |
Prudential’s Gibraltar Fund, Inc. Table of Contents | | Annual Report | | December 31, 2013 |
| n | | PRESENTATION OF PORTFOLIO HOLDINGS |
| n | | FEES AND EXPENSES TABLE |
| | | | |
| |
| Section A | | Schedule of Investments and Financial Statements |
| Section B | | Notes to Financial Statements |
| Section C | | Financial Highlights |
| Section D | | Report of Independent Registered Public Accounting Firm |
| Section E | | Information about Directors and Officers |
| | | | |
Prudential’s Gibraltar Fund, Inc. Letter to Planholders | | Annual Report | | December 31, 2013 |
At Prudential, our primary objective is to help investors achieve and maintain long-term financial success. This Prudential’s Gibraltar Fund annual report outlines our efforts to achieve this goal. We hope you find it informative and useful.
Prudential has been building on a heritage of success for more than 135 years. The quality of our businesses and risk diversification has enabled us to manage effectively through volatile markets over time. We believe the array of our products provides a highly attractive value proposition to clients like you who are focused on financial security.
Your financial professional is the best resource to help you make the most informed investment decisions. Together, you can build a diversified investment portfolio that aligns with your long-term financial goals. Please keep in mind that diversification and asset allocation strategies do not assure a profit or protect against loss in declining markets.
Thank you for selecting Prudential as one of your financial partners. We value your trust and appreciate the opportunity to help you achieve financial security.
Sincerely,

Robert F. O’Donnell
President,
Prudential’s Gibraltar Fund, Inc.
January 31, 2014
| | |
| Prudential’s Gibraltar Fund, Inc. | | December 31, 2013 |
Investment Manager’s Report - As of December 31, 2013
| | | | | | | | | | | | |
Average Annual Total
Returns | | 1-Year | | | 5-Year | | | 10-Year | |
Fund | | | 32.15 | % | | | 19.25 | % | | | 8.62 | % |
S&P 500 Index | | | 32.37 | | | | 17.93 | | | | 7.40 | |
Past performance is no guarantee of future returns. The investment return and principal value of an investment will fluctuate, so that an investor’s shares, when redeemed, may be worth more or less than their original cost. Current performance may be lower or higher than the past performance data quoted.
Fund performance is net of investment fees and fund expenses, but not product charges, which, if included, would significantly lower the performance quoted.
$10,000 INVESTED OVER 10 YEARS
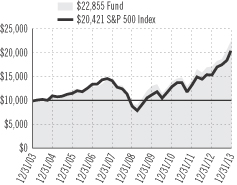
For the 12-month period ended December 31, 2013, Prudential’s Gibraltar Fund returned 32.15%.
The investment objective of the Fund is growth of capital to the extent compatible with a concern for preservation of principal. The Fund is subadvised by Jennison Associates LLC (Jennison).
Consumer discretionary positions were strong contributors to Fund return as both an overweight and stock selection were beneficial. Amazon.com accelerated its business investment to drive robust longer-term growth not only in its core retail business but through the proliferation of digital commerce via the mobile market. Substantial revenue growth reflected its efforts. Nike reported impressive earnings, revenue, gross margins, and future orders, reinforcing Jennison’s conviction in the momentum of the Nike brand around the world and across product categories.
Healthcare holdings, in particular biopharmaceutical companies, were strong contributors to return. The Food and Drug Administration (FDA) approved Gilead Sciences’ Sovaldi for the treatment of hepatitis C. Many patients infected with the liver virus now will be treated with pills only, obviating injections of interferon, which often has debilitating side effects. Sovaldi could also shorten treatment duration, and trial data indicate that it is significantly more effective than current regimens. Gilead’s oncology pipeline also looks promising.
Vertex Pharmaceuticals rose on encouraging data from clinical trials of a combination therapy for cystic fibrosis (CF). In January 2012, the FDA approved Kalydeco as a treatment for the 4.0% of CF patients with a specific mutation in the CF transmembrane conductance regulator (CFTR) gene. Although Kalydeco works in this subset of CF patients, a combination of other Vertex drugs and Kalydeco could treat more common forms of the disease. The FDA granted the combination therapies a “Breakthrough Therapy Designation,” which shortens considerably the time-frame of trials.
In industrials, Boeing reported strong EPS, revenue, cash flow, and margins. Of particular note, the profitability of the company’s 787 Dreamliner improved, driven by an accelerated production rate.
In information technology, stock selection and an overweight position hurt Fund performance relative to the S&P 500 Index, as declines in Rackspace Hosting and Teradata had the effect of tempering strong advances in Google and MasterCard. Rackspace Hosting’s difficulties were largely related to changes in its sales force structure and concerns that its business is being commoditized. Rackspace provides Web and cloud-hosting services to more than 180,000 enterprise customers. Teradata was hurt by overall economic uncertainties and heightened competitive threats. It designs and implements enterprise data warehousing systems that store and transform information amassed about customers, financials, and operations into data that can be mined to improve sales, profitability, inventory management, and customer responsiveness. Jennison eliminated the Fund’s positions in both Rackspace and Teradata.
Google performed well, reflecting its competitive position, strong advertising revenue, and YouTube income-generating opportunities. MasterCard’s strong revenue and earnings were driven by strong growth in global dollar volume and processed transactions. Jennison expects MasterCard to continue to benefit from the long-term shift from cash to electronic credit/debit transactions.
Prudential Investments LLC (PI), an indirect, wholly owned subsidiary of Prudential Financial, Inc., serves as the investment manager for the Fund.
The S&P 500 Index is an unmanaged, market value-weighted index of 500 stocks generally representative of the broad stock market. These returns do not include the effect of any investment management expenses. These returns would have been lower if they included the effect of these expenses. Investors cannot invest directly in a market index or average. For a complete list of holdings, refer to the Schedule of Investments section of this report.
Jennison Associates LLC is a registered investment adviser and a Prudential Financial Company.
| | |
Prudential’s Gibraltar Fund, Inc. Presentation of Portfolio Holdings — unaudited | | December 31, 2013 |
| | | | |
| Prudential’s Gibraltar Fund, Inc. | |
| Five Largest Holdings | | | (% of Net Assets | ) |
| Google, Inc., (Class A Stock) | | | 5.7% | |
| Amazon.com, Inc. | | | 5.5% | |
| Apple, Inc. | | | 5.2% | |
| MasterCard, Inc., (Class A Stock) | | | 4.3% | |
| United Technologies Corp. | | | 3.6% | |
For a complete listing of holdings, refer to the Schedule of Investments section of this report. Holdings reflect only long-term investments. Holdings/Issues/Industries/Sectors are subject to change.
| | |
Prudential’s Gibraltar Fund, Inc. Fees and Expenses — unaudited | | December 31, 2013 |
As a Planholder investing in the Fund through a variable contract, you incur ongoing costs, including management fees, and other Fund expenses. This example is intended to help you understand your ongoing costs (in dollars) of investing in the Fund and to compare these costs with the ongoing costs of investing in other investment options. This example does not reflect fees and charges under your contract. If contract charges were included, the costs shown below would be higher. Please consult your contract for more information about contract fees and charges.
The example is based on an investment of $1,000 invested at the beginning of the period and held for the entire period July 1, 2013 through December 31, 2013.
Actual Expenses
The first line of the table below provides information about actual account values and actual expenses. You may use this information, together with the amount you invested, to estimate the Fund expenses that you paid over the period. Simply divide your account value by $1,000 (for example, an $8,600 account value divided by $1,000 = 8.6), then multiply the result by the number in the first line under the heading entitled “Expenses Paid During the Six-Month Period” to estimate the Fund expenses you paid on your account during this period. As noted above, the table does not reflect variable contract fees and charges.
Hypothetical Example for Comparison Purposes
The second line of the table below provides information about hypothetical account values and hypothetical expenses based on the Fund’s actual expense ratio and an assumed rate of return of 5% per year before expenses, which is not the Fund’s actual return. The hypothetical account values and expenses may not be used to estimate the actual ending account balance or expenses you paid for the period. You may use this information to compare the ongoing costs of investing in the Fund and other investment options. To do so, compare this 5% hypothetical example with the 5% hypothetical examples that appear in the shareholder reports of the other investment options.
Please note that the expenses shown in the table are meant to highlight your ongoing Fund costs only and do not reflect any contract fees and charges, such as sales charges (loads), insurance charges or administrative charges. Therefore the second line of the table is useful to compare ongoing investment option costs only, and will not help you determine the relative total costs of owning different contracts. In addition, if these contract fees and charges were included, your costs would have been higher.
| | | | | | | | | | | | | | | | | | |
| Prudential’s Gibraltar Fund, Inc. | | Beginning
Account Value
July 1, 2013 | | | Ending
Account Value
December 31, 2013 | | | Annualized Expense
Ratio based on the
Six-Month Period | | | Expenses Paid
During the
Six-Month Period* | |
| Prudential’s Gibraltar Fund, Inc. | | Actual | | $ | 1,000.00 | | | $ | 1,215.40 | | | | 0.62 | % | | $ | 3.46 | |
| | | Hypothetical | | $ | 1,000.00 | | | $ | 1,022.08 | | | | 0.62 | % | | $ | 3.16 | |
* Fund expenses (net of fee waivers or subsidies, if any) are equal to the annualized expense ratio (provided in the table), multiplied by the average account value over the period, multiplied by the 184 days in the six-month period ended December 31, 2013, and divided by the 365 days in the Fund’s fiscal year ended December 31, 2013 (to reflect the six-month period). Expenses presented in the table include the expenses of any underlying portfolios in which the Fund may invest.
| | | | | | |
| | | PRUDENTIAL’S GIBRALTAR FUND, INC. | | |
| |
| SCHEDULE OF INVESTMENTS | | December 31, 2013 |
| | | | | | | | |
| LONG-TERM INVESTMENTS — 93.1% | | | | |
| COMMON STOCKS | | Shares
| | | Value
(Note 1)
| |
Aerospace & Defense — 9.0% | | | | | | | | |
Boeing Co. (The) | | | 38,287 | | | $ | 5,225,793 | |
Precision Castparts Corp. | | | 13,436 | | | | 3,618,315 | |
United Technologies Corp. | | | 50,739 | | | | 5,774,098 | |
| | | | | | |
|
|
|
| | | | | | | | 14,618,206 | |
| | | | | | |
|
|
|
Beverages — 2.0% | | | | | | | | |
Diageo PLC, (United Kingdom), ADR | | | 24,223 | | | | 3,207,610 | |
| | | | | | |
|
|
|
Biotechnology — 9.4% | | | | | | | | |
BioMarin Pharmaceutical, Inc.* | | | 71,138 | | | | 4,998,867 | |
Celgene Corp.* | | | 22,177 | | | | 3,747,026 | |
Gilead Sciences, Inc.* | | | 45,067 | | | | 3,386,785 | |
Vertex Pharmaceuticals, Inc.* | | | 42,230 | | | | 3,137,689 | |
| | | | | | |
|
|
|
| | | | | | | | 15,270,367 | |
| | | | | | |
|
|
|
Capital Markets — 2.6% | | | | | | | | |
Goldman Sachs Group, Inc. (The) | | | 23,794 | | | | 4,217,724 | |
| | | | | | |
|
|
|
Chemicals — 2.4% | | | | | | | | |
Monsanto Co. | | | 33,737 | | | | 3,932,047 | |
| | | | | | |
|
|
|
Computers & Peripherals — 6.4% | | | | | | | | |
Apple, Inc. | | | 15,122 | | | | 8,485,105 | |
EMC Corp. | | | 73,045 | | | | 1,837,082 | |
| | | | | | |
|
|
|
| | | | | | | | 10,322,187 | |
| | | | | | |
|
|
|
Energy Equipment & Services — 1.1% | | | | | | | | |
Schlumberger Ltd. | | | 19,549 | | | | 1,761,560 | |
| | | | | | |
|
|
|
Food & Staples Retailing — 5.6% | | | | | | | | |
Costco Wholesale Corp. | | | 37,911 | | | | 4,511,788 | |
Sprouts Farmers Market, Inc.* | | | 1,485 | | | | 57,069 | |
Whole Foods Market, Inc. | | | 77,754 | | | | 4,496,514 | |
| | | | | | |
|
|
|
| | | | | | | | 9,065,371 | |
| | | | | | |
|
|
|
Food Products — 3.2% | | | | | | | | |
Mondelez International, Inc.
(Class A Stock) | | | 145,051 | | | | 5,120,300 | |
| | | | | | |
|
|
|
Health Care Providers & Services — 4.3% | | | | | | | | |
Express Scripts Holding Co.* | | | 48,764 | | | | 3,425,183 | |
UnitedHealth Group, Inc. | | | 48,269 | | | | 3,634,656 | |
| | | | | | |
|
|
|
| | | | | | | | 7,059,839 | |
| | | | | | |
|
|
|
Internet & Catalog Retail — 5.9% | | | | | | | | |
Amazon.com, Inc.* | | | 22,571 | | | | 9,001,089 | |
TripAdvisor, Inc.* | | | 7,169 | | | | 593,808 | |
| | | | | | |
|
|
|
| | | | | | | | 9,594,897 | |
| | | | | | |
|
|
|
Internet Software & Services — 8.2% | | | | | | | | |
eBay, Inc.* | | | 28,663 | | | | 1,573,312 | |
Facebook, Inc. (Class A Stock)* | | | 34,374 | | | | 1,878,883 | |
Google, Inc. (Class A Stock)* | | | 8,222 | | | | 9,214,478 | |
Twitter, Inc.* | | | 10,650 | | | | 677,873 | |
| | | | | | |
|
|
|
| | | | | | | | 13,344,546 | |
| | | | | | |
|
|
|
IT Services — 6.6% | | | | | | | | |
MasterCard, Inc. (Class A Stock) | | | 8,271 | | | | 6,910,090 | |
Visa, Inc. (Class A Stock) | | | 17,305 | | | | 3,853,477 | |
| | | | | | |
|
|
|
| | | | | | | | 10,763,567 | |
| | | | | | |
|
|
|
| | | | | | | | |
COMMON STOCKS
(continued) | | Shares
| | | Value
(Note 1)
| |
Media — 2.6% | | | | | | | | |
Walt Disney Co. (The) | | | 54,905 | | | $ | 4,194,742 | |
| | | | | | |
|
|
|
Oil, Gas & Consumable Fuels — 3.8% | | | | | | | | |
Anadarko Petroleum Corp. | | | 28,217 | | | | 2,238,172 | |
Concho Resources, Inc.* | | | 36,204 | | | | 3,910,032 | |
| | | | | | |
|
|
|
| | | | | | | | 6,148,204 | |
| | | | | | |
|
|
|
Pharmaceuticals — 5.6% | | | | | | | | |
Merck & Co., Inc. | | | 32,253 | | | | 1,614,263 | |
Novo Nordisk A/S (Denmark), ADR | | | 21,046 | | | | 3,888,459 | |
Perrigo Co. PLC | | | 23,143 | | | | 3,551,525 | |
| | | | | | |
|
|
|
| | | | | | | | 9,054,247 | |
| | | | | | |
|
|
|
Road & Rail — 2.4% | | | | | | | | |
Canadian Pacific Railway Ltd. (Canada) | | | 26,116 | | | | 3,951,873 | |
| | | | | | |
|
|
|
Semiconductors & Semiconductor Equipment — 2.7% | |
ARM Holdings PLC
(United Kingdom), ADR | | | 34,856 | | | | 1,908,017 | |
Maxim Integrated Products, Inc. | | | 90,485 | | | | 2,525,436 | |
| | | | | | |
|
|
|
| | | | | | | | 4,433,453 | |
| | | | | | |
|
|
|
Software — 2.7% | | | | | | | | |
Adobe Systems, Inc.* | | | 27,555 | | | | 1,649,993 | |
Red Hat, Inc.* | | | 47,727 | | | | 2,674,621 | |
| | | | | | |
|
|
|
| | | | | | | | 4,324,614 | |
| | | | | | |
|
|
|
Specialty Retail — 2.2% | | | | | | | | |
TJX Cos., Inc. (The) | | | 56,254 | | | | 3,585,067 | |
| | | | | | |
|
|
|
Textiles, Apparel & Luxury Goods — 4.4% | | | | | |
NIKE, Inc. (Class B Stock) | | | 69,857 | | | | 5,493,554 | |
Ralph Lauren Corp. | | | 9,547 | | | | 1,685,716 | |
| | | | | | |
|
|
|
| | | | | | | | 7,179,270 | |
| | | | | | |
|
|
|
TOTAL LONG-TERM INVESTMENTS
(cost $82,092,956) | | | | | | | 151,149,691 | |
| | | | | | |
|
|
|
| SHORT-TERM INVESTMENT — 6.9% | | | | | |
AFFILIATED MONEY MARKET MUTUAL FUND | | | | | |
Prudential Investment Portfolios 2 — Prudential Core Taxable Money Market Fund (cost $11,185,448;
Note 3)(a) | | | 11,185,448 | | | | 11,185,448 | |
| | | | | | |
|
|
|
TOTAL INVESTMENTS — 100.0%
(cost $93,278,404; Note 5) | | | | | | | 162,335,139 | |
OTHER ASSETS IN EXCESS OF LIABILITIES | | | | | | | 50,422 | |
| | | | | | |
|
|
|
NET ASSETS — 100.0% | | | | | | $ | 162,385,561 | |
| | | | | | |
|
|
|
The following abbreviation is used in the portfolio descriptions:
| | |
| ADR | | American Depositary Receipt |
| * | | Non-income producing security. |
| (a) | | Prudential Investments LLC, the manager of the Fund, also serves as manager of the Prudential Investment Portfolios 2 — Prudential Core Taxable Money Market Fund. |
SEE NOTES TO FINANCIAL STATEMENTS.
A1
| | | | | | |
| | | PRUDENTIAL’S GIBRALTAR FUND, INC. (continued) | | |
| |
| SCHEDULE OF INVESTMENTS | | December 31, 2013 |
Various inputs are used in determining the value of the Fund’s investments. These inputs are summarized in the three broad levels listed below.
| Level 1— | quoted prices generally in active markets for identical securities. |
| Level 2— | other significant observable inputs including, but not limited to, quoted prices for similar securities, interest rates and yield curves, prepayment speeds, foreign currency exchange rates, and amortized cost. |
| Level 3— | significant unobservable inputs for securities valued in accordance with Board approved fair valuation procedures. |
The following is a summary of the inputs used as of December 31, 2013 in valuing such portfolio securities:
| | | | | | | | | | | | |
| | | Level 1
| | | Level 2
| | | Level 3
| |
Investments in Securities | | | | | | | | | | | | |
Common Stocks | | $ | 151,149,691 | | | $ | — | | | $ | — | |
Affiliated Money Market
Mutual Fund | | | 11,185,448 | | | | — | | | | — | |
| | |
|
|
| |
|
|
| |
|
|
|
Total | | $ | 162,335,139 | | | $ | — | | | $ | — | |
| | |
|
|
| |
|
|
| |
|
|
|
The industry classification of investments and other assets in excess of liabilities shown as a percentage of net assets as of December 31, 2013 was as follows:
| | | | |
Biotechnology | | | 9.4 | % |
Aerospace & Defense | | | 9.0 | |
Internet Software & Services | | | 8.2 | |
Affiliated Money Market Mutual Fund | | | 6.9 | |
IT Services | | | 6.6 | |
Computers & Peripherals | | | 6.4 | |
Internet & Catalog Retail | | | 5.9 | |
Food & Staples Retailing | | | 5.6 | |
Pharmaceuticals | | | 5.6 | |
Textiles, Apparel & Luxury Goods | | | 4.4 | |
Health Care Providers & Services | | | 4.3 | |
Oil, Gas & Consumable Fuels | | | 3.8 | |
Food Products | | | 3.2 | |
Semiconductors & Semiconductor Equipment | | | 2.7 | |
Software | | | 2.7 | |
Capital Markets | | | 2.6 | |
Media | | | 2.6 | |
Road & Rail | | | 2.4 | |
Chemicals | | | 2.4 | |
Specialty Retail | | | 2.2 | |
Beverages | | | 2.0 | |
Energy Equipment & Services | | | 1.1 | |
| | |
|
|
|
| | | | 100.0 | |
Other assets in excess of liabilities | | | — | * |
| | |
|
|
|
| | | | 100.0 | % |
| | |
|
|
|
SEE NOTES TO FINANCIAL STATEMENTS.
A2
| | | | | | |
| | | PRUDENTIAL’S GIBRALTAR FUND, INC. (continued) | | |
STATEMENT OF ASSETS AND LIABILITIES
as of December 31, 2013
| | | | |
| ASSETS | | | | |
Unaffiliated investments (cost $82,092,956) | | $ | 151,149,691 | |
Affiliated investments (cost $11,185,448) | | | 11,185,448 | |
Cash | | | 16,995 | |
Dividends receivable | | | 117,319 | |
Tax reclaim receivable | | | 34,486 | |
Prepaid expenses | | | 1,338 | |
| | |
|
|
|
Total Assets | | | 162,505,277 | |
| | |
|
|
|
| LIABILITIES | | | | |
Management fee payable | | | 74,096 | |
Accrued expenses and other liabilities | | | 36,762 | |
Payable for investments purchased | | | 8,858 | |
| | |
|
|
|
Total Liabilities | | | 119,716 | |
| | |
|
|
|
| NET ASSETS | | $ | 162,385,561 | |
| | |
|
|
|
Net assets were comprised of: | | | | |
Common stock, at $0.01 par value | | $ | 103,231 | |
Paid-in capital in excess of par | | | 91,085,796 | |
| | |
|
|
|
| | | | 91,189,027 | |
Undistributed net investment income | | | 69,032 | |
Accumulated net realized gain on investment transactions | | | 2,070,767 | |
Net unrealized appreciation on investments | | | 69,056,735 | |
| | |
|
|
|
Net assets, December 31, 2013 | | $ | 162,385,561 | |
| | |
|
|
|
Net asset value and redemption price per share, 10,323,084 outstanding shares of common stock (authorized 75,000,000 shares) | | $ | 15.73 | |
| | |
|
|
|
STATEMENT OF OPERATIONS
Year Ended December 31, 2013
| | | | |
| INCOME | | | | |
Unaffiliated dividend income (net of $5,888 foreign withholding tax) | | $ | 1,409,719 | |
Affiliated dividend income | | | 7,001 | |
| | |
|
|
|
| | | | 1,416,720 | |
| | |
|
|
|
| EXPENSES | | | | |
Management fee | | | 808,155 | |
Custodian’s fees | | | 50,000 | |
Audit fee | | | 20,000 | |
Directors’ fees | | | 12,000 | |
Legal fees and expenses | | | 11,000 | |
Insurance expenses | | | 2,000 | |
Miscellaneous | | | 10,720 | |
| | |
|
|
|
Total expenses | | | 913,875 | |
| | |
|
|
|
| NET INVESTMENT INCOME | | | 502,845 | |
| | |
|
|
|
| NET REALIZED AND UNREALIZED GAIN ON INVESTMENTS | | | | |
Net realized gain on investment transactions | | | 15,709,221 | |
Net change in unrealized appreciation (depreciation) on investments | | | 24,949,924 | |
| | |
|
|
|
| NET GAIN ON INVESTMENTS | | | 40,659,145 | |
| | |
|
|
|
| NET INCREASE IN NET ASSETS RESULTING FROM OPERATIONS | | $ | 41,161,990 | |
| | |
|
|
|
STATEMENT OF CHANGES IN NET ASSETS
| | | | | | | | |
| | | Year Ended December 31,
| |
| | | 2013
| | | 2012
| |
| INCREASE (DECREASE) IN NET ASSETS | | | | | | | | |
| OPERATIONS: | | | | | | | | |
Net investment income | | $ | 502,845 | | | $ | 846,814 | |
Net realized gain on investment transactions | | | 15,709,221 | | | | 15,163,660 | |
Net change in unrealized appreciation (depreciation) on investments | | | 24,949,924 | | | | 9,438,000 | |
| | |
|
|
| |
|
|
|
NET INCREASE IN NET ASSETS RESULTING FROM OPERATIONS | | | 41,161,990 | | | | 25,448,474 | |
| | |
|
|
| |
|
|
|
| DIVIDENDS AND DISTRIBUTIONS: | | | | | | | | |
Dividends from net investment income | | | (517,181 | ) | | | (833,785 | ) |
Distributions from net realized gains | | | (2,616,501 | ) | | | — | |
| | |
|
|
| |
|
|
|
| | | | (3,133,682 | ) | | | (833,785 | ) |
| | |
|
|
| |
|
|
|
| CAPITAL STOCK TRANSACTIONS: | | | | | | | | |
Capital stock issued in reinvestment of dividends [210,310 and 70,374 shares, respectively] | | | 3,133,682 | | | | 833,785 | |
Capital stock repurchased [1,067,557 and 1,646,923 shares, respectively] | | | (14,579,699 | ) | | | (19,239,178 | ) |
| | |
|
|
| |
|
|
|
NET DECREASE IN NET ASSETS RESUTING FROM CAPITAL STOCK TRANSACTIONS | | | (11,446,017 | ) | | | (18,405,393 | ) |
| | |
|
|
| |
|
|
|
| TOTAL INCREASE IN NET ASSETS | | | 26,582,291 | | | | 6,209,296 | |
| NET ASSETS: | | | | | | | | |
Beginning of year | | | 135,803,270 | | | | 129,593,974 | |
| | |
|
|
| |
|
|
|
End of year(a) | | $ | 162,385,561 | | | $ | 135,803,270 | |
| | |
|
|
| |
|
|
|
(a) Includes undistributed net investment income of: | | $ | 69,032 | | | $ | 83,368 | |
| | |
|
|
| |
|
|
|
SEE NOTES TO FINANCIAL STATEMENTS.
A3
NOTES TO THE FINANCIAL STATEMENTS OF
PRUDENTIAL’S GIBRALTAR FUND, INC.
Prudential’s Gibraltar Fund, Inc. (the “Fund”) was originally incorporated in the State of Delaware on March 14, 1968 and was reincorporated in the State of Maryland effective May 1, 1997. It is registered as an open-end, diversified management investment company under the Investment Company Act of 1940, as amended (“1940 Act”). The investment objective of the Fund is growth of capital to the extent compatible with a concern for preservation of principal. The Fund was organized by The Prudential Insurance Company of America (“PICA”) to serve as the investment medium for the variable contract accounts of The Prudential Financial Security Program (“FSP”). The Fund does not sell its shares to the public. The accounts will redeem shares of the Fund to the extent necessary to provide benefits under the contracts or for such other purposes as may be consistent with the contracts.
| Note 1: | | Accounting Policies |
The following accounting policies conform to U.S. generally accepted accounting principles. The Fund consistently follows such policies in the preparation of its financial statements.
Security Valuation: The Fund holds securities and other assets that are fair valued at the close of each day the New York Stock Exchange (“NYSE”) is open for trading. Fair value is the price that would be received to sell an asset or paid to transfer a liability in an orderly transaction between market participants on the measurement date. The Board of Directors (the “Board”) has adopted Valuation Procedures for security valuation under which fair valuation responsibilities have been delegated to Prudential Investments LLC (“PI” or “Manager”). Under the current Valuation Procedures, the established Valuation Committee is responsible for supervising the valuation of portfolio securities and other assets. The Valuation Procedures permit the Fund to utilize independent pricing vendor services, quotations from market makers, and alternative valuation methods when market quotations are either not readily available or not representative of fair value. A record of the Valuation Committee’s actions is subject to the Board’s review, approval, and ratification at its next regularly-scheduled quarterly meeting.
Various inputs determine how the Fund’s investments are valued, all of which are categorized according to the three broad levels (Level 1, 2, or 3) detailed in the table following the Schedule of Investments.
Common stocks, exchange-traded funds, and derivative instruments that are traded on a national securities exchange are valued at the last sale price as of the close of trading on the applicable exchange. Securities traded via NASDAQ are valued at the NASDAQ official closing price. To the extent these securities are valued at the last sale price or NASDAQ official closing price; they are classified as Level 1 in the fair value hierarchy.
In the event that no sale or official closing price on valuation date exists, these securities are generally valued at the mean between the last reported bid and asked prices, or at the last bid price in the absence of an asked price. These securities are classified as Level 2 in the fair value hierarchy, as the inputs are observable and considered to be significant to the valuation.
Common stocks traded on foreign securities exchanges are valued using pricing vendor services that provide model prices derived using adjustment factors based on information such as local closing price, relevant general and sector indices, currency fluctuations, depositary receipts, and futures, as applicable. Securities valued using such model prices are classified as Level 2 in the fair value hierarchy, as the adjustment factors are observable and considered to be significant to the valuation.
Investments in open-end, non-exchange-traded mutual funds are valued at their net asset values as of the close of the NYSE on the date of valuation. These securities are classified as Level 1 in the fair value hierarchy since they may be purchased or sold at their net asset values on the date of valuation.
Fixed income securities traded in the over-the-counter market are generally valued at prices provided by approved independent pricing vendors. The pricing vendors provide these prices after evaluating observable inputs including, but not limited to yield curves, yield spreads, credit ratings, deal terms, tranche level attributes, default rates, cash flows, prepayment speeds, broker/dealer quotations, and reported trades. Securities valued using such vendor prices are classified as Level 2 in the fair value hierarchy.
B1
Over-the-counter derivative instruments are generally valued using pricing vendor services, which derive the valuation based on inputs such as underlying asset prices, indices, spreads, interest rates, and exchange rates. These instruments are categorized as Level 2 in the fair value hierarchy.
Securities and other assets that cannot be priced according to the methods described above are valued based on pricing methodologies approved by the Board of Directors. In the event that significant unobservable inputs are used when determining such valuations, the securities will be classified as Level 3 in the fair value hierarchy.
When determining the fair value of securities, some of the factors influencing the valuation include: the nature of any restrictions on disposition of the securities; assessment of the general liquidity of the securities; the issuer’s financial condition and the markets in which it does business; the cost of the investment; the size of the holding and the capitalization of the issuer; the prices of any recent transactions or bids/offers for such securities or any comparable securities; any available analyst media or other reports or information deemed reliable by the investment adviser regarding the issuer or the markets or industry in which it operates. Using fair value to price securities may result in a value that is different from a security’s most recent closing price and from the price used by other mutual funds to calculate their net asset values.
Securities Transactions and Net Investment Income: Securities transactions are recorded on the trade date. Realized gains or losses from investment transactions are calculated on the identified cost basis. Dividend income is recorded on the ex-dividend date. Interest income, including amortization of premium and accretion of discount on debt securities, as required, is recorded on an accrual basis. Expenses are recorded on the accrual basis, which may require the use of certain estimates by management, that may differ from actual amounts.
Dividends and Distributions: The Fund expects to pay dividends of net investment income semi-annually and distributions of net realized capital gains, if any, at least annually. Dividends and distributions to shareholders, which are determined in accordance with federal income tax regulations and which may differ from generally accepted accounting principles, are recorded on the ex-dividend date. Permanent book/tax differences relating to income and gains are reclassified amongst undistributed net investment income, accumulated net realized gain or loss and paid-in-capital in excess of par, as appropriate.
Taxes: It is the Fund’s policy to continue to meet the requirements of the Internal Revenue Code applicable to regulated investment companies and to distribute all of its taxable net income and capital gains, if any, to its shareholders. Therefore, no federal income tax provision is required. Withholding taxes on foreign dividends are recorded net of reclaimable amounts, at the time the related income is earned.
Estimates: The preparation of the financial statements requires management to make estimates and assumptions that affect the reported amounts and disclosures in the financial statements. Actual results could differ from these estimates.
The Fund has a management agreement with PI. Pursuant to this agreement, PI has responsibility for all investment advisory services and supervises the subadvisor’s performance of such services. PI has entered into a subadvisory agreement with Jennison Associates LLC (“Jennison”). The subadvisory agreement provides that Jennison will furnish investment advisory services in connection with the management of the Fund. PI pays for the services of Jennison, compensation of officers of the Fund, costs related to shareholder reporting, occupancy and certain clerical and administrative expenses of the Fund. The Fund bears all other costs and expenses.
The management fee paid to PI is computed daily and payable monthly, at an annual rate of 0.55% of the Fund’s average daily net assets.
The Fund has a distribution agreement with Prudential Investment Management Services LLC (“PIMS”) which acts as distributor of the shares of the Fund. No distribution or service fees are paid to PIMS as distributor of shares of the Fund.
PI, PICA, PIMS and Jennison are indirect, wholly-owned subsidiaries of Prudential Financial, Inc. (“Prudential”).
B2
The Fund has entered into a brokerage commission recapture agreement with certain registered broker-dealers. Under the brokerage commission recapture program, a portion of the commission is returned to the Fund on whose behalf the trades were made. Commission recapture is paid solely to those funds generating the applicable trades. Such amounts are included within realized gain or loss on investment transactions presented in the Statement of Operations. For the year ended December 31, 2013, brokerage commission recaptured under these agreements was $7,277.
| Note 3: | | Other Transactions with Affiliates |
The Fund invests in the Prudential Core Taxable Money Market Fund (the “Core Fund”), a portfolio of the Prudential Investment Portfolios 2, registered under the 1940 Act and managed by PI. Earnings from the Core Fund are disclosed on the Statement of Operations as affiliated dividend income.
| Note 4: | | Portfolio Securities |
Purchases and sales of portfolio securities, other than short-term investments, for the year ended December 31, 2013, were $41,336,758 and $63,900,993, respectively.
Distributions to shareholders, which are determined in accordance with federal income tax regulations and which may differ from generally accepted accounting principles, are recorded on the ex-dividend date.
For the year ended December 31, 2013, the tax character of dividends paid by the Fund were $517,181 of ordinary income and $2,616,501 of long-term capital gains. For the year ended December 31, 2012, the tax character of dividends paid by the Fund was $833,785 of ordinary income.
As of December 31, 2013, the accumulated undistributed earnings on a tax basis was $69,036 of ordinary income and $2,346,115 of undistributed long-term capital gains. These amounts may differ from the amounts on the Statement of Assets and Liabilities primarily due to cumulative timing differences between financial and tax reporting.
The United States federal income tax basis of the Fund’s investments and the net unrealized appreciation as of December 31, 2013 were as follows:
| | | | | | | | | | | | |
Tax Basis
| | Appreciation
| | | Depreciation
| | | Net Unrealized
Appreciation
| |
| $93,553,752 | | $ | 68,940,778 | | | $ | (159,391 | ) | | $ | 68,781,387 | |
The difference between book basis and tax basis is attributable to deferred losses on wash sales.
The Fund utilized approximately $10,705,000 if its capital loss carryforward to offset net taxable gains realized in the year ended December 31, 2013.
Management has analyzed the Fund’s tax positions taken on federal income tax returns for all open tax years and has concluded that no provision for income tax is required in the Fund’s financial statements for the current reporting period. The Fund’s federal and state income and federal excise tax returns for tax years for which the applicable statutes of limitations have not expired are subject to examination by the Internal Revenue Service and state departments of revenue.
The Fund, along with other affiliated registered investment companies (the “Funds”), is a party to a Syndicated Credit Agreement (“SCA”) with a group of banks. The purpose of the SCA is to provide an alternative source of temporary funding for capital share redemptions. The SCA provides for a commitment of $900 million for the period November 5, 2013 through November 4, 2014. The Funds pay an annualized commitment fee of 0.08% on the unused portion of the SCA. Prior to November 5, 2013, the Funds had another Syndicated Credit Agreement with substantially similar terms. Interest on any borrowings under the SCA is paid at contracted market rates. The commitment fee for the unused amount is accrued daily and paid quarterly.
The Fund did not utilize the SCA during the year ended December 31, 2013.
B3
Financial Highlights
| | | | | | | | | | | | | | | | | | | | |
| | | Year Ended December 31,
| |
| | | 2013
| | | 2012
| | | 2011
| | | 2010
| | | 2009
| |
Per Share Operating Performance: | | | | | | | | | | | | | | | | | | | | |
Net Asset Value, beginning of year | | $ | 12.15 | | | $ | 10.16 | | | $ | 10.04 | | | $ | 9.47 | | | $ | 6.79 | |
| | |
|
|
| |
|
|
| |
|
|
| |
|
|
| |
|
|
|
Income From Investment Operations: | | | | | | | | | | | | | | | | | | | | |
Net investment income | | | 0.05 | | | | 0.08 | | | | 0.04 | | | | 0.04 | | | | 0.04 | |
Net realized and unrealized gain on investments | | | 3.84 | | | | 1.98 | | | | 0.12 | | | | 0.57 | | | | 2.68 | |
| | |
|
|
| |
|
|
| |
|
|
| |
|
|
| |
|
|
|
Total from investment operations | | | 3.89 | | | | 2.06 | | | | 0.16 | | | | 0.61 | | | | 2.72 | |
| | |
|
|
| |
|
|
| |
|
|
| |
|
|
| |
|
|
|
Less Dividends and Distributions: | | | | | | | | | | | | | | | | | | | | |
Dividends from net investment income | | | (0.05 | ) | | | (0.07 | ) | | | (0.04 | ) | | | (0.04 | ) | | | (0.04 | ) |
Distributions from net realized gains | | | (0.26 | ) | | | — | | | | — | | | | — | | | | — | |
| | |
|
|
| |
|
|
| |
|
|
| |
|
|
| |
|
|
|
| | | | (0.31 | ) | | | (0.07 | ) | | | (0.04 | ) | | | (0.04 | ) | | | (0.04 | ) |
| | |
|
|
| |
|
|
| |
|
|
| |
|
|
| |
|
|
|
Net Asset Value, end of year | | $ | 15.73 | | | $ | 12.15 | | | $ | 10.16 | | | $ | 10.04 | | | $ | 9.47 | |
| | |
|
|
| |
|
|
| |
|
|
| |
|
|
| |
|
|
|
Total Return(a): | | | 32.15 | % | | | 20.33 | % | | | 1.57 | % | | | 6.54 | % | | | 40.15 | % |
Ratios/Supplemental Data: | | | | | | | | | | | | | | | | | | | | |
Net assets, end of year (in millions) | | $ | 162.4 | | | $ | 135.8 | | | $ | 129.6 | | | $ | 145.3 | | | $ | 157.6 | |
Ratios to average net assets(b): | | | | | | | | | | | | | | | | | | | | |
Expenses | | | 0.62 | % | | | 0.63 | % | | | 0.62 | % | | | 0.62 | % | | | 0.61 | % |
Net investment income | | | 0.34 | % | | | 0.62 | % | | | 0.37 | % | | | 0.45 | % | | | 0.54 | % |
Portfolio turnover rate | | | 29 | % | | | 32 | % | | | 28 | % | | | 61 | % | | | 56 | % |
| (a) | Total return is calculated assuming a purchase of a share on the first day and a sale on the last day of each year reported and includes reinvestment of dividends and distributions. Past performance is no guarantee of future results. Total returns may reflect adjustments to conform to generally accepted accounting principles. |
| (b) | Does not include expenses of the underlying portfolio in which the Fund invests. |
SEE NOTES TO FINANCIAL STATEMENTS.
C1
REPORT OF INDEPENDENT REGISTERED PUBLIC ACCOUNTING FIRM
THE BOARD OF DIRECTORS AND SHAREHOLDERS
PRUDENTIAL’S GIBRALTAR FUND, INC.:
We have audited the accompanying statement of assets and liabilities of Prudential’s Gibraltar Fund, Inc. (hereafter referred to as the “Fund”), including the schedule of investments, as of December 31, 2013, and the related statement of operations for the year then ended, the statements of changes in net assets for each of the years in the two-year period then ended, and the financial highlights for each of the years in the five-year period then ended. These financial statements and financial highlights are the responsibility of the Fund’s management. Our responsibility is to express an opinion on these financial statements and financial highlights based on our audits.
We conducted our audits in accordance with the standards of the Public Company Accounting Oversight Board (United States). Those standards require that we plan and perform the audit to obtain reasonable assurance about whether the financial statements and financial highlights are free of material misstatement. An audit includes examining, on a test basis, evidence supporting the amounts and disclosures in the financial statements. Our procedures included confirmation of securities owned as of December 31, 2013, by correspondence with the custodian, transfer agent and brokers or by other appropriate auditing procedures where replies from brokers were not received. An audit also includes assessing the accounting principles used and significant estimates made by management, as well as evaluating the overall financial statement presentation. We believe that our audits provide a reasonable basis for our opinion.
In our opinion, the financial statements and financial highlights referred to above present fairly, in all material respects, the financial position of the Fund as of December 31, 2013, the results of its operations, the changes in its net assets and the financial highlights for the periods described in the first paragraph above, in conformity with U.S. generally accepted accounting principles.

New York, New York
February 14, 2014
D1
Federal Income Tax Information (Unaudited)
We are advising you that during the year ended December 31, 2013, the Fund reports the maximum amount allowed per share but not less than $0.26 as a capital gain distribution in accordance with Section 852 (b)(3)(C) of the Internal Revenue Code.
For the year ended December 31, 2013, the Fund reports, in accordance with Section 854 of the Internal Revenue Code, the following percentages of the ordinary income distributions paid as 1) qualified dividend income (QDI); and 2) eligible for corporate dividends received deduction (DRD):
| | | | | | | | |
| | | QDI
| | | DRD
| |
Prudential’s Gibraltar Fund, Inc. | | | 100 | % | | | 100 | % |
D2
INFORMATION ABOUT DIRECTORS AND OFFICERS (Unaudited)
Information about the Directors and the Officers of the Fund is set forth below. Directors who are not deemed to be “interested persons” of the Fund, as defined in the Investment Company Act of 1940, are referred to as “Independent Directors.” Directors who are deemed to be “interested persons” of the Fund are referred to as “Interested Directors.” The Directors are responsible for the overall supervision of the operations of the Fund and perform the various duties imposed on the directors of investment companies by the Investment Company Act of 1940.
| | | | |
| Independent Directors(1) | | | | |
Name, Address, Age No. of Portfolios Overseen | | Principal Occupation(s) During Past Five Years | | Other Directorships Held |
Susan Davenport Austin (46) No. of Portfolios Overseen: 98 | | Vice Chairman (since 2013), Senior Vice President and Chief Financial Officer (2007-2012) and Vice President of Strategic Planning and Treasurer (2002-2007) of Sheridan Broadcasting Corporation; President of Sheridan Gospel Network (Since 2004); Vice President, Goldman, Sachs & Co. (2000-2001); Associate Director, Bear, Stearns & Co. Inc. (1997-2000); Vice President, Salomon Brothers Inc. (1993-1997); President of the Board, The MacDowell Colony (Since 2010); Chairman of the Board of Directors, Broadcast Music, Inc. (Since 2007); Member of the Board of Directors, Hubbard Radio, LLC (Since 2011); formerly Member of the Board of Directors, National Association of Broadcasters (2004-2010). | | None. |
Sherry S. Barrat (64) No. of Portfolios Overseen: 98 | | Formerly, Vice Chairman of Northern Trust Corporation (financial services and banking institution) (2011-June 2012); formerly, President, Personal Financial Services, Northern Trust Corporation (2006-2010); formerly, Chairman & CEO, Western US Region, Northern Trust Corporation (1999-2005); formerly, President & CEO, Palm Beach/Martin County Region, Northern Trust. | | Director of NextEra Energy, Inc. (formerly, FPL Group, Inc.) (1998-Present); Director of Arthur J. Gallagher & Company (since July 2013). |
Kay Ryan Booth (63) No. of Portfolios Overseen: 98 | | Managing Director of Cappello Waterfield & Co. LLC (since 2011); formerly, Vice Chair, Global Research, J.P. Morgan (financial services and investment banking institution) (June 2008 – January 2009); formerly, Global Director of Equity Research, Bear Stearns & Co., Inc. (financial services and investment banking institution) (1995-2008); formerly, Associate Director of Equity Research, Bear Stearns & Co., Inc. (1987-1995). | | None. |
Delayne Dedrick Gold (75) No. of Portfolios Overseen: 98 | | Marketing Consultant (1982-present); formerly Senior Vice President and Member of the Board of Directors, Prudential Bache Securities, Inc. | | None. |
Robert F. Gunia (67) No. of Portfolios Overseen: 98 | | Independent Consultant (since October 2009); formerly Chief Administrative Officer (September 1999-September 2009) and Executive Vice President (December 1996-September 2009) of Prudential Investments LLC; formerly Executive Vice President (March 1999-September 2009) and Treasurer (May 2000-September 2009) of Prudential Mutual Fund Services LLC; formerly President (April 1999-December 2008) and Executive Vice President and Chief Operating Officer (December 2008-December 2009) of Prudential Investment Management Services LLC; formerly Chief Administrative Officer, Executive Vice President and Director (May 2003-September 2009) of AST Investment Services, Inc. | | Director (since May 1989) of The Asia Pacific Fund, Inc. |
W. Scott McDonald, Jr., Ph.D. (76) No. of Portfolios Overseen: 98 | | Formerly Management Consultant (1997-2004) and of Counsel (2004-2005) at Kaludis Consulting Group, Inc. (company serving higher education); formerly principal (1995-1997), Scott McDonald Associates; Chief Operating Officer (1991-1995), Fairleigh Dickinson University; Executive Vice President and Chief Operating Officer (1975-1991), Drew University; interim President (1988-1990), Drew University; formerly Director of School, College and University Underwriters Ltd. | | None. |
Thomas T. Mooney (72) No. of Portfolios Overseen: 98 | | Formerly Chief Executive Officer, Excell Partners, Inc. (2005-2007); founding partner of High Technology of Rochester and the Lennox Technology Center; formerly President of the Greater Rochester Metro Chamber of Commerce (1976-2004) formerly Rochester City Manager (1973); formerly Deputy Monroe County Executive (1974-1976). | | None. |
E1
| | | | |
| Independent Directors(1) | | | | |
Name, Address, Age No. of Portfolios Overseen | | Principal Occupation(s) During Past Five Years | | Other Directorships Held |
Thomas M. O’Brien (63) No. of Portfolios Overseen: 98 | | Director, The BankUnited (NYSE: BKU) (since May 2012); Consultant, Valley National Bancorp, Inc. and Valley National Bank (since January 2012); Formerly President and COO (November 2006-December 2011) and CEO (April 2007-December 2011) of State Bancorp, Inc. and State Bank; formerly Vice Chairman (January 1997-April 2000) of North Fork Bank; formerly President and Chief Executive Officer (December 1984-December 1996) of North Side Savings Bank; formerly President and Chief Executive Officer (May 2000-June 2006) Atlantic Bank of New York. | | Formerly Director (April 2008-January 2012) of Federal Home Loan Bank of New York; formerly Director (December 1996-May 2000) of North Fork Bancorporation, Inc.; formerly Director (May 2000-April 2006) of Atlantic Bank of New York; Director (November 2006-January 2012) of State Bancorp, Inc. (NASDAQ: STBC) and State Bank of Long Island. |
| Interested Directors(1) | | | | |
Robert F. O’Donnell (45) No. of Portfolios Overseen: 98 | | President of Prudential Annuities (since April 2012); Senior Vice President, Head of Product, Investment Management & Marketing for Prudential Annuities (October 2008-April 2012); Senior Vice President, Head of Product (July 2004-October 2008). | | None. |
Timothy S. Cronin (48) Number of Portfolios Overseen: 98 | | Chief Investment Officer and Strategist of Prudential Annuities (since January 2004); Director of Investment & Research Strategy (since February 1998); President of AST Investment Services, Inc. (since June 2005). | | None. |
Bruce W. Ferris (58) Number of Portfolios Overseen: 98 | | Senior Vice President, Sales and Distribution, Product, Marketing, Prudential Annuities (since May 2006); Vice President-Sales, The Hartford Insurance Company (October 1994-April 2005); Sales Manager, Aetna Investment Services (October 1993-September 1994). | | None. |
(1) The year that each Director joined the Fund’s Board is as follows: Susan Davenport Austin, 2011; Sherry S. Barrat, 2013; Kay Ryan Booth, 2013; Delayne Dedrick Gold, 2003; Robert F. Gunia, 2003; W. Scott McDonald, Jr. 1985; Thomas T. Mooney, 2003; Thomas M. O’Brien, 2003; Robert F. O’Donnell, 2012; Timothy S. Cronin, 2009; Bruce W. Ferris, 2013.
| | |
| Fund Officers(a)(1) | | |
Name, Address and Age Position with the Fund | | Principal Occupation(s) During the Past Five Years |
Raymond A. O’Hara (58) Chief Legal Officer | | Vice President and Corporate Counsel (since July 2010) of Prudential Insurance Company of America (Prudential); Vice President (March 2011-Present) of Pruco Life Insurance Company and Pruco Life Insurance Company of New Jersey; Vice President and Corporate Counsel (March 2011-Present) of Prudential Annuities Life Assurance Corporation; Chief Legal Officer of Prudential Investments LLC (since June 2012); Chief Legal Officer of Prudential Mutual Fund Services LLC (since June 2012) and Corporate Counsel of AST Investment Services, Inc. (since June 2012); formerly Assistant Vice President and Corporate Counsel (September 2008-July 2010) of The Hartford Financial Services Group, Inc.; formerly Associate (September 1980-December 1987) and Partner (January 1988–August 2008) of Blazzard & Hasenauer, P.C. (formerly, Blazzard, Grodd & Hasenauer, P.C.). |
Deborah A. Docs (56) Secretary | | Vice President and Corporate Counsel (since January 2001) of Prudential; Vice President (since December 1996) and Assistant Secretary (since March 1999) of Prudential Investments LLC; formerly Vice President and Assistant Secretary (May 2003-June 2005) of AST Investment Services, Inc. |
Kathleen DeNicholas (39) Assistant Secretary | | Vice President and Corporate Counsel (since May 2013) of Prudential; Managing Counsel at The Bank of New York Mellon Corporation (2011-2013); formerly Senior Counsel (2007-2011) and Assistant General Counsel (2001-2007) of The Dreyfus Corporation; Chief Legal Officer and Secretary of MBSC Securities Corporation (2011-2013); Vice President and Assistant Secretary of The Dreyfus Family of Funds (2010-2012). |
Claudia DiGiacomo (39) Assistant Secretary | | Vice President and Corporate Counsel (since January 2005) of Prudential; Vice President and Assistant Secretary of Prudential Investments LLC (since December 2005); Associate at Sidley Austin Brown Wood LLP (1999-2004). |
Jonathan D. Shain (55) Assistant Secretary | | Vice President and Corporate Counsel (since August 1998) of Prudential; Vice President and Assistant Secretary (since May 2001) of Prudential Investments LLC; Vice President and Assistant Secretary (since February 2001) of Prudential Mutual Fund Services LLC; formerly Vice President and Assistant Secretary (May 2003-June 2005) of AST Investment Services, Inc. |
Andrew R. French (51) Assistant Secretary | | Vice President and Corporate Counsel (since February 2010) of Prudential; formerly Director and Corporate Counsel (2006-2010) of Prudential; Vice President and Assistant Secretary (since January 2007) of Prudential Investments LLC; Vice President and Assistant Secretary (since January 2007) of Prudential Mutual Fund Services LLC. |
Amanda S. Ryan (36) Assistant Secretary | | Director and Corporate Counsel (since March 2012) of Prudential; Director and Assistant Secretary (since June 2012) of Prudential Investments LLC; Associate at Ropes & Gray (2008-2012). |
Bruce Karpati (44) Chief Compliance Officer | | Chief Compliance Officer of the Prudential Investments Funds, Target Funds, Advanced Series Trust, the Prudential Series Fund and Prudential’s Gibraltar Fund, Inc. (May 2013-Present); formerly National Chief (May 2012-May 2013) and Co-Chief (January 2010-May 2012) of the Asset Management Unit, Division of Enforcement, of the U.S. Securities & Exchange Commission; Assistant Regional Director (January 2005-January 2010) of the U.S. Securities & Exchange Commission. |
Theresa C. Thompson (51) Deputy Chief Compliance Officer | | Vice President, Compliance, Prudential Investments LLC (since April 2004); and Director, Compliance, Prudential Investments LLC (2001-2004). |
E2
| | |
| Fund Officers(a)(1) | | |
Name, Address and Age Position with the Fund | | Principal Occupation(s) During the Past Five Years |
Richard W. Kinville (45) Anti-Money Laundering Compliance Officer | | Vice President, Corporate Compliance, Anti-Money Laundering Unit (since January 2005) of Prudential; committee member of the American Council of Life Insurers Anti-Money Laundering and Critical Infrastructure Committee (since January 2007); formerly Investigator and Supervisor in the Special Investigations Unit for the New York Central Mutual Fire Insurance Company (August 1994-January 1999); Investigator in AXA Financial’s Internal Audit Department and Manager in AXA’s Anti-Money Laundering Office (January 1999-January 2005); first chair of the American Council of Life Insurers Anti-Money Laundering and Critical Infrastructure Committee (June 2007-December 2009). |
Grace C. Torres (54) Treasurer and Principal Financial and Accounting Officer | | Assistant Treasurer (since March 1999) and Senior Vice President (since September 1999) of Prudential Investments LLC; Assistant Treasurer (since May 2003) and Vice President (since June 2005) of AST Investment Services, Inc.; Senior Vice President and Assistant Treasurer (since May 2003) of Prudential Annuities Advisory Services, Inc.; formerly Senior Vice President (May 2003-June 2005) of AST Investment Services, Inc. |
| Fund Officers(a)(1) | | |
M. Sadiq Peshimam (50) Assistant Treasurer | | Vice President (since 2005) of Prudential Investments LLC. |
Peter Parrella (55) Assistant Treasurer | | Vice President (since 2007) and Director (2004-2007) within Prudential Mutual Fund Administration; formerly Tax Manager at SSB Citi Fund Management LLC (1997-2004). |
Alan Fu (57) Assistant Treasurer | | Vice President and Corporate Counsel – Tax, Prudential Financial, Inc. (since October 2003). |
(a) Excludes Mr. O’Donnell and Mr. Cronin, Interested Directors who also serve as President and Vice President, respectively.
(1) The year in which each individual became an Officer of the Fund is as follows: Raymond A. O’Hara, 2012; Deborah A. Docs, 2005; Kathleen DeNicholas, 2013; Claudia DiGiacomo, 2005; Jonathan D. Shain, 2005; Andrew R. French, 2006; Amanda S. Ryan, 2012; Bruce Karpati, 2013; Theresa C. Thompson, 2008; Richard W. Kinville, 2011; Grace C. Torres, 1997; Peter Parrella, 2007; M. Sadiq Peshimam, 2006; Alan Fu, 2006.
Explanatory Notes to Tables:
Directors are deemed to be “Interested”, as defined in the Investment Company Act of 1940, by reason of their affiliation with Prudential Investments LLC and/or an affiliate of Prudential Investments LLC. Robert F. O’Donnell, Timothy S. Cronin and Bruce W. Ferris are Interested Directors because they are employed by an affiliate of the Manager of the Fund.
Unless otherwise noted, the address of all Directors and Officers is c/o Prudential Investments LLC, Gateway Center Three, 100 Mulberry Street, Newark, New Jersey 07102.
There is no set term of office for Directors or Officers. The Independent Directors have adopted a retirement policy, which calls for the retirement of Directors on December 31 of the year in which they reach the age of 78, provided that the Board may extend the retirement age on a year-by-year basis for a Director.
“Other Directorships Held” includes only directorships of companies required to register or file reports with the SEC under the Securities Exchange Act of 1934 (that is, “public companies”) or other investment companies registered under the Investment Company Act of 1940.
“No. of Portfolios Overseen” includes all investment companies managed by Prudential Investments LLC (PI) and/or AST Investment Services, Inc. (ASTI) (collectively, the Manager) that are overseen by the Director. The investment companies for which PI and/or ASTI serves as Manager include The Prudential Variable Contract Accounts, The Prudential Series Fund, Advanced Series Trust, Prudential’s Gibraltar Fund, Inc., Prudential Short Duration High Yield Fund, Inc. and Prudential Global Short Duration High Yield Fund, Inc.
E3
Variable contracts contain exclusions, limitations, reductions of benefits, and terms for keeping them in force. For costs and complete details, refer to your contract or contact your licensed financial professional. Contract guarantees are based on the claims-paying ability of the issuing company.
Prudential’s Gibraltar Fund, Inc. is distributed by Prudential Investment Management Services LLC (PIMS), Three Gateway Center, 14th Floor, Newark, NJ 07102-4077, member SIPC, a Prudential Financial company and solely responsible for its own financial condition and contractual obligations.
| | | | |
The Prudential Insurance Company of America 751 Broad Street Newark, NJ 07102-3777 | | | | |
| | | | |
| | | | |
| | | | |
The Audited Financial Statements of The Prudential Insurance Company of America are available upon request. You may call 888-778-2888 to obtain a free copy of the Audited Financial Statements.
For service-related questions, please contact the Annuity Service Center at 888-778-2888.
Prudential Investments, Prudential, the Prudential logo, the Rock symbol, and Bring Your Challenges are service marks of Prudential Financial, Inc. and its related entities, registered in many jurisdictions worldwide.
0239274-00002-00 FSP-AR
Item 2 – Code of Ethics — See Exhibit (a)
As of the end of the period covered by this report, the registrant has adopted a code of ethics (the “Section 406 Standards for Investment Companies – Ethical Standards for Principal Executive and Financial Officers”) that applies to the registrant’s Principal Executive Officer and Principal Financial Officer; the registrant’s Principal Financial Officer also serves as the Principal Accounting Officer.
The registrant hereby undertakes to provide any person, without charge, upon request, a copy of the code of ethics. To request a copy of the code of ethics, contact the registrant 973-367-7521, and ask for a copy of the Section 406 Standards for Investment Companies – Ethical Standards for Principal Executive and Financial Officers.
Item 3 – Audit Committee Financial Expert –
The registrant’s Board has determined that Mr. Thomas M. O’Brien, member of the Board’s Audit Committee is an “audit committee financial expert,” and that he is “independent,” for purposes of this Item.
Item 4 – Principal Accountant Fees and Services –
(a) Audit Fees
For the fiscal years ended December 31, 2013 and December 31, 2012, KPMG LLP (“KPMG”), the Registrant’s principal accountant, billed the Registrant $20,000 and $19,500, respectively, for professional services rendered for the audit of the Registrant’s annual financial statements or services that are normally provided in connection with statutory and regulatory filings.
(b) Audit-Related Fees
None.
(c) Tax Fees
None.
(d) All Other Fees
None.
(e) (1) Audit Committee Pre-Approval Policies and Procedures
THE PRUDENTIAL MUTUAL FUNDS
AUDIT COMMITTEE POLICY
on
Pre-Approval of Services Provided by the Independent Accountants
The Audit Committee of each Prudential Mutual Fund is charged with the responsibility to monitor the independence of the Fund’s independent accountants. As part of this responsibility, the Audit Committee must pre-approve any independent accounting firm’s engagement to render audit and/or permissible non-audit services, as required by law. In evaluating a proposed engagement of the independent accountants, the Audit Committee will assess the effect that the engagement might reasonably be expected to have on the accountant’s independence. The Committee’s evaluation will be based on:
| | • | | a review of the nature of the professional services expected to be provided, |
| | • | | a review of the safeguards put into place by the accounting firm to safeguard independence, and |
| | • | | periodic meetings with the accounting firm. |
Policy for Audit and Non-Audit Services Provided to the Funds
On an annual basis, the scope of audits for each Fund, audit fees and expenses, and audit-related and non-audit services (and fees proposed in respect thereof) proposed to be performed by the Fund’s independent accountants will be presented by the Treasurer and the independent accountants to the Audit Committee for review and, as appropriate, approval prior to the initiation of such services. Such presentation shall be accompanied by confirmation by both the Treasurer and the independent accountants that the proposed services will not adversely affect the independence of the independent accountants. Proposed services shall be described in sufficient detail to enable the Audit Committee to assess the appropriateness of such services and fees, and the compatibility of the provision of such services with the auditor’s independence. The Committee shall receive periodic reports on the progress of the audit and other services which are approved by the Committee or by the Committee Chair pursuant to authority delegated in this Policy.
The categories of services enumerated under “Audit Services”, “Audit-related Services”, and “Tax Services” are intended to provide guidance to the Treasurer and the independent accountants as to those categories of services which the Committee believes are generally consistent with the independence of the independent accountants and which the Committee (or the Committee Chair) would expect upon the presentation of specific proposals to pre-approve. The enumerated categories are not intended as an exclusive list of audit, audit-related or tax services, which the Committee (or the Committee Chair) would consider for pre-approval.
Audit Services
The following categories of audit services are considered to be consistent with the role of the Fund’s independent accountants:
| | • | | Annual Fund financial statement audits |
| | • | | Seed audits (related to new product filings, as required) |
| | • | | SEC and regulatory filings and consents |
Audit-related Services
The following categories of audit-related services are considered to be consistent with the role of the Fund’s independent accountants:
| | • | | Accounting consultations |
| | • | | Fund merger support services |
| | • | | Agreed Upon Procedure Reports |
| | • | | Other Internal Control Reports |
Individual audit-related services that fall within one of these categories and are not presented to the Audit Committee as part of the annual pre-approval process will be subject to pre-approval by the Committee Chair (or any other Committee member on whom this responsibility has been delegated) so long as the estimated fee for those services does not exceed $50,000.
Tax Services
The following categories of tax services are considered to be consistent with the role of the Fund’s independent accountants:
| | • | | Tax compliance services related to the filing or amendment of the following: |
| | • | | Federal, state and local income tax compliance; and, |
| | • | | Sales and use tax compliance |
| | • | | Timely RIC qualification reviews |
| | • | | Tax distribution analysis and planning |
| | • | | Tax authority examination services |
| | • | | Tax appeals support services |
| | • | | Accounting methods studies |
| | • | | Fund merger support services |
| | • | | Tax consulting services and related projects |
Individual tax services that fall within one of these categories and are not presented to the Audit Committee as part of the annual pre-approval process will be subject to pre-approval by the Committee Chair (or any other Committee member on whom this responsibility has been delegated) so long as the estimated fee for those services does not exceed $50,000.
Other Non-audit Services
Certain non-audit services that the independent accountants are legally permitted to render will be subject to pre-approval by the Committee or by one or more Committee members to whom the Committee has delegated this authority and who will report to the full Committee any pre-approval decisions made pursuant to this Policy. Non-audit services presented for pre-approval pursuant to this paragraph will be accompanied by a confirmation from both the Treasurer and the independent accountants that the proposed services will not adversely affect the independence of the independent accountants.
Proscribed Services
The Fund’s independent accountants will not render services in the following categories of non-audit services:
| | • | | Bookkeeping or other services related to the accounting records or financial statements of the Fund |
| | • | | Financial information systems design and implementation |
| | • | | Appraisal or valuation services, fairness opinions, or contribution-in-kind reports |
| | • | | Internal audit outsourcing services |
| | • | | Management functions or human resources |
| | • | | Broker or dealer, investment adviser, or investment banking services |
| | • | | Legal services and expert services unrelated to the audit |
| | • | | Any other service that the Public Company Accounting Oversight Board determines, by regulation, is impermissible. |
Pre-approval of Non-Audit Services Provided to Other Entities Within the Prudential Fund Complex
Certain non-audit services provided to Prudential Investments LLC or any of its affiliates that also provide ongoing services to the Prudential Mutual Funds will be subject to pre-approval by the Audit Committee. The only non-audit services provided to these entities that will require pre-approval are those related directly to the operations and financial reporting of the Funds. Individual projects that are not presented to the Audit Committee as part of the annual pre-approval process will be subject to pre-approval by the Committee Chair (or any other Committee member on whom this responsibility has been delegated) so long as the estimated fee for those services does not exceed $50,000. Services presented for pre-approval pursuant to this paragraph will be accompanied by a confirmation from both the Treasurer and the independent accountants that the proposed services will not adversely affect the independence of the independent accountants.
Although the Audit Committee will not pre-approve all services provided to Prudential Investments LLC and its affiliates, the Committee will receive an annual report from the Fund’s independent accounting firm showing the aggregate fees for all services provided to Prudential Investments and its affiliates.
(e) (2) Percentage of services referred to in 4(b) – 4(d) that were approved by the audit committee –
Not applicable.
(f) Percentage of hours expended attributable to work performed by other than full time employees of principal accountant if greater than 50%.
The percentage of hours expended on the principal accountant’s engagement to audit the registrant’s financial statements for the most recent fiscal year that were attributed to work performed by persons other than the principal accountant’s full-time, permanent employees was 0%.
(g) Non-Audit Fees
Not applicable to Registrant for the fiscal years 2013 and 2012. The aggregate non-audit fees billed by KPMG for services rendered to the registrant’s investment adviser and any entity controlling, controlled by, or under common control with the investment adviser that provides ongoing services to the registrant for the fiscal years 2013 and 2012 was $0 and $0, respectively.
(h) Principal Accountant’s Independence
Not applicable as KPMG has not provided non-audit services to the registrant’s investment adviser and any entity controlling, controlled by, or under common control with the investment adviser that provides ongoing services to the registrant that were not pre-approved pursuant to Rule 2-01(c)(7)(ii) of Regulation S-X.
| | |
| Item 5 – Audit Committee of Listed Registrants – Not applicable. |
|
| Item 6 – Schedule of Investments – The schedule is included as part of the report to shareholders filed under Item 1 of this Form. |
|
| Item 7 – Disclosure of Proxy Voting Policies and Procedures for Closed-End Management Investment Companies – Not applicable. |
|
| Item 8 – Portfolio Managers of Closed-End Management Investment Companies – Not applicable. |
|
| Item 9 – Purchases of Equity Securities by Closed-End Management Investment Company and Affiliated Purchasers – Not applicable. |
|
| Item 10 – Submission of Matters to a Vote of Security Holders – Not applicable. |
|
| Item 11 – Controls and Procedures |
| | (a) | It is the conclusion of the registrant’s principal executive officer and principal financial officer that the effectiveness of the registrant’s current disclosure controls and procedures (such disclosure controls and procedures having been evaluated within 90 days of the date of this filing) provide reasonable assurance that the information required to be disclosed by the registrant has been recorded, processed, summarized and reported within the time period specified in the Commission’s rules and forms and that the information required to be disclosed by the registrant has been accumulated and communicated to the registrant’s principal executive officer and principal financial officer in order to allow timely decisions regarding required disclosure. |
| | (b) | There has been no significant change in the registrant’s internal control over financial reporting that occurred during the registrant’s most recent fiscal quarter of the period covered by this report that has materially affected, or is likely to materially affect, the registrant’s internal control over financial reporting. |
Item 12 – Exhibits
| | (a) | (1) Code of Ethics – Attached hereto as Exhibit EX-99.CODE-ETH |
| | (2) | Certifications pursuant to Section 302 of the Sarbanes-Oxley Act – Attached hereto as Exhibit EX-99.CERT. |
| | (3) | Any written solicitation to purchase securities under Rule 23c-1. – Not applicable. |
| | (b) | Certifications pursuant to Section 906 of the Sarbanes-Oxley Act – Attached hereto as Exhibit EX-99.906CERT. |
SIGNATURES
Pursuant to the requirements of the Securities Exchange Act of 1934 and the Investment Company Act of 1940, the registrant has duly caused this report to be signed on its behalf by the undersigned, thereunto duly authorized.
| | | | |
| Registrant: | | Prudential’s Gibraltar Fund, Inc. | | |
| | |
| By: | | /s/ Deborah A. Docs | | |
| | Deborah A. Docs | | |
| | Secretary | | |
| | |
| Date: | | February 27, 2014 | | |
Pursuant to the requirements of the Securities Exchange Act of 1934 and the Investment Company Act of 1940, this report has been signed below by the following persons on behalf of the registrant and in the capacities and on the dates indicated.
| | | | |
| By: | | /s/ Timothy S. Cronin | | |
| | Timothy S. Cronin | | |
| | Acting Principal Executive Officer | | |
| | |
| Date: | | February 27, 2014 | | |
| | |
| By: | | /s/ Grace C. Torres | | |
| | Grace C. Torres | | |
| | Treasurer and Principal Financial Officer | | |
| | |
| Date: | | February 27, 2014 | | |