UNITED STATES
SECURITIES AND EXCHANGE COMMISSION
Washington, D.C. 20549
FORM N-CSR
CERTIFIED SHAREHOLDER REPORT OF REGISTERED MANAGEMENT
INVESTMENT COMPANIES
| | |
Investment Company Act file number: | | 811-01660 |
| |
Exact name of registrant as specified in charter: | | Prudential’s Gibraltar Fund, Inc. |
| |
Address of principal executive offices: | | 655 Broad Street, 17th Floor Newark, New Jersey 07102 |
| |
Name and address of agent for service: | | Deborah A. Docs |
| | 655 Broad Street, 17th Floor |
| | Newark, New Jersey 07102 |
| |
Registrant’s telephone number, including area code: | | 973-367-7521 |
| |
Date of fiscal year end: | | 12/31/2016 |
| |
Date of reporting period: | | 12/31/2016 |
Item 1 – Reports to Stockholders –
Prudential’s Gibraltar Fund, Inc.
| | |
| ANNUAL REPORT | | December 31, 2016 |

This report provides financial information about Prudential’s Gibraltar Fund, Inc. (the Fund), an investment option under your variable contract.
The views expressed in this report and information about the Fund’s portfolio holdings are for the period covered by this report and are subject to change thereafter.

This report is authorized for distribution to prospective investors only when preceded or accompanied by a current prospectus and current performance results. Investors should carefully consider the contract and the Fund’s investment objective, risks, and charges and expenses before investing. The contract and the Fund prospectus contain information relating to investment objectives, risks, and charges and expenses, as well as other important information. Read them carefully before investing or sending money.
A description of the Fund’s proxy voting policies and procedures is available, without charge, upon request. Planholders should call (888)778-2888, to obtain descriptions of the Fund’s proxy voting policies and procedures. Information regarding how the Fund voted proxies relating to portfolio securities during the most recent 12-month period ended June 30 is available on the website of the Securities and Exchange Commission (the Commission) at www.sec.gov.
The Fund files with the Commission a complete listing of portfolio holdings as of its first and third quarter-end on Form N-Q. Form N-Q is available on the Commission’s website at www.sec.gov or by visiting the Commission’s Public Reference Room. For more information on the Commission’s Public Reference Room, please visit the Commission’s website or call (800)SEC-0330.
The Fund’s Statement of Additional Information contains additional information about the Fund’s Directors and is available without charge upon request by calling (888)778-2888.
| | | | |
Prudential’s Gibraltar Fund, Inc. Table of Contents | | Annual Report | | December 31, 2016 |
| ∎ | | REPORT OF THE INVESTMENT MANAGER |
| ∎ | | PRESENTATION OF PORTFOLIO HOLDINGS |
| | | | |
| Section A | | Schedule of Investments and Financial Statements |
| Section B | | Notes to Financial Statements |
| Section C | | Financial Highlights |
| Section D | | Report of Independent Registered Public Accounting Firm |
| Section E | | Information about Directors and Officers |
| | | | |
Prudential’s Gibraltar Fund, Inc. Letter to Planholders | | Annual Report | | December 31, 2016 |
At Prudential, our primary objective is to help investors achieve and maintain long-term financial success. This Prudential’s Gibraltar Fund annual report outlines our efforts to achieve this goal. We hope you find it informative and useful.
Prudential has been building on a heritage of success for more than 135 years. We believe the array of our products provides a highly attractive value proposition to clients like you who are focused on financial security.
Your financial professional is the best resource to help you make the most informed investment decisions. Together, you can build a diversified investment portfolio that aligns with your long-term financial goals. Please keep in mind that diversification and asset allocation strategies do not assure a profit or protect against loss in declining markets.
Thank you for selecting Prudential as one of your financial partners. We value your trust and appreciate the opportunity to help you achieve financial security.
Sincerely,

Timothy S. Cronin
President,
Prudential’s Gibraltar Fund, Inc. | January 31, 2017 |
| | | | |
| Market Overview — unaudited | | Annual Report | | December 31, 2016 |
Equity Market Overview
US Equities lifted by post-election optimism
In a year of surprises, US equities left no surprise regarding investor sentiment. After a powerful fourth quarter of 2016, the S&P 500, including dividends, returned 3.82% for the quarter and 11.94% for the year.
The year began on a down note. US stocks entered into a correction in January, jolted by a steep decline in manufacturing in China, followed by a massive selloff in China’s equity markets, which spilled over to all global markets. Market woes continued roughly through the first half of February, as stocks performed poorly, but then turned upward. In March, a strong rally powered stocks in the S&P 500 to rise by one of the largest gains in any single month in recent history. Continued low interest rates and a stabilization in oil prices helped stocks to rebound.
One of the biggest surprises took place in late June. The UK’s vote to leave the European Union, known as “Brexit,” briefly increased market volatility, although the macroeconomic fallout appeared manageable, if not limited. Volatility was generally kept in check during the third quarter. Also, riskier equities, such as companies in the technology and financial sectors, outperformed.
In the fourth quarter, the presidential election delivered the year’s biggest surprise as Donald Trump was elected the 45th president of the US. Stocks, especially financials, surged on the news, as Trump’s US-focus on a growth-friendly agenda was also seen as a boon for the US financial sector. In December, to no one’s surprise, the Fed raised interest rates by 0.25%.
Sector performance reflects strength in the economy
Sector performance was positive except for health care. Cyclical stocks, which are more sensitive to developments in the economy, outpaced most of their defensive counterparts. Energy led all sectors with a 27.36% gain, as oil prices climbed. The defensive, but dividend-paying, telecommunications sector rose by 23.49%, as the search for yield continues. Financials, were boosted by the election results, shot up 22.80%, with banks and diversified financial companies achieving impressive returns. Industrials churned out an 18.86% gain, led by construction and engineering companies. Materials turned in a strong performance, rising by 16.69%, as metals & mining and construction materials industries surged.
Utilities gained 16.29%, as independent power and renewable energy producers charge forward. Information technology clicked up by 13.85% on strength in the semi-conductor & semi-conductor equipment industry. The media industry and Internet catalogue & retail industries boosted consumer discretionary, which rose by 6.03%. Consumer staples rang up a 5.38% return on gains in the tobacco and food industries. Real estate posted a gain of 3.39%, on concerns over rising interest rates. Health care stumbled to a -2.69% return on weakness in the health care technology and biotechnology industries.
Small-caps show leadership in Russell Indexes
The Russell US Indexes, which measure equity performance with respect to stock-specific styles (value and growth) and capitalization levels (small-, mid-, and large-cap), were all in positive territory. Small-cap stocks, as measured by the Russell 2000® Index, gained 21.31% against their larger counterparts, which also reflected stronger business activity. The Russell Midcap® Index returned 13.80%. In large-cap stocks, the Russell 1000® Value Index gained 17.34% against the 7.08% return of the Russell 1000® Growth Index.
International and emerging markets mixed
The MSCI-EAFE Index, which measures the performance of developed markets excluding the United States and Canada, eked out a positive return of 1.0% net of dividends, for the year.
A lackluster fourth quarter hindered market performance for the year, especially in Europe which was fraught with political uncertainty. Most heavily weighted countries in Europe turned in a moderate performance. Germany returned 2.28%, France rose by 4.88%, and the UK fell by -0.10%. Austria gained 11.26% to lead the region, while Belgium lagged the region, falling to a -15.77% return.
Countries in the Pacific region generally gained. Hong Kong rose by 2.26%. Singapore gained 1.42%. Japan was positive with a 2.37% gain. Australia rose by 11.44% and New Zealand gained 18.37% on low interest rates and strong dividend-paying companies.
The MSCI Emerging Markets Index generally recorded solid gains, rising by 11.19%. The Brazil, Russia, India, and China (BRIC) group rose by 12.12%. Brazil rose by a whopping 66.24%, as a result of its new, pro-growth leadership. Re-energized Russian markets posted a huge 54.82% gain on rising oil prices. India dipped into negative territory with a -1.43% return, and China was slightly positive, returning 0.93%.
| | |
| Prudential’s Gibraltar Fund, Inc. | | December 31, 2016 |
Report of the Investment Manager - As of December 31, 2016 (Unaudited)
| | | | | | | | | | | | |
Average Annual Total
Returns | | 1-Year | | | 5-Year | | | 10-Year | |
Fund | | | 0.39 | % | | | 14.29 | % | | | 7.91 | % |
S&P 500 Index | | | 11.94 | | | | 14.65 | | | | 6.94 | |
Past performance is no guarantee of future returns. The investment return and principal value of an investment will fluctuate, so that an investor’s shares, when redeemed, may be worth more or less than their original cost. Current performance may be lower or higher than the past performance data quoted.
Fund performance is net of investment fees and fund expenses, but not contract charges, which, if included, would significantly lower the performance quoted.
$10,000 INVESTED OVER 10 YEARS
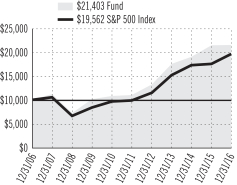
For the year ended December 31, 2016, Prudential’s Gibraltar Fund returned 0.39%.
The net assets of the Fund at December 31, 2016 were $143.4 million.
The investment objective of the Fund is growth of capital to the extent compatible with a concern for preservation of principal. The Fund is subadvised by Jennison Associates LLC.
What were market conditions during the reporting period?
2016 was a year of volatility and surprises. Among the contributing factors were decelerating economic growth in China; concerns that emerging economies might face balance sheet risks; the negative effect of lower energy prices on industrial sectors; fears of slowing US economic growth; uncertainty about future Federal Reserve monetary tightening; Brexit, the UK’s decision to leave the European Union; and the unconventional US presidential election.
In this environment, risk aversion generally affected how investors valued different securities. Low-volatility/high-dividend-paying stocks drove market returns, with dividend-paying and perceived “safety” stocks outperforming and the stocks of higher-growth companies broadly underperforming. After the US election, speculation about the new administration’s potential policy initiatives favored companies — many of them exhibiting little secular growth — that could benefit from less regulation, lower corporate tax rates, and increased infrastructure and defense spending.
What strategies or holdings affected the Fund’s performance?
During the period, risk aversion hurt higher-growth, and therefore higher-valuation, stocks. Health care companies faced an additional headwind — growing concerns about drug pricing. Companies that sell innovative, high-priced drugs sold off, among them Fund holdings Regeneron Pharmaceuticals (eye diseases, high cholesterol), BioMarin Pharmaceutical (neurometabolic degenerative diseases), and Vertex Pharmaceuticals (cystic fibrosis). Novo Nordisk, the world’s leading maker of insulin, faced pressure from increasing competition. At the end of the period, the Fund no longer held Novo Nordisk. Allergan, and other health care companies for which acquired growth plays a large role, declined as regulatory changes threatened to remove many of the tax benefits of mergers between US and offshore companies.
In consumer discretionary, Nike’s decline overshadowed solid advances by Amazon and Marriott. Nike dropped on excess inventory, falling average selling prices, and higher competition. Amazon benefited from continued strong execution, margin expansion, and the development of its cloud infrastructure. The company continues to make investments to drive unit growth in its core retail business and through the proliferation of digital commerce via the mobile market. Marriott, which acquired Starwood Hotels, benefited from increased demand and limited supply growth in the US, leading to accelerating revenue and operating income growth.
Although the Fund’s information technology positions advanced overall, declines in Red Hat and Twitter tempered gains in Facebook and Microsoft. Red Hat, the provider of open-source software products, was hurt by delayed government deals, currency movements, and choppy billings growth. Social media company Twitter’s user growth and revenue generation lacked consistency. The Fund eliminated its position in Twitter during the period. Facebook rose on strong revenue and user growth. The Internet-based social-networking company continues to solidify its dominant position, increasing its appeal to both users and advertisers. Long-term growth drivers include Instagram, WhatsApp, and Messenger. Microsoft benefited from loyal active users, strong account control, and minimal competition in two primary areas — Office and Windows — that are shifting to a subscription model.
In energy, Concho Resources was a strong performer. The company announced a series of deals that would consolidate its core acreage and shed noncore positions, improving its balance sheet and efficiency.
The S&P 500 Index is an unmanaged, market value-weighted index of over 500 stocks generally representative of the broad stock market. These returns do not include the effect of any investment management expenses. These returns would have been lower if they included the effect of these expenses. Investors cannot invest directly in a market index or average. For a complete list of holdings, refer to the Schedule of Investments section of this report.
1
| | |
Prudential’s Gibraltar Fund, Inc. Presentation of Portfolio Holdings — unaudited | | December 31, 2016 |
| | | | |
| Prudential’s Gibraltar Fund, Inc. | |
| Five Largest Holdings | | | (% of Net Assets | ) |
Amazon.com, Inc. | | | 7.5% | |
Visa, Inc. | | | 5.9% | |
Facebook, Inc. | | | 5.5% | |
NIKE, Inc. | | | 5.0% | |
MasterCard, Inc. | | | 4.7% | |
For a complete listing of holdings, refer to the Schedule of Investments section of this report. Holdings reflect only long-term investments. Holdings/Issues/Industries/Sectors are subject to change.
| | |
Prudential’s Gibraltar Fund, Inc. Fees and Expenses — unaudited | | December 31, 2016 |
As a Planholder investing in the Fund through a variable contract, you incur ongoing costs, including management fees, and other Fund expenses. This example is intended to help you understand your ongoing costs (in dollars) of investing in the Fund and to compare these costs with the ongoing costs of investing in other investment options. This example does not reflect fees and charges under your contract. If contract charges were included, the costs shown below would be higher. Please consult your contract for more information about contract fees and charges.
The example is based on an investment of $1,000 invested at the beginning of the period and held for the entire period July 1, 2016 through December 31, 2016.
Actual Expenses
The first line of the table below provides information about actual account values and actual expenses. You may use this information, together with the amount you invested, to estimate the Fund expenses that you paid over the period. Simply divide your account value by $1,000 (for example, an $8,600 account value divided by $1,000 = 8.6), then multiply the result by the number in the first line under the heading entitled “Expenses Paid During the Six-Month Period” to estimate the Fund expenses you paid on your account during this period. As noted above, the table does not reflect variable contract fees and charges.
Hypothetical Example for Comparison Purposes
The second line of the table below provides information about hypothetical account values and hypothetical expenses based on the Fund’s actual expense ratio and an assumed rate of return of 5% per year before expenses, which is not the Fund’s actual return. The hypothetical account values and expenses may not be used to estimate the actual ending account balance or expenses you paid for the period. You may use this information to compare the ongoing costs of investing in the Fund and other investment options. To do so, compare this 5% hypothetical example with the 5% hypothetical examples that appear in the shareholder reports of the other investment options.
Please note that the expenses shown in the table are meant to highlight your ongoing Fund costs only and do not reflect any contract fees and charges, such as sales charges (loads), insurance charges or administrative charges. Therefore the second line of the table is useful to compare ongoing investment option costs only, and will not help you determine the relative total costs of owning different contracts. In addition, if these contract fees and charges were included, your costs would have been higher.
| | | | | | | | | | | | | | | | | | |
| Prudential’s Gibraltar Fund, Inc. | | Beginning
Account Value
July 1, 2016 | | | Ending
Account Value
December 31, 2016 | | | Annualized Expense
Ratio based on the
Six-Month period | | | Expenses Paid
During the
Six-Month period* | |
| Prudential’s Gibraltar Fund, Inc. | | Actual | | $ | 1,000.00 | | | $ | 1,065.20 | | | | 0.61 | % | | $ | 3.17 | |
| | Hypothetical | | $ | 1,000.00 | | | $ | 1,022.07 | | | | 0.61 | % | | $ | 3.10 | |
* Fund expenses (net of fee waivers or subsidies, if any) are equal to the annualized expense ratio (provided in the table), multiplied by the average account value over the period, multiplied by the 184 days in the six-month period ended December 31, 2016, and divided by the 366 days in the Fund’s fiscal year ended December 31, 2016 (to reflect the six-month period). Expenses presented in the table include the expenses of any underlying portfolios in which the Fund may invest.
| | | | | | |
| | | PRUDENTIAL’S GIBRALTAR FUND, INC. | | |
| |
| PORTFOLIO OF INVESTMENTS | | as of December 31, 2016 |
| | | | | | | | |
| LONG-TERM INVESTMENTS — 99.4% | |
| COMMON STOCKS | | Shares
| | | Value
(Note 1)
| |
Aerospace & Defense — 3.8% | |
Boeing Co. (The) | | | 34,824 | | | $ | 5,421,400 | |
| | | | | | |
|
|
|
Banks — 2.3% | |
JPMorgan Chase & Co. | | | 37,534 | | | | 3,238,809 | |
| | | | | | |
|
|
|
Biotechnology — 7.4% | |
BioMarin Pharmaceutical, Inc.* | | | 22,839 | | | | 1,891,983 | |
Celgene Corp.* | | | 23,741 | | | | 2,748,021 | |
Regeneron Pharmaceuticals, Inc.* | | | 6,068 | | | | 2,227,502 | |
Shire PLC, ADR | | | 15,674 | | | | 2,670,536 | |
Vertex Pharmaceuticals, Inc.* | | | 13,971 | | | | 1,029,243 | |
| | | | | | |
|
|
|
| | | | | | | | 10,567,285 | |
| | | | | | |
|
|
|
Capital Markets — 1.0% | |
S&P Global, Inc. | | | 13,560 | | | | 1,458,242 | |
| | | | | | |
|
|
|
Energy Equipment & Services — 2.9% | |
Halliburton Co. | | | 78,155 | | | | 4,227,404 | |
| | | | | | |
|
|
|
Food & Staples Retailing — 1.7% | |
Costco Wholesale Corp. | | | 14,897 | | | | 2,385,159 | |
| | | | | | |
|
|
|
Food Products — 3.5% | |
Mondelez International, Inc.
(Class A Stock) | | | 112,672 | | | | 4,994,750 | |
| | | | | | |
|
|
|
Health Care Providers & Services — 1.9% | |
Cigna Corp. | | | 20,600 | | | | 2,747,834 | |
| | | | | | |
|
|
|
Hotels, Restaurants & Leisure — 2.6% | |
Marriott International, Inc.
(Class A Stock) | | | 45,521 | | | | 3,763,676 | |
| | | | | | |
|
|
|
Internet & Direct Marketing Retail — 11.1% | |
Amazon.com, Inc.* | | | 14,411 | | | | 10,806,377 | |
Priceline Group, Inc. (The)* | | | 3,509 | | | | 5,144,404 | |
| | | | | | |
|
|
|
| | | | | | | | 15,950,781 | |
| | | | | | |
|
|
|
Internet Software & Services — 15.9% | |
Alibaba Group Holding Ltd.
(China), ADR*(a) | | | 60,418 | | | | 5,305,304 | |
Alphabet, Inc. (Class A Stock)* | | | 6,097 | | | | 4,831,568 | |
Alphabet, Inc. (Class C Stock)* | | | 6,211 | | | | 4,793,774 | |
Facebook, Inc. (Class A Stock)* | | | 68,164 | | | | 7,842,268 | |
| | | | | | |
|
|
|
| | | | | | | | 22,772,914 | |
| | | | | | |
|
|
|
IT Services — 10.6% | |
MasterCard, Inc. (Class A Stock) | | | 66,131 | | | | 6,828,026 | |
Visa, Inc. (Class A Stock) | | | 108,193 | | | | 8,441,218 | |
| | | | | | |
|
|
|
| | | | | | | | 15,269,244 | |
| | | | | | |
|
|
|
Oil, Gas & Consumable Fuels — 3.2% | |
Concho Resources, Inc.* | | | 24,042 | | | | 3,187,969 | |
EOG Resources, Inc. | | | 13,239 | | | | 1,338,463 | |
| | | | | | |
|
|
|
| | | | | | | | 4,526,432 | |
| | | | | | |
|
|
|
Pharmaceuticals — 5.6% | |
Allergan PLC* | | | 16,765 | | | | 3,520,818 | |
Bristol-Myers Squibb Co. | | | 77,143 | | | | 4,508,237 | |
| | | | | | |
|
|
|
| | | | | | | | 8,029,055 | |
| | | | | | |
|
|
|
Semiconductors & Semiconductor Equipment — 1.9% | |
QUALCOMM, Inc. | | | 42,232 | | | | 2,753,526 | |
| | | | | | |
|
|
|
Software — 13.0% | | | | | | | | |
Adobe Systems, Inc.* | | | 42,404 | | | | 4,365,492 | |
Microsoft Corp. | | | 104,144 | | | | 6,471,508 | |
Red Hat, Inc.* | | | 69,289 | | | | 4,829,443 | |
salesforce.com, inc.* | | | 44,356 | | | | 3,036,612 | |
| | | | | | |
|
|
|
| | | | | 18,703,055 | |
| | | | | | |
|
|
|
| | | | | | | | |
COMMON STOCKS (continued) | | Shares
| | | Value
(Note 1)
| |
Specialty Retail — 1.2% | | | | | | | | |
TJX Cos., Inc. (The) | | | 23,104 | | | $ | 1,735,804 | |
| | | | | | |
|
|
|
Technology Hardware, Storage & Peripherals — 4.8% | |
Apple, Inc. | | | 58,816 | | | | 6,812,069 | |
| | | | | | |
|
|
|
Textiles, Apparel & Luxury Goods — 5.0% | |
NIKE, Inc. (Class B Stock) | | | 139,891 | | | | 7,110,660 | |
| | | | | | |
|
|
|
TOTAL LONG-TERM INVESTMENTS
(cost $82,013,224) | | | | 142,468,099 | |
| | | | | | |
|
|
|
| SHORT-TERM INVESTMENTS — 4.2% | |
AFFILIATED MUTUAL FUNDS | |
Prudential Investment Portfolios 2 —Prudential Core Ultra Short Bond Fund(b) | | | 895,133 | | | | 895,133 | |
Prudential Investment Portfolios 2 —Prudential Institutional Money Market Fund (cost $5,119,952 includes $5,114,025 of cash collateral for securities on loan)(b)(c) | | | 5,119,268 | | | | 5,120,292 | |
| | | | | | |
|
|
|
TOTAL SHORT-TERM INVESTMENTS
(cost $6,015,085) (Note 3) | | | | 6,015,425 | |
| | | | | | |
|
|
|
TOTAL INVESTMENTS — 103.6%
(cost $88,028,309) (Note 5) | | | | 148,483,524 | |
LIABILITIES IN EXCESS OF
OTHER ASSETS — (3.6)% | | | | (5,105,761 | ) |
| | | | | | |
|
|
|
NET ASSETS — 100.0% | | | $ | 143,377,763 | |
| | | | | | |
|
|
|
The following abbreviations are used in the annual report:
| | |
| ADR | | American Depositary Receipt |
| LIBOR | | London Interbank Offered Rate |
| * | Non-income producing security. |
| (a) | All or a portion of security is on loan. The aggregate market value of such securities, including those sold and pending settlement is $5,031,513; cash collateral of $5,114,025 (included in liabilities) was received with which the Fund purchased highly liquid short-term investments. Securities on loan are subject to contractual netting arrangements. |
| (b) | Prudential Investments LLC, the manager of the Fund, also serves as manager of the Prudential Investment Portfolios 2 — Prudential Core Ultra Short Bond Fund and the Prudential Investment Portfolios 2 — Prudential Institutional Money Market Fund. |
| (c) | Represents security, or a portion thereof, purchased with cash collateral received for securities on loan and includes dividend reinvestment. |
Various inputs are used in determining the value of the Fund’s investments. These inputs are summarized in the three broad levels listed below.
| Level 1— | quoted prices generally in active markets for identical securities. |
| Level 2— | quoted prices for similar securities, interest rates and yield curves, prepayment speeds, foreign currency exchange rates and other observable inputs. |
| Level 3— | unobservable inputs for securities valued in accordance with Board approved fair valuation procedures. |
SEE NOTES TO FINANCIAL STATEMENTS.
A1
| | | | | | |
| | | PRUDENTIAL’S GIBRALTAR FUND, INC. (continued) | | |
| |
| PORTFOLIO OF INVESTMENTS | | as of December 31, 2016 |
The following is a summary of the inputs used as of December 31, 2016 in valuing such portfolio securities:
| | | | | | | | | | | | |
| | | Level 1
| | | Level 2
| | | Level 3
| |
Investments in Securities | | | | | | | | | | | | |
Common Stocks | | | | | | | | | | | | |
Aerospace & Defense | | $ | 5,421,400 | | | $ | — | | | $ | — | |
Banks | | | 3,238,809 | | | | — | | | | — | |
Biotechnology | | | 10,567,285 | | | | — | | | | — | |
Capital Markets | | | 1,458,242 | | | | — | | | | — | |
Energy Equipment & Services | | | 4,227,404 | | | | — | | | | — | |
Food & Staples Retailing | | | 2,385,159 | | | | — | | | | — | |
Food Products | | | 4,994,750 | | | | — | | | | — | |
Health Care Providers & Services | | | 2,747,834 | | | | — | | | | — | |
Hotels, Restaurants & Leisure | | | 3,763,676 | | | | — | | | | — | |
Internet & Direct Marketing Retail | | | 15,950,781 | | | | — | | | | — | |
Internet Software & Services | | | 22,772,914 | | | | — | | | | — | |
IT Services | | | 15,269,244 | | | | — | | | | — | |
Oil, Gas & Consumable Fuels | | | 4,526,432 | | | | — | | | | — | |
Pharmaceuticals | | | 8,029,055 | | | | — | | | | — | |
Semiconductors & Semiconductor Equipment | | | 2,753,526 | | | | — | | | | — | |
Software | | | 18,703,055 | | | | — | | | | — | |
Specialty Retail | | | 1,735,804 | | | | — | | | | — | |
Technology Hardware, Storage & Peripherals | | | 6,812,069 | | | | — | | | | — | |
Textiles, Apparel & Luxury Goods | | | 7,110,660 | | | | — | | | | — | |
Affiliated Mutual Funds | | | 6,015,425 | | | | — | | | | — | |
| | |
|
|
| |
|
|
| |
|
|
|
Total | | $ | 148,483,524 | | | $ | — | | | $ | — | |
| | |
|
|
| |
|
|
| |
|
|
|
During the period, there were no transfers between Level 1 and Level 2 to report.
The industry classification of investments and liabilities in excess of other assets shown as a percentage of net assets as of December 31, 2016 were as follows (unaudited):
| | | | |
Internet Software & Services | | | 15.9 | % |
Software | | | 13.0 | |
Internet & Direct Marketing Retail | | | 11.1 | |
IT Services | | | 10.6 | |
Biotechnology | | | 7.4 | |
Pharmaceuticals | | | 5.6 | |
Textiles, Apparel & Luxury Goods | | | 5.0 | |
Technology Hardware, Storage & Peripherals | | | 4.8 | |
Affiliated Mutual Funds (including 3.6% of collateral for securities on loan) | | | 4.2 | |
Aerospace & Defense | | | 3.8 | |
Food Products | | | 3.5 | |
Oil, Gas & Consumable Fuels | | | 3.2 | |
| | | | |
Energy Equipment & Services | | | 2.9 | % |
Hotels, Restaurants & Leisure | | | 2.6 | |
Banks | | | 2.3 | |
Semiconductors & Semiconductor Equipment | | | 1.9 | |
Health Care Providers & Services | | | 1.9 | |
Food & Staples Retailing | | | 1.7 | |
Specialty Retail | | | 1.2 | |
Capital Markets | | | 1.0 | |
| | |
|
|
|
| | | | 103.6 | |
Liabilities in excess of other assets | | | (3.6 | ) |
| | |
|
|
|
| | | | 100.0 | % |
| | |
|
|
|
The Portfolio entered into financial transactions during the reporting period that are either offset in accordance with current requirements or are subject to enforceable master netting arrangements or similar agreements that permit offsetting. The information about offsetting and related netting arrangements for financial transactions, where the legal right to set-off exists, is presented in the summary below.
Offsetting of financial transactions assets and liabilities:
| | | | | | | | | | | | |
Description
| | Gross Amounts of
Recognized Assets(1)
| | | Collateral Received
| | | Net Amount
| |
Securities on Loan | | $ | 5,031,513 | | | $ | (5,031,513 | ) | | $ | — | |
| | |
|
|
| | | | | | | | |
| (1) | Amount represents market value. |
SEE NOTES TO FINANCIAL STATEMENTS.
A2
| | | | | | |
| | | PRUDENTIAL’S GIBRALTAR FUND, INC. (continued) | | |
STATEMENT OF ASSETS AND LIABILITIES
as of December 31, 2016
| | | | |
| ASSETS | | | | |
Investments at value, including securities on loan of $5,031,513: | | | | |
Unaffiliated investments (cost $82,013,224) | | $ | 142,468,099 | |
Affiliated investments (cost $6,015,085) | | | 6,015,425 | |
Dividends receivable | | | 48,095 | |
Tax reclaim receivable | | | 45,502 | |
Prepaid expenses | | | 1,166 | |
| | |
|
|
|
Total Assets | | | 148,578,287 | |
| | |
|
|
|
| LIABILITIES | | | | |
Payable to broker for collateral for securities on loan | | | 5,114,025 | |
Management fee payable | | | 67,500 | |
Accrued expenses and other liabilities | | | 17,488 | |
Payable for investments purchased | | | 1,511 | |
| | |
|
|
|
Total Liabilities | | | 5,200,524 | |
| | |
|
|
|
| NET ASSETS | | $ | 143,377,763 | |
| | |
|
|
|
Net assets were comprised of: | | | | |
Common stock, at $0.01 par value | | $ | 100,220 | |
Paid-in capital in excess of par | | | 84,107,223 | |
| | |
|
|
|
| | | | 84,207,443 | |
Accumulated net realized loss on investment transactions | | | (1,284,895 | ) |
Net unrealized appreciation on investments | | | 60,455,215 | |
| | |
|
|
|
Net assets, December 31, 2016 | | $ | 143,377,763 | |
| | |
|
|
|
Net asset value and redemption price per share, $143,377,763/10,021,978 outstanding shares of common stock (authorized 75,000,000 shares) | | $ | 14.31 | |
| | |
|
|
|
STATEMENT OF OPERATIONS
Year Ended December 31, 2016
| | | | |
| NET INVESTMENT INCOME (LOSS) | | | | |
Income | | | | |
Unaffiliated dividend income (net of foreign withholding taxes of $37,537) | | $ | 1,145,938 | |
Affiliated dividend income | | | 19,813 | |
Income from securities lending, net (including affiliated income of $12,433) | | | 16,103 | |
| | |
|
|
|
Total income | | | 1,181,854 | |
| | |
|
|
|
| EXPENSES | | | | |
Management fee | | | 804,778 | |
Custodian and accounting fees (net of $4,500 fee credit) | | | 46,000 | |
Audit fee | | | 26,000 | |
Directors’ fees | | | 11,000 | |
Legal fees and expenses | | | 7,000 | |
Insurance expenses | | | 2,000 | |
Miscellaneous | | | 9,942 | |
| | |
|
|
|
Total expenses | | | 906,720 | |
| | |
|
|
|
| NET INVESTMENT INCOME (LOSS) | | | 275,134 | |
| | |
|
|
|
| REALIZED AND UNREALIZED GAIN (LOSS) ON INVESTMENTS | | | | |
Net realized gain (loss) on investment transactions (including affiliated of $1,885) | | | 9,256,360 | |
Net change in unrealized appreciation (depreciation) on investments (including affiliated of $340) | | | (9,470,736 | ) |
| | |
|
|
|
| NET GAIN (LOSS) ON INVESTMENT TRANSACTIONS | | | (214,376 | ) |
| | |
|
|
|
| NET INCREASE (DECREASE) IN NET ASSETS RESULTING FROM OPERATIONS | | $ | 60,758 | |
| | |
|
|
|
STATEMENT OF CHANGES IN NET ASSETS
| | | | | | | | |
| | | Year Ended December 31,
| |
| | | 2016
| | | 2015
| |
| INCREASE (DECREASE) IN NET ASSETS | | | | | | | | |
| OPERATIONS: | | | | | | | | |
Net investment income (loss) | | $ | 275,134 | | | $ | 221,726 | |
Net realized gain (loss) on investment transactions | | | 9,256,360 | | | | 14,915,809 | |
Net change in unrealized appreciation (depreciation) on investments | | | (9,470,736 | ) | | | 4,506,171 | |
| | |
|
|
| |
|
|
|
NET INCREASE (DECREASE) IN NET ASSETS RESULTING FROM OPERATIONS | | | 60,758 | | | | 19,643,706 | |
| | |
|
|
| |
|
|
|
| DIVIDENDS AND DISTRIBUTIONS: | | | | | | | | |
Dividends from net investment income | | | (283,913 | ) | | | (242,658 | ) |
Distributions from net realized gains | | | (12,953,416 | ) | | | (14,188,399 | ) |
| | |
|
|
| |
|
|
|
| | | | (13,237,329 | ) | | | (14,431,057 | ) |
| | |
|
|
| |
|
|
|
| CAPITAL STOCK TRANSACTIONS: | | | | | | | | |
Capital stock sold [260 and 10,237 shares, respectively] | | | 3,733 | | | | 158,411 | |
Capital stock issued in reinvestment of dividends [897,520 and 910,305 shares, respectively] | | | 13,237,329 | | | | 14,431,057 | |
Capital stock repurchased [1,016,800 and 1,203,516 shares, respectively] | | | (15,319,068 | ) | | | (20,036,540 | ) |
| | |
|
|
| |
|
|
|
NET INCREASE (DECREASE) IN NET ASSETS FROM FUND SHARE TRANSACTIONS | | | (2,078,006 | ) | | | (5,447,072 | ) |
| | |
|
|
| |
|
|
|
| TOTAL INCREASE (DECREASE) | | | (15,254,577 | ) | | | (234,423 | ) |
| NET ASSETS: | | | | | | | | |
Beginning of year | | | 158,632,340 | | | | 158,866,763 | |
| | |
|
|
| |
|
|
|
End of year | | $ | 143,377,763 | | | $ | 158,632,340 | |
| | |
|
|
| |
|
|
|
SEE NOTES TO FINANCIAL STATEMENTS.
A3
NOTES TO THE FINANCIAL STATEMENTS OF
PRUDENTIAL’S GIBRALTAR FUND, INC.
Prudential’s Gibraltar Fund, Inc. (the “Fund”) was originally incorporated in the State of Delaware on March 14, 1968 and was reincorporated in the State of Maryland effective May 1, 1997. It is registered as an open-end, diversified management investment company under the Investment Company Act of 1940, as amended (“1940 Act”). The investment objective of the Fund is growth of capital to the extent compatible with a concern for preservation of principal. The Fund was organized by The Prudential Insurance Company of America (“PICA”) to serve as the investment medium for the variable contract accounts of The Prudential Financial Security Program (“FSP”). The Fund does not sell its shares to the public. The accounts will redeem shares of the Fund to the extent necessary to provide benefits under the contracts or for such other purposes as may be consistent with the contracts.
| Note 1: | | Accounting Policies |
The Fund follows investment company accounting and reporting guidance of the Financial Accounting Standards Board (“FASB”) Accounting Standard Codification Topic 946 Financial Services — Investment Companies. The following accounting policies conform to U.S. generally accepted accounting principles. The Fund consistently follows such policies in the preparation of its financial statements.
Securities Valuation: The Fund holds securities and other assets that are fair valued at the close of each day (generally, 4:00 PM Eastern time) the New York Stock Exchange (“NYSE”) is open for trading. Fair value is the price that would be received to sell an asset or paid to transfer a liability in an orderly transaction between market participants on the measurement date. The Board of Directors (the “Board”) has adopted Valuation Procedures for security valuation under which fair valuation responsibilities have been delegated to Prudential Investments LLC (“PI” or “Manager”). Under the current Valuation Procedures, the established Valuation Committee is responsible for supervising the valuation of portfolio securities and other assets. The Valuation Procedures permit the Fund to utilize independent pricing vendor services, quotations from market makers, and alternative valuation methods when market quotations are either not readily available or not deemed representative of fair value. A record of the Valuation Committee’s actions is subject to the Board’s review, approval, and ratification at its next regularly-scheduled quarterly meeting.
Various inputs determine how the Fund’s investments are valued, all of which are categorized according to the three broad levels (Level 1, 2, or 3) detailed in the table following the Schedule of Investments.
Common and preferred stocks, exchange-traded funds, and derivative instruments such as futures or options that are traded on a national securities exchange are valued at the last sale price as of the close of trading on the applicable exchange where the security principally trades. Securities traded via NASDAQ are valued at the NASDAQ official closing price. To the extent these securities are valued at the last sale price or NASDAQ official closing price, they are classified as Level 1 in the fair value hierarchy.
In the event that no sale or official closing price on valuation date exists, these securities are generally valued at the mean between the last reported bid and ask prices, or at the last bid price in the absence of an ask price. These securities are classified as Level 2 in the fair value hierarchy.
Common and preferred stocks traded on foreign securities exchanges are valued using pricing vendor services that provide model prices derived using adjustment factors based on information such as local closing price, relevant general and sector indices, currency fluctuations, depositary receipts, and futures, as applicable. Securities valued using such model prices are classified as Level 2 in the fair value hierarchy. The models generate an evaluated adjustment factor for each security, which is applied to the local closing price to adjust it for post closing market movements. Utilizing that evaluated adjustment factor, the vendor provides an evaluated price for each security. If the vendor does not provide an evaluated price, securities are valued in accordance with exchange-traded common and preferred stocks discussed above.
Participatory notes (“P-notes”) are generally valued based upon the value of a related underlying security that trades actively in the market and are classified as Level 2 in the fair value hierarchy.
Investments in open-end, non-exchange-traded mutual funds are valued at their net asset values as of the close of the NYSE on the date of valuation. These securities are classified as Level 1 in the fair value hierarchy since they may be purchased or sold at their net asset values on the date of valuation.
B1
Securities and other assets that cannot be priced according to the methods described above are valued based on pricing methodologies approved by the Board. In the event that unobservable inputs are used when determining such valuations, the securities will be classified as Level 3 in the fair value hierarchy.
When determining the fair value of securities, some of the factors influencing the valuation include: the nature of any restrictions on disposition of the securities; assessment of the general liquidity of the securities; the issuer’s financial condition and the markets in which it does business; the cost of the investment; the size of the holding and the capitalization of the issuer; the prices of any recent transactions or bids/offers for such securities or any comparable securities; any available analyst media or other reports or information deemed reliable by the investment adviser regarding the issuer or the markets or industry in which it operates. Using fair value to price securities may result in a value that is different from a security’s most recent closing price and from the price used by other mutual funds to calculate their net asset values.
Master Netting Arrangements: The Fund is subject to various Master Agreements, or netting arrangements, with select counterparties. These are agreements which a subadviser may have negotiated and entered into on behalf of the Fund. A master netting arrangement between the Fund and the counterparty permits the Fund to offset amounts payable by the Fund to the same counterparty against amounts to be received; and by the receipt of collateral from the counterparty by the Fund to cover the Fund’s exposure to the counterparty. However, there is no assurance that such mitigating factors are easily enforceable. In addition to master netting arrangements, the right to set-off exists when all the conditions are met such that each of the parties owes the other determinable amounts, the reporting party has the right to set-off the amount owed with the amount owed by the other party, the reporting party intends to set-off and the right of set-off is enforceable by law. During the reporting period, there was no intention to settle on a net basis and all amounts are presented on a gross basis on the Statement of Assets and Liabilities.
Securities Lending: The Fund may lend its portfolio securities to banks and broker-dealers. The loans are secured by collateral at least equal to the market value of the securities loaned. Collateral pledged by each borrower is invested in an affiliated money market fund and is marked to market daily, based on the previous day’s market value, such that the value of the collateral exceeds the value of the loaned securities. Pursuant to the repositioning of the money market fund as an ultra-short bond fund, for the period March 31, 2016 through July 18, 2016 the collateral was invested in an ultra-short bond fund. Loans are subject to termination at the option of the borrower or the Fund. Upon termination of the loan, the borrower will return to the Fund securities identical to the loaned securities. Should the borrower of the securities fail financially, the Fund has the right to repurchase the securities in the open market using the collateral. The Fund recognizes income, net of any rebate and securities lending agent fees, for lending its securities in the form of fees or interest on the investment of any cash received as collateral. The borrower receives all interest and dividends from the securities loaned and such payments are passed back to the lender in amounts equivalent thereto. The Fund also continues to recognize any unrealized gain (loss) in the market price of the securities loaned and on the change in the value of the collateral invested that may occur during the term of the loan. In addition, realized gain (loss) is recognized on changes in the value of the collateral invested that may occur during the term of the loan.
Securities Transactions and Net Investment Income: Securities transactions are recorded on the trade date. Realized gains (losses) from investment transactions are calculated on the specific identification method. Dividend income is recorded on the ex-date. Interest income, including amortization of premium and accretion of discount on debt securities, as required, is recorded on the accrual basis. Expenses are recorded on the accrual basis, which may require the use of certain estimates by management that may differ from actual.
Dividends and Distributions: The Fund expects to pay dividends of net investment income semi-annually and distributions of net realized capital gains, if any, at least annually. Dividends and distributions to shareholders, which are determined in accordance with federal income tax regulations and which may differ from generally accepted accounting principles, are recorded on the ex-date. Permanent book/tax differences relating to income and gain (loss) are reclassified amongst undistributed net investment income, accumulated net realized gain (loss) and paid-in-capital in excess of par, as appropriate.
Taxes: It is the Fund’s policy to continue to meet the requirements of the Internal Revenue Code applicable to regulated investment companies and to distribute all of its taxable net investment income and capital gains, if any, to its shareholders. Therefore, no federal income tax provision is required. Withholding taxes on foreign dividends are recorded, net of reclaimable amounts, at the time the related income is earned.
Estimates: The preparation of financial statements requires management to make estimates and assumptions that affect the reported amounts and disclosures in the financial statements. Actual results could differ from these estimates.
B2
The Fund has a management agreement with PI. Pursuant to this agreement, PI has responsibility for all investment advisory services and supervises the subadviser’s performance of such services. PI has entered into a subadvisory agreement with Jennison Associates LLC (“Jennison”). The subadvisory agreement provides that Jennison will furnish investment advisory services in connection with the management of the Fund. In connection therewith, Jennison is obligated to keep certain books and records of the Fund. PI pays for the services of Jennison, the cost of compensation of officers of the Fund, costs related to shareholder reporting, occupancy and certain clerical and administrative expenses of the Fund. The Fund bears all other costs and expenses.
The management fee paid to PI is accrued daily and payable monthly, at an annual rate of 0.55% of the Fund’s average daily net assets.
The Fund has a distribution agreement with Prudential Investment Management Services LLC (“PIMS”) which acts as distributor of the shares of the Fund. No distribution or service fees are paid to PIMS as distributor of shares of the Fund.
PI, PICA, PIMS and Jennison are indirect, wholly-owned subsidiaries of Prudential Financial, Inc. (“Prudential”).
The Fund has entered into a brokerage commission recapture agreement with certain registered broker-dealers. Under the brokerage commission recapture program, a portion of the commission is returned to the Fund. Such amounts are included within realized gain (loss) on investment transactions presented in the Statement of Operations. For the year ended December 31, 2016, brokerage commission recaptured under these agreements was $8,565.
| Note 3: | | Other Transactions with Affiliates |
The Fund may enter into certain securities purchase or sale transactions under Board approved Rule 17a-7 procedures. Rule 17a-7 is an exemptive rule under the 1940 Act, that permits purchase and sale transactions among affiliated investment companies, or between an investment company and a person that is affiliated solely by reason of having a common (or affiliated) investment adviser, common directors, and/or common officers. Such transactions are subject to ratification by the Board.
The Fund invests its overnight sweep cash in the Prudential Core Ultra Short Bond Fund (the “Core Fund”) and its securities lending cash collateral in the Prudential Institutional Money Market Fund (the “Money Market Fund”) each a series of the Prudential Investment Portfolios 2, registered under the 1940 Act and managed by PI. Earnings from the Core and the Money Market Funds are disclosed on the Statement of Operations as “Affiliated dividend income” and “Income from securities lending, net”.
| Note 4: | | Portfolio Securities |
The cost of purchases and proceeds from sales of portfolio securities, other than short-term investments, for the year ended December 31, 2016, were $30,408,553 and $41,044,728, respectively.
| Note 5: | | Distributions and Tax Information |
Distributions to shareholders, which are determined in accordance with federal income tax regulations and which may differ from generally accepted accounting principles, are recorded on the ex-date. In order to present distributions in excess of net investment income, accumulated net realized loss on investment transactions and paid-in capital in excess of par on the Statement of Assets and Liabilities that more closely represent their tax character, certain adjustments have been made to distributions in excess of net investment income and accumulated net realized loss on investment transactions. For the year ended December 31, 2016, the adjustments were to decrease distributions in excess of net investment income and increase accumulated net realized loss on investment transactions by $8,779 due to the reclassification of distributions. Net investment income, net realized gain on investment transactions and net assets were not affected by this change.
For the year ended December 31, 2016, the tax character of dividends paid by the Fund was $275,134 of ordinary income and $12,962,195 of long-term capital gains. For the year ended December 31, 2015, the tax character of dividends paid by the Fund were $221,726 of ordinary income and $14,209,331 of long-term capital gains.
B3
As of December 31, 2016, there were no accumulated undistributed earnings on a tax basis.
The United States federal income tax basis of the Fund’s investments and the net unrealized appreciation as of December 31, 2016 were as follows:
| | | | | | | | | | | | |
Tax Basis
| | Appreciation
| | | Depreciation
| | | Net Unrealized
Appreciation
| |
| $88,031,848 | | $ | 63,548,247 | | | $ | (3,096,571 | ) | | $ | 60,451,676 | |
The difference between book basis and tax basis is attributable to deferred losses on wash sales.
The Fund elected to treat post-October capital losses of approximately $1,281,000 as having been incurred in the following fiscal year (December 31, 2017).
Management has analyzed the Fund’s tax positions taken on federal, state and local income tax returns for all open tax years and has concluded that no provision for income tax is required in the Fund’s financial statements for the current reporting period. The Fund’s federal, state and local income and federal excise tax returns for tax years for which the applicable statutes of limitations have not expired are subject to examination by the Internal Revenue Service and state departments of revenue.
The Fund, along with other affiliated registered investment companies (the “Funds”), is a party to a Syndicated Credit Agreement (“SCA”) with a group of banks. The purpose of the SCA is to provide an alternative source of temporary funding for capital share redemptions. The SCA provides for a commitment of $900 million for the period October 6, 2016 through October 5, 2017. The Funds pay an annualized commitment fee of .15% of the unused portion of the SCA. The interest rate on borrowings under the SCA is paid monthly and at a per annum rate based upon the higher of 0%, the effective federal funds rate, or the One-Month LIBOR rate, plus a contractual spread. Prior to October 6, 2016, the Funds had another SCA that provided a commitment of $900 million and the Funds paid an annualized commitment fee of .11% of the unused portion of the SCA. The interest rate on borrowings was substantially the same. The Fund’s portion of the commitment fee for the unused amount is accrued daily and paid quarterly.
The Fund did not utilize the SCA during the year ended December 31, 2016.
| Note 7: | | Ownership and Affiliates |
As of December 31, 2016, all shares of record of the Fund were owned by PICA on behalf of the owners of the three variable insurance products: Prudential’s Investment Plan Account, Prudential’s Annuity Plan Account and Prudential’s Annuity Plan Account-2.
| Note 8: | | Recent Accounting Pronouncements and Reporting Updates |
In December 2016, the FASB released an Accounting Standards Update (“ASU”) that makes technical changes to various sections of the Accounting Standards Codification (“ASC”), including Topic 820, Fair Value Measurement. The changes to Topic 820 are intended to clarify the difference between a valuation approach and a valuation technique. The changes to ASC 820-10-50-2 require a reporting entity to disclose, for Level 2 and Level 3 fair value measurements, a change in either or both a valuation approach and a valuation technique and the reason(s) for the change. The changes to Topic 820 are effective for fiscal years, and interim periods within those fiscal years, beginning after December 15, 2016. At this time, management is evaluating the implications of the ASU and its impact on the financial statements and disclosures has not yet been determined.
On October 13, 2016, the Securities and Exchange Commission (the “SEC”) adopted new rules and forms and amended existing rules and forms which are intended to modernize and enhance the reporting and disclosure of information by registered investment companies and to improve the quality of information that funds provide to investors, including modifications to Regulation S-X which would require standardized, enhanced disclosure about derivatives in investment company financial statements. The new rules also enhance disclosure regarding fund liquidity and redemption practices. Also under the new rules, the SEC will permit open-end funds, with the exception of money market funds, to offer swing pricing, subject to board approval and review. The compliance dates of the modifications to Regulation S-X are August 1, 2017 and other amendments and rules are generally June 1, 2018 and December 1, 2018. Management is currently evaluating the impacts to the financial statement disclosures, if any.
B4
Financial Highlights
| | | | | | | | | | | | | | | | | | | | |
| | | Year Ended December 31,
| |
| | | 2016
| | | 2015
| | | 2014
| | | 2013
| | | 2012
| |
Per Share Operating Performance: | | | | | | | | | | | | | | | | | | | | |
Net Asset Value, beginning of year | | $ | 15.64 | | | $ | 15.24 | | | $ | 15.73 | | | $ | 12.15 | | | $ | 10.16 | |
| | |
|
|
| |
|
|
| |
|
|
| |
|
|
| |
|
|
|
Income (Loss) From Investment Operations: | | | | | | | | | | | | | | | | | | | | |
Net investment income (loss) | | | .03 | | | | .02 | | | | .04 | | | | .05 | | | | .08 | |
Net realized and unrealized gain (loss) on investments | | | .05 | | | | 1.92 | | | | 1.24 | | | | 3.84 | | | | 1.98 | |
| | |
|
|
| |
|
|
| |
|
|
| |
|
|
| |
|
|
|
Total from investment operations | | | .08 | | | | 1.94 | | | | 1.28 | | | | 3.89 | | | | 2.06 | |
| | |
|
|
| |
|
|
| |
|
|
| |
|
|
| |
|
|
|
Less Dividends and Distributions: | | | | | | | | | | | | | | | | | | | | |
Dividends from net investment income | | | (.03 | ) | | | (.03 | ) | | | (.04 | ) | | | (.05 | ) | | | (.07 | ) |
Distributions from net realized gains | | | (1.38 | ) | | | (1.51 | ) | | | (1.73 | ) | | | (.26 | ) | | | — | |
| | |
|
|
| |
|
|
| |
|
|
| |
|
|
| |
|
|
|
| | | | (1.41 | ) | | | (1.54 | ) | | | (1.77 | ) | | | (.31 | ) | | | (.07 | ) |
| | |
|
|
| |
|
|
| |
|
|
| |
|
|
| |
|
|
|
Net Asset Value, end of year | | $ | 14.31 | | | $ | 15.64 | | | $ | 15.24 | | | $ | 15.73 | | | $ | 12.15 | |
| | |
|
|
| |
|
|
| |
|
|
| |
|
|
| |
|
|
|
Total Return(a): | | | .39 | % | | | 12.65 | % | | | 8.43 | % | | | 32.15 | % | | | 20.33 | % |
Ratios/Supplemental Data: | | | | | | | | | | | | | | | | | | | | |
Net assets, end of year (in millions) | | $ | 143.4 | | | $ | 158.6 | | | $ | 158.9 | | | $ | 162.4 | | | $ | 135.8 | |
Ratios to average net assets(b): | | | | | | | | | | | | | | | | | | | | |
Expenses after waivers and/or expense reimbursement | | | .62 | % | | | .62 | % | | | .62 | % | | | .62 | % | | | .63 | % |
Expenses before waivers and/or expense reimbursement | | | .62 | % | | | .62 | % | | | .62 | % | | | .62 | % | | | .63 | % |
Net investment income (loss) | | | .19 | % | | | .14 | % | | | .25 | % | | | .34 | % | | | .62 | % |
Portfolio turnover rate | | | 21 | % | | | 22 | % | | | 31 | % | | | 29 | % | | | 32 | % |
| (a) | Total return is calculated assuming a purchase of a share on the first day and a sale on the last day of each year reported and includes reinvestment of dividends and distributions, if any. Past performance is no guarantee of future results. Total returns may reflect adjustments to conform to generally accepted accounting principles. |
| (b) | Does not include expenses of the underlying funds in which the Fund invests. |
SEE NOTES TO FINANCIAL STATEMENTS.
C1
REPORT OF INDEPENDENT REGISTERED PUBLIC ACCOUNTING FIRM
THE BOARD OF DIRECTORS AND SHAREHOLDERS
PRUDENTIAL’S GIBRALTAR FUND, INC.:
We have audited the accompanying statement of assets and liabilities of Prudential’s Gibraltar Fund, Inc. (the “Fund”), including the schedule of investments, as of December 31, 2016, and the related statement of operations for the year then ended, the statements of changes in net assets for each of the years in the two-year period then ended, and the financial highlights for each of the years in the five-year period then ended. These financial statements and financial highlights are the responsibility of the Fund’s management. Our responsibility is to express an opinion on these financial statements and financial highlights based on our audits.
We conducted our audits in accordance with the standards of the Public Company Accounting Oversight Board (United States). Those standards require that we plan and perform the audit to obtain reasonable assurance about whether the financial statements and financial highlights are free of material misstatement. An audit includes examining, on a test basis, evidence supporting the amounts and disclosures in the financial statements. Our procedures included confirmation of securities owned as of December 31, 2016, by correspondence with the custodian, transfer agent and brokers or by other appropriate auditing procedures when replies from brokers were not received. An audit also includes assessing the accounting principles used and significant estimates made by management, as well as evaluating the overall financial statement presentation. We believe that our audits provide a reasonable basis for our opinion.
In our opinion, the financial statements and financial highlights referred to above present fairly, in all material respects, the financial position of the Fund as of December 31, 2016, and the results of its operations, the changes in its net assets and the financial highlights for the periods described in the first paragraph above, in conformity with U.S. generally accepted accounting principles.

New York, New York
February 14, 2017
D1
Federal Income Tax Information (unaudited)
We are advising you that during the year ended December 31, 2016, the Fund reports the maximum amount allowed per share but not less than $1.38 as a capital gain distribution in accordance with Section 852 (b)(3)(C) of the Internal Revenue Code.
For the year ended December 31, 2016, the Fund reports, in accordance with Section 854 of the Internal Revenue Code, the following percentages of the ordinary income distributions paid as 1) qualified dividend income (QDI); and 2) eligible for corporate dividends received deduction (DRD):
| | | | | | | | |
| | | QDI
| | | DRD
| |
Prudential’s Gibraltar Fund, Inc. | | | 100.00 | % | | | 100.00 | % |
D2
INFORMATION ABOUT DIRECTORS AND OFFICERS (Unaudited)
Information about the Directors and the Officers of the Fund is set forth below. Directors who are not deemed to be “interested persons” of the Fund, as defined in the Investment Company Act of 1940, are referred to as “Independent Directors.” Directors who are deemed to be “interested persons” of the Fund are referred to as “Interested Directors.” The Directors are responsible for the overall supervision of the operations of the Fund and perform the various duties imposed on the directors of investment companies by the Investment Company Act of 1940.
| | | | |
| Independent Directors | | | | |
Name, Age Position with the Fund Number of Portfolios in Fund Complex†
Overseen by Director | | Principal Occupation(s) During Past 5 Years | | Other Directorships Held by Director** |
Susan Davenport Austin* (Age: 49) Director Since 2011 Overseen by Director: 112 | | Senior Managing Director of Brock Capital (since 2014); Vice Chairman of Sheridan Broadcasting Corporation (since 2013); Formerly Senior Vice President and Chief Financial Officer (2007-2012) and Vice President of Strategic Planning and Treasurer (2002-2007) of Sheridan Broadcasting Corporation; Formerly President of Sheridan Gospel Network (2004-2014); Vice President, Goldman, Sachs & Co. (2000-2001); Associate Director, Bear, Stearns & Co. Inc (1997-2000); Vice President, Salomon Brothers Inc (1993-1997); President of the Board, The MacDowell Colony (Since 2010); Formerly Chairman of the Board of Directors, Broadcast Music, Inc. (2011-2014); Presiding Director of the Board of Directors, Broadcast Music, Inc. (since 2014); Member of the Board of Directors, Hubbard Radio, LLC (Since 2011); President, Candide Business Advisors, Inc. (since 2011); formerly Member of the Board of Directors, National Association of Broadcasters (2004-2010) | | Director of NextEra Energy Partners, LP (NYSE:NEP) (February 2015-Present) |
Sherry S. Barrat* (Age: 67) Director Since 2013 Overseen by Director: 112 | | Formerly, Vice Chairman of Northern Trust Corporation (financial services and banking institution) (2011-June 2012); formerly President, Personal Financial Services, Northern Trust Corporation (2006-2010); formerly Chairman & CEO, Western US Region, Northern Trust Corporation (1999-2005); formerly President & CEO, Palm Beach/Martin County Region, Northern Trust. | | Director of NextEra Energy, Inc. (NYSE: NEE) (1998-Present); Director of Arthur J. Gallagher & Company (Since July 2013) |
Jessica M. Bibliowicz* (Age: 57) Director Since 2014 Overseen by Director: 112 | | Senior Adviser (Since 2013) of Bridge Growth Partners (private equity firm); formerly Chief Executive Officer (1999-2013) of National Financial Partners (independent distributor of financial services products. | | Director (since 2006) The Asia-Pacific Fund, Inc.; Sotheby’s (since 2014) (auction house and art-related finance). |
Kay Ryan Booth* (Age: 66) Director Since 2013 Overseen by Director: 112 | | Partner, Trinity Private Equity Group (Since September 2014); formerly, Managing Director of Cappello Waterfield & Co. LLC (2011-2014); formerly Vice Chair, Global Research, J.P. Morgan (financial services and investment banking institution) (June 2008-January 2009); formerly Global Director of Equity Research, Bear Stearns & Co., Inc. (financial services and investment banking institution) (1995-2008); formerly Associate Director of Equity Research, Bear Stearns & Co., Inc. (1987-1995). | | None. |
Delayne Dedrick Gold* (Age: 78) Director Since 2003 Overseen by Director: 112 | | Marketing Consultant (1982-present); formerly Senior Vice President and Member of the Board of Directors, Prudential Bache Securities, Inc. | | None. |
Robert F. Gunia* (Age: 70) Director Since 2003 Overseen by Director: 112 | | Independent Consultant (Since October 2009); formerly Chief Administrative Officer (September 1999-September 2009) and Executive Vice President (December 1996-September 2009) of Prudential Investments LLC; formerly Executive Vice President (March 1999-September 2009) and Treasurer (May 2000-September 2009) of Prudential Mutual Fund Services LLC; formerly President (April 1999-December 2008) and Executive Vice President and Chief Operating Officer (December 2008-December 2009) of Prudential Investment Management Services LLC; formerly Chief Administrative Officer, Executive Vice President and Director (May 2003-September 2009) of AST Investment Services, Inc. | | Director (Since May 1989) of The Asia-Pacific Fund, Inc. |
E1
| | | | |
| Independent Directors | | | | |
Name, Age Position with the Fund Number of Portfolios in Fund Complex†
Overseen by Director | | Principal Occupation(s) During Past 5 Years | | Other Directorships Held by Director** |
Thomas T. Mooney* (Age: 75) Director Since 2003 Independent Chair Since 2003 Overseen by Director: 112 | | Formerly Chief Executive Officer, Excell Partners, Inc. (2005- 2007); founding partner of High Technology of Rochester and the Lennox Technology Center; formerly President of the Greater Rochester Metro Chamber of Commerce (1976-2004) formerly Rochester City Manager (1973); formerly Deputy Monroe County Executive (1974-1976). | | None. |
Thomas M. O’Brien* (Age: 66) Director Since 2003 Overseen by Director: 112 | | Director, President and CEO Sun Bancorp, Inc. N.A. (NASDAQ: SNBC) and Sun National Bank (Since July 2014); formerly Consultant, Valley National Bancorp, Inc. and Valley National Bank (January 2012-June 2012); formerly President and COO (November 2006-December 2011) and CEO (April 2007-December 2011) of State Bancorp, Inc. and State Bank; formerly Vice Chairman (January 1997-April 2000) of North Fork Bank; formerly President and Chief Executive Officer (December 1984-December 1996) of North Side Savings Bank; formerly President and Chief Executive Officer (May 2000-June 2006) Atlantic Bank of New York. | | Formerly Director, BankUnited, Inc. and BankUnited N.A. (NYSE: BKU) (May 2012-April 2014); formerly Director (April 2008-January 2012) of Federal Home Loan Bank of New York; formerly Director (December 1996-May 2000) of North Fork Bancorporation, Inc.; formerly Director (May 2000-April 2006) of Atlantic Bank of New York; Director (November 2006-January 2012) of State Bancorp, Inc. (NASDAQ: STBC) and State Bank of Long Island. |
| Interested Director | | | | |
Timothy S. Cronin* (Age: 51) Director Since 2009 Overseen by Director: 113 | | President of Prudential Annuities (Since June 2015); Chief Investment Officer and Strategist of Prudential Annuities (Since January 2004); Director of Investment & Research Strategy (Since February 1998); President of AST Investment Services, Inc. (Since June 2005). | | None. |
* The address of each Director is c/o Prudential Investments LLC, 655 Broad Street, Newark, New Jersey 07102.
** Includes only directorships of companies required to register or file reports with the Securities and Exchange Commission (SEC) under the Securities Exchange Act of 1934 (that is, “public companies”) or other investment companies registered under the Investment Company Act of 1940.
† The Fund Complex consists of all investment companies managed by Prudential Investments LLC). The Funds for which Prudential Investments LLC serves as manager include the Prudential Investments Mutual Funds, Target Mutual Funds, The Prudential Variable Contract Accounts 2, 10 and 11, Prudential Short Duration High Yield Fund, Inc., Prudential Global Short Duration High Yield Fund, Inc., The Prudential Series Fund, Advanced Series Trust, and Prudential’s Gibraltar Fund, Inc.
| | |
| Fund Officers1 | | |
Name, Age Position with the Fund | | Principal Occupation(s) During Past 5 Years |
Raymond A. O’Hara* (61) Chief Legal Officer Since 2012 | | Vice President and Corporate Counsel (since July 2010) of Prudential Insurance Company of America (Prudential); Vice President (March 2011-Present) of Pruco Life Insurance Company and Pruco Life Insurance Company of New Jersey; Vice President and Corporate Counsel (March 2011-Present) of Prudential Annuities Life Assurance Corporation; Chief Legal Officer of Prudential Investments LLC (since June 2012); Chief Legal Officer of Prudential Mutual Fund Services LLC (since June 2012) and Corporate Counsel of AST Investment Services, Inc. (since June 2012); formerly Assistant Vice President and Corporate Counsel (September 2008-July 2010) of The Hartford Financial Services Group, Inc.; formerly Associate (September 1980-December 1987) and Partner (January 1988-August 2008) of Blazzard & Hasenauer, P.C. (formerly, Blazzard, Grodd & Hasenauer, P.C.). |
Chad A. Earnst* (41) Chief Compliance Officer Since 2014 | | Chief Compliance Officer (September 2014-Present) of Prudential Investments LLC; Chief Compliance Officer (September 2014-Present) of the Prudential Investments Funds, Target Funds, Advanced Series Trust, The Prudential Series Fund, Prudential’s Gibraltar Fund, Inc., Prudential Global Short Duration High Yield Income Fund, Inc., Prudential Short Duration High Yield Fund, Inc. and Prudential Jennison MLP Income Fund, Inc.; formerly Assistant Director (March 2010-August 2014) of the Asset Management Unit, Division of Enforcement, U.S. Securities & Exchange Commission; Assistant Regional Director (January 2010-August 2014), Branch Chief (June 2006-December 2009) and Senior Counsel (April 2003-May 2006) of the Miami Regional Office, Division of Enforcement, U.S. Securities & Exchange Commission. |
Deborah A. Docs* (58) Secretary Since 2005 | | Vice President and Corporate Counsel (since January 2001) of Prudential; Vice President (since December 1996) and Assistant Secretary (since March 1999) of Prudential Investments LLC; formerly Vice President and Assistant Secretary (May 2003-June 2005) of AST Investment Services, Inc. |
E2
| | |
| Fund Officers1 | | |
Name, Age Position with the Fund | | Principal Occupation(s) During Past 5 Years |
Jonathan D. Shain* (58 ) Assistant Secretary Since 2005 | | Vice President and Corporate Counsel (since August 1998) of Prudential; Vice President and Assistant Secretary (since May 2001) of Prudential Investments LLC; Vice President and Assistant Secretary (since February 2001) of Prudential Mutual Fund Services LLC; formerly Vice President and Assistant Secretary (May 2003-June 2005) of AST Investment Services, Inc |
Claudia DiGiacomo* (42) Assistant Secretary Since 2005 | | Vice President and Corporate Counsel (since January 2005) of Prudential; Vice President and Assistant Secretary of Prudential Investments LLC (since December 2005); Associate at Sidley Austin Brown & Wood LLP (1999-2004). |
Andrew R. French* (53) Assistant Secretary Since 2006 | | Vice President and Corporate Counsel (since February 2010) of Prudential; formerly Director and Corporate Counsel (2006-2010) of Prudential; Vice President and Assistant Secretary (since January 2007) of Prudential Investments LLC; Vice President and Assistant Secretary (since January 2007) of Prudential Mutual Fund Services LLC. |
Kathleen DeNicholas* (42) Assistant Secretary Since 2013 | | Vice President and Corporate Counsel (since May 2013) of Prudential; Managing Counsel at The Bank of New York Mellon Corporation (2011-2013); formerly Senior Counsel (2007-2011) and Assistant General Counsel (2001-2007) of The Dreyfus Corporation; Chief Legal Officer and Secretary of MBSC Securities Corporation (2011-2013); Vice President and Assistant Secretary of The Dreyfus Family of Funds (2010-2012). |
M. Sadiq Peshimam* (53) Treasurer and Principal Financial & Accounting Officer Since 2014 | | Assistant Treasurer of funds in the Prudential Mutual Fund Complex (2006-2014); Vice President (since 2005) of Prudential Investments LLC. |
Peter Parrella* (58) Assistant Treasurer Since 2007 | | Vice President (since 2007) and Director (2004-2007) within Prudential Mutual Fund Administration; formerly Tax Manager at SSB Citi Fund Management LLC (1997-2004). |
Lana Lomuti* (49) Assistant Treasurer Since 2014 | | Vice President (since 2007) and Director (2005-2007), within Prudential Mutual Fund Administration; formerly Assistant Treasurer (December 2007-February 2014) of The Greater China Fund, Inc. |
Linda McMullin* (55) Assistant Treasurer Since 2014 | | Vice President (since 2011) and Director (2008-2011) within Prudential Mutual Fund Administration. |
Theresa C. Thompson* (54) Deputy Chief Compliance Officer Since 2008 | | Vice President, Compliance, Prudential Investments LLC (since April 2004); and Director, Compliance, Prudential Investments LLC (2001-2004). |
Charles H. Smith* (44) Anti-Money Laundering Compliance Officer Since 2016 | | Vice President, Corporate Compliance, Anti-Money Laundering Unit (since January 2015) of Prudential; committee member of the American Council of Life Insurers Anti-Money Laundering and Critical Infrastructure Committee (since January 2016); formerly Global Head of Economic Sanctions Compliance at AIG Property Casualty (February 2007-December 2014); Assistant Attorney General at the New York State Attorney General’s Office, Division of Public Advocacy. (August 1998-January 2007) |
* The address for each officer is c/o Prudential Investments LLC, 655 Broad Street, Newark, New Jersey 07102.
1 Excludes Mr. Cronin, an Interested Director who serves as President. Biographical and other information with respect to Mr. Cronin appears under “Interested Director,” above.
E3
Variable contracts contain exclusions, limitations, reductions of benefits, and terms for keeping them in force. For costs and complete details, refer to your contract or contact your licensed financial professional. Contract guarantees are based on the claims-paying ability of the issuing company.
Prudential’s Gibraltar Fund, Inc. is distributed by Prudential Investment Management Services LLC (PIMS), 655 Broad Street, 19th Floor, Newark, NJ 07102, member SIPC, a Prudential Financial company and solely responsible for its own financial condition and contractual obligations.
The Prudential Insurance Company of America
751 Broad Street
Newark, NJ 07102-3777
The Audited Financial Statements of The Prudential Insurance Company of America are available upon request. You may call 888-778-2888 to obtain a free copy of the Audited Financial Statements.
For service-related questions, please contact the Annuity Service Center at 888-778-2888.
©2017 Prudential Financial, Inc. and its related entities. Prudential Investments, the Prudential logo, the Rock symbol, and Bring Your Challenges are service marks of Prudential Financial, Inc. and its related entities, registered in many jurisdictions worldwide.
FSP-AR
Item 2 – Code of Ethics – – See Exhibit (a)
As of the end of the period covered by this report, the registrant has adopted a code of ethics (the “Section 406 Standards for Investment Companies – Ethical Standards for Principal Executive and Financial Officers”) that applies to the registrant’s Principal Executive Officer and Principal Financial Officer; the registrant’s Principal Financial Officer also serves as the Principal Accounting Officer.
The registrant hereby undertakes to provide any person, without charge, upon request, a copy of the code of ethics. To request a copy of the code of ethics, contact the registrant 973-367-7521, and ask for a copy of the Section 406 Standards for Investment Companies - Ethical Standards for Principal Executive and Financial Officers.
Item 3 – Audit Committee Financial Expert –
The registrant’s Board has determined that Mr. Thomas M. O’Brien, member of the Board’s Audit Committee is an “audit committee financial expert,” and that he is “independent,” for purposes of this Item.
Item 4 – Principal Accountant Fees and Services –
(a) Audit Fees
For the fiscal years ended December 31, 2016 and December 31, 2015, KPMG LLP (“KPMG”), the Registrant’s principal accountant, billed the Registrant $26,400 and $26,350, respectively, for professional services rendered for the audit of the Registrant’s annual financial statements or services that are normally provided in connection with statutory and regulatory filings.
(b) Audit-Related Fees
For the fiscal years ended December 31, 2016 and December 31, 2015: none.
(c) Tax Fees
For the fiscal years ended December 31, 2016 and December 31, 2015: none.
(d) All Other Fees
For the fiscal years ended December 31, 2016 and December 31, 2015: none.
(e) (1) Audit Committee Pre-Approval Policies and Procedures
THE PRUDENTIAL MUTUAL FUNDS
AUDIT COMMITTEE POLICY
on
Pre-Approval of Services Provided by the Independent Accountants
The Audit Committee of each Prudential Mutual Fund is charged with the responsibility to monitor the independence of the Fund’s independent accountants. As part of this responsibility, the Audit Committee must pre-approve the independent accounting firm’s engagement to render audit and/or permissible non-audit services, as required by law. In evaluating a proposed engagement of the independent accountants, the Audit Committee will assess the effect that the engagement might reasonably be expected to have on the accountant’s independence. The Committee’s evaluation will be based on:
| | • | | a review of the nature of the professional services expected to be provided, |
| | • | | a review of the safeguards put into place by the accounting firm to safeguard independence, and |
| | • | | periodic meetings with the accounting firm. |
Policy for Audit and Non-Audit Services Provided to the Funds
On an annual basis, the scope of audits for each Fund, audit fees and expenses, and audit-related and non-audit services (and fees proposed in respect thereof) proposed to be performed by the Fund’s independent accountants will be presented by the Treasurer and the independent accountants to the Audit Committee for review and, as appropriate, approval prior to the initiation of such services. Such presentation shall be accompanied by confirmation by both the Treasurer and the independent accountants that the proposed non-audit services will not adversely affect the independence of the independent accountants. Such proposed non-audit services shall be described in sufficient detail to enable the Audit Committee to assess the appropriateness of such services and fees, and the compatibility of the provision of such services with the auditor’s independence. The Committee shall receive periodic reports on the progress of the audit and other services which are approved by the Committee or by the Committee Chair pursuant to authority delegated in this Policy.
The categories of services enumerated under “Audit Services”, “Audit-related Services”, and “Tax Services” are intended to provide guidance to the Treasurer and the independent accountants as to those categories of services which the Committee believes are generally consistent with the independence of the independent accountants and which the Committee (or the Committee Chair) would expect upon the presentation of specific proposals to pre-approve. The enumerated categories are not intended as an exclusive list of audit, audit-related or tax services, which the Committee (or the Committee Chair) would consider for pre-approval.
Audit Services
The following categories of audit services are considered to be consistent with the role of the Fund’s independent accountants:
| | Ø | Annual Fund financial statement audits |
| | Ø | Seed audits (related to new product filings, as required) |
| | Ø | SEC and regulatory filings and consents |
Audit-related Services
The following categories of audit-related services are considered to be consistent with the role of the Fund’s independent accountants:
| | Ø | Accounting consultations |
| | Ø | Fund merger support services |
| | Ø | Agreed Upon Procedure Reports |
| | Ø | Other Internal Control Reports |
Individual audit-related services that fall within one of these categories (except for fund merger support services) and are not presented to the Audit Committee as part of the annual pre-approval process are subject to an authorized pre-approval by the Audit Committee so long as the estimated fee for those services does not exceed $30,000. Any services provided under such pre-approval will be reported to the Audit Committee at its next regular meeting. Should the amount of such services exceed $30,000 any additional fees will be subject to pre-approval by the Committee Chair (or any other Committee member on whom this responsibility has been delegated). Fees related to fund merger support services are subject to a separate authorized pre-approval by the Audit Committee with fees determined on a per occurrence and merger complexity basis.
Tax Services
The following categories of tax services are considered to be consistent with the role of the Fund’s independent accountants:
| | Ø | Tax compliance services related to the filing or amendment of the following: |
| | ◾ | | Federal, state and local income tax compliance; and, |
| | ◾ | | Sales and use tax compliance |
| | Ø | Timely RIC qualification reviews |
| | Ø | Tax distribution analysis and planning |
| | Ø | Tax authority examination services |
| | Ø | Tax appeals support services |
| | Ø | Accounting methods studies |
| | Ø | Fund merger support services |
| | Ø | Tax consulting services and related projects |
Individual tax services that fall within one of these categories and are not presented to the Audit Committee as part of the annual pre-approval process are subject to an authorized pre-approval by the Audit Committee so long as the estimated fee for those services does not exceed $30,000. Any services provided under such pre-approval will be reported to the Audit Committee at its next regular meeting. Should the amount of such services exceed $30,000 any additional fees will be subject to pre-approval by the Committee Chair (or any other Committee member on whom this responsibility has been delegated).
Other Non-Audit Services
Certain non-audit services that the independent accountants are legally permitted to render will be subject to pre-approval by the Committee or by one or more Committee members to whom the Committee has delegated this authority and who will report to the full Committee any pre-approval decisions made pursuant to this Policy. Non-audit services presented for pre-approval pursuant to this paragraph will be accompanied by a confirmation from both the Treasurer and the independent accountants that the proposed services will not adversely affect the independence of the independent accountants.
Proscribed Services
The Fund’s independent accountants will not render services in the following categories of non-audit services:
| | |
| Ø | | Bookkeeping or other services related to the accounting records or financial statements of the Fund |
| Ø | | Financial information systems design and implementation |
| Ø | | Appraisal or valuation services, fairness opinions, or contribution-in-kind reports |
| Ø | | Actuarial services |
| Ø | | Internal audit outsourcing services |
| Ø | | Management functions or human resources |
| Ø | | Broker or dealer, investment adviser, or investment banking services |
| Ø | | Legal services and expert services unrelated to the audit |
| Ø | | Any other service that the Public Company Accounting Oversight Board determines, by regulation, is impermissible. |
Pre-approval of Non-Audit Services Provided to Other Entities Within the Prudential Fund Complex
Certain non-audit services provided to Prudential Investments LLC or any of its affiliates that also provide ongoing services to the Prudential Mutual Funds will be subject to pre-approval by the Audit Committee. The only non-audit services provided to these entities that will require pre-approval are those related directly to the operations and financial reporting of the Funds. Individual projects that are not presented to the Audit Committee as part of the annual pre-approval process will be subject to pre-approval by the Committee Chair (or any other Committee member on whom this responsibility has been delegated) so long as the estimated fee for those services does not exceed $30,000. Services presented for pre-approval pursuant to this paragraph will be accompanied by a confirmation from both the Treasurer and the independent accountants that the proposed services will not adversely affect the independence of the independent accountants.
Although the Audit Committee will not pre-approve all services provided to Prudential Investments LLC and its affiliates, the Committee will receive an annual report from the Fund’s independent accounting firm showing the aggregate fees for all services provided to Prudential Investments and its affiliates.
(e) (2) Percentage of services referred to in 4(b) – 4(d) that were approved by the audit committee –
For the fiscal years ended December 31, 2016 and December 31, 2015: none.
(f) Percentage of hours expended attributable to work performed by other than full time employees of principal accountant if greater than 50%.
The percentage of hours expended on the principal accountant’s engagement to audit the registrant’s financial statements for the most recent fiscal year that were attributed to work performed by persons other than the principal accountant’s full-time, permanent employees was 0%.
(g) Non-Audit Fees
The aggregate non-audit fees billed by KPMG for services rendered to the registrant’s investment adviser and any entity controlling, controlled by, or under common control with the investment adviser that provides ongoing services to the registrant for the fiscal years ended December 31, 2016 and December 31, 2015 was $0 and $0, respectively.
(h) Principal Accountant’s Independence
Not applicable as KPMG has not provided non-audit services to the registrant’s investment adviser and any entity controlling, controlled by, or under common control with the investment adviser that provides ongoing services to the registrant that were not pre-approved pursuant to Rule 2-01(c)(7)(ii) of Regulation S-X.
Item 5 – Audit Committee of Listed Registrants – Not applicable.
| Item 6 – | Schedule of Investments – The schedule is included as part of the report to shareholders filed under Item 1 of this Form. |
| Item 7 – | Disclosure of Proxy Voting Policies and Procedures for Closed-End Management Investment Companies – Not applicable. |
| Item 8 – | Portfolio Managers of Closed-End Management Investment Companies – Not applicable. |
| Item 9 – | Purchases of Equity Securities by Closed-End Management Investment Company and Affiliated Purchasers – Not applicable. |
Item 10 – Submission of Matters to a Vote of Security Holders – Not applicable.
Item 11 – Controls and Procedures
| | (a) | It is the conclusion of the registrant’s principal executive officer and principal financial officer that the effectiveness of the registrant’s current disclosure controls and procedures (such disclosure controls and procedures having been evaluated within 90 days of the date of this filing) provide reasonable assurance that the information required to be disclosed by the registrant has been recorded, processed, summarized and reported within the time period specified in the Commission’s rules and forms and that the information required to be disclosed by the registrant has been accumulated and communicated to the registrant’s principal executive officer and principal financial officer in order to allow timely decisions regarding required disclosure. |
| | (b) | There has been no significant change in the registrant’s internal control over financial reporting that occurred during the registrant’s most recent fiscal quarter of the period covered by this report that has materially affected, or is likely to materially affect, the registrant’s internal control over financial reporting. |
Item 12 – Exhibits
| | (a) | (1) Code of Ethics – Attached hereto as Exhibit EX-99.CODE-ETH |
| | (2) | Certifications pursuant to Section 302 of the Sarbanes-Oxley Act – Attached hereto as Exhibit EX-99.CERT. |
| | (3) | Any written solicitation to purchase securities under Rule 23c-1. – Not applicable. |
| | (b) | Certifications pursuant to Section 906 of the Sarbanes-Oxley Act – Attached hereto as Exhibit EX-99.906CERT. |
SIGNATURES
Pursuant to the requirements of the Securities Exchange Act of 1934 and the Investment Company Act of 1940, the registrant has duly caused this report to be signed on its behalf by the undersigned, thereunto duly authorized.
| | |
| Registrant: | | Prudential’s Gibraltar Fund, Inc. |
| |
| By: | | /s/Deborah A. Docs |
| | Deborah A. Docs |
| | Secretary |
| |
| Date: | | February 14, 2017 |
Pursuant to the requirements of the Securities Exchange Act of 1934 and the Investment Company Act of 1940, this report has been signed below by the following persons on behalf of the registrant and in the capacities and on the dates indicated.
| | |
| By: | | /s/Timothy S. Cronin |
| | Timothy S. Cronin |
| | President and Principal Executive Officer |
| |
| Date: | | February 14, 2017 |
| |
| By: | | /s/M. Sadiq Peshimam |
| | M. Sadiq Peshimam |
| | Treasurer and Principal Financial and Accounting Officer |
| |
| Date: | | February 14, 2017 |