UNITED STATES
SECURITIES AND EXCHANGE COMMISSION
Washington, D.C. 20549
FORMN-CSR
CERTIFIED SHAREHOLDER REPORT OF REGISTERED MANAGEMENT INVESTMENT COMPANIES
| | |
| Investment Company Act file number: | | 811-01660 |
| |
| Exact name of registrant as specified in charter: | | Prudential’s Gibraltar Fund, Inc. |
| |
| Address of principal executive offices: | | 655 Broad Street, 17th Floor |
| | Newark, New Jersey 07102 |
| |
| Name and address of agent for service: | | Andrew R. French |
| | 655 Broad Street, 17th Floor |
| | Newark, New Jersey 07102 |
| |
| Registrant’s telephone number, including area code: | | 800-225-1852 |
| |
| Date of fiscal year end: | | 12/31/2019 |
| |
| Date of reporting period: | | 12/31/2019 |
Item 1 – Reports to Stockholders
Prudential’s Gibraltar Fund, Inc.
| | |
| ANNUAL REPORT | | December 31, 2019 |

This report provides financial information about Prudential’s Gibraltar Fund, Inc. (the Fund), an investment option under your variable contract.
The views expressed in this report and information about the Fund’s portfolio holdings are for the period covered by this report and are subject to change thereafter.

Investors should carefully consider the contract and the Fund’s investment objective, risks, and charges and expenses before investing. The contract and the Fund prospectus contain information relating to investment objectives, risks, and charges and expenses, as well as other important information. Read them carefully before investing or sending money.
Information regarding how the Fund voted proxies relating to portfolio securities during the most recent 12-month period ended June 30 is available on the website of the Securities and Exchange Commission (the Commission) atwww.sec.gov.
The Fund files with the Commission a complete listing of portfolio holdings as of its first and third calendar quarter-end on Form N-PORT. Form N-PORT is available on the Commission’s website at www.sec.gov or call (800) SEC-0330.
The Fund’s Statement of Additional Information contains additional information about the Fund’s Directors and is available without charge upon request by calling (888)778-2888.
| | | | |
Prudential’s Gibraltar Fund, Inc. Table of Contents | | Annual Report | | December 31, 2019 |
| | ∎ | | REPORT OF THE INVESTMENT MANAGERS AND PRESENTATION OF PORTFOLIO HOLDINGS |
| | | | |
| Section A | | Schedule of Investments and Financial Statements |
| Section B | | Notes to Financial Statements |
| Section C | | Financial Highlights |
| Section D | | Report of Independent Registered Public Accounting Firm |
| Section E | | Information about Trustees and Officers |
| | | | |
Prudential’s Gibraltar Fund, Inc. Letter to Planholders | | Annual Report | | December 31, 2019 |
At Prudential, our primary objective is to help investors achieve and maintain long-term financial success. This Prudential’s Gibraltar Fund annual report outlines our efforts to achieve this goal. We hope you find it informative and useful.
Prudential has been building on a heritage of success for more than 135 years. We believe the array of our products provides a highly attractive value proposition to clients like you who are focused on financial security.
Your financial professional is the best resource to help you make the most informed investment decisions. Together, you can build a diversified investment portfolio that aligns with your long-term financial goals. Please keep in mind that diversification and asset allocation strategies do not assure a profit or protect against loss in declining markets.
Thank you for selecting Prudential as one of your financial partners. We value your trust and appreciate the opportunity to help you achieve financial security.
Sincerely,

Timothy S. Cronin
President,
Prudential’s Gibraltar Fund, Inc. | January 31, 2020 |
| | | | |
| Market Overview — unaudited | | Annual Report | | December 31, 2019 |
Equity Market Overview
US and international stock markets posted stellar returns in 2019 as many central banks, including the Federal Reserve (the Fed), cut interest rates or used other stimuli to spur growth. Although the markets fluctuated sharply at times in reaction to on-again-off-again trade tensions between the US and China, concerns about tariffs subsided later in the year.
In the US, the broad-based S&P 500® Index and Russell 3000® Index returned 31.46% and 31.02%, respectively, for the year. Internationally, the MSCI ACWI Ex-US Index, a broad measure of stock performance in developed and emerging markets outside the US, returned 21.51%. (All returns cited are in US dollars and include dividends.)
Global economic growth slowed, central banks cut rates
During 2019, the pace of global growth slowed and concerns about the economic outlook rose due in part to uncertainties regarding US-China tariffs and other geopolitical factors, which created a drag on manufacturing and export activity. Many central banks responded by loosening monetary policy — in some cases reversing their positions. For example, the Fed, which hiked rates four times in 2018, cut its federal funds rate target three times in 2019 and moved from tapering its balance sheet to expanding it through asset purchases. The European Central Bank, which had been rolling back its bond-buying program in 2018, restarted it to stimulate the eurozone economy.
Although US real gross domestic product (GDP) growth rose 2.1% (annualized) in the third quarter, down from 3.1% in the first quarter, the US economy expanded at a moderate pace. (Fourth-quarter GDP data had not been released when this overview was published.) Corporate earnings, consumer spending, and the labor market were strong, while inflation remained low.
Stock markets rallied, retreated, and rebounded to record highs
Early in the first quarter, stocks rallied as US-China trade negotiations appeared to be progressing, the Fed signaled that it planned to pause from hiking rates unless warranted, the US government’s partial shutdown ended, and corporate earnings rose sharply despite slower growth. The S&P 500 jumped nearly 8.0% in January alone.
Stocks sold off in May as trade-war worries resurfaced. However, equity markets rallied in June in anticipation of possible rate cuts and on hopes for a trade deal. During the first half of 2019, the Fed maintained its interest rate target.
Trade concerns re-emerged in the third quarter amid signs of slowing growth and renewed trade frictions. With inflation below its target, the Fed cut rates in July for the first time since the financial crisis in 2008 as a pre-emptive measure to help sustain the US economy’s expansion and withstand the risk of a global economic slowdown and further drop in business investment.
In August, concerns about tariffs, the growth of China’s industrial output, and the global economy intensified, driving investors toward less-risky investments like US Treasuries. The yield on the 10-year US Treasury note, which moves opposite to its price, briefly dropped below the rate on two-year Treasuries. Although many analysts didn’t interpret this particular “yield curve inversion” as indicative of a looming recession, as they often have in the past, stock prices — particularly in emerging markets — dropped sharply.
Although the Fed cut rates again in September and October to a range of 1.50%-1.75%, Chairman Jerome Powell conveyed that the central bank did not plan to cut rates further unless incoming information required its members to materially reassess their outlook for the economy. As expected, the Fed did not adjust rates through the remainder of the year.
During the fourth quarter, US stock indexes surged to new highs and emerging market stocks rallied amid reports the US and China were moving toward a “phase one” partial trade deal. (The agreement was signed in January 2020 after the reporting period ended.) Eurozone stock markets rose in reaction to improved economic results from Germany. United Kingdom investors were encouraged by the outcome of December elections that many hope will lead to a smoother potential exit of the UK from the European Union.
All S&P 500 sectors rose
The best-performing sectors in the S&P 500 were information technology (+50.3%), communication services (+32.7%), and financials (+32.1%). Next in line were industrials (+29.4%), real estate (+29.0%), consumer discretionary (+27.9%), consumer staples (+27.6%), utilities (+26.4%), materials (+24.6%), health care (+20.8%), and energy (+11.8%).
| | | | |
| Market Overview — unaudited(continued) | | Annual Report | | December 31, 2019 |
Growth outperformed value, large-cap stocks topped small caps
For the year, the Russell 3000® Growth Index returned 35.85%, outperforming the Russell 3000® Value Index, which rose 26.26%. Large-cap stocks, as measured by the Russell 1000® Index, rose 31.43%. The Russell Midcap® Index returned 30.54%, and the small-cap Russell 2000® Index lagged yet still returned 25.52%.
International stocks collectively rose but underperformed US equities
Stocks trading in emerging markets, as measured by the MSCI Emerging Markets Index, returned 18.4% for the year. Notable top-performing country components in the index included Russia (+50.9%), supported by a jump in oil prices, Taiwan (+36.4%), Brazil (+26.3%), and China (23.5%). Taiwan’s and China’s markets advanced in the fourth quarter as trade frictions diminished, although weak economic data from China dampened investor sentiment during the year. Notable countries that underperformed the index but still contributed positively to performance included South Korea (+12.5%), Mexico (+11.4%), and India (+7.6%). Malaysia (-2.0%) detracted from the index’s performance.
Equities in developed markets outside the US and Canada, as measured by the MSCI EAFE Index, rose 22.01%. For the year, the MSCI Europe Index rose 23.77%, the MSCI UK Index returned 21.05%, and the MSCI Japan Index rose 19.61%.
Fixed Income Market Overview
In 2019, for the first time in more than a decade, the Federal Reserve (the Fed) cut interest rates to help sustain the US economy’s expansion in the face of slowing global economic growth and US-China trade-war risks. The central bank was merely one of dozens that reduced rates throughout the year, igniting rallies in numerous global bond markets. During 2019, emerging markets debt, US high yield bonds, and corporate investment-grade bonds delivered robust returns, yet US government bonds and many other fixed income categories also posted solid results.
In the US, the economy grew at a healthy but slow pace. Although real gross domestic product (GDP) growth dropped from 3.1% (annualized) in the first quarter to 2.1% in the third, the economy continued to expand. (Fourth-quarter GDP data had not been released when this overview was published.) The national unemployment rate dropped to a 50-year low of 3.5% in September, corporate earnings were generally strong, and inflation remained low. Elsewhere, the European economy grew weakly. Notably, China’s growth rate dropped significantly from 6.6% in 2018 to 6.1% in 2019.
Bond markets fluctuated but closed higher
During the first quarter of 2019, global growth expectations softened. The Fed, which increased rates four times in 2018, signaled it would pause from hiking rates further based on its outlook at the time, sending bond markets higher. US high yield and emerging market bond prices rose sharply, supported by a tailwind of receding tariff worries and favorable corporate earnings.
In May, worries about the US-China trade war surfaced again. US Treasuries rallied while riskier assets such as high yield bonds dropped in price. The following month, however, the Fed hinted at the possibility of interest rate cuts ahead, trade fears cooled, and the high yield bond market rebounded. The Fed did not adjust rates during the first half of the year.
In July, the global economy showed signs of a slowdown and tariff fears returned. Later that month, for the first time since the financial crisis in 2008, the Fed cut rates as a pre-emptive measure to help sustain the expansion of the US economy and provide a cushion against the risk of a global economic slowdown. During August, the yield on 10-year US Treasuries dropped below yields on two-year Treasuries. Historically, when yields on longer-term Treasuries fall below yields on shorter-term issues, recessions have often followed. While many analysts questioned the “yield curve inversion” as a recessionary indicator in this instance, investors concerned about the economy gravitated to “safe-haven” securities like longer-term US Treasuries and other high-quality credits.
The investment-grade Bloomberg Barclays US Aggregate Bond Index returned 2.59% in August. US high yield bonds finished virtually flat, whereas emerging market sovereign debt markets dropped sharply due in part to a stronger US dollar versus most currencies.
In September, the Fed cut rates again and the European Central Bank restarted its bond-buying program to help stimulate the eurozone economy after rolling it back the previous year. After the Fed dropped its rate target to a range of 1.50% to 1.75% in October, Chairman Jerome Powell conveyed that the central bank had no plans for further cuts unless incoming data compelled its members to materially reassess their outlook for the economy. As expected, the Fed maintained its rate target through the remainder of the year.
During the fourth quarter, stronger-than-expected economic data and reports that the US and China were moving toward a “phase one” partial trade deal led to a “risk-on” rally. (The agreement was signed in January 2020 after the reporting period ended.) Over the final month of the year, high yield bonds and emerging markets bonds posted solid gains, while investment-grade US bonds dropped slightly.
| | | | |
| Market Overview — unaudited(continued) | | Annual Report | | December 31, 2019 |
Emerging market debt and high yield bonds surged by double digits
For the year, the Bloomberg Barclays Global Aggregate Bond Index (unhedged), which measures global investment-grade debt performance, returned 6.84%. (All returns cited are in US dollars.) Bonds trading in the US, based on the Bloomberg Barclays US Aggregate Bond Index, rose 8.72%. The US index’s leading component sectors included investment-grade corporate bonds (+14.5%), which benefited from the interest rate cuts and solid fundamentals, along with Treasury inflation-protected securities (+8.4%), commercial mortgage-backed securities (+8.3%), and US Treasury securities (+6.9%). Treasuries with longer maturities rallied in the second and third quarters when trade tensions escalated, which triggered a “flight to quality.” The 10-year US Treasury note’s yield, which moves opposite to its price, opened 2019 at approximately 2.65% and closed the year at 1.92% as trade tensions eased.
The Bloomberg Barclays Municipal Bond Index returned 7.54% for the year. US high yield bonds (debt rated below investment grade), as measured by the ICE BofAML US Cash High Yield Index, returned 14.40%. Accommodative monetary policies, strong corporate earnings, and investors’ quest for enhanced yield supported demand for high yield opportunities. Emerging market debt, based on the J.P. Morgan EMBI Global Diversified Index surged 15.04%. Despite a strong US dollar (relative to most currencies), sovereign debt yields in general drifted lower as inflation was contained in many countries, providing their central banks with latitude to reduce interest rates, which bolstered bond prices.
| | |
| Prudential’s Gibraltar Fund, Inc. | | December 31, 2019 |
Report of the Investment Manager - As of December 31, 2019 (Unaudited)
| | | | | | | | | | | | |
Average Annual Total
Returns | | 1 Year | | | 5 Years | | | 10 Years | |
Fund | | | 33.13 | % | | | 16.50 | % | | | 14.88 | % |
S&P 500 Index | | | 31.46 | | | | 11.69 | | | | 13.55 | |
Past performance is no guarantee of future returns. The investment return and principal value of an investment will fluctuate, so that shares, when redeemed, may be worth more or less than their original cost. Current performance may be lower or higher than the past performance.
Fund performance is net of fund expenses, but not contract charges, which, if included, would significantly lower the performance quoted.
$10,000 INVESTED OVER 10 YEARS
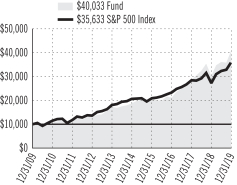
For the year ended December 31, 2019, Prudential’s Gibraltar Fund returned 33.13%. The Fund outperformed the S&P 500 Index.
The investment objective of the Fund is growth of capital to the extent compatible with a concern for preservation of principal.
What were the market conditions during the reporting period?
US equities markets were highly volatile in 2019, unsettled byUS-China trade discord; softening economic growth in the US, Europe, and China; and geopolitical uncertainty. Companies across market sectors cited trade tensions as the source of heightened caution in planning and investing. The US political landscape was likewise unsettled, as investigations of interference in the 2016 presidential election unfolded, impeachment hearings against President Trump proceeded, and the 2020 election cycle ramped up. US economic activity showed signs of tempering, with job growth and business activity moderating. Modest wage gains and positive consumption indicated a still-healthy consumer. Markets responded favorably as the US Federal Reserve pivoted on monetary policy, lowering the federal funds rate three times in the period to1.50%-1.75% at the end of the year.
The S&P 500 benchmark advanced strongly in 2019. Every sector in the Index rose, with information technology, communication services, and financial services outperforming the overall index. Gains in energy and health care were comparatively modest.
What strategies or holdings affected the Portfolio’s performance?
Consumer discretionary positions were strong positive contributors to the Portfolio’s absolute and relative performance. Nike Inc. generated impressive earnings, revenue, and gross margins on the strength of its execution and the Nike brand. The company’s growth opportunities includee-commerce and innovation in apparel and manufacturing technology. Tesla Inc. has a unique product cycle over the next few years as it leverages its electric vehicle powertrain and autonomous driving in more segments within the automotive industry, potentially driving strong growth. The company’s earnings and free cash flow beat consensus estimates significantly during the period on strong demand and higher margins, driven by solid sales of higher-priced Model 3 variants. AlibabaGroup Holding Ltd., one of the world’s largeste-commerce companies, benefited from significant revenue synergies of its various segments, laying the groundwork for strong, durabletop-line growth. French luxury group Kering SA benefited from positive earnings momentum, which reflected an increased focus on organic growth (through retail execution and product innovation), financial discipline, and free-cash-flow generation.
In financials,S&P Global Inc. benefited from secular trends such as debt market development abroad, disintermediation of securities markets, and passive investing. S&P’s financial services and business information units have solid fundamentals, significant barriers to entry, substantial recurring revenue, and attractive long-term growth opportunities.
Stock selection was also beneficial in consumer staples, where Costco Wholesale Corp. was helped by a consistent stream of membership fee income that allowed for low prices and broad product selection, which led to high inventory turnover. Elsewhere in staples, Constellation Brands Inc., a leading producer and seller of wine, beer, and spirits, was hurt by its equity stake in a Canadian cannabis company, which had greater-than-expected losses.
The Portfolio’s information technology holdings rose significantly but lagged the sector return within the benchmark. The fundamental strength of Apple Inc. reflects the proliferation of the iOS platform across the global mobile phone, tablet, and personal device landscape. With its huge installed base, Apple is benefiting from rapid growth in service business subscriptions — a key source of recurring revenue. In 2020, a potentially robust product cycle for Apple incorporates fifth-generation (5G) wireless standards. Payments companies continue to benefit from the long-term shift from cash to electronic credit and debit transactions. In particular, MasterCard Inc. and Visa Inc. maintain strong market positions with high barriers to entry, pricing power, and solid operating leverage potential. Microsoft Corp. and Adobe Inc. continue to offer mission-critical cloud-based applications and services that are creating fundamental changes in the way businesses operate.
For a complete list of holdings, refer to the Schedule of Investments section of this report.
1
| | |
Prudential’s Gibraltar Fund, Inc. | | December 31, 2019 |
Report of the Investment Manager - As of December 31, 2019 (Unaudited) (Continued)
Health care positions detracted from relative performance during the period. Worries about political overhangs, including discussions ofMedicare-for-All proposals and scrutiny of pharmaceutical costs from presidential candidates, created significant headwinds for insurers Cigna Corp. and UnitedHealth Group Inc.
The Portfolio’s position in energy exploration & production company Concho Resources Inc. was eliminated due to logistics constraints that caused weak pricing. The position in EOG Resources Inc., another energy company, was eliminated on a reduced growth outlook.
In materials, increased supply caused a drop in lithium prices, clouding the long-duration earnings power for Albemarle Corp. The Portfolio no longer holds a position in Albemarle.
Presentation of Portfolio Holdings — unaudited
| | | | | | |
| Prudential’s Gibraltar Fund, Inc. (As of 12/31/2019) | |
| Ten Largest Holdings | | Line of Business | | | (% of Net Assets | ) |
| Microsoft Corp. | | Software | | | 7.1% | |
| NIKE, Inc. (Class B Stock) | | Textiles, Apparel & Luxury Goods | | | 6.4% | |
| Mastercard, Inc. (Class A Stock) | | IT Services | | | 6.0% | |
| Visa, Inc. (Class A Stock) | | IT Services | | | 5.9% | |
| Amazon.com, Inc. | | Internet & Direct Marketing Retail | | | 5.2% | |
| salesforce.com, Inc. | | Software | | | 5.0% | |
| Adobe, Inc. | | Software | | | 4.2% | |
| Alphabet, Inc. (Class C Stock) | | Interactive Media & Services | | | 4.0% | |
| Costco Wholesale Corp. | | Food & Staples Retailing | | | 3.9% | |
| Facebook, Inc. (Class A Stock) | | Interactive Media & Services | | | 3.3% | |
For a complete list of holdings, please refer to the Schedule of Investments section of this report. Holdings reflect only long-term investments. Credit Quality/Country Allocation/Holdings/Line of Business are subject to change.
2
| | |
Prudential’s Gibraltar Fund, Inc. Benchmark Glossary — unaudited | | December 31, 2019 |
The indexes are unmanaged and include reinvestment of any income or distributions. They do not reflect any fees, expenses or sales charges. Investors cannot invest directly in a market index.
S&P 500 Index is an unmanaged, market value-weighted index of over 500 stocks generally representative of the broad stock market.
| | |
Prudential’s Gibraltar Fund, Inc. Fees and Expenses — unaudited | | December 31, 2019 |
As a Planholder investing in the Fund through a variable contract, you incur ongoing costs, including management fees, and other Fund expenses. This example is intended to help you understand your ongoing costs (in dollars) of investing in the Fund and to compare these costs with the ongoing costs of investing in other investment options. This example does not reflect fees and charges under your contract. If contract charges were included, the costs shown below would be higher. Please consult your contract for more information about contract fees and charges.
The example is based on an investment of $1,000 invested at the beginning of the period and held for the entire period July 1, 2019 through December 31, 2019.
Actual Expenses
The first line of the table below provides information about actual account values and actual expenses. You may use this information, together with the amount you invested, to estimate the Fund expenses that you paid over the period. Simply divide your account value by $1,000 (for example, an $8,600 account value divided by $1,000 = 8.6), then multiply the result by the number in the first line under the heading entitled “Expenses Paid During the Six-Month Period” to estimate the Fund expenses you paid on your account during this period. As noted above, the table does not reflect variable contract fees and charges.
Hypothetical Example for Comparison Purposes
The second line of the table below provides information about hypothetical account values and hypothetical expenses based on the Fund’s actual expense ratio and an assumed rate of return of 5% per year before expenses, which is not the Fund’s actual return. The hypothetical account values and expenses may not be used to estimate the actual ending account balance or expenses you paid for the period. You may use this information to compare the ongoing costs of investing in the Fund and other investment options. To do so, compare this 5% hypothetical example with the 5% hypothetical examples that appear in the shareholder reports of the other investment options.
Please note that the expenses shown in the table are meant to highlight your ongoing Fund costs only and do not reflect any contract fees and charges, such as sales charges (loads), insurance charges or administrative charges. Therefore the second line of the table is useful to compare ongoing investment option costs only, and will not help you determine the relative total costs of owning different contracts. In addition, if these contract fees and charges were included, your costs would have been higher.
| | | | | | | | | | | | | | | | | | |
| Prudential’s Gibraltar Fund, Inc. | | Beginning
Account Value
July 1, 2019 | | | Ending
Account Value
December 31, 2019 | | | Annualized Expense
Ratio based on the
Six-Month period | | | Expenses Paid
During the
Six-Month period* | |
| | | | | |
| Prudential's Gibraltar Fund, Inc. | | Actual | | $ | 1,000.00 | | | $ | 1,113.40 | | | | 0.62 | % | | $ | 3.30 | |
| | Hypothetical | | $ | 1,000.00 | | | $ | 1,022.08 | | | | 0.62 | % | | $ | 3.16 | |
* Fund expenses (net of fee waivers or subsidies, if any) are equal to the annualized expense ratio (provided in the table), multiplied by the average account value over the period, multiplied by the 184 days in the six-month period ended December 31, 2019, and divided by the 365 days in the Fund’s fiscal year ended December 31, 2019 (to reflect the six-month period). Expenses presented in the table include the expenses of any underlying portfolios in which the Fund may invest.
| | | | | | |
| | |
| | PRUDENTIAL’S GIBRALTAR FUND, INC. | | |
| | | | | | |
| |
| SCHEDULE OF INVESTMENTS | | as of December 31, 2019 |
| | | | | | | | |
| LONG-TERM INVESTMENTS — 96.5% | | | | |
| COMMON STOCKS | | Shares | | | Value | |
Aerospace & Defense — 2.8% | |
Airbus SE (France), ADR | | | 19,587 | | | $ | 719,822 | |
Boeing Co. (The) | | | 13,218 | | | | 4,305,896 | |
| | | | | | | | |
| | | | | | | 5,025,718 | |
| | | | | | | | |
Automobiles — 3.3% | | | | | | | | |
Tesla, Inc.*(a) | | | 14,209 | | | | 5,944,051 | |
| | | | | | | | |
Banks — 2.5% | | | | | | | | |
JPMorgan Chase & Co. | | | 31,724 | | | | 4,422,326 | |
| | | | | | | | |
Beverages — 1.7% | | | | | | | | |
Constellation Brands, Inc. (Class A Stock) | | | 16,142 | | | | 3,062,945 | |
| | | | | | | | |
Biotechnology — 3.1% | | | | | | | | |
Alexion Pharmaceuticals, Inc.* | | | 20,481 | | | | 2,215,020 | |
BioMarin Pharmaceutical, Inc.* | | | 19,305 | | | | 1,632,238 | |
Vertex Pharmaceuticals, Inc.* | | | 7,993 | | | | 1,750,067 | |
| | | | | | | | |
| | | | | | | 5,597,325 | |
| | | | | | | | |
Capital Markets — 1.8% | | | | | | | | |
S&P Global, Inc. | | | 11,461 | | | | 3,129,426 | |
| | | | | | | | |
Food & Staples Retailing — 3.9% | | | | | | | | |
Costco Wholesale Corp. | | | 23,851 | | | | 7,010,286 | |
| | | | | | | | |
Food Products — 1.3% | | | | | | | | |
Mondelez International, Inc.
(Class A Stock) | | | 40,971 | | | | 2,256,683 | |
| | | | | | | | |
Health Care Equipment & Supplies — 1.6% | | | | | |
Abbott Laboratories | | | 32,211 | | | | 2,797,847 | |
| | | | | | | | |
Hotels, Restaurants & Leisure — 2.3% | | | | | |
Marriott International, Inc.
(Class A Stock) | | | 27,037 | | | | 4,094,213 | |
| | | | | | | | |
Interactive Media & Services — 9.6% | | | | | |
Alphabet, Inc. (Class A Stock)* | | | 3,049 | | | | 4,083,800 | |
Alphabet, Inc. (Class C Stock)* | | | 5,284 | | | | 7,064,814 | |
Facebook, Inc. (Class A Stock)* | | | 28,993 | | | | 5,950,813 | |
| | | | | | | | |
| | | | | | | 17,099,427 | |
| | | | | | | | |
Internet & Direct Marketing Retail — 8.5% | | | | | |
Alibaba Group Holding Ltd.
(China), ADR* | | | 27,530 | | | | 5,839,113 | |
Amazon.com, Inc.* | | | 5,037 | | | | 9,307,570 | |
| | | | | | | | |
| | | | | | | 15,146,683 | |
| | | | | | | | |
IT Services — 15.2% | | | | | | | | |
FleetCor Technologies, Inc.* | | | 12,065 | | | | 3,471,342 | |
Mastercard, Inc. (Class A Stock) | | | 35,588 | | | | 10,626,221 | |
Shopify, Inc. (Canada) (Class A Stock)* | | | 5,742 | | | | 2,282,904 | |
Visa, Inc. (Class A Stock)(a) | | | 56,167 | | | | 10,553,779 | |
| | | | | | | | |
| | | | | | | 26,934,246 | |
| | | | | | | | |
Life Sciences Tools & Services — 2.9% | | | | | |
Illumina, Inc.* | | | 15,817 | | | | 5,247,132 | |
| | | | | | | | |
Pharmaceuticals — 3.0% | | | | | | | | |
AstraZeneca PLC (United Kingdom), ADR | | | 108,237 | | | | 5,396,697 | |
| | | | | | | | |
| | | | | | | | |
COMMON STOCKS (continued) | | Shares | | | Value | |
Semiconductors & Semiconductor Equipment — 1.6% | |
QUALCOMM, Inc. | | | 31,720 | | | $ | 2,798,656 | |
| | | | | | | | |
Software — 17.5% | | | | | | | | |
Adobe, Inc.* | | | 22,545 | | | | 7,435,566 | |
Microsoft Corp. | | | 79,831 | | | | 12,589,349 | |
salesforce.com, Inc.* | | | 54,547 | | | | 8,871,524 | |
Splunk, Inc.*(a) | | | 14,260 | | | | 2,135,720 | |
| | | | | | | | |
| | | | | | | 31,032,159 | |
| | | | | | | | |
Specialty Retail — 1.5% | | | | | | | | |
Home Depot, Inc. (The) | | | 12,351 | | | | 2,697,211 | |
| | | | | | | | |
Technology Hardware, Storage & Peripherals — 3.3% | |
Apple, Inc. | | | 19,690 | | | | 5,781,968 | |
| | | | | | | | |
Textiles, Apparel & Luxury Goods — 9.1% | | | | | |
Kering SA (France), ADR | | | 74,544 | | | | 4,872,196 | |
NIKE, Inc. (Class B Stock) | | | 111,483 | | | | 11,294,343 | |
| | | | | | | | |
| | | | | | | 16,166,539 | |
| | | | | | | | |
TOTAL LONG-TERM INVESTMENTS
(cost $62,957,770) | | | | 171,641,538 | |
| | | | | | | | |
|
| SHORT-TERM INVESTMENTS — 13.1% | |
AFFILIATED MUTUAL FUNDS | |
PGIM Core Ultra Short Bond Fund(w) | | | 6,122,590 | | | | 6,122,590 | |
PGIM Institutional Money Market Fund (cost $17,116,113; includes $17,090,604 of cash collateral for securities on loan)(b)(w) | | | 17,114,884 | | | | 17,118,307 | |
| | | | | | | | |
TOTAL SHORT-TERM INVESTMENTS
(cost $23,238,703) | | | | 23,240,897 | |
| | | | | | | | |
TOTAL INVESTMENTS — 109.6%
(cost $86,196,473) | | | | 194,882,435 | |
LIABILITIES IN EXCESS OF
OTHER ASSETS — (9.6)% | | | | (17,132,808 | ) |
| | | | | | | | |
NET ASSETS — 100.0% | | | $ | 177,749,627 | |
| | | | | | | | |
Below is a list of the abbreviation(s) used in the annual report:
| | |
| ADR | | American Depositary Receipt |
| LIBOR | | London Interbank Offered Rate |
| * | Non-income producing security. |
| (a) | All or a portion of security is on loan. The aggregate market value of such securities, including those sold and pending settlement, is $16,797,613; cash collateral of $17,090,604 (included in liabilities) was received with which the Fund purchased highly liquid short-term investments. |
| (b) | Represents security purchased with cash collateral received for securities on loan and includes dividend reinvestment. |
| (w) | PGIM Investments LLC, the manager of the Fund, also serves as manager of the PGIM Core Ultra Short Bond Fund and PGIM Institutional Money Market Fund. |
SEE NOTES TO FINANCIAL STATEMENTS.
A1
| | | | | | |
| | |
| | PRUDENTIAL’S GIBRALTAR FUND, INC. (continued) | | |
| | | | | | |
| |
| SCHEDULE OF INVESTMENTS | | as of December 31, 2019 |
Fair Value Measurements:
Various inputs are used in determining the value of the Fund’s investments. These inputs are summarized in the three broad levels listed below.
| Level 1— | unadjusted quoted prices generally in active markets for identical securities. |
| Level 2— | quoted prices for similar securities, interest rates and yield curves, prepayment speeds, foreign currency exchange rates and other observable inputs. |
| Level 3— | unobservable inputs for securities valued in accordance with Board approved fair valuation procedures. |
The following is a summary of the inputs used as of December 31, 2019 in valuing such portfolio securities:
| | | | | | | | | | | | |
| | | Level 1 | | | Level 2 | | | Level 3 | |
Investments in Securities | | | | | | | | | | | | |
Assets | | | | | | | | | | | | |
Common Stocks | | | | | | | | | | | | |
Aerospace & Defense | | $ | 5,025,718 | | | $ | — | | | $ | — | |
Automobiles | | | 5,944,051 | | | | — | | | | — | |
Banks | | | 4,422,326 | | | | — | | | | — | |
Beverages | | | 3,062,945 | | | | — | | | | — | |
Biotechnology | | | 5,597,325 | | | | — | | | | — | |
Capital Markets | | | 3,129,426 | | | | — | | | | — | |
Food & Staples Retailing | | | 7,010,286 | | | | — | | | | — | |
Food Products | | | 2,256,683 | | | | — | | | | — | |
Health Care Equipment & Supplies | | | 2,797,847 | | | | — | | | | — | |
Hotels, Restaurants & Leisure | | | 4,094,213 | | | | — | | | | — | |
Interactive Media & Services | | | 17,099,427 | | | | — | | | | — | |
Internet & Direct Marketing Retail | | | 15,146,683 | | | | — | | | | — | |
IT Services | | | 26,934,246 | | | | — | | | | — | |
Life Sciences Tools & Services | | | 5,247,132 | | | | — | | | | — | |
Pharmaceuticals | | | 5,396,697 | | | | — | | | | — | |
Semiconductors & Semiconductor Equipment | | | 2,798,656 | | | | — | | | | — | |
Software | | | 31,032,159 | | | | — | | | | — | |
Specialty Retail | | | 2,697,211 | | | | — | | | | — | |
Technology Hardware, Storage & Peripherals | | | 5,781,968 | | | | — | | | | — | |
Textiles, Apparel & Luxury Goods | | | 16,166,539 | | | | — | | | | — | |
Affiliated Mutual Funds | | | 23,240,897 | | | | — | | | | — | |
| | | | | | | | | | | | |
Total | | $ | 194,882,435 | | | $ | — | | | $ | — | |
| | | | | | | | | | | | |
Industry Classification:
The industry classification of investments and liabilities in excess of other assets shown as a percentage of net assets as of December 31, 2019 were as follows (unaudited):
| | | | |
Software | | | 17.5 | % |
IT Services | | | 15.2 | |
Affiliated Mutual Funds (9.6% represents investmentspurchased with collateral from securities on loan) | | | 13.1 | |
Interactive Media & Services | | | 9.6 | |
Textiles, Apparel & Luxury Goods | | | 9.1 | |
Internet & Direct Marketing Retail | | | 8.5 | |
Food & Staples Retailing | | | 3.9 | |
Automobiles | | | 3.3 | |
Technology Hardware, Storage & Peripherals | | | 3.3 | |
Biotechnology | | | 3.1 | |
Pharmaceuticals | | | 3.0 | |
Life Sciences Tools & Services | | | 2.9 | |
Aerospace & Defense | | | 2.8 | |
| | | | |
Banks | | | 2.5 | % |
Hotels, Restaurants & Leisure | | | 2.3 | |
Capital Markets | | | 1.8 | |
Beverages | | | 1.7 | |
Semiconductors & Semiconductor Equipment | | | 1.6 | |
Health Care Equipment & Supplies | | | 1.6 | |
Specialty Retail | | | 1.5 | |
Food Products | | | 1.3 | |
| | | | |
| | | 109.6 | |
Liabilities in excess of other assets | | | (9.6 | ) |
| | | | |
| | | 100.0 | % |
| | | | |
SEE NOTES TO FINANCIAL STATEMENTS.
A2
| | | | | | |
| | |
| | PRUDENTIAL’S GIBRALTAR FUND, INC. (continued) | | |
| | | | | | |
| |
| SCHEDULE OF INVESTMENTS | | as of December 31, 2019 |
Financial Instruments/Transactions — Summary of Offsetting and Netting Arrangements:
The Fund entered into financial instruments/transactions during the reporting period that are either offset in accordance with current requirements or are subject to enforceable master netting arrangements or similar agreements that permit offsetting. The information about offsetting and related netting arrangements for financial instruments/transactions where the legal right to set-off exists is presented in the summary below.
Offsetting of financial instrument/transaction assets and liabilities:
| | | | | | | | | | | | |
Description | | Gross Market
Value of
Recognized
Assets/(Liabilities) | | | Collateral
Pledged/(Received)(1) | | | Net
Amount | |
Securities on Loan | | $ | 16,797,613 | | | $ | (16,797,613 | ) | | $ | — | |
| | | | | | | | | | | | |
| (1) | Collateral amount disclosed by the Fund is limited to the market value of financial instruments/transactions. |
SEE NOTES TO FINANCIAL STATEMENTS.
A3
| | | | | | |
| | |
| | PRUDENTIAL’S GIBRALTAR FUND, INC. (continued) | | |
STATEMENT OF ASSETS AND LIABILITIES
as of December 31, 2019
| | | | |
| ASSETS | | | | |
Investments at value, including securities on loan of $16,797,613: | | | | |
Unaffiliated investments (cost $62,957,770) | | $ | 171,641,538 | |
Affiliated investments (cost $23,238,703) | | | 23,240,897 | |
Tax reclaim receivable | | | 52,323 | |
Dividends and interest receivable | | | 39,991 | |
Prepaid expenses | | | 1,514 | |
| | | | |
Total Assets | | | 194,976,263 | |
| | | | |
| LIABILITIES | | | | |
Payable to broker for collateral for securities onloan | | | 17,090,604 | |
Management fee payable | | | 81,343 | |
Accrued expenses and other liabilities | | | 54,689 | |
| | | | |
Total Liabilities | | | 17,226,636 | |
| | | | |
| NET ASSETS | | $ | 177,749,627 | |
| | | | |
Net assets were comprised of: | | | | |
Shares of beneficial interest, at par | | $ | 89,340 | |
Paid-in capital in excess of par | | | 62,289,816 | |
Total distributable earnings (loss) | | | 115,370,471 | |
| | | | |
Net assets, December 31, 2019 | | $ | 177,749,627 | |
| | | | |
Net asset value and redemption price per share, $177,749,627 / 8,933,967 outstanding shares ofcommon stock (authorized 75,000,000 shares) | | $ | 19.90 | |
| | | | |
STATEMENT OF OPERATIONS
Year Ended December 31, 2019
| | | | |
| NET INVESTMENT INCOME (L OSS) INCOME | | | | |
Unaffiliated dividend income (net of $18,356 foreignwithholding tax) | | $ | 1,311,518 | |
Affiliated dividend income | | | 106,755 | |
Income from securities lending, net (includingaffiliated income of $31,314) | | | 31,670 | |
| | | | |
Total income | | | 1,449,943 | |
| | | | |
| EXPENSES | | | | |
Management fee | | | 918,358 | |
Custodian and accounting fees | | | 49,244 | |
Audit fee | | | 27,200 | |
Legal fees and expenses. | | | 12,625 | |
Directors’ fees | | | 11,918 | |
Miscellaneous | | | 18,471 | |
| | | | |
Total expenses | | | 1,037,816 | |
| | | | |
| NET INVESTMENT INCOME (LOSS) | | | 412,127 | |
| | | | |
| REALIZED AND UNREALIZED GAIN (LOSS) ON INVESTMENT TRANSACTIONS | | | | |
Net realized gain (loss ) on investment transactions (including affiliated of $(1,070)) | | | 18,539,006 | |
Net change in unrealized appreciation (depreciation)on investments (including affiliated of $2,222) | | | 28,343,626 | |
| | | | |
| NET GAIN (LOSS) ON INVESTMENT TRANSACTIONS | | | 46,882,632 | |
| | | | |
| NET INCREASE (DECREASE) IN NET ASSETS RESULTING FROM OPERATIONS | | $ | 47,294,759 | |
| | | | |
STATEMENTS OF CHANGES IN NET ASSETS
| | | | | | | | |
| | | Year Ended | | | Year Ended | |
| | | December 31, 2019 | | | December 31, 2018 | |
| INCREASE (DECREASE) IN NET ASSETS OPERATIONS | | | | | | | | |
Net investment income (loss) | | $ | 412,127 | | | $ | 427,788 | |
Net realized gain (loss) on investment transactions. | | | 18,539,006 | | | | 14,896,455 | |
Net change in unrealized appreciation (depreciation) on investments | | | 28,343,626 | | | | (6,339,764 | ) |
| | | | | | | | |
NET INCREASE (DECREASE) IN NET ASSETS RESULTING FROM OPERATIONS | | | 47,294,759 | | | | 8,984,479 | |
| | | | | | | | |
| DIVIDENDS AND DISTRIBUTIONS | | | | | | | | |
Distributions from distributable earnings | | | (14,368,059 | ) | | | (15,149,087 | ) |
| | | | | | | | |
| CAPITAL STOCK TRANSACTIONS | | | | | | | | |
Capital stock sold [0 and 2,560 shares, respectively] | | | — | | | | 47,851 | |
Capital stock issued in reinvestment of dividends [748,932 and 870,933 shares, respectively] | | | 14,368,059 | | | | 15,149,087 | |
Capital stock repurchased [1,064,221 and 983,606 shares, respectively] | | | (20,350,076 | ) | | | (19,008,505 | ) |
| | | | | | | | |
NET INCREASE (DECREASE) IN NET ASSETS FROM CAPITAL STOCK TRANSACTIONS | | | (5,982,017 | ) | | | (3,811,567 | ) |
| | | | | | | | |
| TOTAL INCREASE (DECREASE) | | | 26,944,683 | | | | (9,976,175 | ) |
| NET ASSETS: | | | | | | | | |
Beginning of year | | | 150,804,944 | | | | 160,781,119 | |
| | | | | | | | |
End of year. | | $ | 177,749,627 | | | $ | 150,804,944 | |
| | | | | | | | |
SEE NOTES TO FINANCIAL STATEMENTS.
A4
NOTES TO FINANCIAL STATEMENTS
Prudential’s Gibraltar Fund, Inc. (the “Fund”) was originally incorporated in the State of Delaware on March 14, 1968 and was reincorporated in the State of Maryland effective May 1, 1997. It is registered as an open-end, diversified management investment company under the Investment Company Act of 1940, as amended (“1940 Act”). The Fund was organized by The Prudential Insurance Company of America (“PICA”) to serve as the investment medium for the variable contract accounts of The Prudential Financial Security Program (“FSP”). The Fund does not sell its shares to the public. The accounts will redeem shares of the Fund to the extent necessary to provide benefits under the contracts or for such other purposes as may be consistent with the contracts.
The investment objective of the Fund is growth of capital to the extent compatible with a concern for preservation of principal.
The Fund follows the investment company accounting and reporting guidance of the Financial Accounting Standards Board (“FASB”) Accounting Standard Codification (“ASC”) Topic 946 Financial Services — Investment Companies. The following accounting policies conform to U.S. generally accepted accounting principles. The Fund consistently follows such policies in the preparation of its financial statements.
Securities Valuation: The Fund holds securities and other assets and liabilities that are fair valued at the close of each day (generally, 4:00 PM Eastern time) the New York Stock Exchange (“NYSE”) is open for trading. Fair value is the price that would be received to sell an asset or paid to transfer a liability in an orderly transaction between market participants on the measurement date. The Fund’s Board of Directors (the “Board”) has adopted valuation procedures for security valuation under which fair valuation responsibilities have been delegated to PGIM Investments LLC (“PGIM Investments” or the “Manager”). Pursuant to the Board’s delegation, the Manager has established a Valuation Committee responsible for supervising the fair valuation of portfolio securities and other assets and liabilities. The valuation procedures permit the Fund to utilize independent pricing vendor services, quotations from market makers, and alternative valuation methods when market quotations are either not readily available or not deemed representative of fair value. A record of the Valuation Committee’s actions is subject to the Board’s review, approval, and ratification at its next regularly scheduled quarterly meeting.
For the fiscal reporting year-end, securities and other assets and liabilities were fair valued at the close of the last U.S. business day. Trading in certain foreign securities may occur when the NYSE is closed (including weekends and holidays). Because such foreign securities trade in markets that are open on weekends and U.S. holidays, the values of some of the Fund’s foreign investments may change on days when investors cannot purchase or redeem Fund shares.
Various inputs determine how the Fund’s investments are valued, all of which are categorized according to the three broad levels (Level 1, 2, or 3) detailed in the Schedule of Investments and referred to herein as the “fair value hierarchy” in accordance with FASB ASC Topic 820 — Fair Value Measurements and Disclosures.
Common and preferred stocks, exchange-traded funds, and derivative instruments, such as futures or options, that are traded on a national securities exchange are valued at the last sale price as of the close of trading on the applicable exchange where the security principally trades. Securities traded via NASDAQ are valued at the NASDAQ official closing price. To the extent these securities are valued at the last sale price or NASDAQ official closing price, they are classified as Level 1 in the fair value hierarchy. In the event that no sale or official closing price on valuation date exists, these securities are generally valued at the mean between the last reported bid and ask prices, or at the last bid price in the absence of an ask price. These securities are classified as Level 2 in the fair value hierarchy.
Investments in open-end, non-exchange-traded mutual funds are valued at their net asset values as of the close of the NYSE on the date of valuation. These securities are classified as Level 1 in the fair value hierarchy since they may be purchased or sold at their net asset values on the date of valuation.
Securities and other assets that cannot be priced according to the methods described above are valued based on pricing methodologies approved by the Board. In the event that unobservable inputs are used when determining such valuations, the securities will be classified as Level 3 in the fair value hierarchy.
When determining the fair value of securities, some of the factors influencing the valuation include: the nature of any restrictions on disposition of the securities; assessment of the general liquidity of the securities; the issuer’s financial condition and the markets in which it does business; the cost of the investment; the size of the holding and
B1
the capitalization of the issuer; the prices of any recent transactions or bids/offers for such securities or any comparable securities; any available analyst media or other reports or information deemed reliable by the Manager regarding the issuer or the markets or industry in which it operates. Using fair value to price securities may result in a value that is different from a security’s most recent closing price and from the price used by other unaffiliated mutual funds to calculate their net asset values.
Illiquid Securities: Pursuant to Rule 22e-4 under the 1940 Act, the Fund has adopted a Board approved Liquidity Risk Management Program (“LRMP”) that requires, among other things, that the Fund limit its illiquid investments that are assets to no more than 15% of net assets. Illiquid securities are those that, because of the absence of a readily available market or due to legal or contractual restrictions on resale, may not reasonably be expected to be sold or disposed of in current market conditions in seven calendar days or less without the sale or disposition significantly changing the market value of the investment. The Fund may find it difficult to sell illiquid securities at the time considered most advantageous by its subadviser(s) and may incur transaction costs that would not be incurred in the sale of securities that were freely marketable.
Restricted Securities: Securities acquired in unregistered, private sales from the issuing company or from an affiliate of the issuer are considered restricted as to disposition under federal securities law (“restricted securities”). Such restricted securities are valued pursuant to the valuation procedures noted above. Restricted securities that would otherwise be considered illiquid investments pursuant to the Fund’s LRMP because of legal restrictions on resale to the general public may be traded among qualified institutional buyers under Rule 144A of the Securities Act of 1933. Therefore, these Rule 144A securities, as well as commercial paper that is sold in private placements under Section 4(2) of the Securities Act of 1933, may be classified higher than “illiquid” under the LRMP (i.e. “moderately liquid” or “less liquid” investments). However, the liquidity of the Fund’s investments in restricted securities could be impaired if trading does not develop or declines.
Master Netting Arrangements: The Fund is subject to various Master Agreements, or netting arrangements, with select counterparties. These are agreements which a subadviser may have negotiated and entered into on behalf of all or a portion of the Fund. A master netting arrangement between the Fund and the counterparty permits the Fund to offset amounts payable by the Fund to the same counterparty against amounts to be received; and by the receipt of collateral from the counterparty by the Fund to cover the Fund’s exposure to the counterparty. However, there is no assurance that such mitigating factors are easily enforceable. In addition to master netting arrangements, the right to set-off exists when all the conditions are met such that each of the parties owes the other determinable amounts, the reporting party has the right to set-off the amount owed with the amount owed by the other party, the reporting party intends to set-off and the right of set-off is enforceable by law. During the reporting period, there was no intention to settle on a net basis and all amounts are presented on a gross basis on the Statement of Assets and Liabilities.
Securities Lending: The Fund lends its portfolio securities to banks and broker-dealers. The loans are secured by collateral at least equal to the market value of the securities loaned. Collateral pledged by each borrower is invested in an affiliated money market fund and is marked to market daily, based on the previous day’s market value, such that the value of the collateral exceeds the value of the loaned securities. In the event of significant appreciation in value of securities on loan on the last business day of the reporting period, the financial statements may reflect a collateral value that is less than the market value of the loaned securities. Such shortfall is remedied as described above. Loans are subject to termination at the option of the borrower or the Fund. Upon termination of the loan, the borrower will return to the Fund securities identical to the loaned securities. Should the borrower of the securities fail financially, the Fund has the right to repurchase the securities in the open market using the collateral.
The Fund recognizes income, net of any rebate and securities lending agent fees, for lending its securities in the form of fees or interest on the investment of any cash received as collateral. The borrower receives all interest and dividends from the securities loaned and such payments are passed back to the lender in amounts equivalent thereto. The Fund also continues to recognize any unrealized gain (loss) in the market price of the securities loaned and on the change in the value of the collateral invested that may occur during the term of the loan. In addition, realized gain (loss) is recognized on changes in the value of the collateral invested upon liquidation of the collateral. Net earnings from securities lending are disclosed in the Statement of Operations.
Securities Transactions and Net Investment Income: Securities transactions are recorded on the trade date. Realized gains (losses) from investment and currency transactions are calculated on the specific identification method. Dividend income is recorded on the ex-date, or for certain foreign securities, when the Fund becomes
B2
aware of such dividends. Interest income, including amortization of premium and accretion of discount on debt securities, as required, is recorded on the accrual basis. Expenses are recorded on an accrual basis, which may require the use of certain estimates by management that may differ from actual.
Taxes: It is the Fund’s policy to continue to meet the requirements of the Internal Revenue Code applicable to regulated investment companies and to distribute all of its taxable net investment income and capital gains, if any, to its shareholders. Therefore, no federal income tax provision is required. Withholding taxes on foreign dividends, interest and capital gains, if any, are recorded, net of reclaimable amounts, at the time the related income is earned.
Dividends and Distributions: The Fund expects to pay dividends from net investment income semi-annually and distributions from net realized capital gains, if any, at least annually. Dividends and distributions to shareholders, which are determined in accordance with federal income tax regulations and which may differ from generally accepted accounting principles, are recorded on the ex-date. Permanent book/tax differences relating to income and gain (loss) are reclassified between total distributable earnings (loss) and paid-in capital in excess of par, as appropriate.
Estimates: The preparation of financial statements requires management to make estimates and assumptions that affect the reported amounts and disclosures in the financial statements. Actual results could differ from those estimates.
The Fund has a management agreement with PGIM Investments. Pursuant to this agreement, the Manager has responsibility for all investment advisory services and supervises the subadviser’s performance of such services. PGIM Investments has entered into a subadvisory agreement with Jennison Associates LLC (“Jennison”) (the “Subadviser”), under which provides that Jennison will furnish investment advisory services in connection with the management of the Fund. In connection therewith, Jennison is obligated to keep certain books and records of the Fund. PGIM Investments pays for the services of the Subadviser, the cost of compensation of officers of the Fund, costs related to shareholder reporting, occupancy and certain clerical and administrative expenses of the Fund. The Fund bears all other costs and expenses.
The management fee paid to the Manager is accrued daily and payable monthly at an annual rate of 0.55% of the Fund’s average daily net assets of the Fund. All amounts paid or payable by the Fund to the Manager, under the agreement, are reflected in the Statement of Operations.
The Fund has a distribution agreement with Prudential Investment Management Services LLC (“PIMS”), which acts as the distributor of the shares of the Fund. No distribution or service fees are paid to PIMS as distributor of shares of the Fund.
The Fund has entered into brokerage commission recapture agreements with certain registered broker-dealers. Under the brokerage commission recapture program, a portion of the commission is returned to the Fund. Such amounts are included within realized gain (loss) on investment transactions presented in the Statement of Operations. For the reporting period ended December 31, 2019, brokerage commission recaptured under these agreements was $2,272.
PGIM Investments, PICA, PIMS and Jennison are indirect, wholly-owned subsidiaries of Prudential Financial, Inc.
| 3. | | Other Transactions with Affiliates |
The Fund may invest its overnight sweep cash in the PGIM Core Ultra Short Bond Fund (the “Core Fund”), and its securities lending cash collateral in the PGIM Institutional Money Market Fund (formerly known as Prudential Institutional Money Market Fund) (the “Money Market Fund”), each a series of Prudential Investment Portfolios 2, registered under the 1940 Act and managed by PGIM Investments. Through the Fund’s investments in the mentioned underlying funds, PGIM Investments and/or its affiliates are paid fees or reimbursed for providing their services. In addition to the realized and unrealized gains on investments in the Core Fund and Money Market Fund, earnings from such investments are disclosed on the Statement of Operations as “Affiliated dividend income” and “Income from securities lending, net”, respectively.
The Fund may enter into certain securities purchase or sale transactions under Board approved Rule 17a-7 procedures. Rule 17a-7 is an exemptive rule under the 1940 Act, that subject to certain conditions, permits purchase and sale transactions among affiliated investment companies, or between an investment company and
B3
a person that is affiliated solely by reason of having a common (or affiliated) investment adviser, common directors, and/or common officers. Pursuant to the Rule 17a-7 procedures and consistent with guidance issued by the SEC, the Fund’s Chief Compliance Officer (“CCO”) prepares a quarterly summary of all such transactions for submission to the Board, together with the CCO’s written representation that all such 17a-7 transactions were effected in accordance with the Fund’s Rule 17a-7 procedures. For the year ended December 31, 2019, no 17a-7 transactions were entered into by the Fund.
The aggregate cost of purchases and proceeds from sales of portfolio securities (excluding short-term investments and U.S. Government securities) for the year ended December 31, 2019, were $26,717,864 and $51,780,253, respectively.
A summary of the cost of purchases and proceeds from sales of shares of affiliated investments for the year ended December 31, 2019, is presented as follows:
| | | | | | | | | | | | | | | | | | | | | | | | | | | | | | |
Value,
Beginning of Year | | | Cost of
Purchases | | | Proceeds
from Sales | | | Change in
Unrealized
Gain
(Loss) | | | Realized
Gain
(Loss) | | | Value,
End
of Year | | | Shares,
End
of Year | | | Income | |
| | PGIM Core Ultra Short Bond Fund* | | | | | | | | | | | | | | | | | | | | | |
| | $ 987,041 | | | $ | 41,614,913 | | | $ | 36,479,364 | | | $ | — | | | $ | — | | | $ | 6,122,590 | | | | 6,122,590 | | | $ | 106,755 | |
| | PGIM Institutional Money Market Fund* | | | | | | | | | | | | | | | | | | | | | |
| | 5,440,479 | | | | 131,734,805 | | | | 120,058,129 | | | | 2,222 | | | | (1,070 | ) | | | 17,118,307 | | | | 17,114,884 | | | | 31,314 | ** |
| | | | | | | | | | | | | | | | | | | | | | | | | | | | | | |
| | $6,427,520 | | | $ | 173,349,718 | | | $ | 156,537,493 | | | $ | 2,222 | | | $ | (1,070 | ) | | $ | 23,240,897 | | | | | | | $ | 138,069 | |
| | | | | | | | | | | | | | | | | | | | | | | | | | | | | | |
| | * | The Fund did not have any capital gain distributions during the reporting period. |
| | ** | Represents the affiliated amount of securities lending income shown on the Statement of Operations. |
| 5. | | Distributions and Tax Information |
Distributions to shareholders, which are determined in accordance with federal income tax regulations and which may differ from generally accepted accounting principles, are recorded on the ex-date.
For the year ended December 31, 2019, the tax character of dividends paid by the Fund were $368,395 of ordinary income and $13,999,664 of long-term capital gains. For the year ended December 31, 2018, the tax character of dividends paid by the Fund were $1,393,821 of ordinary income and $13,755,266 of long-term capital gains.
As of December 31, 2019, the accumulated undistributed earnings on a tax basis were $99,252 of ordinary income and $6,585,966 of long-term capital gains.
The United States federal income tax basis of the Fund’s investments and the net unrealized appreciation as of December 31, 2019 were as follows:
| | | | | | | | | | | | |
Tax Basis | | Gross
Unrealized
Appreciation | | | Gross
Unrealized
Depreciation | | | Net
Unrealized
Appreciation | |
| $86,197,182 | | $ | 109,319,609 | | | $ | (634,356 | ) | | $ | 108,685,253 | |
The difference between book basis and tax basis is primarily attributable to deferred losses on wash sales.
The Manager has analyzed the Fund’s tax positions taken on federal, state and local income tax returns for all open tax years and has concluded that no provision for income tax is required in the Fund’s financial statements for the current reporting period. Since tax authorities can examine previously filed tax returns, the Fund’s U.S. federal and state tax returns for each of the four fiscal years up to the most recent fiscal year ended December 31, 2019 are subject to such review.
B4
The Fund, along with other affiliated registered investment companies (the “Funds”), is a party to a Syndicated Credit Agreement (“SCA”) with a group of banks. The purpose of the SCA is to provide an alternative source of temporary funding for capital share redemptions. The table below provides details of the current SCA in effect at the reporting period-end as well as the prior SCA.
| | | | |
| | | Current SCA | | Prior SCA |
| Term of Commitment | | 10/3/2019 – 10/1/2020 | | 10/4/2018 – 10/2/2019 |
| Total Commitment | | $ 900 million | | $ 900 million |
| Annualized Commitment Fee on the Unused Portion of the SCA | | 0.15% | | 0.15% |
| Annualized Interest Rate on Borrowings | | 1.20% plus the higher of (1) the effective federal funds rate, (2) the one-month LIBOR rate or (3) zero percent | | 1.25% plus the higher of (1) the effective federal funds rate, (2) the one-month LIBOR rate or (3) zero percent |
Certain affiliated registered investment companies that are parties to the SCA include portfolios that are subject to a predetermined mathematical formula used to manage certain benefit guarantees offered under variable annuity contracts. The formula may result in large scale asset flows into and out of these portfolios. Consequently, these portfolios may be more likely to utilize the SCA for purposes of funding redemptions. It may be possible for those portfolios to fully exhaust the committed amount of the SCA, thereby requiring the Manager to allocate available funding per a Board-approved methodology designed to treat the Funds in the SCA equitably.
The Fund did not utilize the SCA during the year ended December 31, 2019.
| 7. | | Ownership and Affiliates |
Pursuant to the Fund’s Articles of Incorporation, the Fund is authorized to issue 75,000,000 shares, with a par value of $0.01 per share, and an aggregate par value of $750,000.
As of December 31, 2019, all shares of record of the Fund were owned by PICA on behalf of the owners of the three variable insurance products: Prudential’s Investment Plan Account, Prudential’s Annuity Plan Account and Prudential’s Annuity Plan Account-2.
| 8. | | Risks of Investing in the Fund |
The Fund’s risks include, but are not limited to, some or all of the risks discussed below:
Equity and Equity-Related Securities Risks: The value of a particular security could go down and you could lose money. In addition to an individual security losing value, the value of the equity markets or a sector in which the Fund invests could go down. The Fund’s holdings can vary significantly from broad market indexes and the performance of the Fund can deviate from the performance of these indexes. Different parts of a market can react differently to adverse issuer, market, regulatory, political and economic developments.
Market and Credit Risk: Securities markets may be volatile and the market prices of the Fund’s securities may decline. Securities fluctuate in price based on changes in an issuer’s financial condition and overall market and economic conditions. If the market prices of the securities owned by the Fund fall, the value of an investment in the Fund will decline. Additionally, the Fund may also be exposed to credit risk in the event that an issuer or guarantor fails to perform or that an institution or entity with which the Fund has unsettled or open transactions defaults.
| 9. | | Recent Accounting Pronouncements and Reporting Updates |
In August 2018, the FASB issued Accounting Standards Update (“ASU”) No. 2018-13, which changes certain fair value measurement disclosure requirements. The new ASU, in addition to other modifications and additions, removes the requirement to disclose the amount and reasons for transfers between Level 1 and Level 2 of the fair value hierarchy, and the Fund’s policy for the timing of transfers between levels. The amendments are effective for financial statements issued for fiscal years beginning after December 15, 2019, and interim periods within those fiscal years. The Manager has evaluated the implications of certain provisions of the ASU and has adopted the aspects related to the removal and modification of certain fair value measurement disclosures under the ASU. The Manager continues to evaluate certain other provisions of the ASU and does not expect a material impact to financial statement disclosures.
B5
Financial Highlights
| | | | | | | | | | | | | | | | | | | | |
| | | Prudential’s Gibraltar Fund, Inc. | |
| | | Year Ended December 31, | |
| | | 2019 | | | 2018 | | | 2017 | | | 2016 | | | 2015 | |
Per Share Operating Performance: | | | | | | | | | | | | | | | | | | | | |
Net Asset Value, beginning of year. | | $ | 16.30 | | | $ | 17.18 | | | $ | 14.31 | | | $ | 15.64 | | | $ | 15.24 | |
| | | | | | | | | | | | | | | | | | | | |
Income (Loss) From Investment Operations: | | | | | | | | | | | | | | | | | | | | |
Net investment income (loss) | | | 0.05 | | | | 0.05 | | | | 0.05 | | | | 0.03 | | | | 0.02 | |
Net realized and unrealized gain (loss) on investment transactions | | | 5.26 | | | | 0.83 | | | | 5.11 | | | | 0.05 | | | | 1.92 | |
| | | | | | | | | | | | | | | | | | | | |
Total from investment operations | | | 5.31 | | | | 0.88 | | | | 5.16 | | | | 0.08 | | | | 1.94 | |
| | | | | | | | | | | | | | | | | | | | |
Less Dividends and Distributions: | | | | | | | | | | | | | | | | | | | | |
Dividends from net investment income | | | (0.04 | ) | | | (0.04 | ) | | | (0.05 | ) | | | (0.03 | ) | | | (0.03 | ) |
Distributions from net realized gains on investments | | | (1.67 | ) | | | (1.72 | ) | | | (2.24 | ) | | | (1.38 | ) | | | (1.51 | ) |
| | | | | | | | | | | | | | | | | | | | |
Total dividends and distributions | | | (1.71 | ) | | | (1.76 | ) | | | (2.29 | ) | | | (1.41 | ) | | | (1.54 | ) |
| | | | | | | | | | | | | | | | | | | | |
Net Asset Value, end of year | | $ | 19.90 | | | $ | 16.30 | | | $ | 17.18 | | | $ | 14.31 | | | $ | 15.64 | |
| | | | | | | | | | | | | | | | | | | | |
Total Return(a) | | | 33.13 | % | | | 4.61 | % | | | 36.24 | % | | | 0.39 | % | | | 12.65 | % |
Ratios/Supplemental Data: | | | | | | | | | | | | | | | | | | | | |
Net assets, end of year (in millions) | | $ | 178 | | | $ | 151 | | | $ | 161 | | | $ | 143 | | | $ | 159 | |
Average net assets (in millions) | | $ | 167 | | | $ | 171 | | | $ | 158 | | | $ | 146 | | | $ | 162 | |
Ratios to average net assets(b): | | | | | | | | | | | | | | | | | | | | |
Expenses after waivers and/or expense reimbursement | | | 0.62 | % | | | 0.61 | % | | | 0.62 | % | | | 0.62 | % | | | 0.62 | % |
Expenses before waivers and/or expense reimbursement | | | 0.62 | % | | | 0.61 | % | | | 0.62 | % | | | 0.62 | % | | | 0.62 | % |
Net investment income (loss) | | | 0.25 | % | | | 0.25 | % | | | 0.29 | % | | | 0.19 | % | | | 0.14 | % |
Portfolio turnover rate(c) | | | 16 | % | | | 12 | % | | | 16 | % | | | 21 | % | | | 22 | % |
| (a) | Total return is calculated assuming a purchase of a share on the first day and a sale on the last day of each year reported and includes reinvestment of distributions, if any, and does not reflect the effect of insurance contract charges. Total return does not reflect expenses associated with the separate account such as administrative fees, account charges and surrender charges which, if reflected, would reduce the total returns for all years shown. Performance figures may reflect fee waivers and/or expense reimbursements. In the absence of fee waivers and/or expense reimbursements, the total return would be lower. Past performance is no guarantee of future results. Total returns may reflect adjustments to conform to generally accepted accounting principles. |
| (b) | Does not include expenses of the underlying funds in which the Fund invests. |
| (c) | The Fund’s portfolio turnover rate is calculated in accordance with regulatory requirements, without regard to transactions involving short-term investments and certain derivatives. If such transactions were included, the Fund’s portfolio turnover rate may be higher. |
SEE NOTES TO FINANCIAL STATEMENTS.
C10
REPORT OF INDEPENDENT REGISTERED PUBLIC ACCOUNTING FIRM
TO THE SHAREHOLDERS AND BOARD OF DIRECTORS
PRUDENTIAL’S GIBRALTAR FUND, INC.:
Opinion on the Financial Statements
We have audited the accompanying statement of assets and liabilities of Prudential’s Gibraltar Fund, Inc. (the Fund), including the schedule of investments, as of December 31, 2019, the related statement of operations for the year then ended, the statements of changes in net assets for each of the years in thetwo-year period then ended, and the related notes (collectively, the financial statements) and the financial highlights for each of the years indicated therein. In our opinion, the financial statements and financial highlights present fairly, in all material respects, the financial position of the Fund as of December 31, 2019, the results of its operations for the year then ended, the changes in its net assets for each of the years in thetwo-year period then ended, and the financial highlights for each of the years indicated therein, in conformity with U.S. generally accepted accounting principles.
Basis for Opinion
These financial statements and financial highlights are the responsibility of the Fund’s management. Our responsibility is to express an opinion on these financial statements and financial highlights based on our audits. We are a public accounting firm registered with the Public Company Accounting Oversight Board (United States) (PCAOB) and are required to be independent with respect to the Fund in accordance with the U.S. federal securities laws and the applicable rules and regulations of the Securities and Exchange Commission and the PCAOB.
We conducted our audits in accordance with the standards of the PCAOB. Those standards require that we plan and perform the audit to obtain reasonable assurance about whether the financial statements and financial highlights are free of material misstatement, whether due to error or fraud. Our audits included performing procedures to assess the risks of material misstatement of the financial statements and financial highlights, whether due to error or fraud, and performing procedures that respond to those risks. Such procedures included examining, on a test basis, evidence regarding the amounts and disclosures in the financial statements and financial highlights. Such procedures also included confirmation of securities owned as of December 31, 2019, by correspondence with the custodian, transfer agent, and brokers, or by other appropriate auditing procedures when replies were not received. Our audits also included evaluating the accounting principles used and significant estimates made by management, as well as evaluating the overall presentation of the financial statements and financial highlights. We believe that our audits provide a reasonable basis for our opinion.

We have served as the auditor of one or more PGIM and/or Prudential Insurance investment companies since 2003.
New York, New York
February 12, 2020
D1
FEDERAL INCOME TAX INFORMATION (unaudited)
We are advising you that during the year ended December 31, 2019, the Fund reports the maximum amount allowed per share but not less than $1.67 as a capital gain distribution in accordance with Section 852 (b)(3)(C) of the Internal Revenue Code.
For the year ended December 31, 2019, the Fund reports, in accordance with Section 854 of the Internal Revenue Code, the following percentages of the ordinary income distributions paid as 1) qualified dividend income (QDI); and 2) eligible for corporate dividends received deduction (DRD):
| | | | | | | | |
| | | QDI | | | DRD | |
Prudential’s Gibraltar Fund, Inc. | | | 99.49 | % | | | 99.04 | % |
D2
INFORMATION ABOUT DIRECTORS AND OFFICERS (Unaudited)
Information about the Directors and the officers of the Fund is set forth below. Directors who are not deemed to be “interested persons” of the Fund, as defined in the Investment Company Act of 1940 (1940 Act), are referred to as “Independent Directors.” Directors who are deemed to be “interested persons” of the Fund are referred to as “Interested Directors.” The Directors oversee the operations of the Fund and appoint officers who are responsible forday-to-day business decisions based on policies set by the Board.
| | | | | | |
| | | | |
| Independent Directors | | | | | | |
Name
Date of Birth
No. of Portfolios Overseen | | Principal Occupation(s) During Past Five Years | | Other Directorships Held | | Length of Board Service |
Susan Davenport Austin
10/19/1967
No. of Portfolios Overseen: 109 | | Chief Financial Officer of Grace Church School (Since September 2019); formerly Senior Managing Director of Brock Capital (2014-2019); formerly Vice Chairman (2013-2017), Senior Vice President and Chief Financial Officer (2007-2012) and Vice President of Strategic Planning and Treasurer (2002-2007) of Sheridan Broadcasting Corporation; formerly President of Sheridan Gospel Network (2004-2014); formerly Vice President, Goldman, Sachs & Co. (2000-2001); formerly Associate Director, Bear, Stearns & Co. Inc. (1997-2000); formerly Vice President, Salomon Brothers Inc. (1993-1997); Member of the Board of Directors, The MacDowell Colony (Since 2010); formerly Chairman (2011-2014), formerly Presiding Director(2014-2017) and currently a Member(2007-present) of the Board of Directors, Broadcast Music, Inc.; Member of the Board of Directors, Hubbard Radio, LLC (Since 2011); President, Candide Business Advisors, Inc. (Since 2011); formerly Member of the Board of Directors, National Association of Broadcasters (2004-2010). | | Director of NextEra Energy Partners, LP (NYSE: NEP) (Since February 2015); Director of Broadcast Music, Inc. (Since 2007). | | Since February 2011 |
Sherry S. Barrat
11/13/1949
No. of Portfolios Overseen: 109 | | Formerly Vice Chairman of Northern Trust Corporation (financial services and banking institution) (2011-June 2012); formerly President, Personal Financial Services, Northern Trust Corporation (2006-2010); formerly Chairman & CEO, Western US Region, Northern Trust Corporation (1999-2005); formerly President & CEO, Palm Beach/Martin County Region, Northern Trust. | | Director of NextEra Energy, Inc. (NYSE: NEE) (1998-Present); Director of Arthur J. Gallagher & Company (Since July 2013). | | Since January 2013 |
Jessica M. Bibliowicz
11/28/1959
No. of Portfolios Overseen: 109 | | Formerly Senior Adviser (2013-2019) of Bridge Growth Partners (private equity firm); formerly Director (2013-2016) of Realogy Holdings Corp. (residential real estate services); formerly Chief Executive Officer (1999-2013) of National Financial Partners (independent distributor of financial services products). | | Formerly Director (2006-2019) of The Asia-Pacific Fund, Inc.; Sotheby’s (Since 2014) (auction house andart-related finance). | | Since September 2014 |
Kay Ryan Booth
11/1/1950
No. of Portfolios Overseen: 109 | | Partner, Trinity Private Equity Group (Since September 2014); formerly, Managing Director of Cappello Waterfield & Co. LLC (2011-2014); formerly Vice Chair, Global Research, J.P. Morgan (financial services and investment banking institution) (June 2008-January 2009); formerly Global Director of Equity Research, Bear Stearns & Co., Inc. (financial services and investment banking institution) (1995-2008); formerly Associate Director of Equity Research, Bear Stearns & Co., Inc.(1987-1995). | | None. | | Since January 2013 |
Stephen M. Chipman
10/26/1961
No. of Portfolios Overseen: 109 | | Formerly Group Managing Director, International Expansion and Regional Managing Director, Americas of Vistra (June 2018-June 2019); formerly Chief Executive Officer and Director of Radius (2016-2018); formerly Senior Vice Chairman (January 2015-October 2015) and Chief Executive Officer (January 2010-December 2014) of Grant Thornton LLP. | | Non-Executive Chairman (Since September 2019) of Litera Microsystems. | | Since January 2018 |
E1
| | | | | | |
| | | | |
| Independent Directors | | | | | | |
Name
Date of Birth
No. of Portfolios Overseen | | Principal Occupation(s) During Past Five Years | | Other Directorships Held | | Length of Board Service |
Robert F. Gunia
12/15/1946
No. of Portfolios Overseen: 109 | | Formerly Director of ICI Mutual Insurance Company (June 2016-June 2019; June 2012-June 2015); formerly Chief Administrative Officer (September 1999-September 2009) and Executive Vice President (December 1996-September 2009) of PGIM Investments LLC; formerly Executive Vice President (March1999-September 2009) and Treasurer (May2000-September 2009) of Prudential Mutual Fund Services LLC; formerly President (April1999-December 2008) and Executive Vice President and Chief Operating Officer (December2008-December 2009) of Prudential Investment Management Services LLC; formerly Chief Administrative Officer, Executive Vice President and Director (May 2003-September 2009) of AST Investment Services, Inc. | | Formerly Director (1989-2019) of The Asia Pacific Fund, Inc. | | Since July 2003 |
Thomas T. Mooney
11/11/1941
No. of Portfolios Overseen: 109 | | Formerly Chief Executive Officer, Excell Partners, Inc. (2005-2007); founding partner of High Technology of Rochester and the Lennox Technology Center; formerly President of the Greater Rochester Metro Chamber of Commerce (1976-2004); formerly Rochester City Manager (1973); formerly Deputy Monroe County Executive (1974-1976). | | None. | | Since July 2003 |
Thomas M. O’Brien
12/5/1950
No. of Portfolios Overseen: 109 | | Vice Chairman of Emigrant Bank and President of its Naples Commercial Finance Division (Since October 2018); formerly Director, President and CEO Sun Bancorp, Inc. N.A. (NASDAQ: SNBC) and Sun National Bank (July 2014-February 2018); formerly Consultant, Valley National Bancorp, Inc. and Valley National Bank (January 2012-June 2012); formerly President and COO (November 2006-April 2017) and CEO (April 2007-December 2011) of State Bancorp, Inc. and State Bank; formerly Vice Chairman (January 1997-April 2000) of North Fork Bank; formerly President and Chief Executive Officer (December 1984-December 1996) of North Side Savings Bank; formerly President and Chief Executive Officer (May 2000-June 2006) Atlantic Bank of New York. | | Formerly Director, Sun Bancorp, Inc. N.A. (NASDAQ: SNBC) and Sun National Bank (July 2014-February 2018); formerly Director, BankUnited, Inc. and BankUnited N.A. (NYSE: BKU) (May 2012-April 2014); formerly Director (April 2008-January 2012) of Federal Home Loan Bank of New York; formerly Director (December1996-May 2000) of North Fork Bancorporation, Inc.; formerly Director (May2000-April 2006) of Atlantic Bank of New York; Director (November 2006-January 2012) of State Bancorp, Inc. (NASDAQ: STBC) and State Bank of Long Island. | | Since July 2003 |
| | | | |
| Interested Director | | | | | | |
Timothy S. Cronin
12/21/1965
No. of Portfolios Overseen: 109 | | Vice President of Prudential Annuities (Since June 2015); Senior Vice President of PGIM Investments LLC (Since May 2009); Chief Investment Officer and Strategist of Prudential Annuities (Since January 2004); Director of Investment & Research Strategy (Since February 1998); President of AST Investment Services, Inc. (Since June 2005). | | None. | | Since October 2009 |
| | | | |
| | | |
| Fund Officers(a) | | | | |
Name
Date of Birth
Position with the Fund | | Principal Occupation(s) During the Past Five Years | | Length of Service as Fund Officer |
Ken Allen
1/24/1969
Vice President | | Vice President of Investment Management (since December 2009) | | Since June 2019 |
E2
| | | | |
| | | |
| Fund Officers(a) | | | | |
Name
Date of Birth
Position with the Fund | | Principal Occupation(s) During the Past Five Years | | Length of Service as Fund Officer |
Raymond A. O’Hara
9/19/1955
Chief Legal Officer | | Vice President and Corporate Counsel (since July 2010) of Prudential Insurance Company of America (Prudential); Vice President (March 2011-Present) of Pruco Life Insurance Company and Pruco Life Insurance Company of New Jersey; Vice President and Corporate Counsel (March 2011-Present) of Prudential Annuities Life Assurance Corporation; Chief Legal Officer of PGIM Investments LLC (since June 2012); Chief Legal Officer of Prudential Mutual Fund Services LLC (since June 2012) and Corporate Counsel of AST Investment Services, Inc. (since June 2012); formerly Assistant Vice President and Corporate Counsel (September 2008-July 2010) of The Hartford Financial Services Group, Inc.; formerly Associate (September 1980-December 1987) and Partner (January 1988-August 2008) of Blazzard & Hasenauer, P.C. (formerly, Blazzard, Grodd & Hasenauer, P.C.). | | Since June 2012 |
Andrew R. French
12/22/1962
Secretary | | Vice President within PGIM Investments LLC (December2018-Present); formerly Vice President and Corporate Counsel (February 2010-December 2018) of Prudential; formerly Director and Corporate Counsel (2006-2010) of Prudential; Vice President and Assistant Secretary (since January 2007) of PGIM Investments LLC; Vice President and Assistant Secretary (since January 2007) of Prudential Mutual Fund Services LLC. | | Since October 2006 |
Jonathan D. Shain
8/9/1958
Assistant Secretary | | Vice President and Corporate Counsel (since August 1998) of Prudential; Vice President and Assistant Secretary (since May 2001) of PGIM Investments LLC; Vice President and Assistant Secretary (since February 2001) of Prudential Mutual Fund Services LLC; formerly Vice President and Assistant Secretary (May 2003-June 2005) of AST Investment Services, Inc. | | Since May 2005 |
Claudia DiGiacomo
10/14/1974
Assistant Secretary | | Vice President and Corporate Counsel (since January 2005) of Prudential; Vice President and Assistant Secretary of PGIM Investments LLC (since December 2005); Associate at Sidley Austin Brown Wood LLP (1999-2004). | | Since December 2005 |
Melissa Gonzalez
2/10/1980
Assistant Secretary | | Vice President and Corporate Counsel (since September 2018) of Prudential; formerly Director and Corporate Counsel (March2014-September 2018) of Prudential. | | Since March 2019 |
Dino Capasso
8/19/1974
Chief Compliance Officer | | Chief Compliance Officer (July 2019-Present) of PGIM Investments LLC; Chief Compliance Officer (July 2019-Present) of the PGIM Funds, Target Funds, Advanced Series Trust, The Prudential Series Fund, Prudential’s Gibraltar Fund, Inc., PGIM Global High Yield Fund, Inc., and PGIM High Yield Bond Fund, Inc., ;Vice President and Deputy Chief Compliance Officer (June 2017-July 2019) of PGIM Investments LLC; formerly, Senior Vice President and Senior Counsel (January 2016-June 2017), and Vice President and Counsel (February 2012-December 2015) of Pacific Investment Management Company LLC. | | Since March 2018 |
Charles H. Smith
1/11/1973
Anti-Money Laundering Compliance Officer | | Vice President, Corporate Compliance, Anti-Money Laundering Unit (since January 2015) of Prudential; committee member of the American Council of Life Insurers Anti-Money Laundering and Critical Infrastructure Committee (since January 2016); formerly Global Head of Economic Sanctions Compliance at AIG Property Casualty (February 2007-December 2014); Assistant Attorney General at the New York State Attorney General’s Office, Division of Public Advocacy. (August 1998-January 2007). | | Since January 2017 |
Christian J. Kelly
5/5/1975
Treasurer and Principal Financial
and Accounting Officer | | Vice President, Head of Fund Administration of PGIM Investments LLC (since November 2018); formerly, Director of Fund Administration of Lord Abbett & Co. LLC (2009-2018), Treasurer and Principal Accounting Officer of the Lord Abbett Family of Funds (2017-2018); Director of Accounting, Avenue Capital Group (2008-2009); Senior Manager, Investment Management Practice of Deloitte & Touche LLP (1998-2007). | | Since January 2019 |
E3
| | | | |
| | | |
| Fund Officers(a) | | | | |
Name
Date of Birth
Position with the Fund | | Principal Occupation(s) During the Past Five Years | | Length of Service as Fund Officer |
Lana Lomuti
6/7/1967
Assistant Treasurer | | Vice President (since 2007) and Director (2005-2007), within PGIM Investments Fund Administration; formerly Assistant Treasurer (December 2007-February 2014) of The Greater China Fund, Inc. | | Since April 2014 |
Russ Shupak
10/08/73
Assistant Treasurer | | Vice President (since 2017) and Director (2013-2017), within PGIM Investments Fund Administration. | | Since October 2019 |
Deborah Conway
3/26/69
Assistant Treasurer | | Vice President (since 2017) and Director (2007-2017), within PGIM Investments Fund Administration. | | Since October 2019 |
Elyse M. McLaughlin
1/20/74
Assistant Treasurer | | Vice President (since 2017) and Director (2011-2017), within PGIM Investments Fund Administration. | | Since October 2019 |
Alina Srodecka, CPA
8/19/1966
Assistant Treasurer | | Vice President of Tax at Prudential Financial, Inc. (Since August 2007); formerly Director of Tax at MetLife (January 2003-May 2006); formerly Tax Manager at Deloitte & Touché (October1997-January 2003); formerly Staff Accountant at Marsh & McLennan (May 1994-May 1997) | | Since June 2017 |
(a)Excludes Mr. Cronin, an Interested Director who also serves as President.
Explanatory Notes to Tables:
Directors are deemed to be “Interested,” as defined in the 1940 Act, by reason of their affiliation with PGIM Investments and/or an affiliate of PGIM Investments. Timothy S. Cronin is an Interested Director because he is employed by an affiliate of the Manager.
Unless otherwise noted, the address of all Directors and Officers is c/o PGIM Investments LLC, 655 Broad Street, Newark, New Jersey 07102.
There is no set term of office for Directors or Officers. The Independent Directors have adopted a retirement policy, which calls for the retirement of Directors on December 31 of the year in which they reach the age of 78, provided that the Board may extend the retirement age on ayear-by-year basis for a Director.
“Other Directorships Held” includes only directorships of companies required to register or file reports with the SEC under the 1934 Act (that is, “public companies”) or other investment companies registered under the 1940 Act.
“No. of Portfolios Overseen” includes all investment companies managed by PGIM Investments and/or ASTIS that are overseen by the Director. The investment companies for which PGIM Investments and/or ASTIS serves as Manager include The Prudential Variable Contract Accounts, The Prudential Series Fund, Advanced Series Trust, Prudential’s Gibraltar Fund, Inc., the PGIM Funds, the PGIM High Yield Bond Fund, Inc. and PGIM Global High Yield Fund, Inc.
E4
Variable contracts contain exclusions, limitations, reductions of benefits, and terms for keeping them in force. For costs and complete details, refer to your contract or contact your licensed financial professional. Contract guarantees are based on the claims-paying ability of the issuing company.
The Prudential Insurance Company of America
751 Broad Street
Newark, NJ 07102-3714
The Audited Financial Statements of The Prudential Insurance Company of America are available upon request. You may call(888) 778-2888 to obtain a free copy of the Audited Financial Statements.
For service-related questions, please contact the Annuity Service Center at (888) 778-2888.
©2020 Prudential Financial, Inc. and its related entities. PGIM Investments, the Prudential logo, the Rock symbol, and Bring Your Challenges are service marks of Prudential Financial, Inc. and its related entities, registered in many jurisdictions worldwide.
FSP-AR
Item 2 – Code of Ethics — See Exhibit (a)
As of the end of the period covered by this report, the registrant has adopted a code of ethics (the “Section 406 Standards for Investment Companies – Ethical Standards for Principal Executive and Financial Officers”) that applies to the registrant’s Principal Executive Officer and Principal Financial Officer; the registrant’s Principal Financial Officer also serves as the Principal Accounting Officer.
The registrant hereby undertakes to provide any person, without charge, upon request, a copy of the code of ethics. To request a copy of the code of ethics, contact the registrant800-225-1852, and ask for a copy of the Section 406 Standards for Investment Companies - Ethical Standards for Principal Executive and Financial Officers.
Item 3 – Audit Committee Financial Expert –
The registrant’s Board has determined that Mr. Thomas O’Brien, member of the Board’s Audit Committee is an “audit committee financial expert,” and that he is “independent,” for purposes of this Item.
Item 4 – Principal Accountant Fees and Services –
(a)Audit Fees
For the fiscal years ended December 31, 2019 and December 31, 2018, KPMG LLP (“KPMG”), the Registrant’s principal accountant, billed the Registrant $27,200 and $27,200 respectively, for professional services rendered for the audit of the Registrant’s annual financial statements or services that are normally provided in connection with statutory and regulatory filings.
(b)Audit-Related Fees
For the fiscal year ended December 31, 2019, fees of $1,418 were billed to the Registrant for services rendered by KPMG in connection with an accounting system conversion and were paid by The Bank of New York Mellon. For the fiscal year ended December 31, 2018, there are no fees to report.
(c)Tax Fees
For the fiscal years ended December 31, 2019 and December 31, 2018: none.
(d)All Other Fees
For the fiscal years ended December 31, 2019 and December 31, 2018: none.
(e) (1)Audit CommitteePre-Approval Policies and Procedures
THE PGIM MUTUAL FUNDS
AUDIT COMMITTEE POLICY
on
Pre-Approval of Services Provided by the Independent Accountants
The Audit Committee of each PGIM Mutual Fund is charged with the responsibility to monitor the independence of the Fund’s independent accountants. As part of this responsibility, the Audit Committee mustpre-approve the independent accounting firm’s engagement to render audit and/or permissiblenon-audit services, as required by law. In evaluating a proposed engagement of the independent accountants, the Audit Committee will assess the effect that the engagement might reasonably be expected to have on the accountant’s independence. The Committee’s evaluation will be based on:
| | • | | a review of the nature of the professional services expected to be provided, |
| | • | | a review of the safeguards put into place by the accounting firm to safeguard independence, and |
| | • | | periodic meetings with the accounting firm. |
Policy for Audit andNon-Audit Services Provided to the Funds
On an annual basis, the scope of audits for each Fund, audit fees and expenses, and audit-related andnon-audit services (and fees proposed in respect thereof) proposed to be performed by the Fund’s independent accountants will be presented by the Treasurer and the independent accountants to the Audit Committee for review and, as appropriate, approval prior to the initiation of such services.
Such presentation shall be accompanied by confirmation by both the Treasurer and the independent accountants that the proposednon-audit services will not adversely affect the independence of the independent accountants. Such proposednon-audit services shall be described in sufficient detail to enable the Audit Committee to assess the appropriateness of such services and fees, and the compatibility of the provision of such services with the auditor’s independence. The Committee shall receive periodic reports on the progress of the audit and other services which are approved by the Committee or by the Committee Chair pursuant to authority delegated in this Policy.
The categories of services enumerated under “Audit Services”, “Audit-related Services”, and “Tax Services” are intended to provide guidance to the Treasurer and the independent accountants as to those categories of services which the Committee believes are generally consistent with the independence of the independent accountants and which the Committee (or the Committee Chair) would expect upon the presentation of specific proposals topre-approve. The enumerated categories are not intended as an exclusive list of audit, audit-related or tax services, which the Committee (or the Committee Chair) would consider forpre-approval.
Audit Services
The following categories of audit services are considered to be consistent with the role of the Fund’s independent accountants:
| | • | | Annual Fund financial statement audits |
| | • | | Seed audits (related to new product filings, as required) |
| | • | | SEC and regulatory filings and consents |
Audit-related Services
The following categories of audit-related services are considered to be consistent with the role of the Fund’s independent accountants:
| | • | | Accounting consultations |
| | • | | Fund merger support services |
| | • | | Agreed Upon Procedure Reports |
| | • | | Other Internal Control Reports |
Individual audit-related services that fall within one of these categories (except for fund merger support services) and are not presented to the Audit Committee as part of the annualpre-approval process are subject to an authorizedpre-approval by the Audit Committee so long as the estimated fee for those services does not exceed $30,000. Any services provided under suchpre-approval will be reported to the Audit Committee at its next regular meeting. Should the amount of such services exceed $30,000 any additional fees will be subject topre-approval by the Committee Chair (or any other Committee member on whom this responsibility has been delegated). Fees related to fund merger support services are subject to a separate authorizedpre-approval by the Audit Committee with fees determined on a per occurrence and merger complexity basis.
Tax Services
The following categories of tax services are considered to be consistent with the role of the Fund’s independent accountants:
| | • | | Tax compliance services related to the filing or amendment of the following: |
| | • | | Federal, state and local income tax compliance; and, |
| | • | | Sales and use tax compliance |
| | • | | Timely RIC qualification reviews |
| | • | | Tax distribution analysis and planning |
| | • | | Tax authority examination services |
| | • | | Tax appeals support services |
| | • | | Accounting methods studies |
| | • | | Fund merger support services |
| | • | | Tax consulting services and related projects |
Individual tax services that fall within one of these categories and are not presented to the Audit Committee as part of the annualpre-approval process are subject to an authorizedpre-approval by the Audit Committee so long as the estimated fee for those services does not exceed $30,000. Any services provided under suchpre-approval will be reported to the Audit Committee at its next regular meeting. Should the amount of such services exceed $30,000 any additional fees will be subject topre-approval by the Committee Chair (or any other Committee member on whom this responsibility has been delegated).
OtherNon-Audit Services
Certainnon-audit services that the independent accountants are legally permitted to render will be subject topre-approval by the Committee or by one or more Committee members to whom the Committee has delegated this authority and who will report to the full Committee anypre-approval decisions made pursuant to this Policy.Non-audit services presented forpre-approval pursuant to this paragraph will be accompanied by a confirmation from both the Treasurer and the independent accountants that the proposed services will not adversely affect the independence of the independent accountants.
Proscribed Services
The Fund’s independent accountants will not render services in the following categories ofnon-audit services:
| | • | | Bookkeeping or other services related to the accounting records or financial statements of the Fund |
| | • | | Financial information systems design and implementation |
| | • | | Appraisal or valuation services, fairness opinions, orcontribution-in-kind reports |
| | • | | Internal audit outsourcing services |
| | • | | Management functions or human resources |
| | • | | Broker or dealer, investment adviser, or investment banking services |
| | • | | Legal services and expert services unrelated to the audit |
| | • | | Any other service that the Public Company Accounting Oversight Board determines, by regulation, is impermissible. |
Pre-approval ofNon-Audit Services Provided to Other Entities Within the PGIM Fund Complex
Certainnon-audit services provided to PGIM Investments LLC or any of its affiliates that also provide ongoing services to the PGIM Mutual Funds will be subject topre-approval by the Audit Committee. The onlynon-audit services provided to these entities that will requirepre-approval are thoserelated directly to the operations and financial reporting of the Funds. Individual projects that are not presented to the Audit Committee as part of the annualpre-approval process will be subject topre-approval by the Committee Chair (or any other Committee member on whom this responsibility has been delegated) so long as the estimated fee for those services does not exceed $30,000. Services presented forpre-approval pursuant to this paragraph will be accompanied by a confirmation from both the Treasurer and the independent accountants that the proposed services will not adversely affect the independence of the independent accountants.
Although the Audit Committee will notpre-approve all services provided to PGIM Investments LLC and its affiliates, the Committee will receive an annual report from the Fund’s independent accounting firm showing the aggregate fees for all services provided to PGIM Investments and its affiliates.
(e) (2)Percentage of services referred to in 4(b) – 4(d) that were approved by the audit committee–
For the fiscal year ended December 31, 2019 and December 31, 2018, 100% of the services referred to in Item 4(b) was approved by the audit committee.
(f)Percentage of hours expended attributable to work performed by other than full time employees of principal accountant if greaterthan 50%.
The percentage of hours expended on the principal accountant’s engagement to audit the registrant’s financial statements for the most recent fiscal year that were attributed to work performed by persons other than the principal accountant’s full-time, permanent employees was 0%.
(g)Non-Audit Fees
The aggregatenon-audit fees billed by KPMG for services rendered to the registrant’s investment adviser and any entity controlling, controlled by, or under common control with the investment adviser that provides ongoing services to the registrant for the fiscal years ended December 31, 2019 and December 31, 2018 was $0 and $0, respectively.
(h)Principal Accountant’s Independence
Not applicable as KPMG has not providednon-audit services to the registrant’s investment adviser and any entity controlling, controlled by, or under common control with the investment adviser that provides ongoing services to the registrant that were notpre-approved pursuant to Rule2-01(c)(7)(ii) of RegulationS-X.
Item 5 – Audit Committee of Listed Registrants – Not applicable.
Item 6 – Schedule of Investments – The schedule is included as part of the report to shareholders filed under Item 1 of this Form.
Item 7 – Disclosure of Proxy Voting Policies and Procedures forClosed-End Management Investment Companies – Not applicable.
Item 8 – Portfolio Managers ofClosed-End Management Investment Companies – Not applicable.
Item 9 – Purchases of Equity Securities byClosed-End Management Investment Company and Affiliated Purchasers – Not applicable.
Item 10 – Submission of Matters to a Vote of Security Holders – There have been no material changes to these procedures.
Item 11 – Controls and Procedures
| | (a) | It is the conclusion of the registrant’s principal executive officer and principal financial officer that the effectiveness of the registrant’s current disclosure controls and procedures (such disclosure controls and procedures having been evaluated within 90 days of the date of this filing) provide reasonable assurance that the information required to be disclosed by the registrant has been recorded, processed, summarized and reported within the time period specified in the Commission’s rules and forms and that the information required to be disclosed by the registrant has been accumulated and communicated to the registrant’s principal executive officer and principal financial officer in order to allow timely decisions regarding required disclosure. |
| | (b) | There has been no significant change in the registrant’s internal control over financial reporting that occurred during the registrant’s most recent fiscal quarter of the period covered by this report that has materially affected, or is likely to materially affect, the registrant’s internal control over financial reporting. |
Item 12 – Controls and Procedures - Disclosure of Securities Lending Activities forClosed-End Management Investment Companies – Not applicable.
Item 13 – Exhibits
(a) (1) Code of Ethics – Attached hereto as ExhibitEX-99.CODE-ETH
(2) Certifications pursuant to Section 302 of the Sarbanes-Oxley Act – Attached hereto as ExhibitEX-99.CERT.
(3) Any written solicitation to purchase securities under Rule23c-1 – Not applicable.
(4) Registrant’s Independent Public Accountant, attached as Exhibit 99.ACCT
(b) Certifications pursuant to Section 906 of the Sarbanes-Oxley Act – Attached hereto as ExhibitEX-99.906CERT.
SIGNATURES
Pursuant to the requirements of the Securities Exchange Act of 1934 and the Investment Company Act of 1940, the registrant has duly caused this report to be signed on its behalf by the undersigned, thereunto duly authorized.
| | |
| Registrant: | | Prudential’s Gibraltar Fund, Inc. |
| |
| By: | | /s/ Andrew R. French |
| | Andrew R. French |
| | Secretary |
| |
| Date: | | February 12, 2020 |
Pursuant to the requirements of the Securities Exchange Act of 1934 and the Investment Company Act of 1940, this report has been signed below by the following persons on behalf of the registrant and in the capacities and on the dates indicated.
| | |
| By: | | /s/ Timothy S. Cronin |
| | Timothy S. Cronin |
| | President and Principal Executive Officer |
| |
| Date: | | February 12, 2020 |
| |
| By: | | /s/ Christian J. Kelly |
| | Christian J. Kelly |
| | Treasurer and Principal Financial and Accounting Officer |
| |
| Date: | | February 12, 2020 |