UNITED STATES
SECURITIES AND EXCHANGE COMMISSION
Washington, D.C. 20549
FORM N-CSR
CERTIFIED SHAREHOLDER REPORT OF REGISTERED MANAGEMENT INVESTMENT COMPANIES
| | |
| Investment Company Act file number: | | 811-01660 |
| |
| Exact name of registrant as specified in charter: | | Prudential’s Gibraltar Fund, Inc. |
| |
| Address of principal executive offices: | | 655 Broad Street, 17th Floor Newark, New Jersey 07102 |
| |
| Name and address of agent for service: | | Andrew R. French 655 Broad Street, 17th Floor Newark, New Jersey 07102 |
| |
| Registrant’s telephone number, including area code: | | 800-225-1852 |
| |
| Date of fiscal year end: | | 12/31/2020 |
| |
| Date of reporting period: | | 12/31/2020 |
Item 1 – Reports to Stockholders
Prudential’s Gibraltar Fund, Inc.
| | |
| ANNUAL REPORT | | December 31, 2020 |

This report provides financial information about Prudential’s Gibraltar Fund, Inc. (the Fund), an investment option under your variable contract.
The views expressed in this report and information about the Fund’s portfolio holdings are for the period covered by this report and are subject to change thereafter.

| | | | |
Prudential’s Gibraltar Fund, Inc. Table of Contents | | Annual Report | | December 31, 2020 |
| | ∎ | | REPORT OF THE INVESTMENT MANAGERS AND PRESENTATION OF PORTFOLIO HOLDINGS |
| | | | |
| Section A | | Schedule of Investments and Financial Statements |
| Section B | | Notes to Financial Statements |
| Section C | | Financial Highlights |
| Section D | | Report of Independent Registered Public Accounting Firm |
| Section E | | Information about Trustees and Officers |
| | | | |
Prudential’s Gibraltar Fund, Inc. Letter to Planholders | | Annual Report | | December 31, 2020 |
At Prudential, our primary objective is to help investors achieve and maintain long-term financial success. Despite today’s uncertainties, we remain strong and ready to serve and support you. This Prudential’s Gibraltar Fund annual report outlines our efforts to achieve this goal. We hope you find it informative and useful.
Prudential has been building on a heritage of success for more than 145 years. You can count on our history of financial stability. We are diversified for endurance. Our balanced mix of risks and businesses positions us well to manage through any economic environment. We’ve applied the lessons from decades of challenges to be stronger, because we are committed to keeping our promises to you.
Your financial professional is the best resource to help you make the most informed investment decisions. Together, you can build a diversified investment portfolio that aligns with your long-term financial goals. Please keep in mind that diversification and asset allocation strategies do not assure a profit or protect against loss in declining markets.
Thank you for selecting Prudential as one of your financial partners. A strong sense of social responsibility for our clients, our employees, and our communities has been embedded in the company since our founding. It guides our efforts to help our customers achieve peace of mind through financial wellness.
We value your trust and appreciate the opportunity to help you achieve financial security.
Sincerely,

Timothy S. Cronin
President,
Prudential’s Gibraltar Fund, Inc. | January 31, 2021 |
| | | | |
| Market Overview — unaudited | | Annual Report | | December 31, 2020 |
Equity Market Overview
A global pandemic caused by a novel coronavirus—followed by massive monetary and fiscal stimulus packages implemented by central banks and governments worldwide—whipsawed equity markets in 2020. When the chaos subsided, stocks in general closed the year higher, with several US indexes setting record highs as investors responded favorably to the stimulus and to new vaccines that they hoped would speed up the recovery.
Performance varied notably by investing style, market capitalization, geography, and sector. While some industries such as travel struggled during the pandemic, others such as online technology benefited from consumers working from home.
In the US, the broad-based Russell 3000 Index and the large-cap S&P 500 Index rose 20.89% and 18.40%, respectively, for the year. Meanwhile, the Dow Jones Industrial Average (Dow) surpassed 30,000 points with a return of 9.92%, and the tech-heavy Nasdaq Composite Index returned 43.64%. Internationally, the MSCI ACWI Ex-US Index, a broad measure of stock performance in developed and emerging markets outside the US, returned 10.65%. (All returns cited are in US dollars unless stated otherwise and assume reinvestment of dividends.)
Economies crashed, nations responded
When the year began, the outlook for the global economy and equity markets was generally upbeat. Sentiment swiftly shifted south in February and into March as concerns about the spread of COVID-19, the disease caused by the coronavirus, alarmed the markets. Many governments throughout the world rolled out restrictions such as stay-at-home orders, travel bans, and temporary business closures to help reduce transmission of COVID-19. These moves took a toll on the global economy, thrusting many countries into recession and sending stock markets sharply lower.
Lawmakers and central banks worldwide quickly implemented extraordinary stimulus to shore up liquidity. In the US, the Federal Reserve (the Fed) cut its federal funds rate target to a range of 0.00%-0.25%. Congress and the Fed rolled out trillions of dollars in combined stimulus. Real gross domestic product (GDP) in the US dropped at an annualized rate of 31.4% over the second quarter, and the national unemployment rate spiked to 14.7% in April. However, the economy responded favorably to the stimulus and reversed course, with GDP vaulting 33.4% over the third quarter.
Stocks retreated, rebounded, and rallied to record highs
Stock markets plunged in the first quarter as investors worried the recession would hamper growth and corporate profits, with the Dow posting its worst first-quarter performance in history. Stocks rebounded in the second quarter as national and state governments reopened their economies, and the Dow recorded its best performance for any quarter since 1987. Over the third quarter and through the end of the year, equity markets fluctuated yet continued their ascent, due in part to regulatory approval of two COVID-19 vaccines and better-than-expected economic data.
In December, the Fed committed to continue buying bonds until the US economy achieves full employment, provided that inflation stays at 2%, and the central bank also maintained its near-zero federal funds rate target. That same month, Congress approved $900 billion of additional fiscal stimulus, and the national unemployment rate dropped to 6.7%. A large number of countries outside the US also remained supportive of the markets. Many stock indexes closed the year at or near all-time highs.
S&P 500: leaders and laggards
Over the period, the top-performing sectors in the S&P 500 were information technology (+43.89%) and consumer discretionary (+33.30%). Many companies in the technology arena benefited from stronger demand for online shopping and delivery services as a result of the pandemic. Other sectors that posted gains were communication services (+23.61%), materials (+20.73%), health care (+13.45%), industrials (+11.06%), consumer staples (+10.75%), and utilities (+0.48%). Sectors that posted negative returns included financials (-1.69%), real estate (-2.17%), and energy (-33.68%). Energy stocks were dragged down by plunging oil prices during the first half of the year. Prices fell due to the onset of a price war between Russia and Saudi Arabia and lower oil demand after travel declined during the pandemic. Prices eventually stabilized but ended lower for the year.
| | | | |
| Market Overview — unaudited (continued) | | Annual Report | | December 31, 2020 |
Growth outshined value, large caps edged out small caps
Over the year, the Russell 3000 Growth Index returned 38.26%, far surpassing the Russell 3000 Value Index, which rose 2.87%. The large-cap Russell 1000 Index gained 20.96%, the Russell Midcap Index returned 17.10%, and the small-cap Russell 2000 Index returned 19.96%. Although large caps outperformed smaller caps, the small-cap index topped its large-cap counterpart over the third and fourth quarters, with the indexes returning 37.85% and 24.46%, respectively, during that time.
Emerging market equities posted robust overall gains
Emerging market equities, as measured by the MSCI Emerging Markets Investable Market Index, dropped sharply in the first quarter but rebounded to return 18.40% for the year. The recovery was driven by a pickup in China’s economy fueled by aggressive stimulus and a surge in exports. Top-performing markets included Korea, Taiwan, China, and India, all of which posted double-digit returns. Latin American markets, Russia, and South Africa finished lower.
International developed market stocks rose, but regional results were mixed
For the year, stocks in developed markets outside the US and Canada, as measured by the MSCI EAFE Index, lagged those in emerging markets but advanced 7.82%. The MSCI Japan Index returned 14.48%, aided by substantial fiscal and monetary stimulus. The Japanese yen, often perceived as a “safe haven” currency, gained 5.3% against the US dollar. European equities, as measured by the MSCI Europe Index, ended in negative territory in local-currency terms yet returned 5.38% in US dollars. Concerns about the economy eased as the year ended after the European Union and the United Kingdom (UK) agreed to a post-Brexit trade deal. (Brexit refers to the UK’s exit from the European Union.) The MSCI UK Index returned -10.47%.
Fixed Income Market Overview
Government bond markets worldwide collectively rose in 2020 as central banks aggressively cut interest rates, amplified bond-buying programs, and enacted other stimulus measures to support their economies in response to a disruptive global pandemic caused by a novel coronavirus.
Higher-rated credits performed particularly well early in the year but gave back some gains later as investors gravitated toward riskier assets such as higher-yielding bonds, which plunged early in the year but rallied in the fourth quarter.
The global investment-grade bond market, as measured by the Bloomberg Barclays Global Aggregate Bond Index (unhedged), rose 9.20% for the year. Emerging market debt, based on the J.P. Morgan EMBI Global Diversified Index, returned 5.26%. In the US, the investment-grade Bloomberg Barclays US Aggregate Bond Index rose 7.51%, and high yield bonds (i.e., debt rated below investment grade), as measured by the ICE BofAML US Cash High Yield Index, returned 6.20%. (All returns cited are in US dollars unless stated otherwise.)
Massive stimulus supported global markets and economies
During the first few months of the year, many governments worldwide began to impose travel restrictions, stay-at-home orders, and social distancing guidelines to reduce the spread of COVID-19, the disease caused by the coronavirus. Many of these remedies crippled the travel, restaurant, energy, leisure, and various services industries.
To help buoy markets and local economies, policymakers and central banks responded with unprecedented levels of stimulus, beginning in the first quarter. In the US, the Federal Reserve (the Fed) slashed its federal funds rate target to virtually zero. Lawmakers and the Fed then rolled out trillions of dollars in combined stimulus. The central bank also implemented emergency lending facilities, expanded its asset-purchase program to include individual corporate bonds, and unveiled other bold initiatives. Although real gross domestic product (GDP) fell at an annualized rate of 31.4% in the second quarter and national unemployment spiked to 14.7% in April, the economy rebounded in the second half of the year. GDP rose 33.4% in the third quarter, and unemployment closed December at 6.7%—far below April’s peak but still above pre-pandemic levels. The dollar, as measured by the US Dollar Index, dropped 6.7%. Inflation remained subdued.
| | | | |
| Market Overview — unaudited (continued) | | Annual Report | | December 31, 2020 |
Elsewhere, China’s economy weathered the COVID-19 crisis better than many other regional markets, largely due to severe lockdowns, stimulus packages, and a sharp rise in exports. The country’s exports soared almost 20% during the pandemic, surpassing exports of countries outside the region, including the US and eurozone. Latin America’s economy was a laggard, and many developed nations fell into recession as a result of the pandemic.
In December, the Fed maintained its near-zero federal funds rate target, and the central bank committed to continue buying bonds until the US economy achieves full employment, provided that inflation stays at 2%. Congress also approved $900 billion of additional fiscal stimulus. Outside the US, many nations maintained a stimulus mindset as they continued to deal with pandemic-related challenges.
A banner year for investment-grade bonds
During the first quarter, US investment-grade bond yields, which move opposite to bond prices, dropped in reaction to substantial monetary easing and a “flight to quality” from stocks and other riskier securities. At the time, investors favored higher-quality credits, particularly US Treasuries with longer maturities.
As investors’ risk appetite increased during the second half of year, yields on higher-rated debt such as Treasuries rose on worries that the implemented stimulus packages could lead to higher inflation. Higher-yielding assets fell into favor. The yield on the 10-year US Treasury dropped from approximately 1.88% at the beginning of 2020 to 0.70% at the end of the first quarter, and fell further to 0.58% during late April on strong demand. However, the yield subsequently rose to close 2020 at 0.93%, albeit notably lower than where it started the year.
Over the year, longer-dated US Treasury bonds returned 17.70%, while US Treasuries in general returned 8.00%. Treasury inflation-protected securities rose 10.99%. (Returns of US investment-grade bonds noted are based on Bloomberg Barclays bond indexes unless stated otherwise.)
Investment-grade corporate bonds delivered a stellar return of 9.89%. Central banks’ extraordinary moves to support markets, investors’ reaction to stimulus, expectations that US interest rates will remain low for some time, regulatory approval of two COVID-19 vaccines, and better-than-expected corporate earnings results fueled demand for corporates in the latter part of the year. Other notable performers included commercial mortgage-backed securities, which returned 8.11%, and municipal bonds, which rose 5.21%.
High yield bonds rebounded after a rocky start
As mentioned earlier, US high yield bonds returned 6.20% in 2020, thanks to a rebound late in the year. Earlier in 2020, high yield bond prices tumbled when concerns about the pandemic’s potential economic consequences were intensifying and crude oil prices were plunging. Prices fell due to the onset of a price war between Russia and Saudi Arabia and lower oil demand after travel declined during the pandemic. The lower prices hurt oil exporters, which constitute a significant chunk of the high yield issuer market.
Oil prices eventually stabilized but ended lower over the year. The price of a barrel of West Texas Intermediate crude oil traded above $61 when 2020 began and closed the year slightly above $48. The high yield market staged a comeback later in the year as investors applauded approval of the two COVID-19-vaccines. High yield bonds returned 6.50% over the fourth quarter.
Emerging market debt also rallied in the final quarter
Emerging market debt ended 2020 in positive territory, rising 5.26% for the year as mentioned earlier, including 5.80% in the fourth quarter. Like many high yield bond issuers, emerging market debt issuers include many exporters of crude oil.
| | |
| Prudential’s Gibraltar Fund, Inc. | | December 31, 2020 |
Report of the Investment Manager - As of December 31, 2020 (Unaudited)
| | | | | | | | | | | | |
Average Annual Total
Returns | | 1 Year | | | 5 Years | | | 10 Years | |
Fund | | | 42.73 | % | | | 22.14 | % | | | 18.29 | % |
S&P 500 Index | | | 18.40 | | | | 15.21 | | | | 13.87 | |
Past performance is no guarantee of future returns. The investment return and principal value of an investment will fluctuate, so that shares, when redeemed, may be worth more or less than their original cost. Current performance may be lower or higher than the past performance.
Fund performance is net of fund expenses, but not contract charges, which, if included, would significantly lower the performance quoted.
$10,000 INVESTED OVER 10 YEARS
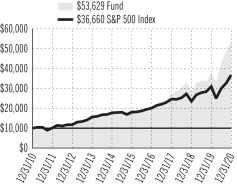
For the year ended December 31, 2020, Prudential’s Gibraltar Fund returned 42.73%. The Fund outperformed the S&P 500 Index.
What were the market conditions during the reporting period?
Equity markets were extremely volatile in 2020 (the reporting period), unsettled by US-China trade discord and the COVID-19 pandemic. Stocks peaked at new highs in early 2020, then dropped dramatically in late February as the viral outbreak spread around the globe, disrupting markets and life everywhere. The realities of the pandemic dictated daily conduct for individuals, businesses, and governments worldwide, as shelter-in-place and work-from-home initiatives became standard. Stocks rebounded rapidly later in the period, but the pandemic-related economic damage continued to accumulate. The effects of fiscal stimulus blunted the pandemic’s impact on employment and spending, while comprehensive monetary policy initiatives to bolster liquidity and stabilize asset prices contributed to record-low interest rates.
What strategies or holdings affected the Portfolio’s performance?
Consumer discretionary positions were strong positive contributors to the Fund’s performance during the reporting period. Shares of Tesla, Inc. continued to surge on impressive financial results made possible by solid production, increased capacity, and strong execution. The company’s technology, scale, and low-cost advantage have made it the breakaway leader in the electric vehicle market, and Jennison believes these characteristics also position Tesla to disrupt the overall automotive industry. Consumer businesses that have migrated to digital direct-to-consumer business models were notably strong performers, including Amazon.com, Inc. Amazon has operated in this mode for years, and its relevance and dominance became even more apparent during the period as the firm continued to benefit from economies of scale and its platform-based business model. The Amazon Web Services (AWS) cloud-computing platform remained a significant additional driver of revenue and profit.
In information technology, digital payments processors were strong performers. The growing importance of digital commerce in times of restricted personal mobility benefited Shopify, Inc., which provides user-friendly cloud-based infrastructure tools to enable omnichannel e-commerce capability.
With millions of people around the world working from home, the advantage of housing mission-critical software applications and services on the cloud became clear. In addition to a strong and stable enterprise business, Microsoft Corp. has a differentiated hybrid cloud strategy that is leading to an increase in its share of technology capital spending. Its Azure cloud business hosts Microsoft software as well as hundreds of cloud-native applications created by Microsoft customers or third parties. Adobe, Inc. offers content creation and digital marketing applications and services that are transforming businesses operations.
With its huge installed base, Apple, Inc. is benefiting from rapid growth in service business subscriptions, a key source of recurring revenue. Jennison believes the company’s current product cycle should provide robust revenue and profit growth.
In communication services, Alphabet, Inc. continues to increase revenue by monetizing its globally dominant platforms — Search, YouTube, and Maps — through enhanced advertising solutions. Jennison expects additional growth from the company’s enterprise cloud solutions suite. The COVID-19 outbreak negatively affected the company’s advertising revenue; but with its strong market share in digital advertising and its industry-leading, vertically integrated technology portfolio, Alphabet remained resilient.
The Fund’s industrials holdings advanced during the period but lagged the sector’s performance in the S&P 500 Index. The longer-than-anticipated 737 Max 8 jet recertification process weighed on The Boeing Co. early in the period. With the pandemic restricting air travel and compromising the
For a complete list of holdings, refer to the Schedule of Investments section of this report. Holdings reflect only long-term investments.
1
| | |
Prudential’s Gibraltar Fund, Inc. | | December 31, 2020 |
Report of the Investment Manager - As of December 31, 2020 (Unaudited) (Continued)
financial health of airlines, the position was eliminated from the Fund during the period. The position in Airbus SE was likewise eliminated because of the company’s exposure to airlines.
The position in hotelier Marriott International, Inc. was eliminated on lackluster revenue per available room and exposure to the COVID-19-related impact on global travel and tourism.
Lastly, Jennison eliminated the position in FleetCor Technologies, Inc., which provides specific-purpose charge cards and payment-processing services for commercial and government trucking fleets, based on the overhang from regulatory litigation related to the company’s marketing and fee practices, as well as its exposure to oil prices.
Presentation of Portfolio Holdings — unaudited
| | | | | | |
| Prudential’s Gibraltar Fund, Inc. (As of 12/31/2020) | |
| Ten Largest Holdings | | Line of Business | | | % of Net Assets | |
| Microsoft Corp. | | Software | | | 7.5% | |
| Amazon.com, Inc. | | Internet & Direct Marketing Retail | | | 7.0% | |
| Tesla, Inc. | | Automobiles | | | 6.9% | |
| salesforce.com, Inc. | | Software | | | 5.2% | |
| Mastercard, Inc. (Class A Stock) | | IT Services | | | 5.0% | |
| Adobe, Inc. | | Software | | | 4.8% | |
| Visa, Inc. (Class A Stock) | | IT Services | | | 4.6% | |
| NIKE, Inc. (Class B Stock) | | Textiles, Apparel & Luxury Goods | | | 4.5% | |
| Apple, Inc. | | Technology Hardware, Storage & Peripherals | | | 4.4% | |
| Alphabet, Inc. (Class C Stock) | | Interactive Media & Services | | | 3.9% | |
For a complete list of holdings, please refer to the Schedule of Investments section of this report. Holdings reflect only long-term investments.
2
| | |
Prudential’s Gibraltar Fund, Inc. Benchmark Glossary — unaudited | | December 31, 2020 |
The index is unmanaged and includes reinvestment of any income or distributions. The index does not reflect any fees, expenses or sales charges. Investors cannot invest directly in a market index.
S&P 500 Index is an unmanaged, market value-weighted index of over 500 stocks generally representative of the broad stock market.
The S&P 500 index is a product of S&P Dow Jones Indices LLC and/or its affiliates and has been licensed for use by PGIM, Inc. and/or its affiliates. Copyright © 2020 S&P Dow Jones Indices LLC, a division of S&P Global, Inc., and/or its affiliates. All rights reserved. Redistribution or reproduction in whole or in part are prohibited without written permission of S&P Dow Jones Indices LLC. For more information on any of S&P Dow Jones Indices LLC’s indices please visit www.spdji.com. S&P® is a registered trademark of S&P Global and Dow Jones® is a registered trademark of Dow Jones Trademark Holdings LLC.
| | |
Prudential’s Gibraltar Fund, Inc. Fees and Expenses — unaudited | | December 31, 2020 |
As a Planholder investing in the Fund through a variable contract, you incur ongoing costs, including management fees, and other Fund expenses. This example is intended to help you understand your ongoing costs (in dollars) of investing in the Fund and to compare these costs with the ongoing costs of investing in other investment options. This example does not reflect fees and charges under your contract. If contract charges were included, the costs shown below would be higher. Please consult your contract for more information about contract fees and charges.
The example is based on an investment of $1,000 invested at the beginning of the period and held for the entire period July 1, 2020 through December 31, 2020.
Actual Expenses
The first line of the table below provides information about actual account values and actual expenses. You may use this information, together with the amount you invested, to estimate the Fund expenses that you paid over the period. Simply divide your account value by $1,000 (for example, an $8,600 account value divided by $1,000 = 8.6), then multiply the result by the number in the first line under the heading entitled “Expenses Paid During the Six-Month Period” to estimate the Fund expenses you paid on your account during this period. As noted above, the table does not reflect variable contract fees and charges.
Hypothetical Example for Comparison Purposes
The second line of the table below provides information about hypothetical account values and hypothetical expenses based on the Fund’s actual expense ratio and an assumed rate of return of 5% per year before expenses, which is not the Fund’s actual return. The hypothetical account values and expenses may not be used to estimate the actual ending account balance or expenses you paid for the period. You may use this information to compare the ongoing costs of investing in the Fund and other investment options. To do so, compare this 5% hypothetical example with the 5% hypothetical examples that appear in the shareholder reports of the other investment options.
Please note that the expenses shown in the table are meant to highlight your ongoing Fund costs only and do not reflect any contract fees and charges, such as sales charges (loads), insurance charges or administrative charges. Therefore the second line of the table is useful to compare ongoing investment option costs only, and will not help you determine the relative total costs of owning different contracts. In addition, if these contract fees and charges were included, your costs would have been higher.
| | | | | | | | | | | | | | | | | | |
| Prudential’s Gibraltar Fund, Inc. | | Beginning
Account Value
July 1, 2020 | | | Ending
Account Value
December 31, 2020 | | | Annualized Expense
Ratio based on the
Six-Month Period | | | Expenses Paid
During the
Six-Month Period* | |
| | | | | |
| Prudential's Gibraltar Fund, Inc. | | Actual | | $ | 1,000.00 | | | $ | 1,256.80 | | | | 0.63 | % | | $ | 3.57 | |
| | Hypothetical | | $ | 1,000.00 | | | $ | 1,021.97 | | | | 0.63 | % | | $ | 3.20 | |
*Fund expenses (net of fee waivers or subsidies, if any) are equal to the annualized expense ratio (provided in the table), multiplied by the average account value over the period, multiplied by the 184 days in the six-month period ended December 31, 2020, and divided by the 366 days in the Fund’s fiscal year ended December 31, 2020 (to reflect the six-month period). Expenses presented in the table include the expenses of any underlying portfolios in which the Fund may invest.
| | | | | | |
| | |
| | PRUDENTIAL’S GIBRALTAR FUND, INC. | | |
| | | | | | |
| |
| SCHEDULE OF INVESTMENTS | | as of December 31, 2020 |
| | | | | | | | |
| LONG-TERM INVESTMENTS — 95.0% | | | | |
| COMMON STOCKS | | Shares | | | Value | |
Automobiles — 6.9% | | | | | | | | |
Tesla, Inc.*(a) | | | 22,225 | | | $ | 15,683,516 | |
| | | | | | | | |
Biotechnology — 0.8% | | | | | | | | |
Vertex Pharmaceuticals, Inc.* | | | 7,665 | | | | 1,811,546 | |
| | | | | | | | |
Capital Markets — 1.6% | | | | | | | | |
S&P Global, Inc. | | | 10,990 | | | | 3,612,743 | |
| | | | | | | | |
Entertainment — 1.1% | | | | | | | | |
Spotify Technology SA* | | | 8,056 | | | | 2,534,901 | |
| | | | | | | | |
Food & Staples Retailing — 3.5% | |
Costco Wholesale Corp. | | | 21,215 | | | | 7,993,388 | |
| | | | | | | | |
Health Care Equipment & Supplies — 2.4% | |
Danaher Corp. | | | 2,171 | | | | 482,266 | |
Edwards Lifesciences Corp.* | | | 53,437 | | | | 4,875,057 | |
| | | | | | | | |
| | | | | | | 5,357,323 | |
| | | | | | | | |
Health Care Technology — 2.0% | |
Teladoc Health, Inc.*(a) | | | 22,288 | | | | 4,456,708 | |
| | | | | | | | |
Interactive Media & Services — 10.9% | |
Alphabet, Inc. (Class A Stock)* | | | 2,923 | | | | 5,122,967 | |
Alphabet, Inc. (Class C Stock)* | | | 5,067 | | | | 8,876,776 | |
Facebook, Inc. (Class A Stock)* | | | 27,800 | | | | 7,593,848 | |
Match Group, Inc.* | | | 20,823 | | | | 3,148,229 | |
| | | | | | | | |
| | | | | | | 24,741,820 | |
| | | | | | | | |
Internet & Direct Marketing Retail — 8.7% | |
Amazon.com, Inc.* | | | 4,829 | | | | 15,727,715 | |
Chewy, Inc. (Class A Stock)*(a) | | | 42,667 | | | | 3,835,337 | |
| | | | | | | | |
| | | | | | | 19,563,052 | |
| | | | | | | | |
IT Services — 14.7% | |
Mastercard, Inc. (Class A Stock) | | | 31,332 | | | | 11,183,644 | |
Shopify, Inc. (Canada) (Class A Stock)* | | | 5,506 | | | | 6,232,517 | |
Square, Inc. (Class A Stock)* | | | 24,348 | | | | 5,299,099 | |
Visa, Inc. (Class A Stock) | | | 47,779 | | | | 10,450,700 | |
| | | | | | | | |
| | | | | | | 33,165,960 | |
| | | | | | | | |
Pharmaceuticals — 4.2% | |
AstraZeneca PLC (United Kingdom),
ADR(a) | | | 103,781 | | | | 5,188,012 | |
Eli Lilly & Co. | | | 26,174 | | | | 4,419,218 | |
| | | | | | | | |
| | | | | | | 9,607,230 | |
| | | | | | | | |
Road & Rail — 2.8% | |
Uber Technologies, Inc.* | | | 123,859 | | | | 6,316,809 | |
| | | | | | | | |
Software — 19.9% | |
Adobe, Inc.* | | | 21,617 | | | | 10,811,094 | |
Microsoft Corp. | | | 76,546 | | | | 17,025,362 | |
RingCentral, Inc. (Class A Stock)* | | | 6,069 | | | | 2,299,969 | |
salesforce.com, Inc.* | | | 52,302 | | | | 11,638,764 | |
Splunk, Inc.* | | | 18,226 | | | | 3,096,415 | |
| | | | | | | | |
| | | | | | | 44,871,604 | |
| | | | | | | | |
| | | | | | | | |
COMMON STOCKS
(continued) | | Shares | | | Value | |
Specialty Retail — 2.2% | |
Home Depot, Inc. (The) | | | 12,351 | | | $ | 3,280,673 | |
TJX Cos., Inc. (The) | | | 23,979 | | | | 1,637,526 | |
| | | | | | | | |
| | | | | | | 4,918,199 | |
| | | | | | | | |
Technology Hardware, Storage & Peripherals — 4.4% | |
Apple, Inc. | | | 75,519 | | | | 10,020,616 | |
| | | | | | | | |
Textiles, Apparel & Luxury Goods — 8.9% | |
Kering SA (France), ADR(a) | | | 73,096 | | | | 5,295,805 | |
Lululemon Athletica, Inc.* | | | 13,174 | | | | 4,584,947 | |
NIKE, Inc. (Class B Stock) | | | 71,699 | | | | 10,143,258 | |
| | | | | | | | |
| | | | | | | 20,024,010 | |
| | | | | | | | |
TOTAL LONG-TERM INVESTMENTS
(cost $66,758,203) | | | | 214,679,425 | |
| | | | | | | | |
|
| SHORT-TERM INVESTMENTS — 17.3% | |
AFFILIATED MUTUAL FUNDS | |
PGIM Core Ultra Short Bond Fund(w) | | | 11,401,041 | | | | 11,401,041 | |
PGIM Institutional Money Market Fund (cost $27,672,703; includes $27,670,282 of cash collateral for securities on loan)(b)(w) | | | 27,698,743 | | | | 27,684,893 | |
| | | | | | | | |
TOTAL SHORT-TERM INVESTMENTS
(cost $39,073,744) | | | | 39,085,934 | |
| | | | | | | | |
TOTAL INVESTMENTS — 112.3%
(cost $105,831,947) | | | | 253,765,359 | |
LIABILITIES IN EXCESS OF
OTHER ASSETS — (12.3)% | | | | (27,780,373 | ) |
| | | | | | | | |
NET ASSETS — 100.0% | | | $ | 225,984,986 | |
| | | | | | | | |
Below is a list of the abbreviation(s) used in the annual report:
| | |
| ADR | | American Depositary Receipt |
| LIBOR | | London Interbank Offered Rate |
| * | Non-income producing security. |
| (a) | All or a portion of security is on loan. The aggregate market value of such securities, including those sold and pending settlement, is $27,182,599; cash collateral of $27,670,282 (included in liabilities) was received with which the Fund purchased highly liquid short-term investments. In the event of significant appreciation in value of securities on loan on the last business day of the reporting period, the Fund may reflect a collateral value that is less than the market value of the loaned securities and such shortfall is remedied the following business day. |
| (b) | Represents security, or portion thereof, purchased with cash collateral received for securities on loan and includes dividend reinvestment. |
| (w) | PGIM Investments LLC, the manager of the Fund, also serves as manager of the PGIM Core Ultra Short Bond Fund and PGIM Institutional Money Market Fund. |
Fair Value Measurements:
Various inputs are used in determining the value of the Fund’s investments. These inputs are summarized in the three broad levels listed below.
| Level 1— | unadjusted quoted prices generally in active markets for identical securities. |
SEE NOTES TO FINANCIAL STATEMENTS.
A1
| | | | | | |
| | |
| | PRUDENTIAL’S GIBRALTAR FUND, INC. (continued) | | |
| | | | | | |
| |
| SCHEDULE OF INVESTMENTS | | as of December 31, 2020 |
| Level 2— | quoted prices for similar securities, interest rates and yield curves, prepayment speeds, foreign currency exchange rates and other observable inputs. |
| Level 3— | unobservable inputs for securities valued in accordance with Board approved fair valuation procedures. |
The following is a summary of the inputs used as of December 31, 2020 in valuing such portfolio securities:
| | | | | | | | | | | | |
| | | Level 1 | | | Level 2 | | | Level 3 | |
Investments in Securities | | | | | | | | | | | | |
Assets | | | | | | | | | | | | |
Common Stocks | | | | | | | | | | | | |
Automobiles | | $ | 15,683,516 | | | $ | — | | | $ | — | |
Biotechnology | | | 1,811,546 | | | | — | | | | — | |
Capital Markets | | | 3,612,743 | | | | — | | | | — | |
Entertainment | | | 2,534,901 | | | | — | | | | — | |
Food & Staples Retailing | | | 7,993,388 | | | | — | | | | — | |
Health Care Equipment & Supplies | | | 5,357,323 | | | | — | | | | — | |
Health Care Technology | | | 4,456,708 | | | | — | | | | — | |
Interactive Media & Services | | | 24,741,820 | | | | — | | | | — | |
Internet & Direct Marketing Retail | | | 19,563,052 | | | | — | | | | — | |
IT Services | | | 33,165,960 | | | | — | | | | — | |
Pharmaceuticals | | | 9,607,230 | | | | — | | | | — | |
Road & Rail | | | 6,316,809 | | | | — | | | | — | |
Software | | | 44,871,604 | | | | — | | | | — | |
Specialty Retail | | | 4,918,199 | | | | — | | | | — | |
Technology Hardware, Storage & Peripherals | | | 10,020,616 | | | | — | | | | — | |
Textiles, Apparel & Luxury Goods | | | 20,024,010 | | | | — | | | | — | |
Affiliated Mutual Funds | | | 39,085,934 | | | | — | | | | — | |
| | | | | | | | | | | | |
Total | | $ | 253,765,359 | | | $ | — | | | $ | — | |
| | | | | | | | | | | | |
Industry Classification:
The industry classification of investments and liabilities in excess of other assets shown as a percentage of net assets as of December 31, 2020 were as follows (unaudited):
| | | | |
Software | | | 19.9 | % |
Affiliated Mutual Funds (12.2% represents investments purchased with collateral from securities on loan) | | | 17.3 | |
IT Services | | | 14.7 | |
Interactive Media & Services | | | 10.9 | |
Textiles, Apparel & Luxury Goods | | | 8.9 | |
Internet & Direct Marketing Retail | | | 8.7 | |
Automobiles | | | 6.9 | |
Technology Hardware, Storage & Peripherals | | | 4.4 | |
Pharmaceuticals | | | 4.2 | |
Food & Staples Retailing | | | 3.5 | |
Road & Rail | | | 2.8 | |
| | | | |
Health Care Equipment & Supplies | | | 2.4 | % |
Specialty Retail | | | 2.2 | |
Health Care Technology | | | 2.0 | |
Capital Markets | | | 1.6 | |
Entertainment | | | 1.1 | |
Biotechnology | | | 0.8 | |
| | | | |
| | | 112.3 | |
Liabilities in excess of other assets | | | (12.3 | ) |
| | | | |
| | | 100.0 | % |
| | | | |
SEE NOTES TO FINANCIAL STATEMENTS.
A2
| | | | | | |
| | |
| | PRUDENTIAL’S GIBRALTAR FUND, INC. (continued) | | |
| | | | | | |
| |
| SCHEDULE OF INVESTMENTS | | as of December 31, 2020 |
Financial Instruments/Transactions — Summary of Offsetting and Netting Arrangements:
The Fund entered into financial instruments/transactions during the reporting period that are either offset in accordance with current requirements or are subject to enforceable master netting arrangements or similar agreements that permit offsetting. The information about offsetting and related netting arrangements for financial instruments/transactions where the legal right to set-off exists is presented in the summary below.
Offsetting of financial instrument/transaction assets and liabilities:
| | | | | | | | | | | | |
Description | | Gross Market
Value of
Recognized
Assets/(Liabilities) | | | Collateral
Pledged/(Received)(1) | | | Net
Amount | |
Securities on Loan | | $ | 27,182,599 | | | $ | (27,182,599 | ) | | $ | — | |
| | | | | | | | | | | | |
| (1) | Collateral amount disclosed by the Fund is limited to the market value of financial instruments/transactions. |
SEE NOTES TO FINANCIAL STATEMENTS.
A3
| | | | | | |
| | |
| | PRUDENTIAL’S GIBRALTAR FUND, INC. (continued) | | |
STATEMENT OF ASSETS AND LIABILITIES
as of December 31, 2020
| | | | |
| ASSETS | | | | |
Investments at value, including securities on loan of $27,182,599: | | | | |
Unaffiliated investments (cost $66,758,203) | | $ | 214,679,425 | |
Affiliated investments (cost $39,073,744) | | | 39,085,934 | |
Tax reclaim receivable | | | 56,098 | |
Dividends receivable | | | 334 | |
Prepaid expenses | | | 3,642 | |
| | | | |
Total Assets | | | 253,825,433 | |
| | | | |
| LIABILITIES | | | | |
Payable to broker for collateral for securities on loan | | | 27,670,282 | |
Management fee payable | | | 103,371 | |
Accrued expenses and other liabilities | | | 65,712 | |
Directors’ fees payable | | | 1,082 | |
| | | | |
Total Liabilities | | | 27,840,447 | |
| | | | |
| NET ASSETS | | $ | 225,984,986 | |
| | | | |
Net assets were comprised of: | | | | |
Shares of beneficial interest, at par | | $ | 88,227 | |
Paid-in capital in excess of par | | | 61,729,053 | |
Total distributable earnings (loss) | | | 164,167,706 | |
| | | | |
Net assets, December 31, 2020 | | $ | 225,984,986 | |
| | | | |
Net asset value and redemption price per share, $225,984,986 / 8,822,701 outstanding shares of common stock (authorized 75,000,000 shares) | | $ | 25.61 | |
| | | | |
STATEMENT OF OPERATIONS
Year Ended December 31, 2020
| | | | |
| NET INVESTMENT INCOME (LOSS) INCOME | | | | |
Unaffiliated dividend income (net of $10,122 foreign withholding tax) | | $ | 1,283,368 | |
Affiliated dividend income | | | 70,889 | |
Income from securities lending, net (including affiliated income of $40,617) | | | 40,694 | |
| | | | |
Total income | | | 1,394,951 | |
| | | | |
| EXPENSES | | | | |
Management fee | | | 1,074,148 | |
Custodian and accounting fees | | | 53,122 | |
Audit fee | | | 28,145 | |
Legal fees and expenses | | | 24,988 | |
Directors’ fees | | | 12,132 | |
Miscellaneous | | | 24,587 | |
| | | | |
Total expenses | | | 1,217,122 | |
| | | | |
| NET INVESTMENT INCOME (LOSS) | | | 177,829 | |
| | | | |
| REALIZED AND UNREALIZED GAIN (LOSS) ON INVESTMENT TRANSACTIONS | | | | |
Net realized gain (loss) on investment transactions (including affiliated of $(15,160)) | | | 31,079,414 | |
Net change in unrealized appreciation (depreciation) on investments (including affiliated of $9,996) | | | 39,247,450 | |
| | | | |
| NET GAIN (LOSS) ON INVESTMENT TRANSACTIONS | | | 70,326,864 | |
| | | | |
| NET INCREASE (DECREASE) IN NET ASSETS RESULTING FROM OPERATIONS | | $ | 70,504,693 | |
| | | | |
STATEMENTS OF CHANGES IN NET ASSETS
| | | | | | | | |
| | | Year Ended | | | Year Ended | |
| | | December 31, 2020 | | | December 31, 2019 | |
| INCREASE (DECREASE) IN NET ASSETS OPERATIONS | | | | | | | | |
Net investment income (loss) | | $ | 177,829 | | | $ | 412,127 | |
Net realized gain (loss) on investment transactions | | | 31,079,414 | | | | 18,539,006 | |
Net change in unrealized appreciation (depreciation) on investments | | | 39,247,450 | | | | 28,343,626 | |
| | | | | | | | |
NET INCREASE (DECREASE) IN NET ASSETS RESULTING FROM OPERATIONS | | | 70,504,693 | | | | 47,294,759 | |
| | | | | | | | |
| DIVIDENDS AND DISTRIBUTIONS | | | | | | | | |
Distributions from distributable earnings | | | (21,707,458 | ) | | | (14,368,059 | ) |
| | | | | | | | |
| CAPITAL STOCK TRANSACTIONS | | | | | | | | |
Capital stock sold [13,909 and 0 shares, respectively] | | | 321,625 | | | | — | |
Capital stock issued in reinvestment of dividends [885,046 and 748,932 shares, respectively] | | | 21,707,458 | | | | 14,368,059 | |
Capital stock purchased [1,010,221 and 1,064,221 shares, respectively] | | | (22,590,959 | ) | | | (20,350,076 | ) |
| | | | | | | | |
NET INCREASE (DECREASE) IN NET ASSETS FROM CAPITAL STOCK TRANSACTIONS | | | (561,876 | ) | | | (5,982,017 | ) |
| | | | | | | | |
| TOTAL INCREASE (DECREASE) | | | 48,235,359 | | | | 26,944,683 | |
| NET ASSETS: | | | | | | | | |
Beginning of year | | | 177,749,627 | | | | 150,804,944 | |
| | | | | | | | |
End of year | | $ | 225,984,986 | | | $ | 177,749,627 | |
| | | | | | | | |
SEE NOTES TO FINANCIAL STATEMENTS.
A4
NOTES TO FINANCIAL STATEMENTS
Prudential’s Gibraltar Fund, Inc. (the “Fund”) was originally incorporated in the State of Delaware on March 14, 1968 and was reincorporated in the State of Maryland effective May 1, 1997. It is registered as an open-end, management investment company under the Investment Company Act of 1940, as amended (“1940 Act”) and is a diversified fund for purposes of the 1940 Act. The Fund was organized by The Prudential Insurance Company of America (“PICA”) to serve as the investment medium for the variable contract accounts of The Prudential Financial Security Program (“FSP”). The Fund does not sell its shares to the public. The accounts will redeem shares of the Fund to the extent necessary to provide benefits under the contracts or for such other purposes as may be consistent with the contracts.
The investment objective of the Fund is growth of capital to the extent compatible with a concern for preservation of principal.
The Fund follows the investment company accounting and reporting guidance of the Financial Accounting Standards Board (“FASB”) Accounting Standard Codification (“ASC”) Topic 946 Financial Services — Investment Companies. The following accounting policies conform to U.S. generally accepted accounting principles (“GAAP”). The Fund consistently follows such policies in the preparation of its financial statements.
Securities Valuation: The Fund holds securities and other assets and liabilities that are fair valued at the close of each day (generally, 4:00 PM Eastern time) the New York Stock Exchange (“NYSE”) is open for trading. Fair value is the price that would be received to sell an asset or paid to transfer a liability in an orderly transaction between market participants on the measurement date. The Fund’s Board of Directors (the “Board”) has adopted valuation procedures for security valuation under which fair valuation responsibilities have been delegated to PGIM Investments LLC (“PGIM Investments” or the “Manager”). Pursuant to the Board’s delegation, the Manager has established a Valuation Committee responsible for supervising the fair valuation of portfolio securities and other assets and liabilities. The valuation procedures permit the Fund to utilize independent pricing vendor services, quotations from market makers, and alternative valuation methods when market quotations are either not readily available or not deemed representative of fair value. A record of the Valuation Committee’s actions is subject to the Board’s review, approval, and ratification at its next regularly scheduled quarterly meeting.
For the fiscal reporting year-end, securities and other assets and liabilities were fair valued at the close of the last U.S. business day. Trading in certain foreign securities may occur when the NYSE is closed (including weekends and holidays). Because such foreign securities trade in markets that are open on weekends and U.S. holidays, the values of some of the Fund’s foreign investments may change on days when investors cannot purchase or redeem Fund shares.
Various inputs determine how the Fund’s investments are valued, all of which are categorized according to the three broad levels (Level 1, 2, or 3) detailed in the Schedule of Investments and referred to herein as the “fair value hierarchy” in accordance with FASB ASC Topic 820—Fair Value Measurements and Disclosures.
Common or preferred stocks, exchange-traded funds and derivative instruments, if applicable, that are traded on a national securities exchange are valued at the last sale price as of the close of trading on the applicable exchange where the security principally trades. Securities traded via NASDAQ are valued at the NASDAQ official closing price. To the extent these securities are valued at the last sale price or NASDAQ official closing price, they are classified as Level 1 in the fair value hierarchy. In the event that no sale or official closing price on valuation date exists, these securities are generally valued at the mean between the last reported bid and ask prices, or at the last bid price in the absence of an ask price. These securities are classified as Level 2 in the fair value hierarchy.
Investments in open-end funds (other than exchange-traded funds) are valued at their net asset values as of the close of the NYSE on the date of valuation. These securities are classified as Level 1 in the fair value hierarchy since they may be purchased or sold at their net asset values on the date of valuation.
Securities and other assets that cannot be priced according to the methods described above are valued based on pricing methodologies approved by the Board. In the event that unobservable inputs are used when determining such valuations, the securities will be classified as Level 3 in the fair value hierarchy. Altering one or more
B1
unobservable inputs may result in a significant change to a Level 3 security’s fair value measurement.
When determining the fair value of securities, some of the factors influencing the valuation include: the nature of any restrictions on disposition of the securities; assessment of the general liquidity of the securities; the issuer’s financial condition and the markets in which it does business; the cost of the investment; the size of the holding and the capitalization of the issuer; the prices of any recent transactions or bids/offers for such securities or any comparable securities; any available analyst media or other reports or information deemed reliable by the Manager regarding the issuer or the markets or industry in which it operates. Using fair value to price securities may result in a value that is different from a security’s most recent closing price and from the price used by other unaffiliated mutual funds to calculate their net asset values.
Master Netting Arrangements: The Fund is subject to various Master Agreements, or netting arrangements, with select counterparties. These are agreements which a subadviser may have negotiated and entered into on behalf of all or a portion of the Fund. A master netting arrangement between the Fund and the counterparty permits the Fund to offset amounts payable by the Fund to the same counterparty against amounts to be received; and by the receipt of collateral from the counterparty by the Fund to cover the Fund’s exposure to the counterparty. However, there is no assurance that such mitigating factors are easily enforceable. In addition to master netting arrangements, the right to set-off exists when all the conditions are met such that each of the parties owes the other determinable amounts, the reporting party has the right to set-off the amount owed with the amount owed by the other party, the reporting party intends to set-off and the right of set-off is enforceable by law. During the reporting period, there was no intention to settle on a net basis and all amounts are presented on a gross basis on the Statement of Assets and Liabilities.
Securities Lending: The Fund lends its portfolio securities to banks and broker-dealers. The loans are secured by collateral at least equal to the market value of the securities loaned. Collateral pledged by each borrower is invested in an affiliated money market fund and is marked to market daily, based on the previous day’s market value, such that the value of the collateral exceeds the value of the loaned securities. In the event of significant appreciation in value of securities on loan on the last business day of the reporting period, the financial statements may reflect a collateral value that is less than the market value of the loaned securities. Such shortfall is remedied as described above. Loans are subject to termination at the option of the borrower or the Fund. Upon termination of the loan, the borrower will return to the Fund securities identical to the loaned securities. The remaining maturities of the securities lending transactions are considered overnight and continuous. Should the borrower of the securities fail financially, the Fund has the right to repurchase the securities in the open market using the collateral.
The Fund recognizes income, net of any rebate and securities lending agent fees, for lending its securities in the form of fees or interest on the investment of any cash received as collateral. The borrower receives all interest and dividends from the securities loaned and such payments are passed back to the lender in amounts equivalent thereto, which are reflected in interest income or unaffiliated dividend income based on the nature of the payment on the Statement of Operations. The Fund also continues to recognize any unrealized gain (loss) in the market price of the securities loaned and on the change in the value of the collateral invested that may occur during the term of the loan. In addition, realized gain (loss) is recognized on changes in the value of the collateral invested upon liquidation of the collateral. Net earnings from securities lending are disclosed in the Statement of Operations.
Securities Transactions and Net Investment Income: Securities transactions are recorded on the trade date. Realized gains (losses) from investment and currency transactions are calculated on the specific identification method. Dividend income is recorded on the ex-date, or for certain foreign securities, when the Fund becomes aware of such dividends. Interest income, including amortization of premium and accretion of discount on debt securities, as required, is recorded on the accrual basis. Expenses are recorded on an accrual basis, which may require the use of certain estimates by management that may differ from actual.
Taxes: It is the Fund’s policy to continue to meet the requirements of the Internal Revenue Code applicable to regulated investment companies and to distribute all of its taxable net investment income and capital gains, if any, to its shareholders. Therefore, no federal income tax provision is required. Withholding taxes on foreign dividends, interest and capital gains, if any, are recorded, net of reclaimable amounts, at the time the related income is earned.
Dividends and Distributions: The Fund expects to pay dividends from net investment income semi-annually and distributions from net realized capital gains, if any, at least annually. Dividends and distributions to shareholders,
B2
which are determined in accordance with federal income tax regulations and which may differ from GAAP, are recorded on the ex-date. Permanent book/tax differences relating to income and gain (loss) are reclassified between total distributable earnings (loss) and paid-in capital in excess of par, as appropriate.
Estimates: The preparation of financial statements requires management to make estimates and assumptions that affect the reported amounts and disclosures in the financial statements. Actual results could differ from those estimates.
The Fund has a management agreement with the Manager. Pursuant to this agreement, the Manager has responsibility for all investment advisory services and supervises the subadviser’s performance of such services. PGIM Investments has entered into a subadvisory agreement with Jennison Associates LLC (“Jennison” or the “Subadviser”), which provides that Jennison will furnish investment advisory services in connection with the management of the Fund. In connection therewith, Jennison is obligated to keep certain books and records of the Fund. PGIM Investments pays for the services of the Subadviser, the cost of compensation of officers of the Fund, costs related to shareholder reporting, occupancy and certain clerical and administrative expenses of the Fund. The Fund bears all other costs and expenses.
The management fee paid to the Manager is accrued daily and payable monthly at an annual rate of 0.55% of the Fund’s average daily net assets of the Fund. All amounts paid or payable by the Fund to the Manager, under the agreement, are reflected in the Statement of Operations.
The Fund has a distribution agreement with Prudential Investment Management Services LLC (“PIMS”), which acts as the distributor of the shares of the Fund. No distribution or service fees are paid to PIMS as distributor of shares of the Fund.
The Fund has entered into brokerage commission recapture agreements with certain registered broker-dealers. Under the brokerage commission recapture program, a portion of the commission is returned to the Fund. Such amounts are included within realized gain (loss) on investment transactions presented in the Statement of Operations. For the reporting period ended December 31, 2020, brokerage commission recaptured under these agreements was $5,262.
PGIM Investments, PICA, PIMS and Jennison are indirect, wholly-owned subsidiaries of Prudential Financial, Inc. (“Prudential”).
| 4. | | Other Transactions with Affiliates |
The Fund may invest its overnight sweep cash in the PGIM Core Ultra Short Bond Fund (the “Core Fund”), and its securities lending cash collateral in the PGIM Institutional Money Market Fund (the “Money Market Fund”), each a series of Prudential Investment Portfolios 2, registered under the 1940 Act and managed by PGIM Investments. Through the Fund’s investments in the mentioned underlying funds, PGIM Investments and/or its affiliates are paid fees or reimbursed for providing their services. In addition to the realized and unrealized gains on investments in the Core Fund and Money Market Fund, earnings from such investments are disclosed on the Statement of Operations as “Affiliated dividend income” and “Income from securities lending, net”, respectively.
The Fund may enter into certain securities purchase or sale transactions under Board approved Rule 17a-7 procedures. Rule 17a-7 is an exemptive rule under the 1940 Act, that subject to certain conditions, permits purchase and sale transactions among affiliated investment companies, or between an investment company and a person that is affiliated solely by reason of having a common (or affiliated) investment adviser, common directors, and/or common officers. Pursuant to the Rule 17a-7 procedures and consistent with guidance issued by the Securities and Exchange Commission (“SEC”), the Fund’s Chief Compliance Officer (“CCO”) prepares a quarterly summary of all such transactions for submission to the Board, together with the CCO’s written representation that all such 17a-7 transactions were effected in accordance with the Fund’s Rule 17a-7 procedures. For the year ended December 31, 2020, no 17a-7 transactions were entered into by the Fund.
The aggregate cost of purchases and proceeds from sales of portfolio securities (excluding short-term investments and U.S. Government securities) for the year ended December 31, 2020, were $40,293,613 and $67,582,064, respectively.
B3
A summary of the cost of purchases and proceeds from sales of shares of affiliated investments for the year ended December 31, 2020, is presented as follows:
| | | | | | | | | | | | | | | | | | | | | | | | | | | | | | |
Value,
Beginning
of Year | | | Cost of
Purchases | | | Proceeds
from Sales | | | Change in
Unrealized
Gain
(Loss) | | | Realized
Gain
(Loss) | | | Value, End
of Year | | | Shares,
End of
Year | | | Income | |
| | PGIM Core Ultra Short Bond Fund* | | | | | | | | | | | | | | | | | | | | | |
| | $ 6,122,590 | | | $ | 54,758,523 | | | $ | 49,480,072 | | | $ | — | | | $ | — | | | $ | 11,401,041 | | | | 11,401,041 | | | $ | 70,889 | |
| | PGIM Institutional Money Market Fund* | | | | | | | | | | | | | | | | | | | | | |
| | 17,118,307 | | | | 151,542,229 | | | | 140,970,479 | | | | 9,996 | | | | (15,160 | ) | | | 27,684,893 | | | | 27,698,743 | | | | 40,617 | ** |
| | | | | | | | | | | | | | | | | | | | | | | | | | | | | | |
| | $23,240,897 | | | $ | 206,300,752 | | | $ | 190,450,551 | | | $ | 9,996 | | | $ | (15,160 | ) | | $ | 39,085,934 | | | | | | | $ | 111,506 | |
| | | | | | | | | | | | | | | | | | | | | | | | | | | | | | |
| | * | The Fund did not have any capital gain distributions during the reporting period. |
| | ** | The amount, or a portion thereof, represents the affiliated securities lending income shown on the Statement of Operations. |
| 6. | | Distributions and Tax Information |
Distributions to shareholders, which are determined in accordance with federal income tax regulations and which may differ from GAAP, are recorded on the ex-date.
For the year ended December 31, 2020, the tax character of dividends paid by the Fund were $2,521,172 of ordinary income and $19,186,286 of long-term capital gains. For the year ended December 31, 2019, the tax character of dividends paid by the Fund were $368,395 of ordinary income and $13,999,664 of long-term capital gains.
As of December 31, 2020, the accumulated undistributed earnings on a tax basis were $296,952 of ordinary income and $15,945,440 of long-term capital gains.
The United States federal income tax basis of the Fund’s investments and the net unrealized appreciation as of December 31, 2020 were as follows:
| | | | | | | | | | | | |
Tax Basis | | Gross
Unrealized
Appreciation | | | Gross
Unrealized
Depreciation | | | Net
Unrealized
Appreciation | |
| $105,840,045 | | $ | 148,084,353 | | | $ | (159,039 | ) | | $ | 147,925,314 | |
The difference between GAAP and tax basis is primarily attributable to deferred losses on wash sales.
The Manager has analyzed the Fund’s tax positions taken on federal, state and local income tax returns for all open tax years and has concluded that no provision for income tax is required in the Fund’s financial statements for the current reporting period. Since tax authorities can examine previously filed tax returns, the Fund’s U.S. federal and state tax returns for each of the four fiscal years up to the most recent fiscal year ended December 31, 2020 are subject to such review.
The Fund, along with other affiliated registered investment companies (the “Participating Funds”), is a party to a Syndicated Credit Agreement (“SCA”) with a group of banks. The purpose of the SCA is to provide an alternative source of temporary funding for capital share redemptions. The table below provides details of the current SCA in effect at the reporting period-end as well as the prior SCA.
| | | | |
| | | Current SCA | | Prior SCA |
| Term of Commitment | | 10/2/2020 – 9/30/2021 | | 10/3/2019 – 10/1/2020 |
| Total Commitment | | $ 1,200,000,000 | | $ 1,222,500,000* |
| Annualized Commitment Fee on the Unused Portion of the SCA | | 0.15% | | 0.15% |
B4
| | | | |
| | | Current SCA | | Prior SCA |
| Annualized Interest Rate on Borrowings | | 1.30% plus the higher of (1) the effective federal funds rate, (2) the one-month LIBOR rate or (3) zero percent | | 1.20% plus the higher of (1) the effective federal funds rate, (2) the one-month LIBOR rate or (3) zero percent |
* Effective March 31, 2020, the SCA’s total commitment was increased from $900,000,000 to $1,162,500,000 and subsequently, effective April 7, 2020 was increased to $1,222,500,000. |
Certain affiliated registered investment companies that are parties to the SCA include portfolios that are subject to a predetermined mathematical formula used to manage certain benefit guarantees offered under variable annuity contracts. The formula may result in large scale asset flows into and out of these portfolios. Consequently, these portfolios may be more likely to utilize the SCA for purposes of funding redemptions. It may be possible for those portfolios to fully exhaust the committed amount of the SCA, thereby requiring the Manager to allocate available funding per a Board-approved methodology designed to treat the Participating Funds in the SCA equitably.
The Fund did not utilize the SCA during the year ended December 31, 2020.
| 8. | | Ownership and Affiliates |
Pursuant to the Fund’s Articles of Incorporation, the Fund is authorized to issue 75,000,000 shares, with a par value of $0.01 per share, and an aggregate par value of $750,000.
As of December 31, 2020, all shares of record of the Fund were owned by PICA on behalf of the owners of the three variable insurance products: Prudential’s Investment Plan Account, Prudential’s Annuity Plan Account and Prudential’s Annuity Plan Account-2.
| 9. | | Risks of Investing in the Fund |
The Fund’s risks include, but are not limited to, some or all of the risks discussed below. For further information on the Fund’s risks, please refer to the Fund’s Prospectus and Statement of Additional Information.
Economic and Market Events Risk: Events in the US and global financial markets, including actions taken by the US Federal Reserve or foreign central banks to stimulate or stabilize economic growth, may at times result in periods of unusually high volatility in a market or a segment of a market, which could negatively impact performance. Reduced liquidity in credit and fixed income markets could adversely affect issuers worldwide.
Equity Securities Risk: There is a risk that the value of a particular stock or equity-related security held by a Portfolio could fluctuate, perhaps greatly, in response to a number of factors, such as changes in the issuer’s financial condition. In addition to an individual stock losing value, the value of the equity markets or a sector of those markets in which a Portfolio invests could go down. A Portfolio’s holdings can vary from broad market indexes, and the performance of a Portfolio can deviate from the performance of such indexes. Different parts of a market can react differently to adverse issuer, market, regulatory, political and economic developments. Such events may result in losses to a Portfolio. Preferred stock generally pays dividends at a specified rate and has preference over common stock in the payment of dividends and the liquidation of assets, but does not ordinarily carry voting rights. The price of a preferred stock is generally determined by earnings, type of products or services, projected growth rates, experience of management, liquidity, and general market conditions of the markets on which the stock trades. The most significant risks associated with investments in preferred stock include the risk of losses attributable to adverse changes in interest rates, broader market conditions and the financial condition of the stock’s issuer. Equity securities may have greater price volatility than other types of investments. These risks are generally magnified in the case of equity investments in distressed companies.
Market and Management Risk: Market risk is the risk that the markets in which a Portfolio invests will experience market volatility and go down in value, including the possibility that a market will go down sharply and unpredictably. All markets go through cycles, and market risk involves being on the wrong side of a cycle. Factors affecting market risk include political events, broad economic and social changes, and the mood of the investing public. If investor sentiment turns negative, the price of all securities may decline. Market risk also includes the risk that geopolitical and other events will disrupt the economy on a national or global level. For instance, war, terrorism, market manipulation, government defaults, government shutdowns, political changes or diplomatic developments, public health emergencies (such as the spread of infectious diseases, pandemics, or epidemics) and natural/environmental disasters can all negatively impact the securities markets, which could cause a Portfolio to lose value. Such events may reduce consumer demand or economic output, result in market closures, travel
B5
restrictions or quarantines, and significantly adversely impact the economy. In addition, economies and financial markets throughout the world are becoming increasingly interconnected, which increases the likelihood that events or conditions in one country or region will adversely impact markets or issuers in other countries or regions. Exchanges and securities markets may close early, close late or issue trading halts on specific securities, which may result in, among other things, a Portfolio being unable to buy or sell certain securities at an advantageous time or accurately price its portfolio investments. In addition, a Portfolio may rely on various third-party sources to calculate its net asset value. As a result, a Portfolio is subject to certain operational risks associated with reliance on service providers and service providers’ data sources. In particular, errors or systems failures and other technological issues may adversely impact the Portfolio’s calculations of its net asset value. Such net asset value calculation issues may result in inaccurately calculated net asset values, delays in net asset value calculations and/or the inability to calculate net asset values over extended periods. A Portfolio may be unable to recover any losses associated with such failures.
Management risk is the risk that the investment strategy or the Manager or a subadviser will not work as intended. All decisions by the Manager or a subadviser require judgment and are based on imperfect information. In addition, if a Portfolio is managed using a quantitative investment model, it is subject to the risk that the model may not perform as expected. Similarly, there can be no assurance that quantitative models or methods utilized by the Manager or a subadviser, or related data sources, will always be available, and the loss of access to any such model(s) or data sources could have an adverse impact on a Portfolio’s ability to realize its investment objective. Moreover, regulatory restrictions, actual or potential conflicts of interest or other considerations may cause the Manager or a subadviser to restrict or prohibit participation in certain investments. There is no guarantee that the investment objective of a Portfolio will be achieved.
Regulatory Risk: The Fund is subject to a variety of laws and regulations which govern its operations. The Fund is subject to regulation by the SEC. Similarly, the businesses and other issuers of the securities and other instruments in which the Fund invests are also subject to considerable regulation. Changes in laws and regulations may materially impact the Fund, a security, business, sector or market.
| 10. | | Recent Regulatory Developments |
On December 3, 2020, the SEC announced that it voted to adopt a new rule that establishes an updated regulatory framework for fund valuation practices (the “Rule”). The Rule, in part, provides (i) a framework for determining fair value in good faith and (ii) provides for a fund Board’s assignment of its responsibility for the execution of valuation-related activities to a fund’s investment adviser. Further, the SEC is rescinding previously issued guidance on related issues. The Rule will become effective 60 days after publication in the Federal Register, and will have a compliance date 18 months following the effective date. Management is currently evaluating the Rule and its impact to the Funds.
B6
Financial Highlights
| | | | | | | | | | | | | | | | | | | | |
| | | Prudential’s Gibraltar Fund, Inc. | |
| | | Year Ended December 31, | |
| | | 2020 | | | 2019 | | | 2018 | | | 2017 | | | 2016 | |
Per Share Operating Performance: | | | | | | | | | | | | | | | | | | | | |
Net Asset Value, beginning of year | | $ | 19.90 | | | $ | 16.30 | | | $ | 17.18 | | | $ | 14.31 | | | $ | 15.64 | |
| | | | | | | | | | | | | | | | | | | | |
Income (Loss) From Investment Operations: | | | | | | | | | | | | | | | | | | | | |
Net investment income (loss) | | | 0.02 | | | | 0.05 | | | | 0.05 | | | | 0.05 | | | | 0.03 | |
Net realized and unrealized gain (loss) on investment transactions | | | 8.30 | | | | 5.26 | | | | 0.83 | | | | 5.11 | | | | 0.05 | |
| | | | | | | | | | | | | | | | | | | | |
Total from investment operations | | | 8.32 | | | | 5.31 | | | | 0.88 | | | | 5.16 | | | | 0.08 | |
| | | | | | | | | | | | | | | | | | | | |
Less Dividends and Distributions: | | | | | | | | | | | | | | | | | | | | |
Dividends from net investment income | | | (0.03 | ) | | | (0.04 | ) | | | (0.04 | ) | | | (0.05 | ) | | | (0.03 | ) |
Distributions from net realized gains on investments | | | (2.58 | ) | | | (1.67 | ) | | | (1.72 | ) | | | (2.24 | ) | | | (1.38 | ) |
| | | | | | | | | | | | | | | | | | | | |
Total dividends and distributions | | | (2.61 | ) | | | (1.71 | ) | | | (1.76 | ) | | | (2.29 | ) | | | (1.41 | ) |
| | | | | | | | | | | | | | | | | | | | |
Net Asset Value, end of year | | $ | 25.61 | | | $ | 19.90 | | | $ | 16.30 | | | $ | 17.18 | | | $ | 14.31 | |
| | | | | | | | | | | | | | | | | | | | |
Total Return(a) | | | 42.73 | % | | | 33.13 | % | | | 4.61 | % | | | 36.24 | % | | | 0.39 | % |
Ratios/Supplemental Data: | | | | | | | | | | | | | | | | | | | | |
Net assets, end of year (in millions) | | $ | 226 | | | $ | 178 | | | $ | 151 | | | $ | 161 | | | $ | 143 | |
Average net assets (in millions) | | $ | 195 | | | $ | 167 | | | $ | 171 | | | $ | 158 | | | $ | 146 | |
Ratios to average net assets(b): | | | | | | | | | | | | | | | | | | | | |
Expenses after waivers and/or expense reimbursement | | | 0.62 | % | | | 0.62 | % | | | 0.61 | % | | | 0.62 | % | | | 0.62 | % |
Expenses before waivers and/or expense reimbursement | | | 0.62 | % | | | 0.62 | % | | | 0.61 | % | | | 0.62 | % | | | 0.62 | % |
Net investment income (loss) | | | 0.09 | % | | | 0.25 | % | | | 0.25 | % | | | 0.29 | % | | | 0.19 | % |
Portfolio turnover rate(c) | | | 22 | % | | | 16 | % | | | 12 | % | | | 16 | % | | | 21 | % |
| (a) | Total return is calculated assuming a purchase of a share on the first day and a sale on the last day of each year reported and includes reinvestment of dividends and distributions, if any, and does not reflect the effect of insurance contract charges. Total return does not reflect expenses associated with the separate account such as administrative fees, account charges and surrender charges which, if reflected, would reduce the total returns for all years shown. Performance figures may reflect fee waivers and/or expense reimbursements. In the absence of fee waivers and/or expense reimbursements, the total return would be lower. Past performance is no guarantee of future results. Total returns may reflect adjustments to conform to GAAP. |
| (b) | Does not include expenses of the underlying funds in which the Fund invests. |
| (c) | The Fund’s portfolio turnover rate is calculated in accordance with regulatory requirements, without regard to transactions involving short-term investments and certain derivatives. If such transactions were included, the Fund’s portfolio turnover rate may be higher. |
SEE NOTES TO FINANCIAL STATEMENTS.
C1
REPORT OF INDEPENDENT REGISTERED PUBLIC ACCOUNTING FIRM
To the Board of Directors of Prudential’s Gibraltar Fund, Inc. and Shareholders of Prudential’s Gibraltar Fund, Inc.
Opinion on the Financial Statements
We have audited the accompanying statement of assets and liabilities, including the schedule of investments, of Prudential’s Gibraltar Fund, Inc. (the “Fund”) as of December 31, 2020, and the related statements of operations and changes in net assets, including the related notes, and the financial highlights for the year then ended (collectively referred to as the “financial statements”). In our opinion, the financial statements present fairly, in all material respects, the financial position of the Fund as of December 31, 2020, and the results of its operations, changes in its net assets, and the financial highlights for the year then ended in conformity with accounting principles generally accepted in the United States of America.
The financial statements of the Fund as of and for the year ended December 31, 2019 and the financial highlights for each of the periods ended on or prior to December 31, 2019 (not presented herein, other than the statement of changes in net assets and the financial highlights) were audited by other auditors whose report dated February 12, 2020 expressed an unqualified opinion on those financial statements and financial highlights.
Basis for Opinion
These financial statements are the responsibility of the Fund’s management. Our responsibility is to express an opinion on the Fund’s financial statements based on our audit. We are a public accounting firm registered with the Public Company Accounting Oversight Board (United States) (PCAOB) and are required to be independent with respect to the Fund in accordance with the U.S. federal securities laws and the applicable rules and regulations of the Securities and Exchange Commission and the PCAOB.
We conducted our audit of these financial statements in accordance with the standards of the PCAOB. Those standards require that we plan and perform the audit to obtain reasonable assurance about whether the financial statements are free of material misstatement, whether due to error or fraud.
Our audit included performing procedures to assess the risks of material misstatement of the financial statements, whether due to error or fraud, and performing procedures that respond to those risks. Such procedures included examining, on a test basis, evidence regarding the amounts and disclosures in the financial statements. Our audit also included evaluating the accounting principles used and significant estimates made by management, as well as evaluating the overall presentation of the financial statements. Our procedures included confirmation of securities owned as of December 31, 2020 by correspondence with the custodian and transfer agent. We believe that our audit provides a reasonable basis for our opinion.
/s/ PricewaterhouseCoopers LLP
New York, New York
February 16, 2021
We have served as the auditor of one or more investment companies in the Prudential Insurance Portfolios complex since 2020.
D1
FEDERAL INCOME TAX INFORMATION (unaudited)
We are advising you that during the year ended December 31, 2020, the Fund reports the maximum amount allowed per share but not less than $2.31 as a capital gain distribution in accordance with Section 852 (b)(3)(C) of the Internal Revenue Code.
For the year ended December 31, 2020, the Fund reports, in accordance with Section 854 of the Internal Revenue Code, the following percentages of the ordinary income distributions paid as 1) qualified dividend income (QDI); and 2) eligible for corporate dividends received deduction (DRD):
| | | | | | | | |
| | | QDI | | | DRD | |
Prudential’s Gibraltar Fund, Inc. | | | 50.03 | % | | | 41.47 | % |
D2
INFORMATION ABOUT TRUSTEES AND OFFICERS (Unaudited)
Information pertaining to the Directors and officers of the Fund is set forth below. The Directors are also referred to as “Trustees” or “Board Members.” Trustees who are not deemed to be interested persons of the Fund as defined in the 1940 Act are referred to as “Independent Trustees.” Trustees who are deemed to be “interested persons” of the Fund are referred to as “Interested Trustees.” The Trustees oversee the operations of the Fund and appoint officers who are responsible for the day-to-day business decisions based on policies set by the Board. The Fund is also referred to as the “Trust.” The “Fund Complex” consists of the Fund and any other investment companies managed by PGIM Investments LLC (PGIM Investments or the Investment Manager).
| | | | | | |
| | | | |
| Independent Trustees | | | | | | |
Name Year of Birth No. of Portfolios Overseen | | Principal Occupation(s) During Past Five Years | | Other Directorships Held | | Length of Board Service |
Susan Davenport Austin 1967 No. of Portfolios Overseen: 95 | | Chief Financial Officer of Grace Church School (Since September 2019); formerly Senior Managing Director of Brock Capital (2014-2019); formerly Vice Chairman (2013-2017), Senior Vice President and Chief Financial Officer (2007-2012) and Vice President of Strategic Planning and Treasurer (2002-2007) of Sheridan Broadcasting Corporation; formerly President of Sheridan Gospel Network (2004-2014); formerly Vice President, Goldman, Sachs & Co. (2000-2001); formerly Associate Director, Bear, Stearns & Co. Inc. (1997-2000); formerly Vice President, Salomon Brothers Inc. (1993-1997); Member of the Board of Directors, The MacDowell Colony (Since 2010); formerly Chairman (2011-2014), formerly Presiding Director (2014-2017) and currently a Member (2007-present) of the Board of Directors, Broadcast Music, Inc.; President, Candide Business Advisors, Inc. (Since 2011); formerly Member of the Board of Directors, National Association of Broadcasters (2004-2010). | | Director of NextEra Energy Partners, LP (NYSE: NEP) (Since February 2015); Director of Broadcast Music, Inc. (Since 2007); Member of the Board of Directors, Hubbard Radio, LLC (Since 2011). | | Since February 2011 |
Sherry S. Barrat 1949 No. of Portfolios Overseen: 95 | | Formerly Vice Chairman of Northern Trust Corporation (financial services and banking institution) (2011-June 2012); formerly President, Personal Financial Services, Northern Trust Corporation (2006-2010); formerly Chairman & CEO, Western US Region, Northern Trust Corporation (1999-2005); formerly President & CEO, Palm Beach/Martin County Region, Northern Trust. | | Lead Director of NextEra Energy, Inc. (NYSE: NEE) (since May 2020); Director of NextEra Energy, Inc. (since 1998); Director of Arthur J. Gallagher & Company (Since July 2013). | | Since January 2013 |
Jessica M. Bibliowicz 1959 No. of Portfolios Overseen: 95 | | Chairman of the Board of Overseers of Weill Cornell Medicine (since 2014); Formerly Chief Executive Officer (1999-2013) of National Financial Partners (independent distributor of financial services products). | | Formerly Director (2006-2019) of The Asia Pacific Fund, Inc.; Formerly Director of Sotheby’s (2014-2019) (auction house and art-related finance). | | Since September 2014 |
Kay Ryan Booth 1950 No. of Portfolios Overseen: 95 | | Advisory Partner, Trinity Private Equity Group (Since September 2014); formerly, Managing Director of Cappello Waterfield & Co. LLC (2011-2014); formerly Vice Chair, Global Research, J.P. Morgan (financial services and investment banking institution) (June 2008-January 2009); formerly Global Director of Equity Research, Bear Stearns & Co., Inc. (financial services and investment banking institution) (1995-2008); formerly Associate Director of Equity Research, Bear Stearns & Co., Inc. (1987-1995). | | None. | | Since January 2013 |
E1
| | | | | | |
| | | | |
| Independent Trustees | | | | | | |
Name Year of Birth No. of Portfolios Overseen | | Principal Occupation(s) During Past Five Years | | Other Directorships Held | | Length of Board Service |
Stephen M. Chipman 1961 No. of Portfolios Overseen: 95 | | Formerly Group Managing Director, International Expansion and Regional Managing Director, Americas of Vistra (June 2018-June 2019); formerly Chief Executive Officer and Director of Radius (2016-2018); formerly Senior Vice Chairman (January 2015-October 2015) and Chief Executive Officer (January 2010-December 2014) of Grant Thornton LLP. | | Non-Executive Chairman (Since September 2019) of Litera Microsystems. Non-Executive Director of Stout (Since January 2020); Non-Executive Director of Clyde & Co. (Since January 2020). | | Since January 2018 |
Robert F. Gunia 1946 No. of Portfolios Overseen: 95 | | Director of ICI Mutual Insurance Company (June 2020-present; June 2016-June 2019; June 2012-June 2015); formerly Chief Administrative Officer (September 1999-September 2009) and Executive Vice President (December 1996-September 2009) of PGIM Investments LLC; formerly Executive Vice President (March 1999-September 2009) and Treasurer (May 2000-September 2009) of Prudential Mutual Fund Services LLC; formerly President (April 1999-December 2008) and Executive Vice President and Chief Operating Officer (December 2008-December 2009) of Prudential Investment Management Services LLC; formerly Chief Administrative Officer, Executive Vice President and Director (May 2003-September 2009) of AST Investment Services, Inc. | | Formerly Director (1989-2019) of The Asia Pacific Fund, Inc. | | Since July 2003 |
Thomas T. Mooney 1941 No. of Portfolios Overseen: 95 | | Formerly Chief Executive Officer, Excell Partners, Inc. (2005-2007); founding partner of High Technology of Rochester and the Lennox Technology Center; formerly President of the Greater Rochester Metro Chamber of Commerce (1976-2004); formerly Rochester City Manager (1973); formerly Deputy Monroe County Executive (1974-1976); Former President of The First Financial Fund and High Yield Plus Fund (1988-2005); Former Vice Chairman Monroe County Water Authority (1980-2002). | | Former Director of Executive Service Corps of Rochester (1988-1990); Former Director of Rural/Metro Medical Services (1985-1990); Former Trustee of Center for Governmental Research (1977-1995); Former Director of Excellus BlueCross BlueShield (1980-1998). | | Since July 2003 |
Thomas M. O’Brien 1950 No. of Portfolios Overseen: 95 | | Vice Chairman of Emigrant Bank and President of its Naples Commercial Finance Division (Since October 2018); formerly Director, President and CEO Sun Bancorp, Inc. N.A. (NASDAQ: SNBC) and Sun National Bank (July 2014-February 2018); formerly Consultant, Valley National Bancorp, Inc. and Valley National Bank (January 2012-June 2012); formerly President and COO (November 2006-April 2017) and CEO (April 2007-December 2011) of State Bancorp, Inc. and State Bank; formerly Vice Chairman (January 1997-April 2000) of North Fork Bank; formerly President and Chief Executive Officer (December 1984-December 1996) of North Side Savings Bank; formerly President and Chief Executive Officer (May 2000-June 2006) Atlantic Bank of New York. | | Formerly Director, Sun Bancorp, Inc. N.A. (NASDAQ: SNBC) and Sun National Bank (July 2014-February 2018); formerly Director, BankUnited, Inc. and BankUnited N.A. (NYSE: BKU) (May 2012-April 2014); formerly Director (April 2008-January 2012) of Federal Home Loan Bank of New York; formerly Director (December 1996-May 2000) of North Fork Bancorporation, Inc.; formerly Director (May 2000-April 2006) of Atlantic Bank of New York; Director (November 2006-January 2012) of State Bancorp, Inc. (NASDAQ: STBC) and State Bank of Long Island. | | Since July 2003 |
E2
| | | | | | |
| | | | |
| Interested Trustee | | | | | | |
Name Year of Birth No. of Portfolios Overseen | | Principal Occupation(s) During Past Five Years | | Other Directorships Held | | Length of Board Service |
Timothy S. Cronin 1965 Number of Portfolios Overseen: 95 | | Vice President of Prudential Annuities (Since May 2003); Senior Vice President of PGIM Investments LLC (Since May 2009); Chief Investment Officer and Strategist of Prudential Annuities (Since January 2004); Director of Investment & Research Strategy (Since February 1998); President of AST Investment Services, Inc. (Since March 2006). | | None. | | Since October 2009 |
| | | | |
| | | |
| Trust Officers(a) | | | | |
Name Year of Birth Position with the Trust | | Principal Occupation(s) During the Past Five Years | | Length of Service as Trust Officer |
Ken Allen 1969 Vice President | | Vice President of Investment Management (since December 2009). | | Since June 2019 |
Claudia DiGiacomo 1974 Chief Legal Officer | | Chief Legal Officer, Executive Vice President and Secretary of PGIM Investments LLC (since August 2020); Chief Legal Officer of Prudential Mutual Fund Services LLC (since August 2020); Chief Legal Officer of PIFM Holdco, LLC (since August 2020); Vice President and Corporate Counsel (since January 2005) of Prudential; and Corporate Counsel of AST Investment Services, Inc. (since August 2020); formerly Vice President and Assistant Secretary of PGIM Investments LLC (2005-2020); formerly Associate at Sidley Austin Brown & Wood LLP (1999-2004). | | Since December 2005 |
Andrew R. French 1962 Secretary | | Vice President (since December 2018-present) of PGIM Investments LLC; formerly, Vice President and Corporate Counsel (2010-2018) of Prudential; formerly Director and Corporate Counsel (2006-2010) of Prudential; Vice President and Assistant Secretary (since January 2007) of PGIM Investments LLC; Vice President and Assistant Secretary (since January 2007) of Prudential Mutual Fund Services LLC. | | Since October 2006 |
Melissa Gonzalez 1980 Assistant Secretary | | Vice President and Corporate Counsel (since September 2018) of Prudential; Vice President and Assistant Secretary (since August 2020) of PGIM Investments LLC; formerly Director and Corporate Counsel (March 2014-September 2018) of Prudential. | | Since March 2019 |
Patrick E. McGuinness 1986 Assistant Secretary | | Vice President and Assistant Secretary (since August 2020) of PGIM Investments LLC; Director and Corporate Counsel (since February 2017) of Prudential; and Corporate Counsel (2012-2017) of IIL, Inc. | | Since June 2020 |
Debra Rubano 1975 Assistant Secretary | | Vice President and Corporate Counsel (since November 2020) of Prudential; formerly Director and Senior Counsel of Allianz Global Investors U.S. Holdings LLC (2010-2020) and Assistant Secretary of numerous funds in the Allianz fund complex (2015-2020). | | Since December 2020 |
Dino Capasso 1974 Chief Compliance Officer | | Chief Compliance Officer (July 2019-Present) of PGIM Investments LLC; Chief Compliance Officer (July 2019-Present) of the PGIM Funds, Target Funds, Advanced Series Trust, The Prudential Series Fund, Prudential’s Gibraltar Fund, Inc., PGIM Global High Yield Fund, Inc., and PGIM High Yield Bond Fund, Inc.; Vice President and Deputy Chief Compliance Officer (June 2017-2019) of PGIM Investments LLC; formerly, Senior Vice President and Senior Counsel (January 2016-June 2017), and Vice President and Counsel (February 2012-December 2015) of Pacific Investment Management Company LLC. | | Since March 2018 |
E3
| | | | |
| | | |
| Trust Officers(a) | | | | |
Name Year of Birth Position with the Trust | | Principal Occupation(s) During the Past Five Years | | Length of Service as Trust Officer |
Charles H. Smith, III 1973 Anti-Money Laundering Compliance Officer | | Vice President, Corporate Compliance, Anti-Money Laundering Unit (since January 2015) of Prudential; committee member of the American Council of Life Insurers Anti-Money Laundering and Critical Infrastructure Committee (since January 2016); formerly Global Head of Economic Sanctions Compliance at AIG Property Casualty (February 2007-December 2014); Assistant Attorney General at the New York State Attorney General’s Office, Division of Public Advocacy. (August 1998-January 2007). | | Since January 2017 |
Christian J. Kelly 1975 Treasurer and Principal Financial and Accounting Officer | | Vice President, Head of Fund Administration of PGIM Investments LLC (since November 2018); formerly, Director of Fund Administration of Lord Abbett & Co. LLC (2009-2018), Treasurer and Principal Accounting Officer of the Lord Abbett Family of Funds (2017-2018); Director of Accounting, Avenue Capital Group (2008-2009); Senior Manager, Investment Management Practice of Deloitte & Touche LLP (1998-2007). | | Since January 2019 |
Lana Lomuti 1967 Assistant Treasurer | | Vice President (since 2007) and Director (2005-2007), within PGIM Investments Fund Administration; formerly Assistant Treasurer (December 2007-February 2014) of The Greater China Fund, Inc. | | Since April 2014 |
Russ Shupak 1973 Assistant Treasurer | | Vice President (since 2017) and Director (2013-2017), within PGIM Investments Fund Administration. | | Since October 2019 |
Deborah Conway 1969 Assistant Treasurer | | Vice President (since 2017) and Director (2007-2017), within PGIM Investments Fund Administration. | | Since October 2019 |
Elyse M. McLaughlin 1974 Assistant Treasurer | | Vice President (since 2017) and Director (2011-2017), within PGIM Investments Fund Administration. | | Since October 2019 |
Alina Srodecka, CPA 1966 Assistant Treasurer | | Vice President of Tax at Prudential Financial, Inc. (Since August 2007); formerly Director of Tax at MetLife (January 2003-May 2006); formerly Tax Manager at Deloitte & Touché (October 1997-January 2003); formerly Staff Accountant at Marsh & McLennan (May 1994-May 1997). | | Since June 2017 |
(a) Excludes Mr. Cronin, an Interested Trustee who also serves as President and Principal Executive Officer.
Explanatory Notes to Tables:
Trustees are deemed to be “Interested,” as defined in the 1940 Act, by reason of their affiliation with PGIM Investments and/or an affiliate of PGIM Investments. Timothy S. Cronin is an Interested Trustee because he is employed by an affiliate of the Manager.
Unless otherwise noted, the address of all Trustees and Officers is c/o PGIM Investments LLC, 655 Broad Street, Newark, New Jersey 07102.
There is no set term of office for Trustees or Officers. The Independent Trustees have adopted a retirement policy, which calls for the retirement of Trustees on December 31 of the year in which they reach the age of 78, provided that the Board may extend the retirement age on a year-by-year basis for a Trustee.
As used in the Officer’s table, “Prudential” means The Prudential Insurance Company of America
“Other Directorships Held” includes all directorships of companies required to register or file reports with the SEC under the 1934 Act (that is, “public companies”) or other investment companies registered under the 1940 Act.
“No. of Portfolios Overseen” includes all investment companies managed by PGIM Investments and/or ASTIS that are overseen by the Trustee. The investment companies for which PGIM Investments and/or ASTIS serves as Manager include The Prudential Variable Contract Accounts, The Prudential Series Fund, Advanced Series Trust, Prudential’s Gibraltar Fund, Inc., the PGIM Funds, the PGIM High Yield Bond Fund, Inc., PGIM Global High Yield Fund, Inc. and PGIM Short Duration High Yield Opportunities Fund.
E4
Investors should carefully consider the contract and the Fund’s investment objective, risks, and charges and expenses before investing. The contract and the Fund prospectus contain information relating to investment objectives, risks, and charges and expenses, as well as other important information. Read them carefully before investing or sending money.
Annuity contracts contain exclusions, limitations, reductions of benefits, and terms for keeping them in force. For costs and complete details, refer to your contract or contact your licensed financial professional. Contract guarantees are based on the claims-paying ability of the issuing company.
Information regarding how the Fund voted proxies relating to portfolio securities during the most recent 12-month period ended June 30 is available on the website of the Securities and Exchange Commission (the Commission) at www.sec.gov.
The Fund files with the Commission a complete listing of portfolio holdings as of its first and third calendar quarter-end on Form N-PORT. Form N-PORT is available on the Commission’s website at www.sec.gov or call (800) SEC-0330.
The Fund’s Statement of Additional Information contains additional information about the Fund’s Directors and is available without charge upon request by calling (888) 778-2888.
The Prudential Insurance Company of America
751 Broad Street
Newark, NJ 07102-3714
The Audited Financial Statements of The Prudential Insurance Company of America are available upon request. You may call (800) 944-8786 to obtain a free copy of the Audited Financial Statements.
For service-related questions, please contact the Annuity Service Center at (888) 778-2888.
©2021 Prudential Financial, Inc. and its related entities. PGIM Investments, the Prudential logo, the Rock symbol, and Bring Your Challenges are service marks of Prudential Financial, Inc. and its related entities, registered in many jurisdictions worldwide.
FSP-AR
Item 2 – Code of Ethics — See Exhibit (a)
As of the end of the period covered by this report, the registrant has adopted a code of ethics (the “Section 406 Standards for Investment Companies – Ethical Standards for Principal Executive and Financial Officers”) that applies to the registrant’s Principal Executive Officer and Principal Financial Officer; the registrant’s Principal Financial Officer also serves as the Principal Accounting Officer.
The registrant hereby undertakes to provide any person, without charge, upon request, a copy of the code of ethics. To request a copy of the code of ethics, contact the registrant 800-225-1852, and ask for a copy of the Section 406 Standards for Investment Companies - Ethical Standards for Principal Executive and Financial Officers.
Item 3 – Audit Committee Financial Expert –
The registrant’s Board has determined that Mr. Thomas O’Brien, member of the Board’s Audit Committee is an “audit committee financial expert,” and that he is “independent,” for purposes of this item.
Item 4 – Principal Accountant Fees and Services –
(a) Audit Fees
For the fiscal year ended December 31, 2020, the Registrant’s principal accountant was PricewaterhouseCoopers LLP (“PwC”). For the fiscal year ended December 31, 2020, PwC billed the Registrant $27,200 for professional services rendered for the audit of the Registrant’s annual financial statements or services that are normally provided in connection with statutory and regulatory filings.
For the fiscal year ended December 31, 2019, the Registrant’s principal accountant was KPMG LLP (“KPMG”). For the fiscal year ended December 31, 2019, KPMG billed the Registrant $27,200 for professional services rendered for the audit of the Registrant’s annual financial statements or services that are normally provided in connection with statutory and regulatory filings.
(b) Audit-Related Fees
For the fiscal year ended December 31, 2020, PwC did not bill the Registrant for audit-related services.
For the fiscal year ended December 31, 2020, fees of $4,945 were billed to the Registrant for services rendered by KPMG in connection with the auditor transition.
For the fiscal year ended December 31, 2019, fees of $1,418 were billed to the Registrant for services rendered by KPMG in connection with an accounting system conversion and were paid by The Bank of New York Mellon.
(c) Tax Fees
For the fiscal years ended December 31, 2020 and December 31, 2019: none.
(d) All Other Fees
For the fiscal years ended December 31, 2020 and December 31, 2019: none.
(e) (1) Audit Committee Pre-Approval Policies and Procedures
THE PGIM MUTUAL FUNDS
AUDIT COMMITTEE POLICY
on
Pre-Approval of Services Provided by the Independent
Accountants
The Audit Committee of each PGIM Mutual Fund is charged with the responsibility to monitor the independence of the Fund’s independent accountants. As part of this responsibility, the Audit Committee must pre-approve the independent accounting firm’s engagement to render audit and/or permissible non-audit services, as required by law. In evaluating a proposed engagement of the independent accountants, the Audit Committee will assess the effect that the engagement might reasonably be expected to have on the accountant’s independence. The Committee’s evaluation will be based on:
| | • | | a review of the nature of the professional services expected to be provided, |
| | • | | a review of the safeguards put into place by the accounting firm to safeguard independence, and |
| | • | | periodic meetings with the accounting firm. |
Policy for Audit and Non-Audit Services Provided to the Funds
On an annual basis, the scope of audits for each Fund, audit fees and expenses, and audit-related and non-audit services (and fees proposed in respect thereof) proposed to be performed by the Fund’s independent accountants will be presented by the Treasurer and the independent accountants to the Audit Committee for review and, as appropriate, approval prior to the initiation of such services.
Such presentation shall be accompanied by confirmation by both the Treasurer and the independent accountants that the proposed non-audit services will not adversely affect the independence of the independent accountants. Such proposed non-audit services shall be described in sufficient detail to enable the Audit Committee to assess the appropriateness of such services and fees, and the compatibility of the provision of such services with the auditor’s independence. The Committee shall receive periodic reports on the progress of the audit and other services which are approved by the Committee or by the Committee Chair pursuant to authority delegated in this Policy.
The categories of services enumerated under “Audit Services”, “Audit-related Services”, and “Tax Services” are intended to provide guidance to the Treasurer and the independent accountants as to those categories of services which the Committee believes are generally consistent with the independence of the independent accountants and which the Committee (or the Committee Chair) would expect upon the presentation of specific proposals to pre-approve. The enumerated categories are not intended as an exclusive list of audit, audit-related or tax services, which the Committee (or the Committee Chair) would consider for pre-approval.
Audit Services
The following categories of audit services are considered to be consistent with the role of the Fund’s independent accountants:
| | • | | Annual Fund financial statement audits |
| | • | | Seed audits (related to new product filings, as required) |
| | • | | SEC and regulatory filings and consents |
Audit-related Services
The following categories of audit-related services are considered to be consistent with the role of the Fund’s independent accountants:
| | • | | Accounting consultations |
| | • | | Fund merger support services |
| | • | | Agreed Upon Procedure Reports |
| | • | | Other Internal Control Reports |
Individual audit-related services that fall within one of these categories (except for fund merger support services) and are not presented to the Audit Committee as part of the annual pre-approval process are subject to an authorized pre-approval by the Audit Committee so long as the estimated fee for those services does not exceed $30,000. Any services provided under such pre-approval will be reported to the Audit Committee at its next regular meeting. Should the amount of such services exceed $30,000 any additional fees will be subject to pre-approval by the Committee Chair (or any other Committee member on whom this responsibility has been delegated). Fees related to fund merger support services are subject to a separate authorized pre-approval by the Audit Committee with fees determined on a per occurrence and merger complexity basis.
Tax Services
The following categories of tax services are considered to be consistent with the role of the Fund’s independent accountants:
| | • | | Tax compliance services related to the filing or amendment of the following: |
| | • | | Federal, state and local income tax compliance; and, |
| | • | | Sales and use tax compliance |
| | • | | Timely RIC qualification reviews |
| | • | | Tax distribution analysis and planning |
| | • | | Tax authority examination services |
| | • | | Tax appeals support services |
| | • | | Accounting methods studies |
| | • | | Fund merger support services |
| | • | | Tax consulting services and related projects |
Individual tax services that fall within one of these categories and are not presented to the Audit Committee as part of the annual pre-approval process are subject to an authorized pre-approval by the Audit Committee so long as the estimated fee for those services does not exceed $30,000. Any services provided under such pre-approval will be reported to the Audit Committee at its next regular meeting. Should the amount of such services exceed $30,000 any additional fees will be subject to pre-approval by the Committee Chair (or any other Committee member on whom this responsibility has been delegated).
Other Non-Audit Services
Certain non-audit services that the independent accountants are legally permitted to render will be subject to pre-approval by the Committee or by one or more Committee members to whom the Committee has delegated this authority and who will report to the full Committee any pre-approval decisions made pursuant to this Policy. Non-audit services presented for pre-approval pursuant to this paragraph will be accompanied by a confirmation from both the Treasurer and the independent accountants that the proposed services will not adversely affect the independence of the independent accountants.
Proscribed Services
The Fund’s independent accountants will not render services in the following categories of non-audit services:
| | • | | Bookkeeping or other services related to the accounting records or financial statements of the Fund |
| | • | | Financial information systems design and implementation |
| | • | | Appraisal or valuation services, fairness opinions, or contribution-in-kind reports |
| | • | | Internal audit outsourcing services |
| | • | | Management functions or human resources |
| | • | | Broker or dealer, investment adviser, or investment banking services |
| | • | | Legal services and expert services unrelated to the audit |
| | • | | Any other service that the Public Company Accounting Oversight Board determines, by regulation, is impermissible. |
Pre-approval of Non-Audit Services Provided to Other Entities Within the PGIM Fund Complex
Certain non-audit services provided to PGIM Investments LLC or any of its affiliates that also provide ongoing services to the PGIM Mutual Funds will be subject to pre-approval by the Audit Committee. The only non-audit services provided to these entities that will require pre-approval are those related directly to the operations and financial reporting of the Funds. Individual projects that are not presented to the Audit Committee as part of the annual pre-approval process will be subject to pre-approval by the Committee Chair (or any other Committee member on whom this responsibility has been delegated) so long as the estimated fee for those services does not exceed $30,000. Services presented for pre-approval pursuant to this paragraph will be accompanied by a confirmation from both the Treasurer and the independent accountants that the proposed services will not adversely affect the independence of the independent accountants.
Although the Audit Committee will not pre-approve all services provided to PGIM Investments LLC and its affiliates, the Committee will receive an annual report from the Fund’s independent accounting firm showing the aggregate fees for all services provided to PGIM Investments and its affiliates.
(e) (2) Percentage of services referred to in 4(b) – 4(d) that were approved by the audit committee –
For the fiscal years ended December 31, 2020 and December 31, 2019, 100% of the services referred to in Item 4(b) was approved by the audit committee.
(f) Percentage of hours expended attributable to work performed by other than full time employees of principal accountant if greater than 50%.
The percentage of hours expended on the principal accountant’s engagement to audit the registrant’s financial statements for the most recent fiscal year that were attributed to work performed by persons other than the principal accountant’s full-time, permanent employees was 0%.
(g) Non-Audit Fees
The aggregate non-audit fees billed by the Registrant’s principal accountant for services rendered to the registrant’s investment adviser and any entity controlling, controlled by, or under common control with the investment adviser that provides ongoing services to the registrant for the fiscal years ended December 31, 2020 and December 31, 2019 was $0 and $0, respectively.
(h) Principal Accountant’s Independence
Not applicable as the Registrant’s principal accountant has not provided non-audit services to the registrant’s investment adviser and any entity controlling, controlled by, or under common control with the investment adviser that provides ongoing services to the registrant that were not pre-approved pursuant to Rule 2-01(c)(7)(ii) of Regulation S-X.
Item 5 – Audit Committee of Listed Registrants – Not applicable.
Item 6 – Schedule of Investments – The schedule is included as part of the report to shareholders filed under Item 1 of this Form.
Item 7 – Disclosure of Proxy Voting Policies and Procedures for Closed-End Management Investment Companies – Not applicable.
Item 8 – Portfolio Managers of Closed-End Management Investment Companies – Not applicable.
Item 9 – Purchases of Equity Securities by Closed-End Management Investment Company and Affiliated Purchasers – Not applicable.
Item 10 – Submission of Matters to a Vote of Security Holders – There have been no material changes to these procedures.
Item 11 – Controls and Procedures
| | (a) | It is the conclusion of the registrant’s principal executive officer and principal financial officer that the effectiveness of the registrant’s current disclosure controls and procedures (such disclosure controls and procedures having been evaluated within 90 days of the date of this filing) provide reasonable assurance that the information required to be disclosed by the registrant has been recorded, processed, summarized and reported within the time period specified in the Commission’s rules and forms and that the information required to be disclosed by the registrant has been accumulated and communicated to the registrant’s principal executive officer and principal financial officer in order to allow timely decisions regarding required disclosure. |
| | (b) | There has been no significant change in the registrant’s internal control over financial reporting that occurred during the registrant’s most recent fiscal quarter of the period covered by this report that has materially affected, or is likely to materially affect, the registrant’s internal control over financial reporting. |
Item 12 – Controls and Procedures – Disclosure of Securities Lending Activities for Closed-End Management Investment Companies – Not applicable.
Item 13 – Exhibits
| | (3) Any | written solicitation to purchase securities under Rule 23c-1 – Not applicable. |
SIGNATURES
Pursuant to the requirements of the Securities Exchange Act of 1934 and the Investment Company Act of 1940, the registrant has duly caused this report to be signed on its behalf by the undersigned, thereunto duly authorized.
| | |
Registrant: | | Prudential’s Gibraltar Fund, Inc. |
| |
By: | | /s/ Andrew R. French |
| | Andrew R. French |
| | Secretary |
| |
Date: | | February 16, 2021 |
Pursuant to the requirements of the Securities Exchange Act of 1934 and the Investment Company Act of 1940, this report has been signed below by the following persons on behalf of the registrant and in the capacities and on the dates indicated.
| | |
By: | | /s/ Timothy S. Cronin |
| | Timothy S. Cronin |
| | President and Principal Executive Officer |
| |
Date: | | February 16, 2021 |
| |
By: | | /s/ Christian J. Kelly |
| | Christian J. Kelly |
| | Treasurer and Principal Financial and Accounting Officer |
| |
Date: | | February 16, 2021 |