UNITED STATES
SECURITIES AND EXCHANGE COMMISSION
Washington, D.C. 20549
FORM N-CSR
CERTIFIED SHAREHOLDER REPORT OF REGISTERED MANAGEMENT INVESTMENT COMPANIES
| | |
Investment Company Act file number: | | 811-01660 |
| |
Exact name of registrant as specified in charter: | | Prudential’s Gibraltar Fund, Inc. |
| |
Address of principal executive offices: | | 655 Broad Street, 6th Floor |
| | Newark, New Jersey 07102 |
| |
Name and address of agent for service: | | Andrew R. French |
| | 655 Broad Street, 6th Floor |
| | Newark, New Jersey 07102 |
| |
Registrant’s telephone number, including area code: | | 800-225-1852 |
| |
Date of fiscal year end: | | 12/31/2023 |
| |
Date of reporting period: | | 12/31/2023 |
Item 1 – Reports to Stockholders

Prudential’s Gibraltar Fund, Inc.
| | |
ANNUAL REPORT | | December 31, 2023 |
 |
|
This report provides financial information about Prudential’s Gibraltar Fund, Inc. (the Fund), an investment option under your variable contract. The views expressed in this report and information about the Fund’s portfolio holdings are for the period covered by this report and are subject to change thereafter. |

| | | | |
Prudential’s Gibraltar Fund, Inc. Table of Contents | | Annual Report | | December 31, 2023 |
| | ∎ | | REPORT OF THE INVESTMENT MANAGERS AND PRESENTATION OF PORTFOLIO HOLDINGS |
| | | | |
| Section A | | Schedule of Investments, Financial Statements, and |
| |
| | | Financial Highlights |
| |
| Section B | | Notes to Financial Statements |
| |
| Section C | | Report of Independent Registered Public Accounting Firm |
| |
| Section D | | Information about Board Members and Officers |
| | | | |
Prudential’s Gibraltar Fund, Inc. Letter to Planholders | | Annual Report | | December 31, 2023 |
At Prudential, our primary objective is to help investors achieve and maintain long-term financial success. Despite today’s uncertainties, we remain strong and ready to serve and support you. This Prudential’s Gibraltar Fund annual report outlines our efforts to achieve this goal. We hope you find it informative and useful.
Prudential has been building on a heritage of success for more than 145 years. You can count on our history of financial stability. We are diversified for endurance. Our balanced mix of risks and businesses positions us well to manage through any economic environment. We’ve applied the lessons from decades of challenges to be stronger because we are committed to keeping our promises to you.
Your financial professional is the best resource to help you make the most informed investment decisions. Together, you can build a diversified investment portfolio that aligns with your long-term financial goals. Please keep in mind that diversification and asset allocation strategies do not assure a profit or protect against loss in declining markets.
Thank you for selecting Prudential as one of your financial partners. A strong sense of social responsibility for our clients, our employees, and our communities has been embedded in the company since our founding. It guides our efforts to help our customers achieve peace of mind through financial wellness.
We value your trust and appreciate the opportunity to help you achieve financial security.
Sincerely,

| | |
Timothy S. Cronin | | |
President, | | |
Prudential’s Gibraltar Fund, Inc. | | January 31, 2024 |
| | | | |
Market Overview — unaudited | | Annual Report | | December 31, 2023 |
Equity Market Overview
Easing inflationary pressures, hopes for central bank interest rate cuts, and artificial intelligence (AI) excitement helped drive equity returns sharply higher in 2023. Markets rose despite several headwinds, including the failure of several high-profile banks in the spring and Hamas’ attack on Israel in October. Anticipation of a rate-cut pivot pushed the 10-year US Treasury yield lower, which helped bond markets post gains for the first time in two years. Conversely, oil and gas prices retreated based on fears of oversupply.
Equities rally worldwide during the year
US equities were led by the tech-heavy Nasdaq Composite, which soared 43.42%. The large-cap S&P 500 Index advanced 26.29%, and the broad-based Russell 3000 Index added 25.96%. Stocks gained internationally as well, with the MSCI ACWI Ex-US Index—a gauge of stock performance in developed and emerging markets outside the US—gaining 15.62%. (Performance is based on net returns in US dollars unless stated otherwise and assumes reinvestment of dividends.)
Rate-cut expectations drove market sentiment
The US Federal Reserve (the Fed) hiked the federal funds rate four times in 2023 but paused at its September Federal Open Market Committee (FOMC) meeting. Market enthusiasm spiked in December when the Fed held interest rates steady for the third consecutive FOMC meeting. After the December meeting, Fed Chairman Jerome Powell noted that rates were “likely at or near peak,” and the Fed signaled the potential for several rate cuts in 2024.
During the year, inflation trended lower while still remaining above the Fed’s 2% target. Gross domestic product gained steadily in both the first and second quarters, followed by faster-than-expected growth in the third quarter.
Generative AI boosts US technology stocks
Enthusiasm over generative AI and its implications for both labor and operational efficiencies drove US stock market gains during the year. The market capitalization of NVIDIA Corp., maker of an overwhelming majority of the chips needed for generative AI programs, surged to over $1 trillion. In all, seven mega-tech companies—Apple, Inc., Alphabet, Inc., Microsoft Corp., Amazon.com, Inc., Meta Platforms, Inc., Tesla, Inc.,and NVIDIA Corp. (also known as the Magnificent Seven)—accounted for most of the S&P 500 Index’s positive returns in 2023.
Fueled by technology stocks, growth equities handily outperformed value equities. During the year, the Russell 1000 Growth Index surged 42.68%, significantly higher than the 11.46% gain of the Russell 1000 Value Index. The Russell Midcap Index rose 17.23%, and the small-cap Russell 2000 Index added 16.93%.
Financials gain despite rising rates and bank failures
While financial services stocks ultimately ended the year higher, challenges proliferated as bank profit margins were squeezed by higher interest rates and elevated borrowing costs. Higher rates prompted concerns about liquidity, which then led to several bank runs. Over the course of a few weeks in the spring, the deposits of Silicon Valley Bank Group, Signature Bank, and First Republic Bank were all seized by the Federal Deposit Insurance Corporation, significantly impacting other regional banking stocks. Fears also spread to Europe as the 167-year-old Credit Suisse AG suffered a similar demise before it was absorbed by its rival UBS Group AG.
Oil and gas prices plummet
Despite increasing geopolitical strife in the Middle East and the continuation of the Russia-Ukraine war, oil prices fell during the year. Fears of oversupply weighed on markets, combined with a weaker-than-expected recovery in China. Natural gas prices experienced double-digit losses on record production, higher supply inventories, and a warm start to winter in the northern hemisphere.
Developed markets rally
European equities rose as inflation cooled during 2023. However, unlike the Fed in the United States, neither the European Central Bank nor the Bank of England gave any indication of potential interest rate cuts in 2024. Macroeconomic data in the region remained uncertain.
Japan’s negative interest rate policy, which has been in place since 2016, continued even as inflation remained above the Bank of Japan’s 2% target. The Bank of Japan maintained its conservative guidance, although indications surfaced that it would begin adjusting its ultra-loose monetary policy. Japanese stocks posted solid gains into year-end, helped by better earnings and corporate governance reform.
Developed equity markets outside the US and Canada, as measured by the MSCI EAFE Index, rose 18.85% during the year, while the MSCI Europe Index gained 19.89% and the MSCI Japan Index soared 20.32%.
| | | | |
Market Overview — unaudited (continued) | | Annual Report | | December 31, 2023 |
Emerging-market stocks trail as China’s recovery disappoints
Emerging-market stocks gained but underperformed their developed-market peers. The year began with strong hopes for a recovery in China as the country lifted its zero-COVID policy. When that optimism faded following the policy change, confidence waned and pushed down the value of stocks in China. Meanwhile, Indian stocks posted strong returns on bullish sentiment due to solid economic growth and robust international investments.
In Latin America, Mexico’s central bank said interest rate cuts were possible in early 2024 and revised its inflation and growth forecast for the year, while Brazil began its monetary policy easing during the summer. In Argentina, newly elected President Javier Milei lifted the value of stocks with his ideas for economic reform.
Fixed Income Market Overview
After a dismal bond market performance for most of 2023, strong rallies in November and December lifted fixed income prices. The potential end of central bank interest rate hikes and the growing possibility of rate cuts in 2024 were the driving forces behind the renewed strength in bonds.
The rally in bond prices pushed the US 10-year Treasury yield from 5.0% to below 4.0% in a matter of weeks, and the yield ultimately ended the year at 3.88%. (Yields move inversely to prices.) Bonds registered their first gain in two years, with the Bloomberg US Aggregate Bond Index gaining 5.53%. Bonds issued by the US government and indexed to inflation, or Treasury inflation-protected securities (TIPS), added 3.90% per the Bloomberg US TIPS Index.
High yield bonds (i.e., debt rated below investment grade) were the standout performers, rising 13.46%, as measured by the Bloomberg US Corporate High Yield Index. Emerging-market debt, based on the J.P. Morgan EMBI Global Diversified Index, also posted solid gains, up 11.09%. (All returns cited are in US dollars unless stated otherwise.)
Central bankers turn dovish
The year began with consistently hawkish comments from developed-market central banks and continued interest rate hikes. (A hawkish view signals a tighter monetary policy supported by the potential for higher rates. A dovish view signals the potential for a looser monetary policy supported by holding rates steady or lowering them.) Over the reporting period, the Federal Reserve (the Fed) raised rates by an additional 100 basis points. (One basis point equals 0.01%.)
While remaining above the Fed’s 2% target, inflation began to cool in the second half of 2023. Slowing pricing pressures prompted the Fed to pause interest rate hikes at its September Federal Open Market Committee (FOMC) meeting, and it held rates steady through the end of the year. The pause lifted market expectations that the Fed was likely done hiking and increased hopes for future rate cuts. After the December FOMC meeting, Fed Chairman Jerome Powell noted that rates were “likely at or near peak,” and the Fed signaled the potential for several rate cuts in 2024.
The European Central Bank (ECB) also paused interest rate hikes at its October meeting amid a cooling inflation environment. However, ECB officials stated that any hope of rate cuts would be “premature” and that the fight against inflation would continue. Despite a rising inflation trend, the Bank of Japan maintained its negative interest rate policy. However, the Bank of Japan began to loosen its grip on long-term interest rates, and signs emerged of a possible end to the country’s ultra-loose monetary policy.
Investors hope for a soft landing
The US economy proved resilient, as gross domestic product showed better-than-expected real growth in 2023, buoyed by strength in manufacturing and robust (albeit moderating) consumer spending, particularly on travel and entertainment. With inflation cooling and employment growth slowing, investors’ anticipation of a soft landing increased. (A soft landing refers to the central bank tightening monetary policy enough to slow the economy and lower inflation without causing a recession.)
Treasury yields spike but end the year unchanged
Throughout 2023, yields on short-term US Treasuries were higher than those of longer-dated issues, referred to as yield curve inversion. (Typically, longer-term issues command a higher yield than shorter issues.) While the yield curve inversion continued into year-end, interest rates started to normalize.
The 10-year US Treasury yield began the year at 3.88%, spiked as high as 5% in October, only to end the year back at 3.88%. This drop in yields helped the US Treasury market post its first annual gain since 2020. Short-maturity yields, which are more sensitive to changes in monetary policy, declined the most during the year.
Government bonds in the United Kingdom, Germany, and Japan followed a similar path, with 10-year yields retreating from highs earlier in the year.
Credit spreads widen
Spreads and yields tightened into year-end as risk assets benefited from easing pricing pressures, better-than-feared third-quarter corporate earnings, and expectations that the Fed would pivot to interest rate cuts sometime in 2024. (Risk assets generally refer to assets that potentially have a significant
| | | | |
Market Overview — unaudited (continued) | | Annual Report | | December 31, 2023 |
degree of price volatility, such as equities, high yield bonds, real estate, and currencies.) These solid fundamentals helped US investment-grade corporate spreads tighten. US high yield bonds rallied strongly amid lower new issuances, resilient economic data, and an ongoing supply deficit.
Emerging-market bond performance varies by region
Emerging-market bonds delivered positive returns in US dollar terms but underperformed their developed-market bond peers. Similar to equities, performance diverged by region. Latin America was the strongest performer, as local-currency bonds benefited from strong domestic economies. Asian bonds had a more mixed performance, as China’s economic headwinds and geopolitical tensions impacted the country’s sovereign bonds. Geopolitical strife caused bonds in emerging-market Europe, the Middle East, and Africa to lag.
| | | | |
Prudential’s Gibraltar Fund, Inc. | | | | December 31, 2023 |
Report of the Investment Manager - As of December 31, 2023 (Unaudited)
| | | | | | | | | | | | | | | | | | |
| | | Average Annual Total Returns | | | 1 Year | | | | 5 Years | | | | 10 Years | | | $10,000 INVESTED OVER 10 YEARS 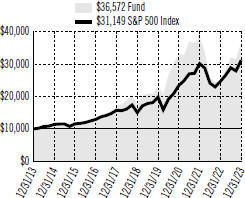
| | |
| | | Fund | | 48.88% | | | 15.92% | | | 13.85% | |
| | | S&P 500 Index | | | 26.29 | | | | 15.69 | | | | 12.03 | |
| | | Past performance is no guarantee of future returns. The investment return and principal value of an investment will fluctuate, so that shares, when redeemed, may be worth more or less than their original cost. Current performance may be lower or higher than the past performance. Fund performance is net of fund expenses, but not contract charges, which, if included, would significantly lower the performance quoted. | |
| | | | | | | | | | | | | | | |
| | | | | | | | | | | | | | | |
| | | | | | | | | | | | | | | |
| | | | | | | | | | | | | | | |
For the year ended December 31, 2023, Prudential’s Gibraltar Fund, Inc. returned 48.88%. The Fund outperformed the S&P 500 Index.
What were the market conditions during the reporting period?
Equities rose strongly in calendar year 2023 (the reporting period), led by gains in growth stocks, especially technology companies. The reporting period was dominated by the US Federal Reserve’s (the Fed’s) historic campaign of interest rate hikes.
Throughout the reporting period, many investors anticipated a significant slowdown and a possible recession that ultimately did not occur. The Fed’s expeditious steps following the failure of three major US banks in March provided stability and calm, resulting in a short-lived period of unease. The ongoing war in Ukraine and the Israel/Hamas conflict in the Middle East did not lead to a typical spike in energy prices. Indeed, the price of energy declined beginning in October, in line with reduced demand trends and abundant supply.
Volatility in the capital markets reflected economic and geopolitical realities in different ways throughout the reporting period. At the beginning of the reporting period, the 10-year US Treasury bond’s yield was approximately 3.8%, with an expectation that the federal funds rate would rise as the Fed’s battle to curb inflation continued. That rate, which started the reporting period in a range of 4.25% to 4.50%, reached a peak range of 5.25% to 5.50% in July and remained at that level through the end of the reporting period. Meanwhile, the 10-year US Treasury yield peaked at just under 5.0% in late October before declining at the end of the reporting period to its level at the beginning. Markets rallied in December after the Fed stated inflation had cooled and additional interest rate increases appeared unnecessary.
The grudging pace of the US economic slowdown was a surprise to many investors during the reporting period. In Prudential’s view, consumer resiliency in the face of geopolitical and macroeconomic turbulence was a significant reason, reflecting low unemployment, corporate balance sheet strength, and rising financial asset prices. Uncertainty about the US economy’s ability to avoid recession remained a focus at the end of the reporting period, with easing inflation and lower borrowing costs serving as economic tailwinds. Wage rates were no longer rising, and entry-level pay in some cases was below the COVID-19 pandemic peak. Corporate profits favorably weathered the post-pandemic period.
What strategies or holdings affected the Fund’s performance?*
The Fund significantly outperformed its benchmark index during the reporting period. The success of the Fed’s effort to lower inflation—along with clearing of the supply chain, resilient consumer spending, and most important, healthy earnings—drove the Fund’s strong performance.
During the previous reporting period, the Fund reduced or eliminated positions in companies with minimal free cash flows and very high valuations, as well as in companies that benefited disproportionately from COVID-19 pandemic demand. At the same time, positions were maintained in companies with strong fundamentals that were expected to perform well as share prices were revalued by the markets. Many of these maintained stock positions posted strong gains for the Fund during the reporting period. This price appreciation benefited from the depressed nature of valuations at the start of the reporting period, as well as from early indications that near- and medium-term revenue and profit expectations for numerous companies were beginning to improve.
For a complete list of holdings, please refer to the Schedule of Investments section of this report. Holdings reflect only long-term investments.
| | | | |
Prudential’s Gibraltar Fund, Inc. | | | | December 31, 2023 |
Report of the Investment Manager - As of December 31, 2023 (Unaudited) (Continued)
Key individual contributors to the Fund’s absolute return during the reporting period included Alphabet, Inc., Amazon.com, Inc., Microsoft Corp., Adobe, Inc., and Advanced Micro Devices, Inc. Key individual detractors from absolute return included Danaher Corp., Ulta Beauty, Inc., Chewy, Inc., Goldman Sachs Group, Inc., and NIKE, Inc.
Taken together, the last two reporting periods encompassed financial market distress driven by historic inflationary pressures and interest rate increases, followed by a rebound in asset prices to levels that, in some cases, reached near peaks. Valuation played a significant role in both the decline and rebound of asset prices. This period has been challenging, but Fund holdings meaningfully participated in the recovery. Prudential believes these companies navigated this environment in strong financial and operational health.
*This strategy and performance overview, which discusses what strategies or holdings (including derivatives, if applicable) affected the Portfolio’s performance, is compiled based on how the Portfolio performed relative to the Portfolio’s assigned performance index and is viewed for performance attribution purposes at the aggregate Portfolio level, which in most instances will not directly correlate to the amounts disclosed in the Statement of Operations which conform to U.S. generally accepted accounting principles.
Presentation of Portfolio Holdings — unaudited
| | | | |
| |
| Prudential’s Gibraltar Fund, Inc. (As of 12/31/2023) | | |
| | |
| Ten Largest Holdings | | Line of Business | | % of Net Assets |
Microsoft Corp. | | Software | | 7.5% |
| | |
| Amazon.com, Inc. | | Broadline Retail | | 6.4% |
Alphabet, Inc. (Class C Stock) | | Interactive Media & Services | | 6.2% |
| | |
| Adobe, Inc. | | Software | | 5.8% |
Costco Wholesale Corp. | | Consumer Staples Distribution & Retail | | 5.1% |
| | |
| Advanced Micro Devices, Inc. | | Semiconductors & Semiconductor Equipment | | 5.0% |
Apple, Inc. | | Technology Hardware, Storage & Peripherals | | 4.9% |
| | |
| Eli Lilly & Co. | | Pharmaceuticals | | 4.6% |
Novo Nordisk A/S (Denmark), ADR | | Pharmaceuticals | | 4.2% |
| | |
| Visa, Inc. (Class A Stock) | | Financial Services | | 4.1% |
For a complete list of holdings, please refer to the Schedule of Investments section of this report. Holdings reflect only long-term investments.
| | | | |
Prudential’s Gibraltar Fund, Inc. Benchmark Glossary — unaudited | | | | December 31, 2023 |
The index is unmanaged and includes reinvestment of any income or distributions. They do not reflect any fees, expenses or sales charges. Investors cannot invest directly in a market index.
S&P 500 Index is an unmanaged, market value-weighted index of over 500 stocks generally representative of the broad stock market.
The S&P 500 index is a product of S&P Dow Jones Indices LLC and/or its affiliates and has been licensed for use by PGIM, Inc. and/or its affiliates. Copyright © 2024 S&P Dow Jones Indices LLC, a division of S&P Global, Inc., and/or its affiliates. All rights reserved. Redistribution or reproduction in whole or in part are prohibited without written permission of S&P Dow Jones Indices LLC. For more information on any of S&P Dow Jones Indices LLC’s indices please visit www.spdji.com. S&P® is a registered trademark of S&P Global and Dow Jones® is a registered trademark of Dow Jones Trademark Holdings LLC.
| | | | |
Prudential’s Gibraltar Fund, Inc. Fees and Expenses — unaudited | | | | December 31, 2023 |
As a Planholder investing in the Fund through a variable contract, you incur ongoing costs, including management fees, distribution and/or service (12b-1) fees, and other Fund expenses, as applicable. This example is intended to help you understand your ongoing costs (in dollars) of investing in the Fund and to compare these costs with the ongoing costs of investing in other investment options. This example does not reflect fees and charges under your contract. If contract charges were included, the costs shown below would be higher. Please consult your contract for more information about contract fees and charges.
The example is based on an investment of $1,000 invested at the beginning of the period and held for the entire period July 1, 2023 through December 31, 2023.
Actual Expenses
The first line of the table below provides information about actual account values and actual expenses. You may use this information, together with the amount you invested, to estimate the Fund expenses that you paid over the period. Simply divide your account value by $1,000 (for example, an $8,600 account value divided by $1,000 = 8.6), then multiply the result by the number in the first line under the heading entitled “Expenses Paid During the Six-Month Period” to estimate the Fund expenses you paid on your account during this period. As noted above, the table does not reflect variable contract fees and charges.
Hypothetical Example for Comparison Purposes
The second line of the table below provides information about hypothetical account values and hypothetical expenses based on the Fund’s actual expense ratio and an assumed rate of return of 5% per year before expenses, which is not the Fund’s actual return. The hypothetical account values and expenses may not be used to estimate the actual ending account balance or expenses you paid for the period. You may use this information to compare the ongoing costs of investing in the Fund and other investment options. To do so, compare this 5% hypothetical example with the 5% hypothetical examples that appear in the shareholder reports of the other investment options.
Please note that the expenses shown in the table are meant to highlight your ongoing Fund costs only and do not reflect any contract fees and charges, such as sales charges (loads), insurance charges or administrative charges. Therefore the second line of the table is useful to compare ongoing investment option costs only, and will not help you determine the relative total costs of owning different contracts. In addition, if these contract fees and charges were included, your costs would have been higher.
| | | | | | | | | | |
| | | | | | |
| Prudential’s Gibraltar Fund, Inc. | | | | Beginning
Account Value
July 1, 2023 | | Ending
Account Value
December 31, 2023 | | Annualized Expense
Ratio Based on the
Six-Month Period | | Expenses Paid
During the
Six-Month Period* |
| | | | | |
Prudential’s Gibraltar Fund, Inc. | | Actual | | $1,000.00 | | $1,147.00 | | 0.67% | | $3.63 |
| | | Hypothetical | | $1,000.00 | | $1,021.83 | | 0.67% | | $3.41 |
* Fund expenses (net of fee waivers or subsidies, if any) are equal to the annualized expense ratio (provided in the table), multiplied by the average account value over the period, multiplied by the 184 days in the six-month period ended December 31, 2023, and divided by the 365 days in the Fund’s fiscal year ended December 31, 2023 (to reflect the six-month period). Expenses presented in the table include the expenses of any underlying portfolios in which the Fund may invest.
| | | | | | |
| | |
| | PRUDENTIAL’S GIBRALTAR FUND, INC. | | |
| | | | | | |
| |
| SCHEDULE OF INVESTMENTS | | as of December 31, 2023 |
| | | | | | | | |
| | | Shares | | | Value | |
|
| LONG-TERM INVESTMENTS — 99.9% | |
| | |
| COMMON STOCKS | | | | | | | | |
Aerospace & Defense — 0.8% | | | | | | | | |
Boeing Co. (The)* | | | 4,985 | | | $ | 1,299,390 | |
| | | | | | | | |
| | |
Automobiles — 4.0% | | | | | | | | |
Tesla, Inc.* | | | 25,678 | | | | 6,380,469 | |
| | | | | | | | |
| | |
Biotechnology — 1.4% | | | | | | | | |
Vertex Pharmaceuticals, Inc.* | | | 5,439 | | | | 2,213,075 | |
| | | | | | | | |
| | |
Broadline Retail — 7.1% | | | | | | | | |
Amazon.com, Inc.* | | | 66,591 | | | | 10,117,837 | |
MercadoLibre, Inc. (Brazil)* | | | 780 | | | | 1,225,801 | |
| | | | | | | | |
| | |
| | | | | | | 11,343,638 | |
| | | | | | | | |
Capital Markets — 1.3% | | | | | | | | |
Goldman Sachs Group, Inc. (The) | | | 2,084 | | | | 803,945 | |
Moody’s Corp. | | | 3,413 | | | | 1,332,981 | |
| | | | | | | | |
| | |
| | | | | | | 2,136,926 | |
| | | | | | | | |
Consumer Staples Distribution & Retail — 5.1% | |
Costco Wholesale Corp. | | | 12,386 | | | | 8,175,751 | |
| | | | | | | | |
| | |
Financial Services — 8.2% | | | | | | | | |
Mastercard, Inc. (Class A Stock) | | | 15,081 | | | | 6,432,197 | |
Visa, Inc. (Class A Stock)(a) | | | 25,188 | | | | 6,557,696 | |
| | | | | | | | |
| | |
| | | | | | | 12,989,893 | |
| | | | | | | | |
Ground Transportation — 2.5% | | | | | | | | |
Uber Technologies, Inc.* | | | 64,073 | | | | 3,944,975 | |
| | | | | | | | |
|
Health Care Equipment & Supplies — 2.6% | |
Intuitive Surgical, Inc.* | | | 12,455 | | | | 4,201,819 | |
| | | | | | | | |
|
Health Care Providers & Services — 1.0% | |
UnitedHealth Group, Inc | | | 2,935 | | | | 1,545,189 | |
| | | | | | | | |
| | |
Hotels, Restaurants & Leisure — 2.0% | | | | | | | | |
Airbnb, Inc. (Class A Stock)* | | | 11,184 | | | | 1,522,590 | |
Marriott International, Inc. (Class A Stock) | | | 7,453 | | | | 1,680,726 | |
| | | | | | | | |
| | |
| | | | | | | 3,203,316 | |
| | | | | | | | |
Interactive Media & Services — 12.1% | | | | | | | | |
Alphabet, Inc. (Class A Stock)* | | | 22,943 | | | | 3,204,908 | |
Alphabet, Inc. (Class C Stock)* | | | 69,863 | | | | 9,845,793 | |
Meta Platforms, Inc. (Class A Stock)* | | | 17,214 | | | | 6,093,067 | |
| | | | | | | | |
| | |
| | | | | | | 19,143,768 | |
| | | | | | | | |
IT Services — 1.9% | | | | | | | | |
MongoDB, Inc.* | | | 3,417 | | | | 1,397,040 | |
Snowflake, Inc. (Class A Stock)* | | | 8,086 | | | | 1,609,114 | |
| | | | | | | | |
| | |
| | | | | | | 3,006,154 | |
| | | | | | | | |
Pharmaceuticals — 8.8% | | | | | | | | |
Eli Lilly & Co. | | | 12,452 | | | | 7,258,520 | |
Novo Nordisk A/S (Denmark), ADR(a) | | | 64,546 | | | | 6,677,284 | |
| | | | | | | | |
| | |
| | | | | | | 13,935,804 | |
| | | | | | | | |
Semiconductors & Semiconductor Equipment — 8.5% | |
Advanced Micro Devices, Inc.* | | | 53,564 | | | | 7,895,869 | |
ARM Holdings PLC, ADR*(a) | | | 10,487 | | | | 788,046 | |
| | | | | | | | |
| | | Shares | | | Value | |
COMMON STOCKS (continued) | |
Semiconductors & Semiconductor Equipment (cont’d.) | |
NVIDIA Corp. | | | 9,766 | | | $ | 4,836,318 | |
| | | | | | | | |
| | |
| | | | | | | 13,520,233 | |
| | | | | | | | |
Software — 16.1% | | | | | | | | |
Adobe, Inc.* | | | 15,358 | | | | 9,162,583 | |
Microsoft Corp. | | | 31,889 | | | | 11,991,539 | |
Salesforce, Inc.* | | | 16,676 | | | | 4,388,123 | |
| | | | | | | | |
| | |
| | | | | | | 25,542,245 | |
| | | | | | | | |
Specialized REITs — 2.0% | | | | | | | | |
American Tower Corp. | | | 14,495 | | | | 3,129,181 | |
| | | | | | | | |
| | |
Specialty Retail — 3.1% | | | | | | | | |
Home Depot, Inc. (The) | | | 8,778 | | | | 3,042,016 | |
TJX Cos., Inc. (The) | | | 20,272 | | | | 1,901,716 | |
| | | | | | | | |
| | |
| | | | | | | 4,943,732 | |
| | | | | | | | |
Technology Hardware, Storage & Peripherals — 5.0% | |
Apple, Inc. | | | 40,821 | | | | 7,859,267 | |
| | | | | | | | |
|
Textiles, Apparel & Luxury Goods — 6.4% | |
Lululemon Athletica, Inc.* | | | 9,362 | | | | 4,786,697 | |
LVMH Moet Hennessy Louis Vuitton SE (France), ADR(a) | | | 7,539 | | | | 1,224,710 | |
NIKE, Inc. (Class B Stock) | | | 38,945 | | | | 4,228,259 | |
| | | | | | | | |
| | |
| | | | | | | 10,239,666 | |
| | | | | | | | |
TOTAL LONG-TERM INVESTMENTS
(cost $52,891,847) | | | | 158,754,491 | |
| | | | | | | | |
|
| SHORT-TERM INVESTMENTS — 5.0% | |
| |
| AFFILIATED MUTUAL FUNDS | | | | | |
PGIM Core Ultra Short Bond Fund(wb) | | | 180,193 | | | | 180,193 | |
PGIM Institutional Money Market Fund (cost $7,798,887; includes $7,762,431 of cash collateral for securities on loan)(b)(wb) | | | 7,813,110 | | | | 7,809,984 | |
| | | | | | | | |
| | |
TOTAL SHORT-TERM INVESTMENTS
(cost $7,979,080) | | | | | | | 7,990,177 | |
| | | | | | | | |
| | |
TOTAL INVESTMENTS—104.9%
(cost $60,870,927) | | | | | | | 166,744,668 | |
| |
Liabilities in excess of other assets — (4.9)% | | | | (7,855,666 | ) |
| | | | | | | | |
| |
NET ASSETS — 100.0% | | | $ | 158,889,002 | |
| | | | | | | | |
Below is a list of the abbreviation(s) used in the annual report:
ADR — American Depositary Receipt
REITs — Real Estate Investment Trust
SOFR — Secured Overnight Financing Rate
SEE NOTES TO FINANCIAL STATEMENTS.
A1
| | | | | | |
| | |
| | PRUDENTIAL’S GIBRALTAR FUND, INC. (CONTINUED) | | |
| | | | | | |
| |
| SCHEDULE OF INVESTMENTS | | as of December 31, 2023 |
| * | Non-income producing security. |
| (a) | All or a portion of security is on loan. The aggregate market value of such securities, including those sold and pending settlement, is $7,592,926; cash collateral of $7,762,431 (included in liabilities) was received with which the Fund purchased highly liquid short-term investments. In the event of significant appreciation in value of securities on loan on the last business day of the reporting period, the Fund may reflect a collateral value that is less than the market value of the loaned securities and such shortfall is remedied the following business day. |
| (b) | Represents security, or portion thereof, purchased with cash collateral received for securities on loan and includes dividend reinvestment. |
(wb) Represents an investment in a Fund affiliated with the Manager.
Fair Value Measurements:
Various inputs are used in determining the value of the Fund’s investments. These inputs are summarized in the three broad levels listed below.
Level 1—unadjusted quoted prices generally in active markets for identical securities.
Level 2—quoted prices for similar securities, interest rates and yield curves, prepayment speeds, foreign currency exchange rates and other observable inputs.
Level 3—unobservable inputs for securities valued in accordance with Board approved fair valuation procedures.
The following is a summary of the inputs used as of December 31, 2023 in valuing such portfolio securities:
| | | | | | | | | | | | |
| | | Level 1 | | | Level 2 | | | Level 3 | |
Investments in Securities | | | | | | | | | | | | |
Assets | | | | | | | | | | | | |
Long-Term Investments | | | | | | | | | | | | |
Common Stocks | | | | | | | | | | | | |
Aerospace & Defense | | $ | 1,299,390 | | | | $— | | | | $— | |
Automobiles | | | 6,380,469 | | | | — | | | | — | |
Biotechnology | | | 2,213,075 | | | | — | | | | — | |
Broadline Retail | | | 11,343,638 | | | | — | | | | — | |
Capital Markets | | | 2,136,926 | | | | — | | | | — | |
Consumer Staples Distribution & Retail | | | 8,175,751 | | | | — | | | | — | |
Financial Services | | | 12,989,893 | | | | — | | | | — | |
Ground Transportation | | | 3,944,975 | | | | — | | | | — | |
Health Care Equipment & Supplies | | | 4,201,819 | | | | — | | | �� | — | |
Health Care Providers & Services | | | 1,545,189 | | | | — | | | | — | |
Hotels, Restaurants & Leisure | | | 3,203,316 | | | | — | | | | — | |
Interactive Media & Services | | | 19,143,768 | | | | — | | | | — | |
IT Services | | | 3,006,154 | | | | — | | | | — | |
Pharmaceuticals | | | 13,935,804 | | | | — | | | | — | |
Semiconductors & Semiconductor Equipment | | | 13,520,233 | | | | — | | | | — | |
Software | | | 25,542,245 | | | | — | | | | — | |
Specialized REITs | | | 3,129,181 | | | | — | | | | — | |
Specialty Retail | | | 4,943,732 | | | | — | | | | — | |
Technology Hardware, Storage & Peripherals | | | 7,859,267 | | | | — | | | | — | |
Textiles, Apparel & Luxury Goods | | | 10,239,666 | | | | — | | | | — | |
Short-Term Investments | | | | | | | | | | | | |
Affiliated Mutual Funds | | | 7,990,177 | | | | — | | | | — | |
| | | | | | | | | | | | |
Total | | $ | 166,744,668 | | | | $— | | | | $— | |
| | | | | | | | | | | | |
Industry Classification:
The industry classification of investments and liabilities in excess of other assets shown as a percentage of net assets as of December 31, 2023 were as follows:
| | | | |
Software | | | 16.1 | % |
Interactive Media & Services | | | 12.1 | |
Pharmaceuticals | | | 8.8 | |
Semiconductors & Semiconductor Equipment | | | 8.5 | |
| | | | |
Financial Services | | | 8.2 | % |
Broadline Retail | | | 7.1 | |
Textiles, Apparel & Luxury Goods | | | 6.4 | |
Consumer Staples Distribution & Retail | | | 5.1 | |
SEE NOTES TO FINANCIAL STATEMENTS.
A2
| | | | | | |
| | |
| | PRUDENTIAL’S GIBRALTAR FUND, INC. (CONTINUED) | | |
| | | | | | |
| |
| SCHEDULE OF INVESTMENTS | | as of December 31, 2023 |
Industry Classification (continued):
| | | | |
Technology Hardware, Storage & Peripherals | | | 5.0 | % |
Affiliated Mutual Funds (4.9% represents investments purchased with collateral from securities on loan) | | | 5.0 | |
Automobiles | | | 4.0 | |
Specialty Retail | | | 3.1 | |
Health Care Equipment & Supplies | | | 2.6 | |
Ground Transportation | | | 2.5 | |
Hotels, Restaurants & Leisure | | | 2.0 | |
Specialized REITs | | | 2.0 | |
IT Services | | | 1.9 | |
| | | | |
Biotechnology | | | 1.4 | % |
Capital Markets | | | 1.3 | |
Health Care Providers & Services | | | 1.0 | |
Aerospace & Defense | | | 0.8 | |
| | | | |
| | | 104.9 | |
Liabilities in excess of other assets | | | (4.9 | ) |
| | | | |
| |
| | | 100.0 | % |
| | | | |
| | | | |
Financial Instruments/Transactions—Summary of Offsetting and Netting Arrangements:
The Fund entered into financial instruments/transactions during the reporting period that are either offset in accordance with current requirements or are subject to enforceable master netting arrangements or similar agreements that permit offsetting. The information about offsetting and related netting arrangements for financial instruments/transactions where the legal right to set-off exists is presented in the summary below.
Offsetting of financial instrument/transaction assets and liabilities:
| | | | | | |
| Description | | Gross Market
Value of
Recognized
Assets/(Liabilities) | | Collateral
Pledged/(Received)(1) | | Net
Amount |
Securities on Loan | | $7,592,926 | | $(7,592,926) | | $— |
| (1) | Collateral amount disclosed by the Fund is limited to the market value of financial instruments/transactions. |
SEE NOTES TO FINANCIAL STATEMENTS.
A3
| | | | | | |
| | |
| | PRUDENTIAL’S GIBRALTAR FUND, INC. (CONTINUED) | | |
STATEMENT OF ASSETS AND LIABILITIES
as of December 31, 2023
| | | | |
| ASSETS | | | | |
Investments at value, including securities on loan of $7,592,926: | | | | |
Unaffiliated investments (cost $52,891,847) | | $ | 158,754,491 | |
Affiliated investments (cost $7,979,080) | | | 7,990,177 | |
Dividends receivable | | | 223,401 | |
Tax reclaim receivable | | | 24,401 | |
Prepaid expenses | | | 1,702 | |
| | | | |
Total Assets | | | 166,994,172 | |
| | | | |
| LIABILITIES | | | | |
Payable to broker for collateral for securities on loan | | | 7,762,431 | |
Payable for investments purchased | | | 180,092 | |
Accrued expenses and other liabilities | | | 89,264 | |
Management fee payable | | | 72,993 | |
Directors’ fees payable. | | | 390 | |
| | | | |
Total Liabilities | | | 8,105,170 | |
| | | | |
| NET ASSETS | | $ | 158,889,002 | |
| | | | |
Net assets were comprised of: | | | | |
Shares of beneficial interest, at par | | $ | 78,611 | |
Paid-in capital in excess of par | | | 45,206,384 | |
Total distributable earnings (loss) | | | 113,604,007 | |
| | | | |
| Net assets, December 31, 2023 | | $ | 158,889,002 | |
| | | | |
Net asset value and redemption price per share, $158,889,002 / 7,861,065 outstanding shares of common stock | | $ | 20.21 | |
| | | | |
STATEMENT OF OPERATIONS
Year Ended December 31, 2023
| | | | |
NET INVESTMENT INCOME (LOSS) INCOME | | | | |
Unaffiliated dividend income (net of $14,184 foreign withholding tax) | | $ | 940,252 | |
Affiliated dividend income | | | 151,797 | |
Affiliated income from securities lending, net | | | 16,146 | |
| | | | |
Total income | | | 1,108,195 | |
| | | | |
| EXPENSES | | | | |
Management fee | | | 794,369 | |
Custodian and accounting fees | | | 47,423 | |
Professional fees | | | 39,389 | |
Audit fee | | | 29,150 | |
Directors’ fees | | | 10,821 | |
Miscellaneous | | | 28,739 | |
| | | | |
Total expenses | | | 949,891 | |
| | | | |
| NET INVESTMENT INCOME (LOSS) | | | 158,304 | |
| | | | |
| REALIZED AND UNREALIZED GAIN (LOSS) ON INVESTMENT TRANSACTIONS | | | | |
Net realized gain (loss) on investment transactions (including affiliated of $879) | | | 16,105,868 | |
Net change in unrealized appreciation (depreciation) on investments (including affiliated of $(210)) | | | 40,785,572 | |
| | | | |
| NET GAIN (LOSS) ON INVESTMENT TRANSACTIONS | | | 56,891,440 | |
| | | | |
| NET INCREASE (DECREASE) IN NET ASSETS RESULTING FROM OPERATIONS | | $ | 57,049,744 | |
| | | | |
STATEMENTS OF CHANGES IN NET ASSETS
| | | | | | | | | | | | | | | | | | | | |
| | | Year Ended December 31, 2023 | | Year Ended December 31, 2022 | |
INCREASE (DECREASE) IN NET ASSETS OPERATIONS | | | | | | | | | | | | | | | | | | | | |
Net investment income (loss) | | | | $ | 158,304 | | | | | | | | | $ | (112,454 | ) | | | | |
Net realized gain (loss) on investment transactions | | | | | 16,105,868 | | | | | | | | | | 8,345,543 | | | | | |
Net change in unrealized appreciation (depreciation) on investments | | | | | 40,785,572 | | | | | | | | | | (87,182,902 | ) | | | | |
| | | | | | | | | | | | | | | | | | | | |
NET INCREASE (DECREASE) IN NET ASSETS RESULTING FROM OPERATIONS | | | | | 57,049,744 | | | | | | | | | | (78,949,813 | ) | | | | |
| | | | | | | | | | | | | | | | | | | | |
| DIVIDENDS AND DISTRIBUTIONS | | | | | | | | | | | | | | | | | | | | |
Distributions from distributable earnings | | | | | (8,525,895 | ) | | | | | | | | | (11,897,456 | ) | | | | |
| | | | | | | | | | | | | | | | | | | | |
Tax return of capital distributions | | | | | — | | | | | | | | | | (75,678 | ) | | | | |
| | | | | | | | | | | | | | | | | | | | |
| CAPITAL STOCK TRANSACTIONS | | | | | | | | | | | | | | | | | | | | |
Capital stock sold (1,839 and 0 shares, respectively) | | | | | 36,423 | | | | | | | | | | — | | | | | |
Capital stock issued in reinvestment of dividends (435,439 and 759,132 shares, respectively) | | | | | 8,525,895 | | | | | | | | | | 11,973,134 | | | | | |
Capital stock purchased [1,324,841 and 1,413,001 shares, respectively] | | | | | (23,828,784 | ) | | | | | | | | | (25,184,039 | ) | | | | |
| | | | | | | | | | | | | | | | | | | | |
NET INCREASE (DECREASE) IN NET ASSETS FROM CAPITAL STOCK TRANSACTIONS | | | | | (15,266,466 | ) | | | | | | | | | (13,210,905 | ) | | | | |
| | | | | | | | | | | | | | | | | | | | |
| TOTAL INCREASE (DECREASE) | | | | | 33,257,383 | | | | | | | | | | (104,133,852 | ) | | | | |
| NET ASSETS: | | | | | | | | | | | | | | | | | | | | |
Beginning of year | | | | | 125,631,619 | | | | | | | | | | 229,765,471 | | | | | |
| | | | | | | | | | | | | | | | | | | | |
End of year | | | | $ | 158,889,002 | | | | | | | | | $ | 125,631,619 | | | | | |
| | | | | | | | | | | | | | | | | | | | |
SEE NOTES TO FINANCIAL STATEMENTS.
A4
| | | | | | |
| | |
| | PRUDENTIAL’S GIBRALTAR FUND, INC. (CONTINUED) | | |
| | | | | | | | | | | | | | | | | | | | |
| | | Year Ended December 31, | |
| | | 2023 | | | 2022 | | | 2021 | | | 2020 | | | 2019 | |
Per Share Operating Performance(a): | | | | | | | | | | | | | | | | | | | | |
Net Asset Value, beginning of year | | $ | 14.36 | | | $ | 24.44 | | | $ | 25.61 | | | $ | 19.90 | | | $ | 16.30 | |
| | | | | | | | | | | | | | | | | | | | |
Income (Loss) From Investment Operations: | | | | | | | | | | | | | | | | | | | | |
Net investment income (loss) | | | 0.02 | | | | (0.01 | ) | | | (0.07 | ) | | | 0.02 | | | | 0.05 | |
Net realized and unrealized gain (loss) on investment transactions | | | 6.96 | | | | (8.64 | ) | | | 3.91 | | | | 8.30 | | | | 5.26 | |
| | | | | | | | | | | | | | | | | | | | |
Total from investment operations | | | 6.98 | | | | (8.65 | ) | | | 3.84 | | | | 8.32 | | | | 5.31 | |
| | | | | | | | | | | | | | | | | | | | |
Less Dividends and Distributions: | | | | | | | | | | | | | | | | | | | | |
Dividends from net investment income | | | — | | | | — | | | | — | | | | (0.03 | ) | | | (0.04 | ) |
Tax return of capital distributions | | | — | | | | (0.01 | ) | | | — | | | | — | | | | — | |
Distributions from net realized gains on investments | | | (1.13 | ) | | | (1.42 | ) | | | (5.01 | ) | | | (2.58 | ) | | | (1.67 | ) |
| | | | | | | | | | | | | | | | | | | | |
Total dividends and distributions | | | (1.13 | ) | | | (1.43 | ) | | | (5.01 | ) | | | (2.61 | ) | | | (1.71 | ) |
| | | | | | | | | | | | | | | | | | | | |
Net Asset Value, end of year | | $ | 20.21 | | | $ | 14.36 | | | $ | 24.44 | | | $ | 25.61 | | | $ | 19.90 | |
| | | | | | | | | | | | | | | | | | | | |
Total Return(b) | | | 48.88 | % | | | (35.82 | )% | | | 15.26 | % | | | 42.73 | % | | | 33.13 | % |
Ratios/Supplemental Data: | | | | | | | | | | | | | | | | | | | | |
Net assets, end of year (in millions) | | $ | 159 | | | $ | 126 | | | $ | 230 | | | $ | 226 | | | $ | 178 | |
Average net assets (in millions) | | $ | 144 | | | $ | 161 | | | $ | 232 | | | $ | 195 | | | $ | 167 | |
Ratios to average net assets(c): | | | | | | | | | | | | | | | | | | | | |
Expenses after waivers and/or expense reimbursement | | | 0.66 | % | | | 0.62 | % | | | 0.61 | % | | | 0.62 | % | | | 0.62 | % |
Expenses before waivers and/or expense reimbursement | | | 0.66 | % | | | 0.62 | % | | | 0.61 | % | | | 0.62 | % | | | 0.62 | % |
Net investment income (loss) | | | 0.11 | % | | | (0.07 | )% | | | (0.27 | )% | | | 0.09 | % | | | 0.25 | % |
Portfolio turnover rate(d) | | | 19 | % | | | 15 | % | | | 18 | % | | | 22 | % | | | 16 | % |
| (a) | Calculated based on average shares outstanding during the year. |
| (b) | Total return is calculated assuming a purchase of a share on the first day and a sale on the last day of each year reported and includes reinvestment of dividends and distributions, if any, and does not reflect the effect of insurance contract charges. Total return does not reflect expenses associated with the separate account such as administrative fees, account charges and surrender charges which, if reflected, would reduce the total returns for all years shown. Performance figures may reflect fee waivers and/or expense reimbursements. In the absence of fee waivers and/or expense reimbursements, the total return would be lower. Past performance is no guarantee of future results. Total returns may reflect adjustments to conform to GAAP. |
| (c) | Does not include expenses of the underlying funds in which the Fund invests. |
| (d) | The Fund’s portfolio turnover rate is calculated in accordance with regulatory requirements, without regard to transactions involving short-term investments, certain derivatives and in-kind transactions (if any). If such transactions were included, the Fund’s portfolio turnover rate may be higher. |
SEE NOTES TO FINANCIAL STATEMENTS.
A5
NOTES TO FINANCIAL STATEMENTS
1. Organization
Prudential’s Gibraltar Fund, Inc. (the “Fund”) was originally incorporated in the State of Delaware on March 14, 1968 and was reincorporated in the State of Maryland effective May 1, 1997. It is registered as an open-end, management investment company under the Investment Company Act of 1940, as amended (“1940 Act”) and is a diversified fund for purposes of the 1940 Act. The Fund was organized by The Prudential Insurance Company of America (“PICA”) to serve as the investment medium for the variable contract accounts of The Prudential Financial Security Program. The Fund does not sell its shares to the public.
The investment objective of the Fund is growth of capital to the extent compatible with a concern for preservation of principal. Current income, if any, is incidental.
2. Accounting Policies
The Fund follows the investment company accounting and reporting guidance of the Financial Accounting Standards Board (“FASB”) Accounting Standard Codification (“ASC”) Topic 946 Financial Services — Investment Companies. The following is a summary of significant accounting policies followed by the Fund in the preparation of its financial statements. The policies conform to U.S. generally accepted accounting principles (“GAAP”). The Fund consistently follows such policies in the preparation of its financial statements.
Securities Valuation: The Fund holds securities and other assets and liabilities that are fair valued as of the close of each day (generally, 4:00 PM Eastern time) the New York Stock Exchange (“NYSE”) is open for trading. As described in further detail below, the Fund’s investments are valued daily based on a number of factors, including the type of investment and whether market quotations are readily available. The Fund’s Board of Directors (the “Board”) has approved the Fund’s valuation policies and procedures for security valuation and designated PGIM Investments LLC (“PGIM Investments” or the “Manager”) as the “Valuation Designee,” as defined by Rule 2a-5(b) under the 1940 Act, to perform the fair value determination relating to all Fund investments. Pursuant to the Board’s oversight, the Valuation Designee has established a Valuation Committee to perform the duties and responsibilities as Valuation Designee under Rule 2a-5. The valuation procedures permit the Fund to utilize independent pricing vendor services, quotations from market makers, and alternative valuation methods when market quotations are either not readily available or not deemed representative of fair value. Fair value is the estimated price that would be received to sell an asset or paid to transfer a liability in an orderly transaction between market participants on the measurement date.
For the fiscal reporting year-end, securities and other assets and liabilities were fair valued at the close of the last U.S. business day. Trading in certain foreign securities may occur when the NYSE is closed (including weekends and holidays). Because such foreign securities trade in markets that are open on weekends and U.S. holidays, the values of some of the Fund’s foreign investments may change on days when investors cannot purchase or redeem Fund shares.
Various inputs determine how the Fund’s investments are valued, all of which are categorized according to the three broad levels (Level 1, 2, or 3) detailed in the Schedule of Investments and referred to herein as the “fair value hierarchy” in accordance with FASB ASC Topic 820 Fair Value Measurement.
Common or preferred stocks, exchange-traded funds (“ETFs”) and derivative instruments, if applicable, that are traded on a national securities exchange are valued at the last sale price as of the close of trading on the applicable exchange where the security principally trades. Securities traded via NASDAQ are valued at the NASDAQ official closing price. To the extent these securities are valued at the last sale price or NASDAQ official closing price, they are classified as Level 1 in the fair value hierarchy. In the event that no sale or official closing price on a valuation date exists, these securities are generally valued at the mean between the last reported bid and ask prices, or at the last bid price in the absence of an ask price. These securities are classified as Level 2 in the fair value hierarchy.
Investments in open-end funds (other than ETFs) are valued at their net asset values as of the close of the NYSE on the date of valuation. These securities are classified as Level 1 in the fair value hierarchy since they may be purchased or sold at their net asset values on the date of valuation.
Securities and other assets that cannot be priced according to the methods described above are valued based on policies and procedures approved by the Board. In the event that unobservable inputs are used when determining such valuations, the securities will be classified as Level 3 in the fair value hierarchy. Altering one or more unobservable inputs may result in a significant change to a Level 3 security’s fair value measurement.
B1
When determining the fair value of securities, some of the factors influencing the valuation include: the nature of any restrictions on disposition of the securities; assessment of the general liquidity of the securities; the issuer’s financial condition and the markets in which it does business; the cost of the investment; the size of the holding and the capitalization of the issuer; the prices of any recent transactions or bids/offers for such securities or any comparable securities; and any available analyst media or other reports or information deemed reliable by the Valuation Designee regarding the issuer or the markets or industry in which it operates. Using fair value to price securities may result in a value that is different from a security’s most recent closing price and from the price used by other unaffiliated mutual funds to calculate their net asset values.
Master Netting Arrangements: The Fund is subject to various Master Agreements, or netting arrangements, with select counterparties. These are agreements which a subadviser may have negotiated and entered into on behalf of all or a portion of the Fund. A master netting arrangement between the Fund and the counterparty permits the Fund to offset amounts payable by the Fund to the same counterparty against amounts to be received and by the receipt of collateral from the counterparty by the Fund to cover the Fund’s exposure to the counterparty. However, there is no assurance that such mitigating factors are easily enforceable. In addition to master netting arrangements, the right to set-off exists when all the conditions are met such that each of the parties owes the other determinable amounts, the reporting party has the right to set-off the amount owed with the amount owed by the other party, the reporting party intends to set-off and the right of set-off is enforceable by law.
Securities Lending: The Fund lends its portfolio securities to banks and broker-dealers. The loans are secured by collateral at least equal to the market value of the securities loaned. Collateral pledged by each borrower is invested in an affiliated money market fund and is marked to market daily, based on the previous day’s market value, such that the value of the collateral exceeds the value of the loaned securities. In the event of significant appreciation in value of the securities on loan on the last business day of the reporting period, the financial statements may reflect a collateral value that is less than the market value of the loaned securities. Such shortfall is remedied as described above. Loans are subject to termination at the option of the borrower or the Fund. Upon termination of the loan, the borrower will return to the Fund securities identical to the loaned securities. The remaining open loans of the securities lending transactions are considered overnight and continuous. Should the borrower of the securities fail financially, the Fund has the right to repurchase the securities in the open market using the collateral.
The Fund recognizes income, net of any rebate and securities lending agent fees, for lending its securities in the form of fees or interest on the investment of any cash received as collateral. The borrower receives all interest and dividends from the securities loaned and such payments are passed back to the lender in amounts equivalent thereto, which are reflected in interest income or unaffiliated dividend income based on the nature of the payment on the Statement of Operations. The Fund also continues to recognize any unrealized gain (loss) in the market price of the securities loaned and on the change in the value of the collateral invested that may occur during the term of the loan. In addition, realized gain (loss) is recognized on changes in the value of the collateral invested upon liquidation of the collateral. Net earnings from securities lending are disclosed in the Statement of Operations.
Securities Transactions and Net Investment Income: Securities transactions are recorded on the trade date. Realized gains (losses) from investment and currency transactions are calculated on the specific identification method. Dividend income is recorded on the ex-date, or for certain foreign securities, when the Fund becomes aware of such dividends. Interest income, including amortization of premium and accretion of discount on debt securities, as required, is recorded on the accrual basis. Expenses are recorded on an accrual basis, which may require the use of certain estimates by management that may differ from actual expense amounts.
Taxes: It is the Fund’s policy to continue to meet the requirements of the Internal Revenue Code applicable to regulated investment companies and to distribute all of its taxable net investment income and capital gains, if any, to its shareholders. Therefore, no federal income tax provision is required. Withholding taxes on foreign dividends, interest and capital gains, if any, are recorded, net of reclaimable amounts, at the time the related income is earned.
Dividends and Distributions: Dividends and distributions to shareholders, which are determined in accordance with federal income tax regulations and which may differ from GAAP, are recorded on the ex-date. Permanent book/tax differences relating to income and gain (loss) are reclassified between total distributable earnings (loss) and paid-in capital in excess of par, as appropriate. The chart below sets forth the expected frequency of dividend and capital gains distributions to shareholders. Various factors may impact the frequency of dividend distributions to shareholders, including but not limited to adverse market conditions or portfolio holding-specific events.
| | |
Expected Distribution Schedule to Shareholders* | | Frequency |
Net Investment Income | | Semi-Annually |
B2
| | |
Expected Distribution Schedule to Shareholders* | | Frequency |
Short-Term Capital Gains | | Annually |
Long-Term Capital Gains | | Annually |
* Under certain circumstances, the Fund may make more than one distribution of short-term and/or long-term capital gains during a fiscal year.
Estimates: The preparation of financial statements requires management to make estimates and assumptions that affect the reported amounts and disclosures in the financial statements. Actual results could differ from those estimates.
3. Agreements
The Fund has a management agreement with the Manager pursuant to which it has responsibility for all investment advisory services, including supervision of the subadviser’s performance of such services, and for rendering administrative services.
The Manager has entered into a subadvisory agreement with Jennison Associates LLC (“Jennison” or the “subadviser”). The Manager pays for the services of the subadviser.
The management fee paid to the Manager is accrued daily and payable monthly at an annual rate of 0.55% of average daily net assets of the Fund. All amounts paid or payable by the Fund to the Manager, under the agreement, are reflected in the Statement of Operations.
The Fund has a distribution agreement with Prudential Investment Management Services LLC (“PIMS”), which acts as the distributor of the shares of the Fund. No distribution or service fees are paid to PIMS as distributor of shares of the Fund.
The Fund has entered into brokerage commission recapture agreements with certain registered broker-dealers. Under the brokerage commission recapture program, a portion of the commission is returned to the Fund. Such amounts are included within realized gain (loss) on investment transactions presented in the Statement of Operations. For the reporting period ended December 31, 2023, brokerage commission recaptured under these agreements was $1,619.
PGIM Investments, PICA, PIMS and Jennison are indirect, wholly-owned subsidiaries of Prudential Financial, Inc. (“Prudential”).
4. Other Transactions with Affiliates
The Fund may invest its overnight sweep cash in the PGIM Core Ultra Short Bond Fund (the “Core Fund”), and its securities lending cash collateral in the PGIM Institutional Money Market Fund (the “Money Market Fund”). The Core Fund and the Money Market Fund are each a series of Prudential Investment Portfolios 2, registered under the 1940 Act and managed by PGIM Investments. PGIM Investments and/or its affiliates are paid fees or reimbursed for providing their services to the Core Fund and the Money Market Fund. In addition to the realized and unrealized gains on investments in the Core Fund and Money Market Fund, earnings from such investments are disclosed on the Statement of Operations as “Affiliated dividend income” and “Affiliated income from securities lending, net”, respectively.
The Fund may enter into certain securities purchase or sale transactions under Board approved Rule 17a-7 procedures. Rule 17a-7 is an exemptive rule under the 1940 Act that, subject to certain conditions, permits purchase and sale transactions among affiliated investment companies, or between an investment company and a person that is affiliated solely by reason of having a common (or affiliated) investment adviser, common directors/trustees, and/or common officers. For the year ended December 31, 2023, no Rule 17a-7 transactions were entered into by the Fund.
5. Portfolio Securities
The aggregate cost of purchases and proceeds from sales of portfolio securities (excluding short-term investments and U.S. Government securities) for the reporting period ended December 31, 2023, were as follows:
| | |
| Cost of Purchases | | Proceeds from Sales |
| $26,710,769 | | $48,175,268 |
A summary of the cost of purchases and proceeds from sales of shares of affiliated mutual funds for the year ended December 31, 2023, is presented as follows:
B3
| | | | | | | | | | | | | | | | |
| | | | | | | | |
Value,
Beginning
of Year | | Cost of
Purchases | | Proceeds
from Sales | | Change in
Unrealized
Gain
(Loss) | | Realized
Gain
(Loss) | | Value,
End of Year | | Shares,
End of Year | | Income | |
| Short-Term Investments - Affiliated Mutual Funds: | | | | | | |
| | | | | |
PGIM Core Ultra Short Bond Fund(1)(wb) | | | | | | | | | | | | |
$ 2,346,130 | | $29,843,311 | | $32,009,248 | | $ — | | $ — | | $180,193 | | 180,193 | | | $151,797 | |
| | | |
| PGIM Institutional Money Market Fund(1)(b)(wb) | | | | | | |
9,619,172 | | 33,482,804 | | 35,292,661 | | (210) | | 879 | | 7,809,984 | | 7,813,110 | | | 16,146 | (2) |
$11,965,302 | | $63,326,115 | | $67,301,909 | | $(210) | | $879 | | $7,990,177 | | | | | $167,943 | |
| (1) | The Fund did not have any capital gain distributions during the reporting period. |
| (2) | The amount, or a portion thereof, represents the affiliated securities lending income shown on the Statement of Operations. |
| (b) | Represents security, or portion thereof, purchased with cash collateral received for securities on loan and includes dividend reinvestment. |
| (wb) | Represents an investment in a Fund affiliated with the Manager. |
6. Distributions and Tax Information
Distributions to shareholders, which are determined in accordance with federal income tax regulations and which may differ from GAAP, are recorded on the ex-date. In order to present total distributable earnings (loss) and paid-in capital in excess of par on the Statement of Assets and Liabilities that more closely represent their tax character, certain adjustments have been made to total distributable earnings (loss) and paid-in capital in excess of par for the Fund. The adjustments were due to Equalization.
For the year ended December 31, 2023, the adjustments were as follows:
| | |
Total Distributable Earnings (Loss) | | Paid-in Capital in Excess of Par |
| $(1,672) | | $1,672 |
For the year ended December 31, 2023, the tax character of dividends paid as reflected in the Statement of Changes in Net Assets were as follows:
| | | | | | |
Ordinary Income | | Long-Term Capital Gains | | Tax Return of Capital | | Total Dividends and Distributions |
$— | | $8,525,895 | | $— | | $8,525,895 |
For the year ended December 31, 2022, the tax character of dividends paid as reflected in the Statement of Changes in Net Assets were as follows:
| | | | | | |
Ordinary Income | | Long-Term Capital Gains | | Tax Return of Capital | | Total Dividends and Distributions |
$— | | $11,897,456 | | $75,678 | | $11,973,134 |
For the year ended December 31, 2023, the Fund had the following amounts of accumulated undistributed earnings on a tax basis:
| | |
Undistributed Ordinary Income | | Undistributed Long-Term Capital Gains |
| $182,934 | | $7,551,003 |
The United States federal income tax basis of the Fund’s investments and the net unrealized appreciation as of December 31, 2023 were as follows:
| | | | | | |
| Tax Basis | | Gross Unrealized Appreciation | | Gross Unrealized Depreciation | | Net Unrealized Appreciation |
$60,874,598 | | $106,044,257 | | $(174,187) | | $105,870,070 |
B4
The difference between GAAP and tax basis is primarily attributable to deferred losses on wash sales.
The Manager has analyzed the Fund’s tax positions taken on federal, state and local income tax returns for all open tax years and has concluded that no provision for income tax is required in the Fund’s financial statements for the current reporting period. Since tax authorities can examine previously filed tax returns, the Fund’s U.S. federal and state tax returns for each of the four fiscal years up to the most recent fiscal year ended December 31, 2023 are subject to such review.
7. Borrowings
The Fund , along with other affiliated registered investment companies (the “Participating Funds”), is a party to a Syndicated Credit Agreement (“SCA”) with a group of banks. The purpose of the SCA is to provide an alternative source of temporary funding for capital share redemptions. The table below provides details of the current SCA in effect at the reporting period-end as well as the prior SCA.
| | | | | | | | |
| | | Current SCA | | | | Prior SCA | | |
| | | | |
| Term of Commitment | | 9/29/2023 - 9/26/2024 | | | | 9/30/2022 – 9/28/2023 | | |
| | | | | |
| Total Commitment | | $ 1,200,000,000 | | | | $ 1,200,000,000 | | |
| | | | |
| Annualized Commitment Fee on the Unused Portion of the SCA | | 0.15% | | | | 0.15% | | |
| | | | | |
| Annualized Interest Rate on Borrowings | | 1.00% plus the higher of (1)
the effective federal funds
rate, (2) the daily SOFR
rate plus 0.10% or (3) zero
percent | | | | 1.00% plus the higher of (1)
the effective federal funds
rate, (2) the daily
SOFR rate plus 0.10% or (3) zero
percent | | |
Certain affiliated registered investment companies that are parties to the SCA include portfolios that are subject to a predetermined mathematical formula used to manage certain benefit guarantees offered under variable annuity contracts. The formula may result in large scale asset flows into and out of these portfolios. Consequently, these portfolios may be more likely to utilize the SCA for purposes of funding redemptions. It may be possible for those portfolios to fully exhaust the committed amount of the SCA, thereby requiring the Manager to allocate available funding per a Board-approved methodology designed to treat the Participating Funds in the SCA equitably.
The Fund did not utilize the SCA during the year ended December 31, 2023.
8. Capital and Ownership
Pursuant to the Fund’s Articles of Incorporation, the Fund is authorized to issue 75,000,000 shares, with a par value of $0.01 per share, and an aggregate par value of $750,000.
As of December 31, 2023, all shares of record of the Fund were owned by PICA on behalf of the owners of the three variable insurance products: Prudential’s Investment Plan Account, Prudential’s Annuity Plan Account and Prudential’s Annuity Plan Account-2.
9. Risks of Investing in the Fund
The Fund’s risks include, but are not limited to, some or all of the risks discussed below. For further information on the Fund’s risks, please refer to the Fund’s Prospectus and Statement of Additional Information.
Economic and Market Events Risk: Economic and market events risk is the risk that one or more markets in which the Fund invests will decline in value, including the possibility that the markets will decline sharply and unpredictably. While a Fund’s Manager or Subadviser(s) may make efforts to control the risks associated with market changes, and may attempt to identify changes as they occur, market environment changes can be sudden and extreme. Significant shocks to or disruptions of the financial markets or the economy, including those relating to general economic, political, or financial market conditions; significant or unexpected failures, near-failures or credit downgrades of key institutions; investor sentiment and market perceptions; unexpected changes in the prices of key commodities; government actions; geopolitical events or changes; and factors related to a specific issuer, geography, industry or sector, could adversely affect the liquidity and volatility of securities held by the Fund. In periods of market volatility and/or declines, the Fund may experience high levels of shareholder redemptions, and may have to sell securities at times when it would otherwise not do so, and at unfavorable prices.
Equity Securities Risk: The value of a particular stock or equity-related security held by the Fund could fluctuate, perhaps greatly, in response to a number of factors, such as changes in the issuer’s financial condition or the value of the equity
B5
markets or a sector of those markets. Such events may result in losses to the Fund. In addition, due to decreases in liquidity, the Fund may be unable to sell its securities holdings within a reasonable time at the price it values the security or at any price.
Expense Risk: The actual cost of investing in the Fund may be higher than the expenses shown in the “Annual Fund Operating Expenses” table in the Fund’s prospectus for a variety of reasons, including, for example, if the Fund’s average net assets decrease.
Investment Style Risk: Securities held by the Fund as a result of a particular investment style, such as growth or value, tend to perform differently (i.e., better or worse than other segments of, or the overall, stock market) depending on market and economic conditions and investor sentiment. At times when the investment style is out of favor, the Fund may underperform other funds that invest in similar asset classes but use different investment styles.
Liquidity and Valuation Risk: The Fund may hold one or more securities for which there are no or few buyers and sellers or the securities are subject to limitations on transfer. The Fund may be unable to sell those portfolio holdings at the desired time or price and may have difficulty determining the value of such securities for the purpose of determining the Fund’s net asset value. In such cases, investments owned by the Fund may be valued at fair value pursuant to policies and procedures adopted and implemented by the Manager. No assurance can be given that the fair value prices accurately reflect the value of the security. The Fund is subject to a liquidity risk management program, which limits the ability of the Fund to invest in illiquid investments.
Market and Management Risk: Markets in which the Fund invests may experience volatility and go down in value, and possibly sharply and unpredictably in short periods of time. Investment techniques, risk analyses and investment strategies, which may include quantitative models or methods, used by a subadviser in making investment decisions for the Fund are subject to human error and may not produce the intended or desired results. The value of the Fund’s investments may be negatively affected by the occurrence of domestic or global events, including war, terrorism, environmental disasters, natural disasters, sanctions, cybersecurity events, supply chain disruptions, political or civil instability, and public health emergencies, among others. Such events may reduce consumer demand or economic output, result in market closures, travel restrictions or quarantines, and significantly adversely impact the economy. There is no guarantee that the investment objective of the Fund will be achieved.
Regulatory Risk: The Fund is subject to a variety of laws and regulations which govern its operations. The Fund is subject to regulation by the Securities and Exchange Commission (the “SEC”). Similarly, the businesses and other issuers of the securities and other instruments in which the Fund invests are also subject to considerable regulation. Changes in laws and regulations may materially impact the Fund, a security, business, sector or market.
10. Recent Regulatory Developments
Effective January 24, 2023, the SEC adopted rule and form amendments to require mutual funds and ETFs to transmit concise and visually engaging streamlined annual and semiannual reports to shareholders that highlight key information deemed important for retail investors to assess and monitor their fund investments (the “Rule”). Other information, including financial statements, will no longer appear in the funds’ streamlined shareholder reports but must be available online, delivered free of charge upon request, and filed on a semiannual basis on Form N-CSR. The Rule and form amendments have a compliance date of July 24, 2024. At this time, management is evaluating the Rule and its impact to the Fund.
B6
REPORT OF INDEPENDENT REGISTERED PUBLIC ACCOUNTING FIRM
To the Board of Directors of Prudential’s Gibraltar Fund, Inc. and Shareholders of Prudential’s Gibraltar Fund, Inc.
Opinion on the Financial Statements
We have audited the accompanying statement of assets and liabilities, including the schedule of investments, of Prudential’s Gibraltar Fund, Inc. (the “Fund”) as of December 31, 2023, the related statement of operations for the year ended December 31, 2023, the statements of changes in net assets for each of the two years in the period ended December 31, 2023, including the related notes, and the financial highlights for each of the four years in the period ended December 31, 2023 (collectively referred to as the “financial statements”). In our opinion, the financial statements present fairly, in all material respects, the financial position of the Fund as of December 31, 2023, the results of its operations for the year then ended, the changes in its net assets for each of the two years in the period ended December 31, 2023 and the financial highlights for each of the four years in the period ended December 31, 2023 in conformity with accounting principles generally accepted in the United States of America.
The financial statements of the Fund as of and for the year ended December 31, 2019 and the financial highlights for the year ended December 31, 2019 (not presented herein, other than the financial highlights) were audited by other auditors whose report dated February 12, 2020 expressed an unqualified opinion on those financial statements and financial highlights.
Basis for Opinion
These financial statements are the responsibility of the Fund’s management. Our responsibility is to express an opinion on the Fund’s financial statements based on our audits. We are a public accounting firm registered with the Public Company Accounting Oversight Board (United States) (PCAOB) and are required to be independent with respect to the Fund in accordance with the U.S. federal securities laws and the applicable rules and regulations of the Securities and Exchange Commission and the PCAOB.
We conducted our audits of these financial statements in accordance with the standards of the PCAOB. Those standards require that we plan and perform the audit to obtain reasonable assurance about whether the financial statements are free of material misstatement, whether due to error or fraud.
Our audits included performing procedures to assess the risks of material misstatement of the financial statements, whether due to error or fraud, and performing procedures that respond to those risks. Such procedures included examining, on a test basis, evidence regarding the amounts and disclosures in the financial statements. Our audits also included evaluating the accounting principles used and significant estimates made by management, as well as evaluating the overall presentation of the financial statements. Our procedures included confirmation of securities owned as of December 31, 2023 by correspondence with the custodian, transfer agent and brokers; when replies were not received from brokers, we performed other auditing procedures. We believe that our audits provide a reasonable basis for our opinion.
/s/ PricewaterhouseCoopers LLP
New York, New York
February 15, 2024
We have served as the auditor of one or more investment companies in the Prudential Insurance Portfolios complex since 2020.
C1
FEDERAL INCOME TAX INFORMATION (unaudited)
We are advising you that during the year ended December 31, 2023, the Fund reports the maximum amount allowed per share but not less than $1.13 as a capital gain distribution in accordance with Section 852 (b)(3)(C) of the Internal Revenue Code.
C2
INFORMATION ABOUT BOARD MEMBERS AND OFFICERS
MANAGEMENT OF THE FUND
Information pertaining to the Directors and officers of the Fund is set forth below. The Directors are also referred to as “Board Members.” Board Members who are not deemed to be interested persons of the Fund as defined in the 1940 Act are referred to as “Independent Board Members.” Board Members who are deemed to be “interested persons” of the Fund are referred to as “Interested Board Members.” The Board Members oversee the operations of the Fund and appoint officers who are responsible for the day-to-day business decisions based on policies set by the Board.
| | | | | | |
| | | | |
Independent Board Members | | | | | | |
Name Year of Birth No. of Portfolios Overseen | | Principal Occupation(s) During Past Five Years | | Other Directorships Held | | Length of Board Service |
| | | | |
Susan Davenport Austin 1967 No. of Portfolios Overseen: 60 | | Chief Financial Officer and Chief Operating Officer of Grace Church School (since September 2019); President, Candide Business Advisors, Inc. (since 2011); formerly Senior Managing Director of Brock Capital (2014-2019); formerly Vice Chairman (2013-2017), Senior Vice President and Chief Financial Officer (2007-2012) and Vice President of Strategic Planning and Treasurer (2002-2007) of Sheridan Broadcasting Corporation; formerly President of Sheridan Gospel Network (2004-2014). | | Director of NextEra Energy Partners, LP (NYSE: NEP) (since February 2015); Member of the Board of Directors, Hubbard Radio, LLC (since 2011); formerly Chairman (2011-2014), formerly Presiding Director (2014-2017) and currently a Member (2007-present) of the Board of Directors, Broadcast Music, Inc.; formerly Member of the Board of Directors, The MacDowell Colony (2010-2021). | | Since February 2011 |
| | | | |
Sherry S. Barrat 1949 No. of Portfolios Overseen: 60 | | Formerly Vice Chairman of Northern Trust Corporation (financial services and banking institution) (2011-June 2012); formerly President, Personal Financial Services, Northern Trust Corporation (2006-2010); formerly Chairman & CEO, Western US Region, Northern Trust Corporation (1999-2005); formerly President & CEO, Palm Beach/Martin County Region, Northern Trust. | | Lead Director of NextEra Energy, Inc. (NYSE: NEE) (since May 2020); Director of NextEra Energy, Inc. (since 1998); Director of Arthur J. Gallagher & Company (since July 2013). | | Since January 2013 |
| | | | |
Jessica M. Bibliowicz 1959 No. of Portfolios Overseen: 60 | | Chairman of the Board of Fellows of Weill Cornell Medicine (since 2014); Director of Apollo Global Management, Inc. (since 2022); formerly Chief Executive Officer (1999-2013) of National Financial Partners (independent distributor of financial services products). | | Formerly Director of the Asia-Pacific Fund, Inc. (2006-2019); formerly Director of Sotheby’s (2014-2019) auction house and art-related finance. | | Since September 2014 |
| | | | |
Kay Ryan Booth 1950 No. of Portfolios Overseen: 60 | | Trinity Investors (since September 2014); formerly, Managing Director of Cappello Waterfield & Co. LLC (2011-2014); formerly Vice Chair, Global Research, J.P. Morgan (financial services and investment banking institution) (June 2008-January 2009); formerly Global Director of Equity Research, Bear Stearns & Co., Inc. (financial services and investment banking institution) (1995-2008); formerly Associate Director of Equity Research, Bear Stearns & Co., Inc. (1987-1995). | | None. | | Since January 2013 |
| | | | |
Stephen M. Chipman 1961 No. of Portfolios Overseen: 60 | | Formerly Group Managing Director, International Expansion and Regional Managing Director, Americas of Vistra (June 2018-June 2019); formerly Chief Executive Officer and Director of Radius (2016-2018); formerly Senior Vice Chairman (January 2015-October 2015) and Chief Executive Officer (January 2010-December 2014) of Grant Thornton LLP. | | Board of Directors of Willis Towers Watson Public Limited Company (WTW) (since April 2023); Chairman of the Board of Auxadi Holdco, S.L. (since February 2022); Non-Executive Director of Auxadi Holdco, S.L (since November 2020); Non-Executive Director of Stout (since January 2020); formerly Non-Executive Director of Clyde & Co. (January 2020-June 2021); Formerly Non-Executive Chairman (September 2019-January 2021) of Litera Microsystems. | | Since January 2018 |
| | | | |
Robert F. Gunia 1946 No. of Portfolios Overseen: 60 | | Director of ICI Mutual Insurance Company (June 2020-June 2023; June 2012-June 2015); formerly Chief Administrative Officer (September 1999-September 2009) and Executive Vice President (December 1996-September 2009) of PGIM Investments LLC; formerly Executive Vice President (March 1999-September 2009) and Treasurer (May 2000-September 2009) of Prudential Mutual Fund Services LLC; formerly President (April 1999-December 2008) and Executive Vice President and Chief Operating Officer (December 2008-December 2009) of Prudential Investment Management Services LLC; formerly Chief Administrative Officer, Executive Vice President and Director (May 2003-September 2009) of AST Investment Services, Inc. | | Formerly Director (1989-2019) of The Asia Pacific Fund, Inc. | | Since July 2003 |
D1
| | | | | | |
| | | | |
Independent Board Members | | | | | | |
Name Year of Birth No. of Portfolios Overseen | | Principal Occupation(s) During Past Five Years | | Other Directorships Held | | Length of Board Service |
| | | | |
Thomas M. O’Brien 1950 No. of Portfolios Overseen: 60 | | Chairman, Chief Executive Officer and President of Sterling Bancorp (since June 2020); Chairman, Chief Executive Officer and President of Sterling Bank and Trust, F.S.B.; formerly Vice Chairman of Emigrant Bank and President of its Naples Commercial Finance Division (October 2018-March 2020); formerly Director, President and CEO Sun Bancorp, Inc. N.A. (NASDAQ: SNBC) and Sun National Bank (July 2014-February 2018); formerly Consultant, Valley National Bancorp, Inc. and Valley National Bank (January 2012-June 2012); formerly President and COO (November 2006-April 2017) and CEO (April 2007-December 2011) of State Bancorp, Inc. and State Bank; formerly Vice Chairman (January 1997-April 2000) of North Fork Bank; formerly President and Chief Executive Officer (December 1984-December 1996) of North Side Savings Bank; formerly President and Chief Executive Officer (May 2000-June 2006) Atlantic Bank of New York. | | Formerly Director, Sun Bancorp, Inc. N.A. (NASDAQ: SNBC) and Sun National Bank (July 2014-February 2018); formerly Director, BankUnited, Inc. and BankUnited N.A. (NYSE: BKU) (May 2012-April 2014); formerly Director (April 2008-January 2012) of Federal Home Loan Bank of New York; formerly Director (December 1996-May 2000) of North Fork Bancorporation, Inc.; formerly Director (May 2000-April 2006) of Atlantic Bank of New York; Director (November 2006-January 2012) of State Bancorp, Inc. (NASDAQ: STBC) and State Bank of Long Island. | | Since July 2003 |
| | | | | | |
| | | | |
Interested Board Member | | | | | | |
Timothy S. Cronin 1965 Number of Portfolios Overseen: 60 | | Vice President of Prudential Annuities (since May 2003); Senior Vice President of PGIM Investments LLC (since May 2009); Chief Investment Officer and Strategist of Prudential Annuities (since January 2004); Director of Investment & Research Strategy (since February 1998); President of AST Investment Services, Inc. (since March 2006). | | None. | | Since October 2009 |
| | | | |
| | | |
Officers(a) | | | | |
Name Year of Birth Position | | Principal Occupation(s) During the Past Five Years | | Length of Service as Officer |
| | | |
Ken Allen 1969 Vice President | | Vice President of Investment Management (since December 2009). | | Since June 2019 |
| | | |
Claudia DiGiacomo 1974 Chief Legal Officer and Assistant Secretary | | Chief Legal Officer (since September 2023) of the PGIM Credit Income Fund and the PGIM Rock ETF Trust; Chief Legal Officer (since September 2022) of the PGIM Private Credit Fund; Chief Legal Officer (since July 2022) of the PGIM Private Real Estate Fund, Inc.; Chief Legal Officer, Executive Vice President and Secretary of PGIM Investments LLC (since August 2020); Chief Legal Officer of Prudential Mutual Fund Services LLC (since August 2020); Chief Legal Officer of PIFM Holdco, LLC (since August 2020); Vice President and Corporate Counsel (since January 2005) of Prudential; and Corporate Counsel of AST Investment Services, Inc. (since August 2020); formerly Vice President and Assistant Secretary of PGIM Investments LLC (2005-2020); formerly Associate at Sidley Austin Brown & Wood LLP (1999-2004). | | Since December 2005 |
| | | |
Andrew R. French 1962 Secretary | | Vice President (since December 2018) of PGIM Investments LLC; Secretary (since September 2023) of the PGIM Credit Income Fund and the PGIM Rock ETF Trust; Secretary (since September 2022) of the PGIM Private Credit Fund; Secretary (since March 2022) of the PGIM Private Real Estate Fund, Inc.; formerly Vice President and Corporate Counsel (2010-2018) of Prudential; formerly Director and Corporate Counsel (2006-2010) of Prudential; Vice President and Assistant Secretary (since January 2007) of PGIM Investments LLC; Vice President and Assistant Secretary (since January 2007) of Prudential Mutual Fund Services LLC. | | Since October 2006 |
| | | |
Melissa Gonzalez 1980 Assistant Secretary | | Vice President and Corporate Counsel (since September 2018) of Prudential; Vice President and Assistant Secretary (since August 2020) of PGIM Investments LLC; Assistant Secretary (since September 2023) of the PGIM Credit Income Fund and the PGIM Rock ETF Trust; Assistant Secretary (since September 2022) of the PGIM Private Credit Fund; Assistant Secretary (since March 2022) of the PGIM Private Real Estate Fund, Inc.; formerly Director and Corporate Counsel (March 2014-September 2018) of Prudential. | | Since March 2019 |
| | | |
Patrick E. McGuinness 1986 Assistant Secretary | | Vice President and Assistant Secretary (since August 2020) of PGIM Investments LLC; Director and Corporate Counsel (since February 2017) of Prudential; Assistant Secretary (since September 2023) of the PGIM Credit Income Fund and the PGIM Rock ETF Trust; Assistant Secretary (since September 2022) of the PGIM Private Credit Fund; Assistant Secretary (since March 2022) of the PGIM Private Real Estate Fund, Inc. | | Since June 2020 |
D2
| | | | |
| | | |
Officers(a) | | | | |
Name Year of Birth Position | | Principal Occupation(s) During the Past Five Years | | Length of Service as Officer |
| | | |
Debra Rubano 1975 Assistant Secretary | | Vice President and Corporate Counsel (since November 2020) of Prudential; Assistant Secretary (since September 2023) of the PGIM Credit Income Fund and the PGIM Rock ETF Trust; Assistant Secretary (since September 2022) of the PGIM Private Credit Fund; Assistant Secretary (since March 2022) of the PGIM Private Real Estate Fund, Inc; formerly Director and Senior Counsel of Allianz Global Investors U.S. Holdings LLC (2010-2020) and Assistant Secretary of numerous funds in the Allianz fund complex (2015-2020). | | Since March 2021 |
| | | |
Andrew Donohue 1972 Chief Compliance Officer | | Chief Compliance Officer (since May 2023) of the PGIM Funds, Target Funds, PGIM ETF Trust, PGIM Global High Yield Fund, Inc., PGIM High Yield Bond Fund, Inc., PGIM Short Duration High Yield Opportunities Fund, Advanced Series Trust, The Prudential Series Fund, Prudential’s Gibraltar Fund, Inc., PGIM Private Credit Fund, PGIM Private Real Estate Fund, Inc.; Chief Compliance Officer of AST Investment Services, Inc. (since October 2022); Vice President, Chief Compliance Officer of PGIM Investments LLC (since September 2022); Chief Compliance Officer (since September 2023) of the PGIM Credit Income Fund and the PGIM Rock ETF Trust; formerly various senior compliance roles within Principal Global Investors, LLC., global asset management for Principal Financial (2011-2022), most recently as Global Chief Compliance Officer (2016-2022). | | Since May 2023 |
| | | |
Kelly Florio 1978 Anti-Money Laundering Compliance Officer | | Vice President, Corporate Compliance, Global Compliance Programs and Compliance Risk Management (since December 2021) of Prudential; formerly Head of Fraud Risk Management (October 2019-December 2021) at New York Life Insurance Company; formerly Head of Key Risk Area Operations (November 2018-October 2019), Director of the US Anti-Money Laundering Compliance Unit (2009-2018) and Bank Loss Prevention Associate (2006-2009) at MetLife. | | Since June 2022 |
| | | |
Christian J. Kelly 1975 Chief Financial Officer | | Vice President, Global Head of Fund Administration of PGIM Investments LLC (since November 2018); Chief Financial Officer (since March 2023) of PGIM Investments mutual funds, closed end funds and ETFs, Advanced Series Trust Portfolios, Prudential Series Funds and Prudential Gibraltar Fund; Chief Financial Officer (since September 2023) of the PGIM Credit Income Fund and the PGIM Rock ETF Trust; Chief Financial Officer of PGIM Private Credit Fund (since September 2022); Chief Financial Officer of PGIM Private Real Estate Fund, Inc. (since July 2022); formerly Treasurer and Principal Financial Officer (January 2019- March 2023) of PGIM Investments mutual funds, closed end funds and ETFs, Advanced Series Trust Portfolios, Prudential Series Funds and Prudential Gibraltar Fund; formerly Treasurer and Principal Financial Officer (March 2022 – July 2022) of the PGIM Private Real Estate Fund, Inc.; formerly Director of Fund Administration of Lord Abbett & Co. LLC (2009-2018), Treasurer and Principal Accounting Officer of the Lord Abbett Family of Funds (2017-2018); Director of Accounting, Avenue Capital Group (2008-2009); Senior Manager, Investment Management Practice of Deloitte & Touche LLP (1998-2007). | | Since January 2019 |
| | | |
Elyse M. McLaughlin 1974 Treasurer and Principal Accounting Officer | | Vice President (since 2017) within PGIM Investments Fund Administration; Treasurer and Principal Accounting Officer of the Advanced Series Trust, the Prudential Series Fund and the Prudential Gibraltar Fund (since March 2023); Treasurer and Principal Accounting Officer (since September 2023) of the PGIM Rock ETF Trust; Assistant Treasurer (since September 2023) of the PGIM Credit Income Fund; Treasurer and Principal Accounting Officer (since September 2022) of the PGIM Private Credit Fund; Assistant Treasurer (since March 2022) of the PGIM Private Real Estate Fund, Inc.; Assistant Treasurer of PGIM Investments mutual funds, closed end funds and ETFs (since October 2019); formerly Director (2011-2017) within PGIM Investments Fund Administration. | | Since October 2019 |
| | | |
Lana Lomuti 1967 Assistant Treasurer | | Vice President (since 2007) within PGIM Investments Fund Administration; formerly Assistant Treasurer (December 2007-February 2014) of The Greater China Fund, Inc.; formerly Director (2005-2007) within PGIM Investments Fund Administration. | | Since April 2014 |
| | | |
Russ Shupak 1973 Assistant Treasurer | | Vice President (since 2017) within PGIM Investments Fund Administration; Treasurer and Principal Accounting Officer of PGIM Investments mutual funds, closed end funds and ETFs (since March 2023); Treasurer and Principal Accounting Officer (since September 2023) of the PGIM Credit Income Fund; Treasurer and Principal Accounting Officer (since July 2022) of the PGIM Private Real Estate Fund, Inc.; Assistant Treasurer (since September 2023) of the PGIM Rock ETF Trust; Assistant Treasurer (since September 2022) of the PGIM Private Credit Fund; formerly Assistant Treasurer (March 2022 – July 2022) of the PGIM Private Real Estate Fund, Inc.; Assistant Treasurer of Advanced Series Trust Portfolios, Prudential Series Funds and Prudential Gibraltar Fund (since October 2019); formerly Director (2013-2017) within PGIM Investments Fund Administration. | | Since October 2019 |
| | | |
Deborah Conway 1969 Assistant Treasurer | | Vice President (since 2017) within PGIM Investments Fund Administration; formerly Director (2007-2017) within PGIM Investments Fund Administration. | | Since October 2019 |
D3
| | | | |
| | | |
Officers(a) | | | | |
Name Year of Birth Position | | Principal Occupation(s) During the Past Five Years | | Length of Service as Officer |
| | | |
Robert W. McCormack 1973 Assistant Treasurer | | Vice President (since 2019) within PGIM Investments Fund Administration; Assistant Treasurer (since March 2023) of PGIM Investments mutual funds, closed end funds, ETFs, Advanced Series Trust Portfolios, Prudential Series Funds and Prudential Gibraltar Fund; Assistant Treasurer (since September 2023) of the PGIM Credit Income Fund and the PGIM Rock ETF Trust; Assistant Treasurer (since September 2022) of the PGIM Private Credit Fund; Assistant Treasurer (since March 2022) of the PGIM Private Real Estate Fund, Inc.; formerly Director (2016-2019) within PGIM Investments Fund Administration; formerly Vice President within Goldman, Sachs & Co. Investment Management Controllers (2008-2016), Assistant Treasurer of Goldman Sachs Family of Funds (2015-2016). | | Since March 2023 |
| | | |
Alina Srodecka, CPA 1966 Assistant Treasurer | | Vice President of Tax at Prudential Financial, Inc. (Since August 2007); formerly Director of Tax at MetLife (January 2003 – May 2006); formerly Tax Manager at Deloitte & Touché (October 1997 – January 2003); formerly Staff Accountant at Marsh & McLennan (May 1994 – May 1997). | | Since June 2017 |
(a) Excludes Mr. Cronin, an Interested Board Member who also serves as President and Principal Executive Officer of the Trust.
Explanatory Notes to Tables:
Timothy S. Cronin is an Interested Board Member because he is an officer of the Trust and an officer of the Manager.
Unless otherwise noted, the address of all Board Members and Officers is c/o PGIM Investments LLC, 655 Broad Street, Newark, New Jersey 07102.
There is no set term of office for Board Members or Officers. The Independent Board Members have adopted a retirement policy, which calls for the retirement of Board Members on December 31 of the year in which they reach the age of 78, provided that the Board may extend the retirement age on a year-by-year basis for a Board Member.
As used in the Officer’s table, “Prudential” means The Prudential Insurance Company of America.
“Other Directorships Held” includes all directorships of companies required to register or file reports with the SEC under the 1934 Act (that is, “public companies”) or other investment companies registered under the 1940 Act.
“No. of Portfolios Overseen” includes all investment companies managed by PGIM Investments and/or ASTIS that are overseen by the Board Member. The investment companies for which PGIM Investments and/or ASTIS serves as Manager include PGIM Mutual Funds, Target Funds, PGIM ETF Trust, PGIM Rock ETF Trust, PGIM Private Real Estate Fund, Inc., PGIM Private Credit Fund, PGIM Credit Income Fund, PGIM High Yield Bond Fund, Inc., PGIM Global High Yield Fund, Inc., PGIM Short Duration High Yield Opportunities Fund, The Prudential Series Fund, Prudential’s Gibraltar Fund, Inc. and the Advanced Series Trust.
D4
Investors should carefully consider the contract and the Fund’s investment objective, risks, and charges and expenses before investing. The contract and the Fund prospectus contain information relating to investment objectives, risks, and charges and expenses, as well as other important information. Read them carefully before investing or sending money.
Annuity contracts contain exclusions, limitations, reductions of benefits, and terms for keeping them in force. For costs and complete details, refer to your contract or contact your licensed financial professional. Contract guarantees are based on the claims-paying ability of the issuing company.
A description of the policies and procedures that the Fund used to determine how to vote proxies relating to portfolio securities is available without charge upon request by calling the appropriate phone number listed below and on the website of the SEC at www.sec.gov. Information regarding how the Fund voted proxies relating to portfolio securities during the most recent 12-month period ended June 30 is available without charge upon request by calling the appropriate phone number listed below and on the website of the SEC at www.sec.gov.
The Fund files with the SEC a complete listing of portfolio holdings as of its first and third calendar quarter-end, which are publicly available on Form N-PORT. Form N-PORT is available on the SEC’s website at www.sec.gov or call (800) SEC-0330.
The Fund’s Statement of Additional Information contains additional information about the Fund’s Directors and is available without charge upon request by calling (888) 778-2888.
The Prudential Insurance Company of America
751 Broad Street
Newark, NJ 07102-3714
For service-related questions, please contact the Annuity Service Center at (888) 778-2888.
©2024 Prudential Financial, Inc. and its related entities. PGIM Investments, the Prudential logo, and the Rock symbol are service marks of Prudential Financial, Inc. and its related entities, registered in many jurisdictions worldwide.
FSP-AR
Item 2 – Code of Ethics — See Exhibit (a)
As of the end of the period covered by this report, the registrant has adopted a code of ethics (the “Section 406 Standards for Investment Companies – Ethical Standards for Principal Executive and Financial Officers”) that applies to the registrant’s Principal Executive Officer and Principal Financial Officer; the registrant’s Principal Financial Officer also serves as the Principal Accounting Officer.
The registrant hereby undertakes to provide any person, without charge, upon request, a copy of the code of ethics. To request a copy of the code of ethics, contact the registrant 800-225-1852, and ask for a copy of the Section 406 Standards for Investment Companies - Ethical Standards for Principal Executive and Financial Officers.
Item 3 – Audit Committee Financial Expert –
The registrant’s Board has determined that Mr. Stephen Chipman, member of the Board’s Audit Committee is an “audit committee financial expert,” and that he is “independent,” for purposes of this item.
Item 4 – Principal Accountant Fees and Services –
(a) Audit Fees
For the fiscal years ended December 31, 2023 and December 31, 2022, PricewaterhouseCoopers LLP (“PwC”), the Registrant’s principal accountant, billed the Registrant $29,150 and $27,200, respectively, for professional services rendered for the audit of the Registrant’s annual financial statements or services that are normally provided in connection with statutory and regulatory filings.
(b) Audit-Related Fees
For the fiscal years ended December 31, 2023 and December 31, 2022: none.
(c) Tax Fees
For the fiscal years ended December 31, 2023 and December 31, 2022: none.
(d) All Other Fees
For the fiscal years ended December 31, 2023 and December 31, 2022: none.
(e) (1) Audit Committee Pre-Approval Policies and Procedures
THE PGIM MUTUAL FUNDS
AUDIT COMMITTEE POLICY
on
Pre-Approval of Services Provided by the Independent
Accountants
The Audit Committee of each PGIM Mutual Fund is charged with the responsibility to monitor the independence of the Fund’s independent accountants. As part of this responsibility, the Audit Committee must pre-approve the independent accounting firm’s engagement to render audit and/or permissible non-audit services, as required by law. In evaluating a proposed engagement of the independent accountants, the Audit Committee will assess the effect that the engagement might reasonably be expected to have on the accountant’s independence. The Committee’s evaluation will be based on:
| | • | | a review of the nature of the professional services expected to be provided, |
| | • | | a review of the safeguards put into place by the accounting firm to safeguard independence, and |
| | • | | periodic meetings with the accounting firm. |
Policy for Audit and Non-Audit Services Provided to the Funds
On an annual basis, the scope of audits for each Fund, audit fees and expenses, and audit-related and non-audit services (and fees proposed in respect thereof) proposed to be performed by the Fund’s independent accountants will be presented by the Treasurer and the independent accountants to the Audit Committee for review and, as appropriate, approval prior to the initiation of such services. Such presentation shall be accompanied by confirmation by both the Treasurer and the independent accountants that the proposed non-audit services will not adversely affect the independence of the independent accountants. Such proposed non-audit services shall be described in sufficient detail to enable the Audit Committee to assess the appropriateness of such services and fees, and the compatibility of the provision of such services with the auditor’s independence. The Committee shall receive periodic reports on the progress of the audit and other services which are approved by the Committee or by the Committee Chair pursuant to authority delegated in this Policy.
The categories of services enumerated under “Audit Services”, “Audit-related Services”, and “Tax Services” are intended to provide guidance to the Treasurer and the independent accountants as to those categories of services which the Committee believes are generally consistent with the independence of the independent accountants and which the Committee (or the Committee Chair) would expect upon the presentation of specific proposals to pre-approve. The enumerated categories are not intended as an exclusive list of audit, audit-related or tax services, which the Committee (or the Committee Chair) would consider for pre-approval.
Audit Services
The following categories of audit services are considered to be consistent with the role of the Fund’s independent accountants:
| | • | | Annual Fund financial statement audits |
| | • | | Seed audits (related to new product filings, as required) |
| | • | | SEC and regulatory filings and consents |
Audit-related Services
The following categories of audit-related services are considered to be consistent with the role of the Fund’s independent accountants:
| | • | | Accounting consultations |
| | • | | Fund merger support services |
| | • | | Agreed Upon Procedure Reports |
| | • | | Other Internal Control Reports |
Individual audit-related services that fall within one of these categories (except for fund merger support services) and are not presented to the Audit Committee as part of the annual pre-approval process are subject to an authorized pre-approval by the Audit Committee so long as the estimated fee for those services does not exceed $30,000. Any services provided under such pre-approval will be reported to the Audit Committee at its next regular meeting. Should the amount of such services exceed $30,000 any additional fees will be subject to pre-approval by the Committee Chair (or any other Committee member on whom this responsibility has been delegated). Fees related to fund merger support services are subject to a separate authorized pre-approval by the Audit Committee with fees determined on a per occurrence and merger complexity basis.
Tax Services
The following categories of tax services are considered to be consistent with the role of the Fund’s independent accountants:
| | • | | Tax compliance services related to the filing or amendment of the following: |
| | • | | Federal, state and local income tax compliance; and, |
| | • | | Sales and use tax compliance |
| | • | | Timely RIC qualification reviews |
| | • | | Tax distribution analysis and planning |
| | • | | Tax authority examination services |
| | • | | Tax appeals support services |
| | • | | Accounting methods studies |
| | • | | Fund merger support services |
| | • | | Tax consulting services and related projects |
Individual tax services that fall within one of these categories and are not presented to the Audit Committee as part of the annual pre-approval process are subject to an authorized pre-approval by the Audit Committee so long as the estimated fee for those services does not exceed $30,000. Any services provided under such pre-approval will be reported to the Audit Committee at its next regular meeting. Should the amount of such services exceed $30,000 any additional fees will be subject to pre-approval by the Committee Chair (or any other Committee member on whom this responsibility has been delegated).
Other Non-Audit Services
Certain non-audit services that the independent accountants are legally permitted to render will be subject to pre-approval by the Committee or by one or more Committee members to whom the Committee has delegated this authority and who will report to the full Committee any pre-approval decisions made pursuant to this Policy. Non-audit services presented for pre-approval pursuant to this paragraph will be accompanied by a confirmation from both the Treasurer and the independent accountants that the proposed services will not adversely affect the independence of the independent accountants.
Proscribed Services
The Fund’s independent accountants will not render services in the following categories of non-audit services:
| | • | | Bookkeeping or other services related to the accounting records or financial statements of the Fund |
| | • | | Financial information systems design and implementation |
| | • | | Appraisal or valuation services, fairness opinions, or contribution-in-kind reports |
| | • | | Internal audit outsourcing services |
| | • | | Management functions or human resources |
| | • | | Broker or dealer, investment adviser, or investment banking services |
| | • | | Legal services and expert services unrelated to the audit |
| | • | | Any other service that the Public Company Accounting Oversight Board determines, by regulation, is impermissible. |
Pre-approval of Non-Audit Services Provided to Other Entities Within the PGIM Fund Complex
Certain non-audit services provided to PGIM Investments LLC or any of its affiliates that also provide ongoing services to the PGIM Mutual Funds will be subject to pre-approval by the Audit Committee. The only non-audit services provided to these entities that will require pre-approval are those related directly to the operations and financial reporting of the Funds. Individual projects that are not presented to the Audit Committee as part of the annual pre-approval process will be subject to pre-approval by the Committee Chair
(or any other Committee member on whom this responsibility has been delegated) so long as the estimated fee for those services does not exceed $30,000. Services presented for pre-approval pursuant to this paragraph will be accompanied by a confirmation from both the Treasurer and the independent accountants that the proposed services will not adversely affect the independence of the independent accountants.
Although the Audit Committee will not pre-approve all services provided to PGIM Investments LLC and its affiliates, the Committee will receive an annual report from the Fund’s independent accounting firm showing the aggregate fees for all services provided to PGIM Investments and its affiliates.
| (e) (2) | Percentage of services described in each of paragraphs (b) through (d) of this Item that were approved by the audit committee pursuant to paragraph (c)(7)(i)(C) of Rule 2-01 of Regulation S-X – |
| | | | |
| | Fiscal Year Ended December 31, 2023 | | Fiscal Year Ended December 31, 2022 |
| 4(b) | | Not applicable. | | Not applicable. |
| 4(c) | | Not applicable. | | Not applicable. |
| 4(d) | | Not applicable. | | Not applicable. |
(f) Percentage of hours expended attributable to work performed by other than full time employees of principal accountant if greater than 50%.
The percentage of hours expended on the principal accountant’s engagement to audit the registrant’s financial statements for the most recent fiscal year that were attributed to work performed by persons other than the principal accountant’s full-time, permanent employees was 0%.
(g) Non-Audit Fees
The aggregate non-audit fees billed by the Registrant’s principal accountant for services rendered to the registrant’s investment adviser and any entity controlling, controlled by, or under common control with the investment adviser that provides ongoing services to the registrant for the fiscal years ended December 31, 2023 and December 31, 2022 was $0 and $0, respectively.
(h) Principal Accountant’s Independence
Not applicable as the Registrant’s principal accountant has not provided non-audit services to the registrant’s investment adviser and any entity controlling, controlled by, or under common control with the investment adviser that provides ongoing services to the registrant that were not pre-approved pursuant to Rule 2-01(c)(7)(ii) of Regulation S-X.
(i) Not applicable.
(j) Not applicable.
Item 5 – Audit Committee of Listed Registrants – Not applicable.
Item 6 – Schedule of Investments – The schedule is included as part of the report to shareholders filed under Item 1 of this Form.
Item 7 – Disclosure of Proxy Voting Policies and Procedures for Closed-End Management Investment Companies – Not applicable.
Item 8 – Portfolio Managers of Closed-End Management Investment Companies – Not applicable.
| Item 9 – | Purchases of Equity Securities by Closed-End Management Investment Company and Affiliated Purchasers – Not applicable. |
Item 10 – Submission of Matters to a Vote of Security Holders – There have been no material changes to these procedures.
| Item 11 – | Controls and Procedures |
| | (a) | It is the conclusion of the registrant’s principal executive officer and principal financial officer that the effectiveness of the registrant’s current disclosure controls and procedures (such disclosure controls and procedures having been evaluated within 90 days of the date of this filing) provide reasonable assurance that the information required to be disclosed by the registrant has been recorded, processed, summarized and reported within the time period specified in the Commission’s rules and forms and that the information required to be disclosed by the registrant has been accumulated and communicated to the registrant’s principal executive officer and principal financial officer in order to allow timely decisions regarding required disclosure. |
| | (b) | There has been no significant change in the registrant’s internal control over financial reporting (as defined in Rule 30a-3(d) under the Act (17 CFR 270.30a-3(d)) that occurred during the period covered by this report that has materially affected, or is reasonably likely to materially affect, the registrant’s internal control over financial reporting. |
Item 12 – Controls and Procedures - Disclosure of Securities Lending Activities for Closed-End Management Investment Companies – Not applicable.
Item 13 – Exhibits
(a)(1) Code of Ethics – Attached hereto as Exhibit EX-99.CODE-ETH.
(a)(2) Certifications pursuant to Section 302 of the Sarbanes-Oxley Act – Attached hereto as Exhibit EX-99.CERT.
(a)(2)(1) Any written solicitation to purchase securities under Rule 23c-1 – Not applicable.
(a)(2)(2) Change in the registrant’s independent public accountant – Not applicable.
(b) Certifications pursuant to Section 906 of the Sarbanes-Oxley Act – Attached hereto as Exhibit EX-99.906CERT.
SIGNATURES
Pursuant to the requirements of the Securities Exchange Act of 1934 and the Investment Company Act of 1940, the registrant has duly caused this report to be signed on its behalf by the undersigned, thereunto duly authorized.
| | |
Registrant: | | Prudential’s Gibraltar Fund, Inc. |
| |
| By: | | /s/ Andrew R. French |
| | Andrew R. French |
| | Secretary |
| |
| Date: | | February 15, 2024 |
Pursuant to the requirements of the Securities Exchange Act of 1934 and the Investment Company Act of 1940, this report has been signed below by the following persons on behalf of the registrant and in the capacities and on the dates indicated.
| | |
| By: | | /s/ Timothy S. Cronin |
| | Timothy S. Cronin |
| | | President and Principal Executive Officer |
| |
| Date: | | February 15, 2024 |
| |
| By: | | /s/ Christian J. Kelly |
| | Christian J. Kelly |
| | Chief Financial Officer (Principal Financial Officer) |
| |
| Date: | | February 15, 2024 |