UNITED STATES
SECURITIES AND EXCHANGE COMMISSION
Washington, D.C. 20549
FORMN-CSR
CERTIFIED SHAREHOLDER REPORT OF REGISTERED MANAGEMENT
INVESTMENT COMPANIES
| | |
| Investment Company Act file number: | | 811-01660 |
| |
| Exact name of registrant as specified in charter: | | Prudential’s Gibraltar Fund, Inc. |
| |
| Address of principal executive offices: | | 655 Broad Street, 17th Floor |
| | | Newark, New Jersey 07102 |
| |
| Name and address of agent for service: | | Andrew R. French |
| | | 655 Broad Street, 17th Floor |
| | | Newark, New Jersey 07102 |
| |
| Registrant’s telephone number, including area code: | | 800-225-1852 |
| |
| Date of fiscal year end: | | 12/31/2018 |
| |
| Date of reporting period: | | 12/31/2018 |
Item 1 – Reports to Stockholders
Prudential’s Gibraltar Fund, Inc.
| | |
| ANNUAL REPORT | | December 31, 2018 |

This report provides financial information about Prudential’s Gibraltar Fund, Inc. (the Fund), an investment option under your variable contract.
The views expressed in this report and information about the Fund’s portfolio holdings are for the period covered by this report and are subject to change thereafter.

Investors should carefully consider the contract and the Fund’s investment objective, risks, and charges and expenses before investing. The contract and the Fund prospectus contain information relating to investment objectives, risks, and charges and expenses, as well as other important information. Read them carefully before investing or sending money.
Information regarding how the Fund voted proxies relating to portfolio securities during the most recent 12-month period ended June 30 is available on the website of the Securities and Exchange Commission (the Commission) atwww.sec.gov.
The Fund will file with the Commission a complete listing of portfolio holdings as of its first and third quarter-end onForm N-PORT. Form N-PORT will be available on the Commission’s website atwww.sec.gov or call(800) SEC-0330.
The Fund’s Statement of Additional Information contains additional information about the Fund’s Directors and is available without charge upon request by calling (888)778-2888.
| | | | |
Prudential’s Gibraltar Fund, Inc. Table of Contents | | Annual Report | | December 31, 2018 |
| ∎ | | REPORT OF THE INVESTMENT MANAGER |
| ∎ | | PRESENTATION OF PORTFOLIO HOLDINGS |
| | | | |
| Section A | | Schedule of Investments and Financial Statements |
| Section B | | Notes to Financial Statements |
| Section C | | Financial Highlights |
| Section D | | Report of Independent Registered Public Accounting Firm |
| Section E | | Information about Trustees and Officers |
| | | | |
Prudential’s Gibraltar Fund, Inc. Letter to Planholders | | Annual Report | | December 31, 2018 |
At Prudential, our primary objective is to help investors achieve and maintain long-term financial success. This Prudential’s Gibraltar Fund annual report outlines our efforts to achieve this goal. We hope you find it informative and useful.
Prudential has been building on a heritage of success for more than 135 years. We believe the array of our products provides a highly attractive value proposition to clients like you who are focused on financial security.
Your financial professional is the best resource to help you make the most informed investment decisions. Together, you can build a diversified investment portfolio that aligns with your long-term financial goals. Please keep in mind that diversification and asset allocation strategies do not assure a profit or protect against loss in declining markets.
Thank you for selecting Prudential as one of your financial partners. We value your trust and appreciate the opportunity to help you achieve financial security.
Sincerely,

Timothy S. Cronin
President,
Prudential’s Gibraltar Fund, Inc. | January 31, 2019 |
| | | | |
| Market Overview — unaudited | | Annual Report | | December 31, 2018 |
Equity Market Overview
Stock markets worldwide retreated in 2018 and volatility spiked late in the year, triggered by uncertainties regarding interest rates, a potential trade war, slowing global economic growth, geopolitical issues, and other challenges.
In the US, the broad-based Russell 3000® Index and the S&P 500® Index returned-5.24% and-4.38%, respectively, for the year but held up better than international stocks in general. Equities trading in developed markets outside the US and Canada, as measured by the MSCI EAFE Index, fell 13.79%. Stocks in emerging markets reversed course. After posting strong gains in 2017, the MSCI Emerging Markets Index finished down 14.58%. (Returns are in US dollars, excluding dividends.)
Global economy and interest rates
In contrast to 2017’s global synchronized growth, 2018 saw global divergence characterized by strength in the US and weakness in many other parts of the world. In the US, economic growth remained healthy but decelerated slightly in the third quarter. Corporate earnings were generally solid, companies continued to hire at a strong pace, and inflation remained benign. The US dollar strengthened against most other currencies, and oil prices declined.
Several emerging markets economies, such as Argentina and Turkey, faced severe challenges in 2018, and the performance of other countries ran somewhere in between. In China, economic activity weakened and imports slowed, which had a negative impact on other economies, particularly in Europe. In the United Kingdom, wage growth improved, but uncertainty regarding negotiations to leave the European Union (known as Brexit) created a drag on stock prices. The European political backdrop became a bit more volatile late in the period, spurred by concerns over cohesion in the eurozone after the election of an anti-establishment coalition government in Italy that is skeptical of the European Union and widespread protests over stagnant wage growth in France.
Against this backdrop of decelerating economic activity and rising global tensions, many central banks continued to tighten monetary policy. In December, the Federal Reserve (the Fed) raised its target range for the short-term federal funds rate to2.25%-2.50%, following three rate hikes earlier in the year. The Fed also moderated its median projection for additional hikes going forward. A number of other central banks raised rates or took other measures to reduce stimulus during the period. For example, the European Central Bank ended its quantitative-easing bond-purchase program. China, however, moved to stimulate its economy, but these efforts did not gain much traction.
Equity markets fluctuated sharply
Volatility picked up significantly in 2018. The CBOE Volatility Index (VIX) average annual level rose sharply in 2018 from 2017.
After kicking off the new year with a rally, stocks declined in early February in reaction to reports of a sharp rise in average hourly earnings, which triggered concerns about inflation and that the Fed might raise rates more quickly than expected. Stocks recovered but sold off again in March, driven by the prospects of a tariff trade war between the US and China. US companies continued to report strong earnings, fueled in part by tax cuts, and stocks advanced throughout the spring and summer.
In the fall, sentiment shifted again in reaction to Fed comments perceived by many as hawkish, weaker growth in China, and rising trade tensions. The price of a42-gallon barrel of Current West Texas Intermediate Crude Oil, which had risen to $76.41 per barrel in October, plunged to $45.41 at the end of the period. The year closed with a US government shutdown due to a stalemate over border wall funding. Many of these factors exerted pressure on European, Japanese, and US stock markets.
Strong earnings growth, combined with the market decline, brought US equity valuations down from elevated levels to multiples more in line with long-term averages. For the fourth quarter, the Russell 3000 returned -14.30% and the MSCI EAFE Index returned-12.54%, although the MSCI Emerging Markets Index held up better, declining 7.47%.
Investors’ desire for less-risky assets prompted a rally in US Treasuries in December. The yield on the10-year note, which moves opposite to its price, ended the year up 28 basis points (0.28%) at approximately 2.68%.
S&P 500: leaders and laggards
Three of the S&P 500’s 11 sectors finished higher during the period. They were Health Care (+6.5%) and Utilities (+4.1%), which include defensive stocks less correlated to the economy, and Consumer Discretionary (+0.8%). Five sectors posted double-digit losses. Energy performed worst(-18.1%), hurt by the sharp drop in oil prices. The next worst-performing sectors were Materials(-14.7%), Industrials(-13.3%), Financials(-13.0%), Communication Services(-12.5%), Consumer Staples(-8.4%), Real Estate(-2.2%), and Information Technology(-0.3%).
| | | | |
| Market Overview — unaudited(continued) | | Annual Report | | December 31, 2018 |
Growth andlarger-cap stocks outperformed their counterparts
During the period, the Russell 3000 Growth Index fell 2.1%, while the Russell 3000 Value Index dropped 8.6%. Stocks with large market capitalizations, as measured by the Russell 1000® Index, held up best, finishing down 4.8%. The Russell Midcap® Index fell 9.1%, and the Russell 2000® Index, which reflects the performance ofsmall-cap stocks, dropped 11.0%. Smaller-capitalized companies often have more debt, making them more susceptible to rising rates.
International equity markets: best and worst performers
For the 12 months, the best-performing countries making up the MSCI Emerging Markets Index were Russia (+0.2%), Brazil(-0.1%), and Malaysia(-6.0%). The worst performers were South Africa(-24.3%), South Korea(-20.5%), and China(-18.7%). For the fourth quarter, Brazil’s market outperformed, returning 13.6%.
For the 12 months, the best-performing developed markets making up the MSCI EAFE Index were Switzerland(-8.2%), Australia(-11.8%), and France(-11.9%). The worst performers were Germany(-21.6%), Italy(-17.0%), and Spain(-15.7%).
Fixed Income Market Overview
Financial markets experienced a volatile year in 2018, particularly riskier assets. The total returns and excess returns on bonds relative to US Treasuries were generally low or negative.
Over the12-month period, the Bloomberg Barclays US Aggregate Bond Index, a broad measure of the US investment-grade bond market, finished virtually flat with a return of 0.01%. Among key sectors, US agency mortgage-backed securities returned 0.99%, US Treasuries advanced 0.86%, commercial mortgage-backed securities (CMBS) rose 0.78%, Treasury inflation protected securities (TIPS) dropped 1.26%, and investment-grade corporate bonds declined 2.51%.
Municipal bonds rose 1.28%. High yield municipal issues (rated below investment grade) rose 4.76% for the year. However, high yield corporate bonds fell 2.08%.
The Bloomberg Barclays Global Aggregate Bond Index (USD), which reflects performance of investment-grade bonds in developing and emerging markets, declined 0.03%. Emerging markets bonds, as measured by the J.P. Morgan EMBI Global Diversified Index (hard currency), finished down 4.26% for the year.
Bond market highlights
Early in the reporting period, hawkish rhetoric from the Federal Reserve (the Fed), anticipated fiscal stimulus from tax cuts, an increased supply of US Treasuries (particularly shorter-dated issues), and concerns about inflation exerted pressure on the prices of US bonds. These factors sent bond yields, which move in the opposite direction, higher. Later in the first quarter, concerns about trade friction between the US and China put pressure on riskier assets.
In the second quarter, rates diverged. Signs that the US economy was growing at a strong pace sparked concerns that inflation could pick up. The yield on the10-year US Treasury note rose above 3%. Meanwhile, growth in many other economies weakened. Rising rates in the US and a strong dollar, coupled with trade uncertainty and geopolitical concerns, helped expose structural weaknesses in several emerging markets, and prices of emerging market bonds fell sharply. Yields on Italian bonds rose significantly in reaction to political concerns in Italy.
Although the US economy grew at a healthy pace during the year, growth decelerated in the third quarter and economic activity in the eurozone slowed.
Risk aversion rose late in the period
In the fourth quarter, following a sharp spike in US Treasury bond yields in November, demand for higher-quality US bonds rose — driving their prices higher and yields down — as a result of a flight to quality, whereas riskier US assets such as high yield bonds sold off. The shift in sentiment was triggered by uncertainties regarding the economy amid growing concerns about a potential trade war, Great Britain’s negotiations to leave the European Union (known as Brexit), and perceptions of a hawkish Fed.
In December, the Fed raised its federal funds rate target for the fourth time in 2018 but moderated its median projection for future additional rate hikes. The European Central Bank (ECB) halted its quantitative-easing asset purchases and issued guidance that it does not anticipate raising interest rates at least until after the summer of 2019. The yield on the10-year US Treasury note fell during the quarter to close the period at 2.68%.
For the fourth quarter, based on returns of the Bloomberg Barclays indexes, US Treasuries returned 2.6%. Agency mortgage-backed securities returned 2.1%, as their spreads widened amid the broadrisk-off sentiment and higher net supply. CMBS advanced 1.7%.
| | | | |
| Market Overview — unaudited(continued) | | Annual Report | | December 31, 2018 |
US corporate bonds — excluding energy — remained supported by robust earnings, strong cash flows, positive economic growth, and tailwinds from tax reform, but underperformed US government securities. For the quarter, US investment-grade corporates returned-0.2%. High yield bonds declined 4.53%, as they were hurt by a drop in oil prices. The municipal bonds sector rose 1.20%. Yields on debt carrying atriple-A rating ended lower on the heels of the rally in US Treasuries.
Emerging markets closed the year at varying stages of economic and political cycles. For the fourth quarter, emerging markets bonds declined 1.26%, based on the return of the J.P. Morgan EMBI Global Diversified Index (hard currency), benefiting in part from a weakening US dollar following its strong rise during the year. Yields on China’s government bonds dropped significantly in November in anticipation of further monetary stimulus. Global investment-grade bonds, based on the Bloomberg Barclays Global Aggregate Bond Index (USD), gained 1.55% in the fourth quarter.
| | |
| Prudential’s Gibraltar Fund, Inc. | | December 31, 2018 |
Report of the Investment Manager - As of December 31, 2018 (Unaudited)
| | | | | | | | | | | | |
Average Annual Total
Returns | | 1-Year | | | 5-Years | | | 10-Years | |
Fund | | | 4.61 | % | | | 11.81 | % | | | 15.47 | % |
S&P 500 Index | | | -4.38 | | | | 8.49 | | | | 13.11 | |
Past performance is no guarantee of future returns. The investment return and principal value of an investment will fluctuate, so that an investor’s shares, when redeemed, may be worth more or less than their original cost. Current performance may be lower or higher than the past performance.
Fund performance is net of fund expenses, but not contract charges, which, if included, would significantly lower the performance quoted.
$10,000 INVESTED OVER 10 YEARS
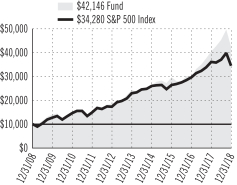
For the year ended December 31, 2018, Prudential’s Gibraltar Fund returned 4.61%. The Fund outperformed the S&P 500 Index.
The investment objective of the Fund is growth of capital to the extent compatible with a concern for preservation of principal.
What were market conditions during the reporting period?
As 2018 began, global gross domestic product (GDP) growth was accelerating, the labor market was continuing to strengthen, and lower US corporate tax rates were taking effect, helping to boost wages and capital spending. Given the constructive macroeconomic landscape, investors largely overlooked uncertainty created by White House trade and other policy initiatives. Asell-off in the fourth quarter reflected mounting investor concerns about a range of issues, including the pace of US interest rate increases and its effect on US economic growth, decelerating expansion innon-US economies, the state of US trade alliances with major trading partners — most notably the rising risk of a trade war with China — and discord and uncertainty about domestic policy, which culminated in a partial US government shutdown as the year drew to a close.
Gains in the benchmark S&P 500 Index were led by select health care, technology, and consumer companies. Sectors with sensitivity to commodities prices and cyclical growth — including materials, energy, and industrials — were weaker performers.
What strategies or holdings affected the Fund’s performance?
Information technology positions were strong contributors to Fund performance. Digital transformation of the enterprise has become a strategic imperative across many industries and companies. Cloudware, therefore, is no longer primarily a tool to reduce infrastructure costs. Fund holdingsSalesforce.com Inc., Red Hat Inc., Adobe Inc., Microsoft Corp., and Workday Inc. offer mission-critical applications and services that are creating fundamental changes in the way businesses operate.
Payment companies continue to benefit from the long-term shift from cash to electronic credit and debit transactions. BothMasterCard Inc. andVisa Inc. have strong market positions with high barriers to entry, pricing power, and solid operating leverage potential.
The Fund’s long-term holdings in US Internet companies also meaningfully contributed to performance.E-commerce stalwartAmazon.com Inc. benefited from its market position, scale, and execution.
Conversely, Chinese Internet companies fared poorly, includingAlibaba Group. While Alibaba’s various business segments are providing significant revenue growth, the stock declined on high business investment spending and Chinese government efforts to tighten control of Internet andnon-traditional financial companies.
Ongoing concerns about data breaches, user-data usage, and increased government scrutiny, coupled with maturation of user engagement, continued to loom over social media giantFacebook Inc. However, the company has significant scale benefits and untapped monetization opportunities that Jennison believes should drive better-than-average growth even with higher costs and restriction in data usage.
Boeing Co.was a top performer in industrials. Its stock gain reflected 787 Dreamlinercommercial-jet cash generation, solid cost controls, andramped-up 737 jet production.
Performance of the Fund’s health care positions improved over the year, as the“hot- button” topic of drug pricing subsided. However, Jennison expects the issue willre-emerge as political winds change once again. Advances in systems for analyzing genetic variation and function continue to broaden
For a complete list of holdings, refer to the Schedule of Investments section of this report.
1
| | |
Prudential’s Gibraltar Fund, Inc. | | December 31, 2018 |
Report of the Investment Manager - As of December 31, 2018 (Unaudited) (Continued)
the understanding of the clinical significance of the genome. Fund holdingIllumina Inc. is at the forefront of this technology. Some of the Fund’s biopharmaceutical positions experienced setbacks.Bristol-Myers Squibb Co. fell on signs that itsnon-small cell lung cancer program has been eclipsed by a competing franchise. The Fund’s position in Bristol-Myers was eliminated byperiod-end. However, Jennison believes the likely broad adoption of immuno-oncology therapy in multiple settings points to avenues of future growth for Bristol-Myers.
In energy, petroleum and natural gas exploration and production firmConcho Resources was hurt by logistics constraints that resulted in weak pricing in a portion of its production.
For a complete list of holdings, refer to the Schedule of Investments section of this report.
2
| | |
Prudential’s Gibraltar Fund, Inc. Benchmark Glossary — unaudited | | December 31, 2018 |
The indexes are unmanaged and include reinvestment of any income or distributions. They do not reflect any fees, expenses or sales charges. Investors cannot invest directly in a market index.
S&P 500 Index is an unmanaged, market value-weighted index of over 500 stocks generally representative of the broad stock market.
| | |
Prudential’s Gibraltar Fund, Inc. Presentation of Portfolio Holdings — unaudited | | December 31, 2018 |
| | | | |
| Prudential’s Gibraltar Fund, Inc. | |
| Five Largest Holdings | | | (% of Net Assets | ) |
| Mastercard, Inc. (Class A Stock) | | | 7.1% | |
| Amazon.com, Inc. | | | 6.9% | |
| Visa, Inc. (Class A Stock) | | | 6.1% | |
| Microsoft Corp. | | | 6.0% | |
| NIKE, Inc. (Class B Stock) | | | 5.6% | |
For a complete list of holdings, please refer to the Schedule of Investments section of this report. Holdings reflect only long-term investments. Holdings/Issues/Industries/Sectors are subject to change.
| | |
Prudential’s Gibraltar Fund, Inc. Fees and Expenses — unaudited | | December 31, 2018 |
As a Planholder investing in the Fund through a variable contract, you incur ongoing costs, including management fees, and other Fund expenses. This example is intended to help you understand your ongoing costs (in dollars) of investing in the Fund and to compare these costs with the ongoing costs of investing in other investment options. This example does not reflect fees and charges under your contract. If contract charges were included, the costs shown below would be higher. Please consult your contract for more information about contract fees and charges.
The example is based on an investment of $1,000 invested at the beginning of the period and held for the entire period July 1, 2018 through December 31, 2018.
Actual Expenses
The first line of the table below provides information about actual account values and actual expenses. You may use this information, together with the amount you invested, to estimate the Fund expenses that you paid over the period. Simply divide your account value by $1,000 (for example, an $8,600 account value divided by $1,000 = 8.6), then multiply the result by the number in the first line under the heading entitled “Expenses Paid During the Six-Month Period” to estimate the Fund expenses you paid on your account during this period. As noted above, the table does not reflect variable contract fees and charges.
Hypothetical Example for Comparison Purposes
The second line of the table below provides information about hypothetical account values and hypothetical expenses based on the Fund’s actual expense ratio and an assumed rate of return of 5% per year before expenses, which is not the Fund’s actual return. The hypothetical account values and expenses may not be used to estimate the actual ending account balance or expenses you paid for the period. You may use this information to compare the ongoing costs of investing in the Fund and other investment options. To do so, compare this 5% hypothetical example with the 5% hypothetical examples that appear in the shareholder reports of the other investment options.
Please note that the expenses shown in the table are meant to highlight your ongoing Fund costs only and do not reflect any contract fees and charges, such as sales charges (loads), insurance charges or administrative charges. Therefore the second line of the table is useful to compare ongoing investment option costs only, and will not help you determine the relative total costs of owning different contracts. In addition, if these contract fees and charges were included, your costs would have been higher.
| | | | | | | | | | | | | | | | | | |
| Prudential’s Gibraltar Fund, Inc. | | Beginning
Account Value
July 1, 2018 | | | Ending
Account Value
December 31, 2018 | | | Annualized Expense
Ratio based on the
Six-Month period | | | Expenses Paid
During the
Six-Month period* | |
| | | | | |
| Prudential's Gibraltar Fund, Inc. | | Actual | | $ | 1,000.00 | | | $ | 933.10 | | | | 0.61 | % | | $ | 2.97 | |
| | Hypothetical | | $ | 1,000.00 | | | $ | 1,022.13 | | | | 0.61 | % | | $ | 3.11 | |
* Fund expenses (net of fee waivers or subsidies, if any) are equal to the annualized expense ratio (provided in the table), multiplied by the average account value over the period, multiplied by the 184 days in the six-month period ended December 31, 2018, and divided by the 365 days in the Fund’s fiscal year ended December 31, 2018 (to reflect the six-month period). Expenses presented in the table include the expenses of any underlying portfolios in which the Fund may invest.
| | | | | | |
| | |
| | PRUDENTIAL’S GIBRALTAR FUND, INC. | | |
| | | | | | |
| |
| SCHEDULE OF INVESTMENTS | | as of December 31, 2018 |
| | | | | | | | |
| LONG-TERM INVESTMENTS — 99.3% | | | | |
| COMMON STOCKS | | Shares | | | Value | |
Aerospace & Defense — 3.2% | | | | | | | | |
Boeing Co. (The) | | | 14,990 | | | $ | 4,834,275 | |
| | | | | | | | |
Banks — 2.1% | | | | | | | | |
JPMorgan Chase & Co. | | | 32,138 | | | | 3,137,311 | |
| | | | | | | | |
Biotechnology — 4.5% | | | | | | | | |
Alexion Pharmaceuticals, Inc.* | | | 19,335 | | | | 1,882,456 | |
BioMarin Pharmaceutical, Inc.* | | | 19,557 | | | | 1,665,279 | |
Celgene Corp.* | | | 19,517 | | | | 1,250,844 | |
Vertex Pharmaceuticals, Inc.* | | | 11,965 | | | | 1,982,720 | |
| | | | | | | | |
| | | | | | | 6,781,299 | |
| | | | | | | | |
Capital Markets — 1.3% | | | | | | | | |
S&P Global, Inc. | | | 11,611 | | | | 1,973,173 | |
| | | | | | | | |
Chemicals — 1.0% | | | | | | | | |
Albemarle Corp.(a) | | | 18,782 | | | | 1,447,529 | |
| | | | | | | | |
Entertainment — 0.9% | | | | | | | | |
Activision Blizzard, Inc. | | | 30,711 | | | | 1,430,211 | |
| | | | | | | | |
Food & Staples Retailing — 3.3% | | | | | | | | |
Costco Wholesale Corp. | | | 24,162 | | | | 4,922,041 | |
| | | | | | | | |
Food Products — 1.1% | | | | | | | | |
Mondelez International, Inc.
(Class A Stock) | | | 41,505 | | | | 1,661,445 | |
| | | | | | | | |
Health Care Equipment & Supplies — 2.7% | | | | | |
Abbott Laboratories | | | 55,840 | | | | 4,038,907 | |
| | | | | | | | |
Health Care Providers & Services — 4.8% | | | | | | | | |
Cigna Corp.(a) | | | 19,657 | | | | 3,733,258 | |
UnitedHealth Group, Inc. | | | 14,252 | | | | 3,550,458 | |
| | | | | | | | |
| | | | | | | 7,283,716 | |
| | | | | | | | |
Hotels, Restaurants & Leisure — 2.6% | | | | | | | | |
Marriott International, Inc. (Class A Stock) | | | 35,994 | | | | 3,907,509 | |
| | | | | | | | |
Interactive Media & Services — 10.9% | | | | | | | | |
Alphabet, Inc. (Class A Stock)* | | | 3,089 | | | | 3,227,882 | |
Alphabet, Inc. (Class C Stock)* | | | 5,353 | | | | 5,543,620 | |
Facebook, Inc. (Class A Stock)* | | | 31,190 | | | | 4,088,697 | |
Tencent Holdings Ltd. (China), ADR(a) | | | 92,526 | | | | 3,652,001 | |
| | | | | | | | |
| | | | | | | 16,512,200 | |
| | | | | | | | |
Internet & Direct Marketing Retail — 10.5% | | | | | |
Alibaba Group Holding Ltd. (China), ADR* | | | 23,683 | | | | 3,246,229 | |
Amazon.com, Inc.* | | | 6,915 | | | | 10,386,123 | |
Booking Holdings, Inc.* | | | 1,251 | | | | 2,154,747 | |
| | | | | | | | |
| | | | | | | 15,787,099 | |
| | | | | | | | |
IT Services — 13.2% | | | | | | | | |
Mastercard, Inc. (Class A Stock) | | | 56,626 | | | | 10,682,495 | |
Visa, Inc. (Class A Stock) | | | 70,025 | | | | 9,239,098 | |
| | | | | | | | |
| | | | | | | 19,921,593 | |
| | | | | | | | |
Life Sciences Tools & Services — 3.5% | | | | | | | | |
Illumina, Inc.* | | | 17,405 | | | | 5,220,282 | |
| | | | | | | | |
Machinery — 0.9% | | | | | | | | |
Caterpillar, Inc. | | | 10,646 | | | | 1,352,787 | |
| | | | | | | | |
| | | | | | | | |
COMMON STOCKS
(continued) | | Shares | | | Value | |
Oil, Gas & Consumable Fuels — 2.1% | | | | | |
Concho Resources, Inc.* | | | 20,586 | | | $ | 2,116,035 | |
EOG Resources, Inc. | | | 11,337 | | | | 988,700 | |
| | | | | | | | |
| | | | | | | 3,104,735 | |
| | | | | | | | |
Pharmaceuticals — 2.3% | | | | | | | | |
Allergan PLC | | | 14,353 | | | | 1,918,422 | |
Merck & Co., Inc. | | | 21,329 | | | | 1,629,749 | |
| | | | | | | | |
| | | | | | | 3,548,171 | |
| | | | | | | | |
Software — 15.9% | | | | | | | | |
Adobe, Inc.* | | | 25,077 | | | | 5,673,421 | |
Microsoft Corp. | | | 89,176 | | | | 9,057,606 | |
Red Hat, Inc.* | | | 18,816 | | | | 3,304,842 | |
salesforce.com, Inc.* | | | 43,967 | | | | 6,022,160 | |
| | | | | | | | |
| | | | | | | 24,058,029 | |
| | | | | | | | |
Specialty Retail — 1.4% | | | | | | | | |
Home Depot, Inc. (The) | | | 12,512 | | | | 2,149,812 | |
| | | | | | | | |
Technology Hardware, Storage & Peripherals — 3.2% | |
Apple, Inc. | | | 30,766 | | | | 4,853,029 | |
| | | | | | | | |
Textiles, Apparel & Luxury Goods — 7.9% | | | | | |
Kering SA (France), ADR | | | 75,516 | | | | 3,530,751 | |
NIKE, Inc. (Class B Stock) | | | 112,937 | | | | 8,373,149 | |
| | | | | | | | |
| | | | | | | 11,903,900 | |
| | | | | | | | |
TOTAL LONG-TERM INVESTMENTS
(cost $69,486,689) | | | | 149,829,053 | |
| | | | | | | | |
| |
| SHORT-TERM INVESTMENTS — 4.3% | | | | | |
AFFILIATED MUTUAL FUNDS | | | | | | | | |
PGIM Core Ultra Short Bond Fund(w) | | | 987,041 | | | | 987,041 | |
PGIM Institutional Money Market Fund (cost $5,440,507; includes $5,430,772 of cash collateral for securities on loan)(b)(w) | | | 5,441,023 | | | | 5,440,479 | |
| | | | | | | | |
TOTAL SHORT-TERM INVESTMENTS
(cost $6,427,548) | | | | 6,427,520 | |
| | | | | | | | |
TOTAL INVESTMENTS — 103.6%
(cost $75,914,237) | | | | 156,256,573 | |
LIABILITIES IN EXCESS OF
OTHER ASSETS — (3.6)% | | | | (5,451,629 | ) |
| | | | | | | | |
NET ASSETS — 100.0% | | | | | | $ | 150,804,944 | |
| | | | | | | | |
The following abbreviations are used in the annual report:
| | |
| ADR | | American Depositary Receipt |
| LIBOR | | London Interbank Offered Rate |
| * | Non-income producing security. |
| (a) | All or a portion of security is on loan. The aggregate market value of such securities, including those sold and pending settlement, is $5,320,199; cash collateral of $5,430,772 (included in liabilities) was received with which the Fund purchased highly liquid short-term investments. |
| (b) | Represents security purchased with cash collateral received for securities on loan and includes dividend reinvestment. |
| (w) | PGIM Investments LLC, the manager of the Fund, also serves as manager of the PGIM Core Ultra Short Bond Fund and PGIM Institutional Money Market Fund. |
SEE NOTES TO FINANCIAL STATEMENTS.
A1
| | | | | | |
| | |
| | PRUDENTIAL’S GIBRALTAR FUND, INC. (continued) | | |
| | | | | | |
| |
| SCHEDULE OF INVESTMENTS | | as of December 31, 2018 |
Fair Value Measurements:
Various inputs are used in determining the value of the Fund’s investments. These inputs are summarized in the three broad levels listed below.
| Level 1— | unadjusted quoted prices generally in active markets for identical securities. |
| Level 2— | quoted prices for similar securities, interest rates and yield curves, prepayment speeds, foreign currency exchange rates and other observable inputs. |
| Level 3— | unobservable inputs for securities valued in accordance with Board approved fair valuation procedures. |
The following is a summary of the inputs used as of December 31, 2018 in valuing such portfolio securities:
| | | | | | | | | | | | |
| | | Level 1 | | | Level 2 | | | Level 3 | |
Investments in Securities | | | | | | | | | | | | |
Common Stocks | | | | | | | | | | | | |
Aerospace & Defense | | $ | 4,834,275 | | | $ | — | | | $ | — | |
Banks | | | 3,137,311 | | | | — | | | | — | |
Biotechnology | | | 6,781,299 | | | | — | | | | — | |
Capital Markets | | | 1,973,173 | | | | — | | | | — | |
Chemicals | | | 1,447,529 | | | | — | | | | — | |
Entertainment | | | 1,430,211 | | | | — | | | | — | |
Food & Staples Retailing | | | 4,922,041 | | | | — | | | | — | |
Food Products | | | 1,661,445 | | | | — | | | | — | |
Health Care Equipment & Supplies | | | 4,038,907 | | | | — | | | | — | |
Health Care Providers & Services | | | 7,283,716 | | | | — | | | | — | |
Hotels, Restaurants & Leisure | | | 3,907,509 | | | | — | | | | — | |
Interactive Media & Services | | | 16,512,200 | | | | — | | | | — | |
Internet & Direct Marketing Retail | | | 15,787,099 | | | | — | | | | — | |
IT Services | | | 19,921,593 | | | | — | | | | — | |
Life Sciences Tools & Services | | | 5,220,282 | | | | — | | | | — | |
Machinery | | | 1,352,787 | | | | — | | | | — | |
Oil, Gas & Consumable Fuels | | | 3,104,735 | | | | — | | | | — | |
Pharmaceuticals | | | 3,548,171 | | | | — | | | | — | |
Software | | | 24,058,029 | | | | — | | | | — | |
Specialty Retail | | | 2,149,812 | | | | — | | | | — | |
Technology Hardware, Storage & Peripherals | | | 4,853,029 | | | | — | | | | — | |
Textiles, Apparel & Luxury Goods | | | 11,903,900 | | | | — | | | | — | |
Affiliated Mutual Funds | | | 6,427,520 | | | | — | | | | — | |
| | | | | | | | | | | | |
Total | | $ | 156,256,573 | | | $ | — | | | $ | — | |
| | | | | | | | | | | | |
Industry Classification:
The industry classification of investments and liabilities in excess of other assets shown as a percentage of net assets as of December 31, 2018 were as follows (unaudited):
| | | | |
Software | | | 15.9 | % |
IT Services | | | 13.2 | |
Interactive Media & Services | | | 10.9 | |
Internet & Direct Marketing Retail | | | 10.5 | |
Textiles, Apparel & Luxury Goods | | | 7.9 | |
Health Care Providers & Services | | | 4.8 | |
Biotechnology | | | 4.5 | |
Affiliated Mutual Funds (3.6% represents investments purchased with collateral from securities on loan) | | | 4.3 | |
Life Sciences Tools & Services | | | 3.5 | |
Food & Staples Retailing | | | 3.3 | |
Technology Hardware, Storage & Peripherals | | | 3.2 | |
Aerospace & Defense | | | 3.2 | |
Health Care Equipment & Supplies | | | 2.7 | |
| | | | |
Hotels, Restaurants & Leisure | | | 2.6 | % |
Pharmaceuticals | | | 2.3 | |
Banks | | | 2.1 | |
Oil, Gas & Consumable Fuels | | | 2.1 | |
Specialty Retail | | | 1.4 | |
Capital Markets | | | 1.3 | |
Food Products | | | 1.1 | |
Chemicals | | | 1.0 | |
Entertainment | | | 0.9 | |
SEE NOTES TO FINANCIAL STATEMENTS.
A2
| | | | | | |
| | |
| | PRUDENTIAL’S GIBRALTAR FUND, INC. (continued) | | |
| | | | | | |
| |
| SCHEDULE OF INVESTMENTS | | as of December 31, 2018 |
Industry Classification (cont.):
| | | | |
Machinery | | | 0.9 | % |
| | | | |
| | | 103.6 | |
Liabilities in excess of other assets | | | (3.6 | ) |
| | | | |
| | | 100.0 | % |
| | | | |
Financial Instruments/Transactions — Summary of Offsetting and Netting Arrangements:
The Fund entered into financial instruments/transactions during the reporting period that are either offset in accordance with current requirements or are subject to enforceable master netting arrangements or similar agreements that permit offsetting. The information about offsetting and related netting arrangements for financial instruments/transactions, where the legal right toset-off exists, is presented in the summary below.
Offsetting of financial instrument/transaction assets and liabilities:
| | | | | | | | | | | | |
Description | | Gross Market
Value of
Recognized
Assets/(Liabilities) | | | Collateral
Pledged/
(Received)(1) | | | Net Amount | |
Securities on Loan | | $ | 5,320,199 | | | $ | (5,320,199 | ) | | $ | — | |
| | | | | | | | | | | | |
| (1) | Collateral amount disclosed by the Fund is limited to the market value of financial instruments/transactions. |
SEE NOTES TO FINANCIAL STATEMENTS.
A3
| | | | | | |
| | |
| | PRUDENTIAL’S GIBRALTAR FUND, INC. (continued) | | |
STATEMENT OF ASSETS AND LIABILITIES
as of December 31, 2018
| | | | |
| ASSETS | | | | |
Investments at value, including securities on loan of $5,320,199: | | | | |
Unaffiliated investments (cost $69,486,689) | | $ | 149,829,053 | |
Affiliated investments (cost $6,427,548) | | | 6,427,520 | |
Dividends and interest receivable | | | 54,843 | |
Tax reclaim receivable | | | 38,943 | |
Receivable for investments sold | | | 612 | |
Prepaid expenses | | | 1,514 | |
| | | | |
Total Assets | | | 156,352,485 | |
| | | | |
| LIABILITIES | | | | |
Payable to broker for collateral for securities on loan | | | 5,430,772 | |
Management fee payable | | | 72,065 | |
Accrued expenses and other liabilities | | | 44,704 | |
| | | | |
Total Liabilities | | | 5,547,541 | |
| | | | |
| NET ASSETS | | $ | 150,804,944 | |
| | | | |
Net assets were comprised of: | | | | |
Shares of beneficial interest, at par | | $ | 92,493 | |
Paid-in capital in excess of par | | | 68,268,680 | |
| | | | |
| | | 68,361,173 | |
Distributable earnings | | | 82,443,771 | |
| | | | |
Net assets, December 31, 2018 | | $ | 150,804,944 | |
| | | | |
Net asset value and redemption price per share $150,804,944 / 9,249,256 outstanding shares of common stock (authorized 75,000,000 shares) | | $ | 16.30 | |
| | | | |
STATEMENT OF OPERATIONS
Year Ended December 31, 2018
| | | | |
| NET INVESTMENT INCOME (LOSS) INCOME | | | | |
Unaffiliated dividend income | | $ | 1,391,781 | |
Affiliated dividend income | | | 68,608 | |
Affiliated income from securities lending, net | | | 15,832 | |
| | | | |
Total income | | | 1,476,221 | |
| | | | |
| EXPENSES | | | | |
Management fee | | | 937,901 | |
Custodian and accounting fees | | | 47,197 | |
Audit fee | | | 27,200 | |
Directors’ fees | | | 11,026 | |
Legal fees and expenses | | | 9,925 | |
Miscellaneous | | | 15,184 | |
| | | | |
Total expenses | | | 1,048,433 | |
| | | | |
| NET INVESTMENT INCOME (LOSS) | | | 427,788 | |
| | | | |
| REALIZED AND UNREALIZED GAIN (LOSS) ON INVESTMENT TRANSACTIONS | | | | |
Net realized gain (loss) on investment transactions (including affiliated of $(609)) | | | 14,896,455 | |
Net change in unrealized appreciation (depreciation) on investments (including affiliated of $151) | | | (6,339,764 | ) |
| | | | |
| NET GAIN (LOSS) ON INVESTMENT TRANSACTIONS | | | 8,556,691 | |
| | | | |
| NET INCREASE (DECREASE) IN NET ASSETS RESULTING FROM OPERATIONS | | $ | 8,984,479 | |
| | | | |
STATEMENTS OF CHANGES IN NET ASSETS
| | | | | | | | |
| | | Year Ended December 31, | |
| | | 2018 | | | 2017 | |
| INCREASE (DECREASE) IN NET ASSETS OPERATIONS | | | | | | | | |
Net investment income (loss) | | $ | 427,788 | | | $ | 452,660 | |
Net realized gain (loss) on investment transactions | | | 14,896,455 | | | | 21,810,316 | |
Net change in unrealized appreciation (depreciation) on investments | | | (6,339,764 | ) | | | 26,226,885 | |
| | | | | | | | |
NET INCREASE (DECREASE) IN NET ASSETS RESULTING FROM OPERATIONS | | | 8,984,479 | | | | 48,489,861 | |
| | | | | | | | |
| DIVIDENDS AND DISTRIBUTIONS | | | | | | | | |
Distributions from distributable earnings* | | | (15,149,087 | ) | | | — | |
Dividends from net investment income | | | * | | | | (431,781 | ) |
Dividends from net realized gains | | | * | | | | (18,620,021 | ) |
| | | | | | | | |
| | | (15,149,087 | ) | | | (19,051,802 | ) |
| | | | | | | | |
| CAPITAL STOCK TRANSACTIONS | | | | | | | | |
Capital stock sold [2,560 and 1,204 shares, respectively] | | | 47,851 | | | | 22,501 | |
Capital stock issued in reinvestment of dividends [870,933 and 1,119,033 shares, respectively] | | | 15,149,087 | | | | 19,051,802 | |
Capital stock repurchased [983,606 and 1,782,846 shares, respectively] | | | (19,008,505 | ) | | | (31,109,006 | ) |
| | | | | | | | |
NET INCREASE (DECREASE) IN NET ASSETS FROM CAPITAL STOCK TRANSACTIONS | | | (3,811,567 | ) | | | (12,034,703 | ) |
| | | | | | | | |
| TOTAL INCREASE (DECREASE) | | | (9,976,175 | ) | | | 17,403,356 | |
| NET ASSETS: | | | | | | | | |
Beginning of year | | | 160,781,119 | | | | 143,377,763 | |
| | | | | | | | |
End of year (a) | | $ | 150,804,944 | | | $ | 160,781,119 | |
| | | | | | | | |
(a) Includes undistributed net investment income of: | | $ | * | | | $ | 20,879 | |
| | | | | | | | |
* For the year ended December 31, 2018, the Fund has adopted amendments to RegulationS-X (refer to Note 9). | | | | | | | | |
SEE NOTES TO FINANCIAL STATEMENTS.
A4
NOTES TO FINANCIAL STATEMENTS
Prudential’s Gibraltar Fund, Inc. (the “Fund”) was originally incorporated in the State of Delaware on March 14, 1968 and was reincorporated in the State of Maryland effective May 1, 1997. It is registered as anopen-end, diversified management investment company under the Investment Company Act of 1940, as amended (“1940 Act”). The Fund was organized by The Prudential Insurance Company of America (“PICA”) to serve as the investment medium for the variable contract accounts of The Prudential Financial Security Program (“FSP”). The Fund does not sell its shares to the public. The accounts will redeem shares of the Fund to the extent necessary to provide benefits under the contracts or for such other purposes as may be consistent with the contracts.
The investment objective of the Fund is growth of capital to the extent compatible with a concern for preservation of principal.
The Fund follows the investment company accounting and reporting guidance of the Financial Accounting Standards Board (“FASB”) Accounting Standard Codification (“ASC”) Topic 946 Financial Services —Investment Companies.The following accounting policies conform to U.S. generally accepted accounting principles. The Fund consistently follows such policies in the preparation of its financial statements.
Securities Valuation: The Fund holds securities and other assets and liabilities that are fair valued at the close of each day (generally, 4:00 PM Eastern time) the New York Stock Exchange (“NYSE”) is open for trading. Fair value is the price that would be received to sell an asset or paid to transfer a liability in an orderly transaction between market participants on the measurement date. The Fund’s Board of Directors (the “Board”) has adopted valuation procedures for security valuation under which fair valuation responsibilities have been delegated to PGIM Investments LLC (“PGIM Investments” or the “Manager”). Pursuant to the Board’s delegation, the Manager has established a Valuation Committee responsible for supervising the fair valuation of portfolio securities and other assets and liabilities. The valuation procedures permit the Fund to utilize independent pricing vendor services, quotations from market makers, and alternative valuation methods when market quotations are either not readily available or not deemed representative of fair value. A record of the Valuation Committee’s actions is subject to the Board’s review, approval, and ratification at its next regularly scheduled quarterly meeting.
For the fiscal reportingyear-end, securities and other assets and liabilities were fair valued at the close of the last U.S. business day. Trading in certain foreign securities may occur when the NYSE is closed (including weekends and holidays). Because such foreign securities trade in markets that are open on weekends and U.S. holidays, the values of some of the Fund’s foreign investments may change on days when investors cannot purchase or redeem Fund shares.
Various inputs determine how the Fund’s investments are valued, all of which are categorized according to the three broad levels (Level 1, 2, or 3) detailed in the Schedule of Investments and referred to herein as the “fair value hierarchy” in accordance with FASB ASC Topic 820 — Fair Value Measurements and Disclosures.
Common and preferred stocks, exchange-traded funds, and derivative instruments, such as futures or options, that are traded on a national securities exchange are valued at the last sale price as of the close of trading on the applicable exchange where the security principally trades. Securities traded via NASDAQ are valued at the NASDAQ official closing price. To the extent these securities are valued at the last sale price or NASDAQ official closing price, they are classified as Level 1 in the fair value hierarchy. In the event that no sale or official closing price on valuation date exists, these securities are generally valued at the mean between the last reported bid and ask prices, or at the last bid price in the absence of an ask price. These securities are classified as Level 2 in the fair value hierarchy.
Investments inopen-end,non-exchange-traded mutual funds are valued at their net asset values as of the close of the NYSE on the date of valuation. These securities are classified as Level 1 in the fair value hierarchy since they may be purchased or sold at their net asset values on the date of valuation.
Securities and other assets that cannot be priced according to the methods described above are valued based on pricing methodologies approved by the Board. In the event that unobservable inputs are used when determining such valuations, the securities will be classified as Level 3 in the fair value hierarchy.
When determining the fair value of securities, some of the factors influencing the valuation include: the nature of any restrictions on disposition of the securities; assessment of the general liquidity of the securities; the issuer’s financial condition and the markets in which it does business; the cost of the investment; the size of the holding and
B1
the capitalization of the issuer; the prices of any recent transactions or bids/offers for such securities or any comparable securities; any available analyst media or other reports or information deemed reliable by the Manager regarding the issuer or the markets or industry in which it operates. Using fair value to price securities may result in a value that is different from a security’s most recent closing price and from the price used by other unaffiliated mutual funds to calculate their net asset values.
Restricted and Illiquid Securities: Subject to guidelines adopted by the Board, the Fund may invest up to 15% of its net assets in illiquid securities, including those which are restricted as to disposition under federal securities law (“restricted securities”). Restricted securities are valued pursuant to the valuation procedures noted above. Illiquid securities are those that, because of the absence of a readily available market or due to legal or contractual restrictions on resale, may not reasonably be expected to be sold or disposed of in current market conditions in seven calendar days or less without the sale or disposition significantly changing the market value of the investment. Therefore, the Fund may find it difficult to sell illiquid securities at the time considered most advantageous by its Subadviser and may incur transaction costs that would not be incurred in the sale of securities that were freely marketable. Certain securities that would otherwise be considered illiquid because of legal restrictions on resale to the general public may be traded among qualified institutional buyers under Rule 144A of the Securities Act of 1933. These Rule 144A securities, as well as commercial paper that is sold in private placements under Section 4(2) of the Securities Act of 1933, may be deemed liquid by the Fund’s Subadviser under the guidelines adopted by the Board. However, the liquidity of the Fund’s investments in Rule 144A securities could be impaired if trading does not develop or declines.
Master Netting Arrangements: The Fund is subject to various Master Agreements, or netting arrangements, with select counterparties. These are agreements which a Subadviser may have negotiated and entered into on behalf of the Fund. A master netting arrangement between the Fund and the counterparty permits the Fund to offset amounts payable by the Fund to the same counterparty against amounts to be received; and by the receipt of collateral from the counterparty by the Fund to cover the Fund’s exposure to the counterparty. However, there is no assurance that such mitigating factors are easily enforceable. In addition to master netting arrangements, the right toset-off exists when all the conditions are met such that each of the parties owes the other determinable amounts, the reporting party has the right toset-off the amount owed with the amount owed by the other party, the reporting party intends toset-off and the right ofset-off is enforceable by law. During the reporting period, there was no intention to settle on a net basis and all amounts are presented on a gross basis on the Statement of Assets and Liabilities.
Securities Lending: The Fund lends its portfolio securities to banks and broker-dealers. The loans are secured by collateral at least equal to the market value of the securities loaned. Collateral pledged by each borrower is invested in an affiliated money market fund and is marked to market daily, based on the previous day’s market value, such that the value of the collateral exceeds the value of the loaned securities. In the event of significant appreciation in value of securities on loan on the last business day of the reporting period, the financial statements may reflect a collateral value that is less than the market value of the loaned securities. Such shortfall is remedied as described above. Loans are subject to termination at the option of the borrower or the Fund. Upon termination of the loan, the borrower will return to the Fund securities identical to the loaned securities. Should the borrower of the securities fail financially, the Fund has the right to repurchase the securities in the open market using the collateral.
The Fund recognizes income, net of any rebate and securities lending agent fees, for lending its securities in the form of fees or interest on the investment of any cash received as collateral. The borrower receives all interest and dividends from the securities loaned and such payments are passed back to the lender in amounts equivalent thereto. The Fund also continues to recognize any unrealized gain (loss) in the market price of the securities loaned and on the change in the value of the collateral invested that may occur during the term of the loan. In addition, realized gain (loss) is recognized on changes in the value of the collateral invested upon liquidation of the collateral. Net earnings from securities lending are disclosed on the Statement of Operations as “Income from securities lending, net”.
Securities Transactions and Net Investment Income: Securities transactions are recorded on the trade date. Realized gains (losses) from investment and currency transactions are calculated on the specific identification method. Dividend income is recorded on theex-date, or for certain foreign securities, when the Fund becomes aware of such dividends. Interest income, including amortization of premium and accretion of discount on debt securities, as required, is recorded on the accrual basis. Expenses are recorded on an accrual basis, which may require the use of certain estimates by management that may differ from actual.
B2
Taxes: It is the Fund’s policy to continue to meet the requirements of the Internal Revenue Code applicable to regulated investment companies and to distribute all of its taxable net investment income and capital gains, if any, to its shareholders. Therefore, no federal income tax provision is required. Withholding taxes on foreign dividends, interest and capital gains, if any, are recorded, net of reclaimable amounts, at the time the related income is earned.
Dividends and Distributions: The Fund expects to pay dividends of net investment income semi-annually and distributions of net realized capital gains, if any, at least annually. Dividends and distributions to shareholders, which are determined in accordance with federal income tax regulations and which may differ from generally accepted accounting principles, are recorded on theex-date. Permanent book/tax differences relating to income and gain (loss) are reclassified amongst total distributable earnings (loss) andpaid-in capital in excess of par, as appropriate.
Estimates: The preparation of financial statements requires management to make estimates and assumptions that affect the reported amounts and disclosures in the financial statements. Actual results could differ from those estimates.
The Fund has a management agreement with PGIM Investments. Pursuant to this agreement, PGIM Investments has responsibility for all investment advisory services and supervises the Subadviser’s performance of such services. PGIM Investments has entered into a subadvisory agreement with Jennison Associates LLC (“Jennison”) (the “Subadviser”), under which provides that Jennison will furnish investment advisory services in connection with the management of the Fund. In connection therewith, Jennison is obligated to keep certain books and records of the Fund. PGIM Investments pays for the services of the Subadviser, the cost of compensation of officers of the Fund, costs related to shareholder reporting, occupancy and certain clerical and administrative expenses of the Fund. The Fund bears all other costs and expenses.
The management fee paid to PGIM Investments is accrued daily and payable monthly at an annual rate of 0.55% of the Fund’s average daily net assets. All amounts paid or payable by the Fund to the Manager, under the agreement, are reflected in the Statement of Operations.
The Fund has a distribution agreement with Prudential Investment Management Services LLC (“PIMS”), which acts as the distributor of the shares of the Fund. No distribution or service fees are paid to PIMS as distributor of shares of the Fund.
The Fund has entered into brokerage commission recapture agreements with certain registered broker-dealers. Under the brokerage commission recapture program, a portion of the commission is returned to the Fund. Such amounts are included within realized gain (loss) on investment transactions presented in the Statement of Operations. For the year ended December 31, 2018, brokerage commission recaptured under these agreements was $4,160.
PGIM Investments, PICA, PIMS and Jennison are indirect, wholly-owned subsidiaries of Prudential Financial, Inc. (“Prudential”).
| 3. | | Other Transactions with Affiliates |
The Fund may enter into certain securities purchase or sale transactions under Board approved Rule17a-7 procedures. Rule17a-7 is an exemptive rule under the 1940 Act, that subject to certain conditions, permits purchase and sale transactions among affiliated investment companies, or between an investment company and a person that is affiliated solely by reason of having a common (or affiliated) investment adviser, common directors, and/or common officers. Such transactions are subject to ratification by the Board. For the year ended December 31, 2018, no such transactions were entered into by the Fund.
The Fund may invest its overnight sweep cash in the PGIM Core Ultra Short Bond Fund (formerly known as Prudential Core Ultra Short Bond Fund) (the “Core Fund”), and its securities lending cash collateral in the PGIM Institutional Money Market Fund (formerly known as Prudential Institutional Money Market Fund) (the “Money Market Fund”), each a series of Prudential Investment Portfolios 2, registered under the 1940 Act and managed by PGIM Investments. Through the Fund’s investments in the mentioned underlying funds, PGIM Investments and/or its affiliates are paid fees or compensated for providing their services. Earnings from the Core Fund and Money Market Fund are disclosed on the Statement of Operations as “Affiliated dividend income” and “Income
B3
from securities lending, net”, respectively.
The aggregate cost of purchases and proceeds from sales of portfolio securities (excluding short-term investments and U.S. Government securities) for the year ended December 31, 2018, were $19,591,843 and $39,061,503, respectively.
A summary of the cost of purchases and proceeds from sales of shares of affiliated mutual funds for the year ended December 31, 2018, is presented as follows:
| | | | | | | | | | | | | | | | | | | | | | | | | | | | | | |
Value, Beginning of Year | | | Cost of
Purchases | | | Proceeds
from Sales | | | Change in
Unrealized
Gain
(Loss) | | | Realized
Gain
(Loss) | | | Value,
End
of Year | | | Shares,
End
of Year | | | Income | |
| | PGIM Core Ultra Short Bond Fund* | | | | | | | | | | | | | | | | | | | | | |
| | $ — | | | $ | 25,926,718 | | | $ | 24,939,677 | | | $ | — | | | $ | — | | | $ | 987,041 | | | | 987,041 | | | $ | 68,608 | |
| | PGIM Institutional Money Market Fund* | | | | | | | | | | | | | | | | | | | | | |
| | 6,479,690 | | | | 93,986,636 | | | | 95,025,389 | | | | 151 | | | | (609 | ) | | | 5,440,479 | | | | 5,441,023 | | | | 15,832 | ** |
| | | | | | | | | | | | | | | | | | | | | | | | | | | | | | |
| | $6,479,690 | | | $ | 119,913,354 | | | $ | 119,965,066 | | | $ | 151 | | | $ | (609 | ) | | $ | 6,427,520 | | | | | | | $ | 84,440 | |
| | | | | | | | | | | | | | | | | | | | | | | | | | | | | | |
| | * | The Fund did not have any capital gain distributions during the reporting period. |
| | ** | This amount is included in “Income from securities lending, net” on the Statement of Operations. |
| 5. | | Distributions and Tax Information |
Distributions to shareholders, which are determined in accordance with federal income tax regulations and which may differ from generally accepted accounting principles, are recorded on theex-date.
For the year ended December 31, 2018, the tax character of dividends paid by the Fund were $1,393,821 of ordinary income and $13,755,266 of long-term capital gains. For the year ended December 31, 2017, the tax character of dividends paid by the Fund were $431,781 of ordinary income and $18,620,021 of long-term capital gains.
As of December 31, 2018, the accumulated undistributed earnings on a tax basis were $55,520 of ordinary income and $2,058,616 of long-term capital gains.
The United States federal income tax basis of the Fund’s investments and the net unrealized appreciation as of December 31, 2018 were as follows:
| | | | | | | | | | | | |
Tax Basis | | Gross
Unrealized
Appreciation | | | Gross
Unrealized
Depreciation | | | Net
Unrealized
Appreciation | |
| $75,926,938 | | $ | 84,706,445 | | | $ | (4,376,810 | ) | | $ | 80,329,635 | |
The difference between book basis and tax basis is primarily attributable to deferred losses on wash sales.
The Manager has analyzed the Fund’s tax positions taken on federal, state and local income tax returns for all open tax years and has concluded that no provision for income tax is required in the Fund’s financial statements for the current reporting period. The Fund’s federal, state and local income and federal excise tax returns for tax years for which the applicable statutes of limitations have not expired are subject to examination by the Internal Revenue Service and state departments of revenue.
The Fund, along with other affiliated registered investment companies (the “Funds”), is a party to a Syndicated Credit Agreement (“SCA”) with a group of banks. The purpose of the SCA is to provide an alternative source of temporary funding for capital share redemptions. The SCA provides for a commitment of $900 million for the period October 4, 2018 through October 3, 2019. The Funds pay an annualized commitment fee of 0.15% of the unused
B4
portion of the SCA. The Fund’s portion of the commitment fee for the unused amount, allocated based upon a method approved by the Board, is accrued daily and paid quarterly. Prior to October 4, 2018, the Fund had another SCA that provided a commitment of $900 million and the Fund paid an annualized commitment fee of 0.15% of the unused portion of the SCA. The interest on borrowings under the SCAs is paid monthly and at a per annum interest rate based upon a contractual spread plus the higher of (1) the effective federal funds rate, (2) the1-month LIBOR rate or (3) zero percent.
Other affiliated registered investment companies that are parties to the SCA include portfolios that are subject to a predetermined mathematical formula used to manage certain benefit guarantees offered under variable annuity contracts. The formula may result in large scale asset flows into and out of these portfolios. Consequently, these portfolios may be more likely to utilize the SCA for purposes of funding redemptions. It may be possible for those portfolios to fully exhaust the committed amount of the SCA, thereby requiring the Manager to allocate available funding per a Board-approved methodology designed to treat the Funds in the SCA equitably.
The Fund did not utilize the SCA during the year ended December 31, 2018.
| 7. | | Ownership and Affiliates |
Pursuant to the Fund’s Articles of Incorporation, the Fund is authorized to issue 75,000,000 shares, with a par value of $0.01 per share, and an aggregate par value of $750,000.
As of December 31, 2018, all shares of record of the Fund were owned by PICA on behalf of the owners of the three variable insurance products: Prudential’s Investment Plan Account, Prudential’s Annuity Plan Account and Prudential’s Annuity PlanAccount-2.
| 8. | | Risks of Investing in the Fund |
The Fund’s risks include, but are not limited to, some or all of the risks discussed below:
Equity and Equity-Related Securities Risks: The value of a particular security could go down and you could lose money. In addition to an individual security losing value, the value of the equity markets or a sector in which the Fund invests could go down. The Fund’ holdings can vary significantly from broad market indexes and the performance of the Fund can deviate from the performance of these indexes. Different parts of a market can react differently to adverse issuer, market, regulatory, political and economic developments.
Market and Credit Risk: Securities markets may be volatile and the market prices of the Fund’s securities may decline. Securities fluctuate in price based on changes in an issuer’s financial condition and overall market and economic conditions. If the market prices of the securities owned by the Fund fall, the value of an investment in the Fund will decline. Additionally, the Fund may also be exposed to credit risk in the event that an issuer or guarantor fails to perform or that an institution or entity with which the Fund has unsettled or open transactions defaults.
| 9. | | Recent Accounting Pronouncements and Reporting Updates |
In August 2018, the Securities and Exchange Commission (the “SEC”) adopted amendments to RegulationS-X to update and simplify the disclosure requirements for registered investment companies by eliminating requirements that are redundant or duplicative of US GAAP requirements or other SEC disclosure requirements. The new amendments require the presentation of the total, rather than the components, of distributable earnings on the Statement of Assets and Liabilities and the total, rather than the components, of dividends from net investment income and distributions from net realized gains on the Statements of Changes in Net Assets. The amendments also removed the requirement for the parenthetical disclosure of undistributed net investment income on the Statements of Changes in Net Assets and certain tax adjustments that were reflected in the Notes to Financial Statements. All of these have been reflected in the Fund’s financial statements.
In August 2018, the FASB issued Accounting Standards Update (“ASU”)No. 2018-13, which changes certain fair value measurement disclosure requirements. The new ASU, in addition to other modifications and additions, removes the requirement to disclose the amount and reasons for transfers between Level 1 and Level 2 of the fair value hierarchy, and the Fund’s policy for the timing of transfers between levels. The amendments are effective for financial statements issued for fiscal years beginning after December 15, 2019, and interim periods within those fiscal years. The Manager has evaluated the implications of certain provisions of the ASU and has determined to early adopt aspects related to the removal and modification of certain fair value measurement disclosures under the ASU effective immediately. At this time, the Manager is evaluating the implications of certain other provisions
B5
of the ASU related to new disclosure requirements and any impact on the financial statement disclosures has not yet been determined.
B6
Financial Highlights
| | | | | | | | | | | | | | | | | | | | |
| | | Prudential’s Gibraltar Fund, Inc. | |
| | | Year Ended December 31, | |
| | | 2018 | | | 2017 | | | 2016 | | | 2015 | | | 2014 | |
Per Share Operating Performance: | | | | | | | | | | | | | | | | | | | | |
Net Asset Value, beginning of year | | $ | 17.18 | | | $ | 14.31 | | | $ | 15.64 | | | $ | 15.24 | | | $ | 15.73 | |
| | | | | | | | | | | | | | | | | | | | |
Income (Loss) From Investment Operations: | | | | | | | | | | | | | | | | | | | | |
Net investment income (loss) | | | 0.05 | | | | 0.05 | | | | 0.03 | | | | 0.02 | | | | 0.04 | |
Net realized and unrealized gain (loss) on investment transactions | | | 0.83 | | | | 5.11 | | | | 0.05 | | | | 1.92 | | | | 1.24 | |
| | | | | | | | | | | | | | | | | | | | |
Total from investment operations | | | 0.88 | | | | 5.16 | | | | 0.08 | | | | 1.94 | | | | 1.28 | |
| | | | | | | | | | | | | | | | | | | | |
Less Dividends and Distributions: | | | | | | | | | | | | | | | | | | | | |
Dividends from net investment income | | | (0.04 | ) | | | (0.05 | ) | | | (0.03 | ) | | | (0.03 | ) | | | (0.04 | ) |
Distributions from net realized gains on investments | | | (1.72 | ) | | | (2.24 | ) | | | (1.38 | ) | | | (1.51 | ) | | | (1.73 | ) |
| | | | | | | | | | | | | | | | | | | | |
Total dividends and distributions | | | (1.76 | ) | | | (2.29 | ) | | | (1.41 | ) | | | (1.54 | ) | | | (1.77 | ) |
| | | | | | | | | | | | | | | | | | | | |
Net Asset Value, end of year | | $ | 16.30 | | | $ | 17.18 | | | $ | 14.31 | | | $ | 15.64 | | | $ | 15.24 | |
| | | | | | | | | | | | | | | | | | | | |
Total Return(a): | | | 4.61 | % | | | 36.24 | % | | | 0.39 | % | | | 12.65 | % | | | 8.43 | % |
Ratios/Supplemental Data: | | | | | | | | | | | | | | | | | | | | |
Net assets, end of year (in millions) | | $ | 150.8 | | | $ | 160.8 | | | $ | 143.4 | | | $ | 158.6 | | | $ | 158.9 | |
Ratios to average net assets(b): | | | | | | | | | | | | | | | | | | | | |
Expenses after waivers and/or expense reimbursement | | | 0.61 | % | | | 0.62 | % | | | 0.62 | % | | | 0.62 | % | | | 0.62 | % |
Expenses before waivers and/or expense reimbursement | | | 0.61 | % | | | 0.62 | % | | | 0.62 | % | | | 0.62 | % | | | 0.62 | % |
Net investment income (loss) | | | 0.25 | % | | | 0.29 | % | | | 0.19 | % | | | 0.14 | % | | | 0.25 | % |
Portfolio turnover rate(c) | | | 12 | % | | | 16 | % | | | 21 | % | | | 22 | % | | | 31 | % |
| (a) | Total return is calculated assuming a purchase of a share on the first day and a sale on the last day of each year reported and includes reinvestment of distributions, if any, and does not reflect the effect of insurance contract charges. Total return does not reflect expenses associated with the separate account such as administrative fees, account charges and surrender charges which, if reflected, would reduce the total returns for all years shown. Performance figures may reflect fee waivers and/or expense reimbursements. In the absence of fee waivers and/or expense reimbursements, the total return would be lower. Past performance is no guarantee of future results. Total returns may reflect adjustments to conform to generally accepted accounting principles. |
| (b) | Does not include expenses of the underlying funds in which the Fund invests. |
| (c) | The Fund’s turnover rate is calculated in accordance with regulatory requirements, without regard to transactions involving short term investments and certain derivatives. If such transactions were included, the Fund’s turnover rate may be higher. |
SEE NOTES TO FINANCIAL STATEMENTS.
C1
REPORT OF INDEPENDENT REGISTERED PUBLIC ACCOUNTING FIRM
TO THE SHAREHOLDERS AND BOARD OF DIRECTORS
PRUDENTIAL’S GIBRALTAR FUND, INC.:
Opinion on the Financial Statements
We have audited the accompanying statement of assets and liabilities of Prudential’s Gibraltar Fund, Inc. (the Fund), including the schedule of investments, as of December 31, 2018, the related statement of operations for the year then ended, the statements of changes in net assets for each of the years in thetwo-year period then ended, and the related notes (collectively, the financial statements) and the financial highlights for each of the years indicated therein. In our opinion, the financial statements and financial highlights present fairly, in all material respects, the financial position of the Fund as of December 31, 2018, the results of its operations for the year then ended, changes in its net assets for each of the years in thetwo-year period then ended, and the financial highlights for each of the years indicated therein, in conformity with U.S. generally accepted accounting principles.
Basis for Opinion
These financial statements and financial highlights are the responsibility of the Fund’s management. Our responsibility is to express an opinion on these financial statements and financial highlights based on our audits. We are a public accounting firm registered with the Public Company Accounting Oversight Board (United States) (PCAOB) and are required to be independent with respect to the Fund in accordance with the U.S. federal securities laws and the applicable rules and regulations of the Securities and Exchange Commission and the PCAOB.
We conducted our audits in accordance with the standards of the PCAOB. Those standards require that we plan and perform the audit to obtain reasonable assurance about whether the financial statements and financial highlights are free of material misstatement, whether due to error or fraud. Our audits included performing procedures to assess the risks of material misstatement of the financial statements and financial highlights, whether due to error or fraud, and performing procedures that respond to those risks. Such procedures included examining, on a test basis, evidence regarding the amounts and disclosures in the financial statements and financial highlights. Such procedures also included confirmation of securities owned as of December 31, 2018, by correspondence with the custodian, transfer agent, or brokers, or by other appropriate auditing procedures when replies were not received. Our audits also included evaluating the accounting principles used and significant estimates made by management, as well as evaluating the overall presentation of the financial statements and financial highlights. We believe that our audits provide a reasonable basis for our opinion.

We have served as the auditor of one or more PGIM and/or Prudential Insurance investment companies since 2003.
New York, New York
February 14, 2019
D1
Federal Income Tax Information (unaudited)
We are advising you that during the year ended December 31, 2018, the Fund reports the maximum amount allowed per share but not less than $1.60 as a capital gain distribution in accordance with Section 852 (b)(3)(C) of the Internal Revenue Code.
For the year ended December 31, 2018, the Fund reports, in accordance with Section 854 of the Internal Revenue Code, the following percentages of the ordinary income distributions paid as 1) qualified dividend income (QDI); and 2) eligible for corporate dividends received deduction (DRD):
| | | | | | | | |
| | | QDI | | | DRD | |
Prudential’s Gibraltar Fund, Inc. | | | 96.64 | % | | | 93.70 | % |
D2
INFORMATION ABOUT DIRECTORS AND OFFICERS (Unaudited)
Information about the Directors and the Officers of Prudential’s Gibraltar Fund, Inc. (the Fund) is set forth below. Directors who are not deemed to be “interested persons” of the Fund, as defined in the Investment Company Act of 1940, are referred to as “Independent Directors.” Directors who are deemed to be “interested persons” of the Fund are referred to as “Interested Directors.” The Directors are responsible for the overall supervision of the operations of the Fund and perform the various duties imposed on the directors of investment companies by the Investment Company Act of 1940.
| | | | | | |
| | | | |
| Independent Directors | | | | | | |
Name, Address, Age
No. of Portfolios Overseen | | Principal Occupation(s) During Past
5 Years | | Other Directorships Held by Director** | | Length of Board Service |
Susan Davenport Austin* Age: 51 No. of Portfolios Overseen: 108 | | Senior Managing Director of Brock Capital (Since 2014); formerly Vice Chairman (2013-2017), Senior Vice President and Chief Financial Officer (2007-2012) and Vice President of Strategic Planning and Treasurer (2002-2007) of Sheridan Broadcasting Corporation; formerly President of Sheridan Gospel Network (2004-2014); formerly Vice President, Goldman, Sachs & Co. (2000-2001); formerly Associate Director, Bear, Stearns & Co. Inc. (1997-2000); formerly Vice President, Salomon Brothers Inc. (1993-1997); Member of the Board of Directors, The MacDowell Colony (Since 2010); Director (Since 2017); formerly Presiding Director (2014-2017) and Chairman (2011-2014) of the Board of Directors, Broadcast Music, Inc.; Member of the Board of Directors, Hubbard Radio, LLC (Since 2011); President, Candide Business Advisors, Inc. (Since 2011); formerly Member of the Board of Directors, National Association of Broadcasters (2004-2010). | | Director of NextEra Energy Partners, LP (NYSE: NEP) (Since February 2015). | | Since February 2011 |
Sherry S. Barrat* Age: 69 No. of Portfolios Overseen: 108 | | Formerly Vice Chairman of Northern Trust Corporation (financial services and banking institution) (2011-June 2012); formerly President, Personal Financial Services, Northern Trust Corporation (2006-2010); formerly Chairman & CEO, Western US Region, Northern Trust Corporation (1999-2005); formerly President & CEO, Palm Beach/Martin County Region, Northern Trust. | | Director of NextEra Energy, Inc. (NYSE: NEE) (1998-Present); Director of Arthur J. Gallagher & Company (Since July 2013). | | Since January 2013 |
Jessica M. Bibliowicz* Age: 59 No. of Portfolios Overseen: 108 | | Senior Adviser (Since 2013) of Bridge Growth Partners (private equity firm); formerly Director (2013-2016) of Realogy Holdings Corp. (residential real estate services); formerly Chief Executive Officer (1999-2013) of National Financial Partners (independent distributor of financial services products). | | Director (since 2006) of The Asia-Pacific Fund, Inc.; Sotheby’s (since 2014) (auction house and art-related finance). | | Since September 2014 |
Kay Ryan Booth* Age: 68 No. of Portfolios Overseen: 108 | | Partner, Trinity Private Equity Group (Since September 2014); formerly, Managing Director of Cappello Waterfield & Co. LLC (2011-2014); formerly Vice Chair, Global Research, J.P. Morgan (financial services and investment banking institution) (June 2008-January 2009); formerly Global Director of Equity Research, Bear Stearns & Co., Inc. (financial services and investment banking institution) (1995-2008); formerly Associate Director of Equity Research, Bear Stearns & Co., Inc. (1987-1995). | | None. | | Since January 2013 |
E1
| | | | | | |
| | | | |
| Independent Directors | | | | | | |
Name, Address, Age
No. of Portfolios Overseen | | Principal Occupation(s) During Past
5 Years | | Other Directorships Held by Director** | | Length of Board Service |
Stephen M. Chipman* Age: 57 No. of Portfolios Overseen: 108 | | Group Managing Director International Expansion and Regional Managing Director, Americas of Vistra (Since June 2018); formerly Chief Executive Officer and Director of Radius (2016-2018); formerly Vice Chairman (January 2015-October 2015) and Chief Executive Officer (January 2010-December 2014) of Grant Thornton LLP. | | None. | | Since January 2018 |
Robert F. Gunia* Age: 72 No. of Portfolios Overseen: 108 | | Director ICI Mutual Insurance Company (June 2016-present; June 2012-June 2015); formerly Chief Administrative Officer (September 1999-September 2009) and Executive Vice President (December 1996-September 2009) of PGIM Investments LLC; formerly Executive Vice President (March 1999-September 2009) and Treasurer (May 2000-September 2009) of Prudential Mutual Fund Services LLC; formerly President (April 1999-December 2008) and Executive Vice President and Chief Operating Officer (December 2008-December 2009) of Prudential Investment Management Services LLC; formerly Chief Administrative Officer, Executive Vice President and Director (May 2003-September 2009) of AST Investment Services, Inc. | | Director (Since May 1989) of The Asia-Pacific Fund, Inc. | | Since July 2003 |
Thomas T. Mooney* Age: 77 Independent Chair Since July 2003 No. of Portfolios Overseen: 108 | | Formerly Chief Executive Officer, Excell Partners, Inc. (2005-2007); founding partner of High Technology of Rochester and the Lennox Technology Center; formerly President of the Greater Rochester Metro Chamber of Commerce (1976-2004); formerly Rochester City Manager (1973); formerly Deputy Monroe County Executive (1974-1976). | | None. | | Since July 2003 |
Thomas M. O’Brien* Age: 68 No. of Portfolios Overseen: 108 | | Vice Chairman of Emigrant Bank and President of its Naples Commercial Finance Division (Since October 2018); formerly Director, President and CEO Sun Bancorp, Inc. N.A. (NASDAQ: SNBC) and Sun National Bank (July 2014-February 2018); formerly Consultant, Valley National Bancorp, Inc. and Valley National Bank (January 2012-June 2012); formerly President and COO (November 2006-April 2017) and CEO (April 2007-December 2011) of State Bancorp, Inc. and State Bank; formerly Vice Chairman (January 1997-April 2000) of North Fork Bank; formerly President and Chief Executive Officer (December 1984-December 1996) of North Side Savings Bank; formerly President and Chief Executive Officer (May 2000-June 2006) Atlantic Bank of New York. | | Formerly Director, Sun Bancorp, Inc. N.A. (NASDAQ: SNBC) and Sun National Bank (July 2014-February 2018); formerly Director, BankUnited, Inc. and BankUnited N.A. (NYSE: BKU) (May 2012-April 2014); formerly Director (April 2008-January 2012) of Federal Home Loan Bank of New York; formerly Director (December 1996-May 2000) of North Fork Bancorporation, Inc.; formerly Director (May 2000-April 2006) of Atlantic Bank of New York; Director (November 2006-January 2012) of State Bancorp, Inc. (NASDAQ: STBC) and State Bank of Long Island. | | Since July 2003 |
| | | | |
| Interested Director | | | | | | |
Timothy S. Cronin* Age: 53 No. of Portfolios Overseen: 108 | | President of Prudential Annuities (Since June 2015); Chief Investment Officer and Strategist of Prudential Annuities (Since January 2004); Director of Investment & Research Strategy (Since February 1998); President of AST Investment Services, Inc. (Since June 2005). | | None. | | Since October 2009 |
* The address of each Director is c/o PGIM Investments LLC, 655 Broad Street, Newark, New Jersey 07102.
** Includes only directorships of companies required to register or file reports with the Securities and Exchange Commission (SEC) under the Securities Exchange Act of 1934 (that is, “public companies”) or other investment companies registered under the Investment Company Act of 1940.
† The Fund Complex consists of all investment companies managed by PGIM Investments LLC. The Funds for which PGIM Investments LLC serves as manager include the PGIM Funds, The Prudential Variable Contract Accounts 2 and 10, PGIM Short Duration High Yield Fund, Inc., PGIM Global Short Duration High Yield Fund, Inc., PGIM ETF Trust, The Prudential Series Fund, Advanced Series Trust, and Prudential’s Gibraltar Fund, Inc.
E2
| | | | |
| | | |
| Fund Officers1 | | | | |
Name, Age Position with the Fund | | Principal Occupation(s) During Past 5 Years
| | Length of Service as Fund Officer
|
Edward C. Merrill, IV, CFA* Age: 34 Vice President | | Vice President of Prudential Annuities (since December 2014); formerly Director of Prudential Annuities (December 2010-December 2014); formerly Manager of Prudential Annuities (August 2009-December 2010); formerly Senior Analyst of Prudential Annuities (October 2008-August 2009). | | Since June 2017 |
Raymond A. O’Hara* Age: 63 Chief Legal Officer | | Vice President and Corporate Counsel (since July 2010) of Prudential Insurance Company of America (Prudential); Vice President (March 2011-Present) of Pruco Life Insurance Company and Pruco Life Insurance Company of New Jersey; Vice President and Corporate Counsel (March 2011-Present) of Prudential Annuities Life Assurance Corporation; Chief Legal Officer of PGIM Investments LLC (since June 2012); Chief Legal Officer of Prudential Mutual Fund Services LLC (since June 2012) and Corporate Counsel of AST Investment Services, Inc. (since June 2012); formerly Assistant Vice President and Corporate Counsel (September 2008-July 2010) of The Hartford Financial Services Group, Inc.; formerly Associate (September 1980-December 1987) and Partner (January 1988-August 2008) of Blazzard & Hasenauer, P.C. (formerly, Blazzard, Grodd & Hasenauer, P.C.). | | Since June 2012 |
Chad A. Earnst* Age: 43 Chief Compliance Officer | | Chief Compliance Officer (September 2014-Present) of PGIM Investments LLC; Chief Compliance Officer (September 2014-Present) of the PGIM Funds, Advanced Series Trust, The Prudential Series Fund, Prudential’s Gibraltar Fund, Inc., PGIM Global Short Duration High Yield Income Fund, Inc., PGIM Short Duration High Yield Fund, Inc. and Prudential Jennison MLP Income Fund, Inc.; formerly Assistant Director (March 2010-August 2014) of the Asset Management Unit, Division of Enforcement, US Securities & Exchange Commission; Assistant Regional Director (January 2010-August 2014), Branch Chief (June 2006–December 2009) and Senior Counsel (April 2003-May 2006) of the Miami Regional Office, Division of Enforcement, US Securities & Exchange Commission. | | Since September 2014 |
Dino Capasso* Age: 43 Deputy Chief Compliance Officer | | Vice President and Deputy Chief Compliance Officer (June 2017-Present) of PGIM Investments LLC; formerly, Senior Vice President and Senior Counsel (January 2016-June 2017), and Vice President and Counsel (February 2012-December 2015) of Pacific Investment Management Company LLC. | | Since March 2018 |
Andrew R. French* Age: 56 Secretary | | Vice President and Corporate Counsel (since February 2010) of Prudential; formerly Director and Corporate Counsel (2006-2010) of Prudential; Vice President and Assistant Secretary (since January 2007) of PGIM Investments LLC; Vice President and Assistant Secretary (since January 2007) of Prudential Mutual Fund Services LLC. | | Since October 2006 |
Jonathan D. Shain* Age: 60 Assistant Secretary | | Vice President and Corporate Counsel (since August 1998) of Prudential; Vice President and Assistant Secretary (since May 2001) of PGIM Investments LLC; Vice President and Assistant Secretary (since February 2001) of Prudential Mutual Fund Services LLC; formerly Vice President and Assistant Secretary (May 2003-June 2005) of AST Investment Services, Inc. | | Since May 2005 |
Claudia DiGiacomo* Age: 44 Assistant Secretary | | Vice President and Corporate Counsel (since January 2005) of Prudential; Vice President and Assistant Secretary of PGIM Investments LLC (since December 2005); Associate at Sidley Austin Brown Wood LLP (1999-2004). | | Since December 2005 |
Kathleen DeNicholas* Age: 44 Assistant Secretary | | Vice President and Corporate Counsel (since May 2013) of Prudential; Managing Counsel at The Bank of New York Mellon Corporation (2011-2013); formerly Senior Counsel (2007-2011) and Assistant General Counsel (2001-2007) of The Dreyfus Corporation; Chief Legal Officer and Secretary of MBSC Securities Corporation (2011-2013); Vice President and Assistant Secretary of The Dreyfus Family of Funds (2010-2012). | | Since May 2013 |
Christian J. Kelly* Age: 43 Treasurer and Principal Financial & Accounting Officer | | Vice President, Head of Fund Administration of PGIM Investments LLC (since November 2018); formerly, Director of Fund Administration of Lord Abbett & Co. LLC (2009-2018), Treasurer and Principal Accounting Officer of the Lord Abbett Family of Funds (2017-2018); Director of Accounting, Avenue Capital Group (2008-2009); Senior Manager, Investment Management Practice of Deloitte & Touche LLP (1998-2007). | | Since January 2019 |
Peter Parrella* Age: 60 Assistant Treasurer | | Vice President (since 2007) and Director (2004-2007) within Prudential Mutual Fund Administration; formerly Tax Manager at SSB Citi Fund Management LLC (1997-2004). | | Since June 2007 |
Lana Lomuti* Age: 51 Assistant Treasurer | | Vice President (since 2007) and Director (2005-2007), within Prudential Mutual Fund Administration; formerly Assistant Treasurer (December 2007-February 2014) of The Greater China Fund, Inc. | | Since April 2014 |
Linda McMullin* Age: 57 Assistant Treasurer | | Vice President (since 2011) and Director (2008-2011) within Prudential Mutual Fund Administration. | | Since April 2014 |
E3
| | | | |
| | | |
| Fund Officers1 | | | | |
Name, Age Position with the Fund | | Principal Occupation(s) During Past 5 Years
| | Length of Service as Fund Officer
|
Alina Srodecka, CPA* Age: 52 Assistant Treasurer | | Vice President of Tax at Prudential Financial, Inc. (Since August 2007); formerly Director of Tax at MetLife (January 2003-May 2006); formerly Tax Manager at Deloitte & Touche (October 1997-January 2003); formerly Staff Accountant at Marsh & McLennan (May 1994-May 1997). | | Since June 2017 |
Charles H. Smith* Age: 46 Anti-Money Laundering Compliance Officer | | Vice President, Corporate Compliance, Anti-Money Laundering Unit (since January 2015) of Prudential; committee member of the American Council of Life Insurers Anti-Money Laundering and Critical Infrastructure Committee (since January 2016); formerly Global Head of Economic Sanctions Compliance at AIG Property Casualty (February 2007-December 2014); Assistant Attorney General at the New York State Attorney General’s Office, Division of Public Advocacy. (August 1998-January 2007). | | Since January 2017 |
* The address for each officer is c/o PGIM Investments LLC, 655 Broad Street, Newark, New Jersey 07102.
1 Excludes Mr. Cronin, an Interested Director who serves as President. Biographical and other information with respect to Mr. Cronin appears under “Interested Director,” above.
E4
Variable contracts contain exclusions, limitations, reductions of benefits, and terms for keeping them in force. For costs and complete details, refer to your contract or contact your licensed financial professional. Contract guarantees are based on the claims-paying ability of the issuing company.
Prudential’s Gibraltar Fund, Inc. is distributed by Prudential Investment Management Services LLC (PIMS), 655 Broad Street, 19th Floor, Newark, NJ 07102, member SIPC, a Prudential Financial company and solely responsible for its own financial condition and contractual obligations.
The Prudential Insurance Company of America
751 Broad Street
Newark, NJ 07102-3714
The Audited Financial Statements of The Prudential Insurance Company of America are available upon request. You may call(888) 778-2888 to obtain a free copy of the Audited Financial Statements.
For service-related questions, please contact the Annuity Service Center at (888) 778-2888.
©2019 Prudential Financial, Inc. and its related entities. PGIM Investments, the Prudential logo, the Rock symbol, and Bring Your Challenges are service marks of Prudential Financial, Inc. and its related entities, registered in many jurisdictions worldwide.
FSP-AR
Item 2 – Code of Ethics ––See Exhibit (a)
As of the end of the period covered by this report, the registrant has adopted a code of ethics (the “Section 406 Standards for Investment Companies – Ethical Standards for Principal Executive and Financial Officers”) that applies to the registrant’s Principal Executive Officer and Principal Financial Officer; the registrant’s Principal Financial Officer also serves as the Principal Accounting Officer.
The registrant hereby undertakes to provide any person, without charge, upon request, a copy of the code of ethics. To request a copy of the code of ethics, contact the registrant800-225-1852, and ask for a copy of the Section 406 Standards for Investment Companies - Ethical Standards for Principal Executive and Financial Officers.
Item 3 – Audit Committee Financial Expert –
The registrant’s Board has determined that Mr. Thomas O’Brien, member of the Board’s Audit Committee is an “audit committee financial expert,” and that he is “independent,” for purposes of this Item.
Item 4 – Principal Accountant Fees and Services –
(a) Audit Fees
For the fiscal years ended December 31, 2018 and December 31, 2017, KPMG LLP (“KPMG”), the Registrant’s principal accountant, billed the Registrant $27,200 and $26,800 respectively, for professional services rendered for the audit of the Registrant’s annual financial statements or services that are normally provided in connection with statutory and regulatory filings.
(b) Audit-Related Fees
For the fiscal years ended December 31, 2018 and December 31, 2017: none.
(c) Tax Fees
For the fiscal years ended December 31, 2018 and December 31, 2017: none.
(d)All Other Fees
For the fiscal years ended December 31, 2018 and December 31, 2017: none.
(e) (1)Audit CommitteePre-Approval Policies and Procedures
THE PRUDENTIAL MUTUAL FUNDS
AUDIT COMMITTEE POLICY
on
Pre-Approval of Services Provided by the Independent Accountants
The Audit Committee of each Prudential Mutual Fund is charged with the responsibility to monitor the independence of the Fund’s independent accountants. As part of this responsibility, the Audit Committee mustpre-approve the independent accounting firm’s engagement to render audit and/or permissiblenon-audit services, as required by law. In evaluating a proposed engagement of the independent accountants, the Audit Committee will assess the effect that the engagement might reasonably be expected to have on the accountant’s independence. The Committee’s evaluation will be based on:
| | ● | | a review of the nature of the professional services expected to be provided, |
| | ● | | a review of the safeguards put into place by the accounting firm to safeguard independence, and |
| | ● | | periodic meetings with the accounting firm. |
Policy for Audit andNon-Audit Services Provided to the Funds
On an annual basis, the scope of audits for each Fund, audit fees and expenses, and audit-related andnon-audit services (and fees proposed in respect thereof) proposed to be performed by the Fund’s independent accountants will be presented by the Treasurer and the independent accountants to the Audit Committee for review and, as appropriate, approval prior to the initiation of such services. Such presentation shall be accompanied by confirmation by both the Treasurer and the independent accountants that the proposednon-audit services will not adversely affect the independence of the independent accountants. Such proposednon-audit services shall be described in sufficient detail to enable the Audit Committee to assess the appropriateness of such services and fees, and the compatibility of the provision of such services with the auditor’s independence. The Committee shall receive periodic reports on the progress of the audit and other services which are approved by the Committee or by the Committee Chair pursuant to authority delegated in this Policy.
The categories of services enumerated under “Audit Services”, “Audit-related Services”, and “Tax Services” are intended to provide guidance to the Treasurer and the independent accountants as to those categories of services which the Committee believes are generally consistent with the independence of the independent accountants and which the Committee (or the Committee Chair) would expect upon the presentation of specific proposals topre-approve. The enumerated categories are not intended as an exclusive list of audit, audit-related or tax services, which the Committee (or the Committee Chair) would consider forpre-approval.
Audit Services
The following categories of audit services are considered to be consistent with the role of the Fund’s independent accountants:
| | Ø | Annual Fund financial statement audits |
| | Ø | Seed audits (related to new product filings, as required) |
| | Ø | SEC and regulatory filings and consents |
Audit-related Services
The following categories of audit-related services are considered to be consistent with the role of the Fund’s independent accountants:
| | Ø | Accounting consultations |
| | Ø | Fund merger support services |
| | Ø | Agreed Upon Procedure Reports |
| | Ø | Other Internal Control Reports |
Individual audit-related services that fall within one of these categories (except for fund merger support services) and are not presented to the Audit Committee as part of the annualpre-approval process are subject to an authorizedpre-approval by the Audit Committee so long as the estimated fee for those services does not exceed $30,000. Any services provided under suchpre-approval will be reported to the Audit Committee at its next regular meeting. Should the amount of such services exceed $30,000 any additional fees will be subject topre-approval by the Committee Chair (or any other Committee member on whom this responsibility has been delegated). Fees related to fund merger support services are subject to a separate authorizedpre-approval by the Audit Committee with fees determined on a per occurrence and merger complexity basis.
Tax Services
The following categories of tax services are considered to be consistent with the role of the Fund’s independent accountants:
| | Ø | Tax compliance services related to the filing or amendment of the following: |
| | ◾ | Federal, state and local income tax compliance; and, |
| | ◾ | Sales and use tax compliance |
| | Ø | Timely RIC qualification reviews |
| | Ø | Tax distribution analysis and planning |
| | Ø | Tax authority examination services |
| | Ø | Tax appeals support services |
| | Ø | Accounting methods studies |
| | Ø | Fund merger support services |
| | Ø | Tax consulting services and related projects |
Individual tax services that fall within one of these categories and are not presented to the Audit Committee as part of the annualpre-approval process are subject to an authorizedpre-approval by the Audit Committee so long as the estimated fee for those services does not exceed $30,000. Any services provided under suchpre-approval will be reported to the Audit Committee at its next regular meeting. Should the amount of such services exceed $30,000 any additional fees will be subject topre-approval by the Committee Chair (or any other Committee member on whom this responsibility has been delegated).
OtherNon-Audit Services
Certainnon-audit services that the independent accountants are legally permitted to render will be subject topre-approval by the Committee or by one or more Committee members to whom the Committee has delegated this authority and who will report to the full Committee anypre-approval decisions made pursuant to this Policy.Non-audit services presented forpre-approval pursuant to this paragraph will be accompanied by a confirmation from both the Treasurer and the independent accountants that the proposed services will not adversely affect the independence of the independent accountants.
Proscribed Services
The Fund’s independent accountants will not render services in the following categories ofnon-audit services:
| | Ø | Bookkeeping or other services related to the accounting records or financial statements of the Fund |
| | Ø | Financial information systems design and implementation |
| | Ø | Appraisal or valuation services, fairness opinions, orcontribution-in-kind reports |
| | Ø | Internal audit outsourcing services |
| | Ø | Management functions or human resources |
| | Ø | Broker or dealer, investment adviser, or investment banking services |
| | Ø | Legal services and expert services unrelated to the audit |
| | Ø | Any other service that the Public Company Accounting Oversight Board determines, by regulation, is impermissible. |
Pre-approval ofNon-Audit Services Provided to Other Entities Within the Prudential Fund Complex
Certainnon-audit services provided to PGIM Investments LLC or any of its affiliates that also provide ongoing services to the Prudential Mutual Funds will be subject topre-approval by the Audit Committee. The onlynon-audit services provided to these entities that will requirepre-approval are thoserelated directly to the operations and financial reporting of the Funds. Individual projects that are not presented to the Audit Committee as part of the annualpre-approval process will be subject topre-approval by the Committee Chair (or any other Committee member on whom this responsibility has been delegated) so long as the estimated fee for those services does not exceed $30,000. Services presented forpre-approval pursuant to this paragraph will be accompanied by a confirmation from both the Treasurer and the independent accountants that the proposed services will not adversely affect the independence of the independent accountants.
Although the Audit Committee will notpre-approve all services provided to PGIM Investments LLC and its affiliates, the Committee will receive an annual report from the Fund’s independent accounting firm showing the aggregate fees for all services provided to PGIM Investments and its affiliates.
(e) (2)Percentage of services referred to in 4(b) – 4(d) that were approved by the audit committee –
For the fiscal years ended December 31, 2018 and December 31, 2017: none.
|
(f)Percentage of hours expended attributable to work performed by other than full time employees of principal accountant if greater than 50%. |
The percentage of hours expended on the principal accountant’s engagement to audit the registrant’s financial statements for the most recent fiscal year that were attributed to work performed by persons other than the principal accountant’s full-time, permanent employees was 0%.
(g)Non-Audit Fees
The aggregatenon-audit fees billed by KPMG for services rendered to the registrant’s investment adviser and any entity controlling, controlled by, or under common control with the investment adviser that provides ongoing services to the registrant for the fiscal years ended December 31, 2018 and December 31, 2017 was $0 and $0, respectively.
(h)Principal Accountant’s Independence
Not applicable as KPMG has not providednon-audit services to the registrant’s investment adviser and any entity controlling, controlled by, or under common control with the investment adviser that provides ongoing services to the registrant that were notpre-approved pursuant toRule 2-01(c)(7)(ii) ofRegulation S-X.
| Item 5 – | Audit Committee of Listed Registrants – Not applicable. |
| Item 6 – | Schedule of Investments – The schedule is included as part of the report to shareholders filed under Item 1 of this Form. |
| Item 7 – | Disclosure of Proxy Voting Policies and Procedures forClosed-End Management Investment Companies – Not applicable. |
| Item 8 – | Portfolio Managers ofClosed-End Management Investment Companies – Not applicable. |
| Item 9 – | Purchases of Equity Securities byClosed-End Management Investment Company and Affiliated Purchasers – Not applicable. |
Item 10 – Submission of Matters to a Vote of Security Holders – Not applicable.
Item 11 – Controls and Procedures
| | (a) | It is the conclusion of the registrant’s principal executive officer and principal financial officer that the effectiveness of the registrant’s current disclosure controls and procedures (such disclosure controls and procedures having been evaluated within 90 days of the date of this filing) provide reasonable assurance that the information required to be disclosed by the registrant has been recorded, processed, summarized and reported within the time period specified in the Commission’s rules and forms and that the information required to be disclosed by the registrant has been accumulated and communicated to the registrant’s principal executive officer and principal financial officer in order to allow timely decisions regarding required disclosure. |
| | (b) | There has been no significant change in the registrant’s internal control over financial reporting that occurred during the registrant’s most recent fiscal quarter of the period covered by this report that has materially affected, or is likely to materially affect, the registrant’s internal control over financial reporting. |
Item 12 – Exhibits
| | (a) (1) | Code of Ethics – Attached hereto as ExhibitEX-99.CODE-ETH |
| | (2) | Certifications pursuant to Section 302 of the Sarbanes-Oxley Act – Attached hereto as ExhibitEX-99.CERT. |
| | (3) | Any written solicitation to purchase securities under Rule23c-1. – Not applicable. |
| | (b) | Certifications pursuant to Section 906 of the Sarbanes-Oxley Act – Attached hereto as ExhibitEX-99.906CERT. |
SIGNATURES
Pursuant to the requirements of the Securities Exchange Act of 1934 and the Investment Company Act of 1940, the registrant has duly caused this report to be signed on its behalf by the undersigned, thereunto duly authorized.
| | |
| Registrant: | | Prudential’s Gibraltar Fund, Inc. |
| |
| By: | | /s/ Andrew R. French |
| | Andrew R. French |
| | Secretary |
| |
| Date: | | February 14, 2019 |
Pursuant to the requirements of the Securities Exchange Act of 1934 and the Investment Company Act of 1940, this report has been signed below by the following persons on behalf of the registrant and in the capacities and on the dates indicated.
| | |
| By: | | /s/ Timothy S. Cronin |
| | Timothy S. Cronin |
| | | President and Principal Executive Officer |
| |
| Date: | | February 14, 2019 |
| |
| By: | | /s/ Christian J. Kelly |
| | Christian J. Kelly |
| | Treasurer and Principal Financial and Accounting Officer |
| |
| Date: | | February 14, 2019 |