UNITED STATES
SECURITIES AND EXCHANGE COMMISSION
Washington, D.C. 20549
FORM N-CSR
CERTIFIED SHAREHOLDER REPORT OF REGISTERED
MANAGEMENT INVESTMENT COMPANIES
Investment Company Act File number: 811-04982
Heartland Group, Inc.
(Exact name of Registrant as specified in charter)
| 790 North Water Street, Suite 1200, Milwaukee, WI | | 53202 |
| (Address of principal executive offices) | | (Zip code) |
Nicole J. Best
Heartland Group, Inc., 790 North Water Street, Suite 1200, Milwaukee, WI 53202
(Name and address of agent for service)
Ellen Drought
Godfrey & Kahn, S.C., 833 East Michigan Street, Suite 1800, Milwaukee, WI 53202-5615
(With a copy to:)
Registrant’s telephone number, including area code: (414) 347-7777
Date of fiscal year end: December 31
Date of reporting period: June 30, 2020
Form N-CSR is to be used by management investment companies to file reports with the Commission, not later than 10 days after the transmission to stockholders of any report that is required to be transmitted to stockholders under Rule 30e-1 under the Investment Company Act of 1940 (17 CFR 270.30e-1). The Commission may use the information provided on Form N-CSR in its regulatory, disclosure review, inspection, and policymaking roles.
A Registrant is required to disclose the information specified by Form N-CSR, and the Commission will make this information public. A Registrant is not required to respond to the collection of information contained in Form N-CSR unless the Form displays a currently valid Office of Management and Budget ("OMB") control number. Please direct comments concerning the accuracy of the information collection burden estimate and any suggestions for reducing the burden to the Secretary, Securities and Exchange Commission, 100 F Street, NE, Washington, DC 20549. The OMB has reviewed this collection of information under the clearance requirements of 44 U.S.C. § 3507.
| Item 1. | Reports to Stockholders. |

SEMIANNUAL
REPORT
June 30, 2020
Select Value Fund
Mid Cap Value Fund
Value Plus Fund
Value Fund
TABLE OF CONTENTS
Beginning on January 1, 2021, as permitted by regulations adopted by the U.S. Securities and Exchange Commission, paper copies of the Funds’ annual and semi-annual shareholder reports will no longer be sent by mail, unless you specifically request paper copies of the reports. Instead, the reports will be made available on the Funds’ website at www.heartlandadvisors.com and you will be notified by mail each time a report is posted and provided with a website link to access the report.
You may, notwithstanding the availability of shareholder reports online, elect to receive all future shareholder reports in paper free of charge. If you invest through a financial intermediary, you can contact your financial intermediary to request that you continue to receive paper copies of your shareholder reports. If you invest directly with the Funds, you can call 1-800-432-7856 to let the Funds know you wish to continue receiving paper copies of your shareholder reports.
If you already elected to receive shareholder reports electronically, you will not be affected by this change and you need not take any action. You may elect to receive shareholder reports and other communications from the Funds electronically anytime by contacting your financial intermediary (such as a broker-dealer or bank) or, if you are a direct investor, by enrolling at www.heartlandadvisors.com.
A MESSAGE FROM OUR PRESIDENT AND CEO (UNAUDITED)
“Price is What You Pay; Value is What You Get”
—Warren Buffett
Dear Fellow Shareholders,
The first half of 2020 has been anything but normal. In the course of just a few months, investors have gone from panic-based selling, to aggressively bidding up stocks in hopes of a V-shaped economic recovery.
While the recent move higher was a welcome relief for battered portfolios, a closer look painted a less optimistic picture. Breadth was weak with shares of many companies failing to recoup previous losses and large-cap names trumped small.
Adding to our concern was the seeming indifference investors had for fundamentals. As shown below, shares of companies with low returns on equity, as a whole, materially outperformed their higher quality counterparts. Weaker businesses often lead in rallies following selloffs, but the magnitude of the bounce back was noteworthy.
We’d be tempted to overlook these developments as a temporary blip if it weren’t for the picture painted by the data. Recent analysis shows that the mass herding into weak businesses and mega-caps has resulted in profitable small cap companies trading at historical discounts—the most in 30+ years—to the S&P 500 as reflected by earnings yield.
Maybe it’s the result of our long history of value investing, but we find it hard to find joy in overpaying for inferior businesses.
Instead of chasing the allure of a quick rush from buying shares of a questionable business in hopes there is a greater fool out there willing to pay a few cents more, we prefer a more diligent approach. Our satisfaction comes from digging into a business to determine its intrinsic value. We get to know the management team, identify catalysts for growth and look for mispriced opportunities.
We believe this fundamental approach is the best way to help our clients achieve their goal of capital appreciation. In our view, the valuations across each of our portfolios are compelling with solid sales and earnings growth, which could exceed that of many ridiculously priced market darlings.
Low Quality in the Limelight

Source: FactSet; FTSE Russell; Jefferies. This chart shows companies held in the Russell 2000 Index. The 2020 bear market is representing data gathered during 1/16/2020 to 3/18/2020. The average bear market data is calculated based on bear markets taking place during 12/31/1985 to 6/18/2020. Bottom was on 3/18/2020. The average 3-month after bear market data is calculated based on 3 months following each bear market taking place during 12/31/1985 to 6/18/2020. Return on equity (ROE) measures the net income after taxes a firm is able to earn as a percentage of shareholders’ equity. A bear market occurs when the price of a group of securities is falling or is expected to fall.
Past performance does not guarantee future results.
Sincerely,

Will Nasgovitz
President and Chief Executive Officer
HEARTLAND SELECT VALUE FUND
MANAGEMENT’S DISCUSSION OF FUND PERFORMANCE (UNAUDITED)
 | MANAGEMENT REPORT Despite a strong second quarter, U.S. equities failed to fully recoup losses stemming from the COVID-19 selloff of February and March and finished the first half of the year in negative territory. The Heartland Select Value Fund Investor Class lagged the Russell 3000® Value Index, returning -19.18% versus -16.74%. The Fund’s Information Technology holdings outperformed those in the benchmark, and the group contained a top contributor, Alphabet Inc. (GOOGL), the parent company of Google. Shares of Alphabet snapped back after selling off earlier in the year due to fears of a pandemic-driven slump in ad sales revenue. Wall Street analysts cut their outlook for Alphabet earnings for the next 12 months by roughly 15% during the first quarter, however, shares of the company fell by more than twice that amount during the height of the selloff. Near-term economic challenges have muddied the picture for predicting digital ad spending, however, we believe that Alphabet is an excellent business that should be able to grow at a rate in excess of GDP growth in the years ahead. Additionally, the company’s balance sheet is a standout among public companies, and management is investing more than $25 billion per year on research and development, which should provide a catalyst for sustained, above-market earnings expansion. As States started to ease stay-at-home restrictions in late spring, investors showed signs of increasing confidence that the economy would bounce back quickly. The bullish sentiment boosted economically sensitive areas and helped portfolio holdings such as Canadian National Railway Company (CNI), a rail transport company with routes throughout the U.S. Canadian National is an industry leader featuring a management team with a history of making innovative and forward-looking investments in the business. Under this approach, the company has built a rail network that spans coast to coast and from Canada south to the Gulf of Mexico. The efficiency and capacity gained through its rail network, in our view, provides the company with a competitive advantage that it will be able to leverage for the foreseeable future. When shares of Canadian National sold off late in the first quarter, we were quick to take a position at what we believed was a rare discount for an industry powerhouse. Our decision was rewarded this quarter as shares were up double digits from our purchase price. During the weakness that plagued the markets throughout March, we were able to add to some high-quality names as their valuations became more attractive. For example, we had been selling shares of Gorman-Rupp Company (GRC), a global-leading manufacturer of pumps used in municipal water, industrial, agricultural and petrochemical applications early in the year as it approached our estimates of fair value. But as the market began to sell off, valuations once again reached attractive levels and we began to add shares. While we believe the industrial economy will be challenged in the intermediate term, Gorman-Rupp should benefit from demand for water projects throughout the country. Water infrastructure is funded with tax receipts and, therefore, is less sensitive to the economic cycle. We have seen several large municipalities raise money to upgrade their water pump station infrastructure, which we believe will benefit Gorman-Rupp in the years to come. The fallout from COVID-19 is far from over and we have no doubt that unforeseen effects from this evolving pandemic will ripple through the economy and equity markets for quarters to come. We believe businesses with pricing power will have an advantage in an economy that is likely to see excess supply and weakened consumer demand in the near-term. CFA® is a registered trademark owned by the CFA Institute. |
HEARTLAND SELECT VALUE FUND
(UNAUDITED)
FUND SUMMARY
| Average Annual Total Returns | | Inception | | Year To | | One | | Three | | Five | | Ten | | Fifteen | | Twenty | | Since |
| as of June 30, 2020 | | Date | | Date* | | Year | | Years | | Years | | Years | | Years | | Years | | Inception |
| Investor Class (HRSVX) | | 10/11/96 | | -19.18% | | -16.07% | | 0.18% | | 2.85% | | 8.06% | | 6.51% | | 8.74% | | 8.86% |
| Institutional Class (HNSVX) | | 5/1/08 | | -19.06 | | -15.84 | | 0.43 | | 3.10 | | 8.36 | | 6.76 | | 8.93 | | 9.02 |
| Russell 3000® Value Index | | — | | -16.74 | | -9.42 | | 1.41 | | 4.41 | | 10.23 | | 6.15 | | 6.42 | | 7.84 |
Index Source: FactSet Research Systems, Inc. and Russell®.
* Not annualized.
In the prospectus dated 5/1/20, the Gross Fund Operating Expenses for the Investor and Institutional Class are 1.25% and 1.02%, respectively. Heartland Advisors (the “Advisor”) has voluntarily agreed to waive fees and/or reimburse expenses with respect to the Institutional Class, to the extent necessary to maintain the Institutional Class’ Net Annual Operating Expenses at a ratio not to exceed 0.99% of average daily net assets. This voluntary waiver/reimbursement may be discontinued at any time. Without such waivers and/or reimbursements, total returns may have been lower.
Past performance does not guarantee future results. Performance for the Institutional Class prior to its initial offering is based on the performance of the Investor Class. Performance represents past -performance; current returns may be lower or higher. The investment return and principal value will fluctuate so that an investor’s shares, when redeemed, may be worth more or less than the original cost. All returns reflect reinvested dividends and capital gains distributions, but do not reflect the deduction of taxes that an investor would pay on distributions or redemptions. Subject to certain exceptions, shares of a Fund redeemed or exchanged within 10 days of purchase are subject to a 2% redemption fee.
Performance does not reflect this fee, which if deducted would reduce an -individual’s return. To obtain performance through the most recent month end, call 800-432-7856, or visit www.heartlandadvisors.com.
HYPOTHETICAL GROWTH OF $10,000 SINCE INCEPTION — 10/11/96 — INVESTOR CLASS SHARES

SECTOR ALLOCATION — % OF EQUITY INVESTMENTS

Sector and Industry classifications are sourced from GICS®. The Global Industry Classification Standard (GICS®) is the exclusive intellectual property of MSCI Inc. (“MSCI”) and S&P Global Market Intelligence (“S&P”). Neither MSCI, S&P, their affiliates, nor any of their third party providers (“GICS Parties”) makes any representations or warranties, express or implied, with respect to GICS or the results to be obtained by the use thereof, and expressly disclaims all warranties, including warranties of accuracy, completeness, merchantability, and fitness for a particular purpose. The GICS Parties shall not have any liability for any direct, indirect, special, punitive, consequential, or any other damages (including lost profits) even if notified of such damages.
VALUATION ANALYSIS (Equity Securities Only, Weighted Harmonic Average Unless Otherwise Noted)

Source: FactSet Research Systems, Inc., and Russell®.
INVESTMENT GOAL
The Fund seeks long-term capital appreciation.
INVESTMENT STRATEGY/DISTINGUISHING CHARACTERISTIC
The Fund seeks to capture long-term capital appreciation by investing in companies with market capitalizations greater than $500 million. The Fund’s flexible pursuit of value positions it as a core holding. The Fund utilizes Heartland’s disciplined and time–tested 10 Principles of Value Investing™, designed to capture upside potential while minimizing downside risk.
INVESTMENT CONSIDERATIONS
In addition to stocks of large companies, the Fund invests in small- and mid-sized companies- that are generally less liquid and more volatile than large -companies. The Fund also invests in a smaller number of stocks (generally 40 to 60) than the average mutual fund. The performance of these holdings generally will increase the volatility of the Fund’s returns. Value investments are subject to the risk that their intrinsic value may not be recognized by the broad market.
| PORTFOLIO STATISTICS | | |
| | | |
| Number of holdings (excludes cash equivalents) | | 50 |
| Net assets | | $140.1 mil. |
| NAV (Investor Class) | | $20.61 |
| NAV (Institutional Class) | | $20.55 |
| Median market cap | | $1.4 bil. |
| Weighted average market cap | | $107.2 bil. |
| TOP TEN HOLDINGS — % OF NET ASSETS (EXCLUDES CASH EQUIVALENTS) | | |
| | | |
| Berkshire Hathaway, Inc. (Class B) | | 4.46% |
| Johnson & Johnson | | 3.94 |
| Cisco Systems, Inc. | | 3.66 |
| Verizon Communications, Inc. | | 3.51 |
| Exelon Corp. | | 3.42 |
| Unilever NV | | 3.27 |
| The Charles Schwab Corp. | | 3.25 |
| Cal-Maine Foods, Inc. | | 3.11 |
| Alphabet, Inc. (Class A) | | 3.10 |
| Skyworks Solutions, Inc. | | 2.92 |
Portfolio holdings, statistics, and manager views are subject to change without notice, and discussions of portfolio holdings are intended as illustrations of investment strategy, not as recommendations. Index definitions and investment terms are found on the page titled “Definitions and Disclosures.” All indices are unmanaged. It is not possible to invest directly in an index. All information, unless otherwise indicated, is as of 6/30/2020.
HEARTLAND MID CAP VALUE FUND
MANAGEMENT’S DISCUSSION OF FUND PERFORMANCE (UNAUDITED)
 | MANAGEMENT REPORT A strong second quarter for U.S. equities helped recoup some of the losses stemming from the COVID-19 selloff of February and March, but the major indices ended the first half of the year in the red. The Heartland Mid Cap Value Fund Investor Class held up better than its Russell Midcap® Value Index benchmark, returning -17.32% versus -18.09%. Information Technology (IT) lagged but the group contained a top performer, Skyworks Solutions Inc. (SWKS), a manufacturer of semiconductors used in multiple end markets including aerospace and defense, medical, consumer electronics and wireless communication products. Advancements in technology are expected to lead to greater opportunities for Skyworks in the consumer smart phone market, as well as in higher margin commercial applications, which currently account for one-third of total revenue. Sales growth in the industrial, defense and medical lines should help diversify sources of income and improve margins, while advancements in smart phones are expected to drive the use of more Skyworks products in each handset sold. Skyworks has enjoyed a sharp move higher since our purchase late last year, but we still believe it has a long runway for sales growth. Global economic concerns drove a significant pullback in the Energy sector. The portfolio’s names performed in line with the average for the benchmark. In light of the weak pricing power for producers, we’ve sought to own companies with strong balance sheets and top-tier assets such as Pioneer Natural Resources Company (PXD). Pioneer is the largest independent producer operating in the Permian Basin. The company’s size, along with its resource-rich drillable acreage, low-cost structure, and financial strength provides the business with a competitive advantage and the ability to withstand temporary shocks to demand and pricing. Management has implemented a massive streamlining initiative at Pioneer that has already begun to boost free cash flow generation and has resulted in dividend increases and share buybacks. The company has also been selling non-core assets, which provides it more flexibility in the future and has further bolstered its financial position. The portfolio’s Consumer Discretionary names held up meaningfully better than the benchmark average and the group included a solid performer, Advance Auto Parts, Inc. (AAP). The company is a dominant player in the fragmented auto parts industry and differentiates itself from peers through its client mix. We took a stake in the business after it experienced what we viewed as a temporary lull in its self-help efforts. Despite the setback, we’ve been impressed with management’s ability to stabilize gross profit margin, improve free cash flow, and deleverage the balance sheet. We continue to see ample opportunity for achievable operating improvements and believe management is on the right path. As the U.S. economy has begun to reopen from the COVID-19 shutdown, Advance Auto Parts has enjoyed a surge in sales. The jump has caught the attention of investors and shares are up double-digits for the quarter. Investors have been heartened by recent data that shows a more resilient economy than initially expected at the beginning of the pandemic. However, the fallout from COVID-19 is far from over and we have no doubt that unforeseen effects from the coronavirus will ripple through the economy and equity markets for quarters to come. In the face of this ever-changing backdrop, we believe “less bad” news will no longer drive positive performance. Instead, companies will need to show bottom-line growth to differentiate themselves. Balance sheet strength and catalysts that can result in a change in perception by investors remain a priority. We also believe businesses with pricing power will have an advantage in an economy that is likely to see excess supply and weakened consumer demand in the near-term. CFA® is a registered trademark owned by the CFA Institute. |
heartland mid cap value fund
(UNAUDITED)
FUND SUMMARY
| Average Annual Total Returns | | Inception | | Year To | | One | | Three | | Five | | Since |
| as of June 30, 2020 | | Date | | Date* | | Year | | Years | | Years | | Inception |
| Investor Class (HRMDX) | | 10/31/14 | | -17.32% | | -11.16% | | 0.15% | | 4.19% | | 3.93% |
| Institutional Class (HNMDX) | | 10/31/14 | | -17.28 | | -10.98 | | 0.37 | | 4.44 | | 4.19 |
| Russell Midcap® Value Index | | — | | -18.09 | | -11.81 | | -0.54 | | 3.32 | | 3.46 |
Index Source: FactSet Research Systems, Inc., and Russell®.
* Not annualized.
In the prospectus dated 5/1/20, the Net Fund Operating Expenses After Fee Waiver and/or Expense Reimbursement for the Investor and Institutional Class are 1.10% and 0.85%, respectively. The Advisor has contractually agreed to waive its management fees and/or reimburse expenses of the Fund to ensure that Net Annual Operating Expenses do not exceed 1.10% of the Fund’s average daily net assets for the Investor Class and 0.85% for the Institutional Class, through at least May 1, 2022, and subject thereafter to annual reapproval of the agreement by the Board of Directors. Without such waiver and/or reimbursements, the Gross Fund Operating Expenses would be 1.36% and 1.07% for the Investor and Institutional Class, respectively.
Past performance does not guarantee future results. Performance represents past performance; current returns may be lower or higher. The investment return and principal value will fluctuate so that an investor’s shares, when redeemed, may be worth more or less than the original cost. All returns reflect reinvested dividends and capital gains distributions, but do not reflect the deduction of taxes that an investor would pay on distributions or redemptions. Subject to certain exceptions, shares of a Fund redeemed or exchanged within 10 days of purchase are subject to a 2% redemption fee. Performance does not reflect this fee, which if deducted would reduce an individual’s return. To obtain performance through the most recent month end, call 800-432-7856, or visit www.heartlandadvisors.com.
HYPOTHETICAL GROWTH OF $10,000 SINCE INCEPTION — 10/31/14 — INVESTOR CLASS SHARES
SECTOR ALLOCATION — % OF EQUITY INVESTMENTS
Sector and Industry classifications are sourced from GICS®. The Global Industry Classification Standard (GICS®) is the exclusive intellectual property of MSCI Inc. (“MSCI”) and S&P Global Market Intelligence (“S&P”). Neither MSCI, S&P, their affiliates, nor any of their third party providers (“GICS Parties”) makes any representations or warranties, express or implied, with respect to GICS or the results to be obtained by the use thereof, and expressly disclaims all warranties, including warranties of accuracy, completeness, merchantability, and fitness for a particular purpose. The GICS Parties shall not have any liability for any direct, indirect, special, punitive, consequential, or any other damages (including lost profits) even if notified of such damages.
VALUATION ANALYSIS (Equity Securities Only, Weighted Harmonic Average Unless Otherwise Noted)
Source: FactSet Research Systems, Inc., and Russell®.
(1) Weighted average
INVESTMENT GOAL
The Fund seeks long-term capital appreciation and modest current income.
INVESTMENT STRATEGY/DISTINGUISHING CHARACTERISTIC
The Fund seeks long–term capital appreciation. It invests in mid-size, dividend paying companies with a market cap range defined by the Russell Midcap® Index. The Fund utilizes Heartland’s disciplined and time–tested 10 Principles of Value Investing™, designed to capture upside potential while minimizing downside risk.
INVESTMENT CONSIDERATIONS
The Fund invests in a smaller number of stocks (generally 30 to 60) than the average mutual fund. The performance of these holdings generally will increase the volatility of the Fund’s returns. The Fund also invests in mid-sized companies on a value basis. Mid-sized securities generally are more volatile and less liquid than those of larger companies. There can be no assurance that the Fund will grow to or maintain an economically viable size, in which case the Board of Directors may determine to liquidate the Fund. There is no assurance that dividend-paying stocks will mitigate volatility. Value investments are subject to the risk that their intrinsic value may not be recognized by the broad market.
| PORTFOLIO STATISTICS | | | | |
| | | | | |
| Number of holdings (excludes cash equivalents) | | | 47 | |
| Net assets | | | $56.3 mil. | |
| NAV (Investor Class) | | | $10.12 | |
| NAV (Institutional Class) | | | $10.15 | |
| Median market cap | | | $7.5 bil. | |
| Weighted average market cap | | | $11.7 bil. | |
| TOP TEN HOLDINGS — % OF NET ASSETS (EXCLUDES CASH EQUIVALENTS) | | | | |
| | | | | |
| Lincoln Electric Holdings, Inc. | | | 4.16 | % |
| Quest Diagnostics, Inc. | | | 3.96 | |
| Skyworks Solutions, Inc. | | | 3.55 | |
| Exelon Corp. | | | 3.33 | |
| Advance Auto Parts, Inc. | | | 3.08 | |
| Raymond James Financial, Inc. | | | 2.99 | |
| Mohawk Industries, Inc. | | | 2.98 | |
| The Charles Schwab Corp. | | | 2.80 | |
| UMB Financial Corp. | | | 2.60 | |
| International Paper Co | | | 2.49 | |
Portfolio holdings, statistics, and manager views are subject to change without notice, and discussions of portfolio holdings are intended as illustrations of investment strategy, not as recommendations. Index definitions and investment terms are found on the page titled “Definitions and Disclosures.” All indices are unmanaged. It is not possible to invest directly in an index. All information, unless otherwise indicated, is as of 6/30/2020.
HEARTLAND VALUE PLUS FUND
MANAGEMENT’S DISCUSSION OF FUND PERFORMANCE (UNAUDITED)
| | |
 | MANAGEMENT REPORT With the Federal Reserve jumping in to backstop the economy and prop up even the weakest businesses, investors flocked back to the equity markets to end the first half of the year. The stampede was a welcome relief for battered portfolios, but the major indices still finished the first half of the year in negative territory. The Heartland Value Plus Fund Investor Class meaningfully outpaced the Russell 2000® Value Index, returning -12.23% versus -23.50%. As part of our quest to find businesses with opportunities to improve sales and earnings, we have sought companies that are taking a differentiated path from competitors. We believe these disruptors will be well suited to compete in the aftermath of the global pandemic. Sonic Automotive Inc. (SAH), a top performer in the Consumer Discretionary sector, is an example of our thinking. Sonic is one of the country’s largest automotive retailers, with 95 franchises in 12 states. The business operates in two segments—traditional, franchised dealerships and its high-growth, EchoPark unit which offers a unique car buying experience in the 1- to 4-year-old used vehicle market. Shares of the company were up sharply during the quarter as auto sales surged after a dismal first quarter due to COVID-19. We welcomed the improvement but view Sonic as attractive for the long haul. Specifically, in our view, the company has one of the strongest balances sheets in the industry coupled with a unique high-growth engine in EchoPark. EchoPark focuses on newer, used vehicles, prices the vehicles below market and offers a simplified, no hassle car purchasing environment that we believe will continue to resonate well with consumers. InterDigital Inc. (IDCC), a winner in the Information Technology (IT) area epitomizes our focus on sound balance sheets and steady cashflows. The company pays a dividend and is financially strong with nearly $500 million of net cash on the balance sheet. The business develops and licenses numerous IP patents related to cellular/ wireless products, consumer electronics and video. Shares have rebounded from the lows during the COVID-19 selloff, but we believe investors aren’t fully appreciating InterDigital’s durable cash flow. Unlike many IT players, IDCC generates 90% of its revenues from fixed fee agreements that are not reliant upon customer sales volumes. Additionally, we believe IDCC should see a surge in revenue tied to the continued rollout of 5G technology in cellular service, an area where the company holds a strong portfolio of patents. The Fund’s Health Care names lagged the benchmark average. We have avoided biotech companies as they tend to be richly valued and speculative. We remain confident in the long-term prospect of our holdings including a key detractor, Cross Country Health Care Inc. (CCRN), a health care staffing company specializing in traveling nurses. Shares of Cross Country were under pressure as demand for health care workers was down due to “elective” procedures being halted during COVID-19. As restrictions have eased and procedures have ramped up, the company has begun to see a rebound in revenue. We expect top-line trends to continue to improve and have been encouraged by meaningful share purchases made by company executives this year. The far-reaching economic impact caused by COVID-19 is likely to play out for several years. The pandemic will change the way consumers shop, where they eat and how they work. Against this still evolving backdrop, we have sought to identify companies trading at attractive valuations that have avenues to succeed under multiple scenarios. Commoditized areas of the market, such as in Energy, could continue to face headwinds due to excess supply and diminished demand. As such, we have struggled to find compelling opportunities in the space, and it remains an underweight for the portfolio. CFA® is a registered trademark owned by the CFA Institute. |
| | |
HEARTLAND VALUE PLUS FUND
(UNAUDITED)
FUND SUMMARY
| Average Annual Total Returns | | Inception | | Year To | | One | | Three | | Five | | Ten | | Fifteen | | Twenty | | Twenty-Five | | Since |
| as of June 30, 2020 | | Date | | Date* | | Year | | Years | | Years | | Years | | Years | | Years | | Years | | Inception |
| Investor Class (HRVIX) | | 10/26/93 | | -12.23% | | -6.35% | | 2.66% | | 2.83% | | 6.75% | | 6.42% | | 8.47% | | 9.03% | | 9.11% |
| Institutional Class (HNVIX) | | 5/1/08 | | -12.13 | | -6.14 | | 2.89 | | 3.04 | | 7.01 | | 6.63 | | 8.63 | | 9.16 | | 9.23 |
| Russell 2000® Value Index | | — | | -23.50 | | -17.48 | | -4.35 | | 1.26 | | 7.82 | | 4.97 | | 7.65 | | 8.45 | | 8.40 |
Index Source: FactSet Research Systems, Inc., and Russell®.
* Not annualized.
In the prospectus dated 5/1/20, the Gross Fund Operating Expenses for the Investor and Institutional Class are 1.19% and 0.98%, respectively. The Advisor has voluntarily agreed to waive fees and/or reimburse expenses with respect to the Institutional Class, to the extent necessary to maintain the Institutional Class’ Net Annual Operating Expenses at a ratio not to exceed 0.99% of average daily net assets. This voluntary waiver/reimbursement may be discontinued at any time. Without such waivers and/or reimbursements, total returns may have been lower.
Past performance does not guarantee future results. Performance for the Institutional Class prior to its initial offering is based on the performance of the Investor Class. Performance represents past -performance; current returns may be lower or higher. The investment return and principal value will fluctuate so that an investor’s shares, when redeemed, may be worth more or less than the original cost. All returns reflect reinvested dividends and capital gains distributions, but do not reflect the deduction of taxes that an investor would pay on distributions or redemptions. Subject to certain exceptions, shares of a Fund redeemed or exchanged within 10 days of purchase are subject to a 2% redemption fee. Performance does not reflect this fee, which if deducted would reduce an -individual’s return. To obtain performance through the most recent month end, call 800-432-7856, or visit www.heartlandadvisors.com.
HYPOTHETICAL GROWTH OF $10,000 SINCE INCEPTION —10/26/93 — INVESTOR CLASS SHARES
SECTOR ALLOCATION — % OF EQUITY INVESTMENTS

Sector and Industry classifications are sourced from GICS®. The Global Industry Classification Standard (GICS®) is the exclusive intellectual property of MSCI Inc. (“MSCI”) and S&P Global Market Intelligence (“S&P”). Neither MSCI, S&P, their affiliates, nor any of their third party providers (“GICS Parties”) makes any representations or warranties, express or implied, with respect to GICS or the results to be obtained by the use thereof, and expressly disclaims all warranties, including warranties of accuracy, completeness, merchantability, and fitness for a particular purpose. The GICS Parties shall not have any liability for any direct, indirect, special, punitive, consequential, or any other damages (including lost profits) even if notified of such damages.
VALUATION ANALYSIS (Equity Securities Only, Weighted Harmonic Average Unless Otherwise Noted)

Source: FactSet Research Systems, Inc., and Russell®.
(1) Weighted average
INVESTMENT GOAL
The Fund seeks long-term capital appreciation and modest current income.
INVESTMENT STRATEGY/DISTINGUISHING CHARACTERISTIC
The Fund seeks to capture the long-term capital appreciation of small-cap stocks, while potentially mitigating volatility by focusing on dividend-paying companies. The Fund utilizes Heartland’s disciplined and time-tested 10 Principles of Value Investing™, designed to capture upside potential while minimizing downside risk.
INVESTMENT CONSIDERATIONS
The Fund invests in small companies that are generally less liquid and more volatile than large companies. The Fund also invests in a smaller number of stocks (generally 40 to 70) than the average- mutual fund. The performance of these -holdings generally will increase the volatility of the Fund’s returns. Value investments are subject to the risk that their intrinsic value may not be recognized by the broad market.
| PORTFOLIO STATISTICS | | | | |
| | | | | |
| Number of holdings (excludes cash equivalents) | | | 44 | |
| Net assets | | | $302.7 mil. | |
| NAV (Investor Class) | | | $31.14 | |
| NAV (Institutional Class) | | | $1.00 | |
| Median market cap | | | $2.0 bil. | |
| Weighted average market cap | | | $2.1 bil. | |
| | | | | |
| TOP TEN HOLDINGS — % OF NET ASSETS (EXCLUDES CASH EQUIVALENTS) | | | | |
| | | | | |
| Hain Celestial Group, Inc. | | | 3.96 | % |
| PotlatchDeltic Corp. | | | 3.83 | |
| Portland General Electric Co | | | 3.80 | |
| Sonic Automotive, Inc. (Class A) | | | 3.69 | |
| ATN International, Inc. | | | 3.40 | |
| Kratos Defense & Security Solutions, Inc. | | | 3.33 | |
| TreeHouse Foods, Inc. | | | 3.19 | |
| Heartland Express, Inc. | | | 3.10 | |
| MicroStrategy, Inc. | | | 3.00 | |
| Phibro Animal Health Corp. (Class A) | | | 2.80 | |
Portfolio holdings, statistics, and manager views are subject to change without notice, and discussions of portfolio holdings are intended as illustrations of investment strategy, not as recommendations. Index definitions and investment terms are found on the page titled “Definitions and Disclosures.” All indices are unmanaged. It is not possible to invest directly in an index. All information, unless otherwise indicated, is as of 6/30/2020.
HEARTLAND VALUE FUND
MANAGEMENT’S DISCUSSION OF FUND PERFORMANCE (UNAUDITED)
 | MANAGEMENT REPORT “Stocks only go up, this is the easiest game I’ve been part of!”
—David Portnoy, Internet Celebrity and Founder of website Barstool Sports Despite recent headwinds, the Value Fund outperformed the Russell 2000® Value Index through the first half of the year. The portfolio was up nearly 30% during the second quarter but was unable to undo the damage from the pandemic-fueled selloff of Spring, with the Investor Class finishing the first half down -15.75%, well ahead of the -23.50% for its benchmark. In a market driven by momentum and speculation, the fact that the Fund outpaced its benchmark is encouraging given the team’s commitment to fundamental research focusing on valuations. Information Technology (IT) was a source of strength for the portfolio during the period, and we believe holdings such as Photronics Inc. (PLAB) have further room to run. Photronics is a global manufacturer of photomasks used to transfer circuit patterns onto semiconductor wafers and flat panel displays during the fabrication process. The company operates nine manufacturing facilities throughout the world and is an established player in fast-growing markets. We took a stake in Photronics when shares were under pressure as it was investing in expanding its capacity. While other investors were fixated on the short-term effect capital spending put on profit margins, we saw a business that was positioning itself to meet the needs of the high-growth IT industry. Value Fund Valuations 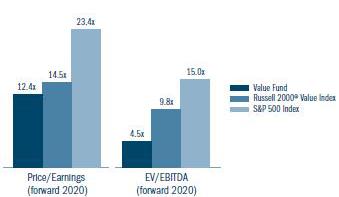
Source: FactSet Research Systems Inc., Russell®, Standard & Poor’s, and Heartland Advisors, Inc., as of 6/30/2020 Price/Earnings and EV/EBITDA are calculated as weighted harmonic average. Certain security valuations and forward estimates are based on Heartland Advisors’ calculations. Certain outliers may be excluded. Any forecasts may not prove to be true. Economic predictions are based on estimates and are subject to change. All indices are unmanaged. It is not possible to invest directly in an index. Past performance does not guarantee future returns. Photronics is now set to reap the benefits of several years of growth investments. Along with an expected jump in sales, margins should expand as capital improvements wind down leaving the company well situated to generate robust cash flow going forward. We also view the business’ financial position, with $2.76/ share of cash on the balance sheet, as a competitive advantage. The sleepy Utilities sector is rarely seen as a place to look for businesses with strong growth prospects. However, for investors willing to do their homework, opportunities do exist. Recent portfolio National Fuel Gas Company (NFG) is a prime example Although NFG is lumped in with plain vanilla power companies, it is much more diverse. In addition to its utility operations, a pipeline and storage division generates almost a quarter of its profits and the company generates nearly 40% of its bottom line from natural gas exploration and production. Given the current state of the energy industry, we believe NFG’s gas unit could be an overlooked source of growth. As a result of decreased oil drilling, natural gas production has shrunk. The upshot is that the supply/demand dynamic may finally be shifting in favor of gas producers who have lacked pricing power for years. Sensing the improved outlook, NFG opportunistically expanded its gas producing footprint when it acquired assets from a subsidiary of Royal Dutch Shell in May. The deal is expected to immediately contribute to earnings and provide the company with additional fertile acreage and room to grow its 4% dividend yield. The first six months of 2020 have been anything but normal. In the course of just a few months, investors have gone from panic-based selling to clamoring to bid up shares of bankrupt businesses. For some, like Mr. Portnoy, the chaos has created a game like atmosphere where trading stocks is done for entertainment. Maybe it’s the result of our decades of experience as value investors, but we find it hard to find joy in overpaying for inferior companies. Our satisfaction comes from digging into a business to determine its intrinsic value. We get to know the management team, identify catalysts for growth and look for mispriced valuations. We believe this fundamental approach is the best way to help our clients achieve their goal of capital appreciation. The valuations of your portfolio, shown above, are compelling in our view with solid sales and earnings growth which could exceed that of many ridiculously priced market darlings. |
HEARTLAND VALUE FUND
(UNAUDITED)
FUND SUMMARY
| Average Annual Total Returns | | Inception | | Year To | | One | | Three | | Five | | Ten | | Fifteen | | Twenty | | Twenty-Five | | Since |
| as of June 30, 2020 | | Date | | Date* | | Year | | Years | | Years | | Years | | Years | | Years | | Years | | Inception |
| Investor Class (HRTVX) | | 12/28/84 | | -15.75% | | -12.65% | | -2.65% | | -0.15% | | 5.86% | | 4.52% | | 7.52% | | 8.18% | | 10.55% |
| Institutional Class (HNTVX) | | 5/1/08 | | -15.70 | | -12.56 | | -2.50 | | 0.01 | | 6.03 | | 4.68 | | 7.64 | | 8.27 | | 10.62 |
| Russell 2000® Value Index | | — | | -23.50 | | -17.48 | | -4.35 | | 1.26 | | 7.82 | | 4.97 | | 7.65 | | 8.45 | | 9.91 |
Index Source: FactSet Research Systems, Inc., and Russell®.
* Not annualized.
In the prospectus dated 5/1/20, the Gross Fund Operating Expenses for the Investor and Institutional Class are 1.10% and 0.92%, respectively. The Advisor has voluntarily agreed to waive fees and/or reimburse expenses with respect to the Institutional Class, to the extent necessary to maintain the Institutional Class’ Net Annual Operating Expenses at a ratio not to exceed 0.99% of average daily net assets. This voluntary waiver/reimbursement may be discontinued at any time. Without such waivers total returns may have been lower.
Past performance does not guarantee future results. Performance for the Institutional Class prior to its initial offering is based on the performance of the Investor Class. Performance represents past -performance; current returns may be lower or higher. The investment return and principal value will fluctuate so that an investor’s shares, when redeemed, may be worth more or less than the original cost. All returns reflect reinvested dividends and capital gains distributions, but do not reflect the deduction of taxes that an investor would pay on distributions or redemptions. Subject to certain exceptions, shares of a Fund redeemed or exchanged within 10 days of purchase are subject to a 2% redemption fee. Performance does not reflect this fee, which if deducted would reduce an -individual’s return. To obtain performance through the most recent month end, call 800-432-7856, or visit www.heartlandadvisors.com.
HYPOTHETICAL GROWTH OF $10,000 SINCE INCEPTION — 12/28/84 — INVESTOR CLASS SHARES

SECTOR ALLOCATION — % OF EQUITY INVESTMENTS

Sector and Industry classifications are sourced from GICS®. The Global Industry Classification Standard (GICS®) is the exclusive intellectual property of MSCI Inc. (“MSCI”) and S&P Global Market Intelligence (“S&P”). Neither MSCI, S&P, their affiliates, nor any of their third party providers (“GICS Parties”) makes any representations or warranties, express or implied, with respect to GICS or the results to be obtained by the use thereof, and expressly disclaims all warranties, including warranties of accuracy, completeness, merchantability, and fitness for a particular purpose. The GICS Parties shall not have any liability for any direct, indirect, special, punitive, consequential, or any other damages (including lost profits) even if notified of such damages.
VALUATION ANALYSIS (Equity Securities Only, Weighted Harmonic Average Unless Otherwise Noted)

Source: FactSet Research Systems, Inc., and Russell®.
INVESTMENT GOAL
The Fund seeks long-term capital appreciation through investing in small companies.
INVESTMENT STRATEGY/DISTINGUISHING CHARACTERISTIC
The Fund seeks to capture long-term capital appreciation by investing in micro- and small-cap companies. The micro- and small-cap segment of the stock market is robust with thousands of publicly traded issues, many of which lack traditional Wall Street research coverage. Thus, we believe this market is often inefficient, mispricing businesses and offering opportunities for fundamental research-minded investors such as Heartland. The Fund utilizes Heartland’s disciplined and time-tested 10 Principles of Value Investing™, designed to capture upside potential while minimizing downside risk.
INVESTMENT CONSIDERATIONS
The Fund invests primarily in small -companies selected on a value basis. Such securities generally are more volatile and less liquid than those of larger companies. Value investments are subject to the risk that their intrinsic value may not be recognized by the broad market.
| PORTFOLIO STATISTICS | | | |
| | | | |
| Number of holdings (excludes cash equivalents) | | | 109 | |
| Net assets | | | $521.9 mil. | |
| NAV (Investor Class) | | | $32.47 | |
| NAV (Institutional Class) | | | $33.18 | |
| Median market cap | | | $418 mil. | |
| Weighted average market cap | | | $1.5 bil. | |
| | | | | |
| TOP TEN HOLDINGS — % OF NET ASSETS (EXCLUDES CASH EQUIVALENTS) | | | | |
| | | | | |
| Centerra Gold, Inc. | | | 4.28 | % |
| Vistra Energy Corp. | | | 2.85 | |
| UMB Financial Corp. | | | 2.47 | |
| MGIC Investment Corp. | | | 2.35 | |
| Century Communities, Inc. | | | 2.35 | |
| Argan, Inc. | | | 2.27 | |
| Radian Group, Inc. | | | 2.23 | |
| TriCo Bancshares | | | 2.20 | |
| Kennedy-Wilson Holdings, Inc. | | | 2.29 | |
| Vonage Holdings Corp. | | | 2.12 | |
Portfolio holdings, statistics, and manager views are subject to change without notice, and discussions of portfolio holdings are intended as illustrations of investment strategy, not as recommendations. Index definitions and investment terms are found on the page titled “Definitions and Disclosures.” All indices are unmanaged. It is not possible to invest directly in an index. All information, unless otherwise indicated, is as of 6/30/2020.
the heartland family of equity funds
ADDITIONAL FUND CHARACTERISTICS (UNAUDITED)
SECTOR ALLOCATION — % OF TOTAL INVESTMENTS
The following table summarizes the sector classifications of each of the Heartland Funds as of June 30, 2020. These sectors represent groupings of industry classifications.
| | | SELECT | | | MID CAP | | | VALUE | | | VALUE | |
| | | VALUE FUND | | | VALUE FUND | | | PLUS FUND | | | FUND | |
| Communication Services | | | 6.7 | % | | | 1.6 | % | | | 3.4 | % | | | 2.8 | % |
| Consumer Discretionary | | | 8.0 | | | | 10.0 | | | | 8.2 | | | | 10.5 | |
| Consumer Staples | | | 8.5 | | | | 6.5 | | | | 9.3 | | | | 2.2 | |
| Energy | | | 4.7 | | | | 6.0 | | | | 0.9 | | | | 1.1 | |
| Financials | | | 21.5 | | | | 16.7 | | | | 20.6 | | | | 23.6 | |
| Health Care | | | 14.5 | | | | 10.8 | | | | 8.2 | | | | 9.6 | |
| Industrials | | | 13.8 | | | | 18.6 | | | | 15.1 | | | | 17.7 | |
| Information Technology | | | 10.0 | | | | 6.9 | | | | 12.7 | | | | 11.6 | |
| Materials | | | 3.3 | | | | 6.9 | | | | 10.4 | | | | 9.9 | |
| Real Estate | | | 3.5 | | | | 8.2 | | | | 6.3 | | | | 5.7 | |
| Utilities | | | 5.2 | | | | 7.7 | | | | 3.8 | | | | 5.0 | |
| Short-Term Investments | | | 0.3 | | | | 0.1 | | | | 1.1 | | | | 0.3 | |
| Total | | | 100.0 | % | | | 100.0 | % | | | 100.0 | % | | | 100.0 | % |
Portfolio holdings, statistics, and manager views are subject to change without notice and discussions of portfolio holdings are intended as illustrations of investment strategy, not as recommendations.
financial statements
SELECT VALUE FUND — SCHEDULE OF INVESTMENTS
June 30, 2020 (Unaudited)
| | | SHARES | | | VALUE | |
| COMMON STOCKS (98.7%) | | | | | | | | |
| Aerospace & Defense (1.0%) | | | | | | | | |
| Huntington Ingalls Industries, Inc. | | | 8,435 | | | $ | 1,471,823 | |
| | | | | | | | | |
| Air Freight & Logistics (2.2%) | | | | | | | | |
| FedEx Corp. | | | 22,200 | | | | 3,112,884 | |
| | | | | | | | | |
| Automobiles (0.9%) | | | | | | | | |
| Thor Industries, Inc. | | | 12,200 | | | | 1,299,666 | |
| | | | | | | | | |
| Banks (8.2%) | | | | | | | | |
| Community Trust Bancorp, Inc. | | | 75,002 | | | | 2,457,066 | |
| PNC Financial Services Group, Inc. | | | 32,000 | | | | 3,366,720 | |
| Stock Yards Bancorp, Inc. | | | 95,000 | | | | 3,819,000 | |
| Truist Financial Corp. | | | 48,933 | | | | 1,837,434 | |
| | | | | | | | 11,480,220 | |
| | | | | | | | | |
| Capital Markets (5.3%) | | | | | | | | |
| Raymond James Financial, Inc. | | | 41,195 | | | | 2,835,452 | |
| The Charles Schwab Corp. | | | 135,000 | | | | 4,554,900 | |
| | | | | | | | 7,390,352 | |
| Chemicals (2.3%) | | | | | | | | |
| American Vanguard Corp. | | | 110,000 | | | | 1,513,600 | |
| Sensient Technologies Corp. | | | 32,000 | | | | 1,669,120 | |
| | | | | | | | 3,182,720 | |
| | | | | | | | | |
| Commercial Services & Supplies (1.0%) | | | | | | | | |
| Stericycle, Inc.(a) | | | 25,000 | | | | 1,399,500 | |
| | | | | | | | | |
| Communications Equipment (3.7%) | | | | | | | | |
| Cisco Systems, Inc. | | | 110,000 | | | | 5,130,400 | |
| | | | | | | | | |
| Consumer Finance (1.0%) | | | | | | | | |
| Capital One Financial Corp. | | | 22,000 | | | | 1,376,980 | |
| | | | | | | | | |
| Diversified Consumer Services (1.1%) | | | | | | | | |
| Grand Canyon Education, Inc.(a) | | | 16,800 | | | | 1,520,904 | |
| | | | | | | | | |
| Diversified Financial Services (4.4%) | | | | | | | | |
| Berkshire Hathaway, Inc. (Class B)(a) | | | 35,000 | | | | 6,247,850 | |
| | | | | | | | | |
| Diversified Telecommunication Services (3.5%) | | | | | | | | |
| Verizon Communications, Inc. | | | 89,057 | | | | 4,909,713 | |
| | | | | | | | | |
| Electric Utilities (3.4%) | | | | | | | | |
| Exelon Corp. | | | 132,000 | | | | 4,790,280 | |
| | | | | | | | | |
| Electrical Equipment (0.7%) | | | | | | | | |
| Regal Beloit Corp. | | | 10,995 | | | | 960,083 | |
| | | | | | | | | |
| Equity Real Estate Investment Trusts (REITs) (2.8%) | | | | | | | | |
| CyrusOne, Inc. | | | 23,508 | | | | 1,710,207 | |
| Public Storage | | | 11,800 | | | | 2,264,302 | |
| | | | | | | | 3,974,509 | |
| | | | | | | | | |
| Food Products (5.2%) | | | | | | | | |
| Bunge, Ltd. | | | 70,929 | | | | 2,917,310 | |
| Cal-Maine Foods, Inc.(a) | | | 97,824 | | | | 4,351,211 | |
| | | | | | | | 7,268,521 | |
| | | | | | | | | |
| Health Care Equipment & Supplies (2.4%) | | | | | | | | |
| AngioDynamics, Inc.(a) | | | 125,000 | | | | 1,271,250 | |
| Medtronic PLC | | | 22,213 | | | | 2,036,932 | |
| | | | | | | | 3,308,182 | |
| | | | | | | | | |
| Health Care Providers & Services (6.1%) | | | | | | | | |
| CVS Health Corp. | | | 45,000 | | | | 2,923,650 | |
| Quest Diagnostics, Inc. | | | 35,900 | | | | 4,091,164 | |
| Triple-S Management Corp. (Class B)(a) | | | 77,621 | | | | 1,476,352 | |
| | | | | | | | 8,491,166 | |
| Hotels, Restaurants & Leisure (0.5%) | | | | | | | | |
| Hilton Worldwide Holdings, Inc. | | | 9,212 | | | | 676,621 | |
| | | | | | | | | |
| Household Durables (1.8%) | | | | | | | | |
| Mohawk Industries, Inc.(a) | | | 25,000 | | | | 2,544,000 | |
| | | | | | | | | |
| Insurance (2.3%) | | | | | | | | |
| Old Republic International Corp. | | | 143,350 | | | | 2,338,039 | |
| Reinsurance Group of America, Inc. | | | 12,000 | | | | 941,280 | |
| | | | | | | | 3,279,319 | |
| | | | | | | | | |
| Interactive Media & Services (3.1%) | | | | | | | | |
| Alphabet, Inc. (Class A)(a) | | | 3,064 | | | | 4,344,905 | |
| | | | | | | | | |
| Machinery (4.3%) | | | | | | | | |
| Gorman-Rupp Co. | | | 72,142 | | | | 2,242,173 | |
| Lincoln Electric Holdings, Inc. | | | 45,331 | | | | 3,818,684 | |
| | | | | | | | 6,060,857 | |
| | | | | | | | | |
| Metals & Mining (1.0%) | | | | | | | | |
| Schnitzer Steel Industries, Inc. (Class A) | | | 80,000 | | | | 1,411,200 | |
| | | | | | | | | |
| Multi-Utilities (1.7%) | | | | | | | | |
| MDU Resources Group, Inc. | | | 110,000 | | | | 2,439,800 | |
| | | | | | | | | |
| Oil, Gas & Consumable Fuels (4.7%) | | | | | | | | |
| HollyFrontier Corp. | | | 91,100 | | | | 2,660,120 | |
| Suncor Energy, Inc. | | | 231,269 | | | | 3,899,195 | |
| | | | | | | | 6,559,315 | |
| | | | | | | | | |
| Personal Products (3.3%) | | | | | | | | |
| Unilever NV | | | 86,000 | | | | 4,581,220 | |
| | | | | | | | | |
| Pharmaceuticals (6.0%) | | | | | | | | |
| Johnson & Johnson | | | 39,200 | | | | 5,512,696 | |
| Sanofi (ADR) | | | 55,600 | | | | 2,838,380 | |
| | | | | | | | 8,351,076 | |
| | | | | | | | | |
| Professional Services (1.9%) | | | | | | | | |
| ManpowerGroup, Inc. | | | 38,550 | | | | 2,650,313 | |
| | | | | | | | | |
| Real Estate Management & Development (0.6%) | | | | | | | | |
| Forestar Group, Inc.(a) | | | 57,000 | | | | 859,560 | |
| | | | | | | | | |
| Road & Rail (2.5%) | | | | | | | | |
| Canadian National Railway Co. | | | 39,509 | | | | 3,499,312 | |
| | | | | | | | | |
| Semiconductors & Semiconductor Equipment (3.7%) | | | | | | | | |
| ON Semiconductor Corp.(a) | | | 52,298 | | | | 1,036,546 | |
| Skyworks Solutions, Inc. | | | 32,000 | | | | 4,091,520 | |
| | | | | | | | 5,128,066 | |
| Software (2.6%) | | | | | | | | |
| Oracle Corp. | | | 65,000 | | | | 3,592,550 | |
| | | | | | | | | |
| Specialty Retail (3.5%) | | | | | | | | |
| Aaron’s, Inc. | | | 40,735 | | | | 1,849,369 | |
| Advance Auto Parts, Inc. | | | 21,800 | | | | 3,105,410 | |
| | | | | | | | 4,954,779 | |
| TOTAL COMMON STOCKS | | | | | | | | |
| (Cost $133,212,274) | | | | | | $ | 138,248,646 | |
| | | | | | | | | |
| | | | INTEREST | | | | PAR | | | | | |
| | | RATE | | | | AMOUNT | | | | VALUE | |
| SHORT-TERM INVESTMENTS (0.3%) | | | | | | | | | | | | |
| Time Deposits (0.3%) | | | | | | | | | | | | |
| JPM Chase (New York)(b) | | | 0.01 | % | | $ | 486,097 | | | $ | 486,097 | |
| | | | | | | | | | | | | |
| TOTAL SHORT-TERM INVESTMENTS | | | | | | | | | | | | |
| (Cost $486,097) | | | | | | | | | | $ | 486,097 | |
| | | | | | | | | | | | | |
| TOTAL INVESTMENTS - (99.0%) | | | | | | | | | | | | |
| (Cost $133,698,371) | | | | | | | | | | $ | 138,734,743 | |
| OTHER ASSETS AND LIABILITIES, NET - (1.0%) | | | | | | | | | | | 1,323,103 | |
| TOTAL NET ASSETS - (100.0%) | | | | | | | | | | $ | 140,057,846 | |
The accompanying Notes to Financial Statements are an integral part of these Statements.
MID CAP VALUE FUND — SCHEDULE OF INVESTMENTS
June 30, 2020 (Unaudited)
| | | SHARES | | | VALUE | |
| COMMON STOCKS (99.7%) | | | | | | | | |
| Aerospace & Defense (2.2%) | | | | | | | | |
| Huntington Ingalls Industries, Inc. | | | 7,073 | | | $ | 1,234,168 | |
| | | | | | | | | |
| Automobiles (1.9%) | | | | | | | | |
| Thor Industries, Inc. | | | 10,280 | | | | 1,095,128 | |
| | | | | | | | | |
| Banks (6.6%) | | | | | | | | |
| First Horizon National Corp. | | | 99,150 | | | | 987,534 | |
| Popular, Inc. | | | 33,468 | | | | 1,244,006 | |
| UMB Financial Corp. | | | 28,406 | | | | 1,464,329 | |
| | | | | | | | 3,695,869 | |
| | | | | | | | | |
| Building Products (1.8%) | | | | | | | | |
| A.O. Smith Corp. | | | 21,669 | | | | 1,021,043 | |
| | | | | | | | | |
| Capital Markets (5.8%) | | | | | | | | |
| Raymond James Financial, Inc. | | | 24,479 | | | | 1,684,890 | |
| The Charles Schwab Corp. | | | 46,814 | | | | 1,579,504 | |
| | | | | | | | 3,264,394 | |
| | | | | | | | | |
| Chemicals (2.3%) | | | | | | | | |
| Eastman Chemical Co. | | | 18,366 | | | | 1,279,008 | |
| | | | | | | | | |
| Commercial Services & Supplies (2.1%) | | | | | | | | |
| Stericycle, Inc.(a) | | | 21,314 | | | | 1,193,158 | |
| | | | | | | | | |
| Consumer Finance (1.4%) | | | | | | | | |
| Discover Financial Services | | | 15,397 | | | | 771,236 | |
| | | | | | | | | |
| Containers & Packaging (2.5%) | | | | | | | | |
| International Paper Co. | | | 39,843 | | | | 1,402,872 | |
| | | | | | | | | |
| Electric Utilities (5.3%) | | | | | | | | |
| Exelon Corp. | | | 51,718 | | | | 1,876,846 | |
| FirstEnergy Corp. | | | 27,922 | | | | 1,082,815 | |
| | | | | | | | 2,959,661 | |
| | | | | | | | | |
| Electrical Equipment (1.1%) | | | | | | | | |
| Regal Beloit Corp. | | | 7,320 | | | | 639,182 | |
| | | | | | | | | |
| Energy Equipment & Services (1.8%) | | | | | | | | |
| National Oilwell Varco, Inc. | | | 81,088 | | | | 993,328 | |
| | | | | | | | | |
| Equity Real Estate Investment Trusts (REITs) (8.1%) | | | | | | | | |
| American Homes 4 Rent (Class A) | | | 41,460 | | | | 1,115,274 | |
| PS Business Parks, Inc. | | | 8,508 | | | | 1,126,459 | |
| Public Storage | | | 6,706 | | | | 1,286,814 | |
| Ryman Hospitality Properties, Inc. | | | 30,096 | | | | 1,041,322 | |
| | | | | | | | 4,569,869 | |
| | | | | | | | | |
| Food Products (4.3%) | | | | | | | | |
| Bunge, Ltd. | | | 33,940 | | | | 1,395,952 | |
| Cal-Maine Foods, Inc.(a) | | | 22,721 | | | | 1,010,630 | |
| | | | | | | | 2,406,582 | |
| | | | | | | | | |
| Health Care Equipment & Supplies (2.4%) | | | | | | | | |
| DENTSPLY SIRONA, Inc. | | | 31,265 | | | | 1,377,536 | |
| | | | | | | | | |
| Health Care Providers & Services (6.3%) | | | | | | | | |
| Encompass Health Corp | | | 11,961 | | | | 740,745 | |
| Humana, Inc. | | | 1,528 | | | | 592,482 | |
| Quest Diagnostics, Inc. | | | 19,584 | | | | 2,231,792 | |
| | | | | | | | 3,565,019 | |
| | | | | | | | | |
| Hotels, Restaurants & Leisure (0.9%) | | | | | | | | |
| Hilton Worldwide Holdings, Inc. | | | 7,316 | | | | 537,360 | |
| | | | | | | | | |
| Household Durables (4.0%) | | | | | | | | |
| DR Horton, Inc. | | | 10,184 | | | | 564,703 | |
| Mohawk Industries, Inc.(a) | | | 16,500 | | | | 1,679,040 | |
| | | | | | | | 2,243,743 | |
| | | | | | | | | |
| Household Products (2.2%) | | | | | | | | |
| Spectrum Brands Holdings, Inc. | | | 27,430 | | | | 1,259,037 | |
| | | | | | | | | |
| Insurance (3.0%) | | | | | | | | |
| Old Republic International Corp. | | | 78,632 | | | | 1,282,488 | |
| Reinsurance Group of America, Inc. | | | 4,910 | | | | 385,140 | |
| | | | | | | | 1,667,628 | |
| | | | | | | | | |
| IT Services (1.5%) | | | | | | | | |
| The Western Union Co. | | | 40,268 | | | | 870,594 | |
| | | | | | | | | |
| Machinery (7.0%) | | | | | | | | |
| Flowserve Corp. | | | 25,400 | | | | 724,408 | |
| Lincoln Electric Holdings, Inc. | | | 27,822 | | | | 2,343,726 | |
| Parker-Hannifin Corp. | | | 4,660 | | | | 854,038 | |
| | | | | | | | 3,922,172 | |
| | | | | | | | | |
| Media (1.6%) | | | | | | | | |
| Omnicom Group, Inc. | | | 16,556 | | | | 903,958 | |
| | | | | | | | | |
| Metals & Mining (2.1%) | | | | | | | | |
| Freeport-McMoRan, Inc. | | | 104,708 | | | | 1,211,472 | |
| | | | | | | | | |
| Multi-Utilities (2.5%) | | | | | | | | |
| MDU Resources Group, Inc. | | | 62,499 | | | | 1,386,228 | |
| | | | | | | | | |
| Oil, Gas & Consumable Fuels (4.2%) | | | | | | | |
| Cabot Oil & Gas Corp. | | | 62,505 | | | | 1,073,836 | |
| Pioneer Natural Resources Co. | | | 13,224 | | | | 1,291,985 | |
| | | | | | | | 2,365,821 | |
| | | | | | | | | |
| Pharmaceuticals (2.0%) | | | | | | | | |
| Perrigo Co. PLC | | | 20,105 | | | | 1,111,203 | |
| | | | | | | | | |
| Professional Services (2.0%) | | | | | | | | |
| ManpowerGroup, Inc. | | | 16,363 | | | | 1,124,956 | |
| | | | | | | | | |
| Road & Rail (2.4%) | | | | | | | | |
| AMERCO | | | 4,434 | | | | 1,339,911 | |
| | | | | | | | | |
| Semiconductors & Semiconductor Equipment (5.3%) | | | | | | | | |
| ON Semiconductor Corp.(a) | | | 50,411 | | | | 999,146 | |
| Skyworks Solutions, Inc. | | | 15,651 | | | | 2,001,137 | |
| | | | | | | | 3,000,283 | |
| | | | | | | | | |
| Specialty Retail (3.1%) | | | | | | | | |
| Advance Auto Parts, Inc. | | | 12,185 | | | | 1,735,753 | |
| | | | | | | | | |
| TOTAL COMMON STOCKS | | | | | | | | |
| (Cost $49,781,172) | | | | | | $ | 56,148,172 | |
| | | INTEREST | | | PAR | | | | |
| | | RATE | | | AMOUNT | | | VALUE | |
| SHORT-TERM INVESTMENTS (0.1%) | | | | | | | | | | | | |
| Time Deposits (0.1%) | | | | | | | | | | | | |
| Citibank (New York)(b) | | | 0.01 | % | | $ | 81,961 | | | $ | 81,961 | |
| | | | | | | | | | | | | |
| TOTAL SHORT-TERM INVESTMENTS | | | | | | | | | | | | |
| (Cost $81,961) | | | | | | | | | | $ | 81,961 | |
| | | | | | | | | | | | | |
| TOTAL INVESTMENTS - (99.8%) | | | | | | | | | | | | |
| (Cost $49,863,133) | | | | | | | | | | $ | 56,230,133 | |
| OTHER ASSETS AND LIABILITIES, NET - (0.2%) | | | | | | | | | | | 91,229 | |
| TOTAL NET ASSETS - (100.0%) | | | | | | | | | | $ | 56,321,362 | |
The accompanying Notes to Financial Statements are an integral part of these Statements.
VALUE PLUS FUND — SCHEDULE OF INVESTMENTS
June 30, 2020 (Unaudited)
| | | SHARES | | | VALUE | |
| COMMON STOCKS (98.7%) | | | | | | | | |
| Aerospace & Defense (3.3%) | | | | | | | | |
| Kratos Defense & Security Solutions, Inc.(a) | | | 645,000 | | | $ | 10,081,350 | |
| | | | | | | | | |
| Banks (10.8%) | | | | | | | | |
| Associated Banc-Corp | | | 559,000 | | | | 7,647,120 | |
| Glacier Bancorp, Inc. | | | 175,000 | | | | 6,175,750 | |
| Independent Bank Corp. | | | 125,000 | | | | 8,386,250 | |
| Old National Bancorp | | | 359,800 | | | | 4,950,848 | |
| Seacoast Banking Corp. of Florida(a) | | | 267,500 | | | | 5,457,000 | |
| | | | | | | | 32,616,968 | |
| Capital Markets (4.0%) | | | | | | | | |
| Artisan Partners Asset Management, Inc. (Class A) | | | 145,000 | | | | 4,712,500 | |
| B Riley Financial, Inc. | | | 335,000 | | | | 7,289,600 | |
| | | | | | | | 12,002,100 | |
| | | | | | | | | |
| Chemicals (5.3%) | | | | | | | | |
| American Vanguard Corp. | | | 600,000 | | | | 8,256,000 | |
| Sensient Technologies Corp. | | | 150,000 | | | | 7,824,000 | |
| | | | | | | | 16,080,000 | |
| | | | | | | | | |
| Commercial Services & Supplies (1.6%) | | | | | | | | |
| Brady Corp. (Class A) | | | 100,000 | | | | 4,682,000 | |
| | | | | | | | | |
| Communications Equipment (2.7%) | | | | | | | | |
| InterDigital, Inc. | | | 145,000 | | | | 8,211,350 | |
| | | | | | | | | |
| Consumer Finance (2.2%) | | | | | | | | |
| FirstCash, Inc. | | | 100,000 | | | | 6,748,000 | |
| | | | | | | | | |
| Diversified Telecommunication Services (3.4%) | | | | | | | | |
| ATN International, Inc. | | | 170,000 | | | | 10,296,900 | |
| | | | | | | | | |
| Electric Utilities (3.8%) | | | | | | | | |
| Portland General Electric Co. | | | 275,000 | | | | 11,497,750 | |
| | | | | | | | | |
| Electrical Equipment (1.7%) | | | | | | | | |
| Vicor Corp.(a) | | | 70,000 | | | | 5,036,500 | |
| | | | | | | | | |
| Electronic Equipment, Instruments & Components (2.7%) | | | | | | | | |
| Knowles Corp.(a) | | | 325,000 | | | | 4,959,500 | |
| Methode Electronics, Inc. | | | 100,000 | | | | 3,126,000 | |
| | | | | | | | 8,085,500 | |
| Equity Real Estate Investment Trusts (REITs) (6.3%) | | | | | | | | |
| Lamar Advertising Co. (Class A) | | | 110,000 | | | | 7,343,600 | |
| PotlatchDeltic Corp. | | | 305,000 | | | | 11,599,150 | |
| | | | | | | | 18,942,750 | |
| Food Products (7.1%) | | | | | | | | |
| Hain Celestial Group, Inc.(a) | | | 380,000 | | | | 11,973,800 | |
| TreeHouse Foods, Inc.(a) | | | 220,000 | | | | 9,636,000 | |
| | | | | | | | 21,609,800 | |
| Health Care Equipment & Supplies (3.7%) | | | | | | | | |
| AngioDynamics, Inc.(a) | | | 390,000 | | | | 3,966,300 | |
| Avanos Medical, Inc.(a) | | | 250,000 | | | | 7,347,500 | |
| | | | | | | | 11,313,800 | |
| Health Care Providers & Services (1.6%) | | | | | | | | |
| Cross Country Healthcare, Inc.(a) | | | 785,000 | | | | 4,835,600 | |
| | | | | | | | | |
| Household Durables (2.3%) | | | | | | | | |
| MDC Holdings, Inc. | | | 195,000 | | | | 6,961,500 | |
| | | | | | | | | |
| Household Products (2.1%) | | | | | | | | |
| Spectrum Brands Holdings, Inc. | | | 140,000 | | | | 6,426,000 | |
| | | | | | | | | |
| Insurance (3.6%) | | | | | | | | |
| Old Republic International Corp. | | | 200,000 | | | | 3,262,000 | |
| The Hanover Insurance Group, Inc. | | | 75,000 | | | | 7,599,750 | |
| | | | | | | | 10,861,750 | |
| Leisure Products (2.2%) | | | | | | | | |
| Acushnet Holdings Corp. | | | 195,000 | | | | 6,784,050 | |
| | | | | | | | | |
| Machinery (5.5%) | | | | | | | | |
| Astec Industries, Inc. | | | 115,000 | | | | 5,325,650 | |
| Donaldson Co., Inc. | | | 115,000 | | | | 5,349,800 | |
| Enerpac Tool Group Corp. (Class A) | | | 170,000 | | | | 2,992,000 | |
| Kennametal, Inc. | | | 100,000 | | | | 2,871,000 | |
| | | | | | | | 16,538,450 | |
| | | | | | | | | |
| Metals & Mining (2.3%) | | | | | | | | |
| Materion Corp. | | | 55,000 | | | | 3,381,950 | |
| Schnitzer Steel Industries, Inc. (Class A) | | | 200,000 | | | | 3,528,000 | |
| | | | | | | | 6,909,950 | |
| Oil, Gas & Consumable Fuels (0.9%) | | | | | | | | |
| Cabot Oil & Gas Corp. | | | 150,000 | | | | 2,577,000 | |
| | | | | | | | | |
| Paper & Forest Products (2.7%) | | | | | | | | |
| P.H. Glatfelter Co. | | | 515,000 | | | | 8,265,750 | |
| | | | | | | | | |
| Pharmaceuticals (2.8%) | | | | | | | | |
| Phibro Animal Health Corp. (Class A) | | | 325,000 | | | | 8,537,750 | |
| | | | | | | | | |
| Road & Rail (3.1%) | | | | | | | | |
| Heartland Express, Inc. | | | 450,000 | | | | 9,369,000 | |
| | | | | | | | | |
| Semiconductors & Semiconductor Equipment (4.3%) | | | | | | | | |
| DSP Group, Inc.(a) | | | 475,000 | | | | 7,543,000 | |
| Semtech Corp.(a) | | | 105,000 | | | | 5,483,100 | |
| | | | | | | | 13,026,100 | |
| | | | | | | | | |
| Software (3.0%) | | | | | | | | |
| MicroStrategy, Inc. (Class A)(a) | | | 76,750 | | | | 9,078,758 | |
| | | | | | | | | |
| Specialty Retail (3.7%) | | | | | | | | |
| Sonic Automotive, Inc. (Class A) | | | 350,000 | | | | 11,168,500 | |
| | | | | | | | | |
| TOTAL COMMON STOCKS | | | | | | | | |
| (Cost $283,900,522) | | | | | | $ | 298,544,926 | |
| | | INTEREST
RATE | | | PAR
AMOUNT | | | VALUE | |
| SHORT-TERM INVESTMENTS (1.1%) | | | | | | |
| Time Deposits (1.1%) | | | | | | | | | | | | |
| Citibank (New York)(b) | | | 0.01 | % | | $ | 3,390,034 | | | $ | 3,390,034 | |
| | | | | | | | | | | | | |
| TOTAL SHORT-TERM INVESTMENTS | | | | | | | | | | | | |
| (Cost $3,390,034) | | | | | | | | | | $ | 3,390,034 | |
| | | | | | | | | | | | | |
| TOTAL INVESTMENTS - (99.8%) | | | | | | | | | | | | |
| (Cost $287,290,556) | | | | | | | | | | $ | 301,934,960 | |
| OTHER ASSETS AND LIABILITIES, NET - (0.2%) | | | | | | | | | | | 742,653 | |
| TOTAL NET ASSETS - (100.0%) | | | | | | | | | | $ | 302,677,613 | |
The accompanying Notes to Financial Statements are an integral part of these Statements.
VALUE FUND — SCHEDULE OF INVESTMENTS
June 30, 2020 (Unaudited)
| | | SHARES | | | VALUE | |
| COMMON STOCKS (99.4%) | | | | | | | | |
| Aerospace & Defense (1.2%) | | | | | | | | |
| CPI Aerostructures, Inc.(a) | | | 500,000 | | | $ | 1,645,000 | |
| Cubic Corp. | | | 100,000 | | | | 4,803,000 | |
| | | | | | | | 6,448,000 | |
| | | | | | | | | |
| Air Freight & Logistics (0.8%) | | | | | | | | |
| Atlas Air Worldwide Holdings, Inc.(a) | | | 100,000 | | | | 4,303,000 | |
| | | | | | | | | |
| Auto Components (1.4%) | | | | | | | | |
| Motorcar Parts of America, Inc.(a) | | | 400,200 | | | | 7,071,534 | |
| | | | | | | | | |
| Banks (14.8%) | | | | | | | | |
| Associated Banc-Corp | | | 600,000 | | | | 8,208,000 | |
| Bancorp, Inc.(a) | | | 750,000 | | | | 7,350,000 | |
| Capital City Bank Group, Inc. | | | 500,000 | | | | 10,475,000 | |
| Century Bancorp, Inc. (Class A) | | | 73,100 | | | | 5,681,332 | |
| First Internet Bancorp | | | 301,671 | | | | 5,013,772 | |
| Heritage Financial Corp. | | | 300,000 | | | | 6,000,000 | |
| Stock Yards Bancorp, Inc. | | | 100,000 | | | | 4,020,000 | |
| TriCo Bancshares | | | 377,320 | | | | 11,489,394 | |
| TriState Capital Holdings, Inc.(a) | | | 400,000 | | | | 6,284,000 | |
| UMB Financial Corp. | | | 250,000 | | | | 12,887,500 | |
| | | | | | | | 77,408,998 | |
| | | | | | | | | |
| Biotechnology (1.8%) | | | | | | | | |
| Albireo Pharma, Inc.(a) | | | 150,000 | | | | 3,973,500 | |
| Heron Therapeutics, Inc.(a) | | | 375,000 | | | | 5,516,250 | |
| | | | | | | | 9,489,750 | |
| | | | | | | | | |
| Capital Markets (3.4%) | | | | | | | | |
| Cowen, Inc. (Class A) | | | 525,000 | | | | 8,510,250 | |
| US Global Investors, Inc. (Class A) | | | 550,000 | | | | 1,045,000 | |
| Waddell & Reed Financial, Inc.(Class A) | | | 425,000 | | | | 6,591,750 | |
| WisdomTree Investments, Inc. | | | 500,000 | | | | 1,735,000 | |
| | | | | | | | 17,882,000 | |
| | | | | | | | | |
| Commercial Services & Supplies (1.9%) | | | | | | | | |
| CECO Environmental Corp.(a) | | | 550,000 | | | | 3,624,500 | |
| Perma-Fix Environmental Services, Inc.(a)(c) | | | 1,007,700 | | | | 6,439,203 | |
| | | | | | | | 10,063,703 | |
| | | | | | | | | |
| Communications Equipment (2.1%) | | | | | | | | |
| Calix, Inc.(a) | | | 300,000 | | | | 4,470,000 | |
| DASAN Zhone Solutions, Inc.(a) | | | 400,000 | | | | 3,572,000 | |
| Digi International, Inc.(a) | | | 150,000 | | | | 1,747,500 | |
| Franklin Wireless Corp.(a) | | | 200,000 | | | | 1,104,000 | |
| | | | | | | | 10,893,500 | |
| Construction & Engineering (4.5%) | | | | | | | | |
| Argan, Inc. | | | 250,000 | | | | 11,845,000 | |
| Northwest Pipe Co.(a) | | | 375,000 | | | | 9,401,250 | |
| Sterling Construction Co., Inc.(a) | | | 225,000 | | | | 2,355,750 | |
| | | | | | | | 23,602,000 | |
| | | | | | | | | |
| Construction Materials (0.4%) | | | | | | | | |
| Tecnoglass, Inc. | | | 350,000 | | | | 1,907,500 | |
| | | | | | | | | |
| Containers & Packaging (0.6%) | | | | | | | | |
| Westrock Co. | | | 100,000 | | | | 2,826,000 | |
| | | | | | | | | |
| Diversified Consumer Services (3.3%) | | | | | | | | |
| Carriage Services, Inc. (Class A) | | | 100,000 | | | | 1,812,000 | |
| Lincoln Educational Services Corp.(a)(c) | | | 2,395,000 | | | | 9,340,500 | |
| Zovio, Inc.(a)(c) | | | 2,025,000 | | | | 6,196,500 | |
| | | | | | | | 17,349,000 | |
| | | | | | | | | |
| Diversified Telecommunication Services (2.1%) | | | | | | | | |
| Vonage Holdings Corp.(a) | | | 1,100,000 | | | | 11,066,000 | |
| | | | | | | | | |
| Electric Utilities (0.6%) | | | | | | | | |
| Spark Energy, Inc. (Class A) | | | 450,000 | | | | 3,181,500 | |
| | | | | | | | | |
| Electrical Equipment (1.0%) | | | | | | | | |
| Orion Energy Systems, Inc.(a) | | | 750,000 | | | | 2,595,000 | |
| Powell Industries, Inc. | | | 87,155 | | | | 2,387,176 | |
| | | | | | | | 4,982,176 | |
| | | | | | | | | |
| Electronic Equipment, Instruments & Components (1.8%) | | | | | | | | |
| Identiv, Inc.(a) | | | 600,000 | | | | 3,060,000 | |
| Intellicheck, Inc.(a) | | | 500,000 | | | | 3,775,000 | |
| Orbital Energy Group, Inc.(a) | | | 1,415,000 | | | | 875,954 | |
| SMTC Corp.(a) | | | 600,000 | | | | 1,818,000 | |
| | | | | | | | 9,528,954 | |
| | | | | | | | | |
| Equity Real Estate Investment Trusts (REITs) (3.5%) | | | | | | | | |
| CareTrust REIT, Inc. | | | 300,000 | | | | 5,148,000 | |
| Equity Commonwealth | | | 50,000 | | | | 1,610,000 | |
| Investors Real Estate Trust | | | 40,000 | | | | 2,819,600 | |
| Monmouth Real Estate Investment Corp. | | | 350,000 | | | | 5,071,500 | |
| PotlatchDeltic Corp. | | | 90,000 | | | | 3,422,700 | |
| | | | | | | | 18,071,800 | |
| | | | | | | | | |
| Food Products (2.2%) | | | | | | | | |
| Hanover Foods Corp. (Class A)(d) | | | 48,633 | | | | 3,258,411 | |
| Landec Corp.(a) | | | 1,050,000 | | | | 8,358,000 | |
| | | | | | | | 11,616,411 | |
| Gas Utilities (0.8%) | | | | | | | | |
| National Fuel Gas Co. | | | 100,000 | | | | 4,193,000 | |
| | | | | | | | | |
| Health Care Equipment & Supplies (1.8%) | | | | | | | | |
| Accuray, Inc.(a) | | | 3,000,000 | | | | 6,090,000 | |
| Chembio Diagnostics, Inc.(a)(e) | | | 275,000 | | | | 893,750 | |
| Cutera, Inc.(a) | | | 50,000 | | | | 608,500 | |
| Trinity Biotech, PLC (ADR)(a)(e) | | | 850,000 | | | | 1,853,000 | |
| | | | | | | | 9,445,250 | |
| | | | | | | | | |
| Health Care Providers & Services (2.5%) | | | | | | | | |
| Patterson Cos., Inc. | | | 250,000 | | | | 5,500,000 | |
| Triple-S Management Corp.(Class B)(a) | | | 400,000 | | | | 7,608,000 | |
| | | | | | | | 13,108,000 | |
| | | | | | | | | |
| Household Durables (4.5%) | | | | | | | | |
| Century Communities, Inc.(a) | | | 400,000 | | | | 12,264,000 | |
| Hooker Furniture Corp. | | | 64,153 | | | | 1,247,776 | |
| MDC Holdings, Inc. | | | 250,000 | | | | 8,925,000 | |
| ZAGG, Inc.(a) | | | 400,000 | | | | 1,256,000 | |
| | | | | | | | 23,692,776 | |
| | | | | | | | | |
| Independent Power & Renewable Electricity Producers (2.9%) | | | | | | | | |
| Spark Power Group, Inc. (CAD)(a)(f) | | | 500,000 | | | | 423,542 | |
| Vistra Energy Corp. | | | 800,000 | | | | 14,896,000 | |
| | | | | | | | 15,319,542 | |
| | | | | | | | | |
| Insurance (0.7%) | | | | | | | | |
| FedNat Holding Co. | | | 325,000 | | | | 3,597,750 | |
| | | | | | | | | |
| Internet & Direct Marketing Retail (0.4%) | | | | | | | | |
| Trxade Group, Inc.(a) | | | 300,000 | | | | 1,800,000 | |
| | | | | | | | | |
| IT Services (3.0%) | | | | | | | | |
| EVERTEC, Inc. | | | 270,911 | | | | 7,612,599 | |
| Limelight Networks, Inc.(a)(e) | | | 600,000 | | | | 4,416,000 | |
| USA Technologies, Inc.(a) | | | 500,000 | | | | 3,505,000 | |
| | | | | | | | 15,533,599 | |
| | | | | | | | | |
| Leisure Products (0.2%) | | | | | | | | |
| Vista Outdoor, Inc.(a) | | | 75,000 | | | | 1,083,750 | |
| | | | | | | | | |
| Life Sciences Tools & Services (0.9%) | | | | | | | | |
| Harvard Bioscience, Inc.(a) | | | 1,000,000 | | | | 3,100,000 | |
| Pacific Biosciences of California, Inc.(a) | | | 500,000 | | | | 1,725,000 | |
| | | | | | | | 4,825,000 | |
The accompanying Notes to Financial Statements are an integral part of these Statements.
VALUE FUND — SCHEDULE OF INVESTMENTS (CONTINUED)
June 30, 2020 (Unaudited)
| | | SHARES | | | VALUE | |
| Machinery (3.5%) | | | | | | |
| Energy Recovery, Inc.(a) | | | 168,943 | | | $ | 1,283,122 | |
| Gorman-Rupp Co. | | | 150,000 | | | | 4,662,000 | |
| Mayville Engineering Co., Inc.(a) | | | 6,048 | | | | 47,779 | |
| Pentair PLC | | | 100,000 | | | | 3,799,000 | |
| Shyft Group, Inc. | | | 500,000 | | | | 8,420,000 | |
| | | | | | | | 18,211,901 | |
| Media (0.7%) | | | | | | | | |
| A H Belo Corp. (Class A) | | | 900,000 | | | | 1,557,000 | |
| Marchex, Inc. (Class B)(a) | | | 1,400,000 | | | | 2,212,000 | |
| | | | | | | | 3,769,000 | |
| Metals & Mining (8.5%) | | | | | | | | |
| Centerra Gold, Inc. (CAD)(f) | | | 2,000,000 | | | | 22,318,798 | |
| IAMGOLD Corp.(a) | | | 1,000,000 | | | | 3,950,000 | |
| Major Drilling Group International, Inc. (CAD)(a)(f) | | | 600,000 | | | | 1,895,993 | |
| Pretium Resources, Inc.(a) | | | 1,000,000 | | | | 8,400,000 | |
| Roxgold, Inc. (CAD)(a)(f) | | | 5,000,000 | | | | 5,634,944 | |
| Standard Lithium, Ltd. (CAD)(a)(f) | | | 900,000 | | | | 662,934 | |
| Teranga Gold Corp. (CAD)(a)(f) | | | 150,000 | | | | 1,359,016 | |
| | | | | | | | 44,221,685 | |
| Multi-Utilities (0.6%) | | | | | | | | |
| MDU Resources Group, Inc. | | | 150,000 | | | | 3,327,000 | |
| | | | | | | | | |
| Oil, Gas & Consumable Fuels (1.1%) | | | | | | | | |
| Berry Corp. (Class A) | | | 1,000,000 | | | | 4,830,000 | |
| HollyFrontier Corp. | | | 25,000 | | | | 730,000 | |
| | | | | | | | 5,560,000 | |
| Paper & Forest Products (0.5%) | | | | | | | | |
| Western Forest Products, Inc. (CAD)(f) | | | 3,900,000 | | | | 2,671,626 | |
| | | | | | | | | |
| Pharmaceuticals (2.5%) | | | | | | | | |
| Evofem Biosciences, Inc.(a)(g) | | | 1,500,000 | | | | 4,245,000 | |
| Jazz Pharmaceuticals PLC(a) | | | 80,000 | | | | 8,827,200 | |
| | | | | | | | 13,072,200 | |
| Professional Services (4.2%) | | | | | | | | |
| Acacia Research Corp.(a) | | | 2,429,800 | | | | 9,937,882 | |
| Barrett Business Services, Inc. | | | 159,600 | | | | 8,479,548 | |
| Hudson Global, Inc.(a)(c) | | | 315,000 | | | | 2,772,000 | |
| RCM Technologies, Inc.(a)(c) | | | 586,623 | | | | 786,075 | |
| | | | | | | | 21,975,505 | |
| Real Estate Management & Development (2.2%) | | | | | | | | |
| Kennedy-Wilson Holdings, Inc. | | | 750,000 | | | | 11,415,000 | |
| | | | | | | | | |
| Road & Rail (0.5%) | | | | | | | | |
| Marten Transport, Ltd. | | | 100,000 | | | | 2,516,000 | |
| | | | | | | | | |
| Semiconductors & Semiconductor Equipment (2.0%) | | | | | | | | |
| GSI Technology, Inc.(a) | | | 450,000 | | | | 3,231,000 | |
| Photronics, Inc.(a) | | | 310,151 | | | | 3,451,981 | |
| Pixelworks, Inc.(a) | | | 1,125,000 | | | | 3,633,750 | |
| | | | | | | | 10,316,731 | |
| Software (1.5%) | | | | | | | | |
| Ebix, Inc. | | | 100,000 | | | | 2,236,000 | |
| Mitek Systems, Inc.(a) | | | 300,000 | | | | 2,883,000 | |
| OneSpan, Inc.(a) | | | 100,000 | | | | 2,793,000 | |
| | | | | | | | 7,912,000 | |
| Specialty Retail (0.7%) | | | | | | | | |
| Dick’s Sporting Goods, Inc. | | | 50,000 | | | | 2,063,000 | |
| Indigo Books & Music, Inc. (CAD)(a)(f) | | | 418,700 | | | | 277,571 | |
| Rent-A-Center, Inc. (Class A) | | | 40,220 | | | | 1,118,920 | |
| | | | | | | | 3,459,491 | |
| Technology Hardware, Storage & Peripherals (1.2%) | | | | | | | | |
| NCR Corp.(a) | | | 175,000 | | | | 3,031,000 | |
| Quantum Corp.(a) | | | 800,000 | | | | 3,088,000 | |
| | | | | | | | 6,119,000 | |
| Thrifts & Mortgage Finance (4.6%) | | | | | | | | |
| MGIC Investment Corp. | | | 1,500,000 | | | | 12,285,000 | |
| Radian Group, Inc. | | | 750,000 | | | | 11,632,500 | |
| | | | | | | | 23,917,500 | |
| TOTAL COMMON STOCKS | | | | | | | | |
| (Cost $518,098,957) | | | | | | $ | 518,755,132 | |
| | | INTEREST | | | PAR | | | | |
| | | RATE | | | AMOUNT | | | VALUE | |
| SHORT-TERM INVESTMENTS (0.4%) | | | | | | | | | | | | |
| Time Deposits (0.4%) | | | | | | | | | | | | |
| JPM Chase (New York)(b) | | | 0.01% | | | $ | 1,798,842 | | | $ | 1,798,842 | |
| | | | | | | | | | | | | |
| TOTAL SHORT-TERM INVESTMENTS | | | | | | | | | | | | |
| (Cost $1,798,842) | | | | | | | | | | $ | 1,798,842 | |
| | | INTEREST | | | | | | | |
| | | RATE | | | SHARES | | | VALUE | |
| INVESTMENTS PURCHASED WITH CASH COLLATERAL |
| FROM SECURITIES LOANED (0.1%) | | | | | | |
| Registered Investment Companies (0.1%) | | | | | | | | | | | | |
| Invesco Treasury Portfolio Short-Term Investments Trust, Institutional Class(h) | | | 0.0 8% | | | | 718,250 | | | $ | 718,250 | |
| | | | | | | | | | | | | |
| TOTAL INVESTMENTS PURCHASED WITH CASH COLLATERAL | | | | | | | | | | | | |
| FROM SECURITIES LOANED | | | | | | | | | | | | |
| (Cost $718,250) | | | | | | | | | | $ | 718,250 | |
| | | | | | | | | | | | | |
| TOTAL INVESTMENTS - (99.9%) | | | | | | | | | | | | |
| (Cost $520,616,049) | | | | | | | | | | $ | 521,272,224 | |
| OTHER ASSETS AND LIABILITIES, NET - (0.1%) | | | | | | | | | | | 586,000 | |
| TOTAL NET ASSETS - (100.0%) | | | | | | | | | | $ | 521,858,224 | |
The accompanying Notes to Financial Statements are an integral part of these Statements.
VALUE FUND — SCHEDULE OF OPTIONS
June 30, 2020 (Unaudited)
| DESCRIPTION | | | COUNTERPARTY | | | NUMBER OF
CONTRACTS | | | WRITTEN
OPTIONS
AT VALUE* | | | NOTIONAL
VALUE | |
| Chembio Diagnostics, Inc., $5.00 7/17/20 (Covered Call) | | | Susquehanna | | | | (1,500 | ) | | $ | (30,000 | ) | | $ | (487,500 | ) |
| Limelight Networks, Inc., $8.00 7/17/20 (Covered Call) | | | Susquehanna | | | | (1,500 | ) | | | (60,000 | ) | | | (1,104,000 | ) |
| Trinity Biotech PLC, $2.50 7/17/20 (Covered Call) | | | Susquehanna | | | | (2,427 | ) | | | (84,945 | ) | | | (529,086 | ) |
| Total Written Options | | | | | | | (5,427 | ) | | $ | (174,945 | ) | | $ | (2,120,586 | ) |
| * | Amounts reflect a liability of the Fund which is included on the Statements of Assets and Liabilities. |
| (a) | Non-income producing security. Includes securities which did not pay at least one dividend in the year preceding the date of this statement. |
| (b) | Time deposits are considered short-term obligations and are payable on demand. Interest rates change periodically on specified dates. The rate listed is the 7-day yield as of June 30, 2020. |
| (c) | Affiliated company. See Note 10 in Notes to Financial Statements. |
| (d) | Classified as Level 2. Valued using methods determined by the Board of Directors or using systematic fair valuation model provided by an independent pricing service. See Note 3 in Notes to Financial Statements. |
| (e) | All or a portion of the security is pledged as collateral on written options. The aggregate value of the collateralized securities totals $2,120,586 as of June 30, 2020. See Note 4 in Notes to Financial Statements. |
| (f) | Traded in a foreign country. |
| (g) | Loaned security; a portion or all of the security was on loan at June 30, 2020. The total value of securities on loan for the Value Fund was $685,143. See Note 5 in Notes to Financial Statements. |
| (h) | The security has been segregated to satisfy the commitment to return the cash collateral received in securities lending transactions upon the borrower’s return of the securities loaned. See Note 5 in Notes to |
| | Financial Statements. The rate listed is the 7-day yield as of June 30, 2020. |
| Common Abbreviations: |
| |
| ADR | American Depositary Receipt. |
| Ltd. | Limited. |
| PLC | Public Limited Company is a publicly traded company which signifies that shareholders have limited liability. |
| REIT | Real Estate Investment Trust. |
Currency Abbreviations:
Percentages are stated as a percent of net assets.
Sector and Industry classifications are sourced from GICS®, The Global Industry Classification Standard (GICS®) is the exclusive intellectual property of MSCI Inc. (“MSCI”) and S&P Global Market Intelligence (“S&P”). Neither MSCI, S&P, their affiliates, nor any of their third party providers (“GICS Parties”) makes any representations or warranties, express or implied, with respect to GICS or the results to be obtained by the use thereof, and expressly disclaims all warranties, including warranties of accuracy, completeness, merchantability and fitness for a particular purpose. The GICS Parties shall not have any liability for any direct, indirect, special, punitive, consequential, or any other damages (including lost profits) even if notified of such damages.
The accompanying Notes to Financial Statements are an integral part of these Statements.
STATEMENTS OF ASSETS AND LIABILITIES
June 30, 2020 (Unaudited)
| | | SELECT
VALUE FUND | | | MID CAP
VALUE FUND | | | VALUE PLUS
FUND | | | VALUE FUND | |
| ASSETS: | | | | | | | | | | | | | | | | |
| Investments in securities, at cost(a) | | $ | 133,698,371 | | | $ | 49,863,133 | | | $ | 287,290,556 | | | $ | 520,616,049 | |
| Investments in securities, at value(b) | | $ | 138,734,743 | | | $ | 56,230,133 | | | $ | 301,934,960 | | | $ | 495,737,946 | |
| Investments in affiliates, at value (See Note 10) | | | — | | | | — | | | | — | | | | 25,534,278 | |
| Total Investments, at value | | | 138,734,743 | | | | 56,230,133 | | | | 301,934,960 | | | | 521,272,224 | |
| Receivable for securities sold | | | 1,208,753 | | | | 61,990 | | | | 1,959,233 | | | | 5,915,890 | |
| Accrued dividends and interest | | | 168,756 | | | | 130,113 | | | | 237,354 | | | | 466,225 | |
| Accrued securities lending income | | | — | | | | — | | | | — | | | | 3,532 | |
| Receivable for capital shares issued | | | 8,438 | | | | 2,798 | | | | 374,907 | | | | 114,812 | |
| Prepaid expenses | | | 31,736 | | | | 22,074 | | | | 53,534 | | | | 87,917 | |
| Total Assets | | | 140,152,426 | | | | 56,447,108 | | | | 304,559,988 | | | | 527,860,600 | |
| | | | | | | | | | | | | | | | | |
| LIABILITIES: | | | | | | | | | | | | | | | | |
| Written options, at value (proceeds $—, $—, $— and $276,787, respectively) | | | — | | | | — | | | | — | | | | 174,945 | |
| Payable for securities purchased | | | — | | | | 58,750 | | | | 1,531,904 | | | | 4,859,286 | |
| Payable for capital shares redeemed | | | 25,516 | | | | 11,799 | | | | 233,359 | | | | 77,646 | |
| Payable for collateral upon return of securities loaned | | | — | | | | — | | | | — | | | | 718,250 | |
| Accrued expenses | | | | | | | | | | | | | | | | |
| Management fees | | | 10,674 | | | | 748 | | | | 21,319 | | | | 41,607 | |
| Distribution fees - Investor Class | | | 3,052 | | | | 1,136 | | | | 5,964 | | | | 8,062 | |
| Fund accounting fees | | | 16,770 | | | | 12,708 | | | | 27,614 | | | | 50,159 | |
| Transfer agency fees | | | 15,479 | | | | 16,092 | | | | 33,343 | | | | 34,066 | |
| Custody fees | | | 1,515 | | | | — | | | | 1,977 | | | | 4,203 | |
| Audit fees | | | 12,219 | | | | 15,266 | | | | 11,189 | | | | 13,505 | |
| Legal fees | | | 75 | | | | 35 | | | | 88 | | | | 91 | |
| Printing fees | | | 7,674 | | | | 5,331 | | | | 14,906 | | | | 18,033 | |
| Other | | | 1,606 | | | | 3,881 | | | | 712 | | | | 2,523 | |
| Total Liabilities | | | 94,580 | | | | 125,746 | | | | 1,882,375 | | | | 6,002,376 | |
| TOTAL NET ASSETS | | $ | 140,057,846 | | | $ | 56,321,362 | | | $ | 302,677,613 | | | $ | 521,858,224 | |
| | | | | | | | | | | | | | | | | |
| NET ASSETS CONSIST OF: | | | | | | | | | | | | | | | | |
| Paid-in capital | | $ | 138,939,741 | | | $ | 56,112,297 | | | $ | 291,343,234 | | | $ | 527,926,370 | |
| Total distributable earnings | | | 1,118,105 | | | | 209,065 | | | | 11,334,379 | | | | (6,068,146 | ) |
| TOTAL NET ASSETS | | $ | 140,057,846 | | | $ | 56,321,362 | | | $ | 302,677,613 | | | $ | 521,858,224 | |
| | | | | | | | | | | | | | | | | |
| NET ASSET VALUE, OFFERING PRICE & REDEMPTION PRICE PER SHARE: | | | | | | | | | | | | | | | | |
| INVESTOR CLASS: | | | | | | | | | | | | | | | | |
| Net assets | | $ | 114,480,396 | | | $ | 48,851,010 | | | $ | 227,245,021 | | | $ | 473,895,562 | |
| Shares outstanding | | | 5,554,347 | | | | 4,829,100 | | | | 7,297,071 | | | | 14,596,492 | |
| NET ASSET VALUE, OFFERING PRICE & REDEMPTION PRICE PER SHARE | | $ | 20.61 | | | $ | 10.12 | | | $ | 31.14 | | | $ | 32.47 | |
| INSTITUTIONAL CLASS: | | | | | | | | | | | | | | | | |
| Net assets | | $ | 25,577,450 | | | $ | 7,470,352 | | | $ | 75,432,592 | | | $ | 47,962,662 | |
| Shares outstanding | | | 1,244,829 | | | | 736,104 | | | | 2,433,051 | | | | 1,445,455 | |
| NET ASSET VALUE, OFFERING PRICE & REDEMPTION PRICE PER SHARE | | $ | 20.55 | | | $ | 10.15 | | | $ | 31.00 | | | $ | 33.18 | |
| (a) | Includes cost of investments in affiliates of $— for the Select Value Fund, $— for the Mid Cap Value Fund, $— for the Value Plus Fund and $47,066,656 for the Value Fund. See Note 10 in the Notes to Financial Statements. |
| (b) | Includes securities on loan in the amount of $— for the Select Value Fund, $— for the Mid Cap Value Fund, $— for the Value Plus Fund and $685,143 for the Value Fund. |
The accompanying Notes to Financial Statements are an integral part of these Statements.
STATEMENTS OF OPERATIONS
For the Six Months Ended June 30, 2020 (Unaudited)
| | | SELECT
VALUE FUND | | | MID CAP
VALUE FUND | | | VALUE PLUS
FUND | | | VALUE FUND | |
| INVESTMENT INCOME: | | | | | | | | | | | | | | | | |
| Dividends(a) | | $ | 2,050,772 | | | $ | 498,000 | | | $ | 3,403,258 | | | $ | 4,261,862 | |
| Interest | | | 5,133 | | | | 1,442 | | | | 42,067 | | | | 6,438 | |
| Securities lending, net | | | 59 | | | | — | | | | — | | | | 27,524 | |
| Foreign taxes withheld | | | (79,728 | ) | | | (2,985 | ) | | | — | | | | (27,054 | ) |
| Total Investment Income | | | 1,976,236 | | | | 496,457 | | | | 3,445,325 | | | | 4,268,770 | |
| | | | | | | | | | | | | | | | | |
| EXPENSES: | | | | | | | | | | | | | | | | |
| Management fees | | | 578,755 | | | | 139,135 | | | | 1,022,689 | | | | 1,960,155 | |
| Distribution fees - Investor Class | | | 142,228 | | | | 37,784 | | | | 288,773 | | | | 413,794 | |
| Transfer agency fees | | | 100,771 | | | | 44,544 | | | | 201,153 | | | | 222,802 | |
| Fund accounting fees | | | 44,305 | | | | 16,938 | | | | 77,205 | | | | 134,719 | |
| Custodian fees | | | 6,763 | | | | 5,179 | | | | 12,355 | | | | 21,630 | |
| Printing and communication fees | | | 2,398 | | | | 1,294 | | | | 4,070 | | | | 8,199 | |
| Postage fees | | | 5,726 | | | | 1,329 | | | | 12,059 | | | | 10,297 | |
| Legal fees | | | 14,724 | | | | 2,932 | | | | 27,064 | | | | 48,791 | |
| Registration fees | | | 18,754 | | | | 14,944 | | | | 19,188 | | | | 19,591 | |
| Directors' fees | | | 15,726 | | | | 3,544 | | | | 27,636 | | | | 50,991 | |
| Audit and tax fees | | | 11,728 | | | | 12,631 | | | | 11,214 | | | | 12,368 | |
| Insurance fees | | | 11,650 | | | | 678 | | | | 19,329 | | | | 38,845 | |
| Other expenses | | | 10,256 | | | | 4,176 | | | | 16,049 | | | | 29,639 | |
| Total Expenses before waivers | | | 963,784 | | | | 285,108 | | | | 1,738,784 | | | | 2,971,821 | |
| Expenses waived by investment advisor (See Note 6) | | | 10,105 | | | | 83,824 | | | | 5,968 | | | | — | |
| Total Expenses after waivers | | | 953,679 | | | | 201,284 | | | | 1,732,816 | | | | 2,971,821 | |
| NET INVESTMENT INCOME | | | 1,022,557 | | | | 295,173 | | | | 1,712,509 | | | | 1,296,949 | |
| | | | | | | | | | | | | | | | | |
| REALIZED & UNREALIZED GAINS (LOSSES) ON INVESTMENTS, OPTIONS AND TRANSLATION OF ASSETS AND LIABILITIES IN FOREIGN CURRENCY | | | | | | | | | | | | | | | | |
| Net realized gains (losses) on: | | | | | | | | | | | | | | | | |
| Investments | | | (7,690,507 | ) | | | (6,328,964 | ) | | | (2,956,617 | ) | | | (6,221,574 | ) |
| Investments - Affiliated securities | | | — | | | | — | | | | — | | | | (2,470,426 | ) |
| Written options | | | — | | | | — | | | | — | | | | 926,207 | |
| Foreign currency translation | | | 386 | | | | — | | | | — | | | | (13,724 | ) |
| Net change in unrealized appreciation (depreciation) on: | | | | | | | | | | | | | | | | |
| Investments | | | (31,442,088 | ) | | | 4,751,573 | | | | (38,881,176 | ) | | | (99,639,257 | ) |
| Investments - Affiliated securities | | | — | | | | — | | | | — | | | | 2,060,879 | |
| Written options | | | — | | | | — | | | | — | | | | 516,016 | |
| Foreign currency translation | | | 30,882 | | | | — | | | | — | | | | (761,916 | ) |
| TOTAL REALIZED & UNREALIZED NET (LOSSES) ON INVESTMENTS, OPTIONS AND TRANSLATION OF ASSETS IN FOREIGN CURRENCY | | | (39,101,327 | ) | | | (1,577,391 | ) | | | (41,837,793 | ) | | | (105,603,795 | ) |
| NET (DECREASE) IN NET ASSETS RESULTING FROM OPERATIONS | | $ | (38,078,770 | ) | | $ | (1,282,218 | ) | | $ | (40,125,284 | ) | | $ | (104,306,846 | ) |
| (a) | Includes $— received from affiliated issuers held by the Value Fund. See Note 10 in the Notes to Financial Statements. |
The accompanying Notes to Financial Statements are an integral part of these Statements.
THIS PAGE INTENTIONALLY LEFT BLANK
STATEMENTS OF CHANGES IN NET ASSETS
| | | SELECT VALUE FUND | | | MID CAP VALUE FUND | | | VALUE PLUS FUND | |
| | | For the Six Months | | | | | | For the Six Months | | | | | | For the Six Months | | | | |
| | | Ended June 30,
2020 | | | For the Year Ended | | | Ended June 30,
2020 | | | For the Year Ended | | | Ended June 30,
2020 | | | For the Year Ended | |
| | | (Unaudited) | | | December 31, 2019 | | | (Unaudited) | | | December 31, 2019 | | | (Unaudited) | | | December 31, 2019 | |
| FROM INVESTMENT OPERATIONS: | | | | | | | | | | | | | | | | | | | | | | | | |
| Net investment income | | $ | 1,022,557 | | | $ | 1,936,668 | | | $ | 295,173 | | | $ | 139,461 | | | $ | 1,712,509 | | | $ | 5,127,489 | |
| Net realized gains (losses) | | | (7,690,121 | ) | | | 10,279,927 | | | | (6,328,964 | ) | | | 166,026 | | | | (2,956,617 | ) | | | 9,582,164 | |
| Net change in unrealized appreciation (depreciation) | | | (31,411,206 | ) | | | 22,103,863 | | | | 4,751,573 | | | | 2,272,462 | | | | (38,881,176 | ) | | | 62,714,578 | |
| Net increase (decrease) in net assets resulting from operations | | | (38,078,770 | ) | | | 34,320,458 | | | | (1,282,218 | ) | | | 2,577,949 | | | | (40,125,284 | ) | | | 77,424,231 | |
| | | | | | | | | | | | | | | | | | | | | | | | | |
| DISTRIBUTIONS TO SHAREHOLDERS: | | | | | | | | | | | | | | | | | | | | | | | | |
| Investor Class | | | — | | | | (8,751,125 | ) | | | — | | | | (168,887 | ) | | | — | | | | (4,063,213 | ) |
| Institutional Class | | | — | | | | (1,832,026 | ) | | | — | | | | (168,220 | ) | | | — | | | | (1,084,045 | ) |
| Total distributions to shareholders | | | — | | | | (10,583,151 | ) | | | — | | | | (337,107 | ) | | | — | | | | (5,147,258 | ) |
| | | | | | | | | | | | | | | | | | | | | | | | | |
| CAPITAL TRANSACTIONS: | | | | | | | | | | | | | | | | | | | | | | | | |
| Investor Class | | | | | | | | | | | | | | | | | | | | | | | | |
| Proceeds from shares issued | | | 2,849,183 | | | | 16,032,279 | | | | 512,446 | | | | 2,905,843 | | | | 15,271,795 | | | | 11,780,519 | |
| Dividends reinvested | | | — | | | | 8,693,087 | | | | — | | | | 165,686 | | | | — | | | | 3,983,890 | |
| Value of shares redeemed(a) | | | (23,483,960 | ) | | | (40,509,686 | ) | | | (4,038,181 | ) | | | (2,130,069 | ) | | | (32,598,748 | ) | | | (54,885,476 | ) |
| Acquisition | | | — | | | | — | | | | 49,462,515 | | | | — | | | | — | | | | — | |
| Total Investor Class | | | (20,634,777 | ) | | | (15,784,320 | ) | | | 45,936,780 | | | | 941,460 | | | | (17,326,953 | ) | | | (39,121,067 | ) |
| Institutional Class | | | | | | | | | | | | | | | | | | | | | | | | |
| Proceeds from shares issued | | | 3,263,604 | | | | 11,840,648 | | | | 1,666,625 | | | | 3,572,982 | | | | 28,115,523 | | | | 8,568,874 | |
| Dividends reinvested | | | — | | | | 1,804,068 | | | | — | | | | 166,221 | | | | — | | | | 1,032,063 | |
| Value of shares redeemed(a) | | | (4,429,764 | ) | | | (13,861,228 | ) | | | (1,106,756 | ) | | | (576,579 | ) | | | (12,168,321 | ) | | | (12,047,560 | ) |
| Acquisition | | | — | | | | — | | | | (3,839,726 | ) | | | — | | | | — | | | | — | |
| Total Institutional Class | | | (1,166,160 | ) | | | (216,512 | ) | | | (3,279,857 | ) | | | 3,162,624 | | | | 15,947,202 | | | | (2,446,623 | ) |
| Net increase (decrease) in net assets derived from | | | | | | | | | | | | | | | | | | | | | | | | |
| capital transactions | | | (21,800,937 | ) | | | (16,000,832 | ) | | | 42,656,923 | | | | 4,104,084 | | | | (1,379,751 | ) | | | (41,567,690 | ) |
| TOTAL INCREASE (DECREASE) IN NET ASSETS | | | (59,879,707 | ) | | | 7,736,475 | | | | 41,374,705 | | | | 6,344,926 | | | | (41,505,035 | ) | | | 30,709,283 | |
| NET ASSETS AT THE BEGINNING OF THE PERIOD | | | 199,937,553 | | | | 192,201,078 | | | | 14,946,657 | | | | 8,601,731 | | | | 344,182,648 | | | | 313,473,365 | |
| NET ASSETS AT THE END OF THE PERIOD | | $ | 140,057,846 | | | $ | 199,937,553 | | | $ | 56,321,362 | | | $ | 14,946,657 | | | $ | 302,677,613 | | | $ | 344,182,648 | |
| | | | | | | | | | | | | | | | | | | | | | | | | |
| FUND SHARE TRANSACTIONS | | | | | | | | | | | | | | | | | | | | | | | | |
| Investor Class | | | | | | | | | | | | | | | | | | | | | | | | |
| Shares Issued | | | 137,176 | | | | 635,486 | | | | 50,185 | | | | 253,377 | | | | 502,709 | | | | 354,899 | |
| Reinvested Shares | | | — | | | | 341,326 | | | | — | | | | 13,559 | | | | — | | | | 112,698 | |
| Shares Redeemed | | | (1,125,228 | ) | | | (1,600,036 | ) | | | (440,377 | ) | | | (183,192 | ) | | | (1,090,249 | ) | | | (1,658,549 | ) |
| Acquisition | | | — | | | | — | | | | 4,596,024 | | | | — | | | | — | | | | — | |
| Net increase (decrease) resulting from share transactions | | | (988,052 | ) | | | (623,224 | ) | | | 4,205,832 | | | | 83,744 | | | | (587,540 | ) | | | (1,190,952 | ) |
| Institutional Class | | | | | | | | | | | | | | | | | | | | | | | | |
| Shares Issued | | | 153,833 | | | | 472,420 | | | | 176,671 | | | | 311,967 | | | | 1,004,138 | | | | 257,941 | |
| Reinvested Shares | | | — | | | | 71,110 | | | | — | | | | 13,569 | | | | — | | | | 29,362 | |
| Shares Redeemed | | | (212,969 | ) | | | (553,811 | ) | | | (109,445 | ) | | | (49,930 | ) | | | (397,938 | ) | | | (366,818 | ) |
| Acquisition | | | — | | | | — | | | | 72,056 | | | | — | | | | — | | | | — | |
| Net increase (decrease) resulting from share transactions | | | (59,136 | ) | | | (10,281 | ) | | | 139,282 | | | | 275,606 | | | | 606,200 | | | | (79,515 | ) |
| (a) | Value of shares redeemed includes amounts for early redemption fees. See Note 7 in Notes to Financial Statements. |
The accompanying Notes to Financial Statements are an integral part of these Statements.
STATEMENTS OF CHANGES IN NET ASSETS (CONTINUED)
| | | VALUE FUND | |
| | | For the Six Months | | | | |
| | | Ended June 30, 2020 | | | For the Year Ended | |
| | | (Unaudited) | | | December 31, 2019 | |
| FROM INVESTMENT OPERATIONS: | | | | | | | | |
| Net investment income | | $ | 1,296,949 | | | $ | 1,844,183 | |
| Net realized gains (losses) | | | (7,779,517 | ) | | | 18,943,744 | |
| Net change in unrealized appreciation (depreciation) | | | (97,824,278 | ) | | | 88,872,938 | |
| Net increase (decrease) in net assets resulting from operations | | | (104,306,846 | ) | | | 109,660,865 | |
| | | | | | | | | |
| DISTRIBUTIONS TO SHAREHOLDERS: | | | | | | | | |
| Investor Class | | | — | | | | (18,186,616 | ) |
| Institutional Class | | | — | | | | (1,736,705 | ) |
| Total distributions to shareholders | | | — | | | | (19,923,321 | ) |
| | | | | | | | | |
| CAPITAL TRANSACTIONS: | | | | | | | | |
| Investor Class | | | | | | | | |
| Proceeds from shares issued | | | 6,375,124 | | | | 11,926,421 | |
| Dividends reinvested | | | — | | | | 17,465,232 | |
| Value of shares redeemed(a) | | | (35,586,545 | ) | | | (82,513,277 | ) |
| Acquisition | | | — | | | | — | |
| Total Investor Class | | | (29,211,421 | ) | | | (53,121,624 | ) |
| Institutional Class | | | | | | | | |
| Proceeds from shares issued | | | 5,010,706 | | | | 4,017,848 | |
| Dividends reinvested | | | — | | | | 1,635,066 | |
| Value of shares redeemed(a) | | | (3,791,545 | ) | | | (21,250,558 | ) |
| Acquisition | | | — | | | | — | |
| Total Institutional Class | | | 1,219,161 | | | | (15,597,644 | ) |
| Net decrease in net assets derived from | | | | | | | | |
| capital transactions | | | (27,992,260 | ) | | | (68,719,268 | ) |
| | | | | | | | | |
| TOTAL INCREASE (DECREASE) IN NET ASSETS | | | (132,299,106 | ) | | | 21,018,276 | |
| NET ASSETS AT THE BEGINNING OF THE PERIOD | | | 654,157,330 | | | | 633,139,054 | |
| NET ASSETS AT THE END OF THE PERIOD | | $ | 521,858,224 | | | $ | 654,157,330 | |
| | | | | | | | | |
| FUND SHARE TRANSACTIONS | | | | | | | | |
| Investor Class | | | | | | | | |
| Shares Issued | | | 200,401 | | | | 314,848 | |
| Reinvested Shares | | | — | | | | 456,172 | |
| Shares Redeemed | | | (1,129,200 | ) | | | (2,175,912 | ) |
| Acquisition | | | — | | | | — | |
| Net decrease resulting from share transactions | | | (928,799 | ) | | | (1,404,892 | ) |
| Institutional Class | | | | | | | | |
| Shares Issued | | | 155,160 | | | | 103,125 | |
| Reinvested Shares | | | — | | | | 41,807 | |
| Shares Redeemed | | | (128,340 | ) | | | (544,245 | ) |
| Acquisition | | | — | | | | — | |
| Net increase (decrease) resulting from share transactions | | | 26,820 | | | | (399,313 | ) |
| (a) | Value of shares redeemed includes amounts for early redemption fees. See Note 7 in Notes to Financial Statements. |
The accompanying Notes to Financial Statements are an integral part of these Statements.
FINANCIAL HIGHLIGHTS
| | | INCOME FROM INVESTMENT OPERATIONS(a) | | | DISTRIBUTIONS | | | | |
| | | | Net asset value,
beginning of
period | | | | Net investment
income (loss)(a)(b) | | | | Net realized and
unrealized gains
(losses) | | | | Total income
(loss) from
investment
operations | | | | Distributions
from net
investment income | | | | Distributions from
net realized gains
on investments | | | | Total
distributions | | | | Net asset value,
end of period | |
| SELECT VALUE FUND | | | | | | | | | | | | | | | | | | | | | | | | | | | | | | | | |
| Investor Class | | | | | | | | | | | | | | | | | | | | | | | | | | | | | | | | |
| June 30, 2020 (Unaudited) | | $ | 25.50 | | | $ | 0.14 | | | $ | (5.03 | ) | | $ | (4.89 | ) | | $ | — | | | $ | — | | | $ | — | | | $ | 20.61 | |
| December 31, 2019 | | | 22.68 | | | | 0.23 | | | | 3.98 | | | | 4.21 | | | | (0.22 | ) | | | (1.17 | ) | | | (1.39 | ) | | | 25.50 | |
| December 31, 2018 | | | 28.09 | | | | 0.35 | | | | (1.72 | ) | | | (1.37 | ) | | | (0.32 | ) | | | (3.72 | ) | | | (4.04 | ) | | | 22.68 | |
| December 31, 2017 | | | 28.43 | | | | 0.42 | | | | 3.13 | | | | 3.55 | | | | (0.42 | ) | | | (3.47 | ) | | | (3.89 | ) | | | 28.09 | |
| December 31, 2016 | | | 27.08 | | | | 0.32 | | | | 4.91 | | | | 5.23 | | | | (0.33 | ) | | | (3.55 | ) | | | (3.88 | ) | | | 28.43 | |
| December 31, 2015 | | | 31.32 | | | | 0.26 | | | | (1.51 | ) | | | (1.25 | ) | | | (0.29 | ) | | | (2.70 | ) | | | (2.99 | ) | | | 27.08 | |
| Institutional Class | | | | | | | | | | | | | | | | | | | | | | | | | | | | | | | | |
| June 30, 2020 (Unaudited) | | | 25.39 | | | | 0.17 | | | | (5.01 | ) | | | (4.84 | ) | | | — | | | | — | | | | — | | | | 20.55 | |
| December 31, 2019 | | | 22.58 | | | | 0.29 | | | | 3.97 | | | | 4.26 | | | | (0.28 | ) | | | (1.17 | ) | | | (1.45 | ) | | | 25.39 | |
| December 31, 2018 | | | 28.00 | | | | 0.41 | | | | (1.71 | ) | | | (1.30 | ) | | | (0.40 | ) | | | (3.72 | ) | | | (4.12 | ) | | | 22.58 | |
| December 31, 2017 | | | 28.35 | | | | 0.50 | | | | 3.12 | | | | 3.62 | | | | (0.50 | ) | | | (3.47 | ) | | | (3.97 | ) | | | 28.00 | |
| December 31, 2016 | | | 27.01 | | | | 0.38 | | | | 4.91 | | | | 5.29 | | | | (0.40 | ) | | | (3.55 | ) | | | (3.95 | ) | | | 28.35 | |
| December 31, 2015 | | | 31.25 | | | | 0.33 | | | | (1.50 | ) | | | (1.17 | ) | | | (0.37 | ) | | | (2.70 | ) | | | (3.07 | ) | | | 27.01 | |
| MID CAP VALUE FUND | | | | | | | | | | | | | | | | | | | | | | | | | | | | | | | | |
| Investor Class | | | | | | | | | | | | | | | | | | | | | | | | | | | | | | | | |
| June 30, 2020 (Unaudited) | | | 12.24 | | | | 0.07 | | | | (2.19 | ) | | | (2.12 | ) | | | — | | | | — | | | | — | | | | 10.12 | |
| December 31, 2019 | | | 9.99 | | | | 0.11 | | | | 2.42 | | | | 2.53 | | | | (0.10 | ) | | | (0.18 | ) | | | (0.28 | ) | | | 12.24 | |
| December 31, 2018 | | | 11.99 | | | | 0.17 | | | | (1.21 | ) | | | (1.04 | ) | | | (0.13 | ) | | | (0.83 | ) | | | (0.96 | ) | | | 9.99 | |
| December 31, 2017 | | | 11.82 | | | | 0.10 | | | | 0.86 | | | | 0.96 | | | | (0.09 | ) | | | (0.70 | ) | | | (0.79 | ) | | | 11.99 | |
| December 31, 2016 | | | 9.25 | | | | 0.08 | | | | 2.57 | | | | 2.65 | | | | (0.08 | ) | | | — | | | | (0.08 | ) | | | 11.82 | |
| December 31, 2015 | | | 10.13 | | | | 0.09 | | | | (0.80 | ) | | | (0.71 | ) | | | (0.07 | ) | | | (0.10 | ) | | | (0.17 | ) | | | 9.25 | |
| Institutional Class | | | | | | | | | | | | | | | | | | | | | | | | | | | | | | | | |
| June 30, 2020 (Unaudited) | | | 12.27 | | | | 0.08 | | | | (2.20 | ) | | | (2.12 | ) | | | — | | | | — | | | | — | | | | 10.15 | |
| December 31, 2019 | | | 10.00 | | | | 0.15 | | | | 2.41 | | | | 2.56 | | | | (0.11 | ) | | | (0.18 | ) | | | (0.29 | ) | | | 12.27 | |
| December 31, 2018 | | | 11.99 | | | | 0.21 | | | | (1.21 | ) | | | (1.00 | ) | | | (0.16 | ) | | | (0.83 | ) | | | (0.99 | ) | | | 10.00 | |
| December 31, 2017 | | | 11.82 | | | | 0.13 | | | | 0.86 | | | | 0.99 | | | | (0.12 | ) | | | (0.70 | ) | | | (0.82 | ) | | | 11.99 | |
| December 31, 2016 | | | 9.23 | | | | 0.12 | | | | 2.55 | | | | 2.67 | | | | (0.08 | ) | | | — | | | | (0.08 | ) | | | 11.82 | |
| December 31, 2015 | | | 10.15 | | | | 0.11 | | | | (0.81 | ) | | | (0.70 | ) | | | (0.12 | ) | | | (0.10 | ) | | | (0.22 | ) | | | 9.23 | |
| VALUE PLUS FUND | | | | | | | | | | | | | | | | | | | | | | | | | | | | | | | | |
| Investor Class | | | | | | | | | | | | | | | | | | | | | | | | | | | | | | | | |
| June 30, 2020 (Unaudited) | | | 35.48 | | | | 0.17 | | | | (4.51 | ) | | | (4.34 | ) | | | — | | | | — | | | | — | | | | 31.14 | |
| December 31, 2019 | | | 28.57 | | | | 0.49 | | | | 6.94 | | | | 7.43 | | | | (0.52 | ) | | | — | | | | (0.52 | ) | | | 35.48 | |
| December 31, 2018 | | | 33.26 | | | | 0.32 | | | | (4.69 | ) | | | (4.37 | ) | | | (0.32 | ) | | | — | | | | (0.32 | ) | | | 28.57 | |
| December 31, 2017 | | | 30.33 | | | | 0.04 | | | | 2.94 | | | | 2.98 | | | | (0.05 | ) | | | — | | | | (0.05 | ) | | | 33.26 | |
| December 31, 2016 | | | 24.08 | | | | 0.14 | | | | 6.31 | | | | 6.45 | | | | (0.20 | ) | | | — | | | | (0.20 | ) | | | 30.33 | |
| December 31, 2015 | | | 31.66 | | | | 0.16 | | | | (5.62 | ) | | | (5.46 | ) | | | (0.21 | ) | | | (1.91 | ) | | | (2.12 | ) | | | 24.08 | |
| Institutional Class | | | | | | | | | | | | | | | | | | | | | | | | | | | | | | | | |
| June 30, 2020 (Unaudited) | | | 35.28 | | | | 0.20 | | | | (4.48 | ) | | | (4.28 | ) | | | — | | | | — | | | | — | | | | 31.00 | |
| December 31, 2019 | | | 28.41 | | | | 0.55 | | | | 6.92 | | | | 7.47 | | | | (0.60 | ) | | | — | | | | (0.60 | ) | | | 35.28 | |
| December 31, 2018 | | | 33.10 | | | | 0.39 | | | | (4.67 | ) | | | (4.28 | ) | | | (0.41 | ) | | | — | | | | (0.41 | ) | | | 28.41 | |
| December 31, 2017 | | | 30.19 | | | | 0.10 | | | | 2.93 | | | | 3.03 | | | | (0.12 | ) | | | — | | | | (0.12 | ) | | | 33.10 | |
| December 31, 2016 | | | 23.97 | | | | 0.15 | | | | 6.30 | | | | 6.45 | | | | (0.23 | ) | | | — | | | | (0.23 | ) | | | 30.19 | |
| December 31, 2015 | | | 31.57 | | | | 0.24 | | | | (5.62 | ) | | | (5.38 | ) | | | (0.31 | ) | | | (1.91 | ) | | | (2.22 | ) | | | 23.97 | |
| (a) | Redemption fees represent less than $.01 on a per share basis. |
| (b) | Calculated using the average shares method. |
| (c) | Portfolio turnover rate is calculated at the Fund level. |
| (d) | Not Annualized. |
| (e) | Annualized. |
| (f) | Total returns would have been lower had various fees and expenses not been waived and reimbursed during the period. |
| (g) | For the period ended June 30, 2020, the portfolio turnover calculation excludes the value of securities purchases of $58,658,022 and sold of $36,894,276 in the effort to realign the Mid Cap Value Fund’s portfolio holdings after the reorganization of the ALPS | WMC Research Value Fund into the Mid Cap Value Fund. See Note 11 in Notes to Financial Statements. |
The accompanying Notes to Financial Statements are an integral part of these Statements.
| | | | RATIOS/SUPPLEMENTAL DATA |
| Total Return | | | Net assets,
end of period
(in thousands) | | | Percentage of
expenses to
average net assets | | | Percentage of net
investment income
(loss) to average
net assets | | | Percentage of
expenses to
average net assets
before waivers | | | Percentage of
expenses to average
net assets
after waivers | | | Percentage of net
investment income
(loss) to average net
assets before waiver | | | Percentage of net
investment income
(loss) to average net
assets after waivers | | | Portfolio
turnover rate(c) | |
| (19.18 | )%(d) | | | 114,480 | | | | 1.29 | % | | | 1.27 | % | | | N/A | | | | N/A | | | | N/A | | | | N/A | | | | 30 | %(d) |
| 18.59 | | | | 166,834 | | | | 1.25 | | | | 0.90 | | | | N/A | | | | N/A | | | | N/A | | | | N/A | | | | 54 | |
| (4.76 | ) | | | 162,524 | | | | 1.20 | | | | 1.21 | | | | N/A | | | | N/A | | | | N/A | | | | N/A | | | | 37 | |
| 12.42 | | | | 199,636 | | | | 1.23 | | | | 1.42 | | | | N/A | | | | N/A | | | | N/A | | | | N/A | | | | 43 | |
| 19.25 | | | | 221,868 | | | | 1.23 | | | | 1.13 | | | | N/A | | | | N/A | | | | N/A | | | | N/A | | | | 49 | |
| (4.16 | ) | | | 245,105 | | | | 1.20 | | | | 0.84 | | | | N/A | | | | N/A | | | | N/A | | | | N/A | | | �� | 40 | |
| | | | | | | | | | | | | | | | | | | | | | | | | | | | | | | | | | |
| (19.06 | )%(d) | | | 25,577 | | | | N/A | | | | N/A | | | | 1.07 | %(e) | | | 0.99 | %(e) | | | 1.58 | %(e) | | | 1.58 | %(e) | | | 30 | %(d) |
| 18.91 | (f) | | | 33,104 | | | | N/A | | | | N/A | | | | 1.02 | | | | 0.99 | | | | 1.12 | | | | 1.15 | | | | 54 | |
| (4.55 | ) | | | 29,677 | | | | N/A | | | | N/A | | | | 0.98 | | | | 0.98 | | | | 1.43 | | | | 1.43 | | | | 37 | |
| 12.69 | (f) | | | 34,401 | | | | N/A | | | | N/A | | | | 1.01 | | | | 0.99 | | | | 1.70 | | | | 1.72 | | | | 43 | |
| 19.54 | (f) | | | 42,256 | | | | N/A | | | | N/A | | | | 1.00 | | | | 0.99 | | | | 1.36 | | | | 1.37 | | | | 49 | |
| (3.92 | ) | | | 47,178 | | | | N/A | | | | N/A | | | | 0.94 | | | | 0.94 | | | | 1.05 | | | | 1.05 | | | | 40 | |
| | | | | | | | | | | | | | | | | | | | | | | | | | | | | | | | | | |
| (17.32 | )%(d)(f) | | | 48,851 | | | | N/A | | | | N/A | | | | 1.53 | %(e) | | | 1.12 | %(e) | | | 1.56 | %(e) | | | 1.56 | %(e) | | | 51 | %(d)(g) |
| 25.30 | (f) | | | 7,627 | | | | N/A | | | | N/A | | | | 2.11 | | | | 1.25 | | | | 0.12 | | | | 0.98 | | | | 62 | |
| (8.58 | )(f) | | | 5,390 | | | | N/A | | | | N/A | | | | 2.37 | | | | 1.25 | | | | 0.31 | | | | 1.43 | | | | 49 | |
| 8.11 | (f) | | | 4,823 | | | | N/A | | | | N/A | | | | 2.50 | | | | 1.25 | | | | (0.42 | ) | | | 0.83 | | | | 51 | |
| 28.67 | (f) | | | 3,998 | | | | N/A | | | | N/A | | | | 3.22 | | | | 1.25 | | | | (1.13 | ) | | | 0.84 | | | | 76 | |
| (7.08 | )(f) | | | 2,853 | | | | N/A | | | | N/A | | | | 3.55 | | | | 1.25 | | | | (1.40 | ) | | | 0.90 | | | | 46 | |
| | | | | | | | | | | | | | | | | | | | | | | | | | | | | | | | | | |
| (17.28 | )%(d)(f) | | | 7,470 | | | | N/A | | | | N/A | | | | 1.52 | %(e) | | | 0.91 | %(e) | | | 1.67 | %(e) | | | 1.67 | %(e) | | | 51 | %(d)(g) |
| 25.58 | (f) | | | 7,320 | | | | N/A | | | | N/A | | | | 1.86 | | | | 0.99 | | | | 0.42 | | | | 1.30 | | | | 62 | |
| (8.28 | )(f) | | | 3,211 | | | | N/A | | | | N/A | | | | 2.28 | | | | 0.99 | | | | 0.39 | | | | 1.68 | | | | 49 | |
| 8.37 | (f) | | | 2,823 | | | | N/A | | | | N/A | | | | 2.45 | | | | 0.99 | | | | (0.37 | ) | | | 1.09 | | | | 51 | |
| 28.97 | (f) | | | 2,689 | | | | N/A | | | | N/A | | | | 3.46 | | | | 0.99 | | | | (1.33 | ) | | | 1.14 | | | | 76 | |
| (6.89 | )(f) | | | 1,723 | | | | N/A | | | | N/A | | | | 3.41 | | | | 0.99 | | | | (1.36 | ) | | | 1.06 | | | | 46 | |
| | | | | | | | | | | | | | | | | | | | | | | | | | | | | | | | | | |
| (12.23 | )%(d) | | | 227,245 | | | | 1.24 | % | | | 1.13 | % | | | N/A | | | | N/A | | | | N/A | | | | N/A | | | | 60 | %(d) |
| 26.02 | | | | 279,737 | | | | 1.19 | | | | 1.48 | | | | N/A | | | | N/A | | | | N/A | | | | N/A | | | | 51 | |
| (13.13 | ) | | | 259,304 | | | | 1.18 | | | | 0.94 | | | | N/A | | | | N/A | | | | N/A | | | | N/A | | | | 71 | |
| 9.81 | | | | 352,173 | | | | 1.19 | | | | 0.13 | | | | N/A | | | | N/A | | | | N/A | | | | N/A | | | | 75 | |
| 26.77 | | | | 426,486 | | | | 1.19 | | | | 0.56 | | | | N/A | | | | N/A | | | | N/A | | | | N/A | | | | 77 | |
| (17.41 | ) | | | 536,809 | | | | 1.16 | | | | 0.53 | | | | N/A | | | | N/A | | | | N/A | | | | N/A | | | | 22 | |
| | | | | | | | | | | | | | | | | | | | | | | | | | | | | | | | | | |
| (12.13 | )%(d) | | | 75,433 | | | | N/A | | | | N/A | | | | 1.01 | %(e) | | | 0.99 | %(e) | | | 1.34 | %(e) | | | 1.34 | %(e) | | | 60 | %(d) |
| 26.29 | | | | 64,446 | | | | N/A | | | | N/A | | | | 0.98 | | | | 0.98 | | | | 1.67 | | | | 1.67 | | | | 51 | |
| (12.93 | ) | | | 54,169 | | | | N/A | | | | N/A | | | | 0.95 | | | | 0.95 | | | | 1.15 | | | | 1.15 | | | | 71 | |
| 10.04 | | | | 69,506 | | | | N/A | | | | N/A | | | | 0.97 | | | | 0.97 | | | | 0.33 | | | | 0.33 | | | | 75 | |
| 26.89 | | | | 109,010 | | | | N/A | | | | N/A | | | | 0.97 | | | | 0.97 | | | | 0.61 | | | | 0.61 | | | | 77 | |
| (17.20 | ) | | | 514,613 | | | | N/A | | | | N/A | | | | 0.90 | | | | 0.90 | | | | 0.81 | | | | 0.81 | | | | 22 | |
The accompanying Notes to Financial Statements are an integral part of these Statements.
FINANCIAL HIGHLIGHTS (CONTINUED)
| | | INCOME FROM INVESTMENT OPERATIONS(a) | | | DISTRIBUTIONS | | | | |
| | | | | | | | | | | | Total income | | | | | | | | | | | | | |
| | | | | | | | | Net realized and | | | (loss) from | | | Distributions | | | Distributions from | | | | | | | |
| | | Net asset value, | | | Net investment | | | unrealized gains | | | investment | | | from net | | | net realized gains | | | Total | | | Net asset value, | |
| | | beginning of period | | | income (loss)(a)(b) | | | (losses) | | | operations | | | investment income | | | on investments | | | distributions | | | end of period | |
| VALUE FUND | | | | | | | | | | | | | | | | | | | | | | | | |
| Investor Class | | | | | | | | | | | | | | | | | | | | | | | | |
| June 30, 2020 (Unaudited) | | $ | 38.54 | | | $ | 0.08 | | | $ | (6.15 | ) | | $ | (6.07 | ) | | $ | — | | | $ | — | | | $ | — | | | $ | 32.47 | |
| December 31, 2019 | | 33.70 | | | 0.10 | | | 5.94 | | | 6.04 | | | (0.11 | ) | | (1.09 | ) | | (1.20 | ) | | 38.54 | |
| December 31, 2018 | | 41.18 | | | 0.08 | | | (5.12 | ) | | (5.04 | ) | | (0.06 | ) | | (2.38 | ) | | (2.44 | ) | | 33.70 | |
| December 31, 2017 | | 40.41 | | | 0.05 | | | 3.37 | | | 3.42 | | | (0.04 | ) | | (2.61 | ) | | (2.65 | ) | | 41.18 | |
| December 31, 2016 | | 35.98 | | | (0.04 | ) | | 5.91 | | | 5.87 | | | — | | | (1.44 | ) | | (1.44 | ) | | 40.41 | |
| December 31, 2015 | | 43.73 | | | 0.15 | | | (4.93 | ) | | (4.78 | ) | | (0.14 | ) | | (2.83 | ) | | (2.97 | ) | | 35.98 | |
| Institutional Class | | | | | | | | | | | | | | | | | | | | | | | | |
| June 30, 2020 (Unaudited) | | 39.36 | | | 0.11 | | | (6.29 | ) | | (6.18 | ) | | — | | | — | | | — | | | 33.18 | |
| December 31, 2019 | | 34.40 | | | 0.17 | | | 6.06 | | | 6.23 | | | (0.18 | ) | | (1.09 | ) | | (1.27 | ) | | 39.36 | |
| December 31, 2018 | | 41.98 | | | 0.15 | | | (5.22 | ) | | (5.07 | ) | | (0.13 | ) | | (2.38 | ) | | (2.51 | ) | | 34.40 | |
| December 31, 2017 | | 41.15 | | | 0.14 | | | 3.42 | | | 3.56 | | | (0.12 | ) | | (2.61 | ) | | (2.73 | ) | | 41.98 | |
| December 31, 2016 | | 36.56 | | | 0.02 | (f) | | 6.01 | | | 6.03 | | | — | | | (1.44 | ) | | (1.44 | ) | | 41.15 | |
| December 31, 2015 | | 44.39 | | | 0.22 | | | (5.01 | ) | | (4.79 | ) | | (0.21 | ) | | (2.83 | ) | | (3.04 | ) | | 36.56 | |
| (a) | Redemption fees represent less than $.01 on a per share basis. |
| (b) | Calculated using the average shares method. |
| (c) | Portfolio turnover rate is calculated at the Fund level. |
| (d) | Not Annualized. |
| (e) | Annualized. |
| (f) | The amount shown for a share outstanding throughout the period may not correlate with the Statements of Operations for the period due to timing of sales and redemptions of Fund shares in relation to income earned and/or fluctuating value of the investments of the Fund. |
The accompanying Notes to Financial Statements are an integral part of these Statements.
| | | | RATIOS/SUPPLEMENTAL DATA | |
| Total Return | | | Net assets,
end of period
(in thousands) | | | Percentage of
expenses to
average net
assets | | | Percentage of
net investment
income
(loss) to average
net assets | | | Percentage of
expenses to
average net
assets
before waivers | | | Percentage of
expenses to
average net
assets
after waivers | | | Percentage of
net investment
income (loss)
to average net
assets before waiver | | | Percentage of
net investment
income (loss)
to average net
assets after waivers | | | Portfolio
turnover rate(c) | |
| (15.75 | )%(d) | | $ | 473,896 | | | | 1.16 | % | | | 0.48 | % | | | N/A | | | | N/A | | | | N/A | | | | N/A | | | | 26 | %(d) |
| 17.96 | | | | 598,325 | | | | 1.10 | | | | 0.26 | | | | N/A | | | | N/A | | | | N/A | | | | N/A | | | | 42 | |
| (12.15 | ) | | | 570,608 | | | | 1.07 | | | | 0.19 | | | | N/A | | | | N/A | | | | N/A | | | | N/A | | | | 37 | |
| 8.42 | | | | 726,558 | | | | 1.09 | | | | 0.12 | | | | N/A | | | | N/A | | | | N/A | | | | N/A | | | | 35 | |
| 16.31 | | | | 776,071 | | | | 1.09 | | | | (0.11 | ) | | | N/A | | | | N/A | | | | N/A | | | | N/A | | | | 47 | |
| (11.04 | ) | | | 786,936 | | | | 1.06 | | | | 0.36 | | | | N/A | | | | N/A | | | | N/A | | | | N/A | | | | 52 | |
| (15.70 | )%(d) | | | 47,963 | | | | N/A | | | | N/A | | | | 0.97 | %(e) | | | 0.97 | %(e) | | | 0.67 | %(e) | | | 0.67 | %(e) | | | 26 | %(d) |
| 18.14 | | | | 55,832 | | | | N/A | | | | N/A | | | | 0.92 | | | | 0.92 | | | | 0.43 | | | | 0.43 | | | | 42 | |
| (11.98 | ) | | | 62,531 | | | | N/A | | | | N/A | | | | 0.90 | | | | 0.90 | | | | 0.36 | | | | 0.36 | | | | 37 | |
| 8.59 | | | | 73,924 | | | | N/A | | | | N/A | | | | 0.91 | | | | 0.91 | | | | 0.34 | | | | 0.34 | | | | 35 | |
| 16.52 | | | | 61,543 | | | | N/A | | | | N/A | | | | 0.92 | | | | 0.92 | | | | 0.04 | | | | 0.04 | | | | 47 | |
| (10.90 | ) | | | 58,914 | | | | N/A | | | | N/A | | | | 0.91 | | | | 0.91 | | | | 0.52 | | | | 0.52 | | | | 52 | |
The accompanying Notes to Financial Statements are an integral part of these Statements.
NOTES TO FINANCIAL STATEMENTS (UNAUDITED)
June 30, 2020
Heartland Group, Inc. (the “Corporation”) is registered as an open-end management investment company under the Investment Company Act of 1940 (the “1940 Act”), as amended. The capital shares of the Select Value Fund, Mid Cap Value Fund, Value Plus Fund, and Value Fund (each a “Fund” and collectively, the “Funds”, with 150,000,000 shares authorized and a par value of $.001 per share), each of which is a diversified fund, are issued by the Corporation. The Funds offer Investor Class and Institutional Class shares. Heartland Advisors, Inc. (the “Advisor”) serves as investment advisor to the Corporation.
Under the Corporation’s organizational documents, its Officers and Directors are indemnified against certain liabilities arising out of the performance of their duties to the Corporation. In addition, in the normal course of business, the Corporation enters into contracts with its vendors and others that provide for general indemnifications. The Corporation’s maximum exposure under these arrangements is unknown, as this would involve future claims that may be made against the Corporation.
| (2) | SUMMARY OF SIGNIFICANT ACCOUNTING POLICIES |
The following is a summary of significant accounting policies followed by the Funds in the preparation of the financial statements. Each Fund is considered an investment company for financial reporting purposes under Generally Accepted Accounting Principles (“GAAP”). The Funds have applied the guidance of Financial Accounting Standards Board (“FASB”) Accounting Standards Codification Topic 946 (“ASC 946”).
| (a) | Portfolio securities traded on a national securities exchange or in the over-the-counter market are valued at the closing price on the principal exchange or market as of the close of regular trading hours on the day the securities are being valued, or, closing price on the composite market. Lacking any trades, securities are valued at the mean between the most recent quoted bid and asked prices on the principal exchange or market. Foreign securities are valued on the basis of quotations from the primary market in which they are traded, and are translated from the local currency into U.S. dollars using exchange rates as of the close of the New York Stock Exchange (“NYSE”) or using methods determined by the Board of Directors of the Corporation (the “Board”). The Funds may use a systematic fair valuation model provided by an independent pricing service to value foreign equity securities in order to capture events occurring between the time a foreign exchange closes and the close of the NYSE that may affect the value of the Funds’ securities traded on those foreign exchanges. These are generally categorized as Level 2 under GAAP. Debt securities having maturities of 60 days or less and short-term investments may be valued at acquisition cost, which approximates fair value, plus or minus any amortization or accretion, if applicable. Securities and other assets for which quotations are not readily available, deemed unreliable, or have facts and circumstances that indicate otherwise, are valued at their fair value using methods determined by the Board. The Pricing Committee for the Corporation may also make a fair value determination if it reasonably determines that a significant event, which materially affects the value of a security, occurs after the time at which the market price for the security is determined, but prior to the time at which a Fund’s net asset value is calculated. Fair valuation of a particular security is an inherently subjective process, with no single standard to utilize when determining a security’s fair value. As such, different mutual funds could reasonably arrive at a different fair value price for the same security. In each case where a security is fair valued, consideration is given to the facts and circumstances relevant to the particular situation. This consideration includes reviewing various factors set forth in the pricing procedures adopted by the Board and other factors as warranted. In making a fair value determination, factors that may be considered, among others, include: the type and structure of the security; unusual events or circumstances relating to the security’s issuer; general market conditions; prior day’s valuation; fundamental analytical data; size of the holding; cost of the security on the date of purchase; nature and duration of any restriction on disposition; trading activities; and prices of similar securities or financial instruments. |
| (b) | The Funds’ policy is to comply with the requirements of the Internal Revenue Code that are applicable to regulated investment companies (“RICs”) and to distribute substantially all of their taxable income to their shareholders. The Funds accordingly pay no Federal income taxes, and no Federal income tax provision is recorded. |
| (c) | Net investment income, if any, is distributed to each shareholder as a dividend. Dividends from the Funds are declared and paid at least annually. Dividends from the Funds are recorded on ex-date and determined in accordance with tax regulations. Net realized gains on investments, if any, are distributed at least annually. During the fiscal year ended December 31, 2019, the Funds utilized earnings and profits distributions to shareholders on redemption of shares as part of the dividends paid deduction for income tax purposes. GAAP requires that permanent financial reporting and tax differences be reclassified based on their characterization for federal income tax purposes. Accordingly, at December 31, 2019, the following reclassifications were made to increase (decrease) such amounts: |
| FUND | | TOTAL DISTRIBUTABLE EARNINGS | | | PAID-IN CAPITAL | |
| SELECT VALUE FUND | | $ | (1,758,894 | ) | | $ | 1,758,894 | |
| MID CAP VALUE FUND | | | (25,228 | ) | | | 25,228 | |
| VALUE PLUS FUND | | | (51,293 | ) | | | 51,293 | |
| VALUE FUND | | | (2,506,949 | ) | | | 2,506,949 | |
These reclassifications are primarily due to the use of tax equalization. Total net assets are not affected by these reclassifications.
| (d) | For financial reporting purposes, transactions are accounted for on trade date on the last business day of the reporting period. Net realized gains and losses on investments are computed on the identified cost basis. The portion of security gains and losses resulting from changes in foreign exchange rates is disclosed in the Statements of Operations. Dividend income is recognized on the ex-dividend date, and interest income is recognized on an accrual basis. Certain dividends from foreign securities will be recorded as soon as the Corporation is informed of the dividend, if such information is obtained subsequent to the ex-dividend date. The Funds amortize premium and accrete discount on investments utilizing the effective interest method. Foreign dividend income may be subject to foreign withholding taxes. Withholding taxes on foreign dividends have been provided for in accordance with the Funds’ understanding of the applicable country’s tax rules and regulations. |
| (e) | Investment income and realized and unrealized gains or losses on investments, options, and translation of assets in foreign currency are allocated to each Fund’s share class based on their respective net assets. The Funds and share classes are charged for those expenses that are directly attributable to them. Expenses that are not directly attributable to any one Fund are typically allocated among the Funds and respective share classes in proportion to their respective net assets, number of open shareholder accounts, number of funds, or some combination thereof, as applicable. |
| (f) | The Funds may invest a portion of their assets in Real Estate Investment Trusts (“REITs”) and are subject to certain risks associated with direct investment in REITs. REITs may be affected by changes in the value of their underlying properties and by defaults by borrowers or tenants. REITs depend generally on their ability to generate cash flow to make distributions to shareowners, and certain REITs have self-liquidation provisions by which mortgages held may be paid in full and distributions of capital returns may be made at any time. In addition, the performance of a REIT may be affected by its failure to qualify for tax-free pass-through of income under the Internal Revenue Code of 1986, as amended (the “Code”), or its failure to maintain exemption from registration under the 1940 Act. A Fund’s investments in REITs may result in such Fund’s receipt of cash in excess of the REITs’ earnings. If the Fund receives such distributions all or a portion of these distributions will constitute a return of capital to such Fund. Receiving a return of capital distribution from REITs will reduce the amount of income available to be distributed to Fund shareholders. Income from REITs may not be eligible for treatment as qualified dividend income. As the final character of the distributions may not be known until reported by the REITs on their 1099s, the Funds may utilize an estimate for the current year character of distributions. |
| (g) | As of June 30, 2020, the Funds did not hold any securities classified as illiquid as defined pursuant to the Corporation’s Liquidity Risk Management Program (the “LRMP”). |
| (h) | Certain securities exempt from registration or issued in transactions exempt from registration under the Securities Act of 1933, as amended (the “Act”), such as securities issued pursuant to the resale limitations provided under Rule 144A or Regulation S under the Act, may be considered to be liquid under the LRMP. As of June 30, 2020, the Funds did not hold any restricted securities. |
| (i) | The Funds isolate the portion of the results of operations from changes in foreign exchange rates on investments from those resulting in market prices of securities held. Reported net realized foreign exchange gains or losses arise from sales of portfolio securities, sales and maturities of short-term securities, sales of foreign currencies, currency gains or losses realized between trade and settlement date on securities transactions, and the difference between the amounts of dividends, interest, and foreign withholding taxes recorded on the respective Fund’s books, and the U.S. dollar equivalent of the amounts actually received or paid. Net unrealized foreign exchange gains and losses arise from changes in the values of assets and liabilities, including investments in securities at the period end, resulting from changes in the exchange rate. Foreign markets can be more volatile than the U.S. market due to increased risks of adverse political, social, regulatory, and economic developments. Foreign security prices can be affected by exchange rate and foreign currency fluctuations, less publicly available information, and different accounting, auditing, legal, and financial standards. Foreign investments may also be less liquid than investments in U.S. issuers. This risk may be heightened in emerging or developing markets. Foreign securities usually are generally denominated and traded in foreign currencies, while the Funds value assets in U.S. dollars. The exchange rates between foreign currencies and the U.S. dollar fluctuate continuously. As a result, the values of the Funds’ non-U.S. investments will be affected favorably or unfavorably by changes in currency exchange rates relative to the U.S. dollar. |
| (j) | The accompanying financial statements were prepared in conformity with GAAP, which requires management to make estimates and assumptions that affect the reported amounts of assets and liabilities and disclosure of contingent assets and liabilities at the date of the financial statements and the reported amounts of revenues and expenses during the reporting period. Actual results could differ from these estimates. |
| (3) | FAIR VALUE MEASUREMENTS |
The Funds follow GAAP, under which various inputs are used in determining the value of the Funds’ investments.
The basis of the hierarchy is dependent upon the various “inputs” used to determine the value of the Funds’ investments. These inputs are summarized in the three broad levels listed below:
| · | Level 1 - Unadjusted quoted prices in active markets for identical assets or liabilities that a Fund has the ability to access at the measurement date. |
| · | Level 2 - Other significant observable inputs include quoted prices which are not active, quoted prices for similar assets or liabilities in active markets, or input other than quoted prices that are observable (either directly or indirectly) for the asset or liability. Includes portfolio securities and other financial instruments lacking any sales referenced in Note 2. |
| · | Level 3 - Significant unobservable prices or inputs (includes the Board’s and Pricing Committee’s own assumptions in determining the fair value of investments). |
The inputs or methodology used for valuing securities are not necessarily an indication of the risk associated with investing in those securities.
The following is a summary of the inputs used to value the Funds’ investments as of June 30, 2020:
| SELECT VALUE FUND | | | | | | | | | | | | |
| | | Level 1 - Quoted and | | | Level 2 - Other Significant | | | Level 3 - Significant | | | | |
| Investments in Securities at Value | | Unadjusted Prices | | | Observable Inputs(a) | | | Unobservable Inputs(b) | | | Total | |
| Common Stocks | | $ | 138,248,646 | | | $ | – | | | $ | – | | | $ | 138,248,646 | |
| Short-Term Investments | | | 486,097 | | | | – | | | | – | | | | 486,097 | |
| Total | | $ | 138,734,743 | | | $ | – | | | $ | – | | | $ | 138,734,743 | |
| | | | | | | | | | | | | | | | | |
| MID CAP VALUE FUND | | | | | | | | | | | | | | | | |
| | | | Level 1 - Quoted and | | | | Level 2 - Other Significant | | | | Level 3 - Significant | | | | | |
| Investments in Securities at Value | | | Unadjusted Prices | | | | Observable Inputs(a) | | | | Unobservable Inputs(b) | | | | Total | |
| Common Stocks | | $ | 56,148,172 | | | $ | – | | | $ | – | | | $ | 56,148,172 | |
| Short-Term Investments | | | 81,961 | | | | – | | | | – | | | | 81,961 | |
| Total | | $ | 56,230,133 | | | $ | – | | | $ | – | | | $ | 56,230,133 | |
| | | | | | | | | | | | | | | | | |
| VALUE PLUS FUND | | | | | | | | | | | | | | | | |
| | | | Level 1 - Quoted and | | | | Level 2 - Other Significant | | | | Level 3 - Significant | | | | | |
| Investments in Securities at Value | | | Unadjusted Prices | | | | Observable Inputs(a) | | | | Unobservable Inputs(b) | | | | Total | |
| Common Stocks | | $ | 298,544,926 | | | $ | – | | | $ | – | | | $ | 298,544,926 | |
| Short-Term Investments | | | 3,390,034 | | | | – | | | | – | | | | 3,390,034 | |
| Total | | $ | 301,934,960 | | | $ | – | | | $ | – | | | $ | 301,934,960 | |
| VALUE FUND | | | | | | | | | | | | |
| | | Level 1 - Quoted and | | | Level 2 - Other Significant | | | Level 3 - Significant | | | | |
| Investments in Securities at Value | | Unadjusted Prices | | | Observable Inputs(a) | | | Unobservable Inputs(b) | | | Total | |
| Common Stocks | | $ | 515,496,721 | | | $ | 3,258,411 | | | $ | – | | | $ | 518,755,132 | |
| Short-Term Investments | | | 1,798,842 | | | | – | | | | – | | | | 1,798,842 | |
| Investments purchased with cash collateral from securities loaned | | | 718,250 | | | | – | | | | – | | | | 718,250 | |
| Total | | $ | 521,272,224 | | | $ | – | | | $ | – | | | $ | 521,272,224 | |
| | | | | | | | | | | | | | | | | |
| Other Financial Instruments(c) | | | | | | | | | | | | | | | | |
| Liabilities | | | | | | | | | | | | | | | | |
| Written Options | | $ | (174,945 | ) | | $ | – | | | $ | – | | | $ | (174,945 | ) |
| Total | | $ | (174,945 | ) | | $ | – | | | $ | – | | | $ | (174,945 | ) |
| (a) | For detailed industry descriptions and securities identified as Level 2 within the hierarchy, see the accompanying Schedules of Investments. |
| (b) | The Funds measure Level 3 activity as of the beginning and end of the financial period. For the six month period ended June 30, 2020, the Funds did not have significant unobservable inputs (Level 3) used in determining fair value. Therefore, a reconciliation of assets in which significant unobservable inputs (Level 3) were used in determining fair value is not applicable. |
| (c) | Other financial instruments are derivative instruments not reflected in the Schedules of Investments, such as covered calls. |
| (4) | DERIVATIVE INSTRUMENTS |
GAAP requires enhanced disclosure about the Funds’ derivative and hedging activities, including how such activities are accounted for and their effects on the Funds’ financial position, performance, and cash flows. The Funds may invest in a broad array of financial instruments and securities, the value of which is “derived” from the performance of an underlying asset or a “benchmark” such as a security index, an interest rate, or a currency. In particular, each Fund may engage in transactions in options, and options on futures contracts (a) to hedge against anticipated declines in the market value of its portfolio securities or currencies and against increases in the market values of securities or currencies it intends to acquire, (b) to manage exposure to changing interest rates (duration management), (c) to enhance total return, or (d) to invest in eligible asset classes with a greater efficiency and lower cost than is possible through direct investment.
Options can be highly volatile investments and involve certain risks. These strategies require the ability to anticipate future movements in securities prices, interest rates, currency exchange rates, and other economic factors. Attempts to use such investments may not be successful and could result in reduction of a Fund’s total return. Each Fund could experience losses if the prices of its options positions move in a direction different than anticipated, or if the Fund were unable to close out its positions due to disruptions in the market or lack of liquidity. Over-the-counter options generally involve greater credit and liquidity risks than exchange-traded options. Options traded on foreign exchanges generally are not regulated by U.S. authorities, and may offer less liquidity and less protection to a Fund if the other party to the contract defaults.
The Funds’ use of options and other investment techniques for hedging purposes involves the risk that changes in the value of a hedging investment will not match those of the asset or security being hedged. Hedging is the use of one investment to offset the effects of another investment. Imperfect or no correlation of the values of the hedging instrument and the hedged security or asset might occur because of characteristics of the instruments themselves or unrelated factors involving, for example, the markets on which the instruments are traded. As a result, hedging strategies may not always be successful. While hedging strategies can help reduce or eliminate portfolio losses, they can also reduce or eliminate portfolio gains.
OPTIONS CONTRACTS
The Funds may enter into options transactions for hedging purposes and will not use these instruments for speculation. Each Fund may write covered put and call options on any securities or futures contracts in which it may invest, on any securities index based on or related to securities in which it may invest, or on any currency in which Fund investments may be denominated. A call option on an asset written by a Fund obligates the Fund to sell the specified asset to the holder (purchaser) at a stated price (the exercise price) if the option is exercised before a specified date (the expiration date). A put option on an asset written by a Fund obligates the Fund to buy the specified asset from the purchaser at the exercise price if the option is exercised before the expiration date. Premiums received when writing options are recorded as liabilities and are subsequently adjusted to the current value of the options written. Premiums received from writing options that expire are treated as realized gains. Premiums received from writing options, which are either exercised or closed, are offset against the proceeds received or amount paid on the transaction to determine realized gains or losses. Each Fund may also purchase put options on any securities or futures contracts in which it may invest, on any securities index based on or related to securities in which it may invest, or on any currency in which Fund investments may be denominated. A Fund may enter into closing transactions with respect to such options by writing an option identical to the one it has purchased (for exchange-listed options) or by entering into an offsetting transaction with the counterparty to such option (for OTC options). A Fund may also exercise such options or allow them to expire. The monthly average notional amount and monthly average number of contracts of written options held by the Value Fund during the six month period ended June 30, 2020 was $10,431,514 and 5,821, respectively.
Statements of Assets and Liabilities - Fair Value of Derivative Instruments as of June 30, 2020:
| VALUE FUND | | Statements of Assets and Liabilities Location | | | Fair Value | |
| Liability Derivatives | | | | | | | |
| Equity Contracts (Written Options) | | Written options, at value | | | $ | (174,945 | ) |
| Total | | | | | $ | (174,945 | ) |
The effect of derivatives instruments on the Statements of Operations for the six month period ended June 30, 2020:
| | | Location of Gain (Losses) on | | Realized Gain on Derivatives | | | Change in Unrealized Loss on | |
| VALUE FUND | | Derivatives Recognized in Income | | Recognized in Income | | | Derivatives Recognized in Income | |
| Equity Contracts (Written Options) | | Net realized gains (losses) on written options / Net change in unrealized appreciation (depreciation) on written options | | $ | 926,207 | | | $ | 516,016 | |
| Total | | | | $ | 926,207 | | | $ | 516,016 | |
OFFSETTING ARRANGEMENTS
Certain derivative contracts are executed under either standardized netting agreements or, for exchange-traded derivatives, the relevant contracts for a particular exchange which contain enforceable netting provisions. A derivative netting arrangement creates an enforceable right of set-off that becomes effective, and affects the realization of settlement on individual assets and liabilities, only following a specified event of default or early termination. The following table presents derivative financial instruments that are subject to enforceable netting arrangements or other similar agreements as of June 30, 2020.
| | | | GROSS AMOUNTS OF | | | | GROSS AMOUNTS
OFFSET IN THE
STATEMENTS OF | | | | NET AMOUNTS
PRESENTED IN THE
STATEMENTS OF | | | GROSS AMOUNTS NOT OFFSET IN THE
STATEMENT OF FINANCIAL POSITION | |
| DESCRIPTION | | | RECOGNIZED
LIABILITIES | | | | ASSETS AND
LIABILITIES | | | | ASSETS AND
LIABILITIES | | | | FINANCIAL
INSTRUMENTS | | | | CASH COLLATERAL
PLEDGED(1) | | | | NET AMOUNT | |
| VALUE FUND | | | | | | | | | | | | | | | | | | | | | | | | |
| Written Options (counterparty, Susquehanna) | | $ | 174,945 | | | $ | – | | | $ | 174,945 | | | $ | (174,945 | ) | | $ | – | | | $ | – | |
| Total | | $ | 174,945 | | | $ | – | | | $ | 174,945 | | | $ | (174,945 | ) | | $ | – | | | $ | – | |
| (1) | The amount is limited to the derivative liability balance and, accordingly, does not include excess collateral pledged. |
The Funds have entered into an agreement with Brown Brothers Harriman & Co. (the “Lending Agent”), dated November 30, 2011, as amended (“Securities Lending Agreement”), to provide securities lending services to the Funds. Under this program, the proceeds (cash collateral) received from borrowers are used to invest in money market funds. Under the Securities Lending Agreement, the borrowers may pay the Funds negotiated lender fees and the Funds receive cash collateral in an amount equal to not less than 102% of the value of loaned securities. The borrower pays fees at the Funds’ direction to the Lending Agent. Although the risk of lending is generally mitigated by the collateral, the Funds could experience a delay in recovering securities and a possible loss of income or value if the borrower fails to return them. The agreement provides the right in the event of default for the non-defaulting party to liquidate the collateral and calculate a net exposure to the defaulting party or request additional collateral. In the event that a borrower defaults, the Funds, as lender, would offset the market value of the collateral received against the market value of the securities loaned. When the value of the collateral is greater than that of the market value of the securities loaned, the lender is left with a net amount payable to the defaulting party. However, bankruptcy or insolvency laws of a particular jurisdiction may impose restrictions on or prohibitions against such a right of offset in the event of a counterparty’s bankruptcy or insolvency. Under the agreement, the borrower can resell or re-pledge the loaned securities, and the Funds can reinvest cash collateral, or, upon an event of default, resell or re-pledge the collateral. As of June 30, 2020, only the Value Fund had securities on loan.
The following table indicates the total amount of securities loaned by type, reconciled to gross liability payable upon return of the securities loaned by the Funds as of June 30, 2020:
| | | REMAINING CONTRACTUAL MATURITY OF THE LENDING AGREEMENT | |
| | | OVERNIGHT & | | | | | | | | | GREATER THAN | | | | |
| VALUE FUND | | CONTINUOUS | | | UP TO 30 DAYS | | | 30-90 DAYS | | | 90 DAYS | | | TOTAL | |
| Securities Lending Transactions | | | | | | | | | | | | | | | | | | | | |
| Common Stocks (counterparty, Barclays Capital, Inc.) | | $ | 457,328 | | | $ | – | | | $ | – | | | $ | – | | | $ | 457,328 | |
| Common Stocks (counterparty, UBS Securities, LLC) | | | 227,815 | | | | – | | | | – | | | | – | | | | 227,815 | |
| Total Loans | | | | | | | | | | | | | | | | | | $ | 685,143 | |
| Gross amount of recognized liabilities for securities lending (collateral received) | | | | | | | | | | | | | | | | | | $ | 718,250 | |
| Amounts due to counterparty | | | | | | | | | | | | | | | | | | $ | 33,107 | |
| (6) | INVESTMENT MANAGEMENT FEES AND TRANSACTIONS WITH RELATED PARTIES |
The Corporation entered into investment advisory agreements with the Advisor to serve as investment advisor and manager to the Funds (the “Advisory Agreements”). Under the terms of the Advisory Agreements, the Select Value Fund pays the Advisor a monthly management fee at the annual rate of 0.75% of the average daily net assets of the Fund up to $1 billion and at an annual rate of 0.70% of the average daily net assets in excess of $1 billion. The Mid Cap Value Fund pays the Advisor a monthly management fee at the annual rate of 0.75% of the average daily net assets, the Value Plus Fund pays the Advisor a monthly management fee at the annual rate of 0.70% of the average daily net assets, and the Value Fund pays the Advisor a monthly management fee at the annual rate of 0.75% of the average daily net assets.
The Advisor previously contractually agreed to waive its management fees and/or reimburse expenses of the Mid Cap Value Fund to ensure that the Fund’s total annual fund operating expenses do not exceed 1.25% of the Fund’s average daily net assets for the Investor Class Shares and 0.99% for the Institutional Class Shares. Effective March 16, 2020, the Advisor agreed to amend its current operating expense limitation agreement to lower the total expense ratio of the Mid Cap Value Fund to 1.10% for the Investor Class and 0.85% for the Institutional Class through at least May 1, 2022, subject thereafter to annual renewal of the agreement by the Board. The operating expense limitation agreement can be terminated only with the consent of the Board. For the six month period ended June 30, 2020, expenses of $62,775 for Investor Class and $21,049 for Institutional Class were waived by the Advisor. The Advisor may not recoup amounts previously waived or reimbursed.
The Advisor has voluntarily agreed to waive fees and/or reimburse certain expenses with respect to the Institutional Class Shares of the Select Value Fund, Value Plus Fund, and Value Fund, to the extent necessary to maintain the Institutional Class total annual fund operating expenses at a ratio of 0.99% of average daily net assets. During the six month period ended June 30, 2020, Institutional class expenses of $10,105 for the Select Value Fund and $5,968 for the Value Plus Fund were waived by the Advisor. This voluntary waiver/reimbursement may be discontinued at any time. The Advisor may not recoup amounts previously waived or reimbursed.
The Corporation has adopted a Distribution Plan pursuant to Rule 12b-1 under the Investment Company Act of 1940, as amended (the “Plan”). Pursuant to the Plan, the Investor Class pays the Funds’ distributor, ALPS Distributors, Inc. (the “Distributor”), an amount up to 0.25% of the average daily net assets of the Investor Class Shares of such Fund (limited to actual costs incurred), computed on an annual basis and paid monthly, for distributing Fund shares and providing shareholder services. Any fees paid to the Distributor under the Plan that are not used during a calendar year are reimbursed to the respective Fund. Institutional Class shares are not subject to 12b-1 fees. During the six month period ended June 30, 2020, $102,376 of distribution related expenses incurred by the Advisor were reimbursed by fees collected under the Plan. The Advisor and/or Distributor may also contractually commit to pay these fees to other third parties who agree to provide various services to their customers who hold Fund shares. Fees paid pursuant to any such contractual commitment are not subject to reimbursement. The Distributor receives a fee for providing distribution services based on an annual rate of $225,000 for all Funds, plus 1/10 basis point for each Fund’s annual net assets.
Transfer agent and fund accounting services are provided by ALPS Fund Services, Inc. (“ALPS”). ALPS is an affiliate of the Distributor. From its own assets, the Advisor may pay retirement plan service providers, brokers, banks, financial advisors, and other financial intermediaries’ fees for providing recordkeeping, sub-accounting, marketing, and other administrative services to their customers in connection with investment in the Funds. These fees may be in addition to any distribution, administrative, or shareholder servicing fees paid from the Funds’ assets to these financial intermediaries.
Officers and certain directors of the Corporation are also officers and/or directors of the Advisor; however, they receive no compensation from the Funds.
To discourage market timing and other short-term trading, certain shares of the Select Value Fund, Mid Cap Value Fund, Value Plus Fund, and Value Fund that are redeemed or exchanged within 10 days are assessed a 2% fee on the current net asset value of the shares. The fee applies to shares being redeemed or exchanged in the order in which they are purchased, treating shares that have been held the longest in an account as being redeemed first. The fee is retained by the applicable Fund for the benefit of the remaining shareholders. For financial statement purposes, these amounts are included in the Statements of Assets and Liabilities as “paid-in capital”. The Funds retained redemption fees during the six month period ended June 30, 2020 as follows:
| | | SELECT VALUE
FUND | | | MID CAP VALUE
FUND | | | VALUE PLUS
FUND | | | VALUE
FUND | |
| Investor Class | | $ | 17 | | | $ | – | | | $ | 1,234 | | | $ | 204 | |
| Institutional Class | | | – | | | | – | | | | – | | | | – | |
| Total | | $ | 17 | | | $ | – | | | $ | 1,234 | | | $ | 204 | |
| (8) | INVESTMENT TRANSACTIONS |
During the six month period ended June 30, 2020, the cost of purchases and proceeds from sales of securities (excluding securities maturing less than one year from acquisition) are noted below. During the same period, there were no purchases of long-term U.S. Government obligations.
| FUND | | COST OF
PURCHASES | | | PROCEEDS FROM
SALES | |
| SELECT VALUE FUND | | $ | 46,519,963 | | | $ | 68,741,549 | |
| MID CAP VALUE FUND | | | 77,600,564 | | | | 58,766,532 | |
| VALUE PLUS FUND | | | 174,219,231 | | | | 176,044,261 | |
| VALUE FUND | | | 140,854,481 | | | | 168,670,402 | |
| (9) | FEDERAL INCOME TAX INFORMATION |
The Funds have qualified and intend to qualify as regulated investment companies under Subchapter M of the Internal Revenue Code for federal income tax purposes and to distribute substantially all taxable income and net capital gains. Passive foreign investment companies, foreign currency, and certain other investments could create book tax differences that may have an impact on the character of each Fund’s distributions.
As of and during the six month period ended June 30, 2020, the Funds did not have a liability for any unrecognized tax benefits. The Funds file U.S. federal, state, and local tax returns as required. The Funds’ tax returns are subject to examination by the relevant tax authorities until expiration of the applicable statute of limitations which is generally three years after the filing of the tax return for federal purposes and four years for most state returns. Tax returns for open years have incorporated no uncertain tax positions that require a provision for income taxes.
The amount of net unrealized appreciation/(depreciation) and the cost of investment securities for tax purposes, including short-term securities as of June 30, 2020, are displayed in the table below.
| FUND | | TAX COST OF INVESTMENTS | | | GROSS UNREALIZED
APPRECIATION | | | GROSS UNREALIZED
DEPRECIATION | | | NET APPRECIATION/
(DEPRECIATION) OF
FOREIGN CURRENCY | | | NET TAX UNREALIZED
APPRECIATION/
(DEPRECIATION)
ON INVESTMENTS | |
| SELECT VALUE FUND | | $ | 133,698,371 | | | $ | 18,221,754 | | | $ | (13,185,382 | ) | | $ | — | | | $ | 5,036,372 | |
| MID CAP VALUE FUND | | | 50,548,790 | | | | 7,115,180 | | | | (1,433,837 | ) | | | — | | | | 5,681,343 | |
| VALUE PLUS FUND | | | 288,510,224 | | | | 38,708,892 | | | | (25,284,156 | ) | | | — | | | | 13,424,736 | |
| VALUE FUND | | | 521,040,854 | | | | 96,068,565 | | | | (95,735,354 | ) | | | — | | | | 333,211 | |
The difference between book-basis and tax-basis unrealized appreciation is attributable primarily to tax deferral of losses in wash sales.
| (10) | TRANSACTIONS WITH AFFILIATES |
The following investments are in companies deemed “affiliated” (as defined in Section 2(a)(3) of the 1940 Act) with the Value Fund; that is, the Fund held 5% or more of their outstanding voting securities during the six month period ended June 30, 2020. The Select Value, Mid Cap Value, and Value Plus Funds had no transactions with affiliates during the six month period ended June 30, 2020.
| VALUE FUND | | | | | | | | | | | | | | | | | | | | | | | | |
| SECURITY NAME | | MARKET VALUE
AS OF
DECEMBER 31, 2019 | | | PURCHASES | | | SALES | | | MARKET VALUE
AS OF
JUNE 30, 2020 | | | SHARE BALANCE
AS OF
JUNE 30, 2020 | | | DIVIDENDS | | | CHANGE IN
UNREALIZED
GAIN (LOSS) | | | REALIZED
GAIN (LOSS) | |
| Investments in affiliates held as of June 30, 2020 | | | | | | | | | | | | | | | | | | | | | |
| Hudson Global, Inc. | | $ | 3,764,250 | | | $ | — | | | $ | — | | | $ | 2,772,000 | | | | 315,000 | | | $ | — | | | $ | (992,250 | ) | | $ | — | |
| Lincoln Educational Services Corp. | | | 6,399,000 | | | | 52,504 | | | | — | | | | 9,340,500 | | | | 2,395,000 | | | | — | | | | 2,888,996 | | | | — | |
| Perma-Fix Environmental Services, Inc. | | | 9,170,070 | | | | — | | | | — | | | | 6,439,203 | | | | 1,007,700 | | | | — | | | | (2,730,867 | ) | | | — | |
| RCM Technologies, Inc. | | | 1,838,001 | | | | 81,937 | | | | (74,963 | ) | | | 786,075 | | | | 586,623 | | | | — | | | | (909,788 | ) | | | (149,112 | ) |
| Zovio, Inc. | | | 3,296,000 | | | | 732,063 | | | | — | | | | 6,196,500 | | | | 2,025,000 | | | | — | | | | 2,168,437 | | | | — | |
| Total | | | | | | | | | | | | | | $ | 25,534,278 | | | | 6,329,323 | | | $ | — | | | $ | 424,528 | | | $ | (149,112 | ) |
| VALUE FUND | | | | | | | | | | | | | | | | | | | | | | | | | | | | | | | | |
| SECURITY NAME | | | MARKET VALUE
AS OF
DECEMBER 31, 2019 | | | | PURCHASES | | | | SALES | | | | MARKET VALUE
AS OF
JUNE 30, 2020 | | | | SHARE BALANCE
AS OF
JUNE 30, 2020 | | | | DIVIDENDS | | | | CHANGE IN
UNREALIZED
GAIN (LOSS) | | | | REALIZED
GAIN (LOSS) | |
| Investments no longer affiliated as of June 30, 2020 | | | | | | | | | | | | | | | | | | | | | | | | | | | | | |
| Orbital Energy Group, Inc.(a) | | $ | 1,931,699 | | | $ | — | | | $ | (370,782 | ) | | $ | 875,954 | | | | 1,415,000 | | | $ | — | | | $ | 1,636,351 | | | $ | (2,321,314 | ) |
| Total | | | | | | | | | | | | | | $ | 875,954 | | | | 1,415,000 | | | $ | — | | | $ | 1,636,351 | | | $ | (2,321,314 | ) |
| | | | | | | | | | | | | | | | | | | | | | | | | | | | | | | | | |
| Grand Total | | | | | | | | | | | | | | $ | 26,410,232 | | | | | | | $ | — | | | $ | 2,060,879 | | | $ | (2,470,426 | ) |
| (a) | Name changed. Formerly known as CUI Global, Inc. |
On March 3, 2020, shareholders of the ALPS | WMC Research Value Fund (the “Acquired Fund”), a series of Financial Investors Trust, approved the reorganization of the Acquired Fund with and into the Mid Cap Value Fund, a series of the Corporation, pursuant to an Agreement and Plan of Reorganization (the “WMC Reorganization”). The primary purpose of the WMC Reorganization was to restructure the Acquired Fund as a fund within the Corporation and combine it with the Mid Cap Value Fund. The costs of the WMC Reorganization, other than trading costs, were borne by the Advisor. The Mid Cap Value Fund is the accounting survivor for financial statement and performance reporting purposes. The WMC Reorganization provided for the transfer of assets of the Acquired Fund to the Mid Cap Value Fund in exchange for Investor Class and Institutional Class shares of the Mid Cap Value Fund and its assumption of the liabilities of the Acquired Fund. The WMC Reorganization was effective on March 16, 2020.
The reorganization was accomplished by the exchange of 7,093,455 shares of the Acquired Fund’s Investor class valued at $41,149,466 for 4,554,628 shares of the Mid Cap Value Fund’s Investor Class, 4,531 shares of the Acquired Fund’s Class A valued at $26,286 for 2,913 shares of the Mid Cap Value Fund’s Investor Class, 65,351 shares of the Acquired Fund’s Class C valued at $347,284 for 38,483 shares of the Mid Cap Value Fund’s Investor Class and 107,379 shares of the Acquired Fund’s Class I valued at $652,092 for 72,056 shares of the Mid Cap Value Fund’s Institutional Class.
| | | SHARES OUTSTANDING OF | | | NET ASSETS OF | | | | | ACQUIRED FUND | | | NET ASSETS OF | |
| ACQUIRING FUND | | ACQUIRING FUND | | | ACQUIRING FUND | | | ACQUIRED FUND | | SHARES EXCHANGED | | | ACQUIRED FUND EXCHANGED | |
| Mid Cap Value Fund | | | 1,231,174 | | | $ | 11,126,621 | | | ALPS | WMC Research Value Fund | | | 7,270,716 | | | $ | 42,175,128 | |
The investment portfolio cost, fair value, and unrealized appreciation for the Acquired Fund immediately prior to the reorganization were as follows:
| ACQUIRED FUND | | COST OF INVESTMENTS | | | PORTFOLIO VALUE | | | UNREALIZED DEPRECIATION | |
| ALPS | WMC Research Value Fund | | $ | 45,606,418 | | | $ | 42,112,412 | | | $ | (3,494,006 | ) |
Immediately following the reorganization the net assets of the combined fund was $53,301,749.
The WMC Reorganization qualified as a tax-free “reorganization” under the Internal Revenue Code of 1986, as amended. For financial reporting purposes, assets received and shares issued by the Mid Cap Value Fund were recorded at fair value; however, the cost basis of the investments received from the Target Fund was carried forward to align ongoing reporting of the Mid Cap Value Fund’s realized and unrealized gains and losses with amounts distributable to shareholders for tax purposes.
Assuming the WMC Reorganization had been completed on January 1, 2020, the beginning of the reporting period, the pro forma results of operation for the six month period ended June 30, 2020, would have been as follows:
| Net investment income | | $ | 882,597 | |
| Net realized and unrealized gain (loss) on investments | | | 3,728,114 | |
| Net increase in net assets resulting from operations | | $ | 4,610,711 | |
Because the Mid Cap Value Fund has been managed as a single integrated portfolio since the WMC Reorganization was completed, it is not practicable to separate the amounts of revenue and earnings of the Acquired Fund and the Mid Cap Value Fund that have been included in the Mid Cap Value Fund’s Statement of Operations since March 16, 2020.
Subsequent events after the date of the Statements of Assets and Liabilities have been evaluated through the date the financial statements were issued.
On May 14, 2020, the Board unanimously approved the proposed reorganization of the Select Value Fund into the Mid Cap Value Fund, subject to the approval of the shareholders of the Select Value Fund (the “Reorganization”). The Board approved an Agreement and Plan of Reorganization that provides for the acquisition of all of the assets of the Select Value Fund by the Mid Cap Value Fund in exchange for shares of the Mid Cap Value Fund. Shareholders of the Select Value Fund would become shareholders of the Mid Cap Value Fund, receiving shares of the applicable class of the Mid Cap Value Fund equal in value to the shares of the Select Value Fund held immediately prior to the Reorganization. The Reorganization is intended to qualify as a tax-free transaction for federal income tax purposes. The Board will hold a special meeting of shareholders on or about September 28, 2020, as may be adjourned, at which shareholders of record of the Select Value Fund as of July 8, 2020 will be asked to consider and vote on the Agreement and Plan of Reorganization. If shareholders of the Select Value Fund approve the Reorganization, it is expected to close in the fourth quarter of 2020.
ADDITIONAL INFORMATION (UNAUDITED)
EXPENSE EXAMPLES
As a shareholder of the Heartland Funds, you incur two types of costs: (1) transaction costs, including redemption fees and (2) ongoing costs, including management fees, 12b-1 fees, and other Fund expenses. This example is intended to help you understand your ongoing costs (in dollars) of investing in the Funds and to compare these costs with the ongoing costs of investing in other mutual funds. The example is based on an investment of $1,000 invested at the beginning of the six month period and held for the entire six month period from January 1, 2020 through June 30, 2020.
Actual Expenses
The table below provides information about actual account values and actual expenses. You may use the information below, together with the amount you invested, to estimate the expenses that you paid over the period. Simply divide your account value by $1,000 (for example, an $8,600 account value divided by $1,000 = 8.6), then multiply the result by the number in the table under the heading entitled “Expenses Paid during the Period” to estimate the expenses you paid on your account during this period.
| | | BEGINNING | | | ENDING | | | EXPENSES PAID | | | ANNUALIZED EXPENSE | |
| | | ACCOUNT VALUE | | | ACCOUNT VALUE | | | DURING THE PERIOD(a) | | | RATIO DURING PERIOD | |
| FUND | | 1/1/20 | | | 6/30/20 | | | 1/1/20 - 6/30/20 | | | 1/1/20 - 6/30/20 | |
| Heartland Select Value Fund - Investor | | $ | 1,000.00 | | | $ | 808.20 | | | $ | 5.80 | | | | 1.29 | % |
| Heartland Select Value Fund - Institutional | | | 1,000.00 | | | | 809.40 | | | | 4.45 | | | | 0.99 | |
| Heartland Mid Cap Value Fund - Investor | | | 1,000.00 | | | | 826.80 | | | | 5.09 | | | | 1.12 | |
| Heartland Mid Cap Value Fund - Institutional | | | 1,000.00 | | | | 827.20 | | | | 4.13 | | | | 0.91 | |
| Heartland Value Plus Fund - Investor | | | 1,000.00 | | | | 877.70 | | | | 5.79 | | | | 1.24 | |
| Heartland Value Plus Fund - Institutional | | | 1,000.00 | | | | 878.70 | | | | 4.62 | | | | 0.99 | |
| Heartland Value Fund - Investor | | | 1,000.00 | | | | 842.50 | | | | 5.31 | | | | 1.16 | |
| Heartland Value Fund - Institutional | | | 1,000.00 | | | | 843.00 | | | | 4.44 | | | | 0.97 | |
| (a) | Expenses are equal to the average account value times the Fund’s annualized expense ratio multiplied by the number of days in the most recent fiscal half-year (182) divided by the number of days in the fiscal year (366). |
Hypothetical Example for Comparison Purposes
The table below provides information about hypothetical account values and hypothetical expenses based on each of the Fund’s actual expense ratio and an assumed rate of return of 5% per year before expenses, which is not the Fund’s actual return. The hypothetical account values and expenses may not be used to estimate the actual ending account balance or expenses you paid for the period. You may use this information to compare this 5% hypothetical example with the 5% hypothetical examples that appear in the shareholder reports of other funds.
Please note that the expenses shown in the table are meant to highlight your ongoing costs and do not reflect any transactional costs, such as redemption fees. Therefore, the table is useful in comparing ongoing costs only, and will not help you determine the relative total costs of owning different funds. In addition, if these transactional costs were included, your costs would have been higher.
| | | BEGINNING | | | ENDING | | | EXPENSES PAID | | | ANNUALIZED EXPENSE | |
| | | ACCOUNT VALUE | | | ACCOUNT VALUE | | | DURING THE PERIOD(a) | | | RATIO DURING PERIOD | |
| FUND | | 1/1/20 | | | 6/30/20 | | | 1/1/20 - 6/30/20 | | | 1/1/20 - 6/30/20 | |
| Heartland Select Value Fund - Investor | | $ | 1,000.00 | | | $ | 1,018.45 | | | $ | 6.47 | | | | 1.29 | % |
| Heartland Select Value Fund - Institutional | | | 1,000.00 | | | | 1,019.94 | | | | 4.97 | | | | 0.99 | |
| Heartland Mid Cap Value Fund - Investor | | | 1,000.00 | | | | 1,019.29 | | | | 5.62 | | | | 1.12 | |
| Heartland Mid Cap Value Fund - Institutional | | | 1,000.00 | | | | 1,020.34 | | | | 4.57 | | | | 0.91 | |
| Heartland Value Plus Fund - Investor | | | 1,000.00 | | | | 1,018.70 | | | | 6.22 | | | | 1.24 | |
| Heartland Value Plus Fund - Institutional | | | 1,000.00 | | | | 1,019.94 | | | | 4.97 | | | | 0.99 | |
| Heartland Value Fund - Investor | | | 1,000.00 | | | | 1,019.10 | | | | 5.82 | | | | 1.16 | |
| Heartland Value Fund - Institutional | | | 1,000.00 | | | | 1,020.04 | | | | 4.87 | | | | 0.97 | |
| (a) | Expenses are equal to the average account value times the Fund’s annualized expense ratio multiplied by the number of days in the most recent fiscal half-year (182) divided by the number of days in the fiscal year (366). |
OTHER INFORMATION
A description of the policies and procedures that the Corporation uses to determine how to vote proxies relating to portfolio securities, and a copy of the voting record, is available without charge at www.heartlandadvisors.com and on the Securities and Exchange Commission’s (the “Commission”) website at www.sec.gov, or upon request, by calling Heartland Advisors, Inc. at 1-888-505-5180, or by writing to Heartland Advisors, Inc. at 790 N. Water Street, Suite 1200, Milwaukee, WI 53202. Information regarding how the Corporation voted proxies relating to portfolio securities during the most recent twelve month period ended June 30 is also available on the Commission’s website at www.sec.gov.
The Funds’ portfolio holdings are made available semi-annually in shareholder reports within 60 days after the close of the period for which the report is being made, as required by federal securities laws. The Funds also file a complete schedule of portfolio holdings with the commission for the first and third quarters of the Funds’ fiscal year on Part F of Form N-PORT. Portfolio holdings filed on Form N-PORT become publicly available on the commissions website at www.sec.gov within 60 days after the end of that Funds’ fiscal quarter. Schedules of portfolio holdings are also available at www.heartlandadvisors.com, or upon request, without charge by calling Heartland Advisors, Inc. at 1-888-505-5180, or by writing to Heartland Advisors, Inc. at 790 N. Water Street, Suite 1200, Milwaukee, WI, 53202.
DEFINITIONS AND DISCLOSURES
This report contains forward-looking statements, such as economic predictions and portfolio manager opinions. These statements are subject to risks, uncertainties, and actual developments in the future, and their impact on the Funds could be materially different than those that are projected or implied.
Certain security valuations and forward estimates are based on Heartland Advisors’ calculations. Statements regarding securities are not recommendations to buy or sell the securities discussed, but rather illustrations of our value investment strategy. Such statements represent the portfolio manager’s view when made and are subject to change at any time based on market and other considerations. Any forecasts may not prove to be true. Economic predictions are based on estimates and are subject to change. There is no guarantee that any particular investment strategy will be successful.
Dividends are not guaranteed and a company’s future ability to pay dividends may be limited. A company currently paying dividends may cease paying dividends at any time.
Growth and value investing each have unique risks and potential for rewards and may not be suitable for all investors. A growth investing strategy emphasizes capital appreciation and typically carries a higher risk of loss and potential reward than a value investing strategy; a value investing strategy emphasizes investments in companies believed to be undervalued.
Small-cap and large-cap investment strategies each have their own unique risks and potential for rewards and may not be suitable for all investors. Small-cap investment strategies emphasize the significant growth potential of small companies, however, small-cap securities, are generally more volatile and less liquid than those of larger companies. Large-cap investment strategies emphasize the stability of large companies, however, large-cap securities are more susceptible to momentum investments and may quickly become overpriced or suffer losses.
Heartland Advisors defines market cap ranges by the following indices: micro-cap by the Russell Microcap®, small-cap by the Russell 2000®, mid-cap by the Russell Midcap®, large-cap by the Russell Top 200®.
Bear Market occurs when the price of a group of securities is falling or is expected to fall.
Buyback is the repurchase of outstanding shares (repurchase) by a company in order to reduce the number of shares on the market.
Dividend Yield is a ratio that shows how much a company pays out in dividends each year relative to its share price.
Earnings Yield is the reciprocal of the price to earnings ratio.
Earnings Before Interest, Taxes, Depreciation and Amortization (EBITDA) measures a company’s financial performance. It is used to analyze and compare profitability between companies and industries because it eliminates the effects of financing and accounting decisions.
Free Cash Flow is the amount of cash a company has after expenses, debt service, capital expenditures, and dividends. The higher the free cash flow, the stronger the company’s balance sheet.
Intrinsic Value is the actual value of a company or an asset based on an underlying perception of its true value including all aspects of the business, in terms of both tangible and intangible factors. This value may or may not be the same as the current market value.
Net Debt/Total Capital Ratio of a stock is calculated as a company’s interest-bearing liabilities minus cash or cash equivalents divided by its total capital, which is represented by the company’s debt and shareholders’ equity, and includes common stock, preferred stock, minority interest and net debt.
Price/Book Ratio of a company is calculated by dividing the market price of its stock by the company’s per-share book value.
Price/Cash Flow represents the amount an investor is willing to pay for a dollar generated from a particular company’s operations, shows the ability of a business to generate cash, and acts as a gauge of liquidity and solvency.
Price/Earnings Ratio of a stock is calculated by dividing the current price of the stock by its trailing or its forward 12 months’ earnings per share.
Return on Equity is a measure of the net income after taxes that a firm is able to earn as a percent of stockholders equity.
Russell 2000® Index includes the 2000 firms from the Russell 3000® Index with the smallest market capitalizations.
Russell 2000® Value Index measures the performance of those Russell 2000® companies with lower price/book ratios and lower forecasted growth characteristics.
Russell 3000® Value Index measures the performance of those Russell 3000® Index companies with lower price/book ratios and lower forecasted growth characteristics.
Russell Midcap® Value Index measures the performance of those Russell Midcap® Index companies with lower price/book ratios and lower forecasted growth characteristics.
S&P 500 Index is an index of 500 U.S. stocks chosen for market size, liquidity and industry group representation and is a widely used U.S. equity benchmark.
All indices are unmanaged. It is not possible to invest directly in an index.
Russell Investment Group is the source and owner of the trademarks, service marks and copyrights related to the Russell indices. Russell® is a trademark of the Frank Russell Investment Group.
Data sourced from FactSet: Copyright 2020 FactSet Research Systems Inc., FactSet Fundamentals. All rights reserved.
Impacts of COVID-19
The recent global outbreak of COVID-19 has disrupted financial markets and the prolonged economic impact is uncertain. The performance of the Funds’ investments depends on future developments, including the duration and spread of the outbreak. Events related to COVID-19 may result in further global economic disruption and market volatility which in turn may impact the value of each of the Fund’s investments.
STATEMENT REGARDING LIQUIDITY RISK MANAGEMENT PROGRAM
In accordance with Rule 22e-4 under the Investment Company Act of 1940, the Corporation has adopted and implemented a liquidity risk management program (the “Program”). The Program seeks to promote effective liquidity risk management of each Fund and to protect Fund shareholders from dilution of their interests. The Board has appointed Heartland Advisors, Inc., the Funds’ investment advisor, as the program administrator (the “Program Administrator”). The Program Administrator has further delegated the administration of the Program to the members of its Pricing Committee. The Program Administrator is required to provide an annual report to the Board regarding the adequacy and effectiveness of the Program, including the operation of the highly liquid investment minimum, if applicable, and any material changes to the Program.
On May 14, 2020, the Board reviewed the Program Administrator’s annual written report for the period December 1, 2018 through March 31, 2020 (the “Report”). The Report provided an assessment of each Fund’s liquidity risk, which is the risk a Fund could not meet requests to redeem shares issued by a Fund without significant dilution of the remaining investors’ interest in the Fund. The Report noted that the Program Administrator uses ICE Data Services, a third party vendor, to provide portfolio classification services, and that each Fund predominantly held investments that were classified as highly liquid during the review period. The Report noted that each Fund’s portfolio is expected to continue to primarily hold highly liquid investments and be considered a “primarily highly liquid fund” (as defined in the Program) and can therefore continue to rely on the exclusion in Rule 22e-4 from the requirements to determine and review a highly liquid investment minimum for each Fund and to adopt policies and procedures for responding to a highly liquid investment minimum shortfall. The Program Administrator noted that no material changes had been made to the Program since the Board’s last approval of the Program.
The Program Administrator concluded that in all market conditions, with an emphasis on the unprecedented volatility in the first quarter of 2020, and under Fund-specific stresses, each Fund has been able to meet redemption needs without significant dilution to the Fund’s remaining investors. The Program Administrator determined that the Program is adequate and is operating effectively.
BOARD REVIEW OF INVESTMENT ADVISORY AGREEMENT (UNAUDITED)
The Investment Company Act of 1940, as amended, requires that the Funds’ Investment Advisory Agreements be approved annually by the vote of a majority of the Board of Directors who are not parties to the investment advisory agreements or “interested persons” (as that term is defined in the Investment Company Act of 1940, as amended) of the Funds (the “Independent Directors”), cast in person at a meeting called for the purpose of voting on such approval. At its meeting held on May 14, 2020, the Board of Directors, including all of the Independent Directors, unanimously approved the continuation of the Investment Advisory Agreements for the Funds.
As part of the process of approving the continuation of the Investment Advisory Agreements, the Directors reviewed the legal requirements governing their consideration of the advisory agreements and the relevant factors for the Directors to consider, and the Independent Directors met in executive session on May 13, 2020, with their independent legal counsel, to discuss the renewal of the Investment Advisory Agreements. The Directors recognized that the fee arrangements for the Funds are the result of years of review and discussion between the Independent Directors and the Advisor, that certain aspects of such arrangements may receive greater scrutiny in some years than in others and that the Directors’ conclusions may be based, in part, on their consideration of these arrangements and information received during the course of the year and in prior years.
The Directors’ approval was based on their consideration and evaluation of a variety of factors, which included, among other things: (1) the nature, extent, and quality of the services provided by the Advisor, including the investment process used by the Advisor; (2) the performance of each Fund in comparison to its benchmark index, a peer group and a comparison universe of similar mutual funds; (3) the management fees and total net operating expenses of the Funds, including comparative information with respect to a peer group and a comparison universe of similar mutual funds; (4) a comparison of the Advisor’s services and the amounts paid by the Funds with those under the Advisor’s agreements with other clients; (5) the profitability of the Advisor with respect to the Funds; (6) the extent to which economies of scale may be realized as the Funds grow and whether fee levels reflect these economies of scale for the benefit of Fund investors; and (7) any benefits accruing to the Advisor or its affiliates from their relationship with the Funds. As part of this process, the Board of Directors reviewed and considered various materials, including, but not limited to the following:
MATERIALS RELATING TO THE NATURE, EXTENT, AND QUALITY OF SERVICES PROVIDED BY THE ADVISOR:
| • | A summary of the qualifications and background of the Advisor’s senior management personnel; |
| • | A summary of the Advisor’s investment process for the Funds; |
| • | Information regarding the Advisor’s risk management practices; |
| • | Information regarding the operation of the Advisor’s business continuity plan during the work from home orders in response to the COVID-19 pandemic; |
| • | Information regarding initiatives to improve operations and services; |
| • | Biographical information for the Fund’s portfolio management teams; |
| • | The Advisor’s Form ADV Part 2A (brochure) and 2B (supplements); |
| • | Representative marketing publications; |
| • | Information regarding the Advisor’s compliance program; and |
| • | Information regarding trading costs and best execution. |
INFORMATION WITH RESPECT TO FUND PERFORMANCE AND EXPENSES:
| • | Discussions with management regarding Fund performance and related performance data, including the Advisor’s initiatives to improve performance for certain Funds; |
| • | A Section 15(c) Report and related materials prepared by FUSE Research Network, LLC (“FUSE”) using Morningstar, Inc. data comparing advisory fees, other expenses and the performance of each class of each Fund against a peer group of funds consisting of such Fund and other open-end funds classified by FUSE as having a similar investment strategy and a comparable asset level as such Fund (“Expense Group”); and |
| • | Other comparative expense and performance information for each Fund and its corresponding Expense Group, which was customized to include the particular Fund’s peer funds which were in its expense group in either or both of the prior two years (the 2018 peer group having been selected by another provider), are still in existence, and have a strategy that falls within the category used by FUSE in the current year. |
| • | The Board did not consider information regarding the Advisor’s performance for other accounts to be a material factor. |
MATERIALS RELATED TO THE ADVISOR’S SERVICES TO OTHER ACCOUNTS:
| • | A schedule of standard account minimums and standard fees for separately managed account portfolios managed with investment strategies similar to the Funds; and |
| • | Information regarding the level of services provided by the Advisor for the Funds versus the Advisor’s other clients with investment strategies similar to the Funds. |
MATERIALS RELATING TO PROFITABILITY AND ECONOMIES OF SCALE:
| • | A profitability analysis prepared by management; |
| • | An independent study prepared by FUSE of the profitability of a group of publicly traded advisors; |
| • | A summary of revenue sharing arrangements that the Advisor has with various financial intermediaries; and |
| • | A memorandum prepared by management discussing economies of scale. |
INFORMATION RELATING TO THE ADVISOR’S FINANCIAL STRENGTH:
| • | The Advisor’s financial statements and independent auditor’s report for the years ended December 31, 2019 and December 31, 2018; |
| • | Consolidated financial statements of Heartland Holdings, Inc. (the Advisor’s parent company) and its subsidiary and independent auditor’s report for the years ended December 31, 2019 and December 31, 2018; |
| • | Consolidated financial information for Heartland Holdings, Inc. for the first quarter ended March 31, 2020 (unaudited); |
| • | The Advisor’s historical assets under management for the past ten years; |
| • | Heartland Holdings’ consolidated financial projections; and |
| • | The Advisor’s management succession and personnel contingency plan. |
In considering the foregoing documents and information, the Independent Directors were assisted by their independent legal counsel, who was present at all times at the May 14, 2020, meeting and at the executive session on May 13, 2020, and who provided a memorandum that outlined the duties and responsibilities of the Board of Directors in connection with approving the continuation of the Investment Advisory Agreements.
In reviewing and discussing this information, the Independent Directors took into account information regularly provided at the Board of Directors’ quarterly meetings throughout the year regarding the services provided by the Advisor, the performance of the Funds, expenses, the Funds’ compliance program, asset flows, sales and marketing updates and other relevant matters. After considering this information, the Board of Directors, including all of the Independent Directors, reached the following conclusions:
| • | The nature and extent of the services provided by the Advisor are appropriate for the investment objectives and programs of the Select Value Fund, Value Plus Fund, Value Fund and Mid Cap Value Fund and are appropriate to assure that each Fund’s operations are conducted in compliance with their investment objectives and strategies, and in compliance with applicable laws, rules and regulations. |
| • | The Advisor provides a high quality of services to the Funds, based upon: (a) the Advisor’s consistent value investment process, which has been in place for over 35 years; (b) the background and experience of the Advisor’s senior management and the expertise of, and the amount of attention given to the Funds by, investment personnel of the Advisor; (c) the extensive other services provided by the Advisor that benefit the Funds, including compliance services, pricing and risk management services, business continuity services; oversight of service providers and other administrative services, such as the provision of Fund officers and office space; and (d) the overall reputation and capabilities of the Advisor. |
| • | While the Funds have had periods of underperformance, the Funds had generally seen improved performance in recent years in relation to their benchmark index and peer groups and have good longer term performance. With respect to the shorter term performance of the Select Value Fund, the Directors considered the Advisor’s initiatives to improve performance and the Advisor’s ongoing strategic review of the Fund, and determined that continuation of the Investment Advisory Agreement at this time was in the best interests of the Fund’s shareholders. The Directors concluded, within the context of their full deliberations, that the investment results that the Advisor had been able to achieve for each of the Funds were sufficient to support continuation of the Investment Advisory Agreements, as they believe the investment approach of each Fund should produce positive, long term performance for investors. |
| • | The advisory fees charged to the Funds are fair and reasonable based on the nature, scope and quality of the services provided to the Funds, and those fees are competitive, taking into account all relevant circumstances, with fees paid by peer funds and fees charged by the Advisor to other accounts it manages under similar investment strategies and programs. |
| | | |
| • | The level of profitability realized by the Advisor from its provision of services to the Funds is reasonable. |
| • | The Advisor has sufficient financial resources and revenues to enable it to finance the provision and delivery of the services it is obligated to provide under the Investment Advisory Agreements and the Advisor has used these resources and revenues to manage the operations of the Funds in an effective manner that is beneficial to shareholders. |
With regard to economies of scale, the Directors concluded that, given the Funds’ current asset levels, the Funds did not recognize economies of scale during this review cycle. However, they noted that the five basis point fee reduction on net assets greater than $1.0 billion for the Select Value Fund, as well as the expense limitation agreement in place for the Mid Cap Value Fund, which had recently been reduced for the benefit of shareholders, represent an appropriate sharing of economies of scales between the Advisor and such Funds at foreseeable asset levels. The Directors also noted that voluntary waivers are in place with respect to the Institutional share class of each Fund, and that the Advisor continues to invest significant resources in the Funds’ portfolio management and research teams.
The Board considered other benefits to the Advisor from serving as advisor to the Funds (in addition to the advisory fee). For example, the Board noted that the Advisor derives ancillary benefits from its association with the Funds in the form of proprietary and third party research products and services received from broker dealers that execute portfolio trades for the Funds. The Board determined such products and services have been used for legitimate purposes beneficial to the Funds by providing assistance in the investment decision making process. The Advisor also experiences reputational and other modest benefits due to its association with the Funds. The Board concluded that the other benefits realized by the Advisor from its relationship with the Funds were reasonable.
The Directors reached these conclusions after carefully considering all of the information provided by management and after taking into account recent developments and circumstances affecting the Funds. They concluded that the information and materials provided addressed all of the relevant matters that they considered necessary or advisable to assess the performance of the Funds and the performance of the Advisor under the Investment Advisory Agreements. All of the factors discussed above were considered separately by the Board of Directors, including the Independent Directors meeting in executive session and as part of the Audit Committee. The factors were viewed in their totality by the Board of Directors, with no single factor being the principal or determinative factor in the Board’s determination to approve the continuation of the Investment Advisory Agreements.
INFORMATION REGARDING EXECUTIVE OFFICERS AND DIRECTORS (UNAUDITED)
INFORMATION REGARDING EXECUTIVE OFFICERS AND DIRECTORS
Under applicable law, the Board of Directors is responsible for management of the Corporation and provides broad supervision over its affairs. The Board elects the Officers of the Corporation and hires the Funds’ service providers, including the Funds’ investment advisor, Heartland Advisors, Inc., and distributor of the Funds’ shares, ALPS Distributors, Inc. The Board meets regularly to review, among other items, the Funds’ investments, performance, and expenses. The Board annually reviews and considers approval of the continuation of the investment advisory agreement with the Advisor and each Fund’s distribution plan and related distribution agreements. The Board also establishes, monitors, and -periodically reviews numerous policies and procedures governing the conduct of the Corporation’s business. The policy of the Corporation is that the Chairman and 75% of the members of the Board must be independent directors for purposes of the 1940 Act. The following table presents information about each Director and Officer of the Corporation. The mailing address of the Directors and Officers is 790 North Water Street, Suite 1200, Milwaukee, WI 53202.
| INDEPENDENT DIRECTORS: | Position(s) held with the Corporation | Term of office and length of time served(1) | Principal occupations during past five years: | Number of Heartland Funds overseen by Director | Other Directorships held by Director(2) | |
| | | | | | | |
 | Robert A. Rudell Date of Birth: 9/48 | Chairman of the Board Director | Since 1/06 Since 2/05 | Retired; Chief Operating Officer, Zurich Scudder Investments, 1998 to 2002; President, Scudder Retirement Services, 1996 to 1998; employed by IDS/American Express as President in Institutional Retirement Services and other capacities, 1973 to 1996. | 4 | Director, Optimum Funds, May 2003 to present (6 mutual funds); Director, Medtox Scientific, Inc., April 2002 to July 2012; Director, Vantagepoint Funds, March 2007 to 2011 (31 mutual funds). | |
| | | | | | | | |
 | Dale J. Kent Date of Birth: 11/52 | Director | Since 8/03 | Director (part-time), R&R Insurance, since September 2017; Vice President-Capital Markets (part-time), Continental Properties Company, since February 2018; Director (part-time), Continental Properties Company, September 2017 to February 2018; Executive Vice President and Chief Financial Officer, West Bend Mutual Insurance Company, July 2002 to July 2017; Partner, Arthur Andersen, LLP, 1986 to 2002; employed by Arthur Andersen, LLP, in other capacities, 1974 to 1985. | 4 | None | |
| | | | | | | | |
 | Ward D. Armstrong Date of Birth: 1/54 | Director | Since 2/08 | Retired; Managing Partner, NorthRock Partners, LLC, October 2013 to July 2015; Managing Director, NorthRock Partners, a Private Wealth Advisory Practice of Ameriprise Financial, February 2010 to October 2013; Senior Vice President, Ameriprise Financial, Inc., November 1984 to May 2007; President, American Express Asset Management, 2002 to 2004; Chairman, Ameriprise Trust Company, November 1996 to May 2007. | 4 | Trustee, ALPS Series Trust, May 2016 to present (9 mutual funds). | |
| INTERESTED DIRECTORS AND OFFICERS: | Position(s) held with the Corporation | Term of office and length of time served(1) | Principal occupations during past five years: | Number of Heartland Funds overseen by Director | Other Directorships held by Director(2) | |
| | | | | | | |

| William (“Will”) R. Nasgovitz(3) Date of Birth: 4/78 | Chief Executive Officer President and Director | Since 5/12 Since 1/20 | Chief Executive Officer and Portfolio Manager, Heartland Advisors, Inc., since January 2013; Senior Vice President and Portfolio Manager, Heartland Advisors, Inc., since 2012; Director, Heartland Advisors, Inc., since November 2010; Vice President and Portfolio Manager, Heartland Advisors, Inc., 2006 to 2011; Research Analyst, Heartland Advisors, Inc., 2004 to 2006; Research Associate, Heartland Advisors, Inc., 2003 to 2004; Senior Research Associate, Cambridge Associates, LLC 2000 to 2002. | 4 | N/A | |
| | | | | | | | |
 | Nicole J. Best Date of Birth: 9/73 | Vice President, Treasurer and Principal Accounting Officer | Since 6/11 | Chief Administrative Officer, Heartland Advisors, Inc., since June 2015; Senior Vice President and Chief Financial Officer, Heartland Advisors, Inc., since May 2010; Vice President and Secretary, Heartland Group, Inc., May 2010 to June 2011; Senior Vice President, Investor Services and Markets, Brown Brothers Harriman & Co., September 2008 to May 2010; Senior Vice President and Chief Compliance Officer, Heartland Advisors, Inc. and Heartland Group, Inc., November 2005 to August 2008; Senior Vice President and Treasurer, Heartland Advisors, Inc., February 2001 to August 2006; Treasurer and Principal Accounting Officer, Heartland Group, Inc., June 2000 to November 2005. Employed by Heartland Advisors, Inc. in other capacities from 1998 to 2008. Employed by Arthur Andersen, LLP, in other capacities, 1995 to 1998. | N/A | N/A | |
| | | | | | | | |
 | Vinita K. Paul Date of Birth: 8/79 | Vice President Chief Compliance Officer Anti-Money Laundering Officer Secretary | Since 8/08 Since 12/16; 8/08 – 5/16 Since 2/14 Since 4/17 | Vice President and General Counsel, Heartland Advisors, Inc., since August 2009; Vice President and Chief Compliance Officer, Heartland Advisors, Inc., August 2008 to May 2016 and since December 2016; Assistant Secretary, Heartland Group, Inc., May 2016 to April 2017; Associate, Quarles & Brady LLP, November 2007 to July 2008; Vice President and Interim General Counsel, The Ziegler Companies, Inc., July 2007 to October 2007; Assistant Secretary, North Track Funds, Inc., December 2006 to October 2007; Assistant Secretary, Ziegler Exchange Traded Trust, December 2006 to October 2007; Vice President and Assistant General Counsel, The Ziegler Companies, Inc., September 2006 to July 2007; Associate, Quarles & Brady LLP, September 2004 to August 2006. | N/A | N/A | |
| (1) | Officers of the Corporation serve one-year terms, subject to annual reappointment by the Board of Directors. Directors of the Corporation serve a term of indefinite length until their resignation or removal, and stand for re-election by shareholders only as and when required under the Investment Company Act of 1940. |
| (2) | Only includes directorships held in a company with a class of securities registered pursuant to Section 12 of the Securities Exchange Act of 1934 or subject to the requirements of Section 15(d) of the Securities Exchange Act of 1934, or any company registered as an investment company under the Investment Company Act of 1940. |
| (3) | William (“Will”) R. Nasgovitz is considered to be an “interested person” (as defined in the Investment Company Act of 1940) of the Corporation because of his position with the Advisor. Will is the son of William (“Bill”) J. Nasgovitz. |
The standing committees of the Corporation’s Board of Directors include an Audit Committee and a Nominating and Governance Committee. Both Committees consist of all the Independent Directors, namely Robert A. Rudell, Dale J. Kent, and Ward D. Armstrong. Mr. Kent serves as chairman of the Audit Committee, and Mr. Armstrong serves as chairman of the Nominating and Governance Committee. The Board has determined that Mr. Kent is an Audit Committee financial expert.
The Audit Committee is responsible for selecting the independent registered public accounting firm for the Funds and oversees the preparation of each Fund’s financial statements. In this capacity, the Audit Committee meets at least annually with the independent registered public accounting firm to discuss any issues surrounding the preparation and audit of the Funds’ financial statements. The Audit Committee also discusses with the independent registered public accounting firm the systems and operating procedures employed in connection with the preparation of each Fund’s financial statements, pricing procedures and the like, as well as the performance and cooperation of those responsible for these functions. The Audit Committee has adopted a written charter. The Audit Committee had four meetings during the twelve months ended June 30, 2020.
The Nominating and Governance Committee nominates candidates for appointment to the Board of Directors to fill vacancies and to nominate candidates for election and re-election to the Board as and when required. The Nominating and Governance Committee generally accepts recommendations for nominations by shareholders of the Funds. The Nominating and Governance Committee has adopted a written charter. The Nominating and Governance Committee had three meetings during the twelve months ended June 30, 2020.
The Funds’ Statement of Additional Information includes additional information about the Directors of the Corporation and is available, without charge, at www.heartlandadvisors.com or upon request, by calling 1-800-432-7856.

Heartland Advisors’ commitment to you:
Striving to achieve superior investment results and outstanding client service
Fundamental Research
We are committed to discovering opportunities through extensive fundamental analysis
Seasoned Investment Team
We leverage our investment team’s decades of experience to uncover out-of-favor, financially sound, and undervalued companies
Consistent and Disciplined Approach
We consistently adhere to our clearly defined, time-tested investment process driven by Heartland’s 10 Principles of Value Investing TM
An investor should consider the Funds’ investment objectives, risks, and charges and expenses carefully before investing or sending money. This and other important information can be found in the Funds’ prospectus. To obtain a prospectus, please call 1-800-432-7856 or visit www.heartlandadvisors.com. Please read the prospectus carefully before investing.
| Distributed by ALPS Distributors, Inc. | HLF006667/0821 |
Not applicable to semi-annual report.
| Item 3. | Audit Committee Financial Expert. |
Not applicable to semi-annual report.
| Item 4. | Principal Accountant Fees and Services. |
Not applicable to semi-annual report.
| Item 5. | Audit Committee of Listed Registrants. |
Not applicable.
| (a) | Schedule of Investments as of the close of the reporting period is included as part of the report to stockholders filed under Item 1 of this Form N-CSR. |
| Item 7. | Disclosure of Proxy Voting Policies and Procedures for Closed-End Management Investment Companies. |
Not applicable.
| Item 8. | Portfolio Managers of Closed-End Management Investment Companies. |
Not applicable.
| Item 9. | Purchases of Equity Securities by Closed-End Management Investment Companies and Affiliated Purchases. |
Not applicable.
| Item 10. | Submission of Matters to a Vote of Security Holders. |
No material changes to the procedures by which the shareholders may recommend nominees to the registrant’s Board of Directors have been implemented after the registrant’s last provided disclosure in response to the requirements of Item 407(c)(2)(iv) of Regulation S-K (17 CFR 229.407) (as required by Item 22(b)(15) of Schedule 14A (17 CFR 240.14a-101)), or this Item.
| Item 11. | Controls and Procedures. |
| (a) | The registrant’s principal executive and principal financial officers, or persons performing similar functions, have concluded that the registrant’s disclosure controls and procedures (as defined in Rule 30a-3(c) under the Investment Company Act of 1940, as amended (the “1940 Act”) (17 CFR 270.30a-3(c))) are effective, based on their evaluation of these controls and procedures as of a date within 90 days of the filing date of the report that includes the disclosure required by this paragraph, based on their evaluation of these controls and procedures required by Rule 30a-3(b) under the 1940 Act (17 CFR 270.30a-3(b)) and Rules 13a-15(b) or 15d-15(b) under the Securities Exchange Act of 1934, as amended (17 CFR 240.13a-15(b) or 240.15d-15(b)). |
| (b) | No changes in the registrant’s internal control over financial reporting (as defined in Rule 30a-3(d) under the 1940 Act (17 CFR 270.30a-3(d)) occurred during the period covered by this report that have materially affected, or are reasonably likely to materially affect, the registrant’s internal control over financial reporting. |
| Item 12. | Disclosure of Securities Lending Activities for Closed-End Management Investment Companies. |
SIGNATURES
Pursuant to the requirements of the Securities Exchange Act of 1934 and the Investment Company Act of 1940, the registrant has duly caused this report to be signed on its behalf by the undersigned, thereunto duly authorized.
HEARTLAND GROUP, INC.
| By: | /s/ William R. Nasgovitz | |
| | William R. Nasgovitz | |
| | President and Chief Executive Officer | |
| | | |
| Date: | August 24, 2020 | |
Pursuant to the requirements of the Securities Exchange Act of 1934 and the Investment Company Act of 1940, this report has been signed below by the following persons on behalf of the registrant and in the capacities and on the dates indicated.
| By: | /s/ William R. Nasgovitz | |
| | William R. Nasgovitz | |
| | President and Chief Executive Officer | |
| | | |
| Date: | August 24, 2020 | |
| | | |
| | | |
| By: | /s/ Nicole J. Best | |
| | Nicole J. Best | |
| | Treasurer & Principal Accounting Officer | |
| | | |
| Date: | August 24, 2020 | |