UNITED STATES
SECURITIES AND EXCHANGE COMMISSION
Washington, D.C. 20549
FORM N-CSR
CERTIFIED SHAREHOLDER REPORT OF REGISTERED
MANAGEMENT INVESTMENT COMPANIES
Investment Company Act File number: 811-04982
Heartland Group, Inc.
(Exact name of Registrant as specified in charter)
| 790 North Water Street, Suite 1200, Milwaukee, WI | | 53202 |
| (Address of principal executive offices) | | (Zip code) |
Nicole J. Best
Heartland Group, Inc., 790 North Water Street, Suite 1200, Milwaukee, WI 53202
(Name and address of agent for service)
Ellen Drought
Godfrey & Kahn, S.C., 833 East Michigan Street, Suite 1800, Milwaukee, WI 53202-5615
(With a copy to:)
Registrant’s telephone number, including area code: (414) 347-7777
Date of fiscal year end: December 31
Date of reporting period: June 30, 2023
Form N-CSR is to be used by management investment companies to file reports with the Commission, not later than 10 days after the transmission to stockholders of any report that is required to be transmitted to stockholders under Rule 30e-1 under the Investment Company Act of 1940 (17 CFR 270.30e-1). The Commission may use the information provided on Form N-CSR in its regulatory, disclosure review, inspection, and policymaking roles.
A registrant is required to disclose the information specified by Form N-CSR, and the Commission will make this information public. A registrant is not required to respond to the collection of information contained in Form N-CSR unless the Form displays a currently valid Office of Management and Budget ("OMB") control number. Please direct comments concerning the accuracy of the information collection burden estimate and any suggestions for reducing the burden to the Secretary, Securities and Exchange Commission, 100 F Street, NE, Washington, DC 20549. The OMB has reviewed this collection of information under the clearance requirements of 44 U.S.C. § 3507.
| Item 1. | Reports to Stockholders. |


| A MESSAGE FROM OUR PRESIDENT AND CEO | 1 |
| | |
| HEARTLAND MID CAP VALUE FUND | |
| Management’s Discussion of Fund Performance | 2 |
| | |
| HEARTLAND VALUE PLUS FUND | |
| Management’s Discussion of Fund Performance | 4 |
| | |
| HEARTLAND VALUE FUND | |
| Management’s Discussion of Fund Performance | 6 |
| | |
| THE HEARTLAND FAMILY OF EQUITY FUNDS | |
| Additional Fund Characteristics | 8 |
| | |
| FINANCIAL STATEMENTS | |
| Schedules of Investments | 10 |
| Statements of Assets and Liabilities | 15 |
| Statements of Operations | 16 |
| Statements of Changes in Net Assets | 17 |
| Financial Highlights | 18 |
| Notes to Financial Statements | 21 |
| | |
| ADDITIONAL INFORMATION | |
| Expense Examples | 28 |
| Other Information | 28 |
| Definitions and Disclosures | 29 |
| Statement Regarding Liquidity Risk Management Program | 30 |
| Board Review of Investment Advisory Agreement | 31 |
| Information Regarding Executive Officers and Directors | 33 |

“The easiest way to solve a problem is to deny it exists.”
| Dear Fellow Shareholders, | —Issac Asimov |
Recently, risk-taking returned to the market in a big way. The tech-heavy NASDAQ Composite Index is up more than 30% year to date, driven in large part to the speculative frenzy over artificial intelligence stocks. Is this surprising, given that a series of bank failures in March seemed to scare investors straight earlier in the year? Not really. Denial is a natural phase in the investment cycle, coming after delusion but preceding capitulation and despair.
Yet denying that a problem exists does not actually make it go away. The truth is, there is a long list of nagging problems, including the Federal Reserve’s still-restrictive monetary policy, 6-month T-bills yielding 5.4% — tough competition for equities — and the 14th consecutive monthly decline in the Leading Economic Indicators.
These things will not disappear overnight even if the Federal Reserve is done raising rates, which remains a big if. Many of the effects of higher borrowing costs are already taking their toll, and there is a strong likelihood of further credit stress in the coming months. Banks are hunkering down, tightening their lending standards while cutting back on loan issuance.
Something else that cannot be denied is how narrow the breadth is in today’s market. So far this year, a smaller percentage of stocks are beating the benchmark than was the case in the run up to the global financial crisis, the dotcom crash, and the early ’80s recessions.
Percentage of S&P 500 Stocks that Outperformed the S&P 500

Source: Ned Davis Research, yearly data from 12/31/1973 to 12/31/2022 and partial year data from 1/1/2023 to 6/22/2023. This chart represents the percentage of S&P 500® stocks that outperformed the S&P 500® over the calendar year. All indices are unmanaged. It is not possible to invest directly in an index. Past performance does not guarantee future results.
Narrow markets have historically been associated with poor performance while wide breadth has correlated with strong price gains in the 12 months after the fact. The good news is, there is a corollary to this rule — one that signals hope for patient, value-minded investors like us who have a focus on small-cap names. Ned Davis Research examined past periods in which the market’s breadth narrowed—specifically, when fewer than 30% of the stocks in the S&P 500 were beating the benchmark. It found that in the 12 months following those instances, small stocks outperformed large stocks every time.

Source: Ned Davis Research, daily data from 3/27/1980 to 5/31/2023. This chart represents the Russell 2000® to 1000® ratio performance after the percent of S&P 500® stocks outperforming the index in last three months falls below 30%. All indices are unmanaged. It is not possible to invest directly in an index. Past performance does not guarantee future results.
In our opinion, the market’s advance, principally fueled by P/E expansion, the allure of AI stocks, and the hope for imminent Federal Reserve rate cuts, is destined to disappoint. Yet we believe this remains a constructive environment for value investors who are disciplined. We are focused on what the market is giving us and being extremely selective in identifying opportunities that can shine over the next the next market cycle, not just the coming quarter.
Fundamentally Yours,

Will Nasgovitz
President and Chief Executive Officer
1

| PORTFOLIO MANAGEMENT TEAM | 
Colin P. McWey, CFA 
Will R. Nasgovitz 
Troy W. McGlone, CFA | MANAGEMENT REPORT After taking risk off the table earlier in the year, investors scrambled back during the second quarter, sparked by better-than-expected inflation data, the resolution of the debt ceiling crisis in Washington, and newfound hope that the Federal Reserve might be done tightening. As a result, Growth outperformed Value in the first half of the year, and speculative Growth did even better. Our Mid Cap Value Fund Investor Class gained 8.0% for the first six months, leading the Russell Midcap® Value Index, which was up 5.23%. Our outperformance was driven by stock selection, particularly in the Technology, Consumer Discretionary, Real Estate, and Utilities sectors. We remain confident that effective stock selection will provide opportunities for good relative performance, and potentially downside protection, in a market where many uncertainties remain. We also believe Value will have an advantage going forward. That said, we do not rely on top-down forecasts to pick stocks. We build our portfolio through bottom-up stock selection, relying on our 10 Principles of Value Investing™ within a two-bucket approach. Among Value investors, there are those who prefer owning high-quality companies trading at decent bargains (“value") and others who focus on deeply discounted companies that have produced poor economic returns over time (“deep value”). Just as Growth and Value tend to take turns outperforming, these two styles within value investing also tend to alternate market leadership. Within the mid-cap space, choosing one while ignoring the other does not seem prudent, as this can cause a top-down bet to be introduced into the portfolio. In the Value bucket, Hasbro (HAS) is one of the world’s leading toy and game manufacturers with key franchises such as Peppa Pig, Play-Doh, My Little Pony, and Playskool. For several years, Hasbro’s returns on invested capital have been going the wrong way. That said, we believe the shares possess compelling turnaround and self-help potential. The company has made progress working down excess inventory at retailers. This progress comes in front of an impressive slate of new products and entertainment releases, including movies, which should help catalyze better sales. Hasbro is streamlining operations and strategic focus across its products/gaming/entertainment segments by allocating more resources to growing its larger brands, while simultaneously de-emphasizing smaller brands that have created unnecessary distraction in recent years. Additionally, we expect management to complete a partial divestiture of noncore assets in its entertainment segment to reduce expenses and relieve the burden of inefficiently deployed capital. Furthermore, we are encouraged by Hasbro’s undertaking of a $250-300 million multi-year cost-saving initiative and a necessary supply chain management overhaul. Our purchase of Hasbro shares was motivated by these operational/strategic changes, our confidence in the company’s ability to significantly expand operating margins, and compelling multiples of earnings, cashflow and invested capital. Also in value, Centene Corporation (CNC) is one of the largest managed health care insurance providers in the U.S. and the largest player in Medicaid. The stock has underperformed this year, as CNC faces reimbursement headwinds including a reduction in its 2024 Medicare Advantage premiums and higher healthcare utilization from the return of elective procedures. Investors also fear a potential loss of insured lives when Medicaid eligibility, which was expanded during the pandemic, gets redetermined in 2023-2024. CNC’s historical results have lacked the consistency demonstrated by premier large managed care companies. However, since 2021, the company has steadily upgraded its leadership ranks from the CEO on down through the executive ranks and line-of-business leaders. CNC’s executive leadership is comprised of industry veterans with a demonstrated record of success. Their executive compensation is clearly aligned with shareholder value creation, and they recently bought large amounts of CNC stock personally in the open market, demonstrating confidence in their prospects. Self-help initiatives are well underway and include noncore divestitures, material expense streamlining, improved digital capabilities, improved provider contracting, and meaningful share repurchases. In our estimation, the market is too focused on near-term overhangs that will prove temporary and disregards the substantial value creation opportunities that lie ahead. CNC trades at just 10X 2023 earnings compared to peers valued at mid/upper teens P/E ratios. After a brief pause caused by the reimbursement headwinds in 2024, we expect CNC to resume its 12-15% EPS growth rate, comparable to leading industry operators. This should help close the valuation gap. In the deep value bucket, Stericycle (SRCL) is the largest medical waste disposal and compliance company in the U.S. Over the past few years, the company has transformed itself from an aggressive, acquisition-driven company to one focused on organic growth, integrating core assets, reducing debt, and expanding profit margins. Toward that end, the company has undertaken several self-help strategies. This includes divesting non-core operations in order to focus on its core businesses of medical waste disposal and document destruction in the U.S. and Europe. Today, SRCL is largely complete with this portfolio reshaping and has successfully reduced debt to target levels. The critical action items left for the company pertain to integrating technology systems and demonstrating further progress in operational execution. In summary, SRCL is morphing from a “holding company” into an “operating company,” with the latter offering far better prospects of rewarding shareholders. Candidly, this is not our first time owning SRCL. The first time around, we became shareholders far too early in the company’s turnaround efforts and exited the position. However, we continue to monitor the progress made under a much-improved management team and expect a better outcome for shareholders going forward. Regulated waste companies with leading market shares and secular growth, like SRCL, trade at far more expensive multiples of EBITDA and free cash flow. Additionally, the company is significantly underearning its potential. As this dynamic changes, we can envision a virtuous circle where the company earns progressively higher trading multiples on higher earnings power. We remain focused on bottom-up stock selection because that is something that is within our control, unlike the stock market. We also believe this will remain a key determinant of success for our shareholders. CFA® is a registered trademark owned by the CFA Institute. |
2

FUND SUMMARY
| Average Annual Total Returns as of June 30, 2023 | Inception Date | Year to Date* | One Year | Three Years | Five Years | Since Inception |
| Investor Class (HRMDX) | 10/31/14 | 8.00% | 15.08% | 20.18% | 10.11% | 9.29% |
| Institutional Class (HNMDX) | 10/31/14 | 8.12% | 15.34% | 20.47% | 10.36% | 9.56% |
| Russell Midcap® Value Index | - | 5.23% | 10.50% | 15.04% | 6.84% | 7.33% |
Index Source: FactSet Research Systems, Inc., and Russell®.
* Not annualized.
In the prospectus dated 5/1/23, the Net Fund Operating Expenses After Fee Waiver and/or Expense Reimbursement for the Investor and Institutional Class are 1.10% and 0.85%, respectively. The Advisor has contractually agreed to waive its management fees and/or reimburse expenses of the Fund to ensure that Net Annual Operating Expenses do not exceed 1.10% of the Fund's average daily net assets for the Investor Class and 0.85% for the Institutional Class, through at least 4/5/2025, and subject thereafter to annual reapproval of the agreement by the Board of Directors. Without such waiver and/or reimbursements, the Gross Fund Operating Expenses would be 1.16% and 1.04% for the Investor and Institutional Class, respectively.
Past performance does not guarantee future results. Performance represents past performance; current returns may be lower or higher. The investment return and principal value will fluctuate so that an investor’s shares, when redeemed, may be worth more or less than the original cost. All returns reflect reinvested dividends and capital gains distributions, but do not reflect the deduction of taxes that an investor would pay on distributions or redemptions. Subject to certain exceptions, shares of a Fund redeemed or exchanged within 10 days of purchase are subject to a 2% redemption fee. Performance does not reflect this fee, which if deducted would reduce an individual’s return. To obtain performance through the most recent month end, call 800-432-7856, or visit www.heartlandadvisors.com.
HYPOTHETICAL GROWTH OF $10,000 SINCE INCEPTION - 10/31/14 - INVESTOR CLASS SHARES

SECTOR ALLOCATION - % OF EQUITY INVESTMENTS

Sector and Industry classifications are sourced from GICS®. The Global Industry Classification Standard (GICS®) is the exclusive intellectual property of MSCI Inc. (“MSCI”) and S&P Global Market Intelligence (“S&P”). Neither MSCI, S&P, their affiliates, nor any of their third party providers (“GICS Parties”) makes any representations or warranties, express or implied, with respect to GICS or the results to be obtained by the use thereof, and expressly disclaims all warranties, including warranties of accuracy, completeness, merchantability, and fitness for a particular purpose. The GICS Parties shall not have any liability for any direct, indirect, special, punitive, consequential, or any other damages (including lost profits) even if notified of such damages.
INVESTMENT GOAL
The Fund seeks long-term capital appreciation and modest current income.
INVESTMENT STRATEGY/DISTINGUISHING CHARACTERISTIC
The Fund seeks long-term capital appreciation. It invests in mid-size, dividend paying companies with a market cap range defined by the Russell Midcap® Index. The Fund utilizes Heartland's disciplined and time-tested 10 Principles of Value Investing™, designed to capture upside potential while minimizing downside risk.
INVESTMENT CONSIDERATIONS
The Fund invests in a smaller number of stocks (generally 40 to 60) than the average mutual fund. The performance of these holdings generally will increase the volatility of the Fund's returns. The Fund also invests in mid-sized companies on a value basis. Mid-sized securities generally are more volatile and less liquid than those of larger companies. There is no assurance that dividend-paying stocks will mitigate volatility. Value investments are subject to the risk that their intrinsic value may not be recognized by the broad market.
PORTFOLIO STATISTICS
| Number of holdings (excludes cash equivalents) | 42 |
| Net assets | $501.3 mil. |
| NAV (Investor Class) | $13.37 |
| NAV (Institutional Class) | $13.45 |
| Median market cap | $11.4 bil. |
| Weighted average market cap | $16.9 bil. |
TOP TEN HOLDINGS - % OF NET ASSETS (EXCLUDES CASH EQUIVALENTS)
| NOV, Inc. | 4.9 % |
| Teradata Corp. | 4.6 |
| Centene Corp. | 4.1 |
| PPG Industries, Inc. | 4.0 |
| FirstEnergy Corp. | 3.8 |
| Essex Property Trust, Inc. | 3.8 |
| CarMax, Inc. | 3.7 |
| Equity Commonwealth. | 3.4 |
| Qorvo, Inc. | 3.3 |
| Quest Diagnostics, Inc. | 3.1 |
Portfolio holdings, statistics, and manager views are subject to change without notice, and discussions of portfolio holdings are intended as illustrations of investment strategy, not as recommendations. Index definitions and investment terms are found on the page titled “Definitions and Disclosures.” All indices are unmanaged. It is not possible to invest directly in an index. All information, unless otherwise indicated, is as of 6/30/2023.
3

| PORTFOLIO MANAGEMENT TEAM | 
Brad A. Evans, CFA 
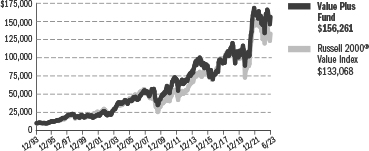
Andrew J. Fleming, CFA | MANAGEMENT REPORT At the start of the year, investors were scrambling for well-managed businesses with strong balance sheets, as the banking crisis refocused the market’s attention on fundamentals. But in the second quarter, the market’s appetite for risk taking returned in a big way and the types of financially sound companies we embrace — with consistent free cash flow generation to self-finance their organic growth and raise dividends over time — were largely ignored. As a result, this has proved to be a challenging market. Heartland Value Plus Fund Investor Class was up 0.27% in the first six months, versus a gain of 2.5% for the Russell 2000 Value Index. Factors we gravitate toward — such as low volatility, low leverage, and dividends — have not been working lately. While stock selection has been a leading driver of our performance over the long run, our selection effect was negative this year as the market has moved away from high-quality names with strong balance sheets. The new narrative in the market seems to indicate that the Federal Reserve may not simply be done tightening; it may be close to cutting rates shortly. It is not surprising, then, that speculative, low-quality stocks outperformed in the second quarter, since those types of equities led in the previous easing cycles. Underlying this line of thinking is the hope that the Federal Reserve has threaded the proverbial needle and is about to engineer a quick takeoff for the economy after achieving a ‘soft landing.’ While we do not view this as an impossibility, the chances of this occurring seem slim. By contrast, we think there is a high likelihood of some form of stagflation weighing on the economy going forward, and we continue to be positioned for this scenario. That said, we outperformed our benchmark in Consumer Staples, Utilities, Real Estate, and Industrials, where our stock selection added positive value. An example in industrials is Healthcare Services Group (HCSG), the leading provider of housekeeping and culinary services to skilled nursing facilities. As those healthcare providers scale, it makes sense for them to outsource ancillary services, yet currently only around 30% of skilled nursing facilities do so. The stock has come under pressure in recent years, as occupancy levels at their clients’ facilities plummeted during the global pandemic. Meanwhile, inflation in the aftermath of the pandemic disadvantaged HCSG’s contract pricing, meaning they were taking a hit on both revenues and costs. We believe those headwinds have abated. Not only is occupancy improving, the company’s two-year self-help strategy of renegotiating all contracts with all customers to include more dynamic pricing is finally starting to pay off. The company’s EBITDA margins fell to 4-4.5%, but our projections show them improving to 6.5% this year and 7.5% in 2024 on their way to a target of 10%. Today, the stock trades at 0.6 times enterprise value to sales. Yet when it was at this level of profitability in the past, the stock traded at 1.5 times EV/Sales. With more credit stress likely to come in this slow-growing economy, from our perspective, now is not the time to be distracted by all the bright, shiny objects that have garnered the market’s attention. It also seems more important than ever to have conviction about the companies we own. This means doing the work to assess the financial strength of every company under consideration, while confirming that each company’s self-help strategies remain intact and compelling. In our assessment, we hold many such names that are currently flying under the market’s radar. We see them as small kernels ready to pop. That may not happen in the coming weeks or months. But our goal is not to win the quarter; it is aligning the portfolio to outperform in the long run. CFA® is a registered trademark owned by the CFA Institute. |
4

FUND SUMMARY
| Average Annual Total Returns as of June 30, 2023 | Inception Date | Year to Date* | One Year | Three Years | Five Years | Ten Years | Fifteen Years | Twenty Years | Twenty-Five Years | Since Inception |
| Investor Class (HRVIX) | 10/26/93 | 0.27% | 7.77% | 15.15% | 6.43% | 7.20% | 7.17% | 9.11% | 8.24% | 9.71% |
| Institutional Class (HNVIX) | 5/1/08 | 0.41% | 8.04% | 15.43% | 6.68% | 7.44% | 7.44% | 9.31% | 8.40% | 9.84% |
| Russell 2000® Value Index | - | 2.50% | 6.01% | 15.43% | 3.54% | 7.29% | 7.72% | 8.29% | 7.62% | 9.09% |
Index Source: FactSet Research Systems, Inc., and Russell®.
* Not annualized.
In the prospectus dated 5/1/23, the Gross Fund Operating Expenses for the Investor and Institutional Class are 1.22% and 1.01%, respectively. The Advisor has voluntarily agreed to waive fees and/or reimburse expenses with respect to the Institutional Class, to the extent necessary to maintain the Institutional Class' Net Annual Operating Expenses at a ratio not to exceed 0.99% of average daily net assets. This voluntary waiver/reimbursement may be discontinued at any time. Without such waivers and/or reimbursements, total returns may have been lower.
Past performance does not guarantee future results. Performance for the Institutional Class prior to its initial offering is based on the performance of the Investor Class. Performance represents past performance; current returns may be lower or higher. The investment return and principal value will fluctuate so that an investor’s shares, when redeemed, may be worth more or less than the original cost. All returns reflect reinvested dividends and capital gains distributions, but do not reflect the deduction of taxes that an investor would pay on distributions or redemptions. Subject to certain exceptions, shares of a Fund redeemed or exchanged within 10 days of purchase are subject to a 2% redemption fee. Performance does not reflect this fee, which if deducted would reduce an individual’s return. To obtain performance through the most recent month end, call 800-432-7856, or visit www.heartlandadvisors.com.
HYPOTHETICAL GROWTH OF $10,000 SINCE INCEPTION - 10/26/93 - INVESTOR CLASS SHARES
SECTOR ALLOCATION - % OF EQUITY INVESTMENTS

Sector and Industry classifications are sourced from GICS®. The Global Industry Classification Standard (GICS®) is the exclusive intellectual property of MSCI Inc. (“MSCI”) and S&P Global Market Intelligence (“S&P”). Neither MSCI, S&P, their affiliates, nor any of their third party providers (“GICS Parties”) makes any representations or warranties, express or implied, with respect to GICS or the results to be obtained by the use thereof, and expressly disclaims all warranties, including warranties of accuracy, completeness, merchantability, and fitness for a particular purpose. The GICS Parties shall not have any liability for any direct, indirect, special, punitive, consequential, or any other damages (including lost profits) even if notified of such damages.
INVESTMENT GOAL
The Fund seeks long-term capital appreciation and modest current income.
INVESTMENT STRATEGY/DISTINGUISHING CHARACTERISTIC
The Fund seeks to capture the long-term capital appreciation of small-cap stocks, while potentially mitigating volatility by focusing on dividend-paying companies. The Fund utilizes Heartland's disciplined and time-tested 10 Principles of Value Investing™, designed to capture upside potential while minimizing downside risk.
INVESTMENT CONSIDERATIONS
The Fund invests in small companies that are generally less liquid and more volatile than large companies. The Fund also invests in a smaller number of stocks (generally 40 to 70) than the average mutual fund. The performance of these holdings generally will increase the volatility of the Fund's returns. Value investments are subject to the risk that their intrinsic value may not be recognized by the broad market.
PORTFOLIO STATISTICS
| Number of holdings (excludes cash equivalents) | 42 |
| Net assets | $440.2 mil. |
| NAV (Investor Class) | $36.97 |
| NAV (Institutional Class) | $36.73 |
| Median market cap | $1.7 bil. |
| | |
| Weighted average market cap | $2.3 bil. |
TOP TEN HOLDINGS - % OF NET ASSETS (EXCLUDES CASH EQUIVALENTS)
| Powell Industries, Inc. | 4.8% |
| PotlatchDeltic Corp. | 4.1 |
| Texas Capital Bancshares, Inc. | 3.7 |
| TreeHouse Foods, Inc. | 3.4 |
| Haemonetics Corp. | 3.4 |
| Carter's, Inc. | 3.3 |
| Comstock Resources, Inc. | 3.3 |
| Avanos Medical, Inc. | 3.2 |
| Granite Construction, Inc. | 2.9 |
| The Hanover Insurance Group, Inc. | 2.8 |
Portfolio holdings, statistics, and manager views are subject to change without notice, and discussions of portfolio holdings are intended as illustrations of investment strategy, not as recommendations. Index definitions and investment terms are found on the page titled “Definitions and Disclosures.” All indices are unmanaged. It is not possible to invest directly in an index. All information, unless otherwise indicated, is as of 6/30/2023.
5

| PORTFOLIO MANAGEMENT TEAM | 
Bill J. Nasgovitz 
Will R. Nasgovitz | MANAGEMENT REPORT “The easiest way to solve a problem is to deny it exists.” —Isaac Asimov It was not surprising that risk-taking returned to the market, just a few months after a series of bank failures in March seemed to scare investors straight. Denial is a natural phase in the investment cycle, coming after delusion but preceding capitulation and despair. It helped propel the NASDAQ Composite Index, a beneficiary of the recent frenzy over artificial intelligence stocks, up more than 30% for the first six months. By contrast, the Russell 2000® Value Index gained just 2.50% in the first six months. The Heartland Value Fund Investor Class outperformed the benchmark with a return of 5.97%. Stock selection provided a boost in the first six months, particularly in Financials, Health Care, Consumer Discretionary, Real Estate, Materials, and Utilities — sectors where we outpaced the small cap value index. Yet denying problems exist — such as the Federal Reserve’s still-restrictive monetary policy, 5.4% yields on 6-month T-bills that are tough competition for equities, and 14 consecutive monthly declines in the Leading Economic Indicators — does not make them go away. We believe investors will begin recognizing this once the markets price in growing credit and solvency risks. Our approach in these moments is to be patient and add to holdings with attractive risk/reward characteristics that fit our 10 Principles of Value Investing™. We remain focused on uncovering businesses with strong leadership and resilient balance sheets offering compelling valuations. Mohawk (MHK), a new position, is a perfect example of a stock that has “come to us.” A leading manufacturer of flooring including carpets, tiles, and wood and vinyl products for the residential and commercial markets, Mohawk ran into stiff headwinds in recent years owing to high inflation in its source materials. This compressed their margins, and the stock price was nearly cut in half between June 2021 and early 2023. We believe the worst of those pricing pressures are largely behind the business, which stands to benefit from several trends, including ongoing growth in home remodeling; the anticipated reacceleration of existing home sales once rates begin to stabilize; and office space conversions as the commercial real estate market struggles with hybrid work. We purchased the shares when they were selling at around 6 times our estimated 2024 earnings, even though the stock has historically traded at a P/E of 15. Electronic manufacturing services companies, like Benchmark Electronics (BHE), tend to do well in terms of profit and sales growth when things are good but poorly when times are bad, owing in part to their significant fixed cost overhead. Though management has shifted its production mix away from lower-margin and slower-growth segments (like advanced computing) and toward more profitable areas (like semi-cap equipment), BHE’s margins failed to deliver during the recent downturn in the semiconductor cycle. Moreover, recent moves to expand capacity to help customers “re-shore” manufacturing were not fully scaled, further weighing on profitability. This short-term disappointment caused the stock to sell-off sharply and approach our downside target, creating a compelling entry point. We believe management has now positioned the business in segments that will allow for above-average industry growth and margin expansion. BHE trades at 12 times 2023 earnings and 10 times 2024 profits. By comparison, industry peers with similar growth and margin expansion opportunities are trading at P/E ratios (based on 2024 earnings) in the low- to mid-teens. Healthcare Services Group (HCSG) manages housekeeping, laundry, dining, and nutritional services within the healthcare market. The stock has come under pressure in recent years, as occupancy levels at their clients’ skilled nursing facilities (SNFs) plummeted during the COVID shutdowns. Meanwhile, inflation in the aftermath of the pandemic disadvantaged HCSG’s contract pricing. We believe those headwinds have abated, as occupancy is improving, and the company is restructuring its agreements to include more dynamic pricing. There is also a significant opportunity to gain market share, as only 30% of SNFs currently outsource their housekeeping. Management’s efforts have guided EBITDA margins back to 6%. Today, HCSG sports a balance sheet that exceeds our expectations with net cash and strong free cash flow and trades at 0.6X enterprise value to sales. Yet when it was at this level of profitability in the past, the business was priced at 1.5X EV/Sales. Despite the speculative nature of this year’s rally, we believe this remains a constructive environment for value investors who are disciplined. We are focused on what the market is giving us, being extremely selective in identifying opportunities that can shine over the next market cycle, not just the coming quarters. |
| 6 | | |

FUND SUMMARY
| Average Annual Total Returns as of June 30, 2023 | | Inception Date | | | Year to Date* | | | One Year | | | Three Years | | | Five Years | | | Ten Years | | | Fifteen Years | | | Twenty Years | | | Twenty-Five Years | | | Since Inception | |
| Investor Class (HRTVX) | | | 12/28/84 | | | | 5.97 | % | | | 11.13 | % | | | 15.98 | % | | | 5.37 | % | | | 6.61 | % | | | 5.93 | % | | | 7.39 | % | | | 7.85 | % | | | 10.96 | % |
| Institutional Class (HNTVX) | | | 5/1/08 | | | | 6.06 | % | | | 11.27 | % | | | 16.14 | % | | | 5.51 | % | | | 6.77 | % | | | 6.11 | % | | | 7.53 | % | | | 7.96 | % | | | 11.04 | % |
| Russell 2000® Value Index | | | - | | | | 2.50 | % | | | 6.01 | % | | | 15.43 | % | | | 3.54 | % | | | 7.29 | % | | | 7.72 | % | | | 8.29 | % | | | 7.62 | % | | | 10.33 | % |
Index Source: FactSet Research Systems, Inc., and Russell®.
* Not annualized.
In the prospectus dated 5/1/23, the Gross Fund Operating Expenses for the Investor and Institutional Class are 1.09% and 0.98%, respectively.
Past performance does not guarantee future results. Performance for the Institutional Class prior to its initial offering is based on the performance of the Investor Class. Performance represents past performance; current returns may be lower or higher. The investment return and principal value will fluctuate so that an investor’s shares, when redeemed, may be worth more or less than the original cost. All returns reflect reinvested dividends and capital gains distributions, but do not reflect the deduction of taxes that an investor would pay on distributions or redemptions. Subject to certain exceptions, shares of a Fund redeemed or exchanged within 10 days of purchase are subject to a 2% redemption fee. Performance does not reflect this fee, which if deducted would reduce an individual’s return. To obtain performance through the most recent month end, call 800-432-7856, or visit www.heartlandadvisors.com.
HYPOTHETICAL GROWTH OF $10,000 SINCE INCEPTION –
12/28/84 - INVESTOR CLASS SHARES

SECTOR ALLOCATION - % OF EQUITY INVESTMENTS

Sector and Industry classifications are sourced from GICS®. The Global Industry Classification Standard (GICS®) is the exclusive intellectual property of MSCI Inc. (“MSCI”) and S&P Global Market Intelligence (“S&P”). Neither MSCI, S&P, their affiliates, nor any of their third party providers (“GICS Parties”) makes any representations or warranties, express or implied, with respect to GICS or the results to be obtained by the use thereof, and expressly disclaims all warranties, including warranties of accuracy, completeness, merchantability, and fitness for a particular purpose. The GICS Parties shall not have any liability for any direct, indirect, special, punitive, consequential, or any other damages (including lost profits) even if notified of such damages.
INVESTMENT GOAL
The Fund seeks long-term capital appreciation through investing in small companies.
INVESTMENT STRATEGY/DISTINGUISHING CHARACTERISTIC
The Fund seeks to capture long-term capital appreciation by investing in micro- and smallcap companies. The micro- and small-cap segment of the stock market is robust with thousands of publicly traded issues, many of which lack traditional Wall Street research coverage. Thus, we believe this market is often inefficient, mispricing businesses and offering opportunities for fundamental research-minded investors such as Heartland. The Fund utilizes Heartland's disciplined and time-tested 10 Principles of Value Investing™, designed to capture upside potential while minimizing downside risk.
INVESTMENT CONSIDERATIONS
The Fund invests primarily in small companies selected on a value basis. Such securities generally are more volatile and less liquid than those of larger companies. Value investments are subject to the risk that their intrinsic value may not be recognized by the broad market.
| PORTFOLIO STATISTICS | | | |
| Number of holdings (excludes cash equivalents) | | | 86 | |
| Net assets | $662.8 mil. | |
| NAV (Investor Class) | | $ | 42.97 | |
| NAV (Institutional Class) | | $ | 44.10 | |
| Median market cap | | | $1.1 bil. | |
| Weighted average market cap | | | $2.3 bil. | |
| TOP TEN HOLDINGS - % OF NET ASSETS (EXCLUDES CASH EQUIVALENTS) | | | |
| Encompass Health Corp. | | | 2.5 | % |
| Century Communities, Inc. | | | 2.3 | |
| Capital City Bank Group, Inc. | | | 2.3 | |
| Perrigo Co. PLC | | | 2.3 | |
| Radian Group, Inc. | | | 2.2 | |
| Texas Capital Bancshares, Inc. | | | 2.1 | |
| NOV, Inc. | | | 2.1 | |
| National Fuel Gas Co. | | | 1.9 | |
| Lincoln Educational Services Corp. | | | 1.9 | |
| Northwest Pipe Co. | | | 1.8 | |
Portfolio holdings, statistics, and manager views are subject to change without notice, and discussions of portfolio holdings are intended as illustrations of investment strategy, not as recommendations Index definitions and investment terms are found on the page titled “Definitions and Disclosures.” All indices are unmanaged. It is not possible to invest directly in an index. All information, unless otherwise indicated, is as of 6/30/2023.
7

| SECTOR ALLOCATION - % OF TOTAL INVESTMENTS |
The following table summarizes the sector classifications of each of the Heartland Funds as of June 30, 2023. These sectors represent groupings of industry classifications.
| | MID CAP VALUE FUND | VALUE PLUS FUND | VALUE FUND |
| Communication Services | 3.0% | 2.1% | 0.4% |
| Consumer Discretionary | 9.0 | 7.0 | 11.5 |
| Consumer Staples | 3.2 | 9.2 | 2.5 |
| Energy | 7.2 | 7.4 | 5.1 |
| Financials | 13.2 | 13.6 | 23.4 |
| Health Care | 13.3 | 12.6 | 11.6 |
| Industrials | 14.0 | 23.5 | 15.5 |
| Information Technology | 12.7 | 4.1 | 4.2 |
| Materials | 10.3 | 9.5 | 8.0 |
| Real Estate | 7.2 | 6.9 | 8.2 |
| Utilities | 6.3 | 2.7 | 5.9 |
| Short-Term Investments | 0.6 | 1.4 | 3.7 |
| Total | 100.0% | 100.0% | 100.0% |
Portfolio holdings, statistics, and manager views are subject to change without notice and discussions of portfolio holdings are intended as illustrations of investment strategy, not as recommendations.
8
THIS PAGE INTENTIONALLY LEFT BLANK
9
| HEARTLAND MID CAP VALUE FUND | SCHEDULE OF INVESTMENTS |
June 30, 2023 (Unaudited)
| | | SHARES | | | VALUE | |
| COMMON STOCKS (98.4%) | | |
| Automobiles (1.1%) | | | | | | |
| Thor Industries, Inc. | | | 52,798 | | | $ | 5,464,593 | |
| | | | | | | | | |
| Banks (3.8%) | | | | | | | | |
| PNC Financial Services Group, Inc. | | | 97,797 | | | | 12,317,532 | |
| Texas Capital Bancshares, Inc.(a) | | | 135,002 | | | | 6,952,603 | |
| | | | | | | | 19,270,135 | |
| Building Products (1.2%) | | | | | | | | |
| A.O. Smith Corp. | | | 83,083 | | | | 6,046,781 | |
| | | | | | | | | |
| Capital Markets (4.4%) | | | | | | | | |
| Interactive Brokers Group, Inc. | | | 134,390 | | | | 11,163,777 | |
| Northern Trust Corp. | | | 148,417 | | | | 11,003,637 | |
| | | | | | | | 22,167,414 | |
| Chemicals (6.7%) | | | | | | | | |
| FMC Corp. | | | 127,191 | | | | 13,271,109 | |
| PPG Industries, Inc. | | | 135,561 | | | | 20,103,696 | |
| | | | | | | | 33,374,805 | |
| Commercial Services & Supplies (1.6%) | | | | | | | | |
| Stericycle, Inc.(a) | | | 171,519 | | | | 7,965,342 | |
| | | | | | | | | |
| Containers & Packaging (3.5%) | | | | | | | | |
| Ball Corp. | | | 104,406 | | | | 6,077,473 | |
| Packaging Corp. of America | | | 87,238 | | | | 11,529,374 | |
| | | | | | | | 17,606,847 | |
| Electric Utilities (6.3%) | | | | | | | | |
| Constellation Energy Corp. | | | 135,263 | | | | 12,383,327 | |
| FirstEnergy Corp. | | | 491,719 | | | | 19,118,035 | |
| | | | | | | | 31,501,362 | |
| Electronic Equipment, Instruments & Components (1.1%) | | | | | | | | |
| TE Connectivity Ltd. | | | 37,919 | | | | 5,314,727 | |
| | | | | | | | | |
| Energy Equipment & Services (4.9%) | | | | | | | | |
| NOV, Inc. | | | 1,537,093 | | | | 24,654,972 | |
| Entertainment (1.6%) | | | | | | | | |
| Activision Blizzard, Inc. | | | 96,119 | | | | 8,102,832 | |
| Food Products (3.2%) | | | | | | | | |
| Conagra Brands, Inc. | | | 216,534 | | | | 7,301,527 | |
| Ingredion, Inc. | | | 82,752 | | | | 8,767,574 | |
| | | | | | | | 16,069,101 | |
| Ground Transportation (2.3%) | | | | | | | | |
| JB Hunt Transport | | | | | | | | |
| Services, Inc. | | | 64,879 | | | | 11,745,045 | |
| | | SHARES | | | VALUE | |
| Health Care Equipment & Supplies (2.0%) | | | | | | | | |
| DENTSPLY SIRONA, Inc. | | | 248,296 | | | $ | 9,936,806 | |
| Health Care Providers & Services (8.3%) | | | | | | | | |
| Centene Corp.(a) | | | 303,024 | | | | 20,438,969 | |
| Encompass Health Corp. | | | 80,758 | | | | 5,468,124 | |
| Quest Diagnostics, Inc. | | | 110,756 | | | | 15,567,863 | |
| | | | | | | | 41,474,956 | |
| Household Durables (2.4%) | | | | | | | | |
| Mohawk Industries, Inc.(a) | | | 117,779 | | | | 12,150,082 | |
| Insurance (4.7%) | | | | | | | | |
| First American Financial Corp. | | | 217,493 | | | | 12,401,451 | |
| Markel Group, Inc.(a) | | | 3,021 | | | | 4,178,587 | |
| Old Republic International Corp. | | | 287,439 | | | | 7,234,839 | |
| | | | | | | | 23,814,877 | |
| Leisure Products (1.7%) | | | | | | | | |
| Hasbro, Inc. | | | 134,544 | | | | 8,714,415 | |
| Machinery (5.1%) | | | | | | | | |
| Flowserve Corp. | | | 341,313 | | | | 12,679,778 | |
| Kennametal, Inc. | | | 452,150 | | | | 12,836,538 | |
| | | | | | | | 25,516,316 | |
| Marine Transportation (2.0%) | | | | | | | | |
| Kirby Corp.(a) | | | 133,584 | | | | 10,279,289 | |
| Media (1.4%) | | | | | | | | |
| Cable One, Inc. | | | 10,401 | | | | 6,834,289 | |
| Office REITs (3.4%) | | | | | | | | |
| Equity Commonwealth | | | 832,187 | | | | 16,860,109 | |
| | | | | | | | | |
| Oil, Gas & Consumable Fuels (2.2%) | | | | | | | | |
| Pioneer Natural Resources Co. | | | 53,326 | | | | 11,048,081 | |
| | | | | | | | | |
| Pharmaceuticals (2.9%) | | | | | | | | |
| Perrigo Co. PLC | | | 424,262 | | | | 14,403,695 | |
| Residential REITs (3.8%) | | | | | | | | |
| Essex Property Trust, Inc. | | | 81,006 | | | | 18,979,706 | |
| | | | | | | | | |
| Semiconductors & Semiconductor Equipment (6.9%) | | | | | | | | |
| Micron Technology, Inc. | | | 157,045 | | | | 9,911,110 | |
| Qorvo, Inc.(a) | | | 161,355 | | | | 16,463,051 | |
| Skyworks Solutions, Inc. | | | 73,755 | | | | 8,163,941 | |
| | | | | | | | 34,538,102 | |
| | | SHARES | | | VALUE | |
| Software (4.6%) | | | | | | |
| Teradata Corp.(a) | | | 431,662 | | | $ | 23,055,067 | |
| | | | | | | | | |
| Specialty Retail (3.7%) | | | | | | | | |
| CarMax, Inc.(a) | | | 220,973 | | | | 18,495,440 | |
| | | | | | | | | |
| Trading Companies & Distributors (1.6%) | | | | | | | | |
| Watsco, Inc. | | | 20,605 | | | | 7,860,189 | |
| TOTAL COMMON STOCKS |
| (Cost $452,470,200) | | $ | 493,245,375 | |
| | | INTEREST RATE | | | PAR AMOUNT | | | VALUE | |
| SHORT-TERM INVESTMENTS (0.6%) | | | | | | | | | |
| Time Deposits (0.6%) | | | | | | | | | |
| Citibank (New York) 07/03/2023(b) | | | 4.42 | % | | $ | 2,938,127 | | | $ | 2,938,127 | |
| TOTAL SHORT-TERM INVESTMENTS | | | | | |
| (Cost $2,938,127) | | | $ | 2,938,127 | |
| TOTAL INVESTMENTS - (99.0%) | | | | | |
| (Cost $455,408,327) | | | $ | 496,183,502 | |
| OTHER ASSETS AND LIABILITIES, NET - (1.0%) | | | | 5,098,083 | |
| TOTAL NET ASSETS - (100.0%) | | | $ | 501,281,585 | |
| The accompanying Notes to Financial Statements are an integral part of these Statements. |
| 10 | www.heartlandadvisors.com |
| HEARTLAND VALUE PLUS FUND | SCHEDULE OF INVESTMENTS |
| | June 30, 2023 (Unaudited) |
| | | SHARES | | | VALUE | |
| COMMON STOCKS (98.7%) | | | | | | |
| Aerospace & Defense (2.7%) | | | | | | |
| Park Aerospace Corp. | | | 855,000 | | | $ | 11,799,000 | |
| Banks (8.4%) | | | | | | | | |
| Glacier Bancorp, Inc. | | | 275,000 | | | | 8,571,750 | |
| Seacoast Banking Corp. of Florida | | | 550,000 | | | | 12,155,000 | |
| Texas Capital Bancshares, Inc.(a) | | | 315,000 | | | | 16,222,500 | |
| | | | | | | | 36,949,250 | |
| Capital Markets (2.5%) | | | | | | | | |
| Artisan Partners Asset | | | | | | | | |
| Management, Inc. (Class A) | | | 275,000 | | | | 10,810,250 | |
| | | | | | | | | |
| Chemicals (4.7%) | | | | | | | | |
| American Vanguard Corp. | | | 660,000 | | | | 11,794,200 | |
| Sensient Technologies Corp. | | | 125,000 | | | | 8,891,250 | |
| | | | | | | | 20,685,450 | |
| Commercial Services & Supplies (4.9%) | | | | | | | | |
| CoreCivic, Inc.(a) | | | 700,000 | | | | 6,587,000 | |
| Healthcare Services Group, Inc. | | | 700,000 | | | | 10,451,000 | |
| Stericycle, Inc.(a) | | | 100,000 | | | | 4,644,000 | |
| | | | | | | | 21,682,000 | |
| Construction & Engineering (2.9%) | | | | | | | | |
| Granite Construction, Inc. | | | 325,000 | | | | 12,928,500 | |
| | | | | | | | | |
| Diversified Telecommunication Services (2.1%) | | | | | | | | |
| ATN International, Inc. | | | 250,000 | | | | 9,150,000 | |
| | | | | | | | | |
| Electric Utilities (2.7%) | | | | | | | | |
| Portland General Electric Co. | | | 250,000 | | | | 11,707,500 | |
| | | | | | | | | |
| Electrical Equipment (5.6%) | | | | | | | | |
| Powell Industries, Inc. | | | 345,000 | | | | 20,903,550 | |
| Vicor Corp. | | | 70,000 | | | | 3,780,000 | |
| | | | | | | | 24,683,550 | |
| Electronic Equipment, Instruments & Components (4.1%) | | | | | | | | |
| Knowles Corp.(a) | | | 500,000 | | | | 9,030,000 | |
| Methode Electronics, Inc. | | | 275,000 | | | | 9,218,000 | |
| | | | | | | | 18,248,000 | |
| Energy Equipment & Services (4.1%) | | | | | | | | |
| ChampionX Corp. | | | 225,000 | | | | 6,984,000 | |
| Dril-Quip, Inc.(a) | | | 475,000 | | | | 11,053,250 | |
| | | | | | | | 18,037,250 | |
| | SHARES | | | VALUE | |
| Food Products (3.4%) | | | | | | |
| TreeHouse Foods, Inc.(a) | | | 300,000 | | | $ | 15,114,000 | |
| Ground Transportation (2.0%) | | | | | | | | |
| Heartland Express, Inc. | | | 550,000 | | | | 9,025,500 | |
| Health Care Equipment & Supplies (7.6%) | | | | | | | | |
| AngioDynamics, Inc.(a) | | | 450,000 | | | | 4,693,500 | |
| Avanos Medical, Inc.(a) | | | 550,000 | | | | 14,058,000 | |
| Haemonetics Corp.(a) | | | 175,000 | | | | 14,899,500 | |
| | | | | | | | 33,651,000 | |
| Health Care Technology (2.8%) | | | | | | | | |
| HealthStream, Inc. | | | 495,000 | | | | 12,157,200 | |
| Household Durables (1.6%) | | | | | | | | |
| MDC Holdings, Inc. | | | 150,000 | | | | 7,015,500 | |
| Household Products (5.8%) | | | | | | | | |
| Oil-Dri Corp. of America | | | 205,000 | | | | 12,092,950 | |
| Reynolds Consumer Products, Inc. | | | 125,000 | | | | 3,531,250 | |
| Spectrum Brands Holdings, Inc. | | | 125,000 | | | | 9,756,250 | |
| | | | | | | | 25,380,450 | |
| Insurance (2.8%) | | | | | | | | |
| The Hanover Insurance Group, Inc. | | | 110,000 | | | | 12,433,300 | |
| | | | | | | | | |
| Machinery (5.3%) | | | | | | | | |
| Astec Industries, Inc. | | | 175,000 | | | | 7,952,000 | |
| Douglas Dynamics, Inc. | | | 175,000 | | | | 5,229,000 | |
| Enerpac Tool Group Corp. (Class A) | | | 375,000 | | | | 10,125,000 | |
| | | | | | | | 23,306,000 | |
| Metals & Mining (4.8%) | | | | | | | | |
| Royal Gold, Inc. | | | 105,000 | | | | 12,051,900 | |
| Schnitzer Steel Industries, Inc. (Class A) | | | 310,000 | | | | 9,296,900 | |
| | | | | | | | 21,348,800 | |
| Oil, Gas & Consumable Fuels (3.3%) | | | | | | | | |
| Comstock Resources, Inc. | | | 1,250,000 | | | | 14,500,000 | |
| Pharmaceuticals (2.2%) | | | | | | | | |
| Phibro Animal Health Corp. (Class A) | | | 700,000 | | | | 9,590,000 | |
| Specialized REITs (6.9%) | | | | | | | | |
| Farmland Partners, Inc. | | | 600,000 | | | | 7,326,000 | |
| Lamar Advertising Co. (Class A) | | | 50,000 | | | | 4,962,500 | |
| PotlatchDeltic Corp. | | | 340,000 | | | | 17,969,000 | |
| | | | | | | | 30,257,500 | |
| | | SHARES | | | VALUE | |
| Specialty Retail (2.2%) | | | | | | |
| Monro, Inc. | | 235,000 | | $ | 9,548,050 | |
| Textiles, Apparel & Luxury Goods (3.3%) | | | | | | | | |
| Carter's, Inc. | | | 200,000 | | | | 14,520,000 | |
| TOTAL COMMON STOCKS | | | | | | | | |
| (Cost $409,007,904) | | | | | | $ | 434,528,050 | |
| | | INTEREST RATE | | | PAR AMOUNT | | | VALUE | |
| SHORT-TERM INVESTMENTS (1.5%) | | | | | | | | | |
| Time Deposits (1.5%) | | | | | | | | | |
| Citibank (New York) 07/03/2023(b) | | | 4.42 | % | | $ | 6,298,046 | | | $ | 6,298,046 | |
| TOTAL SHORT-TERM INVESTMENTS | | | | | |
| (Cost $6,298,046) | | | $ | 6,298,046 | |
| TOTAL INVESTMENTS - (100.2%) | | | | | |
| (Cost $415,305,950) | | | $ | 440,826,096 | |
| OTHER ASSETS AND LIABILITIES, NET - (-0.2%) | | | | (675,002 | ) |
| TOTAL NET ASSETS - (100.0%) | | | $ | 440,151,094 | |
| The accompanying Notes to Financial Statements are an integral part of these Statements. |
| Semi-Annual Report | June 30, 2023 | 11 |
| HEARTLAND VALUE FUND | SCHEDULE OF INVESTMENTS |
| | June 30, 2023 (Unaudited) |
| | | SHARES | | | VALUE | |
| COMMON STOCKS (96.9%) | | | | | | |
| Aerospace & Defense (1.6%) | | | | | | |
| BWX Technologies, Inc. | | | 150,000 | | | $ | 10,735,500 | |
| Automobile Components (1.0%) | | | | | | | | |
| Linamar Corp. (CAD)(c) | | | 120,000 | | | | 6,306,397 | |
| Automobiles (1.2%) | | | | | | | | |
| Thor Industries, Inc. | | | 80,000 | | | | 8,280,000 | |
| Banks (10.9%) | | | | | | | | |
| Associated Banc-Corp | | | 400,000 | | | | 6,492,000 | |
| Canadian Western Bank (CAD)(c) | | | 500,000 | | | | 9,330,062 | |
| Capital City Bank Group, Inc. | | | 500,000 | | | | 15,320,000 | |
| First Internet Bancorp | | | 250,000 | | | | 3,712,500 | |
| First Interstate | | | | | | | | |
| BancSystem, Inc. (Class A) | | | 150,000 | | | | 3,576,000 | |
| Glacier Bancorp, Inc. | | | 200,000 | | | | 6,234,000 | |
| Heritage Financial Corp. | | | 400,000 | | | | 6,468,000 | |
| Texas Capital Bancshares, Inc.(a) | | | 275,000 | | | | 14,162,500 | |
| TriCo Bancshares | | | 200,000 | | | | 6,640,000 | |
| | | | | | | | 71,935,062 | |
| | | | | | | | | |
| Beverages (1.3%) | | | | | | | | |
| Primo Water Corp. | | | 700,000 | | | | 8,778,000 | |
| | | | | | | | | |
| Chemicals (2.5%) | | | | | | | | |
| Core Molding | | | | | | | | |
| Technologies, Inc.(a) | | | 200,000 | | | | 4,550,000 | |
| Nufarm, Ltd. (AUD)(c)(d) | | | 2,000,000 | | | | 6,810,111 | |
| Orion SA | | | 250,000 | | | | 5,305,000 | |
| | | | | | | | 16,665,111 | |
| | | | | | | | | |
| Commercial Services & Supplies (2.7%) | | | | | | | | |
| CECO Environmental Corp.(a) | | | 550,000 | | | | 7,348,000 | |
| Healthcare Services Group, Inc. | | | 350,000 | | | | 5,225,500 | |
| Perma-Fix Environmental Services, Inc.(a) | | | 500,000 | | | | 5,490,000 | |
| | | | | | | | 18,063,500 | |
| | | | | | | | | |
| Communications Equipment (0.1%) | | | | | | | | |
| AudioCodes, Ltd. | | | 100,000 | | | | 913,000 | |
| | | | | | | | | |
| Construction & Engineering (1.8%) | | | | | | | | |
| Northwest Pipe Co.(a) | | | 395,000 | | | | 11,944,800 | |
| | | | | | | | | |
| Construction Materials (0.7%) | | | | | | | | |
| Knife River Corp.(a) | | | 100,000 | | | | 4,350,000 | |
| | | SHARES | | | VALUE | |
| Consumer Finance (1.0%) | | | | | | | | |
| Ezcorp, Inc. (Class A)(a) | | | 800,000 | | | $ | 6,704,000 | |
| | | | | | | | | |
| Containers & Packaging (1.3%) | | | | | | | | |
| Westrock Co. | | | 300,000 | | | | 8,721,000 | |
| | | | | | | | | |
| Diversified Consumer Services (2.9%) | | | | | | | | |
| Carriage Services, Inc. | | | 200,000 | | | | 6,494,000 | |
| Lincoln Educational Services Corp.(a)(e) | | | 1,850,000 | | | | 12,469,000 | |
| | | | | | | | 18,963,000 | |
| | | | | | | | | |
| Diversified REITs (1.0%) | | | | | | | | |
| Alpine Income Property Trust, Inc. | | | 400,000 | | | | 6,500,000 | |
| | | | | | | | | |
| Electric Utilities (1.7%) | | | | | | | | |
| ALLETE, Inc. | | | 200,000 | | | | 11,594,000 | |
| | | | | | | | | |
| Electrical Equipment (1.4%) | | | | | | | | |
| Orion Energy Systems, Inc.(a) | | | 900,000 | | | | 1,467,000 | |
| Thermon Group Holdings, Inc.(a) | | | 300,000 | | | | 7,980,000 | |
| | | | | | | | 9,447,000 | |
| | | | | | | | | |
| Electronic Equipment, Instruments & Components (1.3%) | | | | | | | | |
| Advanced Energy Industries, Inc. | | | 25,000 | | | | 2,786,250 | |
| Benchmark Electronics, Inc. | | | 225,000 | | | | 5,811,750 | |
| | | | | | | | 8,598,000 | |
| | | | | | | | | |
| Energy Equipment & Services (2.8%) | | | | | | | | |
| Dril-Quip, Inc.(a) | | | 200,000 | | | | 4,654,000 | |
| NOV, Inc. | | | 850,000 | | | | 13,634,000 | |
| | | | | | | | 18,288,000 | |
| | | | | | | | | |
| Financial Services (8.4%) | | | | | | | | |
| Cantaloupe, Inc.(a) | | | 900,000 | | | | 7,164,000 | |
| Cass Information Systems, Inc. | | | 225,682 | | | | 8,751,948 | |
| EVERTEC, Inc. | | | 200,000 | | | | 7,366,000 | |
| I3 Verticals, Inc. (Class A)(a) | | | 450,000 | | | | 10,287,000 | |
| MGIC Investment Corp. | | | 500,000 | | | | 7,895,000 | |
| Radian Group, Inc. | | | 565,395 | | | | 14,293,185 | |
| | | | | | | | 55,757,133 | |
| | | | | | | | | |
| Food Products (1.1%) | | | | | | | | |
| MamaMancini's Holdings, Inc.(a) | | | 950,000 | | | | 2,869,000 | |
| SunOpta, Inc.(a) | | | 700,000 | | | | 4,683,000 | |
| | | | | | | | 7,552,000 | |
| | | | | | | | | |
| Gas Utilities (1.9%) | | | | | | | | |
| National Fuel Gas Co. | | | 250,000 | | | | 12,840,000 | |
| | | SHARES | | | VALUE | |
| Ground Transportation (0.5%) | | | | | | |
| Marten Transport, Ltd. | | | 150,000 | | | $ | 3,225,000 | |
| | | | | | | | | |
| Health Care Equipment & Supplies (3.5%) | | | | | | | | |
| Accuray, Inc.(a) | | | 2,000,000 | | | | 7,740,000 | |
| Haemonetics Corp.(a) | | | 100,000 | | | | 8,514,000 | |
| Integer Holdings Corp.(a) | | | 75,000 | | | | 6,645,750 | |
| | | | | | | | 22,899,750 | |
| | | | | | | | | |
| Health Care Providers & Services (4.8%) | | | | | | | | |
| Encompass Health Corp. | | | 240,000 | | | | 16,250,400 | |
| InfuSystem Holdings, Inc.(a) | | | 425,000 | | | | 4,092,750 | |
| Patterson Cos., Inc. | | | 350,000 | | | | 11,641,000 | |
| | | | | | | | 31,984,150 | |
| | | | | | | | | |
| Health Care Technology (0.4%) | | | | | | | | |
| Computer Programs and Systems, Inc.(a) | | | 100,000 | | | | 2,469,000 | |
| | | | | | | | | |
| Hotel & Resort REITs (1.7%) | | | | | | | | |
| Sunstone Hotel Investors, Inc. | | | 1,100,000 | | | | 11,132,000 | |
| | | | | | | | | |
| Hotels, Restaurants & Leisure (1.7%) | | | | | | | | |
| Everi Holdings, Inc.(a) | | | 300,000 | | | | 4,338,000 | |
| Potbelly Corp.(a) | | | 800,000 | | | | 7,024,000 | |
| | | | | | | | 11,362,000 | |
| | | | | | | | | |
| Household Durables (3.9%) | | | | | | | | |
| Century Communities, Inc. | | | 200,000 | | | | 15,324,000 | |
| Mohawk Industries, Inc.(a) | | | 100,000 | | | | 10,316,000 | |
| | | | | | | | 25,640,000 | |
| | | | | | | | | |
| Insurance (3.3%) | | | | | | | | |
| International General Insurance Holdings, Ltd. | | | 550,000 | | | | 4,917,000 | |
| Old Republic International Corp. | | | 150,000 | | | | 3,775,500 | |
| Stewart Information Services Corp. | | | 185,000 | | | | 7,610,900 | |
| Tiptree, Inc. | | | 350,000 | | | | 5,253,500 | |
| | | | | | | | 21,556,900 | |
| | | | | | | | | |
| Life Sciences Tools & Services (0.7%) | | | | | | | | |
| Harvard Bioscience, Inc.(a) | | | 850,000 | | | | 4,666,500 | |
| | | | | | | | | |
| Machinery (3.8%) | | | | | | | | |
| Flowserve Corp. | | | 200,000 | | | | 7,430,000 | |
| Luxfer Holdings PLC | | | 175,000 | | | | 2,490,250 | |
| Shyft Group, Inc. | | | 500,000 | | | | 11,030,000 | |
| Twin Disc, Inc.(a) | | | 400,000 | | | | 4,504,000 | |
| | | | | | | | 25,454,250 | |
| | | | | | | | | |
| Media (0.4%) | | | | | | | | |
| WideOpenWest, Inc.(a) | | | 350,000 | | | | 2,954,000 | |
| The accompanying Notes to Financial Statements are an integral part of these Statements. |
| 12 | www.heartlandadvisors.com |
| HEARTLAND VALUE FUND | SCHEDULE OF INVESTMENTS |
| | June 30, 2023 (Unaudited) |
| | | SHARES | | | VALUE | |
| Metals & Mining (3.6%) | | | | | | | | |
| Centerra Gold, Inc. | | | 1,800,000 | | | $ | 10,800,000 | |
| Major Drilling Group | | | | | | | | |
| International, Inc. (CAD)(c)(a) | | | 1,000,000 | | | | 6,899,415 | |
| Osisko Gold Royalties, Ltd. | | | 400,000 | | | | 6,148,000 | |
| | | | | | | | 23,847,415 | |
| Oil, Gas & Consumable Fuels (2.3%) | | | | | | | | |
| Berry Corp. (Class A) | | | 1,000,000 | | | | 6,880,000 | |
| Denbury, Inc.(a) | | | 100,000 | | | | 8,626,000 | |
| | | | | | | | 15,506,000 | |
| Pharmaceuticals (2.3%) | | | | | | | | |
| Perrigo Co. PLC | | | 450,000 | | | | 15,277,500 | |
| Professional Services (2.6%) | | | | | | | | |
| Barrett Business Services, Inc. | | | 135,000 | | | | 11,772,000 | |
| Hudson Global, Inc.(a)(e) | | | 252,700 | | | | 5,440,631 | |
| | | | | | | | 17,212,631 | |
| Real Estate Management & Development (1.6%) | | | | | | | | |
| Forestar Group, Inc.(a) | | | 475,000 | | | | 10,711,250 | |
| Residential REITs (2.0%) | | | | | | | | |
BSR Real Estate Investment Trust (CAD)(c) | | | 400,300 | | | | 5,127,829 | |
| UMH Properties, Inc. | | | 500,000 | | | | 7,990,000 | |
| | | | | | | | 13,117,829 | |
| Semiconductors & Semiconductor Equipment (2.8%) | | | | | | | | |
| Photronics, Inc.(a) | | | 300,000 | | | | 7,737,000 | |
| Silicon Motion Technology Corp. (ADR) | | | 150,000 | | | | 10,779,000 | |
| | | | | | | | 18,516,000 | |
| Specialized REITs (2.0%) | | | | | | | | |
| National Storage Affiliates Trust | | | 225,000 | | | | 7,836,750 | |
| PotlatchDeltic Corp. | | | 100,000 | | | | 5,285,000 | |
| | | | | | | | 13,121,750 | |
| Specialty Retail (0.3%) | | | | | | | | |
| Envela Corp. | | | 240,388 | | | | 1,769,256 | |
| Textiles, Apparel & Luxury Goods (0.7%) | | | | | | | | |
| Carter's, Inc. | | | 60,000 | | | | 4,356,000 | |
| Trading Companies & Distributors (1.1%) | | | | | | | | |
| NOW, Inc.(a) | | | 700,000 | | | | 7,252,000 | |
| | | SHARES | | | VALUE | |
| Water Utilities (2.3%) | | | | | | |
| Consolidated Water Co., Ltd. | | | 400,000 | | | $ | 9,692,000 | |
| Pure Cycle Corp.(a) | | | 500,000 | | | | 5,500,000 | |
| | | | | | | | 15,192,000 | |
| TOTAL COMMON STOCKS | | | | | | | | |
| (Cost $518,863,264) | | | | | | $ | 642,158,684 | |
| | | INTEREST RATE | | | PAR AMOUNT | | | VALUE | |
| SHORT-TERM INVESTMENTS (3.7%) | | | | | | | | | |
| Time Deposits (3.7%) | | | | | | | | | |
| Citibank (New York) 07/03/2023(b) | | | 4.42 | % | | $ | 24,724,430 | | | $ | 24,724,430 | |
| TOTAL SHORT-TERM INVESTMENTS | | | | | |
| (Cost $24,724,430) | | | $ | 24,724,430 | |
| TOTAL INVESTMENTS - (100.6%) | | | | | |
| (Cost $543,587,694) | | | $ | 666,883,114 | |
| OTHER ASSETS AND LIABILITIES, NET - (-0.6%) | | | | (4,121,083 | ) |
| TOTAL NET ASSETS - (100.0%) | | | $ | 662,762,031 | |
| The accompanying Notes to Financial Statements are an integral part of these Statements. | |
| Semi-Annual Report | June 30, 2023 | 13 |
| HEARTLAND FUNDS | SCHEDULES OF INVESTMENTS - FOOTNOTES |
| | June 30, 2023 (Unaudited) |
| (a) | Non-income producing security. Includes securities which did not pay at least one dividend in the year preceding the date of this statement. |
| (b) | Time deposits are considered short-term obligations and are payable on demand. Interest rates change periodically on specified dates. The rate listed is the 7-day yield as of June 30, 2023. |
| (c) | Traded in a foreign country. |
| (d) | Classified as Level 2. Valued using methods determined by the Board of Directors or using systematic fair valuation model provided by an independent pricing service. See Note 3 in Notes to Financial Statements. |
| (e) | Affiliated company. See Note 10 to Notes to Financial Statements. |
Common Abbreviations:
| ADR | American Depositary Receipt. |
| Ltd. | Limited. |
| PLC | Public Limited Company is a publicly traded company which signifies that shareholders have limited liability. |
Currency Abbreviations:
| CAD | Canadian Dollar |
| AUD | Australian Dollar |
Percentages are stated as a percent of net assets.
Sector and Industry classifications are sourced from GICS®, The Global Industry Classification Standard (GICS®) is the exclusive intellectual property of MSCI Inc. (“MSCI”) and S&P Global Market Intelligence ("S&P"). Neither MSCI, S&P, their affiliates, nor any of their third party providers (“GICS Parties”) makes any representations or warranties, express or implied, with respect to GICS or the results to be obtained by the use thereof, and expressly disclaims all warranties, including warranties of accuracy, completeness, merchantability and fitness for a particular purpose. The GICS Parties shall not have any liability for any direct, indirect, special, punitive, consequential, or any other damages (including lost profits) even if notified of such damages.
| The accompanying Notes to Financial Statements are an integral part of these Statements. |
| 14 | www.heartlandadvisors.com |
| HEARTLAND FUNDS | STATEMENTS OF ASSETS AND LIABILITIES |
| | June 30, 2023 (Unaudited) |
| | | MID CAP VALUE FUND | | | VALUE PLUS FUND | | | VALUE FUND | |
| ASSETS: | | | | | | | | | |
| Investments in securities, at cost(a) | | $ | 455,408,327 | | | $ | 415,305,950 | | | $ | 543,587,694 | |
| Investments in securities, at value | | $ | 496,183,502 | | | $ | 440,826,096 | | | $ | 648,973,483 | |
| Investments in affiliates, at value (See Note 10) | | | - | | | | - | | | | 17,909,631 | |
| Total Investments, at value | | | 496,183,502 | | | | 440,826,096 | | | | 666,883,114 | |
| Receivable for securities sold | | | 3,954,934 | | | | 290,013 | | | | 603,299 | |
| Accrued dividends and interest | | | 658,401 | | | | 387,948 | | | | 381,231 | |
| Receivable for capital shares issued | | | 903,693 | | | | 78,373 | | | | 147,315 | |
| Prepaid expenses | | | 81,897 | | | | 33,488 | | | | 46,367 | |
| Total Assets | | | 501,782,427 | | | | 441,615,918 | | | | 668,061,326 | |
| LIABILITIES: | | | | | | | | | | | | |
| Payable for securities purchased | | | - | | | | 1,122,885 | | | | 4,358,278 | |
| Payable for capital shares redeemed | | | 375,291 | | | | 112,433 | | | | 751,913 | |
| Accrued expenses | | | | | | | | | | | | |
| Management fees | | | 27,476 | | | | 25,142 | | | | 40,469 | |
| Distribution fees - Investor Class | | | 4,757 | | | | 5,539 | | | | 7,309 | |
| Fund accounting fees | | | 19,930 | | | | 22,202 | | | | 36,193 | |
| Transfer agency fees | | | 31,619 | | | | 48,611 | | | | 34,743 | |
| Custody fees | | | 3,501 | | | | 6,645 | | | | 10,093 | |
| Audit fees | | | 12,143 | | | | 11,124 | | | | 16,643 | |
| Printing fees | | | 26,125 | | | | 69,536 | | | | 40,987 | |
| Other | | | - | | | | 40,707 | | | | 2,667 | |
| Total Liabilities | | | 500,842 | | | | 1,464,824 | | | | 5,299,295 | |
| TOTAL NET ASSETS | | $ | 501,281,585 | | | $ | 440,151,094 | | | $ | 662,762,031 | |
| | | | | | | | | | | | | |
| NET ASSETS CONSIST OF: | | | | | | | | | | | | |
| Paid-in capital | | $ | 447,669,781 | | | $ | 401,985,888 | | | $ | 509,530,808 | |
| Total distributable earnings | | | 53,611,804 | | | | 38,165,206 | | | | 153,231,223 | |
| TOTAL NET ASSETS | | $ | 501,281,585 | | | $ | 440,151,094 | | | $ | 662,762,031 | |
| | | | | | | | | | | | | |
| NET ASSET VALUE, OFFERING PRICE & REDEMPTION PRICE PER SHARE: | | | | | | | | | | | | |
| INVESTOR CLASS: | | | | | | | | | | | | |
| Net assets | | $ | 233,974,591 | | | $ | 271,833,820 | | | $ | 598,290,851 | |
| Shares outstanding | | | 17,502,099 | | | | 7,353,342 | | | | 13,925,041 | |
| NET ASSET VALUE, OFFERING PRICE & REDEMPTION PRICE PER SHARE | | $ | 13.37 | | | $ | 36.97 | | | $ | 42.97 | |
| INSTITUTIONAL CLASS: | | | | | | | | | | | | |
| Net assets | | $ | 267,306,994 | | | $ | 168,317,274 | | | $ | 64,471,180 | |
| Shares outstanding | | | 19,870,977 | | | | 4,582,618 | | | | 1,461,826 | |
| NET ASSET VALUE, OFFERING PRICE & REDEMPTION PRICE PER SHARE | | $ | 13.45 | | | $ | 36.73 | | | $ | 44.10 | |
| (a) | Includes cost of investments in affiliates of $- for the Mid Cap Value Fund, $- for the Value Plus Fund and $17,413,126 for the Value Fund. See Note 10 in the Notes to Financial Statements. |
| The accompanying Notes to Financial Statements are an integral part of these Statements. | |
| Semi-Annual Report | June 30, 2023 | 15 |
| HEARTLAND FUNDS | STATEMENTS OF OPERATIONS |
| | For the Six Months Ended June 30, 2023 (Unaudited) |
| | | MID CAP VALUE FUND | | | VALUE PLUS FUND | | | VALUE FUND | |
| INVESTMENT INCOME: | | | | | | | | | |
| Dividends(a) | | $ | 4,580,514 | | | $ | 4,957,230 | | | $ | 5,737,531 | |
| Interest | | | 132,900 | | | | 411,222 | | | | 661,335 | |
| Foreign taxes withheld | | | - | | | | (286 | ) | | | (106,147 | ) |
| Total Investment Income | | | 4,713,414 | | | | 5,368,166 | | | | 6,292,719 | |
| | | | | | | | | | | | | |
| EXPENSES: | | | | | | | | | | | | |
| Management fees | | | 1,562,681 | | | | 1,569,238 | | | | 2,447,583 | |
| Distribution fees - Investor Class | | | 274,090 | | | | 338,662 | | | | 576,638 | |
| Transfer agency fees | | | 215,945 | | | | 271,546 | | | | 237,172 | |
| Fund accounting fees | | | 68,359 | | | | 75,258 | | | | 108,321 | |
| Custodian fees | | | 10,217 | | | | 13,301 | | | | 21,348 | |
| Printing and communication fees | | | 5,832 | | | | 12,071 | | | | 8,196 | |
| Postage fees | | | 8,673 | | | | 17,371 | | | | 8,996 | |
| Legal fees | | | 27,859 | | | | 35,405 | | | | 51,803 | |
| Registration fees | | | 20,145 | | | | 23,056 | | | | 4,952 | |
| Directors’ fees | | | 40,588 | | | | 51,760 | | | | 76,373 | |
| Audit and tax fees | | | 10,945 | | | | 12,186 | | | | 9,574 | |
| Insurance fees | | | 15,129 | | | | 19,815 | | | | 29,918 | |
| Other expenses | | | 11,065 | | | | 13,054 | | | | 20,669 | |
| Total Expenses before waivers | | | 2,271,528 | | | | 2,452,723 | | | | 3,601,543 | |
| Expenses waived by investment advisor (See Note 6) | | | 222,775 | | | | - | | | | - | |
| Total Expenses after waivers | | | 2,048,753 | | | | 2,452,723 | | | | 3,601,543 | |
| NET INVESTMENT INCOME | | | 2,664,661 | | | | 2,915,443 | | | | 2,691,176 | |
| | | | | | | | | | | | | |
| REALIZED & UNREALIZED GAINS (LOSSES) ON INVESTMENTS, AND TRANSLATION OF ASSETS AND LIABILITIES IN FOREIGN CURRENCY | | |
| Net realized gains (losses) on: | | | | | | | | | | | | |
| Investments | | | 11,746,487 | | | | 9,806,176 | | | | 29,869,341 | |
| Investments - Affiliated securities (See Note 10) | | | - | | | | - | | | | (747,754 | ) |
| Foreign currency translation | | | - | | | | - | | | | (9,320 | ) |
| Net change in unrealized appreciation (depreciation) on: | | | | | | | | | | | | |
| Investments | | | 18,965,758 | | | | (12,934,072 | ) | | | (1,132,587 | ) |
| Investments - Affiliated securities (See Note 10) | | | - | | | | - | | | | 7,300,194 | |
| Foreign currency translation | | | - | | | | - | | | | 155 | |
| TOTAL REALIZED & UNREALIZED NET GAINS (LOSSES) ON INVESTMENTS, AND TRANSLATION OF ASSETS IN FOREIGN CURRENCY | | | 30,712,245 | | | | (3,127,896 | ) | | | 35,280,029 | |
| NET INCREASE (DECREASE) IN NET ASSETS RESULTING FROM OPERATIONS | | $ | 33,376,906 | | | $ | (212,453 | ) | | $ | 37,971,205 | |
| (a) | Includes $- received from affiliated issuers held by the Value Fund. See Note 10 in the Notes to Financial Statements. |
| The accompanying Notes to Financial Statements are an integral part of these Statements | |
| 16 | www.heartlandadvisors.com |
| HEARTLAND FUNDS | STATEMENTS OF CHANGES IN NET ASSETS |
| | |
| | | MID CAP VALUE FUND | | | VALUE PLUS FUND | | | VALUE FUND | |
| | | For the Six Months Ended June 30, 2023 (Unaudited) | | | For the Year Ended December 31, 2022 | | | For the Six Months Ended June 30, 2023 (Unaudited) | | | For the Year Ended December 31, 2022 | | | For the Six Months Ended June 30, 2023 (Unaudited) | | | For the Year Ended December 31, 2022 | |
| FROM INVESTMENT OPERATIONS: | | | |
| Net investment income | | $ | 2,664,661 | | | $ | 2,288,859 | | | $ | 2,915,443 | | | $ | 2,646,422 | | | $ | 2,691,176 | | | $ | 2,818,250 | |
| Net realized gains | | | 11,746,487 | | | | 13,334,014 | | | | 9,806,176 | | | | 2,656,250 | | | | 29,112,267 | | | | 5,533,353 | |
| Net change in unrealized appreciation (depreciation) | | | 18,965,758 | | | | (24,160,569 | ) | | | (12,934,072 | ) | | | (30,014,764 | ) | | | 6,167,762 | | | | (83,292,876 | ) |
| Net increase (decrease) in net assets resulting from operations | | | 33,376,906 | | | | (8,537,696 | ) | | | (212,453 | ) | | | (24,712,092 | ) | | | 37,971,205 | | | | (74,941,273 | ) |
| | | | | | | | | | | | | | | | | | | | | | | | | |
| DISTRIBUTIONS TO SHAREHOLDERS: | | | | | | | | | | | | | | | | | | | | | | | | |
| Investor Class | | | - | | | | (10,850,257 | ) | | | - | | | | (6,022,695 | ) | | | - | | | | (16,977,738 | ) |
| Institutional Class | | | - | | | | (7,495,651 | ) | | | - | | | | (4,106,441 | ) | | | - | | | | (1,802,249 | ) |
| Total distributions to shareholders | | | - | | | | (18,345,908 | ) | | | - | | | | (10,129,136 | ) | | | - | | | | (18,779,987 | ) |
| | | | | | | | | | | | | | | | | | | | | | | | | |
CAPITAL TRANSACTIONS: | | | | | | | | | | | | | | | | | | | | | | | | |
| Investor Class | | | | | | | | | | | | | | | | | | | | | | | | |
| Proceeds from shares issued | | | 20,857,764 | | | | 19,368,233 | | | | 20,866,249 | | | | 16,429,781 | | | | 6,841,142 | | | | 8,020,563 | |
| Dividends reinvested | | | 18,372 | | | | 10,624,103 | | | | - | | | | 5,932,882 | | | | - | | | | 16,315,469 | |
| Value of shares redeemed(a) | | | (12,882,403 | ) | | | (30,403,465 | ) | | | (21,840,972 | ) | | | (41,597,246 | ) | | | (23,229,601 | ) | | | (44,083,777 | ) |
| Total Investor Class | | | 7,993,733 | | | | (411,129 | ) | | | (974,723 | ) | | | (19,234,583 | ) | | | (16,388,459 | ) | | | (19,747,745 | ) |
| Institutional Class | | | | | | | | | | | | | | | | | | | | | | | | |
| Proceeds from shares issued | | | 129,008,911 | | | | 78,440,292 | | | | 37,011,546 | | | | 47,514,874 | | | | 1,738,686 | | | | 6,385,682 | |
| Dividends reinvested | | | - | | | | 7,438,577 | | | | - | | | | 3,647,828 | | | | - | | | | 1,727,689 | |
| Value of shares redeemed(a) | | | (19,889,285 | ) | | | (16,950,884 | ) | | | (32,048,737 | ) | | | (49,326,038 | ) | | | (1,359,219 | ) | | | (6,668,167 | ) |
| Total Institutional Class | | | 109,119,626 | | | | 68,927,985 | | | | 4,962,809 | | | | 1,836,664 | | | | 379,467 | | | | 1,445,204 | |
| Net increase (decrease) in net assets derived from capital transactions | | | 117,113,359 | | | | 68,516,856 | | | | 3,988,086 | | | | (17,397,919 | ) | | | (16,008,992 | ) | | | (18,302,541 | ) |
| | | | | | | | | | | | | | | | | | | | | | | | | |
| TOTAL INCREASE (DECREASE) IN NET ASSETS | | | 150,490,265 | | | | 41,633,252 | | | | 3,775,633 | | | | (52,239,147 | ) | | | 21,962,213 | | | | (112,023,801 | ) |
| NET ASSETS AT THE BEGINNING OF THE PERIOD | | | 350,791,320 | | | | 309,158,068 | | | | 436,375,461 | | | | 488,614,608 | | | | 640,799,818 | | | | 752,823,619 | |
| NET ASSETS AT THE END OF THE PERIOD | | $ | 501,281,585 | | | $ | 350,791,320 | | | $ | 440,151,094 | | | $ | 436,375,461 | | | $ | 662,762,031 | | | $ | 640,799,818 | |
| | | | | | | | | | | | | | | | | | | | | | | | | |
FUND SHARE TRANSACTIONS | | | | | | | | | | | | | | | | | | | | | | | | |
| Investor Class | | | | | | | | | | | | | | | | | | | | | | | | |
| Shares Issued | | | 1,616,238 | | | | 1,487,673 | | | | 565,312 | | | | 445,478 | | | | 162,904 | | | | 187,059 | |
| Reinvested Shares | | | 1,503 | | | | 869,403 | | | | - | | | | 163,485 | | | | - | | | | 409,320 | |
| Shares Redeemed | | | (1,002,353 | ) | | | (2,345,635 | ) | | | (589,804 | ) | | | (1,136,868 | ) | | | (549,936 | ) | | | (1,034,473 | ) |
| Net increase (decrease) resulting from share transactions | | | 615,388 | | | | 11,441 | | | | (24,492 | ) | | | (527,905 | ) | | | (387,032 | ) | | | (438,094 | ) |
| Institutional Class | | | | | | | | | | | | | | | | | | | | | | | | |
| Shares Issued | | | 10,018,742 | | | | 6,045,436 | | | | 975,829 | | | | 1,299,313 | | | | 40,747 | | | | 142,252 | |
| Reinvested Shares | | | - | | | | 605,254 | | | | - | | | | 101,300 | | | | - | | | | 42,273 | |
| Shares Redeemed | | | (1,541,962 | ) | | | (1,311,593 | ) | | | (886,008 | ) | | | (1,348,475 | ) | | | (31,110 | ) | | | (159,548 | ) |
| Net increase resulting from share transactions | | | 8,476,780 | | | | 5,339,097 | | | | 89,821 | | | | 52,138 | | | | 9,637 | | | | 24,977 | |
| (a) | Value of shares redeemed includes amounts for early redemption fees. See Note 7 in Notes to Financial Statements. |
| The accompanying Notes to Financial Statements are an integral part of these Statements. | |
| Semi-Annual Report | June 30, 2023 | 17 |
| HEARTLAND FUNDS | FINANCIAL HIGHLIGHTS |
| | |
| | | Net asset value, beginning of period | | | Net investment income (loss)(a)(b) | | | Net realized and unrealized gains (losses) | | | Total income (loss) from investment operations | | | Distributions from net investment income | | | Distributions from net realized gains on investments | | | Total distributions | | | Net asset value, end of period | |
| MID CAP VALUE FUND | | | | | | | | | | | | | | | | | | | | | | | | |
| Investor Class | | | | | | | | | | | | | | | | | | | | | | | | |
| June 30, 2023 (Unaudited) | | $ | 12.38 | | | $ | 0.08 | | | $ | 0.91 | | | $ | 0.99 | | | $ | - | | | $ | - | | | $ | - | | | $ | 13.37 | |
| December 31, 2022 | | | 13.47 | | | | 0.09 | | | | (0.50 | ) | | | (0.41 | ) | | | (0.07 | ) | | | (0.61 | ) | | | (0.68 | ) | | | 12.38 | |
| December 31, 2021 | | | 13.03 | | | | 0.14 | | | | 3.53 | | | | 3.67 | | | | (0.12 | ) | | | (3.11 | ) | | | (3.23 | ) | | | 13.47 | |
| December 31, 2020 | | | 12.24 | | | | 0.13 | | | | 0.72 | | | | 0.85 | | | | (0.06 | ) | | | - | | | | (0.06 | ) | | | 13.03 | |
| December 31, 2019 | | | 9.99 | | | | 0.11 | | | | 2.42 | | | | 2.53 | | | | (0.10 | ) | | | (0.18 | ) | | | (0.28 | ) | | | 12.24 | |
| December 31, 2018 | | | 11.99 | | | | 0.17 | | | | (1.21 | ) | | | (1.04 | ) | | | (0.13 | ) | | | (0.83 | ) | | | (0.96 | ) | | | 9.99 | |
| Institutional Class | | | | | | | | | | | | | | | | | | | | | | | | | | | | | | | | |
| June 30, 2023 (Unaudited) | | $ | 12.44 | | | $ | 0.22 | | | $ | 0.79 | | | $ | 1.01 | | | $ | - | | | $ | - | | | $ | - | | | $ | 13.45 | |
| December 31, 2022 | | | 13.53 | | | | 0.13 | | | | (0.51 | ) | | | (0.38 | ) | | | (0.10 | ) | | | (0.61 | ) | | | (0.71 | ) | | | 12.44 | |
| December 31, 2021 | | | 13.08 | | | | 0.18 | | | | 3.54 | | | | 3.72 | | | | (0.16 | ) | | | (3.11 | ) | | | (3.27 | ) | | | 13.53 | |
| December 31, 2020 | | | 12.27 | | | | 0.17 | | | | 0.71 | | | | 0.88 | | | | (0.07 | ) | | | - | | | | (0.07 | ) | | | 13.08 | |
| December 31, 2019 | | | 10.00 | | | | 0.15 | | | | 2.41 | | | | 2.56 | | | | (0.11 | ) | | | (0.18 | ) | | | (0.29 | ) | | | 12.27 | |
| December 31, 2018 | | | 11.99 | | | | 0.21 | | | | (1.21 | ) | | | (1.00 | ) | | | (0.16 | ) | | | (0.83 | ) | | | (0.99 | ) | | | 10.00 | |
| VALUE PLUS FUND | | | | | | | | | | | | | | | | | | | | | | | | | | | | | | | | |
| Investor Class | | | | | | | | | | | | | | | | | | | | | | | | | | | | | | | | |
| June 30, 2023 (Unaudited) | | $ | 36.87 | | | $ | 0.21 | | | $ | (0.11 | ) | | $ | 0.10 | | | $ | - | | | $ | - | | | $ | - | | | $ | 36.97 | |
| December 31, 2022 | | | 39.68 | | | | 0.19 | | | | (2.17 | ) | | | (1.98 | ) | | | (0.17 | ) | | | (0.66 | ) | | | (0.83 | ) | | | 36.87 | |
| December 31, 2021 | | | 39.55 | | | | 0.31 | | | | 9.54 | | | | 9.85 | | | | (0.27 | ) | | | (9.45 | ) | | | (9.72 | ) | | | 39.68 | |
| December 31, 2020 | | | 35.48 | | | | 0.20 | | | | 4.28 | | | | 4.48 | | | | (0.18 | ) | | | (0.23 | ) | | | (0.41 | ) | | | 39.55 | |
| December 31, 2019 | | | 28.57 | | | | 0.49 | | | | 6.94 | | | | 7.43 | | | | (0.52 | ) | | | - | | | | (0.52 | ) | | | 35.48 | |
| December 31, 2018 | | | 33.26 | | | | 0.32 | | | | (4.69 | ) | | | (4.37 | ) | | | (0.32 | ) | | | - | | | | (0.32 | ) | | | 28.57 | |
| Institutional Class | | | | | | | | | | | | | | | | | | | | | | | | | | | | | | | | |
| June 30, 2023 (Unaudited) | | $ | 36.58 | | | $ | 0.29 | | | $ | (0.14 | ) | | $ | 0.15 | | | $ | - | | | $ | - | | | $ | - | | | $ | 36.73 | |
| December 31, 2022 | | | 39.39 | | | | 0.28 | | | | (2.16 | ) | | | (1.88 | ) | | | (0.27 | ) | | | (0.66 | ) | | | (0.93 | ) | | | 36.58 | |
| December 31, 2021 | | | 39.33 | | | | 0.42 | | | | 9.48 | | | | 9.90 | | | | (0.39 | ) | | | (9.45 | ) | | | (9.84 | ) | | | 39.39 | |
| December 31, 2020 | | | 35.28 | | | | 0.27 | | | | 4.29 | | | | 4.56 | | | | (0.28 | ) | | | (0.23 | ) | | | (0.51 | ) | | | 39.33 | |
| December 31, 2019 | | | 28.41 | | | | 0.55 | | | | 6.92 | | | | 7.47 | | | | (0.60 | ) | | | - | | | | (0.60 | ) | | | 35.28 | |
| December 31, 2018 | | | 33.10 | | | | 0.39 | | | | (4.67 | ) | | | (4.28 | ) | | | (0.41 | ) | | | - | | | | (0.41 | ) | | | 28.41 | |
| VALUE FUND | | | | | | | | | | | | | | | | | | | | | | | | | | | | | | | | |
| Investor Class | | | | | | | | | | | | | | | | | | | | | | | | | | | | | | | | |
| June 30, 2023 (Unaudited) | | $ | 40.55 | | | $ | 0.16 | | | $ | 2.26 | | | $ | 2.42 | | | $ | - | | | $ | - | | | $ | - | | | $ | 42.97 | |
| December 31, 2022 | | | 46.43 | | | | 0.17 | | | | (4.83 | ) | | | (4.66 | ) | | | (0.17 | ) | | | (1.05 | ) | | | (1.22 | ) | | | 40.55 | |
| December 31, 2021 | | | 43.27 | | | | 0.01 | | | | 9.41 | | | | 9.42 | | | | (0.07 | ) | | | (6.19 | ) | | | (6.26 | ) | | | 46.43 | |
| December 31, 2020 | | | 38.54 | | | | 0.08 | | | | 4.98 | | | | 5.06 | | | | (0.14 | ) | | | (0.19 | ) | | | (0.33 | ) | | | 43.27 | |
| December 31, 2019 | | | 33.70 | | | | 0.10 | | | | 5.94 | | | | 6.04 | | | | (0.11 | ) | | | (1.09 | ) | | | (1.20 | ) | | | 38.54 | |
| December 31, 2018 | | | 41.18 | | | | 0.08 | | | | (5.12 | ) | | | (5.04 | ) | | | (0.06 | ) | | | (2.38 | ) | | | (2.44 | ) | | | 33.70 | |
| Institutional Class | | | | | | | | | | | | | | | | | | | | | | | | | | | | | | | | |
| June 30, 2023 (Unaudited) | | $ | 41.58 | | | $ | 0.23 | | | $ | 2.29 | | | $ | 2.52 | | | $ | - | | | $ | - | | | $ | - | | | $ | 44.10 | |
| December 31, 2022 | | | 47.58 | | | | 0.23 | | | | (4.97 | ) | | | (4.74 | ) | | | (0.21 | ) | | | (1.05 | ) | | | (1.26 | ) | | | 41.58 | |
| December 31, 2021 | | | 44.21 | | | | 0.08 | | | | 9.62 | | | | 9.70 | | | | (0.14 | ) | | | (6.19 | ) | | | (6.33 | ) | | | 47.58 | |
| December 31, 2020 | | | 39.36 | | | | 0.13 | | | | 5.10 | | | | 5.23 | | | | (0.19 | ) | | | (0.19 | ) | | | (0.38 | ) | | | 44.21 | |
| December 31, 2019 | | | 34.40 | | | | 0.17 | | | | 6.06 | | | | 6.23 | | | | (0.18 | ) | | | (1.09 | ) | | | (1.27 | ) | | | 39.36 | |
| December 31, 2018 | | | 41.98 | | | | 0.15 | | | | (5.22 | ) | | | (5.07 | ) | | | (0.13 | ) | | | (2.38 | ) | | | (2.51 | ) | | | 34.40 | |
| The accompanying Notes to Financial Statements are an integral part of these Statements. | |
| 18 | www.heartlandadvisors.com |
| HEARTLAND FUNDS | FINANCIAL HIGHLIGHTS |
| | |
| Total Return | | | Net assets, end of period (in thousands) | | | Percentage of expenses to average net assets | | | Percentage of net investment income (loss) to average net assets | | | Percentage of expenses to average net assets before waivers | | | Percentage of expenses to average net assets after waivers | | | Percentage of net investment income (loss) to average net assets before waiver | | | Percentage of net investment income (loss) to average net assets after waivers | | | Portfolio turnover rate(c) | |
| | | | | |
| | | | | |
| | 8.00 | %(d)(e) | | $ | 233,975 | | | | N/A | | | | N/A | | | | 1.21 | %(f) | | | 1.10 | %(f) | | | 1.05 | %(f) | | | 1.16 | %(f) | | | 42 | %(d) |
| | (3.01 | )(e) | | | 209,035 | | | | N/A | | | | N/A | | | | 1.16 | | | | 1.10 | | | | 0.62 | | | | 0.68 | | | | 66 | |
| | 28.12 | (e) | | | 227,242 | | | | N/A | | | | N/A | | | | 1.17 | | | | 1.10 | | | | 0.82 | | | | 0.89 | | | | 86 | |
| | 6.93 | (e) | | | 189,119 | | | | N/A | | | | N/A | | | | 1.35 | | | | 1.10 | | | | 0.96 | | | | 1.21 | | | | 68 | (g) |
| | 25.30 | (e) | | | 7,627 | | | | N/A | | | | N/A | | | | 2.11 | | | | 1.25 | | | | 0.12 | | | | 0.98 | | | | 62 | |
| | (8.58 | )(e) | | | 5,390 | | | | N/A | | | | N/A | | | | 2.37 | | | | 1.25 | | | | 0.31 | | | | 1.43 | | | | 49 | |
| | | | | | | | | | | | | | | | | | | | | | | | | | | | | | | | | | | |
| | 8.12 | %(d)(e) | | $ | 267,307 | | | | N/A | | | | N/A | | | | 0.95 | %(f) | | | 0.85 | %(f) | | | 1.30 | %(f) | | | 1.41 | %(f) | | | 42 | %(d) |
| | (2.78 | )(e) | | | 141,756 | | | | N/A | | | | N/A | | | | 1.04 | | | | 0.85 | | | | 0.78 | | | | 0.98 | | | | 66 | |
| | 28.39 | (e) | | | 81,916 | | | | N/A | | | | N/A | | | | 0.98 | | | | 0.85 | | | | 1.04 | | | | 1.17 | | | | 86 | |
| | 7.18 | (e) | | | 40,960 | | | | N/A | | | | N/A | | | | 1.20 | | | | 0.86 | | | | 1.13 | | | | 1.47 | | | | 68 | (g) |
| | 25.58 | (e) | | | 7,320 | | | | N/A | | | | N/A | | | | 1.86 | | | | 0.99 | | | | 0.42 | | | | 1.30 | | | | 62 | |
| | (8.28 | )(e) | | | 3,211 | | | | N/A | | | | N/A | | | | 2.28 | | | | 0.99 | | | | 0.39 | | | | 1.68 | | | | 49 | |
| | | | | | | | | | | | | | | | | | | | | | | | | | | | | | | | | | | |
| | 0.27 | %(d) | | $ | 271,834 | | | | 1.19 | %(f) | | | 1.19 | %(f) | | | N/A | | | | N/A | | | | N/A | | | | N/A | | | | 28 | %(d) |
| | (4.95 | ) | | | 272,008 | | | | 1.22 | | | | 0.51 | | | | N/A | | | | N/A | | | | N/A | | | | N/A | | | | 48 | |
| | 24.85 | | | | 313,703 | | | | 1.15 | | | | 0.64 | | | | N/A | | | | N/A | | | | N/A | | | | N/A | | | | 58 | |
| | 12.64 | | | | 269,451 | | | | 1.23 | | | | 0.63 | | | | N/A | | | | N/A | | | | N/A | | | | N/A | | | | 90 | |
| | 26.02 | | | | 279,737 | | | | 1.19 | | | | 1.48 | | | | N/A | | | | N/A | | | | N/A | | | | N/A | | | | 51 | |
| | (13.13 | ) | | | 259,304 | | | | 1.18 | | | | 0.94 | | | | N/A | | | | N/A | | | | N/A | | | | N/A | | | | 71 | |
| | | | | | | | | | | | | | | | | | | | | | | | | | | | | | | | | | | |
| | 0.41 | %(d) | | $ | 168,317 | | | | N/A | | | | N/A | | | | 0.94 | %(f) | | | 0.94 | %(f) | | | 1.47 | %(f) | | | 1.47 | %(f) | | | 28 | %(d) |
| | (4.75 | ) | | | 164,367 | | | | N/A | | | | N/A | | | | 1.01 | | | | 0.99 | | | | 0.74 | | | | 0.76 | | | | 48 | |
| | 25.11 | | | | 174,912 | | | | N/A | | | | N/A | | | | 0.92 | | | | 0.92 | | | | 0.88 | | | | 0.88 | | | | 58 | |
| | 12.93 | | | | 108,110 | | | | N/A | | | | N/A | | | | 0.97 | | | | 0.97 | | | | 0.84 | | | | 0.84 | | | | 90 | |
| | 26.29 | | | | 64,446 | | | | N/A | | | | N/A | | | | 0.98 | | | | 0.98 | | | | 1.67 | | | | 1.67 | | | | 51 | |
| | (12.93 | ) | | | 54,169 | | | | N/A | | | | N/A | | | | 0.95 | | | | 0.95 | | | | 1.15 | | | | 1.15 | | | | 71 | |
| | | | | | | | | | | | | | | | | | | | | | | | | | | | | | | | | | | |
| | 5.97 | %(d) | | $ | 598,291 | | | | 1.13 | %(f) | | | 0.80 | %(f) | | | N/A | | | | N/A | | | | N/A | | | | N/A | | | | 25 | %(d) |
| | (9.99 | ) | | | 580,421 | | | | 1.09 | | | | 0.41 | | | | N/A | | | | N/A | | | | N/A | | | | N/A | | | | 45 | |
| | 21.81 | | | | 684,923 | | | | 1.04 | | | | 0.03 | | | | N/A | | | | N/A | | | | N/A | | | | N/A | | | | 45 | |
| | 13.14 | | | | 606,172 | | | | 1.10 | | | | 0.22 | | | | N/A | | | | N/A | | | | N/A | | | | N/A | | | | 49 | |
| | 17.96 | | | | 598,325 | | | | 1.10 | | | | 0.26 | | | | N/A | | | | N/A | | | | N/A | | | | N/A | | | | 42 | |
| | (12.15 | ) | | | 570,608 | | | | 1.07 | | | | 0.19 | | | | N/A | | | | N/A | | | | N/A | | | | N/A | | | | 37 | |
| | | | | | | | | | | | | | | | | | | | | | | | | | | | | | | | | | | |
| | 6.06 | %(d) | | $ | 64,471 | | | | N/A | | | | N/A | | | | 0.88 | %(f) | | | 0.88 | %(f) | | | 1.05 | %(f) | | | 1.05 | %(f) | | | 25 | %(d) |
| | (9.91 | ) | | | 60,379 | | | | N/A | | | | N/A | | | | 0.98 | | | | 0.98 | | | | 0.52 | | | | 0.52 | | | | 45 | |
| | 21.96 | | | | 67,901 | | | | N/A | | | | N/A | | | | 0.92 | | | | 0.92 | | | | 0.15 | | | | 0.15 | | | | 45 | |
| | 13.31 | | | | 58,060 | | | | N/A | | | | N/A | | | | 0.95 | | | | 0.95 | | | | 0.38 | | | | 0.38 | | | | 49 | |
| | 18.14 | | | | 55,832 | | | | N/A | | | | N/A | | | | 0.92 | | | | 0.92 | | | | 0.43 | | | | 0.43 | | | | 42 | |
| | (11.98 | ) | | | 62,531 | | | | N/A | | | | N/A | | | | 0.90 | | | | 0.90 | | | | 0.36 | | | | 0.36 | | | | 37 | |
| The accompanying Notes to Financial Statements are an integral part of these Statements. | |
| Semi-Annual Report | June 30, 2023 | 19 |
| HEARTLAND FUNDS | FINANCIAL HIGHLIGHTS |
| (a) | Redemption fees represent less than $.01 on a per share basis. |
| (b) | Calculated using the average shares method. |
| (c) | Portfolio turnover rate is calculated at the Fund level. |
| (e) | Total returns would have been lower had various fees and expenses not been waived and reimbursed during the period. |
| (g) | For the year ended December 31, 2020, the portfolio turnover calculation excludes the value of securities purchases of $58,658,022 and sold of $36,894,276 in the effort to realign the Mid Cap Value Fund’s portfolio holdings after the reorganization of the ALPS | WMC Research Value Fund into the Mid Cap Value Fund and the value of securities purchased of $2,929,666 and sold of $1,852,981 after the reorganization of the Heartland Select Value Fund into the Mid Cap Value Fund. |
| The accompanying Notes to Financial Statements are an integral part of these Statements. | |
| 20 | www.heartlandadvisors.com |
| HEARTLAND FUNDS | NOTES TO FINANCIAL STATEMENTS |
| | June 30, 2023 (Unaudited) |
1. ORGANIZATION
Heartland Group, Inc. (the “Corporation”) is registered as an open-end management investment company under the Investment Company Act of 1940 (the “1940 Act”), as amended. The capital shares of the Mid Cap Value Fund, Value Plus Fund, and Value Fund (each a “Fund” and collectively, the “Funds”), each of which is a diversified fund, are issued by the Corporation. Each Fund has 150,000,000 shares authorized with a par value of $.001 per share and offers Investor Class and Institutional Class shares. Heartland Advisors, Inc. (the “Advisor”) serves as investment advisor to the Corporation.
Under the Corporation’s organizational documents, its Officers and Directors are indemnified against certain liabilities arising out of the performance of their duties to the Corporation. In addition, in the normal course of business, the Corporation enters into contracts with its vendors and others that provide for general indemnifications. The Corporation’s maximum exposure under these arrangements is unknown, as this would involve future claims that may be made against the Corporation.
2. SUMMARY OF SIGNIFICANT ACCOUNTING POLICIES
The following is a summary of significant accounting policies followed by the Funds in the preparation of the financial statements. Each Fund is considered an investment company for financial reporting purposes under Generally Accepted Accounting Principles (“GAAP”). The Funds have applied the guidance of Financial Accounting Standards Board (“FASB”) Accounting Standards Codification Topic 946 (“ASC 946”).
| (a) | Portfolio securities traded on a national securities exchange or in the over-the-counter market are valued at the closing price on the principal exchange or market as of the close of regular trading hours on the day the securities are being valued, or, closing price on the composite market. Lacking any trades, securities are valued at the mean between the most recent quoted bid and asked prices on the principal exchange or market. Foreign securities are valued on the basis of quotations from the primary market in which they are traded, and are translated from the local currency into U.S. dollars using exchange rates as of the close of the New York Stock Exchange (“NYSE”) or using methods determined by Heartland Advisors, Inc. (the “Advisor”) as the valuation designee of the Board of Directors of the Corporation (the “Board”) in accordance with policies and procedures adopted pursuant to Rule 2a-5 of the 1940 Act. The Funds may use a systematic fair valuation model provided by an independent pricing service to value foreign equity securities in order to capture events occurring between the time a foreign exchange closes and the close of the NYSE that may affect the value of the Funds’ securities traded on those foreign exchanges. These are generally categorized as Level 2 under GAAP. Debt securities purchased with maturities of 60 days or less are generally valued at acquisition cost, which approximates fair value, plus or minus any amortization or accretion, if applicable. Securities and other assets for which quotations are not readily available, are deemed unreliable, or have facts and circumstances that indicate otherwise, are valued at their fair value using methods determined by the Advisor as the Board’s valuation designee, subject to oversight of the Board. The Advisor may also make a fair value determination if it reasonably determines that a significant event, which materially affects the value of a security, occurs after the time at which the market price for the security is determined, but prior to the time at which a Fund’s net asset value is calculated. Fair valuation of a particular security is an inherently subjective process, with no single standard to utilize when determining a security’s fair value. As such, different mutual funds could reasonably arrive at a different fair value price for the same security. In each case where a security is fair valued, consideration is given to the facts and circumstances relevant to the particular situation. This consideration includes reviewing various factors set forth in Heartland Advisors’ fair value procedures and other factors as warranted. In making a fair value determination, factors that may be considered, among others, include: the type and structure of the security; unusual events or circumstances relating to the security’s issuer; general market conditions; prior day’s valuation; fundamental analytical data; size of the holding; cost of the security on the date of purchase; nature and duration of any restriction on disposition; trading activities; and prices of similar securities or financial instruments. |
| (b) | The Funds’ policy is to comply with the requirements of the Internal Revenue Code of 1986, as amended (the “Code”), that are applicable to regulated investment companies (“RICs”) and to distribute substantially all of their taxable income to their shareholders. The Funds accordingly pay no Federal income taxes, and no Federal income tax provision is recorded. |
| Semi-Annual Report | June 30, 2023 | 21 |
| HEARTLAND FUNDS | NOTES TO FINANCIAL STATEMENTS |
| | June 30, 2023 (Unaudited) |
| (c) | Net investment income, if any, is distributed to each shareholder as a dividend. Dividends from the Funds are declared and paid at least annually. Dividends from the Funds are recorded on ex-date and determined in accordance with tax regulations. Net realized gains on investments, if any, are distributed at least annually. During the fiscal year ended December 31, 2022, the Funds utilized earnings and profits distributions to shareholders on redemption of shares as part of the dividends paid deduction for income tax purposes. GAAP requires that permanent financial reporting and tax differences be reclassified based on their characterization for federal income tax purposes. Accordingly, at December 31, 2022, the following reclassifications were made to increase (decrease) such amounts: |
| | | TOTAL DISTRIBUTABLE EARNINGS | | | PAID-IN CAPITAL | |
| MID CAP VALUE FUND | | $ | 749,838 | | | $ | (749,838 | ) |
| VALUE PLUS FUND | | | (523,761 | ) | | | 523,761 | |
| VALUE FUND | | | (1,354,070 | ) | | | 1,354,070 | |
| (d) | For financial reporting purposes, transactions are accounted for on trade date on the last business day of the reporting period. Net realized gains and losses on investments are computed on the identified cost basis. The portion of security gains and losses resulting from changes in foreign exchange rates is disclosed in the Statements of Operations. Dividend income is recognized on the ex-dividend date, and interest income is recognized on an accrual basis. Certain dividends from foreign securities will be recorded as soon as the Corporation is informed of the dividend, if such information is obtained subsequent to the ex-dividend date. The Funds amortize premium and accrete discount on investments utilizing the effective interest method. Foreign dividend income may be subject to foreign withholding taxes. Withholding taxes on foreign dividends have been provided for in accordance with the Funds’ understanding of the applicable country’s tax rules and regulations. |
| (e) | Investment income and realized and unrealized gains or losses on investments, options, and translation of assets in foreign currency are allocated to each Fund’s share class based on their respective net assets. The Funds and share classes are charged for those expenses that are directly attributable to them. Expenses that are not directly attributable to any one Fund are typically allocated among the Funds and respective share classes in proportion to their respective net assets, number of open shareholder accounts, number of funds, or some combination thereof, as applicable. |
| (f) | The Funds may invest a portion of their assets in Real Estate Investment Trusts (“REITs”) and are subject to certain risks associated with direct investment in REITs. REITs may be affected by changes in the value of their underlying properties and by defaults by borrowers or tenants. REITs depend generally on their ability to generate cash flow to make distributions to shareowners, and certain REITs have selfliquidation provisions by which mortgages held may be paid in full and distributions of capital returns may be made at any time. In addition, the performance of a REIT may be affected by its failure to qualify for tax-free pass-through of income under the Code, or its failure to maintain exemption from registration under the 1940 Act. A Fund’s investments in REITs may result in such Fund’s receipt of cash in excess of the REITs’ earnings. If the Fund receives such distributions all or a portion of these distributions will constitute a return of capital to such Fund. Receiving a return of capital distribution from REITs will reduce the amount of income available to be distributed to Fund shareholders. Income from REITs may not be eligible for treatment as qualified dividend income. As the final character of the distributions may not be known until reported by the REITs on their 1099s, the Funds may utilize an estimate for the current year character of distributions. |
| (g) | As of June 30, 2023, the Funds were not invested in any illiquid securities as defined pursuant to the Corporation’s Liquidity Risk Management Program (the “LRMP”). |
| (h) | Certain securities exempt from registration or issued in transactions exempt from registration under the Securities Act of 1933, as amended (the “Act”), such as securities issued pursuant to the resale limitations provided under Rule 144A or Regulation S under the Act, may be considered to be liquid under the LRMP. As of June 30, 2023, the Funds did not hold any restricted securities. |
| (i) | The Funds isolate the portion of the results of operations from changes in foreign exchange rates on investments from those resulting in market prices of securities held. Reported net realized foreign exchange gains or losses arise from sales of portfolio securities, sales and maturities of short-term securities, sales of foreign currencies, currency gains or losses realized between trade and settlement date on securities transactions, and the difference between the amounts of dividends, interest, and foreign withholding taxes recorded on the respective Fund’s books, and the U.S. dollar equivalent of the amounts actually received or paid. Net unrealized foreign exchange gains and losses arise from changes in the values of assets and liabilities, including investments in securities at the period end, resulting from changes in the exchange rate. Foreign markets can be more volatile than the U.S. market due to increased risks of adverse political, social, regulatory, and economic developments. Foreign security prices can be affected by exchange rate and foreign currency fluctuations, less publicly available information, and different accounting, auditing, legal, and financial standards. Foreign investments may also be less liquid than investments in U.S. issuers. This risk may be heightened in emerging or developing markets. Foreign securities usually are generally denominated and traded in foreign currencies, while the Funds value assets in U.S. dollars. The exchange rates between foreign currencies and the U.S. dollar fluctuate continuously. As a result, the values of the Funds’ non-U.S. investments will be affected favorably or unfavorably by changes in currency exchange rates relative to the U.S. dollar. |
| 22 | www.heartlandadvisors.com |
| HEARTLAND FUNDS | NOTES TO FINANCIAL STATEMENTS |
| | June 30, 2023 (Unaudited) |
| (j) | The accompanying financial statements were prepared in conformity with GAAP, which requires management to make estimates and assumptions that affect the reported amounts of assets and liabilities and disclosure of contingent assets and liabilities at the date of the financial statements and the reported amounts of revenues and expenses during the reporting period. Actual results could differ from these estimates. |
3. FAIR VALUE MEASUREMENTS
The Funds follow GAAP, under which various inputs are used in determining the value of the Funds’ investments.
The basis of the hierarchy is dependent upon the various “inputs” used to determine the value of the Funds’ investments. These inputs are summarized in the three broad levels listed below:
| Level 1 | - | Unadjusted quoted prices in active markets for identical assets or liabilities that a Fund has the ability to access at the measurement date. |
| Level 2 | - | Other significant observable inputs include quoted prices which are not active, quoted prices for similar assets or liabilities in active markets, or inputs other than quoted prices that are observable (either directly or indirectly) for the asset or liability. Includes portfolio securities and other financial instruments lacking any sales referenced in Note 2. |
| Level 3 | - | Significant unobservable prices or inputs (includes the Advisor’s own assumptions, as the Board’s valuation designee, in determining the fair value of investments). |
The inputs or methodology used for valuing securities are not necessarily an indication of the risk associated with investing in those securities.
The following is a summary of the inputs used to value the Funds’ investments as of June 30, 2023:
| MID CAP VALUE FUND |
| INVESTMENTS IN SECURITIES AT VALUE | | LEVEL 1 - QUOTED AND UNADJUSTED PRICES | | | LEVEL 2 - OTHER SIGNIFICANT OBSERVABLE INPUTS(a) | | | LEVEL 3 - SIGNIFICANT UNOBSERVABLE INPUTS(b) | | | TOTAL | |
| Common Stocks | | $ | 493,245,375 | | | $ | - | | | $ | - | | | $ | 493,245,375 | |
| Short-Term Investments | | | 2,938,127 | | | | - | | | | - | | | | 2,938,127 | |
| Total | | $ | 496,183,502 | | | $ | - | | | $ | - | | | $ | 496,183,502 | |
| VALUE PLUS FUND |
| INVESTMENTS IN SECURITIES AT VALUE | | LEVEL 1 - QUOTED AND UNADJUSTED PRICES | | | LEVEL 2 - OTHER SIGNIFICANT OBSERVABLE INPUTS(a) | | | LEVEL 3 - SIGNIFICANT UNOBSERVABLE INPUTS(b) | | | TOTAL | |
| Common Stocks | | $ | 434,528,050 | | | $ | - | | | $ | - | | | $ | 434,528,050 | |
| Short-Term Investments | | | 6,298,046 | | | | - | | | | - | | | | 6,298,046 | |
| Total | | $ | 440,826,096 | | | $ | - | | | $ | - | | | $ | 440,826,096 | |
| VALUE FUND |
| INVESTMENTS IN SECURITIES AT VALUE | | LEVEL 1 - QUOTED AND UNADJUSTED PRICES | | | LEVEL 2 - OTHER SIGNIFICANT OBSERVABLE INPUTS(a) | | | LEVEL 3 - SIGNIFICANT UNOBSERVABLE INPUTS(b) | | | TOTAL | |
| Common Stocks | | $ | 635,348,573 | | | $ | 6,810,111 | | | $ | - | | | $ | 642,158,684 | |
| Short-Term Investments | | | 24,724,430 | | | | - | | | | - | | | | 24,724,430 | |
| Total | | $ | 660,073,003 | | | $ | 6,810,111 | | | $ | - | | | $ | 666,883,114 | |
| (a) | For detailed industry descriptions and securities identified as Level 2 within the hierarchy, see the accompanying Schedules of Investments. |
| (b) | The Funds measure Level 3 activity as of the beginning and end of the financial period. For the six month period ended June 30, 2023, the Funds did not have significant unobservable inputs (Level 3) used in determining fair value. Therefore, a reconciliation of assets in which significant unobservable inputs (Level 3) were used in determining fair value is not applicable. |
| Semi-Annual Report | June 30, 2023 | 23 |
| HEARTLAND FUNDS | NOTES TO FINANCIAL STATEMENTS |
| | June 30, 2023 (Unaudited) |
4. DERIVATIVE INSTRUMENTS
GAAP requires enhanced disclosure about the Funds’ derivative and hedging activities, including how such activities are accounted for and their effects on the Funds’ financial position, performance, and cash flows. The Funds may invest in a broad array of financial instruments and securities, the value of which is “derived” from the performance of an underlying asset or a “benchmark” such as a security index, an interest rate, or a currency. In particular, each Fund may engage in transactions in options, and options on futures contracts (a) to hedge against anticipated declines in the market value of its portfolio securities or currencies and against increases in the market values of securities or currencies it intends to acquire, (b) to manage exposure to changing interest rates (duration management), (c) to enhance total return, or (d) to invest in eligible asset classes with a greater efficiency and lower cost than is possible through direct investment.
Options can be highly volatile investments and involve certain risks. These strategies require the ability to anticipate future movements in securities prices, interest rates, currency exchange rates, and other economic factors. Attempts to use such investments may not be successful and could result in reduction of a Fund’s total return. Each Fund could experience losses if the prices of its options positions move in a direction different than anticipated, or if the Fund were unable to close out its positions due to disruptions in the market or lack of liquidity. Over-the-counter options generally involve greater credit and liquidity risks than exchange-traded options. Options traded on foreign exchanges generally are not regulated by U.S. authorities, and may offer less liquidity and less protection to a Fund if the other party to the contract defaults.
The Funds’ use of options and other investment techniques for hedging purposes involves the risk that changes in the value of a hedging investment will not match those of the asset or security being hedged. Hedging is the use of one investment to offset the effects of another investment. Imperfect or no correlation of the values of the hedging instrument and the hedged security or asset might occur because of characteristics of the instruments themselves or unrelated factors involving, for example, the markets on which the instruments are traded. As a result, hedging strategies may not always be successful. While hedging strategies can help reduce or eliminate portfolio losses, they can also reduce or eliminate portfolio gains.
Options Contracts
The Funds may enter into options transactions for hedging purposes and will not use these instruments for speculation. Each Fund may write covered put and call options on any securities or futures contracts in which it may invest, on any securities index based on or related to securities in which it may invest, or on any currency in which Fund investments may be denominated. A call option on an asset written by a Fund obligates the Fund to sell the specified asset to the holder (purchaser) at a stated price (the exercise price) if the option is exercised before a specified date (the expiration date). A put option on an asset written by a Fund obligates the Fund to buy the specified asset from the purchaser at the exercise price if the option is exercised before the expiration date. Premiums received when writing options are recorded as liabilities and are subsequently adjusted to the current value of the options written. Premiums received from writing options that expire are treated as realized gains. Premiums received from writing options, which are either exercised or closed, are offset against the proceeds received or amount paid on the transaction to determine realized gains or losses. Each Fund may also purchase put options on any securities or futures contracts in which it may invest, on any securities index based on or related to securities in which it may invest, or on any currency in which Fund investments may be denominated. A Fund may enter into closing transactions with respect to such options by writing an option identical to the one it has purchased (for exchange-listed options) or by entering into an offsetting transaction with the counterparty to such option (for OTC options). A Fund may also exercise such options or allow them to expire. During the six months ended June 30, 2023, the Funds were not invested in option contracts.
Offsetting Arrangements
Certain derivative contracts are executed under either standardized netting agreements or, for exchange-traded derivatives, the relevant contracts for a particular exchange which contain enforceable netting provisions. A derivative netting arrangement creates an enforceable right of set-off that becomes effective, and affects the realization of settlement on individual assets and liabilities, only following a specified event of default or early termination. There are no derivative financial instruments that are subject to enforceable netting arrangements or other similar agreements as of June 30, 2023.
5. SECURITIES LENDING
The Funds have entered into an agreement with Brown Brothers Harriman & Co. (the “Lending Agent”), dated November 30, 2011, as amended (“Securities Lending Agreement”), to provide securities lending services to the Funds. Under this program, the proceeds (cash collateral) received from borrowers are used to invest in money market funds. Under the Securities Lending Agreement, the borrowers may pay the Funds negotiated lender fees and the Funds receive cash collateral in an amount equal to not less than 102% of the value of loaned securities. The borrower pays fees at the Funds’ direction to the Lending Agent. Although the risk of lending is generally mitigated by the collateral, the Funds could experience a delay in recovering securities and a possible loss of income or value if the borrower fails to return them. The agreement provides the right in the event of default for the non-defaulting party to liquidate the collateral and calculate a net exposure to the defaulting party or request additional collateral. In the event that a borrower defaults, the Funds, as lender, would offset the market value of the collateral received against the market value of the securities loaned. When the value of the collateral is greater than that of the market value of the securities loaned, the lender is left with a net amount payable to the defaulting party. However, bankruptcy or insolvency laws of a particular jurisdiction may impose restrictions on or prohibitions against such a right of offset in the event of a counterparty’s bankruptcy or insolvency. Under the agreement, the borrower can resell or re-pledge the loaned securities, and the Funds can reinvest cash collateral, or, upon an event of default, resell or re-pledge the collateral. As of and for the six month period ended June 30, 2023, the Funds did not have any securities on loan.
| 24 | www.heartlandadvisors.com |
| HEARTLAND FUNDS | NOTES TO FINANCIAL STATEMENTS |
| | June 30, 2023 (Unaudited) |
6. INVESTMENT MANAGEMENT FEES AND TRANSACTIONS WITH RELATED PARTIES
The Corporation entered into an investment advisory agreement with the Advisor to serve as investment advisor and manager to the Funds (the “Advisory Agreement”). The Mid Cap Value Fund pays the Advisor a monthly management fee at the annual rate of 0.75% of the average daily net assets, the Value Plus Fund pays the Advisor a monthly management fee at the annual rate of 0.70% of the average daily net assets, and the Value Fund pays the Advisor a monthly management fee at the annual rate of 0.75% of the average daily net assets.
The Advisor has contractually agreed to waive its management fees and/or reimburse expenses of the Mid Cap Value Fund to ensure that the Fund’s total annual fund operating expenses do not exceed 1.10% of the Fund’s average daily net assets for the Investor Class Shares and 0.85% for the Institutional Class Shares through at least April 5, 2025, and subject thereafter to annual renewal of the agreement by the Board. The operating expense limitation agreement can be terminated only with the consent of the Board. For the six month period ended June 30, 2023, expenses of $120,345 for Investor Class and $102,430 for Institutional Class were waived by the Advisor. The Advisor may not recoup amounts previously waived or reimbursed.
The Advisor has voluntarily agreed to waive fees and/or reimburse certain expenses with respect to the Institutional Class Shares of the Value Plus Fund, to the extent necessary to maintain the Institutional Class total annual fund operating expenses at a ratio of 0.99% of average daily net assets. This voluntary waiver/reimbursement may be discontinued at any time. For the six month period ended June 30, 2023, expenses of $0 for the Institutional Class Shares of the Value Plus Fund were waived by the Advisor. The Advisor may not recoup amounts previously waived or reimbursed.
Previously, the Advisor voluntarily agreed to waive fees and/or reimburse certain expenses with respect to the Institutional Class Shares of the Value Fund, to the extent necessary to maintain the Institutional Class total annual fund operating expenses at a ratio of 0.99% of average daily net assets. For the six month period ended June 30, 2023, expenses of $0 for the Institutional Class Shares of the Value Fund were waived by the Advisor. This voluntary waiver/reimbursement was discontinued effective May 1, 2023. The Advisor may not recoup amounts previously waived or reimbursed.
The Corporation has adopted a Distribution Plan pursuant to Rule 12b-1 under the 1940 Act (the “Plan”). Pursuant to the Plan, the Investor Class pays the Funds’ distributor, ALPS Distributors, Inc. (the “Distributor”), an amount up to 0.25% of the average daily net assets of the Investor Class Shares of such Fund (limited to actual costs incurred), computed on an annual basis and paid monthly, for distributing Fund shares and providing shareholder services. Any fees paid to the Distributor under the Plan that are not used during a calendar year are reimbursed to the respective Fund’s Investor Class. Institutional Class Shares are not subject to 12b-1 fees. During the six month period ended June 30, 2023, $263,495 of distribution related expenses incurred by the Advisor were reimbursed by fees collected under the Plan. The Advisor and/or Distributor may also contractually commit to pay these fees to other third parties who agree to provide various services to their customers who hold Fund shares. Fees paid pursuant to any such contractual commitment are not subject to reimbursement. The Distributor receives a fee for providing distribution services based on an annual rate of $225,000 for all Funds, plus 1/10 basis point for each Fund’s annual net assets.
Transfer agent, fund accounting and fund administration services are provided by ALPS Fund Services, Inc. (“ALPS”). ALPS is an affiliate of the Distributor. From its own assets, the Advisor may pay retirement plan service providers, brokers, banks, financial advisors, and other financial intermediaries’ fees for providing recordkeeping, sub-accounting, marketing, and other administrative services to their customers in connection with investment in the Funds. These fees may be in addition to any distribution, administrative, or shareholder servicing fees paid from the Funds’ assets to these financial intermediaries.
Officers and certain directors of the Corporation are also officers and/or directors of the Advisor; however, they receive no compensation from the Funds.
| Semi-Annual Report | June 30, 2023 | 25 |
| HEARTLAND FUNDS | NOTES TO FINANCIAL STATEMENTS |
| | June 30, 2023 (Unaudited) |
7. EARLY REDEMPTION FEE
To discourage market timing and other short-term trading, certain shares of the Funds that are redeemed or exchanged within 10 days are assessed a 2% fee on the current net asset value of the shares. The fee applies to shares being redeemed or exchanged in the order in which they are purchased, treating shares that have been held the longest in an account as being redeemed first. The fee is retained by the applicable Fund for the benefit of the remaining shareholders. For financial statement purposes, these amounts are included in the Statements of Assets and Liabilities as “paid-in capital”. The Funds retained redemption fees during the six month period ended June 30, 2023, as follows:
| | | MID CAP VALUE FUND | | | VALUE PLUS FUND | | | VALUE FUND | |
| Investor Class | | $ | (751 | ) | | $ | - | | | $ | 8 | |
| Institutional Class | | | 731 | | | | 10 | | | | - | |
| Total | | $ | (20 | ) | | $ | 10 | | | $ | 8 | |
8. INVESTMENT TRANSACTIONS
During the six month period ended June 30, 2023, the cost of purchases and proceeds from sales of securities (excluding securities maturing less than one year from acquisition) are noted below. During the same period, there were no purchases of long-term U.S. Government obligations.
| | | COST OF PURCHASES | | | PROCEEDS FROM SALES | |
| MID CAP VALUE FUND | | $ | 288,349,352 | | | $ | 174,658,282 | |
| VALUE PLUS FUND | | | 123,782,880 | | | | 120,848,835 | |
| VALUE FUND | | | 154,190,468 | | | | 183,430,548 | |
9. FEDERAL INCOME TAX INFORMATION
The Funds have qualified and intend to qualify as RICs under Subchapter M of the Code for federal income tax purposes and to distribute substantially all taxable income and net capital gains. Passive foreign investment companies, foreign currency, and certain other investments could create book tax differences that may have an impact on the character of each Fund’s distributions.
As of and during the six month period ended June 30, 2023, the Funds did not have a liability for any unrecognized tax benefits. The Funds file U.S. federal, state, and local tax returns as required. The Funds’ tax returns are subject to examination by the relevant tax authorities until expiration of the applicable statute of limitations which is generally three years after the filing of the tax return for federal purposes and four years for most state returns. Tax returns for open years have incorporated no uncertain tax positions that require a provision for income taxes.
The amount of net unrealized appreciation/(depreciation) and the cost of investment securities for tax purposes, including short-term securities as of June 30, 2023, are displayed in the table below.
| | | | | | | | | | | | NET APPRECIATION/ NET TAX UNREALIZED | |
| | | TAX COST OF INVESTMENTS | | | GROSS UNREALIZED APPRECIATION | | | GROSS UNREALIZED DEPRECIATION | | | (DEPRECIATION) OF FOREIGN CURRENCY | | | APPRECIATION/ (DEPRECIATION) | |
| MID CAP VALUE FUND | | $ | 457,434,846 | | | $ | 50,871,608 | | | $ | (12,122,952 | ) | | $ | - | | | $ | 38,748,656 | |
| VALUE PLUS FUND | | | 417,625,395 | | | | 58,137,129 | | | | (34,936,428 | ) | | | - | | | | 23,200,701 | |
| VALUE FUND | | | 545,796,691 | | | | 147,690,794 | | | | (26,604,371 | ) | | | - | | | | 121,086,423 | |
The difference between book-basis and tax-basis unrealized appreciation is attributable primarily to tax deferral of losses in wash sales.
| 26 | www.heartlandadvisors.com |
| HEARTLAND FUNDS | NOTES TO FINANCIAL STATEMENTS |
| | June 30, 2023 (Unaudited) |
10. TRANSACTIONS WITH AFFILIATES
The following investments are in companies deemed “affiliated” (as defined in Section 2(a)(3) of the 1940 Act) with the Value Fund; that is, the Fund held 5% or more of their outstanding voting securities during the six month period ended June 30, 2023. The Mid Cap Value and Value Plus Funds had no transactions with affiliates during the six month period ended June 30, 2023.
| SECURITY NAME | | FAIR VALUE AS OF DECEMBER 31, 2022 | | | PURCHASES | | | SALES | | | FAIR VALUE AS OF JUNE 30, 2023 | | | SHARE BALANCE AS OF JUNE 30, 2023 | | | DIVIDENDS | | | CHANGE IN UNREALIZED GAIN/(LOSS) | | | REALIZED GAIN/(LOSS) | |
| Hudson Global,Inc. | | $ | 5,718,601 | | | $ | - | | | $ | - | | | $ | 5,440,631 | | | | 252,700 | | | $ | - | | | $ | (277,970 | ) | | $ | - | |
| Lincoln Educational Services Corp. | | | 10,711,500 | | | | - | | | | - | | | | 12,469,000 | | | | 1,850,000 | | | | - | | | | 1,757,500 | | | | - | |
| Total | | $ | 16,430,101 | | | $ | - | | | $ | - | | | $ | 17,909,631 | | | | 2,102,700 | | | $ | - | | | $ | 1,479,530 | | | $ | - | |
| INVESTMENTS NO LONGER AFFILIATED AS OF JUNE 30, 2023 |
| Perma-Fix Environmental Services, Inc. | | $ | 2,954,610 | | | $ | - | | | $ | (2,537,520 | ) | | $ | 5,490,000 | | | | 500,000 | | | $ | - | | | $ | 5,820,664 | | | $ | (747,754 | ) |
| Grand Total | | $ | 19,384,711 | | | $ | - | | | $ | (2,537,520 | ) | | $ | 23,399,631 | | | | 2,602,700 | | | $ | - | | | $ | 7,300,194 | | | $ | (747,754 | ) |
11. NEW REGULATORY REQUIREMENTS
In November 2020, the SEC adopted Rule 18f-4 under the 1940 Act and issued Release No. IC-34084, Use of Derivatives by Registered Investment Companies and Business Development Companies (“Rule 18f-4”), to govern the use of derivatives and certain related instruments by registered investment companies. Rule 18f-4 replaced existing SEC and staff guidance with a new framework for the use of derivatives by registered investment companies. Unless a fund qualifies as a “limited derivatives user,” as defined in Rule 18f-4, Rule 18f-4 requires registered investment companies that trade derivatives and other instruments that create future payment or delivery obligations to adopt a value at-risk leverage limit and implement a derivatives risk management program. The compliance date for the Rule 18f-4 was August 19, 2022. There was no material impact to the Funds’ asset segregation and coverage practices. Each Fund currently qualifies as a “limited derivatives user”.
In December 2020, the SEC adopted Rule 2a-5 providing a framework for fund valuation practices (“Rule 2a-5”). Rule 2a-5 establishes requirements for determining fair value in good faith for purposes of the 1940 Act. Rule 2a-5 permits fund boards to designate certain parties to perform fair value determinations, subject to board oversight and certain other conditions. Rule 2a-5 also defines when market quotations are “readily available” for purposes of the 1940 Act and the threshold for determining whether a fund must fair value a security. In connection with Rule 2a-5, the SEC also adopted related recordkeeping requirements and is rescinding previously issued guidance, including with respect to the role of a board in determining fair value and the accounting and auditing of fund investments. The Funds were required to comply with the rules by September 8, 2022, at which time Heartland Advisors, Inc. was established as the Board’s valuation designee. There was no material impact to the Funds’ financial statements, as a result of the implementation of these new rules.
12. SUBSEQUENT EVENTS
Subsequent events after the date of the Statements of Assets and Liabilities have been evaluated through the date the financial statements were issued.
| Semi-Annual Report | June 30, 2023 | 27 |

EXPENSE EXAMPLES
As a shareholder of the Heartland Funds, you incur two types of costs: (1) transaction costs, including redemption fees and (2) ongoing costs, including management fees, 12b-1 fees, and other Fund expenses. This example is intended to help you understand your ongoing costs (in dollars) of investing in the Funds and to compare these costs with the ongoing costs of investing in other mutual funds. The example is based on an investment of $1,000 invested at the beginning of the six month period and held for the entire six month period from January 1, 2023 through June 30, 2023.
Actual Expenses
The table below provides information about actual account values and actual expenses. You may use the information below, together with the amount you invested, to estimate the expenses that you paid over the period. Simply divide your account value by $1,000 (for example, an $8,600 account value divided by $1,000 = 8.6), then multiply the result by the number in the table under the heading entitled “Expenses Paid during the Period” to estimate the expenses you paid on your account during this period.
| FUND | | BEGINNING ACCOUNT VALUE 1/1/23 | | | ENDING ACCOUNT VALUE 6/30/23 | | | EXPENSES PAID DURING THE PERIOD(a) 1/1/23 - 6/30/23 | | | ANNUALIZED EXPENSE RATIO DURING PERIOD 1/1/23 - 6/30/23 | |
| Mid Cap Value Fund - Investor | | $ | 1,000.00 | | | $ | 1,080.00 | | | $ | 5.67 | | | | 1.10 | % |
| Mid Cap Value Fund - Institutional | | | 1,000.00 | | | | 1,081.20 | | | | 4.39 | | | | 0.85 | |
| Value Plus Fund - Investor | | | 1,000.00 | | | | 1,002.70 | | | | 5.91 | | | | 1.19 | |
| Value Plus Fund - Institutional | | | 1,000.00 | | | | 1,004.10 | | | | 4.67 | | | | 0.94 | |
| Value Fund - Investor | | | 1,000.00 | | | | 1,059.70 | | | | 5.77 | | | | 1.13 | |
| Value Fund - Institutional | | | 1,000.00 | | | | 1,060.60 | | | | 4.50 | | | | 0.88 | |
| (a) | Expenses are equal to the average account value times the Fund’s annualized expense ratio multiplied by the number of days in the most recent fiscal half-year (181) divided by the number of days in the fiscal year (365). |
Hypothetical Example for Comparison Purposes
The table below provides information about hypothetical account values and hypothetical expenses based on each of the Fund’s actual expense ratio and an assumed rate of return of 5% per year before expenses, which is not the Fund’s actual return. The hypothetical account values and expenses may not be used to estimate the actual ending account balance or expenses you paid for the period. You may use this information to compare this 5% hypothetical example with the 5% hypothetical examples that appear in the shareholder reports of other funds.
Please note that the expenses shown in the table are meant to highlight your ongoing costs and do not reflect any transactional costs, such as redemption fees. Therefore, the table is useful in comparing ongoing costs only, and will not help you determine the relative total costs of owning different funds. In addition, if these transactional costs were included, your costs would have been higher.
| FUND | | BEGINNING ACCOUNT VALUE 1/1/23 | | | ENDING ACCOUNT VALUE 6/30/23 | | | EXPENSES PAID DURING THE PERIOD(a) 1/1/23 - 6/30/23 | | | ANNUALIZED EXPENSE RATIO DURING PERIOD 1/1/23 - 6/30/23 | |
| Mid Cap Value Fund - Investor | | $ | 1,000.00 | | | $ | 1,019.34 | | | $ | 5.51 | | | | 1.10 | % |
| Mid Cap Value Fund - Institutional | | | 1,000.00 | | | | 1,020.58 | | | | 4.26 | | | | 0.85 | |
| Value Plus Fund - Investor | | | 1,000.00 | | | | 1,018.89 | | | | 5.96 | | | | 1.19 | |
| Value Plus Fund - Institutional | | | 1,000.00 | | | | 1,020.13 | | | | 4.71 | | | | 0.94 | |
| Value Fund - Investor | | | 1,000.00 | | | | 1,019.19 | | | | 5.66 | | | | 1.13 | |
| Value Fund - Institutional | | | 1,000.00 | | | | 1,020.43 | | | | 4.41 | | | | 0.88 | |
| (a) | Expenses are equal to the average account value times the Fund’s annualized expense ratio multiplied by the number of days in the most recent fiscal half-year (181) divided by the number of days in the fiscal year (365). |
OTHER INFORMATION
A description of the policies and procedures that the Corporation uses to determine how to vote proxies relating to portfolio securities, and a copy of the voting record, is available without charge at www.heartlandadvisors.com and on the Securities and Exchange Commission’s (the “Commission”) website at www.sec.gov, or upon request, by calling Heartland Advisors, Inc. at 1-888-505-5180, or by writing to Heartland Advisors, Inc. at 790 N. Water Street, Suite 1200, Milwaukee, WI 53202. Information regarding how the Corporation voted proxies relating to portfolio securities during the most recent twelve month period ended June 30 is also available on the Commission’s website at www.sec.gov.
The Funds’ portfolio holdings are made available semi-annually in shareholder reports within 60 days after the close of the period for which the report is being made, as required by federal securities laws. The Funds also file a complete schedule of portfolio holdings with the Commission for the first and third quarters of the Funds’ fiscal year on Part F of Form N-PORT. Portfolio holdings filed on Form N-PORT become publicly available on the Commission’s website at www.sec.gov within 60 days after the end of that Funds’ fiscal quarter. Schedules of portfolio holdings are also available at www.heartlandadvisors.com, or upon request, without charge by calling Heartland Advisors, Inc. at 1-888-505-5180, or by writing to Heartland Advisors, Inc. at 790 N. Water Street, Suite 1200, Milwaukee, WI, 53202.

DEFINITIONS AND DISCLOSURES
This report contains forward-looking statements, such as economic predictions and portfolio manager opinions. These statements are subject to risks, uncertainties, and actual developments in the future, and their impact on the Funds could be materially different than those that are projected or implied.
Certain security valuations and forward estimates are based on Heartland Advisors’ calculations. Statements regarding securities are not recommendations to buy or sell the securities discussed, but rather illustrations of our value investment strategy. Such statements represent the portfolio manager’s view when made and are subject to change at any time based on market and other considerations. Any forecasts may not prove to be true. Economic predictions are based on estimates and are subject to change. There is no guarantee that any particular investment strategy will be successful.
Dividends are not guaranteed and a company’s future ability to pay dividends may be limited. A company currently paying dividends may cease paying dividends at any time.
Small-cap and large-cap investment strategies each have their own unique risks and potential for rewards and may not be suitable for all investors. Small-cap investment strategies emphasize the significant growth potential of small companies, however, small-cap securities, are generally more volatile and less liquid than those of larger companies. Large-cap investment strategies emphasize the stability of large companies, however, large-cap securities are more susceptible to momentum Sector and Industry classifications are sourced from GICS®. The Global Industry Classification Standard (GICS®) is the exclusive intellectual property of MSCI Inc. (“MSCI”) and S&P Global Market Intelligence (“S&P”). Neither MSCI, S&P, their affiliates, nor any of their third party providers (“GICS Parties”) makes any representations or warranties, express or implied, with respect to GICS or the results to be obtained by the use thereof, and expressly disclaim all warranties, including warranties of accuracy, completeness, merchantability and fitness for a particular purpose. The GICS Parties shall not have any liability for any direct, indirect, special, punitive, consequential or any other damages (including lost profits) even if notified of such damages.
Heartland Advisors defines market cap ranges by the following indices: micro-cap by the Russell Microcap®, small-cap by the Russell 2000®, mid-cap by the Russell Midcap®, large-cap by the Russell Top 200®.
Artificial intelligence (AI) is intelligence-perceiving, synthesizing, and inferring information- demonstrated by computers, as opposed to intelligence displayed by humans or by other animals.
Book Value is the sum of all of a company’s assets, minus its liabilities.
Earnings Before Interest, Taxes, Depreciation and Amortization (EBITDA) measures a company’s financial performance. It is used to analyze and compare profitability between companies and industries because it eliminates the effects of financing and accounting decisions.
Earnings Per Share is the portion of a company’s profit allocated to each outstanding share of common stock.
Enterprise Value/Sales Ratio is a financial indicator used to determine the value of a company including debt. It is equal to a company’s Enterprise Value divided by its annual sales.
Free Cash Flow is the amount of cash a company has after expenses, debt service, capital expenditures, and dividends. The higher the free cash flow, the stronger the company’s balance sheet.
Growth Rate represents the rate of growth of equity securities within the Fund’s portfolio and is not meant as a prediction of the funds future performance, income earned by the Fund, or distributions made by the Fund. There can be no assurance that a company’s actual earnings growth rate will be consistent with the estimate.
Inflation Risk is the possibility that the value of assets or income will decrease as inflation shrinks the purchasing power of a currency.
NASDAQ Composite Index is the market capitalization-weighted index of approximately 3,000 common equities listed on the NASDAQ stock exchange and includes all Nasdaq-listed stocks that are not derivatives, preferred shares, funds, exchange-traded funds (ETFs) or debenture securities.
Net Debt is a metric that shows a company’s overall debt situation by netting the value of a company’s liabilities and debts with its cash and other similar liquid assets.
Net Debt/Total Capital Ratio of a stock is calculated as a company’s interest-bearing liabilities minus cash or cash equivalents divided by its total capital, which is represented by the company’s debt and shareholders’ equity, and includes common stock, preferred stock, minority interest and net debt.
Operating Income Margin is a ratio used to measure a company’s pricing strategy and operating efficiency.
Price/Book Ratio of a company is calculated by dividing the market price of its stock by the company’s per-share book value.
Price/Cash Flow represents the amount an investor is willing to pay for a dollar generated from a particular company’s operations, shows the ability of a business to generate cash, and acts as a gauge of liquidity and solvency.
Price/Earnings Ratio of a stock is calculated by dividing the current price of the stock by its trailing or its forward 12 months’ earnings per share.
Russell 2000® Index includes the 2000 firms from the Russell 3000® Index with the smallest market capitalizations.
Russell 2000® Value Index measures the performance of those Russell 2000® companies with lower price/book ratios and lower forecasted growth characteristics.
Russell Midcap® Value Index measures the performance of those Russell Midcap® Index companies with lower price/book ratios and lower forecasted growth characteristics.
S&P 500 Index is an index of 500 U.S. stocks chosen for market size, liquidity and industry group representation and is a widely used U.S. equity benchmark.
Treasury Bill (T-Bill) is a short-term debt obligation backed by the U.S. government with a maturity of less than one year. T-bills are sold in denominations of $1,000 up to a maximum purchase of $5 million and commonly have maturities of one month (four weeks), three months (13 weeks) or six months (26 weeks).
Volatility is a statistical measure of the dispersion of returns for a given security or market index which can either be measured by using the standard deviation or variance between returns from that same security or market index. Commonly, the higher the volatility, the riskier the security.
All indices are unmanaged. It is not possible to invest directly in an index.
Russell Investment Group is the source and owner of the trademarks, service marks and copyrights related to the Russell indices. Russell® is a trademark of the Frank Russell Investment Group.
Data sourced from FactSet: Copyright 2023 FactSet Research Systems Inc., FactSet Fundamentals. All rights reserved.

In accordance with Rule 22e-4 under the 1940 Act, the Corporation has adopted and implemented a LRMP, which seeks to promote effective liquidity risk management of each Fund and to protect Fund shareholders from dilution of their interests. The Board has appointed Heartland Advisors as the Funds’ Program Administrator. The Program Administrator has designated its Pricing Committee to implement its responsibilities as Program Administrator. The Program Administrator is required to provide an annual written report to the Board regarding the adequacy and effectiveness of the LRMP, including the operation of the highly liquid investment minimum, if applicable, and any material changes to the LRMP.
On May 11, 2023, the Board reviewed the Program Administrator’s annual report as of March 31, 2023. The report provided an assessment of each Fund’s liquidity risk, which is the risk a Fund could not meet requests to redeem shares issued by such Fund without significant dilution of the remaining shareholders’ interests in the Fund. The Program Administrator assessed each Fund’s liquidity risk (under both normal and reasonably foreseeable stressed marked conditions) through the consideration of various liquidity risk factors, including each Fund’s investment strategy, the liquidity of portfolio investments, projected cash flows, cash and cash equivalent holdings and available liquidity sources. The report noted that the Program Administrator continues to engage ICE Data Services, a third-party vendor that assists the Funds with classifying their holdings pursuant to the LRMP, and that the Program Administrator concluded that each Fund predominantly held investments that were classified as highly liquid during the review period. The report noted that each Fund continues to be considered a primarily highly liquid fund and is not required to determine a highly liquid investment minimum. The Program Administrator noted that no material changes had been made to the LRMP. The Program Administrator concluded that in all market conditions (including during the significant market volatility in 2020 and 2022), and considering Fund-specific stresses, each Fund has been able to meet redemption needs without significant dilution to the Fund’s remaining shareholders. The Program Administrator determined that the LRMP is reasonably designed and is operating effectively.

The 1940 Act requires that the Funds’ Investment Advisory Agreement be approved by the vote of a majority of the Independent Directors, cast in the manner required by the 1940 Act, and the rules and regulations thereunder. At an in-person meeting held on May 11, 2023, the Board, including a majority of the Independent Directors, approved the continuation of the Funds’ Investment Advisory Agreement.
As part of the process of approving the continuation of the Investment Advisory Agreement, the directors reviewed the legal requirements governing their consideration of the Investment Advisory Agreement and the relevant factors that should be considered to inform their judgement. The Independent Directors also met in separate executive sessions on May 5, 2023, May 10, 2023 and May 11, 2023, with their independent legal counsel, to discuss the continuation of the Investment Advisory Agreement. The directors recognized that each Fund’s fee arrangements are the result of years of review and discussion between the Independent Directors and Heartland Advisors, that certain aspects of such arrangements may receive greater scrutiny in some years than in others and that the directors’ conclusions may be based, in part, on their consideration of these arrangements and information received during the course of the year and in prior years.
The directors’ approval of the continuation of the Investment Advisory Agreement, including the Independent Directors’ approval, was based on their consideration and evaluation of a variety of factors, which included, among other things: (1) the nature, extent, and quality of the services provided by Heartland Advisors, including the investment process used by Heartland Advisors; (2) the performance of each Fund in comparison to its benchmark index, a peer group and a comparison universe of similar mutual funds; (3) the advisory fees and total net operating expenses of each Fund, including comparative information with respect to a peer group and a comparison universe of similar mutual funds; (4) a comparison of Heartland Advisors’ services and the amounts paid by the Funds with those under Heartland Advisors’ agreements with other clients; (5) the profitability of Heartland Advisors with respect to each Fund; (6) the extent to which economies of scale may be realized as the Funds grow and whether fee levels reflect these economies of scale for the benefit of Fund investors; and (7) any benefits accruing to Heartland Advisors from its relationship with the Funds.
The following is a more detailed summary of certain of the factors and information considered by the directors:
MATERIALS RELATING TO THE NATURE, EXTENT, AND QUALITY OF SERVICES PROVIDED BY THE ADVISOR:
| • | A summary of the qualifications and background of Heartland Advisors’ senior management personnel; |
| • | A summary of Heartland Advisors’ investment process for the Funds; |
| • | Information regarding Heartland Advisors’ risk management practices; |
| • | Information regarding the operation of Heartland Advisors’ business continuity plan; |
| • | Information regarding initiatives to improve operations and services; |
| • | Biographical information for the Fund’s portfolio management teams; |
| • | Heartland Advisors’ Form ADV Part 2A (brochure) and 2B (supplements); |
| • | Information regarding Heartland Advisors’ compliance program, and a discussion regarding its risk management functions; and |
| • | Information regarding trading costs, brokerage commissions and best execution. |
INFORMATION WITH RESPECT TO FUND PERFORMANCE AND EXPENSES:
| • | Discussions with management regarding Fund performance and related performance data; |
| • | Discussions with management regarding the appropriateness of each Fund’s fee and expense levels; and |
| • | A Section 15(c) Report and related materials prepared by FUSE Research Network, LLC (“FUSE”), an independent third-party Section 15(c) report provider, using Morningstar, Inc. data comparing advisory fees, other expenses and the performance of each class of each Fund against a comparison universe as well as a smaller peer group of funds consisting of such Fund and other open-end funds classified by FUSE as having a similar investment strategy and a comparable asset level as the Fund. |
The Board did not consider information regarding Heartland Advisors’ performance for other managed accounts to be a material factor.
MATERIALS RELATED TO HEARTLAND ADVISOR’S SERVICES TO OTHER ACCOUNTS:
| • | A schedule of standard account minimums and fees for other accounts managed with investment strategies similar to the Funds; and |
| • | Information regarding the level of services provided by Heartland Advisors to the Funds as compared to Heartland Advisors’ other clients with investment strategies similar to the Funds. |
MATERIALS RELATING TO PROFITABILITY AND ECONOMIES OF SCALE:
| • | A profitability analysis prepared by management; |
| • | An independent study prepared by FUSE of the profitability of a group of publicly traded asset managers; |
| • | A summary of revenue-sharing arrangements that Heartland Advisors has with various financial intermediaries; and |
| • | A memorandum prepared by management discussing economies of scale, and a discussion regarding how to determine when economies of scale are being achieved. |
INFORMATION RELATING TO HEARTLAND ADVISOR’S FINANCIAL STRENGTH:
| • | Heartland Advisors’ financial statements and independent auditor’s report for the years ended December 31, 2022, and December 31, 2021; |
| • | Consolidated financial statements of Heartland Advisors and its parent company and independent auditor’s report for the years ended December 31, 2022, and December 31, 2021; |
| • | Consolidated financial information for Heartland Advisors and its parent company for the first quarter ended March 31, 2023 (unaudited); |
| • | Heartland Advisors’ historical assets under management for the past ten years; |
| • | Consolidated financial projections of Heartland Advisors’ parent company; and |
| • | Heartland Advisors’ management succession and personnel contingency plan. |
The Board also considered a memorandum from independent legal counsel that outlined the duties and responsibilities of the Board in connection with approving the continuation of the Investment Advisory Agreement.

In considering the documents and information listed above, the Independent Directors were assisted by their independent legal counsel who was present at all times at the May Board meetings and at the related executive sessions of the Independent Directors. In reviewing and discussing this information, the Independent Directors took into account information regularly provided at the Board’s quarterly meetings throughout the year regarding the services provided by Heartland Advisors, the performance of each Fund, expenses, the Funds’ compliance program, asset flows, sales and marketing updates and other relevant matters. After considering this information, the Board, including a majority of the Independent Directors, reached the following conclusions:
| • | The nature and extent of the services provided by Heartland Advisors are appropriate for the investment objectives and programs of the Value Plus Fund, Value Fund and Mid Cap Value Fund and are appropriate to assure that each Fund’s operations are conducted in compliance with their investment objectives and strategies, and in compliance with applicable laws, rules and regulations. |
| • | Heartland Advisors provides a high quality of services to the Funds, based upon: (a) Heartland Advisors’ consistent value investment process, which has been in place for almost 40 years; (b) the background and experience of Heartland Advisors’ senior management and the expertise of, and the amount of attention given to the Funds by, investment personnel of Heartland Advisors; (c) the extensive other services provided by Heartland Advisors that benefit the Funds, including compliance services, serving as the Board’s valuation designee for purposes of fair value determinations, serving as the Funds’ liquidity risk management program administrator, risk management services, business continuity services, oversight of service providers and other operational services, such as the provision of Fund officers and office space; and (d) the overall reputation and capabilities of Heartland Advisors. In addition, the Board considered that the Funds and their shareholders benefit from Heartland Advisors’ payments to financial intermediaries for the provision of distribution services and shareholder services. |
| • | The Funds have experienced improved near-term absolute and relative performance and positive longer-term performance. The Board considered that each Fund has outperformed its benchmark index and peer group average over the one-, three- and five- year periods and the respective since-inception periods ended December 31, 2022. With respect to the Value and Value Plus Funds, the Board noted that each Fund has experienced satisfactory performance for the ten-year period. The directors concluded that each Fund and its shareholders were likely to benefit from Heartland Advisors’ continued management. |
| • | The advisory fee charged to each Fund is fair and reasonable based on the nature, scope and quality of the services provided to the Fund, and those fees are competitive, considering all relevant circumstances, with fees paid by peer funds and fees charged by Heartland Advisors to other accounts it manages under similar investment strategies, as applicable. |
| • | The level of profitability realized by Heartland Advisors from its provision of services to each Fund is reasonable. |
| • | Heartland Advisors has sufficient financial resources and revenues to enable it to finance the provision and delivery of the services it is obligated to provide under the Investment Advisory Agreement and Heartland Advisors has used these resources and revenues to manage the operations of the Funds in an effective manner that is beneficial to shareholders. |
The Board considered the extent to which economies of scale might be realized as each Fund grows and to the extent which each Fund’s advisory fee reflects those economies of scale for the benefit of Fund shareholders. The directors concluded that the Mid Cap Value Fund’s current fee level represents an appropriate sharing of economies of scale with its shareholders, also noting the benefits to shareholders from the operating expense limitation agreement in place between Heartland Advisors and the Mid Cap Value Fund. With respect to the Value Plus and Value Funds, the directors did not consider economies of scale to be a material factor in light of each Fund’s current asset size and management fee, and determined to continue to monitor these Funds should they experience substantial growth in assets.
The Board considered other benefits to Heartland Advisors from serving as advisor to the Funds (in addition to the advisory fee). The Board considered the benefits to Heartland Advisors from soft dollar arrangements whereby Heartland Advisors receives proprietary and third-party investment research and related services from broker-dealers that execute portfolio trades for the Funds. The Board considered that the research services received from such broker-dealers are used to service all accounts managed by Heartland Advisors, including the Funds, and that Heartland Advisors’ separately managed account clients also benefit from this research. The directors concluded that the benefits Heartland Advisors receives are appropriate and that such products and services have been used for legitimate purposes beneficial to the Funds by providing assistance in the investment decision making process. The Board noted that Heartland Advisors also experiences brand and name recognition and other modest benefits due to its association with the Funds. The Board concluded that the other benefits realized by Heartland Advisors from its relationship with the Funds were reasonable.
The directors reached these conclusions after carefully considering all of the information provided by management and after taking into account recent developments and circumstances affecting the Funds. They concluded that the information and materials provided addressed all of the relevant matters that they considered necessary or advisable to assess the performance of the Funds and the performance of Heartland Advisors under the Investment Advisory Agreement. All of the factors discussed above were considered separately by the Board, including by the Independent Directors meeting in executive sessions and as part of the Audit Committee. The factors were viewed in their totality by the Board, with no single factor being the principal or determinative factor in the Board’s determination to approve the Investment Advisory Agreement. Based on its review of the information set forth above, the Board found that the terms of the Investment Advisory Agreement are fair and reasonable and in the best interests of the shareholders of each Fund.

INFORMATION REGARDING EXECUTIVE OFFICERS AND DIRECTORS
Under applicable law, the Board of Directors is responsible for management of the Corporation and provides broad supervision over its affairs. The Board elects the Officers of the Corporation and hires the Funds’ service providers, including the Funds’ investment advisor, Heartland Advisors, Inc., and distributor of the Funds’ shares, ALPS Distributors, Inc. The Board meets regularly to review, among other items, the Funds’ investments, performance, and expenses. The Board annually reviews and considers approval of the continuation of the investment advisory agreement with the Advisor and each Fund’s distribution plan and related distribution agreements. The Board also establishes, monitors, and periodically reviews numerous policies and procedures governing the conduct of the Corporation’s business. The policy of the Corporation is that the Chairman and 75% of the members of the Board must be independent directors for purposes of the 1940 Act. The following table presents information about each Director and Officer of the Corporation. The mailing address of the Directors and Officers is 790 North Water Street, Suite 1200, Milwaukee, WI 53202.
| INDEPENDENT DIRECTORS: | Position(s) held with the Corporation | Term of office and length of time served(1) | Principal occupations during past five years: | Number of Heartland Funds overseen by Director | Other Directorships held by Director(2) |
Robert A. Rudell Date of Birth: 9/48 | Chairman of the Board Director | Since 1/06 Since 2/05 | Retired; Chief Operating Officer, Zurich Scudder Investments, 1998 to 2002; President, Scudder Retirement Services, 1996 to 1998; employed by IDS/American Express as President in Institutional Retirement Services and other capacities, 1973 to 1996. | 3 | Director, Optimum Funds, May 2003 to present (6 mutual funds). |
Dale J. Kent Date of Birth: 11/52 | Director and Chair of the Audit Committee | Since 8/03 | Vice President-Capital Markets (part-time), Continental Properties Company, since February 2018; Director (part-time) R&R insurance, September 2017 to December 2019; Director (part-time),Continental Properties Company, September 2017 to February 2018; Executive Vice President and Chief Financial Officer, West Bend Mutual Insurance Company, July 2002 to July 2017; Partner, Arthur Andersen, LLP, 1986 to 2002; employed by Arthur Andersen, LLP, in other capacities, 1974 to 1985. | 3 | None |
Ward D. Armstrong Date of Birth: 1/54 | Director and Chair of the Nominating and Governance Committee | Since 2/08 | Retired; Managing Partner, NorthRock Partners, LLC, October 2013 to July 2015; Managing Director, NorthRock Partners, a Private Wealth Advisory Practice of Ameriprise Financial, February 2010 to October 2013; Senior Vice President, Ameriprise Financial, Inc., November 1984 to May 2007; President, American Express Asset Management, 2002 to 2004; Chairman, Ameriprise Trust Company, November 1996 to May 2007. | 3 | Trustee, ALPS Series Trust, May 2016 to present (12 registered funds). |
Dianna Gonzales-Burdin Date of Birth: 8/61 | Director | Since 4/22 | Retired; Managing Director and Partner of Strategic Investment Group (a registered investment advisor), December 1991 to March 2021; employed by Barclays Global Investors (f/k/a Wells Fargo Nikko Investment Advisors), in the portfolio implementation and transaction management groups prior to 1991. | 3 | Director, Optimum Funds, August 2022 to present (6 mutual funds). |
Dina A. Tantra Date of Birth: 10/69 | Director | Since 4/22 | Co-Chief Executive Officer, Global Rhino, LLC (consulting firm), October 2018 to present; Chief Strategy Officer, CCO Technology, LLC (d/b/a Joot) (consulting and technology firm), February 2019 to January 2023; Executive Vice President, Ultimus Fund Solutions (fund administrator and distributor), August 2017 to September 2018; Managing Director, Foreside Financial Services, LLC (fund administrator and distributor), July 2016 to August 2017; Director and General Counsel, Beacon Hill Fund Services (fund administrator and distributor), February 2008 to July 2016. | 3 | Trustee, Boston Trust & Walden Funds, August 2021 to present (10 mutual funds); Trustee, Thornburg Income Builder Opportunities Trust, October 2020 to present (1 closed-end fund); Director, Advisers Investment Trust, 2012 to 2017 (16 funds). |

| INTERESTED DIRECTORS AND OFFICERS: | Position(s) held with the Corporation | Term of office and length of time served(1) | Principal occupations during past five years: | Number of Heartland Funds overseen by Director | Other Directorships held by Director(2) |
William (“Will”) R. Nasgovitz(3) Date of Birth: 4/78 | Chief Executive Officer President and Director | Since 5/12 Since 1/20 | Chief Executive Officer and Portfolio Manager, Heartland Advisors, Inc., since January 2013; Senior Vice President and Portfolio Manager, Heartland Advisors, Inc., since 2012; Director, Heartland Advisors, Inc., since November 2010; Vice President and Portfolio Manager, Heartland Advisors, Inc., 2006 to 2011; Research Analyst, Heartland Advisors, Inc., 2004 to 2006; Research Associate, Heartland Advisors, Inc., 2003 to 2004; Senior Research Associate, Cambridge Associates, LLC 2000 to 2002. | 3 | N/A |
Nicole J. Best Date of Birth: 9/73 | Vice President, Treasurer and Principal Accounting Officer | Since 6/11 | Chief Administrative Officer, Heartland Advisors, Inc., since June 2015; Senior Vice President and Chief Financial Officer, Heartland Advisors, Inc., since May 2010; Vice President and Secretary, Heartland Group, Inc., May 2010 to June 2011; Senior Vice President, Investor Services and Markets, Brown Brothers Harriman & Co., September 2008 to May 2010; Senior Vice President and Chief Compliance Officer, Heartland Advisors, Inc. and Heartland Group, Inc., November 2005 to August 2008; Senior Vice President and Treasurer, Heartland Advisors, Inc., February 2001 to August 2006; Treasurer and Principal Accounting Officer, Heartland Group, Inc., June 2000 to November 2005. Employed by Heartland Advisors, Inc. in other capacities from 1998 to 2008. Employed by Arthur Andersen, LLP, in other capacities, 1995 to 1998. | N/A | N/A |
Vinita K. Paul Date of Birth: 8/79 | Vice President Chief Compliance Officer Anti-Money Laundering Officer Secretary | Since 8/08 Since 12/16; 8/08 - 5/16 Since 2/14 Since 4/17 | Vice President and General Counsel, Heartland Advisors, Inc., since August 2009; Vice President and Chief Compliance Officer, Heartland Advisors, Inc., August 2008 to May 2016 and since December 2016; Assistant Secretary, Heartland Group, Inc., May 2016 to April 2017; Associate, Quarles & Brady LLP, November 2007 to July 2008; Vice President and Interim General Counsel, The Ziegler Companies, Inc., July 2007 to October 2007; Assistant Secretary, North Track Funds, Inc., December 2006 to October 2007; Assistant Secretary, Ziegler Exchange Traded Trust, December 2006 to October 2007; Vice President and Assistant General Counsel, The Ziegler Companies, Inc., September 2006 to July 2007; Associate, Quarles & Brady LLP, September 2004 to August 2006. | N/A | N/A |
| (1) | Officers of the Corporation serve one-year terms, subject to annual reappointment by the Board of Directors. Directors of the Corporation serve a term of indefinite length until their resignation or removal, and stand for re-election by shareholders only as and when required under the Investment Company Act of 1940. |
| (2) | Only includes directorships held in a company with a class of securities registered pursuant to Section 12 of the Securities Exchange Act of 1934 or subject to the requirements of Section 15(d) of the Securities Exchange Act of 1934, or any company registered as an investment company under the Investment Company Act of 1940. |
| (3) | William (“Will”) R. Nasgovitz is considered to be an “interested person” (as defined in the Investment Company Act of 1940) of the Corporation because of his position with the Advisor. Will is the son of William (“Bill”) J. Nasgovitz. |
The standing committees of the Corporation’s Board of Directors include an Audit Committee and a Nominating and Governance Committee. Both Committees consist of all the Independent Directors, namely Robert A. Rudell, Dale J. Kent, Ward D. Armstrong, Dianna Gonzales-Burdin, and Dina A. Tantra. Mr. Kent serves as chairman of the Audit Committee, and Mr. Armstrong serves as chairman of the Nominating and Governance Committee. The Board has determined that Mr. Kent is an Audit Committee financial expert.
The Audit Committee is responsible for selecting the independent registered public accounting firm for the Funds and oversees the preparation of each Fund’s financial statements. In this capacity, the Audit Committee meets at least annually with the independent registered public accounting firm to discuss any issues surrounding the preparation and audit of the Funds’ financial statements. The Audit Committee also discusses with the independent registered public accounting firm the systems and operating procedures employed in connection with the preparation of each Fund’s financial statements, and the operation of the Funds’ pricing procedures, as well as the performance and cooperation of those responsible for these functions. The Audit Committee has adopted a written charter. The Audit Committee had four meetings during the twelve months ended December 31, 2022.
The Nominating and Governance Committee nominates candidates for appointment to the Board of Directors to fill vacancies and to nominate candidates for election and re-election to the Board as and when required. The Nominating and Governance Committee generally accepts recommendations for nominations by shareholders of the Funds made within one year prior to the appointment or election of a Director. The Nominating and Governance Committee has adopted a written charter. The Nominating and Governance Committee had two meetings during the twelve months ended December 31, 2022.
The Funds’ Statement of Additional Information includes additional information about the Directors of the Corporation and is available, without charge, at www.heartlandadvisors.com or upon request, by calling 1-800-432-7856.
THIS PAGE INTENTIONALLY LEFT BLANK
THIS PAGE INTENTIONALLY LEFT BLANK
THIS PAGE INTENTIONALLY LEFT BLANK

Heartland Advisors’ commitment to you:
Striving to achieve superior investment results and outstanding client service
Fundamental Research
We are committed to discovering opportunities through extensive fundamental analysis
Seasoned Investment Team
We leverage our investment team’s decades of experience to uncover out-of-favor, financially sound, and undervalued companies
Consistent and Disciplined Approach
We consistently adhere to our clearly defined, time-tested investment process driven by Heartland’s 10 Principles of Value Investing™
An investor should consider the Funds’ investment objectives, risks, and charges and expenses carefully before investing or sending money. This and other important information can be found in the Funds’ prospectus. To obtain a prospectus, please call 1-800-432-7856 or visit www.heartlandadvisors.com. Please read the prospectus carefully before investing.
| Distributed by ALPS Distributors, Inc. | HLF007045/0824 |
Not applicable to semi-annual report.
| Item 3. | Audit Committee Financial Expert. |
Not applicable to semi-annual report.
| Item 4. | Principal Accountant Fees and Services. |
Not applicable to semi-annual report.
| Item 5. | Audit Committee of Listed Registrants. |
Not applicable.
| (a) | Schedule of Investments as of the close of the reporting period is included as part of the report to stockholders filed under Item 1 of this Form N-CSR. |
| Item 7. | Disclosure of Proxy Voting Policies and Procedures for Closed-End Management Investment Companies. |
Not applicable.
| Item 8. | Portfolio Managers of Closed-End Management Investment Companies. |
Not applicable.
| Item 9. | Purchases of Equity Securities by Closed-End Management Investment Companies and Affiliated Purchases. |
Not applicable.
| Item 10. | Submission of Matters to a Vote of Security Holders. |
No material changes to the procedures by which the shareholders may recommend nominees to the registrant’s Board of Directors have been implemented after the registrant’s last provided disclosure in response to the requirements of Item 407(c)(2)(iv) of Regulation S-K (17 CFR 229.407) (as required by Item 22(b)(15) of Schedule 14A (17 CFR 240.14a-101)), or this Item.
| Item 11. | Controls and Procedures. |
| (a) | The registrant’s principal executive and principal financial officers, or persons performing similar functions, have concluded that the registrant’s disclosure controls and procedures (as defined in Rule 30a-3(c) under the Investment Company Act of 1940, as amended (the “1940 Act”) (17 CFR 270.30a-3(c))) are effective, based on their evaluation of these controls and procedures as of a date within 90 days of the filing date of the report that includes the disclosure required by this paragraph, based on their evaluation of these controls and procedures required by Rule 30a-3(b) under the 1940 Act (17 CFR 270.30a-3(b)) and Rules 13a-15(b) or 15d-15(b) under the Securities Exchange Act of 1934, as amended (17 CFR 240.13a-15(b) or 240.15d-15(b)). |
| (b) | No changes in the registrant’s internal control over financial reporting (as defined in Rule 30a-3(d) under the 1940 Act (17 CFR 270.30a-3(d)) occurred during the period covered by this report that have materially affected, or are reasonably likely to materially affect, the registrant���s internal control over financial reporting. |
| Item 12. | Disclosure of Securities Lending Activities for Closed-End Management Investment Companies. |
Not applicable.
SIGNATURES
Pursuant to the requirements of the Securities Exchange Act of 1934 and the Investment Company Act of 1940, the registrant has duly caused this report to be signed on its behalf by the undersigned, thereunto duly authorized.
HEARTLAND GROUP, INC.
| By: | /s/ William R. Nasgovitz | |
| | William R. Nasgovitz | |
| | President and Chief Executive Officer | |
| | | |
| Date: | August 17, 2023 | |
Pursuant to the requirements of the Securities Exchange Act of 1934 and the Investment Company Act of 1940, this report has been signed below by the following persons on behalf of the registrant and in the capacities and on the dates indicated.
| By: | /s/ William R. Nasgovitz | |
| | William R. Nasgovitz | |
| | President and Chief Executive Officer | |
| | | |
| Date: | August 17, 2023 | |
| | | |
| | | |
| By: | /s/ Nicole J. Best | |
| | Nicole J. Best | |
| | Treasurer & Principal Accounting Officer | |
| | | |
| Date: | August 17, 2023 | |