| LOU HOLLAND |
| GROWTH FUND |
| |
| Letter to Shareholders |
| December, 2010 |
Dear Fellow Shareholder:
Thank you for your investment in the Lou Holland Growth Fund.
Fund Results
After a tremendous rise in 2009, the domestic equity market continued to climb higher in 2010, with the major stock indexes experiencing a second consecutive year of double-digit returns. As expected, the Fund again participated in this strong uptrend, generating a return of +14.03%. However, the Fund’s conservative high quality strategy was unable to keep pace with the +16.71% return of its style benchmark, the Russell 1000 Growth Index, and it also trailed the +15.06% return of its secondary benchmark, the S&P 500 Index.
Fund Performance
Stock selection decisions were additive to Fund performance overall during the year, with good performance in technology, health care, and producer durables more than offsetting weakness in energy and financial services. However, sector allocation decisions were unfavorable. An underweight in the strong performing consumer discretionary and materials & processing sectors hurt relative performance.
In addition, the Fund was particularly impacted by the combined effect of an overweight in energy and the weak performance of energy holdings, which acted as a major drag. Halliburton Company and Occidental Petroleum were among the top contributors to the Fund’s overall performance. However, Range Resources and Southwestern Energy, high quality natural gas focused exploration and production companies, were the main detractors. Both have been negatively impacted by low natural gas prices and overall natural gas supplies that remain high relative to current demand. Given the uncertain global economic environment, we continue to diligently assess our holdings and the near-term dynamics and longer-term outlook for the sector. However, we believe that Range and Southwestern are best positioned because of their deep inventory of high quality low cost reserves and that industry fundamentals will eventually shift in favor of these companies.
Financial services was another area of weakness for the Fund. IHS, which was initiated as a new position earlier in the year, has posted very strong performance as the company’s organic growth continues to trend higher. However, Visa and BlackRock have disappointed. Regulatory concerns about interchange fees and the competitive landscape for mobile payments have caused a contraction in Visa’s multiple and BlackRock has been negatively impacted by concern about outflows due to the Barclays integration and due to the negative market sentiment toward money funds and quantitative strategies. Despite these issues, we continue to believe in their longer-term drivers.
Technology holdings provided a source of positive relative performance. Citrix had another stellar year due to a well-executed business model, movement toward cloud computing and penetration into new vertical markets with existing offerings. QUALCOMM and Apple were also top contributors. QUALCOMM is a major beneficiary of global smartphone share gains, with an enviable market share. Apple continued to gain market- and mind-share through new applications and hardware. We believe that the company’s pace of innovation remains robust, as does its underlying growth rate.
In health care, Genzyme Corporation rose sharply on news of Sanofi-Aventis’ offer to acquire the company and Laboratory Corporation of America recently closed the acquisition of Genzyme’s lab testing business, making them in our
| LOU HOLLAND |
| GROWTH FUND |
| |
| Letter to Shareholders |
| December, 2010 |
view the premier player in the genomic/esoteric testing segment, the fastest growing and most profitable area of lab testing.
A number of producer durables holdings contributed nicely to Fund performance. Waters Corp. continues to deliver strong results, generate impressive cash flow, and gain market share with one of its products. In addition, Expeditors International benefited from the uptick in global trade.
Fund Changes
We rely on our fundamental, bottom-up research to identify stocks that meet our long-term, fundamental, conservative investment criteria of double-digit earnings growth rates and reasonable valuations. We focus on a three-to-five year investment horizon which generally results in low average turnover over long periods of time. However, turnover can be higher or lower than average in any given year. 2010 was a year of below average turnover for the Fund, as was 2009 because we continue to allow the thesis behind our investments to play out, including the purchases during the last market downturn that positioned the Fund to benefit from a future return of domestic and global economic growth.
Additions during the year include Mead Johnson, IHS, and Waters Corporation. Mead Johnson exhibits one of the best top line growth outlooks in the staples sector, with strong exposure to emerging markets and a reasonable number of competitors in the space. IHS, principally a subscription based data provider serving energy, infrastructure, environmental and security markets, has grown organically over time and was purchased due to its strong position in its core end markets and management’s history of effectively redeploying excess cash flow toward accretive merger & acquisition transactions. Waters, a manufacturer and designer of capital equipment for health care and industrial research has fundamentals that continue to improve, a balance sheet that remains rock solid, and shares that have become relatively cheap. Berkshire Hathaway entered the portfolio when it replaced Burlington Northern due to its acquisition of the company.
Stocks are generally sold when they no longer meet our investment criteria or when we identify a better idea. Suntech Power was exited because of concerns that the European debt crisis could impact credit for solar projects and cause some countries to discontinue or reduce solar subsidies. AFLAC was sold because of concerns about its exposure to European hybrid securities. Two holdings were take-over targets: Xerox acquired ACS and XTO Energy was taken over by Exxon Mobil. Symantec Corporation was liquidated to create cash for various buys and McKesson Corporation was sold because of concerns about management’s capital allocation and other decisions. After Questar’s spin-off of QEP, the QEP position was retained since it fit our criteria of a low cost producer (of natural gas) with a deep inventory for projects, but the remaining Questar position was sold.
Outlook
Despite the headwinds that continue to face the economy, the S&P 500 Index experienced its second consecutive positive year, returning +15.06%. This came on the heels of the stellar +26.46% return it produced in 2009. And while the stock market performed better than generally anticipated in 2010, the path to this end was anything but smooth. The main focus of the financial markets since the recession began three years ago has been the economy and, throughout the past year, investors reacted strongly to economic and other news and events on a real-time basis. However, during the last half of the year, additional monetary and fiscal stimulus, strong corporate earnings, and better economic data resulted in a shift from the earlier fear of a double-dip recession to optimism that the economy is or will be improving. The economy
| LOU HOLLAND |
| GROWTH FUND |
| |
| Letter to Shareholders |
| December, 2010 |
now appears to be on more durable ground than it was this time last year. Yet, some risks linger, particularly high unemployment, slow job creation, and continued weak housing. Earnings have been better than anticipated, but corporations remain cautious about future demand as evidenced by their preference to use cash strategically in ways that generally benefit shareholders, as contrasted to putting people back to work. Indeed, the economy faces many challenges as it continues to unwind the excesses of the past several decades. Thus, while things are improving, stock market action may likely remain choppy until data signals an economy that is able to grow on a self-sustaining basis.
We do not attempt to predict the direction of the stock market, the economy, or interest rates. However, we understand that corporate profitability and earnings are affected by the pace of economic growth. Thus, we remain committed to using our thorough, high quality, bottom-up research to identify companies that best meet our long-term fundamental investment criteria. In addition, we currently like companies with exposure to faster-growing products or markets, companies that are market share gainers, and companies whose bottom lines are leveraged to increased demand as the economy recovers. We continue to focus on high quality companies, with solid balance sheets and strong free cash flow and also favorably regard those using this time to take advantage of opportunities that strengthen their competitive positions and that create shareholder value longer-term, including returning capital to shareholders by instituting or increasing dividends and/or buying back shares.
In general, we believe that as the economy further recovers and corporate earnings growth normalizes, investors will become cautious of lower quality stocks with lower quality or unsustainable earnings. We expect investors to shift their focus toward stocks of high quality companies with strong balance sheets and good managements, with the ability to generate high quality, sustainable earnings with achievable estimates, metrics consistent with our bottom-up fundamental investment criteria.
We believe that our extensive investment experience and our conservative growth strategy will produce superior results for long-term investors.
Sincerely,
Monica L. Walker Carl R. Bhathena
CEO & Chief Investment Officer – Equity Co-Portfolio Manager - Equity
| LOU HOLLAND |
| GROWTH FUND |
| |
| Performance Chart and Analysis |
| December 31, 2010 |
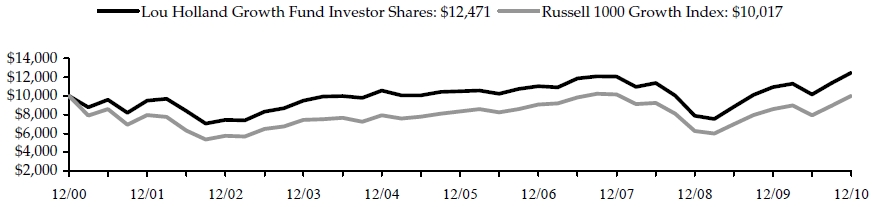
The following chart reflects the change in the value of a hypothetical $10,000 investment in Investor Shares, including reinvested dividends and distributions, in the Lou Holland Growth Fund (the “Fund”) compared with the performance of the benchmark Russell 1000 Growth Index, over the past ten fiscal years. The Russell 1000 Growth Index, is an unmanaged index which measures the performance of a subset of approximately 622 of those Russell 1000 companies (that is, the 1,000 largest U.S. companies in terms of market capitalization) with higher price-to-book ratios and higher forecasted growth values. The total return of the Fund's classes includes the maximum sales charge of 5.75% (A Shares only) and operating expenses that reduce returns, while the total return of the Russell 1000 Growth Index does not include the effect of sales charges and expenses. A Shares are subject to a 1.00% contingent deferred sales charge on shares purchased without an initial sales charge and redeemed less than one year after purchase. The total return of the Russell 1000 Growth Index includes reinvestment of dividends and income. The total return of the Fund includes operating expenses that reduce returns, while the total return of the Russell 1000 Growth Index does not include expenses. The Fund is professionally managed while the Russell 1000 Growth Index is unmanaged and is not available for investment.
Performance data quoted represents past performance and is no guarantee of future results. Current performance may be lower or higher than the performance data quoted. Investment return and principal value will fluctuate so that shares, when redeemed, may be worth more or less than original cost. For the most recent month-end performance, please visit the website of the Fund's investment adviser at www.hollandcap.com. As stated in the Fund's prospectus, the annual operating expense ratios (gross) for Investor Shares, Institutional Shares and A Shares, respectively are 1.79%, 1.81% and 36.77%, respectively. However, the Fund's adviser has agreed to contractually waive a portion of its fees and to reimburse expenses such that total operating expenses do not exceed 1.35% for Investor Shares through May 1, 2013, and 1.20% and 1.40% for Institutional Shares and A Shares, respectively, which is in effect until May 1, 2011. The performance table and graph do not reflect the deduction of taxes that a shareholder would pay on Fund distributions or the redemption of Fund shares. Returns greater than one year are annualized.
Average Annual Rate of Return for the Year Ended December 31, 2010
| Lou Holland Growth Fund | 1 Year | 5 Years | 10 Years |
| Investor Shares | 14.03% | 3.54% | 2.24% |
| Institutional Shares* | 14.20% | 3.57% | 2.25% |
| A Shares (with sales charge)* | 7.42% | 2.31% | 1.63% |
| Russell 1000 Growth Index | 16.71% | 3.75% | 0.02% |
*For the Institutional Shares and the A Shares, performance for the above periods are blended average annual returns which include the returns of the Investor Shares prior to February 1, 2010, the commencement of operations of the Institutional Shares and A Shares.
| LOU HOLLAND |
| GROWTH FUND |
| |
| Schedule of Investments |
| December 31, 2010 |
| Shares | | Security Description | | Value | |
| Common Stock - 98.5% |
| Consumer Discretionary - 12.1% |
| | 7,350 | | Amazon.com, Inc. (a) | $ | 1,323,000 | |
| | 9,500 | | Costco Wholesale Corp. | | 685,995 | |
| | 5,950 | | Kohl's Corp. (a) | | 323,323 | |
| | 13,700 | | NIKE, Inc., Class B | | 1,170,254 | |
| | 17,350 | | The Walt Disney Co. | | 650,799 | |
| | 12,650 | | Wal-Mart Stores, Inc. | | 682,214 | |
| | 37,700 | | Yum! Brands, Inc. | | 1,849,185 | |
| | | 6,684,770 | |
| Consumer Staples - 6.1% |
| | 7,050 | | Diageo PLC, ADR | | 524,027 | |
| | 11,500 | | H.J. Heinz Co. | | 568,790 | |
| | 13,100 | | Mead Johnson Nutrition Co. | | 815,475 | |
| | 14,550 | | PepsiCo, Inc. | | 950,551 | |
| | 7,850 | | The Procter & Gamble Co. | | 504,991 | |
| | | 3,363,834 | |
| Energy - 18.0% |
| | 27,309 | | Exxon Mobil Corp. | | 1,996,834 | |
| | 37,250 | | Halliburton Co. | | 1,520,917 | |
| | 14,250 | | Noble Corp. | | 509,723 | |
| | 19,850 | | Occidental Petroleum Corp. | | 1,947,285 | |
| | 19,700 | | QEP Resources, Inc. | | 715,307 | |
| | 46,700 | | Range Resources Corp. | | 2,100,566 | |
| | 31,050 | | Southwestern Energy Co. (a) | | 1,162,202 | |
| | | 9,952,834 | |
| Financial Services - 8.7% |
| | 17,490 | | Berkshire Hathaway, Inc., Class B (a) | | 1,401,124 | |
| | 3,800 | | BlackRock, Inc. | | 724,204 | |
| | 8,900 | | IHS, Inc., Class A (a) | | 715,471 | |
| | 46,950 | | TD Ameritrade Holding Corp. | | 891,580 | |
| | 15,650 | | Visa, Inc., Class A | | 1,101,447 | |
| | | 4,833,826 | |
| Health Care - 9.8% |
| | 45,350 | | Covidien PLC | | 2,070,681 | |
| | 12,250 | | Genzyme Corp. (a) | | 872,200 | |
| | 18,550 | | Hospira, Inc. (a) | | 1,033,049 | |
| | 16,650 | | Laboratory Corp. of America Holdings (a) | | 1,463,868 | |
| | | 5,439,798 | |
| Materials & Processing - 2.1% |
| | 12,050 | | Praxair, Inc. | | 1,150,414 | |
| | | | |
| Producer Durables - 11.1% |
| | 9,450 | | Automatic Data Processing, Inc. | | 437,346 | |
| | 12,100 | | Expeditors International of Washington, Inc. | | 660,660 | |
| | 22,700 | | Honeywell International, Inc. (a) | | 1,206,732 | |
| | 7,400 | | MSC Industrial Direct Co. | | 478,706 | |
| | 10,300 | | Roper Industries, Inc. | | 787,229 | |
| | 7,450 | | United Parcel Service, Inc., Class B | | 540,721 | |
| | 9,550 | | United Technologies Corp. | | 751,776 | |
| | 16,350 | | Waters Corp. (a) | | 1,270,558 | |
| | | 6,133,728 | |
| Technology - 30.6% |
| | 43,650 | | Adobe Systems, Inc. (a) | | 1,343,547 | |
| | 25,450 | | American Tower Corp., Class A(a) | | 1,314,238 | |
| | 7,850 | | Apple, Inc. (a) | | 2,532,096 | |
| | 98,250 | | Cisco Systems, Inc. (a) | | 1,987,598 | |
| | 34,150 | | Citrix Systems, Inc. (a) | | 2,336,201 | |
| | 2,700 | | Google, Inc., Class A (a) | | 1,603,719 | |
| | 31,700 | | Intel Corp. | | 666,651 | |
| | 9,700 | | International Business Machines Corp. | | 1,423,572 | |
| | 59,950 | | Microsoft Corp. | | 1,673,804 | |
| | 40,550 | | QUALCOMM, Inc. | | 2,006,819 | |
| | | 16,888,245 | |
Total Common Stock (Cost $40,746,902) | | 54,447,449 | |
Total Investments - 98.5% (Cost $40,746,902)* | $ | 54,447,449 | |
| Other Assets & Liabilities, Net – 1.5% | | 818,417 | |
| Net Assets – 100.0% | $ | 55,265,866 | |
| | See Notes to Financial Statements | |
| | 5 | |
| LOU HOLLAND |
| GROWTH FUND |
| |
| Schedule of Investments |
| December 31, 2010 |
| ADR | American Depository Receipt |
| PLC | Public Limited Company |
(a) Non-income producing security.
*Cost of investments for federal income tax purposes is $40,951,430 and net unrealized appreciation on investments consists of:
| Gross Unrealized Appreciation | | $ | 14,924,157 | |
| Gross Unrealized Depreciation | | | (1,428,138 | ) |
| Net Unrealized Appreciation | | $ | 13,496,019 | |
The following is a summary of the inputs used to value the Fund’s investments as of December 31, 2010.
The inputs or methodology used for valuing securities are not necessarily an indication of the risk associated with investing in those securities. For more information on valuation inputs, and their aggregation into the levels used in the tables below, please refer to Note 2- Security Valuation section in the accompanying Notes to Financial Statements.
| Valuation Inputs | | Investments in Securities |
| Level 1 – Quoted Prices | | $ | 54,447,449 |
| Level 2 – Other Significant Observable Inputs | | | – |
| Level 3 – Significant Unobservable Inputs | | | – |
| Total Investments | | $ | 54,447,449 |
The Level 1 inputs displayed in this table are Common Stock. Refer to the Schedule of Investments for a further breakout of each security by type.
| PORTFOLIO HOLDINGS | | |
| % of Total Investments | | |
| Consumer Discretionary | 12.3 | % |
| Consumer Staples | 6.2 | % |
| Energy | 18.3 | % |
| Financial Services | 8.9 | % |
| Health Care | 10.0 | % |
| Materials & Processing | 2.1 | % |
| Producer Durables | 11.2 | % |
| Technology | 31.0 | % |
| | 100.0 | % |
| | See Notes to Financial Statements | |
| | 6 | |
| LOU HOLLAND |
| GROWTH FUND |
| |
| Statement of Assets and Liabilities |
| December 31, 2010 |
| ASSETS | | | | |
| | Total investments, at value (Cost $40,746,902) | | $ | 54,447,449 | |
| | Cash | | | 1,019,331 | |
| | Receivables: | | | | |
| | | Fund shares sold | | | 11,945 | |
| | | Dividends and interest | | | 37,002 | |
| | Prepaid expenses | | | 12,054 | |
| Total Assets | | | 55,527,781 | |
| LIABILITIES | | | | |
| | Payables: | | | | |
| | | Investment securities purchased | | | 147,789 | |
| | | Fund shares redeemed | | | 30,024 | |
| | Accrued Liabilities: | | | | |
| | Investment adviser fees | | | 27,204 | |
| | | Trustees’ fees and expenses | | | 34 | |
| | | Fund service fees | | | 8,422 | |
| | | Compliance services fees | | | 1,250 | |
| | | Other expenses | | | 47,192 | |
| Total Liabilities | | | 261,915 | |
| NET ASSETS | | $ | 55,265,866 | |
| | | | | | | |
| COMPONENTS OF NET ASSETS | | | | |
| | Paid-in capital | | $ | 41,769,847 | |
| | Accumulated net realized loss | | | (204,528 | ) |
| | Net unrealized appreciation | | | 13,700,547 | |
| NET ASSETS | | $ | 55,265,866 | |
| | | | | | | |
| SHARES OF BENEFICIAL INTEREST AT NO PAR VALUE (UNLIMITED SHARES AUTHORIZED) | | | | |
| | Investor Shares | | | 2,710,957 | |
| | Institutional Shares | | | 56,304 | |
| | A Shares | | | 618 | |
| NET ASSET VALUE, OFFERING AND REDEMPTION PRICE PER SHARE | | | | |
| | Investor Shares (based on net assets of $54,127,702) | | $ | 19.97 | |
| | Institutional Shares (based on net assets of $1,125,826) | | $ | 20.00 | |
| | A Shares (based on net assets of $12,338) | | $ | 19.96 | |
| | A Shares Maximum Public Offering Price Per Share (net asset value per share/(100%-5.75%)) | | $ | 21.18 | |
| | See Notes to Financial Statements | |
| | 7 | |
| LOU HOLLAND |
| GROWTH FUND |
| |
| Statement of Operations |
| For the Year Ended December 31, 2010 |