Table of Contents
| Letter to Shareholders | 1 |
| Fund Performance and Summary | 4 |
| Schedule of Investments | 5 |
| Statement of Assets and Liabilities | 8 |
| Statement of Operations | 9 |
| Statements of Changes in Net Assets | 10 |
| Financial Highlights | 11 |
| Notes to Financial Statements | 12 |
| Report of Independent Registered Public Accounting Firm | 18 |
| Supplemental Information | 19 |
| Expense Example | 23 |
This report and the financial statements contained herein are provided for the general information of the shareholders of the SGA Global Growth Fund. This report is not authorized for distribution to prospective investors in the Fund unless preceded or accompanied by an effective prospectus.
SGA Global Growth Fund
Performance Review
For the year ended September 30, 2012, the SGA Global Growth Fund returned 27.00%, outpacing both the 23.02% return of the MSCI World Growth Index and the 21.59% return of the MSCI World Index.
Market Overview
Global equity markets generated very strong returns during the reporting period, gaining more than 20%. Nearly all the advance occurred during the first six months of the period, when evidence of improving economic conditions in the U.S. and signs of greater stability in Europe fueled a sharp rally in global equity markets. Stocks reversed course in the second quarter of 2012 as uneven U.S. economic data, renewed European debt troubles, slower growth in China and other emerging economies, and the looming “fiscal cliff” in the U.S. (the year-end expiration of certain tax cuts and the mandated implementation of federal government spending reductions) weighed on investor confidence. However, global stocks bounced back late in the period as central banks around the world took steps to stimulate economic activity.
U.S. stocks posted the strongest returns for the 12 months, followed by markets in the Asia/Pacific region (excluding Japan). Europe lagged the global equity indexes but still generated double-digit gains, while Japan was one of the few stock markets worldwide to decline for the reporting period.
The Importance of Revenue Growth
In managing the portfolio, we seek out companies around the world that can produce strong growth along with the low variability of earnings and revenue growth that come from highly stable and predictable business models. Over time, we believe the market will reward these companies as they deliver consistently robust revenue, profit, and cash flow growth.
The ability to increase revenues consistently is vital for companies to produce sustainable earnings growth. One of the striking elements of the sharp profit recovery in developed economies over the past three years is the corresponding lack of sales growth. For example, corporate profit margins in the U.S. are now above the prior peak reached in 2007 despite the fact that corporate revenues have increased only slightly from the low point of the recent recession—a testament to corporate America’s management prowess and worker productivity.
From current peak margins, further profit growth will require higher revenues, but that will be a tall order in an environment of sluggish and uneven economic activity. In fact, corporate profit growth is decelerating sharply across the globe; by comparison, portfolio companies reported double-digit profit growth over the reporting period.
Leaders
The Fund’s holdings in the information technology sector contributed the most to its strong performance during the reporting period. The top contributor in the portfolio was consumer electronics maker Apple, which gained more than 75% for the 12-month period. Apple continued to deliver tremendous cash flow as the company rolled out a well-received new iteration of the iPhone and enjoyed continued strong demand for the iPad. Online auctioneer EBay, another leading contributor, enjoyed higher e-commerce activity as a revised pricing methodology and new search algorithm improved the value proposition for both sellers and buyers. PayPal, EBay’s online payment arm, also continued to produce very strong growth, providing an additional boost to the stock.
Other notable contributors included Danish drug maker Novo Nordisk and global brewing giant Anheuser-Busch Inbev. Novo Nordisk, the world’s largest producer of insulin, benefited from low production costs and improving delivery of its product, while A-B Inbev made a beneficial acquisition during the period that was viewed favorably by the market.
Laggards
Just four stocks in the portfolio posted negative returns during the 12-month period, led by mining equipment producer Joy Global, which was added to the portfolio in early 2012. Joy Global is the global leader in coal mining equipment, but its stock declined during the period amid slowing economic growth (particularly in emerging markets), declining commodity prices, and the recent conversion of some electricity-generation capacity from coal to natural gas in the U.S.
Other notable decliners in the portfolio included Arcos Dorados, the largest McDonald’s franchisee in the world with exclusive rights to Latin America and the Caribbean; Transocean, a Swiss provider of oil drilling services; and MercadoLibre, which operates the leading e-commerce marketplace in Latin America. Transocean and MercadoLibre were added to the portfolio during the first half of 2012.
Portfolio Changes
We are constantly seeking to boost the portfolio’s growth prospects when we can do so at attractive valuations. Toward that end, we added eight new stocks to the portfolio during the 12-month period and subtracted five others.
Among the additions, four were U.S.-based companies—Joy Global, hotel operator Starwood Hotels & Resorts Worldwide, agricultural products maker Monsanto, and open-source software provider Red Hat. The other four included Transocean and MercadoLibre, as well as Swiss food products maker Nestle and Danish industrial enzyme producer Novozymes.
The five stocks eliminated from the portfolio during the reporting period included three American companies—coffee retailer Starbucks, payroll processor Automatic Data Processing, and cleaning products manufacturer Ecolab—as well as German industrial gas company Linde and Mexican discount retailer Wal-Mart de Mexico.
Outlook
The Fund has delivered strong results since its inception, and we believe that it remains well positioned going forward. Portfolio companies are delivering double-digit revenue, profit, and cash flow growth in an environment where the global equity markets are struggling to produce any growth at all. In addition, for each dollar of earnings, portfolio companies generate 82 cents in free cash flow available to shareholders.
Furthermore, the portfolio’s valuation remains attractive—the enterprise yield (a measure of true free cash flow) of the portfolio currently stands at 3.9%, more than double the yield on the 10-year Treasury bond. We expect this combination of growth and valuation to remain a tailwind for the portfolio’s absolute and relative performance going forward.
Mid and large cap stocks are subject to substantial risks such as market, business, size volatility, management experience, product diversification, financial resource, competitive strength, liquidity, and potential to fall out of favor that may cause their prices to fluctuate over time, sometimes rapidly and unpredictably. Foreign investments present additional risk due to currency fluctuations, economic and political factors, government regulations, differences in accounting standards and other factors. Investments in emerging markets involve even greater risks.
If this report is used for promotional purposes, distribution of the report must be preceded or accompanied by a current prospectus.
SGA Global Growth Fund
FUND PERFORMANCE AND SUMMARY at September 30, 2012
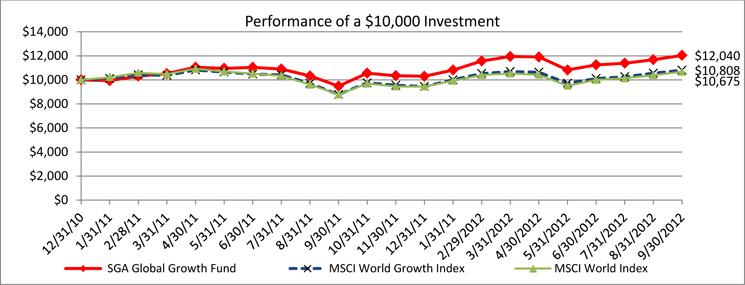
This graph compares a hypothetical $10,000 investment in the Fund, made at its inception with a similar investment in the MSCI World Growth Index and MSCI World Index. Results include the reinvestment of all dividends and capital gains.
The MSCI World Growth Index is a free-float weighted index.
The MSCI World Index is a free float-adjusted market capitalization weighted index that is designed to measure the equity market performance of developed markets.
These indices do not reflect expenses, fees or sales charge, which would lower performance.
Total Returns as of September 30, 2012 |
| | 6 Months | 1 Year | Since
Inception* |
| SGA Global Growth Fund | 0.75% | 27.00% | 11.21% |
| MSCI World Growth Index | 1.05% | 23.02% | 4.55% |
| MSCI World Index | 1.30% | 21.59% | 3.81% |
| * | Inception date 12/31/10. |
The performance data quoted here represents past performance and past performance is no guarantee of future results. Investment return and principal will fluctuate, so that an investor's shares, when redeemed, may be worth more or less than their original cost. Current performance may be lower or higher than the performance quoted.
Gross and net expense ratio for the Fund are 28.14% and 1.75%, respectively, which are the amounts stated in the current prospectus as of the date of this report. The contractual fee waivers are in effect until January 31, 2022.
Returns reflect the reinvestment of distributions made by the Fund, if any. The deduction of taxes that a shareholder would pay on Fund distribution or the redemption of Fund shares is not reflected in the total returns.
Shares redeemed within 60 days of purchase will be charged 2.00% redemption fee.
SGA Global Growth Fund
SCHEDULE OF INVESTMENTS
Number of Shares | | | | Value | |
| | | | | | |
| | | COMMON STOCKS – 97.6% | | | |
| | | CONSUMER DISCRETIONARY – 12.7% | | | |
| | 252 | | Amazon.com, Inc.* | | $ | 64,089 | |
| | 4,795 | | Arcos Dorados Holdings, Inc. - Class A | | | 73,987 | |
| | 761 | | Starwood Hotels & Resorts Worldwide, Inc. | | | 44,107 | |
| | 1,265 | | Yum! Brands, Inc. | | | 83,920 | |
| | | | | | | 266,103 | |
| | | | CONSUMER STAPLES – 20.1% | | | | |
| | 1,026 | | Anheuser-Busch InBev N.V. - ADR | | | 88,144 | |
| | 1,469 | | Cia de Bebidas das Americas - ADR | | | 56,219 | |
| | 2,357 | | Coca-Cola Amatil Ltd. - ADR | | | 66,444 | |
| | 628 | | Colgate-Palmolive Co. | | | 67,334 | |
| | 4,796 | | Danone - ADR | | | 58,751 | |
| | 1,340 | | Nestle S.A. - ADR | | | 84,701 | |
| | | | | | | 421,593 | |
| | | | ENERGY – 9.8% | | | | |
| | 1,069 | | National Oilwell Varco, Inc. | | | 85,637 | |
| | 887 | | Schlumberger Ltd. | | | 64,157 | |
| | 1,220 | | Transocean Ltd. | | | 54,766 | |
| | | | | | | 204,560 | |
| | | | FINANCIALS – 3.0% | | | | |
| | 1,492 | | State Street Corp. | | | 62,604 | |
| | | | | | | | |
| | | | HEALTH CARE – 14.9% | | | | |
| | 824 | | Cerner Corp.* | | | 63,786 | |
| | 1,166 | | Fresenius Medical Care A.G. & Co. KGaA - ADR | | | 85,584 | |
| | 410 | | Novo Nordisk A/S - ADR | | | 64,702 | |
| | 76,827 | | Shandong Weigao Group Medical Polymer Co., Ltd. - Class H | | | 99,278 | |
| | | | | | | 313,350 | |
| | | | INDUSTRIALS – 2.0% | | | | |
| | 750 | | Joy Global, Inc. | | | 42,045 | |
| | | | | | | | |
| | | | INFORMATION TECHNOLOGY – 29.5% | | | | |
| | 155 | | Apple, Inc. | | | 103,425 | |
| | 2,455 | | ARM Holdings PLC - ADR | | | 68,691 | |
| | 342 | | Baidu, Inc. - ADR* | | | 39,953 | |
| | 1,785 | | eBay, Inc.* | | | 86,412 | |
| | 510 | | MercadoLibre, Inc. | | | 42,101 | |
| | 710 | | Red Hat, Inc.* | | | 40,427 | |
| | 1,234 | | SAP A.G. - ADR | | | 88,021 | |
| | 655 | | Visa, Inc. - Class A | | | 87,953 | |
SGA Global Growth Fund
SCHEDULE OF INVESTMENTS - Continued
Number of Shares | | | | Value | |
| | | | | | | | |
| | | | COMMON STOCKS (Continued) | | | | |
| | | | INFORMATION TECHNOLOGY (Continued) | | | | |
| | 1,797 | | VistaPrint N.V.* | | $ | 61,368 | |
| | | | | | | 618,351 | |
| | | | MATERIALS – 5.6% | | | | |
| | 950 | | Monsanto Co. | | | 86,469 | |
| | 1,150 | | Novozymes A/S - ADR | | | 31,913 | |
| | | | | | | 118,382 | |
| | | | TOTAL COMMON STOCKS (Cost $1,829,273) | | | 2,046,988 | |
| | | | | | | | |
| | | | SHORT-TERM INVESTMENTS – 2.8% | | | | |
| | 58,648 | | Federated Treasury Obligations Fund, 0.01%1 | | | 58,648 | |
| | | | | | | | |
| | | | TOTAL SHORT-TERM INVESTMENTS (Cost $58,648) | | | 58,648 | |
| | | | | | | | |
| | | | TOTAL INVESTMENTS – 100.4% (Cost $1,887,921) | | | 2,105,636 | |
| | | | Liabilities in Excess of Other Assets – (0.4)% | | | (8,647 | ) |
| | | | | | | | |
| | | | TOTAL NET ASSETS –100.0% | | $ | 2,096,989 | |
| ADR – American Depositary Receipt | | | |
| PLC – Public Limited Company | | | |
| | | | |
* Non-income producing security. | | | |
1 The rate quoted is the annualized seven-day yield of the Fund at the period end. | | | |
| | | | |
See accompanying Notes to Financial Statements.
SGA Global Growth FundSUMMARY OF INVESTMENTS
| Percent of Total
Net Assets |
| Common Stocks | |
| United States | 46.8% |
| Germany | 8.3% |
| Switzerland | 6.7% |
| China | 6.6% |
| Argentina | 5.5% |
| Denmark | 4.6% |
| Belgium | 4.2% |
| United Kingdom | 3.3% |
| Australia | 3.2% |
| Netherlands | 2.9% |
| France | 2.8% |
| Brazil | 2.7% |
| Total Common Stocks | 97.6% |
| Short-Term Investments | 2.8% |
| Total Investments | 100.4% |
| Liabilities in Excess of Other Assets | (0.4)% |
| Total Net Assets | 100.0% |
See accompanying Notes to Financial Statements.
| SGA Global Growth Fund |
| STATEMENT OF ASSETS AND LIABILITIES |
| As of September 30, 2012 |
| Assets: | | | |
| Investments, at value (cost $1,887,921) | | $ | 2,105,636 | |
| Receivables: | | | | |
| Investment securities sold | | | 31,253 | |
| Dividends and interest | | | 2,643 | |
| Due from advisor | | | 6,104 | |
| Prepaid expenses | | | 4,193 | |
| Total assets | | | 2,149,829 | |
| | | | | |
| Liabilities: | | | | |
| Payables: | | | | |
| Investment securities purchased | | | 10,553 | |
| Distribution fees (Note 6) | | | 428 | |
| Audit fees | | | 15,241 | |
| Fund accounting fees | | | 6,217 | |
| Transfer agent fees and expenses | | | 5,377 | |
| Administration fees | | | 4,261 | |
| Legal fees | | | 3,055 | |
| Custody fees | | | 2,292 | |
| Chief Compliance Officer fees | | | 938 | |
| Trustees' fees and expenses | | | 164 | |
| Accrued other expenses | | | 4,314 | |
| Total liabilities | | | 52,840 | |
| | | | | |
| Net Assets | | $ | 2,096,989 | |
| | | | | |
| Components of Net Assets: | | | | |
| Capital (par value of $0.01 per share with an unlimited number of shares authorized) | | $ | 1,857,589 | |
| Accumulated net investment loss | | | (1,895 | ) |
| Accumulated net realized gain on investments and foreign currency transactions | | | 23,580 | |
| Net unrealized appreciation on investments | | | 217,715 | |
| Net Assets | | $ | 2,096,989 | |
| | | | | |
| Number of shares issued and outstanding | | | 174,193 | |
| Net asset value per share | | $ | 12.04 | |
| SGA Global Growth Fund |
| STATEMENT OF OPERATIONS |
| For the Year Ended September 30, 2012 |
| Investment Income: | | | |
| Dividends (net of foreign tax withholding of $2,074) | | $ | 21,202 | |
| Interest | | | 3 | |
| Total investment income | | | 21,205 | |
| | | | | |
| Expenses: | | | | |
| Administration fees | | | 36,093 | |
| Fund accounting fees | | | 32,170 | |
| Transfer agent fees and expenses | | | 28,338 | |
| Registration fees | | | 24,062 | |
| Advisory fees | | | 16,816 | |
| Audit fees | | | 15,185 | |
| Custody fees | | | 9,374 | |
| Offering cost | | | 8,876 | |
| Legal fees | | | 8,028 | |
| Miscellaneous | | | 7,346 | |
| Chief Compliance Officer fees | | | 7,025 | |
| Distribution fees (Note 6) | | | 4,175 | |
| Trustees' fees and expenses | | | 4,017 | |
| Insurance fees | | | 721 | |
| Total expenses | | | 202,226 | |
| Advisory fees waived | | | (16,816 | ) |
| Other expenses absorbed | | | (155,978 | ) |
| Net expenses | | | 29,432 | |
| Net investment loss | | | (8,227 | ) |
| | | | | |
| Realized and Unrealized Gain (Loss) on Investments and Foreign Currency: | | | | |
| Net realized gain (loss) on: | | | | |
| Investments | | | 36,989 | |
| Foreign currency transactions | | | (4 | ) |
| Net change in unrealized appreciation/depreciation on investments | | | 318,782 | |
| Net realized and unrealized gain on investments and foreign currency | | | 355,767 | |
| | | | | |
| Net Increase in Net Assets from Operations | | $ | 347,540 | |
| * Commencement of operations | | | | |
See accompanying Notes to Financial Statements.
| SGA Global Growth Fund |
| STATEMENT OF CHANGES IN NET ASSETS |
| | | For the Year Ended
September 30, 2012 | | | For the Period
December 31, 2010* to September 30, 2011 | |
| Increase (Decrease) in Net Assets from: | | | | | | |
| Operations: | | | | | | |
| Net investment loss | | $ | (8,227 | ) | | $ | (3,120 | ) |
| Net realized gain (loss) on investments and | | | | | | | | |
| foreign currency transactions | | | 36,985 | | | | (7,073 | ) |
| Net change in unrealized appreciation/depreciation | | | | | | | | |
| on investments | | | 318,782 | | | | (101,067 | ) |
| Net increase (decrease) in net assets resulting | | | | | | | | |
| from operations | | | 347,540 | | | | (111,260 | ) |
| | | | | | | | | |
| Capital Transactions: | | | | | | | | |
| Net proceeds from shares sold | | | 554,515 | | | | 1,306,239 | |
| Cost of shares redeemed | | | — | | | | (45 | ) |
| Net increase in net assets from capital transactions | | | 554,515 | | | | 1,306,194 | |
| | | | | | | | | |
| Total increase in net assets | | | 902,055 | | | | 1,194,934 | |
| | | | | | | | | |
| Net Assets: | | | | | | | | |
| Beginning of period | | | 1,194,934 | | | | — | |
| End of period | | $ | 2,096,989 | | | $ | 1,194,934 | |
| | | | | | | | | |
| Accumulated net investment loss | | $ | (1,895 | ) | | $ | — | |
| | | | | | | | | |
| Capital Share Transactions: | | | | | | | | |
| Shares sold | | | 48,113 | | | | 126,085 | |
| Shares redeemed | | | — | | | | (5 | ) |
| Net increase from capital share transactions | | | 48,113 | | | | 126,080 | |
| * Commencement of operations | | | | |
See accompanying Notes to Financial Statements.
| SGA Global Growth Fund |
| FINANCIAL HIGHLIGHTS |
| Per share operating performance. |
| For a capital share outstanding throughout the period. |
| | | Year Ended September 30, 2012 | | | For the Period December 31, 2010* to | |
| | | | | | | |
| Net asset value, beginning of period | | $ | 9.48 | | | $ | 10.00 | |
| Income from Investment Operations: | | | | | | | | |
Net investment loss1 | | | (0.05 | ) | | | (0.04 | ) |
| Net realized and unrealized gain (loss) | | | | | | | | |
| on investments and foreign currency | | | 2.61 | | | | (0.48 | ) |
| Total from investment operations | | | 2.56 | | | | (0.52 | ) |
| | | | | | | | | |
| Net asset value, end of period | | $ | 12.04 | | | $ | 9.48 | |
| | | | | | | | | |
| Total return | | | 27.00 | % | | | (5.20 | )%2 |
| | | | | | | | | |
| Ratios and Supplemental Data: | | | | | | | | |
| Net assets, end of period (in thousands) | | $ | 2,097 | | | $ | 1,195 | |
| | | | | | | | | |
| Ratio of expenses to average net assets: | | | | | | | | |
| Before fees waived and expenses absorbed | | | 12.02 | % | | | 28.14 | %3 |
| After fees waived and expenses absorbed | | | 1.75 | % | | | 1.74 | %3 |
| Ratio of net investment loss to average net assets: | | | | | | | | |
| Before fees waived and expenses absorbed | | | (10.76 | )% | | | (26.92 | )%3 |
| After fees waived and expenses absorbed | | | (0.49 | )% | | | (0.52 | )%3 |
| Portfolio turnover rate | | | 41 | % | | | 48 | %2 |
| * | Commencement of operations. |
| 1 | Based on average shares outstanding during the period. |
| 2 | Not annualized. |
| 3 | Annualized. |
Note 1 – Organization
SGA Global Growth Fund (the ‘‘Fund’’) was organized as a non-diversified series of Investment Managers Series Trust, a Delaware statutory trust (the “Trust”) which is registered as an open-end management investment company under the Investment Company Act of 1940, as amended (the “1940 Act”). The Fund’s primary investment objective is long-term capital appreciation. The Fund commenced investment operations on December 31, 2010.
Note 2 – Accounting Policies
The following is a summary of the significant accounting policy consistently followed by the Fund in the preparation of its financial statements. The preparation of financial statements in conformity with accounting principles generally accepted in the United States of America (“GAAP”) requires management to make estimates and assumptions that affect the reported amounts and disclosures in the financial statements. Actual results could differ from these estimates.
(a) Valuation of Investments
The Fund values equity securities at the last reported sale price on the principal exchange or in the principal over the counter (“OTC”) market in which such securities are traded, as of the close of regular trading on the NYSE on the day the securities are being valued or, if there are no sales, at the mean between the last available bid and asked prices on that day. Securities traded on the NASDAQ are valued at the NASDAQ Official Closing Price (“NOCP”). Other types of securities, including restricted securities and securities for which market quotations are not readily available, are valued at fair value as determined in accordance with procedures established in good faith by the Board of Trustees. Short-term securities with remaining maturities of sixty days or less are valued at amortized cost, which approximates market value.
A Fund’s assets generally are valued at their market value. If a market quotation is not readily available for a portfolio security, the security will be valued at fair value (the amount which the Fund might reasonably expect to receive for the security upon its current sale) as determined in good faith by the Fund’s advisor, subject to review and approval by the Valuation Committee, pursuant to procedures adopted by the Board of Trustees. The actions of the Valuation Committee are subsequently reviewed by the Board at its next regularly scheduled board meeting. The Valuation Committee meets as needed. The Valuation Committee is comprised of all the Trustees but action may be taken by any one of the Trustees.
(b) Investment Transactions, Investment Income and Expenses
Investment transactions are accounted for on the trade date. Realized gains and losses on investments are determined on the identified cost basis. Dividend income is recorded net of applicable withholding taxes on the ex-dividend date and interest income is recorded on an accrual basis. Withholding taxes on foreign dividends have been provided for in accordance with the Fund’s understanding of the applicable country’s tax rules and rates. Expenses incurred by the Trust with respect to more than one fund are allocated in proportion to the net assets of each fund except where allocation of direct expenses to each fund or an alternative allocation method can be more appropriately made.
The Fund incurred offering costs of approximately $32,810, which were amortized over a one-year period from December 31, 2010 (commencement of operations).
(c) Foreign Currency Translation
The Fund’s records are maintained in U.S. dollars. The value of securities, currencies and other assets and liabilities denominated in currencies other than U.S. dollars are translated into U.S. dollars based upon foreign exchange rates prevailing at the end of the reporting period. The currencies are translated into U.S. dollars by
SGA Global Growth Fund
NOTES TO FINANCIAL STATEMENTS - Continued
using the exchange rates quoted prior to when the Fund’s net asset value is next determined. Purchases and sales of investment securities, income and expenses are translated on the respective dates of such transactions.
The Fund does not isolate that portion of its net realized and unrealized gains and losses on investments resulting from changes in foreign exchange rates from the impact arising from changes in market prices. Such fluctuations are included with net realized and unrealized gain or loss from investments and foreign currency.
Net realized foreign currency transaction gains and losses arise from sales of foreign currencies, currency gains or losses realized between the trade and settlement dates on securities transactions, and the differences between the amounts of dividends, interest, and foreign withholding taxes recorded on the Fund’s books and the U.S. dollar equivalent of the amounts actually received or paid. Net unrealized foreign currency translation gains and losses arise from changes in the value of assets and liabilities, other than investments in securities, resulting from changes in the exchange rates.
(d) Federal Income Taxes
The Fund intends to comply with the requirements of Subchapter M of the Internal Revenue Code applicable to regulated investment companies and to distribute substantially all of its net investment income and any net realized gains to its shareholders. Therefore, no provision is made for federal income or excise taxes. Due to the timing of dividend distributions and the differences in accounting for income and realized gains and losses for financial statement and federal income tax purposes, the fiscal year in which amounts are distributed may differ from the year in which the income and realized gains and losses are recorded by the Fund.
The Regulated Investment Company Modernization Act of 2010 (the "Act") was signed into law on December 22, 2010. The Act made changes to a number of the federal income and excise tax provisions impacting regulated investment companies ("RICs"), including simplification provisions on asset diversification and qualifying income tests, provisions aimed at preserving the character of the distributions made by the RIC and coordination of the income and excise tax distribution requirements, and provisions for allowing unlimited years carryforward for capital losses. In general, the provisions of the Act were effective for taxable years beginning after December 22, 2010, the date of enactment.
Accounting for Uncertainty in Income Taxes (the “Income Tax Statement”) requires an evaluation of tax positions taken (or expected to be taken) in the course of preparing a Fund’s tax returns to determine whether these positions meet a “more-likely-than-not” standard that, based on the technical merits, have a more than fifty percent likelihood of being sustained by a taxing authority upon examination. A tax position that meets the “more-likely-than-not” recognition threshold is measured to determine the amount of benefit to recognize in the financial statements. The Fund recognizes interest and penalties, if any, related to unrecognized tax benefits as income tax expense in the Statement of Operations.
The Income Tax Statement requires management of the Fund to analyze tax positions taken in the prior three open tax years, if any, and tax positions expected to be taken in the Fund’s current tax year, as defined by the IRS statute of limitations for all major jurisdictions, including federal tax authorities and certain state tax authorities. As of and during the year ended September 30, 2012, the Fund did not have a liability for any unrecognized tax benefits. The Fund has no examination in progress and is not aware of any tax positions for which it is reasonably possible that the total amounts of unrecognized tax benefits will significantly change in the next twelve months.
SGA Global Growth Fund
NOTES TO FINANCIAL STATEMENTS - Continued
(e) Distributions to Shareholders
The Fund will make distributions of net investment income and capital gains, if any, at least annually. Distributions to shareholders are recorded on the ex-dividend date. The amount and timing of distributions are determined in accordance with federal income tax regulations, which may differ from GAAP.
The character of distributions made during the year from net investment income or net realized gains may differ from the characterization for federal income tax purposes due to differences in the recognition of income, expense and gain (loss) items for financial statement and tax purposes. Where appropriate, reclassifications between net asset accounts are made for such differences that are permanent in nature.
Note 3 – Investment Advisory and Other Agreements
The Trust, on behalf of the Fund, entered into an Investment Advisory Agreement (the “Agreement”) with Sustainable Growth Advisers, LP (the “Advisor”). Under the terms of the Agreement, the Fund pays a monthly investment advisory fee to the Advisor at the annual rate of 1.00% of the Fund’s average daily net assets. The Advisor has contractually agreed to waive its fee and, if necessary, to absorb other operating expenses in order to limit total annual operating expenses (excluding taxes, leverage interest, brokerage commissions, dividend expenses on short sales, acquired fund fees and expenses as determined in accordance with Form N-1A, expenses incurred in connection with any merger or reorganization, or extraordinary expenses such as litigation) to 1.75% of the Fund's average daily net assets until January 31, 2022.
For the year ended September 30, 2012, the Advisor waived all of its advisory fees and reimbursed other expenses totaling $172,794. The Advisor may recover from the Fund fees and expenses previously waived and/or absorbed if the Fund’s expense ratio, including the recovered expenses, falls below any current expense limit. The Advisor is permitted to seek reimbursement from the Fund for a period three fiscal years following the fiscal year in which such reimbursements occurred. The Advisor may recapture a portion of the following amounts no later than September 30, of the years stated below:
| | 2014: | | $ | 157,015 | |
| | 2015: | | | 172,794 | |
| | | | $ | 329,809 | |
Grand Distribution Services, LLC (“GDS”) serves as the Fund’s distributor; UMB Fund Services, Inc. (“UMBFS”), an affiliate of GDS, serves as the Fund’s fund accountant and co-administrator; and Mutual Fund Administration Corporation (“MFAC”) serves as the Fund’s other co-administrator. UMBFS also serves as the Fund’s transfer agent and UMB Bank, n.a. (“UMBNA”), an affiliate of UMBFS, serves as the Fund’s custodian.
Certain trustees and officers of the Trust are employees of UMBFS or MFAC. The Fund does not compensate trustees and officers affiliated with the Fund’s co-administrators. For the year ended September 30, 2012, the Fund’s allocated fees incurred for Trustees who are not affiliated with the Fund’s co-administrators are reported on the Statement of Operations.
Cipperman & Co. provides Chief Compliance Officer (“CCO”) services to the Trust. The Fund’s allocated fees incurred for CCO services for the year ended September 30, 2012, are reported on the Statement of Operations.
Note 4 – Federal Income Taxes
At September 30, 2012, gross unrealized appreciation and depreciation of investments and foreign currency owned by the Fund, based on cost for federal income tax purposes were as follows:
SGA Global Growth Fund
NOTES TO FINANCIAL STATEMENTS - Continued
| Cost of investments | | $ | 1,894,587 | |
| | | | | |
| Gross unrealized appreciation | | | 294,028 | |
| Gross unrealized depreciation | | | (82,979 | ) |
| Net unrealized appreciation (depreciation) on investments and foreign currency translations | | $ | 211,049 | |
The difference between cost amounts for financial statement and federal income tax purposes is due primarily to timing differences in recognizing certain gains and losses in security transactions.
Accounting principals generally accepted in the United States require that certain components of net assets be reclassified between financial and tax reporting. These reclassifications have no effect on net assets or net asset value per share. For the year ended September 30, 2012, permanent differences in book and tax accounting have been reclassified to accumulated net investment income and accumulated net realized loss as follows:
| Increase (Decrease) |
| Paid in Capital | Accumulated Net
Investment Income | Accumulated Net
Realized Loss |
| $ - | $ 6,332 | $ (6,332) |
As of September 30, 2012, the components of accumulated earnings on a tax basis were as follows:
| Undistributed ordinary income | | $ | - | |
| Undistributed long-term gains | | | 30,246 | |
| Tax accumulated earnings | | | 30,246 | |
| Accumulated capital and other losses | | | (1,895 | ) |
| | | | | |
| Unrealized appreciation (depreciation) on investments | | | 211,049 | |
| Unrealized appreciation (depreciation) on foreign currency | | | - | |
| Total accumulated earnings | | $ | 239,400 | |
As of September 30, 2012, the Fund had $1,895 of qualified late-year ordinary losses, which are deferred until fiscal year 2013 for tax purposes. Net late-year losses incurred after December 31, and within the taxable year are deemed to arise on the first day of the Fund’s next taxable year.
Note 5 – Investment Transactions
For the year ended September 30, 2012, purchases and sales of investments, excluding short-term investments, were $1,198,564 and $687,654, respectively.
Note 6 – Distribution Plan
The Trust, on behalf of the Fund, has adopted a Distribution Plan (the “Plan”) pursuant to Rule 12b-1 under the 1940 Act that allows the Fund to pay distribution fees for the sale and distribution of its shares. The Plan provides for the payment of distribution fees at the annual rate of up to 0.25% of average daily net assets.
For the year ended September 30, 2012, distribution fees incurred are disclosed on the Statement of Operations.
SGA Global Growth Fund
NOTES TO FINANCIAL STATEMENTS - Continued
Note 7 – Indemnifications
In the normal course of business, the Fund enters into contracts that contain a variety of representations which provide general indemnifications. The Fund’s maximum exposure under these arrangements is unknown, as this would involve future claims that may be made against the Fund that have not yet occurred. However, the Fund expects the risk of loss to be remote.
Note 8 – Fair Value Measurements and Disclosure
Fair Value Measurements and Disclosures defines fair value, establishes a framework for measuring fair value in accordance with GAAP, and expands disclosure about fair value measurements. It also provides guidance on determining when there has been a significant decrease in the volume and level of activity for an asset or liability, when a transaction is not orderly, and how that information must be incorporated into a fair value measurement.
Under Fair Value Measurements and Disclosures, various inputs are used in determining the value of the Fund’s investments. These inputs are summarized into three broad Levels as described below:
| | · | Level 1 – Unadjusted quoted prices in active markets for identical assets or liabilities that the Fund has the ability to access. |
| | · | Level 2 – Observable inputs other than quoted prices included in Level 1 that are observable for the asset or liability, either directly or indirectly. These inputs may include quoted prices for the identical instrument on an inactive market, prices for similar instruments, interest rates, prepayment speeds, credit risk, yield curves, default rates and similar data. |
| | · | Level 3 – Unobservable inputs for the asset or liability, to the extent relevant observable inputs are not available, representing the Fund’s own assumptions about the assumptions a market participant would use in valuing the asset or liability, and would be based on the best information available. |
The availability of observable inputs can vary from security to security and is affected by a wide variety of factors, including, for example, the type of security, whether the security is new and not yet established in the marketplace, the liquidity of markets, and other characteristics particular to the security. To the extent that valuation is based on models or inputs that are less observable or unobservable in the market, the determination of fair value requires more judgment. Accordingly, the degree of judgment exercised in determining fair value is greatest for instruments categorized in Level 3.
The inputs used to measure fair value may fall into different Levels of the fair value hierarchy. In such cases, for disclosure purposes, the Level in the fair value hierarchy within which the fair value measurement falls in its entirety, is determined based on the lowest Level input that is significant to the fair value measurement in its entirety.
In addition, the Fund has adopted Accounting Standards Update No. 2011-04 Amendments to Achieve Common Fair Value Measurement and Disclosure Requirements in U.S. GAAP and IFRSs which amends Fair Value Measurements and Disclosures to establish common requirements for measuring fair value and for disclosing information about fair value measurements in accordance with U.S. GAAP and International Financial Reporting Standards. Enhanced disclosure is required to detail any transfers in to and out of Level 1 and Level 2 measurements and Level 2 and Level 3 measurements and the reasons for the transfers.
SGA Global Growth Fund
NOTES TO FINANCIAL STATEMENTS - Continued
The inputs or methodology used for valuing securities are not an indication of the risk associated with investing in those securities. The following is a summary of the inputs used, as of September 30, 2012, in valuing the Fund’s assets carried at fair value:
| | | Level 1 | | | Level 2* | | | Level 3* | | | Total | |
| Investments | | | | | | | | | | | | |
Common Stocks1 | | $ | 2,046,988 | | | $ | - | | | $ | - | | | $ | 2,046,988 | |
| Short-Term Investments | | | 58,648 | | | | - | | | | - | | | | 58,648 | |
| Total Investments | | $ | 2,105,636 | | | $ | - | | | $ | - | | | $ | 2,105,636 | |
| 1 | All common stocks held in the Fund are Level 1 securities. For a detailed break-out of common stocks by major industry classification, please refer to the Schedule of Investments. |
| * | The Fund did not hold any Level 2 or Level 3 securities at period end. |
There were no transfers between Levels at period end.
Note 9 – Recently Issued Accounting Pronouncements
In December 2011, the Financial Accounting Standards Board (“FASB”) issued Accounting Standards Update (“ASU”) No. 2011-11 Disclosures about Offsetting Assets and Liabilities. The amendments in this ASU require an entity to disclose information about offsetting and related arrangements to enable users of its financial statements to understand the effect of those arrangements on its financial position. The ASU is effective for annual reporting periods beginning on or after January 1, 2013, and interim periods within those annual periods. The guidance requires retrospective application for all comparative periods presented. Management is currently evaluating the impact ASU 2011-11 will have on the financial statement disclosures.
Note 10 – Events Subsequent to the Fiscal Period End
The Fund has adopted financial reporting rules regarding subsequent events which require an entity to recognize in the financial statements the effects of all subsequent events that provide additional evidence about conditions that existed at the date of the balance sheet. Management has evaluated the Fund’s related events and transactions that occurred through the date of issuance of the Fund’s financial statements. There were no events or transactions that occurred during this period that materially impacted the amounts or disclosures in the Fund’s financial statements.
REPORT OF INDEPENDENT REGISTERED PUBLIC ACCOUNTING FIRM
To the Board of Trustees and Shareholders
Investment Managers Series Trust
We have audited the accompanying statement of assets and liabilities of the SGA Global Growth Fund (the “Fund”), a series of Investment Managers Series Trust, including the schedule of investments, as of September 30, 2012, and the related statement of operations for the year then ended, the statement of changes in net assets and the financial highlights for the year then ended and for the period December 31, 2010 (commencement of operations) to September 30, 2011. These financial statements and financial highlights are the responsibility of the Fund’s management. Our responsibility is to express an opinion on these financial statements and financial highlights based on our audit.
We conducted our audits in accordance with the standards of the Public Company Accounting Oversight Board (United States). Those standards require that we plan and perform the audit to obtain reasonable assurance about whether the financial statements and financial highlights are free of material misstatement. The Fund is not required to have, nor were we engaged to perform, an audit of its internal control over financial reporting. Our audits included consideration of internal control over financial reporting as a basis for designing audit procedures that are appropriate in the circumstances, but not for the purpose of expressing an opinion on the effectiveness of the Fund’s internal control over financial reporting. Accordingly, we express no such opinion. An audit includes examining, on a test basis, evidence supporting the amounts and disclosures in the financial statements. Our procedures included confirmation of securities owned as of September 30, 2012, by correspondence with the custodian and brokers, or by other appropriate auditing procedures where replies from brokers were not received. An audit also includes assessing the accounting principles used and significant estimates made by management, as well as evaluating the overall financial statement presentation. We believe that our audits provide a reasonable basis for our opinion.
In our opinion, the financial statements and financial highlights referred to above present fairly, in all material respects, the financial position of SGA Global Growth Fund as of September 30, 2012, and the results of its operations for the year then ended, the changes in its net assets, and its financial highlights for the year then ended and for the period December 31, 2010 to September 30, 2011, in conformity with accounting principles generally accepted in the United States of America.
Philadelphia, Pennsylvania November 28, 2012
SGA Global Growth Fund
SUPPLEMENTAL INFORMATION (Unaudited)
Trustees and Officer Information
Additional information about the Trustees is included in the Fund’s Statement of Additional Information which is available, without charge, upon request by calling (888) 988-8SGA (8742). The Trustees and officers of the Fund and their principal occupations during the past five years are as follows:
Name, Address, Year of Birth and Position(s) held with Trust | Term of
Officec and
Length of
Time Served | Principal Occupation During the Past Five Years
and Other Affiliations | Number of Portfolios in
the Fund
Complex Overseen by Trustee | Other
Directorships
Held During the
Past Five Years
by Trustee |
| Independent Trustees: | | | |
Charles H. Miller a (born 1947) Trustee | Since November 2007 | Executive Vice President, Client Management and Development, Access Data, a Broadridge Company, a provider of technology and services to asset management firms (1997-present). | 51 | None |
Ashley Toomey Rabun a
(born 1952) Trustee and Chairperson of the Board | Since November 2007 | President and Founder, InvestorReach, Inc. a financial services consulting firm (1996-present). | 51 | None |
William H. Young a
(born 1950) Trustee | Since November 2007 | Independent financial services consultant (1996-present); Consultant-Interim CEO, Unified Fund Services, Inc., a mutual fund service provider (2003-2006); Ex-officio Board Member of the National Investment Company Service Association and past President and Chairman (1995-1997); Senior Vice President, Oppenheimer Management Company (1983-1996). | 51 | None |
| Interested Trustees: | | | |
John P. Zader a † (born 1961) Trustee and President | Since November 2007 as Trustee and December 2007 as President | CEO, UMB Fund Services, Inc., a mutual and hedge fund service provider, and the transfer agent, fund accountant, and co-administrator for the Fund, and affiliate of the distributor of certain series of the Trust (not including the Fund), Grand Distribution Services, LLC, and custodian (2006-present); Consultant to Jefferson Wells International (2006); Senior Vice President and Chief Financial Officer, U.S. Bancorp Fund Services, LLC, a mutual and hedge fund service provider (1988-2006). | 51 | None |
Eric M. Banhazl b † (born 1957) Trustee and Vice President | Since January 2008 as Trustee and December 2007 as Vice President | President, Mutual Fund Administration Corp. (2006 – present); Senior Vice President, U.S. Bancorp Fund Services, LLC, a mutual and hedge fund service provider (2001 – 2006); Partner, The Wadsworth Group, a mutual fund administration and consulting services provider (1990-2001). | 51 | Advisors Series Trust (1997 to 2007). |
| Officers of the Trust | | |
Rita Dam b (born 1966) Treasurer and Assistant Secretary | Since December 2007 | Vice President, Mutual Fund Administration Corp. (2006 – present); Vice President, U.S. Bancorp Fund Services, LLC, a mutual and hedge fund service provider (2001 - 2006); Vice President, The Wadsworth Group, a mutual fund administration and consulting services provider (1994-2001). | N/A | N/A |
SGA Global Growth Fund
SUPPLEMENTAL INFORMATION (Unaudited)
Name, Address, Year of Birth and Position(s) held with Trust | Term of
Officec and
Length of
Time Served | Principal Occupation During the Past Five Years
and Other Affiliations | Number of Portfolios in
the Fund
Complex Overseen by Trustee | Other
Directorships
Held During the
Past Five Years
by Trustee |
Joy Ausili b (born 1966) Secretary and Assistant Treasurer | Since December 2007 | Vice President, Mutual Fund Administration Corp. (2006 – present); Vice President, U.S. Bancorp Fund Services, LLC, a mutual and hedge fund service provider (2001 - 2006); Vice President, The Wadsworth Group, a mutual fund administration and consulting services provider (1997-2001). | N/A | N/A |
Terrance P. Gallagher, CPA, JD a (born 1958) Vice President | Since December 2007 | Executive Vice President, UMB Fund Services, Inc. (2007 – present); Director of Compliance, Unified Fund Services Inc. (2004 – 2007); Partner, The Academy of Financial Services Studies and Precision Marketing Partners (1998 - 2004); Senior Vice President, Chief Financial Officer and Treasurer of AAL Capital Management and The AAL Mutual Funds (1987 - 1998). | N/A | N/A |
Robert Tuszynski a (born 1959) Vice President | Since March 2010 | Senior Vice President, Director of Distribution Services, UMB Fund Services, Inc. (2008 – present); Vice President and CCO, CUNA Mutual Fund Group (2004 – 2008). | N/A | N/A |
Todd Cipperman b (born 1966) Chief Compliance Officer | Since December 2009 | Founder and Principal, Cipperman & Company/Cipperman Compliance Services (2004 – present). | N/A | N/A |
| a | Address for certain Trustees and certain officers: 803 West Michigan Street, Milwaukee, WI 53233. |
| b | Address for Mr. Banhazl, Ms. Ausili and Ms. Dam: 2220 E. Route 66, Suite 226, Glendora, CA 91740. Address for Mr. Cipperman: 500 Swedesford Road, Suite 104, Wayne, PA 19087. |
| c | Trustees and officers serve until their successors have been duly elected. |
| † | Mr. Zader is an “interested person” of the Trust by virtue of his position with the Fund’s distributor, Grand Distribution Services, LLC and its affiliates, UMB Fund Services, Inc., the transfer agent, fund accountant and co-administrator of the Fund, and the Fund’s custodian, UMB Bank, n.a. Mr. Banhazl is deemed to be an “interested person” of the Trust by virtue of his position with Mutual Fund Administration Corp., the Fund’s co-administrator. |
SGA Global Growth Fund
SUPPLEMENTAL INFORMATION (Unaudited)
Board Consideration of Investment Advisory Agreement (Unaudited)
At in-person meetings held on August 14-15, 2012, and September 26-27, 2012, the Board of Trustees (the “Board”) of Investment Managers Series Trust (the “Trust”), including the trustees who are not “interested persons” of the Trust (the “Independent Trustees”) as defined in the Investment Company Act of 1940, as amended (the “1940 Act”), reviewed and unanimously approved renewal of the Investment Advisory Agreement (the “Advisory Agreement”) between the Trust and Sustainable Growth Advisers, LP (the “Investment Advisor”) with respect to the SGA Global Growth Fund series of the Trust (the “Fund”) for an additional one-year term. In approving renewal of the Advisory Agreement, the Board of Trustees, including the Independent Trustees, determined that renewal of the Advisory Agreement is in the best interests of the Fund and its shareholders.
Background
In advance of the meeting, the Board received information about the Fund and the Advisory Agreement from the Investment Advisor and from Mutual Fund Administration Corporation (“MFAC”) and UMB Fund Services, Inc., the Trust’s co-administrators, certain portions of which are discussed below. The Board also received a memorandum from the independent legal counsel to the Independent Trustees discussing the legal standards under the 1940 Act and other applicable law for their consideration of the proposed renewal of the Advisory Agreement. The Board considered information reviewed by the Board during the year at other Board and committee meetings. Before voting on the Advisory Agreement, the Independent Trustees met in a private session at which no representatives of the Investment Advisor were present.
In approving the Advisory Agreement, the Board and the Independent Trustees considered a variety of factors, including those discussed below. In their deliberations, the Board and the Independent Trustees did not identify any particular factor that was controlling, and each Trustee may have attributed different weights to the various factors.
Nature, Extent and Quality of Services
The Board considered information included in the meeting materials regarding the performance of the Fund compared with the returns of the MSCI World Growth Index and the returns of a select group of comparable funds selected by Morningstar, Inc. (the “Peer Group”) from its World Large Growth Universe for the one-year period ended June 30, 2012. With respect to the performance results of the Fund, the Board noted that the materials they reviewed indicated the annualized total returns of the Fund for the one-year period exceeded the returns of the Peer Group and World Large Growth Universe medians and the MSCI World Growth Index. The Board noted that consideration of returns of market indexes needed to take into account that indexes do not reflect the expenses of operating mutual funds.
The Board considered the overall quality of services provided by the Investment Advisor to the Fund. In doing so, the Board considered the Investment Advisor’s specific responsibilities in all aspects of day-to-day management and oversight of the Fund, as well as the qualifications, experience and responsibilities of the personnel involved in the activities of the Fund. The Board also considered the overall quality of the Investment Advisor’s organization and operations, the commitment of the Investment Advisor to the Fund’s growth, and the Investment Advisor’s compliance structure and compliance procedures. Based on its review, the Board and the Independent Trustees concluded that the Investment Advisor had sufficient quality and depth of personnel, resources, investment methods and compliance policies and procedures necessary to perform its duties under the Advisory Agreement. The Board and the Independent Trustees also concluded that based on the various factors they had reviewed, the nature, overall quality, and extent of the management and oversight services provided by the Investment Advisor to the Fund were satisfactory.
SGA Global Growth Fund
SUPPLEMENTAL INFORMATION (Unaudited)
Advisory Fee and Expense Ratio
With respect to the advisory fees and total expenses paid by the Fund, the Board noted the meeting materials indicated that the investment advisory fees (gross of fee waivers) were higher than the Fund’s Peer Group and Universe medians, and that the total expenses paid by the Fund (net of fee waivers) were higher than the Fund’s Peer Group and Universe medians, but were not the highest in the Peer Group. The Trustees noted, however, that the Investment Advisor was waiving its entire advisory fee with respect to the Fund and subsidizing other Fund expenses because of the Fund’s low asset levels. The Board observed that the fees charged by the Investment Advisor to the Fund are slightly lower than the fees it charges other clients according to its standard fee schedule. The Board and the Independent Trustees concluded that the compensation payable to the Investment Advisor under the Advisory Agreement was fair and reasonable in light of the nature and quality of the services the Investment Advisor provides to the Fund.
Profitability and Economies of Scale
The Board also considered information relating to the Investment Advisor’s costs and profits with respect to the Fund, noting that the Investment Advisor had realized no profits with respect to the Fund in the past year. The Board also considered the benefits received by the Investment Advisor as a result of the Investment Advisor’s relationship with the Fund, including investment advisory fees paid to the Investment Advisor and the intangible benefits of any favorable publicity arising in connection with the Fund’s performance. They also noted that although there were no advisory fee breakpoints, the asset levels of the Fund were not currently likely to lead to significant economies of scale, and that any such economies would be considered in the future, as the Fund’s assets grow.
Conclusion
Based on these and other factors, the Board and the Independent Trustees concluded that renewal of the Advisory Agreement is in the best interests of the Fund and its shareholders and, accordingly, approved renewal of the Advisory Agreement.
SGA Global Growth Fund
EXPENSE EXAMPLE
For the Six Months Ended September 30, 2012 (Unaudited)
Expense Example
As a shareholder of the Fund, you incur two types of costs: (1) transaction costs, and (2) ongoing costs, including management fees; distribution and/or service (12b-1) fees; and other Fund expenses. The examples below are intended to help you understand your ongoing costs (in dollars) of investing in the Fund and to compare these costs with the ongoing costs of investing in other mutual funds.
These examples are based on an investment of $1,000 invested at the beginning of the period and held for the entire period from 4/1/2012 to 9/30/12.
Actual Expenses
The information in the row titled “Actual Performance” of the table below provides actual account values and actual expenses. You may use the information in these columns, together with the amount you invested, to estimate the expenses that you paid over the period. Simply divide your account value by $1,000 (for example, an $8,600 account value divided by $1,000 = 8.6), then multiply the result by the number in the appropriate row under the column titled “Expenses Paid During Period” to estimate the expenses you paid on your account during this period.
Hypothetical Example for Comparison Purposes
The information in the row titled “Hypothetical (5% annual return before expenses)” of the table below provides hypothetical account values and hypothetical expenses based on the Fund’s actual expense ratios and an assumed rate of return of 5% per year before expenses, which is not the Fund’s actual return. The hypothetical account values and expenses may not be used to estimate the actual ending account balance or expenses you paid for the period. You may use this information to compare the ongoing costs of investing in the Fund and other funds. To do so, compare these 5% hypothetical examples with the 5% hypothetical examples that appear in the shareholder reports of the other funds.
Please note that the expenses shown in the table are meant to highlight your ongoing costs only and do not reflect any transaction costs, such as sales charges (load) or contingent deferred sales charges. Therefore, the information under the headings “Hypothetical (5% annual return before expenses)” is useful in comparing ongoing costs only, and will not help you determine the relative total costs of owning different funds. In addition, if these transactional costs were included, your costs would have been higher.
| | Beginning
Account Value | Ending Account Value | Expense Paid During Period* |
| | 4/1/12 | 9/30/12 | 4/1/12 – 9/30/12 |
| SGA Global Growth Fund | | | |
| Actual Performance | $ 1,000.00 | $ 1,007.50 | $ 8.78 |
| Hypothetical (5% annual return before expenses) | 1,000.00 | 1,016.25 | 8.82 |
| * | Expenses are equal to the Fund’s annualized expense ratio of 1.75% multiplied by the average account value over the period, multiplied by 183/366 (to reflect the six month period). The expense ratios reflect an expense waiver. Assumes all dividends and distributions were reinvested. |
This page is intentionally left blank
Investment Advisor
Sustainable Growth Advisers, LP
301 Tresser Boulevard, Ste 1310
Stamford, Connecticut 06901
Independent Counsel
Bingham McCutchen LLP
355 S. Grand Avenue, Suite 4400
Los Angeles, California 90071
Independent Registered Public Accounting Firm
Tait, Weller & Baker, LLP
1818 Market Street, Suite 2400
Philadelphia, Pennsylvania 19103
Custodian
UMB Bank, n.a.
928 Grand Boulevard, 5th Floor
Kansas City, Missouri 64106
Fund Co-Administrator
Mutual Fund Administration Corporation
2220 E. Route 66, Suite 226
Glendora, California 91740
Fund Co-Administrator, Transfer Agent and Fund Accountant
UMB Fund Services, Inc.
803 West Michigan Street
Milwaukee, Wisconsin 53233-2301
Distributor
Grand Distribution Services, LLC
803 West Michigan Street
Milwaukee, Wisconsin 53233-2301
| | TICKER | CUSIP |
| SGA Global Growth Fund | SGAGX | 461418 592 |
Privacy Principles of the SGA Global Growth Fund for Shareholders
The Fund is committed to maintaining the privacy of its shareholders and to safeguarding its non-public personal information. The following information is provided to help you understand what personal information the Fund collects, how we protect that information and why, in certain cases, we may share information with select other parties.
Generally, the Fund does not receive any non-public personal information relating to its shareholders, although certain non-public personal information of its shareholders may become available to the Fund. The Fund does not disclose any non-public personal information about its shareholders or former shareholders to anyone, except as permitted by law or as is necessary in order to service shareholder accounts (for example, to a transfer agent or third party administrator).
This report is sent to shareholders of the SGA Global Growth Fund for their information. It is not a Prospectus, circular or representation intended for use in the purchase or sale of shares of the Fund or of any securities mentioned in this report.
Proxy Voting Policies and Procedures
A description of the Fund’s proxy voting policies and procedures related to portfolio securities is available without charge, upon request, by calling the Fund at 1-888-988-8SGA (8742) or on the U.S. Securities and Exchange Commission’s (“SEC”) website at http://www.sec.gov.
Proxy Voting Record
Information regarding how the Fund voted proxies for portfolio securities, if applicable, during the most recent 12-month period ended June 30, is also available, without charge and upon request by calling 1-888-988-8SGA (8742) or by accessing the Fund’s Form N-PX on the SEC’s website at http://www.sec.gov.
Form N-Q Disclosure
The Fund files its complete schedule of portfolio holdings with the SEC for the first and third quarters of each fiscal year on Form N-Q. The Fund’s Form N-Q is available on the SEC website at http://www.sec.gov or by calling the Fund at 1-888-988-8SGA (8742). The Fund’s Form N-Q may also be viewed and copied at the SEC’s Public Reference Room in Washington, DC. Information on the operation of the Public Reference Room may be obtained by calling (202) 551-8090.
SGA Global Growth Fund
803 West Michigan Street
Milwaukee, WI 53233
Toll Free: 1-888-988-8SGA (8742)