UNITED STATES
SECURITIES AND EXCHANGE COMMISSION
Washington, D.C. 20549
FORM N-CSR
CERTIFIED SHAREHOLDER REPORT OF REGISTERED
MANAGEMENT INVESTMENT COMPANIES
Investment Company Act file number: 811-4984
AMERICAN BEACON FUNDS
(Exact name of registrant as specified in charter)
220 East Las Colinas Boulevard, Suite 1200
Irving, Texas 75039
(Address of principal executive offices)-(Zip code)
GENE L. NEEDLES, JR., PRESIDENT
220 East Las Colinas Boulevard, Suite 1200
Irving, Texas 75039
(Name and address of agent for service)
Registrant’s telephone number, including area code: (817) 391-6100
Date of fiscal year end: December 31, 2017
Date of reporting period: December 31, 2017
Form N-CSR is to be used by management investment companies to file reports with the Commission not later than 10 days after the transmission to stockholders of any report that is required to be transmitted to stockholders under Rule 30e-1 under the Investment Company Act of 1940 (17 CFR 270.30e-1). The Commission may use the information provided on Form N-CSR in its regulatory, disclosure review, inspection, and policymaking roles.
A registrant is required to disclose the information specified by Form N-CSR, and the Commission will make this information public. A registrant is not required to respond to the collection of information contained in Form N-CSR unless the Form displays a currently valid Office of Management and Budget (“OMB”) control number. Please direct comments concerning the accuracy of the information collection burden estimate and any suggestions for reducing the burden to Secretary, Securities and Exchange Commission, 450 Fifth Street, NW, Washington, DC 20549-0609. The OMB has reviewed this collection of information under the clearance requirements of 44 U.S.C. § 3507.
| ITEM 1. | REPORTS TO STOCKHOLDERS. |
About American Beacon Advisors
Since 1986, American Beacon Advisors has offered a variety of products and investment advisory services to numerous institutional and retail clients, including a variety of mutual funds, corporate cash management, and separate account management.
Our clients include defined benefit plans, defined contribution plans, foundations, endowments, corporations, financial planners, and other institutional investors. With American Beacon Advisors, you can put the experience of a multi-billion dollar asset management firm to work for your company.
BRIDGEWAY LARGE CAP GROWTH FUND
Growth stocks typically are more volatile than value stocks; however, value stocks have a lower expected growth rate in earnings and sales. Investing in foreign securities may involve heightened risk due to currency fluctuations and economic and political risks. While the Fund is managed pursuant to a tax management strategy, the Fund’s investments could create capital gains. The use of futures contracts for cash management may subject the Fund to losing more money than invested. Please see the prospectus for a complete discussion of the Fund’s risks. There can be no assurances that the investment objectives of this Fund will be met.
BRIDGEWAY LARGE CAP VALUE FUND
Investing in value stocks may limit downside risk over time; however, the Fund may produce more modest gains than riskier stock funds as a trade-off for this potentially lower risk. Investing in foreign securities may involve heightened risk due to currency fluctuations and economic and political risks. While the Fund is managed pursuant to a tax management strategy, the Fund’s investments could create capital gains. The use of futures contracts for cash management may subject the Fund to losing more money than invested. Please see the prospectus for a complete discussion of the Fund’s risks. There can be no assurances that the investment objectives of this Fund will be met.
Any opinions herein, including forecasts, reflect our judgment as of the end of the reporting period and are subject to change. Each advisor’s strategies and each Fund’s portfolio composition will change depending on economic and market conditions. This report is not a complete analysis of market conditions, and, therefore, should not be relied upon as investment advice. Although economic and market information has been compiled from reliable sources, American Beacon Advisors, Inc. makes no representation as to the completeness or accuracy of the statements contained herein.
American Beacon Funds | December 31, 2017 |
Contents
President’s Message
| | |
 | | Dear Shareholders, At American Beacon, we are proud to offer a broad range of equity, fixed-income and alternative mutual fund products for institutions and individuals. Our mutual funds – which span the domestic, international, global, frontier and emerging markets – are sub-advised by experienced portfolio managers who employ distinctive investment processes to manage assets through a variety of economic and market conditions. Together, we work diligently to help our clients and shareholders meet their long-term financial goals. Institutional wisdom, enduring value. Since our inception as a pension fiduciary in 1986, American Beacon has focused on identifying and overseeing institutional investment managers and portfolio risk management. In 1987, we leveraged our size and experience to launch a series of sub-advised, multi- |
manager mutual funds providing individual investors access to many of the same institutional managers as our pension clients. Following the financial crisis in 2008, we saw that investors were looking for unique solutions from managers who were not necessarily mainstream. In 2010, we began offering mutual funds from single managers with distinctive investment styles or asset classes. As we continue to expand our family of funds, our solutions-based approach provides innovative investments.
Guiding principles. Our “manager of managers” philosophy is built on a long-standing history of innovative thinking, discipline and consistency in applying our solutions-based approach. As a manager of managers, our goal is to engage the most effective money managers for each asset class, investment style or market strategy – whether through a single sub-advisor or a combination of sub-advisors. Because we take our fiduciary responsibilities very seriously, our thorough manager evaluation and selection process is rigorous and ongoing. Our guiding principles – predictability, style consistency, competitive pricing and long-term relationships – provide a strong foundation for our due-diligence process. Our broad range of mutual funds helps investors navigate the economic storms and market downturns in the U.S. and abroad. Our years of experience evaluating sub-advisors have led us to identify and partner with asset managers who have adhered to their disciplined processes for many years and through multiple market cycles.
Focus on asset protection and risk mitigation. We strive to provide innovative, long-term products without gimmicks. From offering some of the first multi-manager funds, one of the first retirement-income funds and the first open-end mutual fund in the U.S. to focus primarily on frontier-market debt, our robust history includes applying a disciplined, solutions-based approach to our product development process to help protect assets and mitigate risk.
Thank you for your continued interest in American Beacon. For additional information about our funds or to access your account information, please visit our website at www.americanbeaconfunds.com.
Best Regards,

Gene L. Needles, Jr.
President
American Beacon Funds
1
Domestic Equity Market Overview
December 31, 2017 (Unaudited)
During the 12-month period ended December 31, 2017, domestic equity markets ignored any signs of investor skepticism that started the year as markets pushed into their ninth year of this long-running bull market. Volatility remained at suppressed levels within the S&P 500 Index, a broad measure of domestic equity markets, providing positive total returns every month and finishing the year up 21.83%. While large-cap stocks outpaced small-caps, growth stocks exhibited drastic outperformance versus value stocks across all market-cap styles. The Russell 2000 Growth Index outperformed the Russell 2000 Value Index by 14.33%, while the Russell 1000 Growth Index outperformed the Russell 1000 Value Index by 16.55%. While many investors were skeptical of the market’s advance in 2017, data during the year suggested the lift in domestic equities reflected the now-visible signs of globally synchronized economic strength.
In the first quarter of 2017, the U.S. equity markets achieved fresh, all-time highs, as optimism from the Trump administration’s “pro-growth” agenda spilled over from the fourth quarter of 2016. Despite failure to pass revisions to health-care legislation, the market remained upbeat toward Washington, D.C., on the premise of tax cuts, easing of business regulations and a boost to U.S. infrastructure investment. The economy displayed supportive evidence of further market advances and a March rate hike from the Federal Reserve (the “Fed”). The Purchasing Managers Index, the Consumer Confidence Index and the NFIB Small Business Optimism Index all flashed constructive data. During 2016, the S&P 500 Index’s trailing 12-month, year-over-year earnings growth inflected and turned positive after four quarters in negative territory. Large-caps outperformed small-caps, reversing trading patterns from the previous quarter, with Technology stocks leading the way.
In the second quarter, U.S. equities across all market caps delivered gains, shaking off growing concerns regarding the Trump administration’s ability to pass pro-growth measures and economic data that was less enthusiastic than the previous quarter, namely within Manufacturing and Consumer Health. Political uncertainty flared up after President Trump dismissed James Comey, the former FBI director. The Fed, however, delivered another 25 basis point (0.25%) rate hike and laid out plans to begin reducing its balance sheet after years of its unprecedented quantitative easing policy program. Large-cap stocks led the march higher for the second quarter, with reflationary sectors at the top – Health Care, Industrials and Financials.
In the third quarter, robust corporate earnings continued, increasing 11.6% on a trailing 12-month basis versus a year ago. Gross domestic product growth of 3.0% was released during the quarter, breaking out from the sub-3.0% growth seen in the economy since the lowest point of the financial crisis. Historic hurricanes were disruptive to Texas, Louisiana and Puerto Rico, but negative outcomes were determined to be transitory (ex-Puerto Rico), displaying the resiliency of U.S. industry. Despite concerns of stubbornly low inflation, the Fed confirmed its balance sheet roll-off beginning in October. Crude oil prices began to solidify above $50, a key support level, which boosted cyclical energy and industrial stocks. U.S. stocks across all capitalizations made gains.
In the fourth quarter, the U.S. economy and U.S. equities capped off a robust year as corporations delivered another quarter of strong earnings growth. The Technology sector, the best performing sector in the 12-month period, delivered particularly healthy results. The much-awaited Tax Cuts and Jobs Act of 2017 was passed by Congress and signed into law by President Trump on December 22. Markets jumped on this news as the permanent tax cut is expected to make U.S. companies more competitive than non-domestic peers. U.S. Treasury yields, led by the short end of the yield curve, rose during the quarter and caused interest-rate sensitive sectors, such as Real Estate and Utilities, to underperform the broader market. In December, the Fed lifted base rates for the third time during the year and lifted their U.S. 2018 economic growth forecast to 2.5% from 2.1%.
2
American Beacon Bridgeway Large Cap Growth FundSM
Performance Overview
December 31, 2017 (Unaudited)
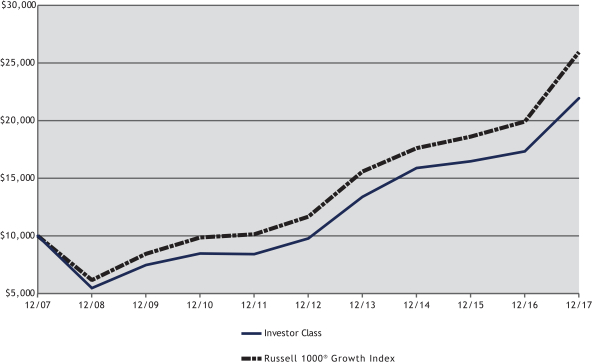
The Investor Class of the American Beacon Bridgeway Large Cap Growth Fund (the “Fund”) returned 26.72% for the twelve months ended December 31, 2017, compared to the Russell 1000® Growth Index (the “Index”) return of 30.21% for the same period.
Comparison of Change in Value of a $10,000 Investment for the period from 12/31/2007 through 12/31/2017
| | | | | | | | | | | | | | | | | | | | | | | | | | | | | | |
| Total Returns for the Period Ended December 31, 2017 | |
| | | Ticker | | 1 Year | | 3 Years | | 5 Years | | 10 Years | | Value of $10,000 12/31/2007- 12/31/2017 |
Institutional Class (1,7) | | BRLGX | | | | 27.21 | % | | | | 11.65 | % | | | | 17.77 | % | | | | 8.25 | % | | | $ | 22,102 | |
Y Class (1,2,7) | | BLYYX | | | | 28.17 | % | | | | 11.90 | % | | | | 17.93 | % | | | | 8.33 | % | | | $ | 22,251 | |
Investor Class (1,3,7) | | BLYPX | | | | 26.72 | % | | | | 11.37 | % | | | | 17.60 | % | | | | 8.17 | % | | | $ | 21,937 | |
A without Sales Charge (1,4,7) | | BLYAX | | | | 27.00 | % | | | | 11.47 | % | | | | 17.66 | % | | | | 8.20 | % | | | $ | 21,994 | |
A with Sales Charge (1,4,7) | | BLYAX | | | | 19.69 | % | | | | 9.29 | % | | | | 16.27 | % | | | | 7.57 | % | | | $ | 20,736 | |
C without Sales Charge (1,5,7) | | BLYCX | | | | 26.82 | % | | | | 11.14 | % | | | | 17.45 | % | | | | 8.11 | % | | | $ | 21,801 | |
C with Sales Charge (1,5,7) | | BLYCX | | | | 25.82 | % | | | | 11.14 | % | | | | 17.45 | % | | | | 8.11 | % | | | $ | 21,801 | |
| | | | | | | | | | | | | | | | | | | | | | | | | | | | | | |
Russell 1000® Growth Index (6) | | | | | | 30.21 | % | | | | 13.79 | % | | | | 17.33 | % | | | | 10.00 | % | | | $ | 25,930 | |
| 1. | Performance shown is historical and is not indicative of future returns. Investment returns and principal value will vary, and shares may be worth more or less at redemption than at original purchase. Performance shown is calculated based on the published end of day net asset values as of date indicated, and current performance may be lower or higher than the performance data quoted. To obtain performance as of the most recent month end, please visit www. americanbeaconfunds.com or call 1-800-967-9009. Fund performance in the table above does not reflect the deduction of taxes a shareholder would pay on distributions or the redemption of shares. Generally accepted accounting principles require adjustments to be made to the net assets of the Fund at period end for financial reporting purposes only; and as such, the total return based on the unadjusted net asset value per share may differ from the total return reported in the financial highlights. Please note that the recent performance of the securities market has helped produce short-term returns that are not typical and may not continue in the future. A portion of the fees charged to each Class of the Fund has been waived since Fund inception. Performance prior to waiving fees was lower than the actual returns shown since inception. |
| 2. | Fund performance for the five-year and ten-year periods represent the returns achieved by the Institutional Class from 12/31/07 up to 2/5/16, the inception date of the Y Class, and the returns of the Y Class since its inception. Expenses of the Y Class are higher than those of the Institutional Class. As a result, total returns shown may be higher than they would have been had the Y Class been in existence since 12/31/07. |
3
American Beacon Bridgeway Large Cap Growth FundSM
Performance Overview
December 31, 2017 (Unaudited)
| 3. | Fund performance for the five-year and ten-year periods represent the returns achieved by the Institutional Class from 12/31/07 up to 2/5/16, the inception date of the Investor Class, and the returns of the Investor Class since its inception. Expenses of the Investor Class are higher than those of the Institutional Class. Therefore, total returns shown may be higher than they would have been had the Investor Class been in existence since 12/31/07. |
| 4. | Fund performance for the five-year and ten-year periods represent the returns achieved by the Institutional Class from 12/31/07 through 2/5/16, the inception date of the A Class, and the returns of the A Class since its inception. Expenses of the A Class are higher than those of the Institutional Class. As a result, total returns shown may be higher than they would have been had the A Class been in existence since 12/31/07. A Class shares have a maximum sales charge of 5.75%. |
| 5. | Fund performance for the five-year and ten-year periods represent the returns achieved by the Institutional Class from 12/31/07 through 2/5/16, the inception date of the C Class, and the returns of the C Class since its inception. Expenses of the C Class are higher than those of the Institutional Class. As a result, total returns shown may be higher than they would have been had the C Class been in existence since 12/31/07. C Class has a maximum contingent deferred sales charge of 1.00% for shares redeemed within one year of the date of purchase. |
| 6. | The Russell 1000® Growth Index is an unmanaged index of those stocks in the Russell 1000 Index with higher price-to-book ratios and higher forecasted growth values. Russell 1000 Growth Index and Russell 1000 Index are registered trademarks of the Frank Russell Company. One cannot directly invest in an index. |
| 7. | The Total Annual Fund Operating Expense ratios set forth in the most recent Fund prospectus for the Institutional, Y, Investor, A, and C Class shares were 1.03%, 1.10%, 1.56%, 1.44%, and 2.19%, respectively. The expense ratios above may vary from the expense ratios presented in other sections of this report that are based on expenses incurred during the period covered by this report. |
The Fund trailed the Index for the period as both stock selection and sector allocation detracted value relative to the Index.
Most of the Fund’s underperformance related to security selection was attributed to holdings in the Consumer Discretionary and Information Technology sectors. Within Consumer Discretionary, Ulta Beauty down 11.5% and Autozone down 35.8% were the largest detractors. In the Information Technology sector, the Fund’s absence from Apple, which was up 48.5% in the Index, negatively impacted performance. Good security selection in the Health Care sector added relative value; however, performance within this sector was not enough to offset the aforementioned poor performance. In the Health Care sector, Align Technology up 135.2% and Intuitive Surgical up 75.8% contributed most to the Fund’s return.
From a sector allocation perspective, the Fund’s overweight in Energy, the worst performing sector, detracted value relative to the Index. An underweight allocation to Information Technology, the second best performing sector, also detracted from performance. An overweight position in the Industrials sector added relative value.
The sub-advisor continues to invest in a broadly diversified portfolio of companies that they believe have attractive valuations and above-average earnings growth potential. This approach should allow the Fund to benefit over the longer term.
| | | | | | | | |
| Top Ten Holdings (% Net Assets) | | | | | | | | |
| Micron Technology, Inc. | | | | | | | 2.3 | |
| Apple, Inc. | | | | | | | 2.1 | |
| Boeing Co. | | | | | | | 2.1 | |
| United Rentals, Inc. | | | | | | | 2.0 | |
| Amazon.com, Inc. | | | | | | | 2.0 | |
| NVIDIA Corp. | | | | | | | 1.9 | |
| Align Technology, Inc. | | | | | | | 1.9 | |
| UnitedHealth Group, Inc. | | | | | | | 1.9 | |
| Applied Materials, Inc. | | | | | | | 1.9 | |
| Lam Research Corp. | | | | | | | 1.8 | |
| | |
| Total Fund Holdings | | | 86 | | | | | |
| | | | | | | | |
4
American Beacon Bridgeway Large Cap Growth FundSM
Performance Overview
December 31, 2017 (Unaudited)
| | | | | | | | |
| Sector Allocation (% Equities) | | | | | | | | |
| Information Technology | | | | | | | 34.4 | |
| Consumer Discretionary | | | | | | | 16.0 | |
| Industrials | | | | | | | 15.5 | |
| Health Care | | | | | | | 15.2 | |
| Consumer Staples | | | | | | | 5.8 | |
| Materials | | | | | | | 5.5 | |
| Financials | | | | | | | 5.2 | |
| Telecommunication Services | | | | | | | 1.2 | |
| Real Estate | | | | | | | 1.2 | |
5
American Beacon Bridgeway Large Cap Value FundSM
Performance Overview
December 31, 2017 (Unaudited)
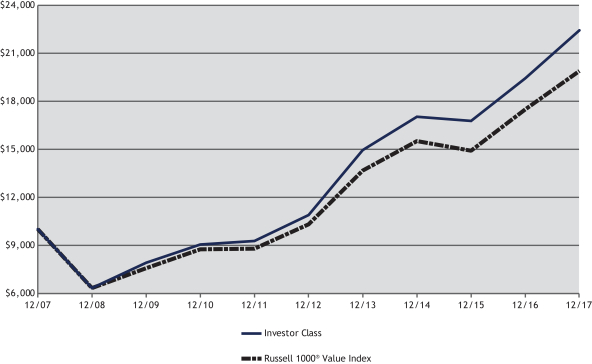
The Investor Class of the American Beacon Bridgeway Large Cap Value Fund (the “Fund”) returned 15.52% for the twelve months ended December 31, 2017. The Fund outperformed the Russell 1000® Value Index (the “Index”) return of 13.66% for the same period.
Comparison of Change in Value of a $10,000 Investment for the period from 12/31/2007 through 12/31/2017
| | | | | | | | | | | | | | | | | | | | | | | | | | | | | | |
| Total Returns for the Period Ended December 31, 2017 | |
| | | Ticker | | 1 Year | | 3 Years | | 5 Years | | 10 Years | | Value of $10,000
12/31/2007- 12/31/2017 |
Institutional Class (1,7) | | BRLVX | | | | 15.88 | % | | | | 9.98 | % | | | | 15.92 | % | | | | 8.61 | % | | | $ | 22,843 | |
Y Class (1,2,7) | | BWLYX | | | | 15.82 | % | | | | 9.93 | % | | | | 15.84 | % | | | | 8.57 | % | | | $ | 22,756 | |
Investor Class(1,3,7) | | BWLIX | | | | 15.52 | % | | | | 9.63 | % | | | | 15.55 | % | | | | 8.41 | % | | | $ | 22,416 | |
A without Sales Charge (1,4,7) | | BWLAX | | | | 15.42 | % | | | | 9.57 | % | | | | 15.45 | % | | | | 8.34 | % | | | $ | 22,285 | |
A with Sales Charge (1,4,7) | | BWLAX | | | | 8.76 | % | | | | 7.44 | % | | | | 14.09 | % | | | | 7.70 | % | | | $ | 21,003 | |
C without Sales Charge (1,5,7) | | BWLCX | | | | 14.58 | % | | | | 8.77 | % | | | | 14.59 | % | | | | 7.89 | % | | | $ | 21,364 | |
C with Sales Charge (1,5,7) | | BWLCX | | | | 13.58 | % | | | | 8.77 | % | | | | 14.59 | % | | | | 7.89 | % | | | $ | 21,364 | |
R6 Class | | BWLRX | | | | 15.83 | % | | | | 9.97 | % | | | | 15.91 | % | | | | 8.61 | % | | | $ | 22,833 | |
| | | | | | | | | | | | | | | | | | | | | | | | | | | | | | |
Russell 1000® Value Index (6) | | | | | | 13.66 | % | | | | 8.65 | % | | | | 14.04 | % | | | | 7.10 | % | | | $ | 19,863 | |
| 1. | Performance shown is historical and is not indicative of future returns. Investment returns and principal value will vary, and shares may be worth more or less at redemption than at original purchase. Performance shown is calculated based on the published end of day net asset values as of date indicated, and current performance may be lower or higher than the performance data quoted. To obtain performance as of the most recent month end, please visit www.americanbeaconfunds.com or call 1-800-967-9009. Fund performance in the table above does not reflect the deduction of taxes a shareholder would pay on distributions or the redemption of shares. Please note that the recent performance of the securities market has helped produce short-term returns that are not typical and may not continue in the future. A portion of the fees charged to the Institutional Class was waived from 2008 through 2013, partially recovered in 2014, and fully recovered in 2015. Performance prior to waiving fees was lower than the actual returns shown from 2008 through 2013. |
| 2. | Fund performance for the ten-year period represents the returns achieved by the Institutional Class from 12/31/07 up to 2/3/12, the inception date of the Y Class, and the returns of the Y Class since its inception. Expenses of the Y Class are higher than those of the Institutional Class. As a result, total returns shown may be higher than they would have been had the Y Class been in existence since 12/31/07. A portion of the fees charged to the Y Class was waived in 2012, partially recovered in 2013 and fully recovered in 2014. Performance prior to waiving fees was lower than the actual returns shown in 2012. |
6
American Beacon Bridgeway Large Cap Value FundSM
Performance Overview
December 31, 2017 (Unaudited)
| 3. | Fund performance for the ten-year period represents the returns achieved by the Institutional Class from 12/31/07 up to 2/3/12, the inception date of the Investor Class, and the returns of the Investor Class since its inception. Expenses of the Investor Class are higher than those of the Institutional Class. Therefore, total returns shown may be higher than they would have been had the Investor Class been in existence since 12/31/07. A portion of the fees charged to the Investor Class was waived in 2012 and fully recovered in 2013. Performance prior to waiving fees was lower than the actual returns shown in 2012. |
| 4. | Fund performance for the ten-year period represents the returns achieved by the Institutional Class from 12/31/07 through 2/3/12, the inception date of the A Class, and the returns of the A Class since its inception. Expenses of the A Class are higher than those of the Institutional Class. As a result, total returns shown may be higher than they would have been had the A Class been in existence since 12/31/07. A portion of the fees charged to the A Class was waived in 2012 and 2013 and fully recovered in 2014. Performance prior to waiving fees was lower than the actual returns shown in 2012 and 2013. A Class shares have a maximum sales charge of 5.75%. |
| 5. | Fund performance for the ten-year period represents the returns achieved by the Institutional Class from 12/31/07 through 2/3/12, the inception date of the C Class, and the returns of the C Class since its inception. Expenses of the C Class are higher than those of the Institutional Class. As a result, total returns shown may be higher than they would have been had the C Class been in existence since 12/31/07. A portion of the fees charged to the C Class was waived in 2012 and 2013 and fully recovered in 2014. Performance prior to waiving fees was lower than the actual returns shown in 2012 and 2013. C Class has a maximum contingent deferred sales charge of 1.00% for shares redeemed within one year of the date of purchase. |
| 6. | The Russell 1000® Value Index is an unmanaged index of those stocks in the Russell 1000 Index with lower price-to-book ratios and lower forecasted growth values. Russell 1000 Value Index and Russell 1000 Index are registered trademarks of the Frank Russell Company. One cannot directly invest in an index. |
| 7. | The Total Annual Fund Operating Expense ratios set forth in the most recent Fund prospectus for the Institutional, Y, Investor, A, C and R6 Class shares was 0.73%, 0.80%, 1.08%, 1.12%, 1.86%, and 0.71%, respectively. The expense ratios above may vary from the expense ratios presented in other sections of this report that are based on expenses incurred during the period covered by this report. |
The Fund outperformed the Index as both stock selection and sector allocation added value relative to the Index.
From a stock selection perspective, the Fund’s Energy, Information Technology and Consumer Staples sectors added the most relative value. Within the Energy sector, the Fund’s absence from Exxon Mobil and Schlumberger, which were down 3.8% and 17.4%, respectively, in the Index, positively impacted performance. The Fund’s allocation in Valero Energy up 39.8% also added relative value. Companies in the Information Technology sector contributing to the Fund’s return included Applied Materials up 76.3%, Lam Research up 77.0% and Micron Technology up 37.2%. Wal-Mart Stores up 48.1% was the largest contributor in the Consumer Staples sector. The Fund’s absence from Walgreens Boots Alliance, which was down 10.5% in the Index, also added relative value. The aforementioned good performance was somewhat offset by securities held in the Fund’s Health Care sector. Mallinckrodt down 29.9% and Allergan down 30.2% were the largest detractors in Health Care.
From a sector allocation standpoint, the Fund’s underweight position in Energy and Real Estate, two of the poorer performing sectors, added value relative to the Index. An overweight allocation in Telecommunication Services, the worst performing sector, detracted from the Fund’s return.
The sub-advisor continues to invest in a broadly diversified portfolio of companies that they believe have attractive valuations and above-average earnings growth potential. This approach should allow the Fund to benefit over the longer term.
| | | | | | | | |
| Top Ten Holdings (% Net Assets) | | | | | | | | |
| Micron Technology, Inc. | | | | | | | 1.9 | |
| Wal-Mart Stores, Inc. | | | | | | | 1.8 | |
| Valero Energy Corp. | | | | | | | 1.8 | |
| Bank of America Corp. | | | | | | | 1.8 | |
| Citigroup, Inc. | | | | | | | 1.6 | |
| LyondellBasell Industries N.V., Class A | | | | | | | 1.6 | |
| Best Buy Co., Inc. | | | | | | | 1.5 | |
| Intel Corp. | | | | | | | 1.5 | |
| Corning, Inc. | | | | | | | 1.4 | |
| Spirit AeroSystems Holdings, Inc., Class A | | | | | | | 1.4 | |
| | |
| Total Fund Holdings | | | 105 | | | | | |
7
American Beacon Bridgeway Large Cap Value FundSM
Performance Overview
December 31, 2017 (Unaudited)
| | | | | | | | |
| Sector Allocation (% Equities) | | | | | | | | |
| Financials | | | | | | | 27.3 | |
| Industrials | | | | | | | 13.1 | |
| Consumer Discretionary | | | | | | | 12.1 | |
| Health Care | | | | | | | 11.4 | |
| Information Technology | | | | | | | 10.5 | |
| Consumer Staples | | | | | | | 8.6 | |
| Energy | | | | | | | 6.4 | |
| Utilities | | | | | | | 4.9 | |
| Materials | | | | | | | 4.2 | |
| Telecommunication Services | | | | | | | 0.9 | |
| Real Estate | | | | | | | 0.6 | |
8
American Beacon FundsSM
Expense Examples
December 31, 2017 (Unaudited)
Fund Expense Example
As a shareholder of a Fund, you incur two types of costs: (1) transaction costs, including sales charges (loads) on purchase payments and redemption fees, if applicable, and (2) ongoing costs, including management fees, distribution (12b-1) fees, sub-transfer agent fees, and other Fund expenses. The Examples are intended to help you understand the ongoing cost (in dollars) of investing in the Funds and to compare these costs with the ongoing costs of investing in other mutual funds. The Examples are based on an investment of $1,000 invested at the beginning of the period in each Class and held for the entire period from July 1, 2017 through December 31, 2017.
Actual Expenses
The “Actual” lines of the tables provide information about actual account values and actual expenses. You may use the information on this page, together with the amount you invested, to estimate the expenses that you paid over the period. Simply divide your account value by $1,000 (for example, an $8,600 account value divided by $1,000 = $8.60), then multiply the result by the “Expenses Paid During Period” to estimate the expenses you paid on your account during this period. Shareholders of the Investor and Institutional Classes that invest in the Fund through an IRA or Roth IRA may be subject to a custodial IRA fee of $15 that is typically deducted each December. If your account was subject to a custodial IRA fee during the period, your costs would have been $15 higher.
Hypothetical Example for Comparison Purposes
The “Hypothetical” lines of the tables provide information about hypothetical account values and hypothetical expenses based on the Fund’s actual expense ratio and an assumed 5% per year rate of return before expenses (not the Fund’s actual return). You may compare the ongoing costs of investing in the Funds with other funds by contrasting this 5% hypothetical example and the 5% hypothetical examples that appear in the shareholder reports of the other funds. The hypothetical account values and expenses may not be used to estimate the actual ending account balance or expenses you paid for the period. Shareholders of the Investor and Institutional Classes that invest in the Funds through an IRA or Roth IRA may be subject to a custodial IRA fee of $15 that is typically deducted each December. If your account was subject to a custodial IRA fee during the period, your costs would have been $15 higher.
You should also be aware that the expenses shown in the table highlight only your ongoing costs and do not reflect any transaction costs charged by the Funds, such as sales charges (loads) or redemption fees, as applicable. Similarly, the expense examples for other funds do not reflect any transaction costs charged by those funds, such as sales charges (loads), redemption fees or exchange fees. Therefore, the “Hypothetical” lines of the tables are useful in comparing ongoing costs only and will not help you determine the relative total costs of owning different funds. If you were subject to any transaction costs during the period, your costs would have been higher.
9
American Beacon FundsSM
Expense Examples
December 31, 2017 (Unaudited)
| | | | | | | | | | | | | | | |
| American Beacon Bridgeway Large Cap Growth Fund | |
| | | Beginning Account Value
7/1/2017 | | Ending Account Value
12/31/2017 | | Expenses Paid During
Period
7/1/2017-12/31/2017* |
| Institutional Class | | | | | | | | | | | | | | | |
| Actual | | | | $1,000.00 | | | | | $1,148.60 | | | | | $4.39 | |
| Hypothetical** | | | | $1,000.00 | | | | | $1,021.10 | | | | | $4.13 | |
| Y Class | | | | | | | | | | | | | | | |
| Actual | | | | $1,000.00 | | | | | $1,148.00 | | | | | $4.93 | |
| Hypothetical** | | | | $1,000.00 | | | | | $1,020.60 | | | | | $4.63 | |
| Investor Class | | | | | | | | | | | | | | | |
| Actual | | | | $1,000.00 | | | | | $1,146.40 | | | | | $6.44 | |
| Hypothetical** | | | | $1,000.00 | | | | | $1,019.20 | | | | | $6.06 | |
| A Class | | | | | | | | | | | | | | | |
| Actual | | | | $1,000.00 | | | | | $1,147.00 | | | | | $6.55 | |
| Hypothetical** | | | | $1,000.00 | | | | | $1,019.10 | | | | | $6.16 | |
| C Class | | | | | | | | | | | | | | | |
| Actual | | | | $1,000.00 | | | | | $1,142.20 | | | | | $10.58 | |
| Hypothetical** | | | | $1,000.00 | | | | | $1,015.30 | | | | | $9.96 | |
| * | Expenses are equal to the Fund’s annualized expense ratios for the six-month period of 0.81%, 0.91%, 1.19%, 1.21%, and 1.96% for the Institutional, Y, Investor, A, and C Classes, respectively, multiplied by the average account value over the period, multiplied by the number derived by dividing the number of days in the most recent fiscal half-year (184) by days in the year (365) to reflect the half-year period. |
| ** | 5% return before expenses. |
| | | | | | | | | | | | | | | |
| American Beacon Bridgeway Large Cap Value Fund | |
| | | Beginning Account Value
7/1/2017 | | Ending Account Value
12/31/2017 | | Expenses Paid During
Period
7/1/2017-12/31/2017* |
| Institutional Class | | | | | | | | | | | | | | | |
| Actual | | | | $1,000.00 | | | | | $1,116.40 | | | | | $3.89 | |
| Hypothetical** | | | | $1,000.00 | | | | | $1,021.50 | | | | | $3.72 | |
| Y Class | | | | | | | | | | | | | | | |
| Actual | | | | $1,000.00 | | | | | $1,116.10 | | | | | $4.27 | |
| Hypothetical** | | | | $1,000.00 | | | | | $1,021.20 | | | | | $4.08 | |
| Investor Class | | | | | | | | | | | | | | | |
| Actual | | | | $1,000.00 | | | | | $1,114.80 | | | | | $5.70 | |
| Hypothetical** | | | | $1,000.00 | | | | | $1,019.80 | | | | | $5.45 | |
| A Class | | | | | | | | | | | | | | | |
| Actual | | | | $1,000.00 | | | | | $1,114.10 | | | | | $5.70 | |
| Hypothetical** | | | | $1,000.00 | | | | | $1,019.80 | | | | | $5.45 | |
| C Class | | | | | | | | | | | | | | | |
| Actual | | | | $1,000.00 | | | | | $1,110.20 | | | | | $9.68 | |
| Hypothetical** | | | | $1,000.00 | | | | | $1,016.00 | | | | | $9.25 | |
| R6 Class | | | | | | | | | | | | | | | |
| Actual | | | | $1,000.00 | | | | | $1,115.90 | | | | | $3.79 | |
| Hypothetical** | | | | $1,000.00 | | | | | $1,021.60 | | | | | $3.62 | |
| * | Expenses are equal to the Fund’s annualized expense ratios for the six-month period of 0.73%, 0.80%, 1.07%, 1.07%, 1.82%, and 0.71% for the Institutional, Y, Investor, A, C, and R6 Classes, respectively, multiplied by the average account value over the period, multiplied by the number derived by dividing the number of days in the most recent fiscal half-year (184) by days in the year (365) to reflect the half-year period. |
| ** | 5% return before expenses. |
10
American Beacon FundsSM
Report of Independent Registered Public Accounting Firm
To the Shareholders of American Beacon Bridgeway Large Cap Growth Fund and American Beacon Bridgeway Large Cap Value Fund and the Board of Trustees of American Beacon Funds
Opinion on the Financial Statements
We have audited the accompanying statements of assets and liabilities of American Beacon Bridgeway Large Cap Growth Fund and American Beacon Bridgeway Large Cap Value Fund (collectively referred to as the “Funds”), (two of the funds constituting American Beacon Funds (the “Trust”)), including the schedules of investments, as of December 31, 2017, and the related statements of operations and changes in net assets, and the financial highlights for each of the periods indicated in the table below and the related notes (collectively referred to as the “financial statements”). In our opinion, the financial statements present fairly, in all material respects, the financial position of each of the Funds (two of the funds constituting American Beacon Funds) at December 31, 2017, the results of their operations, changes in net assets and financial highlights for each of the periods indicated in the table below, in conformity with U.S. generally accepted accounting principles. The financial highlights for the periods ended June 30, 2015, 2014 and 2013 of American Beacon Bridgeway Large Cap Growth Fund were audited by other auditors whose report dated August 27, 2015, expressed an opinion on those financial statements and financial highlights.
| | | | | | |
Individual fund constituting
the American Beacon Funds | | Statement of operations | | Statements of changes
in net assets | | Financial highlights |
| American Beacon Bridgeway Large Cap Growth Fund | | For the year ended
December 31, 2017 | | For the year ended December 31, 2017, the six months ended December 31, 2016 and the year ended June 30, 2016 | | For the year ended December 31, 2017, the six months ended December 31, 2016 and each of the four years in the period ended June 30, 2016 |
| American Beacon Bridgeway Large Cap Value Fund | | For the year ended
December 31, 2017 | | For each of the two years in the period ended December 31, 2017 | | For each of the five years in the period ended December 31, 2017 |
Basis for Opinion
These financial statements are the responsibility of the Trust’s management. Our responsibility is to express an opinion on the Funds’ financial statements based on our audits. We are a public accounting firm registered with the Public Company Accounting Oversight Board (United States) (“PCAOB”) and are required to be independent with respect to the Trust in accordance with the U.S. federal securities laws and the applicable rules and regulations of the Securities and Exchange Commission and the PCAOB.
We conducted our audits in accordance with the standards of the PCAOB. Those standards require that we plan and perform the audit to obtain reasonable assurance about whether the financial statements are free of material misstatement, whether due to error or fraud. The Trust is not required to have, nor were we engaged to perform, an audit of the Trust’s internal control over financial reporting. As part of our audits, we are required to obtain an understanding of internal control over financial reporting, but not for the purpose of expressing an opinion on the effectiveness of the Trust’s internal control over financial reporting. Accordingly, we express no such opinion.
Our audits included performing procedures to assess the risks of material misstatement of the financial statements, whether due to error or fraud, and performing procedures that respond to those risks. Such procedures included examining, on a test basis, evidence regarding the amounts and disclosures in the financial statements. Our procedures included confirmation of securities owned as of December 31, 2017, by correspondence with the custodian and brokers or by other appropriate auditing procedures where replies from brokers were not received. Our audits also included evaluating the accounting principles used and significant estimates made by management, as well as evaluating the overall presentation of the financial statements. We believe that our audits provide a reasonable basis for our opinion.

We have served as the auditor of one or more American Beacon investment companies since 1987.
Dallas, Texas
February 28, 2018
11
American Beacon Bridgeway Large Cap Growth FundSM
Schedule of Investments
December 31, 2017
| | | | | | | | | | | | | | | |
| | | Shares | | | | Fair Value |
| | | | | | | | | | | | | | | |
| COMMON STOCKS - 99.39% | | | | | | | | | | | | | | | |
| Consumer Discretionary - 15.94% | | | | | | | | | | | | | | | |
| Auto Components - 2.16% | | | | | | | | | | | | | | | |
| Aptiv PLC | | | | 27,600 | | | | | | | | | $ | 2,341,308 | |
| Delphi Technologies PLCA | | | | 9,199 | | | | | | | | | | 482,671 | |
| Lear Corp. | | | | 15,500 | | | | | | | | | | 2,738,230 | |
| | | | | | | | | | | | | | | |
| | | | | | | | | | | | | | 5,562,209 | |
| | | | | | | | | | | | | | | |
| | | | | | | | | | | | | | | |
| Automobiles - 1.03% | | | | | | | | | | | | | | | |
| Thor Industries, Inc. | | | | 17,600 | | | | | | | | | | 2,652,672 | |
| | | | | | | | | | | | | | | |
| | | | | | | | | | | | | | | |
| Hotels, Restaurants & Leisure - 0.94% | | | | | | | | | | | | | | | |
| Domino’s Pizza, Inc. | | | | 12,800 | | | | | | | | | | 2,418,688 | |
| | | | | | | | | | | | | | | |
| | | | | | | | | | | | | | | |
| Household Durables - 1.89% | | | | | | | | | | | | | | | |
| NVR, Inc.A | | | | 600 | | | | | | | | | | 2,104,932 | |
| Toll Brothers, Inc. | | | | 57,100 | | | | | | | | | | 2,741,942 | |
| | | | | | | | | | | | | | | |
| | | | | | | | | | | | | | 4,846,874 | |
| | | | | | | | | | | | | | | |
| | | | | | | | | | | | | | | |
| Internet & Direct Marketing Retail - 4.38% | | | | | | | | | | | | | | | |
| Amazon.com, Inc.A | | | | 4,300 | | | | | | | | | | 5,028,721 | |
| Netflix, Inc.A | | | | 24,200 | | | | | | | | | | 4,645,432 | |
| Priceline Group, Inc.A | | | | 900 | | | | | | | | | | 1,563,966 | |
| | | | | | | | | | | | | | | |
| | | | | | | | | | | | | | 11,238,119 | |
| | | | | | | | | | | | | | | |
| | | | | | | | | | | | | | | |
| Media - 1.80% | | | | | | | | | | | | | | | |
| Comcast Corp., Class A | | | | 78,500 | | | | | | | | | | 3,143,925 | |
| Viacom, Inc., Class B | | | | 47,800 | | | | | | | | | | 1,472,718 | |
| | | | | | | | | | | | | | | |
| | | | | | | | | | | | | | 4,616,643 | |
| | | | | | | | | | | | | | | |
| | | | | | | | | | | | | | | |
| Multiline Retail - 1.63% | | | | | | | | | | | | | | | |
| Nordstrom, Inc. | | | | 46,400 | | | | | | | | | | 2,198,432 | |
| Target Corp. | | | | 30,400 | | | | | | | | | | 1,983,600 | |
| | | | | | | | | | | | | | | |
| | | | | | | | | | | | | | 4,182,032 | |
| | | | | | | | | | | | | | | |
| | | | | | | | | | | | | | | |
| Specialty Retail - 2.11% | | | | | | | | | | | | | | | |
| Gap, Inc. | | | | 42,900 | | | | | | | | | | 1,461,174 | |
| Ulta Salon Cosmetics & Fragrance, Inc.A | | | | 17,700 | | | | | | | | | | 3,958,782 | |
| | | | | | | | | | | | | | | |
| | | | | | | | | | | | | | 5,419,956 | |
| | | | | | | | | | | | | | | |
| | | | | | | | | | | | | | | |
Total Consumer Discretionary | | | | | | | | | | | | | | 40,937,193 | |
| | | | | | | | | | | | | | | |
| | | | | | | | | | | | | | | |
| Consumer Staples - 5.78% | | | | | | | | | | | | | | | |
| Beverages - 1.49% | | | | | | | | | | | | | | | |
| Coca-Cola Co. | | | | 83,300 | | | | | | | | | | 3,821,804 | |
| | | | | | | | | | | | | | | |
| | | | | | | | | | | | | | | |
| Food & Staples Retailing - 1.28% | | | | | | | | | | | | | | | |
| Sysco Corp. | | | | 54,200 | | | | | | | | | | 3,291,566 | |
| | | | | | | | | | | | | | | |
| | | | | | | | | | | | | | | |
| Food Products - 2.20% | | | | | | | | | | | | | | | |
| General Mills, Inc. | | | | 49,300 | | | | | | | | | | 2,922,997 | |
| Kellogg Co. | | | | 40,000 | | | | | | | | | | 2,719,200 | |
| | | | | | | | | | | | | | | |
| | | | | | | | | | | | | | 5,642,197 | |
| | | | | | | | | | | | | | | |
| | | | | | | | | | | | | | | |
| Personal Products - 0.81% | | | | | | | | | | | | | | | |
| Estee Lauder Companies, Inc., Class A | | | | 16,300 | | | | | | | | | | 2,074,012 | |
| | | | | | | | | | | | | | | |
| | | | | | | | | | | | | | | |
Total Consumer Staples | | | | | | | | | | | | | | 14,829,579 | |
| | | | | | | | | | | | | | | |
| | | | | | | | | | | | | | | |
See accompanying notes
12
American Beacon Bridgeway Large Cap Growth FundSM
Schedule of Investments
December 31, 2017
| | | | | | | | | | | | | | | |
| | | Shares | | | | Fair Value |
| | | | | | | | | | | | | | | |
| COMMON STOCKS - 99.39% (continued) | | | | | | | | | | | | | | | |
| Financials - 5.14% | | | | | | | | | | | | | | | |
| Capital Markets - 1.10% | | | | | | | | | | | | | | | |
| SEI Investments Co. | | | | 39,200 | | | | | | | | | $ | 2,816,912 | |
| | | | | | | | | | | | | | | |
| | | | | | | | | | | | | | | |
| Consumer Finance - 1.45% | | | | | | | | | | | | | | | |
| Capital One Financial Corp. | | | | 37,300 | | | | | | | | | | 3,714,334 | |
| | | | | | | | | | | | | | | |
| | | | | | | | | | | | | | | |
| Diversified Financial Services - 0.91% | | | | | | | | | | | | | | | |
| Leucadia National Corp. | | | | 88,400 | | | | | | | | | | 2,341,716 | |
| | | | | | | | | | | | | | | |
| | | | | | | | | | | | | | | |
| Insurance - 1.68% | | | | | | | | | | | | | | | |
| Lincoln National Corp. | | | | 25,100 | | | | | | | | | | 1,929,437 | |
| Reinsurance Group of America, Inc. | | | | 15,300 | | | | | | | | | | 2,385,729 | |
| | | | | | | | | | | | | | | |
| | | | | | | | | | | | | | 4,315,166 | |
| | | | | | | | | | | | | | | |
| | | | | | | | | | | | | | | |
Total Financials | | | | | | | | | | | | | | 13,188,128 | |
| | | | | | | | | | | | | | | |
| | | | | | | | | | | | | | | |
| Health Care - 15.09% | | | | | | | | | | | | | | | |
| Biotechnology - 3.27% | | | | | | | | | | | | | | | |
| AbbVie, Inc. | | | | 28,500 | | | | | | | | | | 2,756,235 | |
| Gilead Sciences, Inc. | | | | 36,600 | | | | | | | | | | 2,622,024 | |
| Vertex Pharmaceuticals, Inc.A | | | | 20,200 | | | | | | | | | | 3,027,172 | |
| | | | | | | | | | | | | | | |
| | | | | | | | | | | | | | 8,405,431 | |
| | | | | | | | | | | | | | | |
| | | | | | | | | | | | | | | |
| Health Care Equipment & Supplies - 4.36% | | | | | | | | | | | | | | | |
| ABIOMED, Inc.A | | | | 13,300 | | | | | | | | | | 2,492,553 | |
| Align Technology, Inc.A | | | | 21,700 | | | | | | | | | | 4,821,523 | |
| IDEXX Laboratories, Inc.A | | | | 24,800 | | | | | | | | | | 3,878,224 | |
| | | | | | | | | | | | | | | |
| | | | | | | | | | | | | | 11,192,300 | |
| | | | | | | | | | | | | | | |
| Health Care Providers & Services - 4.89% | | | | | | | | | | | | | | | |
| Centene Corp.A | | | | 26,400 | | | | | | | | | | 2,663,232 | |
| Cigna Corp. | | | | 12,000 | | | | | | | | | | 2,437,080 | |
| HCA Healthcare, Inc.A | | | | 30,500 | | | | | | | | | | 2,679,120 | |
| UnitedHealth Group, Inc. | | | | 21,700 | | | | | | | | | | 4,783,982 | |
| | | | | | | | | | | | | | | |
| | | | | | | | | | | | | | 12,563,414 | |
| | | | | | | | | | | | | | | |
| Life Sciences Tools & Services - 2.57% | | | | | | | | | | | | | | | |
| IQVIA Holdings, Inc.A | | | | 26,200 | | | | | | | | | | 2,564,980 | |
| Mettler-Toledo International, Inc.A | | | | 6,500 | | | | | | | | | | 4,026,880 | |
| | | | | | | | | | | | | | | |
| | | | | | | | | | | | | | 6,591,860 | |
| | | | | | | | | | | | | | | |
| | | | | | | | | | | | | | | |
Total Health Care | | | | | | | | | | | | | | 38,753,005 | |
| | | | | | | | | | | | | | | |
| | | | | | | | | | | | | | | |
| Industrials - 15.44% | | | | | | | | | | | | | | | |
| Aerospace & Defense - 3.13% | | | | | | | | | | | | | | | |
| Boeing Co. | | | | 18,100 | | | | | | | | | | 5,337,871 | |
| Huntington Ingalls Industries, Inc. | | | | 11,400 | | | | | | | | | | 2,686,980 | |
| | | | | | | | | | | | | | | |
| | | | | | | | | | | | | | 8,024,851 | |
| | | | | | | | | | | | | | | |
| | | | | | | | | | | | | | | |
| Airlines - 3.03% | | | | | | | | | | | | | | | |
| American Airlines Group, Inc. | | | | 65,800 | | | | | | | | | | 3,423,574 | |
| Delta Air Lines, Inc. | | | | 38,900 | | | | | | | | | | 2,178,400 | |
| United Continental Holdings, Inc.A | | | | 32,500 | | | | | | | | | | 2,190,500 | |
| | | | | | | | | | | | | | | |
| | | | | | | | | | | | | | 7,792,474 | |
| | | | | | | | | | | | | | | |
| | | | | | | | | | | | | | | |
| Commercial Services & Supplies - 2.27% | | | | | | | | | | | | | | | |
| Cintas Corp. | | | | 18,000 | | | | | | | | | | 2,804,940 | |
| Rollins, Inc. | | | | 64,800 | | | | | | | | | | 3,015,144 | |
| | | | | | | | | | | | | | | |
| | | | | | | | | | | | | | 5,820,084 | |
| | | | | | | | | | | | | | | |
| | | | | | | | | | | | | | | |
See accompanying notes
13
American Beacon Bridgeway Large Cap Growth FundSM
Schedule of Investments
December 31, 2017
| | | | | | | | | | | | | | | |
| | | Shares | | | | Fair Value |
| | | | | | | | | | | | | | | |
| COMMON STOCKS - 99.39% (continued) | | | | | | | | | | | | | | | |
| Industrials - 15.44% (continued) | | | | | | | | | | | | | | | |
| Industrial Conglomerates - 1.04% | | | | | | | | | | | | | | | |
| Honeywell International, Inc. | | | | 17,400 | | | | | | | | | $ | 2,668,464 | |
| | | | | | | | | | | | | | | |
| | | | | | | | | | | | | | | |
| Machinery - 3.96% | | | | | | | | | | | | | | | |
| Deere & Co. | | | | 18,100 | | | | | | | | | | 2,832,831 | |
| Toro Co. | | | | 34,800 | | | | | | | | | | 2,270,004 | |
| WABCO Holdings, Inc.A | | | | 17,000 | | | | | | | | | | 2,439,500 | |
| Xylem, Inc. | | | | 38,400 | | | | | | | | | | 2,618,880 | |
| | | | | | | | | | | | | | | |
| | | | | | | | | | | | | | 10,161,215 | |
| | | | | | | | | | | | | | | |
| | | | | | | | | | | | | | | |
| Trading Companies & Distributors - 2.01% | | | | | | | | | | | | | | | |
| United Rentals, Inc.A | | | | 30,100 | | | | | | | | | | 5,174,491 | |
| | | | | | | | | | | | | | | |
| | | | | | | | | | | | | | | |
Total Industrials | | | | | | | | | | | | | | 39,641,579 | |
| | | | | | | | | | | | | | | |
| | | | | | | | | | | | | | | |
| Information Technology - 34.17% | | | | | | | | | | | | | | | |
| Communications Equipment - 1.97% | | | | | | | | | | | | | | | |
| Arista Networks, Inc.A | | | | 10,400 | | | | | | | | | | 2,450,032 | |
| F5 Networks, Inc.A | | | | 19,800 | | | | | | | | | | 2,598,156 | |
| | | | | | | | | | | | | | | |
| | | | | | | | | | | | | | 5,048,188 | |
| | | | | | | | | | | | | | | |
| | | | | | | | | | | | | | | |
| Electronic Equipment, Instruments & Components - 3.07% | | | | | | | | | | | | | | | |
| Amphenol Corp., Class A | | | | 42,800 | | | | | | | | | | 3,757,840 | |
| Cognex Corp. | | | | 34,400 | | | | | | | | | | 2,103,904 | |
| IPG Photonics Corp.A | | | | 9,400 | | | | | | | | | | 2,012,822 | |
| | | | | | | | | | | | | | | |
| | | | | | | | | | | | | | 7,874,566 | |
| | | | | | | | | | | | | | | |
| | | | | | | | | | | | | | | |
| Internet Software & Services - 0.73% | | | | | | | | | | | | | | | |
| GoDaddy, Inc., Class AA | | | | 37,300 | | | | | | | | | | 1,875,444 | |
| | | | | | | | | | | | | | | |
| | | | | | | | | | | | | | | |
| IT Services - 2.99% | | | | | | | | | | | | | | | |
| Broadridge Financial Solutions, Inc. | | | | 30,400 | | | | | | | | | | 2,753,632 | |
| Mastercard, Inc., Class A | | | | 15,300 | | | | | | | | | | 2,315,808 | |
| PayPal Holdings, Inc.A | | | | 35,500 | | | | | | | | | | 2,613,510 | |
| | | | | | | | | | | | | | | |
| | | | | | | | | | | | | | 7,682,950 | |
| | | | | | | | | | | | | | | |
| | | | | | | | | | | | | | | |
| Semiconductors & Semiconductor Equipment - 14.15% | | | | | | | | | | | | | | | |
| Applied Materials, Inc. | | | | 93,100 | | | | | | | | | | 4,759,272 | |
| Intel Corp. | | | | 58,000 | | | | | | | | | | 2,677,280 | |
| KLA-Tencor Corp. | | | | 25,000 | | | | | | | | | | 2,626,750 | |
| Lam Research Corp. | | | | 25,400 | | | | | | | | | | 4,675,378 | |
| Microchip Technology, Inc. | | | | 27,000 | | | | | | | | | | 2,372,760 | |
| Micron Technology, Inc.A | | | | 141,100 | | | | | | | | | | 5,802,032 | |
| NVIDIA Corp. | | | | 25,100 | | | | | | | | | | 4,856,850 | |
| ON Semiconductor Corp.A | | | | 94,000 | | | | | | | | | | 1,968,360 | |
| Teradyne, Inc. | | | | 58,800 | | | | | | | | | | 2,461,956 | |
| Texas Instruments, Inc. | | | | 39,500 | | | | | | | | | | 4,125,380 | |
| | | | | | | | | | | | | | | |
| | | | | | | | | | | | | | 36,326,018 | |
| | | | | | | | | | | | | | | |
| | | | | | | | | | | | | | | |
| Software - 8.36% | | | | | | | | | | | | | | | |
| Cadence Design Systems, Inc.A | | | | 107,400 | | | | | | | | | | 4,491,468 | |
| Electronic Arts, Inc.A | | | | 16,600 | | | | | | | | | | 1,743,996 | |
| Intuit, Inc. | | | | 23,700 | | | | | | | | | | 3,739,386 | |
| Microsoft Corp. | | | | 40,600 | | | | | | | | | | 3,472,924 | |
| Red Hat, Inc.A | | | | 15,900 | | | | | | | | | | 1,909,590 | |
| ServiceNow, Inc.A | | | | 26,000 | | | | | | | | | | 3,390,140 | |
| Take-Two Interactive Software, Inc.A | | | | 24,800 | | | | | | | | | | 2,722,544 | |
| | | | | | | | | | | | | | | |
| | | | | | | | | | | | | | 21,470,048 | |
| | | | | | | | | | | | | | | |
See accompanying notes
14
American Beacon Bridgeway Large Cap Growth FundSM
Schedule of Investments
December 31, 2017
| | | | | | | | | | | | | | | |
| | | Shares | | | | Fair Value |
| | | | | | | | | | | | | | | |
| COMMON STOCKS - 99.39% (continued) | | | | | | | | | | | | | | | |
| Information Technology - 34.17% (continued) | | | | | | | | | | | | | | | |
| Technology Hardware, Storage & Peripherals - 2.90% | | | | | | | | | | | | | | | |
| Apple, Inc. | | | | 31,600 | | | | | | | | | $ | 5,347,668 | |
| Western Digital Corp. | | | | 26,400 | | | | | | | | | | 2,099,592 | |
| | | | | | | | | | | | | | | |
| | | | | | | | | | | | | | 7,447,260 | |
| | | | | | | | | | | | | | | |
| | | | | | | | | | | | | | | |
Total Information Technology | | | | | | | | | | | | | | 87,724,474 | |
| | | | | | | | | | | | | | | |
| | | | | | | | | | | | | | | |
| Materials - 5.42% | | | | | | | | | | | | | | | |
| Chemicals - 2.05% | | | | | | | | | | | | | | | |
| Ecolab, Inc. | | | | 17,900 | | | | | | | | | | 2,401,822 | |
| LyondellBasell Industries N.V., Class A | | | | 25,900 | | | | | | | | | | 2,857,288 | |
| | | | | | | | | | | | | | | |
| | | | | | | | | | | | | | 5,259,110 | |
| | | | | | | | | | | | | | | |
| | | | | | | | | | | | | | | |
| Containers & Packaging - 1.85% | | | | | | | | | | | | | | | |
| Avery Dennison Corp. | | | | 22,600 | | | | | | | | | | 2,595,836 | |
| Crown Holdings, Inc.A | | | | 38,200 | | | | | | | | | | 2,148,750 | |
| | | | | | | | | | | | | | | |
| | | | | | | | | | | | | | 4,744,586 | |
| | | | | | | | | | | | | | | |
| | | | | | | | | | | | | | | |
| Metals & Mining - 1.52% | | | | | | | | | | | | | | | |
| Southern Copper Corp. | | | | 82,500 | | | | | | | | | | 3,914,625 | |
| | | | | | | | | | | | | | | |
| | | | | | | | | | | | | | | |
Total Materials | | | | | | | | | | | | | | 13,918,321 | |
| | | | | | | | | | | | | | | |
| | | | | | | | | | | | | | | |
| Real Estate - 1.20% | | | | | | | | | | | | | | | |
| Real Estate Management & Development - 1.20% | | | | | | | | | | | | | | | |
| CBRE Group, Inc., Class AA | | | | 71,400 | | | | | | | | | | 3,092,334 | |
| | | | | | | | | | | | | | | |
| | | | | | | | | | | | | | | |
| Telecommunication Services - 1.21% | | | | | | | | | | | | | | | |
| Wireless Telecommunication Services - 1.21% | | | | | | | | | | | | | | | |
| T-Mobile US, Inc.A | | | | 48,800 | | | | | | | | | | 3,099,288 | |
| | | | | | | | | | | | | | | |
| | | | | | | | | | | | | | | |
Total Common Stocks (Cost $216,217,937) | | | | | | | | | | | | | | 255,183,901 | |
| | | | | | | | | | | | | | | |
| | | | | | | | | | | | | | | |
| SHORT-TERM INVESTMENTS - 0.56% (Cost $1,441,964) | | | | | | | | | | | | | | | |
| Investment Companies - 0.56% | | | | | | | | | | | | | | | |
| American Beacon U.S. Government Money Market Select Fund, Select Class, 1.13%B C | | | | 1,441,964 | | | | | | | | | | 1,441,964 | |
| | | | | | | | | | | | | | | |
| | | | | | | | | | | | | | | |
TOTAL INVESTMENTS - 99.95% (Cost $217,659,901) | | | | | | | | | | | | | | 256,625,865 | |
OTHER ASSETS, NET OF LIABILITIES - 0.05% | | | | | | | | | | | | | | 121,746 | |
| | | | | | | | | | | | | | | |
TOTAL NET ASSETS - 100.00% | | | | | | | | | | | | | $ | 256,747,611 | |
| | | | | | | | | | | | | | | |
| | | | | | | | | | | | | | | |
| Percentages are stated as a percent of net assets. | | | | | | | | | | | | | | | |
A Non-income producing security.
B The Fund is affiliated by having the same investment advisor.
C 7-day yield.
PLC - Public Limited Company.
| | | | | | | | | | | | | | | | |
| Futures Contracts Open on December 31, 2017: | |
| | | | | |
| Long Futures | | | | | | | | | | | | | |
| | | | | |
| Equity Futures Contracts | | | | | | | | | | | | | |
| Description | | Number of
Contracts | | Expiration Date | | Notional Amount | | | Contract Value | | | Unrealized
Appreciation
(Depreciation) | |
| S&P 500 E-Mini Index Futures | | 10 | | March 2018 | | $ | 1,343,422 | | | $ | 1,338,000 | | | $ | (5,422 | ) |
| | | | | | | | | | | | | | | | |
| | | | | | $ | 1,343,422 | | | $ | 1,338,000 | | | $ | (5,422 | ) |
| | | | | | | | | | | | | | | | |
See accompanying notes
15
American Beacon Bridgeway Large Cap Growth FundSM
Schedule of Investments
December 31, 2017
| | |
| Index Abbreviations: |
| S&P 500 | | Standard & Poor’s U.S. Equity Large-Cap Index |
The Fund’s investments are summarized by level based on the inputs used to determine their values. As of December 31, 2017, the investments were classified as described below:
| | | | | | | | | | | | | | | | | | | | | | | | | | | | |
Bridgeway Large Cap Growth Fund | | Level 1 | | | | | | Level 2 | | | | | | Level 3 | | | | | | Total | |
Assets | | | | | | | | | | | | | | | | | | | | | | | | | | | | |
Common Stocks | | $ | 255,183,901 | | | | | | | $ | - | | | | | | | $ | - | | | | | | | $ | 255,183,901 | |
Short-Term Investments | | | 1,441,964 | | | | | | | | - | | | | | | | | - | | | | | | | | 1,441,964 | |
| | | | | | | | | | | | | | | | | | | | | | | | | | | | |
Total Investments in Securities - Assets | | $ | 256,625,865 | | | | | | | $ | - | | | | | | | $ | - | | | | | | | $ | 256,625,865 | |
| | | | | | | | | | | | | | | | | | | | | | | | | | | | |
| | | | | | | |
Financial Derivative Instruments - Liabilities | | | | | | | | | | | | | | | | | | | | | | | | | | | | |
Futures Contracts | | $ | (5,422 | ) | | | | | | $ | - | | | | | | | $ | - | | | | | | | $ | (5,422 | ) |
| | | | | | | | | | | | | | | | | | | | | | | | | | | | |
Total Financial Derivative Instruments - Liabilities | | $ | (5,422 | ) | | | | | | $ | - | | | | | | | $ | - | | | | | | | $ | (5,422 | ) |
| | | | | | | | | | | | | | | | | | | | | | | | | | | | |
U.S. GAAP requires all transfers between any levels to be disclosed. The end of period timing recognition has been adopted for the transfers between levels of the Fund’s assets and liabilities. During the period ended December 31, 2017, there were no transfers between levels.
See accompanying notes
16
American Beacon Bridgeway Large Cap Value FundSM
Schedule of Investments
December 31, 2017
| | | | | | | | | | | | | | | |
| | | Shares | | | | Fair Value |
| | | | | | | | | | | | | | | |
| COMMON STOCKS - 97.97% | | | | | | | | | | | | | | | |
| Consumer Discretionary - 11.87% | | | | | | | | | | | | | | | |
| Auto Components - 1.13% | | | | | | | | | | | | | | | |
| Lear Corp. | | | | 304,700 | | | | | | | | | $ | 53,828,302 | |
| | | | | | | | | | | | | | | |
| | | | | | | | | | | | | | | |
| Automobiles - 1.99% | | | | | | | | | | | | | | | |
| Ford Motor Co. | | | | 3,640,040 | | | | | | | | | | 45,464,100 | |
| General Motors Co. | | | | 1,204,980 | | | | | | | | | | 49,392,130 | |
| | | | | | | | | | | | | | | |
| | | | | | | | | | | | | | 94,856,230 | |
| | | | | | | | | | | | | | | |
| | | | | | | | | | | | | | | |
| Diversified Consumer Services - 0.19% | | | | | | | | | | | | | | | |
| H&R Block, Inc. | | | | 342,800 | | | | | | | | | | 8,988,216 | |
| | | | | | | | | | | | | | | |
| | | | | | | | | | | | | | | |
| Hotels, Restaurants & Leisure - 1.14% | | | | | | | | | | | | | | | |
| Carnival Corp. | | | | 503,000 | | | | | | | | | | 33,384,110 | |
| Royal Caribbean Cruises Ltd. | | | | 174,800 | | | | | | | | | | 20,850,144 | |
| | | | | | | | | | | | | | | |
| | | | | | | | | | | | | | 54,234,254 | |
| | | | | | | | | | | | | | | |
| | | | | | | | | | | | | | | |
| Household Durables - 0.61% | | | | | | | | | | | | | | | |
| PulteGroup, Inc. | | | | 879,000 | | | | | | | | | | 29,226,750 | |
| | | | | | | | | | | | | | | |
| | | | | | | | | | | | | | | |
| Media - 1.99% | | | | | | | | | | | | | | | |
| Comcast Corp., Class A | | | | 824,000 | | | | | | | | | | 33,001,200 | |
| Twenty-First Century Fox, Inc., Class A | | | | 1,793,200 | | | | | | | | | | 61,919,196 | |
| | | | | | | | | | | | | | | |
| | | | | | | | | | | | | | 94,920,396 | |
| | | | | | | | | | | | | | | |
| | | | | | | | | | | | | | | |
| Multiline Retail - 2.80% | | | | | | | | | | | | | | | |
| Kohl’s Corp. | | | | 902,600 | | | | | | | | | | 48,947,998 | |
| Macy’s, Inc. | | | | 1,400,400 | | | | | | | | | | 35,276,076 | |
| Target Corp. | | | | 757,600 | | | | | | | | | | 49,433,400 | |
| | | | | | | | | | | | | | | |
| | | | | | | | | | | | | | 133,657,474 | |
| | | | | | | | | | | | | | | |
| | | | | | | | | | | | | | | |
| Specialty Retail - 2.02% | | | | | | | | | | | | | | | |
| Best Buy Co., Inc. | | | | 1,036,600 | | | | | | | | | | 70,976,002 | |
| Burlington Stores, Inc.A | | | | 207,700 | | | | | | | | | | 25,553,331 | |
| | | | | | | | | | | | | | | |
| | | | | | | | | | | | | | 96,529,333 | |
| | | | | | | | | | | | | | | |
| | | | | | | | | | | | | | | |
Total Consumer Discretionary | | | | | | | | | | | | | | 566,240,955 | |
| | | | | | | | | | | | | | | |
| | | | | | | | | | | | | | | |
| Consumer Staples - 8.39% | | | | | | | | | | | | | | | |
| Beverages - 2.20% | | | | | | | | | | | | | | | |
| Coca-Cola Co. | | | | 1,053,700 | | | | | | | | | | 48,343,756 | |
| PepsiCo, Inc. | | | | 474,500 | | | | | | | | | | 56,902,040 | |
| | | | | | | | | | | | | | | |
| | | | | | | | | | | | | | 105,245,796 | |
| | | | | | | | | | | | | | | |
| | | | | | | | | | | | | | | |
| Food & Staples Retailing - 2.40% | | | | | | | | | | | | | | | |
| CVS Health Corp. | | | | 375,200 | | | | | | | | | | 27,202,000 | |
| Wal-Mart Stores, Inc. | | | | 885,000 | | | | | | | | | | 87,393,750 | |
| | | | | | | | | | | | | | | |
| | | | | | | | | | | | | | 114,595,750 | |
| | | | | | | | | | | | | | | |
| | | | | | | | | | | | | | | |
| Food Products - 2.44% | | | | | | | | | | | | | | | |
| General Mills, Inc. | | | | 581,300 | | | | | | | | | | 34,465,277 | |
| Ingredion, Inc. | | | | 276,800 | | | | | | | | | | 38,696,640 | |
| Kellogg Co. | | | | 634,600 | | | | | | | | | | 43,140,108 | |
| | | | | | | | | | | | | | | |
| | | | | | | | | | | | | | 116,302,025 | |
| | | | | | | | | | | | | | | |
| | | | | | | | | | | | | | | |
| Household Products - 1.35% | | | | | | | | | | | | | | | |
| Procter & Gamble Co. | | | | 698,900 | | | | | | | | | | 64,214,932 | |
| | | | | | | | | | | | | | | |
| | | | | | | | | | | | | | | |
Total Consumer Staples | | | | | | | | | | | | | | 400,358,503 | |
| | | | | | | | | | | | | | | |
| | | | | | | | | | | | | | | |
See accompanying notes
17
American Beacon Bridgeway Large Cap Value FundSM
Schedule of Investments
December 31, 2017
| | | | | | | | | | | | | | | |
| | | Shares | | | | Fair Value |
| | | | | | | | | | | | | | | |
| COMMON STOCKS - 97.97% (continued) | | | | | | | | | | | | | | | |
| Energy - 6.28% | | | | | | | | | | | | | | | |
| Oil, Gas & Consumable Fuels - 6.28% | | | | | | | | | | | | | | | |
| HollyFrontier Corp. | | | | 1,007,800 | | | | | | | | | $ | 51,619,516 | |
| Marathon Petroleum Corp. | | | | 923,900 | | | | | | | | | | 60,958,922 | |
| Occidental Petroleum Corp. | | | | 869,100 | | | | | | | | | | 64,017,906 | |
| Phillips 66 | | | | 356,800 | | | | | | | | | | 36,090,320 | |
| Valero Energy Corp. | | | | 944,500 | | | | | | | | | | 86,808,995 | |
| | | | | | | | | | | | | | | |
| | | | | | | | | | | | | | 299,495,659 | |
| | | | | | | | | | | | | | | |
| | | | | | | | | | | | | | | |
Total Energy | | | | | | | | | | | | | | 299,495,659 | |
| | | | | | | | | | | | | | | |
| | | | | | | | | | | | | | | |
| Financials - 26.76% | | | | | | | | | | | | | | | |
| Banks - 6.99% | | | | | | | | | | | | | | | |
| Bank of America Corp. | | | | 2,889,100 | | | | | | | | | | 85,286,232 | |
| CIT Group, Inc. | | | | 908,500 | | | | | | | | | | 44,725,455 | |
| Citigroup, Inc. | | | | 1,041,500 | | | | | | | | | | 77,498,015 | |
| Fifth Third Bancorp | | | | 1,686,200 | | | | | | | | | | 51,159,308 | |
| Regions Financial Corp. | | | | 3,100,900 | | | | | | | | | | 53,583,552 | |
| US Bancorp | | | | 398,200 | | | | | | | | | | 21,335,556 | |
| | | | | | | | | | | | | | | |
| | | | | | | | | | | | | | 333,588,118 | |
| | | | | | | | | | | | | | | |
| | | | | | | | | | | | | | | |
| Capital Markets - 3.15% | | | | | | | | | | | | | | | |
| Ameriprise Financial, Inc. | | | | 355,500 | | | | | | | | | | 60,246,585 | |
| Morgan Stanley | | | | 1,083,500 | | | | | | | | | | 56,851,245 | |
| State Street Corp. | | | | 338,100 | | | | | | | | | | 33,001,941 | |
| | | | | | | | | | | | | | | |
| | | | | | | | | | | | | | 150,099,771 | |
| | | | | | | | | | | | | | | |
| | | | | | | | | | | | | | | |
| Consumer Finance - 5.16% | | | | | | | | | | | | | | | |
| Ally Financial, Inc. | | | | 1,540,600 | | | | | | | | | | 44,923,896 | |
| American Express Co. | | | | 480,100 | | | | | | | | | | 47,678,731 | |
| Capital One Financial Corp. | | | | 618,600 | | | | | | | | | | 61,600,188 | |
| Discover Financial Services | | | | 615,836 | | | | | | | | | | 47,370,105 | |
| Synchrony Financial | | | | 1,156,800 | | | | | | | | | | 44,664,048 | |
| | | | | | | | | | | | | | | |
| | | | | | | | | | | | | | 246,236,968 | |
| | | | | | | | | | | | | | | |
| | | | | | | | | | | | | | | |
| Diversified Financial Services - 1.10% | | | | | | | | | | | | | | | |
| Voya Financial, Inc. | | | | 1,061,600 | | | | | | | | | | 52,517,352 | |
| | | | | | | | | | | | | | | |
| | | | | | | | | | | | | | | |
| Insurance - 10.36% | | | | | | | | | | | | | | | |
| Aflac, Inc. | | | | 430,600 | | | | | | | | | | 37,798,068 | |
| Allstate Corp. | | | | 476,800 | | | | | | | | | | 49,925,728 | |
| American Financial Group, Inc. | | | | 167,800 | | | | | | | | | | 18,213,012 | |
| American International Group, Inc. | | | | 787,200 | | | | | | | | | | 46,901,376 | |
| Chubb Ltd. | | | | 221,000 | | | | | | | | | | 32,294,730 | |
| Everest Re Group Ltd. | | | | 171,500 | | | | | | | | | | 37,946,090 | |
| Hartford Financial Services Group, Inc. | | | | 512,700 | | | | | | | | | | 28,854,756 | |
| Lincoln National Corp. | | | | 711,000 | | | | | | | | | | 54,654,570 | |
| Loews Corp. | | | | 706,200 | | | | | | | | | | 35,331,186 | |
| Prudential Financial, Inc. | | | | 476,900 | | | | | | | | | | 54,833,962 | |
| Reinsurance Group of America, Inc. | | | | 155,200 | | | | | | | | | | 24,200,336 | |
| Travelers Companies, Inc. | | | | 301,800 | | | | | | | | | | 40,936,152 | |
| XL Group Ltd. | | | | 927,200 | | | | | | | | | | 32,600,352 | |
| | | | | | | | | | | | | | | |
| | | | | | | | | | | | | | 494,490,318 | |
| | | | | | | | | | | | | | | |
| | | | | | | | | | | | | | | |
Total Financials | | | | | | | | | | | | | | 1,276,932,527 | |
| | | | | | | | | | | | | | | |
| | | | | | | | | | | | | | | |
| Health Care - 11.17% | | | | | | | | | | | | | | | |
| Biotechnology - 2.15% | | | | | | | | | | | | | | | |
| Amgen, Inc. | | | | 119,600 | | | | | | | | | | 20,798,440 | |
See accompanying notes
18
American Beacon Bridgeway Large Cap Value FundSM
Schedule of Investments
December 31, 2017
| | | | | | | | | | | | | | | |
| | | Shares | | | | Fair Value |
| | | | | | | | | | | | | | | |
| COMMON STOCKS - 97.97% (continued) | | | | | | | | | | | | | | | |
| Health Care - 11.17% (continued) | | | | | | | | | | | | | | | |
| Biotechnology - 2.15% (continued) | | | | | | | | | | | | | | | |
| Gilead Sciences, Inc. | | | | 631,600 | | | | | | | | | $ | 45,247,824 | |
| United Therapeutics Corp.A | | | | 247,200 | | | | | | | | | | 36,573,240 | |
| | | | | | | | | | | | | | | |
| | | | | | | | | | | | | | 102,619,504 | |
| | | | | | | | | | | | | | | |
| | | | | | | | | | | | | | | |
| Health Care Equipment & Supplies - 1.15% | | | | | | | | | | | | | | | |
| Dentsply Sirona, Inc. | | | | 833,000 | | | | | | | | | | 54,836,390 | |
| | | | | | | | | | | | | | | |
| | | | | | | | | | | | | | | |
| Health Care Providers & Services - 5.11% | | | | | | | | | | | | | | | |
| Aetna, Inc. | | | | 62,100 | | | | | | | | | | 11,202,219 | |
| Anthem, Inc. | | | | 232,400 | | | | | | | | | | 52,292,324 | |
| Centene Corp.A | | | | 240,000 | | | | | | | | | | 24,211,200 | |
| Express Scripts Holding Co.A | | | | 725,300 | | | | | | | | | | 54,136,392 | |
| HCA Healthcare, Inc.A | | | | 616,500 | | | | | | | | | | 54,153,360 | |
| McKesson Corp. | | | | 308,400 | | | | | | | | | | 48,094,980 | |
| | | | | | | | | | | | | | | |
| | | | | | | | | | | | | | 244,090,475 | |
| | | | | | | | | | | | | | | |
| | | | | | | | | | | | | | | |
| Life Sciences Tools & Services - 0.88% | | | | | | | | | | | | | | | |
| IQVIA Holdings, Inc.A | | | | 427,400 | | | | | | | | | | 41,842,460 | |
| | | | | | | | | | | | | | | |
| | | | | | | | | | | | | | | |
| Pharmaceuticals - 1.88% | | | | | | | | | | | | | | | |
| Allergan PLC | | | | 266,800 | | | | | | | | | | 43,643,144 | |
| Pfizer, Inc. | | | | 1,273,700 | | | | | | | | | | 46,133,414 | |
| | | | | | | | | | | | | | | |
| | | | | | | | | | | | | | 89,776,558 | |
| | | | | | | | | | | | | | | |
| | | | | | | | | | | | | | | |
Total Health Care | | | | | | | | | | | | | | 533,165,387 | |
| | | | | | | | | | | | | | | |
| | | | | | | | | | | | | | | |
| Industrials - 12.80% | | | | | | | | | | | | | | | |
| Aerospace & Defense - 4.04% | | | | | | | | | | | | | | | |
| Arconic, Inc. | | | | 1,215,300 | | | | | | | | | | 33,116,925 | |
| Raytheon Co. | | | | 249,900 | | | | | | | | | | 46,943,715 | |
| Spirit AeroSystems Holdings, Inc., Class A | | | | 739,000 | | | | | | | | | | 64,477,750 | |
| United Technologies Corp. | | | | 377,600 | | | | | | | | | | 48,170,432 | |
| | | | | | | | | | | | | | | |
| | | | | | | | | | | | | | 192,708,822 | |
| | | | | | | | | | | | | | | |
| | | | | | | | | | | | | | | |
| Airlines - 3.55% | | | | | | | | | | | | | | | |
| American Airlines Group, Inc. | | | | 811,852 | | | | | | | | | | 42,240,659 | |
| Delta Air Lines, Inc. | | | | 674,700 | | | | | | | | | | 37,783,200 | |
| JetBlue Airways Corp.A | | | | 1,829,800 | | | | | | | | | | 40,877,732 | |
| United Continental Holdings, Inc.A | | | | 717,800 | | | | | | | | | | 48,379,720 | |
| | | | | | | | | | | | | | | |
| | | | | | | | | | | | | | 169,281,311 | |
| | | | | | | | | | | | | | | |
| | | | | | | | | | | | | | | |
| Building Products - 1.26% | | | | | | | | | | | | | | | |
| Lennox International, Inc. | | | | 131,000 | | | | | | | | | | 27,282,060 | |
| Owens Corning | | | | 354,900 | | | | | | | | | | 32,629,506 | |
| | | | | | | | | | | | | | | |
| | | | | | | | | | | | | | 59,911,566 | |
| | | | | | | | | | | | | | | |
| | | | | | | | | | | | | | | |
| Commercial Services & Supplies - 1.14% | | | | | | | | | | | | | | | |
| Republic Services, Inc. | | | | 806,600 | | | | | | | | | | 54,534,226 | |
| | | | | | | | | | | | | | | |
| | | | | | | | | | | | | | | |
| Electrical Equipment - 0.47% | | | | | | | | | | | | | | | |
| Eaton Corp. PLC | | | | 285,000 | | | | | | | | | | 22,517,850 | |
| | | | | | | | | | | | | | | |
| | | | | | | | | | | | | | | |
| Industrial Conglomerates - 0.77% | | | | | | | | | | | | | | | |
| General Electric Co. | | | | 2,118,600 | | | | | | | | | | 36,969,570 | |
| | | | | | | | | | | | | | | |
| | | | | | | | | | | | | | | |
| Machinery - 0.52% | | | | | | | | | | | | | | | |
| Deere & Co. | | | | 158,800 | | | | | | | | | | 24,853,788 | |
| | | | | | | | | | | | | | | |
See accompanying notes
19
American Beacon Bridgeway Large Cap Value FundSM
Schedule of Investments
December 31, 2017
| | | | | | | | | | | | | | | |
| | | Shares | | | | Fair Value |
| | | | | | | | | | | | | | | |
| COMMON STOCKS - 97.97% (continued) | | | | | | | | | | | | | | | |
| Industrials - 12.80% (continued) | | | | | | | | | | | | | | | |
| Road & Rail - 1.05% | | | | | | | | | | | | | | | |
| Norfolk Southern Corp. | | | | 344,700 | | | | | | | | | $ | 49,947,030 | |
| | | | | | | | | | | | | | | |
| | | | | | | | | | | | | | | |
Total Industrials | | | | | | | | | | | | | | 610,724,163 | |
| | | | | | | | | | | | | | | |
| | | | | | | | | | | | | | | |
| Information Technology - 10.24% | | | | | | | | | | | | | | | |
| Electronic Equipment, Instruments & Components - 1.45% | | | | | | | | | | | | | | | |
| Corning, Inc. | | | | 2,160,200 | | | | | | | | | | 69,104,798 | |
| | | | | | | | | | | | | | | |
| | | | | | | | | | | | | | | |
| IT Services - 0.58% | | | | | | | | | | | | | | | |
| Amdocs Ltd. | | | | 425,200 | | | | | | | | | | 27,842,096 | |
| | | | | | | | | | | | | | | |
| | | | | | | | | | | | | | | |
| Semiconductors & Semiconductor Equipment - 6.50% | | | | | | | | | | | | | | | |
| Intel Corp. | | | | 1,516,200 | | | | | | | | | | 69,987,792 | |
| Lam Research Corp. | | | | 328,800 | | | | | | | | | | 60,522,216 | |
| Micron Technology, Inc.A | | | | 2,185,400 | | | | | | | | | | 89,863,648 | |
| ON Semiconductor Corp.A | | | | 1,699,800 | | | | | | | | | | 35,593,812 | |
| QUALCOMM, Inc. | | | | 675,000 | | | | | | | | | | 43,213,500 | |
| Teradyne, Inc. | | | | 257,900 | | | | | | | | | | 10,798,273 | |
| | | | | | | | | | | | | | | |
| | | | | | | | | | | | | | 309,979,241 | |
| | | | | | | | | | | | | | | |
| | | | | | | | | | | | | | | |
| Technology Hardware, Storage & Peripherals - 1.71% | | | | | | | | | | | | | | | |
| Western Digital Corp. | | | | 495,800 | | | | | | | | | | 39,430,974 | |
| Xerox Corp. | | | | 1,454,675 | | | | | | | | | | 42,403,776 | |
| | | | | | | | | | | | | | | |
| | | | | | | | | | | | | | 81,834,750 | |
| | | | | | | | | | | | | | | |
| | | | | | | | | | | | | | | |
Total Information Technology | | | | | | | | | | | | | | 488,760,885 | |
| | | | | | | | | | | | | | | |
| | | | | | | | | | | | | | | |
| Materials - 4.07% | | | | | | | | | | | | | | | |
| Chemicals - 3.57% | | | | | | | | | | | | | | | |
| DowDuPont, Inc. | | | | 673,500 | | | | | | | | | | 47,966,670 | |
| Eastman Chemical Co. | | | | 502,700 | | | | | | | | | | 46,570,128 | |
| LyondellBasell Industries N.V., Class A | | | | 689,300 | | | | | | | | | | 76,043,576 | |
| | | | | | | | | | | | | | | |
| | | | | | | | | | | | | | 170,580,374 | |
| | | | | | | | | | | | | | | |
| | | | | | | | | | | | | | | |
| Containers & Packaging - 0.50% | | | | | | | | | | | | | | | |
| Avery Dennison Corp. | | | | 207,200 | | | | | | | | | | 23,798,992 | |
| | | | | | | | | | | | | | | |
| | | | | | | | | | | | | | | |
Total Materials | | | | | | | | | | | | | | 194,379,366 | |
| | | | | | | | | | | | | | | |
| | | | | | | | | | | | | | | |
| Real Estate - 0.63% | | | | | | | | | | | | | | | |
| Equity Real Estate Investment Trusts (REITs) - 0.63% | | | | | | | | | | | | | | | |
| Gaming and Leisure Properties, Inc. | | | | 813,006 | | | | | | | | | | 30,081,222 | |
| | | | | | | | | | | | | | | |
| | | | | | | | | | | | | | | |
| Telecommunication Services - 0.93% | | | | | | | | | | | | | | | |
| Diversified Telecommunication Services - 0.93% | | | | | | | | | | | | | | | |
| CenturyLink, Inc. | | | | 2,674,500 | | | | | | | | | | 44,610,660 | |
| | | | | | | | | | | | | | | |
| | | | | | | | | | | | | | | |
| Utilities - 4.83% | | | | | | | | | | | | | | | |
| Electric Utilities - 1.88% | | | | | | | | | | | | | | | |
| NextEra Energy, Inc. | | | | 304,100 | | | | | | | | | | 47,497,379 | |
| PG&E Corp. | | | | 158,600 | | | | | | | | | | 7,110,038 | |
| PPL Corp. | | | | 1,140,200 | | | | | | | | | | 35,289,190 | |
| | | | | | | | | | | | | | | |
| | | | | | | | | | | | | | 89,896,607 | |
| | | | | | | | | | | | | | | |
| | | | | | | | | | | | | | | |
| Multi-Utilities - 2.95% | | | | | | | | | | | | | | | |
| Ameren Corp. | | | | 737,100 | | | | | | | | | | 43,481,529 | |
| DTE Energy Co. | | | | 415,600 | | | | | | | | | | 45,491,576 | |
See accompanying notes
20
American Beacon Bridgeway Large Cap Value FundSM
Schedule of Investments
December 31, 2017
| | | | | | | | | | | | | | | |
| | | Shares | | | | Fair Value |
| | | | | | | | | | | | | | | |
| COMMON STOCKS - 97.97% (continued) | | | | | | | | | | | | | | | |
| Utilities - 4.83% (continued) | | | | | | | | | | | | | | | |
| Multi-Utilities - 2.95% (continued) | | | | | | | | | | | | | | | |
| Sempra Energy | | | | 484,600 | | | | | | | | | $ | 51,813,432 | |
| | | | | | | | | | | | | | | |
| | | | | | | | | | | | | | 140,786,537 | |
| | | | | | | | | | | | | | | |
| | | | | | | | | | | | | | | |
Total Utilities | | | | | | | | | | | | | | 230,683,144 | |
| | | | | | | | | | | | | | | |
| | | | | | | | | | | | | | | |
Total Common Stocks (Cost $3,906,923,100) | | | | | | | | | | | | | | 4,675,432,471 | |
| | | | | | | | | | | | | | | |
| | | | | | | | | | | | | | | |
| SHORT-TERM INVESTMENTS - 2.18% (Cost $104,213,767) | | | | | | | | | | | | | | | |
| Investment Companies - 2.18% | | | | | | | | | | | | | | | |
| American Beacon U.S. Government Money Market Select Fund, Select Class, 1.13%B C | | | | 104,213,767 | | | | | | | | | | 104,213,767 | |
| | | | | | | | | | | | | | | |
| | | | | | | | | | | | | | | |
TOTAL INVESTMENTS - 100.15% (Cost $4,011,136,867) | | | | | | | | | | | | | | 4,779,646,238 | |
LIABILITIES, NET OF OTHER ASSETS - (0.15%) | | | | | | | | | | | | | | (7,168,827 | ) |
| | | | | | | | | | | | | | | |
TOTAL NET ASSETS - 100.00% | | | | | | | | | | | | | $ | 4,772,477,411 | |
| | | | | | | | | | | | | | | |
| | | | | | | | | | | | | | | |
| Percentages are stated as a percent of net assets. | | | | | | | | | | | | | | | |
A Non-income producing security.
B The Fund is affiliated by having the same investment advisor.
C 7-day yield.
PLC - Public Limited Company.
| | | | | | | | | | | | | | | | |
| Futures Contracts Open on December 31, 2017: | |
|
| Long Futures | |
|
| Equity Futures Contracts | |
| Description | | Number of
Contracts | | Expiration Date | | Notional Amount | | | Contract Value | | | Unrealized
Appreciation
(Depreciation) | |
| S&P 500 E-Mini Index Futures | | 611 | | March 2018 | | $ | 81,886,059 | | | $ | 81,751,800 | | | $ | (134,259 | ) |
| | | | | | | | | | | | | | | | |
| | $ | 81,886,059 | | | $ | 81,751,800 | | | $ | (134,259 | ) |
| | | | | | | | | | | | | | | | |
| | |
| Index Abbreviations: |
| S&P 500 | | Standard & Poor’s U.S. Equity Large-Cap Index |
The Fund’s investments are summarized by level based on the inputs used to determine their values. As of December 31, 2017, the investments were classified as described below:
| | | | | | | | | | | | | | | | | | | | | | | | | | | | |
Bridgeway Large Cap Value Fund | | Level 1 | | | | | | Level 2 | | | | | | Level 3 | | | | | | Total | |
Assets | | | | | | | | | | | | | | | | | | | | | | | | | | | | |
Common Stocks | | $ | 4,675,432,471 | | | | | | | $ | - | | | | | | | $ | - | | | | | | | $ | 4,675,432,471 | |
Short-Term Investments | | | 104,213,767 | | | | | | | | - | | | | | | | | - | | | | | | | | 104,213,767 | |
| | | | | | | | | | | | | | | | | | | | | | | | | | | | |
Total Investments in Securities - Assets | | $ | 4,779,646,238 | | | | | | | $ | - | | | | | | | $ | - | | | | | | | $ | 4,779,646,238 | |
| | | | | | | | | | | | | | | | | | | | | | | | | | | | |
| | | | | | | |
Financial Derivative Instruments - Liabilities | | | | | | | | | | | | | | | | | | | | | | | | | | | | |
Futures Contracts | | $ | (134,259 | ) | | | | | | $ | - | | | | | | | $ | - | | | | | | | $ | (134,259 | ) |
| | | | | | | | | | | | | | | | | | | | | | | | | | | | |
Total Financial Derivative Instruments - Liabilities | | $ | (134,259 | ) | | | | | | $ | - | | | | | | | $ | - | | | | | | | $ | (134,259 | ) |
| | | | | | | | | | | | | | | | | | | | | | | | | | | | |
U.S. GAAP requires all transfers between any levels to be disclosed. The end of period timing recognition has been adopted for the transfers between levels of the Fund’s assets and liabilities. During the period ended December 31, 2017, there were no transfers between levels.
See accompanying notes
21
American Beacon FundsSM
Statements of Assets and Liabilities
December 31, 2017
| | | | | | | | | | | | |
| | | Bridgeway Large Cap
Growth Fund | | | | | | Bridgeway Large Cap
Value Fund | |
Assets: | |
Investments in unaffiliated securities, at fair value† | | $ | 255,183,901 | | | | | | | $ | 4,675,432,471 | |
Investments in affiliated securities, at fair value‡ | | | 1,441,964 | | | | | | | | 104,213,767 | |
Cash | | | – | | | | | | | | 42,987 | |
Deposit with brokers for futures contracts | | | 45,000 | | | | | | | | 2,749,500 | |
Dividends and interest receivable | | | 119,016 | | | | | | | | 7,660,035 | |
Receivable for investments sold | | | – | | | | | | | | 15,289,339 | |
Receivable for fund shares sold | | | 215,495 | | | | | | | | 9,162,113 | |
Receivable for expense reimbursement (Note 2) | | | 183,224 | | | | | | | | 1,792 | |
Receivable for variation margin on open futures contracts (Note 5) | | | 14,316 | | | | | | | | 118,143 | |
Prepaid expenses | | | 97,847 | | | | | | | | 118,544 | |
| | | | | | | | | | | | |
Total assets | | | 257,300,763 | | | | | | | | 4,814,788,691 | |
| | | | | | | | | | | | |
Liabilities: | |
Payable for investments purchased | | | – | | | | | | | | 31,504,537 | |
Payable for fund shares redeemed | | | 178,706 | | | | | | | | 6,883,680 | |
Cash due to custodian | | | 34,815 | | | | | | | | – | |
Management and sub-advisory fees payable (Note 2) | | | 175,196 | | | | | | | | 2,797,124 | |
Service fees payable (Note 2) | | | 13,109 | | | | | | | | 528,248 | |
Transfer agent fees payable (Note 2) | | | 20,648 | | | | | | | | 200,172 | |
Custody and fund accounting fees payable | | | 24,265 | | | | | | | | 218,227 | |
Professional fees payable | | | 74,888 | | | | | | | | 44,044 | |
Trustee fees payable (Note 2) | | | 11 | | | | | | | | 193 | |
Payable for prospectus and shareholder reports | | | 4,708 | | | | | | | | 106,935 | |
Other liabilities | | | 26,806 | | | | | | | | 28,120 | |
| | | | | | | | | | | | |
Total liabilities | | | 553,152 | | | | | | | | 42,311,280 | |
| | | | | | | | | | | | |
Net assets | | $ | 256,747,611 | | | | | | | $ | 4,772,477,411 | |
| | | | | | | | | | | | |
Analysis of net assets: | |
Paid-in-capital | | $ | 219,554,420 | | | | | | | $ | 3,923,463,749 | |
Undistributed net investment income | | | - | | | | | | | | (1 | ) |
Accumulated net realized gain (loss) | | | (1,767,351 | ) | | | | | | | 80,638,551 | |
Unrealized appreciation of investments in unaffiliated securitiesA | | | 38,965,964 | | | | | | | | 768,509,371 | |
Unrealized (depreciation) of futures contracts | | | (5,422 | ) | | | | | | | (134,259 | ) |
| | | | | | | | | | | | |
Net assets | | $ | 256,747,611 | | | | | | | $ | 4,772,477,411 | |
| | | | | | | | | | | | |
See accompanying notes
22
American Beacon FundsSM
Statements of Assets and Liabilities
December 31, 2017
| | | | | | | | | | | | |
| | | Bridgeway Large Cap
Growth Fund | | | | | | Bridgeway Large Cap
Value Fund | |
Shares outstanding at no par value (unlimited shares authorized): | |
Institutional Class | | | 5,960,139 | | | | | | | | 54,180,991 | |
| | | | | | | | | | | | |
Y Class | | | 67,607 | | | | | | | | 54,311,809 | |
| | | | | | | | | | | | |
Investor Class | | | 2,403,599 | | | | | | | | 48,834,761 | |
| | | | | | | | | | | | |
A Class | | | 155,767 | | | | | | | | 3,398,135 | |
| | | | | | | | | | | | |
C Class | | | 26,267 | | | | | | | | 3,712,170 | |
| | | | | | | | | | | | |
R6 ClassB | | | – | | | | | | | | 3,205,784 | |
| | | | | | | | | | | | |
Net assets: | |
Institutional Class | | $ | 178,062,388 | | | | | | | $ | 1,547,760,278 | |
| | | | | | | | | | | | |
Y Class | | $ | 2,016,161 | | | | | | | $ | 1,547,228,114 | |
| | | | | | | | | | | | |
Investor Class | | $ | 71,273,896 | | | | | | | $ | 1,387,184,369 | |
| | | | | | | | | | | | |
A Class | | $ | 4,625,607 | | | | | | | $ | 96,229,248 | |
| | | | | | | | | | | | |
C Class | | $ | 769,559 | | | | | | | $ | 102,553,616 | |
| | | | | | | | | | | | |
R6 ClassB | | $ | – | | | | | | | $ | 91,521,786 | |
| | | | | | | | | | | | |
Net asset value, offering and redemption price per share: | |
Institutional Class | | $ | 29.88 | | | | | | | $ | 28.57 | |
| | | | | | | | | | | | |
Y Class | | $ | 29.82 | | | | | | | $ | 28.49 | |
| | | | | | | | | | | | |
Investor Class | | $ | 29.65 | | | | | | | $ | 28.41 | |
| | | | | | | | | | | | |
A Class | | $ | 29.70 | | | | | | | $ | 28.32 | |
| | | | | | | | | | | | |
A Class (offering price) | | $ | 31.56 | | | | | | | $ | 30.05 | |
| | | | | | | | | | | | |
C Class | | $ | 29.30 | | | | | | | $ | 27.63 | |
| | | | | | | | | | | | |
R6 ClassB | | $ | – | | | | | | | $ | 28.55 | |
| | | | | | | | | | | | |
| | | |
† Cost of investments in unaffiliated securities | | $ | 216,217,937 | | | | | | | $ | 3,906,923,100 | |
‡ Cost of investments in affiliated securities | | $ | 1,441,964 | | | | | | | $ | 104,213,767 | |
A The Fund’s investments in affiliated securities did not have unrealized appreciation (depreciation) at year end. | |
B Class commenced operations April 28, 2017 (Note 1). | |
See accompanying notes
23
American Beacon FundsSM
Statements of Operations
For the year ended December 31, 2017
| | | | | | | | | | | | |
| | | Bridgeway Large Cap
Growth Fund | | | | | | Bridgeway Large Cap
Value Fund | |
Investment income: | |
Dividend income from unaffiliated securities | | $ | 1,773,461 | | | | | | | $ | 90,646,382 | |
Dividend income from affiliated securities | | | 47,510 | | | | | | | | 555,870 | |
Interest income | | | – | | | | | | | | 3,345 | |
Income derived from securities lending (Note 9) | | | 16,017 | | | | | | | | 87,525 | |
| | | | | | | | | | | | |
Total investment income | | | 1,836,988 | | | | | | | | 91,293,122 | |
| | | | | | | | | | | | |
Expenses: | |
Management and sub-advisory fees (Note 2) | | | 1,151,311 | | | | | | | | 28,317,045 | |
Transfer agent fees: | | | | | | | | | | | | |
Institutional Class (Note 2) | | | 102,007 | | | | | | | | 362,887 | |
Y Class (Note 2) | | | 1,082 | | | | | | | | 965,432 | |
Investor Class | | | 860 | | | | | | | | 56,641 | |
A Class | | | 143 | | | | | | | | 18,726 | |
C Class | | | 148 | | | | | | | | 8,612 | |
R6 ClassA | | | – | | | | | | | | 2,080 | |
Custody and fund accounting fees | | | 20,806 | | | | | | | | 325,714 | |
Professional fees | | | 88,241 | | | | | | | | 168,009 | |
Registration fees and expenses | | | 68,089 | | | | | | | | 242,196 | |
Service fees (Note 2): | | | | | | | | | | | | |
Y Class | | | 169 | | | | | | | | 239,065 | |
Investor Class | | | 9,646 | | | | | | | | 5,247,639 | |
A Class | | | 1,774 | | | | | | | | 165,481 | |
C Class | | | 439 | | | | | | | | 127,314 | |
Distribution fees (Note 2): | | | | | | | | | | | | |
A Class | | | 3,032 | | | | | | | | 343,980 | |
C Class | | | 3,272 | | | | | | | | 1,008,430 | |
Prospectus and shareholder report expenses | | | 40,882 | | | | | | | | 363,797 | |
Trustee fees (Note 2) | | | 9,784 | | | | | | | | 268,226 | |
Reorganization costs | | | 132,450 | | | | | | | | – | |
Other expenses | | | 9,548 | | | | | | | | 222,377 | |
| | | | | | | | | | | | |
Total expenses | | | 1,643,683 | | | | | | | | 38,453,651 | |
| | | | | | | | | | | | |
Net fees waived and expenses (reimbursed) (Note 2) | | | (375,714 | ) | | | | | | | (1,792 | ) |
| | | | | | | | | | | | |
Net expenses | | | 1,267,969 | | | | | | | | 38,451,859 | |
| | | | | | | | | | | | |
Net investment income | | | 569,019 | | | | | | | | 52,841,263 | |
| | | | | | | | | | | | |
|
Realized and unrealized gain (loss) from investments: | |
Net realized gain from: | | | | | | | | | | | | |
Investments in unaffiliated securitiesB | | | 15,320,055 | | | | | | | | 226,111,409 | |
Futures contracts | | | 581,173 | | | | | | | | 11,339,713 | |
Change in net unrealized appreciation (depreciation) of: | | | | | | | | | | | | |
Investments in unaffiliated securitiesC D | | | 19,951,560 | | | | | | | | 348,877,611 | |
Futures contracts | | | (4,140 | ) | | | | | | | 93,423 | |
| | | | | | | | | | | | |
Net gain from investments | | | 35,848,648 | | | | | | | | 586,422,156 | |
| | | | | | | | | | | | |
Net increase in net assets resulting from operations | | $ | 36,417,667 | | | | | | | $ | 639,263,419 | |
| | | | | | | | | | | | |
| |
A Class commenced operations April 28, 2017 (Note 1). | | | | |
B The Fund did not recognize net realized gains (losses) from the sale of investments in affiliated securities. | |
C The Fund’s investments in affiliated securities did not have a change in unrealized appreciation (depreciation) at year end. | |
D Change in net unrealized appreciation of investments in unaffiliated securities does not include net unrealized appreciation of investments of $6,433,434 of the Target Fund in connection with the Reorganization (Note 1). | |
See accompanying notes
24
American Beacon FundsSM
Statements of Changes in Net Assets
| | | | | | | | | | | | | | | | | | | | |
| | | Bridgeway Large Cap Growth Fund | |
| | | Year Ended
December 31, 2017 | | | | | | Six Months Ended
December 31, 2016 | | | | | | Year Ended
June 30, 2016 | |
Increase (decrease) in net assets: | |
Operations: | |
Net investment income | | $ | 569,019 | | | | | | | $ | 227,279 | | | | | | | $ | 542,052 | |
Net realized gain from investments in unaffiliated securities and futures contracts | | | 15,901,228 | | | | | | | | 4,333,737 | | | | | | | | 500,781 | |
Change in net unrealized appreciation (depreciation) of investments in unaffiliated securities and futures contracts | | | 19,947,420 | | | | | | | | 6,144,056 | | | | | | | | (8,621,100 | ) |
| | | | | | | | | | | | | | | | | | | | |
Net increase (decrease) in net assets resulting from operations | | | 36,417,667 | | | | | | | | 10,705,072 | | | | | | | | (7,578,267 | ) |
| | | | | | | | | | | | | | | | | | | | |
Distributions to shareholders: | |
Net investment income: | | | | | | | | | | | | | | | | | | | | |
Institutional Class | | | (484,349 | ) | | | | | | | (860,039 | ) | | | | | | | (775,100 | ) |
Y Class | | | (5,409 | ) | | | | | | | (4,225 | ) | | | | | | | - | |
Investor Class | | | (191,071 | ) | | | | | | | (2,556 | ) | | | | | | | - | |
A Class | | | (9,014 | ) | | | | | | | (872 | ) | | | | | | | - | |
C Class | | | - | | | | | | | | (1,137 | ) | | | | | | | - | |
Net realized gain from investments: | | | | | | | | | | | | | | | | | | | | |
Institutional Class | | | (6,720,047 | ) | | | | | | | - | | | | | | | | - | |
Y Class | | | (75,954 | ) | | | | | | | - | | | | | | | | - | |
Investor Class | | | (2,741,957 | ) | | | | | | | - | | | | | | | | - | |
A Class | | | (173,903 | ) | | | | | | | - | | | | | | | | - | |
C Class | | | (29,746 | ) | | | | | | | - | | | | | | | | - | |
| | | | | | | | | | | | | | | | | | | | |
Net distributions to shareholders | | | (10,431,450 | ) | | | | | | | (868,829 | ) | | | | | | | (775,100 | ) |
| | | | | | | | | | | | | | | | | | | | |
|
Capital share transactions (Note 11): | |
Proceeds from sales of shares | | | 21,584,214 | | | | | | | | 9,041,296 | | | | | | | | 39,701,829 | |
Reinvestment of dividends and distributions | | | 10,260,437 | | | | | | | | 841,538 | | | | | | | | 753,120 | |
Issued in reorganization | | | 89,545,160 | | | | | | | | - | | | | | | | | - | |
Cost of shares redeemed | | | (25,647,762 | ) | | | | | | | (22,099,149 | ) | | | | | | | (51,195,470 | ) |
| | | | | | | | | | | | | | | | | | | | |
Net increase (decrease) in net assets from capital share transactions | | | 95,742,049 | | | | | | | | (12,216,315 | ) | | | | | | | (10,740,521 | ) |
| | | | | | | | | | | | | | | | | | | | |
Net increase (decrease) in net assets | | | 121,728,266 | | | | | | | | (2,380,072 | ) | | | | | | | (19,093,888 | ) |
| | | | | | | | | | | | | | | | | | | | |
Net assets: | |
Beginning of period | | | 135,019,345 | | | | | | | | 137,399,417 | | | | | | | | 156,493,305 | |
| | | | | | | | | | | | | | | | | | | | |
End of period * | | $ | 256,747,611 | | | | | | | $ | 135,019,345 | | | | | | | $ | 137,400,411 | |
| | | | | | | | | | | | | | | | | | | | |
*Includes undistributed (overdistribution of) net investment income | | $ | - | | | | | | | $ | 4,804 | | | | | | | $ | 305,886 | |
| | | | | | | | | | | | | | | | | | | | |
See accompanying notes
25
American Beacon FundsSM
Statements of Changes in Net Assets
| | | | | | | | | | | | |
| | | Bridgeway Large Cap Value Fund | |
| | | Year Ended
December 31, 2017 | | | | | | Year Ended
December 31, 2016 | |
Increase (decrease) in net assets: | |
Operations: | |
Net investment income | | $ | 52,841,263 | | | | | | | $ | 45,078,090 | |
Net realized gain from investments in unaffiliated securities and futures contracts | | | 237,451,122 | | | | | | | | 70,985,632 | |
Change in net unrealized appreciation of investments in unaffiliated securities and futures contracts | | | 348,971,034 | | | | | | | | 383,878,468 | |
| | | | | | | | | | | | |
Net increase in net assets resulting from operations | | | 639,263,419 | | | | | | | | 499,942,190 | |
| | | | | | | | | | | | |
Distributions to shareholders: | |
Net investment income: | | | | | | | | | | | | |
Institutional Class | | | (20,161,179 | ) | | | | | | | (15,314,069 | ) |
Y Class | | | (19,084,760 | ) | | | | | | | (10,949,276 | ) |
Investor Class | | | (13,087,732 | ) | | | | | | | (16,243,795 | ) |
A Class | | | (742,378 | ) | | | | | | | (1,480,352 | ) |
C Class | | | (248,713 | ) | | | | | | | (320,550 | ) |
R6 ClassA | | | (992,942 | ) | | | | | | | – | |
Net realized gain from investments: | | | | | | | | | | | | |
Institutional Class | | | (66,124,077 | ) | | | | | | | (1,014,762 | ) |
Y Class | | | (65,433,464 | ) | | | | | | | (761,516 | ) |
Investor Class | | | (59,258,862 | ) | | | | | | | (1,387,328 | ) |
A Class | | | (4,128,443 | ) | | | | | | | (137,125 | ) |
C Class | | | (4,510,939 | ) | | | | | | | (91,127 | ) |
R6 ClassA | | | (3,198,781 | ) | | | | | | | – | |
| | | | | | | | | | | | |
Net distributions to shareholders | | | (256,972,270 | ) | | | | | | | (47,699,900 | ) |
| | | | | | | | | | | | |
|
Capital share transactions (Note 11): | |
Proceeds from sales of shares | | | 1,914,217,676 | | | | | | | | 2,035,885,045 | |
Reinvestment of dividends and distributions | | | 246,592,299 | | | | | | | | 45,900,960 | |
Cost of shares redeemed | | | (1,672,312,273 | ) | | | | | | | (939,299,165 | ) |
| | | | | | | | | | | | |
Net increase in net assets from capital share transactions | | | 488,497,702 | | | | | | | | 1,142,486,840 | |
| | | | | | | | | | | | |
Net increase in net assets | | | 870,788,851 | | | | | | | | 1,594,729,130 | |
| | | | | | | | | | | | |
Net assets: | |
Beginning of period | | | 3,901,688,560 | | | | | | | | 2,306,959,430 | |
| | | | | | | | | | | | |
End of period * | | $ | 4,772,477,411 | | | | | | | $ | 3,901,688,560 | |
| | | | | | | | | | | | |
*Includes undistributed net investment income | | $ | (1 | ) | | | | | | $ | 257,260 | |
| | | | | | | | | | | | |
| | | |
A Class commenced operations April 28, 2017 (Note 1). | | | | | | | | | | | | |
See accompanying notes
26
American Beacon FundsSM
Notes to Financial Statements
December 31, 2017
1. Organization and Significant Accounting Policies
American Beacon Funds (the “Trust”), is organized as a Massachusetts business trust. The Funds, each a series within the Trust, are registered under the Investment Company Act of 1940 (the “Act”), as amended, as diversified, open-end management investment companies. As of December 31, 2017, the Trust consists of thirty-three active series, two of which are presented in this filing: American Beacon Bridgeway Large Cap Growth Fund and American Beacon Bridgeway Large Cap Value Fund (collectively, the “Funds” and each individually a “Fund”). The remaining thirty-one active series are reported in separate filings.
American Beacon Advisors, Inc. (the “Manager”) is a wholly-owned subsidiary of Resolute Investment Managers, Inc., which is indirectly owned by investment funds affiliated with Kelso & Company, L.P. and Estancia Capital Management, LLC, and was organized in 1986 to provide business management, advisory, administrative, and asset management consulting services to the Trust and other investors.
Fund Reorganization
On September 20, 2017, the Trust’s Board of Trustees (the “Board”) approved an interim investment advisory agreement among the Manager, Bridgeway Capital Management, Inc. (“Bridgeway”) and the Trust, on behalf of the American Beacon Holland Large Cap Growth Fund (the “Holland Fund”), pursuant to which Bridgeway was appointed as the Fund’s interim sub-advisor. The Board also approved the Holland Fund’s name change to the American Beacon Bridgeway Large Cap Growth II Fund (the “Target Fund”) with an effective date of September 27, 2017.
At a special meeting held on September 29, 2017, the Board approved a Plan of Reorganization and Termination (the “Plan”) to reorganize the Target Fund into the American Beacon Bridgeway Large Cap Growth Fund (the “Acquiring Fund”), another series of the Trust (the “Reorganization”). Shareholders for the Target Fund approved the Plan at a special meeting on December 14, 2017. On December 15, 2017, pursuant to the Plan, the Target Fund transferred all of its property and assets to the Acquiring Fund in exchange solely for voting shares of the Acquiring Fund and the assumption all of the Target Fund’s liabilities. The Target Fund’s shareholders received a pro rata portion of the Acquiring Fund’s shares in exchange for their shares therein and in liquidation and termination of the Target Fund. Class shares outstanding, net assets applicable to each class and NAV per share outstanding immediately before the Reorganization were as follows:
| | | | | | | | | | | | | | | | | | | | | | | | | | | | | | |
Target Fund
Class Prior to
Reorganization | | Target Fund
Shares
Outstanding
Prior to
Reorganization | | | Target Fund
Net Assets
Prior to
Reorganization | | | Target Fund
NAV Per Share
Prior to
Reorganization | | | Acquiring Fund
Class Prior to
Reorganization | | Acquiring
Fund Shares
Outstanding
Prior to
Reorganization | | | Acquiring
Fund Net
Assets Prior to
Reorganization | | | Acquiring
Fund NAV Per
Share Prior to
Reorganization | | | Exchange
Ratio1 | |
Institutional | | | 935,977 | | | $ | 17,375,798 | | | $ | 18.56 | | | Institutional | | | 5,175,336 | | | $ | 160,531,441 | | | $ | 31.02 | | | | 0.598 | |
Y | | | 8,504 | | | | 156,423 | | | | 18.39 | | | Y | | | 57,691 | | | | 1,786,421 | | | | 30.97 | | | | 0.594 | |
Investor | | | 3,932,636 | | | | 70,337,259 | | | | 17.88 | | | Investor | | | 58,545 | | | | 1,802,844 | | | | 30.79 | | | | 0.581 | |
A | | | 76,305 | | | | 1,344,061 | | | | 17.61 | | | A | | | 105,063 | | | | 3,237,862 | | | | 30.82 | | | | 0.572 | |
C | | | 20,630 | | | | 331,620 | | | | 16.07 | | | C | | | 14,486 | | | | 439,929 | | | | 30.37 | | | | 0.529 | |
1 Calculated by dividing the NAV of the Target Fund by the NAV of the Acquiring Fund on Reorganization date.
Class shares outstanding, net assets applicable to each class and NAV per share outstanding immediately after the Reorganization were as follows:
| | | | | | | | | | | | |
Acquiring Fund Class – After Reorganization | | Shares
Outstanding | | | Net Assets | | | NAV Per Share | |
Institutional | | | 5,735,484 | | | $ | 177,907,239 | | | $ | 31.02 | |
Y | | | 62,742 | | | | 1,942,844 | | | | 30.97 | |
Investor | | | 2,342,964 | | | | 72,140,103 | | | | 30.79 | |
A | | | 148,673 | | | | 4,581,922 | | | | 30.82 | |
C | | | 25,406 | | | | 771,549 | | | | 30.37 | |
27
American Beacon FundsSM
Notes to Financial Statements
December 31, 2017
The Reorganization was structured to qualify as a tax-free reorganization under the Internal Revenue Code for federal income tax purposes. As such, the Target Fund’s shareholders recognized no gain or loss for federal income tax purposes. Prior to the closing of the Reorganization, the Target Fund distributed all of its net investment income and capital gains to shareholders of record on December 12, 2017. Such a distribution may be taxable to the Target Fund’s shareholders for federal income tax purposes.
The cost, fair value and net unrealized appreciation (depreciation) of the investments of the Target Fund as of the date of Reorganization, were as follows:
| | | | |
Target Fund – Prior to Reorganization | |
Cost of investments | | $ | 90,026,157 | |
Fair value of investments | | | 96,459,591 | |
Net unrealized appreciation of investments | | | 6,433,434 | |
For financial reporting purposes, assets received and shares issued by the Acquiring Fund were recorded at fair value; however, the cost basis of the investments received from the Target Fund was carried forward to align ongoing reporting of the Acquiring Fund’s realized and unrealized gains and losses with the amount distributable to shareholders for tax purposes.
Assuming the Reorganization had been completed on January 1, 2017, the beginning of the Acquiring Fund’s current fiscal period, the pro forma results of operations for the current fiscal period would have been as follows:
| | | | |
Acquiring Fund – Pro Forma Results from Operations | |
Net investment income | | $ | 642,575 | |
Net realized and unrealized gains | | | 83,122,703 | |
Change in net assets resulting in operations | | | 83,765,279 | |
Because the combined investment portfolios for the Reorganization have been managed as a single integrated portfolio since the Reorganization was completed, it is not practicable to separate the amounts of revenue and earnings of the Target Fund that have been included in the Statements of Operations for the Acquiring Fund since the Reorganization was consummated.
In connection with the Reorganization, the Acquiring Fund incurred certain associated expenses. Such amounts were included as components of “Other liabilities” on the Statements of Assets and Liabilities and “Reorganization costs” on the Statements of Operations.
Class Disclosure
On April, 28, 2017, the Bridgeway Large Cap Value Fund created the R6 Class, a new class made available for sale to retirement plans pursuant to an amendment to the Fund’s registrations statement filed with the U.S. Securities and Exchange Commission. Refer to the Fund’s prospectus for more details.
28
American Beacon FundsSM
Notes to Financial Statements
December 31, 2017
Each Fund has multiple classes of shares designed to meet the needs of different groups of investors; however, not all of the Funds offer all classes. The following table sets forth the differences amongst the classes:
| | | | | | |
Class | | Eligible Investors | | Minimum Initial
Investments | |
| Institutional | | Large institutional investors - sold directly or through intermediary channels. | | $ | 250,000 | |
| Y Class | | Large institutional retirement plan investors - sold directly or through intermediary channels. | | $ | 100,000 | |
| Investor | | All investors using intermediary organizations, such as broker-dealers or retirement plan sponsors. | | $ | 2,500 | |
| A Class | | All investors who invest through intermediary organizations, such as broker-dealers or third party administrator. Retail investors who invest directly through a financial intermediary such as a broker, bank, or registered investment advisor which may include a front-end sales charge and a contingent deferred sales charge (“CDSC”). | | $ | 2,500 | |
| C Class | | Retail investors who invest directly through a financial intermediary, such as a broker or through employee directed benefit plans with applicable sales charges which may include CDSC. | | $ | 1,000 | |
| R6 | | Large institutional retirement plan investors - sold through retirement plan sponsors. | | | None | |
Each class offered by the Trust has equal rights as to assets and voting privileges. Income and non-class specific expenses are allocated daily to each class on the basis of the relative net assets. Realized and unrealized capital gains and losses of each class are allocated daily based on the relative net assets of each class of the respective Fund. Class specific expenses, where applicable, currently include service, distribution, and sub-transfer agent fees that vary amongst the classes as described more fully in Note 2.
Recently Adopted Accounting Pronouncements
In October 2016, the SEC adopted amendments to rules under the Investment Company Act of 1940 (“final rules”) intended to modernize the reporting and disclosure of information by registered investment companies. The final rules amend Regulation S-X and require funds to provide standardized, enhanced derivative disclosure in fund financial statements in a format designed for individual investors. The amendments to Regulation S-X also update the disclosures for other investments and investments in and advances to affiliates and amend the rules regarding the general form and content of fund financial statements. The compliance date for the amendments to Regulation S-X is August 1, 2017, and has been adopted accordingly.
Significant Accounting Policies
The following is a summary of significant accounting policies, consistently followed by the Funds in preparation of the financial statements. The Funds are considered investment companies and accordingly, follow the investment company accounting and reporting guidance of the Financial Accounting Standards Board Accounting Standard Codification Topic 946, Financial Services – Investment Companies, a part of Generally Accepted Accounting Principles (“U.S. GAAP”).
Security Transactions and Investment Income
Security transactions are recorded on the trade date of the security purchase or sale. The Funds may purchase securities with delivery or payment to occur at a later date. At the time the Funds enter into a commitment to purchase a security, the transaction is recorded, and the value of the security is reflected in the Net Asset Value (“NAV”). The value of the security may vary with market fluctuations.
Dividend income, net of foreign taxes, is recorded on the ex-dividend date, except certain dividends from foreign securities which are recorded as soon as the information is available to the Funds. Interest income is
29
American Beacon FundsSM
Notes to Financial Statements
December 31, 2017
earned from settlement date, recorded on the accrual basis, and adjusted, if necessary, for accretion of discounts and amortization of premiums. For financial and tax reporting purposes, realized gains and losses are determined on the basis of specific lot identification.
Distributions to Shareholders
Distributions, if any, of net investment income are generally paid at least annually and recorded on the ex-dividend date. Distributions, if any, of net realized capital gains are generally paid at least annually and recorded on the ex-dividend date. Dividends to shareholders are determined in accordance with federal income tax regulations, which may differ in amount and character from net investment income and realized gains recognized for purposes of U.S. GAAP. To the extent necessary to fully distribute capital gains, the Fund may designate earnings and profits distributed to shareholders on the redemption of shares.
Commission Recapture
The Funds have established brokerage commission recapture arrangements with certain brokers or dealers. If a Funds’ investment advisor chooses to execute a transaction through a participating broker, the broker rebates a portion of the commission back to the Funds. Any collateral benefit received through participation in the commission recapture program is directed exclusively to the Funds. This amount is reported with the net realized gain in the Funds’ Statements of Operations, if applicable.
Allocation of Income, Trust Expenses, Gains, and Losses
Investment income, realized and unrealized gains and losses from investments of the Funds are allocated daily to each class of shares based upon the relative proportion of net assets of each class to the total net assets of the Funds. Expenses directly charged or attributable to any Fund will be paid from the assets of the Fund. Generally, expenses of the Trust will be allocated among and charged to the assets of the Funds on a basis that the Trust’s Board of Trustees (the “Board”) deems fair and equitable, which may be based on the relative net assets of the Funds or nature of the services performed and relative applicability to the Funds.
Use of Estimates
The preparation of financial statements in conformity with U.S. GAAP requires management to make estimates and assumptions that affect the amounts reported in the financial statements and accompanying notes. Actual results may differ from those estimated.
Other
Under the Trust’s organizational documents, its officers and trustees are indemnified against certain liabilities arising out of the performance of their duties to the Trust. In the normal course of business, the Trust enters into contracts that provide indemnification to the other party or parties against potential costs or liabilities. The Trust’s maximum exposure under these arrangements is dependent on claims that may be made in the future and, therefore, cannot be estimated. The Trust has had no prior claims or losses pursuant to any such agreement.
30
American Beacon FundsSM
Notes to Financial Statements
December 31, 2017
2. Transactions with Affiliates
Management and Investment Sub-Advisory Agreements
The Funds and the Manager are parties to a Management Agreement that obligates the Manager to provide the Funds with investment advisory and administrative services. As compensation for performing the duties under the Management Agreement, the Manager will receive an annualized management fee based on a percentage of the Funds’ average daily net assets that is calculated and accrued daily according to the following schedule:
| | | | |
First $5 billion | | | 0.35 | % |
Next $5 billion | | | 0.325 | % |
Next $10 billion | | | 0.30 | % |
Over $20 billion | | | 0.275 | % |
The Trust, on behalf of the Funds, and the Manager have entered into an Investment Advisory Agreements with Bridgeway Capital Management, Inc. (the “Sub-Advisor”) pursuant to which each Fund has agreed to pay an annualized sub-advisory fee that is calculated and accrued daily based on the Fund’s average daily net assets according to the following schedule:
| | | | |
First $250 million | | | 0.40 | % |
Next $250 million | | | 0.35 | % |
Over $500 million | | | 0.30 | % |
The Management and Sub-Advisory Fees paid by the Fund for the year ended December 31, 2017 were as follows:
Bridgeway Large Cap Growth Fund
| | | | | | | | |
| | | Effective Fee Rate | | | Amount of Fees Paid | |
Management Fees | | | 0.35 | % | | $ | 537,497 | |
Sub-Advisor Fees | | | 0.40 | % | | | 613,814 | |
| | | | | | | | |
Total | | | 0.75 | % | | $ | 1,151,311 | |
| | | | | | | | |
Bridgeway Large Cap Value Fund
| | | | | | | | |
| | | Effective Fee Rate | | | Amount of Fees Paid | |
Management Fees | | | 0.35 | % | | $ | 15,050,205 | |
Sub-Advisor Fees | | | 0.32 | % | | | 13,266,840 | |
| | | | | | | | |
Total | | | 0.67 | % | | $ | 28,317,045 | |
| | | | | | | | |
As compensation for services provided by the Manager in connection with securities lending activities conducted by the Funds, the lending Fund pays to the Manager, with respect to cash collateral posted by borrowers, a fee up to 10% of the net monthly interest income (the gross interest income earned by the investment of cash collateral, less the amount paid to borrowers and related expenses) from such activities and, with respect to loan fees paid by borrowers, a fee up to 10% of such loan fees. These fees are included in “Income derived from securities lending” and “Management and investment advisory fees” on the Statements of Operations. During the year ended December 31, 2017, the Manager received securities lending fees of $1,983 and $9,727 for the securities lending activities of the Bridgeway Large Cap Growth Fund and Bridgeway Large Cap Value Fund, respectively.
31
American Beacon FundsSM
Notes to Financial Statements
December 31, 2017
Distribution Plans
The Funds, except for the A and C Classes of the Funds, have adopted a “defensive” Distribution Plan (the “Plan”) in accordance with Rule 12b-1 under the Act, pursuant to which no separate fees may be charged to the Funds for distribution purposes. However, the Plan authorizes the management fee received by the Manager and the investment advisors hired by the Manager to be used for distribution purposes. Under this Plan, the Funds do not intend to compensate the Manager or any other party, either directly or indirectly, for the distribution of Fund shares.
Separate Distribution Plans (the “Distribution Plans”) have been adopted pursuant to Rule 12b-1 under the Act for the A and C Classes of the Funds. Under the Distribution Plans, as compensation for distribution assistance, the Manager receives an annual fee of 0.25% of the average daily net assets of the A Class and 1.00% of the average daily net assets of the C Class. The fee will be payable without regard to whether the amount of the fee is more or less than the actual expenses incurred in a particular month by the Manager for distribution assistance.
Service Plans
The Manager and the Trust entered into Service Plans that obligate the Manager to oversee additional shareholder servicing of the Y, Investor, A, and C Classes of the Funds. As compensation for performing the duties required under the Service Plans, the Manager receives an annualized fee up to 0.10% of the average daily net assets of the Y Class, up to 0.25% of the average daily net assets of the A and C Classes, and up to 0.375% of the average daily net assets of the Investor Class of the Funds. Effective April 1, 2017, the Funds terminated the Service Plan for the Y Class. During the year ended December 31, 2017 the Manager voluntarily reimbursed service fees to the A and C classes of the Bridgeway Large Cap Growth Fund in the amounts of $1,741 and $554, respectively. The Manager also voluntarily reimbursed service fees to the A and C classes of the Bridgeway Large Cap Value Fund in the amounts of $40,907 and $23,951, respectively.
Sub-Transfer Agent Fees
The Manager has entered into agreements, which include servicing agreements, with financial intermediaries that provide recordkeeping, processing, shareholder communications and other services to customers of the intermediaries that hold positions in the Institutional Class of the Funds and has agreed to compensate the intermediaries for providing these services. Effective April 1, 2017, the Funds agreed to compensate the intermediaries for providing services to the Y Class. Intermediaries transact with the Funds primarily through the use of omnibus accounts on behalf of their customers who hold positions in the Funds. Certain services would have been provided by the Funds’ transfer agent and other service providers if the shareholders’ accounts were maintained directly by the Funds’ transfer agent. Accordingly, the Funds, pursuant to the Board approval, have agreed to reimburse the Manager for certain non-distribution shareholder services provided by financial intermediaries for the Institutional and Y Classes. The reimbursement amounts (sub-transfer agent fees) paid to the Manager are subject to a fee limit of up to 0.10% of an intermediary’s average net assets in the Institutional and Y Classes on an annual basis. During the year ended December 31, 2017, the sub-transfer agent fees, as reflected in “Transfer agent fees” on the Statements of Operations, were as follows:
| | | | |
Fund | | Sub-Transfer Agent Fees | |
Bridgeway Large Cap Growth | | $ | 79,782 | |
Bridgeway Large Cap Value | | | 1,202,755 | |
As of December 31, 2017, the Funds owed the Manager the following reimbursement of sub-transfer agent fees, as reflected in “Transfer agent fees payable” on the Statements of Assets and Liabilities:
| | | | |
Fund | | Reimbursement
Sub-Transfer Agent Fees | |
Bridgeway Large Cap Growth | | $ | 7,813 | |
Bridgeway Large Cap Value | | | 158,429 | |
32
American Beacon FundsSM
Notes to Financial Statements
December 31, 2017
During the year ended December 31, 2017, the Manager voluntarily reimbursed sub-transfer agent fees to the Y Class of the Bridgeway Large Cap Value Fund in the amount of $21,735.
Investments in Affiliated Funds
The Funds may invest in the American Beacon U.S. Government Money Market Select Fund (the “USG Select Fund”). Cash collateral received by the Funds in connection with securities lending may also be invested in the USG Select Fund. The Funds and the USG Select Fund have the same investment advisor and therefore, are considered to be affiliated. The Manager serves as investment advisor to the USG Select Fund and receives management fees and administrative fees totaling 0.10% of the average daily net assets of the USG Select Fund. During the year ended December 31, 2017, the Manager earned fees on the Funds’ direct investments and securities lending collateral investments in the USG Select Fund as shown below:
| | | | | | | | | | | | |
Fund | | Direct Investments in
USG Select Fund | | | Securities Lending
Collateral in USG
Select Fund | | | Total | |
Bridgeway Large Cap Growth | | $ | 3,012 | | | $ | 1,607 | | | $ | 4,619 | |
Bridgeway Large Cap Value | | | 69,897 | | | | 36,273 | | | | 106,170 | |
Interfund Credit Facility
Pursuant to an exemptive order issued by the Securities and Exchange Commission (“SEC”), the Funds, along with other registered investment companies having management contracts with the Manager, may participate in a credit facility whereby each Fund, under certain conditions, is permitted to lend money directly to and borrow directly from other participating Funds for temporary purposes. The interfund credit facility is advantageous to the Funds because it provides added liquidity, and eliminates the need to maintain higher cash balances to meet redemptions. This situation could arise when shareholder redemptions exceed anticipated volumes and certain funds have insufficient cash on hand to satisfy such redemptions or when sales of securities do not settle as expected, resulting in a cash shortfall for a fund. When a Fund liquidates portfolio securities to meet redemption requests, they often do not receive payment in settlement for up to three days (or longer for certain foreign transactions). Redemption requests normally are satisfied on the next business day. The credit facility provides a source of immediate, short-term liquidity pending settlement of the sale of portfolio securities. The credit facility is administered by a credit facility team consisting of professionals from the Manager’s asset management, compliance, and accounting areas who report the activities of the credit facility to the Board. During the year ended December 31, 2017, the Bridgeway Large Cap Growth Fund borrowed on average $2,949,958 for 2 days at an average interest rate of 2.00% with interest charges of $323. This amount is included in “Other expenses” on the Statements of Operations. For the year ended December 31, 2017, the Bridgeway Large Cap Value Fund did not utilize the credit facility.
Expense Reimbursement Plan
The Manager contractually agreed to reduce fees and/or reimburse expenses for the classes of the Funds to the extent that total operating expenses exceed the Funds’ expense cap. During the year ended December 31, 2017, the Manager waived and/or reimbursed expenses as follows:
| | | | | | | | | | | | | | | | | | |
| | | | | Expense Cap | | | | | | | | | | |
Fund | | Class | | 1/1/2017 -
12/31/2017 | | | Reimbursed
Expenses | | | (Recouped)
Expenses | | | Expiration of
Reimbursed
Expenses | |
Bridgeway Large Cap Growth | | Institutional | | | 0.81 | % | | $ | 327,896 | | | $ | – | | | | 2020 | |
Bridgeway Large Cap Growth | | Y | | | 0.91 | % | | | 2,236 | | | | – | | | | 2020 | |
Bridgeway Large Cap Growth | | Investor | | | 1.19 | % | | | 40,918 | | | | – | | | | 2020 | |
Bridgeway Large Cap Growth | | A | | | 1.21 | % | | | 3,844 | | | | – | | | | 2020 | |
Bridgeway Large Cap Growth | | C | | | 1.96 | % | | | 820 | | | | – | | | | 2020 | |
Bridgeway Large Cap Value | | R6 | | | 0.71 | %(1) | | | 1,792 | | | | – | | | | 2020 | |
(1) Voluntary expense cap.
33
American Beacon FundsSM
Notes to Financial Statements
December 31, 2017
Of these amounts, $183,224 and $1,792 were disclosed as a receivable from the Manager on the Statements of Assets and Liabilities at December 31, 2017 for the Bridgeway Large Cap Growth Fund and Bridgeway Large Cap Value Fund, respectively.
The Funds have adopted an Expense Reimbursement Plan whereby the Manager may seek repayment of such fee reductions and expense reimbursements. Under the policy, the Manager can be reimbursed by the Funds for any contractual or voluntary fee reductions or expense reimbursements if reimbursement to the Manager (a) occurs within three years after the Manager’s own waiver or reimbursement and (b) does not cause the Funds’ annual operating expenses to exceed the lesser of the contractual percentage limit in effect at the time of the waiver/reimbursement or time of recoupment. The reimbursed expenses listed above will expire in 2020. The Funds did not record a liability for potential reimbursements due to the current assessment that reimbursements are unlikely. The carryover of excess expenses potentially reimbursable to the Manager are as follows:
| | | | | | | | | | | | | | | | |
Fund | | Recovered
Expenses | | | Excess Expense
Carryover | | | Expired Expense
Carryover | | | Expiration of
Reimbursed
Expenses | |
Bridgeway Large Cap Growth | | $ | – | | | $ | 238,079 | | | $ | – | | | | 2019 | |
Sales Commissions
The Funds’ distributor, Foreside Fund Services, LLC (“Foreside”), may receive a portion of A Class sales charges from broker dealers and it may be used to offset distribution related expenses. During the year ended December 31, 2017, Foreside collected $1,871 and $38,306 in sales commissions for Bridgeway Large Cap Growth Fund and Bridgeway Large Cap Value Fund, respectively, from the sale of Class A Shares.
A CDSC of 0.50% will be deducted with respect to Class A Shares on certain purchases of $1,000,000 or more that are redeemed in whole or part within 18 months of purchase, unless waived as discussed in the Funds’ Prospectus. Any applicable CDSC will be 0.50% of the lesser of the original purchase price or the value of the redemption of the Class A Shares redeemed. During the year ended December 31, 2017, CDSC fees of $193 were collected for Class A Shares of the Bridgeway Large Cap Value Fund. There were no CDSC fees collected for Class A Shares of the Bridgeway Large Cap Growth Fund.
A CDSC of 1.00% will be deducted with respect to Class C Shares redeemed within 12 months of purchase, unless waived as discussed in the Funds’ Prospectus. Any applicable CDSC will be 1.00% of the lesser of the original purchase price or the value of the redemption of the Class C Shares redeemed. During the year ended December 31, 2017, CDSC fees of $20 and $14,217 were collected for Class C Shares of the Bridgeway Large Cap Growth Fund and Bridgeway Large Cap Value Fund, respectively.
Trustee Fees and Expenses
As compensation for their service to the Trust, the American Beacon Select Funds and the American Beacon Institutional Funds Trust, each Trustee receives an annual retainer of $120,000, plus $10,000 for each Board meeting attended in person or via teleconference, $2,500 for attendance by Committee members at meetings of the Audit Committee and the Investment Committee, and $1,500 for attendance by Committee members at meetings of the Nominating and Governance Committee, plus reimbursement of reasonable expenses incurred in attending Board meetings, Committee meetings, and relevant educational seminars. The Trustees also may be compensated for attendance at special Board and/or Committee meetings from time to time. The Board Chairman receives an additional annual retainer of $50,000 as well as a single $10,000 fee each quarter for his attendance at the committee meetings. The Chairpersons of the Audit Committee and the Investment Committee each receive an additional annual retainer of $25,000 and the Chairman of the Nominating and Governance Committee receives an additional annual retainer of $10,000. These expenses are allocated on a prorated basis to each Fund of the Trusts according to its respective net assets.
34
American Beacon FundsSM
Notes to Financial Statements
December 31, 2017
3. Security Valuation and Fair Value Measurements
Investments are valued at the close of the New York Stock Exchange (the “Exchange”), normally at 4:00 p.m. Eastern Time, each day that the Exchange is open for business. Equity securities, including exchange-traded funds (“ETFs”) for which market quotations are available are valued at the last sale price or official closing price (closing bid price or last evaluated quote if no sale has occurred) on the primary market or exchange on which they trade.
Investments in open-end mutual funds are valued at the closing NAV per share of the mutual fund on the day of valuation.
Securities for which the market prices are not readily available or are not reflective of the fair value of the security, as determined by the Manager, will be priced at fair value following procedures approved by the Board.
Futures contracts are valued based upon their quoted daily settlement prices. Upon entering into a futures contract, the Funds are required to deposit with their futures broker, an amount of cash or U.S. Government and Agency Obligations in accordance with the initial margin requirements of the broker or exchange. Futures contracts are marked-to-market daily and an appropriate payable or receivable for the change in value (“variation margin”) is recorded by the Funds. Gains or losses are recognized, but not considered realized until the contracts expire or are closed. Futures contracts involve, to varying degrees, risk of loss in excess of the variation margin disclosed on the Statements of Assets and Liabilities.
Other investments, including restricted securities and those financial instruments for which the above valuation procedures are inappropriate or are deemed not to reflect fair value, are stated at fair value, as determined in good faith by the Manager’s Valuation Committee, pursuant to procedures established by the Board.
Valuation Inputs
Various inputs may be used to determine the fair value of the Funds’ investments. These inputs are summarized in three broad levels for financial statement purposes. The inputs or methodologies used to value securities are not necessarily an indication of the risk associated with investing in those securities.
| | | | |
| Level 1 | | - | | Quoted prices in active markets for identical securities. |
| | |
| Level 2 | | - | | Prices determined using other significant observable inputs. These may include quoted prices for similar securities, interest rates, prepayment speeds, credit risk, and others. |
| | |
| Level 3 | | - | | Prices determined using other significant unobservable inputs. Unobservable inputs reflect the Fund’s own assumptions about the factors market participants would use in pricing an investment. |
Level 1 and Level 2 trading assets and trading liabilities, at fair value
Common stocks, preferred securities, ETFs, and financial derivative instruments, such as futures contracts that are traded on a national securities exchange, are stated at the last reported sale or settlement price on the day of valuation. To the extent these securities are actively traded and valuation adjustments are not applied, they are categorized as Level 1 of the fair value hierarchy. Preferred securities and other equities traded on inactive markets or valued by reference to similar instruments are generally categorized as Level 2 of the fair value hierarchy.
Investments in registered open-end investment management companies will be valued based upon the NAVs of such investments and are categorized as Level 1 of the fair value hierarchy.
35
American Beacon FundsSM
Notes to Financial Statements
December 31, 2017
4. Securities and Other Investments
Common Stock
Common stock generally takes the form of shares in a corporation which represent an ownership interest. It ranks below preferred stock and debt securities in claims for dividends and for assets of the company in a liquidation or bankruptcy. The value of a company’s common stock may fall as a result of factors directly relating to that company, such as decisions made by its management or decreased demand for the company’s products or services. A stock’s value may also decline because of factors affecting not just the company, but also companies in the same industry or sector. The price of a company’s stock may also be affected by changes in financial markets that are relatively unrelated to the company, such as changes in interest rates, currency exchange rates or industry regulation. Companies that elect to pay dividends on their common stock generally only do so after they invest in their own business and make required payments to bondholders and on other debt and preferred stock. Therefore, the value of a company’s common stock will usually be more volatile than its bonds, other debt and preferred stock. Common stock may be exchange-traded or over-the-counter (“OTC”). OTC stock may be less liquid than exchange-traded stock.
Other Investment Company Securities and Other Exchange-Traded Products
The Funds may invest in shares of other investment companies, including open-end funds, closed-end funds, business development companies, ETFs, unit investment trusts, and other investment companies of the Trust. The Funds may invest in investment company securities advised by the Manager or a sub-advisor. Investments in the securities of other investment companies may involve duplication of advisory fees and certain other expenses. By investing in another investment company, the Funds become a shareholder of that investment company. As a result, the Funds’ shareholders indirectly will bear the Funds’ proportionate share of the fees and expenses paid by shareholders of the other investment company, in addition to the fees and expenses the Funds’ shareholders directly bear in connection with the Funds’ own operations. These other fees and expenses are reflected as Acquired Fund Fees and Expenses and are included in the Fees and Expenses Table for the Funds in their Prospectus, if applicable. Investments in other investment companies may involve the payment of substantial premiums above the value of such issuer’s portfolio securities.
Real Estate Investment Trusts
The Funds may own shares of real estate investment trusts (“REITs”) which report information on the source of their distributions annually. The Funds re-characterize distributions received from REIT investments based on information provided by the REITs into the following categories: ordinary income, long-term capital gains, and return of capital. If information is not available on a timely basis from the REITs, the re-characterization will be estimated based on available information, which may include the previous year allocation. If new or additional information becomes available from the REITs at a later date, a re-characterization will be made the following year.
5. Financial Derivative Instruments
The Funds may utilize derivative instruments to market exposure on cash balances or reduce market exposure in anticipation of liquidity needs. When considering the Funds’ use of derivatives, it is important to note that the Funds do not use derivatives for the purpose of creating financial leverage.
Futures Contracts
Futures contracts are contracts to buy or sell a standard quantity of securities at a specified price on a future date. The Funds may enter into financial futures contracts as a method for keeping assets readily convertible to cash if needed to meet shareholder redemptions or for other needs while maintaining exposure to
36
American Beacon FundsSM
Notes to Financial Statements
December 31, 2017
the stock or bond market, as applicable. The primary risks associated with the use of futures contracts are the possibility of illiquid markets or imperfect correlation between the values of the contracts and the underlying securities or that the counterparty will fail to perform its obligations.
Upon entering into a futures contract, the Funds are required to set aside or deposit with a broker an amount, termed the initial margin, which typically represents a portion of the face value of the futures contract. The Funds usually reflects this amount on the Schedules of Investments as a U.S. Treasury Bill held as collateral for futures contracts or as cash deposited with broker on the Statements of Assets and Liabilities. Payments to and from the broker, known as variation margin, are required to be made on a daily basis as the price of the futures contract fluctuates. Changes in initial settlement values are accounted for as unrealized appreciation (depreciation) until the contracts are terminated, at which time realized gains and losses are recognized. Futures contracts are valued at the most recent settlement price established each day by the exchange on which they are traded.
During the year ended December 31, 2017, the Funds entered into future contracts primarily for exposing cash to markets.
The Funds’ average futures contracts outstanding fluctuate throughout the operating year as required to meet strategic requirements. The following table illustrates the average quarterly volume of futures contracts. For purpose of this disclosure, volume is measured by contracts outstanding at each quarter end.
| | | | |
Average Futures Contracts Outstanding | |
Fund | | Year Ended December 31, 2017 | |
Bridgeway Large Cap Growth | | | 20 | |
Bridgeway Large Cap Value | | | 540 | |
The following is a summary of the fair valuations of the Funds’ derivative instruments categorized by risk exposure(1):
Bridgeway Large Cap Growth Fund
| | | | | | | | | | | | | | | | | | | | | | | | | | | | | | | | | | | | | | | | | | | | | | | | | | | | | | | |
| Fair values of financial instruments on the Statements of Assets and Liabilities as of December 31, 2017: | |
|
Derivatives not accounted for as hedging instruments |
| | | | | | | | | | | |
Liabilities: | | Credit
contracts | | | | Foreign
exchange
contracts | | | | Commodity
contracts | | | | Interest rate
contracts | | | | Equity
contracts | | | | Total |
| Payable for variation margin from open futures contracts(2) | | | $ | - | | | | | | | | | $ | - | | | | | | | | | $ | - | | | | | | | | | $ | - | | | | | | | | | $ | (5,422 | ) | | | | | | | | $ | (5,422 | ) |
| | | | | | | | | | | | | | | | | | | | | | | | | | | | | | | | | | | | | | | | | | | | | | | | | | | | | | | |
| The effect of financial derivative instruments on the Statements of Operations as of December 31, 2017: | |
|
Derivatives not accounted for as hedging instruments |
| | | | | | | | | | | |
Realized gain (loss) from derivatives
recognized as a result of operations: | | Credit
contracts | | | | Foreign
exchange
contracts | | | | Commodity
contracts | | | | Interest rate
contracts | | | | Equity
contracts | | | | Total |
| Futures contracts | | | $ | - | | | | | | | | | $ | - | | | | | | | | | $ | - | | | | | | | | | $ | - | | | | | | | | | $ | 581,173 | | | | | | | | | $ | 581,173 | |
| | | | | | | | | | | |
Net change in unrealized appreciation
(depreciation) of derivatives
recognized as a result from
operations: | | Credit
contracts | | | | Foreign
exchange
contracts | | | | Commodity
contracts | | | | Interest rate
contracts | | | | Equity
contracts | | | | Total |
| Futures contracts | | | $ | - | | | | | | | | | $ | - | | | | | | | | | $ | - | | | | | | | | | $ | - | | | | | | | | | $ | (4,140 | ) | | | | | | | | $ | (4,140 | ) |
37
American Beacon FundsSM
Notes to Financial Statements
December 31, 2017
Bridgeway Large Cap Value Fund
| | | | | | | | | | | | | | | | | | | | | | | | | | | | | | | | | | | | | | | | | | | | | | | | | | | | | | | |
| Fair values of financial instruments on the Statements of Assets and Liabilities as of December 31, 2017: | |
|
Derivatives not accounted for as hedging instruments |
| | | | | | | | | | | |
Liabilities: | | Credit
contracts | | | | Foreign
exchange
contracts | | | | Commodity
contracts | | | | Interest rate
contracts | | | | Equity
contracts | | | | Total |
| Payable for variation margin from open futures contracts(2) | | | $ | - | | | | | | | | | $ | - | | | | | | | | | $ | - | | | | | | | | | $ | - | | | | | | | | | $ | (134,259 | ) | | | | | | | | $ | (134,259 | ) |
| | | | | | | | | | | | | | | | | | | | | | | | | | | | | | | | | | | | | | | | | | | | | | | | | | | | | | | |
| The effect of financial derivative instruments on the Statements of Operations as of December 31, 2017: | |
|
Derivatives not accounted for as hedging instruments |
| | | | | | | | | | | |
Realized gain (loss) from derivatives
recognized as a result of operations: | | Credit
contracts | | | | Foreign
exchange
contracts | | | | Commodity
contracts | | | | Interest rate
contracts | | | | Equity
contracts | | | | Total |
| Futures contracts | | | $ | - | | | | | | | | | $ | - | | | | | | | | | $ | - | | | | | | | | | $ | - | | | | | | | | | $ | 11,339,713 | | | | | | | | | $ | 11,339,713 | |
| | | | | | | | | | | |
Net change in unrealized appreciation
(depreciation) of derivatives
recognized as a result from
operations: | | Credit
contracts | | | | Foreign
exchange
contracts | | | | Commodity
contracts | | | | Interest rate
contracts | | | | Equity
contracts | | | | Total |
| Futures contracts | | | $ | - | | | | | | | | | $ | - | | | | | | | | | $ | - | | | | | | | | | $ | - | | | | | | | | | $ | 93,423 | | | | | | | | | $ | 93,423 | |
(1) See Note 3 in the Notes to Financial Statements for additional information.
(2) Includes cumulative appreciation (depreciation) of futures contracts as reported in the Funds’ Schedule of Investments footnotes. Only current day’s variation margin is reported within the Statements of Assets and Liabilities.
6. Principal Risks
Investing in the Funds may involve certain risks including, but not limited to, those described below.
Equity Investment Risk
Equity securities are subject to market risk. The Funds’ investments in equity securities may include common stocks, preferred stocks, securities convertible into or exchangeable for common stocks, REITs, depositary receipts, and U.S. dollar-denominated foreign stocks traded on U.S. exchanges. Such investments may expose the Funds to additional risk. The value of a company’s common stock may fall as a result of factors affecting the company, companies in the same industry or sector, or the financial markets overall. Common stock generally is subordinate to preferred stock upon the liquidation or bankruptcy of the issuing company. Preferred stocks and convertible securities are sensitive to movements in interest rates. Preferred stocks may be less liquid than common stocks and, unlike common stocks, participation in the growth of an issuer may be limited. Distributions on preferred stocks generally are payable at the discretion of an issuer and after required payments to bond holders. Convertible securities are subject to the risk that the credit standing of the issuer may have an effect on the convertible securities’ investment value. Investments in REITs are subject to the risks associated with investing in the real estate industry such as adverse developments affecting the real estate industry and real property values. Depositary receipts and U.S. dollar-denominated foreign stocks traded on U.S. exchanges are subject to certain of the risks associated with investing directly in foreign securities, including, but not limited to, currency fluctuations and political and financial instability in the home country of a particular depositary receipt or foreign stock.
Foreign Investing Risk
The Funds may invest in securities issued by foreign companies through ADRs and U.S. dollar-denominated foreign stocks traded on U.S. exchanges. The Funds may also invest in local currency investments. ADRs are subject
38
American Beacon FundsSM
Notes to Financial Statements
December 31, 2017
to many of the risks inherent in currency fluctuations and political and financial instability in the home country of a particular ADR or foreign stock. Non-U.S. investments carry potential risks not associated with U.S. investments. Such risks include, but are not limited to: (1) currency exchange rate fluctuations, (2) political and financial instability, (3) less liquidity and greater volatility, (4) lack of uniform accounting, auditing and financial reporting standards, (5) increased price volatility, (6) less government regulation and supervision of foreign stock exchanges, brokers and listed companies, and (7) delays in transaction settlement in some foreign markets.
Futures Contracts Risk
Futures contracts are derivative instruments where one party pays a fixed price for an agreed amount of securities or other underlying assets at an agreed date. The use of such derivative instruments may expose the Funds to additional risks that they would not be subject to if they invested directly in the securities underlying those derivatives. Futures contracts may experience potentially dramatic price changes (losses) and imperfect correlation between the price of the contract and the underlying security or index, which will increase the volatility of the Funds and may involve a small investment of cash (the amount of initial and variation margin) relative to the magnitude of the risk assumed (the potential increase or decrease in the price of the futures contract).
Market Risk
Since the financial crisis that started in 2008, the U.S. and many foreign economies continue to experience its after-effects, which have resulted, and may continue to result, in fixed-income instruments experiencing unusual liquidity issues, increased price volatility and, in some cases, credit downgrades and increased likelihood of default. These events have reduced the willingness and ability of some lenders to extend credit, and have made it more difficult for some borrowers to obtain financing on attractive terms, if at all. In addition, global economies and financial markets are becoming increasingly interconnected, which increases the possibilities that conditions in one country or region might adversely impact issuers in a different country or region. The severity or duration of adverse economic conditions may also be affected by policy changes made by governments or quasi-governmental organizations.
In addition, political events within the U.S. and abroad may affect investor and consumer confidence and may adversely impact financial markets and the broader economy, perhaps suddenly and to a significant degree. High public debt in the U.S. and other countries creates ongoing systemic and market risks and policymaking uncertainty. Because the impact on the markets has been widespread, it may be difficult to identify both risks and opportunities using past models of the interplay of market forces, or to predict the duration of these market conditions. Interest rates have been unusually low in recent years in the U.S. and abroad. Because there is little precedent for this situation, it is difficult to predict the impact on various markets of a significant rate increase, whether brought about by U.S. policy makers or by dislocations in world markets. In addition, there is a risk that the prices of goods and services in the U.S. and many foreign economies may decline over time, known as deflation (the opposite of inflation). Deflation may have an adverse effect on stock prices and creditworthiness and may make defaults on debt more likely.
Other Investment Companies Risk
The Funds may invest in shares of other registered investment companies, including ETFs and money market funds. To the extent that the Funds invest in shares of other registered investment companies, the Funds will indirectly bear the fees and expenses charged by the underlying funds in addition to the Funds’ direct fees and expenses and will be subject to the risks associated with investments in those funds.
Securities Lending Risk
To the extent the Funds lends its securities, it may be subject to the following risks; i) borrowers of the Funds’ securities typically provide collateral in the form of cash that is reinvested in securities, ii) the securities in
39
American Beacon FundsSM
Notes to Financial Statements
December 31, 2017
which the collateral is invested may not perform sufficiently to cover the return collateral payments owed to borrowers, iii) delays may occur in the recovery of securities from borrowers, which could interfere with the Funds’ ability to vote proxies or to settle transactions, and iv) there is the risk of possible loss of rights in the collateral should the borrower fail financially.
Offsetting Assets and Liabilities
The Funds are parties to enforceable master netting agreements between brokers and counterparties which provide for the right to offset under certain circumstances. The Funds employ multiple money managers and counterparties and have elected not to offset qualifying financial and derivative instruments on the Statements of Assets and Liabilities, as such all financial and derivative instruments are presented on a gross basis. The impacts of netting arrangements that provide the right to offset are detailed below. The net amount represents the net receivable or payable that would be due from or to the counterparty in the event of default. Exposure from borrowings and other financing agreements such as repurchase agreements can only be netted across transactions governed by the same Master Agreement with the same legal entity. All amounts reported below represent the balance as of the report date, December 31, 2017.
Bridgeway Large Cap Growth Fund
| | | | | | | | | | | | |
| Offsetting of Financial and Derivative Assets as of December 31, 2017: | |
| | | Assets | | | | | | Liabilities | |
| Futures Contracts | | $ | - | | | | | | | $ | 5,422 | |
| | | | | | | | | | | | |
| Total derivative assets and liabilities in the Statement of Assets and Liabilities | | $ | - | | | | | | | $ | 5,422 | |
| | | | | | | | | | | | |
| Derivatives not subject to a Master Netting Agreement or similar agreement (“MNA”) | | $ | - | | | | | | | $ | (5,422 | ) |
| | | | | | | | | | | | |
Bridgeway Large Cap Value Fund
| | | | | | | | | | | | |
| Offsetting of Financial and Derivative Assets as of December 31, 2017: | |
| | | Assets | | | | | | Liabilities | |
| Futures Contracts | | $ | - | | | | | | | $ | 134,259 | |
| | | | | | | | | | | | |
| Total derivative assets and liabilities in the Statement of Assets and Liabilities | | $ | - | | | | | | | $ | 134,259 | |
| | | | | | | | | | | | |
| Derivatives not subject to a Master Netting Agreement or similar agreement (“MNA”) | | $ | - | | | | | | | $ | (134,259 | ) |
| | | | | | | | | | | | |
7. Federal Income and Excise Taxes
It is the policy of each Fund to qualify as a regulated investment company (“RIC”), by complying with all applicable provisions of Subchapter M of the Internal Revenue Code, as amended, and to make distributions of taxable income sufficient to relieve it from substantially all federal income and excise taxes. For federal income tax purposes, each Fund is treated as a single entity for the purpose of determining such qualification.
The Funds do not have any unrecorded tax liabilities in the accompanying financial statements. Each of the tax years in the four year period ended December 31, 2017 remain subject to examination by the Internal Revenue Service. If applicable, the Funds recognize interest accrued related to unrecognized tax benefits in interest expense and penalties in “Other expenses” on the Statements of Operations.
The Funds may be subject to taxes imposed by countries in which it invests. Such taxes are generally based on returns of income earned or gains realized or repatriated. Taxes are accrued and applied to net investment income, net realized capital gains and net unrealized appreciation (depreciation), as applicable, as the income is earned or capital gains are recorded.
40
American Beacon FundsSM
Notes to Financial Statements
December 31, 2017
Dividends are categorized in accordance with income tax regulations which may treat certain transactions differently than U.S. GAAP. Accordingly, the character of distributions and composition of net assets for tax purposes may differ from those reflected in the accompanying financial statements.
The tax character of distributions paid were as follows:
| | | | | | | | | | | | | | | | | | | | | | | | | | | | | | | | | | | | |
| | | Bridgeway Large Cap Growth Fund | | | | | | Bridgeway Large Cap Value Fund | |
| | | Year Ended
December 31, 2017 | | | | | | Six Months Ended
December 31, 2016 | | | | | | Year Ended
June 30, 2016 | | | | | | Year Ended
December 31, 2017 | | | | | | Year Ended
December 31, 2016 | |
Distributions paid from: | |
Ordinary income* | |
Institutional Class | | $ | 2,444,697 | | | | | | | $ | 860,039 | | | | | | | $ | 775,100 | | | | | | | $ | 21,115,635 | | | | | | | $ | 16,192,058 | |
Y Class | | | 27,566 | | | | | | | | 4,225 | | | | | | | | - | | | | | | | | 20,051,334 | | | | | | | | 11,608,153 | |
Investors Class | | | 990,945 | | | | | | | | 2,556 | | | | | | | | - | | | | | | | | 14,070,130 | | | | | | | | 17,444,134 | |
A Class | | | 59,745 | | | | | | | | 872 | | | | | | | | - | | | | | | | | 815,141 | | | | | | | | 1,598,995 | |
C Class | | | 8,677 | | | | | | | | 1,137 | | | | | | | | - | | | | | | | | 342,565 | | | | | | | | 399,395 | |
R6 Class | | | - | | | | | | | | - | | | | | | | | - | | | | | | | | 1,038,664 | | | | | | | | - | |
Long-term capital gains | |
Institutional Class | | | 4,759,699 | | | | | | | | - | | | | | | | | - | | | | | | | | 65,169,621 | | | | | | | | 136,773 | |
Y Class | | | 53,797 | | | | | | | | - | | | | | | | | - | | | | | | | | 64,466,890 | | | | | | | | 102,639 | |
Investors Class | | | 1,942,083 | | | | | | | | - | | | | | | | | - | | | | | | | | 58,276,464 | | | | | | | | 186,988 | |
A Class | | | 123,172 | | | | | | | | - | | | | | | | | - | | | | | | | | 4,055,680 | | | | | | | | 18,482 | |
C Class | | | 21,069 | | | | | | | | - | | | | | | | | - | | | | | | | | 4,417,087 | | | | | | | | 12,283 | |
R6 Class | | | - | | | | | | | | - | | | | | | | | - | | | | | | | | 3,153,059 | | | | | | | | - | |
| | | | | | | | | | | | | | | | | | | | | | | | | | | | | | | | | | | | |
Total distributions paid | | $ | 10,431,450 | | | | | | | $ | 868,829 | | | | | | | $ | 775,100 | | | | | | | $ | 256,972,270 | | | | | | | $ | 47,699,900 | |
| | | | | | | | | | | | | | | | | | | | | | | | | | | | | | | | | | | | |
*For tax purposes, short-term capital gains are considered ordinary income distributions.
As of December 31, 2017 the components of distributable earnings (deficits) on a tax basis were as follows:
| | | | | | | | | | | | | | | | | | | | | | | | | | | | |
Fund | | Tax Cost | | | | | | Unrealized
Appreciation | | | | | | Unrealized
(Depreciation) | | | | | | Net Unrealized
Appreciation
(Depreciation) | |
| Bridgeway Large Cap Growth | | $ | 217,662,584 | | | | | | | $ | 40,962,545 | | | | | | | $ | (1,999,264 | ) | | | | | | $ | 38,963,281 | |
| Bridgeway Large Cap Value | | | 4,011,136,867 | | | | | | | | 871,801,698 | | | | | | | | (103,292,327 | ) | | | | | | | 768,509,371 | |
| | | | | | | | | | | | | | | | | | | | | | | | | | | | | | | | | | | | | | | | | | | | |
Fund | | Net Unrealized
Appreciation
(Depreciation) | | | | | | Undistributed
Ordinary
Income | | | | | | Undistributed
Long-Term
Capital Gains | | | | | | Accumulated
Capital and
Other (Losses) | | | | | | Other
Temporary
Differences | | | | | | Distributable
Earnings | |
| Bridgeway Large Cap Growth | | $ | 38,963,281 | | | | | | | $ | - | | | | | | | $ | - | | | | | | | $ | (1,770,090 | ) | | | | | | $ | - | | | | | | | $ | 37,193,191 | |
| Bridgeway Large Cap Value | | | 768,509,371 | | | | | | | | - | | | | | | | | 80,504,292 | | | | | | | | - | | | | | | | | (1 | ) | | | | | | | 849,013,662 | |
Financial reporting records are adjusted for permanent book/tax differences to reflect tax character. Financial records are not adjusted for temporary differences. The temporary differences between financial reporting and tax-basis reporting of unrealized appreciation (depreciation) are attributable primarily to the tax deferral of losses from wash sales, the tax deferral of post-October capital losses and the realization for tax purposes of unrealized gains (losses) on certain derivative instruments.
Due to inherent differences in the recognition of income, expenses, and realized gains (losses) under U.S. GAAP and federal income tax regulations, permanent differences between book and tax reporting have been identified and appropriately reclassified on the Statements of Assets and Liabilities.
41
American Beacon FundsSM
Notes to Financial Statements
December 31, 2017
Accordingly, the following amounts represent current year permanent differences derived from reclassifications of income from real estate investment securities, reclassifications of income to return of capital, basis adjustments on transferred assets from the Target Fund, distribution re-designations and distributions in excess of current earnings as of December 31, 2017:
| | | | | | | | | | | | | | | | | | | | | | | | | | | | | | | | |
Fund | | Paid-In-Capital | | | | | | Undistributed
(Overdistribution of)
Net Investment
Income | | | | | | Accumulated Net
Realized Gain (Loss) | | | | | | Net Unrealized
Appreciation
(Depreciation) | | | | |
| Bridgeway Large Cap Growth | | $ | (119,147 | ) | | | | | | $ | 116,020 | | | | | | | $ | 3,127 | | | | | | | $ | – | | | | | |
| Bridgeway Large Cap Value | | | – | | | | | | | | 1,219,180 | | | | | | | | (1,219,180 | ) | | | | | | | – | | | | | |
Under the Regulated Investment Company Modernization Act of 2010 (“RIC MOD”), net capital losses recognized by the Funds in taxable years beginning after December 22, 2010 are carried forward indefinitely and retain their character as short-term and/or long-term losses. Prior to RICMOD, net capital losses incurred by the Fund were carried forward for eight years and treated as short-term losses. RICMOD requires that post enactment losses be utilized before pre-enactment net capital losses.
For the year ended December 31, 2017, the Funds did not have any capital loss carryforwards. The Bridgeway Large Cap Growth Fund utilized $7,930,923 pre-RIC MOD capital loss carryforward.
The Funds are permitted for tax purposes to defer into its next fiscal year qualified late year losses. Qualified late year capital losses are any capital losses incurred after October 31 through the Fund’s fiscal year end, December 31, 2017. Qualified late year ordinary losses are specified losses generally incurred after October 31 through the Fund’s fiscal year end, December 31, 2017. For the period ended December 31, 2017, Bridgeway Large Cap Growth Fund deferred $1,770,090 of capital losses to January 1, 2018.
8. Investment Transactions
The aggregate cost of purchases and proceeds from sales of investments, other than short-term obligations, for the year ended December 31, 2017 were as follows:
| | | | | | | | | | | | |
Fund | | Purchases
(non-U.S. Government
Securities) | | | | | | Sales
(non-U.S. Government
Securities) | |
| Bridgeway Large Cap Growth | | $ | 120,132,759 | | | | | | | $ | 129,497,929 | |
| Bridgeway Large Cap Value | | | 2,322,923,198 | | | | | | | | 2,045,441,958 | |
A summary of the Funds’ transactions in the USG Select Fund for the year ended December 31, 2017 are as follows:
| | | | | | | | | | | | | | | | | | | | | | | | | | | | | | | | | | | | | | | | | | | | | | |
Fund | | Type of
Transaction | | | | | December 31,
2016
Share/Fair
Value | | | | | | Purchases | | | | | | Sales | | | | | | December 31,
2017
Share/Fair
Value | | | | | | Dividend
Income | | | | |
| Bridgeway Large Cap Growth Fund | | Direct | | | | | | $ | 1,766,715 | | | | | | | $ | 80,533,137 | | | | | | | $ | 80,857,888 | | | | | | | $ | 1,441,964 | | | | | | | $ | 47,510 | | | | | |
| Bridgeway Large Cap Growth Fund | | Securities Lending | | | | | | | - | | | | | | | | 65,569,572 | | | | | | | | 65,569,572 | | | | | | | | - | | | | | | | | N/A | | | | | |
| Bridgeway Large Cap Value Fund | | Direct | | | | | | | 94,937,593 | | | | | | | | 2,098,363,158 | | | | | | | | 2,089,086,984 | | | | | | | | 104,213,767 | | | | | | | | 555,870 | | | | | |
| Bridgeway Large Cap Value Fund | | Securities Lending | | | | | | | - | | | | | | | | 430,783,276 | | | | | | | | 430,783,276 | | | | | | | | - | | | | | | | | N/A | | | | | |
9. Securities Lending
The Funds may lend their securities to qualified financial institutions, such as certain broker-dealers, to earn additional income. The borrowers are required to secure their loans continuously with collateral in an amount at least equal to the fair value of the securities loaned, initially in an amount at least equal to 102% of the fair value of domestic securities loaned and 105% of the fair value of international securities loaned. Collateral is monitored
42
American Beacon FundsSM
Notes to Financial Statements
December 31, 2017
and marked-to-market daily. Daily mark-to-market amounts are required to be paid to the borrower or received from the borrower by the end of the following business day. This one day settlement for mark-to-market amounts may result in the collateral being temporarily less than the value of the securities on loan or temporarily more than the required minimum collateral.
To the extent that a loan is collateralized by cash, such cash collateral shall be invested by the securities lending agent (the “Agent”) in money market mutual funds and other short-term investments, provided the investments meet certain quality and diversification requirements. Securities purchased with cash collateral proceeds are listed in the Funds’ Schedule of Investments and the collateral is shown on the Statement of Assets and Liabilities as a payable.
Securities lending income is generated from the demand premium (if any) paid by the borrower to borrow a specific security and from the return on investment of cash collateral, reduced by negotiated rebate fees paid to the borrower and transaction costs. To the extent that a loan is secured by non-cash collateral, securities lending income is generated as a demand premium reduced by transaction costs. The Funds, the Agent, and the Manager retained 80%, 10%, and 10%, respectively, of the income generated from securities lending.
While securities are on loan, the Funds continue to receive certain income associated with that security and any gain or loss in the market price that may occur during the term of the loan. In the case of domestic equities, the value of any dividend is received in the form of a substitute payment approximately equal to the dividend. In the case of foreign securities, a negotiated amount is received that is less than the actual dividend, but higher than the dividend amount minus the foreign tax that the Funds would be subject to on the dividend.
Securities lending transactions pose certain risks to the Funds, including that the borrower may not provide additional collateral when required or return the securities when due, that the value of the short-term investments will be less than the amount of cash collateral required to be returned to the borrower, that non-cash collateral may be subject to legal constraints in the event of a borrower bankruptcy, and that the cash collateral investments could become illiquid and unable to be used to return collateral to the borrower. The Funds could also experience delays and costs in gaining access to the collateral. The Funds bear the risk of any deficiency in the amount of the cash collateral available for return to the borrower and any action which impairs its ability to liquidate non-cash collateral to satisfy a borrower default.
Cash collateral is listed on the Funds’ Schedules of Investments and is shown on the Statements of Assets and Liabilities. Income earned on these investments is included in “Income derived from securities lending” on the Statements of Operations.
Non-cash collateral received by the Funds may not be sold or re-pledged except to satisfy a borrower default. Therefore, non-cash collateral is not included on the Funds’ Schedules of Investments or Statements of Assets and Liabilities.
The Funds did not have any securities on loan or hold any securities lending collateral as of the year ended December 31, 2017.
10. Borrowing Arrangements
Effective November 16, 2017, the Funds, along with certain other funds managed by the Manager (“Participating Funds”), entered into a committed revolving line of credit (the “Committed Line”) agreement with State Street Bank and Trust Company (the “Bank”) to be used to facilitate portfolio liquidity. The maximum borrowing amount under the Committed Line is $50 million with interest at a rate equal to the higher of (a) one-month London Inter-Bank Offered Rate (“LIBOR”) plus 1.25% per annum or (b) the Federal Funds rate plus 1.25% per annum on amounts borrowed. Each of the Participating Funds will pay a commitment fee at a rate of 0.25% per annum on the unused portion of the Committed Line amount. The Committed Line expires November 15, 2018, unless extended by the Bank or terminated by the Participating Funds in accordance with the agreement.
43
American Beacon FundsSM
Notes to Financial Statements
December 31, 2017
Effective November 16, 2017, the Funds, along with certain other Participating Funds managed by the Manager, entered into an uncommitted discretionary demand revolving line of credit (the “Uncommitted Line”) agreement with the Bank to be used to facilitate portfolio liquidity. The maximum borrowing amount under the Uncommitted Line is $50 million with interest at a rate equal to the higher of (a) one-month LIBOR plus 1.25% per annum or (b) the Federal Funds rate. The Uncommitted Line expires November 15, 2018, unless extended by the Bank or terminated by the Participating Funds in accordance with the agreement.
The Participating Funds paid administration, legal and arrangement fees, which are recognized as a component of “Other expenses” on the Statements of Operations, along with commitment fees, that have been allocated among the Participating Funds based on average daily net assets. During the year ended December 31, 2017, the Funds did not utilize this facility.
11. Capital Share Transactions
The tables below summarize the activity in capital shares for each Class of the Funds:
| | | | | | | | | | | | | | | | | | | | | | | | | | | | | | | | | | | | | | | | | | | | |
| | | Institutional Class | |
| | | Year Ended
December 31, 2017 | | | | | | Six Months Ended
December 31, 2016 | | | | | | Year Ended
June 30, 2016 | |
Bridgeway Large Cap Growth Fund | | Shares | | | | | | Amount | | | | | | Shares | | | | | | Amount | | | | | | Shares | | | | | | Amount | |
| Shares sold | | | 573,230 | | | | | | | $ | 15,764,540 | | | | | | | | 347,029 | | | | | | | $ | 8,235,900 | | | | | | | | 1,664,057 | | | | | | | $ | 38,562,092 | |
| Reinvestment of dividends | | | 234,024 | | | | | | | | 7,037,103 | | | | | | | | 33,619 | | | | | | | | 832,747 | | | | | | | | 31,858 | | | | | | | | 753,120 | |
| Issued in Reorganization | | | 560,148 | | | | | | | | 17,375,797 | | | | | | | | - | | | | | | | | - | | | | | | | | - | | | | | | | | - | |
| Shares redeemed | | | (869,054 | ) | | | | | | | (23,815,289 | ) | | | | | | | (911,246 | ) | | | | | | | (21,647,448 | ) | | | | | | | (2,302,986 | ) | | | | | | | (50,942,698 | ) |
| | | | | | | | | | | | | | | | | | | | | | | | | | | | | | | | | | | | | | | | | | | | |
| Net increase/(decrease) in shares outstanding | | | 498,348 | | | | | | | $ | 16,362,151 | | | | | | | | (530,598 | ) | | | | | | $ | (12,578,801 | ) | | | | | | | (607,071 | ) | | | | | | $ | (11,627,486 | ) |
| | | | | | | | | | | | | | | | | | | | | | | | | | | | | | | | | | | | | | | | | | | | |
| | | | | | | | | | | | | | | | | | | | |
| | | Y Class | |
| | | Year Ended
December 31, 2017 | | | | | | Six Months Ended
December 31, 2016 | | | | | | February 5, 2016A to
June 30, 2016 | |
Bridgeway Large Cap Growth Fund | | Shares | | | | | | Amount | | | | | | Shares | | | | | | Amount | | | | | | Shares | | | | | | Amount | |
| Shares sold | | | 35,909 | | | | | | | $ | 1,013,797 | | | | | | | | 16,663 | | | | | | | $ | 391,005 | | | | | | | | 19,831 | | | | | | | $ | 436,655 | |
| Reinvestment of dividends | | | 2,711 | | | | | | | | 81,363 | | | | | | | | 171 | | | | | | | | 4,225 | | | | | | | | - | | | | | | | | - | |
| Issued in Reorganization | | | 5,051 | | | | | | | | 156,423 | | | | | | | | - | | | | | | | | - | | | | | | | | - | | | | | | | | - | |
| Shares redeemed | | | (3,449 | ) | | | | | | | (96,277 | ) | | | | | | | (7,072 | ) | | | | | | | (168,547 | ) | | | | | | | (2,209 | ) | | | | | | | (48,222 | ) |
| | | | | | | | | | | | | | | | | | | | | | | | | | | | | | | | | | | | | | | | | | | | |
| Net increase in shares outstanding | | | 40,222 | | | | | | | $ | 1,155,306 | | | | | | | | 9,762 | | | | | | | $ | 226,683 | | | | | | | | 17,622 | | | | | | | $ | 388,433 | |
| | | | | | | | | | | | | | | | | | | | | | | | | | | | | | | | | | | | | | | | | | | | |
| | | | | | | | | | | | | | | | | | | | |
| | | Investor Class | |
| | | Year Ended
December 31, 2017 | | | | | | Six Months Ended
December 31, 2016 | | | | | | February 5, 2016A to
June 30, 2016 | |
Bridgeway Large Cap Growth Fund | | Shares | | | | | | Amount | | | | | | Shares | | | | | | Amount | | | | | | Shares | | | | | | Amount | |
| Shares sold | | | 55,661 | | | | | | | $ | 1,500,036 | | | | | | | | 10,944 | | | | | | | $ | 261,573 | | | | | | | | 7,575 | | | | | | | $ | 159,910 | |
| Reinvestment of dividends | | | 98,167 | | | | | | | | 2,930,272 | | | | | | | | 103 | | | | | | | | 2,557 | | | | | | | | - | | | | | | | | - | |
| Issued in Reorganization | | | 2,283,713 | | | | | | | | 70,337,259 | | | | | | | | - | | | | | | | | - | | | | | | | | - | | | | | | | | - | |
| Shares redeemed | | | (50,343 | ) | | | | | | | (1,467,164 | ) | | | | | | | (525 | ) | | | | | | | (13,045 | ) | | | | | | | (1,697 | ) | | | | | | | (38,429 | ) |
| | | | | | | | | | | | | | | | | | | | | | | | | | | | | | | | | | | | | | | | | | | | |
| Net increase in shares outstanding | | | 2,387,198 | | | | | | | $ | 73,300,403 | | | | | | | | 10,522 | | | | | | | $ | 251,085 | | | | | | | | 5,878 | | | | | | | $ | 121,481 | |
| | | | | | | | | | | | | | | | | | | | | | | | | | | | | | | | | | | | | | | | | | | | |
| | | | | | | | | | | | | | | | | | | | |
| | | A Class | |
| | | Year Ended
December 31, 2017 | | | | | | Six Months Ended
December 31, 2016 | | | | | | February 5, 2016A to
June 30, 2016 | |
Bridgeway Large Cap Growth Fund | | Shares | | | | | | Amount | | | | | | Shares | | | | | | Amount | | | | | | Shares | | | | | | Amount | |
| Shares sold | | | 108,872 | | | | | | | $ | 3,081,503 | | | | | | | | 4,610 | | | | | | | $ | 109,611 | | | | | | | | 14,372 | | | | | | | $ | 311,305 | |
| Reinvestment of dividends | | | 6,085 | | | | | | | | 181,953 | | | | | | | | 35 | | | | | | | | 872 | | | | | | | | - | | | | | | | | - | |
| Issued in Reorganization | | | 43,610 | | | | | | | | 1,344,061 | | | | | | | | - | | | | | | | | - | | | | | | | | - | | | | | | | | - | |
| Shares redeemed | | | (8,365 | ) | | | | | | | (233,976 | ) | | | | | | | (6,104 | ) | | | | | | | (144,565 | ) | | | | | | | (7,349 | ) | | | | | | | (166,121 | ) |
| | | | | | | | | | | | | | | | | | | | | | | | | | | | | | | | | | | | | | | | | | | | |
| Net increase/(decrease) in shares outstanding | | | 150,202 | | | | | | | $ | 4,373,541 | | | | | | | | (1,459 | ) | | | | | | $ | (34,082 | ) | | | | | | | 7,023 | | | | | | | $ | 145,184 | |
| | | | | | | | | | | | | | | | | | | | | | | | | | | | | | | | | | | | | | | | | | | | |
| | | | | | | | | | | | | | | | | | | | |
| | | C Class | |
| | | Year Ended
December 31, 2017 | | | | | | Six Months Ended
December 31, 2016 | | | | | | February 5, 2016A to
June 30, 2016 | |
Bridgeway Large Cap Growth Fund | | Shares | | | | | | Amount | | | | | | Shares | | | | | | Amount | | | | | | Shares | | | | | | Amount | |
| Shares sold | | | 8,335 | | | | | | | $ | 224,338 | | | | | | | | 1,783 | | | | | | | $ | 43,207 | | | | | | | | 10,768 | | | | | | | $ | 231,867 | |
| Reinvestment of dividends | | | 1,008 | | | | | | | | 29,746 | | | | | | | | 46 | | | | | | | | 1,137 | | | | | | | | - | | | | | | | | - | |
| Issued in Reorganization | | | 10,919 | | | | | | | | 331,620 | | | | | | | | - | | | | | | | | - | | | | | | | | - | | | | | | | | - | |
| Shares redeemed | | | (1,258 | ) | | | | | | | (35,056 | ) | | | | | | | (5,334 | ) | | | | | | | (125,544 | ) | | | | | | | - | | | | | | | | - | |
| | | | | | | | | | | | | | | | | | | | | | | | | | | | | | | | | | | | | | | | | | | | |
| Net increase/(decrease) in shares outstanding | | | 19,004 | | | | | | | $ | 550,648 | | | | | | | | (3,505 | ) | | | | | | $ | (81,200 | ) | | | | | | | 10,768 | | | | | | | $ | 231,867 | |
| | | | | | | | | | | | | | | | | | | | | | | | | | | | | | | | | | | | | | | | | | | | |
44
American Beacon FundsSM
Notes to Financial Statements
December 31, 2017
| | | | | | | | | | | | | | | | | | | | | | | | | | | | |
| | | Institutional Class | |
| | | Year Ended December 31, | |
| | | 2017 | | | | | | 2016 | |
Bridgeway Large Cap Value Fund | | Shares | | | | | | Amount | | | | | | Shares | | | | | | Amount | |
| Shares sold | | | 22,141,959 | | | | | | | $ | 605,634,913 | | | | | | | | 29,618,277 | | | | | | | $ | 702,728,158 | |
| Reinvestment of dividends | | | 2,851,013 | | | | | | | | 81,738,543 | | | | | | | | 587,707 | | | | | | | | 15,521,344 | |
| Shares redeemed | | | (16,256,439 | ) | | | | | | | (452,560,664 | ) | | | | | | | (14,779,522 | ) | | | | | | | (361,176,117 | ) |
| | | | | | | | | | | | | | | | | | | | | | | | | | | | |
| Net increase in shares outstanding | | | 8,736,533 | | | | | | | $ | 234,812,792 | | | | | | | | 15,426,462 | | | | | | | $ | 357,073,385 | |
| | | | | | | | | | | | | | | | | | | | | | | | | | | | |
| | | | |
| | | Y Class | |
| | | Year Ended December 31, | |
| | | 2017 | | | | | | 2016 | |
Bridgeway Large Cap Value Fund | | Shares | | | | | | Amount | | | | | | Shares | | | | | | Amount | |
| Shares sold | | | 30,846,571 | | | | | | | $ | 837,274,698 | | | | | | | | 21,737,331 | | | | | | | $ | 518,148,202 | |
| Reinvestment of dividends | | | 2,784,424 | | | | | | | | 79,606,684 | | | | | | | | 418,386 | | | | | | | | 11,024,436 | |
| Shares redeemed | | | (13,143,773 | ) | | | | | | | (357,121,560 | ) | | | | | | | (6,598,894 | ) | | | | | | | (157,373,925 | ) |
| | | | | | | | | | | | | | | | | | | | | | | | | | | | |
| Net increase in shares outstanding | | | 20,487,222 | | | | | | | $ | 559,759,822 | | | | | | | | 15,556,823 | | | | | | | $ | 371,798,713 | |
| | | | | | | | | | | | | | | | | | | | | | | | | | | | |
| | | | |
| | | Investor Class | |
| | | Year Ended December 31, | |
| | | 2017 | | | | | | 2016 | |
Bridgeway Large Cap Value Fund | | Shares | | | | | | Amount | | | | | | Shares | | | | | | Amount | |
| Shares sold | | | 12,127,050 | | | | | | | $ | 327,627,225 | | | | | | | | 31,217,772 | | | | | | | $ | 738,978,810 | |
| Reinvestment of dividends | | | 2,532,136 | | | | | | | | 72,191,205 | | | | | | | | 668,953 | | | | | | | | 17,573,398 | |
| Shares redeemed | | | (26,895,237 | ) | | | | | | | (724,443,760 | ) | | | | | | | (14,003,271 | ) | | | | | | | (332,412,565 | ) |
| | | | | | | | | | | | | | | | | | | | | | | | | | | | |
| Net increase (decrease) in shares outstanding | | | (12,236,051 | ) | | | | | | $ | (324,625,330 | ) | | | | | | | 17,883,454 | | | | | | | $ | 424,139,643 | |
| | | | | | | | | | | | | | | | | | | | | | | | | | | | |
| | | | |
| | | A Class | |
| | | Year Ended December 31, | |
| | | 2017 | | | | | | 2016 | |
Bridgeway Large Cap Value Fund | | Shares | | | | | | Amount | | | | | | Shares | | | | | | Amount | |
| Shares sold | | | 1,323,482 | | | | | | | $ | 35,172,571 | | | | | | | | 2,195,353 | | | | | | | $ | 51,983,617 | |
| Reinvestment of dividends | | | 166,852 | | | | | | | | 4,741,923 | | | | | | | | 55,177 | | | | | | | | 1,442,871 | |
| Shares redeemed | | | (4,000,004 | ) | | | | | | | (109,268,040 | ) | | | | | | | (2,884,469 | ) | | | | | | | (67,173,170 | ) |
| | | | | | | | | | | | | | | | | | | | | | | | | | | | |
| Net (decrease) in shares outstanding | | | (2,509,670 | ) | | | | | | $ | (69,353,546 | ) | | | | | | | (633,939 | ) | | | | | | $ | (13,746,682 | ) |
| | | | | | | | | | | | | | | | | | | | | | | | | | | | |
| | | | |
| | | C Class | |
| | | Year Ended December 31, | |
| | | 2017 | | | | | | 2016 | |
Bridgeway Large Cap Value Fund | | Shares | | | | | | Amount | | | | | | Shares | | | | | | Amount | |
| Shares sold | | | 646,529 | | | | | | | $ | 16,939,095 | | | | | | | | 1,058,012 | | | | | | | $ | 24,046,258 | |
| Reinvestment of dividends | | | 148,656 | | | | | | | | 4,122,220 | | | | | | | | 13,238 | | | | | | | | 338,911 | |
| Shares redeemed | | | (1,057,869 | ) | | | | | | | (27,847,899 | ) | | | | | | | (919,457 | ) | | | | | | | (21,163,388 | ) |
| | | | | | | | | | | | | | | | | | | | | | | | | | | | |
| Net increase (decrease) in shares outstanding | | | (262,684 | ) | | | | | | $ | (6,786,584 | ) | | | | | | | 151,793 | | | | | | | $ | 3,221,781 | |
| | | | | | | | | | | | | | | | | | | | | | | | | | | | |
| | | | |
| | | R6 Class | | | | | | | | | | | | | |
| | | April 28, 2017A to
December 31, 2017 | | | | | | | | | | | | | |
Bridgeway Large Cap Value Fund | | Shares | | | | | | Amount | | | | | | | | | | | | | |
| Shares sold | | | 3,096,230 | | | | | | | $ | 91,569,174 | | | | | | | | | | | | | | | | | |
| Reinvestment of dividends | | | 146,308 | | | | | | | | 4,191,724 | | | | | | | | | | | | | | | | | |
| Shares redeemed | | | (36,754 | ) | | | | | | | (1,070,350 | ) | | | | | | | | | | | | | | | | |
| | | | | | | | | | | | | | | | | | | | | | | | | | | | |
| Net increase in shares outstanding | | | 3,205,784 | | | | | | | $ | 94,690,548 | | | | | | | | | | | | | | | | | |
| | | | | | | | | | | | | | | | | | | | | | | | | | | | |
A Commencement of operations.
12. Subsequent Events
Management has evaluated subsequent events for possible recognition or disclosure in the financial statements through the date the financial statements are issued. Management has determined that there are no material events that would require disclosure in the Funds’ financial statements through this date.
45
American Beacon Bridgeway Large Cap Growth FundSM
Financial Highlights
(For a share outstanding throughout the period)
| | | | | | | | | | | | | | | | | | | | | | | | | | | | | | | | | | | | | | | | | | | | |
| | | Institutional ClassA | |
| | | Year Ended
December 31, | | | | | | Six Months
Ended
December 31, | | | | | | Year Ended June 30, | |
| | | 2017G | | | | | | 2016 | | | | | | 2016 | | | | | | 2015 | | | | | | 2014 | | | | | | 2013 | |
| | | | |
Net asset value, beginning of period | | $ | 24.47 | | | | | | | $ | 22.77 | | | | | | | $ | 23.71 | | | | | | | $ | 20.51 | | | | | | | $ | 16.18 | | | | | | | $ | 13.33 | |
| | | | | | | | | | | | | | | | | | | | | | | | | | | | | | | | | | | | | | | | | | | | |
Income (loss) from investment operations: | | | | | | | | | | | | | | | | | | | | | | | | | | | | | | | | | | | | | | | | | | | | |
Net investment income | | | 0.10 | | | | | | | | 0.04 | | | | | | | | 0.07 | | | | | | | | 0.17 | B | | | | | | | 0.13 | B | | | | | | | 0.16 | B |
Net gains (losses) on investments (both realized and unrealized) | | | 6.56 | | | | | | | | 1.82 | | | | | | | | (0.90 | ) | | | | | | | 3.14 | | | | | | | | 4.29 | | | | | | | | 2.88 | |
| | | | | | | | | | | | | | | | | | | | | | | | | | | | | | | | | | | | | | | | | | | | |
Total income (loss) from investment operations | | | 6.66 | | | | | | | | 1.86 | | | | | | | | (0.83 | ) | | | | | | | 3.31 | | | | | | | | 4.42 | | | | | | | | 3.04 | |
| | | | | | | | | | | | | | | | | | | | | | | | | | | | | | | | | | | | | | | | | | | | |
Less distributions: | | | | | | | | | | | | | | | | | | | | | | | | | | | | | | | | | | | | | | | | | | | | |
Dividends from net investment income | | | (0.08 | ) | | | | | | | (0.16 | ) | | | | | | | (0.11 | ) | | | | | | | (0.11 | ) | | | | | | | (0.09 | ) | | | | | | | (0.19 | ) |
Distributions from net realized gains | | | (1.17 | ) | | | | | | | - | | | | | | | | - | | | | | | | | - | | | | | | | | - | | | | | | | | - | |
| | | | | | | | | | | | | | | | | | | | | | | | | | | | | | | | | | | | | | | | | | | | |
Total distributions | | | (1.25 | ) | | | | | | | (0.16 | ) | | | | | | | (0.11 | ) | | | | | | | (0.11 | ) | | | | | | | (0.09 | ) | | | | | | | (0.19 | ) |
| | | | | | | | | | | | | | | | | | | | | | | | | | | | | | | | | | | | | | | | | | | | |
Net asset value, end of period | | $ | 29.88 | | | | | | | $ | 24.47 | | | | | | | $ | 22.77 | | | | | | | $ | 23.71 | | | | | | | $ | 20.51 | | | | | | | $ | 16.18 | |
| | | | | | | | | | | | | | | | | | | | | | | | | | | | | | | | | | | | | | | | | | | | |
Total returnC | | | 27.21 | % | | | | | | | 8.15 | %E | | | | | | | (3.52 | )% | | | | | | | 16.19 | % | | | | | | | 27.41 | %D | | | | | | | 23.06 | %D |
| | | | | | | | | | | | | | | | | | | | | | | | | | | | | | | | | | | | | | | | | | | | |
|
Ratios and supplemental data: | |
Net assets, end of period | | $ | 178,062,388 | | | | | | | $ | 133,638,400 | | | | | | | $ | 136,460,611 | | | | | | | $ | 156,493,513 | | | | | | | $ | 56,343,594 | | | | | | | $ | 47,966,566 | |
Ratios to average net assets: | | | | | | | | | | | | | | | | | | | | | | | | | | | | | | | | | | | | | | | | | | | | |
Expenses, before reimbursements | | | 1.06 | % | | | | | | | 1.02 | %F | | | | | | | 0.89 | % | | | | | | | 0.81 | % | | | | | | | 0.87 | % | | | | | | | 0.90 | % |
Expenses, net of reimbursements | | | 0.81 | % | | | | | | | 0.81 | %F | | | | | | | 0.83 | % | | | | | | | 0.81 | % | | | | | | | 0.84 | % | | | | | | | 0.84 | % |
Net investment income, before expense reimbursements | | | 0.15 | % | | | | | | | 0.12 | %F | | | | | | | 0.30 | % | | | | | | | 0.75 | % | | | | | | | 0.70 | % | | | | | | | 1.10 | % |
Net investment income, net of reimbursements | | | 0.40 | % | | | | | | | 0.33 | %F | | | | | | | 0.35 | % | | | | | | | 0.75 | % | | | | | | | 0.70 | % | | | | | | | 1.10 | % |
Portfolio turnover rate | | | 78 | % | | | | | | | 40 | %E | | | | | | | 100 | % | | | | | | | 48 | % | | | | | | | 74 | % | | | | | | | 49 | % |
| A | Prior to the reorganization on February 5, 2016, the Institutional Class was known as Class N. |
| B | Per share amounts have been calculated using the average shares method. |
| C | Based on net asset value, which does not reflect the sales charge, redemption fee, or contingent deferred sales charge, if applicable. May include adjustments in accordance with U.S. GAAP and as such, the net asset value for reporting purposes and the returns based upon those net asset values may differ from the net asset value and returns for shareholder transactions. |
| D | Total return would have been lower had various fees not been waived during the period. |
| G | On December 15, 2017, pursuant to a plan of Reorganization on termination, the American Beacon Bridgeway Large Cap Growth II Fund (“Target Fund”) transferred all of its property and assets to the American Beacon Bridgeway Large Cap Growth Fund (“Acquiring Fund”) in exchange solely for voting shares of the Acquiring Fund and the assumption of the Target Fund’s liabilities. |
See accompanying notes
46
American Beacon Bridgeway Large Cap Growth FundSM
Financial Highlights
(For a share outstanding throughout the period)
| | | | | | | | | | | | | | | | | | | | |
| | | Y Class | |
| | | Year Ended
December 31,
2017F | | | | | | Six Months
Ended
December 31,
2016 | | | | | | February 5,
2016A to
June 30,
2016 | |
| | | | |
Net asset value, beginning of period | | $ | 24.45 | | | | | | | $ | 22.77 | | | | | | | $ | 20.46 | |
| | | | | | | | | | | | | | | | | | | | |
Income from investment operations: | | | | | | | | | | | | | | | | | | | | |
Net investment income | | | 0.05 | | | | | | | | 0.03 | | | | | | | | 0.03 | |
Net gains on investments (both realized and unrealized) | | | 6.57 | | | | | | | | 1.81 | | | | | | | | 2.28 | |
| | | | | | | | | | | | | | | | | | | | |
Total income from investment operations | | | 6.62 | | | | | | | | 1.84 | | | | | | | | 2.31 | |
| | | | | | | | | | | | | | | | | | | | |
Less distributions: | | | | | | | | | | | | | | | | | | | | |
Dividends from net investment income | | | (0.08 | ) | | | | | | | (0.16 | ) | | | | | | | - | |
Distributions from net realized gains | | | (1.17 | ) | | | | | | | - | | | | | | | | - | |
| | | | | | | | | | | | | | | | | | | | |
Total distributions | | | (1.25 | ) | | | | | | | (0.16 | ) | | | | | | | - | |
| | | | | | | | | | | | | | | | | | | | |
Net asset value, end of period | | $ | 29.82 | | | | | | | $ | 24.45 | | | | | | | $ | 22.77 | |
| | | | | | | | | | | | | | | | | | | | |
Total returnB | | | 27.06 | % | | | | | | | 8.06 | %C | | | | | | | 11.29 | %C |
| | | | | | | | | | | | | | | | | | | | |
|
Ratios and supplemental data: | |
Net assets, end of period | | $ | 2,016,161 | | | | | | | $ | 669,530 | | | | | | | $ | 401,220 | |
Ratios to average net assets: | | | | | | | | | | | | | | | | | | | | |
Expenses, before reimbursements | | | 1.13 | % | | | | | | | 1.09 | %D | | | | | | | 4.00 | %D |
Expenses, net of reimbursements | | | 0.91 | % | | | | | | | 0.91 | %D | | | | | | | 0.91 | %D |
Net investment income (loss), before expense reimbursements | | | 0.08 | % | | | | | | | 0.11 | %D | | | | | | | (2.69 | )%D |
Net investment income, net of reimbursements | | | 0.30 | % | | | | | | | 0.28 | %D | | | | | | | 0.40 | %D |
Portfolio turnover rate | | | 78 | % | | | | | | | 40 | %C | | | | | | | 100 | %E |
| A | Commencement of operations. |
| B | Based on net asset value, which does not reflect the sales charge, redemption fee, or contingent deferred sales charge, if applicable. May include adjustments in accordance with U.S. GAAP and as such, the net asset value for reporting purposes and the returns based upon those net asset values may differ from the net asset value and returns for shareholder transactions. |
| E | Portfolio turnover rate is for the period from February 5, 2016 through June 30, 2016 and is not annualized. |
| F | On December 15, 2017, pursuant to a plan of Reorganization on termination, the American Beacon Bridgeway Large Cap Growth II Fund (“Target Fund”) transferred all of its property and assets to the American Beacon Bridgeway Large Cap Growth Fund (“Acquiring Fund”) in exchange solely for voting shares of the Acquiring Fund and the assumption of the Target Fund’s liabilities. |
See accompanying notes
47
American Beacon Bridgeway Large Cap Growth FundSM
Financial Highlights
(For a share outstanding throughout the period)
| | | | | | | | | | | | | | | | | | | | |
| | | Investor Class | |
| | | Year Ended
December 31,
2017F | | | | | | Six Months
Ended
December 31,
2016 | | | | | | February 5,
2016A to
June 30,
2016 | |
| | | | |
Net asset value, beginning of period | | $ | 24.38 | | | | | | | $ | 22.74 | | | | | | | $ | 20.46 | |
| | | | | | | | | | | | | | | | | | | | |
Income (loss) from investment operations: | | | | | | | | | | | | | | | | | | | | |
Net investment income (loss) | | | (0.01 | ) | | | | | | | (0.01 | ) | | | | | | | 0.01 | |
Net gains on investments (both realized and unrealized) | | | 6.53 | | | | | | | | 1.81 | | | | | | | | 2.27 | |
| | | | | | | | | | | | | | | | | | | | |
Total income from investment operations | | | 6.52 | | | | | | | | 1.80 | | | | | | | | 2.28 | |
| | | | | | | | | | | | | | | | | | | | |
Less distributions: | | | | | | | | | | | | | | | | | | | | |
Dividends from net investment income | | | (0.08 | ) | | | | | | | (0.16 | ) | | | | | | | - | |
Distributions from net realized gains | | | (1.17 | ) | | | | | | | - | | | | | | | | - | |
| | | | | | | | | | | | | | | | | | | | |
Total distributions | | | (1.25 | ) | | | | | | | (0.16 | ) | | | | | | | - | |
| | | | | | | | | | | | | | | | | | | | |
Net asset value, end of period | | $ | 29.65 | | | | | | | $ | 24.38 | | | | | | | $ | 22.74 | |
| | | | | | | | | | | | | | | | | | | | |
Total returnB | | | 26.72 | % | | | | | | | 7.90 | %C | | | | | | | 11.14 | %C |
| | | | | | | | | | | | | | | | | | | | |
|
Ratios and supplemental data: | |
Net assets, end of period | | $ | 71,273,896 | | | | | | | $ | 399,798 | | | | | | | $ | 133,696 | |
Ratios to average net assets: | | | | | | | | | | | | | | | | | | | | |
Expenses, before reimbursements | | | 1.40 | % | | | | | | | 1.55 | %D | | | | | | | 8.43 | %D |
Expenses, net of reimbursements | | | 1.19 | % | | | | | | | 1.19 | %D | | | | | | | 1.18 | %D |
Net investment (loss), before expense reimbursements | | | (0.66 | )% | | | | | | | (0.35 | )%D | | | | | | | (7.08 | )%D |
Net investment income (loss), net of reimbursements | | | (0.45 | )% | | | | | | | 0.02 | %D | | | | | | | 0.17 | %D |
Portfolio turnover rate | | | 78 | % | | | | | | | 40 | %C | | | | | | | 100 | %E |
| A | Commencement of operations. |
| B | Based on net asset value, which does not reflect the sales charge, redemption fee, or contingent deferred sales charge, if applicable. May include adjustments in accordance with U.S. GAAP and as such, the net asset value for reporting purposes and the returns based upon those net asset values may differ from the net asset value and returns for shareholder transactions. |
| E | Portfolio turnover rate is for the period from February 5, 2016 through June 30, 2016 and is not annualized. |
| F | On December 15, 2017, pursuant to a plan of Reorganization on termination, the American Beacon Bridgeway Large Cap Growth II Fund (“Target Fund”) transferred all of its property and assets to the American Beacon Bridgeway Large Cap Growth Fund (“Acquiring Fund”) in exchange solely for voting shares of the Acquiring Fund and the assumption of the Target Fund’s liabilities. |
See accompanying notes
48
American Beacon Bridgeway Large Cap Growth FundSM
Financial Highlights
(For a share outstanding throughout the period)
| | | | | | | | | | | | | | | | | | | | |
| | | A Class | |
| | | Year Ended
December 31,
2017G | | | | | | Six Months
Ended
December 31,
2016 | | | | | | February 5,
2016A to
June 30,
2016 | |
| | | | |
Net asset value, beginning of period | | $ | 24.39 | | | | | | | $ | 22.74 | | | | | | | $ | 20.46 | |
| | | | | | | | | | | | | | | | | | | | |
Income from investment operations: | | | | | | | | | | | | | | | | | | | | |
Net investment income | | | 0.00 | F | | | | | | | 0.00 | F | | | | | | | 0.00 | F |
Net gains on investments (both realized and unrealized) | | | 6.54 | | | | | | | | 1.81 | | | | | | | | 2.28 | |
| | | | | | | | | | | | | | | | | | | | |
Total income (loss) from investment operations | | | 6.54 | | | | | | | | 1.81 | | | | | | | | 2.28 | |
| | | | | | | | | | | | | | | | | | | | |
Less distributions: | | | | | | | | | | | | | | | | | | | | |
Dividends from net investment income | | | (0.06 | ) | | | | | | | (0.16 | ) | | | | | | | - | |
Distributions from net realized gains | | | (1.17 | ) | | | | | | | - | | | | | | | | - | |
| | | | | | | | | | | | | | | | | | | | |
Total distributions | | | (1.23 | ) | | | | | | | (0.16 | ) | | | | | | | - | |
| | | | | | | | | | | | | | | | | | | | |
Net asset value, end of period | | $ | 29.70 | | | | | | | $ | 24.39 | | | | | | | $ | 22.74 | |
| | | | | | | | | | | | | | | | | | | | |
Total returnB | | | 26.79 | % | | | | | | | 7.94 | %C | | | | | | | 11.14 | %C |
| | | | | | | | | | | | | | | | | | | | |
|
Ratios and supplemental data: | |
Net assets, end of period | | $ | 4,625,607 | | | | | | | $ | 135,710 | | | | | | | $ | 159,744 | |
Ratios to average net assets: | | | | | | | | | | | | | | | | | | | | |
Expenses, before reimbursements | | | 1.44 | % | | | | | | | 1.43 | %D | | | | | | | 5.25 | %D |
Expenses, net of reimbursements | | | 1.21 | % | | | | | | | 1.21 | %D | | | | | | | 1.21 | %D |
Net investment income (loss), before expense reimbursements | | | (0.23 | )% | | | | | | | (0.26 | )%D | | | | | | | (4.01 | )%D |
Net investment income (loss), net of reimbursements | | | 0.00 | %H | | | | | | | (0.05 | )%D | | | | | | | 0.02 | %D |
Portfolio turnover rate | | | 78 | % | | | | | | | 40 | %C | | | | | | | 100 | %E |
| A | Commencement of operations. |
| B | Based on net asset value, which does not reflect the sales charge, redemption fee, or contingent deferred sales charge, if applicable. May include adjustments in accordance with U.S. GAAP and as such, the net asset value for reporting purposes and the returns based upon those net asset values may differ from the net asset value and returns for shareholder transactions. |
| E | Portfolio turnover rate is for the period from February 5, 2016 through June 30, 2016 and is not annualized. |
| F | Amounts are less than $0.01 per share. |
| G | On December 15, 2017, pursuant to a plan of Reorganization on termination, the American Beacon Bridgeway Large Cap Growth II Fund (“Target Fund”) transferred all of its property and assets to the American Beacon Bridgeway Large Cap Growth Fund (“Acquiring Fund”) in exchange solely for voting shares of the Acquiring Fund and the assumption of the Target Fund’s liabilities. |
| H | Amount rounds to less than 0.005%. |
See accompanying notes
49
American Beacon Bridgeway Large Cap Growth FundSM
Financial Highlights
(For a share outstanding throughout the period)
| | | | | | | | | | | | | | | | | | | | |
| | | C Class | |
| | | Year Ended
December 31,
2017F | | | | | | Six Months
Ended
December 31,
2016 | | | | | | February 5,
2016A to
June 30,
2016 | |
| | | | |
Net asset value, beginning of period | | $ | 24.22 | | | | | | | $ | 22.67 | | | | | | | $ | 20.46 | |
| | | | | | | | | | | | | | | | | | | | |
Income (loss) from investment operations: | | | | | | | | | | | | | | | | | | | | |
Net investment income (loss) | | | (0.10 | ) | | | | | | | (0.13 | ) | | | | | | | (0.04 | ) |
Net gains on investments (both realized and unrealized) | | | 6.35 | | | | | | | | 1.84 | | | | | | | | 2.25 | |
| | | | | | | | | | | | | | | | | | | | |
Total income from investment operations | | | 6.25 | | | | | | | | 1.71 | | | | | | | | 2.21 | |
| | | | | | | | | | | | | | | | | | | | |
Less distributions: | | | | | | | | | | | | | | | | | | | | |
Dividends from net investment income | | | - | | | | | | | | (0.16 | ) | | | | | | | - | |
Distributions from net realized gains | | | (1.17 | ) | | | | | | | - | | | | | | | | - | |
| | | | | | | | | | | | | | | | | | | | |
Total distributions | | | (1.17 | ) | | | | | | | (0.16 | ) | | | | | | | - | |
| | | | | | | | | | | | | | | | | | | | |
Net asset value, end of period | | $ | 29.30 | | | | | | | $ | 24.22 | | | | | | | $ | 22.67 | |
| | | | | | | | | | | | | | | | | | | | |
Total returnB | | | 25.78 | % | | | | | | | 7.52 | %C | | | | | | | 10.80 | %C |
| | | | | | | | | | | | | | | | | | | | |
|
Ratios and supplemental data: | |
Net assets, end of period | | $ | 769,559 | | | | | | | $ | 175,907 | | | | | | | $ | 244,146 | |
Ratios to average net assets: | | | | | | | | | | | | | | | | | | | | |
Expenses, before reimbursements | | | 2.09 | % | | | | | | | 2.18 | %D | | | | | | | 7.33 | %D |
Expenses, net of reimbursements | | | 1.96 | % | | | | | | | 1.96 | %D | | | | | | | 1.96 | %D |
Net investment (loss), before expense reimbursements | | | (0.90 | )% | | | | | | | (1.04 | )%D | | | | | | | (5.98 | )%D |
Net investment income (loss), net of reimbursements | | | (0.77 | )% | | | | | | | (0.81 | )%D | | | | | | | (0.62 | )%D |
Portfolio turnover rate | | | 78 | % | | | | | | | 40 | %C | | | | | | | 100 | %E |
| A | Commencement of operations. |
| B | Based on net asset value, which does not reflect the sales charge, redemption fee, or contingent deferred sales charge, if applicable. May include adjustments in accordance with U.S. GAAP and as such, the net asset value for reporting purposes and the returns based upon those net asset values may differ from the net asset value and returns for shareholder transactions. |
| E | Portfolio turnover rate is for the period from February 5, 2016 through June 30, 2016 and is not annualized. |
| F | On December 15, 2017, pursuant to a plan of Reorganization on termination, the American Beacon Bridgeway Large Cap Growth II Fund (“Target Fund”) transferred all of its property and assets to the American Beacon Bridgeway Large Cap Growth Fund (“Acquiring Fund”) in exchange solely for voting shares of the Acquiring Fund and the assumption of the Target Fund’s liabilities. |
See accompanying notes
50
American Beacon Bridgeway Large Cap Value FundSM
Financial Highlights
(For a share outstanding throughout the period)
| | | | | | | | | | | | | | | | | | | | | | | | | | | | | | | | | | | | |
| | | Institutional Class | |
| | | Year Ended December 31, | |
| | | 2017 | | | | | | 2016 | | | | | | 2015 | | | | | | 2014 | | | | | | 2013 | |
| | | | |
Net asset value, beginning of period | | $ | 26.08 | | | | | | | $ | 22.75 | | | | | | | $ | 23.89 | | | | | | | $ | 21.39 | | | | | | | $ | 15.85 | |
| | | | | | | | | | | | | | | | | | | | | | | | | | | | | | | | | | | | |
Income (loss) from investment operations: | | | | | | | | | | | | | | | | | | | | | | | | | | | | | | | | | | | | |
Net investment income | | | 0.37 | | | | | | | | 0.38 | | | | | | | | 0.28 | | | | | | | | 0.10 | | | | | | | | 0.11 | |
Net gains (losses) on investments (both realized and unrealized) | | | 3.78 | | | | | | | | 3.32 | | | | | | | | (0.58 | ) | | | | | | | 2.94 | | | | | | | | 5.87 | |
| | | | | | | | | | | | | | | | | | | | | | | | | | | | | | | | | | | | |
Total income (loss) from investment operations | | | 4.15 | | | | | | | | 3.70 | | | | | | | | (0.30 | ) | | | | | | | 3.04 | | | | | | | | 5.98 | |
| | | | | | | | | | | | | | | | | | | | | | | | | | | | | | | | | | | | |
Less distributions: | | | | | | | | | | | | | | | | | | | | | | | | | | | | | | | | | | | | |
Dividends from net investment income | | | (0.39 | ) | | | | | | | (0.35 | ) | | | | | | | (0.29 | ) | | | | | | | (0.17 | ) | | | | | | | (0.11 | ) |
Distributions from net realized gains | | | (1.27 | ) | | | | | | | (0.02 | ) | | | | | | | (0.55 | ) | | | | | | | (0.37 | ) | | | | | | | (0.33 | ) |
Tax return of capital | | | - | | | | | | | | - | | | | | | | | (0.00 | )A | | | | | | | - | | | | | | | | - | |
| | | | | | | | | | | | | | | | | | | | | | | | | | | | | | | | | | | | |
Total distributions | | | (1.66 | ) | | | | | | | (0.37 | ) | | | | | | | (0.84 | ) | | | | | | | (0.54 | ) | | | | | | | (0.44 | ) |
| | | | | | | | | | | | | | | | | | | | | | | | | | | | | | | | | | | | |
Net asset value, end of period | | $ | 28.57 | | | | | | | $ | 26.08 | | | | | | | $ | 22.75 | | | | | | | $ | 23.89 | | | | | | | $ | 21.39 | |
| | | | | | | | | | | | | | | | | | | | | | | | | | | | | | | | | | | | |
Total returnB | | | 15.88 | % | | | | | | | 16.24 | % | | | | | | | (1.23 | )% | | | | | | | 14.18 | % | | | | | | | 37.77 | % |
| | | | | | | | | | | | | | | | | | | | | | | | | | | | | | | | | | | | |
|
Ratios and supplemental data: | |
Net assets, end of period | | $ | 1,547,760,278 | | | | | | | $ | 1,185,013,905 | | | | | | | $ | 682,849,171 | | | | | | | $ | 313,660,568 | | | | | | | $ | 79,889,063 | |
Ratios to average net assets: | | | | | | | | | | | | | | | | | | | | | | | | | | | | | | | | | | | | |
Expenses, before reimbursements | | | 0.72 | % | | | | | | | 0.73 | % | | | | | | | 0.75 | % | | | | | | | 0.79 | % | | | | | | | 1.01 | % |
Expenses, net of reimbursements | | | 0.72 | % | | | | | | | 0.73 | % | | | | | | | 0.79 | % | | | | | | | 0.84 | % | | | | | | | 0.84 | % |
Net investment income, before expense reimbursements | | | 1.41 | % | | | | | | | 1.69 | % | | | | | | | 1.61 | % | | | | | | | 1.08 | % | | | | | | | 0.98 | % |
Net investment income, net of reimbursements | | | 1.41 | % | | | | | | | 1.69 | % | | | | | | | 1.57 | % | | | | | | | 1.04 | % | | | | | | | 1.16 | % |
Portfolio turnover rate | | | 48 | % | | | | | | | 56 | % | | | | | | | 43 | % | | | | | | | 31 | % | | | | | | | 38 | % |
| A | The distributions from return of capital is calculated based on outstanding shares at the time of distribution. Amounts are less than $0.01 per share. |
| B | Based on net asset value, which does not reflect the sales charge, redemption fee, or contingent deferred sales charge, if applicable. May include adjustments in accordance with U.S. GAAP and as such, the net asset value for reporting purposes and the returns based upon those net asset values may differ from the net asset value and returns for shareholder transactions. |
See accompanying notes
51
American Beacon Bridgeway Large Cap Value FundSM
Financial Highlights
(For a share outstanding throughout the period)
| | | | | | | | | | | | | | | | | | | | | | | | | | | | | | | | | | | | |
| | | Y Class | |
| | | Year Ended December 31, | |
| | | 2017 | | | | | | 2016 | | | | | | 2015 | | | | | | 2014 | | | | | | 2013 | |
| | | | |
Net asset value, beginning of period | | $ | 26.01 | | | | | | | $ | 22.69 | | | | | | | $ | 23.84 | | | | | | | $ | 21.35 | | | | | | | $ | 15.84 | |
| | | | | | | | | | | | | | | | | | | | | | | | | | | | | | | | | | | | |
Income (loss) from investment operations: | | | | | | | | | | | | | | | | | | | | | | | | | | | | | | | | | | | | |
Net investment income | | | 0.33 | | | | | | | | 0.32 | | | | | | | | 0.27 | | | | | | | | 0.13 | | | | | | | | 0.22 | |
Net gains (losses) on investments (both realized and unrealized) | | | 3.79 | | | | | | | | 3.35 | | | | | | | | (0.57 | ) | | | | | | | 2.90 | | | | | | | | 5.72 | |
| | | | | | | | | | | | | | | | | | | | | | | | | | | | | | | | | | | | |
Total income (loss) from investment operations | | | 4.12 | | | | | | | | 3.67 | | | | | | | | (0.30 | ) | | | | | | | 3.03 | | | | | | | | 5.94 | |
| | | | | | | | | | | | | | | | | | | | | | | | | | | | | | | | | | | | |
Less distributions: | | | | | | | | | | | | | | | | | | | | | | | | | | | | | | | | | | | | |
Dividends from net investment income | | | (0.37 | ) | | | | | | | (0.33 | ) | | | | | | | (0.30 | ) | | | | | | | (0.17 | ) | | | | | | | (0.10 | ) |
Distributions from net realized gains | | | (1.27 | ) | | | | | | | (0.02 | ) | | | | | | | (0.55 | ) | | | | | | | (0.37 | ) | | | | | | | (0.33 | ) |
Tax return of capital | | | - | | | | | | | | - | | | | | | | | (0.00 | )A | | | | | | | - | | | | | | | | - | |
| | | | | | | | | | | | | | | | | | | | | | | | | | | | | | | | | | | | |
Total distributions | | | (1.64 | ) | | | | | | | (0.35 | ) | | | | | | | (0.85 | ) | | | | | | | (0.54 | ) | | | | | | | (0.43 | ) |
| | | | | | | | | | | | | | | | | | | | | | | | | | | | | | | | | | | | |
Net asset value, end of period | | $ | 28.49 | | | | | | | $ | 26.01 | | | | | | | $ | 22.69 | | | | | | | $ | 23.84 | | | | | | | $ | 21.35 | |
| | | | | | | | | | | | | | | | | | | | | | | | | | | | | | | | | | | | |
Total returnB | | | 15.82 | % | | | | | | | 16.17 | % | | | | | | | (1.26 | )% | | | | | | | 14.15 | % | | | | | | | 37.55 | % |
| | | | | | | | | | | | | | | | | | | | | | | | | | | | | | | | | | | | |
|
Ratios and supplemental data: | |
Net assets, end of period | | $ | 1,547,228,114 | | | | | | | $ | 879,852,983 | | | | | | | $ | 414,585,125 | | | | | | | $ | 119,162,044 | | | | | | | $ | 19,913,753 | |
Ratios to average net assets: | | | | | | | | | | | | | | | | | | | | | | | | | | | | | | | | | | | | |
Expenses, before reimbursements | | | 0.79 | % | | | | | | | 0.80 | % | | | | | | | 0.81 | % | | | | | | | 0.84 | % | | | | | | | 0.93 | % |
Expenses, net of reimbursements | | | 0.79 | % | | | | | | | 0.80 | % | | | | | | | 0.81 | % | | | | | | | 0.85 | % | | | | | | | 0.94 | % |
Net investment income, before expense reimbursements | | | 1.35 | % | | | | | | | 1.63 | % | | | | | | | 1.55 | % | | | | | | | 1.03 | % | | | | | | | 1.07 | % |
Net investment income, net of reimbursements | | | 1.35 | % | | | | | | | 1.63 | % | | | | | | | 1.55 | % | | | | | | | 1.03 | % | | | | | | | 1.06 | % |
Portfolio turnover rate | | | 48 | % | | | | | | | 56 | % | | | | | | | 43 | % | | | | | | | 31 | % | | | | | | | 38 | % |
| A | The distributions from return of capital is calculated based on outstanding shares at the time of distribution. Amounts are less than $0.01 per share. |
| B | Based on net asset value, which does not reflect the sales charge, redemption fee, or contingent deferred sales charge, if applicable. May include adjustments in accordance with U.S. GAAP and as such, the net asset value for reporting purposes and the returns based upon those net asset values may differ from the net asset value and returns for shareholder transactions. |
See accompanying notes
52
American Beacon Bridgeway Large Cap Value FundSM
Financial Highlights
(For a share outstanding throughout the period)
| | | | | | | | | | | | | | | | | | | | | | | | | | | | | | | | | | | | |
| | | Investor Class | |
| | | Year Ended December 31, | |
| | | 2017 | | | | | | 2016 | | | | | | 2015 | | | | | | 2014 | | | | | | 2013 | |
| | | | |
Net asset value, beginning of period | | $ | 25.93 | | | | | | | $ | 22.64 | | | | | | | $ | 23.77 | | | | | | | $ | 21.28 | | | | | | | $ | 15.81 | |
| | | | | | | | | | | | | | | | | | | | | | | | | | | | | | | | | | | | |
Income (loss) from investment operations: | | | | | | | | | | | | | | | | | | | | | | | | | | | | | | | | | | | | |
Net investment income | | | 0.32 | | | | | | | | 0.27 | | | | | | | | 0.25 | | | | | | | | 0.14 | | | | | | | | 0.21 | |
Net gains (losses) on investments (both realized and unrealized) | | | 3.71 | | | | | | | | 3.31 | | | | | | | | (0.61 | ) | | | | | | | 2.82 | | | | | | | | 5.68 | |
| | | | | | | | | | | | | | | | | | | | | | | | | | | | | | | | | | | | |
Total income (loss) from investment operations | | | 4.03 | | | | | | | | 3.58 | | | | | | | | (0.36 | ) | | | | | | | 2.96 | | | | | | | | 5.89 | |
| | | | | | | | | | | | | | | | | | | | | | | | | | | | | | | | | | | | |
Less distributions: | | | | | | | | | | | | | | | | | | | | | | | | | | | | | | | | | | | | |
Dividends from net investment income | | | (0.28 | ) | | | | | | | (0.27 | ) | | | | | | | (0.22 | ) | | | | | | | (0.10 | ) | | | | | | | (0.09 | ) |
Distributions from net realized gains | | | (1.27 | ) | | | | | | | (0.02 | ) | | | | | | | (0.55 | ) | | | | | | | (0.37 | ) | | | | | | | (0.33 | ) |
Tax return of capital | | | - | | | | | | | | - | | | | | | | | (0.00 | )A | | | | | | | - | | | | | | | | - | |
| | | | | | | | | | | | | | | | | | | | | | | | | | | | | | | | | | | | |
Total distributions | | | (1.55 | ) | | | | | | | (0.29 | ) | | | | | | | (0.77 | ) | | | | | | | (0.47 | ) | | | | | | | (0.42 | ) |
| | | | | | | | | | | | | | | | | | | | | | | | | | | | | | | | | | | | |
Net asset value, end of period | | $ | 28.41 | | | | | | | $ | 25.93 | | | | | | | $ | 22.64 | | | | | | | $ | 23.77 | | | | | | | $ | 21.28 | |
| | | | | | | | | | | | | | | | | | | | | | | | | | | | | | | | | | | | |
Total returnB | | | 15.52 | % | | | | | | | 15.81 | % | | | | | | | (1.51 | )% | | | | | | | 13.89 | % | | | | | | | 37.28 | % |
| | | | | | | | | | | | | | | | | | | | | | | | | | | | | | | | | | | | |
|
Ratios and supplemental data: | |
Net assets, end of period | | $ | 1,387,184,369 | | | | | | | $ | 1,583,853,257 | | | | | | | $ | 977,719,149 | | | | | | | $ | 668,659,150 | | | | | | | $ | 274,113,476 | |
Ratios to average net assets: | | | | | | | | | | | | | | | | | | | | | | | | | | | | | | | | | | | | |
Expenses, before reimbursements | | | 1.06 | % | | | | | | | 1.08 | % | | | | | | | 1.09 | % | | | | | | | 1.11 | % | | | | | | | 1.08 | % |
Expenses, net of reimbursements | | | 1.06 | % | | | | | | | 1.08 | % | | | | | | | 1.09 | % | | | | | | | 1.11 | % | | | | | | | 1.09 | % |
Net investment income, before expense reimbursements | | | 1.04 | % | | | | | | | 1.35 | % | | | | | | | 1.28 | % | | | | | | | 0.76 | % | | | | | | | 0.95 | % |
Net investment income, net of reimbursements | | | 1.04 | % | | | | | | | 1.35 | % | | | | | | | 1.28 | % | | | | | | | 0.76 | % | | | | | | | 0.94 | % |
Portfolio turnover rate | | | 48 | % | | | | | | | 56 | % | | | | | | | 43 | % | | | | | | | 31 | % | | | | | | | 38 | % |
| A | The distributions from return of capital is calculated based on outstanding shares at the time of distribution. Amounts are less than $0.01 per share. |
| B | Based on net asset value, which does not reflect the sales charge, redemption fee, or contingent deferred sales charge, if applicable. May include adjustments in accordance with U.S. GAAP and as such, the net asset value for reporting purposes and the returns based upon those net asset values may differ from the net asset value and returns for shareholder transactions. |
See accompanying notes
53
American Beacon Bridgeway Large Cap Value FundSM
Financial Highlights
(For a share outstanding throughout the period)
| | | | | | | | | | | | | | | | | | | | | | | | | | | | | | | | | | | | |
| | | A Class | |
| | | Year Ended December 31, | |
| | | 2017 | | | | | | 2016 | | | | | | 2015 | | | | | | 2014 | | | | | | 2013 | |
| | | | |
Net asset value, beginning of period | | $ | 25.82 | | | | | | | $ | 22.53 | | | | | | | $ | 23.66 | | | | | | | $ | 21.22 | | | | | | | $ | 15.78 | |
| | | | | | | | | | | | | | | | | | | | | | | | | | | | | | | | | | | | |
Income (loss) from investment operations: | | | | | | | | | | | | | | | | | | | | | | | | | | | | | | | | | | | | |
Net investment income | | | 0.42 | | | | | | | | 0.32 | | | | | | | | 0.27 | | | | | | | | 0.09 | | | | | | | | 0.19 | |
Net gains (losses) on investments (both realized and unrealized) | | | 3.58 | | | | | | | | 3.24 | | | | | | | | (0.64 | ) | | | | | | | 2.84 | | | | | | | | 5.64 | |
| | | | | | | | | | | | | | | | | | | | | | | | | | | | | | | | | | | | |
Total income (loss) from investment operations | | | 4.00 | | | | | | | | 3.56 | | | | | | | | (0.37 | ) | | | | | | | 2.93 | | | | | | | | 5.83 | |
| | | | | | | | | | | | | | | | | | | | | | | | | | | | | | | | | | | | |
Less distributions: | | | | | | | | | | | | | | | | | | | | | | | | | | | | | | | | | | | | |
Dividends from net investment income | | | (0.23 | ) | | | | | | | (0.25 | ) | | | | | | | (0.21 | ) | | | | | | | (0.12 | ) | | | | | | | (0.06 | ) |
Distributions from net realized gains | | | (1.27 | ) | | | | | | | (0.02 | ) | | | | | | | (0.55 | ) | | | | | | | (0.37 | ) | | | | | | | (0.33 | ) |
Tax return of capital | | | - | | | | | | | | - | | | | | | | | (0.00 | )A | | | | | | | - | | | | | | | | - | |
| | | | | | | | | | | | | | | | | | | | | | | | | | | | | | | | | | | | |
Total distributions | | | (1.50 | ) | | | | | | | (0.27 | ) | | | | | | | (0.76 | ) | | | | | | | (0.49 | ) | | | | | | | (0.39 | ) |
| | | | | | | | | | | | | | | | | | | | | | | | | | | | | | | | | | | | |
Net asset value, end of period | | $ | 28.32 | | | | | | | $ | 25.82 | | | | | | | $ | 22.53 | | | | | | | $ | 23.66 | | | | | | | $ | 21.22 | |
| | | | | | | | | | | | | | | | | | | | | | | | | | | | | | | | | | | | |
Total returnB | | | 15.46 | % | | | | | | | 15.79 | % | | | | | | | (1.56 | )% | | | | | | | 13.76 | % | | | | | | | 37.01 | % |
| | | | | | | | | | | | | | | | | | | | | | | | | | | | | | | | | | | | |
|
Ratios and supplemental data: | |
Net assets, end of period | | $ | 96,229,248 | | | | | | | $ | 152,520,884 | | | | | | | $ | 147,394,607 | | | | | | | $ | 103,716,652 | | | | | | | $ | 31,300,069 | |
Ratios to average net assets: | | | | | | | | | | | | | | | | | | | | | | | | | | | | | | | | | | | | |
Expenses, before reimbursements | | | 1.08 | % | | | | | | | 1.12 | % | | | | | | | 1.12 | % | | | | | | | 1.19 | % | | | | | | | 1.38 | % |
Expenses, net of reimbursements | | | 1.08 | % | | | | | | | 1.12 | % | | | | | | | 1.12 | % | | | | | | | 1.21 | % | | | | | | | 1.34 | % |
Net investment income, before expense reimbursements | | | 1.01 | % | | | | | | | 1.31 | % | | | | | | | 1.25 | % | | | | | | | 0.69 | % | | | | | | | 0.61 | % |
Net investment income, net of reimbursements | | | 1.01 | % | | | | | | | 1.31 | % | | | | | | | 1.25 | % | | | | | | | 0.67 | % | | | | | | | 0.66 | % |
Portfolio turnover rate | | | 48 | % | | | | | | | 56 | % | | | | | | | 43 | % | | | | | | | 31 | % | | | | | | | 38 | % |
| A | The distributions from return of capital is calculated based on outstanding shares at the time of distribution. Amounts are less than $0.01 per share. |
| B | Based on net asset value, which does not reflect the sales charge, redemption fee, or contingent deferred sales charge, if applicable. May include adjustments in accordance with U.S. GAAP and as such, the net asset value for reporting purposes and the returns based upon those net asset values may differ from the net asset value and returns for shareholder transactions. |
See accompanying notes
54
American Beacon Bridgeway Large Cap Value FundSM
Financial Highlights
(For a share outstanding throughout the period)
| | | | | | | | | | | | | | | | | | | | | | | | | | | | | | | | | | | | |
| | | C Class | |
| | | Year Ended December 31, | |
| | | 2017 | | | | | | 2016 | | | | | | 2015 | | | | | | 2014 | | | | | | 2013 | |
| | | | |
Net asset value, beginning of period | | $ | 25.27 | | | | | | | $ | 22.08 | | | | | | | $ | 23.27 | | | | | | | $ | 21.00 | | | | | | | $ | 15.70 | |
| | | | | | | | | | | | | | | | | | | | | | | | | | | | | | | | | | | | |
Income (loss) from investment operations: | | | | | | | | | | | | | | | | | | | | | | | | | | | | | | | | | | | | |
Net investment income | | | 0.08 | | | | | | | | 0.13 | | | | | | | | 0.13 | | | | | | | | 0.02 | | | | | | | | 0.18 | |
Net gains (losses) on investments (both realized and unrealized) | | | 3.62 | | | | | | | | 3.16 | | | | | | | | (0.66 | ) | | | | | | | 2.69 | | | | | | | | 5.47 | |
| | | | | | | | | | | | | | | | | | | | | | | | | | | | | | | | | | | | |
Total income (loss) from investment operations | | | 3.70 | | | | | | | | 3.29 | | | | | | | | (0.53 | ) | | | | | | | 2.71 | | | | | | | | 5.65 | |
| | | | | | | | | | | | | | | | | | | | | | | | | | | | | | | | | | | | |
Less distributions: | | | | | | | | | | | | | | | | | | | | | | | | | | | | | | | | | | | | |
Dividends from net investment income | | | (0.07 | ) | | | | | | | (0.08 | ) | | | | | | | (0.11 | ) | | | | | | | (0.07 | ) | | | | | | | (0.02 | ) |
Distributions from net realized gains | | | (1.27 | ) | | | | | | | (0.02 | ) | | | | | | | (0.55 | ) | | | | | | | (0.37 | ) | | | | | | | (0.33 | ) |
Tax return of capital | | | - | | | | | | | | - | | | | | | | | (0.00 | )A | | | | | | | - | | | | | | | | - | |
| | | | | | | | | | | | | | | | | | | | | | | | | | | | | | | | | | | | |
Total distributions | | | (1.34 | ) | | | | | | | (0.10 | ) | | | | | | | (0.66 | ) | | | | | | | (0.44 | ) | | | | | | | (0.35 | ) |
| | | | | | | | | | | | | | | | | | | | | | | | | | | | | | | | | | | | |
Net asset value, end of period | | $ | 27.63 | | | | | | | $ | 25.27 | | | | | | | $ | 22.08 | | | | | | | $ | 23.27 | | | | | | | $ | 21.00 | |
| | | | | | | | | | | | | | | | | | | | | | | | | | | | | | | | | | | | |
Total returnB | | | 14.62 | % | | | | | | | 14.91 | % | | | | | | | (2.27 | )% | | | | | | | 12.88 | % | | | | | | | 36.02 | % |
| | | | | | | | | | | | | | | | | | | | | | | | | | | | | | | | | | | | |
| | | | | | | | | |
Ratios and supplemental data: | | | | | | | | | | | | | | | | | | | | | | | | | | | | | | | | | | | | |
Net assets, end of period | | $ | 102,553,616 | | | | | | | $ | 100,447,531 | | | | | | | $ | 84,411,378 | | | | | | | $ | 33,536,254 | | | | | | | $ | 2,346,463 | |
Ratios to average net assets: | | | | | | | | | | | | | | | | | | | | | | | | | | | | | | | | | | | | |
Expenses, before reimbursements | | | 1.83 | % | | | | | | | 1.86 | % | | | | | | | 1.87 | % | | | | | | | 1.92 | % | | | | | | | 2.13 | % |
Expenses, net of reimbursements | | | 1.83 | % | | | | | | | 1.86 | % | | | | | | | 1.87 | % | | | | | | | 1.94 | % | | | | | | | 2.09 | % |
Net investment income (loss), before expense reimbursements | | | 0.28 | % | | | | | | | 0.57 | % | | | | | | | 0.48 | % | | | | | | | (0.05 | )% | | | | | | | (0.13 | )% |
Net investment income (loss), net of reimbursements | | | 0.28 | % | | | | | | | 0.57 | % | | | | | | | 0.48 | % | | | | | | | (0.08 | )% | | | | | | | (0.08 | )% |
Portfolio turnover rate | | | 48 | % | | | | | | | 56 | % | | | | | | | 43 | % | | | | | | | 31 | % | | | | | | | 38 | % |
| A | The distributions from return of capital is calculated based on outstanding shares at the time of distribution. Amounts are less than $0.01 per share. |
| B | Based on net asset value, which does not reflect the sales charge, redemption fee, or contingent deferred sales charge, if applicable. May include adjustments in accordance with U.S. GAAP and as such, the net asset value for reporting purposes and the returns based upon those net asset values may differ from the net asset value and returns for shareholder transactions. |
See accompanying notes
55
American Beacon Bridgeway Large Cap Value FundSM
Financial Highlights
(For a share outstanding throughout the period)
| | | | | | | | |
| | | R6 Class | |
| | | April 28,
2017A to
December 31,
2017 | |
| | | | |
Net asset value, beginning of period | | $ | 26.73 | | | | | |
| | | | |
Income from investment operations: | | | | | | | | |
Net investment income | | | 0.11 | | | | | |
Net gains on investments (both realized and unrealized) | | | 3.37 | | | | | |
| | | | |
Total income from investment operations | | | 3.48 | | | | | |
| | | | |
Less distributions: | | | | | | | | |
Dividends from net investment income | | | (0.39 | ) | | | | |
Distributions from net realized gains | | | (1.27 | ) | | | | |
| | | | |
Total distributions | | | (1.66 | ) | | | | |
| | | | |
Net asset value, end of period | | $ | 28.55 | | | | | |
| | | | |
Total returnB | | | 13.01 | %C | | | | |
| | | | |
| |
Ratios and supplemental data: | | | | | |
Net assets, end of period | | $ | 91,521,786 | | | | | |
Ratios to average net assets: | | | | | | | | |
Expenses, before reimbursements | | | 0.75 | %D | | | | |
Expenses, net of reimbursements | | | 0.71 | %D | | | | |
Net investment income, before expense reimbursements | | | 1.44 | %D | | | | |
Net investment income, net of reimbursements | | | 1.48 | %D | | | | |
Portfolio turnover rate | | | 48 | %E | | | | |
| A | Commencement of operations. |
| B | Based on net asset value, which does not reflect the sales charge, redemption fee, or contingent deferred sales charge, if applicable. May include adjustments in accordance with U.S. GAAP and as such, the net asset value for reporting purposes and the returns based upon those net asset values may differ from the net asset value and returns for shareholder transactions. |
| E | Portfolio turnover is for the period from April 28, 2017 through December 31, 2017 and is not annualized. |
See accompanying notes
56
American Beacon FundsSM
Shareholder Meeting Report
December 31, 2017 (Unaudited)
A special meeting of Shareholders of the American Beacon Bridgeway Large Cap Growth II Fund, a series in the American Beacon Funds (the “Trust”), was held on December 14, 2017. The Shareholders approved the Plan of Reorganization and Termination to reorganize the American Beacon Large Cap Growth II Fund into the American Beacon Bridgeway Large Cap Growth Fund, another series of the Trust. Approval of this proposal required a majority of the outstanding voting securities of each Fund. The following are the results of the shareholder votes for this proposal:
| | | | | | |
For | | Against | | Abstain | | Non-Voting |
2,231,976.33 | | 59.90 | | 63,528.24 | | 1,028,075.45 |
57
American Beacon FundsSM
Federal Tax Information
December 31, 2017 (Unaudited)
The Funds are required to provide to Shareholders certain tax information based upon the Fund’s income and distribution for the taxable year ended December 31, 2017. The information and distributions reported herein may differ from information and distributions taxable to the shareholders for the calendar year ended December 31, 2017.
The Funds designated the following items with regard to distributions paid during the year ended December 31, 2017. All designations are based on financial information available as of this annual report and, accordingly, are subject to change. For each item, it is the intention of the Fund to designate the maximum amount permitted under the Internal Revenue Code of 1986, as amended, and the regulations there under.
| | | | | | | | | | | | |
| | | Bridgeway Large
Cap Growth Fund | | | | | | Bridgeway Large
Cap Value Fund | |
Corporate Dividends Received Deduction | | | 84.50 | % | | | | | | | 100.00 | % |
Qualified Dividend Income | | | 92.30 | % | | | | | | | 100.00 | % |
The Bridgeway Large Cap Growth Fund designated $6,899,820 as long-term capital gains distributions and $2,841,720 as short-term capital gains distributions for the year ended December 31, 2017. The Bridgeway Large Cap Value Fund designated $199,538,801 as long-term capital gains distributions and $4,500,620 as short-term capital gains distributions for the year ended December 31, 2017.
Shareholders received notification in January 2018 of the appropriate tax information necessary to prepare their 2017 income tax return.
58
Trustees and Officers of the American Beacon FundsSM (Unaudited)
The Trustees and officers of the American Beacon Funds (the “Trust”) are listed below, together with their principal occupations during the past five years. The address of each person listed below is 220 Las Colinas Boulevard East, Suite 1200, Irving, Texas 75039. Each Trustee oversees thirty-five funds in the fund complex that includes the Trust, the American Beacon Select Funds and the American Beacon Institutional Funds Trust. The Trust’s Statement of Additional Information contains additional information about the Trustees and is available without charge by calling 1-800-658-5811.
| | | | |
Name, Age and Address | | Position, Term of Office and Length of Time Served with the Trust | | Principal Occupation(s) During Past 5 Years and Current Directorships |
| INTERESTED TRUSTEES | | Term | | |
| | Lifetime of Trust until removal, resignation or retirement* | | |
| | |
| Alan D. Feld** (81) | | Trustee since 1996 | | Sole Shareholder of a professional corporation which is a Partner in the law firm of Akin, Gump, Strauss, Hauer & Feld, LLP (law firm) (1960-Present); Trustee, American Beacon Mileage Funds (1996-2012); Trustee, American Beacon Select Funds (1999-Present); Trustee, American Beacon Master Trust (1996-2012); Trustee, American Beacon Institutional Funds Trust (2017-Present). |
| | |
| NON-INTERESTED TRUSTEES | | Term | | |
| | Lifetime of Trust until removal, resignation or retirement* | | |
| | |
| Gilbert G. Alvarado (48) | | Trustee since 2015 | | Director, Kura MD, Inc. (local telehealth organization) (2015-present); Vice President & CFO, Sierra Health Foundation (health conversion private foundation) (2006-Present); Vice President & CFO, Sierra Health Foundation: Center for Health Program Management (California public benefit corporation) (2012-Present); Director, Innovative North State (2012-2015); Director, Sacramento Regional Technology Alliance (2011-2016); Director, Women’s Empowerment (2009-2014); Director, Valley Healthcare Staffing (2017-present); Trustee, American Beacon Select Funds (2015-Present); Trustee, American Beacon Institutional Funds Trust (2017-Present). |
| | |
| Joseph B. Armes (55) | | Trustee since 2015 | | Chairman & CEO, CSW Industrials f/k/a Capital Southwest Corporation (investment company) (2015-Present); Chairman of the Board of Capital Southwest Corporation, predecessor to CSW Industrials, Inc. (2014-present) (investment company); CEO, Capital Southwest Corporation (2013-2015); President & CEO, JBA Investment Partners (family investment vehicle) (2010-Present); Director and Chair of Audit Committee, RSP Permian (oil and gas producer) (2013-Present); Trustee, American Beacon Select Funds (2015-Present); Trustee, American Beacon Institutional Funds Trust (2017-Present). |
| | |
| Gerard J. Arpey (59) | | Trustee since 2012 | | Director, The Home Depot, Inc. (2015-Present); Partner, Emerald Creek Group (private equity firm) (2011-Present); Director, S.C. Johnson & Son, Inc. (privately held company) (2008-present); Trustee, American Beacon Select Funds (2012-Present); Trustee, American Beacon Institutional Funds Trust (2017-Present). |
| | |
| Brenda A. Cline (57) | | Trustee since 2004 | | Executive Vice President, Chief Financial Officer, Treasurer and Secretary, Kimbell Art Foundation (1993-Present); Director, Range Resources Corporation (oil and natural gas company) (2015-Present); Director, Tyler Technologies, Inc. (public sector software solutions company) (2014-Present); Trustee, American Beacon Mileage Funds (2004-2012); Trustee, American Beacon Select Funds (2004-Present); Trustee, American Beacon Master Trust (2004-2012); Trustee, American Beacon Institutional Funds Trust (2017-Present). |
59
Trustees and Officers of the American Beacon FundsSM (Unaudited)
| | | | |
Name, Age and Address | | Position, Term of Office and Length of Time Served with the Trust | | Principal Occupation(s) During Past 5 Years and Current Directorships |
| NON-INTERESTED TRUSTEES (CONT.) | | Term | | |
| | |
| Eugene J. Duffy (63) | | Trustee since 2008 | | Managing Director, Institutional Services, Intercontinental Real Estate Corporation (2014-Present); Principal and Executive Vice President, Paradigm Asset Management (1994-2014); Director, Sunrise Bank of Atlanta (2008-2013); Trustee, American Beacon Mileage Funds (2008-2012); Trustee, American Beacon Select Funds (2008-Present); Trustee, American Beacon Master Trust (2008-2012); Trustee, American Beacon Institutional Funds Trust (2017-Present). |
| | |
| Thomas M. Dunning*** (75) | | Trustee since 2008 | | Chairman Emeritus, Lockton Dunning Benefits (consulting firm in employee benefits) (2008-Present); Board Director, Oncor Electric Delivery Company LLC (2007-Present); Trustee, American Beacon Mileage Funds (2008-2012); Trustee, American Beacon Select Funds (2008-Present); Trustee, American Beacon Master Trust (2008-2012); Trustee, American Beacon Institutional Funds Trust (2017-Present). |
| | |
| Richard A. Massman (74) | | Trustee since 2004 Chairman since 2008 | | Consultant and General Counsel Emeritus, Hunt Consolidated, Inc. (holding company engaged in oil and gas exploration and production, refining, real estate, farming, ranching and venture capital activities) (2009-Present); Trustee, American Beacon Mileage Funds (2004-2012); Trustee, American Beacon Select Funds (2004-Present); Trustee, American Beacon Master Trust (2004-2012); Trustee, American Beacon Institutional Funds Trust (2017-Present). |
| | |
| Barbara J. McKenna, CFA (54) | | Trustee since 2012 | | Managing Principal, Longfellow Investment Management Company (2005-Present); Trustee, American Beacon Select Funds (2012-Present); Trustee, American Beacon Institutional Funds Trust (2017-Present). |
| | |
| R. Gerald Turner (72) | | Trustee since 2001 | | President, Southern Methodist University (1995-Present); Director, J.C. Penney Company, Inc. (1996-Present); Director, Kronus Worldwide Inc. (chemical manufacturing) (2003-Present); Trustee, American Beacon Mileage Funds (2001-2012); Trustee, American Beacon Select Funds (2001-Present); Trustee, American Beacon Master Trust (2001-2012); Trustee, American Beacon Institutional Funds Trust (2017-Present). |
| | |
| OFFICERS | | Term | | |
| | One Year | | |
| | |
| Gene L. Needles, Jr. (63) | | President since 2009 | | President, CEO and Director, American Beacon Advisors, Inc. (2009-Present); President, CEO and Director, Resolute Investment Managers, Inc. (2015-Present); President, CEO and Director, Resolute Acquisition, Inc. (2015-Present); President, CEO and Director, Resolute Topco, Inc. (2015-Present), President & CEO, Resolute Investment Holdings, LLC (2015-Present); President, CEO and Director, Lighthouse Holdings, Inc. (2009-2015); President and CEO, Lighthouse Holdings Parent, Inc. (2009-2015); Manager, President and CEO, American Private Equity Management, LLC (2012-Present); President, American Beacon Cayman Managed Futures Strategy Fund, Ltd. (2014-Present); Director, Chairman, President and CEO, Alpha Quant Advisors, LLC (2016-Present); Director, ARK Investment Management LLC (2016-Present); Director, Shapiro Capital Management LLC (2017-Present); Member, Investment Advisory Committee, Employees Retirement System of Texas (2017-Present); Trustee, American Beacon NextShares Trust (2015-Present); President, American Beacon Select Funds (2009-Present); President, American Beacon Mileage Funds (2009-2012); President, American Beacon Master Trust (2009-2012); President, American Beacon Institutional Funds Trust (2017-Present). |
60
Trustees and Officers of the American Beacon FundsSM (Unaudited)
| | | | |
Name, Age and Address | | Position, Term of Office and Length of Time Served with the Trust | | Principal Occupation(s) During Past 5 Years and Current Directorships |
| OFFICERS (CONT.) | | Term | | |
| | |
| Rosemary K. Behan (58) | | VP, Secretary and Chief Legal Officer since 2006 | | Vice President and Secretary, American Beacon Advisors, Inc. (2006-Present); Secretary, Resolute Investment Holdings, LLC (2015-Present) Secretary, Resolute Investment Managers, Inc. (2015-Present); Secretary, Resolute Topco, Inc. (2015-Present); Secretary, Resolute Acquisition, Inc. (2015-Present); Secretary, Lighthouse Holdings, Inc. (2008-2015); Secretary, Lighthouse Holdings Parent, Inc. (2008-2015); Secretary, American Private Equity Management, LLC (2008-Present); Secretary, American Beacon Cayman Managed Futures Strategy Fund, Ltd. (2014-Present); Secretary, Alpha Quant Advisors, LLC (2016-Present); Chief Legal Officer, Vice President and Secretary, American Beacon Select Funds (2006-Present); Chief Legal Officer, Vice President and Secretary, American Beacon Mileage Funds (2006-2012); Chief Legal Officer, Vice President and Secretary, American Beacon Master Trust (2006-2012); Chief Legal Officer, Vice President and Secretary, American Beacon Institutional Funds Trust (2017-Present). |
| | |
| Brian E. Brett (57) | | VP since 2004 | | Senior Vice President (2012-Present) and Vice President (2004-2012), American Beacon Advisors, Inc.; Vice President, American Beacon Select Funds (2004-Present); Vice President, American Beacon Mileage Funds (2004-2012); Vice President, American Beacon Master Trust (2004-2012); Vice President, American Beacon Institutional Funds Trust (2017-Present). |
| | |
| Paul B. Cavazos (48) | | VP since 2016 | | Senior Vice President, American Beacon Advisors, Inc. (2016-Present); Chief Investment Officer and Assistant Treasurer, DTE Energy (2007-2016); Vice President, American Beacon Select Funds (2016-Present); Vice President, American Beacon Institutional Funds Trust (2017-Present). |
| | |
| Erica Duncan (47) | | VP Since 2011 | | Vice President, American Beacon Advisors, Inc. (2011-Present); Vice President, American Beacon Select Funds (2011-Present); Vice President, American Beacon Mileage Funds (2011-2012); Vice President, American Beacon Master Trust (2011-2012); Vice President, American Beacon Institutional Funds Trust (2017-Present). |
| | |
| Melinda G. Heika (56) | | Treasurer since 2010 | | Treasurer, American Beacon Advisors, Inc. (2010-Present); Resolute Investment Managers, Inc. (2015-Present); Treasurer, Resolute Acquisition, Inc. (2015-Present); Treasurer, Resolute Topco, Inc. (2015-Present); Treasurer, Resolute Investment Holdings, LLC. (2015-Present); Treasurer, Lighthouse Holdings, Inc. (2010-2015); Treasurer, Lighthouse Holdings Parent Inc., (2010-2015); Treasurer, American Private Equity Management, LLC (2012-Present); Director and Treasurer, American Beacon Cayman Managed Futures Strategy Fund, Ltd. (2014-Present); Treasurer, American Beacon Select Funds (2010-Present); Treasurer, American Beacon Mileage Funds (2010-2012); Treasurer, American Beacon Master Trust (2010-2012); Treasurer, American Beacon Institutional Funds Trust (2017-Present). |
| | |
| Terri L. McKinney (54) | | VP since 2010 | | Vice President (2009-Present) and Managing Director (2003-2009), American Beacon Advisors, Inc.; Vice President, Resolute Investment Managers, Inc. (2017-Present); Vice President, Alpha Quant Advisors, LLC (2016-Present); Vice President, American Beacon Select Funds (2010-Present); Vice President, American Beacon Mileage Funds (2010-2012); Vice President, American Beacon Master Trust (2010-2012); Vice President, American Beacon Institutional Funds Trust (2017-Present). |
61
Trustees and Officers of the American Beacon FundsSM (Unaudited)
| | | | |
Name, Age and Address | | Position, Term of Office and Length of Time Served with the Trust | | Principal Occupation(s) During Past 5 Years and Current Directorships |
| OFFICERS (CONT.) | | Term | | |
| | |
| Jeffrey K. Ringdahl (42) | | VP since 2010 | | Senior Vice President (2013-Present), Vice President (2010-2013), and Director (2015-Present), American Beacon Advisors, Inc.; Vice President, American Beacon Select Funds (2010-Present); Vice President, American Beacon Mileage Funds (2010-2012); Vice President, American Beacon Master Trust (2010-2012); Senior Vice President (2012-Present) and Manager (2015-Present), American Private Equity Management, LLC; Senior Vice President, Lighthouse Holdings, Inc. (2013-2015); Senior Vice President, Lighthouse Holdings Parent, Inc. (2013-2015); Director and Vice President, American Beacon Cayman Managed Futures Strategy Fund, Ltd. (2014-Present); Trustee, American Beacon NextShares Trust (2015-Present); Director and Senior Vice Present, Resolute Investment Holdings, LLC (2015-Present); Director and Senior Vice President, Resolute Topco, Inc. (2015-Present); Director and Senior Vice President, Resolute Acquisition, Inc. (2015-Present); Director and Senior Vice President, Resolute Investment Managers, Inc. (2015-Present); Director, Executive Vice President and Chief Operating Officer, Alpha Quant Advisors, LLC (2016-Present); Vice President, American Beacon Institutional Funds Trust (2017-President); Director, Shapiro Capital Management, LLC (2017-Present). |
| | |
| Samuel J. Silver (54) | | VP Since 2011 | | Vice President, American Beacon Advisors, Inc. (2011-Present); Vice President, American Beacon Select Funds (2011-Present); Vice President, American Beacon Mileage Funds (2011-2012); Vice President, American Beacon Master Trust (2011-2012); American Beacon Institutional Funds Trust (2011-Present). |
| | |
| Christina E. Sears (46) | | Chief Compliance Officer since 2004 and Asst. Secretary since 1999 | | Chief Compliance Officer, American Beacon Advisors, Inc. (2004-Present); Chief Compliance Officer, American Private Equity Management, LLC (2012-Present); Chief Compliance Officer and Vice President, Alpha Quant Advisors, LLC (2016-Present); Chief Compliance Officer (2004-Present) and Assistant Secretary (1999-Present), American Beacon Select Funds; Chief Compliance Officer (2004-2012) and Assistant Secretary (1999-2012), American Beacon Mileage Funds; Chief Compliance Officer (2004-2012) and Assistant Secretary (1999-2012), American Beacon Master Trust; Chief Compliance Officer and Assistant Secretary, American Beacon Institutional Funds Trust (2017-Present). |
| | |
| Sonia L. Bates (61) | | Asst. Treasurer since 2011 | | Assistant Treasurer, American Beacon Advisors, Inc. (2011-Present); Assistant Treasurer, Resolute Investment Managers, Inc. (2015-Present); Assistant Treasurer, Resolute Acquisition, Inc. (2015-Present); Assistant. Treasurer, Resolute Topco, Inc. (2015-Present); Assistant Treasurer, Resolute Investment Holdings, LLC.; Assistant Treasurer, Lighthouse Holdings, Inc. (2011-2015); Assistant Treasurer, Lighthouse Holdings Parent Inc. (2011-2015); Assistant Treasurer, American Private Equity Management, LLC (2012-Present); Assistant Treasurer, American Beacon Select Funds (2011-Present); Assistant Treasurer American Beacon Mileage Funds (2011-2012); Assistant Treasurer, American Beacon Master Trust (2011-2012); Assistant Treasurer, American Beacon Institutional Funds Trust (2017-Present). |
| | |
| Shelley D. Abrahams (43) | | Assistant Secretary since 2008 | | Assistant Secretary, American Beacon Advisors, Inc. (2008-Present); Assistant Secretary, American Beacon Select Funds (2008-Present); Assistant Secretary, American Beacon Mileage Funds (2008-2012); Assistant Secretary, American Beacon Master Trust (2008-2012); Assistant Secretary, American Beacon Institutional Funds Trust (2017-Present). |
62
Trustees and Officers of the American Beacon FundsSM (Unaudited)
| | | | |
Name, Age and Address | | Position, Term of Office and Length of Time Served with the Trust | | Principal Occupation(s) During Past 5 Years and Current Directorships |
| OFFICERS (CONT.) | | Term | | |
| | |
| Rebecca L. Harris (51) | | Assistant Secretary since 2010 | | Vice President, American Beacon Advisors, Inc. (2016-Present); Vice President, Resolute Investment Managers, Inc. (2017-Present); Vice President, Alpha Quant Advisors, LLC (2016-Present); Assistant Secretary, American Beacon Select Funds (2010-Present); Assistant Secretary, American Beacon Mileage Funds (2010-2012); Assistant Secretary, American Beacon Master Trust (2010-2012); Assistant Secretary, American Beacon Institutional Funds Trust (2017-Present). |
| | |
| Diana N. Lai (42) | | Assistant Secretary since 2012 | | Assistant Secretary, American Beacon Advisors, Inc. (2012-Present); Assistant Secretary, American Beacon Select Funds (2012-Present); Assistant Secretary, American Beacon Institutional Funds Trust (2017-Present). |
| | |
| Teresa A. Oxford (59) | | Assistant Secretary since 2015 | | Assistant Secretary, American Beacon Advisors, Inc. (2015-Present); Assistant Secretary, Alpha Quant Advisors, LLC (2016-Present); Assistant Secretary, American Beacon Select Funds (2015-Present); Assistant Secretary, American Beacon Institutional Funds Trust (2017-Present). |
* As of 11/12/2014, the Board adopted a retirement plan that requires Trustees to retire no later than the last day of the calendar year in which they reach the age of 75.
** Mr. Feld is deemed to be an “interested person” of the Trusts, as defined by the 1940 Act. Mr. Feld’s law firm of Akin, Gump, Strauss, Hauer & Feld LLP has provided legal services within the past two fiscal years to one or more of the Trust’s sub-advisors.
*** Mr. Dunning retired as of 12/31/2017. Douglas A. Lindgren became a new Trustee to each of the Trusts on 1/1/2018.
63
American Beacon FundsSM
Privacy Policy
December 31, 2017 (Unaudited)
The American Beacon Funds recognize and respect the privacy of our shareholders. We are providing this notice to you so you will understand how shareholder information may be collected and used.
We may collect nonpublic personal information about you from one or more of the following sources:
| | • | | information we receive from you on applications or other forms; |
| | • | | information about your transactions with us or our service providers; and |
| | • | | information we receive from third parties. |
We do not disclose any nonpublic personal information about our customers or former customers to anyone, except as permitted by law.
We restrict access to your nonpublic personal information to those employees or service providers who need to know that information to provide products or services to you. To ensure the confidentiality of your nonpublic personal information, we maintain safeguards that comply with federal standards.
64

Delivery of Documents
eDelivery is NOW AVAILABLE – Stop traditional mail delivery and receive your
shareholder reports and summary prospectus on-line. Sign up at
www.americanbeaconfunds.com
If you invest in the Fund through a financial institution, you may be able to receive the Fund’s regulatory mailings, such as the Prospectus, Annual Report and Semi-Annual Report, by e-mail. If you are interested in this option, please go to www.icsdelivery.com and search for your financial institution’s name or contact your financial institution directly.
To obtain more information about the Fund:
| | |
 | |  |
| | |
| By E-mail: | | On the Internet: |
| american_beacon.funds@ambeacon.com | | Visit our website at www.americanbeaconfunds.com |
| | | |
| | | |
| | |

By Telephone: Call (800) 658-5811 | | 
By Mail: American Beacon Funds P.O. Box 219643 Kansas City, MO 64121-9643 |
| |
| |
| |
| | | |
| | | |
| Availability of Quarterly Portfolio Schedules | | Availability of Proxy Voting Policy and Records |
| | |
| In addition to the Schedule of Investments provided in each semi-annual and annual report, the Fund files a complete schedule of its portfolio holdings with the Securities and Exchange Commission (“SEC”) on Form N-Q as of the first and third fiscal quarters. The Fund’s Forms N-Q are available on the SEC’s website at www.sec.gov. The Forms N-Q may also be reviewed and copied at the SEC’s Public Reference Section, 100 F Street, NE, Washington, D.C. 20549-2736. Information regarding the operation of the SEC’s Public Reference Room may be obtained by calling (800)-SEC-0330. A complete schedule of the Fund’s portfolio holdings is also available at www.americanbeaconfunds.com approximately twenty days after the end of each month. | | A description of the policies and procedures the Fund uses to determine how to vote proxies relating to portfolio securities is available in the Fund’s Statement of Additional Information, is available free of charge on the Fund’s website www.americanbeaconfunds.com and by calling 1-800-967-9009 or by accessing the SEC’s website at www.sec.gov. The Fund’s proxy voting record for the most recent year ended June 30 is filed annually with the SEC on Form N-PX. The Fund’s Forms N-PX are available on the SEC’s website at www.sec.gov. The Fund’s proxy voting record may also be obtained by calling 1-800-967-9009. |
Fund Service Providers:
| | | | | | | | | | | | |
CUSTODIAN State Street Bank and Trust Boston, Massachusetts | | | | TRANSFER AGENT DST Asset Manager Solutions, Inc. Kansas City, Missouri | | | | INDEPENDENT REGISTERED PUBLIC ACCOUNTING FIRM Ernst & Young LLP Dallas, Texas | | | | DISTRIBUTOR Foreside Fund Services, LLC Portland, Maine |
This report is prepared for shareholders of the American Beacon Funds and may be distributed to others only if preceded or accompanied by a current Prospectus or Summary Prospectus.
American Beacon Funds, American Beacon Bridgeway Large Cap Growth Fund, and American Beacon Bridgeway Large Cap Value Fund are service marks of American Beacon Advisors, Inc.
AR 12/17

About American Beacon Advisors
Since 1986, American Beacon Advisors has offered a variety of products and investment advisory services to numerous institutional and retail clients, including a variety of mutual funds, corporate cash management, and separate account management.
Our clients include defined benefit plans, defined contribution plans, foundations, endowments, corporations, financial planners, and other institutional investors. With American Beacon Advisors, you can put the experience of a multi-billion dollar asset management firm to work for your company.
STEPHENS MID-CAP GROWTH FUND
Growth stocks typically are more volatile than value stocks; however, value stocks have a lower expected growth rate in earnings and sales. Investing in medium-capitalization stocks may involve greater volatility and lower liquidity than larger company stocks. Investing in foreign securities may involve heightened risk due to currency fluctuations and economic and political risks. The use of futures contracts for cash management may subject the Fund to losing more money than invested. The Fund participates in a securities lending program. Please see the prospectus for a complete discussion of the Fund’s risks. There can be no assurances that the investment objectives of this Fund will be met.
STEPHENS SMALL CAP GROWTH FUND
Growth stocks typically are more volatile than value stocks; however, value stocks have a lower expected growth rate in earnings and sales. Investing in small-capitalization stocks may involve greater volatility and lower liquidity than larger company stocks. Investing in foreign securities may involve heightened risk due to currency fluctuations and economic and political risks. The use of futures contracts for cash management may subject the Fund to losing more money than invested. The Fund participates in a securities lending program. Please see the prospectus for a complete discussion of the Fund’s risks. There can be no assurances that the investment objectives of this Fund will be met.
Any opinions herein, including forecasts, reflect our judgment as of the end of the reporting period and are subject to change. Each advisor’s strategies and each Fund’s portfolio composition will change depending on economic and market conditions. This report is not a complete analysis of market conditions, and, therefore, should not be relied upon as investment advice. Although economic and market information has been compiled from reliable sources, American Beacon Advisors, Inc. makes no representation as to the completeness or accuracy of the statements contained herein.
American Beacon Funds | December 31, 2017 |
Contents
President’s Message
| | |
 | | Dear Shareholders, At American Beacon, we are proud to offer a broad range of equity, fixed- income and alternative mutual fund products for institutions and individuals. Our mutual funds – which span the domestic, international, global, frontier and emerging markets – are sub-advised by experienced portfolio managers who employ distinctive investment processes to manage assets through a variety of economic and market conditions. Together, we work diligently to help our clients and shareholders meet their long-term financial goals. Institutional wisdom, enduring value. Since our inception as a pension fiduciary in 1986, American Beacon has focused on identifying and overseeing institutional investment managers and portfolio risk management. In 1987, we leveraged our size and experience to launch a series of sub-advised, multi- |
manager mutual funds providing individual investors access to many of the same institutional managers as our pension clients. Following the financial crisis in 2008, we saw that investors were looking for unique solutions from managers who were not necessarily mainstream. In 2010, we began offering mutual funds from single managers with distinctive investment styles or asset classes. As we continue to expand our family of funds, our solutions- based approach provides innovative investments.
Guiding principles. Our “manager of managers” philosophy is built on a long-standing history of innovative thinking, discipline and consistency in applying our solutions-based approach. As a manager of managers, our goal is to engage the most effective money managers for each asset class, investment style or market strategy – whether through a single sub-advisor or a combination of sub-advisors. Because we take our fiduciary responsibilities very seriously, our thorough manager evaluation and selection process is rigorous and ongoing. Our guiding principles – predictability, style consistency, competitive pricing and long-term relationships – provide a strong foundation for our due-diligence process. Our broad range of mutual funds helps investors navigate the economic storms and market downturns in the U.S. and abroad. Our years of experience evaluating sub-advisors have led us to identify and partner with asset managers who have adhered to their disciplined processes for many years and through multiple market cycles.
Focus on asset protection and risk mitigation. We strive to provide innovative, long-term products without gimmicks. From offering some of the first multi-manager funds, one of the first retirement-income funds and the first open-end mutual fund in the U.S. to focus primarily on frontier-market debt, our robust history includes applying a disciplined, solutions-based approach to our product development process to help protect assets and mitigate risk.
Thank you for your continued interest in American Beacon. For additional information about our funds or to access your account information, please visit our website at www.americanbeaconfunds.com.
Best Regards,

Gene L. Needles, Jr.
President
American Beacon Funds
1
Domestic Equity Market Overview
December 31, 2017 (Unaudited)
During the 12-month period ended December 31, 2017, domestic equity markets ignored any signs of investor skepticism that started the year as markets pushed into their ninth year of this long-running bull market. Volatility remained at suppressed levels within the S&P 500 Index, a broad measure of domestic equity markets, providing positive total returns every month and finishing the year up 21.83%. While large-cap stocks outpaced small-caps, growth stocks exhibited drastic outperformance versus value stocks across all market-cap styles. The Russell 2000 Growth Index outperformed the Russell 2000 Value Index by 14.33%, while the Russell 1000 Growth Index outperformed the Russell 1000 Value Index by 16.55%. While many investors were skeptical of the market’s advance in 2017, data during the year suggested the lift in domestic equities reflected the now-visible signs of globally synchronized economic strength.
In the first quarter of 2017, the U.S. equity markets achieved fresh, all-time highs, as optimism from the Trump administration’s “pro-growth” agenda spilled over from the fourth quarter of 2016. Despite failure to pass revisions to health-care legislation, the market remained upbeat toward Washington, D.C., on the premise of tax cuts, easing of business regulations and a boost to U.S. infrastructure investment. The economy displayed supportive evidence of further market advances and a March rate hike from the Federal Reserve (the “Fed”). The Purchasing Managers Index, the Consumer Confidence Index and the NFIB Small Business Optimism Index all flashed constructive data. During 2016, the S&P 500 Index’s trailing 12-month, year-over-year earnings growth inflected and turned positive after four quarters in negative territory. Large-caps outperformed small-caps, reversing trading patterns from the previous quarter, with Technology stocks leading the way.
In the second quarter, U.S. equities across all market caps delivered gains, shaking off growing concerns regarding the Trump administration’s ability to pass pro-growth measures and economic data that was less enthusiastic than the previous quarter, namely within Manufacturing and Consumer Health. Political uncertainty flared up after President Trump dismissed James Comey, the former FBI director. The Fed, however, delivered another 25 basis point (0.25%) rate hike and laid out plans to begin reducing its balance sheet after years of its unprecedented quantitative easing policy program. Large-cap stocks led the march higher for the second quarter, with reflationary sectors at the top – Health Care, Industrials and Financials.
In the third quarter, robust corporate earnings continued, increasing 11.6% on a trailing 12-month basis versus a year ago. Gross domestic product growth of 3.0% was released during the quarter, breaking out from the sub-3.0% growth seen in the economy since the lowest point of the financial crisis. Historic hurricanes were disruptive to Texas, Louisiana and Puerto Rico, but negative outcomes were determined to be transitory (ex-Puerto Rico), displaying the resiliency of U.S. industry. Despite concerns of stubbornly low inflation, the Fed confirmed its balance sheet roll-off beginning in October. Crude oil prices began to solidify above $50, a key support level, which boosted cyclical energy and industrial stocks. U.S. stocks across all capitalizations made gains.
In the fourth quarter, the U.S. economy and U.S. equities capped off a robust year as corporations delivered another quarter of strong earnings growth. The Technology sector, the best performing sector in the 12-month period, delivered particularly healthy results. The much-awaited Tax Cuts and Jobs Act of 2017 was passed by Congress and signed into law by President Trump on December 22. Markets jumped on this news as the permanent tax cut is expected to make U.S. companies more competitive than non-domestic peers. U.S. Treasury yields, led by the short end of the yield curve, rose during the quarter and caused interest-rate sensitive sectors, such as Real Estate and Utilities, to underperform the broader market. In December, the Fed lifted base rates for the third time during the year and lifted their U.S. 2018 economic growth forecast to 2.5% from 2.1%.
2
American Beacon Stephens Mid-Cap Growth FundSM
Performance Overview
December 31, 2017 (Unaudited)
The Investor Class of the American Beacon Stephens Mid-Cap Growth Fund (the “Fund”) returned 27.97% for the twelve months ended December 31, 2017. The Fund outperformed the Russell Midcap® Growth Index (the “Index”) return of 25.27% for the same period.
Comparison of Change in Value of a $10,000 Investment for the period from 12/31/2007 through 12/31/2017
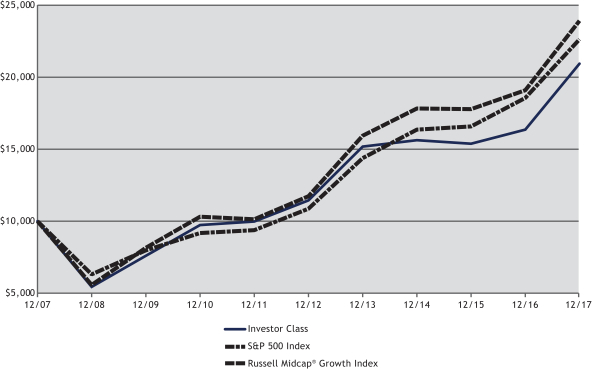
| | | | | | | | | | | | | | | | | | | | | | | | | | | | | | |
| Total Returns for the Period ended December 31, 2017 | | | | | | |
| | | Ticker | | 1 Year | | 3 Years | | 5 Years | | 10 Years | | Value of $10,000 12/31/2007- 12/31/2017 |
Institutional Class (1,2,7) | | SFMIX | | | | 28.38 | % | | | | 10.62 | % | | | | 13.26 | % | | | | 8.00 | % | | | $ | 21,598 | |
Y Class (1,3,7) | | SMFYX | | | | 28.27 | % | | | | 10.50 | % | | | | 13.13 | % | | | | 7.84 | % | | | $ | 21,275 | |
Investor Class (1,7) | | STMGX | | | | 27.97 | % | | | | 10.24 | % | | | | 12.85 | % | | | | 7.66 | % | | | $ | 20,919 | |
A without Sales Charge (1,4,7) | | SMFAX | | | | 27.93 | % | | | | 10.18 | % | | | | 12.79 | % | | | | 7.63 | % | | | $ | 20,856 | |
A with Sales Charge (1,4,7) | | SMFAX | | | | 20.57 | % | | | | 8.04 | % | | | | 11.46 | % | | | | 6.99 | % | | | $ | 19,661 | |
C without Sales Charge (1,5,7) | | SMFCX | | | | 26.93 | % | | | | 9.34 | % | | | | 11.91 | % | | | | 7.16 | % | | | $ | 19,971 | |
C with Sales Charge (1,5,7) | | SMFCX | | | | 25.93 | % | | | | 9.34 | % | | | | 11.91 | % | | | | 7.16 | % | | | $ | 19,971 | |
| | | | | | | | | | | | | | | | | | | | | | | | | | | | | | |
Russell Midcap® Growth Index (6) | | | | | | 25.27 | % | | | | 10.30 | % | | | | 15.30 | % | | | | 9.10 | % | | | $ | 23,895 | |
S&P 500 Index (6) | | | | | | 21.83 | % | | | | 11.41 | % | | | | 15.79 | % | | | | 8.50 | % | | | $ | 22,603 | |
| 1. | Performance shown is historical and is not indicative of future returns. Investment returns and principal value will vary, and shares may be worth more or less at redemption than at original purchase. Performance shown is calculated based on the published end of day net asset values as of date indicated, and current performance may be lower or higher than the performance data quoted. To obtain performance as of the most recent month end, please call 1-800-9687-9009 or visit www.americanbeaconfunds.com. Fund performance in the table above does not reflect the deduction of taxes a shareholder would pay on distributions or the redemption of shares. Generally accepted accounting principles require adjustments to be made to the net assets of the Fund at period end for financial reporting purposes only; and as such, the total return based on the unadjusted net asset value per share may differ from the total return reported in the financial highlights. Please note that the recent growth rate in the securities market has helped to produce short-term returns that are not typical and may not continue in the future. A portion of the fees charged to the Investor Class was waived from 2007 through 2013 and fully recovered in 2014 and 2015. Performance prior to waiving fees was lower than the actual returns shown from 2007 through 2013. |
| 2. | A portion of the fees charged to the Institutional Class has been waived since 2007. Performance prior to waiving fees was lower than the actual returns shown since 2007. |
3
American Beacon Stephens Mid-Cap Growth FundSM
Performance Overview
December 31, 2017 (Unaudited)
| 3. | Fund performance for the ten-year period represents the returns achieved by the Investor Class from 12/31/07 up to 2/14/12, the inception date of the Y Class, and the returns of the Y Class since its inception. Expenses of the Y Class are lower than those of the Investor Class. Therefore, total returns shown may be lower than they would have been had the Y Class been in existence since 12/31/07. A portion of the fees charged to the Y Class was waived in 2012 and 2013, fully recovered in 2014 and 2015, and waived in 2017. Performance prior to waiving fees was lower than the actual returns shown in 2012, 2013 and 2017. |
| 4. | Fund performance for the ten-year period represents the returns achieved by the Investor Class from 12/31/07 up to 2/24/12, the inception date of the A Class, and the returns of the A Class since its inception. Expenses of the A Class are higher than those of the Investor Class. Therefore, total returns shown may be higher than they would have been had the A Class been in existence since 12/31/07. A portion of the fees charged to the A Class was waived in 2012 and 2013, fully recovered in 2015 and waived in 2016 and 2017. Performance prior to waiving fees was lower than the actual returns shown in 2012, 2013, 2016 and 2017. A Class has a maximum sales charge of 5.75%. |
| 5. | Fund performance for the ten-year period represents the returns achieved by the Investor Class from 12/31/07 up to 2/14/12, the inception date of the C Class, and the returns of the C Class since its inception. Expenses of the C Class are higher than those of the Investor Class. Therefore, total returns shown may be higher than they would have been had the C Class been in existence since 12/31/07. A portion of the fees charged to the C Class was waived from 2012 through 2014, fully recovered in 2015 and waived in 2016 and 2017. Performance prior to waiving fees was lower than actual returns shown from 2012 through 2014 and in 2016 and 2017. The maximum contingent deferred sales charge for C Class is 1.00% for shares redeemed within one year of the date of purchase. |
| 6. | The S&P 500 Index is a market capitalization weighted index of common stocks publicly traded in the United States. The Russell Midcap® Growth Index is an unmanaged index of those stocks in the Russell Midcap Index with higher price-to-book ratios and higher forecasted growth values. Russell Midcap Index measures the performance of the 800 smallest companies in the Russell 1000 Index. Russell Midcap Index, Russell Midcap Growth Index and Russell 1000 Index are registered trademarks of Frank Russell Company. One cannot directly invest in an index. |
| 7. | The Total Annual Fund Operating Expense ratios set forth in the most recent Fund prospectus for the Institutional, Y, Investor, A, and C Class shares were 1.10%, 1.13%, 1.39%, 1.43%, and 2.20%, respectively. The expense ratios above may vary from the expense ratios presented in other sections of this report that are based on expenses incurred during the period covered by this report. |
The Fund outperformed the Index primarily due to stock selection, with sector allocation adding modest value relative to the Index. From a stock selection standpoint, holdings in the Information Technology and Consumer Staples sectors contributed the most to relative returns. In Information Technology, positions in Mercadolibre (up 108.5%), Cognex Corp. (up 96.5%) and IPG Photonics Corp. (up 117.1%) led in performance for the period. In Consumer Staples, the Fund avoided Rite Aid (down 76.1% for the period) and held Monster Beverage (up 42.6%) and Brown Forman Corp. (up 58.7%), which all benefited the portfolio.
In contrast, stock selection in the Consumer Discretionary sector detracted from relative returns, with Papa John’s down 36.5% and IMAX Corp. down 30.0%. Industrials also negatively impacted performance during the period, with Wageworks down 13.9% and Acuity Brands down 30.7%.
As it relates to sector allocation, the Fund’s overweight in Information Technology (the best performing sector), and underweights in both Consumer Discretionary and Consumer Staples contributed positively to returns relative to the benchmark. However, the Fund held a sizeable overweight to the Energy sector, which was the lowest performing sector, offsetting some of this positive performance. The Fund’s cash position was a drag on relative returns.
Looking forward, the Fund’s sub-advisor will continue to maintain a disciplined, long-term approach to equity investing in medium capitalization stocks with above-average growth potential.
4
American Beacon Stephens Mid-Cap Growth FundSM
Performance Overview
December 31, 2017 (Unaudited)
| | | | | | | | |
| Top Ten Holdings (% Net Assets) | | | | | | | | |
| SVB Financial Group | | | | | | | 1.9 | |
| MercadoLibre, Inc. | | | | | | | 1.9 | |
| Monster Beverage Corp. | | | | | | | 1.9 | |
| FLIR Systems, Inc. | | | | | | | 1.8 | |
| Microchip Technology, Inc. | | | | | | | 1.8 | |
| IDEXX Laboratories, Inc. | | | | | | | 1.7 | |
| CoStar Group, Inc. | | | | | | | 1.7 | |
| IPG Photonics Corp. | | | | | | | 1.7 | |
| MarketAxess Holdings, Inc. | | | | | | | 1.6 | |
| Burlington Stores, Inc. | | | | | | | 1.6 | |
| | |
| Total Fund Holdings | | | 96 | | | | | |
| | | | | | | | |
| Sector Allocation (% Equities) | | | | | | | | |
| Information Technology | | | | | | | 38.5 | |
| Health Care | | | | | | | 21.6 | |
| Consumer Discretionary | | | | | | | 14.4 | |
| Industrials | | | | | | | 12.3 | |
| Financials | | | | | | | 6.0 | |
| Energy | | | | | | | 3.9 | |
| Consumer Staples | | | | | | | 3.1 | |
| Materials | | | | | | | 0.2 | |
5
American Beacon Stephens Small Cap Growth FundSM
Performance Overview
December 31, 2017 (Unaudited)
The Investor Class of the American Beacon Stephens Small Cap Growth Fund (the “Fund”) returned 19.23% for the twelve months ended December 31, 2017, trailing the Russell 2000® Growth Index (the “Index”) return of 22.17% for the same period.
Comparison of Change in Value of a $10,000 Investment for the period from 12/31/2007 through 12/31/2017
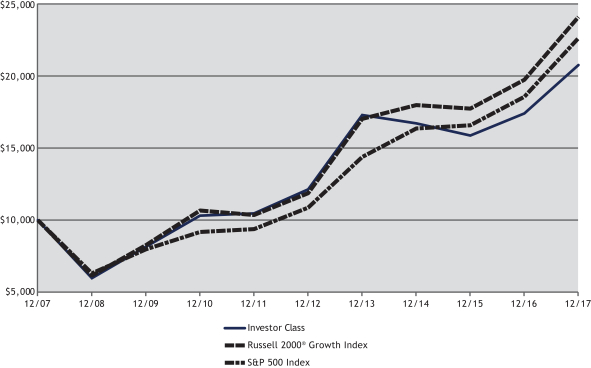
| | | | | | | | | | | | | | | | | | | | | | | | | | | | | | |
| Total Returns for the Period ended December 31, 2017 | | | | | | |
| | | Ticker | | 1 Year | | 3 Years | | 5 Years | | 10 Years | | Value of $10,000 12/31/2007- 12/31/2017 |
Institutional Class (1,2,7) | | STSIX | | | | 19.45 | % | | | | 7.78 | % | | | | 11.64 | % | | | | 7.84 | % | | | $ | 21,274 | |
Y Class (1,3,7) | | SPWYX | | | | 19.42 | % | | | | 7.67 | % | | | | 11.55 | % | | | | 7.69 | % | | | $ | 20,976 | |
Investor Class (1,7) | | STSGX | | | | 19.23 | % | | | | 7.50 | % | | | | 11.36 | % | | | | 7.57 | % | | | $ | 20,743 | |
A without Sales Charge (1,4,7) | | SPWAX | | | | 19.06 | % | | | | 7.39 | % | | | | 11.19 | % | | | | 7.47 | % | | | $ | 20,558 | |
A with Sales Charge (1,4,7) | | SPWAX | | | | 12.25 | % | | | | 5.29 | % | | | | 9.88 | % | | | | 6.84 | % | | | $ | 19,383 | |
C without Sales Charge (1,5,7) | | SPWCX | | | | 18.22 | % | | | | 6.56 | % | | | | 10.35 | % | | | | 7.00 | % | | | $ | 19,677 | |
C with Sales Charge (1,5,7) | | SPWCX | | | | 17.22 | % | | | | 6.56 | % | | | | 10.35 | % | | | | 7.00 | % | | | $ | 19,677 | |
| | | | | | | | | | | | | | | | | | | | | | | | | | | | | | |
Russell 2000® Growth Index (6) | | | | | | 22.17 | % | | | | 10.28 | % | | | | 15.21 | % | | | | 9.19 | % | | | $ | 24,089 | |
S&P 500 Index (6) | | | | | | 21.83 | % | | | | 11.41 | % | | | | 15.79 | % | | | | 8.50 | % | | | $ | 22,603 | |
| 1. | Performance shown is historical and is not indicative of future returns. Investment returns and principal value will vary, and shares may be worth more or less at redemption than at original purchase. Performance shown is calculated based on the published end of day net asset values as of date indicated, and current performance may be lower or higher than the performance data quoted. To obtain performance as of the most recent month end, please visit www.americanbeaconfunds.com or call 1-800-967-9009. Fund performance in the table above does not reflect the deduction of taxes a shareholder would pay on distributions or the redemption of shares. Please note that the recent growth rate in the securities market has helped to produce short-term returns that are not typical and may not continue in the future. A portion of the fees charged to the Investor Class was waived from 2007 through 2013, fully recovered in 2014, waived in 2015 and fully recovered in 2017. Performance prior to waiving fees was lower than actual returns shown from 2007 through 2013 and in 2015. |
| 2. | A portion of the fees charged to the Institutional Class was waived from 2007 through 2013 and fully recovered in 2014. Performance prior to waiving fees was lower than actual returns shown from 2007 through 2013. |
6
American Beacon Stephens Small Cap Growth FundSM
Performance Overview
December 31, 2017 (Unaudited)
| 3. | Fund performance for the ten-year period represents the returns achieved by the Investor Class from 12/31/07 up to 2/24/12, the inception date of the Y Class, and the returns of the Y Class since its inception. Expenses of the Y Class are lower than those of the Investor Class. Therefore, total returns shown may be lower than they would have been had the Y Class been in existence since 12/31/07. A portion of the fees charged to the Y Class was waived from 2007 through 2013, fully recovered in 2014, waived in 2015 and fully recovered in 2017. Performance prior to waiving fees was lower than actual returns shown from 2007 through 2013 and in 2015. |
| 4. | Fund performance for the ten-year period represents the returns achieved by the Investor Class from 12/31/07 up to 2/24/12, the inception date of the A Class, and the returns of the A Class since its inception. Expenses of the A Class are higher than those of the Investor Class. As a result, total returns shown may be higher than they would have been had the A Class been in existence since 12/31/07. A portion of the fees charged to the A Class was waived in 2012, partially recovered in 2013 and 2014, and fully recovered in 2015. Performance prior to waiving fees was lower than actual returns shown for 2012. A Class has a maximum sales charge of 5.75%. |
| 5. | Fund performance for the ten-year period represents the returns achieved by the Investor Class from 12/31/07 up to 2/24/12, the inception date of the C Class, and the returns of the C Class since its inception. Expenses of the C Class are higher than those of the Investor Class. As a result, total returns shown may be higher than they would have been had the C Class been in existence since 12/31/07. A portion of the fees charged to the C Class was waived in 2012, partially recovered in 2013 and 2014, and fully recovered in 2015. Performance prior to waiving fees was lower than actual returns shown for 2012. The maximum contingent deferred sales charge for C Class is 1.00% for shares redeemed within one year of the date of purchase. |
| 6. | The S&P 500 Index is a market capitalization weighted index of common stocks publicly traded in the United States. The Russell 2000® Growth Index is an unmanaged index of those stocks in the Russell 2000 Index with higher price-to-book ratios and higher forecasted growth values. The Russell 2000 Index is an unmanaged index of approximately 2000 smaller-capitalization stocks from various industrial sectors. The Russell 2000 Growth Index and the Russell 2000 Index are registered trademarks of Frank Russell Company. One cannot directly invest in an index. |
| 7. | The Total Annual Fund Operating Expense ratios set forth in the most recent Fund prospectus for the Institutional, Y, Investor, A, and C Class shares was 1.10%, 1.16%, 1.36%, 1.47% and 2.24%, respectively. The expense ratios above may vary from the expense ratios presented in other sections of this report that are based on expenses incurred during the period covered by this report. |
The Fund underperformed the Index due to sector allocation. A significant overweight to Energy (the worst performing sector for the Index) was the primary detractor from relative performance. A sizeable overweight to Information Technology further negatively impacted returns, while the Fund’s cash position dragged on relative performance for the period. In contrast, underweights to Real Estate, Consumer Discretionary and Health Care added modest value during the year, offsetting some of the negative relative performance.
Security selection added value for the period, led by positions in Information Technology, Industrials, Energy and Consumer Staples. In the Information Technology sector, Cognex Corp. (up 94.7%), Shopify, Inc. (up 140.6%) and Take Two Interactive Software (up 124.0%) were the largest contributors to performance. In Energy, Rice Energy, Inc. was up 9.1% while the Fund exited US Silica Holdings (down 45.4%), positively contributing to relative returns. MGP Ingredients (up 60.1%) and Calavo Growers (up 38.7%) contributed most to the Fund’s returns in Consumer Staples.
The aforementioned performance was somewhat offset by poor selection in the Fund’s Health Care, Consumer Discretionary and Materials sectors. In Health Care, being absent from the following companies detracted the most from relative performance: Nektar Therapeutics (up 386.7%), Exact Sciences Corp. (up 293.3%) and Sage Therapeutics (up 222.6%). In Consumer Discretionary, National Cinemedia was down 53.8%, IMAX Corp. down 30.2% and Papa John’s down 36.8%. And within Materials, Forterra, Inc. was down 67.4%, a further drag on returns for the period.
Looking forward, the Fund’s sub-advisor will continue to maintain a disciplined, long-term approach to equity investing in smaller capitalization stocks with above-average growth potential.
7
American Beacon Stephens Small Cap Growth FundSM
Performance Overview
December 31, 2017 (Unaudited)
| | | | | | | | |
| Top Ten Holdings (% Net Assets) | | | | | | | | |
| ICON PLC | | | | | | | 2.0 | |
| Proto Labs, Inc. | | | | | | | 1.8 | |
| CoStar Group, Inc. | | | | | | | 1.7 | |
| Calavo Growers, Inc. | | | | | | | 1.7 | |
| Ligand Pharmaceuticals, Inc. | | | | | | | 1.6 | |
| Take-Two Interactive Software, Inc. | | | | | | | 1.5 | |
| WageWorks, Inc. | | | | | | | 1.5 | |
| Proofpoint, Inc. | | | | | | | 1.5 | |
| Neogen Corp. | | | | | | | 1.5 | |
| Trex Co., Inc. | | | | | | | 1.4 | |
| | |
| Total Fund Holdings | | | 110 | | | | | |
| | | | | | | | |
| Sector Allocation (% Equities) | | | | | | | | |
| Information Technology | | | | | | | 37.8 | |
| Health Care | | | | | | | 20.7 | |
| Industrials | | | | | | | 17.1 | |
| Consumer Discretionary | | | | | | | 10.4 | |
| Financials | | | | | | | 6.9 | |
| Consumer Staples | | | | | | | 3.1 | |
| Energy | | | | | | | 2.5 | |
| Materials | | | | | | | 0.9 | |
| Telecommunication Services | | | | | | | 0.6 | |
8
American Beacon FundsSM
Expense Examples
December 31, 2017 (Unaudited)
Fund Expense Example
As a shareholder of a Fund, you incur two types of costs: (1) transaction costs, including sales charges (loads) on purchase payments and redemption fees, if applicable, and (2) ongoing costs, including management fees, distribution (12b-1) fees, sub-transfer agent fees, and other Fund expenses. The Examples are intended to help you understand the ongoing cost (in dollars) of investing in the Funds and to compare these costs with the ongoing costs of investing in other mutual funds. The Examples are based on an investment of $1,000 invested at the beginning of the period in each Class and held for the entire period from July 1, 2017 through December 31, 2017.
Actual Expenses
The “Actual” lines of the tables provide information about actual account values and actual expenses. You may use the information on this page, together with the amount you invested, to estimate the expenses that you paid over the period. Simply divide your account value by $1,000 (for example, an $8,600 account value divided by $1,000 = $8.60), then multiply the result by the “Expenses Paid During Period” to estimate the expenses you paid on your account during this period. Shareholders of the Investor and Institutional Classes that invest in the Funds through an IRA or Roth IRA may be subject to a custodial IRA fee of $15 that is typically deducted each December. If your account was subject to a custodial IRA fee during the period, your costs would have been $15 higher.
Hypothetical Example for Comparison Purposes
The “Hypothetical” lines of the tables provide information about hypothetical account values and hypothetical expenses based on the Funds’ actual expense ratio and an assumed 5% per year rate of return before expenses (not the Funds’ actual return). You may compare the ongoing costs of investing in the Funds with other funds by contrasting this 5% hypothetical example and the 5% hypothetical examples that appear in the shareholder reports of the other funds. The hypothetical account values and expenses may not be used to estimate the actual ending account balance or expenses you paid for the period. Shareholders of the Investor and Institutional Classes that invest in the Funds through an IRA or Roth IRA may be subject to a custodial IRA fee of $15 that is typically deducted each December. If your account was subject to a custodial IRA fee during the period, your costs would have been $15 higher.
You should also be aware that the expenses shown in the table highlight only your ongoing costs and do not reflect any transaction costs charged by the Funds, such as sales charges (loads) or redemption fees, as applicable. Similarly, the expense examples for other funds do not reflect any transaction costs charged by those funds, such as sales charges (loads), redemption fees or exchange fees. Therefore, the “Hypothetical” lines of the tables are useful in comparing ongoing costs only and will not help you determine the relative total costs of owning different funds. If you were subject to any transaction costs during the period, your costs would have been higher.
9
American Beacon FundsSM
Expense Examples
December 31, 2017 (Unaudited)
| | | | | | | | | | | | | | | |
| American Beacon Stephens Mid-Cap Growth Fund | |
| | | Beginning Account Value
7/1/2017 | | Ending Account Value
12/31/2017 | | Expenses Paid During
Period
7/1/2017-12/31/2017* |
| Institutional Class | | | | | | | | | | | | | | | |
| Actual | | | | $1,000.00 | | | | | $1,117.10 | | | | | $5.28 | |
| Hypothetical** | | | | $1,000.00 | | | | | $1,020.20 | | | | | $5.04 | |
| Y Class | | | | | | | | | | | | | | | |
| Actual | | | | $1,000.00 | | | | | $1,116.60 | | | | | $5.82 | |
| Hypothetical** | | | | $1,000.00 | | | | | $1,019.70 | | | | | $5.55 | |
| Investor Class | | | | | | | | | | | | | | | |
| Actual | | | | $1,000.00 | | | | | $1,115.60 | | | | | $6.61 | |
| Hypothetical** | | | | $1,000.00 | | | | | $1,019.00 | | | | | $6.31 | |
| A Class | | | | | | | | | | | | | | | |
| Actual | | | | $1,000.00 | | | | | $1,115.40 | | | | | $7.36 | |
| Hypothetical** | | | | $1,000.00 | | | | | $1,018.20 | | | | | $7.02 | |
| C Class | | | | | | | | | | | | | | | |
| Actual | | | | $1,000.00 | | | | | $1,110.90 | | | | | $11.07 | |
| Hypothetical** | | | | $1,000.00 | | | | | $1,014.70 | | | | | $10.56 | |
| * | Expenses are equal to the Fund’s annualized expense ratios for the six-month period of 0.99%, 1.09%, 1.24%, 1.38%, and 2.08% for the Institutional, Y, Investor, A, and C Classes, respectively, multiplied by the average account value over the period, multiplied by the number derived by dividing the number of days in the most recent fiscal half-year (184) by days in the year (365) to reflect the half-year period. |
| ** | 5% return before expenses. |
| | | | | | | | | | | | | | | |
| American Beacon Stephens Small Cap Growth Fund | |
| | | Beginning Account Value
7/1/2017 | | Ending Account Value
12/31/2017 | | Expenses Paid During
Period
7/1/2017-12/31/2017* |
| Institutional Class | | | | | | | | | | | | | | | |
| Actual | | | | $1,000.00 | | | | | $1,101.40 | | | | | $5.77 | |
| Hypothetical** | | | | $1,000.00 | | | | | $1,019.70 | | | | | $5.55 | |
| Y Class | | | | | | | | | | | | | | | |
| Actual | | | | $1,000.00 | | | | | $1,101.40 | | | | | $6.09 | |
| Hypothetical** | | | | $1,000.00 | | | | | $1,019.40 | | | | | $5.85 | |
| Investor Class | | | | | | | | | | | | | | | |
| Actual | | | | $1,000.00 | | | | | $1,100.40 | | | | | $6.94 | |
| Hypothetical** | | | | $1,000.00 | | | | | $1,018.60 | | | | | $6.67 | |
| A Class | | | | | | | | | | | | | | | |
| Actual | | | | $1,000.00 | | | | | $1,099.50 | | | | | $7.20 | |
| Hypothetical** | | | | $1,000.00 | | | | | $1,018.30 | | | | | $6.92 | |
| C Class | | | | | | | | | | | | | | | |
| Actual | | | | $1,000.00 | | | | | $1,095.80 | | | | | $10.99 | |
| Hypothetical** | | | | $1,000.00 | | | | | $1,014.70 | | | | | $10.56 | |
| * | Expenses are equal to the Fund’s annualized expense ratios for the six-month period of 1.09%, 1.15%, 1.31%, 1.36%, and 2.08% for the Institutional, Y, Investor, A, and C Classes, respectively, multiplied by the average account value over the period, multiplied by the number derived by dividing the number of days in the most recent fiscal half-year (184) by days in the year (365) to reflect the half-year period. |
| ** | 5% return before expenses. |
10
American Beacon FundsSM
Report of Independent Registered Public Accounting Firm
To the Shareholders of American Beacon Stephens Mid-Cap Growth Fund and American Beacon Stephens Small Cap Growth Fund and Board of Trustees of American Beacon Funds
Opinion on the Financial Statements
We have audited the accompanying statements of assets and liabilities of American Beacon Stephens Mid-Cap Growth Fund and American Beacon Stephens Small Cap Growth Fund (collectively referred to as the “Funds), (two of the funds constituting American Beacon Funds (the “Trust”)), including the schedules of investments, as of December 31, 2017, and the related statements of operations for the year then ended, the statements of changes in net assets for each of the two years in the period then ended, the financial highlights for each of the five years in the period then ended and the related notes (collectively referred to as the “financial statements”). In our opinion, the financial statements present fairly, in all material respects, the financial position of the Funds (two of the funds constituting American Beacon Funds) at December 31, 2017, the results of their operations for the year then ended, the changes in their net assets for each of the two years in the period then ended and their financial highlights for each of the five years in the period then ended, in conformity with U.S. generally accepted accounting principles.
Basis for Opinion
These financial statements are the responsibility of the Trust’s management. Our responsibility is to express an opinion on the Funds’ financial statements based on our audits. We are a public accounting firm registered with the Public Company Accounting Oversight Board (United States) (“PCAOB”) and are required to be independent with respect to the Trust in accordance with the U.S. federal securities laws and the applicable rules and regulations of the Securities and Exchange Commission and the PCAOB.
We conducted our audits in accordance with the standards of the PCAOB. Those standards require that we plan and perform the audit to obtain reasonable assurance about whether the financial statements are free of material misstatement, whether due to error or fraud. The Trust is not required to have, nor were we engaged to perform, an audit of the Trust’s internal control over financial reporting. As part of our audits, we are required to obtain an understanding of internal control over financial reporting, but not for the purpose of expressing an opinion on the effectiveness of the Trust’s internal control over financial reporting. Accordingly, we express no such opinion.
Our audits included performing procedures to assess the risks of material misstatement of the financial statements, whether due to error or fraud, and performing procedures that respond to those risks. Such procedures included examining, on a test basis, evidence regarding the amounts and disclosures in the financial statements. Our procedures included confirmation of securities owned as of December 31, 2017, by correspondence with the custodian and brokers or by other appropriate auditing procedures where replies from brokers were not received. Our audits also included evaluating the accounting principles used and significant estimates made by management, as well as evaluating the overall presentation of the financial statements. We believe that our audits provide a reasonable basis for our opinion.

We have served as the auditor of one or more American Beacon investment companies since 1987.
Dallas, Texas
February 28, 2018
11
American Beacon Stephens Mid-Cap Growth FundSM
Schedule of Investments
December 31, 2017
| | | | | | | | | | | | | | | |
| | | Shares | | | | Fair Value |
| | | | | | | | | | | | | | | |
| COMMON STOCKS - 99.86% | | | | | | | | | | | | | | | |
| Consumer Discretionary - 14.37% | | | | | | | | | | | | | | | |
| Automobiles - 0.58% | | | | | | | | | | | | | | | |
| Tesla, Inc.A B | | | | 1,815 | | | | | | | | | $ | 565,100 | |
| | | | | | | | | | | | | | | |
| | | | | | | | | | | | | | | |
| Distributors - 1.20% | | | | | | | | | | | | | | | |
| LKQ Corp.A | | | | 28,675 | | | | | | | | | | 1,166,212 | |
| | | | | | | | | | | | | | | |
| | | | | | | | | | | | | | | |
| Diversified Consumer Services - 1.14% | | | | | | | | | | | | | | | |
| Bright Horizons Family Solutions, Inc.A | | | | 11,812 | | | | | | | | | | 1,110,328 | |
| | | | | | | | | | | | | | | |
| | | | | | | | | | | | | | | |
| Hotels, Restaurants & Leisure - 1.46% | | | | | | | | | | | | | | | |
| Domino’s Pizza, Inc. | | | | 2,953 | | | | | | | | | | 557,999 | |
| MGM Resorts International | | | | 21,674 | | | | | | | | | | 723,695 | |
| Papa John’s International, Inc. | | | | 2,451 | | | | | | | | | | 137,525 | |
| | | | | | | | | | | | | | | |
| | | | | | | | | | | | | | 1,419,219 | |
| | | | | | | | | | | | | | | |
| | | | | | | | | | | | | | | |
| Internet & Direct Marketing Retail - 2.77% | | | | | | | | | | | | | | | |
| Expedia, Inc. | | | | 10,077 | | | | | | | | | | 1,206,922 | |
| Netflix, Inc.A | | | | 7,726 | | | | | | | | | | 1,483,083 | |
| | | | | | | | | | | | | | | |
| | | | | | | | | | | | | | 2,690,005 | |
| | | | | | | | | | | | | | | |
| | | | | | | | | | | | | | | |
| Media - 1.51% | | | | | | | | | | | | | | | |
| IMAX Corp.A | | | | 20,039 | | | | | | | | | | 463,903 | |
| Live Nation Entertainment, Inc.A | | | | 23,401 | | | | | | | | | | 996,181 | |
| | | | | | | | | | | | | | | |
| | | | | | | | | | | | | | 1,460,084 | |
| | | | | | | | | | | | | | | |
| | | | | | | | | | | | | | | |
| Specialty Retail - 4.46% | | | | | | | | | | | | | | | |
| Burlington Stores, Inc.A | | | | 12,588 | | | | | | | | | | 1,548,702 | |
| Ross Stores, Inc. | | | | 17,545 | | | | | | | | | | 1,407,986 | |
| Ulta Salon Cosmetics & Fragrance, Inc.A | | | | 6,107 | | | | | | | | | | 1,365,892 | |
| | | | | | | | | | | | | | | |
| | | | | | | | | | | | | | 4,322,580 | |
| | | | | | | | | | | | | | | |
| | | | | | | | | | | | | | | |
| Textiles, Apparel & Luxury Goods - 1.25% | | | | | | | | | | | | | | | |
| Lululemon Athletica, Inc.A | | | | 15,378 | | | | | | | | | | 1,208,557 | |
| | | | | | | | | | | | | | | |
| | | | | | | | | | | | | | | |
Total Consumer Discretionary | | | | | | | | | | | | | | 13,942,085 | |
| | | | | | | | | | | | | | | |
| | | | | | | | | | | | | | | |
| Consumer Staples - 3.08% | | | | | | | | | | | | | | | |
| Beverages - 3.08% | | | | | | | | | | | | | | | |
| Brown-Forman Corp., Class B | | | | 17,275 | | | | | | | | | | 1,186,274 | |
| Monster Beverage Corp.A | | | | 28,497 | | | | | | | | | | 1,803,575 | |
| | | | | | | | | | | | | | | |
| | | | | | | | | | | | | | 2,989,849 | |
| | | | | | | | | | | | | | | |
| | | | | | | | | | | | | | | |
Total Consumer Staples | | | | | | | | | | | | | | 2,989,849 | |
| | | | | | | | | | | | | | | |
| | | | | | | | | | | | | | | |
| Energy - 3.88% | | | | | | | | | | | | | | | |
| Energy Equipment & Services - 1.77% | | | | | | | | | | | | | | | |
| Core Laboratories N.V.B | | | | 7,708 | | | | | | | | | | 844,411 | |
| Oceaneering International, Inc. | | | | 20,364 | | | | | | | | | | 430,495 | |
| RPC, Inc.B | | | | 17,275 | | | | | | | | | | 441,031 | |
| | | | | | | | | | | | | | | |
| | | | | | | | | | | | | | 1,715,937 | |
| | | | | | | | | | | | | | | |
| | | | | | | | | | | | | | | |
| Oil, Gas & Consumable Fuels - 2.11% | | | | | | | | | | | | | | | |
| Cabot Oil & Gas Corp. | | | | 33,682 | | | | | | | | | | 963,305 | |
| Pioneer Natural Resources Co. | | | | 4,522 | | | | | | | | | | 781,628 | |
| Range Resources Corp. | | | | 17,894 | | | | | | | | | | 305,272 | |
| | | | | | | | | | | | | | | |
| | | | | | | | | | | | | | 2,050,205 | |
| | | | | | | | | | | | | | | |
| | | | | | | | | | | | | | | |
Total Energy | | | | | | | | | | | | | | 3,766,142 | |
| | | | | | | | | | | | | | | |
See accompanying notes
12
American Beacon Stephens Mid-Cap Growth FundSM
Schedule of Investments
December 31, 2017
| | | | | | | | | | | | | | | |
| | | Shares | | | | Fair Value |
| | | | | | | | | | | | | | | |
| COMMON STOCKS - 99.86% (continued) | | | | | | | | | | | | | | | |
| Financials - 5.96% | | | | | | | | | | | | | | | |
| Banks - 3.21% | | | | | | | | | | | | | | | |
| East West Bancorp, Inc. | | | | 20,553 | | | | | | | | | $ | 1,250,239 | |
| SVB Financial GroupA | | | | 7,995 | | | | | | | | | | 1,868,991 | |
| | | | | | | | | | | | | | | |
| | | | | | | | | | | | | | 3,119,230 | |
| | | | | | | | | | | | | | | |
| | | | | | | | | | | | | | | |
| Capital Markets - 2.75% | | | | | | | | | | | | | | | |
| Affiliated Managers Group, Inc. | | | | 5,434 | | | | | | | | | | 1,115,328 | |
| MarketAxess Holdings, Inc. | | | | 7,693 | | | | | | | | | | 1,552,063 | |
| | | | | | | | | | | | | | | |
| | | | | | | | | | | | | | 2,667,391 | |
| | | | | | | | | | | | | | | |
| | | | | | | | | | | | | | | |
Total Financials | | | | | | | | | | | | | | 5,786,621 | |
| | | | | | | | | | | | | | | |
| | | | | | | | | | | | | | | |
| Health Care - 21.56% | | | | | | | | | | | | | | | |
| Biotechnology - 1.19% | | | | | | | | | | | | | | | |
| Alexion Pharmaceuticals, Inc.A | | | | 5,168 | | | | | | | | | | 618,041 | |
| Exelixis, Inc.A | | | | 17,598 | | | | | | | | | | 534,979 | |
| | | | | | | | | | | | | | | |
| | | | | | | | | | | | | | 1,153,020 | |
| | | | | | | | | | | | | | | |
| | | | | | | | | | | | | | | |
| Health Care Equipment & Supplies - 8.82% | | | | | | | | | | | | | | | |
| ABIOMED, Inc.A | | | | 5,328 | | | | | | | | | | 998,521 | |
| Align Technology, Inc.A | | | | 1,358 | | | | | | | | | | 301,734 | |
| Dentsply Sirona, Inc. | | | | 11,457 | | | | | | | | | | 754,214 | |
| DexCom, Inc.A | | | | 12,329 | | | | | | | | | | 707,561 | |
| Hologic, Inc.A | | | | 22,733 | | | | | | | | | | 971,836 | |
| IDEXX Laboratories, Inc.A | | | | 10,766 | | | | | | | | | | 1,683,587 | |
| Intuitive Surgical, Inc.A | | | | 3,367 | | | | | | | | | | 1,228,753 | |
| ResMed, Inc. | | | | 15,905 | | | | | | | | | | 1,346,995 | |
| Varian Medical Systems, Inc.A | | | | 5,149 | | | | | | | | | | 572,311 | |
| | | | | | | | | | | | | | | |
| | | | | | | | | | | | | | 8,565,512 | |
| | | | | | | | | | | | | | | |
| | | | | | | | | | | | | | | |
| Health Care Providers & Services - 1.81% | | | | | | | | | | | | | | | |
| Acadia Healthcare Co., Inc.A | | | | 21,467 | | | | | | | | | | 700,468 | |
| Henry Schein, Inc.A | | | | 15,084 | | | | | | | | | | 1,054,070 | |
| | | | | | | | | | | | | | | |
| | | | | | | | | | | | | | 1,754,538 | |
| | | | | | | | | | | | | | | |
| | | | | | | | | | | | | | | |
| Health Care Technology - 4.38% | | | | | | | | | | | | | | | |
| athenahealth, Inc.A | | | | 6,999 | | | | | | | | | | 931,147 | |
| Cerner Corp.A | | | | 19,907 | | | | | | | | | | 1,341,533 | |
| HMS Holdings Corp.A | | | | 53,896 | | | | | | | | | | 913,537 | |
| Medidata Solutions, Inc.A | | | | 16,761 | | | | | | | | | | 1,062,145 | |
| | | | | | | | | | | | | | | |
| | | | | | | | | | | | | | 4,248,362 | |
| | | | | | | | | | | | | | | |
| | | | | | | | | | | | | | | |
| Life Sciences Tools & Services - 4.70% | | | | | | | | | | | | | | | |
| ICON PLCA | | | | 11,020 | | | | | | | | | | 1,235,893 | |
| Illumina, Inc.A | | | | 6,867 | | | | | | | | | | 1,500,371 | |
| PRA Health Sciences, Inc.A | | | | 10,091 | | | | | | | | | | 918,987 | |
| QIAGEN N.V.A | | | | 29,362 | | | | | | | | | | 908,167 | |
| | | | | | | | | | | | | | | |
| | | | | | | | | | | | | | 4,563,418 | |
| | | | | | | | | | | | | | | |
| | | | | | | | | | | | | | | |
| Pharmaceuticals - 0.66% | | | | | | | | | | | | | | | |
| Pacira Pharmaceuticals, Inc.A | | | | 13,968 | | | | | | | | | | 637,639 | |
| | | | | | | | | | | | | | | |
| | | | | | | | | | | | | | | |
Total Health Care | | | | | | | | | | | | | | 20,922,489 | |
| | | | | | | | | | | | | | | |
| | | | | | | | | | | | | | | |
| Industrials - 12.26% | | | | | | | | | | | | | | | |
| Aerospace & Defense - 0.56% | | | | | | | | | | | | | | | |
| HEICO Corp., Class A | | | | 6,819 | | | | | | | | | | 539,042 | |
| | | | | | | | | | | | | | | |
See accompanying notes
13
American Beacon Stephens Mid-Cap Growth FundSM
Schedule of Investments
December 31, 2017
| | | | | | | | | | | | | | | |
| | | Shares | | | | Fair Value |
| | | | | | | | | | | | | | | |
| COMMON STOCKS - 99.86% (continued) | | | | | | | | | | | | | | | |
| Industrials - 12.26% (continued) | | | | | | | | | | | | | | | |
| Commercial Services & Supplies - 1.30% | | | | | | | | | | | | | | | |
| Copart, Inc.A | | | | 29,119 | | | | | | | | | $ | 1,257,650 | |
| | | | | | | | | | | | | | | |
| | | | | | | | | | | | | | | |
| Electrical Equipment - 1.68% | | | | | | | | | | | | | | | |
| Rockwell Automation, Inc. | | | | 4,478 | | | | | | | | | | 879,255 | |
| Sensata Technologies Holding N.V.A | | | | 14,715 | | | | | | | | | | 752,084 | |
| | | | | | | | | | | | | | | |
| | | | | | | | | | | | | | 1,631,339 | |
| | | | | | | | | | | | | | | |
| | | | | | | | | | | | | | | |
| Industrial Conglomerates - 0.91% | | | | | | | | | | | | | | | |
| Roper Technologies, Inc. | | | | 3,425 | | | | | | | | | | 887,075 | |
| | | | | | | | | | | | | | | |
| | | | | | | | | | | | | | | |
| Machinery - 0.52% | | | | | | | | | | | | | | | |
| Middleby Corp.A | | | | 3,760 | | | | | | | | | | 507,412 | |
| | | | | | | | | | | | | | | |
| | | | | | | | | | | | | | | |
| Professional Services - 3.82% | | | | | | | | | | | | | | | |
| IHS Markit Ltd.A | | | | 17,917 | | | | | | | | | | 808,953 | |
| Verisk Analytics, Inc.A | | | | 16,009 | | | | | | | | | | 1,536,864 | |
| WageWorks, Inc.A | | | | 21,870 | | | | | | | | | | 1,355,940 | |
| | | | | | | | | | | | | | | |
| | | | | | | | | | | | | | 3,701,757 | |
| | | | | | | | | | | | | | | |
| | | | | | | | | | | | | | | |
| Road & Rail - 1.19% | | | | | | | | | | | | | | | |
| JB Hunt Transport Services, Inc. | | | | 10,080 | | | | | | | | | | 1,158,998 | |
| | | | | | | | | | | | | | | |
| | | | | | | | | | | | | | | |
| Trading Companies & Distributors - 2.28% | | | | | | | | | | | | | | | |
| Fastenal Co. | | | | 20,232 | | | | | | | | | | 1,106,488 | |
| MSC Industrial Direct Co., Inc., Class A | | | | 11,447 | | | | | | | | | | 1,106,467 | |
| | | | | | | | | | | | | | | |
| | | | | | | | | | | | | | 2,212,955 | |
| | | | | | | | | | | | | | | |
| | | | | | | | | | | | | | | |
Total Industrials | | | | | | | | | | | | | | 11,896,228 | |
| | | | | | | | | | | | | | | |
| | | | | | | | | | | | | | | |
| Information Technology - 38.52% | | | | | | | | | | | | | | | |
| Communications Equipment - 2.08% | | | | | | | | | | | | | | | |
| Harris Corp. | | | | 8,155 | | | | | | | | | | 1,155,156 | |
| Palo Alto Networks, Inc.A | | | | 5,962 | | | | | | | | | | 864,132 | |
| | | | | | | | | | | | | | | |
| | | | | | | | | | | | | | 2,019,288 | |
| | | | | | | | | | | | | | | |
| | | | | | | | | | | | | | | |
| Electronic Equipment, Instruments & Components - 6.02% | | | | | | | | | | | | | | | |
| Cognex Corp. | | | | 23,960 | | | | | | | | | | 1,465,394 | |
| FLIR Systems, Inc. | | | | 38,095 | | | | | | | | | | 1,775,989 | |
| IPG Photonics Corp.A | | | | 7,571 | | | | | | | | | | 1,621,178 | |
| National Instruments Corp. | | | | 23,557 | | | | | | | | | | 980,678 | |
| | | | | | | | | | | | | | | |
| | | | | | | | | | | | | | 5,843,239 | |
| | | | | | | | | | | | | | | |
| | | | | | | | | | | | | | | |
| Internet Software & Services - 4.31% | | | | | | | | | | | | | | | |
| CoStar Group, Inc.A | | | | 5,513 | | | | | | | | | | 1,637,085 | |
| GrubHub, Inc.A B | | | | 10,001 | | | | | | | | | | 718,072 | |
| MercadoLibre, Inc. | | | | 5,792 | | | | | | | | | | 1,822,511 | |
| | | | | | | | | | | | | | | |
| | | | | | | | | | | | | | 4,177,668 | |
| | | | | | | | | | | | | | | |
| | | | | | | | | | | | | | | |
| IT Services - 5.51% | | | | | | | | | | | | | | | |
| Euronet Worldwide, Inc.A | | | | 13,037 | | | | | | | | | | 1,098,628 | |
| Fiserv, Inc.A | | | | 5,812 | | | | | | | | | | 762,128 | |
| Global Payments, Inc. | | | | 11,163 | | | | | | | | | | 1,118,979 | |
| Square, Inc., Class AA | | | | 26,849 | | | | | | | | | | 930,855 | |
| WEX, Inc.A | | | | 10,187 | | | | | | | | | | 1,438,710 | |
| | | | | | | | | | | | | | | |
| | | | | | | | | | | | | | 5,349,300 | |
| | | | | | | | | | | | | | | |
| | | | | | | | | | | | | | | |
See accompanying notes
14
American Beacon Stephens Mid-Cap Growth FundSM
Schedule of Investments
December 31, 2017
| | | | | | | | | | | | | | | |
| | | Shares | | | | Fair Value |
| | | | | | | | | | | | | | | |
| COMMON STOCKS - 99.86% (continued) | | | | | | | | | | | | | | | |
| Information Technology - 38.52% (continued) | | | | | | | | | | | | | | | |
| Semiconductors & Semiconductor Equipment - 5.63% | | | | | | | | | | | | | | | |
| Lam Research Corp. | | | | 4,640 | | | | | | | | | $ | 854,085 | |
| Microchip Technology, Inc. | | | | 19,412 | | | | | | | | | | 1,705,926 | |
| NVIDIA Corp. | | | | 3,919 | | | | | | | | | | 758,326 | |
| NXP Semiconductors N.V.A | | | | 5,208 | | | | | | | | | | 609,805 | |
| ON Semiconductor Corp.A | | | | 22,502 | | | | | | | | | | 471,192 | |
| Xilinx, Inc. | | | | 15,735 | | | | | | | | | | 1,060,854 | |
| | | | | | | | | | | | | | | |
| | | | | | | | | | | | | | 5,460,188 | |
| | | | | | | | | | | | | | | |
| | | | | | | | | | | | | | | |
| Software - 14.97% | | | | | | | | | | | | | | | |
| ANSYS, Inc.A | | | | 5,659 | | | | | | | | | | 835,212 | |
| Aspen Technology, Inc.A | | | | 18,955 | | | | | | | | | | 1,254,821 | |
| Autodesk, Inc.A | | | | 11,854 | | | | | | | | | | 1,242,655 | |
| Cadence Design Systems, Inc.A | | | | 32,433 | | | | | | | | | | 1,356,348 | |
| Check Point Software Technologies Ltd.A | | | | 4,706 | | | | | | | | | | 487,636 | |
| Electronic Arts, Inc.A | | | | 12,188 | | | | | | | | | | 1,280,471 | |
| Fortinet, Inc.A | | | | 19,850 | | | | | | | | | | 867,246 | |
| PTC, Inc.A | | | | 11,262 | | | | | | | | | | 684,392 | |
| Red Hat, Inc.A | | | | 10,164 | | | | | | | | | | 1,220,696 | |
| salesforce.com, Inc.A | | | | 7,107 | | | | | | | | | | 726,549 | |
| Splunk, Inc.A | | | | 9,329 | | | | | | | | | | 772,814 | |
| Tableau Software, Inc., Class AA | | | | 10,594 | | | | | | | | | | 733,105 | |
| Take-Two Interactive Software, Inc.A | | | | 11,177 | | | | | | | | | | 1,227,011 | |
| Tyler Technologies, Inc.A | | | | 3,297 | | | | | | | | | | 583,734 | |
| Ultimate Software Group, Inc.A | | | | 5,762 | | | | | | | | | | 1,257,441 | |
| | | | | | | | | | | | | | | |
| | | | | | | | | | | | | | 14,530,131 | |
| | | | | | | | | | | | | | | |
| | | | | | | | | | | | | | | |
Total Information Technology | | | | | | | | | | | | | | 37,379,814 | |
| | | | | | | | | | | | | | | |
| | | | | | | | | | | | | | | |
| Materials - 0.23% | | | | | | | | | | | | | | | |
| Chemicals - 0.23% | | | | | | | | | | | | | | | |
| Albemarle Corp. | | | | 1,743 | | | | | | | | | | 222,912 | |
| | | | | | | | | | | | | | | |
| | | | | | | | | | | | | | | |
Total Common Stocks (Cost $62,391,739) | | | | | | | | | | | | | | 96,906,140 | |
| | | | | | | | | | | | | | | |
| | | | | | | | | | | | | | | |
| SHORT-TERM INVESTMENTS - 0.31% (Cost $295,830) | | | | | | | | | | | | | | | |
| Investment Companies - 0.31% | | | | | | | | | | | | | | | |
| American Beacon U.S. Government Money Market Select Fund, Select Class, 1.13%C D | | | | 295,830 | | | | | | | | | | 295,830 | |
| | | | | | | | | | | | | | | |
| | | | | | | | | | | | | | | |
| SECURITIES LENDING COLLATERAL - 1.91% (Cost $1,853,081) | | | | | | | | | | | | | | | |
| Investment Companies - 1.91% | | | | | | | | | | | | | | | |
| American Beacon U.S. Government Money Market Select Fund, Select Class, 1.13%C D | | | | 1,853,081 | | | | | | | | | | 1,853,081 | |
| | | | | | | | | | | | | | | |
| | | | | | | | | | | | | | | |
TOTAL INVESTMENTS - 102.08% (Cost $64,540,650) | | | | | | | | | | | | | | 99,055,051 | |
LIABILITIES, NET OF OTHER ASSETS - (2.08%) | | | | | | | | | | | | | | (2,014,748 | ) |
| | | | | | | | | | | | | | | |
TOTAL NET ASSETS - 100.00% | | | | | | | | | | | | | $ | 97,040,303 | |
| | | | | | | | | | | | | | | |
| | | | | | | | | | | | | | | |
| Percentages are stated as a percent of net assets. | | | | | | | | | | | | | | | |
A Non-income producing security.
B All or a portion of this security is on loan at December 31, 2017.
C The Fund is affiliated by having the same investment advisor.
D 7-day yield.
PLC - Public Limited Company.
See accompanying notes
15
American Beacon Stephens Mid-Cap Growth FundSM
Schedule of Investments
December 31, 2017
The Fund’s investments are summarized by level based on the inputs used to determine their values. As of December 31, 2017, the investments were classified as described below:
| | | | | | | | | | | | | | | | | | | | | | | | | | | | |
Stephens Mid-Cap Growth Fund | | Level 1 | | | | | | Level 2 | | | | | | Level 3 | | | | | | Total | |
Assets | | | | | | | | | | | | | | | | | | | | | | | | | | | | |
Common Stocks | | $ | 96,906,140 | | | | | | | $ | - | | | | | | | $ | - | | | | | | | $ | 96,906,140 | |
Short-Term Investments | | | 295,830 | | | | | | | | - | | | | | | | | - | | | | | | | | 295,830 | |
Securities Lending Collateral | | | 1,853,081 | | | | | | | | - | | | | | | | | - | | | | | | | | 1,853,081 | |
| | | | | | | | | | | | | | | | | | | | | | | | | | | | |
Total Investments in Securities - Assets | | $ | 99,055,051 | | | | | | | $ | - | | | | | | | $ | - | | | | | | | $ | 99,055,051 | |
| | | | | | | | | | | | | | | | | | | | | | | | | | | | |
U.S. GAAP requires all transfers between any levels to be disclosed. The end of period timing recognition has been adopted for the transfers between levels of the Fund’s assets and liabilities. During the period ended December 31, 2017, there were no transfers between levels.
See accompanying notes
16
American Beacon Stephens Small Cap Growth FundSM
Schedule of Investments
December 31, 2017
| | | | | | | | | | | | | | | |
| | | Shares | | | | Fair Value |
| | | | | | | | | | | | | | | |
| COMMON STOCKS - 99.44% | | | | | | | | | | | | | | | |
| Consumer Discretionary - 10.35% | | | | | | | | | | | | | | | |
| Auto Components - 0.57% | | | | | | | | | | | | | | | |
| Motorcar Parts of America, Inc.A | | | | 130,714 | | | | | | | | | $ | 3,266,543 | |
| | | | | | | | | | | | | | | |
| | | | | | | | | | | | | | | |
| Diversified Consumer Services - 1.76% | | | | | | | | | | | | | | | |
| Bright Horizons Family Solutions, Inc.A | | | | 71,267 | | | | | | | | | | 6,699,098 | |
| Chegg, Inc.A | | | | 210,035 | | | | | | | | | | 3,427,771 | |
| | | | | | | | | | | | | | | |
| | | | | | | | | | | | | | 10,126,869 | |
| | | | | | | | | | | | | | | |
| | | | | | | | | | | | | | | |
| Hotels, Restaurants & Leisure - 3.01% | | | | | | | | | | | | | | | |
| Chuy’s Holdings, Inc.A | | | | 214,303 | | | | | | | | | | 6,011,199 | |
| Papa John’s International, Inc. | | | | 19,840 | | | | | | | | | | 1,113,223 | |
| Potbelly Corp.A | | | | 216,800 | | | | | | | | | | 2,666,640 | |
| Wingstop, Inc. | | | | 191,648 | | | | | | | | | | 7,470,439 | |
| | | | | | | | | | | | | | | |
| | | | | | | | | | | | | | 17,261,501 | |
| | | | | | | | | | | | | | | |
| | | | | | | | | | | | | | | |
| Media - 0.68% | | | | | | | | | | | | | | | |
| IMAX Corp.A | | | | 169,850 | | | | | | | | | | 3,932,027 | |
| | | | | | | | | | | | | | | |
| | | | | | | | | | | | | | | |
| Multiline Retail - 1.24% | | | | | | | | | | | | | | | |
| Ollie’s Bargain Outlet Holdings, Inc.A | | | | 133,912 | | | | | | | | | | 7,130,814 | |
| | | | | | | | | | | | | | | |
| | | | | | | | | | | | | | | |
| Specialty Retail - 2.71% | | | | | | | | | | | | | | | |
| Aaron’s, Inc. | | | | 183,390 | | | | | | | | | | 7,308,091 | |
| Boot Barn Holdings, Inc.A B | | | | 286,064 | | | | | | | | | | 4,751,523 | |
| Monro, Inc. | | | | 61,143 | | | | | | | | | | 3,482,094 | |
| | | | | | | | | | | | | | | |
| | | | | | | | | | | | | | 15,541,708 | |
| | | | | | | | | | | | | | | |
| | | | | | | | | | | | | | | |
| Textiles, Apparel & Luxury Goods - 0.38% | | | | | | | | | | | | | | | |
| Canada Goose Holdings, Inc.A | | | | 68,730 | | | | | | | | | | 2,169,119 | |
| | | | | | | | | | | | | | | |
| | | | | | | | | | | | | | | |
Total Consumer Discretionary | | | | | | | | | | | | | | 59,428,581 | |
| | | | | | | | | | | | | | | |
| | | | | | | | | | | | | | | |
| Consumer Staples - 3.12% | | | | | | | | | | | | | | | |
| Beverages - 0.98% | | | | | | | | | | | | | | | |
| MGP Ingredients, Inc. | | | | 73,182 | | | | | | | | | | 5,626,232 | |
| | | | | | | | | | | | | | | |
| | | | | | | | | | | | | | | |
| Food Products - 1.65% | | | | | | | | | | | | | | | |
| Calavo Growers, Inc.B | | | | 112,525 | | | | | | | | | | 9,497,110 | |
| | | | | | | | | | | | | | | |
| | | | | | | | | | | | | | | |
| Personal Products - 0.49% | | | | | | | | | | | | | | | |
| elf Beauty, Inc.A B | | | | 124,998 | | | | | | | | | | 2,788,706 | |
| | | | | | | | | | | | | | | |
| | | | | | | | | | | | | | | |
Total Consumer Staples | | | | | | | | | | | | | | 17,912,048 | |
| | | | | | | | | | | | | | | |
| | | | | | | | | | | | | | | |
| Energy - 2.47% | | | | | | | | | | | | | | | |
| Energy Equipment & Services - 1.83% | | | | | | | | | | | | | | | |
| Core Laboratories N.V.B | | | | 27,343 | | | | | | | | | | 2,995,426 | |
| Oceaneering International, Inc. | | | | 115,004 | | | | | | | | | | 2,431,184 | |
| RigNet, Inc.A | | | | 166,887 | | | | | | | | | | 2,494,961 | |
| RPC, Inc.B | | | | 101,012 | | | | | | | | | | 2,578,836 | |
| | | | | | | | | | | | | | | |
| | | | | | | | | | | | | | 10,500,407 | |
| | | | | | | | | | | | | | | |
| | | | | | | | | | | | | | | |
| Oil, Gas & Consumable Fuels - 0.64% | | | | | | | | | | | | | | | |
| Carrizo Oil & Gas, Inc.A | | | | 92,790 | | | | | | | | | | 1,974,571 | |
| PDC Energy, Inc.A | | | | 33,158 | | | | | | | | | | 1,708,964 | |
| | | | | | | | | | | | | | | |
| | | | | | | | | | | | | | 3,683,535 | |
| | | | | | | | | | | | | | | |
| | | | | | | | | | | | | | | |
Total Energy | | | | | | | | | | | | | | 14,183,942 | |
| | | | | | | | | | | | | | | |
| | | | | | | | | | | | | | | |
See accompanying notes
17
American Beacon Stephens Small Cap Growth FundSM
Schedule of Investments
December 31, 2017
| | | | | | | | | | | | | | | |
| | | Shares | | | | Fair Value |
| | | | | | | | | | | | | | | |
| COMMON STOCKS - 99.44% (continued) | | | | | | | | | | | | | | | |
| Financials - 6.86% | | | | | | | | | | | | | | | |
| Banks - 3.30% | | | | | | | | | | | | | | | |
| Allegiance Bancshares, Inc.A | | | | 48,078 | | | | | | | | | $ | 1,810,137 | |
| Ameris Bancorp | | | | 89,331 | | | | | | | | | | 4,305,754 | |
| East West Bancorp, Inc. | | | | 52,212 | | | | | | | | | | 3,176,056 | |
| Hilltop Holdings, Inc. | | | | 176,093 | | | | | | | | | | 4,460,435 | |
| SVB Financial GroupA | | | | 13,497 | | | | | | | | | | 3,155,194 | |
| Veritex Holdings, Inc.A | | | | 72,578 | | | | | | | | | | 2,002,427 | |
| | | | | | | | | | | | | | | |
| | | | | | | | | | | | | | 18,910,003 | |
| | | | | | | | | | | | | | | |
| | | | | | | | | | | | | | | |
| Capital Markets - 1.31% | | | | | | | | | | | | | | | |
| MarketAxess Holdings, Inc. | | | | 37,286 | | | | | | | | | | 7,522,451 | |
| | | | | | | | | | | | | | | |
| | | | | | | | | | | | | | | |
| Consumer Finance - 2.25% | | | | | | | | | | | | | | | |
| EZCORP, Inc., Class AA | | | | 345,009 | | | | | | | | | | 4,209,110 | |
| FirstCash, Inc. | | | | 70,110 | | | | | | | | | | 4,728,919 | |
| Green Dot Corp., Class AA | | | | 66,085 | | | | | | | | | | 3,982,282 | |
| | | | | | | | | | | | | | | |
| | | | | | | | | | | | | | 12,920,311 | |
| | | | | | | | | | | | | | | |
| | | | | | | | | | | | | | | |
Total Financials | | | | | | | | | | | | | | 39,352,765 | |
| | | | | | | | | | | | | | | |
| | | | | | | | | | | | | | | |
| Health Care - 20.57% | | | | | | | | | | | | | | | |
| Biotechnology - 3.11% | | | | | | | | | | | | | | | |
| Ligand Pharmaceuticals, Inc.A | | | | 65,340 | | | | | | | | | | 8,947,006 | |
| MiMedx Group, Inc.A B | | | | 298,759 | | | | | | | | | | 3,767,351 | |
| Repligen Corp.A | | | | 141,797 | | | | | | | | | | 5,144,395 | |
| | | | | | | | | | | | | | | |
| | | | | | | | | | | | | | 17,858,752 | |
| | | | | | | | | | | | | | | |
| | | | | | | | | | | | | | | |
| Health Care Equipment & Supplies - 4.72% | | | | | | | | | | | | | | | |
| ABIOMED, Inc.A | | | | 43,423 | | | | | | | | | | 8,137,904 | |
| Neogen Corp.A | | | | 101,399 | | | | | | | | | | 8,336,012 | |
| NuVasive, Inc.A | | | | 112,546 | | | | | | | | | | 6,582,815 | |
| Penumbra, Inc.A | | | | 42,816 | | | | | | | | | | 4,028,986 | |
| | | | | | | | | | | | | | | |
| | | | | | | | | | | | | | 27,085,717 | |
| | | | | | | | | | | | | | | |
| | | | | | | | | | | | | | | |
| Health Care Providers & Services - 2.26% | | | | | | | | | | | | | | | |
| AAC Holdings, Inc.A B | | | | 171,651 | | | | | | | | | | 1,544,859 | |
| Acadia Healthcare Co., Inc.A | | | | 154,763 | | | | | | | | | | 5,049,917 | |
| HealthEquity, Inc.A | | | | 137,362 | | | | | | | | | | 6,409,311 | |
| | | | | | | | | | | | | | | |
| | | | | | | | | | | | | | 13,004,087 | |
| | | | | | | | | | | | | | | |
| | | | | | | | | | | | | | | |
| Health Care Technology - 5.09% | | | | | | | | | | | | | | | |
| athenahealth, Inc.A | | | | 36,424 | | | | | | | | | | 4,845,849 | |
| HealthStream, Inc.A | | | | 161,823 | | | | | | | | | | 3,747,821 | |
| HMS Holdings Corp.A | | | | 409,132 | | | | | | | | | | 6,934,787 | |
| Medidata Solutions, Inc.A | | | | 112,391 | | | | | | | | | | 7,122,218 | |
| Omnicell, Inc.A | | | | 135,432 | | | | | | | | | | 6,568,452 | |
| | | | | | | | | | | | | | | |
| | | | | | | | | | | | | | 29,219,127 | |
| | | | | | | | | | | | | | | |
| | | | | | | | | | | | | | | |
| Life Sciences Tools & Services - 3.76% | | | | | | | | | | | | | | | |
| Bio-Techne Corp. | | | | 32,511 | | | | | | | | | | 4,211,800 | |
| ICON PLCA | | | | 101,474 | | | | | | | | | | 11,380,309 | |
| PRA Health Sciences, Inc.A | | | | 65,571 | | | | | | | | | | 5,971,551 | |
| | | | | | | | | | | | | | | |
| | | | | | | | | | | | | | 21,563,660 | |
| | | | | | | | | | | | | | | |
| | | | | | | | | | | | | | | |
| Pharmaceuticals - 1.63% | | | | | | | | | | | | | | | |
| Pacira Pharmaceuticals, Inc.A | | | | 153,913 | | | | | | | | | | 7,026,129 | |
| Supernus Pharmaceuticals, Inc.A | | | | 58,031 | | | | | | | | | | 2,312,535 | |
| | | | | | | | | | | | | | | |
| | | | | | | | | | | | | | 9,338,664 | |
| | | | | | | | | | | | | | | |
| | | | | | | | | | | | | | | |
Total Health Care | | | | | | | | | | | | | | 118,070,007 | |
| | | | | | | | | | | | | | | |
| | | | | | | | | | | | | | | |
See accompanying notes
18
American Beacon Stephens Small Cap Growth FundSM
Schedule of Investments
December 31, 2017
| | | | | | | | | | | | | | | |
| | | Shares | | | | Fair Value |
| | | | | | | | | | | | | | | |
| COMMON STOCKS - 99.44% (continued) | | | | | | | | | | | | | | | |
| Industrials - 16.98% | | | | | | | | | | | | | | | |
| Aerospace & Defense - 3.50% | | | | | | | | | | | | | | | |
| Aerovironment, Inc.A | | | | 76,038 | | | | | | | | | $ | 4,270,294 | |
| Axon Enterprise, Inc.A B | | | | 172,329 | | | | | | | | | | 4,566,719 | |
| HEICO Corp., Class A | | | | 93,051 | | | | | | | | | | 7,355,682 | |
| KeyW Holding Corp.A B | | | | 414,389 | | | | | | | | | | 2,432,463 | |
| Kratos Defense & Security Solutions, Inc.A | | | | 138,443 | | | | | | | | | | 1,466,111 | |
| | | | | | | | | | | | | | | |
| | | | | | | | | | | | | | 20,091,269 | |
| | | | | | | | | | | | | | | |
| | | | | | | | | | | | | | | |
| Air Freight & Logistics - 1.78% | | | | | | | | | | | | | | | |
| Echo Global Logistics, Inc.A | | | | 199,023 | | | | | | | | | | 5,572,644 | |
| Hub Group, Inc., Class AA | | | | 97,186 | | | | | | | | | | 4,655,209 | |
| | | | | | | | | | | | | | | |
| | | | | | | | | | | | | | 10,227,853 | |
| | | | | | | | | | | | | | | |
| | | | | | | | | | | | | | | |
| Building Products - 1.43% | | | | | | | | | | | | | | | |
| Trex Co., Inc.A | | | | 75,726 | | | | | | | | | | 8,207,941 | |
| | | | | | | | | | | | | | | |
| | | | | | | | | | | | | | | |
| Machinery - 5.40% | | | | | | | | | | | | | | | |
| Kornit Digital Ltd.A B | | | | 257,239 | | | | | | | | | | 4,154,410 | |
| Lindsay Corp. | | | | 37,122 | | | | | | | | | | 3,274,160 | |
| Mueller Water Products, Inc., Class A | | | | 471,642 | | | | | | | | | | 5,909,674 | |
| Proto Labs, Inc.A | | | | 101,105 | | | | | | | | | | 10,413,815 | |
| RBC Bearings, Inc.A | | | | 57,109 | | | | | | | | | | 7,218,578 | |
| | | | | | | | | | | | | | | |
| | | | | | | | | | | | | | 30,970,637 | |
| | | | | | | | | | | | | | | |
| | | | | | | | | | | | | | | |
| Professional Services - 1.53% | | | | | | | | | | | | | | | |
| WageWorks, Inc.A | | | | 141,864 | | | | | | | | | | 8,795,568 | |
| | | | | | | | | | | | | | | |
| | | | | | | | | | | | | | | |
| Trading Companies & Distributors - 3.34% | | | | | | | | | | | | | | | |
| Beacon Roofing Supply, Inc.A | | | | 100,099 | | | | | | | | | | 6,382,312 | |
| MSC Industrial Direct Co., Inc., Class A | | | | 61,669 | | | | | | | | | | 5,960,926 | |
| SiteOne Landscape Supply, Inc.A | | | | 89,220 | | | | | | | | | | 6,843,174 | |
| | | | | | | | | | | | | | | |
| | | | | | | | | | | | | | 19,186,412 | |
| | | | | | | | | | | | | | | |
| | | | | | | | | | | | | | | |
Total Industrials | | | | | | | | | | | | | | 97,479,680 | |
| | | | | | | | | | | | | | | |
| | | | | | | | | | | | | | | |
| Information Technology - 37.56% | | | | | | | | | | | | | | | |
| Electronic Equipment, Instruments & Components - 3.19% | | | | | | | | | | | | | | | |
| Cognex Corp. | | | | 115,885 | | | | | | | | | | 7,087,527 | |
| FLIR Systems, Inc. | | | | 150,810 | | | | | | | | | | 7,030,762 | |
| National Instruments Corp. | | | | 100,735 | | | | | | | | | | 4,193,598 | |
| | | | | | | | | | | | | | | |
| | | | | | | | | | | | | | 18,311,887 | |
| | | | | | | | | | | | | | | |
| | | | | | | | | | | | | | | |
| Internet Software & Services - 10.39% | | | | | | | | | | | | | | | |
| 2U, Inc.A | | | | 72,308 | | | | | | | | | | 4,664,589 | |
| Alarm.com Holdings, Inc.A | | | | 39,720 | | | | | | | | | | 1,499,430 | |
| ANGI Homeservices, Inc., Class AA B | | | | 384,096 | | | | | | | | | | 4,017,644 | |
| CoStar Group, Inc.A | | | | 32,511 | | | | | | | | | | 9,654,142 | |
| Envestnet, Inc.A | | | | 157,746 | | | | | | | | | | 7,863,638 | |
| Five9, Inc.A | | | | 223,894 | | | | | | | | | | 5,570,483 | |
| GrubHub, Inc.A B | | | | 50,265 | | | | | | | | | | 3,609,027 | |
| Mimecast Ltd.A | | | | 148,524 | | | | | | | | | | 4,258,183 | |
| Q2 Holdings, Inc.A | | | | 148,925 | | | | | | | | | | 5,487,886 | |
| Shopify, Inc., Class AA | | | | 38,022 | | | | | | | | | | 3,840,222 | |
| SPS Commerce, Inc.A | | | | 50,240 | | | | | | | | | | 2,441,162 | |
| Stamps.com, Inc.A | | | | 35,687 | | | | | | | | | | 6,709,156 | |
| | | | | | | | | | | | | | | |
| | | | | | | | | | | | | | 59,615,562 | |
| | | | | | | | | | | | | | | |
| | | | | | | | | | | | | | | |
See accompanying notes
19
American Beacon Stephens Small Cap Growth FundSM
Schedule of Investments
December 31, 2017
| | | | | | | | | | | | | | | |
| | | Shares | | | | Fair Value |
| | | | | | | | | | | | | | | |
| COMMON STOCKS - 99.44% (continued) | | | | | | | | | | | | | | | |
| Information Technology - 37.56% (continued) | | | | | | | | | | | | | | | |
| IT Services - 3.19% | | | | | | | | | | | | | | | |
| Euronet Worldwide, Inc.A | | | | 87,120 | | | | | | | | | $ | 7,341,603 | |
| MAXIMUS, Inc. | | | | 52,935 | | | | | | | | | | 3,789,087 | |
| WEX, Inc.A | | | | 50,652 | | | | | | | | | | 7,153,582 | |
| | | | | | | | | | | | | | | |
| | | | | | | | | | | | | | 18,284,272 | |
| | | | | | | | | | | | | | | |
| | | | | | | | | | | | | | | |
| Semiconductors & Semiconductor Equipment - 7.46% | | | | | | | | | | | | | | | |
| Cavium, Inc.A | | | | 79,800 | | | | | | | | | | 6,689,634 | |
| CyberOptics Corp.A B | | | | 69,787 | | | | | | | | | | 1,046,805 | |
| Inphi Corp.A B | | | | 68,530 | | | | | | | | | | 2,508,198 | |
| Integrated Device Technology, Inc.A | | | | 164,002 | | | | | | | | | | 4,875,779 | |
| MACOM Technology Solutions Holdings, Inc.A B | | | | 99,815 | | | | | | | | | | 3,247,980 | |
| Microsemi Corp.A | | | | 153,128 | | | | | | | | | | 7,909,061 | |
| Power Integrations, Inc. | | | | 90,024 | | | | | | | | | | 6,621,265 | |
| Rudolph Technologies, Inc.A | | | | 152,922 | | | | | | | | | | 3,654,836 | |
| Semtech Corp.A | | | | 184,068 | | | | | | | | | | 6,295,126 | |
| | | | | | | | | | | | | | | |
| | | | | | | | | | | | | | 42,848,684 | |
| | | | | | | | | | | | | | | |
| | | | | | | | | | | | | | | |
| Software - 13.33% | | | | | | | | | | | | | | | |
| 8x8, Inc.A | | | | 421,541 | | | | | | | | | | 5,943,728 | |
| Aspen Technology, Inc.A | | | | 111,143 | | | | | | | | | | 7,357,666 | |
| CyberArk Software Ltd.A B | | | | 79,396 | | | | | | | | | | 3,286,200 | |
| Globant S.A.A B | | | | 75,471 | | | | | | | | | | 3,506,383 | |
| Guidewire Software, Inc.A | | | | 106,307 | | | | | | | | | | 7,894,358 | |
| Manhattan Associates, Inc.A | | | | 126,435 | | | | | | | | | | 6,263,590 | |
| Proofpoint, Inc.A | | | | 94,717 | | | | | | | | | | 8,411,817 | |
| PROS Holdings, Inc.A | | | | 190,289 | | | | | | | | | | 5,033,144 | |
| Qualys, Inc.A | | | | 107,045 | | | | | | | | | | 6,353,121 | |
| Take-Two Interactive Software, Inc.A | | | | 80,282 | | | | | | | | | | 8,813,358 | |
| Tyler Technologies, Inc.A | | | | 35,723 | | | | | | | | | | 6,324,757 | |
| Ultimate Software Group, Inc.A | | | | 33,592 | | | | | | | | | | 7,330,782 | |
| | | | | | | | | | | | | | | |
| | | | | | | | | | | | | | 76,518,904 | |
| | | | | | | | | | | | | | | |
| | | | | | | | | | | | | | | |
Total Information Technology | | | | | | | | | | | | | | 215,579,309 | |
| | | | | | | | | | | | | | | |
| | | | | | | | | | | | | | | |
| Materials - 0.91% | | | | | | | | | | | | | | | |
| Chemicals - 0.91% | | | | | | | | | | | | | | | |
| Balchem Corp. | | | | 64,682 | | | | | | | | | | 5,213,369 | |
| | | | | | | | | | | | | | | |
| | | | | | | | | | | | | | | |
| Telecommunication Services - 0.62% | | | | | | | | | | | | | | | |
| Wireless Telecommunication Services - 0.62% | | | | | | | | | | | | | | | |
| Boingo Wireless, Inc.A | | | | 157,390 | | | | | | | | | | 3,541,275 | |
| | | | | | | | | | | | | | | |
| | | | | | | | | | | | | | | |
Total Common Stocks (Cost $393,585,204) | | | | | | | | | | | | | | 570,760,976 | |
| | | | | | | | | | | | | | | |
| | | | | | | | | | | | | | | |
| SHORT-TERM INVESTMENTS - 0.22% (Cost $1,257,376) | | | | | | | | | | | | | | | |
| Investment Companies - 0.22% | | | | | | | | | | | | | | | |
| American Beacon U.S. Government Money Market Select Fund, Select Class, 1.13%C D | | | | 1,257,376 | | | | | | | | | | 1,257,376 | |
| | | | | | | | | | | | | | | |
| | | | | | | | | | | | | | | |
| SECURITIES LENDING COLLATERAL - 8.38% (Cost $48,083,424) | | | | | | | | | | | | | | | |
| Investment Companies - 8.38% | | | | | | | | | | | | | | | |
| American Beacon U.S. Government Money Market Select Fund, Select Class, 1.13%C D | | | | 48,083,424 | | | | | | | | | | 48,083,424 | |
| | | | | | | | | | | | | | | |
| | | | | | | | | | | | | | | |
TOTAL INVESTMENTS - 108.04% (Cost $442,926,004) | | | | | | | | | | | | | | 620,101,776 | |
LIABILITIES, NET OF OTHER ASSETS - (8.04%) | | | | | | | | | | | | | | (46,138,538 | ) |
| | | | | | | | | | | | | | | |
TOTAL NET ASSETS - 100.00% | | | | | | | | | | | | | $ | 573,963,238 | |
| | | | | | | | | | | | | | | |
| | | | | | | | | | | | | | | |
See accompanying notes
20
American Beacon Stephens Small Cap Growth FundSM
Schedule of Investments
December 31, 2017
| | | | | | | | | | | | | | | |
| Percentages are stated as a percent of net assets. | | | | | | | | | | | | | | | |
A Non-income producing security.
B All or a portion of this security is on loan at December 31, 2017.
C The Fund is affiliated by having the same investment advisor.
D 7-day yield.
PLC - Public Limited Company.
The Fund’s investments are summarized by level based on the inputs used to determine their values. As of December 31, 2017, the investments were classified as described below:
| | | | | | | | | | | | | | | | | | | | | | | | | | | | |
Stephens Small Cap Growth Fund | | Level 1 | | | | | | Level 2 | | | | | | Level 3 | | | | | | Total | |
Assets | | | | |
Common Stocks | | $ | 570,760,976 | | | | | | | $ | - | | | | | | | $ | - | | | | | | | $ | 570,760,976 | |
Short-Term Investments | | | 1,257,376 | | | | | | | | - | | | | | | | | - | | | | | | | | 1,257,376 | |
Securities Lending Collateral | | | 48,083,424 | | | | | | | | - | | | | | | | | - | | | | | | | | 48,083,424 | |
| | | | | | | | | | | | | | | | | | | | | | | | | | | | |
Total Investments in Securities - Assets | | $ | 620,101,776 | | | | | | | $ | - | | | | | | | $ | - | | | | | | | $ | 620,101,776 | |
| | | | | | | | | | | | | | | | | | | | | | | | | | | | |
U.S. GAAP requires all transfers between any levels to be disclosed. The end of period timing recognition has been adopted for the transfers between levels of the Fund’s assets and liabilities. During the period ended December 31, 2017, there were no transfers between levels.
See accompanying notes
21
American Beacon FundsSM
Statements of Assets and Liabilities
December 31, 2017
| | | | | | | | | | | | |
| | | Stephens Mid-Cap
Growth Fund | | | | | | Stephens Small Cap
Growth Fund | |
Assets: | | | | | | | | | | | | |
Investments in unaffiliated securities, at fair value† § | | $ | 96,906,140 | | | | | | | $ | 570,760,976 | |
Investments in affiliated securities, at fair value‡ | | | 2,148,911 | | | | | | | | 49,340,800 | |
Cash | | | 10,432 | | | | | | | | – | |
Dividends and interest receivable | | | 9,475 | | | | | | | | 43,223 | |
Receivable for investments sold | | | 360,309 | | | | | | | | 4,165,320 | |
Receivable for fund shares sold | | | 157,571 | | | | | | | | 922,333 | |
Receivable for expense reimbursement (Note 2) | | | 5,925 | | | | | | | | – | |
Prepaid expenses | | | 26,553 | | | | | | | | 45,869 | |
| | | | | | | | | | | | |
Total assets | | | 99,625,316 | | | | | | | | 625,278,521 | |
| | | | | | | | | | | | |
Liabilities: | | | | | | | | | | | | |
Payable for investments purchased | | | 275,945 | | | | | | | | 2,052,924 | |
Payable for fund shares redeemed | | | 336,134 | | | | | | | | 565,752 | |
Payable upon return of securities loaned (Note 9)§ | | | 1,853,081 | | | | | | | | 48,083,424 | |
Management and sub-advisory fees payable (Note 2) | | | 66,278 | | | | | | | | 474,406 | |
Service fees payable (Note 2) | | | 1,582 | | | | | | | | 12,319 | |
Transfer agent fees payable (Note 2) | | | 5,711 | | | | | | | | 26,398 | |
Custody and fund accounting fees payable | | | 10,133 | | | | | | | | 38,688 | |
Professional fees payable | | | 33,265 | | | | | | | | 36,292 | |
Trustee fees payable (Note 2) | | | 4 | | | | | | | | 27 | |
Payable for prospectus and shareholder reports | | | 2,866 | | | | | | | | 24,952 | |
Other liabilities | | | 14 | | | | | | | | 101 | |
| | | | | | | | | | | | |
Total liabilities | | | 2,585,013 | | | | | | | | 51,315,283 | |
| | | | | | | | | | | | |
Net assets | | $ | 97,040,303 | | | | | | | $ | 573,963,238 | |
| | | | | | | | | | | | |
Analysis of net assets: | | | | | | | | | | | | |
Paid-in-capital | | $ | 61,422,466 | | | | | | | $ | 388,124,432 | |
Accumulated net realized gain | | | 1,103,436 | | | | | | | | 8,663,034 | |
Unrealized appreciation of investments in unaffiliated securitiesA | | | 34,514,401 | | | | | | | | 177,175,772 | |
| | | | | | | | | | | | |
Net assets | | $ | 97,040,303 | | | | | | | $ | 573,963,238 | |
| | | | | | | | | | | | |
Shares outstanding at no par value (unlimited shares authorized): | | | | | | | | | | | | |
Institutional Class | | | 2,713,799 | | | | | | | | 22,806,633 | |
| | | | | | | | | | | | |
Y Class | | | 252,448 | | | | | | | | 4,340,368 | |
| | | | | | | | | | | | |
Investor Class | | | 770,067 | | | | | | | | 2,917,975 | |
| | | | | | | | | | | | |
A Class | | | 726,308 | | | | | | | | 315,629 | |
| | | | | | | | | | | | |
C Class | | | 102,837 | | | | | | | | 58,370 | |
| | | | | | | | | | | | |
Net assets: | | | | | | | | | | | | |
Institutional Class | | $ | 60,933,913 | | | | | | | $ | 433,520,624 | |
| | | | | | | | | | | | |
Y Class | | $ | 5,639,207 | | | | | | | $ | 82,072,563 | |
| | | | | | | | | | | | |
Investor Class | | $ | 14,749,984 | | | | | | | $ | 51,839,469 | |
| | | | | | | | | | | | |
A Class | | $ | 13,854,727 | | | | | | | $ | 5,553,261 | |
| | | | | | | | | | | | |
C Class | | $ | 1,862,472 | | | | | | | $ | 977,321 | |
| | | | | | | | | | | | |
Net asset value, offering and redemption price per share: | | | | | | | | | | | | |
Institutional Class | | $ | 22.45 | | | | | | | $ | 19.01 | |
| | | | | | | | | | | | |
Y Class | | $ | 22.34 | | | | | | | $ | 18.91 | |
| | | | | | | | | | | | |
Investor Class | | $ | 19.15 | | | | | | | $ | 17.77 | |
| | | | | | | | | | | | |
A Class | | $ | 19.08 | | | | | | | $ | 17.59 | |
| | | | | | | | | | | | |
A Class (offering price) | | $ | 20.24 | | | | | | | $ | 18.66 | |
| | | | | | | | | | | | |
C Class | | $ | 18.11 | | | | | | | $ | 16.74 | |
| | | | | | | | | | | | |
| | | |
† Cost of investments in unaffiliated securities | | $ | 62,391,739 | | | | | | | $ | 393,585,204 | |
‡ Cost of investments in affiliated securities | | $ | 2,148,911 | | | | | | | $ | 49,340,800 | |
§ Fair value of securities on loan | | $ | 1,812,167 | | | | | | | $ | 46,663,553 | |
A The Fund’s investments in affiliated securities did not have unrealized appreciation (depreciation) at year end. | |
See accompanying notes
22
American Beacon FundsSM
Statements of Operations
For the year ended December 31, 2017
| | | | | | | | | | | | |
| | | Stephens Mid-Cap
Growth Fund | | | | | | Stephens Small Cap
Growth Fund | |
Investment income: | | | | | | | | | | | | |
Dividend income from unaffiliated securities (net of foreign taxes)† | | $ | 631,370 | | | | | | | $ | 1,422,722 | |
Dividend income from affiliated securities | | | 13,202 | | | | | | | | 44,765 | |
Income derived from securities lending (Note 8) | | | 12,830 | | | | | | | | 253,805 | |
| | | | | | | | | | | | |
Total investment income | | | 657,402 | | | | | | | | 1,721,292 | |
| | | | | | | | | | | | |
Expenses: | | | | | | | | | | | | |
Management and sub-advisory fees (Note 2) | | | 785,420 | | | | | | | | 5,844,957 | |
Transfer agent fees: | | | | | | | | | | | | |
Institutional Class (Note 2) | | | 42,188 | | | | | | | | 206,017 | |
Y Class (Note 2) | | | 3,328 | | | | | | | | 64,012 | |
Investor Class | | | 2,221 | | | | | | | | 4,065 | |
A Class | | | 902 | | | | | | | | 436 | |
C Class | | | 145 | | | | | | | | 101 | |
Custody and fund accounting fees | | | 14,473 | | | | | | | | 54,564 | |
Professional fees | | | 39,551 | | | | | | | | 56,860 | |
Registration fees and expenses | | | 58,218 | | | | | | | | 112,304 | |
Service fees (Note 2): | | | | | | | | | | | | |
Y Class | | | 761 | | | | | | | | 20,186 | |
Investor Class | | | 40,944 | | | | | | | | 126,161 | |
A Class | | | 20,047 | | | | | | | | 7,263 | |
C Class | | | 1,756 | | | | | | | | 1,053 | |
Distribution fees (Note 2): | | | | | | | | | | | | |
A Class | | | 37,354 | | | | | | | | 16,892 | |
C Class | | | 17,417 | | | | | | | | 11,099 | |
Prospectus and shareholder report expenses | | | 12,610 | | | | | | | | 89,141 | |
Trustee fees (Note 2) | | | 5,228 | | | | | | | | 38,286 | |
Other expenses | | | 6,465 | | | | | | | | 33,198 | |
| | | | | | | | | | | | |
Total expenses | | | 1,089,028 | | | | | | | | 6,686,595 | |
| | | | | | | | | | | | |
Net fees waived and expenses (reimbursed) / recouped (Note 2) | | | (47,661 | ) | | | | | | | 9,196 | |
| | | | | | | | | | | | |
Net expenses | | | 1,041,367 | | | | | | | | 6,695,791 | |
| | | | | | | | | | | | |
Net investment (loss) | | | (383,965 | ) | | | | | | | (4,974,499 | ) |
| | | | | | | | | | | | |
| | | |
Realized and unrealized gain (loss) from investments: | | | | | | | | | | | | |
Net realized gain from: | | | | | | | | | | | | |
Investments in unaffiliated securitiesA | | | 7,127,682 | | | | | | | | 35,805,473 | |
Change in net unrealized appreciation of: | | | | | | | | | | | | |
Investments in unaffiliated securitiesB | | | 15,861,967 | | | | | | | | 75,670,510 | |
| | | | | | | | | | | | |
Net gain from investments | | | 22,989,649 | | | | | | | | 111,475,983 | |
| | | | | | | | | | | | |
Net increase in net assets resulting from operations | | $ | 22,605,684 | | | | | | | $ | 106,501,484 | |
| | | | | | | | | | | | |
| | | |
† Foreign taxes | | $ | 2,520 | | | | | | | $ | 9,178 | |
A The Fund did not recognize net realized gains (losses) from the sale of investments in affiliated securities. | |
B The Fund’s investments in affiliated securities did not have a change in unrealized appreciation (depreciation) at year end. | |
See accompanying notes
23
American Beacon FundsSM
Statements of Changes in Net Assets
| | | | | | | | | | | | | | | | | | | | | | | | | | | | |
| | | Stephens Mid-Cap Growth Fund | | | | | | Stephens Small Cap Growth Fund | |
| | | Year Ended
December 31, 2017 | | | | | | Year Ended
December 31, 2016 | | | | | | Year Ended
December 31, 2017 | | | | | | Year Ended
December 31, 2016 | |
Increase (decrease) in net assets: | | | | | | | | | | | | | | | | | | | | | | | | | | | | |
Operations: | | | | | | | | | | | | | | | | | | | | | | | | | | | | |
Net investment (loss) | | $ | (383,965 | ) | | | | | | $ | (569,314 | ) | | | | | | $ | (4,974,499 | ) | | | | | | $ | (4,351,324 | ) |
Net realized gain (loss) from investments in unaffiliated securities | | | 7,127,682 | | | | | | | | (1,032,123 | ) | | | | | | | 35,805,473 | | | | | | | | (4,569,025 | ) |
Change in net unrealized appreciation (depreciation) of investments in unaffiliated securities | | | 15,861,967 | | | | | | | | 5,243,617 | | | | | | | | 75,670,510 | | | | | | | | 67,768,829 | |
| | | | | | | | | | | | | | | | | | | | | | | | | | | | |
Net increase in net assets resulting from operations | | | 22,605,684 | | | | | | | | 3,642,180 | | | | | | | | 106,501,484 | | | | | | | | 58,848,480 | |
| | | | | | | | | | | | | | | | | | | | | | | | | | | | |
Distributions to shareholders: | | | | | | | | | | | | | | | | | | | | | | | | | | | | |
Net realized gain from investments: | | | | | | | | | | | | | | | | | | | | | | | | | | | | |
Institutional Class | | | (2,690,238 | ) | | | | | | | (2,746,156 | ) | | | | | | | (14,512,324 | ) | | | | | | | (3,634,109 | ) |
Y Class | | | (245,604 | ) | | | | | | | (101,600 | ) | | | | | | | (2,773,676 | ) | | | | | | | (676,175 | ) |
Investor Class | | | (774,146 | ) | | | | | | | (825,119 | ) | | | | | | | (1,840,808 | ) | | | | | | | (440,539 | ) |
A Class | | | (751,075 | ) | | | | | | | (878,585 | ) | | | | | | | (199,473 | ) | | | | | | | (61,811 | ) |
C Class | | | (100,863 | ) | | | | | | | (90,663 | ) | | | | | | | (36,826 | ) | | | | | | | (11,705 | ) |
| | | | | | | | | | | | | | | | | | | | | | | | | | | | |
Net distributions to shareholders | | | (4,561,926 | ) | | | | | | | (4,642,123 | ) | | | | | | | (19,363,107 | ) | | | | | | | (4,824,339 | ) |
| | | | | | | | | | | | | | | | | | | | | | | | | | | | |
| | | | | | | |
Capital share transactions (Note 10): | | | | | | | | | | | | | | | | | | | | | | | | | | | | |
Proceeds from sales of shares | | | 20,138,157 | | | | | | | | 23,413,554 | | | | | | | | 95,024,755 | | | | | | | | 351,061,950 | |
Reinvestment of dividends and distributions | | | 4,482,386 | | | | | | | | 4,535,561 | | | | | | | | 19,039,862 | | | | | | | | 4,720,165 | |
Cost of shares redeemed | | | (26,940,208 | ) | | | | | | | (55,624,853 | ) | | | | | | | (217,450,885 | ) | | | | | | | (329,962,031 | ) |
| | | | | | | | | | | | | | | | | | | | | | | | | | | | |
Net increase (decrease) in net assets from capital share transactions | | | (2,319,665 | ) | | | | | | | (27,675,738 | ) | | | | | | | (103,386,268 | ) | | | | | | | 25,820,084 | |
| | | | | | | | | | | | | | | | | | | | | | | | | | | | |
Net increase (decrease) in net assets | | | 15,724,093 | | | | | | | | (28,675,681 | ) | | | | | | | (16,247,891 | ) | | | | | | | 79,844,225 | |
| | | | | | | | | | | | | | | | | | | | | | | | | | | | |
Net assets: | | | | | | | | | | | | | | | | | | | | | | | | | | | | |
Beginning of period | | | 81,316,210 | | | | | | | | 109,991,891 | | | | | | | | 590,211,129 | | | | | | | | 510,366,904 | |
| | | | | | | | | | | | | | | | | | | | | | | | | | | | |
End of period | | $ | 97,040,303 | | | | | | | $ | 81,316,210 | | | | | | | $ | 573,963,238 | | | | | | | $ | 590,211,129 | |
| | | | | | | | | | | | | | | | | | | | | | | | | | | | |
See accompanying notes
24
American Beacon FundsSM
Notes to Financial Statements
December 31, 2017
1. Organization and Significant Accounting Policies
American Beacon Funds (the “Trust”), is organized as a Massachusetts business trust. The Funds, each a series within the Trust, are registered under the Investment Company Act of 1940 (the “Act”), as amended, as diversified, open-end management investment companies. As of December 31, 2017, the Trust consists of thirty-three active series, two of which are presented in this filing: American Beacon Stephens Mid-Cap Growth Fund and American Beacon Stephens Small Cap Growth Fund (collectively, the “Funds” and each individually a “Fund”). The remaining thirty-one active series are reported in separate filings.
American Beacon Advisors, Inc. (the “Manager”) is a wholly-owned subsidiary of Resolute Investment Managers, Inc., which is indirectly owned by investment funds affiliated with Kelso & Company, L.P. and Estancia Capital Management, LLC, and was organized in 1986 to provide business management, advisory, administrative, and asset management consulting services to the Trust and other investors.
Class Disclosure
Each Fund has multiple classes of shares designed to meet the needs of different groups of investors. The following table sets forth the differences amongst the classes:
| | | | | | |
Class | | Eligible Investors | | Minimum Initial
Investments | |
| Institutional | | Large institutional investors - sold directly or through intermediary channels. | | $ | 250,000 | |
| Y Class | | Large institutional retirement plan investors - sold directly or through intermediary channels. | | $ | 100,000 | |
| Investor | | All investors using intermediary organizations, such as broker-dealers or retirement plan sponsors. | | $ | 2,500 | |
| A Class | | All investors who invest through intermediary organizations, such as broker-dealers or third party administrator. Retail investors who invest directly through a financial intermediary such as a broker, bank, or registered investment advisor which may include a front-end sales charge and a contingent deferred sales charge (“CDSC”). | | $ | 2,500 | |
| C Class | | Retail investors who invest directly through a financial intermediary such as a broker or through employee directed benefit plans with applicable sales charges which may include CDSC. | | $ | 1,000 | |
Each class offered by the Trust has equal rights as to assets and voting privileges. Income and non-class specific expenses are allocated daily to each class on the basis of the relative net assets. Realized and unrealized capital gains and losses of each class are allocated daily based on the relative net assets of each class of the respective Fund. Class specific expenses, where applicable, currently include service, distribution, and sub-transfer agent fees that vary amongst the classes as described more fully in Note 2.
Recently Adopted Accounting Pronouncements
In October 2016, the SEC adopted amendments to rules under the Investment Company Act of 1940 (“final rules”) intended to modernize the reporting and disclosure of information by registered investment companies. The final rules amend Regulation S-X and require funds to provide standardized, enhanced derivative disclosure in fund financial statements in a format designed for individual investors. The amendments to Regulation S-X also update the disclosures for other investments and investments in and advances to affiliates and amend the rules regarding the general form and content of fund financial statements. The compliance date for the amendments to Regulation S-X is August 1, 2017, and has been adopted accordingly.
25
American Beacon FundsSM
Notes to Financial Statements
December 31, 2017
Significant Accounting Policies
The following is a summary of significant accounting policies, consistently followed by the Funds in preparation of the financial statements. The Funds are considered investment companies and accordingly, follow the investment company accounting and reporting guidance of the Financial Accounting Standards Board Accounting Standard Codification Topic 946, Financial Services – Investment Companies, a part of Generally Accepted Accounting Principles (“U.S. GAAP”).
Security Transactions and Investment Income
Security transactions are recorded on the trade date of the security purchase or sale. The Funds may purchase securities with delivery or payment to occur at a later date. At the time the Funds enter into a commitment to purchase a security, the transaction is recorded, and the value of the security is reflected in the Net Asset Value (“NAV”). The value of the security may vary with market fluctuations.
Distributions to Shareholders
Distributions, if any, of net investment income are generally paid at least annually and recorded on the ex-dividend date. Distributions, if any, of net realized capital gains are generally paid at least annually and recorded on the ex-dividend date. Dividends to shareholders are determined in accordance with federal income tax regulations, which may differ in amount and character from net investment income and realized gains recognized for purposes of U.S. GAAP. To the extent necessary to fully distribute capital gains, the Funds may designate earnings and profits distributed to shareholders on the redemption of shares.
Allocation of Income, Trust Expenses, Gains, and Losses
Investment income, realized and unrealized gains and losses from investments of the Funds are allocated daily to each class of shares based upon the relative proportion of net assets of each class to the total net assets of the Funds. Expenses directly charged or attributable to any Fund will be paid from the assets of the Fund. Generally, expenses of the Trust will be allocated among and charged to the assets of the Funds on a basis that the Trust’s Board of Trustees (the “Board”) deems fair and equitable, which may be based on the relative net assets of the Funds or nature of the services performed and relative applicability to the Funds.
Use of Estimates
The preparation of financial statements in conformity with U.S. GAAP requires management to make estimates and assumptions that affect the amounts reported in the financial statements and accompanying notes. Actual results may differ from those estimated.
Other
Under the Trust’s organizational documents, its officers and trustees are indemnified against certain liabilities arising out of the performance of their duties to the Trust. In the normal course of business, the Trust enters into contracts that provide indemnification to the other party or parties against potential costs or liabilities. The Trust’s maximum exposure under these arrangements is dependent on claims that may be made in the future and, therefore, cannot be estimated. The Trust has had no prior claims or losses pursuant to any such agreement.
2. Transactions with Affiliates
Management and Investment Sub-Advisory Agreements
The Funds and the Manager are parties to a Management Agreement that obligates the Manager to provide the Funds with investment advisory and administrative services. As compensation for performing the duties
26
American Beacon FundsSM
Notes to Financial Statements
December 31, 2017
under the Management Agreement, the Manager will receive an annualized management fee based on a percentage of each Fund’s average daily net assets that is calculated and accrued daily according to the following schedule:
| | | | |
First $5 billion | | | 0.35 | % |
Next $5 billion | | | 0.325 | % |
Next $10 billion | | | 0.30 | % |
Over $20 billion | | | 0.275 | % |
The Trust, on behalf of the Funds, and the Manager have entered into an Investment Advisory Agreement with Stephens Investment Management Group LLC (the “Sub-Advisor”) pursuant to which each Fund have agreed to pay an annualized sub-advisory fee that is calculated and accrued daily based on the Fund’s average daily net assets according to the following schedule:
Stephens Mid-Cap Growth Fund
| | | | |
First $100 million | | | 0.50 | % |
Over $100 million | | | 0.45 | % |
Stephens Small Cap Growth Fund
| | | | |
First $200 million | | | 0.65 | % |
Over $200 million | | | 0.60 | % |
The Management and Sub-Advisory Fees paid by the Funds for the year ended December 31, 2017 were as follows:
Stephens Mid-Cap Growth Fund
| | | | | | | | | | | | |
| | | Effective Fee Rate | | | | | | Amount of Fees Paid | |
| Management Fees | | | 0.35 | % | | | | | | $ | 324,247 | |
| Sub-Advisor Fees | | | 0.50 | % | | | | | | | 461,173 | |
| | | | | | | | | | | | |
| Total | | | 0.85 | % | | | | | | $ | 785,420 | |
| | | | | | | | | | | | |
Stephens Small Cap Growth Fund
| | | | | | | | | | | | |
| | | Effective Fee Rate | | | | | | Amount of Fees Paid | |
| Management Fees | | | 0.35 | % | | | | | | $ | 2,134,376 | |
| Sub-Advisor Fees | | | 0.63 | % | | | | | | | 3,710,581 | |
| | | | | | | | | | | | |
| Total | | | 0.98 | % | | | | | | $ | 5,844,957 | |
| | | | | | | | | | | | |
As compensation for services provided by the Manager in connection with securities lending activities conducted by the Funds, the lending Fund pays to the Manager, with respect to cash collateral posted by borrowers, a fee up to 10% of the net monthly interest income (the gross interest income earned by the investment of cash collateral, less the amount paid to borrowers and related expenses) from such activities and, with respect to loan fees paid by borrowers, a fee up to 10% of such loan fees. These fees are included in “Income derived from securities lending” and “Management and investment advisory fees” on the Statements of Operations. During the year ended December 31, 2017, the Manager received securities lending fees of $1,436 and $33,940 for the securities lending activities of the Stephens Mid-Cap Growth Fund and Stephens Small Cap Growth Fund, respectively.
27
American Beacon FundsSM
Notes to Financial Statements
December 31, 2017
Distribution Plans
The Funds, except for the A and C Classes of the Funds, have adopted a “defensive” Distribution Plan (the “Plan”) in accordance with Rule 12b-1 under the Act, pursuant to which no separate fees may be charged to the Funds for distribution purposes. However, the Plan authorizes the management fee received by the Manager and the investment advisors hired by the Manager to be used for distribution purposes. Under this Plan, the Funds do not intend to compensate the Manager or any other party, either directly or indirectly, for the distribution of Fund shares.
Separate Distribution Plans (the “Distribution Plans”) have been adopted pursuant to Rule 12b-1 under the Act for the A and C Classes of the Funds. Under the Distribution Plans, as compensation for distribution assistance, the Manager receives an annual fee of 0.25% of the average daily net assets of the A Class and 1.00% of the average daily net assets of the C Class. The fee will be payable without regard to whether the amount of the fee is more or less than the actual expenses incurred in a particular month by the Manager for distribution assistance.
Service Plans
The Manager and the Trust entered into Service Plans that obligate the Manager to oversee additional shareholder servicing of the Y, Investor, A, and C Classes of the Funds. As compensation for performing the duties required under the Service Plans, the Manager receives an annualized fee up to 0.10% of the average daily net assets of the Y Class, up to 0.25% of the average daily net assets of the A and C Classes, and up to 0.375% of the average daily net assets of the Investor Class of the Funds. Effective April 1, 2017, the Funds terminated the Service Plan for the Y Class. During the year ended December 31, 2017 the Manager voluntarily reimbursed service fees to the A and C Classes of the Stephens Mid-Cap Growth Fund in the amount of $2,366 and $857, respectively. The Manager also voluntarily reimbursed service fees to the A and C Classes of the Stephens Small Cap Growth Fund in the amount of $2,873 and $612, respectively as reflected in “Service fees” on the Statement of Operations.
Sub-Transfer Agent Fees
The Manager has entered into agreements, which include servicing agreements, with financial intermediaries that provide recordkeeping, processing, shareholder communications and other services to customers of the intermediaries that hold positions in the Institutional Class of the Funds and has agreed to compensate the intermediaries for providing these services. Effective April 1, 2017, the Funds agreed to compensate the intermediaries for providing services to the Y Class. Intermediaries transact with the Funds primarily through the use of omnibus accounts on behalf of their customers who hold positions in the Funds. Certain services would have been provided by the Funds’ transfer agent and other service providers if the shareholders’ accounts were maintained directly by the Funds’ transfer agent. Accordingly, the Funds, pursuant to the Board approval, have agreed to reimburse the Manager for certain non-distribution shareholder services provided by financial intermediaries for the Institutional and Y Classes. The reimbursement amounts (sub-transfer agent fees) paid to the Manager are subject to a fee limit of up to 0.10% of an intermediary’s average net assets in the Institutional and Y Classes on an annual basis. During the year ended December 31, 2017, the sub-transfer agent fees, as reflected in “Transfer agent fees” on the Statements of Operations, were as follows:
| | | | |
Fund | | Sub-Transfer Agent Fees | |
Stephens Mid-Cap Growth | | $ | 42,649 | |
Stephens Small Cap Growth | | | 248,810 | |
As of December 31, 2017, the Funds owed the Manager the following reimbursement of sub-transfer agent fees, as reflected in “Transfer agent fees payable” on the Statements of Assets and Liabilities:
| | | | |
Fund | | Reimbursement
Sub-Transfer Agent Fees | |
Stephens Mid-Cap Growth | | $ | 4,506 | |
Stephens Small Cap Growth | | | 21,300 | |
28
American Beacon FundsSM
Notes to Financial Statements
December 31, 2017
Investments in Affiliated Funds
The Funds may invest in the American Beacon U.S. Government Money Market Select Fund (the “USG Select Fund”). Cash collateral received by the Funds in connection with securities lending may also be invested in the USG Select Fund. The Funds and the USG Select Fund have the same investment advisor and therefore, are considered to be affiliated. The Manager serves as investment advisor to the USG Select Fund and receives management fees and administrative fees totaling 0.10% of the average daily net assets of the USG Select Fund. During the year ended December 31, 2017, the Manager earned fees on the Funds’ direct investments and securities lending collateral investments in the USG Select Fund as shown below:
| | | | | | | | | | | | |
Fund | | Direct Investments in
USG Select Fund | | | Securities Lending
Collateral in USG
Select Fund | | | Total | |
Stephens Mid-Cap Growth | | $ | 1,757 | | | $ | 1,955 | | | $ | 3,712 | |
Stephens Small Cap Growth | | | 6,777 | | | | 34,297 | | | | 41,074 | |
Interfund Credit Facility
Pursuant to an exemptive order issued by the Securities and Exchange Commission (“SEC”), the Funds, along with other registered investment companies having management contracts with the Manager, may participate in a credit facility whereby each Fund, under certain conditions, is permitted to lend money directly to and borrow directly from other participating Funds for temporary purposes. The interfund credit facility is advantageous to the Funds because it provides added liquidity, and eliminates the need to maintain higher cash balances to meet redemptions. This situation could arise when shareholder redemptions exceed anticipated volumes and certain funds have insufficient cash on hand to satisfy such redemptions or when sales of securities do not settle as expected, resulting in a cash shortfall for a fund. When a Fund liquidates portfolio securities to meet redemption requests, they often do not receive payment in settlement for up to three days (or longer for certain foreign transactions). Redemption requests normally are satisfied on the next business day. The credit facility provides a source of immediate, short-term liquidity pending settlement of the sale of portfolio securities. The credit facility is administered by a credit facility team consisting of professionals from the Manager’s asset management, compliance, and accounting areas who report the activities of the credit facility to the Board. During the year ended December 31, 2017, the Stephens Mid-Cap Growth Fund borrowed on average $1,310,394 for 2 days at an average interest rate of 1.74% with interest charges of $125 and the Stephens Small Cap Growth Fund borrowed on average $2,454,156 for 12 days at an average interest rate of 1.80% with interest charges of $1,445. These amounts are recorded as “Other expenses” in the Statements of Operations.
Expense Reimbursement Plan
The Manager contractually agreed to reduce fees and/or reimburse expenses for the classes of the Funds to the extent that total operating expenses exceed the Funds’ expense cap. During the year ended December 31, 2017, the Manager waived and/or reimbursed expenses as follows:
| | | | | | | | | | | | | | | | | | |
| | | | | Expense Cap | | | | | | | | | Expiration of
Reimbursed
Expenses | |
Fund | | Class | | 1/1/2017 -
12/31/2017 | | | Reimbursed
Expenses | | | (Recouped)
Expenses | | |
Stephens Mid-Cap Growth | | Institutional | | | 0.99 | % | | $ | 46,780 | | | $ | - | | | | 2020 | |
Stephens Mid-Cap Growth | | Y | | | 1.09 | % | | | 705 | | | | - | | | | 2020 | |
Stephens Mid-Cap Growth | | A | | | 1.39 | % | | | 153 | | | | - | | | | 2020 | |
Stephens Mid-Cap Growth | | C | | | 2.14 | % | | | 23 | | | | - | | | | 2020 | |
Stephens Small Cap Growth | | Investor | | | 1.35 | % | | | - | | | | (9,196 | ) | | | 2020 | |
Of these amounts, $5,925 was disclosed as a receivable from the Manager on the Statements of Assets and Liabilities at December 31, 2017 for the Stephens Mid-Cap Growth Fund.
29
American Beacon FundsSM
Notes to Financial Statements
December 31, 2017
The Funds have adopted an Expense Reimbursement Plan whereby the Manager may seek repayment of such fee reductions and expense reimbursements. Under the policy, the Manager can be reimbursed by the Funds for any contractual or voluntary fee reductions or expense reimbursements if reimbursement to the Manager (a) occurs within three years after the Manager’s own waiver or reimbursement and (b) does not cause the Funds’ annual operating expenses to exceed the lesser of the contractual percentage limit in effect at the time of the waiver/reimbursement or time of recoupment. The reimbursed expenses listed above will expire in 2020. The Funds did not record a liability for potential reimbursements due to the current assessment that reimbursements are unlikely. The carryover of excess expenses potentially reimbursable to the Manager, but not recorded as a liability are as follows:
| | | | | | | | | | | | | | | | |
Fund | | Recovered
Expenses | | | Excess Expense
Carryover | | | Expired Expense
Carryover | | | Expiration of
Reimbursed
Expenses | |
Stephens Mid-Cap Growth | | $ | - | | | $ | 174 | | | $ | - | | | | 2018 | |
Stephens Mid-Cap Growth | | | - | | | | 54,783 | | | | - | | | | 2019 | |
Stephens Small Cap Growth | | | (9,196 | ) | | | 53 | | | | - | | | | 2018 | |
Sales Commissions
The Funds’ distributor, Foreside Fund Services, LLC (“Foreside”), may receive a portion of A Class sales charges from broker dealers and it may be used to offset distribution related expenses. During the year ended December 31, 2017, Foreside collected $2,913 and $1,554 in sales commissions for Stephens Mid-Cap Growth Fund and Stephens Small Cap Growth Fund, respectively, from the sale of Class A Shares.
A CDSC of 0.50% will be deducted with respect to Class A Shares on certain purchases of $1,000,000 or more that are redeemed in whole or part within 18 months of purchase, unless waived as discussed in the Funds’ Prospectus. Any applicable CDSC will be 0.50% of the lesser of the original purchase price or the value of the redemption of the Class A Shares redeemed. During the year ended December 31, 2017, there were no CDSC fees collected for Class A Shares of the Funds.
A CDSC of 1.00% will be deducted with respect to Class C Shares redeemed within 12 months of purchase, unless waived as discussed in the Funds’ Prospectus. Any applicable CDSC will be 1.00% of the lesser of the original purchase price or the value of the redemption of the Class C Shares redeemed. During the year ended December 31, 2017, CDSC fees of $165 and $24 were collected for Class C Shares of the Stephens Mid-Cap Growth Fund and the Stephens Small Cap Growth Fund, respectively.
Trustee Fees and Expenses
As compensation for their service to the Trust, the American Beacon Select Funds and the American Beacon Institutional Funds Trust, each Trustee receives an annual retainer of $120,000, plus $10,000 for each Board meeting attended in person or via teleconference, $2,500 for attendance by Committee members at meetings of the Audit Committee and the Investment Committee, and $1,500 for attendance by Committee members at meetings of the Nominating and Governance Committee, plus reimbursement of reasonable expenses incurred in attending Board meetings, Committee meetings, and relevant educational seminars. The Trustees also may be compensated for attendance at special Board and/or Committee meetings from time to time. The Board Chairman receives an additional annual retainer of $50,000 as well as a single $10,000 fee each quarter for his attendance at the committee meetings. The Chairpersons of the Audit Committee and the Investment Committee each receive an additional annual retainer of $25,000 and the Chairman of the Nominating and Governance Committee receives an additional annual retainer of $10,000. These expenses are allocated on a prorated basis to each Fund of the Trusts according to its respective net assets.
3. Security Valuation and Fair Value Measurements
Investments are valued at the close of the New York Stock Exchange (the “Exchange”), normally at 4:00 p.m. Eastern Time, each day that the Exchange is open for business. Equity securities, including exchange-traded funds
30
American Beacon FundsSM
Notes to Financial Statements
December 31, 2017
(“ETFs”) for which market quotations are available are valued at the last sale price or official closing price (closing bid price or last evaluated quote if no sale has occurred) on the primary market or exchange on which they trade.
Investments in open-end mutual funds are valued at the closing NAV per share of the mutual fund on the day of valuation.
Securities for which the market prices are not readily available or are not reflective of the fair value of the security, as determined by the Manager, will be priced at fair value following procedures approved by the Board.
Other investments, including restricted securities and those financial instruments for which the above valuation procedures are inappropriate or are deemed not to reflect fair value, are stated at fair value, as determined in good faith by the Manager’s Valuation Committee, pursuant to procedures established by the Board.
Valuation Inputs
Various inputs may be used to determine the fair value of the Funds’ investments. These inputs are summarized in three broad levels for financial statement purposes. The inputs or methodologies used to value securities are not necessarily an indication of the risk associated with investing in those securities.
| | | | |
| Level 1 | | - | | Quoted prices in active markets for identical securities. |
| | |
| Level 2 | | - | | Prices determined using other significant observable inputs. These may include quoted prices for similar securities, interest rates, prepayment speeds, credit risk, and others. |
| | |
| Level 3 | | - | | Prices determined using other significant unobservable inputs. Unobservable inputs reflect the Fund’s own assumptions about the factors market participants would use in pricing an investment. |
Level 1 and Level 2 trading assets and trading liabilities, at fair value
Common stocks, preferred securities, ETFs and financial derivative instruments, such as futures contracts that are traded on a national securities exchange, are stated at the last reported sale or settlement price on the day of valuation. To the extent these securities are actively traded and valuation adjustments are not applied, they are categorized as Level 1 of the fair value hierarchy. Preferred securities and other equities traded on inactive markets or valued by reference to similar instruments are generally categorized as Level 2 of the fair value hierarchy.
Investments in registered open-end investment management companies will be valued based upon the NAVs of such investments and are categorized as Level 1 of the fair value hierarchy.
4. Securities and Other Investments
Common Stock
Common stock generally takes the form of shares in a corporation which represent an ownership interest. It ranks below preferred stock and debt securities in claims for dividends and for assets of the company in a liquidation or bankruptcy. The value of a company’s common stock may fall as a result of factors directly relating to that company, such as decisions made by its management or decreased demand for the company’s products or services. A stock’s value may also decline because of factors affecting not just the company, but also companies in the same industry or sector. The price of a company’s stock may also be affected by changes in financial markets that are relatively unrelated to the company, such as changes in interest rates, currency exchange rates or industry regulation. Companies that elect to pay dividends on their common stock generally only do so after they invest in their own business and make required payments to bondholders and on other debt and preferred stock. Therefore, the value of a company’s common stock will usually be more volatile than its bonds, other debt and preferred stock. Common stock may be exchange-traded or over-the-counter (“OTC”). OTC stock may be less liquid than exchange-traded stock.
31
American Beacon FundsSM
Notes to Financial Statements
December 31, 2017
Other Investment Company Securities and Other Exchange-Traded Products
The Funds may invest in shares of other investment companies, including open-end funds, closed-end funds, business development companies, ETFs, unit investment trusts, and other investment companies of the Trust. The Funds may invest in investment company securities advised by the Manager or a sub-advisor. Investments in the securities of other investment companies may involve duplication of advisory fees and certain other expenses. By investing in another investment company, the Funds become a shareholder of that investment company. As a result, the Funds’ shareholders indirectly will bear the Funds’ proportionate share of the fees and expenses paid by shareholders of the other investment company, in addition to the fees and expenses the Funds’ shareholders directly bear in connection with the Funds’ own operations. These other fees and expenses are reflected as Acquired Fund Fees and Expenses and are included in the Fees and Expenses Table for the Funds in their Prospectus, if applicable. Investments in other investment companies may involve the payment of substantial premiums above the value of such issuer’s portfolio securities.
5. Principal Risks
Investing in the Funds may involve certain risks including, but not limited to, those described below.
Equity Investment Risk
Equity securities are subject to market risk. The Funds’ investments in equity securities may include common stocks, preferred stocks, securities convertible into or exchangeable for common stocks, REITs, depositary receipts, and U.S. dollar-denominated foreign stocks traded on U.S. exchanges. Such investments may expose the Funds to additional risk. The value of a company’s common stock may fall as a result of factors affecting the company, companies in the same industry or sector, or the financial markets overall. Common stock generally is subordinate to preferred stock upon the liquidation or bankruptcy of the issuing company. Preferred stocks and convertible securities are sensitive to movements in interest rates. Preferred stocks may be less liquid than common stocks and, unlike common stocks, participation in the growth of an issuer may be limited. Distributions on preferred stocks generally are payable at the discretion of an issuer and after required payments to bond holders. Convertible securities are subject to the risk that the credit standing of the issuer may have an effect on the convertible securities’ investment value. Investments in REITs are subject to the risks associated with investing in the real estate industry such as adverse developments affecting the real estate industry and real property values. Depositary receipts and U.S. dollar-denominated foreign stocks traded on U.S. exchanges are subject to certain of the risks associated with investing directly in foreign securities, including, but not limited to, currency fluctuations and political and financial instability in the home country of a particular depositary receipt or foreign stock.
Foreign Investing Risk
The Funds may invest in securities issued by foreign companies through ADRs and U.S. dollar-denominated foreign stocks traded on U.S. exchanges. The Funds may also invest in local currency investments. American Depository Reciepts (“ADRs”) are subject to many of the risks inherent in currency fluctuations and political and financial instability in the home country of a particular ADR or foreign stock. Non-U.S. investments carry potential risks not associated with U.S. investments. Such risks include, but are not limited to: (1) currency exchange rate fluctuations, (2) political and financial instability, (3) less liquidity and greater volatility, (4) lack of uniform accounting, auditing and financial reporting standards, (5) increased price volatility, (6) less government regulation and supervision of foreign stock exchanges, brokers and listed companies, and (7) delays in transaction settlement in some foreign markets.
32
American Beacon FundsSM
Notes to Financial Statements
December 31, 2017
Investment Risk
An investment in the Funds is not a deposit with a bank and is not insured or guaranteed by the Federal Deposit Insurance Corporation or any other government agency. When you sell your shares of the Funds, they could be worth less than what you paid for them. Therefore, you may lose money by investing in the Funds.
Market Risk
Since the financial crisis that started in 2008, the U.S. and many foreign economies continue to experience its after-effects, which have resulted, and may continue to result, in fixed-income instruments experiencing unusual liquidity issues, increased price volatility and, in some cases, credit downgrades and increased likelihood of default. These events have reduced the willingness and ability of some lenders to extend credit, and have made it more difficult for some borrowers to obtain financing on attractive terms, if at all. In addition, global economies and financial markets are becoming increasingly interconnected, which increases the possibilities that conditions in one country or region might adversely impact issuers in a different country or region. The severity or duration of adverse economic conditions may also be affected by policy changes made by governments or quasi-governmental organizations.
In addition, political events within the U.S. and abroad may affect investor and consumer confidence and may adversely impact financial markets and the broader economy, perhaps suddenly and to a significant degree. High public debt in the U.S. and other countries creates ongoing systemic and market risks and policymaking uncertainty. Because the impact on the markets has been widespread, it may be difficult to identify both risks and opportunities using past models of the interplay of market forces, or to predict the duration of these market conditions. Interest rates have been unusually low in recent years in the U.S. and abroad. Because there is little precedent for this situation, it is difficult to predict the impact on various markets of a significant rate increase, whether brought about by U.S. policy makers or by dislocations in world markets. In addition, there is a risk that the prices of goods and services in the U.S. and many foreign economies may decline over time, known as deflation (the opposite of inflation). Deflation may have an adverse effect on stock prices and creditworthiness and may make defaults on debt more likely.
Other Investment Companies Risk
The Funds may invest in shares of other registered investment companies, including ETFs and money market funds. To the extent that the Funds invest in shares of other registered investment companies, the Funds will indirectly bear the fees and expenses charged by the underlying funds in addition to the Funds’ direct fees and expenses and will be subject to the risks associated with investments in those funds.
Sector Risk
Sector risk is the risk associated with the Funds holding a significant amount of investments in similar businesses, which could be affected by the same economic or market conditions.
Securities Lending Risk
To the extent the Funds lend its securities, it may be subject to the following risks; i) borrowers of the Funds’ securities typically provide collateral in the form of cash that is reinvested in securities, ii) the securities in which the collateral is invested may not perform sufficiently to cover the return collateral payments owed to borrowers, iii) delays may occur in the recovery of securities from borrowers, which could interfere with the Funds’ ability to vote proxies or to settle transactions, and iv) there is the risk of possible loss of rights in the collateral should the borrower fail financially.
33
American Beacon FundsSM
Notes to Financial Statements
December 31, 2017
Offsetting Assets and Liabilities
The Funds are parties to enforceable master netting agreements between brokers and counterparties which provide for the right to offset under certain circumstances. The Funds employ multiple money managers and counterparties and have elected not to offset qualifying financial and derivative instruments on the Statements of Assets and Liabilities, as such all financial and derivative instruments are presented on a gross basis. The impacts of netting arrangements that provide the right to offset are detailed below. The net amount represents the net receivable or payable that would be due from or to the counterparty in the event of default. Exposure from borrowings and other financing agreements such as repurchase agreements can only be netted across transactions governed by the same Master Agreement with the same legal entity. All amounts reported below represent the balance as of the report date, December 31, 2017.
Stephens Mid-Cap Growth Fund
| | | | | | | | | | | | | | | | | | | | | | | | | | | | | | | | | | | | |
| Offsetting of Financial and Derivative Assets as of December 31, 2017: | |
| | | Remaining Contractual Maturity of the Agreements
As of December 31, 2017 | |
| | Overnight and
Continuous | | | | | | <30 days | | | | | | Between
30 & 90 days | | | | | | >90 days | | | | | | Total | |
| Securities Lending Transactions | | | | | | | | | | | | | | | | | | | | | | | | | | | | | | | | | | | | |
Common Stocks | | $ | 1,853,081 | | | | | | | $ | - | | | | | | | $ | - | | | | | | | $ | - | | | | | | | $ | 1,853,081 | |
| | | | | | | | | | | | | | | | | | | | | | | | | | | | | | | | | | | | |
| Total Borrowings | | $ | 1,853,081 | | | | | | | $ | - | | | | | | | $ | - | | | | | | | $ | - | | | | | | | $ | 1,853,081 | |
| | | | | | | | | | | | | | | | | | | | | | | | | | | | | | | | | | | | |
| Gross amount of recognized liabilities for securities lending transactions | | | | | | | $ | 1,853,081 | |
| | | | | | | | | |
Stephens Small Cap Growth Fund
| | | | | | | | | | | | | | | | | | | | | | | | | | | | | | | | | | | | |
| Offsetting of Financial and Derivative Assets as of December 31, 2017: | |
| | | Remaining Contractual Maturity of the Agreements
As of December 31, 2017 | |
| | Overnight and
Continuous | | | | | | <30 days | | | | | | Between
30 & 90 days | | | | | | >90 days | | | | | | Total | |
| Securities Lending Transactions | | | | | | | | | | | | | | | | | | | | | | | | | | | | | | | | | | | | |
Common Stocks | | $ | 48,083,424 | | | | | | | $ | - | | | | | | | $ | - | | | | | | | $ | - | | | | | | | $ | 48,083,424 | |
| | | | | | | | | | | | | | | | | | | | | | | | | | | | | | | | | | | | |
| Total Borrowings | | $ | 48,083,424 | | | | | | | $ | - | | | | | | | $ | - | | | | | | | $ | - | | | | | | | $ | 48,083,424 | |
| | | | | | | | | | | | | | | | | | | | | | | | | | | | | | | | | | | | |
| Gross amount of recognized liabilities for securities lending transactions | | | | | | | $ | 48,083,424 | |
| | | | | | | | | |
6. Federal Income and Excise Taxes
It is the policy of each Fund to qualify as a regulated investment company (“RIC”), by complying with all applicable provisions of Subchapter M of the Internal Revenue Code, as amended, and to make distributions of taxable income sufficient to relieve it from substantially all federal income and excise taxes. For federal income tax purposes, each Fund is treated as a single entity for the purpose of determining such qualification.
The Funds do not have any unrecognized tax benefits in the accompanying financial statements. Each of the tax years in the four year period ended December 31, 2017 remain subject to examination by the Internal Revenue Service. If applicable, the Funds recognize interest accrued related to unrecognized tax benefits in interest expense and penalties in “Other expenses” on the Statements of Operations.
The Funds may be subject to taxes imposed by countries in which it invests. Such taxes are generally based on returns of income earned or gains realized or repatriated. Taxes are accrued and applied to net investment income, net realized capital gains and net unrealized appreciation (depreciation), as applicable, as the income is earned or capital gains are recorded.
34
American Beacon FundsSM
Notes to Financial Statements
December 31, 2017
The tax character of distributions paid were as follows:
| | | | | | | | | | | | | | | | | | | | | | | | | | | | |
| | | Stephens Mid-Cap Growth Fund | | | | | | Stephens Small Cap Growth Fund | |
| | | Year Ended
December 31, 2017 | | | | | | Year Ended
December 31, 2016 | | | | | | Year Ended
December 31, 2017 | | | | | | Year Ended
December 31, 2016 | |
Distributions paid from: | |
Long-term capital gains | |
Institutional Class | | $ | 2,690,238 | | | | | | | $ | 2,746,156 | | | | | | | $ | 14,512,324 | | | | | | | $ | 3,634,109 | |
Y Class | | | 245,604 | | | | | | | | 101,600 | | | | | | | | 2,773,676 | | | | | | | | 676,175 | |
Investors Class | | | 774,146 | | | | | | | | 825,119 | | | | | | | | 1,840,808 | | | | | | | | 440,539 | |
A Class | | | 751,075 | | | | | | | | 878,585 | | | | | | | | 199,473 | | | | | | | | 61,811 | |
C Class | | | 100,863 | | | | | | | | 90,663 | | | | | | | | 36,826 | | | | | | | | 11,705 | |
| | | | | | | | | | | | | | | | | | | | | | | | | | | | |
Total distributions paid | | $ | 4,561,926 | | | | | | | $ | 4,642,123 | | | | | | | $ | 19,363,107 | | | | | | | $ | 4,824,339 | |
| | | | | | | | | | | | | | | | | | | | | | | | | | | | |
As of December 31, 2017 the components of distributable earnings (deficits) on a tax basis were as follows:
| | | | | | | | | | | | | | | | | | | | | | | | | | | | |
Fund | | Tax Cost | | | | | | Unrealized
Appreciation | | | | | | Unrealized
(Depreciation) | | | | | | Net Unrealized
Appreciation
(Depreciation) | |
| Stephens Mid-Cap Growth | | $ | 65,691,390 | | | | | | | $ | 35,799,619 | | | | | | | $ | (2,435,958 | ) | | | | | | $ | 33,363,661 | |
| Stephens Small Cap Growth | | | 447,252,280 | | | | | | | | 185,994,237 | | | | | | | | (13,144,741 | ) | | | | | | | 172,849,496 | |
| | | | | | | | | | | | | | | | | | | | | | | | | | | | | | | | | | | | | | | | | | | | |
Fund | | Net Unrealized
Appreciation
(Depreciation) | | | | | | Undistributed
Ordinary Income | | | | | | Undistributed
Long-Term
Capital Gains | | | | | | Accumulated
Capital and
Other (Losses) | | | | | | Other Temporary
Differences | | | | | | Distributable
Earnings | |
| Stephens Mid-Cap Growth | | $ | 33,363,661 | | | | | | | $ | - | | | | | | | $ | 2,254,174 | | | | | | | $ | - | | | | | | | $ | 2 | | | | | | | $ | 35,617,837 | |
| Stephens Small Cap Growth | | | 172,849,496 | | | | | | | | - | | | | | | | | 12,989,310 | | | | | | | | - | | | | | | | | - | | | | | | | | 185,838,806 | |
Financial reporting records are adjusted for permanent book/tax differences to reflect tax character. Financial records are not adjusted for temporary differences. The temporary differences between financial reporting and tax-basis reporting of unrealized appreciation (depreciation) are attributable primarily to the tax deferral of losses from wash sales.
Due to inherent differences in the recognition of income, expenses, and realized gains (losses) under U.S. GAAP and federal income tax regulations, permanent differences between book and tax reporting have been identified and appropriately reclassified on the Statements of Assets and Liabilities.
Accordingly, the following amounts represent current year permanent differences derived from non-utilization of net operating losses as of December 31, 2017:
| | | | | | | | | | | | | | | | | | | | | | | | | | | | |
Fund | | Paid-In-Capital | | | | | | Undistributed
(Overdistribution of)
Net Investment
Income | | | | | | Accumulated Net
Realized Gain (Loss) | | | | | | Net Unrealized
Appreciation
(Depreciation) | |
| Stephens Mid-Cap Growth | | $ | (383,965 | ) | | | | | | $ | 383,965 | | | | | | | $ | - | | | | | | | $ | - | |
| Stephens Small Cap Growth | | | (5,293,249 | ) | | | | | | | 4,974,499 | | | | | | | | 318,750 | | | | | | | | - | |
Under the Regulated Investment Company Modernization Act of 2010 (“RIC MOD”), net capital losses recognized by the Funds in taxable years beginning after December 22, 2010 are carried forward indefinitely and retain their character as short-term and/or long-term losses.
During the year December 31, 2017, Stephens Small Cap Growth Fund utilized $2,328,516 long term capital loss carryforward.
35
American Beacon FundsSM
Notes to Financial Statements
December 31, 2017
7. Investment Transactions
The aggregate cost of purchases and proceeds from sales of investments, other than short-term obligations, for the year ended December 31, 2017 were as follows:
| | | | | | | | | | | | |
Fund | | Purchases (non-U.S.
Government
Securities) | | | | | | Sales (non-U.S.
Government
Securities) | |
| Stephens Mid-Cap Growth | | $ | 21,399,201 | | | | | | | $ | 27,030,144 | |
| Stephens Small Cap Growth | | | 129,520,403 | | | | | | | | 247,335,583 | |
A summary of the Funds’ transactions in the USG Select Fund for the year ended December 31, 2017 are as follows:
| | | | | | | | | | | | | | | | | | | | | | | | | | | | | | | | | | | | | | | | | | |
Fund | | Type of
Transaction | | | | | December 31,
2016
Share/Fair
Value | | | | | | Purchases | | | | | | Sales | | | | | | December 31,
2017
Share/Fair
Value | | | | | | Dividend
Income | |
| Stephens Mid-Cap Growth Fund | | Direct | | | | | | $ | 1,747,402 | | | | | | | $ | 22,669,631 | | | | | | | $ | 24,121,203 | | | | | | | $ | 295,830 | | | | | | | $ | 13,202 | |
| Stephens Mid-Cap Growth Fund | | Securities
Lending | | | | | | | 1,346,615 | | | | | | | | 38,630,678 | | | | | | | | 38,124,212 | | | | | | | | 1,853,081 | | | | | | | | N/A | |
| Stephens Small Cap Growth Fund | | Direct | | | | | | | 28,216,747 | | | | | | | | 118,455,298 | | | | | | | | 145,414,669 | | | | | | | | 1,257,376 | | | | | | | | 44,765 | |
| Stephens Small Cap Growth Fund | | Securities
Lending | | | | | | | 17,065,741 | | | | | | | | 293,041,226 | | | | | | | | 262,023,543 | | | | | | | | 48,083,424 | | | | | | | | N/A | |
8. Securities Lending
The Funds may lend their securities to qualified financial institutions, such as certain broker-dealers, to earn additional income. The borrowers are required to secure their loans continuously with collateral in an amount at least equal to the fair value of the securities loaned, initially in an amount at least equal to 102% of the fair value of domestic securities loaned and 105% of the fair value of international securities loaned. Collateral is monitored and marked-to-market daily. Daily mark-to-market amounts are required to be paid to the borrower or received from the borrower by the end of the following business day. This one day settlement for mark-to-market amounts may result in the collateral being temporarily less than the value of the securities on loan or temporarily more than the required minimum collateral.
To the extent that a loan is collateralized by cash, such cash collateral shall be invested by the securities lending agent (the “Agent”) in money market mutual funds and other short-term investments, provided the investments meet certain quality and diversification requirements. Securities purchased with cash collateral proceeds are listed in the Funds’ Schedule of Investments and the collateral is shown on the Statement of Assets and Liabilities as a payable.
Securities lending income is generated from the demand premium (if any) paid by the borrower to borrow a specific security and from the return on investment of cash collateral, reduced by negotiated rebate fees paid to the borrower and transaction costs. To the extent that a loan is secured by non-cash collateral, securities lending income is generated as a demand premium reduced by transaction costs. The Funds, the Agent, and the Manager retained 80%, 10%, and 10%, respectively, of the income generated from securities lending.
While securities are on loan, the Funds continue to receive certain income associated with that security and any gain or loss in the market price that may occur during the term of the loan. In the case of domestic equities, the value of any dividend is received in the form of a substitute payment approximately equal to the dividend. In the case of foreign securities, a negotiated amount is received that is less than the actual dividend, but higher than the dividend amount minus the foreign tax that the Funds would be subject to on the dividend.
36
American Beacon FundsSM
Notes to Financial Statements
December 31, 2017
Securities lending transactions pose certain risks to the Funds, including that the borrower may not provide additional collateral when required or return the securities when due, that the value of the short-term investments will be less than the amount of cash collateral required to be returned to the borrower, that non-cash collateral may be subject to legal constraints in the event of a borrower bankruptcy, and that the cash collateral investments could become illiquid and unable to be used to return collateral to the borrower. The Funds could also experience delays and costs in gaining access to the collateral. The Funds bear the risk of any deficiency in the amount of the cash collateral available for return to the borrower and any action which impairs its ability to liquidate non-cash collateral to satisfy a borrower default.
As of December 31, 2017, the value of outstanding securities on loan and the value of collateral were as follows:
| | | | | | | | | | | | | | | | | | | | | | | | | | | | |
Fund | | Market Value of
Securities on Loan | | | | | | Cash Collateral
Received | | | | | | Non-Cash Collateral
Received | | | | | | Total Collateral
Received | |
| Stephens Mid-Cap Growth | | $ | 1,812,167 | | | | | | | $ | 1,853,081 | | | | | | | $ | - | | | | | | | $ | 1,853,081 | |
| Stephens Small Cap Growth | | | 46,663,553 | | | | | | | | 48,083,424 | | | | | | | | - | | | | | | | | 48,083,424 | |
Cash collateral is listed on the Funds’ Schedules of Investments and is shown on the Statements of Assets and Liabilities. Income earned on these investments is included in “Income derived from securities lending” on the Statements of Operations.
Non-cash collateral received by the Funds may not be sold or re-pledged except to satisfy a borrower default. Therefore, non-cash collateral is not included on the Funds’ Schedules of Investments or Statements of Assets and Liabilities.
9. Borrowing Arrangements
Effective November 16, 2017, the Funds, along with certain other funds managed by the Manager (“Participating Funds”), entered into a committed revolving line of credit (the “Committed Line”) agreement with State Street Bank and Trust Company (the “Bank”) to be used to facilitate portfolio liquidity. The maximum borrowing amount under the Committed Line is $50 million with interest at a rate equal to the higher of (a) one-month London Inter-Bank Offered Rate (“LIBOR”) plus 1.25% per annum or (b) the Federal Funds rate plus 1.25% per annum on amounts borrowed. Each of the Participating Funds will pay a commitment fee at a rate of 0.25% per annum on the unused portion of the Committed Line amount. The Committed Line expires November 15, 2018 unless extended by the Bank or terminated by the Participating Funds in accordance with the agreement.
Effective November 16, 2017, the Funds, along with certain other Participating Funds managed by the Manager, entered into an uncommitted discretionary demand revolving line of credit (the “Uncommitted Line”) agreement with the Bank to be used to facilitate portfolio liquidity. The maximum borrowing amount under the Uncommitted Line is $50 million with interest at a rate equal to the higher of (a) one-month LIBOR plus 1.25% per annum or (b) the Federal Funds rate. The Uncommitted Line expires November 15, 2018, unless extended by the Bank or terminated by the Participating Funds in accordance with the agreement.
The Participating Funds paid administration, legal and arrangement fees, which are recognized as a component of “Other expenses” on the Statements of Operations, along with commitment fees, that have been allocated among the Participating Funds based on average daily net assets. During the year ended December 31, 2017, the Funds did not utilize this facility.
37
American Beacon FundsSM
Notes to Financial Statements
December 31, 2017
10. Capital Share Transactions
The tables below summarize the activity in capital shares for each Class of the Funds:
| | | | | | | | | | | | | | | | | | | | | | | | | | | | |
| | | Institutional Class | |
| | | Year Ended December 31, | |
| | | 2017 | | | | | | 2016 | |
Stephens Mid-Cap Growth Fund | | Shares | | | | | | Amount | | | | | | Shares | | | | | | Amount | |
| Shares sold | | | 668,863 | | | | | | | $ | 13,919,732 | | | | | | | | 1,177,720 | | | | | | | $ | 20,399,984 | |
| Reinvestment of dividends | | | 117,773 | | | | | | | | 2,652,250 | | | | | | | | 146,529 | | | | | | | | 2,693,187 | |
| Shares redeemed | | | (830,684 | ) | | | | | | | (17,481,948 | ) | | | | | | | (2,800,521 | ) | | | | | | | (48,457,431 | ) |
| | | | | | | | | | | | | | | | | | | | | | | | | | | | |
| Net (decrease) in shares outstanding | | | (44,048 | ) | | | | | | $ | (909,966 | ) | | | | | | | (1,476,272 | ) | | | | | | $ | (25,364,260 | ) |
| | | | | | | | | | | | | | | | | | | | | | | | | | | | |
| | | | |
| | | Y Class | |
| | | Year Ended December 31, | |
| | | 2017 | | | | | | 2016 | |
Stephens Mid-Cap Growth Fund | | Shares | | | | | | Amount | | | | | | Shares | | | | | | Amount | |
| Shares sold | | | 170,499 | | | | | | | $ | 3,611,313 | | | | | | | | 44,603 | | | | | | | $ | 820,474 | |
| Reinvestment of dividends | | | 10,385 | | | | | | | | 232,728 | | | | | | | | 5,101 | | | | | | | | 93,381 | |
| Shares redeemed | | | (66,224 | ) | | | | | | | (1,391,934 | ) | | | | | | | (49,219 | ) | | | | | | | (887,718 | ) |
| | | | | | | | | | | | | | | | | | | | | | | | | | | | |
| Net increase in shares outstanding | | | 114,660 | | | | | | | $ | 2,452,107 | | | | | | | | 485 | | | | | | | $ | 26,137 | |
| | | | | | | | | | | | | | | | | | | | | | | | | | | | |
| | | | |
| | | Investor Class | |
| | | Year Ended December 31, | |
| | | 2017 | | | | | | 2016 | |
Stephens Mid-Cap Growth Fund | | Shares | | | | | | Amount | | | | | | Shares | | | | | | Amount | |
| Shares sold | | | 67,121 | | | | | | | $ | 1,177,130 | | | | | | | | 10,957 | | | | | | | $ | 170,834 | |
| Reinvestment of dividends | | | 39,069 | | | | | | | | 750,512 | | | | | | | | 50,612 | | | | | | | | 802,201 | |
| Shares redeemed | | | (165,370 | ) | | | | | | | (3,048,034 | ) | | | | | | | (169,686 | ) | | | | | | | (2,603,913 | ) |
| | | | | | | | | | | | | | | | | | | | | | | | | | | | |
| Net (decrease) in shares outstanding | | | (59,180 | ) | | | | | | $ | (1,120,392 | ) | | | | | | | (108,117 | ) | | | | | | $ | (1,630,878 | ) |
| | | | | | | | | | | | | | | | | | | | | | | | | | | | |
| | | | |
| | | A Class | |
| | | Year Ended December 31, | |
| | | 2017 | | | | | | 2016 | |
Stephens Mid-Cap Growth Fund | | Shares | | | | | | Amount | | | | | | Shares | | | | | | Amount | |
| Shares sold | | | 56,836 | | | | | | | $ | 995,135 | | | | | | | | 122,839 | | | | | | | $ | 1,906,539 | |
| Reinvestment of dividends | | | 39,072 | | | | | | | | 747,844 | | | | | | | | 54,477 | | | | | | | | 860,740 | |
| Shares redeemed | | | (252,690 | ) | | | | | | | (4,653,221 | ) | | | | | | | (176,308 | ) | | | | | | | (2,782,925 | ) |
| | | | | | | | | | | | | | | | | | | | | | | | | | | | |
| Net increase (decrease) in shares outstanding | | | (156,782 | ) | | | | | | $ | (2,910,242 | ) | | | | | | | 1,008 | | | | | | | $ | (15,646 | ) |
| | | | | | | | | | | | | | | | | | | | | | | | | | | | |
| | | | |
| | | C Class | |
| | | Year Ended December 31, | |
| | | 2017 | | | | | | 2016 | |
Stephens Mid-Cap Growth Fund | | Shares | | | | | | Amount | | | | | | Shares | | | | | | Amount | |
| Shares sold | | | 25,836 | | | | | | | $ | 434,847 | | | | | | | | 7,487 | | | | | | | $ | 115,723 | |
| Reinvestment of dividends | | | 5,452 | | | | | | | | 99,052 | | | | | | | | 5,675 | | | | | | | | 86,052 | |
| Shares redeemed | | | (20,605 | ) | | | | | | | (365,071 | ) | | | | | | | (60,007 | ) | | | | | | | (892,866 | ) |
| | | | | | | | | | | | | | | | | | | | | | | | | | | | |
| Net increase (decrease) in shares outstanding | | | 10,683 | | | | | | | $ | 168,828 | | | | | | | | (46,845 | ) | | | | | | $ | (691,091 | ) |
| | | | | | | | | | | | | | | | | | | | | | | | | | | | |
| | | | |
| | | Institutional Class | |
| | | Year Ended December 31, | |
| | | 2017 | | | | | | 2016 | |
Stephens Small Cap Growth Fund | | Shares | | | | | | Amount | | | | | | Shares | | | | | | Amount | |
| Shares sold | | | 4,504,922 | | | | | | | $ | 79,205,971 | | | | | | | | 14,462,163 | | | | | | | $ | 223,106,635 | |
| Reinvestment of dividends | | | 748,200 | | | | | | | | 14,290,622 | | | | | | | | 215,695 | | | | | | | | 3,556,821 | |
| Shares redeemed | | | (9,812,486 | ) | | | | | | | (177,676,084 | ) | | | | | | | (7,271,033 | ) | | | | | | | (109,035,001 | ) |
| | | | | | | | | | | | | | | | | | | | | | | | | | | | |
| Net increase (decrease) in shares outstanding | | | (4,559,364 | ) | | | | | | $ | (84,179,491 | ) | | | | | | | 7,406,825 | | | | | | | $ | 117,628,455 | |
| | | | | | | | | | | | | | | | | | | | | | | | | | | | |
| | | | |
38
American Beacon FundsSM
Notes to Financial Statements
December 31, 2017
| | | | | | | | | | | | | | | | | | | | | | | | | | | | |
| | | Y Class | |
| | | Year Ended December 31, | |
| | | 2017 | | | | | | 2016 | |
Stephens Small Cap Growth Fund | | Shares | | | | | | Amount | | | | | | Shares | | | | | | Amount | |
| Shares sold | | | 613,505 | | | | | | | $ | 10,869,740 | | | | | | | | 7,449,981 | | | | | | | $ | 116,530,831 | |
| Reinvestment of dividends | | | 141,907 | | | | | | | | 2,696,242 | | | | | | | | 39,938 | | | | | | | | 655,773 | |
| Shares redeemed | | | (1,364,123 | ) | | | | | | | (24,219,003 | ) | | | | | | | (12,060,037 | ) | | | | | | | (196,540,679 | ) |
| | | | | | | | | | | | | | | | | | | | | | | | | | | | |
| Net (decrease) in shares outstanding | | | (608,711 | ) | | | | | | $ | (10,653,021 | ) | | | | | | | (4,570,118 | ) | | | | | | $ | (79,354,075 | ) |
| | | | | | | | | | | | | | | | | | | | | | | | | | | | |
| | | | |
| | | Investor Class | |
| | | Year Ended December 31, | |
| | | 2017 | | | | | | 2016 | |
Stephens Small Cap Growth Fund | | Shares | | | | | | Amount | | | | | | Shares | | | | | | Amount | |
| Shares sold | | | 225,973 | | | | | | | $ | 3,803,038 | | | | | | | | 791,664 | | | | | | | $ | 10,678,980 | |
| Reinvestment of dividends | | | 101,889 | | | | | | | | 1,818,722 | | | | | | | | 28,155 | | | | | | | | 435,840 | |
| Shares redeemed | | | (681,438 | ) | | | | | | | (11,357,320 | ) | | | | | | | (1,486,689 | ) | | | | | | | (20,770,152 | ) |
| | | | | | | | | | | | | | | | | | | | | | | | | | | | |
| Net (decrease) in shares outstanding | | | (353,576 | ) | | | | | | $ | (5,735,560 | ) | | | | | | | (666,870 | ) | | | | | | $ | (9,655,332 | ) |
| | | | | | | | | | | | | | | | | | | | | | | | | | | | |
| | | | |
| | | A Class | |
| | | Year Ended December 31, | |
| | | 2017 | | | | | | 2016 | |
Stephens Small Cap Growth Fund | | Shares | | | | | | Amount | | | | | | Shares | | | | | | Amount | |
| Shares sold | | | 68,302 | | | | | | | $ | 1,115,642 | | | | | | | | 46,390 | | | | | | | $ | 691,272 | |
| Reinvestment of dividends | | | 11,268 | | | | | | | | 199,210 | | | | | | | | 3,955 | | | | | | | | 60,700 | |
| Shares redeemed | | | (222,857 | ) | | | | | | | (3,683,945 | ) | | | | | | | (172,992 | ) | | | | | | | (2,427,677 | ) |
| | | | | | | | | | | | | | | | | | | | | | | | | | | | |
| Net (decrease) in shares outstanding | | | (143,287 | ) | | | | | | $ | (2,369,093 | ) | | | | | | | (122,647 | ) | | | | | | $ | (1,675,705 | ) |
| | | | | | | | | | | | | | | | | | | | | | | | | | | | |
| | | | |
| | | C Class | |
| | | Year Ended December 31, | |
| | | 2017 | | | | | | 2016 | |
Stephens Small Cap Growth Fund | | Shares | | | | | | Amount | | | | | | Shares | | | | | | Amount | |
| Shares sold | | | 1,859 | | | | | | | $ | 30,364 | | | | | | | | 4,104 | | | | | | | $ | 54,232 | |
| Reinvestment of dividends | | | 2,084 | | | | | | | | 35,066 | | | | | | | | 747 | | | | | | | | 11,031 | |
| Shares redeemed | | | (32,639 | ) | | | | | | | (514,533 | ) | | | | | | | (89,847 | ) | | | | | | | (1,188,522 | ) |
| | | | | | | | | | | | | | | | | | | | | | | | | | | | |
| Net (decrease) in shares outstanding | | | (28,696 | ) | | | | | | $ | (449,103 | ) | | | | | | | (84,996 | ) | | | | | | $ | (1,123,259 | ) |
| | | | | | | | | | | | | | | | | | | | | | | | | | | | |
11. Subsequent Events
Management has evaluated subsequent events for possible recognition or disclosure in the financial statements through the date the financial statements are issued. Management has determined that there are no material events that would require disclosure in the Funds’ financial statements through this date.
39
American Beacon Stephens Mid-Cap Growth FundSM
Financial Highlights
(For a share outstanding throughout the period)
| | | | | | | | | | | | | | | | | | | | | | | | | | | | | | | | | | | | |
| | | Institutional Class | |
| | | Year Ended December 31, | |
| | | 2017 | | | | | | 2016 | | | | | | 2015 | | | | | | 2014 | | | | | | 2013 | |
| | | | |
Net asset value, beginning of period | | $ | 18.29 | | | | | | | $ | 18.11 | | | | | | | $ | 19.24 | | | | | | | $ | 19.76 | | | | | | | $ | 15.38 | |
| | | | | | | | | | | | | | | | | | | | | | | | | | | | | | | | | | | | |
Income (loss) from investment operations: | | | | | | | | | | | | | | | | | | | | | | | | | | | | | | | | | | | | |
Net investment (loss) | | | (0.07 | ) | | | | | | | (0.26 | ) | | | | | | | (0.13 | ) | | | | | | | (0.04 | ) | | | | | | | (0.05 | ) |
Net gains (losses) on investments (both realized and unrealized) | | | 5.26 | | | | | | | | 1.49 | | | | | | | | (0.11 | ) | | | | | | | 0.72 | | | | | | | | 5.12 | |
| | | | | | | | | | | | | | | | | | | | | | | | | | | | | | | | | | | | |
Total income (loss) from investment operations | | | 5.19 | | | | | | | | 1.23 | | | | | | | | (0.24 | ) | | | | | | | 0.68 | | | | | | | | 5.07 | |
| | | | | | | | | | | | | | | | | | | | | | | | | | | | | | | | | | | | |
Less distributions: | | | | | | | | | | | | | | | | | | | | | | | | | | | | | | | | | | | | |
Dividends from net investment income | | | - | | | | | | | | - | | | | | | | | - | | | | | | | | - | | | | | | | | (0.01 | ) |
Distributions from net realized gains | | | (1.03 | ) | | | | | | | (1.05 | ) | | | | | | | (0.89 | ) | | | | | | | (1.20 | ) | | | | | | | (0.66 | ) |
Tax return of capitalA | | | - | | | | | | | | - | | | | | | | | - | | | | | | | | - | | | | | | | | (0.02 | ) |
| | | | | | | | | | | | | | | | | | | | | | | | | | | | | | | | | | | | |
Total distributions | | | (1.03 | ) | | | | | | | (1.05 | ) | | | | | | | (0.89 | ) | | | | | | | (1.20 | ) | | | | | | | (0.69 | ) |
| | | | | | | | | | | | | | | | | | | | | | | | | | | | | | | | | | | | |
Net asset value, end of period | | $ | 22.45 | | | | | | | $ | 18.29 | | | | | | | $ | 18.11 | | | | | | | $ | 19.24 | | | | | | | $ | 19.76 | |
| | | | | | | | | | | | | | | | | | | | | | | | | | | | | | | | | | | | |
Total returnB | | | 28.38 | % | | | | | | | 6.76 | % | | | | | | | (1.23 | )% | | | | | | | 3.41 | % | | | | | | | 33.14 | % |
| | | | | | | | | | | | | | | | | | | | | | | | | | | | | | | | | | | | |
| | | | | | | | | |
Ratios and supplemental data: | | | | | | | | | | | | | | | | | | | | | | | | | | | | | | | | | | | | |
Net assets, end of period | | $ | 60,933,913 | | | | | | | $ | 50,451,447 | | | | | | | $ | 76,666,136 | | | | | | | $ | 87,620,400 | | | | | | | $ | 63,235,775 | |
Ratios to average net assets: | | | | | | | | | | | | | | | | | | | | | | | | | | | | | | | | | | | | |
Expenses, before reimbursements or recoupments | | | 1.07 | % | | | | | | | 1.09 | % | | | | | | | 1.01 | % | | | | | | | 1.05 | % | | | | | | | 1.12 | % |
Expenses, net of reimbursements or recoupmentsC | | | 0.99 | % | | | | | | | 1.00 | % | | | | | | | 0.99 | % | | | | | | | 1.00 | % | | | | | | | 0.99 | % |
Net investment (loss), before expense reimbursements or recoupments | | | (0.36 | )% | | | | | | | (0.60 | )% | | | | | | | (0.54 | )% | | | | | | | (0.53 | )% | | | | | | | (0.70 | )% |
Net investment (loss), net of reimbursements or recoupments | | | (0.28 | )% | | | | | | | (0.51 | )% | | | | | | | (0.53 | )% | | | | | | | (0.48 | )% | | | | | | | (0.58 | )% |
Portfolio turnover rate | | | 24 | % | | | | | | | 22 | % | | | | | | | 19 | % | | | | | | | 37 | % | | | | | | | 25 | % |
| A | The distributions from return of capital is calculated based on outstanding shares at the time of distribution. |
| B | Based on net asset value, which does not reflect the sales charge, redemption fee, or contingent deferred sales charge, if applicable. May include adjustments in accordance with U.S. GAAP and as such, the net asset value for reporting purposes and the returns based upon those net asset values may differ from the net asset value and returns for shareholder transactions. |
| C | Expense ratios may exceed stated expense caps in Note 2 due to security lending expenses, which are not reimbursable under the agreement with the Manager. |
See accompanying notes
40
American Beacon Stephens Mid-Cap Growth FundSM
Financial Highlights
(For a share outstanding throughout the period)
| | | | | | | | | | | | | | | | | | | | | | | | | | | | | | | | | | | | |
| | | Y Class | |
| | | Year Ended December 31, | |
| | | 2017 | | | | | | 2016 | | | | | | 2015 | | | | | | 2014 | | | | | | 2013 | |
| | | | |
Net asset value, beginning of period | | $ | 18.22 | | | | | | | $ | 18.06 | | | | | | | $ | 19.22 | | | | | | | $ | 19.76 | | | | | | | $ | 15.38 | |
| | | | | | | | | | | | | | | | | | | | | | | | | | | | | | | | | | | | |
Income (loss) from investment operations: | | | | | | | | | | | | | | | | | | | | | | | | | | | | | | | | | | | | |
Net investment income (loss) | | | 0.12 | | | | | | | | (0.10 | ) | | | | | | | (0.15 | ) | | | | | | | (0.06 | ) | | | | | | | (0.08 | ) |
Net gains (losses) on investments (both realized and unrealized) | | | 5.03 | | | | | | | | 1.31 | | | | | | | | (0.12 | ) | | | | | | | 0.72 | | | | | | | | 5.15 | |
| | | | | | | | | | | | | | | | | | | | | | | | | | | | | | | | | | | | |
Total income (loss) from investment operations | | | 5.15 | | | | | | | | 1.21 | | | | | | | | (0.27 | ) | | | | | | | 0.66 | | | | | | | | 5.07 | |
| | | | | | | | | | | | | | | | | | | | | | | | | | | | | | | | | | | | |
Less distributions: | | | | | | | | | | | | | | | | | | | | | | | | | | | | | | | | | | | | |
Dividends from net investment income | | | - | | | | | | | | - | | | | | | | | - | | | | | | | | - | | | | | | | | (0.01 | ) |
Distributions from net realized gains | | | (1.03 | ) | | | | | | | (1.05 | ) | | | | | | | (0.89 | ) | | | | | | | (1.20 | ) | | | | | | | (0.68 | ) |
Tax return of capitalA | | | - | | | | | | | | - | | | | | | | | - | | | | | | | | - | | | | | | | | (0.00 | )B |
| | | | | | | | | | | | | | | | | | | | | | | | | | | | | | | | | | | | |
Total distributions | | | (1.03 | ) | | | | | | | (1.05 | ) | | | | | | | (0.89 | ) | | | | | | | (1.20 | ) | | | | | | | (0.69 | ) |
| | | | | | | | | | | | | | | | | | | | | | | | | | | | | | | | | | | | |
Net asset value, end of period | | $ | 22.34 | | | | | | | $ | 18.22 | | | | | | | $ | 18.06 | | | | | | | $ | 19.22 | | | | | | | $ | 19.76 | |
| | | | | | | | | | | | | | | | | | | | | | | | | | | | | | | | | | | | |
Total returnC | | | 28.27 | % | | | | | | | 6.67 | % | | | | | | | (1.39 | )% | | | | | | | 3.31 | % | | | | | | | 33.14 | % |
| | | | | | | | | | | | | | | | | | | | | | | | | | | | | | | | | | | | |
| | | | | | | | | |
Ratios and supplemental data: | | | | | | | | | | | | | | | | | | | | | | | | | | | | | | | | | | | | |
Net assets, end of period | | $ | 5,639,207 | | | | | | | $ | 2,510,649 | | | | | | | $ | 2,479,918 | | | | | | | $ | 3,109,192 | | | | | | | $ | 1,672,420 | |
Ratios to average net assets: | | | | | | | | | | | | | | | | | | | | | | | | | | | | | | | | | | | | |
Expenses, before reimbursements or recoupments | | | 1.11 | % | | | | | | | 1.12 | % | | | | | | | 1.06 | % | | | | | | | 1.10 | % | | | | | | | 1.14 | % |
Expenses, net of reimbursements or recoupmentsD | | | 1.09 | % | | | | | | | 1.12 | % | | | | | | | 1.09 | % | | | | | | | 1.10 | % | | | | | | | 1.09 | % |
Net investment (loss), before expense reimbursements or recoupments | | | (0.42 | )% | | | | | | | (0.63 | )% | | | | | | | (0.60 | )% | | | | | | | (0.57 | )% | | | | | | | (0.73 | )% |
Net investment (loss), net of reimbursements or recoupments | | | (0.40 | )% | | | | | | | (0.63 | )% | | | | | | | (0.63 | )% | | | | | | | (0.58 | )% | | | | | | | (0.68 | )% |
Portfolio turnover rate | | | 24 | % | | | | | | | 22 | % | | | | | | | 19 | % | | | | | | | 37 | % | | | | | | | 25 | % |
| A | The distributions from return of capital is calculated based on outstanding shares at the time of distribution. |
| B | Amount represents less than $0.01 per share. |
| C | Based on net asset value, which does not reflect the sales charge, redemption fee, or contingent deferred sales charge, if applicable. May include adjustments in accordance with U.S. GAAP and as such, the net asset value for reporting purposes and the returns based upon those net asset values may differ from the net asset value and returns for shareholder transactions. |
| D | Expense ratios may exceed stated expense caps in Note 2 due to security lending expenses, which are not reimbursable under the agreement with the Manager. |
See accompanying notes
41
American Beacon Stephens Mid-Cap Growth FundSM
Financial Highlights
(For a share outstanding throughout the period)
| | | | | | | | | | | | | | | | | | | | | | | | | | | | | | | | | | | | |
| | | Investor Class | |
| | | Year Ended December 31, | |
| | | 2017 | | | | | | 2016 | | | | | | 2015 | | | | | | 2014 | | | | | | 2013 | |
| | | | |
Net asset value, beginning of period | | $ | 15.77 | | | | | | | $ | 15.80 | | | | | | | $ | 16.97 | | | | | | | $ | 17.64 | | | | | | | $ | 13.83 | |
| | | | | | | | | | | | | | | | | | | | | | | | | | | | | | | | | | | | |
Income (loss) from investment operations: | | | | | | | | | | | | | | | | | | | | | | | | | | | | | | | | | | | | |
Net investment (loss) | | | (0.21 | ) | | | | | | | (0.27 | ) | | | | | | | (0.32 | ) | | | | | | | (0.36 | ) | | | | | | | (0.08 | ) |
Net gains on investments (both realized and unrealized) | | | 4.62 | | | | | | | | 1.29 | | | | | | | | 0.04 | | | | | | | | 0.89 | | | | | | | | 4.58 | |
| | | | | | | | | | | | | | | | | | | | | | | | | | | | | | | | | | | | |
Total income (loss) from investment operations | | | 4.41 | | | | | | | | 1.02 | | | | | | | | (0.28 | ) | | | | | | | 0.53 | | | | | | | | 4.50 | |
| | | | | | | | | | | | | | | | | | | | | | | | | | | | | | | | | | | | |
Less distributions: | | | | | | | | | | | | | | | | | | | | | | | | | | | | | | | | | | | | |
Dividends from net investment income | | | - | | | | | | | | - | | | | | | | | - | | | | | | | | - | | | | | | | | (0.01 | ) |
Distributions from net realized gains | | | (1.03 | ) | | | | | | | (1.05 | ) | | | | | | | (0.89 | ) | | | | | | | (1.20 | ) | | | | | | | (0.68 | ) |
Tax return of capitalA | | | - | | | | | | | | - | | | | | | | | - | | | | | | | | - | | | | | | | | (0.00 | )B |
| | | | | | | | | | | | | | | | | | | | | | | | | | | | | | | | | | | | |
Total distributions | | | (1.03 | ) | | | | | | | (1.05 | ) | | | | | | | (0.89 | ) | | | | | | | (1.20 | ) | | | | | | | (0.69 | ) |
| | | | | | | | | | | | | | | | | | | | | | | | | | | | | | | | | | | | |
Net asset value, end of period | | $ | 19.15 | | | | | | | $ | 15.77 | | | | | | | $ | 15.80 | | | | | | | $ | 16.97 | | | | | | | $ | 17.64 | |
| | | | | | | | | | | | | | | | | | | | | | | | | | | | | | | | | | | | |
Total returnC | | | 27.97 | % | | | | | | | 6.42 | % | | | | | | | (1.63 | )% | | | | | | | 2.97 | % | | | | | | | 32.71 | % |
| | | | | | | | | | | | | | | | | | | | | | | | | | | | | | | | | | | | |
| | | | | | | | | |
Ratios and supplemental data: | | | | | | | | | | | | | | | | | | | | | | | | | | | | | | | | | | | | |
Net assets, end of period | | $ | 14,749,984 | | | | | | | $ | 13,078,292 | | | | | | | $ | 14,814,940 | | | | | | | $ | 19,551,562 | | | | | | | $ | 31,912,432 | |
Ratios to average net assets: | | | | | | | | | | | | | | | | | | | | | | | | | | | | | | | | | | | | |
Expenses, before reimbursements or recoupments | | | 1.29 | % | | | | | | | 1.38 | % | | | | | | | 1.32 | % | | | | | | | 1.27 | % | | | | | | | 1.38 | % |
Expenses, net of reimbursements or recoupmentsD | | | 1.29 | % | | | | | | | 1.38 | % | | | | | | | 1.35 | % | | | | | | | 1.38 | % | | | | | | | 1.37 | % |
Net investment (loss), before expense reimbursements or recoupments | | | (0.58 | )% | | | | | | | (0.89 | )% | | | | | | | (0.85 | )% | | | | | | | (0.77 | )% | | | | | | | (0.98 | )% |
Net investment (loss), net of reimbursements or recoupments | | | (0.58 | )% | | | | | | | (0.89 | )% | | | | | | | (0.89 | )% | | | | | | | (0.88 | )% | | | | | | | (0.97 | )% |
Portfolio turnover rate | | | 24 | % | | | | | | | 22 | % | | | | | | | 19 | % | | | | | | | 37 | % | | | | | | | 25 | % |
| A | The distributions from return of capital is calculated based on outstanding shares at the time of distribution. |
| B | Amount represents less than $0.01 per share. |
| C | Based on net asset value, which does not reflect the sales charge, redemption fee, or contingent deferred sales charge, if applicable. May include adjustments in accordance with U.S. GAAP and as such, the net asset value for reporting purposes and the returns based upon those net asset values may differ from the net asset value and returns for shareholder transactions. |
| D | Expense ratios may exceed stated expense caps in Note 2 due to security lending expenses, which are not reimbursable under the agreement with the Manager. |
See accompanying notes
42
American Beacon Stephens Mid-Cap Growth FundSM
Financial Highlights
(For a share outstanding throughout the period)
| | | | | | | | | | | | | | | | | | | | | | | | | | | | | | | | | | | | |
| | | A Class | |
| | | Year Ended December 31, | |
| | | 2017 | | | | | | 2016 | | | | | | 2015 | | | | | | 2014 | | | | | | 2013 | |
| | | | |
Net asset value, beginning of period | | $ | 15.72 | | | | | | | $ | 15.77 | | | | | | | $ | 16.94 | | | | | | | $ | 17.61 | | | | | | | $ | 13.83 | |
| | | | | | | | | | | | | | | | | | | | | | | | | | | | | | | | | | | | |
Income (loss) from investment operations: | | | | | | | | | | | | | | | | | | | | | | | | | | | | | | | | | | | | |
Net investment (loss) | | | (0.28 | ) | | | | | | | (0.14 | ) | | | | | | | (0.20 | ) | | | | | | | (0.19 | ) | | | | | | | (0.10 | ) |
Net gains (losses) on investments (both realized and unrealized) | | | 4.67 | | | | | | | | 1.14 | | | | | | | | (0.08 | ) | | | | | | | 0.72 | | | | | | | | 4.57 | |
| | | | | | | | | | | | | | | | | | | | | | | | | | | | | | | | | | | | |
Total income (loss) from investment operations | | | 4.39 | | | | | | | | 1.00 | | | | | | | | (0.28 | ) | | | | | | | 0.53 | | | | | | | | 4.47 | |
| | | | | | | | | | | | | | | | | | | | | | | | | | | | | | | | | | | | |
Less distributions: | | | | | | | | | | | | | | | | | | | | | | | | | | | | | | | | | | | | |
Dividends from net investment income | | | - | | | | | | | | - | | | | | | | | - | | | | | | | | - | | | | | | | | (0.01 | ) |
Distributions from net realized gains | | | (1.03 | ) | | | | | | | (1.05 | ) | | | | | | | (0.89 | ) | | | | | | | (1.20 | ) | | | | | | | (0.68 | ) |
Tax return of capitalA | | | - | | | | | | | | - | | | | | | | | - | | | | | | | | - | | | | | | | | (0.00 | )B |
| | | | | | | | | | | | | | | | | | | | | | | | | | | | | | | | | | | | |
Total distributions | | | (1.03 | ) | | | | | | | (1.05 | ) | | | | | | | (0.89 | ) | | | | | | | (1.20 | ) | | | | | | | (0.69 | ) |
| | | | | | | | | | | | | | | | | | | | | | | | | | | | | | | | | | | | |
Net asset value, end of period | | $ | 19.08 | | | | | | | $ | 15.72 | | | | | | | $ | 15.77 | | | | | | | $ | 16.94 | | | | | | | $ | 17.61 | |
| | | | | | | | | | | | | | | | | | | | | | | | | | | | | | | | | | | | |
Total returnC | | | 27.93 | % | | | | | | | 6.30 | % | | | | | | | (1.63 | )% | | | | | | | 2.97 | % | | | | | | | 32.49 | % |
| | | | | | | | | | | | | | | | | | | | | | | | | | | | | | | | | | | | |
| | | | | | | | | |
Ratios and supplemental data: | | | | | | | | | | | | | | | | | | | | | | | | | | | | | | | | | | | | |
Net assets, end of period | | $ | 13,854,727 | | | | | | | $ | 13,886,296 | | | | | | | $ | 13,907,563 | | | | | | | $ | 16,505,844 | | | | | | | $ | 18,395,962 | |
Ratios to average net assets: | | | | | | | | | | | | | | | | | | | | | | | | | | | | | | | | | | | | |
Expenses, before reimbursements or recoupments | | | 1.39 | % | | | | | | | 1.42 | % | | | | | | | 1.36 | % | | | | | | | 1.45 | % | | | | | | | 1.57 | % |
Expenses, net of reimbursements or recoupmentsD | | | 1.39 | % | | | | | | | 1.41 | % | | | | | | | 1.39 | % | | | | | | | 1.45 | % | | | | | | | 1.49 | % |
Net investment (loss), before expense reimbursements or recoupments | | | (0.67 | )% | | | | | | | (0.92 | )% | | | | | | | (0.90 | )% | | | | | | | (0.94 | )% | | | | | | | (1.16 | )% |
Net investment (loss), net of reimbursements or recoupments | | | (0.67 | )% | | | | | | | (0.92 | )% | | | | | | | (0.93 | )% | | | | | | | (0.94 | )% | | | | | | | (1.09 | )% |
Portfolio turnover rate | | | 24 | % | | | | | | | 22 | % | | | | | | | 19 | % | | | | | | | 37 | % | | | | | | | 25 | % |
| A | The distributions from return of capital is calculated based on outstanding shares at the time of distribution. |
| B | Amount represents less than $0.01 per share. |
| C | Based on net asset value, which does not reflect the sales charge, redemption fee, or contingent deferred sales charge, if applicable. May include adjustments in accordance with U.S. GAAP and as such, the net asset value for reporting purposes and the returns based upon those net asset values may differ from the net asset value and returns for shareholder transactions. |
| D | Expense ratios may exceed stated expense caps in Note 2 due to security lending expenses, which are not reimbursable under the agreement with the Manager. |
See accompanying notes
43
American Beacon Stephens Mid-Cap Growth FundSM
Financial Highlights
(For a share outstanding throughout the period)
| | | | | | | | | | | | | | | | | | | | | | | | | | | | | | | | | | | | |
| | | C Class | |
| | | Year Ended December 31, | |
| | | 2017 | | | | | | 2016 | | | | | | 2015 | | | | | | 2014 | | | | | | 2013 | |
| | | | |
Net asset value, beginning of period | | $ | 15.08 | | | | | | | $ | 15.28 | | | | | | | $ | 16.57 | | | | | | | $ | 17.38 | | | | | | | $ | 13.75 | |
| | | | | | | | | | | | | | | | | | | | | | | | | | | | | | | | | | | | |
Income (loss) from investment operations: | | | | | | | | | | | | | | | | | | | | | | | | | | | | | | | | | | | | |
Net investment (loss) | | | (0.11 | ) | | | | | | | (0.60 | ) | | | | | | | (0.17 | ) | | | | | | | (0.27 | ) | | | | | | | (0.16 | ) |
Net gains (losses) on investments (both realized and unrealized) | | | 4.17 | | | | | | | | 1.45 | | | | | | | | (0.23 | ) | | | | | | | 0.66 | | | | | | | | 4.47 | |
| | | | | | | | | | | | | | | | | | | | | | | | | | | | | | | | | | | | |
Total income (loss) from investment operations | | | 4.06 | | | | | | | | 0.85 | | | | | | | | (0.40 | ) | | | | | | | 0.39 | | | | | | | | 4.31 | |
| | | | | | | | | | | | | | | | | | | | | | | | | | | | | | | | | | | | |
Less distributions: | | | | | | | | | | | | | | | | | | | | | | | | | | | | | | | | | | | | |
Dividends from net investment income | | | - | | | | | | | | - | | | | | | | | - | | | | | | | | - | | | | | | | | (0.00 | )A |
Distributions from net realized gains | | | (1.03 | ) | | | | | | | (1.05 | ) | | | | | | | (0.89 | ) | | | | | | | (1.20 | ) | | | | | | | (0.68 | ) |
Tax return of capitalB | | | - | | | | | | | | - | | | | | | | | - | | | | | | | | - | | | | | | | | (0.00 | )A |
| | | | | | | | | | | | | | | | | | | | | | | | | | | | | | | | | | | | |
Total distributions | | | (1.03 | ) | | | | | | | (1.05 | ) | | | | | | | (0.89 | ) | | | | | | | (1.20 | ) | | | | | | | (0.68 | ) |
| | | | | | | | | | | | | | | | | | | | | | | | | | | | | | | | | | | | |
Net asset value, end of period | | $ | 18.11 | | | | | | | $ | 15.08 | | | | | | | $ | 15.28 | | | | | | | $ | 16.57 | | | | | | | $ | 17.38 | |
| | | | | | | | | | | | | | | | | | | | | | | | | | | | | | | | | | | | |
Total returnC | | | 26.93 | % | | | | | | | 5.52 | % | | | | | | | (2.39 | )% | | | | | | | 2.21 | % | | | | | | | 31.35 | % |
| | | | | | | | | | | | | | | | | | | | | | | | | | | | | | | | | | | | |
| | | | | | | | | |
Ratios and supplemental data: | | | | | | | | | | | | | | | | | | | | | | | | | | | | | | | | | | | | |
Net assets, end of period | | $ | 1,862,472 | | | | | | | $ | 1,389,526 | | | | | | | $ | 2,123,334 | | | | | | | $ | 1,901,906 | | | | | | | $ | 1,625,535 | |
Ratios to average net assets: | | | | | | | | | | | | | | | | | | | | | | | | | | | | | | | | | | | | |
Expenses, before reimbursements or recoupments | | | 2.11 | % | | | | | | | 2.19 | % | | | | | | | 2.11 | % | | | | | | | 2.22 | % | | | | | | | 2.28 | % |
Expenses, net of reimbursements or recoupmentsD | | | 2.11 | % | | | | | | | 2.18 | % | | | | | | | 2.14 | % | | | | | | | 2.20 | % | | | | | | | 2.24 | % |
Net investment (loss), before expense reimbursements or recoupments | | | (1.40 | )% | | | | | | | (1.70 | )% | | | | | | | (1.65 | )% | | | | | | | (1.69 | )% | | | | | | | (1.87 | )% |
Net investment (loss), net of reimbursements or recoupments | | | (1.39 | )% | | | | | | | (1.69 | )% | | | | | | | (1.68 | )% | | | | | | | (1.68 | )% | | | | | | | (1.84 | )% |
Portfolio turnover rate | | | 24 | % | | | | | | | 22 | % | | | | | | | 19 | % | | | | | | | 37 | % | | | | | | | 25 | % |
| A | Amount represents less than $0.01 per share. |
| B | The distributions from return of capital is calculated based on outstanding shares at the time of distribution. |
| C | Based on net asset value, which does not reflect the sales charge, redemption fee, or contingent deferred sales charge, if applicable. May include adjustments in accordance with U.S. GAAP and as such, the net asset value for reporting purposes and the returns based upon those net asset values may differ from the net asset value and returns for shareholder transactions. |
| D | Expense ratios may exceed stated expense caps in Note 2 due to security lending expenses, which are not reimbursable under the agreement with the Manager. |
See accompanying notes
44
American Beacon Stephens Small Cap Growth FundSM
Financial Highlights
(For a share outstanding throughout the period)
| | | | | | | | | | | | | | | | | | | | | | | | | | | | | | | | | | | | |
| | | Institutional Class | |
| | | Year Ended December 31, | |
| | | 2017 | | | | | | 2016 | | | | | | 2015 | | | | | | 2014 | | | | | | 2013 | |
| | | | |
Net asset value, beginning of period | | $ | 16.45 | | | | | | | $ | 15.08 | | | | | | | $ | 16.57 | | | | | | | $ | 17.83 | | | | | | | $ | 12.99 | |
| | | | | | | | | | | | | | | | | | | | | | | | | | | | | | | | | | | | |
Income (loss) from investment operations: | | | | | | | | | | | | | | | | | | | | | | | | | | | | | | | | | | | | |
Net investment income (loss) | | | (0.23 | ) | | | | | | | 0.00 | A | | | | | | | (0.13 | ) | | | | | | | (0.07 | ) | | | | | | | (0.05 | ) |
Net gains (losses) on investments (both realized and unrealized) | | | 3.44 | | | | | | | | 1.51 | | | | | | | | (0.65 | ) | | | | | | | (0.49 | ) | | | | | | | 5.60 | |
| | | | | | | | | | | | | | | | | | | | | | | | | | | | | | | | | | | | |
Total income (loss) from investment operations | | | 3.21 | | | | | | | | 1.51 | | | | | | | | (0.78 | ) | | | | | | | (0.56 | ) | | | | | | | 5.55 | |
| | | | | | | | | | | | | | | | | | | | | | | | | | | | | | | | | | | | |
Less distributions: | | | | | | | | | | | | | | | | | | | | | | | | | | | | | | | | | | | | |
Dividends from net investment income | | | - | | | | | | | | - | | | | | | | | - | | | | | | | | - | | | | | | | | (0.00 | )A |
Distributions from net realized gains | | | (0.65 | ) | | | | | | | (0.14 | ) | | | | | | | (0.71 | ) | | | | | | | (0.70 | ) | | | | | | | (0.67 | ) |
Tax return of capitalB | | | - | | | | | | | | - | | | | | | | | - | | | | | | | | - | | | | | | | | (0.04 | ) |
| | | | | | | | | | | | | | | | | | | | | | | | | | | | | | | | | | | | |
Total distributions | | | (0.65 | ) | | | | | | | (0.14 | ) | | | | | | | (0.71 | ) | | | | | | | (0.70 | ) | | | | | | | (0.71 | ) |
| | | | | | | | | | | | | | | | | | | | | | | | | | | | | | | | | | | | |
Net asset value, end of period | | $ | 19.01 | | | | | | | $ | 16.45 | | | | | | | $ | 15.08 | | | | | | | $ | 16.57 | | | | | | | $ | 17.83 | |
| | | | | | | | | | | | | | | | | | | | | | | | | | | | | | | | | | | | |
Total returnC | | | 19.52 | % | | | | | | | 9.98 | % | | | | | | | (4.69 | )% | | | | | | | (3.14 | )% | | | | | | | 42.93 | % |
| | | | | | | | | | | | | | | | | | | | | | | | | | | | | | | | | | | | |
| | | | | | | | | |
Ratios and supplemental data: | | | | | | | | | | | | | | | | | | | | | | | | | | | | | | | | | | | | |
Net assets, end of period | | $ | 433,520,624 | | | | | | | $ | 450,286,537 | | | | | | | $ | 300,919,215 | | | | | | | $ | 359,958,471 | | | | | | | $ | 317,341,400 | |
Ratios to average net assets: | | | | | | | | | | | | | | | | | | | | | | | | | | | | | | | | | | | | |
Expenses, before reimbursements or recoupments | | | 1.08 | % | | | | | | | 1.09 | % | | | | | | | 1.08 | % | | | | | | | 1.08 | % | | | | | | | 1.11 | % |
Expenses, net of reimbursements or recoupmentsD | | | 1.08 | % | | | | | | | 1.09 | % | | | | | | | 1.08 | % | | | | | | | 1.10 | % | | | | | | | 1.09 | % |
Net investment (loss), before expense reimbursements or recoupments | | | (0.79 | )% | | | | | | | (0.78 | )% | | | | | | | (0.67 | )% | | | | | | | (0.59 | )% | | | | | | | (0.73 | )% |
Net investment (loss), net of reimbursements or recoupments | | | (0.79 | )% | | | | | | | (0.78 | )% | | | | | | | (0.67 | )% | | | | | | | (0.61 | )% | | | | | | | (0.71 | )% |
Portfolio turnover rate | | | 22 | % | | | | | | | 40 | % | | | | | | | 25 | % | | | | | | | 46 | % | | | | | | | 39 | % |
| A | Amount represents less than $0.01 per share. |
| B | The distributions from return of capital is calculated based on outstanding shares at the time of distribution. |
| C | Based on net asset value, which does not reflect the sales charge, redemption fee, or contingent deferred sales charge, if applicable. May include adjustments in accordance with U.S. GAAP and as such, the net asset value for reporting purposes and the returns based upon those net asset values may differ from the net asset value and returns for shareholder transactions. |
| D | Expense ratios may exceed stated expense caps in Note 2 due to security lending expenses, which are not reimbursable under the agreement with the Manager. |
See accompanying notes
45
American Beacon Stephens Small Cap Growth FundSM
Financial Highlights
(For a share outstanding throughout the period)
| | | | | | | | | | | | | | | | | | | | | | | | | | | | | | | | | | | | |
| | | Y Class | |
| | | Year Ended December 31, | |
| | | 2017 | | | | | | 2016 | | | | | | 2015 | | | | | | 2014 | | | | | | 2013 | |
| | | | |
Net asset value, beginning of period | | $ | 16.38 | | | | | | | $ | 15.02 | | | | | | | $ | 16.54 | | | | | | | $ | 17.81 | | | | | | | $ | 12.98 | |
| | | | | | | | | | | | | | | | | | | | | | | | | | | | | | | | | | | | |
Income (loss) from investment operations: | | | | | | | | | | | | | | | | | | | | | | | | | | | | | | | | | | | | |
Net investment (loss) | | | (0.28 | ) | | | | | | | (0.52 | ) | | | | | | | (0.14 | ) | | | | | | | (0.12 | ) | | | | | | | (0.04 | ) |
Net gains (losses) on investments (both realized and unrealized) | | | 3.46 | | | | | | | | 2.02 | | | | | | | | (0.67 | ) | | | | | | | (0.45 | ) | | | | | | | 5.58 | |
| | | | | | | | | | | | | | | | | | | | | | | | | | | | | | | | | | | | |
Total income (loss) from investment operations | | | 3.18 | | | | | | | | 1.50 | | | | | | | | (0.81 | ) | | | | | | | (0.57 | ) | | | | | | | 5.54 | |
| | | | | | | | | | | | | | | | | | | | | | | | | | | | | | | | | | | | |
Less distributions: | | | | | | | | | | | | | | | | | | | | | | | | | | | | | | | | | | | | |
Dividends from net investment income | | | - | | | | | | | | - | | | | | | | | - | | | | | | | | - | | | | | | | | (0.00 | )A |
Distributions from net realized gains | | | (0.65 | ) | | | | | | | (0.14 | ) | | | | | | | (0.71 | ) | | | | | | | (0.70 | ) | | | | | | | (0.68 | ) |
Tax return of capitalB | | | - | | | | | | | | - | | | | | | | | - | | | | | | | | - | | | | | | | | (0.03 | ) |
| | | | | | | | | | | | | | | | | | | | | | | | | | | | | | | | | | | | |
Total distributions | | | (0.65 | ) | | | | | | | (0.14 | ) | | | | | | | (0.71 | ) | | | | | | | (0.70 | ) | | | | | | | (0.71 | ) |
| | | | | | | | | | | | | | | | | | | | | | | | | | | | | | | | | | | | |
Net asset value, end of period | | $ | 18.91 | | | | | | | $ | 16.38 | | | | | | | $ | 15.02 | | | | | | | $ | 16.54 | | | | | | | $ | 17.81 | |
| | | | | | | | | | | | | | | | | | | | | | | | | | | | | | | | | | | | |
Total returnC | | | 19.42 | % | | | | | | | 9.96 | % | | | | | | | (4.88 | )% | | | | | | | (3.20 | )% | | | | | | | 42.88 | % |
| | | | | | | | | | | | | | | | | | | | | | | | | | | | | | | | | | | | |
| | | | | | | | | |
Ratios and supplemental data: | | | | | | | | | | | | | | | | | | | | | | | | | | | | | | | | | | | | |
Net assets, end of period | | $ | 82,072,563 | | | | | | | $ | 81,069,652 | | | | | | | $ | 142,980,166 | | | | | | | $ | 171,901,004 | | | | | | | $ | 208,196,284 | |
Ratios to average net assets: | | | | | | | | | | | | | | | | | | | | | | | | | | | | | | | | | | | | |
Expenses, before reimbursements or recoupments | | | 1.14 | % | | | | | | | 1.15 | % | | | | | | | 1.14 | % | | | | | | | 1.16 | % | | | | | | | 1.19 | % |
Expenses, net of reimbursements or recoupmentsD | | | 1.14 | % | | | | | | | 1.15 | % | | | | | | | 1.14 | % | | | | | | | 1.16 | % | | | | | | | 1.19 | % |
Net investment (loss), before expense reimbursements or recoupments | | | (0.85 | )% | | | | | | | (0.81 | )% | | | | | | | (0.74 | )% | | | | | | | (0.67 | )% | | | | | | | (0.79 | )% |
Net investment (loss), net of reimbursements or recoupments | | | (0.85 | )% | | | | | | | (0.81 | )% | | | | | | | (0.74 | )% | | | | | | | (0.69 | )% | | | | | | | (0.78 | )% |
Portfolio turnover rate | | | 22 | % | | | | | | | 40 | % | | | | | | | 25 | % | | | | | | | 46 | % | | | | | | | 39 | % |
| A | Amount represents less than $0.01 per share. |
| B | The distributions from return of capital is calculated based on outstanding shares at the time of distribution. |
| C | Based on net asset value, which does not reflect the sales charge, redemption fee, or contingent deferred sales charge, if applicable. May include adjustments in accordance with U.S. GAAP and as such, the net asset value for reporting purposes and the returns based upon those net asset values may differ from the net asset value and returns for shareholder transactions. |
| D | Expense ratios may exceed stated expense caps in Note 2 due to security lending expenses, which are not reimbursable under the agreement with the Manager. |
See accompanying notes
46
American Beacon Stephens Small Cap Growth FundSM
Financial Highlights
(For a share outstanding throughout the period)
| | | | | | | | | | | | | | | | | | | | | | | | | | | | | | | | | | | | |
| | | Investor Class | |
| | | Year Ended December 31, | |
| | | 2017 | | | | | | 2016 | | | | | | 2015 | | | | | | 2014 | | | | | | 2013 | |
| | | | |
Net asset value, beginning of period | | $ | 15.45 | | | | | | | $ | 14.20 | | | | | | | $ | 15.71 | | | | | | | $ | 16.98 | | | | | | | $ | 12.42 | |
| | | | | | | | | | | | | | | | | | | | | | | | | | | | | | | | | | | | |
Income (loss) from investment operations: | | | | | | | | | | | | | | | | | | | | | | | | | | | | | | | | | | | | |
Net investment (loss) | | | (0.37 | ) | | | | | | | (0.41 | ) | | | | | | | (0.82 | ) | | | | | | | (0.16 | ) | | | | | | | (0.04 | ) |
Net gains (losses) on investments (both realized and unrealized) | | | 3.34 | | | | | | | | 1.80 | | | | | | | | 0.02 | | | | | | | | (0.41 | ) | | | | | | | 5.31 | |
| | | | | | | | | | | | | | | | | | | | | | | | | | | | | | | | | | | | |
Total income (loss) from investment operations | | | 2.97 | | | | | | | | 1.39 | | | | | | | | (0.80 | ) | | | | | | | (0.57 | ) | | | | | | | 5.27 | |
| | | | | | | | | | | | | | | | | | | | | | | | | | | | | | | | | | | | |
Less distributions: | | | | | | | | | | | | | | | | | | | | | | | | | | | | | | | | | | | | |
Dividends from net investment income | | | - | | | | | | | | - | | | | | | | | - | | | | | | | | - | | | | | | | | (0.00 | )A |
Distributions from net realized gains | | | (0.65 | ) | | | | | | | (0.14 | ) | | | | | | | (0.71 | ) | | | | | | | (0.70 | ) | | | | | | | (0.69 | ) |
Tax return of capitalB | | | - | | | | | | | | - | | | | | | | | - | | | | | | | | - | | | | | | | | (0.02 | ) |
| | | | | | | | | | | | | | | | | | | | | | | | | | | | | | | | | | | | |
Total distributions | | | (0.65 | ) | | | | | | | (0.14 | ) | | | | | | | (0.71 | ) | | | | | | | (0.70 | ) | | | | | | | (0.71 | ) |
| | | | | | | | | | | | | | | | | | | | | | | | | | | | | | | | | | | | |
Net asset value, end of period | | $ | 17.77 | | | | | | | $ | 15.45 | | | | | | | $ | 14.20 | | | | | | | $ | 15.71 | | | | | | | $ | 16.98 | |
| | | | | | | | | | | | | | | | | | | | | | | | | | | | | | | | | | | | |
Total returnC | | | 19.23 | % | | | | | | | 9.76 | % | | | | | | | (5.08 | )% | | | | | | | (3.35 | )% | | | | | | | 42.62 | % |
| | | | | | | | | | | | | | | | | | | | | | | | | | | | | | | | | | | | |
| | | | | | | | | |
Ratios and supplemental data: | | | | | | | | | | | | | | | | | | | | | | | | | | | | | | | | | | | | |
Net assets, end of period | | $ | 51,839,469 | | | | | | | $ | 50,544,287 | | | | | | | $ | 55,921,959 | | | | | | | $ | 147,227,308 | | | | | | | $ | 169,799,314 | |
Ratios to average net assets: | | | | | | | | | | | | | | | | | | | | | | | | | | | | | | | | | | | | |
Expenses, before reimbursements or recoupments | | | 1.29 | % | | | | | | | 1.35 | % | | | | | | | 1.40 | % | | | | | | | 1.31 | % | | | | | | | 1.39 | % |
Expenses, net of reimbursements or recoupmentsD | | | 1.31 | % | | | | | | | 1.35 | % | | | | | | | 1.39 | % | | | | | | | 1.37 | % | | | | | | | 1.35 | % |
Net investment (loss), before expense reimbursements or recoupments | | | (1.01 | )% | | | | | | | (1.02 | )% | | | | | | | (1.01 | )% | | | | | | | (0.81 | )% | | | | | | | (1.01 | )% |
Net investment (loss), net of reimbursements or recoupments | | | (1.03 | )% | | | | | | | (1.02 | )% | | | | | | | (1.00 | )% | | | | | | | (0.88 | )% | | | | | | | (0.96 | )% |
Portfolio turnover rate | | | 22 | % | | | | | | | 40 | % | | | | | | | 25 | % | | | | | | | 46 | % | | | | | | | 39 | % |
| A | Amount represents less than $0.01 per share. |
| B | The distributions from return of capital is calculated based on outstanding shares at the time of distribution. |
| C | Based on net asset value, which does not reflect the sales charge, redemption fee, or contingent deferred sales charge, if applicable. May include adjustments in accordance with U.S. GAAP and as such, the net asset value for reporting purposes and the returns based upon those net asset values may differ from the net asset value and returns for shareholder transactions. |
| D | Expense ratios may exceed stated expense caps in Note 2 due to security lending expenses, which are not reimbursable under the agreement with the Manager. |
See accompanying notes
47
American Beacon Stephens Small Cap Growth FundSM
Financial Highlights
(For a share outstanding throughout the period)
| | | | | | | | | | | | | | | | | | | | | | | | | | | | | | | | | | | | |
| | | A Class | |
| | | Year Ended December 31, | |
| | | 2017 | | | | | | 2016 | | | | | | 2015 | | | | | | 2014 | | | | | | 2013 | |
| | | | |
Net asset value, beginning of period | | $ | 15.32 | | | | | | | $ | 14.10 | | | | | | | $ | 15.61 | | | | | | | $ | 16.91 | | | | | | | $ | 12.40 | |
| | | | | | | | | | | | | | | | | | | | | | | | | | | | | | | | | | | | |
Income (loss) from investment operations: | | | | | | | | | | | | | | | | | | | | | | | | | | | | | | | | | | | | |
Net investment (loss) | | | (0.62 | ) | | | | | | | (0.31 | ) | | | | | | | (0.19 | ) | | | | | | | (0.18 | ) | | | | | | | (0.10 | ) |
Net gains (losses) on investments (both realized and unrealized) | | | 3.54 | | | | | | | | 1.67 | | | | | | | | (0.61 | ) | | | | | | | (0.42 | ) | | | | | | | 5.32 | |
| | | | | | | | | | | | | | | | | | | | | | | | | | | | | | | | | | | | |
Total income (loss) from investment operations | | | 2.92 | | | | | | | | 1.36 | | | | | | | | (0.80 | ) | | | | | | | (0.60 | ) | | | | | | | 5.22 | |
| | | | | | | | | | | | | | | | | | | | | | | | | | | | | | | | | | | | |
Less distributions: | | | | | | | | | | | | | | | | | | | | | | | | | | | | | | | | | | | | |
Dividends from net investment income | | | - | | | | | | | | (0.00 | )A | | | | | | | - | | | | | | | | - | | | | | | | | (0.00 | )A |
Distributions from net realized gains | | | (0.65 | ) | | | | | | | (0.14 | ) | | | | | | | (0.71 | ) | | | | | | | (0.70 | ) | | | | | | | (0.71 | ) |
Tax return of capitalB | | | - | | | | | | | | - | | | | | | | | - | | | | | | | | - | | | | | | | | (0.00 | )A |
| | | | | | | | | | | | | | | | | | | | | | | | | | | | | | | | | | | | |
Total distributions | | | (0.65 | ) | | | | | | | (0.14 | ) | | | | | | | (0.71 | ) | | | | | | | (0.70 | ) | | | | | | | (0.71 | ) |
| | | | | | | | | | | | | | | | | | | | | | | | | | | | | | | | | | | | |
Net asset value, end of period | | $ | 17.59 | | | | | | | $ | 15.32 | | | | | | | $ | 14.10 | | | | | | | $ | 15.61 | | | | | | | $ | 16.91 | |
| | | | | | | | | | | | | | | | | | | | | | | | | | | | | | | | | | | | |
Total returnC | | | 19.06 | % | | | | | | | 9.61 | % | | | | | | | (5.11 | )% | | | | | | | (3.54 | )% | | | | | | | 42.28 | % |
| | | | | | | | | | | | | | | | | | | | | | | | | | | | | | | | | | | | |
| | | | | | | | | |
Ratios and supplemental data: | | | | | | | | | | | | | | | | | | | | | | | | | | | | | | | | | | | | |
Net assets, end of period | | $ | 5,553,261 | | | | | | | $ | 7,029,682 | | | | | | | $ | 8,197,136 | | | | | | | $ | 9,701,510 | | | | | | | $ | 10,941,646 | |
Ratios to average net assets: | | | | | | | | | | | | | | | | | | | | | | | | | | | | | | | | | | | | |
Expenses, before reimbursements or recoupments | | | 1.40 | % | | | | | | | 1.46 | % | | | | | | | 1.44 | % | | | | | | | 1.51 | % | | | | | | | 1.57 | % |
Expenses, net of reimbursements or recoupmentsD | | | 1.40 | % | | | | | | | 1.46 | % | | | | | | | 1.48 | % | | | | | | | 1.52 | % | | | | | | | 1.59 | % |
Net investment (loss), before expense reimbursements or recoupments | | | (1.11 | )% | | | | | | | (1.14 | )% | | | | | | | (1.03 | )% | | | | | | | (1.02 | )% | | | | | | | (1.18 | )% |
Net investment (loss), net of reimbursements or recoupments | | | (1.11 | )% | | | | | | | (1.14 | )% | | | | | | | (1.08 | )% | | | | | | | (1.03 | )% | | | | | | | (1.20 | )% |
Portfolio turnover rate | | | 22 | % | | | | | | | 40 | % | | | | | | | 25 | % | | | | | | | 46 | % | | | | | | | 39 | % |
| A | Amount represents less than $0.01 per share. |
| B | The distributions from return of capital is calculated based on outstanding shares at the time of distribution. |
| C | Based on net asset value, which does not reflect the sales charge, redemption fee, or contingent deferred sales charge, if applicable. May include adjustments in accordance with U.S. GAAP and as such, the net asset value for reporting purposes and the returns based upon those net asset values may differ from the net asset value and returns for shareholder transactions. |
| D | Expense ratios may exceed stated expense caps in Note 2 due to security lending expenses, which are not reimbursable under the agreement with the Manager. |
See accompanying notes
48
American Beacon Stephens Small Cap Growth FundSM
Financial Highlights
(For a share outstanding throughout the period)
| | | | | | | | | | | | | | | | | | | | | | | | | | | | | | | | | | | | |
| | | C Class | |
| | | Year Ended December 31, | |
| | | 2017 | | | | | | 2016 | | | | | | 2015 | | | | | | 2014 | | | | | | 2013 | |
| | | | |
Net asset value, beginning of period | | $ | 14.71 | | | | | | | $ | 13.65 | | | | | | | $ | 15.26 | | | | | | | $ | 16.66 | | | | | | | $ | 12.32 | |
| | | | | | | | | | | | | | | | | | | | | | | | | | | | | | | | | | | | |
Income (loss) from investment operations: | | | | | | | | | | | | | | | | | | | | | | | | | | | | | | | | | | | | |
Net investment (loss) | | | (1.25 | ) | | | | | | | (1.08 | ) | | | | | | | (0.31 | ) | | | | | | | (0.24 | ) | | | | | | | (0.13 | ) |
Net gains (losses) on investments (both realized and unrealized) | | | 3.93 | | | | | | | | 2.28 | | | | | | | | (0.59 | ) | | | | | | | (0.46 | ) | | | | | | | 5.18 | |
| | | | | | | | | | | | | | | | | | | | | | | | | | | | | | | | | | | | |
Total income (loss) from investment operations | | | 2.68 | | | | | | | | 1.20 | | | | | | | | (0.90 | ) | | | | | | | (0.70 | ) | | | | | | | 5.05 | |
| | | | | | | | | | | | | | | | | | | | | | | | | | | | | | | | | | | | |
Less distributions: | | | | | | | | | | | | | | | | | | | | | | | | | | | | | | | | | | | | |
Dividends from net investment income | | | - | | | | | | | | - | | | | | | | | - | | | | | | | | - | | | | | | | | (0.00 | )A |
Distributions from net realized gains | | | (0.65 | ) | | | | | | | (0.14 | ) | | | | | | | (0.71 | ) | | | | | | | (0.70 | ) | | | | | | | (0.71 | ) |
Tax return of capitalB | | | - | | | | | | | | 0.00 | | | | | | | | - | | | | | | | | - | | | | | | | | - | |
| | | | | | | | | | | | | | | | | | | | | | | | | | | | | | | | | | | | |
Total distributions | | | (0.65 | ) | | | | | | | (0.14 | ) | | | | | | | (0.71 | ) | | | | | | | (0.70 | ) | | | | | | | (0.71 | ) |
| | | | | | | | | | | | | | | | | | | | | | | | | �� | | | | | | | | | | | |
Net asset value, end of period | | $ | 16.74 | | | | | | | $ | 14.71 | | | | | | | $ | 13.65 | | | | | | | $ | 15.26 | | | | | | | $ | 16.66 | |
| | | | | | | | | | | | | | | | | | | | | | | | | | | | | | | | | | | | |
Total returnC | | | 18.22 | % | | | | | | | 8.76 | % | | | | | | | (5.89 | )% | | | | | | | (4.20 | )% | | | | | | | 41.17 | % |
| | | | | | | | | | | | | | | | | | | | | | | | | | | | | | | | | | | | |
| | | | | | | | | |
Ratios and supplemental data: | | | | | | | | | | | | | | | | | | | | | | | | | | | | | | | | | | | | |
Net assets, end of period | | $ | 977,321 | | | | | | | $ | 1,280,971 | | | | | | | $ | 2,348,424 | | | | | | | $ | 2,771,316 | | | | | | | $ | 2,446,766 | |
Ratios to average net assets: | | | | | | | | | | | | | | | | | | | | | | | | | | | | | | | | | | | | |
Expenses, before reimbursements or recoupments | | | 2.14 | % | | | | | | | 2.23 | % | | | | | | | 2.19 | % | | | | | | | 2.26 | % | | | | | | | 2.33 | % |
Expenses, net of reimbursements or recoupmentsD | | | 2.14 | % | | | | | | | 2.23 | % | | | | | | | 2.26 | % | | | | | | | 2.27 | % | | | | | | | 2.34 | % |
Net investment (loss), before expense reimbursements or recoupments | | | (1.86 | )% | | | | | | | (1.91 | )% | | | | | | | (1.79 | )% | | | | | | | (1.76 | )% | | | | | | | (1.93 | )% |
Net investment (loss), net of reimbursements or recoupments | | | (1.86 | )% | | | | | | | (1.91 | )% | | | | | | | (1.85 | )% | | | | | | | (1.77 | )% | | | | | | | (1.94 | )% |
Portfolio turnover rate | | | 22 | % | | | | | | | 40 | % | | | | | | | 25 | % | | | | | | | 46 | % | | | | | | | 39 | % |
| A | Amount represents less than $0.01 per share. |
| B | The distributions from return of capital is calculated based on outstanding shares at the time of distribution. |
| C | Based on net asset value, which does not reflect the sales charge, redemption fee, or contingent deferred sales charge, if applicable. May include adjustments in accordance with U.S. GAAP and as such, the net asset value for reporting purposes and the returns based upon those net asset values may differ from the net asset value and returns for shareholder transactions. |
| D | Expense ratios may exceed stated expense caps in Note 2 due to security lending expenses, which are not reimbursable under the agreement with the Manager. |
See accompanying notes
49
American Beacon FundsSM
Federal Tax Information
December 31, 2017 (Unaudited)
Certain tax information regarding the Funds is required to be provided to shareholders based upon the Funds’ income and distributions for the taxable year ended December 31, 2017. The information and distributions reported herein may differ from information and distributions taxable to the shareholders for the calendar year ended December 31, 2017.
The Funds designated the following items with regard to distributions paid during the fiscal year ended December 31, 2017. All designations are based on financial information available as of this annual report and, accordingly, are subject to change. For each item, it is the intention of the Funds to designate the maximum amount permitted under the Internal Revenue Code of 1986, as amended, and the regulations there under.
Corporate Dividends-Received Deduction:
| | | | |
Stephens Mid-Cap Growth | | | 0.00 | % |
Stephens Small Cap Growth | | | 0.00 | % |
Qualified Dividend Income:
| | | | |
Stephens Mid-Cap Growth | | | 0.00 | % |
Stephens Small Cap Growth | | | 0.00 | % |
Long-Term Capital Gain Distributions:
| | | | |
Stephens Mid-Cap Growth | | $ | 4,561,926 | |
Stephens Small Cap Growth | | | 19,363,107 | |
Short-Term Capital Gain Distributions:
| | | | |
Stephens Mid-Cap Growth | | $ | - | |
Stephens Small Cap Growth | | | - | |
Shareholders received notification in January 2018 of the applicable tax information necessary to prepare their 2017 income tax returns.
50
Trustees and Officers of the American Beacon FundsSM (Unaudited)
The Trustees and officers of the American Beacon Funds (the “Trust”) are listed below, together with their principal occupations during the past five years. The address of each person listed below is 220 Las Colinas Boulevard East, Suite 1200, Irving, Texas 75039. Each Trustee oversees thirty-five funds in the fund complex that includes the Trust, the American Beacon Select Funds and the American Beacon Institutional Funds Trust. The Trust’s Statement of Additional Information contains additional information about the Trustees and is available without charge by calling 1-800-658-5811.
| | | | |
Name, Age and Address | | Position, Term of Office and Length of Time Served with the Trust | | Principal Occupation(s) During Past 5 Years and Current Directorships |
| INTERESTED TRUSTEES | | Term | | |
| | Lifetime of Trust until removal, resignation or retirement* | | |
| | |
| Alan D. Feld** (81) | | Trustee since 1996 | | Sole Shareholder of a professional corporation which is a Partner in the law firm of Akin, Gump, Strauss, Hauer & Feld, LLP (law firm) (1960-Present); Trustee, American Beacon Mileage Funds (1996-2012); Trustee, American Beacon Select Funds (1999-Present); Trustee, American Beacon Master Trust (1996-2012); Trustee, American Beacon Institutional Funds Trust (2017-Present). |
| | |
| NON-INTERESTED TRUSTEES | | Term | | |
| | Lifetime of Trust until removal, resignation or retirement* | | |
| | |
| Gilbert G. Alvarado (48) | | Trustee since 2015 | | Director, Kura MD, Inc. (local telehealth organization) (2015-present); Vice President & CFO, Sierra Health Foundation (health conversion private foundation) (2006-Present); Vice President & CFO, Sierra Health Foundation: Center for Health Program Management (California public benefit corporation) (2012-Present); Director, Innovative North State (2012-2015); Director, Sacramento Regional Technology Alliance (2011-2016); Director, Women’s Empowerment (2009-2014); Director, Valley Healthcare Staffing (2017–present); Trustee, American Beacon Select Funds (2015-Present); Trustee, American Beacon Institutional Funds Trust (2017-Present). |
| | |
| Joseph B. Armes (55) | | Trustee since 2015 | | Chairman & CEO, CSW Industrials f/k/a Capital Southwest Corporation (investment company) (2015-Present); Chairman of the Board of Capital Southwest Corporation, predecessor to CSW Industrials, Inc. (2014-present) (investment company); CEO, Capital Southwest Corporation (2013-2015); President & CEO, JBA Investment Partners (family investment vehicle) (2010-Present); Director and Chair of Audit Committee, RSP Permian (oil and gas producer) (2013-Present); Trustee, American Beacon Select Funds (2015-Present); Trustee, American Beacon Institutional Funds Trust (2017-Present). |
| | |
| Gerard J. Arpey (59) | | Trustee since 2012 | | Director, The Home Depot, Inc. (2015-Present); Partner, Emerald Creek Group (private equity firm) (2011-Present); Director, S.C. Johnson & Son, Inc. (privately held company) (2008-present); Trustee, American Beacon Select Funds (2012-Present); Trustee, American Beacon Institutional Funds Trust (2017-Present). |
| | |
| Brenda A. Cline (57) | | Trustee since 2004 | | Executive Vice President, Chief Financial Officer, Treasurer and Secretary, Kimbell Art Foundation (1993-Present); Director, Range Resources Corporation (oil and natural gas company) (2015-Present); Director, Tyler Technologies, Inc. (public sector software solutions company) (2014-Present); Trustee, American Beacon Mileage Funds (2004-2012); Trustee, American Beacon Select Funds (2004-Present); Trustee, American Beacon Master Trust (2004-2012); Trustee, American Beacon Institutional Funds Trust (2017-Present). |
51
Trustees and Officers of the American Beacon FundsSM (Unaudited)
| | | | |
Name, Age and Address | | Position, Term of Office and Length of Time Served with the Trust | | Principal Occupation(s) During Past 5 Years and Current Directorships |
| NON-INTERESTED TRUSTEES (CONT.) | | Term | | |
| | |
| Eugene J. Duffy (63) | | Trustee since 2008 | | Managing Director, Institutional Services, Intercontinental Real Estate Corporation (2014-Present); Principal and Executive Vice President, Paradigm Asset Management (1994-2014); Director, Sunrise Bank of Atlanta (2008-2013); Trustee, American Beacon Mileage Funds (2008-2012); Trustee, American Beacon Select Funds (2008-Present); Trustee, American Beacon Master Trust (2008-2012); Trustee, American Beacon Institutional Funds Trust (2017-Present). |
| | |
| Thomas M. Dunning*** (75) | | Trustee since 2008 | | Chairman Emeritus, Lockton Dunning Benefits (consulting firm in employee benefits) (2008-Present); Board Director, Oncor Electric Delivery Company LLC (2007-Present); Trustee, American Beacon Mileage Funds (2008-2012); Trustee, American Beacon Select Funds (2008-Present); Trustee, American Beacon Master Trust (2008-2012); Trustee, American Beacon Institutional Funds Trust (2017-Present). |
| | |
| Richard A. Massman (74) | | Trustee since 2004 Chairman since 2008 | | Consultant and General Counsel Emeritus, Hunt Consolidated, Inc. (holding company engaged in oil and gas exploration and production, refining, real estate, farming, ranching and venture capital activities) (2009-Present); Trustee, American Beacon Mileage Funds (2004-2012); Trustee, American Beacon Select Funds (2004-Present); Trustee, American Beacon Master Trust (2004-2012); Trustee, American Beacon Institutional Funds Trust (2017-Present). |
| | |
| Barbara J. McKenna, CFA (54) | | Trustee since 2012 | | Managing Principal, Longfellow Investment Management Company (2005-Present); Trustee, American Beacon Select Funds (2012-Present); Trustee, American Beacon Institutional Funds Trust (2017-Present). |
| | |
| R. Gerald Turner (72) | | Trustee since 2001 | | President, Southern Methodist University (1995-Present); Director, J.C. Penney Company, Inc. (1996-Present); Director, Kronus Worldwide Inc. (chemical manufacturing) (2003-Present); Trustee, American Beacon Mileage Funds (2001-2012); Trustee, American Beacon Select Funds (2001-Present); Trustee, American Beacon Master Trust (2001-2012); Trustee, American Beacon Institutional Funds Trust (2017-Present). |
| | |
| OFFICERS | | Term | | |
| | |
| | One Year | | |
| | |
| Gene L. Needles, Jr. (63) | | President since 2009 | | President, CEO and Director, American Beacon Advisors, Inc. (2009-Present); President, CEO and Director, Resolute Investment Managers, Inc. (2015-Present); President, CEO and Director, Resolute Acquisition, Inc. (2015-Present); President, CEO and Director, Resolute Topco, Inc. (2015-Present), President & CEO, Resolute Investment Holdings, LLC (2015-Present); President, CEO and Director, Lighthouse Holdings, Inc. (2009-2015); President and CEO, Lighthouse Holdings Parent, Inc. (2009-2015); Manager, President and CEO, American Private Equity Management, LLC (2012-Present); President, American Beacon Cayman Managed Futures Strategy Fund, Ltd. (2014-Present); Director, Chairman, President and CEO, Alpha Quant Advisors, LLC (2016-Present); Director, ARK Investment Management LLC (2016-Present); Director, Shapiro Capital Management LLC (2017-Present); Member, Investment Advisory Committee, Employees Retirement System of Texas (2017-Present); Trustee, American Beacon NextShares Trust (2015-Present); President, American Beacon Select Funds (2009-Present); President, American Beacon Mileage Funds (2009-2012); President, American Beacon Master Trust (2009-2012); President, American Beacon Institutional Funds Trust (2017-Present). |
52
Trustees and Officers of the American Beacon FundsSM (Unaudited)
| | | | |
Name, Age and Address | | Position, Term of Office and Length of Time Served with the Trust | | Principal Occupation(s) During Past 5 Years and Current Directorships |
| OFFICERS (CONT.) | | Term | | |
| | |
| Rosemary K. Behan (58) | | VP, Secretary and Chief Legal Officer since 2006 | | Vice President and Secretary, American Beacon Advisors, Inc. (2006-Present); Secretary, Resolute Investment Holdings, LLC (2015-Present) Secretary, Resolute Investment Managers, Inc. (2015-Present); Secretary, Resolute Topco, Inc. (2015-Present); Secretary, Resolute Acquisition, Inc. (2015-Present); Secretary, Lighthouse Holdings, Inc. (2008-2015); Secretary, Lighthouse Holdings Parent, Inc. (2008-2015); Secretary, American Private Equity Management, LLC (2008-Present); Secretary, American Beacon Cayman Managed Futures Strategy Fund, Ltd. (2014-Present); Secretary, Alpha Quant Advisors, LLC (2016-Present); Chief Legal Officer, Vice President and Secretary, American Beacon Select Funds (2006-Present); Chief Legal Officer, Vice President and Secretary, American Beacon Mileage Funds (2006-2012); Chief Legal Officer, Vice President and Secretary, American Beacon Master Trust (2006-2012); Chief Legal Officer, Vice President and Secretary, American Beacon Institutional Funds Trust (2017-Present). |
| | |
| Brian E. Brett (57) | | VP since 2004 | | Senior Vice President (2012-Present) and Vice President (2004-2012), American Beacon Advisors, Inc.; Vice President, American Beacon Select Funds (2004-Present); Vice President, American Beacon Mileage Funds (2004-2012); Vice President, American Beacon Master Trust (2004-2012); Vice President, American Beacon Institutional Funds Trust (2017-Present). |
| | |
| Paul B. Cavazos (48) | | VP since 2016 | | Senior Vice President, American Beacon Advisors, Inc. (2016-Present); Chief Investment Officer and Assistant Treasurer, DTE Energy (2007-2016); Vice President, American Beacon Select Funds (2016-Present); Vice President, American Beacon Institutional Funds Trust (2017-Present). |
| | |
| Erica Duncan (47) | | VP Since 2011 | | Vice President, American Beacon Advisors, Inc. (2011-Present); Vice President, American Beacon Select Funds (2011-Present); Vice President, American Beacon Mileage Funds (2011-2012); Vice President, American Beacon Master Trust (2011-2012); Vice President, American Beacon Institutional Funds Trust (2017-Present). |
| | |
| Melinda G. Heika (56) | | Treasurer since 2010 | | Treasurer, American Beacon Advisors, Inc. (2010-Present); Resolute Investment Managers, Inc. (2015-Present); Treasurer, Resolute Acquisition, Inc. (2015-Present); Treasurer, Resolute Topco, Inc. (2015-Present); Treasurer, Resolute Investment Holdings, LLC. (2015-Present); Treasurer, Lighthouse Holdings, Inc. (2010-2015); Treasurer, Lighthouse Holdings Parent Inc., (2010-2015); Treasurer, American Private Equity Management, LLC (2012-Present); Director and Treasurer, American Beacon Cayman Managed Futures Strategy Fund, Ltd. (2014-Present); Treasurer, American Beacon Select Funds (2010-Present); Treasurer, American Beacon Mileage Funds (2010-2012); Treasurer, American Beacon Master Trust (2010-2012); Treasurer, American Beacon Institutional Funds Trust (2017-Present). |
| | |
| Terri L. McKinney (54) | | VP since 2010 | | Vice President (2009-Present) and Managing Director (2003-2009), American Beacon Advisors, Inc.; Vice President, Resolute Investment Managers, Inc. (2017-Present); Vice President, Alpha Quant Advisors, LLC (2016-Present); Vice President, American Beacon Select Funds (2010-Present); Vice President, American Beacon Mileage Funds (2010-2012); Vice President, American Beacon Master Trust (2010-2012); Vice President, American Beacon Institutional Funds Trust (2017-Present). |
53
Trustees and Officers of the American Beacon FundsSM (Unaudited)
| | | | |
Name, Age and Address | | Position, Term of Office and Length of Time Served with the Trust | | Principal Occupation(s) During Past 5 Years and Current Directorships |
| OFFICERS (CONT.) | | Term | | |
| | |
| Jeffrey K. Ringdahl (42) | | VP since 2010 | | Senior Vice President (2013-Present), Vice President (2010-2013), and Director (2015-Present), American Beacon Advisors, Inc.; Vice President, American Beacon Select Funds (2010-Present); Vice President, American Beacon Mileage Funds (2010-2012); Vice President, American Beacon Master Trust (2010-2012); Senior Vice President (2012-Present) and Manager (2015-Present), American Private Equity Management, LLC; Senior Vice President, Lighthouse Holdings, Inc. (2013-2015); Senior Vice President, Lighthouse Holdings Parent, Inc. (2013-2015); Director and Vice President, American Beacon Cayman Managed Futures Strategy Fund, Ltd. (2014-Present); Trustee, American Beacon NextShares Trust (2015-Present); Director and Senior Vice Present, Resolute Investment Holdings, LLC (2015-Present); Director and Senior Vice President, Resolute Topco, Inc. (2015-Present); Director and Senior Vice President, Resolute Acquisition, Inc. (2015-Present); Director and Senior Vice President, Resolute Investment Managers, Inc. (2015-Present); Director, Executive Vice President and Chief Operating Officer, Alpha Quant Advisors, LLC (2016-Present); Vice President, American Beacon Institutional Funds Trust (2017-President); Director, Shapiro Capital Management, LLC (2017-Present). |
| | |
| Samuel J. Silver (54) | | VP Since 2011 | | Vice President, American Beacon Advisors, Inc. (2011-Present); Vice President, American Beacon Select Funds (2011-Present); Vice President, American Beacon Mileage Funds (2011-2012); Vice President, American Beacon Master Trust (2011-2012); American Beacon Institutional Funds Trust (2011-Present). |
| | |
| Christina E. Sears (46) | | Chief Compliance Officer since 2004 and Asst. Secretary since 1999 | | Chief Compliance Officer, American Beacon Advisors, Inc. (2004-Present); Chief Compliance Officer, American Private Equity Management, LLC (2012-Present); Chief Compliance Officer and Vice President, Alpha Quant Advisors, LLC (2016-Present); Chief Compliance Officer (2004-Present) and Assistant Secretary (1999-Present), American Beacon Select Funds; Chief Compliance Officer (2004-2012) and Assistant Secretary (1999-2012), American Beacon Mileage Funds; Chief Compliance Officer (2004-2012) and Assistant Secretary (1999-2012), American Beacon Master Trust; Chief Compliance Officer and Assistant Secretary, American Beacon Institutional Funds Trust (2017-Present). |
| | |
| Sonia L. Bates (61) | | Asst. Treasurer since 2011 | | Assistant Treasurer, American Beacon Advisors, Inc. (2011-Present); Assistant Treasurer, Resolute Investment Managers, Inc. (2015-Present); Assistant Treasurer, Resolute Acquisition, Inc. (2015-Present); Assistant. Treasurer, Resolute Topco, Inc. (2015-Present); Assistant Treasurer, Resolute Investment Holdings, LLC.; Assistant Treasurer, Lighthouse Holdings, Inc. (2011-2015); Assistant Treasurer, Lighthouse Holdings Parent Inc. (2011-2015); Assistant Treasurer, American Private Equity Management, LLC (2012-Present); Assistant Treasurer, American Beacon Select Funds (2011-Present); Assistant Treasurer American Beacon Mileage Funds (2011-2012); Assistant Treasurer, American Beacon Master Trust (2011-2012); Assistant Treasurer, American Beacon Institutional Funds Trust (2017-Present). |
| | |
| Shelley D. Abrahams (43) | | Assistant Secretary since 2008 | | Assistant Secretary, American Beacon Advisors, Inc. (2008-Present); Assistant Secretary, American Beacon Select Funds (2008-Present); Assistant Secretary, American Beacon Mileage Funds (2008-2012); Assistant Secretary, American Beacon Master Trust (2008-2012); Assistant Secretary, American Beacon Institutional Funds Trust (2017-Present). |
54
Trustees and Officers of the American Beacon FundsSM (Unaudited)
| | | | |
Name, Age and Address | | Position, Term of Office and Length of Time Served with the Trust | | Principal Occupation(s) During Past 5 Years and Current Directorships |
| OFFICERS (CONT.) | | Term | | |
| | |
| Rebecca L. Harris (51) | | Assistant Secretary since 2010 | | Vice President, American Beacon Advisors, Inc. (2016-Present); Vice President, Resolute Investment Managers, Inc. (2017-Present); Vice President, Alpha Quant Advisors, LLC (2016-Present); Assistant Secretary, American Beacon Select Funds (2010-Present); Assistant Secretary, American Beacon Mileage Funds (2010-2012); Assistant Secretary, American Beacon Master Trust (2010-2012); Assistant Secretary, American Beacon Institutional Funds Trust (2017-Present). |
| | |
| Diana N. Lai (42) | | Assistant Secretary since 2012 | | Assistant Secretary, American Beacon Advisors, Inc. (2012-Present); Assistant Secretary, American Beacon Select Funds (2012-Present); Assistant Secretary, American Beacon Institutional Funds Trust (2017-Present). |
| | |
| Teresa A. Oxford (59) | | Assistant Secretary since 2015 | | Assistant Secretary, American Beacon Advisors, Inc. (2015-Present); Assistant Secretary, Alpha Quant Advisors, LLC (2016-Present); Assistant Secretary, American Beacon Select Funds (2015-Present); Assistant Secretary, American Beacon Institutional Funds Trust (2017-Present). |
* As of 11/12/2014, the Board adopted a retirement plan that requires Trustees to retire no later than the last day of the calendar year in which they reach the age of 75.
** Mr. Feld is deemed to be an “interested person” of the Trusts, as defined by the 1940 Act. Mr. Feld’s law firm of Akin, Gump, Strauss, Hauer & Feld LLP has provided legal services within the past two fiscal years to one or more of the Trust’s sub-advisors.
*** Mr. Dunning retired as of 12/31/2017. Douglas A. Lindgren became a new Trustee to each of the Trusts on 1/1/2018.
55
American Beacon FundsSM
Privacy Policy
December 31, 2017 (Unaudited)
The American Beacon Funds recognize and respect the privacy of our shareholders. We are providing this notice to you so you will understand how shareholder information may be collected and used.
We may collect nonpublic personal information about you from one or more of the following sources:
| | • | | information we receive from you on applications or other forms; |
| | • | | information about your transactions with us or our service providers; and |
| | • | | information we receive from third parties. |
We do not disclose any nonpublic personal information about our customers or former customers to anyone, except as permitted by law.
We restrict access to your nonpublic personal information to those employees or service providers who need to know that information to provide products or services to you. To ensure the confidentiality of your nonpublic personal information, we maintain safeguards that comply with federal standards.
56

Delivery of Documents
eDelivery is NOW AVAILABLE – Stop traditional mail delivery and receive your
shareholder reports and summary prospectus on-line. Sign up at
www.americanbeaconfunds.com
If you invest in the Fund through a financial institution, you may be able to receive the Fund’s regulatory mailings, such as the Prospectus, Annual Report and Semi-Annual Report, by e-mail. If you are interested in this option, please go to www.icsdelivery.com and search for your financial institution’s name or contact your financial institution directly.
To obtain more information about the Fund:
| | |
 | |  |
| | |
| By E-mail: | | On the Internet: |
| american_beacon.funds@ambeacon.com | | Visit our website at www.americanbeaconfunds.com |
| | | |
| | | |
| | |

By Telephone: Call (800) 658-5811 | | 
By Mail: American Beacon Funds P.O. Box 219643 Kansas City, MO 64121-9643 |
| |
| |
| |
| | | |
| | | |
| Availability of Quarterly Portfolio Schedules | | Availability of Proxy Voting Policy and Records |
| | |
In addition to the Schedule of Investments provided in each semi-annual and annual report, the Fund files a complete schedule of its portfolio holdings with the Securities and Exchange Commission (“SEC”) on Form N-Q as of the first and third fiscal quarters. The Fund’s Forms N-Q are available on the SEC’s website at www.sec.gov. The Forms N-Q may also be reviewed and copied at the SEC’s Public Reference Section, 100 F Street, NE, Washington, D.C. 20549-2736. Information regarding the operation of the SEC’s Public Reference Room may be obtained by calling (800)-SEC-0330. A complete schedule of the Fund’s portfolio holdings is also available at www.americanbeaconfunds.com approximately twenty days after the end of each month. | | A description of the policies and procedures the Fund uses to determine how to vote proxies relating to portfolio securities is available in the Fund’s Statement of Additional Information, is available free of charge on the Fund’s website www.americanbeaconfunds.com and by calling 1-800-967-9009 or by accessing the SEC’s website at www.sec.gov. The Fund’s proxy voting record for the most recent year ended June 30 is filed annually with the SEC on Form N-PX. The Fund’s Forms N-PX are available on the SEC’s website at www.sec.gov. The Fund’s proxy voting record may also be obtained by calling 1-800-967-9009. |
Fund Service Providers:
| | | | | | | | | | | | |
CUSTODIAN State Street Bank and Trust Boston, Massachusetts | | | | TRANSFER AGENT DST Asset Manager Solutions, Inc. Kansas City, Missouri | | | | INDEPENDENT REGISTERED PUBLIC ACCOUNTING FIRM Ernst & Young LLP Dallas, Texas | | | | DISTRIBUTOR Foreside Fund Services, LLC Portland, Maine |
This report is prepared for shareholders of the American Beacon Funds and may be distributed to others only if preceded or accompanied by a current Prospectus or Summary Prospectus.
American Beacon Funds, American Beacon Stephens Mid-Cap Growth Fund and American Beacon Stephens Small Cap Growth Fund are service marks of American Beacon Advisors, Inc.
AR 12/17

About American Beacon Advisors
Since 1986, American Beacon Advisors has offered a variety of products and investment advisory services to numerous institutional and retail clients, including a variety of mutual funds, corporate cash management, and separate account management.
Our clients include defined benefit plans, defined contribution plans, foundations, endowments, corporations, financial planners, and other institutional investors. With American Beacon Advisors, you can put the experience of a multi-billion dollar asset management firm to work for your company.
BAHL & GAYNOR SMALL CAP GROWTH FUND
Investing in small-capitalization stocks may involve greater volatility and lower liquidity than larger company stocks. Investing in foreign securities may involve heightened risk due to currency fluctuations and economic and political risks. Growth stocks typically are more volatile than value stocks; however, value stocks have a lower expected growth rate in earnings and sales. The use of futures contracts for cash management may subject the Fund to losing more money than invested. The Fund participates in a securities lending program. Please see the prospectus for a complete discussion of the Fund’s risks. There can be no assurances that the investment objectives of this Fund will be met.
Any opinions herein, including forecasts, reflect our judgment as of the end of the reporting period and are subject to change. Each advisor’s strategies and each Fund’s portfolio composition will change depending on economic and market conditions. This report is not a complete analysis of market conditions, and, therefore, should not be relied upon as investment advice. Although economic and market information has been compiled from reliable sources, American Beacon Advisors, Inc. makes no representation as to the completeness or accuracy of the statements contained herein.
American Beacon Funds | December 31, 2017 |
Contents
President’s Message
| | |
 | | Dear Shareholders, At American Beacon, we are proud to offer a broad range of equity, fixed-income and alternative mutual fund products for institutions and individuals. Our mutual funds – which span the domestic, international, global, frontier and emerging markets – are sub-advised by experienced portfolio managers who employ distinctive investment processes to manage assets through a variety of economic and market conditions. Together, we work diligently to help our clients and shareholders meet their long-term financial goals. Institutional wisdom, enduring value. Since our inception as a pension fiduciary in 1986, American Beacon has focused on identifying and overseeing institutional investment managers and portfolio risk management. In 1987, we leveraged our size and experience to launch a series of sub-advised, multi- |
manager mutual funds providing individual investors access to many of the same institutional managers as our pension clients. Following the financial crisis in 2008, we saw that investors were looking for unique solutions from managers who were not necessarily mainstream. In 2010, we began offering mutual funds from single managers with distinctive investment styles or asset classes. As we continue to expand our family of funds, our solutions-based approach provides innovative investments.
Guiding principles. Our “manager of managers” philosophy is built on a long-standing history of innovative thinking, discipline and consistency in applying our solutions-based approach. As a manager of managers, our goal is to engage the most effective money managers for each asset class, investment style or market strategy – whether through a single sub-advisor or a combination of sub-advisors. Because we take our fiduciary responsibilities very seriously, our thorough manager evaluation and selection process is rigorous and ongoing. Our guiding principles – predictability, style consistency, competitive pricing and long-term relationships – provide a strong foundation for our due-diligence process. Our broad range of mutual funds helps investors navigate the economic storms and market downturns in the U.S. and abroad. Our years of experience evaluating sub-advisors have led us to identify and partner with asset managers who have adhered to their disciplined processes for many years and through multiple market cycles.
Focus on asset protection and risk mitigation. We strive to provide innovative, long-term products without gimmicks. From offering some of the first multi-manager funds, one of the first retirement-income funds and the first open-end mutual fund in the U.S. to focus primarily on frontier-market debt, our robust history includes applying a disciplined, solutions-based approach to our product development process to help protect assets and mitigate risk.
Thank you for your continued interest in American Beacon. For additional information about our funds or to access your account information, please visit our website at www.americanbeaconfunds.com.
Best Regards,

Gene L. Needles, Jr.
President
American Beacon Funds
1
Domestic Equity Market Overview
December 31, 2017 (Unaudited)
During the 12-month period ended December 31, 2017, domestic equity markets ignored any signs of investor skepticism that started the year as markets pushed into their ninth year of this long-running bull market. Volatility remained at suppressed levels within the S&P 500 Index, a broad measure of domestic equity markets, providing positive total returns every month and finishing the year up 21.83%. While large-cap stocks outpaced small-caps, growth stocks exhibited drastic outperformance versus value stocks across all market-cap styles. The Russell 2000 Growth Index outperformed the Russell 2000 Value Index by 14.33%, while the Russell 1000 Growth Index outperformed the Russell 1000 Value Index by 16.55%. While many investors were skeptical of the market’s advance in 2017, data during the year suggested the lift in domestic equities reflected the now-visible signs of globally synchronized economic strength.
In the first quarter of 2017, the U.S. equity markets achieved fresh, all-time highs, as optimism from the Trump administration’s “pro-growth” agenda spilled over from the fourth quarter of 2016. Despite failure to pass revisions to health-care legislation, the market remained upbeat toward Washington, D.C., on the premise of tax cuts, easing of business regulations and a boost to U.S. infrastructure investment. The economy displayed supportive evidence of further market advances and a March rate hike from the Federal Reserve (the “Fed”). The Purchasing Managers Index, the Consumer Confidence Index and the NFIB Small Business Optimism Index all flashed constructive data. During 2016, the S&P 500 Index’s trailing 12-month, year-over-year earnings growth inflected and turned positive after four quarters in negative territory. Large-caps outperformed small-caps, reversing trading patterns from the previous quarter, with Technology stocks leading the way.
In the second quarter, U.S. equities across all market caps delivered gains, shaking off growing concerns regarding the Trump administration’s ability to pass pro-growth measures and economic data that was less enthusiastic than the previous quarter, namely within Manufacturing and Consumer Health. Political uncertainty flared up after President Trump dismissed James Comey, the former FBI director. The Fed, however, delivered another 25 basis point (0.25%) rate hike and laid out plans to begin reducing its balance sheet after years of its unprecedented quantitative easing policy program. Large-cap stocks led the march higher for the second quarter, with reflationary sectors at the top – Health Care, Industrials and Financials.
In the third quarter, robust corporate earnings continued, increasing 11.6% on a trailing 12-month basis versus a year ago. Gross domestic product growth of 3.0% was released during the quarter, breaking out from the sub-3.0% growth seen in the economy since the lowest point of the financial crisis. Historic hurricanes were disruptive to Texas, Louisiana and Puerto Rico, but negative outcomes were determined to be transitory (ex-Puerto Rico), displaying the resiliency of U.S. industry. Despite concerns of stubbornly low inflation, the Fed confirmed its balance sheet roll-off beginning in October. Crude oil prices began to solidify above $50, a key support level, which boosted cyclical energy and industrial stocks. U.S. stocks across all capitalizations made gains.
In the fourth quarter, the U.S. economy and U.S. equities capped off a robust year as corporations delivered another quarter of strong earnings growth. The Technology sector, the best performing sector in the 12-month period, delivered particularly healthy results. The much-awaited Tax Cuts and Jobs Act of 2017 was passed by Congress and signed into law by President Trump on December 22. Markets jumped on this news as the permanent tax cut is expected to make U.S. companies more competitive than non-domestic peers. U.S. Treasury yields, led by the short end of the yield curve, rose during the quarter and caused interest-rate sensitive sectors, such as Real Estate and Utilities, to underperform the broader market. In December, the Fed lifted base rates for the third time during the year and lifted their U.S. 2018 economic growth forecast to 2.5% from 2.1%.
2
American Beacon Bahl & Gaynor Small Cap Growth FundSM
Performance Overview
December 31, 2017 (Unaudited)
The Investor Class of the American Beacon Bahl & Gaynor Small Cap Growth Fund (the “Fund”) returned 13.23% for the twelve months ended December 31, 2017. The Fund underperformed the Russell 2000 Growth Index (the “Index”) return of 22.17% for the same period.
Comparison of Change in Value of a $10,000 Investment for the period from 7/15/2014 through 12/31/2017
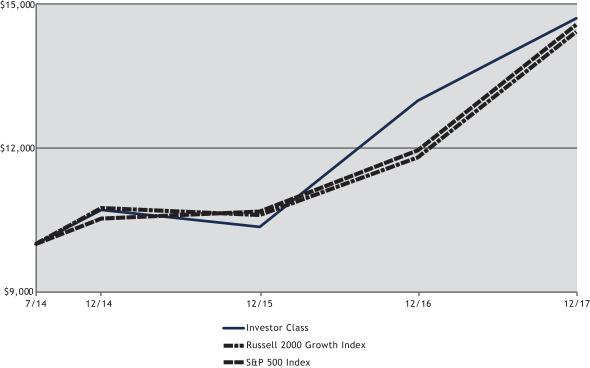
| | | | | | | | | | | | | | | | | | | | | | | | | |
| Total Returns for the Period Ended December 31, 2017 | |
| | | Ticker | | 1 Year | | 3 Year | | Since Inception (7/15/2014) | | Value of $10,000 7/15/2014- 12/31/2017 |
Institutional Class (1,5) | | GBSIX | | | | 13.65 | % | | | | 11.56 | % | | | | 12.19 | % | | | $ | 14,893 | |
Y Class (1,5) | | GBSYX | | | | 13.52 | % | | | | 11.46 | % | | | | 12.10 | % | | | $ | 14,852 | |
Investor Class (1,5) | | GBSPX | | | | 13.23 | % | | | | 11.14 | % | | | | 11.77 | % | | | $ | 14,700 | |
A without Sales Charge (1,2,5) | | GBSAX | | | | 13.21 | % | | | | 11.14 | % | | | | 11.76 | % | | | $ | 14,698 | |
A with Sales Charge (1,2,5) | | GBSAX | | | | 6.72 | % | | | | 8.97 | % | | | | 9.87 | % | | | $ | 13,853 | |
C without Sales Charge (1,3,5) | | GBSCX | | | | 12.38 | % | | | | 10.29 | % | | | | 10.90 | % | | | $ | 14,310 | |
C with Sales Charge (1,3,5) | | GBSCX | | | | 11.38 | % | | | | 10.29 | % | | �� | | 10.90 | % | | | $ | 14,310 | |
| | | | | | | | | | | | | | | | | | | | | | | | | |
Russell 2000 Growth Index (4) | | | | | | 22.17 | % | | | | 10.28 | % | | | | 11.13 | % | | | $ | 14,416 | |
S&P 500 Index (4) | | | | | | 21.83 | % | | | | 11.41 | % | | | | 11.47 | % | | | $ | 14,567 | |
| 1. | Performance shown is historical and is not indicative of future returns. Investment returns and principal value will vary, and shares may be worth more or less at redemption than at original purchase. Performance shown is calculated based on the published end of day net asset values as of date indicated, and current performance may be lower or higher than the performance data quoted. To obtain performance as of the most recent month end, please visit www.americanbeaconfunds.com or call 1-800-967-9009. Fund performance in the table above does not reflect the deduction of taxes a shareholder would pay on distributions or the redemption of shares. Generally accepted accounting principles require adjustments to be made to the net assets of the Fund at period end for financial reporting purposes only; and as such, the total return based on the unadjusted net asset value per share may differ from the total return reported in the financial highlights. A portion of the fees charged to each Class of the Fund has been waived since Fund inception. Performance prior to waiving fees was lower than actual returns shown. |
| 2. | A Class shares have a maximum sales charge of 5.75%. |
3
American Beacon Bahl & Gaynor Small Cap Growth FundSM
Performance Overview
December 31, 2017 (Unaudited)
| 3. | C Class shares have a maximum contingent deferred sales charge of 1.00% for shares redeemed within one year of the date of purchase. |
| 4. | The S&P 500 Index is a market capitalization weighted index of common stocks publicly traded in the United States. The Russell 2000 Growth Index and the Russell 2000 Index are registered trademarks of Frank Russell Company. The Russell 2000 Growth Index is an unmanaged index of those stocks in the Russell 2000 Index with higher price-to-book ratios and higher forecasted growth values. The Russell 2000 Index is an unmanaged index of approximately 2000 smaller-capitalization stocks from various industrial sectors. One cannot directly invest in an index. |
| 5. | The Total Annual Fund Operating Expense ratios set forth in the most recent Fund prospectus for the Institutional, Y, Investor, A, and C Class shares were 1.85%, 1.98%, 2.09%, 2.18%, and 3.09%, respectively. The expense ratios above may vary from the expense ratios presented in other sections of this report that are based on expenses incurred during the period covered by this report. |
The Fund underperformed the Index due to both stock selection and sector allocation relative to the Index. From a stock selection standpoint, the Fund’s holdings in the Health Care, Information Technology and Industrials sectors detracted the most from relative performance. In the Health Care sector, the Fund’s absence from Nektar Therapeutics up 386.7%, Exact Sciences Corp. up 293.3% and Sage Therapeutics up 222.5% negatively impacted returns. Also dragging on performance was the Fund’s Medidata Solutions position, which was down 19.8%. Within the Information Technology sector, NIC, Inc. was down 31.3%, The Hackett Group down 10.0% and Methode Electronics down 4.7%. Companies in the Industrials sector that further detracted from relative performance were Ritchie Bros Auctioneers down 9.4%, Apogee Enterprises down 14.3% and Matthews Intl Corp. down 31.1%.
Offsetting some of the aforementioned performance were positions in the Energy, Consumer Staples and Consumer Discretionary sectors. In Energy, the Fund avoided US Silica down 42.2% and Carrizo Oil & Gas (down 43.0%), while its position in Gaslog Ltd. was up 42.7%. Within Consumer Staples, Inter Parfums Inc. up 35.0% and Calavo Growers Inc. up 40.6% led in performance. Marriott Vacations Worldwide up 61.7%, Pool Corp. up 12.9% and Thor Industries, Inc. up 31.7% were holdings that added to relative performance in Consumer Discretionary.
As it relates to sector allocation, the Fund was underweight Health Care (one of the best performing Index sectors) and held a sizeable overweight to Financials relative to the benchmark. Slight overweights to Consumer Staples and Industrials were also detractors for the period. Offsetting some of this poor performance were underweights to both Energy (the lowest performing sector) and Consumer Discretionary.
The Fund’s basic philosophy remains focused on investing in companies using a fundamental investment approach that seeks price appreciation, capital preservation and income.
| | | | | | | | |
| Top Ten Holdings (% Net Assets) | | | | | | | | |
| Monolithic Power Systems, Inc. | | | | | | | 3.4 | |
| Cantel Medical Corp. | | | | | | | 3.1 | |
| Texas Roadhouse, Inc. | | | | | | | 2.6 | |
| Pool Corp. | | | | | | | 2.6 | |
| Marriott Vacations Worldwide Corp. | | | | | | | 2.4 | |
| Evercore, Inc., Class A | | | | | | | 2.4 | |
| Watsco, Inc. | | | | | | | 2.4 | |
| PolyOne Corp. | | | | | | | 2.1 | |
| MainSource Financial Group, Inc. | | | | | | | 2.1 | |
| Omnicell, Inc. | | | | | | | 2.1 | |
| | |
| Total Fund Holdings | | | 73 | | | | | |
| | | | | | | | |
| Sector Allocation (% Equities) | | | | | | | | |
| Information Technology | | | | | | | 25.0 | |
| Industrials | | | | | | | 17.5 | |
| Health Care | | | | | | | 15.6 | |
| Consumer Discretionary | | | | | | | 14.7 | |
| Financials | | | | | | | 10.6 | |
| Consumer Staples | | | | | | | 5.9 | |
| Materials | | | | | | | 4.4 | |
| Real Estate | | | | | | | 3.8 | |
| Energy | | | | | | | 1.3 | |
| Utilities | | | | | | | 1.2 | |
4
American Beacon Bahl & Gaynor Small Cap Growth FundSM
Expense Examples
December 31, 2017 (Unaudited)
Fund Expense Example
As a shareholder of a Fund, you incur two types of costs: (1) transaction costs, including sales charges (loads) on purchase payments and redemption fees, if applicable, and (2) ongoing costs, including management fees, distribution (12b-1) fees, sub-transfer agent fees, and other Fund expenses. The Examples are intended to help you understand the ongoing cost (in dollars) of investing in the Fund and to compare these costs with the ongoing costs of investing in other mutual funds. The Examples are based on an investment of $1,000 invested at the beginning of the period in each Class and held for the entire period from July 1, 2017 through December 31, 2017.
Actual Expenses
The “Actual” lines of the tables provide information about actual account values and actual expenses. You may use the information on this page, together with the amount you invested, to estimate the expenses that you paid over the period. Simply divide your account value by $1,000 (for example, an $8,600 account value divided by $1,000 = $8.60), then multiply the result by the “Expenses Paid During Period” to estimate the expenses you paid on your account during this period. Shareholders of the Investor and Institutional Classes that invest in the Fund through an IRA or Roth IRA may be subject to a custodial IRA fee of $15 that is typically deducted each December. If your account was subject to a custodial IRA fee during the period, your costs would have been $15 higher.
Hypothetical Example for Comparison Purposes
The “Hypothetical” lines of the tables provide information about hypothetical account values and hypothetical expenses based on the Fund’s actual expense ratio and an assumed 5% per year rate of return before expenses (not the Fund’s actual return). You may compare the ongoing costs of investing in the Fund with other funds by contrasting this 5% hypothetical example and the 5% hypothetical examples that appear in the shareholder reports of the other funds. The hypothetical account values and expenses may not be used to estimate the actual ending account balance or expenses you paid for the period. Shareholders of the Investor and Institutional Classes that invest in the Funds through an IRA or Roth IRA may be subject to a custodial IRA fee of $15 that is typically deducted each December. If your account was subject to a custodial IRA fee during the period, your costs would have been $15 higher.
You should also be aware that the expenses shown in the table highlight only your ongoing costs and do not reflect any transaction costs charged by the Fund, such as sales charges (loads) or redemption fees, as applicable. Similarly, the expense examples for other funds do not reflect any transaction costs charged by those funds, such as sales charges (loads), redemption fees or exchange fees. Therefore, the “Hypothetical” lines of the tables are useful in comparing ongoing costs only and will not help you determine the relative total costs of owning different funds. If you were subject to any transaction costs during the period, your costs would have been higher.
5
American Beacon Bahl & Gaynor Small Cap Growth FundSM
Expense Examples
December 31, 2017 (Unaudited)
| | | | | | | | | | | | |
| American Beacon Bahl & Gaynor Small Cap Growth Fund | |
| | | Beginning Account Value
7/1/2017 | | | Ending Account Value
12/31/2017 | | | Expenses Paid During
Period
7/1/2017-12/31/2017* | |
| Institutional Class | | | | | | | | | | | | |
| Actual | | $ | 1,000.00 | | | $ | 1,075.10 | | | $ | 5.13 | |
| Hypothetical** | | $ | 1,000.00 | | | $ | 1,020.30 | | | $ | 4.99 | |
| Y Class | | | | | | | | | | | | |
| Actual | | $ | 1,000.00 | | | $ | 1,075.30 | | | $ | 5.65 | |
| Hypothetical** | | $ | 1,000.00 | | | $ | 1,019.80 | | | $ | 5.50 | |
| Investor Class | | | | | | | | | | | | |
| Actual | | $ | 1,000.00 | | | $ | 1,072.90 | | | $ | 7.11 | |
| Hypothetical** | | $ | 1,000.00 | | | $ | 1,018.30 | | | $ | 6.92 | |
| A Class | | | | | | | | | | | | |
| Actual | | $ | 1,000.00 | | | $ | 1,073.60 | | | $ | 7.21 | |
| Hypothetical** | | $ | 1,000.00 | | | $ | 1,018.20 | | | $ | 7.02 | |
| C Class | | | | | | | | | | | | |
| Actual | | $ | 1,000.00 | | | $ | 1,068.70 | | | $ | 11.11 | |
| Hypothetical** | | $ | 1,000.00 | | | $ | 1,014.50 | | | $ | 10.82 | |
| * | Expenses are equal to the Fund’s annualized expense ratios for the six-month period of 0.98%, 1.08%, 1.36%, 1.38%, and 2.13% for the Institutional, Y, Investor, A, and C Classes, respectively, multiplied by the average account value over the period, multiplied by the number derived by dividing the number of days in the most recent fiscal half-year (184) by days in the year (365) to reflect the half-year period. |
| ** | 5% return before expenses. |
6
American Beacon FundsSM
Report of Independent Registered Public Accounting Firm
To the Shareholders and the Board of Trustees of American Beacon Bahl & Gaynor Small Cap Growth Fund
Opinion on the Financial Statements
We have audited the accompanying statement of assets and liabilities of American Beacon Bahl & Gaynor Small Cap Growth Fund (the “Fund”) (one of the funds constituting American Beacon Funds (the “Trust”)), including the schedule of investments, as of December 31, 2017, and the related statement of operations for the year then ended, the statements of changes in net assets for each of the two years in the period then ended, the financial highlights for each of the three years in the period then ended and the period from July 15, 2014 (commencement of operations) to December 31, 2014 and the related notes (collectively referred to as the “financial statements”). In our opinion, the financial statements present fairly, in all material respects, the financial position of the Fund (one of the funds constituting American Beacon Funds) at December 31, 2017, the results of its operations for the year then ended, the changes in its net assets for each of the two years in the period then ended and its financial highlights for each of the three years in the period then ended and the period from July 15, 2014 (commencement of operations) to December 31, 2014, in conformity with U.S. generally accepted accounting principles.
Basis for Opinion
These financial statements are the responsibility of the Trust’s management. Our responsibility is to express an opinion on the Fund’s financial statements based on our audits. We are a public accounting firm registered with the Public Company Accounting Oversight Board (United States) (“PCAOB”) and are required to be independent with respect to the Trust in accordance with the U.S. federal securities laws and the applicable rules and regulations of the Securities and Exchange Commission and the PCAOB.
We conducted our audits in accordance with the standards of the PCAOB. Those standards require that we plan and perform the audit to obtain reasonable assurance about whether the financial statements are free of material misstatement, whether due to error or fraud. The Trust is not required to have, nor were we engaged to perform, an audit of the Trust’s internal control over financial reporting. As part of our audits, we are required to obtain an understanding of internal control over financial reporting, but not for the purpose of expressing an opinion on the effectiveness of the Trust’s internal control over financial reporting. Accordingly, we express no such opinion.
Our audits included performing procedures to assess the risks of material misstatement of the financial statements, whether due to error or fraud, and performing procedures that respond to those risks. Such procedures included examining, on a test basis, evidence regarding the amounts and disclosures in the financial statements. Our procedures included confirmation of securities owned as of December 31, 2017, by correspondence with the custodian and brokers. Our audits also included evaluating the accounting principles used and significant estimates made by management, as well as evaluating the overall presentation of the financial statements. We believe that our audits provide a reasonable basis for our opinion.

We have served as the auditor of one or more American Beacon investment companies since 1987.
Dallas, Texas
February 28, 2018
7
American Beacon Bahl & Gaynor Small Cap Growth FundSM
Schedule of Investments
December 31, 2017
| | | | | | | | | | | | | | | |
| | | Shares | | | | Fair Value |
| | | | | | | | | | | | | | | |
| COMMON STOCKS - 98.32% | | | | | | | | | | | | | | | |
| Consumer Discretionary - 14.42% | | | | | | | | | | | | | | | |
| Auto Components - 2.19% | | | | | | | | | | | | | | | |
| Gentex Corp. | | | | 10,830 | | | | | | | | | $ | 226,889 | |
| LCI Industries | | | | 5,065 | | | | | | | | | | 658,450 | |
| | | | | | | | | | | | | | | |
| | | | | | | | | | | | | | 885,339 | |
| | | | | | | | | | | | | | | |
| | | | | | | | | | | | | | | |
| Distributors - 2.58% | | | | | | | | | | | | | | | |
| Pool Corp. | | | | 8,045 | | | | | | | | | | 1,043,034 | |
| | | | | | | | | | | | | | | |
| | | | | | | | | | | | | | | |
| Hotels, Restaurants & Leisure - 5.06% | | | | | | | | | | | | | | | |
| Marriott Vacations Worldwide Corp. | | | | 7,300 | | | | | | | | | | 987,033 | |
| Texas Roadhouse, Inc. | | | | 20,110 | | | | | | | | | | 1,059,395 | |
| | | | | | | | | | | | | | | |
| | | | | | | | | | | | | | 2,046,428 | |
| | | | | | | | | | | | | | | |
| | | | | | | | | | | | | | | |
| Household Durables - 0.81% | | | | | | | | | | | | | | | |
| Flexsteel Industries, Inc. | | | | 7,005 | | | | | | | | | | 327,694 | |
| | | | | | | | | | | | | | | |
| | | | | | | | | | | | | | | |
| Leisure Products - 1.65% | | | | | | | | | | | | | | | |
| Brunswick Corp. | | | | 12,060 | | | | | | | | | | 665,953 | |
| | | | | | | | | | | | | | | |
| | | | | | | | | | | | | | | |
| Media - 0.40% | | | | | | | | | | | | | | | |
| Cinemark Holdings, Inc. | | | | 4,665 | | | | | | | | | | 162,435 | |
| | | | | | | | | | | | | | | |
| | | | | | | | | | | | | | | |
| Specialty Retail - 0.48% | | | | | | | | | | | | | | | |
| Winmark Corp. | | | | 1,490 | | | | | | | | | | 192,806 | |
| | | | | | | | | | | | | | | |
| | | | | | | | | | | | | | | |
| Textiles, Apparel & Luxury Goods - 1.25% | | | | | | | | | | | | | | | |
| Columbia Sportswear Co. | | | | 3,455 | | | | | | | | | | 248,346 | |
| Superior Uniform Group, Inc. | | | | 9,685 | | | | | | | | | | 258,686 | |
| | | | | | | | | | | | | | | |
| | | | | | | | | | | | | | 507,032 | |
| | | | | | | | | | | | | | | |
| | | | | | | | | | | | | | | |
Total Consumer Discretionary | | | | | | | | | | | | | | 5,830,721 | |
| | | | | | | | | | | | | | | |
| | | | | | | | | | | | | | | |
| Consumer Staples - 5.83% | | | | | | | | | | | | | | | |
| Food & Staples Retailing - 1.24% | | | | | | | | | | | | | | | |
| PriceSmart, Inc. | | | | 5,810 | | | | | | | | | | 500,241 | |
| | | | | | | | | | | | | | | |
| | | | | | | | | | | | | | | |
| Food Products - 2.91% | | | | | | | | | | | | | | | |
| Calavo Growers, Inc.A | | | | 8,345 | | | | | | | | | | 704,318 | |
| J&J Snack Foods Corp. | | | | 3,125 | | | | | | | | | | 474,469 | |
| | | | | | | | | | | | | | | |
| | | | | | | | | | | | | | 1,178,787 | |
| | | | | | | | | | | | | | | |
| | | | | | | | | | | | | | | |
| Personal Products - 1.68% | | | | | | | | | | | | | | | |
| Inter Parfums, Inc. | | | | 15,640 | | | | | | | | | | 679,558 | |
| | | | | | | | | | | | | | | |
| | | | | | | | | | | | | | | |
Total Consumer Staples | | | | | | | | | | | | | | 2,358,586 | |
| | | | | | | | | | | | | | | |
| | | | | | | | | | | | | | | |
| Energy - 1.30% | | | | | | | | | | | | | | | |
| Oil, Gas & Consumable Fuels - 1.30% | | | | | | | | | | | | | | | |
| GasLog Ltd. | | | | 23,680 | | | | | | | | | | 526,880 | |
| | | | | | | | | | | | | | | |
| | | | | | | | | | | | | | | |
| Financials - 10.39% | | | | | | | | | | | | | | | |
| Banks - 6.22% | | | | | | | | | | | | | | | |
| Chemical Financial Corp. | | | | 3,765 | | | | | | | | | | 201,315 | |
| First Interstate BancSystem, Inc., Class A | | | | 19,510 | | | | | | | | | | 781,375 | |
| Glacier Bancorp, Inc. | | | | 6,770 | | | | | | | | | | 266,670 | |
| MainSource Financial Group, Inc. | | | | 23,535 | | | | | | | | | | 854,556 | |
| S&T Bancorp, Inc. | | | | 10,280 | | | | | | | | | | 409,247 | |
| | | | | | | | | | | | | | | |
| | | | | | | | | | | | | | 2,513,163 | |
| | | | | | | | | | | | | | | |
| | | | | | | | | | | | | | | |
See accompanying notes
8
American Beacon Bahl & Gaynor Small Cap Growth FundSM
Schedule of Investments
December 31, 2017
| | | | | | | | | | | | | | | |
| | | Shares | | | | Fair Value |
| | | | | | | | | | | | | | | |
| COMMON STOCKS - 98.32% (continued) | | | | | | | | | | | | | | | |
| Financials - 10.39% (continued) | | | | | | | | | | | | | | | |
| Capital Markets - 2.42% | | | | | | | | | | | | | | | |
| Evercore, Inc., Class A | | | | 10,875 | | | | | | | | | $ | 978,750 | |
| | | | | | | | | | | | | | | |
| | | | | | | | | | | | | | | |
| Insurance - 1.75% | | | | | | | | | | | | | | | |
| Horace Mann Educators Corp. | | | | 16,085 | | | | | | | | | | 709,348 | |
| | | | | | | | | | | | | | | |
| | | | | | | | | | | | | | | |
Total Financials | | | | | | | | | | | | | | 4,201,261 | |
| | | | | | | | | | | | | | | |
| | | | | | | | | | | | | | | |
| Health Care - 15.35% | | | | | | | | | | | | | | | |
| Health Care Equipment & Supplies - 5.95% | | | | | | | | | | | | | | | |
| Abaxis, Inc. | | | | 4,365 | | | | | | | | | | 216,155 | |
| Atrion Corp. | | | | 595 | | | | | | | | | | 375,207 | |
| Cantel Medical Corp. | | | | 12,360 | | | | | | | | | | 1,271,473 | |
| LeMaitre Vascular, Inc. | | | | 16,980 | | | | | | | | | | 540,643 | |
| | | | | | | | | | | | | | | |
| | | | | | | | | | | | | | 2,403,478 | |
| | | | | | | | | | | | | | | |
| | | | | | | | | | | | | | | |
| Health Care Providers & Services - 3.60% | | | | | | | | | | | | | | | |
| Chemed Corp. | | | | 2,535 | | | | | | | | | | 616,056 | |
| Patterson Cos., Inc. | | | | 8,645 | | | | | | | | | | 312,344 | |
| US Physical Therapy, Inc. | | | | 7,300 | | | | | | | | | | 527,060 | |
| | | | | | | | | | | | | | | |
| | | | | | | | | | | | | | 1,455,460 | |
| | | | | | | | | | | | | | | |
| | | | | | | | | | | | | | | |
| Health Care Technology - 3.90% | | | | | | | | | | | | | | | |
| Medidata Solutions, Inc.B | | | | 7,595 | | | | | | | | | | 481,295 | |
| Omnicell, Inc.B | | | | 17,420 | | | | | | | | | | 844,870 | |
| Simulations Plus, Inc. | | | | 15,485 | | | | | | | | | | 249,309 | |
| | | | | | | | | | | | | | | |
| | | | | | | | | | | | | | 1,575,474 | |
| | | | | | | | | | | | | | | |
| | | | | | | | | | | | | | | |
| Life Sciences Tools & Services - 1.90% | | | | | | | | | | | | | | | |
| Bio-Techne Corp. | | | | 4,020 | | | | | | | | | | 520,791 | |
| Medpace Holdings, Inc.B | | | | 6,855 | | | | | | | | | | 248,562 | |
| | | | | | | | | | | | | | | |
| | | | | | | | | | | | | | 769,353 | |
| | | | | | | | | | | | | | | |
| | | | | | | | | | | | | | | |
Total Health Care | | | | | | | | | | | | | | 6,203,765 | |
| | | | | | | | | | | | | | | |
| | | | | | | | | | | | | | | |
| Industrials - 17.16% | | | | | | | | | | | | | | | |
| Building Products - 3.71% | | | | | | | | | | | | | | | |
| Apogee Enterprises, Inc. | | | | 11,315 | | | | | | | | | | 517,435 | |
| Simpson Manufacturing Co., Inc. | | | | 8,345 | | | | | | | | | | 479,086 | |
| Universal Forest Products, Inc. | | | | 13,400 | | | | | | | | | | 504,108 | |
| | | | | | | | | | | | | | | |
| | | | | | | | | | | | | | 1,500,629 | |
| | | | | | | | | | | | | | | |
| | | | | | | | | | | | | | | |
| Commercial Services & Supplies - 5.39% | | | | | | | | | | | | | | | |
| Healthcare Services Group, Inc. | | | | 11,465 | | | | | | | | | | 604,435 | |
| Matthews International Corp., Class A | | | | 5,960 | | | | | | | | | | 314,688 | |
| MSA Safety, Inc. | | | | 7,595 | | | | | | | | | | 588,765 | |
| Ritchie Bros Auctioneers, Inc. | | | | 22,495 | | | | | | | | | | 673,275 | |
| | | | | | | | | | | | | | | |
| | | | | | | | | | | | | | 2,181,163 | |
| | | | | | | | | | | | | | | |
| | | | | | | | | | | | | | | |
| Construction & Engineering - 1.53% | | | | | | | | | | | | | | | |
| Valmont Industries, Inc. | | | | 3,725 | | | | | | | | | | 617,791 | |
| | | | | | | | | | | | | | | |
| | | | | | | | | | | | | | | |
| Industrial Conglomerates - 1.48% | | | | | | | | | | | | | | | |
| Raven Industries, Inc. | | | | 17,420 | | | | | | | | | | 598,377 | |
| | | | | | | | | | | | | | | |
| | | | | | | | | | | | | | | |
| Machinery - 0.91% | | | | | | | | | | | | | | | |
| Hyster-Yale Materials Handling, Inc. | | | | 4,320 | | | | | | | | | | 367,891 | |
| | | | | | | | | | | | | | | |
| | | | | | | | | | | | | | | |
See accompanying notes
9
American Beacon Bahl & Gaynor Small Cap Growth FundSM
Schedule of Investments
December 31, 2017
| | | | | | | | | | | | | | | |
| | | Shares | | | | Fair Value |
| | | | | | | | | | | | | | | |
| COMMON STOCKS - 98.32% (continued) | | | | | | | | | | | | | | | |
| Industrials - 17.16% (continued) | | | | | | | | | | | | | | | |
| Trading Companies & Distributors - 4.14% | | | | | | | | | | | | | | | |
| Applied Industrial Technologies, Inc. | | | | 10,430 | | | | | | | | | $ | 710,283 | |
| Watsco, Inc. | | | | 5,660 | | | | | | | | | | 962,427 | |
| | | | | | | | | | | | | | | |
| | | | | | | | | | | | | | 1,672,710 | |
| | | | | | | | | | | | | | | |
| | | | | | | | | | | | | | | |
Total Industrials | | | | | | | | | | | | | | 6,938,561 | |
| | | | | | | | | | | | | | | |
| | | | | | | | | | | | | | | |
| Information Technology - 24.54% | | | | | | | | | | | | | | | |
| Electronic Equipment, Instruments & Components - 6.08% | | | | | | | | | | | | | | | |
| Littelfuse, Inc. | | | | 2,980 | | | | | | | | | | 589,504 | |
| Mesa Laboratories, Inc.A | | | | 3,425 | | | | | | | | | | 425,728 | |
| Methode Electronics, Inc. | | | | 11,025 | | | | | | | | | | 442,102 | |
| National Instruments Corp. | | | | 8,940 | | | | | | | | | | 372,172 | |
| SYNNEX Corp. | | | | 4,620 | | | | | | | | | | 628,089 | |
| | | | | | | | | | | | | | | |
| | | | | | | | | | | | | | 2,457,595 | |
| | | | | | | | | | | | | | | |
| | | | | | | | | | | | | | | |
| Internet Software & Services - 2.02% | | | | | | | | | | | | | | | |
| NIC, Inc. | | | | 37,980 | | | | | | | | | | 630,468 | |
| Reis, Inc. | | | | 8,945 | | | | | | | | | | 184,714 | |
| | | | | | | | | | | | | | | |
| | | | | | | | | | | | | | 815,182 | |
| | | | | | | | | | | | | | | |
| | | | | | | | | | | | | | | |
| IT Services - 2.91% | | | | | | | | | | | | | | | |
| CSG Systems International, Inc. | | | | 8,790 | | | | | | | | | | 385,178 | |
| Forrester Research, Inc. | | | | 6,710 | | | | | | | | | | 296,582 | |
| Hackett Group, Inc. | | | | 31,575 | | | | | | | | | | 496,043 | |
| | | | | | | | | | | | | | | |
| | | | | | | | | | | | | | 1,177,803 | |
| | | | | | | | | | | | | | | |
| | | | | | | | | | | | | | | |
| Semiconductors & Semiconductor Equipment - 8.79% | | | | | | | | | | | | | | | |
| Cabot Microelectronics Corp. | | | | 6,555 | | | | | | | | | | 616,694 | |
| Cirrus Logic, Inc.B | | | | 8,195 | | | | | | | | | | 424,993 | |
| Monolithic Power Systems, Inc. | | | | 12,060 | | | | | | | | | | 1,355,061 | |
| NVE Corp. | | | | 2,385 | | | | | | | | | | 205,110 | |
| Power Integrations, Inc. | | | | 3,005 | | | | | | | | | | 221,018 | |
| Silicon Motion Technology Corp., ADRA | | | | 13,850 | | | | | | | | | | 733,496 | |
| | | | | | | | | | | | | | | |
| | | | | | | | | | | | | | 3,556,372 | |
| | | | | | | | | | | | | | | |
| | | | | | | | | | | | | | | |
| Software - 4.74% | | | | | | | | | | | | | | | |
| Blackbaud, Inc. | | | | 8,490 | | | | | | | | | | 802,220 | |
| Monotype Imaging Holdings, Inc. | | | | 19,660 | | | | | | | | | | 473,806 | |
| Pegasystems, Inc. | | | | 13,550 | | | | | | | | | | 638,883 | |
| | | | | | | | | | | | | | | |
| | | | | | | | | | | | | | 1,914,909 | |
| | | | | | | | | | | | | | | |
| | | | | | | | | | | | | | | |
Total Information Technology | | | | | | | | | | | | | | 9,921,861 | |
| | | | | | | | | | | | | | | |
| | | | | | | | | | | | | | | |
| Materials - 4.32% | | | | | | | | | | | | | | | |
| Chemicals - 4.32% | | | | | | | | | | | | | | | |
| Balchem Corp. | | | | 5,360 | | | | | | | | | | 432,016 | |
| PolyOne Corp. | | | | 19,955 | | | | | | | | | | 868,043 | |
| Stepan Co. | | | | 5,660 | | | | | | | | | | 446,970 | |
| | | | | | | | | | | | | | | |
| | | | | | | | | | | | | | 1,747,029 | |
| | | | | | | | | | | | | | | |
| | | | | | | | | | | | | | | |
Total Materials | | | | | | | | | | | | | | 1,747,029 | |
| | | | | | | | | | | | | | | |
| | | | | | | | | | | | | | | |
| Real Estate - 3.77% | | | | | | | | | | | | | | | |
| Equity Real Estate Investment Trusts (REITs) - 2.18% | | | | | | | | | | | | | | | |
| CoreSite Realty Corp. | | | | 6,105 | | | | | | | | | | 695,359 | |
| QTS Realty Trust, Inc., Class A | | | | 3,455 | | | | | | | | | | 187,123 | |
| | | | | | | | | | | | | | | |
| | | | | | | | | | | | | | 882,482 | |
| | | | | | | | | | | | | | | |
| | | | | | | | | | | | | | | |
See accompanying notes
10
American Beacon Bahl & Gaynor Small Cap Growth FundSM
Schedule of Investments
December 31, 2017
| | | | | | | | | | | | | | | |
| | | Shares | | | | Fair Value |
| | | | | | | | | | | | | | | |
| COMMON STOCKS - 98.32% (continued) | | | | | | | | | | | | | | | |
| Real Estate - 3.77% (continued) | | | | | | | | | | | | | | | |
| Real Estate Management & Development - 1.59% | | | | | | | | | | | | | | | |
| RE/MAX Holdings, Inc., Class A | | | | 13,255 | | | | | | | | | $ | 642,868 | |
| | | | | | | | | | | | | | | |
| | | | | | | | | | | | | | | |
Total Real Estate | | | | | | | | | | | | | | 1,525,350 | |
| | | | | | | | | | | | | | | |
| | | | | | | | | | | | | | | |
| Utilities - 1.24% | | | | | | | | | | | | | | | |
| Gas Utilities - 1.24% | | | | | | | | | | | | | | | |
| ONE Gas, Inc. | | | | 6,855 | | | | | | | | | | 502,197 | |
| | | | | | | | | | | | | | | |
| | | | | | | | | | | | | | | |
Total Common Stocks (Cost $34,304,267) | | | | | | | | | | | | | | 39,756,211 | |
| | | | | | | | | | | | | | | |
| | | | | | | | | | | | | | | |
| SHORT-TERM INVESTMENTS - 1.60% (Cost $646,632) | | | | | | | | | | | | | | | |
| Investment Companies - 1.60% | | | | | | | | | | | | | | | |
| American Beacon U.S. Government Money Market Select Fund, Select Class, 1.13%C D | | | | 646,632 | | | | | | | | | | 646,632 | |
| | | | | | | | | | | | | | | |
| | | | | | | | | | | | | | | |
| SECURITIES LENDING COLLATERAL - 3.19% (Cost $1,288,716) | | | | | | | | | | | | | | | |
| Investment Companies - 3.19% | | | | | | | | | | | | | | | |
| American Beacon U.S. Government Money Market Select Fund, Select Class, 1.13%C D | | | | 1,288,716 | | | | | | | | | | 1,288,716 | |
| | | | | | | | | | | | | | | |
| | | | | | | | | | | | | | | |
TOTAL INVESTMENTS - 103.11% (Cost $36,239,615) | | | | | | | | | | | | | | 41,691,559 | |
LIABILITIES, NET OF OTHER ASSETS - (3.11%) | | | | | | | | | | | | | | (1,259,033 | ) |
| | | | | | | | | | | | | | | |
TOTAL NET ASSETS - 100.00% | | | | | | | | | | | | | $ | 40,432,526 | |
| | | | | | | | | | | | | | | |
| | | | | | | | | | | | | | | |
| Percentages are stated as a percent of net assets. | | | | | | | | | | | | | | | |
A All or a portion of this security is on loan at December 31, 2017.
B Non-income producing security.
C The Fund is affiliated by having the same investment advisor.
D 7-day yield.
ADR – American Depository Reciept.
| | | | | | | | | | | | | | | | |
| Futures Contracts Open on December 31, 2017: | | | | | |
| |
| Long Futures | | | | |
| |
| Equity Futures Contracts | | | | |
| Description | | Number of
Contracts | | Expiration Date | | Notional Amount | | | Contract Value | | | Unrealized
Appreciation
(Depreciation) | |
| Russell 2000 E-Mini Index Futures | | 8 | | March 2018 | | $ | 619,277 | | | $ | 614,600 | | | $ | (4,677 | ) |
| | | | | | | | | | | | | | | | |
| | | | | | $ | 619,277 | | | $ | 614,600 | | | $ | (4,677 | ) |
| | | | | | | | | | | | | | | | |
The Fund’s investments are summarized by level based on the inputs used to determine their values. As of December 31, 2017, the investments were classified as described below:
| | | | | | | | | | | | | | | | | | | | | | | | | | | | |
Bahl & Gaynor Small Cap Growth Fund | | Level 1 | | | | | | Level 2 | | | | | | Level 3 | | | | | | Total | |
Assets | | | | | | | | | | | | | | | | | | | | | | | | | | | | |
Common Stocks | | $ | 39,756,211 | | | | | | | $ | - | | | | | | | $ | - | | | | | | | $ | 39,756,211 | |
Short-Term Investments | | | 646,632 | | | | | | | | - | | | | | | | | - | | | | | | | | 646,632 | |
Securities Lending Collateral | | | 1,288,716 | | | | | | | | - | | | | | | | | - | | | | | | | | 1,288,716 | |
| | | | | | | | | | | | | | | | | | | | | | | | | | | | |
Total Investments in Securities - Assets | | $ | 41,691,559 | | | | | | | $ | - | | | | | | | $ | - | | | | | | | $ | 41,691,559 | |
| | | | | | | | | | | | | | | | | | | | | | | | | | | | |
|
Financial Derivative Instruments - Liabilities | |
Futures Contracts | | $ | (4,677 | ) | | | | | | $ | - | | | | | | | $ | - | | | | | | | $ | (4,677 | ) |
| | | | | | | | | | | | | | | | | | | | | | | | | | | | |
Total Financial Derivative Instruments - Liabilities | | $ | (4,677 | ) | | | | | | $ | - | | | | | | | $ | - | | | | | | | $ | (4,677 | ) |
| | | | | | | | | | | | | | | | | | | | | | | | | | | | |
U.S. GAAP requires all transfers between any levels to be disclosed. The end of period timing recognition has been adopted for the transfers between levels of the Fund’s assets and liabilities. During the period ended December 31, 2017, there were no transfers between levels.
See accompanying notes
11
American Beacon Bahl & Gaynor Small Cap Growth FundSM
Statement of Assets and Liabilities
December 31, 2017
| | | | |
Assets: | |
Investments in unaffiliated securities, at fair value† § | | $ | 39,756,211 | |
Investments in affiliated securities, at fair value‡ | | | 1,935,348 | |
Deposit with brokers for futures contracts | | | 23,600 | |
Dividends and interest receivable | | | 35,036 | |
Receivable for fund shares sold | | | 23,355 | |
Receivable for expense reimbursement (Note 2) | | | 16,194 | |
Prepaid expenses | | | 23,432 | |
| | | | |
Total assets | | | 41,813,176 | |
| | | | |
Liabilities: | |
Payable for fund shares redeemed | | | 5,730 | |
Payable for variation margin from open futures contracts (Note 5) | | | 7,856 | |
Payable upon return of securities loaned (Note 9)§ | | | 1,288,716 | |
Management and sub-advisory fees payable (Note 2) | | | 31,911 | |
Service fees payable (Note 2) | | | 2,632 | |
Transfer agent fees payable (Note 2) | | | 2,478 | |
Custody and fund accounting fees payable | | | 8,666 | |
Professional fees payable | | | 29,948 | |
Trustee fees payable (Note 2) | | | 2 | |
Payable for prospectus and shareholder reports | | | 1,429 | |
Other liabilities | | | 1,282 | |
| | | | |
Total liabilities | | | 1,380,650 | |
| | | | |
Net assets | | $ | 40,432,526 | |
| | | | |
Analysis of net assets: | |
Paid-in-capital | | $ | 35,006,590 | |
Undistributed net investment income | | | 40 | |
Accumulated net realized (loss) | | | (21,371 | ) |
Unrealized appreciation of investments in unaffiliated securitiesA | | | 5,451,944 | |
Unrealized (depreciation) of futures contracts | | | (4,677 | ) |
| | | | |
Net assets | | $ | 40,432,526 | |
| | | | |
Shares outstanding at no par value (unlimited shares authorized): | |
Institutional Class | | | 1,184,093 | |
| | | | |
Y Class | | | 1,088,141 | |
| | | | |
Investor Class | | | 315,853 | |
| | | | |
A Class | | | 287,736 | |
| | | | |
C Class | | | 38,745 | |
| | | | |
Net assets: | |
Institutional Class | | $ | 16,498,344 | |
| | | | |
Y Class | | $ | 15,114,316 | |
| | | | |
Investor Class | | $ | 4,344,476 | |
| | | | |
A Class | | $ | 3,955,277 | |
| | | | |
C Class | | $ | 520,113 | |
| | | | |
Net asset value, offering and redemption price per share: | |
Institutional Class | | $ | 13.93 | |
| | | | |
Y Class | | $ | 13.89 | |
| | | | |
Investor Class | | $ | 13.75 | |
| | | | |
A Class | | $ | 13.75 | |
| | | | |
A Class (offering price) | | $ | 14.59 | |
| | | | |
C Class | | $ | 13.42 | |
| | | | |
| |
† Cost of investments in unaffiliated securities | | $ | 34,304,267 | |
‡ Cost of investments in affiliated securities | | $ | 1,935,348 | |
§ Fair value of securities on loan | | $ | 1,261,238 | |
A The Fund’s investments in affiliated securities did not have unrealized appreciation (depreciation) at year end. | |
See accompanying notes
12
American Beacon Bahl & Gaynor Small Cap Growth FundSM
Statement of Operations
For the year ended December 31, 2017
| | | | |
Investment income: | |
Dividend income from unaffiliated securities (net of foreign taxes)† | | $ | 476,165 | |
Dividend income from affiliated securities | | | 4,130 | |
Income derived from securities lending (Note 9) | | | 3,451 | |
| | | | |
Total investment income | | | 483,746 | |
| | | | |
Expenses: | |
Management and sub-advisory fees (Note 2) | | | 283,341 | |
Transfer agent fees: | | | | |
Institutional Class (Note 2) | | | 4,401 | |
Y Class (Note 2) | | | 11,189 | |
Investor Class | | | 1,484 | |
A Class | | | 456 | |
C Class | | | 71 | |
Custody and fund accounting fees | | | 12,841 | |
Professional fees | | | 37,749 | |
Registration fees and expenses | | | 63,585 | |
Service fees (Note 2): | | | | |
Y Class | | | 2,236 | |
Investor Class | | | 8,605 | |
A Class | | | 4,872 | |
C Class | | | 765 | |
Distribution fees (Note 2): | | | | |
A Class | | | 8,120 | |
C Class | | | 5,102 | |
Prospectus and shareholder report expenses | | | 9,939 | |
Trustee fees (Note 2) | | | 1,978 | |
Other expenses | | | 4,322 | |
| | | | |
Total expenses | | | 461,056 | |
| | | | |
Net fees waived and expenses (reimbursed) (Note 2) | | | (98,429 | ) |
| | | | |
Net expenses | | | 362,627 | |
| | | | |
Net investment income | | | 121,119 | |
| | | | |
|
Realized and unrealized gain (loss) from investments: | |
Net realized gain from: | | | | |
Investments in unaffiliated securitiesA | | | 1,615,880 | |
Futures contracts | | | 19,435 | |
Change in net unrealized appreciation (depreciation) of: | | | | |
Investments in unaffiliated securitiesB | | | 2,517,772 | |
Futures contracts | | | (1,892 | ) |
| | | | |
Net gain from investments | | | 4,151,195 | |
| | | | |
Net increase in net assets resulting from operations | | $ | 4,272,314 | |
| | | | |
| |
† Foreign taxes | | $ | 1,531 | |
A The Fund did not recognize net realized gains (losses) from the sale of investments in affiliated securities. | |
B The Fund’s investments in affiliated securities did not have a change in unrealized appreciation (depreciation) at year end. | |
See accompanying notes
13
American Beacon Bahl & Gaynor Small Cap Growth FundSM
Statement of Changes in Net Assets
| | | | | | | | | | | | |
| | | Year Ended
December 31, 2017 | | | | | | Year Ended
December 31, 2016 | |
Increase (decrease) in net assets: | | | | | | | | | | | | |
Operations: | | | | | | | | | | | | |
Net investment income | | $ | 121,119 | | | | | | | $ | 49,381 | |
Net realized gain from investments in unaffiliated securities and futures contracts | | | 1,635,315 | | | | | | | | 93,102 | |
Change in net unrealized appreciation of investments in unaffiliated securities and futures contracts | | | 2,515,880 | | | | | | | | 2,932,772 | |
| | | | | | | | | | | | |
Net increase in net assets resulting from operations | | | 4,272,314 | | | | | | | | 3,075,255 | |
| | | | | | | | | | | | |
| | | |
Distributions to shareholders: | | | | | | | | | | | | |
Net investment income: | | | | | | | | | | | | |
Institutional Class | | | (52,087 | ) | | | | | | | (18,862 | ) |
Y Class | | | (48,628 | ) | | | | | | | (16,961 | ) |
Investor Class | | | (10,982 | ) | | | | | | | (8,783 | ) |
A Class | | | (9,279 | ) | | | | | | | (5,812 | ) |
C Class | | | – | | | | | | | | (497 | ) |
Net realized gain from investments: | | | | | | | | | | | | |
Institutional Class | | | (615,487 | ) | | | | | | | – | |
Y Class | | | (574,620 | ) | | | | | | | – | |
Investor Class | | | (163,276 | ) | | | | | | | – | |
A Class | | | (149,011 | ) | | | | | | | – | |
C Class | | | (20,233 | ) | | | | | | | – | |
| | | | | | | | | | | | |
Net distributions to shareholders | | | (1,643,603 | ) | | | | | | | (50,915 | ) |
| | | | | | | | | | | | |
| | | |
Capital share transactions (Note 11): | | | | | | | | | | | | |
Proceeds from sales of shares | | | 23,004,549 | | | | | | | | 11,394,900 | |
Reinvestment of dividends and distributions | | | 1,597,617 | | | | | | | | 49,550 | |
Cost of shares redeemed | | | (7,548,368 | ) | | | | | | | (923,263 | ) |
| | | | | | | | | | | | |
Net increase in net assets from capital share transactions | | | 17,053,798 | | | | | | | | 10,521,187 | |
| | | | | | | | | | | | |
Net increase in net assets | | | 19,682,509 | | | | | | | | 13,545,527 | |
| | | | | | | | | | | | |
Net assets: | | | | | | | | | | | | |
Beginning of period | | | 20,750,017 | | | | | | | | 7,204,490 | |
| | | | | | | | | | | | |
End of period* | | $ | 40,432,526 | | | | | | | $ | 20,750,017 | |
| | | | | | | | | | | | |
*Includes undistributed net investment income | | $ | 40 | | | | | | | $ | – | |
| | | | | | | | | | | | |
See accompanying notes
14
American Beacon Bahl & Gaynor Small Cap Growth FundSM
Notes to Financial Statements
December 31, 2017
1. Organization and Significant Accounting Policies
American Beacon Funds (the “Trust”), is organized as a Massachusetts business trust. The Fund, a series within the Trust, is registered under the Investment Company Act of 1940 (the “Act”), as amended, as a diversified, open-end management investment company. As of December 31, 2017, the Trust consists of thirty-three active series, one of which is presented in this filing: American Beacon Bahl & Gaynor Small Cap Growth Fund (the “Fund”). The remaining thirty-two active series are reported in separate filings.
American Beacon Advisors, Inc. (the “Manager”) is a wholly-owned subsidiary of Resolute Investment Managers, Inc., which is indirectly owned by investment funds affiliated with Kelso & Company, L.P. and Estancia Capital Management, LLC, and was organized in 1986 to provide business management, advisory, administrative, and asset management consulting services to the Trust and other investors.
Class Disclosure
The Fund has multiple classes of shares designed to meet the needs of different groups of investors. The following table sets forth the differences amongst the classes:
| | | | | | |
Class | | Eligible Investors | | Minimum Initial
Investments | |
| Institutional | | Large institutional investors - sold directly or through intermediary channels. | | $ | 250,000 | |
| Y Class | | Large institutional retirement plan investors - sold directly or through intermediary channels. | | $ | 100,000 | |
| Investor | | All investors using intermediary organizations, such as broker-dealers or retirement plan sponsors. | | $ | 2,500 | |
| A Class | | All investors who invest through intermediary organizations, such as broker-dealers or third party administrator. Retail investors who invest directly through a financial intermediary such as a broker, bank, or registered investment advisor which may include a front-end sales charge and a contingent deferred sales charge (“CDSC”). | | $ | 2,500 | |
| C Class | | Retail investors who invest directly through a financial intermediary such as a broker or through employee directed benefit plans with applicable sales charges which may include CDSC. | | $ | 1,000 | |
Each class offered by the Trust has equal rights as to assets and voting privileges. Income and non-class specific expenses are allocated daily to each class on the basis of the relative net assets. Realized and unrealized capital gains and losses of each class are allocated daily based on the relative net assets of each class of the respective Fund. Class specific expenses, where applicable, currently include service, distribution, and sub-transfer agent fees that vary amongst the classes as described more fully in Note 2.
Recently Adopted Accounting Pronouncements
In October 2016, the Securities and Exchange Commission (“SEC”) adopted amendments to rules under the Investment Company Act of 1940 (“final rules”) intended to modernize the reporting and disclosure of information by registered investment companies. The final rules amend Regulation S-X and require funds to provide standardized, enhanced derivative disclosure in fund financial statements in a format designed for individual investors. The amendments to Regulation S-X also update the disclosures for other investments and investments in and advances to affiliates and amend the rules regarding the general form and content of fund financial statements. The compliance date for the amendments to Regulation S-X is August 1, 2017, and has been adopted accordingly.
15
American Beacon Bahl & Gaynor Small Cap Growth FundSM
Notes to Financial Statements
December 31, 2017
Significant Accounting Policies
The following is a summary of significant accounting policies, consistently followed by the Fund in preparation of the financial statements. The Fund is considered an investment company and accordingly, follows the investment company accounting and reporting guidance of the Financial Accounting Standards Board Accounting Standard Codification Topic 946, Financial Services – Investment Companies, a part of Generally Accepted Accounting Principles (“U.S. GAAP”).
Security Transactions and Investment Income
Security transactions are recorded on the trade date of the security purchase or sale. The Fund may purchase securities with delivery or payment to occur at a later date. At the time the Fund enters into a commitment to purchase a security, the transaction is recorded, and the value of the security is reflected in the Net Asset Value (“NAV”). The value of the security may vary with market fluctuations.
Distributions to Shareholders
Distributions, if any, of net investment income are generally paid at least annually and recorded on the ex-dividend date. Distributions, if any, of net realized capital gains are generally paid at least annually and recorded on the ex-dividend date. Dividends to shareholders are determined in accordance with federal income tax regulations, which may differ in amount and character from net investment income and realized gains recognized for purposes of U.S. GAAP. To the extent necessary to fully distribute capital gains, the Fund may designate earnings and profits distributed to shareholders on the redemption of shares.
Commission Recapture
The Fund has established brokerage commission recapture arrangements with certain brokers or dealers. If a Fund’s investment advisor chooses to execute a transaction through a participating broker, the broker rebates a portion of the commission back to the Fund. Any collateral benefit received through participation in the commission recapture program is directed exclusively to the Fund. This amount is reported with the net realized gain in the Fund’s Statement of Operations, if applicable.
Allocation of Income, Trust Expenses, Gains, and Losses
Investment income, realized and unrealized gains and losses from investments of the Fund are allocated daily to each class of shares based upon the relative proportion of net assets of each class to the total net assets of the Fund. Expenses directly charged or attributable to any Fund will be paid from the assets of the Fund. Generally, expenses of the Trust will be allocated among and charged to the assets of the Fund on a basis that the Trust’s Board of Trustees (the “Board”) deems fair and equitable, which may be based on the relative net assets of the Fund or nature of the services performed and relative applicability to the Fund.
Use of Estimates
The preparation of financial statements in conformity with U.S. GAAP requires management to make estimates and assumptions that affect the amounts reported in the financial statements and accompanying notes. Actual results may differ from those estimated.
Other
Under the Trust’s organizational documents, its officers and trustees are indemnified against certain liabilities arising out of the performance of their duties to the Trust. In the normal course of business, the Trust enters into contracts that provide indemnification to the other party or parties against potential costs or liabilities.
16
American Beacon Bahl & Gaynor Small Cap Growth FundSM
Notes to Financial Statements
December 31, 2017
The Trust’s maximum exposure under these arrangements is dependent on claims that may be made in the future and, therefore, cannot be estimated. The Trust has had no prior claims or losses pursuant to any such agreement.
Concentration of Ownership
From time to time, the Fund may have a concentration of one or more accounts constituting a significant percentage of shares outstanding. Investment activities by holders of accounts that represent a significant ownership of more than 5% of the Fund’s outstanding shares could have a material impact on the Fund. As of December 31, 2017, based on management’s evaluation of the shareholder account base, exclusive of omnibus accounts, one account has been identified as representing an affiliated significant ownership of approximately 10% of the Fund’s outstanding shares.
2. Transactions with Affiliates
Management and Investment Sub-Advisory Agreements
The Fund and the Manager are parties to a Management Agreement that obligates the Manager to provide the Fund with investment advisory and administrative services. As compensation for performing the duties under the Management Agreement, the Manager will receive an annualized management fee based on a percentage of the Fund’s average daily net assets that is calculated and accrued daily according to the following schedule:
| | | | |
First $5 billion | | | 0.35 | % |
Next $5 billion | | | 0.325 | % |
Next $10 billion | | | 0.30 | % |
Over $20 billion | | | 0.275 | % |
The Trust, on behalf of the Fund, and the Manager have entered into an Investment Advisory Agreement with Bahl & Gaynor, Inc. (the “Sub-Advisor”) pursuant to which the Fund has agreed to pay an annualized sub-advisory fee that is calculated and accrued daily based on the Fund’s average daily net assets according to the following schedule:
| | | | |
First $500 million | | | 0.525 | % |
Over $500 million | | | 0.50 | % |
The Management and Sub-Advisory Fees paid by the Fund for the year ended December 31, 2017 were as follows:
| | | | | | | | | | | | |
| | | Effective Fee Rate | | | | | | Amount of Fees Paid | |
Management Fees | | | 0.350 | % | | | | | | $ | 113,567 | |
Sub-Advisor Fees | | | 0.525 | % | | | | | | | 169,774 | |
| | | | | | | | | | | | |
Total | | | 0.875 | % | | | | | | $ | 283,341 | |
| | | | | | | | | | | | |
As compensation for services provided by the Manager in connection with securities lending activities conducted by the Fund, the lending Fund pays to the Manager, with respect to cash collateral posted by borrowers, a fee up to 10% of the net monthly interest income (the gross interest income earned by the investment of cash collateral, less the amount paid to borrowers and related expenses) from such activities and, with respect to loan fees paid by borrowers, a fee up to 10% of such loan fees. These fees are included in “Income derived from securities lending” and “Management and investment advisory fees” on the Statement of Operations. During the year ended December 31, 2017, the Manager received securities lending fees of $414 for the securities lending activities of the Fund.
17
American Beacon Bahl & Gaynor Small Cap Growth FundSM
Notes to Financial Statements
December 31, 2017
Distribution Plans
The Fund, except for the A and C Classes of the Fund, has adopted a “defensive” Distribution Plan (the “Plan”) in accordance with Rule 12b-1 under the Act, pursuant to which no separate fees may be charged to the Fund for distribution purposes. However, the Plan authorizes the management fee received by the Manager and the investment advisors hired by the Manager to be used for distribution purposes. Under this Plan, the Fund does not intend to compensate the Manager or any other party, either directly or indirectly, for the distribution of Fund shares.
Separate Distribution Plans (the “Distribution Plans”) have been adopted pursuant to Rule 12b-1 under the Act for the A and C Classes of the Fund. Under the Distribution Plans, as compensation for distribution assistance, the Manager receives an annual fee of 0.25% of the average daily net assets of the A Class and 1.00% of the average daily net assets of the C Class. The fee will be payable without regard to whether the amount of the fee is more or less than the actual expenses incurred in a particular month by the Manager for distribution assistance.
Service Plans
The Manager and the Trust entered into Service Plans that obligate the Manager to oversee additional shareholder servicing of the Y, Investor, A, and C Classes of the Fund. As compensation for performing the duties required under the Service Plans, the Manager receives an annualized fee up to 0.10% of the average daily net assets of the Y Class, up to 0.25% of the average daily net assets of the A and C Classes, and up to 0.375% of the average daily net assets of the Investor Class of the Fund. Effective April 1, 2017, the Fund terminated the Service Plan for the Y Class.
Sub-Transfer Agent Fees
The Manager has entered into agreements, which include servicing agreements, with financial intermediaries that provide recordkeeping, processing, shareholder communications and other services to customers of the intermediaries that hold positions in the Institutional Class of the Fund and has agreed to compensate the intermediaries for providing these services. Effective April 1, 2017, the Fund agreed to compensate the intermediaries for providing services to the Y Class. Intermediaries transact with the Fund primarily through the use of omnibus accounts on behalf of its customers who hold positions in the Fund. Certain services would have been provided by the Fund’s transfer agent and other service providers if the shareholders’ accounts were maintained directly by the Fund’s transfer agent. Accordingly, the Fund, pursuant to the Board’s approval, has agreed to reimburse the Manager for certain non-distribution shareholder services provided by financial intermediaries for the Institutional and Y Classes. The reimbursement amounts (sub-transfer agent fees) paid to the Manager are subject to a fee limit of up to 0.10% of an intermediary’s average net assets in the Institutional and Y Classes on an annual basis. During the year ended December 31, 2017, the sub-transfer agent fees, as reflected in “Transfer agent fees” on the Statement of Operations, were as follows:
| | | | |
Fund | | Sub-Transfer Agent Fees | |
Bahl & Gaynor Small Cap Growth | | $ | 14,504 | |
As of December 31, 2017, the Fund owed the Manager the following reimbursement of sub-transfer agent fees, as reflected in “Transfer agent fees payable” on the Statement of Assets and Liabilities:
| | | | |
Fund | | Reimbursement
Sub-Transfer Agent Fees | |
Bahl & Gaynor Small Cap Growth | | $ | 1,784 | |
During the year ended December 31, 2017 the Manager voluntarily reimbursed sub-transfer agent fees to the Y Class of the Fund in the amount of $118.
18
American Beacon Bahl & Gaynor Small Cap Growth FundSM
Notes to Financial Statements
December 31, 2017
Investments in Affiliated Funds
The Fund may invest in the American Beacon U.S. Government Money Market Select Fund (the “USG Select Fund”). Cash collateral received by the Fund in connection with securities lending may also be invested in the USG Select Fund. The Fund and the USG Select Fund have the same investment advisor and therefore, are considered to be affiliated. The Manager serves as investment advisor to the USG Select Fund and receives management fees and administrative fees totaling 0.10% of the average daily net assets of the USG Select Fund. During the year ended December 31, 2017, the Manager earned fees on the Fund’s direct investments and securities lending collateral investments in the USG Select Fund as shown below:
| | | | | | | | | | | | |
Fund | | Direct Investments in
USG Select Fund | | | Securities Lending
Collateral in USG
Select Fund | | | Total | |
Bahl & Gaynor Small Cap Growth | | $ | 528 | | | $ | 880 | | | $ | 1,408 | |
Interfund Credit Facility
Pursuant to an exemptive order issued by the SEC, the Fund, along with other registered investment companies having management contracts with the Manager, may participate in a credit facility whereby each Fund, under certain conditions, is permitted to lend money directly to and borrow directly from other participating Funds for temporary purposes. The interfund credit facility is advantageous to the Fund because it provides added liquidity, and eliminates the need to maintain higher cash balances to meet redemptions. This situation could arise when shareholder redemptions exceed anticipated volumes and certain funds have insufficient cash on hand to satisfy such redemptions or when sales of securities do not settle as expected, resulting in a cash shortfall for a fund. When a Fund liquidates portfolio securities to meet redemption requests, they often do not receive payment in settlement for up to three days (or longer for certain foreign transactions). Redemption requests normally are satisfied on the next business day. The credit facility provides a source of immediate, short-term liquidity pending settlement of the sale of portfolio securities. The credit facility is administered by a credit facility team consisting of professionals from the Manager’s asset management, compliance, and accounting areas who report the activities of the credit facility to the Board. During the year ended December 31, 2017, the Fund borrowed on average $520,665 for 12 days at an average interest rate of 1.70% with interest charges of $278. This amount is included in “Other expenses” on the Statement of Operations.
Expense Reimbursement Plan
The Manager contractually agreed to reduce fees and/or reimburse expenses for the classes of the Fund to the extent that total operating expenses exceed the Fund’s expense cap. During the year ended December 31, 2017, the Manager waived and/or reimbursed expenses as follows:
| | | | | | | | | | | | | | | | | | |
| | | | | Expense Cap | | | | | | | | | Expiration of
Reimbursed
Expenses | |
Fund | | Class | | 1/1/2017 -
12/31/2017 | | | Reimbursed
Expenses | | | (Recouped)
Expenses | | |
Bahl & Gaynor Small Cap Growth | | Institutional | | | 0.98 | % | | $ | 39,478 | | | $ | - | | | | 2020 | |
Bahl & Gaynor Small Cap Growth | | Y | | | 1.08 | % | | | 39,941 | | | | - | | | | 2020 | |
Bahl & Gaynor Small Cap Growth | | Investor | | | 1.36 | % | | | 7,278 | | | | - | | | | 2020 | |
Bahl & Gaynor Small Cap Growth | | A | | | 1.38 | % | | | 10,142 | | | | - | | | | 2020 | |
Bahl & Gaynor Small Cap Growth | | C | | | 2.13 | % | | | 1,590 | | | | - | | | | 2020 | |
Of these amounts, $16,194 was disclosed as a receivable from the Manager on the Statement of Assets and Liabilities at December 31, 2017.
The Fund has adopted an Expense Reimbursement Plan whereby the Manager may seek repayment of such fee reductions and expense reimbursements. Under the policy, the Manager can be reimbursed by the Fund for any contractual or voluntary fee reductions or expense reimbursements if reimbursement to the Manager (a) occurs
19
American Beacon Bahl & Gaynor Small Cap Growth FundSM
Notes to Financial Statements
December 31, 2017
within three years after the Manager’s own waiver or reimbursement and (b) does not cause the Fund’s annual operating expenses to exceed the lesser of the contractual percentage limit in effect at the time of the waiver/reimbursement or time of recoupment. The reimbursed expenses listed above will expire in 2020. The Fund did not record a liability for potential reimbursement, due to the current assessment that a reimbursement is unlikely. The carryover of excess expenses potentially reimbursable to the Manager, but not recorded as a liability are as follows:
| | | | | | | | | | | | | | | | |
Fund | | Recouped
Expenses | | | Excess Expense
Carryover | | | Expired Expense
Carryover | | | Expiration of
Reimbursed
Expenses | |
Bahl & Gaynor Small Cap Growth | | $ | – | | | $ | 123,829 | | | $ | – | | | | 2018 | |
Bahl & Gaynor Small Cap Growth | | | – | | | | 99,554 | | | | – | | | | 2019 | |
Sales Commissions
The Fund’s distributor, Foreside Fund Services, LLC (“Foreside”), may receive a portion of A Class sales charges from broker dealers and it may be used to offset distribution related expenses. During the year ended December 31, 2017, Foreside collected $4,536 for the Fund from the sale of Class A Shares.
A CDSC of 0.50% will be deducted with respect to Class A Shares on certain purchases of $1,000,000 or more that are redeemed in whole or part within 18 months of purchase, unless waived as discussed in the Fund’s Prospectus. Any applicable CDSC will be 0.50% of the lesser of the original purchase price or the value of the redemption of the Class A Shares redeemed. During the year ended December 31, 2017, there were no CDSC fees collected for Class A Shares of the Fund.
A CDSC of 1.00% will be deducted with respect to Class C Shares redeemed within 12 months of purchase, unless waived as discussed in the Fund’s Prospectus. Any applicable CDSC will be 1.00% of the lesser of the original purchase price or the value of the redemption of the Class C Shares redeemed. During the year ended December 31, 2017, CDSC fees of $174 were collected for Class C Shares of the Fund.
Trustee Fees and Expenses
As compensation for their service to the Trust, the American Beacon Select Funds and the American Beacon Institutional Funds Trust, each Trustee receives an annual retainer of $120,000, plus $10,000 for each Board meeting attended in person or via teleconference, $2,500 for attendance by Committee members at meetings of the Audit Committee and the Investment Committee, and $1,500 for attendance by Committee members at meetings of the Nominating and Governance Committee, plus reimbursement of reasonable expenses incurred in attending Board meetings, Committee meetings, and relevant educational seminars. The Trustees also may be compensated for attendance at special Board and/or Committee meetings from time to time. The Board Chairman receives an additional annual retainer of $50,000 as well as a single $10,000 fee each quarter for his attendance at the committee meetings. The Chairpersons of the Audit Committee and the Investment Committee each receive an additional annual retainer of $25,000 and the Chairman of the Nominating and Governance Committee receives an additional annual retainer of $10,000. These expenses are allocated on a prorated basis to each Fund of the Trusts according to its respective net assets.
3. Security Valuation and Fair Value Measurements
Investments are valued at the close of the New York Stock Exchange (the “Exchange”), normally at 4:00 p.m. Eastern Time, each day that the Exchange is open for business. Equity securities, including exchange-traded funds (“ETFs”) for which market quotations are available are valued at the last sale price or official closing price (closing bid price or last evaluated quote if no sale has occurred) on the primary market or exchange on which they trade.
20
American Beacon Bahl & Gaynor Small Cap Growth FundSM
Notes to Financial Statements
December 31, 2017
Investments in open-end mutual funds are valued at the closing NAV per share of the mutual fund on the day of valuation.
Securities for which the market prices are not readily available or are not reflective of the fair value of the security, as determined by the Manager, will be priced at fair value following procedures approved by the Board.
Futures contracts are valued based upon their quoted daily settlement prices. Upon entering into a futures contract, the Fund is required to deposit with their futures broker, an amount of cash or U.S. Government and Agency Obligations in accordance with the initial margin requirements of the broker or exchange. Futures contracts are marked-to-market daily and an appropriate payable or receivable for the change in value (“variation margin”) is recorded by the Fund. Gains or losses are recognized, but not considered realized until the contracts expire or are closed. Futures contracts involve, to varying degrees, risk of loss in excess of the variation margin disclosed on the Statement of Assets and Liabilities.
Other investments for which the above valuation procedures are inappropriate or are deemed not to reflect fair value, are stated at fair value as determined in good faith by the Manager’s Valuation Committee, pursuant to procedures established by the Board.
Valuation Inputs
Various inputs may be used to determine the fair value of the Fund’s investments. These inputs are summarized in three broad levels for financial statement purposes. The inputs or methodologies used to value securities are not necessarily an indication of the risk associated with investing in those securities.
| | | | |
| Level 1 | | - | | Quoted prices in active markets for identical securities. |
| | |
| Level 2 | | - | | Prices determined using other significant observable inputs. These may include quoted prices for similar securities, interest rates, prepayment speeds, credit risk, and others. |
| | |
| Level 3 | | - | | Prices determined using other significant unobservable inputs. Unobservable inputs reflect the Fund’s own assumptions about the factors market participants would use in pricing an investment. |
Level 1 and Level 2 trading assets and trading liabilities, at fair value
Common stocks, preferred securities, ETFs, and financial derivative instruments, such as futures contracts that are traded on a national securities exchange, are stated at the last reported sale or settlement price on the day of valuation. To the extent these securities are actively traded and valuation adjustments are not applied, they are categorized as Level 1 of the fair value hierarchy. Preferred securities and other equities traded on inactive markets or valued by reference to similar instruments are generally categorized as Level 2 of the fair value hierarchy.
Investments in registered open-end investment management companies will be valued based upon the NAVs of such investments and are categorized as Level 1 of the fair value hierarchy.
4. Securities and Other Investments
Common Stock
Common stock generally takes the form of shares in a corporation which represent an ownership interest. It ranks below preferred stock and debt securities in claims for dividends and for assets of the company in a liquidation or bankruptcy. The value of a company’s common stock may fall as a result of factors directly relating to that company, such as decisions made by its management or decreased demand for the company’s products or services. A stock’s value may also decline because of factors affecting not just the company, but also companies in
21
American Beacon Bahl & Gaynor Small Cap Growth FundSM
Notes to Financial Statements
December 31, 2017
the same industry or sector. The price of a company’s stock may also be affected by changes in financial markets that are relatively unrelated to the company, such as changes in interest rates, currency exchange rates or industry regulation. Companies that elect to pay dividends on their common stock generally only do so after they invest in their own business and make required payments to bondholders and on other debt and preferred stock. Therefore, the value of a company’s common stock will usually be more volatile than its bonds, other debt and preferred stock. Common stock may be exchange-traded or over-the-counter (“OTC”). OTC stock may be less liquid than exchange-traded stock.
Other Investment Company Securities and Other Exchange-Traded Products
The Fund may invest in shares of other investment companies, including open-end funds, closed-end funds, business development companies, ETFs, unit investment trusts, and other investment companies of the Trust. The Fund may invest in investment company securities advised by the Manager or a sub-advisor. Investments in the securities of other investment companies may involve duplication of advisory fees and certain other expenses. By investing in another investment company, the Fund becomes a shareholder of that investment company. As a result, the Fund’s shareholders indirectly will bear the Fund’s proportionate share of the fees and expenses paid by shareholders of the other investment company, in addition to the fees and expenses the Fund’s shareholders directly bear in connection with the Fund’s own operations. These other fees and expenses are reflected as Acquired Fund Fees and Expenses and are included in the Fees and Expenses Table for the Fund in its Prospectus, if applicable. Investments in other investment companies may involve the payment of substantial premiums above the value of such issuer’s portfolio securities.
Real Estate Investment Trusts
The Fund may own shares of real estate investment trusts (“REITs”) which report information on the source of their distributions annually. The Fund re-characterizes distributions received from REIT investments based on information provided by the REITs into the following categories: ordinary income, long-term capital gains, and return of capital. If information is not available on a timely basis from the REITs, the re-characterization will be estimated based on available information, which may include the previous year allocation. If new or additional information becomes available from the REITs at a later date, a re-characterization will be made the following year.
5. Financial Derivative Instruments
The Fund may utilize derivative instruments to gain market exposure on cash balances or reduce market exposure in anticipation of liquidity needs. When considering the Fund’s use of derivatives, it is important to note that the Fund does not use derivatives for the purpose of creating financial leverage.
Futures Contracts
Futures contracts are contracts to buy or sell a standard quantity of securities at a specified price on a future date. The Fund may enter into financial futures contracts as a method for keeping assets readily convertible to cash if needed to meet shareholder redemptions or for other needs while maintaining exposure to the stock or bond market, as applicable. The primary risks associated with the use of futures contracts are the possibility of illiquid markets or imperfect correlation between the values of the contracts and the underlying securities or that the counterparty will fail to perform its obligations.
Upon entering into a futures contract, the Fund is required to set aside or deposit with a broker an amount, termed the initial margin, which typically represents a portion of the face value of the futures contract. The Fund usually reflects this amount on the Schedule of Investments as a U.S. Treasury Bill held as collateral for futures contracts or as cash deposited with broker on the Statement of Assets and Liabilities. Payments to and from the broker, known as variation margin, are required to be made on a daily basis as the price of the futures contract
22
American Beacon Bahl & Gaynor Small Cap Growth FundSM
Notes to Financial Statements
December 31, 2017
fluctuates. Changes in initial settlement values are accounted for as unrealized appreciation (depreciation) until the contracts are terminated, at which time realized gains and losses are recognized. Futures contracts are valued at the most recent settlement price established each day by the exchange on which they are traded.
During the year ended December 31, 2017, the Fund entered into future contracts primarily for exposing cash to markets.
The Fund’s average futures contracts outstanding fluctuate throughout the operating year as required to meet strategic requirements. The following table illustrates the average quarterly volume of futures contracts. For purpose of this disclosure, volume is measured by contracts outstanding at each quarter end.
| | | | |
Average Futures Contracts Outstanding | |
Fund | | Year Ended December 31, 2017 | |
Bahl & Gaynor Small Cap Growth | | | 6 | |
The following is a summary of the fair valuations of the Fund’s derivative instruments categorized by risk exposure(1):
| | | | | | | | | | | | | | | | | | | | | | | | | | | | | | | | | | | | | | | | | | | | | | | | | | | | | | | |
| Fair values of financial instruments on the Statement of Assets and Liabilities as of December 31, 2017: | |
| | | | | | | | | | | |
Liabilities: | | Credit
contracts | | | | Foreign exchange
contracts | | | | Commodity
contracts | | | | Interest rate
contracts | | | | Equity
contracts | | | | Total |
| Payable for variation margin from open futures contracts(2) | | | $ | - | | | | | | | | | $ | - | | | | | | | | | $ | - | | | | | | | | | $ | - | | | | | | | | | $ | (4,677 | ) | | | | | | | | $ | (4,677 | ) |
| | | | | | | | | | | | | | | | | | | | | | | | | | | | | | | | | | | | | | | | | | | | | | | | | | | | | | | |
| The effect of financial derivative instruments on the Statement of Operations as of December 31, 2017: | |
|
Derivatives not accounted for as hedging instruments |
| | | | | | | | | | | |
Realized gain (loss) from derivatives
recognized as a result of operations: | | Credit
contracts | | | | Foreign exchange
contracts | | | | Commodity
contracts | | | | Interest rate
contracts | | | | Equity
contracts | | | | Total |
| Futures contracts | | | $ | - | | | | | | | | | $ | - | | | | | | | | | $ | - | | | | | | | | | $ | - | | | | | | | | | $ | 19,435 | | | | | | | | | $ | 19,435 | |
| | | | | | | | | | | |
Net change in unrealized appreciation
(depreciation) of derivatives
recognized as a result from operations: | | Credit
contracts | | | | Foreign exchange
contracts | | | | Commodity
contracts | | | | Interest rate
contracts | | | | Equity
contracts | | | | Total |
| Futures contracts | | | $ | - | | | | | | | | | $ | - | | | | | | | | | $ | - | | | | | | | | | $ | - | | | | | | | | | $ | (1,892) | | | | | | | | | $ | (1,892 | ) |
(1) See Note 3 in the Notes to Financial Statements for additional information.
(2) Includes cumulative appreciation (depreciation) of futures contracts as reported in the Fund’s Schedule of Investments footnotes. Only current day’s variation margin is reported within the Statement of Assets and Liabilities.
6. Principal Risks
Investing in the Fund may involve certain risks including, but not limited to, those described below.
Dividend Risk
An issuer of stock held by the Fund may choose not to declare a dividend or the dividend rate might not remain at current levels. Dividend paying stocks might not experience the same level of earnings growth or capital appreciation as non-dividend paying stocks.
Equity Investment Risk
Equity securities are subject to market risk. The Fund’s investments in equity securities may include common stocks, preferred stocks, securities convertible into or exchangeable for common stocks, REITs, depository receipts, and U.S. dollar-denominated foreign stocks traded on U.S. exchanges. Such investments may expose the
23
American Beacon Bahl & Gaynor Small Cap Growth FundSM
Notes to Financial Statements
December 31, 2017
Fund to additional risk. The value of a company’s common stock may fall as a result of factors affecting the company, companies in the same industry or sector, or the financial markets overall. Common stock generally is subordinate to preferred stock upon the liquidation or bankruptcy of the issuing company. Preferred stocks and convertible securities are sensitive to movements in interest rates. Preferred stocks may be less liquid than common stocks and, unlike common stocks, participation in the growth of an issuer may be limited. Distributions on preferred stocks generally are payable at the discretion of an issuer and after required payments to bond holders. Convertible securities are subject to the risk that the credit standing of the issuer may have an effect on the convertible securities’ investment value. Investments in REITs are subject to the risks associated with investing in the real estate industry such as adverse developments affecting the real estate industry and real property values. Depository receipts and U.S. dollar-denominated foreign stocks traded on U.S. exchanges are subject to certain of the risks associated with investing directly in foreign securities, including, but not limited to, currency fluctuations and political and financial instability in the home country of a particular depository receipt or foreign stock.
Foreign Investing Risk
Non-U.S. investments carry potential risks not associated with U.S. investments. Such risks include, but are not limited to: (1) currency exchange rate fluctuations, (2) political and financial instability, (3) less liquidity and greater volatility, (4) lack of uniform accounting, auditing and financial reporting standards, (5) increased price volatility, (6) less government regulation and supervision of foreign stock exchanges, brokers and listed companies, and (7) delays in transaction settlement in some foreign markets.
Futures Contracts Risk
Futures contracts are derivative instruments where one party pays a fixed price for an agreed amount of securities or other underlying assets at an agreed date. The use of such derivative instruments may expose the Fund to additional risks that it would not be subject to if it invested directly in the securities underlying those derivatives. Futures contracts may experience potentially dramatic price changes (losses) and imperfect correlation between the price of the contract and the underlying security or index, which will increase the volatility of the Fund and may involve a small investment of cash (the amount of initial and variation margin) relative to the magnitude of the risk assumed (the potential increase or decrease in the price of the futures contract).
Investment Risk
An investment in the Fund is not a deposit with a bank and is not insured or guaranteed by the Federal Deposit Insurance Corporation or any other government agency. When you sell your shares of the Fund, they could be worth less than what you paid for them. Therefore, you may lose money by investing in the Fund.
Market Risk
Since the financial crisis that started in 2008, the U.S. and many foreign economies continue to experience its after-effects, which have resulted, and may continue to result, in an unusually high degree of volatility in the financial markets, both domestic and foreign. In addition, global economies and financial markets are becoming increasingly interconnected, which increases the possibilities that conditions in one country or region might adversely impact issuers in a different country or region. The severity or duration of adverse economic conditions may also be affected by policy changes made by governments or quasi-governmental organizations.
In addition, political events within the U.S. and abroad may affect investor and consumer confidence and may adversely impact financial markets and the broader economy, perhaps suddenly and to a significant degree. High public debt in the U.S. and other countries creates ongoing systemic and market risks and policymaking uncertainty. Because the impact on the markets has been widespread, it may be difficult to identify both risks and
24
American Beacon Bahl & Gaynor Small Cap Growth FundSM
Notes to Financial Statements
December 31, 2017
opportunities using past models of the interplay of market forces, or to predict the duration of these market conditions. Interest rates have been unusually low in recent years in the U.S. and abroad. Because there is little precedent for this situation, it is difficult to predict the impact of a rate increase on various markets. In addition, there is a risk that the prices of goods and services in the U.S. and many foreign economies may decline over time, known as deflation (the opposite of inflation). Deflation may have an adverse effect on stock prices and creditworthiness and may make defaults on debt more likely.
Other Investment Companies Risk
The Fund may invest in shares of other registered investment companies, including ETFs and money market funds. To the extent that the Fund invest in shares of other registered investment companies, the Fund will indirectly bear the fees and expenses charged by the underlying funds in addition to the Fund’s direct fees and expenses and will be subject to the risks associated with investments in those funds.
Securities Lending Risk
To the extent the Fund lends its securities, it may be subject to the following risks; i) borrowers of the Fund’s securities typically provide collateral in the form of cash that is reinvested in securities, ii) the securities in which the collateral is invested may not perform sufficiently to cover the return collateral payments owed to borrowers, iii) delays may occur in the recovery of securities from borrowers, which could interfere with the Fund’s ability to vote proxies or to settle transactions, and iv) there is the risk of possible loss of rights in the collateral should the borrower fail financially.
Offsetting Assets and Liabilities
The Fund is a party to enforceable master netting agreements between brokers and counterparties which provide for the right to offset under certain circumstances. The Fund employs multiple money managers and counterparties and has elected not to offset qualifying financial and derivative instruments on the Statement of Assets and Liabilities, as such all financial and derivative instruments are presented on a gross basis. The impacts of netting arrangements that provide the right to offset are detailed below. The net amount represents the net receivable or payable that would be due from or to the counterparty in the event of default. Exposure from borrowings and other financing agreements such as repurchase agreements can only be netted across transactions governed by the same Master Agreement with the same legal entity. All amounts reported below represent the balance as of the report date, December 31, 2017.
| | | | | | | | | | | | |
| Offsetting of Financial and Derivative Assets as of December 31, 2017: | |
| | | Assets | | | | | | Liabilities | |
| Futures Contracts | | $ | - | | | | | | | $ | 4,677 | |
| | | | | | | | | | | | |
| Total derivative assets and liabilities in the Statement of Assets and Liabilities | | $ | - | | | | | | | $ | 4,677 | |
| | | | | | | | | | | | |
| Derivatives not subject to a Master Netting Agreement or similar agreement (“MNA”) | | $ | - | | | | | | | $ | (4,677 | ) |
| | | | | | | | | | | | |
| | | | | | | | | | | | | | | | | | | | | | | | | | | | | | | | | | | | |
| | | Remaining Contractual Maturity of the Agreements
As of December 31, 2017 | |
| | | Overnight and
Continuous | | | | | | <30 days | | | | | | Between
30 & 90 days | | | | | | >90 days | | | | | | Total | |
| Securities Lending Transactions | | | | | | | | | | | | | | | | | | | | | | | | | | | | | | | | | | | | |
| Common Stocks | | $ | 1,288,716 | | | | | | | $ | - | | | | | | | $ | - | | | | | | | $ | - | | | | | | | $ | 1,288,716 | |
| | | | | | | | | | | | | | | | | | | | | | | | | | | | | | | | | | | | |
| Total Borrowings | | $ | 1,288,716 | | | | | | | $ | - | | | | | | | $ | - | | | | | | | $ | - | | | | | | | $ | 1,288,716 | |
| | | | | | | | | | | | | | | | | | | | | | | | | | | | | | | | | | | | |
| Gross amount of recognized liabilities for securities lending transactions | | | | | | | $ | 1,288,716 | |
| | | | | | | | | | | | | | | | | | | | | | | | | | | | | | | | | | | | |
25
American Beacon Bahl & Gaynor Small Cap Growth FundSM
Notes to Financial Statements
December 31, 2017
7. Federal Income and Excise Taxes
It is the policy of the Fund to qualify as a regulated investment company (“RIC”), by complying with all applicable provisions of Subchapter M of the Internal Revenue Code, as amended, and to make distributions of taxable income sufficient to relieve it from substantially all federal income and excise taxes. For federal income tax purposes, the Fund is treated as a single entity for the purpose of determining such qualification.
The Fund does not have any unrecorded tax liabilities in the accompanying financial statements. Each of the tax years in the four year period ended December 31, 2017 remain subject to examination by the Internal Revenue Service. If applicable, the Fund recognizes interest accrued related to unrecognized tax benefits in interest expense and penalties in “Other expenses” on the Statement of Operations.
The Fund may be subject to taxes imposed by countries in which it invests. Such taxes are generally based on returns of income earned or gains realized or repatriated. Taxes are accrued and applied to net investment income, net realized capital gains and net unrealized appreciation (depreciation), as applicable, as the income is earned or capital gains are recorded.
Dividends are categorized in accordance with income tax regulations which may treat certain transactions differently than U.S. GAAP. Accordingly, the character of distributions and composition of net assets for tax purposes may differ from those reflected in the accompanying financial statements.
The tax character of distributions paid were as follows:
| | | | | | | | | | | | |
| | | Bahl & Gaynor Small Cap Growth Fund | |
| | | Year Ended
December 31, 2017 | | | | | | Year Ended
December 31, 2016 | |
Distributions paid from: | |
Ordinary income* | |
Institutional Class | | $ | 171,158 | | | | | | | $ | 18,188 | |
Y Class | | | 159,794 | | | | | | | | 16,392 | |
Investors Class | | | 42,569 | | | | | | | | 8,679 | |
A Class | | | 38,107 | | | | | | | | 5,691 | |
C Class | | | 3,914 | | | | | | | | 431 | |
Long-term capital gains | |
Institutional Class | | | 496,416 | | | | | | | | 674 | |
Y Class | | | 463,454 | | | | | | | | 569 | |
Investors Class | | | 131,689 | | | | | | | | 104 | |
A Class | | | 120,183 | | | | | | | | 121 | |
C Class | | | 16,319 | | | | | | | | 66 | |
| | | | | | | | | | | | |
Total distributions paid | | $ | 1,643,603 | | | | | | | $ | 50,915 | |
| | | | | | | | | | | | |
*For tax purposes, short-term capital gains are considered ordinary income distributions.
As of December 31, 2017 the components of distributable earnings (deficits) on a tax basis were as follows:
| | | | | | | | | | | | | | | | | | | | | | | | | | | | |
Fund | | Tax Cost | | | | | | Unrealized
Appreciation | | | | | | Unrealized
(Depreciation) | | | | | | Net Unrealized
Appreciation
(Depreciation) | |
| Bahl & Gaynor Small Cap Growth | | $ | 36,506,536 | | | | | | | $ | 5,711,007 | | | | | | | $ | (525,986 | ) | | | | | | $ | 5,185,021 | |
| | | | | | | | | | | | | | | | | | | | | | | | | | | | | | | | | | | | | | | | | | | | |
Fund | | Net Unrealized
Appreciation
(Depreciation) | | | | | | Undistributed
Ordinary Income | | | | | | Undistributed
Long-Term Capital
Gains | | | | | | Accumulated
Capital and Other
(Losses) | | | | | | Other Temporary
Differences | | | | �� | | Distributable
Earnings | |
| Bahl & Gaynor Small Cap Growth | | $ | 5,185,021 | | | | | | | $ | 40 | | | | | | | $ | 291,312 | | | | | | | $ | (50,439 | ) | | | | | | $ | 2 | | | | | | | $ | 5,425,936 | |
26
American Beacon Bahl & Gaynor Small Cap Growth FundSM
Notes to Financial Statements
December 31, 2017
Financial reporting records are adjusted for permanent book/tax differences to reflect tax character. Financial records are not adjusted for temporary differences. The temporary differences between financial reporting and tax-basis reporting of unrealized appreciation (depreciation) are attributable primarily to the tax deferral of losses from wash sales, the tax deferral of post-October capital losses and the realization for tax purposes of unrealized gains (losses) on certain derivative instruments.
Due to inherent differences in the recognition of income, expenses, and realized gains (losses) under U.S. GAAP and federal income tax regulations, permanent differences between book and tax reporting have been identified and appropriately reclassified on the Statement of Assets and Liabilities.
Accordingly, the following amounts represent current year permanent differences derived from dividend re-designations as of December 31, 2017:
| | | | | | | | | | | | | | | | | | | | | | | | | | | | |
Fund | | Paid-In-Capital | | | | | | Undistributed
(Overdistribution of)
Net Investment
Income | | | | | | Accumulated Net
Realized Gain (Loss) | | | | | | Net Unrealized
Appreciation
(Depreciation) | |
| Bahl & Gaynor Small Cap Growth | | $ | – | | | | | | | $ | (103 | ) | | | | | | $ | 103 | | | | | | | $ | – | |
Under the Regulated Investment Company Modernization Act of 2010 (“RIC MOD”), net capital losses recognized by the Fund in taxable years beginning after December 22, 2010 are carried forward indefinitely and retain their character as short-term and/or long-term losses.
For the year ended December 31, 2017, the Fund did not have any capital loss carryforwards.
The Fund is permitted for tax purposes to defer into its next fiscal year qualified late year losses. Qualified late year capital losses are any capital losses incurred after October 31 through the Fund’s fiscal year end, December 31, 2017. Qualified late year ordinary losses are specified losses generally incurred after October 31 through the Fund’s fiscal year end, December 31, 2017. For the period ended December 31, 2017, Bahl & Gaynor Small Cap Growth Fund deferred $50,439 of short-term capital losses to January 1, 2018.
8. Investment Transactions
The aggregate cost of purchases and proceeds from sales of investments, other than short-term obligations, for the year ended December 31, 2017 were as follows:
| | | | | | | | | | | | |
Fund | | Purchases (non-U.S.
Government
Securities) | | | | | | Sales (non-U.S.
Government
Securities) | |
| Bahl & Gaynor Small Cap Growth | | $ | 27,575,453 | | | | | | | $ | 12,283,114 | |
A summary of the Fund’s transactions in the USG Select Fund for the year ended December 31, 2017 were as follows:
| | | | | | | | | | | | | | | | | | | | | | | | | | | | | | | | | | | | | | | | | | |
Fund | | Type of
Transaction | | | | | December 31,
2016
Share/Fair
Value | | | | | | Purchases | | | | | | Sales | | | | | | December 31,
2017
Share/Fair
Value | | | | | | Dividend
Income | |
| Bahl & Gaynor Small Cap Growth | | Direct | | | | | | $ | 628,203 | | | | | | | $ | 27,966,562 | | | | | | | $ | 27,948,133 | | | | | | | $ | 646,632 | | | | | | | $ | 4,130 | |
| Bahl & Gaynor Small Cap Growth | | Securities Lending | | | | | | | - | | | | | | | | 17,204,614 | | | | | | | | 15,915,898 | | | | | | | | 1,288,716 | | | | | | | | N/A | |
9. Securities Lending
The Fund may lend its securities to qualified financial institutions, such as certain broker-dealers, to earn additional income. The borrowers are required to secure their loans continuously with collateral in an amount at
27
American Beacon Bahl & Gaynor Small Cap Growth FundSM
Notes to Financial Statements
December 31, 2017
least equal to the fair value of the securities loaned, initially in an amount at least equal to 102% of the fair value of domestic securities loaned and 105% of the fair value of international securities loaned. Collateral is monitored and marked-to-market daily. Daily mark-to-market amounts are required to be paid to the borrower or received from the borrower by the end of the following business day. This one day settlement for mark-to-market amounts may result in the collateral being temporarily less than the value of the securities on loan or temporarily more than the required minimum collateral.
To the extent that a loan is collateralized by cash, such cash collateral shall be invested by the securities lending agent (the “Agent”) in money market mutual funds and other short-term investments, provided the investments meet certain quality and diversification requirements. Securities purchased with cash collateral proceeds are listed in the Fund’s Schedule of Investments and the collateral is shown on the Statement of Assets and Liabilities as a payable.
Securities lending income is generated from the demand premium (if any) paid by the borrower to borrow a specific security and from the return on investment of cash collateral, reduced by negotiated rebate fees paid to the borrower and transaction costs. To the extent that a loan is secured by non-cash collateral, securities lending income is generated as a demand premium reduced by transaction costs. The Fund, the Agent, and the Manager retained 80%, 10%, and 10%, respectively, of the income generated from securities lending.
While securities are on loan, the Fund continues to receive certain income associated with that security and any gain or loss in the market price that may occur during the term of the loan. In the case of domestic equities, the value of any dividend is received in the form of a substitute payment approximately equal to the dividend. In the case of foreign securities, a negotiated amount is received that is less than the actual dividend, but higher than the dividend amount minus the foreign tax that the Fund would be subject to on the dividend.
Securities lending transactions pose certain risks to the Fund, including that the borrower may not provide additional collateral when required or return the securities when due, that the value of the short-term investments will be less than the amount of cash collateral required to be returned to the borrower, that non-cash collateral may be subject to legal constraints in the event of a borrower bankruptcy, and that the cash collateral investments could become illiquid and unable to be used to return collateral to the borrower. The Fund could also experience delays and costs in gaining access to the collateral. The Fund bears the risk of any deficiency in the amount of the cash collateral available for return to the borrower and any action which impairs its ability to liquidate non-cash collateral to satisfy a borrower default.
As of December 31, 2017, the value of outstanding securities on loan and the value of collateral were as follows:
| | | | | | | | | | | | | | | | | | | | | | | | | | | | |
Fund | | Market Value of
Securities on Loan | | | | | | Cash Collateral
Received | | | | | | Non-Cash Collateral
Received | | | | | | Total Collateral
Received | |
| Bahl & Gaynor Small Cap Growth | | $ | 1,261,238 | | | | | | | $ | 1,288,716 | | | | | | | $ | - | | | | | | | $ | 1,288,716 | |
Cash collateral is listed on the Fund’s Schedule of Investments and is shown on the Statement of Assets and Liabilities. Income earned on these investments is included in “Income derived from securities lending” on the Statement of Operations.
Non-cash collateral received by the Fund may not be sold or re-pledged except to satisfy a borrower default. Therefore, non-cash collateral is not included on the Fund’s Schedule of Investments or Statement of Assets and Liabilities.
10. Borrowing Arrangements
Effective November 16, 2017, the Fund, along with certain other funds managed by the Manager (“Participating Funds”), entered into a committed revolving line of credit (the “Committed Line”) agreement with
28
American Beacon Bahl & Gaynor Small Cap Growth FundSM
Notes to Financial Statements
December 31, 2017
State Street Bank and Trust Company (the “Bank”) to be used to facilitate portfolio liquidity. The maximum borrowing amount under the Committed Line is $50 million with interest at a rate equal to the higher of (a) one-month London Inter-Bank Offered Rate (“LIBOR”) plus 1.25% per annum or (b) the Federal Funds rate plus 1.25% per annum on amounts borrowed. Each of the Participating Funds will pay a commitment fee at a rate of 0.25% per annum on the unused portion of the Committed Line amount. The Committed Line expires November 15, 2018 unless extended by the Bank or terminated by the Participating Funds in accordance with the agreement.
Effective November 16, 2017, the Fund, along with certain other Participating Funds managed by the Manager, entered into an uncommitted discretionary demand revolving line of credit (the “Uncommitted Line”) agreement with the Bank to be used to facilitate portfolio liquidity. The maximum borrowing amount under the Uncommitted Line is $50 million with interest at a rate equal to the higher of (a) one-month LIBOR plus 1.25% per annum or (b) the Federal Funds rate. The Uncommitted Line expires November 15, 2018 unless extended by the Bank or terminated by the Participating Funds in accordance with the agreement.
The Participating Funds paid administration, legal and arrangement fees, which are recognized as a component of “Other expenses” on the Statement of Operations, along with commitment fees, that have been allocated among the Participating Funds based on average daily net assets. During the year ended December 31, 2017, the Fund did not utilize this facility.
11. Capital Share Transactions
The tables below summarize the activity in capital shares for each Class of the Fund:
| | | | | | | | | | | | | | | | | | | | | | | | | | | | |
| | | Institutional Class | |
| | | Year Ended December 31, | |
| | | 2017 | | | | | | 2016 | |
Bahl & Gaynor Small Cap Growth Fund | | Shares | | | | | | Amount | | | | | | Shares | | | | | | Amount | |
| Shares sold | | | 587,631 | | | | | | | $ | 7,935,906 | | | | | | | | 279,042 | | | | | | | $ | 3,182,952 | |
| Reinvestment of dividends | | | 47,615 | | | | | | | | 667,574 | | | | | | | | 1,466 | | | | | | | | 18,862 | |
| Shares redeemed | | | (43,420 | ) | | | | | | | (610,922 | ) | | | | | | | (5,890 | ) | | | | | | | (66,509 | ) |
| | | | | | | | | | | | | | | | | | | | | | | | | | | | |
| Net increase in shares outstanding | | | 591,826 | | | | | | | $ | 7,992,558 | | | | | | | | 274,618 | | | | | | | $ | 3,135,305 | |
| | | | | | | | | | | | | | | | | | | | | | | | | | | | |
| | | | |
| | | Y Class | |
| | | Year Ended December 31, | |
| | | 2017 | | | | | | 2016 | |
Bahl & Gaynor Small Cap Growth Fund | | Shares | | | | | | Amount | | | | | | Shares | | | | | | Amount | |
| Shares sold | | | 718,311 | | | | | | | $ | 9,452,536 | | | | | | | | 290,672 | | | | | | | $ | 3,267,497 | |
| Reinvestment of dividends | | | 41,376 | | | | | | | | 578,020 | | | | | | | | 1,225 | | | | | | | | 15,718 | |
| Shares redeemed | | | (209,551 | ) | | | | | | | (2,914,447 | ) | | | | | | | (20,725 | ) | | | | | | | (219,124 | ) |
| | | | | | | | | | | | | | | | | | | | | | | | | | | | |
| Net increase in shares outstanding | | | 550,136 | | | | | | | $ | 7,116,109 | | | | | | | | 271,172 | | | | | | | $ | 3,064,091 | |
| | | | | | | | | | | | | | | | | | | | | | | | | | | | |
| | | | |
| | | Investor Class | |
| | | Year Ended December 31, | |
| | | 2017 | | | | | | 2016 | |
Bahl & Gaynor Small Cap Growth Fund | | Shares | | | | | | Amount | | | | | | Shares | | | | | | Amount | |
| Shares sold | | | 270,909 | | | | | | | $ | 3,653,794 | | | | | | | | 251,437 | | | | | | | $ | 2,931,223 | |
| Reinvestment of dividends | | | 12,591 | | | | | | | | 174,257 | | | | | | | | 686 | | | | | | | | 8,739 | |
| Shares redeemed | | | (251,801 | ) | | | | | | | (3,338,876 | ) | | | | | | | (17,200 | ) | | | | | | | (202,363 | ) |
| | | | | | | | | | | | | | | | | | | | | | | | | | | | |
| Net increase in shares outstanding | | | 31,699 | | | | | | | $ | 489,175 | | | | | | | | 234,923 | | | | | | | $ | 2,737,599 | |
| | | | | | | | | | | | | | | | | | | | | | | | | | | | |
| | | | |
| | | A Class | |
| | | Year Ended December 31, | |
| | | 2017 | | | | | | 2016 | |
Bahl & Gaynor Small Cap Growth Fund | | Shares | | | | | | Amount | | | | | | Shares | | | | | | Amount | |
| Shares sold | | | 134,265 | | | | | | | $ | 1,773,476 | | | | | | | | 169,878 | | | | | | | $ | 1,935,789 | |
| Reinvestment of dividends | | | 11,445 | | | | | | | | 158,290 | | | | | | | | 454 | | | | | | | | 5,785 | |
| Shares redeemed | | | (41,561 | ) | | | | | | | (547,100 | ) | | | | | | | (31,702 | ) | | | | | | | (391,741 | ) |
| | | | | | | | | | | | | | | | | | | | | | | | | | | | |
| Net increase in shares outstanding | | | 104,149 | | | | | | | $ | 1,384,666 | | | | | | | | 138,630 | | | | | | | $ | 1,549,833 | |
| | | | | | | | | | | | | | | | | | | | | | | | | | | | |
| | | | |
29
American Beacon Bahl & Gaynor Small Cap Growth FundSM
Notes to Financial Statements
December 31, 2017
| | | | | | | | | | | | | | | | | | | | | | | | | | | | |
| | | C Class | |
| | | Year Ended December 31, | |
| | | 2017 | | | | | | 2016 | |
Bahl & Gaynor Small Cap Growth Fund | | Shares | | | | | | Amount | | | | | | Shares | | | | | | Amount | |
| Shares sold | | | 14,676 | | | | | | | $ | 188,837 | | | | | | | | 6,362 | | | | | | | $ | 77,439 | |
| Reinvestment of dividends | | | 1,442 | | | | | | | | 19,476 | | | | | | | | 36 | | | | | | | | 446 | |
| Shares redeemed | | | (10,566 | ) | | | | | | | (137,023 | ) | | | | | | | (4,090 | ) | | | | | | | (43,526 | ) |
| | | | | | | | | | | | | | | | | | | | | | | | | | | | |
| Net increase in shares outstanding | | | 5,552 | | | | | | | $ | 71,290 | | | | | | | | 2,308 | | | | | | | $ | 34,359 | |
| | | | | | | | | | | | | | | | | | | | | | | | | | | | |
12. Subsequent Events
Management has evaluated subsequent events for possible recognition or disclosure in the financial statements through the date the financial statements are issued. Management has determined that there are no material events that would require disclosure in the Fund’s financial statements through this date.
30
American Beacon Bahl & Gaynor Small Cap Growth FundSM
Financial Highlights
(For a share outstanding throughout the period)
| | | | | | | | | | | | | | | | | | | | | | | | | | | | |
| | | Institutional Class | |
| | | Year Ended December 31, | | | | | | July 15, 2014A
to
December 31,
2014 | |
| | | 2017 | | | | | | 2016 | | | | | | 2015 | | | | | |
| | | | |
Net asset value, beginning of period | | $ | 12.77 | | | | | | | $ | 10.17 | | | | | | | $ | 10.71 | | | | | | | $ | 10.00 | |
| | | | | | | | | | | | | | | | | | | | | | | | | | | | |
Income (loss) from investment operations: | | | | | | | | | | | | | | | | | | | | | | | | | | | | |
Net investment income | | | 0.04 | | | | | | | | 0.03 | | | | | | | | 0.08 | | | | | | | | 0.02 | |
Net gains (losses) on investments (both realized and unrealized) | | | 1.71 | | | | | | | | 2.60 | | | | | | | | (0.39 | ) | | | | | | | 0.71 | |
| | | | | | | | | | | | | | | | | | | | | | | | | | | | |
Total income (loss) from investment operations | | | 1.75 | | | | | | | | 2.63 | | | | | | | | (0.31 | ) | | | | | | | 0.73 | |
| | | | | | | | | | | | | | | | | | | | | | | | | | | | |
Less distributions: | | | | | | | | | | | | | | | | | | | | | | | | | | | | |
Dividends from net investment income | | | (0.05 | ) | | | | | | | (0.03 | ) | | | | | | | (0.06 | ) | | | | | | | (0.02 | ) |
Distributions from net realized gains | | | (0.54 | ) | | | | | | | - | | | | | | | | (0.16 | ) | | | | | | | - | |
Tax return of capital | | | - | | | | | | | | - | | | | | | | | (0.01 | ) | | | | | | | - | |
| | | | | | | | | | | | | | | | | | | | | | | | | | | | |
Total distributions | | | (0.59 | ) | | | | | | | (0.03 | ) | | | | | | | (0.23 | ) | | | | | | | (0.02 | ) |
| | | | | | | | | | | | | | | | | | | | | | | | | | | | |
Net asset value, end of period | | $ | 13.93 | | | | | | | $ | 12.77 | | | | | | | $ | 10.17 | | | | | | | $ | 10.71 | |
| | | | | | | | | | | | | | | | | | | | | | | | | | | | |
Total returnB | | | 13.65 | % | | | | | | | 25.88 | % | | | | | | | (2.96 | )% | | | | | | | 7.28 | %C |
| | | | | | | | | | | | | | | | | | | | | | | | | | | | |
| | | | | | | |
Ratios and supplemental data: | | | | | | | | | | | | | | | | | | | | | | | | | | | | |
Net assets, end of period | | $ | 16,498,344 | | | | | | | $ | 7,563,970 | | | | | | | $ | 3,231,461 | | | | | | | $ | 3,102,721 | |
Ratios to average net assets: | | | | | | | | | | | | | | | | | | | | | | | | | | | | |
Expenses, before reimbursements | | | 1.32 | % | | | | | | | 1.85 | % | | | | | | | 3.04 | % | | | | | | | 8.98 | %D |
Expenses, net of reimbursements | | | 0.98 | % | | | | | | | 0.98 | % | | | | | | | 0.98 | % | | | | | | | 0.98 | %D |
Net investment income (loss), before expense reimbursements | | | 0.18 | % | | | | | | | (0.30 | )% | | | | | | | (1.33 | )% | | | | | | | (7.51 | )%D |
Net investment income, net of reimbursements | | | 0.52 | % | | | | | | | 0.57 | % | | | | | | | 0.72 | % | | | | | | | 0.49 | %D |
Portfolio turnover rate | | | 38 | % | | | | | | | 23 | % | | | | | | | 54 | % | | | | | | | 12 | %E |
| | | | |
| | | Y Class | |
| | | Year Ended December 31, | | | | | | July 15, 2014A
to
December 31,
2014 | |
| | | 2017 | | | | | | 2016 | | | | | | 2015 | | | | | |
| | | | |
Net asset value, beginning of period | | $ | 12.75 | | | | | | | $ | 10.16 | | | | | | | $ | 10.71 | | | | | | | $ | 10.00 | |
| | | | | | | | | | | | | | | | | | | | | | | | | | | | |
Income (loss) from investment operations: | | | | | | | | | | | | | | | | | | | | | | | | | | | | |
Net investment income | | | 0.05 | | | | | | | | 0.04 | | | | | | | | 0.06 | | | | | | | | 0.01 | |
Net gains (losses) on investments (both realized and unrealized) | | | 1.68 | | | | | | | | 2.58 | | | | | | | | (0.38 | ) | | | | | | | 0.72 | |
| | | | | | | | | | | | | | | | | | | | | | | | | | | | |
Total income (loss) from investment operations | | | 1.73 | | | | | | | | 2.62 | | | | | | | | (0.32 | ) | | | | | | | 0.73 | |
| | | | | | | | | | | | | | | | | | | | | | | | | | | | |
Less distributions: | | | | | | | | | | | | | | | | | | | | | | | | | | | | |
Dividends from net investment income | | | (0.05 | ) | | | | | | | (0.03 | ) | | | | | | | (0.06 | ) | | | | | | | (0.02 | ) |
Distributions from net realized gains | | | (0.54 | ) | | | | | | | - | | | | | | | | (0.16 | ) | | | | | | | - | |
Tax return of capital | | | - | | | | | | | | - | | | | | | | | (0.01 | ) | | | | | | | - | |
| | | | | | | | | | | | | | | | | | | | | | | | | | | | |
Total distributions | | | (0.59 | ) | | | | | | | (0.03 | ) | | | | | | | (0.23 | ) | | | | | | | (0.02 | ) |
| | | | | | | | | | | | | | | | | | | | | | | | | | | | |
Net asset value, end of period | | $ | 13.89 | | | | | | | $ | 12.75 | | | | | | | $ | 10.16 | | | | | | | $ | 10.71 | |
| | | | | | | | | | | | | | | | | | | | | | | | | | | | |
Total returnB | | | 13.52 | % | | | | | | | 25.80 | % | | | | | | | (3.05 | )% | | | | | | | 7.28 | %C |
| | | | | | | | | | | | | | | | | | | | | | | | | | | | |
| | | | | | | |
Ratios and supplemental data: | | | | | | | | | | | | | | | | | | | | | | | | | | | | |
Net assets, end of period | | $ | 15,114,316 | | | | | | | $ | 6,856,954 | | | | | | | $ | 2,711,465 | | | | | | | $ | 387,622 | |
Ratios to average net assets: | | | | | | | | | | | | | | | | | | | | | | | | | | | | |
Expenses, before reimbursements | | | 1.38 | % | | | | | | | 1.98 | % | | | | | | | 2.76 | % | | | | | | | 11.71 | %D |
Expenses, net of reimbursements | | | 1.08 | % | | | | | | | 1.08 | % | | | | | | | 1.08 | % | | | | | | | 1.08 | %D |
Net investment income (loss), before expense reimbursements | | | 0.12 | % | | | | | | | (0.43 | )% | | | | | | | (0.98 | )% | | | | | | | (10.06 | )%D |
Net investment income, net of reimbursements | | | 0.42 | % | | | | | | | 0.47 | % | | | | | | | 0.70 | % | | | | | | | 0.57 | %D |
Portfolio turnover rate | | | 38 | % | | | | | | | 23 | % | | | | | | | 54 | % | | | | | | | 12 | %E |
| A | Commencement of operations. |
| B | Based on net asset value, which does not reflect the sales charge, redemption fee, or contingent deferred sales charge, if applicable. May include adjustments in accordance with U.S. GAAP and as such, the net asset value for reporting purposes and the returns based upon those net asset values may differ from the net asset value and returns for shareholder transactions. |
| E | Portfolio turnover rate is for the period from July 15, 2014 through December 31, 2014 and is not annualized. |
See accompanying notes
31
American Beacon Bahl & Gaynor Small Cap Growth FundSM
Financial Highlights
(For a share outstanding throughout the period)
| | | | | | | | | | | | | | | | | | | | | | | | | | | | |
| | | Investor Class | |
| | | Year Ended December 31, | | | | | | July 15, 2014A
to
December 31,
2014 | |
| | | 2017 | | | | | | 2016 | | | | | | 2015 | | | | | |
| | | | |
Net asset value, beginning of period | | $ | 12.65 | | | | | | | $ | 10.12 | | | | | | | $ | 10.69 | | | | | | | $ | 10.00 | |
| | | | | | | | | | | | | | | | | | | | | | | | | | | | |
Income (loss) from investment operations: | | | | | | | | | | | | | | | | | | | | | | | | | | | | |
Net investment income | | | 0.02 | | | | | | | | 0.03 | | | | | | | | 0.05 | | | | | | | | 0.01 | |
Net gains (losses) on investments (both realized and unrealized) | | | 1.66 | | | | | | | | 2.53 | | | | | | | | (0.39 | ) | | | | | | | 0.70 | |
| | | | | | | | | | | | | | | | | | | | | | | | | | | | |
Total income (loss) from investment operations | | | 1.68 | | | | | | | | 2.56 | | | | | | | | (0.34 | ) | | | | | | | 0.71 | |
| | | | | | | | | | | | | | | | | | | | | | | | | | | | |
Less distributions: | | | | | | | | | | | | | | | | | | | | | | | | | | | | |
Dividends from net investment income | | | (0.04 | ) | | | | | | | (0.03 | ) | | | | | | | (0.06 | ) | | | | | | | (0.02 | ) |
Distributions from net realized gains | | | (0.54 | ) | | | | | | | - | | | | | | | | (0.16 | ) | | | | | | | - | |
Tax return of capital | | | - | | | | | | | | - | | | | | | | | (0.01 | ) | | | | | | | - | |
| | | | | | | | | | | | | | | | | | | | | | | | | | | | |
Total distributions | | | (0.58 | ) | | | | | | | (0.03 | ) | | | | | | | (0.23 | ) | | | | | | | (0.02 | ) |
| | | | | | | | | | | | | | | | | | | | | | | | | | | | |
Net asset value, end of period | | $ | 13.75 | | | | | | | $ | 12.65 | | | | | | | $ | 10.12 | | | | | | | $ | 10.69 | |
| | | | | | | | | | | | | | | | | | | | | | | | | | | | |
Total returnB | | | 13.23 | % | | | | | | | 25.31 | % | | | | | | | (3.25 | )% | | | | | | | 7.08 | %C |
| | | | | | | | | | | | | | | | | | | | | | | | | | | | |
| | | | | | | |
Ratios and supplemental data: | | | | | | | | | | | | | | | | | | | | | | | | | | | | |
Net assets, end of period | | $ | 4,344,476 | | | | | | | $ | 3,595,277 | | | | | | | $ | 498,128 | | | | | | | $ | 239,138 | |
Ratios to average net assets: | | | | | | | | | | | | | | | | | | | | | | | | | | | | |
Expenses, before reimbursements | | | 1.57 | % | | | | | | | 2.09 | % | | | | | | | 3.19 | % | | | | | | | 12.62 | %D |
Expenses, net of reimbursements | | | 1.36 | % | | | | | | | 1.36 | % | | | | | | | 1.36 | % | | | | | | | 1.36 | %D |
Net investment (loss), before expense reimbursements | | | (0.09 | )% | | | | | | | (0.51 | )% | | | | | | | (1.47 | )% | | | | | | | (11.12 | )%D |
Net investment income, net of reimbursements | | | 0.12 | % | | | | | | | 0.23 | % | | | | | | | 0.35 | % | | | | | | | 0.14 | %D |
Portfolio turnover rate | | | 38 | % | | | | | | | 23 | % | | | | | | | 54 | % | | | | | | | 12 | %E |
| | | | |
| | | A Class | |
| | | Year Ended December 31, | | | | | | July 15, 2014A
to
December 31, | |
| | | | | | | | |
| | | 2017 | | | | | | 2016 | | | | | | 2015 | | | | | | 2014 | |
| | | | |
Net asset value, beginning of period | | $ | 12.64 | | | | | | | $ | 10.11 | | | | | | | $ | 10.69 | | | | | | | $ | 10.00 | |
| | | | | | | | | | | | | | | | | | | | | | | | | | | | |
Income (loss) from investment operations: | | | | | | | | | | | | | | | | | | | | | | | | | | | | |
Net investment income | | | 0.03 | | | | | | | | 0.04 | | | | | | | | 0.03 | | | | | | | | 0.00 | |
Net gains (losses) on investments (both realized and unrealized) | | | 1.65 | | | | | | | | 2.52 | | | | | | | | (0.38 | ) | | | | | | | 0.71 | |
| | | | | | | | | | | | | | | | | | | | | | | | | | | | |
Total income (loss) from investment operations | | | 1.68 | | | | | | | | 2.56 | | | | | | | | (0.35 | ) | | | | | | | 0.71 | |
| | | | | | | | | | | | | | | | | | | | | | | | | | | | |
Less distributions: | | | | | | | | | | | | | | | | | | | | | | | | | | | | |
Dividends from net investment income | | | (0.03 | ) | | | | | | | (0.03 | ) | | | | | | | (0.06 | ) | | | | | | | (0.02 | ) |
Distributions from net realized gains | | | (0.54 | ) | | | | | | | – | | | | | | | | (0.16 | ) | | | | | | | – | |
Tax return of capital | | | – | | | | | | | | – | | | | | | | | (0.01 | ) | | | | | | | – | |
| | | | | | | | | | | | | | | | | | | | | | | | | | | | |
Total distributions | | | (0.57 | ) | | | | | | | (0.03 | ) | | | | | | | (0.23 | ) | | | | | | | (0.02 | ) |
| | | | | | | | | | | | | | | | | | | | | | | | | | | | |
Net asset value, end of period | | $ | 13.75 | | | | | | | $ | 12.64 | | | | | | | $ | 10.11 | | | | | | | $ | 10.69 | |
| | | | | | | | | | | | | | | | | | | | | | | | | | | | |
Total returnB | | | 13.30 | % | | | | | | | 25.34 | % | | | | | | | (3.34 | )% | | | | | | | 7.08 | %C |
| | | | | | | | | | | | | | | | | | | | | | | | | | | | |
| | | | | | | |
Ratios and supplemental data: | | | | | | | | | | | | | | | | | | | | | | | | | | | | |
Net assets, end of period | | $ | 3,955,277 | | | | | | | $ | 2,321,426 | | | | | | | $ | 454,614 | | | | | | | $ | 163,704 | |
Ratios to average net assets: | | | | | | | | | | | | | | | | | | | | | | | | | | | | |
Expenses, before reimbursements | | | 1.69 | % | | | | | | | 2.18 | % | | | | | | | 2.88 | % | | | | | | | 13.84 | %D |
Expenses, net of reimbursements | | | 1.38 | % | | | | | | | 1.38 | % | | | | | | | 1.38 | % | | | | | | | 1.38 | %D |
Net investment (loss), before expense reimbursements | | | (0.20 | )% | | | | | | | (0.61 | )% | | | | | | | (1.08 | )% | | | | | | | (12.35 | )%D |
Net investment income, net of reimbursements | | | 0.11 | % | | | | | | | 0.18 | % | | | | | | | 0.41 | % | | | | | | | 0.10 | %D |
Portfolio turnover rate | | | 38 | % | | | | | | | 23 | % | | | | | | | 54 | % | | | | | | | 12 | %E |
| A | Commencement of operations. |
| B | Based on net asset value, which does not reflect the sales charge, redemption fee, or contingent deferred sales charge, if applicable. May include adjustments in accordance with U.S. GAAP and as such, the net asset value for reporting purposes and the returns based upon those net asset values may differ from the net asset value and returns for shareholder transactions. |
| E | Portfolio turnover rate is for the period from July 15, 2014 through December 31, 2014 and is not annualized. |
See accompanying notes
32
American Beacon Bahl & Gaynor Small Cap Growth FundSM
Financial Highlights
(For a share outstanding throughout the period)
| | | | | | | | | | | | | | | | | | | | | | | | | | | | |
| | | C Class | |
| | | Year Ended December 31, | | | | | | July 15, 2014A
to
December 31, | |
| | | | | | | | | | | | | | | | | | | | |
| | | 2017 | | | | | | 2016 | | | | | | 2015 | | | | | | 2014 | |
| | | | |
Net asset value, beginning of period | | $ | 12.42 | | | | | | | $ | 10.00 | | | | | | | $ | 10.65 | | | | | | | $ | 10.00 | |
| | | | | | | | | | | | | | | | | | | | | | | | | | | | |
Income (loss) from investment operations: | | | | | | | | | | | | | | | | | | | | | | | | | | | | |
Net investment (loss) | | | (0.06 | ) | | | | | | | (0.05 | ) | | | | | | | (0.01 | ) | | | | | | | (0.02 | ) |
Net gains (losses) on investments (both realized and unrealized) | | | 1.60 | | | | | | | | 2.49 | | | | | | | | (0.41 | ) | | | | | | | 0.69 | |
| | | | | | | | | | | | | | | | | | | | | | | | | | | | |
Total income (loss) from investment operations | | | 1.54 | | | | | | | | 2.44 | | | | | | | | (0.42 | ) | | | | | | | 0.67 | |
| | | | | | | | | | | | | | | | | | | | | | | | | | | | |
Less distributions: | | | | | | | | | | | | | | | | | | | | | | | | | | | | |
Dividends from net investment income | | | – | | | | | | | | (0.02 | ) | | | | | | | (0.06 | ) | | | | | | | (0.02 | ) |
Distributions from net realized gains | | | (0.54 | ) | | | | | | | – | | | | | | | | (0.16 | ) | | | | | | | – | |
Tax return of capital | | | – | | | | | | | | – | | | | | | | | (0.01 | ) | | | | | | | – | |
| | | | | | | | | | | | | | | | | | | | | | | | | | | | |
Total distributions | | | (0.54 | ) | | | | | | | (0.02 | ) | | | | | | | (0.23 | ) | | | | | | | (0.02 | ) |
| | | | | | | | | | | | | | | | | | | | | | | | | | | | |
Net asset value, end of period | | $ | 13.42 | | | | | | | $ | 12.42 | | | | | | | $ | 10.00 | | | | | | | $ | 10.65 | |
| | | | | | | | | | | | | | | | | | | | | | | | | | | | |
Total returnB | | | 12.38 | % | | | | | | | 24.35 | % | | | | | | | (4.01 | )% | | | | | | | 6.68 | %C |
| | | | | | | | | | | | | | | | | | | | | | | | | | | | |
| | | | | | | |
Ratios and supplemental data: | | | | | | | | | | | | | | | | | | | | | | | | | | | | |
Net assets, end of period | | $ | 520,113 | | | | | | | $ | 412,390 | | | | | | | $ | 308,822 | | | | | | | $ | 142,469 | |
Ratios to average net assets: | | | | | | | | | | | | | | | | | | | | | | | | | | | | |
Expenses, before reimbursements | | | 2.44 | % | | | | | | | 3.09 | % | | | | | | | 3.84 | % | | | | | | | 13.72 | %D |
Expenses, net of reimbursements | | | 2.13 | % | | | | | | | 2.13 | % | | | | | | | 2.13 | % | | | | | | | 2.13 | %D |
Net investment (loss), before expense reimbursements | | | (0.96 | )% | | | | | | | (1.56 | )% | | | | | | | (2.09 | )% | | | | | | | (12.23 | )%D |
Net investment (loss), net of reimbursements | | | (0.65 | )% | | | | | | | (0.60 | )% | | | | | | | (0.38 | )% | | | | | | | (0.64 | )%D |
Portfolio turnover rate | | | 38 | % | | | | | | | 23 | % | | | | | | | 54 | % | | | | | | | 12 | %E |
| A | Commencement of operations. |
| B | Based on net asset value, which does not reflect the sales charge, redemption fee, or contingent deferred sales charge, if applicable. May include adjustments in accordance with U.S. GAAP and as such, the net asset value for reporting purposes and the returns based upon those net asset values may differ from the net asset value and returns for shareholder transactions. |
| E | Portfolio turnover rate is for the period from July 15, 2014 through December 31, 2014 and is not annualized. |
See accompanying notes
33
American Beacon Bahl & Gaynor Small Cap Growth FundSM
Federal Tax Information
December 31, 2017 (Unaudited)
Certain tax information regarding the Fund is required to be provided to shareholders based upon the Fund’s income and distributions for the taxable year ended December 31, 2017. The information and distributions reported herein may differ from information and distributions taxable to the shareholders for the calendar year ended December 31, 2017.
The Fund designated the following items with regard to distributions paid during the fiscal year ended December 31, 2017. All designations are based on financial information available as of this annual report and, accordingly, are subject to change. For each item, it is the intention of the Fund to designate the maximum amount permitted under the Internal Revenue Code of 1986, as amended, and the regulations there under.
Corporate Dividends-Received Deduction:
| | | | |
Bahl & Gaynor Small Cap Growth | | | 94.28 | % |
Qualified Dividend Income:
| | | | |
Bahl & Gaynor Small Cap Growth | | | 96.88 | % |
Long-Term Capital Gain Distributions:
| | | | |
Bahl & Gaynor Small Cap Growth | | $ | 1,228,061 | |
Short-Term Capital Gain Distributions:
| | | | |
Bahl & Gaynor Small Cap Growth | | $ | 294,463 | |
Shareholders received notification in January 2018 of the applicable tax information necessary to prepare their 2017 income tax returns.
34
Trustees and Officers of the American Beacon FundsSM (Unaudited)
The Trustees and officers of the American Beacon Funds (the “Trust”) are listed below, together with their principal occupations during the past five years. The address of each person listed below is 220 Las Colinas Boulevard East, Suite 1200, Irving, Texas 75039. Each Trustee oversees thirty-five funds in the fund complex that includes the Trust, the American Beacon Select Funds and the American Beacon Institutional Funds Trust. The Trust’s Statement of Additional Information contains additional information about the Trustees and is available without charge by calling 1-800-658-5811.
| | | | |
Name, Age and Address | | Position, Term of Office and Length of Time Served with the Trust | | Principal Occupation(s) During Past 5 Years and Current Directorships |
| INTERESTED TRUSTEES | | Term | | |
| | Lifetime of Trust until removal, resignation or retirement* | | |
| | |
| Alan D. Feld** (81) | | Trustee since 1996 | | Sole Shareholder of a professional corporation which is a Partner in the law firm of Akin, Gump, Strauss, Hauer & Feld, LLP (law firm) (1960-Present); Trustee, American Beacon Mileage Funds (1996-2012); Trustee, American Beacon Select Funds (1999-Present); Trustee, American Beacon Master Trust (1996-2012); Trustee, American Beacon Institutional Funds Trust (2017-Present). |
| | |
| NON-INTERESTED TRUSTEES | | Term | | |
| | Lifetime of Trust until removal, resignation or retirement* | | |
| | |
| Gilbert G. Alvarado (48) | | Trustee since 2015 | | Director, Kura MD, Inc. (local telehealth organization) (2015-present); Vice President & CFO, Sierra Health Foundation (health conversion private foundation) (2006-Present); Vice President & CFO, Sierra Health Foundation: Center for Health Program Management (California public benefit corporation) (2012-Present); Director, Innovative North State (2012-2015); Director, Sacramento Regional Technology Alliance (2011-2016); Director, Women’s Empowerment (2009-2014); Director, Valley Healthcare Staffing (2017–present); Trustee, American Beacon Select Funds (2015-Present); Trustee, American Beacon Institutional Funds Trust (2017-Present). |
| | |
| Joseph B. Armes (55) | | Trustee since 2015 | | Chairman & CEO, CSW Industrials f/k/a Capital Southwest Corporation (investment company) (2015-Present); Chairman of the Board of Capital Southwest Corporation, predecessor to CSW Industrials, Inc. (2014-present) (investment company); CEO, Capital Southwest Corporation (2013-2015); President & CEO, JBA Investment Partners (family investment vehicle) (2010-Present); Director and Chair of Audit Committee, RSP Permian (oil and gas producer) (2013-Present); Trustee, American Beacon Select Funds (2015-Present); Trustee, American Beacon Institutional Funds Trust (2017-Present). |
| | |
| Gerard J. Arpey (59) | | Trustee since 2012 | | Director, The Home Depot, Inc. (2015-Present); Partner, Emerald Creek Group (private equity firm) (2011-Present); Director, S.C. Johnson & Son, Inc. (privately held company) (2008-present); Trustee, American Beacon Select Funds (2012-Present); Trustee, American Beacon Institutional Funds Trust (2017-Present). |
| | |
| Brenda A. Cline (57) | | Trustee since 2004 | | Executive Vice President, Chief Financial Officer, Treasurer and Secretary, Kimbell Art Foundation (1993-Present); Director, Range Resources Corporation (oil and natural gas company) (2015-Present); Director, Tyler Technologies, Inc. (public sector software solutions company) (2014-Present); Trustee, American Beacon Mileage Funds (2004-2012); Trustee, American Beacon Select Funds (2004-Present); Trustee, American Beacon Master Trust (2004-2012); Trustee, American Beacon Institutional Funds Trust (2017-Present). |
35
Trustees and Officers of the American Beacon FundsSM (Unaudited)
| | | | |
Name, Age and Address | | Position, Term of Office and Length of Time Served with the Trust | | Principal Occupation(s) During Past 5 Years and Current Directorships |
| NON-INTERESTED TRUSTEES (CONT.) | | Term | | |
| | |
| Eugene J. Duffy (63) | | Trustee since 2008 | | Managing Director, Institutional Services, Intercontinental Real Estate Corporation (2014-Present); Principal and Executive Vice President, Paradigm Asset Management (1994-2014); Director, Sunrise Bank of Atlanta (2008-2013); Trustee, American Beacon Mileage Funds (2008-2012); Trustee, American Beacon Select Funds (2008-Present); Trustee, American Beacon Master Trust (2008-2012); Trustee, American Beacon Institutional Funds Trust (2017-Present). |
| | |
| Thomas M. Dunning*** (75) | | Trustee since 2008 | | Chairman Emeritus, Lockton Dunning Benefits (consulting firm in employee benefits) (2008–Present); Board Director, Oncor Electric Delivery Company LLC (2007-Present); Trustee, American Beacon Mileage Funds (2008-2012); Trustee, American Beacon Select Funds (2008-Present); Trustee, American Beacon Master Trust (2008-2012); Trustee, American Beacon Institutional Funds Trust (2017-Present). |
| | |
| Richard A. Massman (74) | | Trustee since 2004 Chairman since 2008 | | Consultant and General Counsel Emeritus, Hunt Consolidated, Inc. (holding company engaged in oil and gas exploration and production, refining, real estate, farming, ranching and venture capital activities) (2009-Present); Trustee, American Beacon Mileage Funds (2004-2012); Trustee, American Beacon Select Funds (2004-Present); Trustee, American Beacon Master Trust (2004-2012); Trustee, American Beacon Institutional Funds Trust (2017-Present). |
| | |
| Barbara J. McKenna, CFA (54) | | Trustee since 2012 | | Managing Principal, Longfellow Investment Management Company (2005-Present); Trustee, American Beacon Select Funds (2012-Present); Trustee, American Beacon Institutional Funds Trust (2017-Present). |
| | |
| R. Gerald Turner (72) | | Trustee since 2001 | | President, Southern Methodist University (1995-Present); Director, J.C. Penney Company, Inc. (1996-Present); Director, Kronus Worldwide Inc. (chemical manufacturing) (2003-Present); Trustee, American Beacon Mileage Funds (2001-2012); Trustee, American Beacon Select Funds (2001-Present); Trustee, American Beacon Master Trust (2001-2012); Trustee, American Beacon Institutional Funds Trust (2017-Present). |
| | |
| OFFICERS | | Term | | |
| | One Year | | |
| | |
| Gene L. Needles, Jr. (63) | | President since 2009 | | President, CEO and Director, American Beacon Advisors, Inc. (2009-Present); President, CEO and Director, Resolute Investment Managers, Inc. (2015-Present); President, CEO and Director, Resolute Acquisition, Inc. (2015-Present); President, CEO and Director, Resolute Topco, Inc. (2015-Present), President & CEO, Resolute Investment Holdings, LLC (2015-Present); President, CEO and Director, Lighthouse Holdings, Inc. (2009-2015); President and CEO, Lighthouse Holdings Parent, Inc. (2009-2015); Manager, President and CEO, American Private Equity Management, LLC (2012-Present); President, American Beacon Cayman Managed Futures Strategy Fund, Ltd. (2014-Present); Director, Chairman, President and CEO, Alpha Quant Advisors, LLC (2016-Present); Director, ARK Investment Management LLC (2016-Present); Director, Shapiro Capital Management LLC (2017-Present); Member, Investment Advisory Committee, Employees Retirement System of Texas (2017-Present); Trustee, American Beacon NextShares Trust (2015-Present); President, American Beacon Select Funds (2009-Present); President, American Beacon Mileage Funds (2009-2012); President, American Beacon Master Trust (2009–2012); President, American Beacon Institutional Funds Trust (2017-Present). |
36
Trustees and Officers of the American Beacon FundsSM (Unaudited)
| | | | |
Name, Age and Address | | Position, Term of Office and Length of Time Served with the Trust | | Principal Occupation(s) During Past 5 Years and Current Directorships |
| OFFICERS (CONT.) | | Term | | |
| | |
| Rosemary K. Behan (58) | | VP, Secretary and Chief Legal Officer since 2006 | | Vice President and Secretary, American Beacon Advisors, Inc. (2006-Present); Secretary, Resolute Investment Holdings, LLC (2015-Present) Secretary, Resolute Investment Managers, Inc. (2015-Present); Secretary, Resolute Topco, Inc. (2015-Present); Secretary, Resolute Acquisition, Inc. (2015-Present); Secretary, Lighthouse Holdings, Inc. (2008-2015); Secretary, Lighthouse Holdings Parent, Inc. (2008-2015); Secretary, American Private Equity Management, LLC (2008-Present); Secretary, American Beacon Cayman Managed Futures Strategy Fund, Ltd. (2014-Present); Secretary, Alpha Quant Advisors, LLC (2016-Present); Chief Legal Officer, Vice President and Secretary, American Beacon Select Funds (2006-Present); Chief Legal Officer, Vice President and Secretary, American Beacon Mileage Funds (2006-2012); Chief Legal Officer, Vice President and Secretary, American Beacon Master Trust (2006-2012); Chief Legal Officer, Vice President and Secretary, American Beacon Institutional Funds Trust (2017-Present). |
| | |
| Brian E. Brett (57) | | VP since 2004 | | Senior Vice President (2012-Present) and Vice President (2004-2012), American Beacon Advisors, Inc.; Vice President, American Beacon Select Funds (2004-Present); Vice President, American Beacon Mileage Funds (2004-2012); Vice President, American Beacon Master Trust (2004-2012); Vice President, American Beacon Institutional Funds Trust (2017-Present). |
| | |
| Paul B. Cavazos (48) | | VP since 2016 | | Senior Vice President, American Beacon Advisors, Inc. (2016-Present); Chief Investment Officer and Assistant Treasurer, DTE Energy (2007-2016); Vice President, American Beacon Select Funds (2016-Present); Vice President, American Beacon Institutional Funds Trust (2017-Present). |
| | |
| Erica Duncan (47) | | VP Since 2011 | | Vice President, American Beacon Advisors, Inc. (2011-Present); Vice President, American Beacon Select Funds (2011-Present); Vice President, American Beacon Mileage Funds (2011-2012); Vice President, American Beacon Master Trust (2011-2012); Vice President, American Beacon Institutional Funds Trust (2017-Present). |
| | |
| Melinda G. Heika (56) | | Treasurer since 2010 | | Treasurer, American Beacon Advisors, Inc. (2010-Present); Resolute Investment Managers, Inc. (2015-Present); Treasurer, Resolute Acquisition, Inc. (2015-Present); Treasurer, Resolute Topco, Inc. (2015-Present); Treasurer, Resolute Investment Holdings, LLC. (2015-Present); Treasurer, Lighthouse Holdings, Inc. (2010-2015); Treasurer, Lighthouse Holdings Parent Inc., (2010-2015); Treasurer, American Private Equity Management, LLC (2012-Present); Director and Treasurer, American Beacon Cayman Managed Futures Strategy Fund, Ltd. (2014-Present); Treasurer, American Beacon Select Funds (2010-Present); Treasurer, American Beacon Mileage Funds (2010-2012); Treasurer, American Beacon Master Trust (2010-2012); Treasurer, American Beacon Institutional Funds Trust (2017-Present). |
| | |
| Terri L. McKinney (54) | | VP since 2010 | | Vice President (2009-Present) and Managing Director (2003-2009), American Beacon Advisors, Inc.; Vice President, Resolute Investment Managers, Inc. (2017-Present); Vice President, Alpha Quant Advisors, LLC (2016-Present); Vice President, American Beacon Select Funds (2010-Present); Vice President, American Beacon Mileage Funds (2010-2012); Vice President, American Beacon Master Trust (2010-2012); Vice President, American Beacon Institutional Funds Trust (2017-Present). |
37
Trustees and Officers of the American Beacon FundsSM (Unaudited)
| | | | |
Name, Age and Address | | Position, Term of Office and Length of Time Served with the Trust | | Principal Occupation(s) During Past 5 Years and Current Directorships |
| OFFICERS (CONT.) | | Term | | |
| | |
| Jeffrey K. Ringdahl (42) | | VP since 2010 | | Senior Vice President (2013-Present), Vice President (2010-2013), and Director (2015-Present), American Beacon Advisors, Inc.; Vice President, American Beacon Select Funds (2010-Present); Vice President, American Beacon Mileage Funds (2010-2012); Vice President, American Beacon Master Trust (2010-2012); Senior Vice President (2012-Present) and Manager (2015-Present), American Private Equity Management, LLC; Senior Vice President, Lighthouse Holdings, Inc. (2013-2015); Senior Vice President, Lighthouse Holdings Parent, Inc. (2013-2015); Director and Vice President, American Beacon Cayman Managed Futures Strategy Fund, Ltd. (2014-Present); Trustee, American Beacon NextShares Trust (2015-Present); Director and Senior Vice Present, Resolute Investment Holdings, LLC (2015-Present); Director and Senior Vice President, Resolute Topco, Inc. (2015-Present); Director and Senior Vice President, Resolute Acquisition, Inc. (2015-Present); Director and Senior Vice President, Resolute Investment Managers, Inc. (2015-Present); Director, Executive Vice President and Chief Operating Officer, Alpha Quant Advisors, LLC (2016-Present); Vice President, American Beacon Institutional Funds Trust (2017-President); Director, Shapiro Capital Management, LLC (2017-Present). |
| | |
| Samuel J. Silver (54) | | VP Since 2011 | | Vice President, American Beacon Advisors, Inc. (2011-Present); Vice President, American Beacon Select Funds (2011-Present); Vice President, American Beacon Mileage Funds (2011-2012); Vice President, American Beacon Master Trust (2011-2012); American Beacon Institutional Funds Trust (2011-Present). |
| | |
| Christina E. Sears (46) | | Chief Compliance Officer since 2004 and Asst. Secretary since 1999 | | Chief Compliance Officer, American Beacon Advisors, Inc. (2004-Present); Chief Compliance Officer, American Private Equity Management, LLC (2012-Present); Chief Compliance Officer and Vice President, Alpha Quant Advisors, LLC (2016-Present); Chief Compliance Officer (2004-Present) and Assistant Secretary (1999-Present), American Beacon Select Funds; Chief Compliance Officer (2004-2012) and Assistant Secretary (1999-2012), American Beacon Mileage Funds; Chief Compliance Officer (2004-2012) and Assistant Secretary (1999-2012), American Beacon Master Trust; Chief Compliance Officer and Assistant Secretary, American Beacon Institutional Funds Trust (2017-Present). |
| | |
| Sonia L. Bates (61) | | Asst. Treasurer since 2011 | | Assistant Treasurer, American Beacon Advisors, Inc. (2011-Present); Assistant Treasurer, Resolute Investment Managers, Inc. (2015-Present); Assistant Treasurer, Resolute Acquisition, Inc. (2015-Present); Assistant. Treasurer, Resolute Topco, Inc. (2015-Present); Assistant Treasurer, Resolute Investment Holdings, LLC.; Assistant Treasurer, Lighthouse Holdings, Inc. (2011-2015); Assistant Treasurer, Lighthouse Holdings Parent Inc. (2011-2015); Assistant Treasurer, American Private Equity Management, LLC (2012-Present); Assistant Treasurer, American Beacon Select Funds (2011-Present); Assistant Treasurer American Beacon Mileage Funds (2011-2012); Assistant Treasurer, American Beacon Master Trust (2011-2012); Assistant Treasurer, American Beacon Institutional Funds Trust (2017-Present). |
| | |
| Shelley D. Abrahams (43) | | Assistant Secretary since 2008 | | Assistant Secretary, American Beacon Advisors, Inc. (2008-Present); Assistant Secretary, American Beacon Select Funds (2008-Present); Assistant Secretary, American Beacon Mileage Funds (2008-2012); Assistant Secretary, American Beacon Master Trust (2008-2012); Assistant Secretary, American Beacon Institutional Funds Trust (2017-Present). |
38
Trustees and Officers of the American Beacon FundsSM (Unaudited)
| | | | |
Name, Age and Address | | Position, Term of Office and Length of Time Served with the Trust | | Principal Occupation(s) During Past 5 Years and Current Directorships |
| OFFICERS (CONT.) | | Term | | |
| | |
| Rebecca L. Harris (51) | | Assistant Secretary since 2010 | | Vice President, American Beacon Advisors, Inc. (2016-Present); Vice President, Resolute Investment Managers, Inc. (2017-Present); Vice President, Alpha Quant Advisors, LLC (2016-Present); Assistant Secretary, American Beacon Select Funds (2010-Present); Assistant Secretary, American Beacon Mileage Funds (2010-2012); Assistant Secretary, American Beacon Master Trust (2010-2012); Assistant Secretary, American Beacon Institutional Funds Trust (2017-Present). |
| | |
| Diana N. Lai (42) | | Assistant Secretary since 2012 | | Assistant Secretary, American Beacon Advisors, Inc. (2012-Present); Assistant Secretary, American Beacon Select Funds (2012-Present); Assistant Secretary, American Beacon Institutional Funds Trust (2017-Present). |
| | |
| Teresa A. Oxford (59) | | Assistant Secretary since 2015 | | Assistant Secretary, American Beacon Advisors, Inc. (2015-Present); Assistant Secretary, Alpha Quant Advisors, LLC (2016-Present); Assistant Secretary, American Beacon Select Funds (2015-Present); Assistant Secretary, American Beacon Institutional Funds Trust (2017-Present). |
* As of 11/12/2014, the Board adopted a retirement plan that requires Trustees to retire no later than the last day of the calendar year in which they reach the age of 75.
** Mr. Feld is deemed to be an “interested person” of the Trusts, as defined by the 1940 Act. Mr. Feld’s law firm of Akin, Gump, Strauss, Hauer & Feld LLP has provided legal services within the past two fiscal years to one or more of the Trust’s sub-advisors.
*** Mr. Dunning retired as of 12/31/2017. Douglas A. Lindgren became a new Trustee to each of the Trusts on 1/1/2018.
39
American Beacon FundsSM
Privacy Policy
December 31, 2017 (Unaudited)
The American Beacon Funds recognize and respect the privacy of our shareholders. We are providing this notice to you so you will understand how shareholder information may be collected and used.
We may collect nonpublic personal information about you from one or more of the following sources:
| | • | | information we receive from you on applications or other forms; |
| | • | | information about your transactions with us or our service providers; and |
| | • | | information we receive from third parties. |
We do not disclose any nonpublic personal information about our customers or former customers to anyone, except as permitted by law.
We restrict access to your nonpublic personal information to those employees or service providers who need to know that information to provide products or services to you. To ensure the confidentiality of your nonpublic personal information, we maintain safeguards that comply with federal standards.
40

Delivery of Documents
eDelivery is NOW AVAILABLE - Stop traditional mail delivery and receive your
shareholder reports and summary prospectus on-line. Sign up at
www.americanbeaconfunds.com
If you invest in the Fund through a financial institution, you may be able to receive the Fund’s regulatory mailings, such as the Prospectus, Annual Report and Semi-Annual Report, by e-mail. If you are interested in this option, please go to www.icsdelivery.com and search for your financial institution’s name or contact your financial institution directly.
To obtain more information about the Fund:
| | |
 | |  |
| | |
| By E-mail: | | On the Internet: |
| american_beacon.funds@ambeacon.com | | Visit our website at www.americanbeaconfunds.com |
| | | |
| | | |
| | |

By Telephone: Call (800) 658-5811 | | 
By Mail: American Beacon Funds P.O. Box 219643 Kansas City, MO 64121-9643 |
| |
| |
| |
| | | |
| | | |
| Availability of Quarterly Portfolio Schedules | | Availability of Proxy Voting Policy and Records |
| | |
| In addition to the Schedule of Investments provided in each semi-annual and annual report, the Fund files a complete schedule of its portfolio holdings with the Securities and Exchange Commission (“SEC”) on Form N-Q as of the first and third fiscal quarters. The Fund’s Forms N-Q are available on the SEC’s website at www.sec.gov. The Forms N-Q may also be reviewed and copied at the SEC’s Public Reference Section, 100 F Street, NE, Washington, D.C. 20549-2736. Information regarding the operation of the SEC’s Public Reference Room may be obtained by calling (800)-SEC-0330. A complete schedule of the Fund’s portfolio holdings is also available at www.americanbeaconfunds.com approximately twenty days after the end of each month. | | A description of the policies and procedures the Fund uses to determine how to vote proxies relating to portfolio securities is available in the Fund’s Statement of Additional Information, is available free of charge on the Fund’s website www.americanbeaconfunds.com and by calling 1-800-967-9009 or by accessing the SEC’s website at www.sec.gov. The Fund’s proxy voting record for the most recent year ended June 30 is filed annually with the SEC on Form N-PX. The Fund’s Forms N-PX are available on the SEC’s website at www.sec.gov. The Fund’s proxy voting record may also be obtained by calling 1-800-967-9009. |
Fund Service Providers:
| | | | | | | | | | | | |
CUSTODIAN State Street Bank and Trust Boston, Massachusetts | | | | TRANSFER AGENT DST Asset Manager Solutions, Inc. Kansas City, Missouri | | | | INDEPENDENT REGISTERED PUBLIC ACCOUNTING FIRM Ernst & Young LLP Dallas, Texas | | | | DISTRIBUTOR Foreside Fund Services, LLC Portland, Maine |
This report is prepared for shareholders of the American Beacon Funds and may be distributed to others only if preceded or accompanied by a current Prospectus or Summary Prospectus.
American Beacon Funds and American Beacon Bahl & Gaynor Small Cap Growth Fund are service marks of American Beacon Advisors, Inc.
AR 12/17

About American Beacon Advisors
Since 1986, American Beacon Advisors has offered a variety of products and investment advisory services to numerous institutional and retail clients, including a variety of mutual funds, corporate cash management, and separate account management.
Our clients include defined benefit plans, defined contribution plans, foundations, endowments, corporations, financial planners, and other institutional investors. With American Beacon Advisors, you can put the experience of a multi-billion dollar asset management firm to work for your company.
AHL MANAGED FUTURES STRATEGY FUND
Investing in derivative instruments involves liquidity, credit, interest rate and market risks. The use of quantitative models may lead to high levels of trading and concentration among certain investments, resulting in higher trading costs and return volatility. Investing in foreign and emerging market securities may involve heightened risk due to currency fluctuations and economic and political risks. Regulatory changes may impair the Fund’s ability to qualify for federal income tax treatment as a regulated investment company, which could result in the Fund and shareholders incurring significant income tax expense. The Fund may have high portfolio turnover risk, which could increase the Fund’s transaction costs and possibly have a negative impact on performance. Because the Fund may invest in fewer issuers than a more diversified portfolio, the fluctuating value of a single holding may have a greater effect on the value of the Fund.
IONIC STRATEGIC ARBITRAGE FUND
The Fund’s strategy of investing in a variety of arbitrage strategies entails certain risks including that the sub-advisor’s judgments about allocation between such strategies, as well as individual arbitrage opportunities, may not perform to expectations, resulting in the Fund’s underperformance or even losses versus other similar funds. Arbitrage is the simultaneous purchase and sale of an asset or assets to take advantage of a perceived pricing anomaly. Because the Fund may invest in fewer issuers than a more diversified portfolio, the fluctuating value of a single holding may have a greater effect on the value of the Fund. The Fund may have high portfolio turnover, which could increase the Fund’s transaction costs and possibly have a negative impact on performance. Small- or mid-capitalization stocks may involve greater volatility and lower liquidity than larger company stocks. The use of fixed-income securities, including convertible securities, entails interest rate and credit risks. In addition, the value of a convertible security could fluctuate based on the value of the underlying stock. Investing in foreign securities may involve heightened risk due to currency fluctuations and economic and political risks. Investing in derivative instruments involves liquidity, credit, interest rate and market risks. Short sales involve special risks, including greater reliance on the sub-advisor’s ability to accurately anticipate the future value of a security or instrument; the Fund’s losses are potentially unlimited in a short sale.
Please see the prospectus for a complete discussion of the Funds’ risks. There can be no assurances that the investment objectives of these Funds will be met.
Any opinions herein, including forecasts, reflect our judgment as of the end of the reporting period and are subject to change. Each advisor’s strategies and the Fund’s portfolio composition will change depending on economic and market conditions. This report is not a complete analysis of market conditions and therefore, should not be relied upon as investment advice. Although economic and market information has been compiled from reliable sources, American Beacon Advisors, Inc. makes no representation as to the completeness or accuracy of the statements contained herein.
American Beacon Funds | December 31, 2017 |
Contents
President’s Message
| | |
 | | Dear Shareholders, At American Beacon, we are proud to offer a broad range of equity, fixed- income and alternative mutual fund products for institutions and individuals. Our mutual funds – which span the domestic, international, global, frontier and emerging markets – are sub-advised by experienced portfolio managers who employ distinctive investment processes to manage assets through a variety of economic and market conditions. Together, we work diligently to help our clients and shareholders meet their long-term financial goals. Institutional wisdom, enduring value. Since our inception as a pension fiduciary in 1986, American Beacon has focused on identifying and overseeing institutional investment managers and portfolio risk management. In 1987, we leveraged our size and experience to launch a series of sub-advised, multi- |
manager mutual funds providing individual investors access to many of the same institutional managers as our pension clients. Following the financial crisis in 2008, we saw that investors were looking for unique solutions from managers who were not necessarily mainstream. In 2010, we began offering mutual funds from single managers with distinctive investment styles or asset classes. As we continue to expand our family of funds, our solutions- based approach provides innovative investments.
Guiding principles. Our “manager of managers” philosophy is built on a long-standing history of innovative thinking, discipline and consistency in applying our solutions-based approach. As a manager of managers, our goal is to engage the most effective money managers for each asset class, investment style or market strategy – whether through a single sub-advisor or a combination of sub-advisors. Because we take our fiduciary responsibilities very seriously, our thorough manager evaluation and selection process is rigorous and ongoing. Our guiding principles – predictability, style consistency, competitive pricing and long-term relationships – provide a strong foundation for our due-diligence process. Our broad range of mutual funds helps investors navigate the economic storms and market downturns in the U.S. and abroad. Our years of experience evaluating sub-advisors have led us to identify and partner with asset managers who have adhered to their disciplined processes for many years and through multiple market cycles.
Focus on asset protection and risk mitigation. We strive to provide innovative, long-term products without gimmicks. From offering some of the first multi-manager funds, one of the first retirement-income funds and the first open-end mutual fund in the U.S. to focus primarily on frontier-market debt, our robust history includes applying a disciplined, solutions-based approach to our product development process to help protect assets and mitigate risk.
Thank you for your continued interest in American Beacon. For additional information about our funds or to access your account information, please visit our website at www.americanbeaconfunds.com.
Best Regards,

Gene L. Needles, Jr.
President
American Beacon Funds
1
Alternative Investments
Market Overview
December 31, 2017 (Unaudited)
Equity and bond markets produced solid returns throughout 2017, which was a period of unusually low volatility and provided tailwinds for traditional investment strategies. The S&P 500 Index and Bloomberg Barclays U.S. Aggregate Bond Index returned 21.8% and 3.5%, respectively. However, the market environment produced mixed results for alternative investment strategies.
The decline in volatility during 2017 was substantial as 90-day realized volatility for the S&P 500 Index ended the year at its lowest level in more than 50 years. Low volatility was not limited to equities as yields on 10-year Treasuries remained within a trading range of 60 basis points (0.60%) – the narrowest range in more than 50 years. Part of the impetus for such unprecedented low volatility seems to have been continued investor complacency fueled by accelerating economic growth and euphoria over the prospects for tax cuts. While marking its ninth consecutive year of gains, the S&P 500 Index remarkably did not report a single monthly decline in 2017.
Even more unusual, however, were the range-bound Treasury yields given a more hawkish Federal Reserve, increasing inflation expectations and the lowest unemployment rate in nearly 20 years. These factors, coupled with a pronounced flattening in the two- to 10-year Treasury yield curve to a low of 57 basis points (0.57%) – the flattest yield curve since 2007 – typically lead to higher volatility or expectations of recession. However, such was not the case last year. While these conflicting signals can perhaps be explained by sustained purchases of longer-dated Treasuries by foreign central banks, the fact that Treasury yields exhibited such low volatility remains surprising.
Traditional asset classes and higher-beta strategies thrived in 2017, while relative-value-oriented managers were challenged. Not surprisingly, the HFRX Equity Hedge Index gained 10.0% and the HFRX Absolute Return Index returned a modest 3.4%. The HFRX ED/Merger Arbitrage Index gained 2.2% as a decline in corporate transaction activity limited opportunities for event-driven strategies in general. Their performance was further affected in the fourth quarter when several large merger deals faltered. Trend-following strategies also produced meager returns in comparison to traditional asset classes as exhibited by the Morningstar Managed Futures category average return of 3.0% for the year. While the equity markets generally offered stable, consistent trends, many other sectors were trendless and difficult to trade.
2
American Beacon AHL Managed Futures Strategy FundSM
Performance Overview
December 31, 2017 (Unaudited)
The Investor Class of the American Beacon AHL Managed Futures Strategy Fund (the “Fund”) returned 4.78% for the twelve months ended December 31, 2017.
Comparison of Change in Value of a $10,000 Investment for the period from 8/19/2014 through 12/31/2017
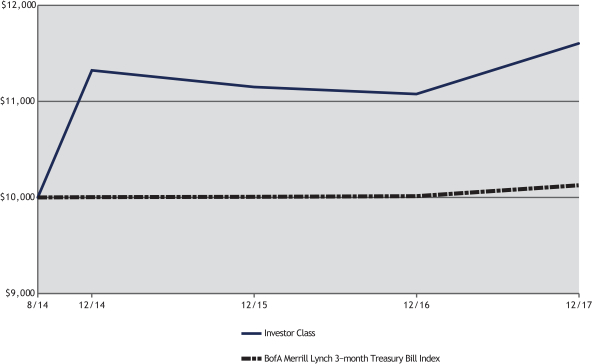
| | | | | | | | | | | | | | | | | | | | | | | | | |
| Total Returns for the Period ended December 31, 2017 | |
| | | Ticker | | 1 Year | | 3 Years | | Since Inception (8/19/2014) | | Value of $10,000 8/19/2014- 12/31/2017 |
Institutional Class (1,5) | | AHLIX | | | | 5.21 | % | | | | 1.22 | % | | | | 4.94 | % | | | $ | 11,764 | |
Y Class (1,5) | | AHLYX | | | | 5.13 | % | | | | 1.13 | % | | | | 4.83 | % | | | $ | 11,722 | |
Investor Class (1,5) | | AHLPX | | | | 4.78 | % | | | | 0.82 | % | | | | 4.51 | % | | | $ | 11,603 | |
A without Sales Charge (1,2,5) | | AHLAX | | | | 4.67 | % | | | | 0.78 | % | | | | 4.48 | % | | | $ | 11,590 | |
A with Sales Charge (1,2,5) | | AHLAX | | | | (1.33 | )% | | | | (1.20 | )% | | | | 2.66 | % | | | $ | 10,924 | |
C without Sales Charge (1,3,5) | | AHLCX | | | | 4.06 | % | | | | 0.06 | % | | | | 3.74 | % | | | $ | 11,315 | |
C with Sales Charge (1,3,5) | | AHLCX | | | | 3.06 | % | | | | 0.06 | % | | | | 3.74 | % | | | $ | 11,315 | |
| | | | | | | | | | | | | | | | | | | | | | | | | |
BofA Merrill Lynch 3-Month Treasury Bill Index (4) | | | | | | 0.86 | % | | | | 0.41 | % | | | | 0.37 | % | | | $ | 10,124 | |
| 1. | Performance shown is historical and is not indicative of future returns. Investment returns and principal value will vary, and shares may be worth more or less at redemption than at original purchase. Performance shown is calculated based on the published end of day net asset values as of date indicated, and current performance may be lower or higher than the performance data quoted. To obtain performance as of the most recent month end, please visit www.americanbeaconfunds.com or call 1-800-967-9009. Fund performance in the table above does not reflect the deduction of taxes a shareholder would pay on distributions or the redemption of shares. Generally accepted accounting principles require adjustments to be made to the net assets of the Fund at period end for financial reporting purposes only; and as such, the total return based on the unadjusted net asset value per share may differ from the total return reported in the financial highlights. A portion of the fees charged to each Class of the Fund has been waived since Fund inception. Performance prior to waiving fees was lower than actual returns shown. |
| 2. | A Class shares have a maximum sales charge of 5.75%. |
| 3. | C Class has a maximum contingent deferred sales charge of 1.00% for shares redeemed within one year of the date of purchase. |
3
American Beacon AHL Managed Futures Strategy FundSM
Performance Overview
December 31, 2017 (Unaudited)
| 4. | The BofA Merrill Lynch 3-Month Treasury Bill Index is designed to measure the total return on cash, including price and interest income, based on short- term government Treasury bills of about 90-day maturity. One cannot directly invest in an index. |
| 5. | The Total Annual Fund Operating Expense ratios set forth in the most recent Fund prospectus for the Institutional, Y, Investor, A, and C Class shares were 1.90%, 1.97%, 2.13%, 2.29%, and 3.04%, respectively. The expense ratios above may vary from the expense ratios presented in other sections of this report that are based on expenses incurred during the period covered by this report. |
For the period, Equities was the only sector to have positive performance making it far and away the best performing sector returning approximately 14.6%. The stellar performance was led by long positions in the Korean Kospi which added approximately 2.7% followed by long positions in the S&P 500 which contributed approximately 1.9% to the Fund.
The remaining sectors in the Fund all detracted from performance for the annual period. The worst performer in the strategy was Fixed Income, which lost approximately 4.9%, and all markets were negative for the year. Short Sterling detracted the most (down 0.6%) with the bulk of the losses coming from long positions in September when the Bank of England hinted at a rate rise in November. Long positioning in the German 10-year bund for the majority of the period lost approximately 0.6%.
Commodities also detracted from Fund returns by about 1.9%. Precious Metals positions hurt performance the most, led by mixed positioning in Gold (down 1.5%) and primarily short positioning in Silver (down 1.1%).
Lastly, the Currency sector was detrimental to Fund performance losing approximately 1.7% for the period. Losses were led by the Japanese yen versus U.S dollar pair (down 1.5%) which was long the yen for most of the year except for August and September. A long position in the British pound versus the U.S. dollar lost approximately 0.9%.
Looking forward, the Fund’s sub-advisor will continue to implement its trading strategy designed to capitalize on price trends (up or down) in a broad range of global equities, fixed income, currency, and commodity futures markets; seeking to achieve the Fund’s goal of capital growth.
| | | | | | | | |
| Commodities | | | | | | | % of VaR | * |
| Natural Gas | | | Short | | | | 7.24 | |
| Crude Oil | | | Long | | | | 6.54 | |
| Copper | | | Long | | | | 5.61 | |
| RBOB Gasoline | | | Long | | | | 3.04 | |
| Silver | | | Short | | | | 2.34 | |
| | | | | | | | |
| Currencies | | | | | | | % of VaR | * |
| JPY/USD | | | Short | | | | 5.37 | |
| EUR/USD | | | Long | | | | 3.97 | |
| GBP/USD | | | Long | | | | 2.57 | |
| AUD/USD | | | Long | | | | 2.10 | |
| CLP/USD | | | Long | | | | 1.87 | |
| | | | | | | | |
| Equities | | | | | | | % of VaR | * |
| Korean Kospi | | | Long | | | | 2.34 | |
| Hang Seng | | | Long | | | | 1.87 | |
| Russell 2000 Index | | | Long | | | | 1.64 | |
| Nasdaq 100 Index | | | Long | | | | 1.64 | |
| Australian SPI 200 Index | | | Long | | | | 1.40 | |
| | | | | | | | |
| Interest Rate | | | | | | | % of VaR | * |
| U.S. Treasuries | | | Long | | | | 1.87 | |
| Eurodollar | | | Long | | | | 1.40 | |
| Euro Bond | | | Long | | | | 0.93 | |
| Japanese Bonds | | | Long | | | | 0.70 | |
| Euribor | | | Short | | | | 0.70 | |
| * | Value at Risk (“VaR”) is a measure of the potential loss in value of a portfolio over a defined period for a given confidence interval. A one-day VaR at the 95% confidence level represents that there is a 5% probability that the mark-to-market loss on the portfolio over a one-day horizon will exceed the value (assuming normal markets and no trading in the portfolio). |
4
American Beacon Ionic Strategic Arbitrage FundSM
Performance Overview
December 31, 2017 (Unaudited)
The Investor Class of the American Beacon Ionic Strategic Arbitrage Fund (the “Fund”) returned -0.49% for the twelve months ended December 31, 2017.
Comparison of Change in Value of a $10,000 Investment for the period from 9/01/2013 through 12/31/2017
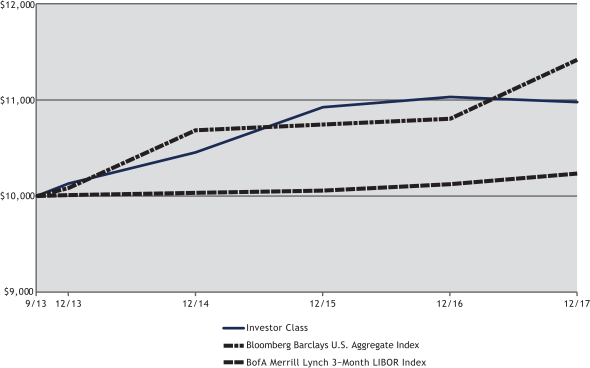
| | | | | | | | | | | | | | | | | | | | | | | | | |
| Total Returns for the Period ended December 31, 2017 | |
| | | Ticker | | 1 Year | | 3 Years | | Since Inception (9/1/2013) | | Value of $10,000 9/1/2013- 12/31/2017 |
Institutional Class (1,7) | | IONIX | | | | (0.04 | )% | | | | 1.93 | % | | | | 2.37 | % | | | $ | 11,069 | |
Y Class (1,2,7) | | IONYX | | | | (0.27 | )% | | | | 1.88 | % | | | | 2.34 | % | | | $ | 11,054 | |
Investor Class (1,3,7) | | IONPX | | | | (0.49 | )% | | | | 1.64 | % | | | | 2.17 | % | | | $ | 10,976 | |
A without Sales Charge (1,4,7) | | IONAX | | | | (0.51 | )% | | | | 1.63 | % | | | | 2.17 | % | | | $ | 10,974 | |
A with Sales Charge (1,4,7) | | IONAX | | | | (5.24 | )% | | | | 0.01 | % | | | | 1.03 | % | | | $ | 10,455 | |
C without Sales Charge (1,5,7) | | IONCX | | | | (1.33 | )% | | | | 0.96 | % | | | | 1.70 | % | | | $ | 10,758 | |
C with Sales Charge (1,5,7) | | IONCX | | | | (2.33 | )% | | | | 0.96 | % | | | | 1.70 | % | | | $ | 10,758 | |
| | | | | | | | | | | | | | | | | | | | | | | | | |
Bloomberg Barclays U.S. Aggregate Index (6) | | | | | | 3.54 | % | | | | 2.24 | % | | | | 3.10 | % | | | $ | 11,416 | |
BofA Merrill Lynch 3-Month LIBOR Index (6) | | | | | | 1.11 | % | | | | 0.67 | % | | | | 0.53 | % | | | $ | 10,233 | |
| 1. | Performance shown is historical and is not indicative of future returns. Investment returns and principal value will vary, and shares may be worth more or less at redemption than at original purchase. Performance shown is calculated based on the published end of day net asset values as of date indicated, and current performance may be lower or higher than the performance data quoted. To obtain performance as of the most recent month end, please visit www.americanbeaconfunds.com or call 1-800-967-9009. Fund performance in the table above does not reflect the deduction of taxes a shareholder would pay on distributions or the redemption of shares. Simultaneous with the commencement of the Fund’s investment operations on June 30, 2015, the Ionic Absolute Return Fund LLC (“Private Fund”), a privately offered investment fund managed by the Fund’s sub-advisor transferred its assets to the Institutional Class shares of the Fund. A portion of the fees charged to each Class of the Fund has been waived since 6/30/15. Performance prior to waiving fees was lower than actual returns shown. |
| 2. | Fund performance for the three-year and since inception periods represents the total returns achieved by the Institutional Class from 9/1/13 up to 6/30/15, the inception date of the Y Class. Expenses of the Y Class are higher than those of the Institutional Class. As a result, total returns shown may be higher than they would have been had the Y Class been in existence since 9/1/13. |
5
American Beacon Ionic Strategic Arbitrage FundSM
Performance Overview
December 31, 2017 (Unaudited)
| 3. | Fund performance for the three-year and since inception periods represents the total returns achieved by the Institutional Class from 9/1/13 up to 6/30/15, the inception date of the Investor Class. Expenses of the Investor Class are higher than those of the Institutional Class. As a result, total returns shown may be higher than they would have been had the Investor Class been in existence since 9/1/13. |
| 4. | Fund performance for the three-year and since inception periods represents the total returns achieved by the Institutional Class from 9/1/13 up to 6/30/15, the inception date of the A Class. Expenses of the A Class are higher than those of the Institutional Class. As a result, total returns shown may be higher than they would have been had the A Class been in existence since 9/1/13. A Class shares have a maximum sales charge of 5.75%. |
| 5. | Fund performance for the three-year and since inception periods represents the total returns achieved by the Institutional Class from 9/1/13 up to 6/30/15, the inception date of the C Class. Expenses of the C Class are higher than those of the Institutional Class. As a result, total returns shown may be higher than they would have been had the C Class been in existence since 9/1/13. C Class has a maximum contingent deferred sales charge of 1.00% for shares redeemed within one year of the date of purchase. |
| 6. | The BofA Merrill Lynch 3-Month LIBOR Index represents the London interbank offered rate (LIBOR) with a constant 3-month average maturity. LIBOR is a composite of the rates of interest at which banks borrow from one another in the London market, and it is a widely used benchmark for short-term interest rates. The Bloomberg Barclays U.S. Aggregate Index is a market weighted index of government, corporate, mortgage-backed and asset-backed fixed-rate debt securities of all maturities. One cannot directly invest in an index. |
| 7. | The Total Annual Fund Operating Expense ratios set forth in the most recent Fund prospectus for the Institutional, Y, Investor, A, and C Class shares were 3.20%, 3.27%, 3.51%, 3.64%, and 4.38%, respectively. The expense ratios above may vary from the expense ratios presented in other sections of this report that are based on expenses incurred during the period covered by this report. |
Relative to the performance of the equities markets, the Fund has tended to perform better when more volatility was present (positive performance in 11 of the 13 months since inception when S&P was down) and underperform during periods of steady gains and low or decreasing volatility, as was the case in 2017. Using the 11.1 average price of the VIX Index as a benchmark (the lowest since its inception in 1990), 2017 can be considered one of the least volatile years on record. While a recovery of corporate earnings has likely contributed to the current low volatility environment, quantitative easing among central bankers around the world since 2008 appears to have been the biggest factor behind this sustained low volatility.
The lack of volatility remained a headwind for the Fund overall and the Fund’s Volatility Arbitrage strategy in particular. Losses in the Volatility Arbitrage strategy were primarily attributable to long volatility-oriented exposure in foreign exchange and emerging market equity positions. U.S. equity positions designed to benefit from the gap between realized and implied volatility mitigated some of these losses. Positions established to benefit from changing volatility levels in gold throughout the year were also accretive to performance.
The Fund’s Convertible Arbitrage strategy contributed positively to performance during the period. Though headline equity volatility declined sharply in 2017, a high level of dispersion benefited the strategy, creating price movement in a number of underlying equity positions that were additive to performance. Tighter credit spreads over the course of the year were also beneficial and, coupled with a lack of new issuance, caused valuations in the U.S. convertible market to move higher.
The Fund’s Equity Arbitrage strategy added to returns over the period and, in particular, had a strong fourth quarter. Positions in closed-end funds in the Energy and MLP sector were top contributors in the fourth quarter as well as two event-oriented positions in the Technology and Healthcare sectors. Over the course of the year, an index ETF position designed to benefit from lower volatility was the strongest performer. While lower overall equity volatility negatively impacted warrant positions in the strategy, two capital structure arbitrage positions in the Technology sector and a merger arbitrage position were the primary drivers of underperformance during the fourth quarter when a number of large corporate transactions faltered and caused spread widening across the event driven space.
The Credit/Interest Rate Arbitrage strategy detracted from performance over the period. This was primarily attributable to the impact that the pronounced flattening in the yield curve had on the Fund’s positions in mortgage derivatives. Over the course of year, the spread between two-year and ten-year treasuries narrowed
6
American Beacon Ionic Strategic Arbitrage FundSM
Performance Overview
December 31, 2017 (Unaudited)
significantly. In response to these narrowing spreads, the Fund reduced exposure to mortgage derivatives and increased positions in closed-end funds focusing on the floating rate loan sector. These closed-end funds generated solid gains as net asset value discounts narrowed meaningfully.
The Fund’s sub-advisor continues to allocate assets among arbitrage strategies, including Convertible, Credit/Interest Rate, Equity and Volatility Arbitrage, seeking capital appreciation with low volatility and low correlation to the broader equity, interest rate and currency markets.
| | | | | | | | |
| Positions By Investment Strategy | | | | | | | Fund | |
| Convertible Arbitrage | | | | | | | 31 | |
| Credit/Interest Rate Arbitrage | | | | | | | 5 | |
| Equity Arbitrage | | | | | | | 46 | |
| Volatility Arbitrage | | | | | | | 14 | |
Total | | | | | | | 96 | |
| | | | | | | | |
| Investment Strategy Exposure (%) | | | LMV | * | | | SMV | ** |
| Convertible Arbitrage | | | 40 | | | | (28 | ) |
| Credit/Interest Rate Arbitrage | | | 26 | | | | - | |
| Equity Arbitrage | | | 32 | | | | (47 | ) |
| Volatility Arbitrage | | | 27 | | | | (12 | ) |
Total | | | 125 | | | | (87 | ) |
7
American Beacon FundsSM
Expense Examples
December 31, 2017 (Unaudited)
Fund Expense Example
As a shareholder of a Fund, you incur two types of costs: (1) transaction costs, including sales charges (loads) on purchase payments and redemption fees, if applicable, and (2) ongoing costs, including management fees, distribution (12b-1) fees, sub-transfer agent fees, and other Fund expenses. The Examples are intended to help you understand the ongoing cost (in dollars) of investing in the Funds and to compare these costs with the ongoing costs of investing in other mutual funds. The Examples are based on an investment of $1,000 invested at the beginning of the period in each Class and held for the entire period from July 1, 2017 through December 31, 2017.
Actual Expenses
The “Actual” lines of the tables provide information about actual account values and actual expenses. You may use the information on this page, together with the amount you invested, to estimate the expenses that you paid over the period. Simply divide your account value by $1,000 (for example, an $8,600 account value divided by $1,000 = $8.60), then multiply the result by the “Expenses Paid During Period” to estimate the expenses you paid on your account during this period. Shareholders of the Investor and Institutional Classes that invest in the Fund through an IRA or Roth IRA may be subject to a custodial IRA fee of $15 that is typically deducted each December. If your account was subject to a custodial IRA fee during the period, your costs would have been $15 higher.
Hypothetical Example for Comparison Purposes
The “Hypothetical” lines of the tables provide information about hypothetical account values and hypothetical expenses based on the Fund’s actual expense ratio and an assumed 5% per year rate of return before expenses (not the Fund’s actual return). You may compare the ongoing costs of investing in the Funds with other funds by contrasting this 5% hypothetical example and the 5% hypothetical examples that appear in the shareholder reports of the other funds. The hypothetical account values and expenses may not be used to estimate the actual ending account balance or expenses you paid for the period. Shareholders of the Investor and Institutional Classes that invest in the Funds through an IRA or Roth IRA may be subject to a custodial IRA fee of $15 that is typically deducted each December. If your account was subject to a custodial IRA fee during the period, your costs would have been $15 higher.
You should also be aware that the expenses shown in the table highlight only your ongoing costs and do not reflect any transaction costs charged by the Funds, such as sales charges (loads) or redemption fees, as applicable. Similarly, the expense examples for other funds do not reflect any transaction costs charged by those funds, such as sales charges (loads), redemption fees or exchange fees. Therefore, the “Hypothetical” lines of the tables are useful in comparing ongoing costs only and will not help you determine the relative total costs of owning different funds. If you were subject to any transaction costs during the period, your costs would have been higher.
8
American Beacon FundsSM
Expense Examples
December 31, 2017 (Unaudited)
| | | | | | | | | | | | | | | |
| American Beacon AHL Managed Futures Strategy Fund | | | | | | | | | | | | | | | |
| | | Beginning Account Value
7/1/2017 | | Ending Account Value
12/31/2017 | | Expenses Paid During
Period
7/1/2017-12/31/2017* |
| Institutional Class | | | | | | | | | | | | | | | |
| Actual | | | | $1,000.00 | | | | | $1,058.20 | | | | | $7.99 | |
| Hypothetical** | | | | $1,000.00 | | | | | $1,017.40 | | | | | $7.83 | |
| Y Class | | | | | | | | | | | | | | | |
| Actual | | | | $1,000.00 | | | | | $1,058.50 | | | | | $8.51 | |
| Hypothetical** | | | | $1,000.00 | | | | | $1,016.90 | | | | | $8.34 | |
| Investor Class | | | | | | | | | | | | | | | |
| Actual | | | | $1,000.00 | | | | | $1,057.00 | | | | | $9.95 | |
| Hypothetical** | | | | $1,000.00 | | | | | $1,015.50 | | | | | $9.75 | |
| A Class | | | | | | | | | | | | | | | |
| Actual | | | | $1,000.00 | | | | | $1,055.90 | | | | | $10.00 | |
| Hypothetical** | | | | $1,000.00 | | | | | $1,015.50 | | | | | $9.80 | |
| C Class | | | | | | | | | | | | | | | |
| Actual | | | | $1,000.00 | | | | | $1,053.00 | | | | | $13.92 | |
| Hypothetical** | | | | $1,000.00 | | | | | $1,011.60 | | | | | $13.64 | |
| * | Expenses are equal to the Fund’s annualized expense ratios for the six-month period of 1.54%, 1.64%, 1.92%, 1.94%, and 2.69% for the Institutional, Y, Investor, A, and C Classes, respectively, multiplied by the average account value over the period, multiplied by the number derived by dividing the number of days in the most recent fiscal half-year (184) by days in the year (365) to reflect the half-year period. |
| ** | 5% return before expenses. |
| | | | | | | | | | | | | | | |
| American Beacon Ionic Strategic Arbitrage Fund | |
| | | Beginning Account Value
7/1/2017 | | Ending Account Value
12/31/2017 | | Expenses Paid During
Period
7/1/2017-12/31/2017* |
| Institutional Class | | | | | | | | | | | | | | | |
| Actual | | | | $1,000.00 | | | | | $1,000.70 | | | | | $12.51 | |
| Hypothetical** | | | | $1,000.00 | | | | | $1,012.70 | | | | | $12.58 | |
| Y Class | | | | | | | | | | | | | | | |
| Actual | | | | $1,000.00 | | | | | $999.50 | | | | | $14.16 | |
| Hypothetical** | | | | $1,000.00 | | | | | $1,011.00 | | | | | $14.24 | |
| Investor Class | | | | | | | | | | | | | | | |
| Actual | | | | $1,000.00 | | | | | $998.50 | | | | | $15.26 | |
| Hypothetical** | | | | $1,000.00 | | | | | $1,009.90 | | | | | $15.35 | |
| A Class | | | | | | | | | | | | | | | |
| Actual | | | | $1,000.00 | | | | | $998.20 | | | | | $15.71 | |
| Hypothetical** | | | | $1,000.00 | | | | | $1,009.50 | | | | | $15.80 | |
| C Class | | | | | | | | | | | | | | | |
| Actual | | | | $1,000.00 | | | | | $993.40 | | | | | $18.64 | |
| Hypothetical** | | | | $1,000.00 | | | | | $1,006.50 | | | | | $18.76 | |
| * | Expenses are equal to the Fund’s annualized expense ratios for the six-month period of 2.48%, 2.81%, 3.03%, 3.12%, and 3.71% for the Institutional, Y, Investor, A, and C Classes, respectively, multiplied by the average account value over the period, multiplied by the number derived by dividing the number of days in the most recent fiscal half-year (184) by days in the year (365) to reflect the half-year period. |
| ** | 5% return before expenses. |
9
American Beacon FundsSM
Report of Independent Registered Public Accounting Firm
To the Shareholders of American Beacon AHL Managed Futures Strategy Fund and American Beacon Ionic Strategic Arbitrage Fund and the Board of Trustees of American Beacon Funds
Opinion on the Financial Statements
We have audited the accompanying consolidated statement of assets and liabilities of American Beacon AHL Managed Futures Strategy Fund and the statement of assets and liabilities of American Beacon Ionic Strategic Arbitrage Fund (collectively referred to as the “Funds”), (two of the funds constituting American Beacon Funds (the “Trust”)), including the (consolidated) schedules of investments, as of December 31, 2017, and the related (consolidated) statements of operations and changes in net assets, and the (consolidated) financial highlights for each of the periods indicated in the table below and the related notes (collectively referred to as the “financial statements”). In our opinion, the financial statements present fairly, in all material respects, the (consolidated) financial position of each of the Funds (two of the funds constituting American Beacon Funds) at December 31, 2017, and the (consolidated) results of their operations, changes in net assets and financial highlights for each of the periods indicated in the table below, in conformity with U.S. generally accepted accounting principles.
| | | | | | |
Individual fund constituting
the American Beacon Funds | | Statement of operations | | Statements of changes
in net assets | | Financial highlights |
| American Beacon AHL Managed Futures Strategy Fund and its subsidiary | | For the year ended
December 31, 2017 | | For each of the two years in the period ended December 31, 2017 | | For each of the three years in the period ended December 31, 2017 and the period from August 19, 2014 (commencement of operations) to December 31, 2014 |
| | | |
| American Beacon Ionic Strategic Arbitrage Fund | | For the year ended
December 31, 2017 | | For each of the two years in the period ended December 31, 2017 | | For each of the two years in the period ended December 31, 2017 and the period from June 30, 2015 (commencement of operations) to December 31, 2015 |
Basis for Opinion
These financial statements are the responsibility of the Trust’s management. Our responsibility is to express an opinion on the Funds’ financial statements based on our audits. We are a public accounting firm registered with the Public Company Accounting Oversight Board (United States) (“PCAOB”) and are required to be independent with respect to the Trust in accordance with the U.S. federal securities laws and the applicable rules and regulations of the Securities and Exchange Commission and the PCAOB.
We conducted our audits in accordance with the standards of the PCAOB. Those standards require that we plan and perform the audit to obtain reasonable assurance about whether the financial statements are free of material misstatement, whether due to error or fraud. The Trust is not required to have, nor were we engaged to perform, an audit of the Trust’s internal control over financial reporting. As part of our audits, we are required to obtain an understanding of internal control over financial reporting, but not for the purpose of expressing an opinion on the effectiveness of the Trust’s internal control over financial reporting. Accordingly, we express no such opinion.
Our audits included performing procedures to assess the risks of material misstatement of the financial statements, whether due to error or fraud, and performing procedures that respond to those risks. Such procedures included examining, on a test basis, evidence regarding the amounts and disclosures in the financial statements. Our procedures included confirmation of securities owned as of December 31, 2017, by correspondence with the custodian and brokers or by other appropriate auditing procedures where replies from brokers were not received.
10
American Beacon FundsSM
Report of Independent Registered Public Accounting Firm
Our audits also included evaluating the accounting principles used and significant estimates made by management, as well as evaluating the overall presentation of the financial statements. We believe that our audits provide a reasonable basis for our opinion.

We have served as the auditor of one or more American Beacon investment companies since 1987.
Dallas, Texas
February 28, 2018
11
American Beacon AHL Managed Futures Strategy FundSM
Consolidated Schedule of Investments
December 31, 2017
| | | | | | | | | | | | | | | |
| | | Shares | | | | Fair Value |
| | | | | | | | | | | | | | | |
| SHORT-TERM INVESTMENTS - 89.90% | | | | | | | | | | | | | | | |
| Investment Companies - 3.93% | | | | | | | | | | | | | | | |
| American Beacon U.S. Government Money Market Select Fund, Select Class, 1.13%A B C | | | | 20,549,617 | | | | | | | | | $ | 20,549,617 | |
| | | | | | | | | | | | | | | |
| | | |
| | | Principal Amount | | | | |
| U.S. Treasury Obligations - 85.97% | | | | | | | | | | | | | | | |
U.S. Treasury Bills, | | | | | | | | | | | | | | | |
0.977%, Due 1/11/2018A | | | $ | 56,500,000 | | | | | | | | | | 56,483,368 | |
1.018%, Due 1/25/2018A | | | | 56,100,000 | | | | | | | | | | 56,055,915 | |
1.034%, Due 2/1/2018A | | | | 56,000,000 | | | | | | | | | | 55,940,947 | |
1.060%, Due 2/8/2018A | | | | 81,000,000 | | | | | | | | | | 80,895,833 | |
1.091%, Due 3/1/2018 | | | | 5,000,000 | | | | | | | | | | 4,989,749 | |
1.150%, Due 3/8/2018A | | | | 47,500,000 | | | | | | | | | | 47,389,043 | |
1.361%, Due 3/29/2018A | | | | 59,500,000 | | | | | | | | | | 59,305,448 | |
1.249%, Due 4/12/2018A | | | | 74,500,000 | | | | | | | | | | 74,212,347 | |
1.514%, Due 6/21/2018A | | | | 14,000,000 | | | | | | | | | | 13,900,833 | |
| | | | | | | | | | | | | | | |
| | | | | | | | | | | | | | 449,173,483 | |
| | | | | | | | | | | | | | | |
| | | | | | | | | | | | | | | |
Total Short-Term Investments (Cost $469,850,037) | | | | | | | | | | | | | | 469,723,100 | |
| | | | | | | | | | | | | | | |
| | | | | | | | | | | | | | | |
TOTAL INVESTMENTS – 89.90% (Cost $469,850,037) | | | | | | | | | | | | | | 469,723,100 | |
OTHER ASSETS, NET OF LIABILITIES – 10.10% | | | | | | | | | | | | | | 52,761,346 | |
| | | | | | | | | | | | | | | |
TOTAL NET ASSETS - 100.00% | | | | | | | | | | | | | $ | 522,484,446 | |
| | | | | | | | | | | | | | | |
| | | | | | | | | | | | | | | |
| Percentages are stated as a percent of net assets. | | | | | | | | | | | | | | | |
A All or a portion represents positions held by the American Beacon Cayman Managed Futures Strategy Fund, Ltd.
B The Fund is affiliated by having the same investment advisor.
C 7-day yield.
| | | | | | | | | | | | | | | | |
| Futures Contracts Open on December 31, 2017: | |
| | | | | | | | | | | | | | | | |
| Long Futures | | | | | |
| |
| Commodity Futures Contracts | | | | |
| Description | | Number of
Contracts | | Expiration Date | | Notional
Amount | | | Contract Value | | | Unrealized
Appreciation
(Depreciation) | |
| Brent Crude FuturesA | | 351 | | January 2018 | | $ | 22,290,807 | | | $ | 23,471,370 | | | $ | 1,180,563 | |
| Copper FuturesA | | 286 | | March 2018 | | | 22,839,827 | | | | 23,598,575 | | | | 758,748 | |
| Gasoline RBOB FuturesA | | 239 | | January 2018 | | | 17,521,193 | | | | 18,026,240 | | | | 505,047 | |
| Gold 100oz FuturesA | | 182 | | February 2018 | | | 23,601,303 | | | | 23,829,260 | | | | 227,957 | |
| LME Copper FuturesA | | 207 | | March 2018 | | | 35,041,919 | | | | 37,505,812 | | | | 2,463,893 | |
| LME Lead FuturesA | | 172 | | March 2018 | | | 10,826,740 | | | | 10,696,250 | | | | (130,490 | ) |
| LME Nickel FuturesA | | 4 | | February 2018 | | | 281,906 | | | | 305,712 | | | | 23,806 | |
| LME Nickel FuturesA | | 60 | | March 2018 | | | 4,105,749 | | | | 4,593,600 | | | | 487,851 | |
| LME Primary Aluminum FuturesA | | 4 | | January 2018 | | | 214,958 | | | | 225,825 | | | | 10,867 | |
| LME Primary Aluminum FuturesA | | 588 | | March 2018 | | | 31,692,838 | | | | 33,391,050 | | | | 1,698,212 | |
| LME Zinc FuturesA | | 322 | | March 2018 | | | 25,537,006 | | | | 26,770,275 | | | | 1,233,269 | |
| Low Sulphur Gasoil FuturesA | | 244 | | January 2018 | | | 13,747,159 | | | | 14,646,100 | | | | 898,941 | |
| Low Sulphur Gasoil FuturesA | | 2 | | February 2018 | | | 119,627 | | | | 120,350 | | | | 723 | |
| NY Harbor ULSD FuturesA | | 169 | | January 2018 | | | 13,822,174 | | | | 14,679,374 | | | | 857,200 | |
| WTI Crude FuturesA | | 457 | | January 2018 | | | 26,727,587 | | | | 27,611,940 | | | | 884,353 | |
| | | | | | | | | | | | | | | | |
| | $ | 248,370,793 | | | $ | 259,471,733 | | | $ | 11,100,940 | |
| | | | | | | | | | | | | | | | |
See accompanying notes
12
American Beacon AHL Managed Futures Strategy FundSM
Consolidated Schedule of Investments
December 31, 2017
| | | | | | | | | | | | | | | | |
| Currency Futures Contracts | |
| Description | | Number of
Contracts | | Expiration Date | | Notional
Amount | | | Contract Value | | | Unrealized
Appreciation
(Depreciation) | |
| Australian Dollar Currency Futures | | 510 | | March 2018 | | $ | 39,363,868 | | | $ | 39,836,100 | | | $ | 472,232 | |
| British Pound Currency Futures | | 621 | | March 2018 | | | 52,170,355 | | | | 52,618,106 | | | | 447,751 | |
| Canadian Dollar Currency Futures | | 323 | | March 2018 | | | 25,669,428 | | | | 25,807,700 | | | | 138,272 | |
| Euro Currency Futures | | 631 | | March 2018 | | | 94,129,554 | | | | 95,245,506 | | | | 1,115,952 | |
| | | | | | | | | | | | | | | | |
| | $ | 211,333,205 | | | $ | 213,507,412 | | | $ | 2,174,207 | |
| | | | | | | | | | | | | | | | |
|
| Equity Futures Contracts | |
| Description | | Number of
Contracts | | Expiration Date | | Notional
Amount | | | Contract Value | | | Unrealized
Appreciation
(Depreciation) | |
| Amsterdam Index Futures | | 89 | | January 2018 | | $ | 11,797,430 | | | $ | 11,638,275 | | | $ | (159,155 | ) |
| CAC40 Index Futures | | 138 | | January 2018 | | | 8,976,038 | | | | 8,800,053 | | | | (175,985 | ) |
| DAX Index Futures | | 38 | | March 2018 | | | 15,042,715 | | | | 14,727,214 | | | | (315,501 | ) |
| Euro Stoxx 50 Index Futures | | 336 | | March 2018 | | | 14,439,795 | | | | 14,093,167 | | | | (346,628 | ) |
| FTSE 100 Index Futures | | 252 | | March 2018 | | | 25,364,327 | | | | 26,037,403 | | | | 673,076 | |
| FTSE/JSE Top 40 Index Futures | | 420 | | March 2018 | | | 17,666,046 | | | | 18,039,645 | | | | 373,599 | |
| FTSE/MIB Index Futures | | 61 | | March 2018 | | | 8,274,176 | | | | 7,968,372 | | | | (305,804 | ) |
| Hang Seng Index Futures | | 326 | | January 2018 | | | 38,143,050 | | | | 38,441,279 | | | | 298,229 | |
| KOSPI 200 Index Futures | | 427 | | March 2018 | | | 32,143,837 | | | | 32,522,080 | | | | 378,243 | |
| Mini MSCI EAFE Index Futures | | 184 | | March 2018 | | | 18,580,398 | | | | 18,818,600 | | | | 238,202 | |
| Mini MSCI Emerging Markets Index Futures | | 288 | | March 2018 | | | 16,120,355 | | | | 16,757,280 | | | | 636,925 | |
| MSCI Taiwan Stock Index Futures | | 294 | | January 2018 | | | 11,404,236 | | | | 11,554,200 | | | | 149,964 | |
| NASDAQ 100 E-Mini Futures | | 214 | | March 2018 | | | 27,476,562 | | | | 27,429,450 | | | | (47,112 | ) |
| Nikkei 225 (SGX) Futures | | 163 | | March 2018 | | | 16,385,107 | | | | 16,462,783 | | | | 77,676 | |
| OMXS30 Index Futures | | 318 | | January 2018 | | | 6,299,817 | | | | 6,114,339 | | | | (185,478 | ) |
| Russell 2000 E-Mini Index Futures | | 307 | | March 2018 | | | 23,472,565 | | | | 23,585,275 | | | | 112,710 | |
| S&P 500 E-Mini Index Futures | | 302 | | March 2018 | | | 40,233,414 | | | | 40,407,600 | | | | 174,186 | |
| S&P/TSX 60 Index Futures | | 142 | | March 2018 | | | 21,648,780 | | | | 21,700,914 | | | | 52,134 | |
| SPI 200 Futures | | 323 | | March 2018 | | | 38,081,126 | | | | 38,021,489 | | | | (59,637 | ) |
| TOPIX Index Futures | | 127 | | March 2018 | | | 20,269,651 | | | | 20,484,599 | | | | 214,948 | |
| | | | | | | | | | | | | | | | |
| | $ | 411,819,425 | | | $ | 413,604,017 | | | $ | 1,784,592 | |
| | | | | | | | | | | | | | | | |
|
| Interest Rate Futures Contracts | |
| Description | | Number of
Contracts | | Expiration Date | | Notional
Amount | | | Contract Value | | | Unrealized
Appreciation
(Depreciation) | |
| 3-Month Euro Euribor Futures | | 1,883 | | March 2019 | | $ | 566,520,847 | | | $ | 566,209,407 | | | $ | (311,440 | ) |
| 3-Month Euro Euribor Futures | | 270 | | December 2019 | | | 81,061,813 | | | | 80,964,855 | | | | (96,958 | ) |
| 3-Month Euro Euribor Futures | | 1 | | September 2020 | | | 299,510 | | | | 299,089 | | | | (421 | ) |
| 90-Day Sterling Futures | | 81 | | March 2019 | | | 13,579,339 | | | | 13,581,541 | | | | 2,202 | |
| Australian 10-Year Bond Futures | | 66 | | March 2018 | | | 6,713,626 | | | | 6,667,378 | | | | (46,248 | ) |
| Euro-Bund Futures | | 210 | | March 2018 | | | 41,151,999 | | | | 40,770,529 | | �� | | (381,470 | ) |
| Euro-Buxl 30-Year Bond Futures | | 57 | | March 2018 | | | 11,431,850 | | | | 11,215,498 | | | | (216,352 | ) |
| Japanese 10-Year Government Bond Futures | | 78 | | March 2018 | | | 104,470,401 | | | | 104,401,598 | | | | (68,803 | ) |
| Long GILT Futures | | 58 | | March 2018 | | | 9,774,652 | | | | 9,819,989 | | | | 45,337 | |
| U.S. Ultra Bond Futures | | 74 | | March 2018 | | | 12,405,324 | | | | 12,406,563 | | | | 1,239 | |
| | | | | | | | | | | | | | | | |
| | $ | 847,409,361 | | | $ | 846,336,447 | | | $ | (1,072,914 | ) |
| | | | | | | | | | | | | | | | |
See accompanying notes
13
American Beacon AHL Managed Futures Strategy FundSM
Consolidated Schedule of Investments
December 31, 2017
| | | | | | | | | | | | | | | | |
| Short Futures | |
|
| Commodity Futures Contracts | |
| Description | | Number of
Contracts | | Expiration Date | | Notional
Amount | | | Contract Value | | | Unrealized
Appreciation
(Depreciation) | |
| Cocoa FuturesA | | 323 | | March 2018 | | $ | (6,191,572 | ) | | $ | (6,111,160 | ) | | $ | 80,412 | |
| Coffee FuturesA | | 231 | | March 2018 | | | (11,018,513 | ) | | | (10,932,075 | ) | | | 86,438 | |
| Corn FuturesA | | 747 | | March 2018 | | | (13,191,144 | ) | | | (13,100,513 | ) | | | 90,631 | |
| Kansas City Hard Red Winter Wheat FuturesA | | 357 | | March 2018 | | | (7,760,129 | ) | | | (7,626,413 | ) | | | 133,716 | |
| LME Copper FuturesA | | 68 | | March 2018 | | | (11,262,450 | ) | | | (12,320,750 | ) | | | (1,058,300 | ) |
| LME Lead FuturesA | | 97 | | March 2018 | | | (6,033,335 | ) | | | (6,032,188 | ) | | | 1,147 | |
| LME Nickel FuturesA | | 27 | | March 2018 | | | (1,769,421 | ) | | | (2,067,120 | ) | | | (297,699 | ) |
| LME Primary Aluminum FuturesA | | 4 | | January 2018 | | | (211,092 | ) | | | (225,825 | ) | | | (14,733 | ) |
| LME Primary Aluminum FuturesA | | 244 | | March 2018 | | | (12,671,630 | ) | | | (13,856,150 | ) | | | (1,184,520 | ) |
| LME Zinc FuturesA | | 118 | | March 2018 | | | (9,215,647 | ) | | | (9,810,225 | ) | | | (594,578 | ) |
| Natural Gas FuturesA | | 970 | | January 2018 | | | (26,405,429 | ) | | | (28,644,100 | ) | | | (2,238,671 | ) |
| Natural Gas Swap FuturesA | | 148 | | March 2018 | | | (1,035,123 | ) | | | (1,017,130 | ) | | | 17,993 | |
| Natural Gas Swap FuturesA | | 148 | | April 2018 | | | (1,035,123 | ) | | | (1,014,170 | ) | | | 20,953 | |
| Natural Gas Swap FuturesA | | 148 | | May 2018 | | | (1,035,123 | ) | | | (1,026,010 | ) | | | 9,113 | |
| Natural Gas Swap FuturesA | | 148 | | June 2018 | | | (1,035,123 | ) | | | (1,037,480 | ) | | | (2,357 | ) |
| Natural Gas Swap FuturesA | | 148 | | July 2018 | | | (1,035,123 | ) | | | (1,038,590 | ) | | | (3,467 | ) |
| Natural Gas Swap FuturesA | | 148 | | August 2018 | | | (1,035,123 | ) | | | (1,031,930 | ) | | | 3,193 | |
| Natural Gas Swap FuturesA | | 148 | | September 2018 | | | (1,035,123 | ) | | | (1,040,440 | ) | | | (5,317 | ) |
| Natural Gas Swap FuturesA | | 168 | | October 2018 | | | (1,256,882 | ) | | | (1,204,140 | ) | | | 52,742 | |
| Natural Gas Swap FuturesA | | 168 | | November 2018 | | | (1,256,882 | ) | | | (1,258,740 | ) | | | (1,858 | ) |
| Natural Gas Swap FuturesA | | 168 | | December 2018 | | | (1,256,882 | ) | | | (1,294,020 | ) | | | (37,138 | ) |
| Natural Gas Swap FuturesA | | 168 | | January 2019 | | | (1,256,882 | ) | | | (1,285,620 | ) | | | (28,738 | ) |
| Natural Gas Swap FuturesA | | 168 | | February 2019 | | | (1,256,882 | ) | | | (1,259,580 | ) | | | (2,698 | ) |
| Silver FuturesA | | 237 | | March 2018 | | | (19,225,426 | ) | | | (20,316,825 | ) | | | (1,091,399 | ) |
| Soybean FuturesA | | 375 | | March 2018 | | | (18,231,536 | ) | | | (18,032,812 | ) | | | 198,724 | |
| Sugar #11 World FuturesA | | 640 | | February 2018 | | | (9,962,916 | ) | | | (10,866,688 | ) | | | (903,772 | ) |
| | | | | | | | | | | | | | | | |
| | $ | (166,680,511 | ) | | $ | (173,450,694 | ) | | $ | (6,770,183 | ) |
| | | | | | | | | | | | | | | | |
|
| Currency Futures Contracts | |
| Description | | Number of
Contracts | | Expiration Date | | Notional
Amount | | | Contract Value | | | Unrealized
Appreciation
(Depreciation) | |
| Japanese Yen Currency Futures | | 1,067 | | March 2018 | | $ | (118,236,741 | ) | | $ | (118,890,475 | ) | | $ | (653,734 | ) |
| Mexican Peso Futures | | 691 | | March 2018 | | | (17,461,374 | ) | | | (17,302,640 | ) | | | 158,734 | |
| New Zealand Dollar Currency Futures | | 52 | | March 2018 | | | (3,608,448 | ) | | | (3,685,240 | ) | | | (76,792 | ) |
| Swiss Franc Currency Futures | | 116 | | March 2018 | | | (14,738,846 | ) | | | (14,974,150 | ) | | | (235,304 | ) |
| U.S. Dollar Index Futures | | 623 | | March 2018 | | | (58,046,329 | ) | | | (57,207,598 | ) | | | 838,731 | |
| | | | | | | | | | | | | | | | |
| | $ | (212,091,738 | ) | | $ | (212,060,103 | ) | | $ | 31,635 | |
| | | | | | | | | | | | | | | | |
|
| Interest Rate Futures Contracts | |
| Description | | Number of
Contracts | | Expiration Date | | Notional
Amount | | | Contract Value | | | Unrealized
Appreciation
(Depreciation) | |
| 90-Day Eurodollar Futures | | 1,050 | | March 2019 | | $ | (256,824,682 | ) | | $ | (256,711,875 | ) | | $ | 112,807 | |
| 90-Day Eurodollar Futures | | 628 | | December 2019 | | | (153,393,282 | ) | | | (153,341,900 | ) | | | 51,382 | |
| 90-Day Eurodollar Futures | | 481 | | September 2020 | | | (117,417,156 | ) | | | (117,412,100 | ) | | | 5,056 | |
| 90-Day Sterling Futures | | 68 | | December 2019 | | | (11,374,151 | ) | | | (11,384,539 | ) | | | (10,388 | ) |
| Australian 3-Year Bond Futures | | 785 | | March 2018 | | | (68,170,790 | ) | | | (68,212,075 | ) | | | (41,285 | ) |
| Euro-Bobl Futures | | 369 | | March 2018 | | | (58,312,731 | ) | | | (58,315,769 | ) | | | (3,038 | ) |
| Euro-Schatz Futures | | 331 | | March 2018 | | | (44,494,401 | ) | | | (44,506,129 | ) | | | (11,728 | ) |
| U.S. Long Bond Futures | | 54 | | March 2018 | | | (8,150,822 | ) | | | (8,262,000 | ) | | | (111,178 | ) |
| U.S. Treasury 10-Year Note Futures | | 373 | | March 2018 | | | (46,113,438 | ) | | | (46,269,485 | ) | | | (156,047 | ) |
| U.S. Treasury 2-Year Note Futures | | 605 | | March 2018 | | | (129,813,030 | ) | | | (129,536,173 | ) | | | 276,857 | |
| U.S. Treasury 2-Year Note Futures | | 678 | | March 2018 | | | (79,004,259 | ) | | | (78,759,235 | ) | | | 245,024 | |
| | | | | | | | | | | | | | | | |
| | $ | (973,068,742 | ) | | $ | (972,711,280 | ) | | $ | 357,462 | |
| | | | | | | | | | | | | | | | |
See accompanying notes
14
American Beacon AHL Managed Futures Strategy FundSM
Consolidated Schedule of Investments
December 31, 2017
| | | | | | | | | | | | | | | | | | | | | | | | | | | | |
| Forward Foreign Currency Contracts Open on December 31, 2017: | |
| | | | | | |
| Currency Purchased* | | | Currency Sold* | | | Settlement
Date | | Counterparty | | | Unrealized
Appreciation | | | Unrealized
(Depreciation) | | | Net Unrealized
Appreciation
(Depreciation) | |
| PHP | | | 50,065 | | | USD | | | 49,462 | | | 1/10/2018 | | | DUB | | | $ | 603 | | | $ | - | | | $ | 603 | |
| PHP | | | 450,586 | | | USD | | | 445,810 | | | 1/10/2018 | | | DUB | | | | 4,776 | | | | - | | | | 4,776 | |
| PHP | | | 1,301,692 | | | USD | | | 1,283,367 | | | 1/10/2018 | | | DUB | | | | 18,325 | | | | - | | | | 18,325 | |
| PHP | | | 8,911,585 | | | USD | | | 8,794,466 | | | 1/10/2018 | | | DUB | | | | 117,119 | | | | - | | | | 117,119 | |
| USD | | | 150,213 | | | PHP | | | 150,195 | | | 1/10/2018 | | | DUB | | | | 18 | | | | - | | | | 18 | |
| USD | | | 50,147 | | | PHP | | | 50,065 | | | 1/10/2018 | | | DUB | | | | 82 | | | | - | | | | 82 | |
| USD | | | 50,120 | | | PHP | | | 50,065 | | | 1/10/2018 | | | DUB | | | | 55 | | | | - | | | | 55 | |
| INR | | | 19,210,917 | | | USD | | | 18,954,602 | | | 1/12/2018 | | | DUB | | | | 256,315 | | | | - | | | | 256,315 | |
| INR | | | 20,149,943 | | | USD | | | 19,661,892 | | | 1/12/2018 | | | DUB | | | | 488,051 | | | | - | | | | 488,051 | |
| TWD | | | 84,075 | | | USD | | | 84,300 | | | 1/18/2018 | | | DUB | | | | - | | | | (225 | ) | | | (225 | ) |
| TWD | | | 756,672 | | | USD | | | 759,852 | | | 1/18/2018 | | | DUB | | | | - | | | | (3,180 | ) | | | (3,180 | ) |
| TWD | | | 1,345,195 | | | USD | | | 1,349,619 | | | 1/18/2018 | | | DUB | | | | - | | | | (4,424 | ) | | | (4,424 | ) |
| TWD | | | 1,681,494 | | | USD | | | 1,689,646 | | | 1/18/2018 | | | DUB | | | | - | | | | (8,152 | ) | | | (8,152 | ) |
| TWD | | | 1,765,569 | | | USD | | | 1,777,173 | | | 1/18/2018 | | | DUB | | | | - | | | | (11,604 | ) | | | (11,604 | ) |
| TWD | | | 3,951,511 | | | USD | | | 3,925,827 | | | 1/18/2018 | | | DUB | | | | 25,684 | | | | - | | | | 25,684 | |
| USD | | | 167,399 | | | TWD | | | 168,149 | | | 1/18/2018 | | | DUB | | | | - | | | | (750 | ) | | | (750 | ) |
| USD | | | 167,123 | | | TWD | | | 168,149 | | | 1/18/2018 | | | DUB | | | | - | | | | (1,026 | ) | | | (1,026 | ) |
| USD | | | 166,906 | | | TWD | | | 168,149 | | | 1/18/2018 | | | DUB | | | | - | | | | (1,243 | ) | | | (1,243 | ) |
| USD | | | 167,532 | | | TWD | | | 168,149 | | | 1/18/2018 | | | DUB | | | | - | | | | (617 | ) | | | (617 | ) |
| USD | | | 166,989 | | | TWD | | | 168,149 | | | 1/18/2018 | | | DUB | | | | - | | | | (1,160 | ) | | | (1,160 | ) |
| USD | | | 166,933 | | | TWD | | | 168,149 | | | 1/18/2018 | | | DUB | | | | - | | | | (1,216 | ) | | | (1,216 | ) |
| USD | | | 167,336 | | | TWD | | | 168,149 | | | 1/18/2018 | | | DUB | | | | - | | | | (813 | ) | | | (813 | ) |
| USD | | | 83,628 | | | TWD | | | 84,075 | | | 1/18/2018 | | | DUB | | | | - | | | | (447 | ) | | | (447 | ) |
| USD | | | 83,495 | | | TWD | | | 84,075 | | | 1/18/2018 | | | DUB | | | | - | | | | (580 | ) | | | (580 | ) |
| USD | | | 83,579 | | | TWD | | | 84,075 | | | 1/18/2018 | | | DUB | | | | - | | | | (496 | ) | | | (496 | ) |
| USD | | | 83,724 | | | TWD | | | 84,075 | | | 1/18/2018 | | | DUB | | | | - | | | | (351 | ) | | | (351 | ) |
| USD | | | 83,660 | | | TWD | | | 84,075 | | | 1/18/2018 | | | DUB | | | | - | | | | (415 | ) | | | (415 | ) |
| USD | | | 83,459 | | | TWD | | | 84,075 | | | 1/18/2018 | | | DUB | | | | - | | | | (616 | ) | | | (616 | ) |
| USD | | | 83,722 | | | TWD | | | 84,075 | | | 1/18/2018 | | | DUB | | | | - | | | | (353 | ) | | | (353 | ) |
| USD | | | 83,629 | | | TWD | | | 84,075 | | | 1/18/2018 | | | DUB | | | | - | | | | (446 | ) | | | (446 | ) |
| USD | | | 83,431 | | | TWD | | | 84,075 | | | 1/18/2018 | | | DUB | | | | - | | | | (644 | ) | | | (644 | ) |
| KRW | | | 186,892 | | | USD | | | 184,180 | | | 1/22/2018 | | | DUB | | | | 2,712 | | | | - | | | | 2,712 | |
| KRW | | | 467,231 | | | USD | | | 460,409 | | | 1/22/2018 | | | DUB | | | | 6,822 | | | | - | | | | 6,822 | |
| KRW | | | 23,361,547 | | | USD | | | 23,010,935 | | | 1/22/2018 | | | DUB | | | | 350,612 | | | | - | | | | 350,612 | |
| KRW | | | 23,828,778 | | | USD | | | 23,401,795 | | | 1/22/2018 | | | DUB | | | | 426,983 | | | | - | | | | 426,983 | |
| BRL | | | 30,147 | | | USD | | | 30,970 | | | 1/3/2018 | | | HUS | | | | - | | | | (823 | ) | | | (823 | ) |
| BRL | | | 30,147 | | | USD | | | 30,994 | | | 1/3/2018 | | | HUS | | | | - | | | | (847 | ) | | | (847 | ) |
| BRL | | | 60,294 | | | USD | | | 62,000 | | | 1/3/2018 | | | HUS | | | | - | | | | (1,706 | ) | | | (1,706 | ) |
| BRL | | | 60,294 | | | USD | | | 62,000 | | | 1/3/2018 | | | HUS | | | | - | | | | (1,706 | ) | | | (1,706 | ) |
| BRL | | | 60,294 | | | USD | | | 60,768 | | | 1/3/2018 | | | HUS | | | | - | | | | (474 | ) | | | (474 | ) |
| BRL | | | 60,294 | | | USD | | | 62,000 | | | 1/3/2018 | | | HUS | | | | - | | | | (1,706 | ) | | | (1,706 | ) |
| BRL | | | 60,294 | | | USD | | | 62,000 | | | 1/3/2018 | | | HUS | | | | - | | | | (1,706 | ) | | | (1,706 | ) |
| BRL | | | 90,440 | | | USD | | | 92,766 | | | 1/3/2018 | | | HUS | | | | - | | | | (2,326 | ) | | | (2,326 | ) |
| BRL | | | 90,440 | | | USD | | | 92,766 | | | 1/3/2018 | | | HUS | | | | - | | | | (2,326 | ) | | | (2,326 | ) |
| BRL | | | 90,440 | | | USD | | | 92,881 | | | 1/3/2018 | | | HUS | | | | - | | | | (2,441 | ) | | | (2,441 | ) |
| BRL | | | 90,440 | | | USD | | | 92,809 | | | 1/3/2018 | | | HUS | | | | - | | | | (2,369 | ) | | | (2,369 | ) |
| BRL | | | 90,440 | | | USD | | | 92,971 | | | 1/3/2018 | | | HUS | | | | - | | | | (2,531 | ) | | | (2,531 | ) |
| BRL | | | 90,440 | | | USD | | | 91,141 | | | 1/3/2018 | | | HUS | | | | - | | | | (701 | ) | | | (701 | ) |
| BRL | | | 90,440 | | | USD | | | 91,113 | | | 1/3/2018 | | | HUS | | | | - | | | | (673 | ) | | | (673 | ) |
| BRL | | | 90,440 | | | USD | | | 91,113 | | | 1/3/2018 | | | HUS | | | | - | | | | (673 | ) | | | (673 | ) |
| BRL | | | 90,440 | | | USD | | | 92,968 | | | 1/3/2018 | | | HUS | | | | - | | | | (2,528 | ) | | | (2,528 | ) |
| BRL | | | 90,440 | | | USD | | | 92,824 | | | 1/3/2018 | | | HUS | | | | - | | | | (2,384 | ) | | | (2,384 | ) |
| BRL | | | 355,732 | | | USD | | | 364,850 | | | 1/3/2018 | | | HUS | | | | - | | | | (9,118 | ) | | | (9,118 | ) |
| BRL | | | 414,519 | | | USD | | | 424,947 | | | 1/3/2018 | | | HUS | | | | - | | | | (10,428 | ) | | | (10,428 | ) |
| BRL | | | 542,643 | | | USD | | | 557,634 | | | 1/3/2018 | | | HUS | | | | - | | | �� | (14,991 | ) | | | (14,991 | ) |
| BRL | | | 544,451 | | | USD | | | 558,493 | | | 1/3/2018 | | | HUS | | | | - | | | | (14,042 | ) | | | (14,042 | ) |
| BRL | | | 560,731 | | | USD | | | 575,104 | | | 1/3/2018 | | | HUS | | | | - | | | | (14,373 | ) | | | (14,373 | ) |
| BRL | | | 572,789 | | | USD | | | 588,928 | | | 1/3/2018 | | | HUS | | | | - | | | | (16,139 | ) | | | (16,139 | ) |
See accompanying notes
15
American Beacon AHL Managed Futures Strategy FundSM
Consolidated Schedule of Investments
December 31, 2017
| | | | | | | | | | | | | | | | | | | | | | | | | | | | |
| | | | | | |
| Currency Purchased* | | | Currency Sold* | | | Settlement
Date | | Counterparty | | | Unrealized
Appreciation | | | Unrealized
(Depreciation) | | | Net Unrealized
Appreciation
(Depreciation) | |
| BRL | | | 649,362 | | | USD | | | 666,007 | | | 1/3/2018 | | | HUS | | | $ | - | | | $ | (16,645 | ) | | $ | (16,645 | ) |
| BRL | | | 679,509 | | | USD | | | 698,023 | | | 1/3/2018 | | | HUS | | | | - | | | | (18,514 | ) | | | (18,514 | ) |
| BRL | | | 790,751 | | | USD | | | 811,547 | | | 1/3/2018 | | | HUS | | | | - | | | | (20,796 | ) | | | (20,796 | ) |
| BRL | | | 934,551 | | | USD | | | 958,358 | | | 1/3/2018 | | | HUS | | | | - | | | | (23,807 | ) | | | (23,807 | ) |
| BRL | | | 942,088 | | | USD | | | 965,430 | | | 1/3/2018 | | | HUS | | | | - | | | | (23,342 | ) | | | (23,342 | ) |
| BRL | | | 1,024,992 | | | USD | | | 1,051,883 | | | 1/3/2018 | | | HUS | | | | - | | | | (26,891 | ) | | | (26,891 | ) |
| BRL | | | 1,099,153 | | | USD | | | 1,128,933 | | | 1/3/2018 | | | HUS | | | | - | | | | (29,780 | ) | | | (29,780 | ) |
| BRL | | | 1,198,939 | | | USD | | | 1,230,660 | | | 1/3/2018 | | | HUS | | | | - | | | | (31,721 | ) | | | (31,721 | ) |
| BRL | | | 1,386,753 | | | USD | | | 1,429,637 | | | 1/3/2018 | | | HUS | | | | - | | | | (42,884 | ) | | | (42,884 | ) |
| BRL | | | 33,342,377 | | | USD | | | 34,199,134 | | | 1/3/2018 | | | HUS | | | | - | | | | (856,757 | ) | | | (856,757 | ) |
| USD | | | 10,118,505 | | | BRL | | | 10,038,889 | | | 1/3/2018 | | | HUS | | | | 79,616 | | | | - | | | | 79,616 | |
| USD | | | 2,187,133 | | | BRL | | | 2,185,946 | | | 1/3/2018 | | | HUS | | | | 1,187 | | | | - | | | | 1,187 | |
| USD | | | 2,079,917 | | | BRL | | | 2,071,991 | | | 1/3/2018 | | | HUS | | | | 7,926 | | | | - | | | | 7,926 | |
| USD | | | 1,975,983 | | | BRL | | | 1,974,315 | | | 1/3/2018 | | | HUS | | | | 1,668 | | | | - | | | | 1,668 | |
| USD | | | 1,935,362 | | | BRL | | | 1,924,271 | | | 1/3/2018 | | | HUS | | | | 11,091 | | | | - | | | | 11,091 | |
| USD | | | 1,709,540 | | | BRL | | | 1,718,368 | | | 1/3/2018 | | | HUS | | | | - | | | | (8,828 | ) | | | (8,828 | ) |
| USD | | | 1,654,496 | | | BRL | | | 1,652,950 | | | 1/3/2018 | | | HUS | | | | 1,546 | | | | - | | | | 1,546 | |
| USD | | | 1,617,152 | | | BRL | | | 1,591,752 | | | 1/3/2018 | | | HUS | | | | 25,400 | | | | - | | | | 25,400 | |
| USD | | | 1,430,044 | | | BRL | | | 1,422,025 | | | 1/3/2018 | | | HUS | | | | 8,019 | | | | - | | | | 8,019 | |
| USD | | | 1,419,854 | | | BRL | | | 1,398,812 | | | 1/3/2018 | | | HUS | | | | 21,042 | | | | - | | | | 21,042 | |
| USD | | | 1,109,069 | | | BRL | | | 1,091,315 | | | 1/3/2018 | | | HUS | | | | 17,754 | | | | - | | | | 17,754 | |
| USD | | | 1,076,606 | | | BRL | | | 1,085,285 | | | 1/3/2018 | | | HUS | | | | - | | | | (8,679 | ) | | | (8,679 | ) |
| USD | | | 993,226 | | | BRL | | | 994,845 | | | 1/3/2018 | | | HUS | | | | - | | | | (1,619 | ) | | | (1,619 | ) |
| USD | | | 911,544 | | | BRL | | | 916,463 | | | 1/3/2018 | | | HUS | | | | - | | | | (4,919 | ) | | | (4,919 | ) |
| USD | | | 897,692 | | | BRL | | | 904,404 | | | 1/3/2018 | | | HUS | | | | - | | | | (6,712 | ) | | | (6,712 | ) |
| USD | | | 871,997 | | | BRL | | | 874,258 | | | 1/3/2018 | | | HUS | | | | - | | | | (2,261 | ) | | | (2,261 | ) |
| USD | | | 838,650 | | | BRL | | | 844,111 | | | 1/3/2018 | | | HUS | | | | - | | | | (5,461 | ) | | | (5,461 | ) |
| USD | | | 776,069 | | | BRL | | | 781,707 | | | 1/3/2018 | | | HUS | | | | - | | | | (5,638 | ) | | | (5,638 | ) |
| USD | | | 728,180 | | | BRL | | | 723,524 | | | 1/3/2018 | | | HUS | | | | 4,656 | | | | - | | | | 4,656 | |
| USD | | | 722,906 | | | BRL | | | 722,318 | | | 1/3/2018 | | | HUS | | | | 588 | | | | - | | | | 588 | |
| USD | | | 715,840 | | | BRL | | | 713,274 | | | 1/3/2018 | | | HUS | | | | 2,566 | | | | - | | | | 2,566 | |
| USD | | | 645,399 | | | BRL | | | 633,083 | | | 1/3/2018 | | | HUS | | | | 12,316 | | | | - | | | | 12,316 | |
| USD | | | 617,524 | | | BRL | | | 621,024 | | | 1/3/2018 | | | HUS | | | | - | | | | (3,500 | ) | | | (3,500 | ) |
| USD | | | 593,433 | | | BRL | | | 591,179 | | | 1/3/2018 | | | HUS | | | | 2,254 | | | | - | | | | 2,254 | |
| USD | | | 579,290 | | | BRL | | | 572,790 | | | 1/3/2018 | | | HUS | | | | 6,500 | | | | - | | | | 6,500 | |
| USD | | | 569,539 | | | BRL | | | 560,731 | | | 1/3/2018 | | | HUS | | | | 8,808 | | | | - | | | | 8,808 | |
| USD | | | 510,711 | | | BRL | | | 514,606 | | | 1/3/2018 | | | HUS | | | | - | | | | (3,895 | ) | | | (3,895 | ) |
| USD | | | 485,257 | | | BRL | | | 482,349 | | | 1/3/2018 | | | HUS | | | | 2,908 | | | | - | | | | 2,908 | |
| USD | | | 453,640 | | | BRL | | | 453,408 | | | 1/3/2018 | | | HUS | | | | 232 | | | | - | | | | 232 | |
| USD | | | 460,592 | | | BRL | | | 452,202 | | | 1/3/2018 | | | HUS | | | | 8,390 | | | | - | | | | 8,390 | |
| USD | | | 453,145 | | | BRL | | | 452,202 | | | 1/3/2018 | | | HUS | | | | 943 | | | | - | | | | 943 | |
| USD | | | 429,962 | | | BRL | | | 422,055 | | | 1/3/2018 | | | HUS | | | | 7,907 | | | | - | | | | 7,907 | |
| USD | | | 401,436 | | | BRL | | | 399,445 | | | 1/3/2018 | | | HUS | | | | 1,991 | | | | - | | | | 1,991 | |
| USD | | | 392,987 | | | BRL | | | 391,909 | | | 1/3/2018 | | | HUS | | | | 1,078 | | | | - | | | | 1,078 | |
| USD | | | 361,207 | | | BRL | | | 361,762 | | | 1/3/2018 | | | HUS | | | | - | | | | (555 | ) | | | (555 | ) |
| USD | | | 332,507 | | | BRL | | | 331,615 | | | 1/3/2018 | | | HUS | | | | 892 | | | | - | | | | 892 | |
| USD | | | 332,457 | | | BRL | | | 331,615 | | | 1/3/2018 | | | HUS | | | | 842 | | | | - | | | | 842 | |
| USD | | | 276,863 | | | BRL | | | 276,446 | | | 1/3/2018 | | | HUS | | | | 417 | | | | - | | | | 417 | |
| USD | | | 241,110 | | | BRL | | | 241,175 | | | 1/3/2018 | | | HUS | | | | - | | | | (65 | ) | | | (65 | ) |
| USD | | | 240,842 | | | BRL | | | 241,175 | | | 1/3/2018 | | | HUS | | | | - | | | | (333 | ) | | | (333 | ) |
| USD | | | 240,950 | | | BRL | | | 241,175 | | | 1/3/2018 | | | HUS | | | | - | | | | (225 | ) | | | (225 | ) |
| USD | | | 204,576 | | | BRL | | | 203,491 | | | 1/3/2018 | | | HUS | | | | 1,085 | | | | - | | | | 1,085 | |
| USD | | | 181,923 | | | BRL | | | 180,881 | | | 1/3/2018 | | | HUS | | | | 1,042 | | | | - | | | | 1,042 | |
| USD | | | 151,394 | | | BRL | | | 150,734 | | | 1/3/2018 | | | HUS | | | | 660 | | | | - | | | | 660 | |
| USD | | | 92,102 | | | BRL | | | 90,440 | | | 1/3/2018 | | | HUS | | | | 1,662 | | | | - | | | | 1,662 | |
| USD | | | 92,150 | | | BRL | | | 90,440 | | | 1/3/2018 | | | HUS | | | | 1,710 | | | | - | | | | 1,710 | |
| USD | | | 92,148 | | | BRL | | | 90,440 | | | 1/3/2018 | | | HUS | | | | 1,708 | | | | - | | | | 1,708 | |
| USD | | | 92,134 | | | BRL | | | 90,440 | | | 1/3/2018 | | | HUS | | | | 1,694 | | | | - | | | | 1,694 | |
| USD | | | 60,687 | | | BRL | | | 60,294 | | | 1/3/2018 | | | HUS | | | | 393 | | | | - | | | | 393 | |
See accompanying notes
16
American Beacon AHL Managed Futures Strategy FundSM
Consolidated Schedule of Investments
December 31, 2017
| | | | | | | | | | | | | | | | | | | | | | | | | | | | |
| | | | | | |
| Currency Purchased* | | | Currency Sold* | | | Settlement
Date | | Counterparty | | | Unrealized
Appreciation | | | Unrealized
(Depreciation) | | | Net Unrealized
Appreciation
(Depreciation) | |
| USD | | | 60,687 | | | BRL | | | 60,294 | | | 1/3/2018 | | | HUS | | | $ | 393 | | | $ | - | | | $ | 393 | |
| USD | | | 61,422 | | | BRL | | | 60,294 | | | 1/3/2018 | | | HUS | | | | 1,128 | | | | - | | | | 1,128 | |
| USD | | | 61,412 | | | BRL | | | 60,294 | | | 1/3/2018 | | | HUS | | | | 1,118 | | | | - | | | | 1,118 | |
| USD | | | 60,697 | | | BRL | | | 60,294 | | | 1/3/2018 | | | HUS | | | | 403 | | | | - | | | | 403 | |
| USD | | | 61,838 | | | BRL | | | 60,294 | | | 1/3/2018 | | | HUS | | | | 1,544 | | | | - | | | | 1,544 | |
| USD | | | 30,336 | | | BRL | | | 30,147 | | | 1/3/2018 | | | HUS | | | | 189 | | | | - | | | | 189 | |
| USD | | | 30,350 | | | BRL | | | 30,147 | | | 1/3/2018 | | | HUS | | | | 203 | | | | - | | | | 203 | |
| USD | | | 30,348 | | | BRL | | | 30,147 | | | 1/3/2018 | | | HUS | | | | 201 | | | | - | | | | 201 | |
| USD | | | 30,334 | | | BRL | | | 30,147 | | | 1/3/2018 | | | HUS | | | | 187 | | | | - | | | | 187 | |
| USD | | | 30,343 | | | BRL | | | 30,147 | | | 1/3/2018 | | | HUS | | | | 196 | | | | - | | | | 196 | |
| USD | | | 30,334 | | | BRL | | | 30,147 | | | 1/3/2018 | | | HUS | | | | 187 | | | | - | | | | 187 | |
| USD | | | 30,718 | | | BRL | | | 30,147 | | | 1/3/2018 | | | HUS | | | | 571 | | | | - | | | | 571 | |
| USD | | | 30,692 | | | BRL | | | 30,147 | | | 1/3/2018 | | | HUS | | | | 545 | | | | - | | | | 545 | |
| USD | | | 30,701 | | | BRL | | | 30,147 | | | 1/3/2018 | | | HUS | | | | 554 | | | | - | | | | 554 | |
| USD | | | 30,914 | | | BRL | | | 30,147 | | | 1/3/2018 | | | HUS | | | | 767 | | | | - | | | | 767 | |
| USD | | | 30,911 | | | BRL | | | 30,147 | | | 1/3/2018 | | | HUS | | | | 764 | | | | - | | | | 764 | |
| USD | | | 30,906 | | | BRL | | | 30,147 | | | 1/3/2018 | | | HUS | | | | 759 | | | | - | | | | 759 | |
| USD | | | 30,901 | | | BRL | | | 30,147 | | | 1/3/2018 | | | HUS | | | | 754 | | | | - | | | | 754 | |
| USD | | | 30,903 | | | BRL | | | 30,147 | | | 1/3/2018 | | | HUS | | | | 756 | | | | - | | | | 756 | |
| USD | | | 30,900 | | | BRL | | | 30,147 | | | 1/3/2018 | | | HUS | | | | 753 | | | | - | | | | 753 | |
| USD | | | 30,339 | | | BRL | | | 30,147 | | | 1/3/2018 | | | HUS | | | | 192 | | | | - | | | | 192 | |
| USD | | | 30,324 | | | BRL | | | 30,147 | | | 1/3/2018 | | | HUS | | | | 177 | | | | - | | | | 177 | |
| USD | | | 30,330 | | | BRL | | | 30,147 | | | 1/3/2018 | | | HUS | | | | 183 | | | | - | | | | 183 | |
| USD | | | 30,343 | | | BRL | | | 30,147 | | | 1/3/2018 | | | HUS | | | | 196 | | | | - | | | | 196 | |
| USD | | | 30,339 | | | BRL | | | 30,147 | | | 1/3/2018 | | | HUS | | | | 192 | | | | - | | | | 192 | |
| USD | | | 30,339 | | | BRL | | | 30,147 | | | 1/3/2018 | | | HUS | | | | 192 | | | | - | | | | 192 | |
| USD | | | 30,330 | | | BRL | | | 30,147 | | | 1/3/2018 | | | HUS | | | | 183 | | | | - | | | | 183 | |
| USD | | | 30,348 | | | BRL | | | 30,147 | | | 1/3/2018 | | | HUS | | | | 201 | | | | - | | | | 201 | |
| USD | | | 30,348 | | | BRL | | | 30,147 | | | 1/3/2018 | | | HUS | | | | 201 | | | | - | | | | 201 | |
| USD | | | 30,341 | | | BRL | | | 30,147 | | | 1/3/2018 | | | HUS | | | | 194 | | | | - | | | | 194 | |
| USD | | | 30,706 | | | BRL | | | 30,147 | | | 1/3/2018 | | | HUS | | | | 559 | | | | - | | | | 559 | |
| USD | | | 30,900 | | | BRL | | | 30,147 | | | 1/3/2018 | | | HUS | | | | 753 | | | | - | | | | 753 | |
| USD | | | 30,900 | | | BRL | | | 30,147 | | | 1/3/2018 | | | HUS | | | | 753 | | | | - | | | | 753 | |
| COP | | | 66,841 | | | USD | | | 66,177 | | | 1/31/2018 | | | HUS | | | | 664 | | | | - | | | | 664 | |
| COP | | | 66,841 | | | USD | | | 65,897 | | | 1/31/2018 | | | HUS | | | | 944 | | | | - | | | | 944 | |
| COP | | | 66,841 | | | USD | | | 66,320 | | | 1/31/2018 | | | HUS | | | | 521 | | | | - | | | | 521 | |
| COP | | | 66,841 | | | USD | | | 66,930 | | | 1/31/2018 | | | HUS | | | | - | | | | (89 | ) | | | (89 | ) |
| COP | | | 66,841 | | | USD | | | 66,236 | | | 1/31/2018 | | | HUS | | | | 605 | | | | - | | | | 605 | |
| COP | | | 66,841 | | | USD | | | 66,101 | | | 1/31/2018 | | | HUS | | | | 740 | | | | - | | | | 740 | |
| COP | | | 66,841 | | | USD | | | 66,029 | | | 1/31/2018 | | | HUS | | | | 812 | | | | - | | | | 812 | |
| COP | | | 66,841 | | | USD | | | 67,051 | | | 1/31/2018 | | | HUS | | | | - | | | | (210 | ) | | | (210 | ) |
| COP | | | 66,841 | | | USD | | | 67,063 | | | 1/31/2018 | | | HUS | | | | - | | | | (222 | ) | | | (222 | ) |
| COP | | | 66,841 | | | USD | | | 66,032 | | | 1/31/2018 | | | HUS | | | | 809 | | | | - | | | | 809 | |
| COP | | | 66,841 | | | USD | | | 66,690 | | | 1/31/2018 | | | HUS | | | | 151 | | | | - | | | | 151 | |
| COP | | | 66,841 | | | USD | | | 66,123 | | | 1/31/2018 | | | HUS | | | | 718 | | | | - | | | | 718 | |
| COP | | | 66,841 | | | USD | | | 65,936 | | | 1/31/2018 | | | HUS | | | | 905 | | | | - | | | | 905 | |
| COP | | | 66,841 | | | USD | | | 65,870 | | | 1/31/2018 | | | HUS | | | | 971 | | | | - | | | | 971 | |
| COP | | | 66,841 | | | USD | | | 65,995 | | | 1/31/2018 | | | HUS | | | | 846 | | | | - | | | | 846 | |
| COP | | | 66,841 | | | USD | | | 67,362 | | | 1/31/2018 | | | HUS | | | | - | | | | (521 | ) | | | (521 | ) |
| COP | | | 66,841 | | | USD | | | 65,673 | | | 1/31/2018 | | | HUS | | | | 1,168 | | | | - | | | | 1,168 | |
| COP | | | 66,841 | | | USD | | | 67,193 | | | 1/31/2018 | | | HUS | | | | - | | | | (352 | ) | | | (352 | ) |
| COP | | | 66,841 | | | USD | | | 66,870 | | | 1/31/2018 | | | HUS | | | | - | | | | (29 | ) | | | (29 | ) |
| COP | | | 66,841 | | | USD | | | 65,910 | | | 1/31/2018 | | | HUS | | | | 931 | | | | - | | | | 931 | |
| COP | | | 66,841 | | | USD | | | 66,000 | | | 1/31/2018 | | | HUS | | | | 841 | | | | - | | | | 841 | |
| COP | | | 66,841 | | | USD | | | 66,237 | | | 1/31/2018 | | | HUS | | | | 604 | | | | - | | | | 604 | |
| COP | | | 66,841 | | | USD | | | 67,136 | | | 1/31/2018 | | | HUS | | | | - | | | | (295 | ) | | | (295 | ) |
| COP | | | 66,841 | | | USD | | | 66,199 | | | 1/31/2018 | | | HUS | | | | 642 | | | | - | | | | 642 | |
| COP | | | 66,841 | | | USD | | | 66,586 | | | 1/31/2018 | | | HUS | | | | 255 | | | | - | | | | 255 | |
| COP | | | 66,841 | | | USD | | | 67,255 | | | 1/31/2018 | | | HUS | | | | - | | | | (414 | ) | | | (414 | ) |
See accompanying notes
17
American Beacon AHL Managed Futures Strategy FundSM
Consolidated Schedule of Investments
December 31, 2017
| | | | | | | | | | | | | | | | | | | | | | | | | | | | | | |
| | | | | | |
| Currency Purchased* | | | Currency Sold* | | | Settlement
Date | | | Counterparty | | | Unrealized
Appreciation | | | Unrealized
(Depreciation) | | | Net Unrealized
Appreciation
(Depreciation) | |
| COP | | | 66,841 | | | USD | | | 66,859 | | | | 1/31/2018 | | | | HUS | | | $ | - | | | $ | (18 | ) | | $ | (18 | ) |
| COP | | | 66,841 | | | USD | | | 66,649 | | | | 1/31/2018 | | | | HUS | | | | 192 | | | | - | | | | 192 | |
| COP | | | 66,841 | | | USD | | | 66,277 | | | | 1/31/2018 | | | | HUS | | | | 564 | | | | - | | | | 564 | |
| COP | | | 66,841 | | | USD | | | 66,094 | | | | 1/31/2018 | | | | HUS | | | | 747 | | | | - | | | | 747 | |
| COP | | | 66,841 | | | USD | | | 66,979 | | | | 1/31/2018 | | | | HUS | | | | - | | | | (138 | ) | | | (138 | ) |
| COP | | | 133,682 | | | USD | | | 134,559 | | | | 1/31/2018 | | | | HUS | | | | - | | | | (877 | ) | | | (877 | ) |
| COP | | | 133,682 | | | USD | | | 134,522 | | | | 1/31/2018 | | | | HUS | | | | - | | | | (840 | ) | | | (840 | ) |
| COP | | | 133,682 | | | USD | | | 133,220 | | | | 1/31/2018 | | | | HUS | | | | 462 | | | | - | | | | 462 | |
| COP | | | 133,682 | | | USD | | | 132,884 | | | | 1/31/2018 | | | | HUS | | | | 798 | | | | - | | | | 798 | |
| COP | | | 133,682 | | | USD | | | 132,388 | | | | 1/31/2018 | | | | HUS | | | | 1,294 | | | | - | | | | 1,294 | |
| COP | | | 133,682 | | | USD | | | 132,185 | | | | 1/31/2018 | | | | HUS | | | | 1,497 | | | | - | | | | 1,497 | |
| COP | | | 133,682 | | | USD | | | 133,981 | | | | 1/31/2018 | | | | HUS | | | | - | | | | (299 | ) | | | (299 | ) |
| COP | | | 133,682 | | | USD | | | 132,216 | | | | 1/31/2018 | | | | HUS | | | | 1,466 | | | | - | | | | 1,466 | |
| COP | | | 133,682 | | | USD | | | 134,096 | | | | 1/31/2018 | | | | HUS | | | | - | | | | (414 | ) | | | (414 | ) |
| COP | | | 133,682 | | | USD | | | 133,458 | | | | 1/31/2018 | | | | HUS | | | | 224 | | | | - | | | | 224 | |
| COP | | | 133,682 | | | USD | | | 134,250 | | | | 1/31/2018 | | | | HUS | | | | - | | | | (568 | ) | | | (568 | ) |
| COP | | | 133,682 | | | USD | | | 134,681 | | | | 1/31/2018 | | | | HUS | | | | - | | | | (999 | ) | | | (999 | ) |
| COP | | | 133,682 | | | USD | | | 134,667 | | | | 1/31/2018 | | | | HUS | | | | - | | | | (985 | ) | | | (985 | ) |
| COP | | | 133,682 | | | USD | | | 134,624 | | | | 1/31/2018 | | | | HUS | | | | - | | | | (942 | ) | | | (942 | ) |
| COP | | | 133,682 | | | USD | | | 133,343 | | | | 1/31/2018 | | | | HUS | | | | 339 | | | | - | | | | 339 | |
| COP | | | 133,682 | | | USD | | | 134,205 | | | | 1/31/2018 | | | | HUS | | | | - | | | | (523 | ) | | | (523 | ) |
| COP | | | 133,682 | | | USD | | | 134,175 | | | | 1/31/2018 | | | | HUS | | | | - | | | | (493 | ) | | | (493 | ) |
| COP | | | 200,522 | | | USD | | | 200,244 | | | | 1/31/2018 | | | | HUS | | | | 278 | | | | - | | | | 278 | |
| COP | | | 200,522 | | | USD | | | 199,469 | | | | 1/31/2018 | | | | HUS | | | | 1,053 | | | | - | | | | 1,053 | |
| COP | | | 200,522 | | | USD | | | 201,636 | | | | 1/31/2018 | | | | HUS | | | | - | | | | (1,114 | ) | | | (1,114 | ) |
| COP | | | 200,522 | | | USD | | | 199,521 | | | | 1/31/2018 | | | | HUS | | | | 1,001 | | | | - | | | | 1,001 | |
| COP | | | 200,522 | | | USD | | | 199,325 | | | | 1/31/2018 | | | | HUS | | | | 1,197 | | | | - | | | | 1,197 | |
| COP | | | 735,249 | | | USD | | | 730,048 | | | | 1/31/2018 | | | | HUS | | | | 5,201 | | | | - | | | | 5,201 | |
| USD | | | 65,639 | | | COP | | | 66,841 | | | | 1/31/2018 | | | | HUS | | | | - | | | | (1,202 | ) | | | (1,202 | ) |
| BRL | | | 30,046 | | | USD | | | 30,170 | | | | 2/2/2018 | | | | HUS | | | | - | | | | (124 | ) | | | (124 | ) |
| BRL | | | 30,046 | | | USD | | | 30,170 | | | | 2/2/2018 | | | | HUS | | | | - | | | | (124 | ) | | | (124 | ) |
| BRL | | | 30,046 | | | USD | | | 30,170 | | | | 2/2/2018 | | | | HUS | | | | - | | | | (124 | ) | | | (124 | ) |
| BRL | | | 30,046 | | | USD | | | 30,169 | | | | 2/2/2018 | | | | HUS | | | | - | | | | (123 | ) | | | (123 | ) |
| BRL | | | 30,046 | | | USD | | | 30,171 | | | | 2/2/2018 | | | | HUS | | | | - | | | | (125 | ) | | | (125 | ) |
| BRL | | | 30,046 | | | USD | | | 30,170 | | | | 2/2/2018 | | | | HUS | | | | - | | | | (124 | ) | | | (124 | ) |
| BRL | | | 30,046 | | | USD | | | 30,170 | | | | 2/2/2018 | | | | HUS | | | | - | | | | (124 | ) | | | (124 | ) |
| BRL | | | 30,046 | | | USD | | | 30,175 | | | | 2/2/2018 | | | | HUS | | | | - | | | | (129 | ) | | | (129 | ) |
| BRL | | | 30,046 | | | USD | | | 30,162 | | | | 2/2/2018 | | | | HUS | | | | - | | | | (116 | ) | | | (116 | ) |
| BRL | | | 30,046 | | | USD | | | 30,111 | | | | 2/2/2018 | | | | HUS | | | | - | | | | (65 | ) | | | (65 | ) |
| BRL | | | 30,046 | | | USD | | | 30,102 | | | | 2/2/2018 | | | | HUS | | | | - | | | | (56 | ) | | | (56 | ) |
| BRL | | | 30,046 | | | USD | | | 30,096 | | | | 2/2/2018 | | | | HUS | | | | - | | | | (50 | ) | | | (50 | ) |
| BRL | | | 30,046 | | | USD | | | 30,100 | | | | 2/2/2018 | | | | HUS | | | | - | | | | (54 | ) | | | (54 | ) |
| BRL | | | 30,046 | | | USD | | | 30,093 | | | | 2/2/2018 | | | | HUS | | | | - | | | | (47 | ) | | | (47 | ) |
| BRL | | | 30,046 | | | USD | | | 30,175 | | | | 2/2/2018 | | | | HUS | | | | - | | | | (129 | ) | | | (129 | ) |
| BRL | | | 30,046 | | | USD | | | 30,105 | | | | 2/2/2018 | | | | HUS | | | | - | | | | (59 | ) | | | (59 | ) |
| BRL | | | 30,046 | | | USD | | | 30,175 | | | | 2/2/2018 | | | | HUS | | | | - | | | | (129 | ) | | | (129 | ) |
| BRL | | | 60,091 | | | USD | | | 60,341 | | | | 2/2/2018 | | | | HUS | | | | - | | | | (250 | ) | | | (250 | ) |
| BRL | | | 60,091 | | | USD | | | 60,339 | | | | 2/2/2018 | | | | HUS | | | | - | | | | (248 | ) | | | (248 | ) |
| BRL | | | 60,091 | | | USD | | | 60,332 | | | | 2/2/2018 | | | | HUS | | | | - | | | | (241 | ) | | | (241 | ) |
| BRL | | | 60,091 | | | USD | | | 60,339 | | | | 2/2/2018 | | | | HUS | | | | - | | | | (248 | ) | | | (248 | ) |
| BRL | | | 60,091 | | | USD | | | 60,339 | | | | 2/2/2018 | | | | HUS | | | | - | | | | (248 | ) | | | (248 | ) |
| BRL | | | 60,091 | | | USD | | | 60,339 | | | | 2/2/2018 | | | | HUS | | | | - | | | | (248 | ) | | | (248 | ) |
| BRL | | | 60,091 | | | USD | | | 60,321 | | | | 2/2/2018 | | | | HUS | | | | - | | | | (230 | ) | | | (230 | ) |
| BRL | | | 60,091 | | | USD | | | 60,350 | | | | 2/2/2018 | | | | HUS | | | | - | | | | (259 | ) | | | (259 | ) |
| BRL | | | 60,091 | | | USD | | | 60,350 | | | | 2/2/2018 | | | | HUS | | | | - | | | | (259 | ) | | | (259 | ) |
| BRL | | | 60,091 | | | USD | | | 60,226 | | | | 2/2/2018 | | | | HUS | | | | - | | | | (135 | ) | | | (135 | ) |
| BRL | | | 60,091 | | | USD | | | 60,203 | | | | 2/2/2018 | | | | HUS | | | | - | | | | (112 | ) | | | (112 | ) |
| BRL | | | 60,091 | | | USD | | | 60,203 | | | | 2/2/2018 | | | | HUS | | | | - | | | | (112 | ) | | | (112 | ) |
| BRL | | | 60,091 | | | USD | | | 60,203 | | | | 2/2/2018 | | | | HUS | | | | - | | | | (112 | ) | | | (112 | ) |
See accompanying notes
18
American Beacon AHL Managed Futures Strategy FundSM
Consolidated Schedule of Investments
December 31, 2017
| | | | | | | | | | | | | | | | | | | | | | | | | | | | | | |
| | | | | | |
| Currency Purchased* | | | Currency Sold* | | | Settlement
Date | | | Counterparty | | | Unrealized
Appreciation | | | Unrealized
(Depreciation) | | | Net Unrealized
Appreciation
(Depreciation) | |
| BRL | | | 90,137 | | | USD | | | 90,509 | | | | 2/2/2018 | | | | HUS | | | $ | - | | | $ | (372 | ) | | $ | (372 | ) |
| BRL | | | 90,137 | | | USD | | | 90,484 | | | | 2/2/2018 | | | | HUS | | | | - | | | | (347 | ) | | | (347 | ) |
| BRL | | | 150,228 | | | USD | | | 150,734 | | | | 2/2/2018 | | | | HUS | | | | - | | | | (506 | ) | | | (506 | ) |
| BRL | | | 150,228 | | | USD | | | 150,689 | | | | 2/2/2018 | | | | HUS | | | | - | | | | (461 | ) | | | (461 | ) |
| BRL | | | 330,501 | | | USD | | | 331,257 | | | | 2/2/2018 | | | | HUS | | | | - | | | | (756 | ) | | | (756 | ) |
| BRL | | | 630,956 | | | USD | | | 633,398 | | | | 2/2/2018 | | | | HUS | | | | - | | | | (2,442 | ) | | | (2,442 | ) |
| BRL | | | 10,005,165 | | | USD | | | 10,080,065 | | | | 2/2/2018 | | | | HUS | | | | - | | | | (74,900 | ) | | | (74,900 | ) |
| CLP | | | 81,248 | | | USD | | | 79,482 | | | | 2/5/2018 | | | | HUS | | | | 1,766 | | | | - | | | | 1,766 | |
| CLP | | | 81,248 | | | USD | | | 79,734 | | | | 2/5/2018 | | | | HUS | | | | 1,514 | | | | - | | | | 1,514 | |
| CLP | | | 81,248 | | | USD | | | 79,208 | | | | 2/5/2018 | | | | HUS | | | | 2,040 | | | | - | | | | 2,040 | |
| CLP | | | 81,248 | | | USD | | | 79,626 | | | | 2/5/2018 | | | | HUS | | | | 1,622 | | | | - | | | | 1,622 | |
| CLP | | | 81,248 | | | USD | | | 79,473 | | | | 2/5/2018 | | | | HUS | | | | 1,775 | | | | - | | | | 1,775 | |
| CLP | | | 81,248 | | | USD | | | 79,177 | | | | 2/5/2018 | | | | HUS | | | | 2,071 | | | | - | | | | 2,071 | |
| CLP | | | 81,248 | | | USD | | | 79,267 | | | | 2/5/2018 | | | | HUS | | | | 1,981 | | | | - | | | | 1,981 | |
| CLP | | | 81,248 | | | USD | | | 79,109 | | | | 2/5/2018 | | | | HUS | | | | 2,139 | | | | - | | | | 2,139 | |
| CLP | | | 81,248 | | | USD | | | 79,360 | | | | 2/5/2018 | | | | HUS | | | | 1,888 | | | | - | | | | 1,888 | |
| CLP | | | 81,248 | | | USD | | | 78,710 | | | | 2/5/2018 | | | | HUS | | | | 2,538 | | | | - | | | | 2,538 | |
| CLP | | | 81,248 | | | USD | | | 78,675 | | | | 2/5/2018 | | | | HUS | | | | 2,573 | | | | - | | | | 2,573 | |
| CLP | | | 81,248 | | | USD | | | 79,780 | | | | 2/5/2018 | | | | HUS | | | | 1,468 | | | | - | | | | 1,468 | |
| CLP | | | 81,248 | | | USD | | | 79,315 | | | | 2/5/2018 | | | | HUS | | | | 1,933 | | | | - | | | | 1,933 | |
| CLP | | | 81,248 | | | USD | | | 79,185 | | | | 2/5/2018 | | | | HUS | | | | 2,063 | | | | - | | | | 2,063 | |
| CLP | | | 81,248 | | | USD | | | 79,321 | | | | 2/5/2018 | | | | HUS | | | | 1,927 | | | | - | | | | 1,927 | |
| CLP | | | 81,248 | | | USD | | | 79,194 | | | | 2/5/2018 | | | | HUS | | | | 2,054 | | | | - | | | | 2,054 | |
| CLP | | | 81,248 | | | USD | | | 79,032 | | | | 2/5/2018 | | | | HUS | | | | 2,216 | | | | - | | | | 2,216 | |
| CLP | | | 162,496 | | | USD | | | 159,267 | | | | 2/5/2018 | | | | HUS | | | | 3,229 | | | | - | | | | 3,229 | |
| CLP | | | 162,496 | | | USD | | | 159,198 | | | | 2/5/2018 | | | | HUS | | | | 3,298 | | | | - | | | | 3,298 | |
| CLP | | | 162,496 | | | USD | | | 158,398 | | | | 2/5/2018 | | | | HUS | | | | 4,098 | | | | - | | | | 4,098 | |
| CLP | | | 162,496 | | | USD | | | 158,949 | | | | 2/5/2018 | | | | HUS | | | | 3,547 | | | | - | | | | 3,547 | |
| CLP | | | 162,496 | | | USD | | | 158,891 | | | | 2/5/2018 | | | | HUS | | | | 3,605 | | | | - | | | | 3,605 | |
| CLP | | | 162,496 | | | USD | | | 159,516 | | | | 2/5/2018 | | | | HUS | | | | 2,980 | | | | - | | | | 2,980 | |
| CLP | | | 162,496 | | | USD | | | 157,958 | | | | 2/5/2018 | | | | HUS | | | | 4,538 | | | | - | | | | 4,538 | |
| CLP | | | 162,496 | | | USD | | | 158,181 | | | | 2/5/2018 | | | | HUS | | | | 4,315 | | | | - | | | | 4,315 | |
| CLP | | | 162,496 | | | USD | | | 157,389 | | | | 2/5/2018 | | | | HUS | | | | 5,107 | | | | - | | | | 5,107 | |
| CLP | | | 162,496 | | | USD | | | 157,421 | | | | 2/5/2018 | | | | HUS | | | | 5,075 | | | | - | | | | 5,075 | |
| CLP | | | 162,496 | | | USD | | | 158,218 | | | | 2/5/2018 | | | | HUS | | | | 4,278 | | | | - | | | | 4,278 | |
| CLP | | | 162,496 | | | USD | | | 158,270 | | | | 2/5/2018 | | | | HUS | | | | 4,226 | | | | - | | | | 4,226 | |
| CLP | | | 162,496 | | | USD | | | 157,451 | | | | 2/5/2018 | | | | HUS | | | | 5,045 | | | | - | | | | 5,045 | |
| CLP | | | 162,496 | | | USD | | | 159,593 | | | | 2/5/2018 | | | | HUS | | | | 2,903 | | | | - | | | | 2,903 | |
| CLP | | | 162,496 | | | USD | | | 159,610 | | | | 2/5/2018 | | | | HUS | | | | 2,886 | | | | - | | | | 2,886 | |
| CLP | | | 162,496 | | | USD | | | 158,371 | | | | 2/5/2018 | | | | HUS | | | | 4,125 | | | | - | | | | 4,125 | |
| CLP | | | 162,496 | | | USD | | | 158,655 | | | | 2/5/2018 | | | | HUS | | | | 3,841 | | | | - | | | | 3,841 | |
| CLP | | | 243,744 | | | USD | | | 238,824 | | | | 2/5/2018 | | | | HUS | | | | 4,920 | | | | - | | | | 4,920 | |
| CLP | | | 243,744 | | | USD | | | 237,632 | | | | 2/5/2018 | | | | HUS | | | | 6,112 | | | | - | | | | 6,112 | |
| CLP | | | 243,744 | | | USD | | | 241,741 | | | | 2/5/2018 | | | | HUS | | | | 2,003 | | | | - | | | | 2,003 | |
| CLP | | | 303,867 | | | USD | | | 301,506 | | | | 2/5/2018 | | | | HUS | | | | 2,361 | | | | - | | | | 2,361 | |
| CLP | | | 305,492 | | | USD | | | 303,162 | | | | 2/5/2018 | | | | HUS | | | | 2,330 | | | | - | | | | 2,330 | |
| CLP | | | 324,992 | | | USD | | | 322,072 | | | | 2/5/2018 | | | | HUS | | | | 2,920 | | | | - | | | | 2,920 | |
| CLP | | | 328,242 | | | USD | | | 328,131 | | | | 2/5/2018 | | | | HUS | | | | 111 | | | | - | | | | 111 | |
| CLP | | | 357,491 | | | USD | | | 357,881 | | | | 2/5/2018 | | | | HUS | | | | - | | | | (390 | ) | | | (390 | ) |
| CLP | | | 365,616 | | | USD | | | 362,202 | | | | 2/5/2018 | | | | HUS | | | | 3,414 | | | | - | | | | 3,414 | |
| CLP | | | 378,616 | | | USD | | | 375,153 | | | | 2/5/2018 | | | | HUS | | | | 3,463 | | | | - | | | | 3,463 | |
| CLP | | | 461,488 | | | USD | | | 457,802 | | | | 2/5/2018 | | | | HUS | | | | 3,686 | | | | - | | | | 3,686 | |
| CLP | | | 484,238 | | | USD | | | 484,005 | | | | 2/5/2018 | | | | HUS | | | | 233 | | | | - | | | | 233 | |
| CLP | | | 487,488 | | | USD | | | 487,266 | | | | 2/5/2018 | | | | HUS | | | | 222 | | | | - | | | | 222 | |
| CLP | | | 536,237 | | | USD | | | 537,433 | | | | 2/5/2018 | | | | HUS | | | | - | | | | (1,196 | ) | | | (1,196 | ) |
| CLP | | | 573,611 | | | USD | | | 568,948 | | | | 2/5/2018 | | | | HUS | | | | 4,663 | | | | - | | | | 4,663 | |
| CLP | | | 604,485 | | | USD | | | 599,623 | | | | 2/5/2018 | | | | HUS | | | | 4,862 | | | | - | | | | 4,862 | |
| CLP | | | 609,360 | | | USD | | | 604,858 | | | | 2/5/2018 | | | | HUS | | | | 4,502 | | | | - | | | | 4,502 | |
| CLP | | | 609,360 | | | USD | | | 608,104 | | | | 2/5/2018 | | | | HUS | | | | 1,256 | | | | - | | | | 1,256 | |
See accompanying notes
19
American Beacon AHL Managed Futures Strategy FundSM
Consolidated Schedule of Investments
December 31, 2017
| | | | | | | | | | | | | | | | | | | | | | | | | | | | |
| | | | | | |
| Currency Purchased* | | | Currency Sold* | | | Settlement
Date | | Counterparty | | | Unrealized
Appreciation | | | Unrealized
(Depreciation) | | | Net Unrealized
Appreciation
(Depreciation) | |
| CLP | | | 688,983 | | | USD | | | 683,119 | | | 2/5/2018 | | | HUS | | | $ | 5,864 | | | $ | - | | | $ | 5,864 | |
| CLP | | | 701,982 | | | USD | | | 696,064 | | | 2/5/2018 | | | HUS | | | | 5,918 | | | | - | | | | 5,918 | |
| CLP | | | 758,856 | | | USD | | | 751,463 | | | 2/5/2018 | | | HUS | | | | 7,393 | | | | - | | | | 7,393 | |
| CLP | | | 771,856 | | | USD | | | 770,166 | | | 2/5/2018 | | | HUS | | | | 1,690 | | | | - | | | | 1,690 | |
| CLP | | | 784,855 | | | USD | | | 784,875 | | | 2/5/2018 | | | HUS | | | | - | | | | (20 | ) | | | (20 | ) |
| CLP | | | 812,480 | | | USD | | | 813,736 | | | 2/5/2018 | | | HUS | | | | - | | | | (1,256 | ) | | | (1,256 | ) |
| CLP | | | 841,729 | | | USD | | | 834,770 | | | 2/5/2018 | | | HUS | | | | 6,959 | | | | - | | | | 6,959 | |
| CLP | | | 874,228 | | | USD | | | 867,684 | | | 2/5/2018 | | | HUS | | | | 6,544 | | | | - | | | | 6,544 | |
| CLP | | | 893,728 | | | USD | | | 894,587 | | | 2/5/2018 | | | HUS | | | | - | | | | (859 | ) | | | (859 | ) |
| CLP | | | 919,727 | | | USD | | | 912,094 | | | 2/5/2018 | | | HUS | | | | 7,633 | | | | - | | | | 7,633 | |
| CLP | | | 1,002,600 | | | USD | | | 1,002,585 | | | 2/5/2018 | | | HUS | | | | 15 | | | | - | | | | 15 | |
| CLP | | | 1,002,600 | | | USD | | | 992,796 | | | 2/5/2018 | | | HUS | | | | 9,804 | | | | - | | | | 9,804 | |
| CLP | | | 1,035,099 | | | USD | | | 1,027,360 | | | 2/5/2018 | | | HUS | | | | 7,739 | | | | - | | | | 7,739 | |
| CLP | | | 1,096,848 | | | USD | | | 1,086,640 | | | 2/5/2018 | | | HUS | | | | 10,208 | | | | - | | | | 10,208 | |
| CLP | | | 1,252,844 | | | USD | | | 1,240,995 | | | 2/5/2018 | | | HUS | | | | 11,849 | | | | - | | | | 11,849 | |
| CLP | | | 1,299,967 | | | USD | | | 1,303,034 | | | 2/5/2018 | | | HUS | | | | - | | | | (3,067 | ) | | | (3,067 | ) |
| CLP | | | 1,361,716 | | | USD | | | 1,348,121 | | | 2/5/2018 | | | HUS | | | | 13,595 | | | | - | | | | 13,595 | |
| CLP | | | 1,429,964 | | | USD | | | 1,412,724 | | | 2/5/2018 | | | HUS | | | | 17,240 | | | | - | | | | 17,240 | |
| CLP | | | 2,112,447 | | | USD | | | 2,082,936 | | | 2/5/2018 | | | HUS | | | | 29,511 | | | | - | | | | 29,511 | |
| CLP | | | 2,112,447 | | | USD | | | 2,082,602 | | | 2/5/2018 | | | HUS | | | | 29,845 | | | | - | | | | 29,845 | |
| CLP | | | 2,144,946 | | | USD | | | 2,121,961 | | | 2/5/2018 | | | HUS | | | | 22,985 | | | | - | | | | 22,985 | |
| CLP | | | 2,437,439 | | | USD | | | 2,417,522 | | | 2/5/2018 | | | HUS | | | | 19,917 | | | | - | | | | 19,917 | |
| CLP | | | 2,599,935 | | | USD | | | 2,580,063 | | | 2/5/2018 | | | HUS | | | | 19,872 | | | | - | | | | 19,872 | |
| CLP | | | 3,737,407 | | | USD | | | 3,708,601 | | | 2/5/2018 | | | HUS | | | | 28,806 | | | | - | | | | 28,806 | |
| CLP | | | 6,662,333 | | | USD | | | 6,605,924 | | | 2/5/2018 | | | HUS | | | | 56,409 | | | | - | | | | 56,409 | |
| USD | | | 1,079,331 | | | CLP | | | 1,137,472 | | | 2/5/2018 | | | HUS | | | | - | | | | (58,141 | ) | | | (58,141 | ) |
| USD | | | 1,009,730 | | | CLP | | | 1,056,224 | | | 2/5/2018 | | | HUS | | | | - | | | | (46,494 | ) | | | (46,494 | ) |
| USD | | | 853,303 | | | CLP | | | 893,728 | | | 2/5/2018 | | | HUS | | | | - | | | | (40,425 | ) | | | (40,425 | ) |
| USD | | | 770,286 | | | CLP | | | 812,480 | | | 2/5/2018 | | | HUS | | | | - | | | | (42,194 | ) | | | (42,194 | ) |
| USD | | | 770,096 | | | CLP | | | 812,480 | | | 2/5/2018 | | | HUS | | | | - | | | | (42,384 | ) | | | (42,384 | ) |
| USD | | | 692,702 | | | CLP | | | 731,232 | | | 2/5/2018 | | | HUS | | | | - | | | | (38,530 | ) | | | (38,530 | ) |
| USD | | | 623,257 | | | CLP | | | 649,984 | | | 2/5/2018 | | | HUS | | | | - | | | | (26,727 | ) | | | (26,727 | ) |
| USD | | | 611,051 | | | CLP | | | 649,984 | | | 2/5/2018 | | | HUS | | | | - | | | | (38,933 | ) | | | (38,933 | ) |
| USD | | | 621,661 | | | CLP | | | 649,984 | | | 2/5/2018 | | | HUS | | | | - | | | | (28,323 | ) | | | (28,323 | ) |
| USD | | | 610,128 | | | CLP | | | 649,984 | | | 2/5/2018 | | | HUS | | | | - | | | | (39,856 | ) | | | (39,856 | ) |
| USD | | | 549,008 | | | CLP | | | 575,236 | | | 2/5/2018 | | | HUS | | | | - | | | | (26,228 | ) | | | (26,228 | ) |
| USD | | | 545,299 | | | CLP | | | 568,736 | | | 2/5/2018 | | | HUS | | | | - | | | | (23,437 | ) | | | (23,437 | ) |
| USD | | | 538,742 | | | CLP | | | 568,736 | | | 2/5/2018 | | | HUS | | | | - | | | | (29,994 | ) | | | (29,994 | ) |
| USD | | | 534,680 | | | CLP | | | 568,736 | | | 2/5/2018 | | | HUS | | | | - | | | | (34,056 | ) | | | (34,056 | ) |
| USD | | | 458,246 | | | CLP | | | 487,488 | | | 2/5/2018 | | | HUS | | | | - | | | | (29,242 | ) | | | (29,242 | ) |
| USD | | | 457,478 | | | CLP | | | 487,488 | | | 2/5/2018 | | | HUS | | | | - | | | | (30,010 | ) | | | (30,010 | ) |
| USD | | | 458,551 | | | CLP | | | 487,488 | | | 2/5/2018 | | | HUS | | | | - | | | | (28,937 | ) | | | (28,937 | ) |
| USD | | | 458,266 | | | CLP | | | 487,488 | | | 2/5/2018 | | | HUS | | | | - | | | | (29,222 | ) | | | (29,222 | ) |
| USD | | | 464,681 | | | CLP | | | 487,488 | | | 2/5/2018 | | | HUS | | | | - | | | | (22,807 | ) | | | (22,807 | ) |
| USD | | | 458,815 | | | CLP | | | 480,988 | | | 2/5/2018 | | | HUS | | | | - | | | | (22,173 | ) | | | (22,173 | ) |
| USD | | | 422,462 | | | CLP | | | 450,114 | | | 2/5/2018 | | | HUS | | | | - | | | | (27,652 | ) | | | (27,652 | ) |
| USD | | | 382,275 | | | CLP | | | 406,240 | | | 2/5/2018 | | | HUS | | | | - | | | | (23,965 | ) | | | (23,965 | ) |
| USD | | | 383,148 | | | CLP | | | 406,240 | | | 2/5/2018 | | | HUS | | | | - | | | | (23,092 | ) | | | (23,092 | ) |
| USD | | | 382,117 | | | CLP | | | 406,240 | | | 2/5/2018 | | | HUS | | | | - | | | | (24,123 | ) | | | (24,123 | ) |
| USD | | | 381,284 | | | CLP | | | 406,240 | | | 2/5/2018 | | | HUS | | | | - | | | | (24,956 | ) | | | (24,956 | ) |
| USD | | | 384,813 | | | CLP | | | 406,240 | | | 2/5/2018 | | | HUS | | | | - | | | | (21,427 | ) | | | (21,427 | ) |
| USD | | | 382,625 | | | CLP | | | 406,240 | | | 2/5/2018 | | | HUS | | | | - | | | | (23,615 | ) | | | (23,615 | ) |
| USD | | | 381,309 | | | CLP | | | 406,240 | | | 2/5/2018 | | | HUS | | | | - | | | | (24,931 | ) | | | (24,931 | ) |
| USD | | | 381,948 | | | CLP | | | 406,240 | | | 2/5/2018 | | | HUS | | | | - | | | | (24,292 | ) | | | (24,292 | ) |
| USD | | | 310,061 | | | CLP | | | 329,867 | | | 2/5/2018 | | | HUS | | | | - | | | | (19,806 | ) | | | (19,806 | ) |
| USD | | | 305,015 | | | CLP | | | 324,992 | | | 2/5/2018 | | | HUS | | | | - | | | | (19,977 | ) | | | (19,977 | ) |
| USD | | | 306,200 | | | CLP | | | 324,992 | | | 2/5/2018 | | | HUS | | | | - | | | | (18,792 | ) | | | (18,792 | ) |
| USD | | | 251,658 | | | CLP | | | 268,118 | | | 2/5/2018 | | | HUS | | | | - | | | | (16,460 | ) | | | (16,460 | ) |
| USD | | | 231,363 | | | CLP | | | 243,744 | | | 2/5/2018 | | | HUS | | | | - | | | | (12,381 | ) | | | (12,381 | ) |
See accompanying notes
20
American Beacon AHL Managed Futures Strategy FundSM
Consolidated Schedule of Investments
December 31, 2017
| | | | | | | | | | | | | | | | | | | | | | | | | | | | |
| | | | | | |
| Currency Purchased* | | | Currency Sold* | | | Settlement
Date | | Counterparty | | | Unrealized
Appreciation | | | Unrealized
(Depreciation) | | | Net Unrealized
Appreciation
(Depreciation) | |
| USD | | | 205,906 | | | CLP | | | 219,370 | | | 2/5/2018 | | | HUS | | | $ | - | | | $ | (13,464 | ) | | $ | (13,464 | ) |
| USD | | | 196,055 | | | CLP | | | 207,995 | | | 2/5/2018 | | | HUS | | | | - | | | | (11,940 | ) | | | (11,940 | ) |
| USD | | | 159,874 | | | CLP | | | 170,621 | | | 2/5/2018 | | | HUS | | | | - | | | | (10,747 | ) | | | (10,747 | ) |
| USD | | | 153,337 | | | CLP | | | 162,496 | | | 2/5/2018 | | | HUS | | | | - | | | | (9,159 | ) | | | (9,159 | ) |
| USD | | | 154,266 | | | CLP | | | 162,496 | | | 2/5/2018 | | | HUS | | | | - | | | | (8,230 | ) | | | (8,230 | ) |
| USD | | | 153,993 | | | CLP | | | 162,496 | | | 2/5/2018 | | | HUS | | | | - | | | | (8,503 | ) | | | (8,503 | ) |
| USD | | | 154,014 | | | CLP | | | 162,496 | | | 2/5/2018 | | | HUS | | | | - | | | | (8,482 | ) | | | (8,482 | ) |
| USD | | | 148,144 | | | CLP | | | 157,621 | | | 2/5/2018 | | | HUS | | | | - | | | | (9,477 | ) | | | (9,477 | ) |
| USD | | | 144,636 | | | CLP | | | 154,371 | | | 2/5/2018 | | | HUS | | | | - | | | | (9,735 | ) | | | (9,735 | ) |
| USD | | | 111,313 | | | CLP | | | 118,622 | | | 2/5/2018 | | | HUS | | | | - | | | | (7,309 | ) | | | (7,309 | ) |
| USD | | | 110,352 | | | CLP | | | 116,997 | | | 2/5/2018 | | | HUS | | | | - | | | | (6,645 | ) | | | (6,645 | ) |
| USD | | | 77,018 | | | CLP | | | 81,248 | | | 2/5/2018 | | | HUS | | | | - | | | | (4,230 | ) | | | (4,230 | ) |
| USD | | | 77,000 | | | CLP | | | 81,248 | | | 2/5/2018 | | | HUS | | | | - | | | | (4,248 | ) | | | (4,248 | ) |
| USD | | | 77,084 | | | CLP | | | 81,248 | | | 2/5/2018 | | | HUS | | | | - | | | | (4,164 | ) | | | (4,164 | ) |
| USD | | | 77,055 | | | CLP | | | 81,248 | | | 2/5/2018 | | | HUS | | | | - | | | | (4,193 | ) | | | (4,193 | ) |
| USD | | | 77,009 | | | CLP | | | 81,248 | | | 2/5/2018 | | | HUS | | | | - | | | | (4,239 | ) | | | (4,239 | ) |
| USD | | | 77,021 | | | CLP | | | 81,248 | | | 2/5/2018 | | | HUS | | | | - | | | | (4,227 | ) | | | (4,227 | ) |
| USD | | | 77,028 | | | CLP | | | 81,248 | | | 2/5/2018 | | | HUS | | | | - | | | | (4,220 | ) | | | (4,220 | ) |
| USD | | | 77,028 | | | CLP | | | 81,248 | | | 2/5/2018 | | | HUS | | | | - | | | | (4,220 | ) | | | (4,220 | ) |
| EUR | | | 4,188,257 | | | USD | | | 4,115,956 | | | 1/11/2018 | | | RBS | | | | 72,301 | | | | - | | | | 72,301 | |
| USD | | | 10,646,844 | | | EUR | | | 10,868,582 | | | 1/11/2018 | | | RBS | | | | - | | | | (221,738 | ) | | | (221,738 | ) |
| USD | | | 9,798,426 | | | HKD | | | 9,777,957 | | | 1/11/2018 | | | RBS | | | | 20,469 | | | | - | | | | 20,469 | |
| USD | | | 7,085,524 | | | KRW | | | 7,387,800 | | | 1/11/2018 | | | RBS | | | | - | | | | (302,276 | ) | | | (302,276 | ) |
| USD | | | 3,901,926 | | | JPY | | | 3,876,751 | | | 1/11/2018 | | | RBS | | | | 25,175 | | | | - | | | | 25,175 | |
| PEN | | | 231,075 | | | USD | | | 230,967 | | | 1/26/2018 | | | RBS | | | | 108 | | | | - | | | | 108 | |
| PEN | | | 308,101 | | | USD | | | 308,328 | | | 1/26/2018 | | | RBS | | | | - | | | | (227 | ) | | | (227 | ) |
| PEN | | | 308,101 | | | USD | | | 308,165 | | | 1/26/2018 | | | RBS | | | | - | | | | (64 | ) | | | (64 | ) |
| PEN | | | 308,101 | | | USD | | | 307,801 | | | 1/26/2018 | | | RBS | | | | 300 | | | | - | | | | 300 | |
| PEN | | | 308,101 | | | USD | | | 308,324 | | | 1/26/2018 | | | RBS | | | | - | | | | (223 | ) | | | (223 | ) |
| PEN | | | 385,126 | | | USD | | | 383,612 | | | 1/26/2018 | | | RBS | | | | 1,514 | | | | - | | | | 1,514 | |
| PEN | | | 1,386,453 | | | USD | | | 1,379,634 | | | 1/26/2018 | | | RBS | | | | 6,819 | | | | - | | | | 6,819 | |
| PEN | | | 2,695,881 | | | USD | | | 2,679,036 | | | 1/26/2018 | | | RBS | | | | 16,845 | | | | - | | | | 16,845 | |
| USD | | | 834,851 | | | PEN | | | 847,277 | | | 1/26/2018 | | | RBS | | | | - | | | | (12,426 | ) | | | (12,426 | ) |
| USD | | | 759,060 | | | PEN | | | 770,252 | | | 1/26/2018 | | | RBS | | | | - | | | | (11,192 | ) | | | (11,192 | ) |
| USD | | | 457,554 | | | PEN | | | 462,151 | | | 1/26/2018 | | | RBS | | | | - | | | | (4,597 | ) | | | (4,597 | ) |
| USD | | | 377,986 | | | PEN | | | 385,126 | | | 1/26/2018 | | | RBS | | | | - | | | | (7,140 | ) | | | (7,140 | ) |
| USD | | | 228,543 | | | PEN | | | 231,076 | | | 1/26/2018 | | | RBS | | | | - | | | | (2,533 | ) | | | (2,533 | ) |
| USD | | | 152,152 | | | PEN | | | 154,050 | | | 1/26/2018 | | | RBS | | | | - | | | | (1,898 | ) | | | (1,898 | ) |
| USD | | | 152,554 | | | PEN | | | 154,050 | | | 1/26/2018 | | | RBS | | | | - | | | | (1,496 | ) | | | (1,496 | ) |
| USD | | | 152,580 | | | PEN | | | 154,050 | | | 1/26/2018 | | | RBS | | | | - | | | | (1,470 | ) | | | (1,470 | ) |
| USD | | | 152,806 | | | PEN | | | 154,050 | | | 1/26/2018 | | | RBS | | | | - | | | | (1,244 | ) | | | (1,244 | ) |
| USD | | | 152,281 | | | PEN | | | 154,050 | | | 1/26/2018 | | | RBS | | | | - | | | | (1,769 | ) | | | (1,769 | ) |
| USD | | | 76,431 | | | PEN | | | 77,025 | | | 1/26/2018 | | | RBS | | | | - | | | | (594 | ) | | | (594 | ) |
| | | | | | | | | | | | | | | | | | | | | | | | | | | | |
| | | $ | 2,603,085 | | | $ | (3,084,017 | ) | | $ | (480,932 | ) |
| | | | | | | | | | | | | | | | | | | | | | | | | | | | |
| * | All values denominated in USD. |
See accompanying notes
21
American Beacon AHL Managed Futures Strategy FundSM
Consolidated Schedule of Investments
December 31, 2017
| | |
| Glossary: |
| | |
| Counterparty Abbreviations: |
| DUB | | Deutsche Bank AG |
| HUS | | HSBC Bank (USA) |
| RBS | | Royal Bank of Scotland PLC |
|
| Currency Abbreviations: |
| BRL | | Brazilian Real |
| CLP | | Chilean Peso |
| COP | | Colombian Peso |
| EUR | | Euro |
| HKD | | Hong Kong Dollar |
| INR | | Indian Rupee |
| JPY | | Japanese Yen |
| KRW | | South Korean Won |
| PEN | | Peruvian Nuevo Sol |
| PHP | | Philippine Peso |
| TWD | | Taiwan Dollar |
| USD | | United States Dollar |
|
| Index Abbreviations: |
| CAC40 | | Euronet Paris - French Stock Market Index |
| DAX | | Deutsche Boerse AG German Stock Index |
| Euro Stoxx 50 | | Eurozone Blue-chip Index |
| FTSE 100 | | Financial Times Stock Exchange 100 Index |
| FTSE/JSE Top 40 | | Largest 40 companies ranked by full market value in the FTSE/JSE All-Share Index |
| FTSE/MIB | | Borsa Italiana- Italian Stock Market Index |
| Hang Seng | | Hong Kong Stock Market Index |
| KOSPI | | South Korean Stock Market Index |
| MSCI | | Morgan Stanley Capital International |
| MSCI EAFE | | Morgan Stanley Capital International - Europe, Australasia, and Far East |
| NASDAQ | | National Association of Securities Dealers Automated Quotations |
| NIKKEI 225 | | Nikkei Stock Average |
| OMXS30 | | Stockholm Stock Exchange’s leading share index |
| S&P 500 | | Standard & Poor’s U.S. Equity Large-Cap Index |
| S&P/TSX | | Canadian Equity Market Index |
| SPI 200 | | Australian Equity Market Index Future |
| TOPIX | | Tokyo Stock Exchange Tokyo Price Index |
|
| Exchange Abbreviations: |
| LME | | London Metal Exchange |
| JSE | | Johannesburg Stock Exchange |
| SGX | | Singapore Stock Exchange |
|
| Other Abbreviations: |
| Bobl | | Medium term debt that is issued by the Federal Republic of Germany |
| Bund | | German Federal Government Bond |
| Buxl | | Long term debt that is issued by the Federal Republic of Germany |
| EURIBOR | | Euro Interbank Offered Rate |
| GILT | | Bank of England Bonds |
| OZ | | Ounce |
| RBOB | | Reformulated Gasoline Blendstock for Oxygen Blending |
| Sugar #11 | | World Benchmark for raw sugar |
| ULSD | | Ultra-low-sulfur-diesel |
| WTI | | West Texas Intermediate |
See accompanying notes
22
American Beacon AHL Managed Futures Strategy FundSM
Consolidated Schedule of Investments
December 31, 2017
The Fund’s investments are summarized by level based on the inputs used to determine their values. As of December 31, 2017, the investments were classified as described below:
| | | | | | | | | | | | | | | | | | | | | | | | | | | | |
AHL Managed Futures Strategy Fund | | Level 1 | | | | | | Level 2 | | | | | | Level 3 | | | | | | Total | |
Assets | | | | | | | | | | | | | | | | | | | | | | | | | | | | |
Short-Term Investments | | | | | | | | | | | | | | | | | | | | | | | | | | | | |
Investment Companies | | $ | 20,549,617 | | | | | | | $ | - | | | | | | | $ | - | | | | | | | $ | 20,549,617 | |
U.S. Treasury Obligations | | | - | | | | | | | | 449,173,483 | | | | | | | | - | | | | | | | | 449,173,483 | |
| | | | | | | | | | | | | | | | | | | | | | | | | | | | |
Total Investments in Securities - Assets | | $ | 20,549,617 | | | | | | | $ | 449,173,483 | | | | | | | $ | - | | | | | | | $ | 469,723,100 | |
| | | | | | | | | | | | | | | | | | | | | | | | | | | | |
| | | | | | | |
Financial Derivative Instruments - Assets | | | | | | | | | | | | | | | | | | | | | | | | | | | | |
Futures Contracts | | $ | 19,217,960 | | | | | | | $ | - | | | | | | | $ | - | | | | | | | $ | 19,217,960 | |
Forward Foreign Currency Contracts | | | - | | | | | | | | 2,603,085 | | | | | | | | - | | | | | | | | 2,603,085 | |
| | | | | | | | | | | | | | | | | | | | | | | | | | | | |
Total Financial Derivative Instruments - Assets | | $ | 19,217,960 | | | | | | | $ | 2,603,085 | | | | | | | $ | - | | | | | | | $ | 21,821,045 | |
| | | | | | | | | | | | | | | | | | | | | | | | | | | | |
| | | | | | | |
Financial Derivative Instruments - Liabilities | | | | | | | | | | | | | | | | | | | | | | | | | | | | |
Futures Contracts | | $ | (11,612,221 | ) | | | | | | $ | - | | | | | | | $ | - | | | | | | | $ | (11,612,221 | ) |
Forward Foreign Currency Contracts | | | - | | | | | | | | (3,084,017 | ) | | | | | | | - | | | | | | | | (3,084,017 | ) |
| | | | | | | | | | | | | | | | | | | | | | | | | | | | |
Total Financial Derivative Instruments - Liabilities | | $ | (11,612,221 | ) | | | | | | $ | (3,084,017 | ) | | | | | | $ | - | | | | | | | $ | (14,696,238 | ) |
| | | | | | | | | | | | | | | | | | | | | | | | | | | | |
U.S. GAAP requires all transfers between any levels to be disclosed. The end of period timing recognition has been adopted for the transfers between levels of the Fund’s assets and liabilities. During the period ended December 31, 2017, there were no transfers between levels.
See accompanying notes
23
American Beacon Ionic Strategic Arbitrage FundSM
Schedule of Investments
December 31, 2017
| | | | | | | | | | | | | | | |
| | | Shares | | | | Fair Value |
| | | | | | | | | | | | | | | |
| SECURITIES HELD LONG - 101.39% | | | | | | | | | | | | | | | |
| COMMON STOCKS - 4.39% | | | | | | | | | | | | | | | |
| Consumer Discretionary - 0.90% | | | | | | | | | | | | | | | |
| Media - 0.61% | | | | | | | | | | | | | | | |
| Naspers Ltd., Class N, Sponsored ADR | | | | 10,590 | | | | | | | | | $ | 599,394 | |
| | | | | | | | | | | | | | | |
| | | | | | | | | | | | | | | |
| Textiles, Apparel & Luxury Goods - 0.29% | | | | | | | | | | | | | | | |
| 361 Degrees International Ltd.A | | | | 845,894 | | | | | | | | | | 292,148 | |
| | | | | | | | | | | | | | | |
| | | | | | | | | | | | | | | |
Total Consumer Discretionary | | | | | | | | | | | | | | 891,542 | |
| | | | | | | | | | | | | | | |
| | | | | | | | | | | | | | | |
| Financials - 0.53% | | | | | | | | | | | | | | | |
| Banks - 0.53% | | | | | | | | | | | | | | | |
| Bank of Kyoto Ltd.A | | | | 9,946 | | | | | | | | | | 517,404 | |
| | | | | | | | | | | | | | | |
| | | | | | | | | | | | | | | |
| Health Care - 0.10% | | | | | | | | | | | | | | | |
| Health Care Equipment & Supplies - 0.10% | | | | | | | | | | | | | | | |
| Becton Dickinson and Co. | | | | 473 | | | | | | | | | | 101,250 | |
| | | | | | | | | | | | | | | |
| | | | | | | | | | | | | | | |
| Industrials - 0.75% | | | | | | | | | | | | | | | |
| Airlines - 0.25% | | | | | | | | | | | | | | | |
| Ryanair Holdings PLCA B | | | | 13,626 | | | | | | | | | | 245,296 | |
| | | | | | | | | | | | | | | |
| | | | | | | | | | | | | | | |
| Commercial Services & Supplies - 0.28% | | | | | | | | | | | | | | | |
| Stericycle, Inc.B | | | | 4,151 | | | | | | | | | | 282,226 | |
| | | | | | | | | | | | | | | |
| | | | | | | | | | | | | | | |
| Marine - 0.22% | | | | | | | | | | | | | | | |
| DryShips, Inc. | | | | 60,890 | | | | | | | | | | 214,942 | |
| | | | | | | | | | | | | | | |
| | | | | | | | | | | | | | | |
Total Industrials | | | | | | | | | | | | | | 742,464 | |
| | | | | | | | | | | | | | | |
| | | | | | | | | | | | | | | |
| Information Technology - 0.81% | | | | | | | | | | | | | | | |
| Internet Software & Services - 0.47% | | | | | | | | | | | | | | | |
| SINA Corp.B | | | | 832 | | | | | | | | | | 83,458 | |
| Sohu.com, Inc.B | | | | 8,800 | | | | | | | | | | 381,480 | |
| | | | | | | | | | | | | | | |
| | | | | | | | | | | | | | 464,938 | |
| | | | | | | | | | | | | | | |
| | | | | | | | | | | | | | | |
| Semiconductors & Semiconductor Equipment - 0.34% | | | | | | | | | | | | | | | |
| NXP Semiconductors N.V.B | | | | 2,888 | | | | | | | | | | 338,156 | |
| | | | | | | | | | | | | | | |
| | | | | | | | | | | | | | | |
Total Information Technology | | | | | | | | | | | | | | 803,094 | |
| | | | | | | | | | | | | | | |
| | | | | | | | | | | | | | | |
| Materials - 0.87% | | | | | | | | | | | | | | | |
| Chemicals - 0.37% | | | | | | | | | | | | | | | |
| Monsanto Co. | | | | 3,132 | | | | | | | | | | 365,755 | |
| | | | | | | | | | | | | | | |
| | | | | | | | | | | | | | | |
| Metals & Mining - 0.50% | | | | | | | | | | | | | | | |
| Grupo Mexico S.A.B. de C.V., Series B | | | | 147,957 | | | | | | | | | | 488,587 | |
| | | | | | | | | | | | | | | |
| | | | | | | | | | | | | | | |
Total Materials | | | | | | | | | | | | | | 854,342 | |
| | | | | | | | | | | | | | | |
| | | | | | | | | | | | | | | |
| Real Estate - 0.12% | | | | | | | | | | | | | | | |
| Equity Real Estate Investment Trusts (REITs) - 0.12% | | | | | | | | | | | | | | | |
| Williams Scotsman Corp.B | | | | 79,352 | | | | | | | | | | 114,267 | |
| | | | | | | | | | | | | | | |
| | | | | | | | | | | | | | | |
| Telecommunication Services - 0.31% | | | | | | | | | | | | | | | |
| Wireless Telecommunication Services - 0.31% | | | | | | | | | | | | | | | |
| SoftBank Group Corp., ADR | | | | 1,000 | | | | | | | | | | 39,755 | |
See accompanying notes
24
American Beacon Ionic Strategic Arbitrage FundSM
Schedule of Investments
December 31, 2017
| | | | | | | | | | | | | | | |
| | | Shares | | | | Fair Value |
| | | | | | | | | | | | | | | |
| COMMON STOCKS - 4.39% (continued) | | | | | | | | | | | | | | | |
| Telecommunication Services - 0.31% (continued) | | | | | | | | | | | | | | | |
| Wireless Telecommunication Services - 0.31% (continued) | | | | | | | | | | | | | | | |
| SoftBank Group Corp.A | | | | 3,372 | | | | | | | | | $ | 266,399 | |
| | | | | | | | | | | | | | | |
| | | | | | | | | | | | | | 306,154 | |
| | | | | | | | | | | | | | | |
| | | | | | | | | | | | | | | |
Total Telecommunication Services | | | | | | | | | | | | | | 306,154 | |
| | | | | | | | | | | | | | | |
| | | | | | | | | | | | | | | |
Total Common Stocks (Cost $4,089,953) | | | | | | | | | | | | | | 4,330,517 | |
| | | | | | | | | | | | | | | |
| | | | | | | | | | | | | | | |
| WARRANTS - 2.91% | | | | | | | | | | | | | | | |
| Consumer Discretionary - 0.87% | | | | | | | | | | | | | | | |
| Distributors - 0.13% | | | | | | | | | | | | | | | |
| Daseke, Inc., 02/27/2022, Strike Price $11.50B | | | | 64,111 | | | | | | | | | | 130,787 | |
| | | | | | | | | | | | | | | |
| | | | | | | | | | | | | | | |
| Hotels, Restaurants & Leisure - 0.71% | | | | | | | | | | | | | | | |
| Del Taco Restaurants, Inc., 06/30/2020, Strike Price $11.50B | | | | 235,824 | | | | | | | | | | 695,681 | |
| | | | | | | | | | | | | | | |
| | | | | | | | | | | | | | | |
| Media - 0.03% | | | | | | | | | | | | | | | |
| Hemisphere Media Group, Inc., 04/04/2018, Strike Price $12.00B | | | | 261,303 | | | | | | | | | | 33,969 | |
| | | | | | | | | | | | | | | |
| | | | | | | | | | | | | | | |
Total Consumer Discretionary | | | | | | | | | | | | | | 860,437 | |
| | | | | | | | | | | | | | | |
| | | | | | | | | | | | | | | |
| Consumer Staples - 0.79% | | | | | | | | | | | | | | | |
| Food Products - 0.79% | | | | | | | | | | | | | | | |
| Hostess Brands, Inc., 11/04/2021, Strike Price $11.50B | | | | 147,337 | | | | | | | | | | 343,295 | |
| Simply Good Foods Co., 07/07/2022, Strike Price $11.50B | | | | 112,570 | | | | | | | | | | 436,772 | |
| | | | | | | | | | | | | | | |
| | | | | | | | | | | | | | 780,067 | |
| | | | | | | | | | | | | | | |
| | | | | | | | | | | | | | | |
Total Consumer Staples | | | | | | | | | | | | | | 780,067 | |
| | | | | | | | | | | | | | | |
| | | | | | | | | | | | | | | |
| Financials - 0.93% | | | | | | | | | | | | | | | |
| Banks - 0.84% | | | | | | | | | | | | | | | |
| Bank of America Corp., 10/28/2018, Strike Price $30.79B | | | | 60,275 | | | | | | | | | | 128,989 | |
| TCF Financial Corp., 11/14/2018, Strike Price $16.93B | | | | 179,929 | | | | | | | | | | 701,723 | |
| | | | | | | | | | | | | | | |
| | | | | | | | | | | | | | 830,712 | |
| | | | | | | | | | | | | | | |
| | | | | | | | | | | | | | | |
| Diversified Financial Services - 0.09% | | | | | | | | | | | | | | | |
| Avista Healthcare Public Acquisition Corp., 12/02/2021, Strike Price $5.75B | | | | 61,402 | | | | | | | | | | 17,199 | |
| M I Acquisitions, Inc., 11/14/2020, Strike Price $11.50B | | | | 41,000 | | | | | | | | | | 16,400 | |
| National Energy Services Reunited Corp., 06/05/2022, Strike Price $5.75B | | | | 34,108 | | | | | | | | | | 28,309 | |
| Stellar Acquisition III, Inc., 03/22/2022, Strike Price $11.50B | | | | 78,069 | | | | | | | | | | 24,209 | |
| | | | | | | | | | | | | | | |
| | | | | | | | | | | | | | 86,117 | |
| | | | | | | | | | | | | | | |
| | | | | | | | | | | | | | | |
Total Financials | | | | | | | | | | | | | | 916,829 | |
| | | | | | | | | | | | | | | |
| | | | | | | | | | | | | | | |
| Health Care - 0.04% | | | | | | | | | | | | | | | |
| Biotechnology - 0.04% | | | | | | | | | | | | | | | |
| BioTime, Inc., 10/01/2018, Strike Price $4.55B | | | | 270,287 | | | | | | | | | | 33,137 | |
| | | | | | | | | | | | | | | |
| | | | | | | | | | | | | | | |
| Industrials - 0.12% | | | | | | | | | | | | | | | |
| Trading Companies & Distributors - 0.12% | | | | | | | | | | | | | | | |
| Nexeo Solutions, Inc., 06/09/2021, Strike Price $11.50B | | | | 186,573 | | | | | | | | | | 120,339 | |
| | | | | | | | | | | | | | | |
| | | | | | | | | | | | | | | |
| Information Technology - 0.00% | | | | | | | | | | | | | | | |
| Technology Hardware, Storage & Peripherals - 0.00% | | | | | | | | | | | | | | | |
| Eastman Kodak Co., 09/03/2018, Strike Price $16.12B | | | | 166,714 | | | | | | | | | | 1,684 | |
| | | | | | | | | | | | | | | |
See accompanying notes
25
American Beacon Ionic Strategic Arbitrage FundSM
Schedule of Investments
December 31, 2017
| | | | | | | | | | | | | | | |
| | | Shares | | | | Fair Value |
| | | | | | | | | | | | | | | |
| WARRANTS - 2.91% (continued) | | | | | | | | | | | | | | | |
| Materials - 0.16% | | | | | | | | | | | | | | | |
| Chemicals - 0.16% | | | | | | | | | | | | | | | |
| AgroFresh Solutions, Inc., 02/19/2019, Strike Price $11.50B | | | | 380,583 | | | | | | | | | $ | 156,039 | |
| | | | | | | | | | | | | | | |
| | | | | | | | | | | | | | | |
| Metals & Mining - 0.00% | | | | | | | | | | | | | | | |
| Alio Gold, Inc., 05/30/2018, Strike Price CAD 7.00B | | | | 65,713 | | | | | | | | | | 1,438 | |
| | | | | | | | | | | | | | | |
Total Materials | | | | | | | | | | | | | | 157,477 | |
| | | | | | | | | | | | | | | |
| | | | | | | | | | | | | | | |
Total Warrants (Cost $2,810,714) | | | | | | | | | | | | | | 2,869,970 | |
| | | | | | | | | | | | | | | |
| | | | | | | | | | | | | | | |
| CONVERTIBLE PREFERRED STOCKS - 17.52% | | | | | | | | | | | | | | | |
| Financials - 5.26% | | | | | | | | | | | | | | | |
| Capital Markets - 5.26% | | | | | | | | | | | | | | | |
| Mandatory Exchangeable Trust, 5.750%, Due 6/3/2019C | | | | 5,600 | | | | | | | | | | 1,092,605 | |
| Mandatory Exchangeable Trust, 5.188%, Due 12/1/2020C | | | | 16,048 | | | | | | | | | | 1,664,579 | |
| Virtus Investment Partners, Inc., 7.250%, Due 2/1/2020, Series D | | | | 23,879 | | | | | | | | | | 2,433,270 | |
| | | | | | | | | | | | | | | |
| | | | | | | | | | | | | | 5,190,454 | |
| | | | | | | | | | | | | | | |
| | | | | | | | | | | | | | | |
Total Financials | | | | | | | | | | | | | | 5,190,454 | |
| | | | | | | | | | | | | | | |
| | | | | | | | | | | | | | | |
| Health Care - 2.73% | | | | | | | | | | | | | | | |
| Health Care Providers & Services - 0.65% | | | | | | | | | | | | | | | |
| Anthem, Inc., 5.250%, Due 5/1/2018 | | | | 11,397 | | | | | | | | | | 638,232 | |
| | | | | | | | | | | | | | | |
| | | | | | | | | | | | | | | |
| Pharmaceuticals - 2.08% | | | | | | | | | | | | | | | |
| Allergan PLC, 5.500%, Due 3/1/2018, Series A | | | | 2,473 | | | | | | | | | | 1,449,796 | |
| Teva Pharmaceutical Industries Ltd., 7.000%, Due 12/15/2018 | | | | 1,712 | | | | | | | | | | 607,452 | |
| | | | | | | | | | | | | | | |
| | | | | | | | | | | | | | 2,057,248 | |
| | | | | | | | | | | | | | | |
| | | | | | | | | | | | | | | |
Total Health Care | | | | | | | | | | | | | | 2,695,480 | |
| | | | | | | | | | | | | | | |
| | | | | | | | | | | | | | | |
| Industrials - 1.12% | | | | | | | | | | | | | | | |
| Machinery - 1.12% | | | | | | | | | | | | | | | |
| Rexnord Corp., 5.750%, Due 11/15/2019, Series A | | | | 18,947 | | | | | | | | | | 1,104,231 | |
| | | | | | | | | | | | | | | |
| | | | | | | | | | | | | | | |
| Information Technology - 3.66% | | | | | | | | | | | | | | | |
| Electronic Equipment, Instruments & Components - 1.64% | | | | | | | | | | | | | | | |
| Belden, Inc., 6.750%, Due 7/15/2019 | | | | 15,721 | | | | | | | | | | 1,620,049 | |
| | | | | | | | | | | | | | | |
| | | | | | | | | | | | | | | |
| Semiconductors & Semiconductor Equipment - 2.02% | | | | | | | | | | | | | | | |
| MTS Systems Corp., 8.750%, Due 7/1/2019 | | | | 16,785 | | | | | | | | | | 1,995,736 | |
| SunEdison, Inc., 6.750%, Series AD | | | | 500 | | | | | | | | | | 1,245 | |
| | | | | | | | | | | | | | | |
| | | | | | | | | | | | | | 1,996,981 | |
| | | | | | | | | | | | | | | |
| | | | | | | | | | | | | | | |
Total Information Technology | | | | | | | | | | | | | | 3,617,030 | |
| | | | | | | | | | | | | | | |
| | | | | | | | | | | | | | | |
| Materials - 2.20% | | | | | | | | | | | | | | | |
| Chemicals - 2.20% | | | | | | | | | | | | | | | |
| Rayonier Advanced Materials, Inc., 8.000%, Due 8/15/2019, Series A | | | | 14,988 | | | | | | | | | | 2,170,562 | |
| | | | | | | | | | | | | | | |
| | | | | | | | | | | | | | | |
| Utilities - 2.55% | | | | | | | | | | | | | | | |
| Independent Power & Renewable Electricity Producers - 1.16% | | | | | | | | | | | | | | | |
| Dynegy, Inc., 7.000%, Due 7/1/2019 | | | | 14,466 | | | | | | | | | | 1,145,997 | |
| | | | | | | | | | | | | | | |
| | | | | | | | | | | | | | | |
| Multi-Utilities - 1.39% | | | | | | | | | | | | | | | |
| Dominion Energy, Inc., 6.750%, Due 8/15/2019, Series A | | | | 26,544 | | | | | | | | | | 1,371,263 | |
| | | | | | | | | | | | | | | |
Total Utilities | | | | | | | | | | | | | | 2,517,260 | |
| | | | | | | | | | | | | | | |
| | | | | | | | | | | | | | | |
Total Convertible Preferred Stocks (Cost $17,143,195) | | | | | | | | | | | | | | 17,295,017 | |
| | | | | | | | | | | | | | | |
See accompanying notes
26
American Beacon Ionic Strategic Arbitrage FundSM
Schedule of Investments
December 31, 2017
| | | | | | | | | | | | | | | |
| | | Principal Amount* | | | | Fair Value |
| | | | | | | | | | | | | | | |
| CONVERTIBLE OBLIGATIONS - 18.67% | | | | | | | | | | | | | | | |
| Basic Materials - 2.35% | | | | | | | | | | | | | | | |
| Cleveland-Cliffs, Inc., 1.500%, Due 1/15/2025C | | | $ | 2,116,000 | | | | | | | | | $ | 2,317,020 | |
| | | | | | | | | | | | | | | |
| | | | | | | | | | | | | | | |
| Communications - 4.51% | | | | | | | | | | | | | | | |
| 51job, Inc., 3.250%, Due 4/15/2019 | | | | 1,315,000 | | | | | | | | | | 1,933,050 | |
| InterDigital, Inc., 1.500%, Due 3/1/2020 | | | | 1,315,000 | | | | | | | | | | 1,568,137 | |
| SINA Corp., 1.000%, Due 12/1/2018 | | | | 863,000 | | | | | | | | | | 951,458 | |
| | | | | | | | | | | | | | | |
| | | | | | | | | | | | | | 4,452,645 | |
| | | | | | | | | | | | | | | |
| | | | | | | | | | | | | | | |
| Consumer, Cyclical - 3.19% | | | | | | | | | | | | | | | |
| RH, 0.010%, Due 7/15/2020C | | | | 335,000 | | | | | | | | | | 325,787 | |
| Suzuki Motor Corp., 0.000%, Due 3/31/2023E | | | JPY | 200,000,000 | | | | | | | | | | 2,826,714 | |
| | | | | | | | | | | | | | | |
| | | | | | | | | | | | | | 3,152,501 | |
| | | | | | | | | | | | | | | |
| | | | | | | | | | | | | | | |
| Consumer, Non-Cyclical - 1.46% | | | | | | | | | | | | | | | |
| Depomed, Inc., 2.500%, Due 9/1/2021 | | | | 242,000 | | | | | | | | | | 204,339 | |
| Live Nation Entertainment, Inc., 2.500%, Due 5/15/2019 | | | | 956,000 | | | | | | | | | | 1,233,837 | |
| | | | | | | | | | | | | | | |
| | | | | | | | | | | | | | 1,438,176 | |
| | | | | | | | | | | | | | | |
| | | | | | | | | | | | | | | |
| Energy - 1.03% | | | | | | | | | | | | | | | |
| Ensco Jersey Finance Ltd., 3.000%, Due 1/31/2024 | | | | 1,145,000 | | | | | | | | | | 1,016,188 | |
| | | | | | | | | | | | | | | |
| | | | | | | | | | | | | | | |
| Financial - 2.27% | | | | | | | | | | | | | | | |
| IH Merger Sub LLC, 3.500%, Due 1/15/2022C | | | | 1,930,000 | | | | | | | | | | 2,241,212 | |
| | | | | | | | | | | | | | | |
| | | | | | | | | | | | | | | |
| Industrial - 1.74% | | | | | | | | | | | | | | | |
| Kaman Corp., 3.250%, Due 5/1/2024C | | | | 1,547,000 | | | | | | | | | | 1,720,071 | |
| | | | | | | | | | | | | | | |
| | | | | | | | | | | | | | | |
| Technology - 2.12% | | | | | | | | | | | | | | | |
| Medidata Solutions, Inc., 1.000%, Due 8/1/2018 | | | | 956,000 | | | | | | | | | | 1,104,180 | |
| Rambus, Inc., 1.375%, Due 2/1/2023C | | | | 986,000 | | | | | | | | | | 984,768 | |
| | | | | | | | | | | | | | | |
| | | | | | | | | | | | | | 2,088,948 | |
| | | | | | | | | | | | | | | |
| | | | | | | | | | | | | | | |
Total Convertible Obligations (Cost $17,400,566) | | | | | | | | | | | | | | 18,426,761 | |
| | | | | | | | | | | | | | | |
| | | | | | | | | | | | | | | |
| FOREIGN CORPORATE OBLIGATIONS - 4.30% | | | | | | | | | | | | | | | |
| Consumer, Non-Cyclical - 2.65% | | | | | | | | | | | | | | | |
| Terumo Corp., 0.010%, Due 12/6/2021E | | | JPY | 210,000,000 | | | | | | | | | | 2,611,604 | |
| | | | | | | | | | | | | | | |
| | | | | | | | | | | | | | | |
| Industrial - 1.65% | | | | | | | | | | | | | | | |
| Golar LNG Ltd., 2.750%, Due 2/15/2022C | | | | 1,536,000 | | | | | | | | | | 1,630,080 | |
| | | | | | | | | | | | | | | |
| | | | | | | | | | | | | | | |
Total Foreign Corporate Obligations (Cost $3,914,526) | | | | | | | | | | | | | | 4,241,684 | |
| | | | | | | | | | | | | | | |
| | | | | | | | | | | | | | | |
| COLLATERALIZED MORTGAGE OBLIGATIONS - 15.75% | | | | | | | | | | | | | | | |
| Agency CMO Interest Only - 11.56% | | | | | | | | | | | | | | | |
| Fannie Mae Interest Strip, | | | | | | | | | | | | | | | |
8.500%, Due 3/25/2023, 211 2 | | | | 179,814 | | | | | | | | | | 27,276 | |
5.000%, Due 4/25/2034, 351 5 | | | | 232,710 | | | | | | | | | | 46,839 | |
5.500%, Due 8/25/2035, 359 14 | | | | 863,495 | | | | | | | | | | 179,584 | |
5.500%, Due 10/25/2035, 359 12 | | | | 866,139 | | | | | | | | | | 187,637 | |
7.000%, Due 2/25/2037, 381 17 | | | | 669,645 | | | | | | | | | | 166,591 | |
| Fannie Mae REMIC Trust, | | | | | | | | | | | | | | | |
6.500%, Due 3/25/2027, 1997-9 H | | | | 657,204 | | | | | | | | | | 87,341 | |
7.000%, Due 10/25/2031, 2016-3 IK | | | | 803,907 | | | | | | | | | | 170,089 | |
4.500%, Due 12/25/2033, 2003-119 GI | | | | 106,282 | | | | | | | | | | 26,046 | |
5.000%, Due 3/25/2039, 2009-11 TIF | | | | 764,676 | | | | | | | | | | 147,633 | |
5.000%, Due 5/25/2039, 2009-50 GI | | | | 797,065 | | | | | | | | | | 124,877 | |
5.000%, Due 2/25/2040, 2010-16 PI | | | | 121,623 | | | | | | | | | | 27,888 | |
5.500%, Due 12/25/2043, 2014-38 QI | | | | 1,355,950 | | | | | | | | | | 356,720 | |
5.000%, Due 5/25/2045, 2015-30 EI | | | | 1,382,200 | | | | | | | | | | 278,205 | |
5.000%, Due 10/25/2045, 2015-70 JI | | | | 1,144,582 | | | | | | | | | | 231,634 | |
5.500%, Due 7/25/2046, 2016-45 MI | | | | 2,503,521 | | | | | | | | | | 556,107 | |
See accompanying notes
27
American Beacon Ionic Strategic Arbitrage FundSM
Schedule of Investments
December 31, 2017
| | | | | | | | | | | | | | | |
| | | Principal Amount* | | | | Fair Value |
| | | | | | | | | | | | | | | |
| COLLATERALIZED MORTGAGE OBLIGATIONS - 15.75% (continued) | | | | | | | | | | | | | | | |
| Agency CMO Interest Only - 11.56% (continued) | | | | | | | | | | | | | | | |
| Freddie Mac REMIC Trust, | | | | | | | | | | | | | | | |
5.500%, Due 10/15/2025, 3046 BI IO | | | $ | 1,148,878 | | | | | | | | | $ | 128,474 | |
8.500%, Due 1/15/2030, 2206 IO | | | | 111,846 | | | | | | | | | | 24,299 | |
5.500%, Due 3/15/2033, 2581 IL | | | | 683,295 | | | | | | | | | | 161,479 | |
5.500%, Due 4/15/2036, 4624 BI | | | | 2,095,665 | | | | | | | | | | 440,012 | |
1.000%, Due 3/15/2038, 3421 IO | | | | 8,741,962 | | | | | | | | | | 351,777 | |
1.751%, Due 10/15/2041, 4413 WIF | | | | 726,239 | | | | | | | | | | 37,484 | |
3.000%, Due 12/15/2042, 4594 IJ | | | | 3,388,116 | | | | | | | | | | 429,575 | |
4.231%, Due 12/15/2042, 303 157F | | | | 1,523,086 | | | | | | | | | | 297,115 | |
6.000%, Due 6/15/2045, 4496 ID | | | | 1,142,162 | | | | | | | | | | 230,460 | |
| Ginnie Mae REMIC Trust, | | | | | | | | | | | | | | | |
5.000%, Due 6/20/2035, 2014-183 IM | | | | 1,571,363 | | | | | | | | | | 346,040 | |
5.500%, Due 9/20/2036, 2016-78 TI | | | | 3,813,215 | | | | | | | | | | 321,396 | |
5.000%, Due 9/20/2038, 2016-12 KI | | | | 963,698 | | | | | | | | | | 236,835 | |
5.500%, Due 5/16/2039, 2009-76 GI | | | | 885,325 | | | | | | | | | | 146,667 | |
4.500%, Due 1/16/2040, 2016-44 PI | | | | 1,772,444 | | | | | | | | | | 366,250 | |
4.000%, Due 2/20/2040, 2015-162 LI | | | | 1,353,903 | | | | | | | | | | 221,014 | |
6.000%, Due 9/20/2040, 2016-75 IO | | | | 1,814,336 | | | | | | | | | | 424,201 | |
3.500%, Due 10/20/2041, 2013-81 PI | | | | 3,739,190 | | | | | | | | | | 454,662 | |
3.500%, Due 5/16/2042, 2015-84 IO | | | | 3,232,485 | | | | | | | | | | 605,018 | |
5.000%, Due 5/16/2042, 2013-44 IB | | | | 1,132,348 | | | | | | | | | | 277,886 | |
5.000%, Due 6/20/2043, 2013-86 IA | | | | 283,527 | | | | | | | | | | 62,914 | |
5.500%, Due 1/20/2044, 2014-2 TI | | | | 332,845 | | | | | | | | | | 65,363 | |
5.000%, Due 12/16/2045, 2015-180 CI | | | | 1,791,299 | | | | | | | | | | 417,935 | |
4.500%, Due 5/20/2046, 2016-69 WI | | | | 2,322,132 | | | | | | | | | | 498,288 | |
3.500%, Due 11/20/2046, 2016-163 MI | | | | 4,468,331 | | | | | | | | | | 512,729 | |
1.947%, Due 6/20/2065, 2015-H17 BIF H | | | | 4,012,115 | | | | | | | | | | 450,109 | |
1.730%, Due 2/20/2066, 2016-H04 KIF H | | | | 4,461,299 | | | | | | | | | | 393,152 | |
2.014%, Due 2/20/2066, 2016-H07 NIF H | | | | 4,415,113 | | | | | | | | | | 463,587 | |
2.031%, Due 4/20/2066, 2016-H13 EIF H | | | | 3,821,596 | | | | | | | | | | 434,706 | |
| | | | | | | | | | | | | | | |
| | | | | | | | | | | | | | 11,413,894 | |
| | | | | | | | | | | | | | | |
| | | | | | | | | | | | | | | |
| Agency CMO Interest Only Inverse Floater - 4.19% | | | | | | | | | | | | | | | |
| Fannie Mae REMIC Trust, | | | | | | | | | | | | | | | |
6.198%, Due 3/25/2032, 2002-8 SC, (1 mo. LIBOR + 7.750%)G | | | | 488,911 | | | | | | | | | | 101,138 | |
5.500%, Due 7/25/2033, 2004-62 TP, (1 mo. LIBOR + 38.500%)G | | | | 1,715,872 | | | | | | | | | | 342,630 | |
5.078%, Due 7/25/2035, 2005-66 LS, (1 mo. LIBOR + 6.630%)G | | | | 1,964,997 | | | | | | | | | | 323,813 | |
5.018%, Due 6/25/2036, 2006-44 SF, (1 mo. LIBOR + 6.570%)G | | | | 3,081,236 | | | | | | | | | | 465,929 | |
5.058%, Due 7/25/2036, 2007-28 GS, (1 mo. LIBOR + 6.610%)G | | | | 749,998 | | | | | | | | | | 125,482 | |
| Freddie Mac REMIC Trust, | | | | | | | | | | | | | | | |
10.348%, Due 7/15/2033, 2647 IV, (1 mo. LIBOR + 13.750%)G | | | | 507,357 | | | | | | | | | | 292,472 | |
4.573%, Due 3/15/2035, 2950 SN, (1 mo. LIBOR + 6.050%)G | | | | 705,465 | | | | | | | | | | 105,589 | |
5.223%, Due 10/15/2036, 3232 ST, (1 mo. LIBOR + 6.700%)G | | | | 153,434 | | | | | | | | | | 22,473 | |
4.973%, Due 3/15/2037, 3284 BI IO, (1 mo. LIBOR + 6.450%)G | | | | 970,968 | | | | | | | | | | 172,548 | |
5.653%, Due 7/15/2037, 3355 KI, (1 mo. LIBOR + 7.130%)G | | | | 2,060,854 | | | | | | | | | | 238,285 | |
4.553%, Due 9/15/2037, 3368 AI, (1 mo. LIBOR + 6.030%)G | | | | 1,172,550 | | | | | | | | | | 170,627 | |
1.844%, Due 4/15/2039, 4314 ITF | | | | 3,130,151 | | | | | | | | | | 160,032 | |
4.862%, Due 9/15/2041, 3997 ES, (1 mo. LIBOR + 6.930%)G | | | | 25,869 | | | | | | | | | | 25,934 | |
0.544%, Due 4/15/2043, 4517 KI, (1 mo. LIBOR + 1.071%)G | | | | 3,508,955 | | | | | | | | | | 100,017 | |
| Ginnie Mae REMIC Trust, | | | | | | | | | | | | | | | |
6.009%, Due 6/16/2032, 2002-41 SY, (1 mo. LIBOR + 7.500%)G | | | | 89,936 | | | | | | | | | | 11,090 | |
6.209%, Due 2/16/2033, 2003-11 SK, (1 mo. LIBOR + 7.700%)G | | | | 217,215 | | | | | | | | | | 28,009 | |
6.149%, Due 6/20/2033, 2004-56 S, (1 mo. LIBOR + 7.650%)G | | | | 350,021 | | | | | | | | | | 70,906 | |
4.939%, Due 10/16/2033, 2003-92 SN, (1 mo. LIBOR + 6.430%)G | | | | 146,118 | | | | | | | | | | 19,445 | |
5.099%, Due 11/20/2033, 2003-98 SC, (1 mo. LIBOR + 6.600%)G | | | | 1,041,666 | | | | | | | | | | 169,044 | |
5.599%, Due 6/20/2034, 2004-46 S, (1 mo. LIBOR + 7.100%)G | | | | 2,263,908 | | | | | | | | | | 433,632 | |
4.599%, Due 9/20/2034, 2004-86 SP, (1 mo. LIBOR + 6.100%)G | | | | 132,159 | | | | | | | | | | 13,762 | |
4.599%, Due 1/20/2035, 2009-25 SB, (1 mo. LIBOR + 6.100%)G | | | | 790,252 | | | | | | | | | | 10,606 | |
5.069%, Due 11/16/2036, 2008-83 SD, (1 mo. LIBOR + 6.560%)G | | | | 83,491 | | | | | | | | | | 14,162 | |
5.149%, Due 12/20/2037, 2007-81 SP, (1 mo. LIBOR + 6.650%)G | | | | 1,933,302 | | | | | | | | | | 323,430 | |
4.499%, Due 5/20/2040, 2016-75 SA, (1 mo. LIBOR + 6.000%)G | | | | 2,585,745 | | | | | | | | | | 371,226 | |
5.439%, Due 11/20/2044, 2014-161 SL, (1 mo. LIBOR + 6.800%)G | | | | 110,104 | | | | | | | | | | 18,657 | |
| | | | | | | | | | | | | | | |
| | | | | | | | | | | | | | 4,130,938 | |
| | | | | | | | | | | | | | | |
| | | | | | | | | | | | | | | |
Total Collateralized Mortgage Obligations (Cost $15,981,701) | | | | | | | | | | | | | | 15,544,832 | |
| | | | | | | | | | | | | | | |
See accompanying notes
28
American Beacon Ionic Strategic Arbitrage FundSM
Schedule of Investments
December 31, 2017
| | | | | | | | | | | | | | | |
| | | Shares | | | | Fair Value |
| | | | | | | | | | | | | | | |
| INVESTMENT COMPANIES - 12.22% | | | | | | | | | | | | | | | |
| Closed-End Funds - 12.22% | | | | | | | | | | | | | | | |
| Aberdeen Asia-Pacific Income Fund, Inc. | | | | 136,314 | | | | | | | | | $ | 665,212 | |
| BlackRock Corporate High Yield Fund, Inc. | | | | 43,203 | | | | | | | | | | 472,641 | |
| BlackRock Resources & Commodities Strategy Trust | | | | 112,529 | | | | | | | | | | 1,099,408 | |
| Cushing Energy Income Fund | | | | 36,285 | | | | | | | | | | 339,628 | |
| Eaton Vance Senior Income Trust | | | | 100,727 | | | | | | | | | | 656,740 | |
| Highland Floating Rate Opportunities FundB | | | | 100,213 | | | | | | | | | | 1,553,302 | |
| Invesco Dynamic Credit Opportunities Fund | | | | 37,917 | | | | | | | | | | 444,008 | |
| Invesco Senior Income Trust | | | | 203,371 | | | | | | | | | | 892,799 | |
| Morgan Stanley Emerging Markets Domestic Debt Fund, Inc. | | | | 69,869 | | | | | | | | | | 537,991 | |
| Nuveen Credit Strategies Income Fund | | | | 116,450 | | | | | | | | | | 957,219 | |
| Pershing Square Holdings Ltd./FundA B | | | | 146,705 | | | | | | | | | | 2,004,934 | |
| Prudential Short Duration High Yield Fund, Inc. | | | | 55,485 | | | | | | | | | | 819,514 | |
| Voya Prime Rate Trust | | | | 166,159 | | | | | | | | | | 842,426 | |
| Western Asset Global High Income Fund, Inc. | | | | 24,687 | | | | | | | | | | 252,301 | |
| Western Asset High Income Opportunity Fund, Inc. | | | | 104,163 | | | | | | | | | | 528,106 | |
| | | | | | | | | | | | | | | |
Total Closed-End Funds | | | | | | | | | | | | | | 12,066,229 | |
| | | | | | | | | | | | | | | |
| | | | | | | | | | | | | | | |
Total Investment Companies (Cost $11,865,540) | | | | | | | | | | | | | | 12,066,229 | |
| | | | | | | | | | | | | | | |
| | | | | | | | | | | | | | | |
| EXCHANGE-TRADED INSTRUMENTS - 5.85% | | | | | | | | | | | | | | | |
| Exchange-Traded Funds - 1.60% | | | | | | | | | | | | | | | |
| CurrencyShares Japanese Yen Trust ETFB | | | | 300 | | | | | | | | | | 25,542 | |
| iShares MSCI Emerging Markets ETF | | | | 4,888 | | | | | | | | | | 230,323 | |
| SPDR Bloomberg Barclays Short Term High Yield Bond ETF | | | | 47,888 | | | | | | | | | | 1,319,793 | |
| | | | | | | | | | | | | | | |
| | | | | | | | | | | | | | | |
Total Exchange-Traded Funds | | | | | | | | | | | | | | 1,575,658 | |
| | | | | | | | | | | | | | | |
| | | | | | | | | | | | | | | |
| Exchange-Traded Notes - 4.25% | | | | | | | | | | | | | | | |
| ETRACS 2x Leveraged Long Wells Fargo Business Development Co. Index ETN | | | | 30,427 | | | | | | | | | | 500,524 | |
| ETRACS 2X Monthly Leveraged Algerian MLP Infrastructure Index ETN, Series B | | | | 30,066 | | | | | | | | | | 1,133,188 | |
| ETRACS Monthly Pay 2x Leveraged Closed-End Fund ETN | | | | 28,151 | | | | | | | | | | 510,096 | |
| ETRACS Monthly Pay 2x Leveraged Mortgage REIT ETN | | | | 28,548 | | | | | | | | | | 503,872 | |
| iPath S&P 500 VIX Mid-Term Futures ETNB | | | | 39,404 | | | | | | | | | | 689,570 | |
| VelocityShares Daily Inverse VIX Short Term ETNB | | | | 6,417 | | | | | | | | | | 862,702 | |
| | | | | | | | | | | | | | | |
Total Exchange-Traded Notes | | | | | | | | | | | | | | 4,199,952 | |
| | | | | | | | | | | | | | | |
| | | | | | | | | | | | | | | |
Total Exchange-Traded Instruments (Cost $5,638,661) | | | | | | | | | | | | | | 5,775,610 | |
| | | | | | | | | | | | | | | |
| | | | | | | | | | | | | | | |
| SHORT-TERM INVESTMENTS - 19.78% (Cost $19,527,208) | | | | | | | | | | | | | | | |
| Investment Companies - 19.78% | | | | | | | | | | | | | | | |
| American Beacon U.S. Government Money Market Select Fund, Select Class, 1.13%I J | | | | 19,527,208 | | | | | | | | | | 19,527,208 | |
| | | | | | | | | | | | | | | |
| | | | | | | | | | | | | | | |
TOTAL SECURITIES HELD LONG (Cost $98,372,064) | | | | | | | | | | | | | | 100,077,828 | |
| | | | | | | | | | | | | | | |
| | | | | | | | | | | | | | | |
| SECURITIES SOLD SHORT - (53.82%) | | | | | | | | | | | | | | | |
| COMMON STOCKS - (43.17%) | | | | | | | | | | | | | | | |
| Consumer Discretionary - (7.37%) | | | | | | | | | | | | | | | |
| Automobiles - (2.49%) | | | | | | | | | | | | | | | |
| Suzuki Motor Corp.A | | | | (42,500 | ) | | | | | | | | | (2,461,604 | ) |
| | | | | | | | | | | | | | | |
| | | | | | | | | | | | | | | |
| Hotels, Restaurants & Leisure - (1.99%) | | | | | | | | | | | | | | | |
| Del Taco Restaurants, Inc.B | | | | (162,050 | ) | | | | | | | | | (1,964,046 | ) |
| | | | | | | | | | | | | | | |
| | | | | | | | | | | | | | | |
| Media - (2.79%) | | | | | | | | | | | | | | | |
| Hemisphere Media Group, Inc., Class AB | | | | (54,543 | ) | | | | | | | | | (629,972 | ) |
| Live Nation Entertainment, Inc.B | | | | (22,695 | ) | | | | | | | | | (966,126 | ) |
| New York Times Co., Class A | | | | (62,441 | ) | | | | | | | | | (1,155,158 | ) |
| | | | | | | | | | | | | | | |
| | | | | | | | | | | | | | (2,751,256 | ) |
| | | | | | | | | | | | | | | |
| | | | | | | | | | | | | | | |
See accompanying notes
29
American Beacon Ionic Strategic Arbitrage FundSM
Schedule of Investments
December 31, 2017
| | | | | | | | | | | | | | | |
| | | Shares | | | | Fair Value |
| | | | | | | | | | | | | | | |
| COMMON STOCKS - (43.17%) (continued) | | | | | | | | | | | | | | | |
| Consumer Discretionary - (7.37%) (continued) | | | | | | | | | | | | | | | |
| Specialty Retail - (0.10%) | | | | | | | | | | | | | | | |
| Restoration HardwareB | | | | (1,175 | ) | | | | | | | | $ | (101,297 | ) |
| | | | | | | | | | | | | | | |
| | | | | | | | | | | | | | | |
Total Consumer Discretionary | | | | | | | | | | | | | | (7,278,203 | ) |
| | | | | | | | | | | | | | | |
| | | | | | | | | | | | | | | |
| Consumer Staples - (2.19%) | | | | | | | | | | | | | | | |
| Food Products - (2.19%) | | | | | | | | | | | | | | | |
| Hostess Brands, Inc.B | | | | (59,757 | ) | | | | | | | | | (885,001 | ) |
| Simply Good Foods Co.B | | | | (89,441 | ) | | | | | | | | | (1,275,429 | ) |
| | | | | | | | | | | | | | | |
| | | | | | | | | | | | | | (2,160,430 | ) |
| | | | | | | | | | | | | | | |
| | | | | | | | | | | | | | | |
Total Consumer Staples | | | | | | | | | | | | | | (2,160,430 | ) |
| | | | | | | | | | | | | | | |
| | | | | | | | | | | | | | | |
| Energy - (0.67%) | | | | | | | | | | | | | | | |
| Energy Equipment & Services - 0.00% | | | | | | | | | | | | | | | |
| Ensco PLC, Class A | | | | (59 | ) | | | | | | | | | (348 | ) |
| | | | | | | | | | | | | | | |
| | | | | | | | | | | | | | | |
| Oil, Gas & Consumable Fuels - (0.67%) | | | | | | | | | | | | | | | |
| Golar LNG Ltd. | | | | (22,059 | ) | | | | | | | | | (657,579 | ) |
| | | | | | | | | | | | | | | |
| | | | | | | | | | | | | | | |
Total Energy | | | | | | | | | | | | | | (657,927 | ) |
| | | | | | | | | | | | | | | |
| | | | | | | | | | | | | | | |
| Financials - (6.79%) | | | | | | | | | | | | | | | |
| Banks - (4.84%) | | | | | | | | | | | | | | | |
| Associated Banc-Corp | | | | (53,363 | ) | | | | | | | | | (1,355,420 | ) |
| Bank of America Corp. | | | | (53,636 | ) | | | | | | | | | (1,583,335 | ) |
| TCF Financial Corp. | | | | (89,479 | ) | | | | | | | | | (1,834,320 | ) |
| | | | | | | | | | | | | | | |
| | | | | | | | | | | | | | (4,773,075 | ) |
| | | | | | | | | | | | | | | |
| | | | | | | | | | | | | | | |
| Capital Markets - (1.95%) | | | | | | | | | | | | | | | |
| Virtus Investment Partners, Inc. | | | | (16,766 | ) | | | | | | | | | (1,928,928 | ) |
| | | | | | | | | | | | | | | |
| | | | | | | | | | | | | | | |
Total Financials | | | | | | | | | | | | | | (6,702,003 | ) |
| | | | | | | | | | | | | | | |
| | | | | | | | | | | | | | | |
| Health Care - (4.71%) | | | | | | | | | | | | | | | |
| Biotechnology - (0.04%) | | | | | | | | | | | | | | | |
| BioTime, Inc.B | | | | (20,287 | ) | | | | | | | | | (43,617 | ) |
| | | | | | | | | | | | | | | |
| | | | | | | | | | | | | | | |
| Health Care Equipment & Supplies - (2.06%) | | | | | | | | | | | | | | | |
| Becton Dickinson and Co. | | | | (473 | ) | | | | | | | | | (101,288 | ) |
| Terumo Corp.A | | | | (40,778 | ) | | | | | | | | | (1,926,794 | ) |
| | | | | | | | | | | | | | | |
| | | | | | | | | | | | | | (2,028,082 | ) |
| | | | | | | | | | | | | | | |
| | | | | | | | | | | | | | | |
| Health Care Providers & Services - (0.53%) | | | | | | | | | | | | | | | |
| Anthem, Inc. | | | | (2,328 | ) | | | | | | | | | (523,823 | ) |
| | | | | | | | | | | | | | | |
| | | | | | | | | | | | | | | |
| Health Care Technology - (0.77%) | | | | | | | | | | | | | | | |
| Medidata Solutions, Inc.B | | | | (12,020 | ) | | | | | | | | | (761,707 | ) |
| | | | | | | | | | | | | | | |
| | | | | | | | | | | | | | | |
| Pharmaceuticals - (1.31%) | | | | | | | | | | | | | | | |
| Allergan PLC | | | | (7,438 | ) | | | | | | | | | (1,216,708 | ) |
| Depomed, Inc.B | | | | (8,900 | ) | | | | | | | | | (71,645 | ) |
| | | | | | | | | | | | | | | |
| | | | | | | | | | | | | | (1,288,353 | ) |
| | | | | | | | | | | | | | | |
| | | | | | | | | | | | | | | |
Total Health Care | | | | | | | | | | | | | | (4,645,582 | ) |
| | | | | | | | | | | | | | | |
| | | | | | | | | | | | | | | |
See accompanying notes
30
American Beacon Ionic Strategic Arbitrage FundSM
Schedule of Investments
December 31, 2017
| | | | | | | | | | | | | | | |
| | | Shares | | | | Fair Value |
| | | | | | | | | | | | | | | |
| COMMON STOCKS - (43.17%) (continued) | | | | | | | | | | | | | | | |
| Industrials - (4.35%) | | | | | | | | | | | | | | | |
| Airlines - (0.29%) | | | | | | | | | | | | | | | |
| Ryanair Holdings PLC, Sponsored ADRB | | | | (2,725 | ) | | | | | | | | $ | (283,918 | ) |
| | | | | | | | | | | | | | | |
| | | | | | | | | | | | | | | |
| Machinery - (0.83%) | | | | | | | | | | | | | | | |
| Rexnord Corp.A | | | | (31,265 | ) | | | | | | | | | (813,515 | ) |
| | | | | | | | | | | | | | | |
| | | | | | | | | | | | | | | |
| Professional Services - (1.76%) | | | | | | | | | | | | | | | |
| 51job, Inc., ADRB | | | | (28,595 | ) | | | | | | | | | (1,740,006 | ) |
| | | | | | | | | | | | | | | |
| | | | | | | | | | | | | | | |
| Road & Rail - (0.37%) | | | | | | | | | | | | | | | |
| Daseke, Inc.B | | | | (25,666 | ) | | | | | | | | | (366,767 | ) |
| | | | | | | | | | | | | | | |
| | | | | | | | | | | | | | | |
| Trading Companies & Distributors - (1.10%) | | | | | | | | | | | | | | | |
| Kaman Corp. | | | | (14,364 | ) | | | | | | | | | (845,178 | ) |
| Nexeo Solutions, Inc.B | | | | (26,598 | ) | | | | | | | | | (242,042 | ) |
| | | | | | | | | | | | | | | |
| | | | | | | | | | | | | | (1,087,220 | ) |
| | | | | | | | | | | | | | | |
| | | | | | | | | | | | | | | |
Total Industrials | | | | | | | | | | | | | | (4,291,426 | ) |
| | | | | | | | | | | | | | | |
| | | | | | | | | | | | | | | |
| Information Technology - (10.00%) | | | | | | | | | | | | | | | |
| Communications Equipment - (0.70%) | | | | | | | | | | | | | | | |
| InterDigital, Inc. | | | | (9,105 | ) | | | | | | | | | (693,346 | ) |
| | | | | | | | | | | | | | | |
| | | | | | | | | | | | | | | |
| Electronic Equipment, Instruments & Components - (3.07%) | | | | | | | | | | | | | | | |
| Belden, Inc. | | | | (16,662 | ) | | | | | | | | | (1,285,807 | ) |
| MTS Systems Corp. | | | | (32,433 | ) | | | | | | | | | (1,741,652 | ) |
| | | | | | | | | | | | | | | |
| | | | | | | | | | | | | | (3,027,459 | ) |
| | | | | | | | | | | | | | | |
| | | | | | | | | | | | | | | |
| Internet Software & Services - (4.96%) | | | | | | | | | | | | | | | |
| Alibaba Group Holding Ltd., Sponsored ADRB | | | | (17,486 | ) | | | | | | | | | (3,015,111 | ) |
| Altaba, Inc.B | | | | (9,625 | ) | | | | | | | | | (672,306 | ) |
| Tencent Holdings Ltd., ADR | | | | (12,193 | ) | | | | | | | | | (633,060 | ) |
| Weibo Corp., Sponsored ADRB | | | | (5,623 | ) | | | | | | | | | (581,756 | ) |
| | | | | | | | | | | | | | | |
| | | | | | | | | | | | | | (4,902,233 | ) |
| | | | | | | | | | | | | | | |
| | | | | | | | | | | | | | | |
| Semiconductors & Semiconductor Equipment - (0.41%) | | | | | | | | | | | | | | | |
| Rambus, Inc.B | | | | (28,662 | ) | | | | | | | | | (407,573 | ) |
| | | | | | | | | | | | | | | |
| | | | | | | | | | | | | | | |
| Software - (0.86%) | | | | | | | | | | | | | | | |
| VMware, Inc., Class AB | | | | (6,752 | ) | | | | | | | | | (846,161 | ) |
| | | | | | | | | | | | | | | |
| | | | | | | | | | | | | | | |
Total Information Technology | | | | | | | | | | | | | | (9,876,772 | ) |
| | | | | | | | | | | | | | | |
| | | | | | | | | | | | | | | |
| Materials - (4.15%) | | | | | | | | | | | | | | | |
| Chemicals - (2.65%) | | | | | | | | | | | | | | | |
| AgroFresh Solutions, Inc.B | | | | (88,469 | ) | | | | | | | | | (654,671 | ) |
| Rayonier Advanced Materials, Inc. | | | | (96,063 | ) | | | | | | | | | (1,964,488 | ) |
| | | | | | | | | | | | | | | |
| | | | | | | | | | | | | | (2,619,159 | ) |
| | | | | | | | | | | | | | | |
| | | | | | | | | | | | | | | |
| Metals & Mining - (1.50%) | | | | | | | | | | | | | | | |
| Cleveland-Cliffs, Inc.B | | | | (137,163 | ) | | | | | | | | | (988,945 | ) |
| Southern Copper Corp. | | | | (10,334 | ) | | | | | | | | | (490,348 | ) |
| | | | | | | | | | | | | | | |
| | | | | | | | | | | | | | (1,479,293 | ) |
| | | | | | | | | | | | | | | |
| | | | | | | | | | | | | | | |
Total Materials | | | | | | | | | | | | | | (4,098,452 | ) |
| | | | | | | | | | | | | | | |
| | | | | | | | | | | | | | | |
See accompanying notes
31
American Beacon Ionic Strategic Arbitrage FundSM
Schedule of Investments
December 31, 2017
| | | | | | | | | | | | | | | |
| | | Shares | | | | Fair Value |
| | | | | | | | | | | | | | | |
| COMMON STOCKS - (43.17%) (continued) | | | | | | | | | | | | | | | |
| Real Estate - (1.42%) | | | | | | | | | | | | | | | |
| Equity Real Estate Investment Trusts (REITs) - (1.42%) | | | | | | | | | | | | | | | |
| Invitation Homes, Inc. | | | | (59,548 | ) | | | | | | | | $ | (1,403,546 | ) |
| | | | | | | | | | | | | | | |
| | | | | | | | | | | | | | | |
| Utilities - (1.52%) | | | | | | | | | | | | | | | |
| Independent Power & Renewable Electricity Producers - (0.86%) | | | | | | | | | | | | | | | |
| Dynegy, Inc.B | | | | (71,530 | ) | | | | | | | | | (847,631 | ) |
| | | | | | | | | | | | | | | |
| | | | | | | | | | | | | | | |
| Multi-Utilities - (0.66%) | | | | | | | | | | | | | | | |
| Dominion Energy, Inc. | | | | (8,019 | ) | | | | | | | | | (650,020 | ) |
| | | | | | | | | | | | | | | |
Total Utilities | | | | | | | | | | | | | | (1,497,651 | ) |
| | | | | | | | | | | | | | | |
| | | | | | | | | | | | | | | |
TOTAL COMMON STOCKS (Proceeds $(41,100,222)) | | | | | | | | | | | | | | (42,611,992 | ) |
| | | | | | | | | | | | | | | |
| | | |
| | | Principal Amount | | | | |
| | | | | | | | | | | | | | | |
| CORPORATE OBLIGATIONS - (1.64%) | | | | | | | | | | | | | | | |
| Energy - (0.83%) | | | | | | | | | | | | | | | |
| Ensco PLC, 4.500%, Due 10/1/2024 | | | $ | (981,000 | ) | | | | | | | | | (824,040 | ) |
| | | | | | | | | | | | | | | |
| | | | | | | | | | | | | | | |
| Materials - (0.81%) | | | | | | | | | | | | | | | |
| Cleveland-Cliffs, Inc., 5.750%, Due 3/1/2025C | | | | (839,000 | ) | | | | | | | | | (798,099 | ) |
| | | | | | | | | | | | | | | |
| | | | | | | | | | | | | | | |
TOTAL CORPORATE OBLIGATIONS (Proceeds $(1,609,860)) | | | | | | | | | | | | | | (1,622,139 | ) |
| | | | | | | | | | | | | | | |
| | | | | | | | | | | | | | | |
| | | |
| | | Shares | | | | |
| | | | | | | | | | | | | | | |
| EXCHANGE-TRADED INSTRUMENTS - (9.01%) | | | | | | | | | | | | | | | |
| Exchange-Traded Funds - (9.01%) | | | | | | | | | | | | | | | |
| CurrencyShares Euro TrustB | | | | (20,744 | ) | | | | | | | | | (2,398,214 | ) |
| Direxion Daily Gold Miners Index Bear 3X Shares ETFB | | | | (9,244 | ) | | | | | | | | | (219,083 | ) |
| Direxion Daily Gold Miners Index Bull 3X Shares ETFB | | | | (17,368 | ) | | | | | | | | | (550,566 | ) |
| iShares China Large-Cap ETF | | | | (72,749 | ) | | | | | | | | | (3,358,821 | ) |
| iShares MSCI EAFE ETF | | | | (28,861 | ) | | | | | | | | | (2,029,217 | ) |
| SPDR Euro Stoxx 50 ETF | | | | (5,165 | ) | | | | | | | | | (210,267 | ) |
| SPDR S&P 500 ETF Trust | | | | (450 | ) | | | | | | | | | (120,087 | ) |
| VanEck Vectors Gold Miners ETF | | | | (239 | ) | | | | | | | | | (5,554 | ) |
| | | | | | | | | | | | | | | |
Total Exchange-Traded Funds | | | | | | | | | | | | | | (8,891,809 | ) |
| | | | | | | | | | | | | | | |
| | | | | | | | | | | | | | | |
TOTAL EXCHANGE-TRADED INSTRUMENTS (Proceeds $(8,982,522)) | | | | | | | | | | | | | | (8,891,809 | ) |
| | | | | | | | | | | | | | | |
| | | | | | | | | | | | | | | |
TOTAL SECURITIES SOLD SHORT (Proceeds $(51,692,604)) | | | | | | | | | | | | | | (53,125,940 | ) |
| | | | | | | | | | | | | | | |
| | | | | | | | | | | | | | | |
TOTAL INVESTMENTS IN SECURITIES (EXCLUDES SECURITIES SOLD SHORT) - 101.39% (Cost $98,372,064) | | | | | | | | | | | | | | 100,077,828 | |
TOTAL PURCHASED OPTIONS CONTRACTS - 6.55% (Premiums Paid $9,189,118) | | | | | | | | | | | | | | 6,464,733 | |
TOTAL WRITTEN OPTIONS CONTRACTS - (3.79%) (Premiums Received $(2,947,551)) | | | | | | | | | | | | | | (3,744,290 | ) |
TOTAL SECURITIES SOLD SHORT - (53.82%) (Proceeds $(51,692,604)) | | | | | | | | | | | | | | (53,125,940 | ) |
OTHER ASSETS, NET OF OTHER LIABILITIES - 49.67% | | | | | | | | | | | | | | 49,037,519 | |
| | | | | | | | | | | | | | | |
NET ASSETS - 100.00% | | | | | | | | | | | | | $ | 98,709,850 | |
| | | | | | | | | | | | | | | |
| | | | | | | | | | | | | | | |
Percentages are stated as a percent of net assets. *In U.S. Dollars unless otherwise noted. | | | | | | | | | | | | | | | |
A Fair valued pursuant to procedures approved by the Board of Trustees. At period end, the value of these securities amounted to $(1,288,861) or (1.30)% of net assets. Valuation was determined using significant unobservable inputs.
B Non-income producing security.
C Security exempt from registration under the Securities Act of 1933. These securities may be resold to qualified institutional buyers pursuant to Rule 144A. At the period end, the value of these securities amounted to $8,861,003 or 8.98% of net assets. The Fund has no right to demand registration of these securities.
See accompanying notes
32
American Beacon Ionic Strategic Arbitrage FundSM
Schedule of Investments
December 31, 2017
D A type of Preferred Stock that has no maturity date.
E Reg S - Security purchased under the Securities Act of 1933, which exempts from registration securities offered and sold outside of the United States. Such a security cannot be sold in the United States without either an effective registration statement filed pursuant to the Securities Act of 1933, or pursuant to an exemption from registration.
F Coupon rate may change based on changes of the underlying collateral or prepayments of principal. The coupon rate shown represents the rate at period end.
G Variable, floating, or adjustable rate securities with an interest rate that changes periodically. Rates are periodically reset with rates that are based on a predetermined benchmark such as a widely followed interest rate such as T-bills, LIBOR or PRIME plus a fixed spread. The interest rate disclosed reflects the rate in effect on December 31, 2017.
H Value was determined using significant unobservable inputs.
I The Fund is affiliated by having the same investment advisor.
J 7-day yield.
ADR - American Depositary Receipt.
CMO - Collateralized Mortgage Obligation.
ETF - Exchange Traded Fund.
ETN - Exchange Traded Note.
Euro Stoxx 50 - Eurozone Blue-chip Index.
LIBOR - London Interbank Offered Rate.
LLC - Limited Liability Company.
MLP - Master Limited Partnership.
MSCI - Morgan Stanley Capital International.
MSCI EAFE - Morgan Stanley Capital International - Europe, Australasia, and Far East.
PLC - Public Limited Company.
PRIME - A rate, charged by banks, based on the U.S. Federal Funds rate.
S&P 500 - Standard & Poor’s U.S. Equity Large-Cap Index.
SPDR - Standard & Poor’s Depository Receipt.
VIX - Volatility Index.
| | | | | | | | | | | | | | | | |
| Futures Contracts Open on December 31, 2017: | |
|
| Long Futures | |
|
| Equity Futures Contracts | |
| Description | | Number of
Contracts | | Expiration Date | | Notional Amount | | | Contract Value | | | Unrealized
Appreciation
(Depreciation) | |
| S&P 500 E-Mini Index Futures | | 195 | | March 2018 | | $ | 25,995,852 | | | $ | 26,091,000 | | | $ | 95,148 | |
| | | | | | | | | | | | | | | | |
| | $ | 25,995,852 | | | $ | 26,091,000 | | | $ | 95,148 | |
| | | | | | | | | | | | | | | | |
| | | | | | | | | | | | | | | | | | | | | | | | | | | | | | |
| OTC Swap Agreements Outstanding on December 31, 2017: | |
|
| Total Return Swap Agreements | |
Pay/Receive
Floating Rate | | Description | | Reference Entity | | Counterparty | | Floating
Rate | | | Expiration
Date | | | Reference
Quantity | | | Notional
Amount | | | Premiums
Paid
(Received) | | | Unrealized
Appreciation
(Depreciation) | |
| Pay | | 1-Month USD-LIBOR plus 0.65% | | Dell Technologies, Inc. | | DUB | | | 2.127 | % | | | 8/3/2018 | | | | 32,793 | | | | 2,629,671 | | | $ | - | | | $ | 35,744 | |
| Pay | | 1-Month USD-LIBOR plus 1.20% | | SunTrust Banks, Inc. | | DUB | | | 1.877 | % | | | 8/3/2018 | | | | 126,078 | | | | 2,599,728 | | | | - | | | | (8,591 | ) |
| Pay | | 1-Month USD-LIBOR plus 1.20% | | Zions Bancorporation | | DUB | | | 1.877 | % | | | 8/3/2018 | | | | 239,101 | | | | 4,180,681 | | | | - | | | | 297,681 | |
| Receive | | 1-Month USD-LIBOR plus 0.30% | | SunTrust Banks, Inc. | | DUB | | | 1.177 | % | | | 8/3/2018 | | | | 175,075 | | | | 11,308,157 | | | | - | | | | 63 | |
| Receive | | 1-Month USD-LIBOR plus 0.30% | | Zions Bancorporation | | DUB | | | 1.877 | % | | | 8/3/2018 | | | | 225,226 | | | | 11,210,486 | | | | - | | | | (237,752 | ) |
| Receive | | 3-Month USD-LIBOR minus 1.10% | | VMware, Inc. | | DUB | | | 0.377 | % | | | 10/23/2018 | | | | 18,000 | | | | 2,193,660 | | | | - | | | | (62,100 | ) |
| Pay | | 1-Month USD-LIBOR minus 1.20% | | ASBISc Enterprises PLC | | DUB | | | 0.277 | % | | | 11/29/2018 | | | | 197,816 | | | | 1,117,660 | | | | - | | | | 101,595 | |
| Receive | | 1-Month USD-LIBOR minus 0.30% | | ASBISc Enterprises PLC | | DUB | | | 1.177 | % | | | 11/29/2018 | | | | 178,034 | | | | 4,468,653 | | | | - | | | | (53,410 | ) |
| | | | | | | | | | | | | | | | | | | | | | | | | | | | | | |
| | | | | | | | | | | | | | | | | | | | | | | | $ | - | | | $ | 73,230 | |
| | | | | | | | | | | | | | | | | | | | | | | | | | | | | | |
See accompanying notes
33
American Beacon Ionic Strategic Arbitrage FundSM
Schedule of Investments
December 31, 2017
| | | | | | | | | | | | | | | | | | | | | | | | | | | | | | |
| Purchased Options Contracts Open on December 31, 2017: | |
|
| Equity Options | |
| Description | | Counterparty | | Exercise
Price | | | Expiration
Date | | Currency | | Number of
Contracts | | | Notional
Amount | | | Premiums
Paid | | | Fair Value | | | Unrealized
Appreciation
(Depreciation) | |
| Call - Altaba, Inc. | | CCP | | | 52.50 | | | 1/19/2018 | | USD | | | 115 | | | | 11,500 | | | $ | 105,287 | | | $ | 200,675 | | | $ | 95,388 | |
| Call - Altaba, Inc. | | CCP | | | 67.50 | | | 1/19/2018 | | USD | | | 300 | | | | 30,000 | | | | 141,566 | | | | 93,300 | | | | (48,266 | ) |
| Call - Dell Technologies, Inc. Class V | | CCP | | | 70.00 | | | 1/19/2018 | | USD | | | 284 | | | | 28,400 | | | | 374,892 | | | | 323,760 | | | | (51,132 | ) |
| Call - Rayonier Advanced Materials, Inc. | | CCP | | | 20.00 | | | 1/19/2018 | | USD | | | 63 | | | | 6,300 | | | | 1,294 | | | | 5,670 | | | | 4,376 | |
| Call - SunTrust Banks, Inc.* | | DUB | | | 60.00 | | | 1/19/2018 | | USD | | | 606 | | | | 60,600 | | | | 127,891 | | | | 318,150 | | | | 190,259 | |
| Call - VMware, Inc. | | CCP | | | 115.00 | | | 1/19/2018 | | USD | | | 112 | | | | 11,200 | | | | 35,453 | | | | 123,312 | | | | 87,859 | |
| Put - Dominion Energy, Inc. | | CCP | | | 82.50 | | | 1/19/2018 | | USD | | | 5 | | | | 500 | | | | 628 | | | | 863 | | | | 235 | |
| Put - Golar LNG Ltd. | | CCP | | | 15.00 | | | 1/19/2018 | | USD | | | 514 | | | | 51,400 | | | | 55,020 | | | | 1,285 | | | | (53,735 | ) |
| Put - Tesla, Inc. | | CCP | | | 110.00 | | | 1/19/2018 | | USD | | | 143 | | | | 14,300 | | | | 17,167 | | | | 215 | | | | (16,952 | ) |
| Put - Rexnord Corp. | | CCP | | | 20.00 | | | 2/16/2018 | | USD | | | 31 | | | | 3,100 | | | | 1,102 | | | | 310 | | | | (792 | ) |
| Call - Associated Banc-Corp. | | CCP | | | 25.00 | | | 3/16/2018 | | USD | | | 1,000 | | | | 100,000 | | | | 109,042 | | | | 132,500 | | | | 23,458 | |
| Call - Depomed, Inc. | | CCP | | | 11.00 | | | 3/16/2018 | | USD | | | 62 | | | | 6,200 | | | | 964 | | | | 930 | | | | (34 | ) |
| Call - Southwestern Energy Co. | | CCP | | | 8.00 | | | 3/16/2018 | | USD | | | 73 | | | | 7,300 | | | | 2,485 | | | | 1,022 | | | | (1,463 | ) |
| Call - Time Warner, Inc. | | CCP | | | 92.50 | | | 3/16/2018 | | USD | | | 283 | | | | 28,300 | | | | 137,685 | | | | 65,090 | | | | (72,595 | ) |
| Call - VMware, Inc. | | CCP | | | 140.00 | | | 3/16/2018 | | USD | | | 293 | | | | 29,300 | | | | 48,495 | | | | 46,147 | | | | (2,348 | ) |
| Put - Dynegy, Inc. | | CCP | | | 11.00 | | | 3/16/2018 | | USD | | | 164 | | | | 16,400 | | | | 9,049 | | | | 9,430 | | | | 381 | |
| Call - Weibo Corp. | | CCP | | | 140.00 | | | 4/20/2018 | | USD | | | 56 | | | | 5,600 | | | | 16,191 | | | | 10,780 | | | | (5,411 | ) |
| Call - Zions Bancorp* | | DUB | | | 48.00 | | | 4/20/2018 | | USD | | | 200 | | | | 20,000 | | | | 62,000 | | | | 92,000 | | | | 30,000 | |
| Call - Rayonier Advanced Materials, Inc. | | CCP | | | 25.00 | | | 5/18/2018 | | USD | | | 32 | | | | 3,200 | | | | 1,297 | | | | 2,080 | | | | 783 | |
| Call - Rexnord Corp. | | CCP | | | 30.00 | | | 5/18/2018 | | USD | | | 57 | | | | 5,700 | | | | 2,310 | | | | 2,137 | | | | (173 | ) |
| Call - Teva Pharmaceutical Industries Ltd. | | CCP | | | 12.50 | | | 6/15/2018 | | USD | | | 182 | | | | 18,200 | | | | 27,399 | | | | 127,582 | | | | 100,183 | |
| Put - TCF Financial Corp. | | CCP | | | 22.50 | | | 7/20/2018 | | USD | | | 1,000 | | | | 100,000 | | | | 269,317 | | | | 272,500 | | | | 3,183 | |
| Put - Tesla, Inc. | | CCP | | | 260.00 | | | 1/18/2019 | | USD | | | 63 | | | | 6,300 | | | | 161,428 | | | | 165,879 | | | | 4,451 | |
| | | | | | | | | | | | | | | | | | | | | | | | | | | | | | |
| | | | | | | $ | 1,707,962 | | | $ | 1,995,617 | | | $ | 287,655 | |
| | | | | | | | | | | | | | | | | | | | | | | | | | | | | | |
| | | | | | | | | | | | | | | | | | | | | | | | | | | | | | |
| Exchange-Traded Fund Options | |
| Description | | Counterparty | | Exercise
Price | | | Expiration
Date | | Currency | | Number of
Contracts | | | Notional
Amount | | | Premiums
Paid | | | Fair Value | | | Unrealized
Appreciation
(Depreciation) | |
| Call - iShares China Large-Cap ETF | | CCP | | | 48.00 | | | 1/19/2018 | | USD | | | 1,200 | | | | 120,000 | | | $ | 10,850 | | | $ | 19,200 | | | $ | 8,350 | |
| Call - SPDR EURO STOXX 50 ETF | | CCP | | | 42.00 | | | 1/19/2018 | | USD | | | 4,408 | | | | 440,800 | | | | 264,663 | | | | 26,448 | | | | (238,215 | ) |
| Put - CurrencyShares Euro Trust ETF | | CCP | | | 103.00 | | | 1/19/2018 | | USD | | | 615 | | | | 61,500 | | | | 4,134 | | | | 308 | | | | (3,826 | ) |
| Put - Direxion Daily Gold Miners Index Bear 3X Shares ETF | | CCP | | | 4.00 | | | 1/19/2018 | | USD | | | 3,006 | | | | 300,600 | | | | 576,311 | | | | 22,545 | | | | (553,766 | ) |
| Put - iShares China Large-Cap ETF | | CCP | | | 39.00 | | | 1/19/2018 | | USD | | | 2,560 | | | | 256,000 | | | | 537,710 | | | | 2,560 | | | | (535,150 | ) |
| Put - iShares iBoxx High Yield Corporate Bond ETF | | CCP | | | 86.00 | | | 1/19/2018 | | USD | | | 900 | | | | 90,000 | | | | 36,431 | | | | 11,700 | | | | (24,731 | ) |
| Put - iShares MSCI EAFE ETF | | CCP | | | 62.00 | | | 1/19/2018 | | USD | | | 1,000 | | | | 100,000 | | | | 106,041 | | | | 2,500 | | | | (103,541 | ) |
| Put - iShares MSCI EAFE ETF | | CCP | | | 71.00 | | | 1/19/2018 | | USD | | | 500 | | | | 50,000 | | | | 90,521 | | | | 45,000 | | | | (45,521 | ) |
See accompanying notes
34
American Beacon Ionic Strategic Arbitrage FundSM
Schedule of Investments
December 31, 2017
| | | | | | | | | | | | | | | | | | | | | | | | | | | | | | |
| Description | | Counterparty | | Exercise
Price | | | Expiration
Date | | Currency | | Number of
Contracts | | | Notional
Amount | | | Premiums
Paid | | | Fair Value | | | Unrealized
Appreciation
(Depreciation) | |
| Put - iShares MSCI Emerging Markets ETF | | CCP | | | 44.00 | | | 1/19/2018 | | USD | | | 744 | | | | 74,400 | | | $ | 163,538 | | | $ | 5,952 | | | $ | (157,586 | ) |
| Put - SPDR Euro Stoxx 50 ETF | | CCP | | | 42.00 | | | 1/19/2018 | | USD | | | 500 | | | | 50,000 | | | | 55,521 | | | | 57,500 | | | | 1,979 | |
| Call - CurrencyShares Euro Trust ETF | | CCP | | | 115.00 | | | 3/16/2018 | | USD | | | 500 | | | | 50,000 | | | | 72,886 | | | | 105,500 | | | | 32,614 | |
| Call - CurrencyShares Euro Trust ETF | | CCP | | | 120.00 | | | 3/16/2018 | | USD | | | 2,723 | | | | 272,300 | | | | 261,084 | | | | 108,920 | | | | (152,164 | ) |
| Call - iShares MSCI EAFE ETF | | CCP | | | 70.00 | | | 3/16/2018 | | USD | | | 1,100 | | | | 110,000 | | | | 172,746 | | | | 184,800 | | | | 12,054 | |
| Call - VanEck Vectors Gold Miners ETF | | CCP | | | 20.00 | | | 3/16/2018 | | USD | | | 800 | | | | 80,000 | | | | 188,488 | | | | 280,000 | | | | 91,512 | |
| Put - CurrencyShares Euro Trust ETF | | CCP | | | 114.00 | | | 3/16/2018 | | USD | | | 500 | | | | 50,000 | | | | 60,336 | | | | 40,500 | | | | (19,836 | ) |
| Put - iShares iBoxx High Yield Corporate Bond ETF | | CCP | | | 84.00 | | | 3/16/2018 | | USD | | | 375 | | | | 37,500 | | | | 22,141 | | | | 19,125 | | | | (3,016 | ) |
| Call - CurrencyShares Euro Trust ETF | | CCP | | | 113.00 | | | 1/18/2019 | | USD | | | 3,066 | | | | 306,600 | | | | 1,254,916 | | | | 1,893,255 | | | | 638,339 | |
| Call - CurrencyShares Euro Trust ETF | | CCP | | | 112.00 | | | 1/18/2019 | | USD | | | 525 | | | | 52,500 | | | | 256,096 | | | | 359,625 | | | | 103,529 | |
| Call - CurrencyShares Euro Trust ETF | | CCP | | | 116.00 | | | 1/18/2019 | | USD | | | 760 | | | | 76,000 | | | | 286,184 | | | | 328,700 | | | | 42,516 | |
| Call - CurrencyShares Japanese Yen Trust ETF | | CCP | | | 92.00 | | | 1/18/2019 | | USD | | | 50 | | | | 5,000 | | | | 17,002 | | | | 7,375 | | | | (9,627 | ) |
| Put - CurrencyShares Euro Trust ETF | | CCP | | | 113.00 | | | 1/18/2019 | | USD | | | 1,000 | | | | 100,000 | | | | 289,375 | | | | 179,000 | | | | (110,375 | ) |
| Put - CurrencyShares Euro Trust ETF | | CCP | | | 102.00 | | | 1/18/2019 | | USD | | | 400 | | | | 40,000 | | | | 144,217 | | | | 9,400 | | | | (134,817 | ) |
| Put - CurrencyShares Euro Trust ETF | | CCP | | | 103.00 | | | 1/18/2019 | | USD | | | 1,650 | | | | 165,000 | | | | 654,376 | | | | 47,025 | | | | (607,351 | ) |
| Put - CurrencyShares Euro Trust ETF | | CCP | | | 101.00 | | | 1/18/2019 | | USD | | | 150 | | | | 15,000 | | | | 48,531 | | | | 3,000 | | | | (45,531 | ) |
| Put - CurrencyShares Euro Trust ETF | | CCP | | | 108.00 | | | 1/18/2019 | | USD | | | 567 | | | | 56,700 | | | | 364,513 | | | | 45,360 | | | | (319,153 | ) |
| Put - CurrencyShares Euro Trust ETF | | CCP | | | 106.00 | | | 1/18/2019 | | USD | | | 381 | | | | 38,100 | | | | 207,672 | | | | 23,241 | | | | (184,431 | ) |
| Put - CurrencyShares Euro Trust ETF | | CCP | | | 104.00 | | | 1/18/2019 | | USD | | | 1,589 | | | | 158,900 | | | | 653,253 | | | | 54,026 | | | | (599,227 | ) |
| Put - CurrencyShares Japanese Yen Trust ETF | | CCP | | | 87.00 | | | 1/18/2019 | | USD | | | 930 | | | | 93,000 | | | | 354,683 | | | | 311,550 | | | | (43,133 | ) |
| Put - CurrencyShares Japanese Yen Trust ETF | | CCP | | | 85.00 | | | 1/18/2019 | | USD | | | 869 | | | | 86,900 | | | | 224,193 | | | | 195,525 | | | | (28,668 | ) |
| Put - CurrencyShares Japanese Yen Trust ETF | | CCP | | | 85.00 | | | 1/17/2020 | | USD | | | 25 | | | | 2,500 | | | | 8,763 | | | | 7,562 | | | | (1,201 | ) |
| Put - CurrencyShares Japanese Yen Trust ETF | | CCP | | | 83.00 | | | 1/17/2020 | | USD | | | 86 | | | | 8,600 | | | | 22,837 | | | | 18,490 | | | | (4,347 | ) |
| | | | | | | | | | | | | | | | | | | | | | | | | | | | | | |
| | | | | | | $ | 7,410,012 | | | $ | 4,415,692 | | | $ | (2,994,320 | ) |
| | | | | | | | | | | | | | | | | | | | | | | | | | | | | | |
| | | | | | | | | | | | | | | | | | | | | | | | | | | | |
| Index Options | | | | | | | | | | | | | | | | | | | | | | | |
| Description | | Counterparty | | Exercise
Price | | Expiration
Date | | Currency | | Number of
Contracts | | | Notional
Amount | | | Premiums
Paid | | | Fair Value | | | Unrealized
Appreciation
(Depreciation) | |
| Put - S&P 500 Index | | CCP | | 2,450.00 | | 1/19/2018 | | USD | | | 2 | | | | 200 | | | $ | 361 | | | $ | 410 | | | $ | 49 | |
| Put - S&P 500 Index | | CCP | | 2,475.00 | | 1/19/2018 | | USD | | | 9 | | | | 900 | | | | 1,850 | | | | 1,764 | | | | (86 | ) |
| Call - S&P 500 Index | | CCP | | 2,700.00 | | 1/31/2018 | | USD | | | 41 | | | | 4,100 | | | | 68,933 | | | | 51,250 | | | | (17,683 | ) |
| | | | | | | | | | | | | | | | | | | | | | | | | | | | |
| | | $ | 71,144 | | | $ | 53,424 | | | $ | (17,720 | ) |
| | | | | | | | | | | | | | | | | | | | | | | | | | | | |
See accompanying notes
35
American Beacon Ionic Strategic Arbitrage FundSM
Schedule of Investments
December 31, 2017
| | | | | | | | | | | | | | | | | | | | | | | | | | | | | | |
| Written Options Contracts Open on December 31, 2017: | | | | | | | | | | | | | |
| | | | | | | |
| Equity Options | | | | | | | | | | | | | | | | | | | | |
| Description | | Counterparty | | Exercise
Price | | | Expiration
Date | | Currency | | Number of
Contracts | | | Notional
Amount | | | Premiums
Received | | | Fair Value | | | Unrealized
Appreciation
(Depreciation) | |
| Call - AgroFresh Solutions, Inc. | | CCP | | | 7.50 | | | 1/19/2018 | | USD | | | 83 | | | | 8,300 | | | $ | (12,746 | ) | | $ | (1,660 | ) | | $ | 11,086 | |
| Call - Hostess Brands, Inc. | | CCP | | | 15.00 | | | 1/19/2018 | | USD | | | 178 | | | | 17,800 | | | | (27,908 | ) | | | (6,230 | ) | | | 21,678 | |
| Call - VMware, Inc. | | CCP | | | 90.00 | | | 1/19/2018 | | USD | | | 235 | | | | 23,500 | | | | (648,575 | ) | | | (830,725 | ) | | | (182,150 | ) |
| Put - Altaba, Inc. | | CCP | | | 67.50 | | | 1/19/2018 | | USD | | | 300 | | | | 30,000 | | | | (112,262 | ) | | | (18,900 | ) | | | 93,362 | |
| Put - Hostess Brands, Inc. | | CCP | | | 15.00 | | | 1/19/2018 | | USD | | | 250 | | | | 25,000 | | | | (14,664 | ) | | | (12,500 | ) | | | 2,164 | |
| Call - Time Warner, Inc. | | CCP | | | 100.00 | | | 3/16/2018 | | USD | | | 283 | | | | 28,300 | | | | (42,532 | ) | | | (12,735 | ) | | | 29,797 | |
| Put - Bank of America Corp. | | CCP | | | 25.00 | | | 1/18/2019 | | USD | | | 1,056 | | | | 105,600 | | | | (202,176 | ) | | | (122,496 | ) | | | 79,680 | |
| | | | | | | | | | | | | | | | | | | | | | | | | | | | | | |
| | | | | | | $ | (1,060,863 | ) | | $ | (1,005,246 | ) | | $ | 55,617 | |
| | | | | | | | | | | | | | | | | | | | | | | | | | | | | | |
| | | | | | | | | | | | | | | | | | | | | | | | | | | | | | |
| Exchange-Traded Fund Options | |
| Description | | Counterparty | | Exercise
Price | | | Expiration
Date | | Currency | | Number of
Contracts | | | Notional
Amount | | | Premiums
Received | | | Fair Value | | | Unrealized
Appreciation/
(Depreciation) | |
| Call - CurrencyShares Euro Trust ETF | | CCP | | | 108.00 | | | 1/19/2018 | | USD | | | 565 | | | | 56,500 | | | $ | (109,049 | ) | | $ | (450,305 | ) | | $ | (341,256 | ) |
| Call - CurrencyShares Euro Trust ETF | | CCP | | | 113.00 | | | 1/19/2018 | | USD | | | 1,300 | | | | 130,000 | | | | (133,895 | ) | | | (351,000 | ) | | | (217,105 | ) |
| Call - CurrencyShares Euro Trust ETF | | CCP | | | 105.00 | | | 1/19/2018 | | USD | | | 500 | | | | 50,000 | | | | (174,135 | ) | | | (542,500 | ) | | | (368,365 | ) |
| Put - CurrencyShares Japanese Yen Trust ETF | | CCP | | | 87.00 | | | 1/19/2018 | | USD | | | 847 | | | | 84,700 | | | | (220,115 | ) | | | (152,460 | ) | | | 67,655 | |
| Put - CurrencyShares Euro Trust ETF | | CCP | | | 113.00 | | | 1/19/2018 | | USD | | | 700 | | | | 70,000 | | | | (79,303 | ) | | | (4,200 | ) | | | 75,103 | |
| Put - CurrencyShares Euro Trust ETF | | CCP | | | 101.00 | | | 1/19/2018 | | USD | | | 179 | | | | 17,900 | | | | (31,911 | ) | | | (179 | ) | | | 31,732 | |
| Put - Direxion Daily Gold Miners Index Bear 3X Shares ETF | | CCP | | | 20.00 | | | 1/19/2018 | | USD | | | 250 | | | | 25,000 | | | | (138,625 | ) | | | (6,250 | ) | | | 132,375 | |
| Put - CurrencyShares Euro Trust ETF | | CCP | | | 102.00 | | | 1/19/2018 | | USD | | | 549 | | | | 54,900 | | | | (137,032 | ) | | | (275 | ) | | | 136,757 | |
| Put - iShares China Large-Cap ETF | | CCP | | | 48.00 | | | 1/19/2018 | | USD | | | 700 | | | | 70,000 | | | | (223,266 | ) | | | (136,500 | ) | | | 86,766 | |
| Call - CurrencyShares Euro Trust ETF | | CCP | | | 116.00 | | | 3/16/2018 | | USD | | | 660 | | | | 66,000 | | | | (111,378 | ) | | | (99,660 | ) | | | 11,718 | |
| Call - CurrencyShares Euro Trust ETF | | CCP | | | 113.00 | | | 3/16/2018 | | USD | | | 100 | | | | 10,000 | | | | (16,644 | ) | | | (36,500 | ) | | | (19,856 | ) |
| Put - CurrencyShares Japanese Yen Trust ETF | | CCP | | | 85.00 | | | 3/16/2018 | | USD | | | 700 | | | | 70,000 | | | | (90,292 | ) | | | (63,700 | ) | | | 26,592 | |
| | | | | | | | | | | | | | | | | | | | | | | | | | | | | | |
| | | | | | | $ | (1,465,645 | ) | | $ | (1,843,529 | ) | | $ | (377,884 | ) |
| | | | | | | | | | | | | | | | | | | | | | | | | | | | | | |
| | | | | | | | | | | | | | | | | | | | | | | | | | | | |
| Index Options | |
| Description | | Counterparty | | Exercise
Price | | Expiration
Date | | Currency | | Number of
Contracts | | | Notional
Amount | | | Premiums
Received | | | Fair Value | | | Unrealized
Appreciation
(Depreciation) | |
| Call - S&P 500 Index | | CCP | | 2,475.00 | | 1/19/2018 | | USD | | | 11 | | | | 1,100 | | | $ | (72,147 | ) | | $ | (224,235 | ) | | $ | (152,088 | ) |
| Call - S&P 500 Index | | CCP | | 2,600.00 | | 1/19/2018 | | USD | | | 68 | | | | 6,800 | | | | (180,669 | ) | | | (544,680 | ) | | | (364,011 | ) |
| Put - S&P 500 Index | | CCP | | 2,600.00 | | 1/19/2018 | | USD | | | 10 | | | | 1,000 | | | | (10,994 | ) | | | (6,600 | ) | | | 4,394 | |
| Call - S&P 500 Index | | CCP | | 2,670.00 | | 3/16/2018 | | USD | | | 25 | | | | 2,500 | | | | (157,233 | ) | | | (120,000 | ) | | | 37,233 | |
| | | | | | | | | | | | | | | | | | | | | | | | | | | | |
| | | | | | | $ | (421,043 | ) | | $ | (895,515 | ) | | $ | (474,472 | ) |
| | | | | | | | | | | | | | | | | | | | | | | | | | | | |
| * | The position was traded Over-the-Counter. |
See accompanying notes
36
American Beacon Ionic Strategic Arbitrage FundSM
Schedule of Investments
December 31, 2017
| | |
| Glossary: |
| | |
| Counterparty Abbreviations: |
| DUB | | Deutsche Bank AG |
|
| Currency Abbreviations: |
| CAD | | Canadian Dollar |
| JPY | | Japanese Yen |
| USD | | United States Dollar |
|
| Index Abbreviations: |
| S&P 500 | | Standard & Poor’s U.S. Equity Large-Cap Index |
|
| Other Abbreviations: |
| CCP | | Central Counterparty Clearing House |
| ETF | | Exchange-Traded Fund |
| Euro Stoxx 50 | | Eurozone Blue-chip Index |
| LIBOR | | London Interbank Offered Rate |
| MSCI | | Morgan Stanley Capital International |
| MSCI EAFE | | Morgan Stanley Capital International - Europe, Australasia, and Far East |
| PLC | | Public Limited Company |
| SPDR | | Standard & Poor’s Depositary Receipt |
The Fund’s investments are summarized by level based on the inputs used to determine their values. As of December 31, 2017, the investments were classified as described below:
| | | | | | | | | | | | | | | | | | | | | | | | | | | | |
Ionic Strategic Arbitrage Fund | | Level 1 | | | | | | Level 2 | | | | | | Level 3 | | | | | | Total | |
Assets | | | | | | | | | | | | | | | | | | | | | | | | | | | | |
Common Stocks | | $ | 3,009,270 | | | | | | | $ | 1,321,247 | | | | | | | $ | - | | | | | | | $ | 4,330,517 | |
Warrants | | | 2,869,970 | | | | | | | | - | | | | | | | | - | | | | | | | | 2,869,970 | |
Convertible Preferred Stocks | | | 17,295,017 | | | | | | | | - | | | | | | | | - | | | | | | | | 17,295,017 | |
Convertible Obligations | | | - | | | | | | | | 18,426,761 | | | | | | | | - | | | | | | | | 18,426,761 | |
Foreign Corporate Obligations | | | - | | | | | | | | 4,241,684 | | | | | | | | - | | | | | | | | 4,241,684 | |
Collateralized Mortgage Obligations | | | - | | | | | | | | 13,803,278 | | | | | | | | 1,741,554 | | | | | | | | 15,544,832 | |
Investment Companies | | | 10,061,295 | | | | | | | | 2,004,934 | | | | | | | | - | | | | | | | | 12,066,229 | |
Exchange-Traded Instruments | | | 5,775,610 | | | | | | | | - | | | | | | | | - | | | | | | | | 5,775,610 | |
Short-Term Investments | | | 19,527,208 | | | | | | | | - | | | | | | | | - | | | | | | | | 19,527,208 | |
| | | | | | | | | | | | | | | | | | | | | | | | | | | | |
Total Investments in Securities - Assets | | $ | 58,538,370 | | | | | | | $ | 39,797,904 | | | | | | | $ | 1,741,554 | | | | | | | $ | 100,077,828 | |
| | | | | | | | | | | | | | | | | | | | | | | | | | | | |
|
Liabilities | |
Common Stocks (Sold Short) | | $ | (38,223,594 | ) | | | | | | $ | (4,388,398 | ) | | | | | | $ | - | | | | | | | $ | (42,611,992 | ) |
Corporate Obligations (Sold Short) | | | - | | | | | | | | (1,622,139 | ) | | | | | | | - | | | | | | | | (1,622,139 | ) |
Exchange-Traded Instruments (Sold Short) | | | (8,891,809 | ) | | | | | | | - | | | | | | | | - | | | | | | | | (8,891,809 | ) |
| | | | | | | | | | | | | | | | | | | | | | | | | | | | |
Total Investments in Securities - Liabilities | | | (47,115,403 | ) | | | | | | | (6,010,537 | ) | | | | | | | - | | | | | | | | (53,125,940 | ) |
| | | | | | | | | | | | | | | | | | | | | | | | | | | | |
Total Investments in Securities | | $ | 11,422,967 | | | | | | | $ | 33,787,367 | | | | | | | $ | 1,741,554 | | | | | | | $ | 46,951,888 | |
| | | | | | | | | | | | | | | | | | | | | | | | | | | | |
|
Financial Derivative Instruments - Assets | |
Futures Contracts | | $ | 95,148 | | | | | | | $ | - | | | | | | | $ | - | | | | | | | $ | 95,148 | |
Swap Contract Agreements | | | - | | | | | | | | 435,083 | | | | | | | | - | | | | | | | | 435,083 | |
Purchased Options Contracts | | | 6,464,733 | | | | | | | | - | | | | | | | | - | | | | | | | | 6,464,733 | |
| | | | | | | | | | | | | | | | | | | | | | | | | | | | |
Total Financial Derivative Instruments - Assets | | $ | 6,559,881 | | | | | | | $ | 435,083 | | | | | | | $ | - | | | | | | | $ | 6,994,964 | |
| | | | | | | | | | | | | | | | | | | | | | | | | | | | |
|
Financial Derivative Instruments - Liabilities | |
Swap Contract Agreements | | $ | - | | | | | | | $ | (361,853 | ) | | | | | | $ | - | | | | | | | $ | (361,853 | ) |
Written Options Contracts | | | (3,744,290 | ) | | | | | | | - | | | | | | | | - | | | | | | | | (3,744,290 | ) |
| | | | | | | | | | | | | | | | | | | | | | | | | | | | |
Total Financial Derivative Instruments - Liabilities | | $ | (3,744,290 | ) | | | | | | $ | (361,853 | ) | | | | | | $ | - | | | | | | | $ | (4,106,143 | ) |
| | | | | | | | | | | | | | | | | | | | | | | | | | | | |
See accompanying notes
37
American Beacon Ionic Strategic Arbitrage FundSM
Schedule of Investments
December 31, 2017
U.S. GAAP requires all transfers between any levels to be disclosed. The end of period timing recognition has been adopted for the transfers between levels of the Fund’s assets and liabilities. During the period ended December 31, 2017, there were transfers from Level 1 to Level 2, with a fair value of $2,522,338, as a result of a determination made by the Valuation Committee that adjustments should be applied to certain international securities due to significant movement in the market. There were transfers from Level 2 to Level 1, with a fair value of $1,092,605, due to active trading and therefore an updated pricing source. The transfers from Level 2 to Level 3, with a fair value of $884,815, are due to the securities being priced by a single broker quote.
The following table is a reconciliation of Level 3 assets within the Fund for which significant unobservable inputs were used to determine fair value. Transfers in or out of Level 3 represent the ending value of any security or instrument where a change in the level has occurred from the beginning to the end of the period:
| | | | | | | | | | | | | | | | | | | | | | | | | | | | | | | | | | |
| Security Type | | Balance as
of
12/31/2016 | | Purchases | | Sales | | Accrued
Discounts
(Premiums) | | | Realized
Gain (Loss) | | | Change in
Unrealized
Appreciation
(Depreciation) | | | Transfer
into
Level 3 | | | Transfer
out of
Level 3 | | | Balance as
of
12/31/2017 | | | Change in
Unrealized
Appreciation
(Depreciation)
at Period end** | |
| Collateralized Mortgage Obligations | | $2,155,189 | | $7,628 | | $936,922 | | $ | - | | | $ | (373,853 | ) | | $ | 4,697 | | | $ | 884,815 | | | $ | - | | | $ | 1,741,554 | | | $ | (257,226 | ) |
| ** | Change in unrealized appreciation (depreciation) attributable to Level 3 securities held at period end. This balance is included in the change in unrealized appreciation (depreciation) on the Statements of Operations. |
The collateralized mortgage obligations, classified as Level 3, were valued using single broker quotes. However, these securities were transferred into the Level 3 category due to limited market transparency and/or lack of corroboration to support the quoted prices.
See accompanying notes
38
American Beacon FundsSM
Statements of Assets and Liabilities
December 31, 2017
| | | | | | | | | | | | |
| | | AHL Managed
Futures Strategy
FundA | | | | | | Ionic Strategic
Arbitrage Fund | |
Assets: | |
Investments in unaffiliated securities, at fair value† | | $ | 449,173,483 | | | | | | | $ | 80,550,620 | |
Investments in affiliated securities, at fair value‡ | | | 20,549,617 | | | | | | | | 19,527,208 | |
Purchased options contracts outstanding (premiums paid $9,189,118) | | | – | | | | | | | | 6,464,733 | |
Foreign currency deposits with brokers for futures contracts, at fair value¤ | | | 17,554,657 | | | | | | | | – | |
Swap income receivable | | | - | | | | | | | | 29,648 | |
Cash with brokers | | | 6,210,539 | | | | | | | | 49,930,111 | |
Deposit with brokers for futures contracts | | | 26,566,367 | | | | | | | | 965,250 | |
Dividends and interest receivable | | | 13,665 | | | | | | | | 553,115 | |
Receivable for investments sold | | | - | | | | | | | | 3,712,642 | |
Receivable for fund shares sold | | | 2,908,890 | | | | | | | | 184,450 | |
Receivable for tax reclaims | | | - | | | | | | | | 2,351 | |
Receivable for expense reimbursement (Note 2) | | | 1,087,897 | | | | | | | | 112,876 | |
Receivable for variation margin on open futures contracts (Note 5) | | | 1,795,935 | | | | | | | | - | |
Unrealized appreciation from swap agreements | | | - | | | | | | | | 435,083 | |
Unrealized appreciation from forward foreign currency contracts | | | 2,603,085 | | | | | | | | - | |
Prepaid expenses | | | 40,167 | | | | | | | | 32,894 | |
| | | | | | | | | | | | |
Total assets | | | 528,504,302 | | | | | | | | 162,500,981 | |
| | | | | | | | | | | | |
Liabilities: | |
Payable for investments purchased | | | - | | | | | | | | 1,730,246 | |
Payable for fund shares redeemed | | | 510,089 | | | | | | | | 627,351 | |
Payable for foreign currency, at fair value^ | | | - | | | | | | | | 271,398 | |
Payable for foreign currency with brokers, at fair value+ | | | - | | | | | | | | 3,445,662 | |
Payable for variation margin from open futures contracts (Note 5) | | | - | | | | | | | | 129,227 | |
Securities sold short, at fair value± | | | - | | | | | | | | 53,125,940 | |
Cash due to custodian | | | - | | | | | | | | 17,192 | |
Written option contracts, at fair value (premiums received $2,947,551) | | | - | | | | | | | | 3,744,290 | |
Swap income payable | | | - | | | | | | | | 8,877 | |
Dividends and interest expense payable | | | - | | | | | | | | 41,941 | |
Management and sub-advisory fees payable (Note 2) | | | 567,209 | | | | | | | | 117,274 | |
Service fees payable (Note 2) | | | 9,694 | | | | | | | | 434 | |
Transfer agent fees payable (Note 2) | | | 21,544 | | | | | | | | 6,379 | |
Custody and fund accounting fees payable | | | 1,694,743 | | | | | | | | 15,582 | |
Professional fees payable | | | 62,761 | | | | | | | | 139,694 | |
Trustee fees payable (Note 2) | | | 22 | | | | | | | | 5 | |
Payable for prospectus and shareholder reports | | | 65,679 | | | | | | | | 7,772 | |
Unrealized depreciation from swap agreements | | | - | | | | | | | | 361,853 | |
Unrealized depreciation from forward foreign currency contracts | | | 3,084,017 | | | | | | | | - | |
Other liabilities | | | 4,098 | | | | | | | | 14 | |
| | | | | | | | | | | | |
Total liabilities | | | 6,019,856 | | | | | | | | 63,791,131 | |
| | | | | | | | | | | | |
Net assets | | $ | 522,484,446 | | | | | | | $ | 98,709,850 | |
| | | | | | | | | | | | |
Analysis of net assets: | |
Paid-in-capital | | $ | 514,340,530 | | | | | | | $ | 121,390,651 | |
Undistributed net investment income | | | 395,553 | | | | | | | | 1,372,186 | |
Accumulated net realized gain (loss) | | | 320,014 | | | | | | | | (20,977,503 | ) |
Unrealized appreciation (depreciation) of investmentsB | | | (126,937 | ) | | | | | | | 1,705,764 | |
Unrealized appreciation of forward currency contracts | | | (480,932 | ) | | | | | | | - | |
Unrealized appreciation of foreign currency transactions | | | 430,479 | | | | | | | | 4,834 | |
Unrealized appreciation of futures contracts | | | 7,605,739 | | | | | | | | 95,148 | |
Unrealized appreciation of swap agreements | | | - | | | | | | | | 73,230 | |
Unrealized (depreciation) of purchased options | | | - | | | | | | | | (2,724,385 | ) |
Unrealized (depreciation) of written options | | | - | | | | | | | | (796,739 | ) |
Unrealized (depreciation) of short sales | | | - | | | | | | | | (1,433,336 | ) |
| | | | | | | | | | | | |
Net assets | | $ | 522,484,446 | | | | | | | $ | 98,709,850 | |
| | | | | | | | | | | | |
See accompanying notes
39
American Beacon FundsSM
Statements of Assets and Liabilities
December 31, 2017
| | | | | | | | | | | | |
| | | AHL Managed
Futures Strategy
FundA | | | | | | Ionic Strategic
Arbitrage Fund | |
Shares outstanding at no par value (unlimited shares authorized): | |
Institutional Class | | | 37,042,161 | | | | | | | | 3,153,071 | |
| | | | | | | | | | | | |
Y Class | | | 9,644,118 | | | | | | | | 8,439,203 | |
| | | | | | | | | | | | |
Investor Class | | | 1,939,236 | | | | | | | | 185,042 | |
| | | | | | | | | | | | |
A Class | | | 323,698 | | | | | | | | 13,715 | |
| | | | | | | | | | | | |
C Class | | | 559,395 | | | | | | | | 9,801 | |
| | | | | | | | | | | | |
Net assets: | |
Institutional Class | | $ | 391,617,624 | | | | | | | $ | 26,386,023 | |
| | | | | | | | | | | | |
Y Class | | $ | 101,513,775 | | | | | | | $ | 70,589,684 | |
| | | | | | | | | | | | |
Investor Class | | $ | 20,241,387 | | | | | | | $ | 1,539,554 | |
| | | | | | | | | | | | |
A Class | | $ | 3,408,861 | | | | | | | $ | 113,957 | |
| | | | | | | | | | | | |
C Class | | $ | 5,702,799 | | | | | | | $ | 80,632 | |
| | | | | | | | | | | | |
Net asset value, offering and redemption price per share: | |
Institutional Class | | $ | 10.57 | | | | | | | $ | 8.37 | |
| | | | | | | | | | | | |
Y Class | | $ | 10.53 | | | | | | | $ | 8.36 | |
| | | | | | | | | | | | |
Investor Class | | $ | 10.44 | | | | | | | $ | 8.32 | |
| | | | | | | | | | | | |
A Class | | $ | 10.53 | | | | | | | $ | 8.31 | |
| | | | | | | | | | | | |
A Class (offering price) | | $ | 11.17 | | | | | | | $ | 8.72 | |
| | | | | | | | | | | | |
C Class | | $ | 10.19 | | | | | | | $ | 8.23 | |
| | | | | | | | | | | | |
| | | |
† Cost of investments in unaffiliated securities | | $ | 449,300,420 | | | | | | | $ | 78,844,856 | |
‡ Cost of investments in affiliated securities | | $ | 20,549,617 | | | | | | | $ | 19,527,208 | |
¤ Cost of foreign currency deposits with broker for futures contracts | | $ | 16,524,192 | | | | | | | $ | - | |
^ Cost of foreign currency | | $ | - | | | | | | | $ | (267,398 | ) |
+ Cost of foreign currency with broker | | $ | - | | | | | | | $ | (3,467,208 | ) |
± Proceeds of securities sold short | | $ | - | | | | | | | $ | 51,692,604 | |
A Consolidated financial statement. See Note 1 in the Notes to Financial Statements for additional information. | |
B The Fund’s investments in affiliated securities did not have unrealized appreciation (depreciation) at year end. | |
See accompanying notes
40
American Beacon FundsSM
Statements of Operations
For the year ended December 31, 2017
| | | | | | | | | | | | |
| | | AHL Managed
Futures Strategy
FundA | | | | | | Ionic Strategic
Arbitrage Fund | |
Investment income: | |
Dividend income from unaffiliated securities (net of foreign taxes)† | | $ | - | | | | | | | $ | 1,930,105 | |
Dividend income from affiliated securities | | | 92,205 | | | | | | | | 126,844 | |
Interest income | | | 3,737,607 | | | | | | | | 1,458,940 | |
Other income | | | - | | | | | | | | 158,228 | |
| | | | | | | | | | | | |
Total investment income | | | 3,829,812 | | | | | | | | 3,674,117 | |
| | | | | | | | | | | | |
Expenses: | |
Management and sub-advisory fees (Note 2) | | | 6,663,952 | | | | | | | | 1,685,674 | |
Transfer agent fees: | | | | | | | | | | | | |
Institutional Class (Note 2) | | | 146,910 | | | | | | | | 26,307 | |
Y Class (Note 2) | | | 58,664 | | | | | | | | 61,519 | |
Investor Class | | | 2,534 | | | | | | | | 1,289 | |
A Class | | | 752 | | | | | | | | 3 | |
C Class | | | 228 | | | | | | | | 3 | |
Custody and fund accounting fees | | | 2,469,016 | | | | | | | | 23,391 | |
Professional fees | | | 100,063 | | | | | | | | 281,204 | |
Registration fees and expenses | | | 86,774 | | | | | | | | 81,685 | |
Service fees (Note 2): | | | | | | | | | | | | |
Y Class | | | 14,847 | | | | | | | | 13,603 | |
Investor Class | | | 57,760 | | | | | | | | 5,613 | |
A Class | | | 22,115 | | | | | | | | 174 | |
C Class | | | 7,179 | | | | | | | | 21 | |
Distribution fees (Note 2): | | | | | | | | | | | | |
A Class | | | 36,859 | | | | | | | | 292 | |
C Class | | | 47,862 | | | | | | | | 1,091 | |
Prospectus and shareholder report expenses | | | 188,726 | | | | | | | | 20,651 | |
Trustee fees (Note 2) | | | 30,785 | | | | | | | | 8,188 | |
Prime broker fees | | | - | | | | | | | | 11,866 | |
Dividends and interest on securities sold short | | | - | | | | | | | | 1,317,169 | |
Other expenses | | | 49,148 | | | | | | | | 4,394 | |
| | | | | | | | | | | | |
Total expenses | | | 9,984,174 | | | | | | | | 3,544,137 | |
| | | | | | | | | | | | |
Net fees waived and expenses (reimbursed) (Note 2) | | | (2,099,369 | ) | | | | | | | (207,392 | ) |
| | | | | | | | | | | | |
Net expenses | | | 7,884,805 | | | | | | | | 3,336,745 | |
| | | | | | | | | | | | |
Net investment income (loss) | | | (4,054,993 | ) | | | | | | | 337,372 | |
| | | | | | | | | | | | |
|
Realized and unrealized gain (loss) from investments: | |
Net realized gain (loss) from: | | | | | | | | | | | | |
Investments in unaffiliated securitiesB | | | (16,601 | ) | | | | | | | (47,427,956 | ) |
Purchased options contracts | | | - | | | | | | | | (4,695,236 | ) |
Foreign currency transactions | | | 542,508 | | | | | | | | (262,049 | ) |
Forward foreign currency contracts | | | (3,743,646 | ) | | | | | | | - | |
Futures contracts | | | 33,270,023 | | | | | | | | 1,819,934 | |
Swap agreements | | | - | | | | | | | | 186,831 | |
Written options contracts | | | - | | | | | | | | (479,820 | ) |
Short sales | | | - | | | | | | | | 53,261,221 | |
Change in net unrealized appreciation (depreciation) of: | | | | | | | | | | | | |
Investments in unaffiliated securitiesC | | | (130,830 | ) | | | | | | | (11,430,213 | ) |
Purchased options contracts | | | - | | | | | | | | 1,424,834 | |
Foreign currency transactions | | | 660,440 | | | | | | | | 143,224 | |
Forward foreign currency contracts | | | 1,244,061 | | | | | | | | - | |
Futures contracts | | | (1,895,868 | ) | | | | | | | (24,181 | ) |
Swap agreements | | | - | | | | | | | | 73,230 | |
Written options contracts | | | - | | | | | | | | (1,923,885 | ) |
Short sales | | | - | | | | | | | | 8,595,514 | |
| | | | | | | | | | | | |
Net gain (loss) from investments | | | 29,930,087 | | | | | | | | (738,552 | ) |
| | | | | | | | | | | | |
Net increase (decrease) in net assets resulting from operations | | $ | 25,875,094 | | | | | | | $ | (401,180 | ) |
| | | | | | | | | | | | |
| | | |
† Foreign taxes | | $ | - | | | | | | | $ | 12,197 | |
A Consolidated financial statement. See Note 1 in the Notes to Financial Statements for additional information. | |
B The Fund did not recognize net realized gains (losses) from the sale of investments in affiliated securities. | |
C The Fund’s investments in affiliated securities did not have a change in unrealized appreciation (depreciation) at year end. | |
See accompanying notes
41
American Beacon FundsSM
Statements of Changes in Net Assets
| | | | | | | | | | | | | | | | | | | | | | | | | | | | |
| | | AHL Managed Futures Strategy FundA | | | | | | Ionic Strategic Arbitrage Fund | |
| | | Year Ended
December 31, 2017 | | | | | | Year Ended
December 31, 2016 | | | | | | Year Ended
December 31, 2017 | | | | | | Year Ended
December 31, 2016 | |
Increase (decrease) in net assets: | |
Operations: | |
Net investment income (loss) | | $ | (4,054,993 | ) | | | | | | $ | (5,980,464 | ) | | | | | | $ | 337,372 | | | | | | | $ | 1,404,577 | |
Net realized gain (loss) from investments in unaffiliated securities, purchased options contracts, foreign currency transactions, forward foreign currency contracts, futures contracts, swap agreements, written options contracts, and short sales | | | 30,052,284 | | | | | | | | (27,761,623 | ) | | | | | | | 2,402,925 | | | | | | | | 458,283 | |
Change in net unrealized appreciation (depreciation) of investments in unaffiliated securities, purchased options contracts, foreign currency transactions, forward foreign currency contracts, futures contracts, swap agreements, written options contracts, and short sales | | | (122,197 | ) | | | | | | | 7,600,291 | | | | | | | | (3,141,477 | ) | | | | | | | 637,345 | |
| | | | | | | | | | | | | | | | | | | | | | | | | | | | |
Net increase (decrease) in net assets resulting from operations | | | 25,875,094 | | | | | | | | (26,141,796 | ) | | | | | | | (401,180 | ) | | | | | | | 2,500,205 | |
| | | | | | | | | | | | | | | | | | | | | | | | | | | | |
Distributions to shareholders: | |
Net investment income: | | | | | | | | | | | | | | | | | | | | | | | | | | | | |
Institutional Class | | | - | | | | | | | | - | | | | | | | | (1,853,900 | ) | | | | | | | (4,423,015 | ) |
Y Class | | | - | | | | | | | | - | | | | | | | | (4,957,963 | ) | | | | | | | (2,709,587 | ) |
Investor Class | | | - | | | | | | | | - | | | | | | | | (105,355 | ) | | | | | | | (62,954 | ) |
A Class | | | - | | | | | | | | - | | | | | | | | (7,498 | ) | | | | | | | (5,200 | ) |
C Class | | | - | | | | | | | | - | | | | | | | | (4,803 | ) | | | | | | | (7,268 | ) |
Net realized gain from investments: | | | | | | | | | | | | | | | | | | | | | | | | | | | | |
Institutional Class | | | (15,176,418 | ) | | | | | | | - | | | | | | | | (202,770 | ) | | | | | | | (5,146,294 | ) |
Y Class | | | (3,701,486 | ) | | | | | | | - | | | | | | | | (542,277 | ) | | | | | | | (3,152,676 | ) |
Investor Class | | | (777,705 | ) | | | | | | | - | | | | | | | | (12,119 | ) | | | | | | | (73,248 | ) |
A Class | | | (142,135 | ) | | | | | | | - | | | | | | | | (851 | ) | | | | | | | (6,051 | ) |
C Class | | | (229,781 | ) | | | | | | | - | | | | | | | | (646 | ) | | | | | | | (8,457 | ) |
| | | | | | | | | | | | | | | | | | | | | | | | | | | | |
Net distributions to shareholders | | | (20,027,525 | ) | | | | | | | - | | | | | | | | (7,688,182 | ) | | | | | | | (15,594,750 | ) |
| | | | | | | | | | | | | | | | | | | | | | | | | | | | |
|
Capital share transactions (Note 10): | |
Proceeds from sales of shares | | | 172,256,169 | | | | | | | | 529,925,260 | | | | | | | | 55,899,547 | | | | | | | | 151,226,921 | |
Reinvestment of dividends and distributions | | | 17,912,969 | | | | | | | | - | | | | | | | | 7,581,413 | | | | | | | | 15,540,914 | |
Cost of shares redeemed | | | (138,380,771 | ) | | | | | | | (142,912,043 | ) | | | | | | | (127,532,637 | ) | | | | | | | (74,737,699 | ) |
| | | | | | | | | | | | | | | | | | | | | | | | | | | | |
Net increase (decrease) in net assets from capital share transactions | | | 51,788,367 | | | | | | | | 387,013,217 | | | | | | | | (64,051,677 | ) | | | | | | | 92,030,136 | |
| | | | | | | | | | | | | | | | | | | | | | | | | | | | |
Net increase (decrease) in net assets | | | 57,635,936 | | | | | | | | 360,871,421 | | | | | | | | (72,141,039 | ) | | | | | | | 78,935,591 | |
| | | | | | | | | | | | | | | | | | | | | | | | | | | | |
Net assets: | |
Beginning of period | | | 464,848,510 | | | | | | | | 103,977,089 | | | | | | | | 170,850,889 | | | | | | | | 91,915,298 | |
| | | | | | | | | | | | | | | | | | | | | | | | | | | | |
End of period* | | $ | 522,484,446 | | | | | | | $ | 464,848,510 | | | | | | | $ | 98,709,850 | | | | | | | $ | 170,850,889 | |
| | | | | | | | | | | | | | | | | | | | | | | | | | | | |
*Includes undistributed net investment income | | $ | 395,553 | | | | | | | $ | 1,423,199 | | | | | | | $ | 1,372,186 | | | | | | | $ | 1,709,862 | |
| | | | | | | | | | | | | | | | | | | | | | | | | | | | |
|
A Consolidated financial statement. See Note 1 in the Notes to Financial Statements for additional information. | |
See accompanying notes
42
American Beacon FundsSM
Notes to Financial Statements
December 31, 2017
1. Organization and Significant Accounting Policies
American Beacon Funds (the “Trust”), is organized as a Massachusetts business trust. The Funds, each a series within the Trust, are registered under the Investment Company Act of 1940 (the “Act”), as amended, as non-diversified, open-end management investment companies. As of December 31, 2017, the Trust consists of thirty-three active series, two of which are presented in this filing: American Beacon AHL Managed Futures Strategy Fund and American Beacon Ionic Strategic Arbitrage Fund (collectively, the “Funds” and each individually a “Fund”). The remaining thirty-one active series are reported in separate filings.
American Beacon Advisors, Inc. (the “Manager”) is a wholly-owned subsidiary of Resolute Investment Managers, Inc., which is indirectly owned by investment funds affiliated with Kelso & Company, L.P. and Estancia Capital Management, LLC, and was organized in 1986 to provide business management, advisory, administrative, and asset management consulting services to the Trust and other investors.
Class Disclosure
Each Fund has multiple classes of shares designed to meet the needs of different groups of investors. The following table sets forth the differences amongst the classes:
| | | | | | |
Class | | Eligible Investors | | Minimum Initial
Investments | |
| Institutional | | Large institutional investors - sold directly or through intermediary channels. | | $ | 250,000 | |
| Y Class | | Large institutional retirement plan investors - sold directly or through intermediary channels. | | $ | 100,000 | |
| Investor | | All investors using intermediary organizations, such as broker-dealers or retirement plan sponsors. | | $ | 2,500 | |
| A Class | | All investors who invest through intermediary organizations, such as broker-dealers or third party administrator. Retail investors who invest directly through a financial intermediary such as a broker, bank, or registered investment advisor which may include a front-end sales charge and a contingent deferred sales charge (“CDSC”). | | $ | 2,500 | |
| C Class | | Retail investors who invest directly through a financial intermediary such as a broker or through employee directed benefit plans with applicable sales charges which may include CDSC. | | $ | 1,000 | |
Each class offered by the Trust has equal rights as to assets and voting privileges. Income and non-class specific expenses are allocated daily to each class on the basis of the relative net assets. Realized and unrealized capital gains and losses of each class are allocated daily based on the relative net assets of each class of the respective Fund. Class specific expenses, where applicable, currently include service, distribution, and sub-transfer agent fees that vary amongst the classes as described more fully in Note 2.
Consolidation of Subsidiaries
The consolidated Schedule of Investments of the AHL Managed Futures Strategy Fund (the “CFC Fund”) includes the accounts of the American Beacon Cayman Managed Futures Strategy Fund, Ltd., a wholly-owned and controlled subsidiary (the “Subsidiary”). All inter-company accounts and transactions have been eliminated in consolidation for the CFC Fund.
For Federal tax purposes, taxable income for the CFC Fund and its Subsidiary are calculated separately. The Subsidiary is classified as a controlled foreign corporation under the Internal Revenue Code of 1986 (the “Code”) and the Subsidiary’s taxable income is included in the calculation of the CFC Fund’s taxable income. Net losses of the Subsidiary are not deductible by the CFC Fund either in the current period or future periods. The Subsidiary has a fiscal year end of December 31st for financial statement consolidation purposes and a nonconforming tax year end of November 30th.
43
American Beacon FundsSM
Notes to Financial Statements
December 31, 2017
The CFC Fund may invest up to 25% of its total assets in the Subsidiary, which acts as an investment vehicle in order to effect certain investments consistent with the CFC Fund’s investment objectives and policies. The CFC Fund expects to achieve a significant portion of its exposure to commodities and commodities-related investments through investment in the Subsidiary. Unlike the CFC Fund, the Subsidiary may invest without limitation in commodities and commodities-related investments.
| | | | | | | | | | | | | | | | |
Fund | | Inception Date of
Subsidiary | | | Subsidiary Net Assets
at December 31,
2017 | | | % of Total Net Assets
of the CFC Fund at
December 31, 2017 | | | Net Realized Gain
(Loss) from
Investments Held in
Subsidiary | |
American Beacon Cayman Managed Futures Strategy Fund, Ltd. | | | August 19, 2014 | | | $ | 123,027,706 | | | | 23.5 | % | | $ | (8,669,907 | ) |
CFTC Regulation
On August 13, 2013, the Commodity Futures Trading Commission (“CFTC”) adopted rules to harmonize conflicting United States Securities and Exchange Commission (the “SEC’’) and CFTC disclosure, reporting and recordkeeping requirements for registered investment companies that do not meet an exemption from the definition of commodity pool. The harmonization rules provide that the CFTC will accept the SEC’s disclosure, reporting, and recordkeeping regime as substituted compliance for substantially all of the otherwise applicable CFTC regulations as long as such investment companies meet the applicable SEC requirements.
The CFC Fund is a commodity pool, as defined in the regulation of the CFTC and operated by the Manager, a commodity pool operator regulated by the CFTC.
Recently Adopted Accounting Pronouncements
In October 2016, the SEC adopted amendments to rules under the Investment Company Act of 1940 (“final rules”) intended to modernize the reporting and disclosure of information by registered investment companies. The final rules amend Regulation S-X and require funds to provide standardized, enhanced derivative disclosure in fund financial statements in a format designed for individual investors. The amendments to Regulation S-X also update the disclosures for other investments and investments in and advances to affiliates and amend the rules regarding the general form and content of fund financial statements. The compliance date for the amendments to Regulation S-X is August 1, 2017, and has been adopted accordingly.
Significant Accounting Policies
The following is a summary of significant accounting policies, consistently followed by the Funds in preparation of the financial statements. The Funds are considered investment companies and accordingly, follow the investment company accounting and reporting guidance of the Financial Accounting Standards Board Accounting Standard Codification Topic 946, Financial Services – Investment Companies, a part of Generally Accepted Accounting Principles (“U.S. GAAP”).
Security Transactions and Investment Income
Security transactions are recorded on the trade date of the security purchase or sale. The Funds may purchase securities with delivery or payment to occur at a later date. At the time the Funds enter into a commitment to purchase a security, the transaction is recorded, and the value of the security is reflected in the Net Asset Value (“NAV”). The value of the security may vary with market fluctuations.
Dividend income, net of foreign taxes, is recorded on the ex-dividend date, except certain dividends from foreign securities which are recorded as soon as the information is available to the Funds. Interest income is earned from settlement date, recorded on the accrual basis, and adjusted, if necessary, for accretion of discounts and amortization of premiums. For financial and tax reporting purposes, realized gains and losses are determined on the basis of specific lot identification.
44
American Beacon FundsSM
Notes to Financial Statements
December 31, 2017
Distributions to Shareholders
Distributions, if any, of net investment income are generally paid at least annually and recorded on the ex-dividend date. Distributions, if any, of net realized capital gains are generally paid at least annually and recorded on the ex-dividend date. Dividends to shareholders are determined in accordance with federal income tax regulations, which may differ in amount and character from net investment income and realized gains recognized for purposes of U.S. GAAP. To the extent necessary to fully distribute capital gains, the Funds may designate earnings and profits distributed to shareholders on the redemption of shares.
Allocation of Income, Trust Expenses, Gains, and Losses
Investment income, realized and unrealized gains and losses from investments of the Funds are allocated daily to each class of shares based upon the relative proportion of net assets of each class to the total net assets of the Funds. Expenses directly charged or attributable to any Fund will be paid from the assets of the Fund. Generally, expenses of the Trust will be allocated among and charged to the assets of the Funds on a basis that the Trust’s Board of Trustees (the “Board”) deems fair and equitable, which may be based on the relative net assets of the Funds or nature of the services performed and relative applicability to the Funds.
Use of Estimates
The preparation of financial statements in conformity with U.S. GAAP requires management to make estimates and assumptions that affect the amounts reported in the financial statements and accompanying notes. Actual results may differ from those estimated.
Other
Under the Trust’s organizational documents, its officers and trustees are indemnified against certain liabilities arising out of the performance of their duties to the Trust. In the normal course of business, the Trust enters into contracts that provide indemnification to the other party or parties against potential costs or liabilities. The Trust’s maximum exposure under these arrangements is dependent on claims that may be made in the future and, therefore, cannot be estimated. The Trust has had no prior claims or losses pursuant to any such agreement.
2. Transactions with Affiliates
Management and Investment Sub-Advisory Agreements
The Funds and the Manager are parties to a Management Agreement that obligates the Manager to provide the Funds with investment advisory and administrative services. As compensation for performing the duties under the Management Agreement, the Manager will receive an annualized management fee based on a percentage of the Funds’ average daily net assets that is calculated and accrued daily, equal to 0.35%.
The Trust, on behalf of the Funds, and the Manager have entered into Investment Advisory Agreements with AHL Partners LLP and Ionic Capital Management LLC (the “Sub-Advisors”) for the AHL Managed Futures Strategy Fund and the Ionic Strategic Arbitrage Fund, respectively, pursuant to which each Fund has agreed to pay an annualized sub-advisory fee that is calculated and accrued daily equal to 1.00% of the Fund’s average daily net assets.
45
American Beacon FundsSM
Notes to Financial Statements
December 31, 2017
The Management and Sub-Advisory Fees paid by the Funds for the year ended December 31, 2017 were as follows:
AHL Managed Futures Strategy Fund
| | | | | | | | |
| | | Effective Fee Rate | | | Amount of Fees Paid | |
Management Fees | | | 0.35 | % | | $ | 1,727,691 | |
Sub-Advisor Fees | | | 1.00 | % | | | 4,936,261 | |
| | | | | | | | |
Total | | | 1.35 | % | | $ | 6,663,952 | |
| | | | | | | | |
Ionic Strategic Arbitrage Fund
| | | | | | | | |
| | | Effective Fee Rate | | | Amount of Fees Paid | |
Management Fees | | | 0.35 | % | | $ | 437,027 | |
Sub-Advisor Fees | | | 1.00 | % | | | 1,248,647 | |
| | | | | | | | |
Total | | | 1.35 | % | | $ | 1,685,674 | |
| | | | | | | | |
Distribution Plans
The Funds, except for the A and C Classes of the Funds, have adopted a “defensive” Distribution Plan (the “Plan”) in accordance with Rule 12b-1 under the Act, pursuant to which no separate fees may be charged to the Funds for distribution purposes. However, the Plan authorizes the management fee received by the Manager and the investment advisors hired by the Manager to be used for distribution purposes. Under this Plan, the Funds do not intend to compensate the Manager or any other party, either directly or indirectly, for the distribution of Fund shares.
Separate Distribution Plans (the “Distribution Plans”) have been adopted pursuant to Rule 12b-1 under the Act for the A and C Classes of the Funds. Under the Distribution Plans, as compensation for distribution assistance, the Manager receives an annual fee of 0.25% of the average daily net assets of the A Class and 1.00% of the average daily net assets of the C Class. The fee will be payable without regard to whether the amount of the fee is more or less than the actual expenses incurred in a particular month by the Manager for distribution assistance.
Service Plans
The Manager and the Trust entered into Service Plans that obligate the Manager to oversee additional shareholder servicing of the Y, Investor, A, and C Classes of the Funds. As compensation for performing the duties required under the Service Plans, the Manager receives an annualized fee up to 0.10% of the average daily net assets of the Y Class, up to 0.25% of the average daily net assets of the A and C Classes, and up to 0.375% of the average daily net assets of the Investor Class of the Funds. Effective April 1, 2017, the Funds terminated the Service Plan for the Y Class. During the year ended December 31, 2017 the Manager voluntarily reimbursed service fees to the Y and C Classes of the Ionic Strategic Arbitrage Fund in the amount of $2,037 and $142, respectively.
Sub-Transfer Agent Fees
The Manager has entered into agreements, which include servicing agreements, with financial intermediaries that provide recordkeeping, processing, shareholder communications and other services to customers of the intermediaries that hold positions in the Institutional Class of the Funds and has agreed to compensate the intermediaries for providing these services. Effective April 1, 2017, the Funds agreed to compensate the intermediaries for providing services to the Y Class. Intermediaries transact with the Funds primarily through the use of omnibus accounts on behalf of their customers who hold positions in the Funds. Certain services would have been provided by the Funds’ transfer agent and other service providers if the shareholders’ accounts were maintained directly by the Funds’ transfer agent. Accordingly, the Funds, pursuant
46
American Beacon FundsSM
Notes to Financial Statements
December 31, 2017
to the Board approval, have agreed to reimburse the Manager for certain non-distribution shareholder services provided by financial intermediaries for the Institutional and Y Classes. The reimbursement amounts (sub-transfer agent fees) paid to the Manager are subject to a fee limit of up to 0.10% of an intermediary’s average net assets in the Institutional and Y Classes on an annual basis. During the year ended December 31, 2017, the sub-transfer agent fees, as reflected in “Transfer agent fees” on the Statements of Operations, were as follows:
| | | | |
Fund | | Sub-Transfer Agent Fees | |
AHL Managed Futures Strategy | | $ | 188,724 | |
Ionic Strategic Arbitrage | | | 82,925 | |
As of December 31, 2017, the Funds owed the Manager the following reimbursement of sub-transfer agent fees, as reflected in “Transfer agent fees payable” on the Statements of Assets and Liabilities:
| | | | |
Fund | | Reimbursement
Sub-Transfer Agent Fees | |
AHL Managed Futures Strategy | | $ | 17,316 | |
Ionic Strategic Arbitrage | | | 5,094 | |
During the year ended December 31, 2017 the Manager voluntarily reimbursed sub-transfer agent fees to the Y Class of the AHL Managed Futures Strategy Fund in the amount of $2,060.
Investments in Affiliated Funds
The Funds may invest in the American Beacon U.S. Government Money Market Select Fund (the “USG Select Fund”). The Funds and the USG Select Fund have the same investment advisor and therefore, are considered to be affiliated. The Manager serves as investment advisor to the USG Select Fund and receives management fees and administrative fees totaling 0.10% of the average daily net assets of the USG Select Fund. During the year ended December 31, 2017, the Manager earned fees on the Funds’ direct investments in the USG Select Fund as shown below:
| | | | |
Fund | | Direct Investments in
USG Select Fund | |
AHL Managed Futures Strategy | | $ | 9,012 | |
Ionic Strategic Arbitrage | | | 14,679 | |
Interfund Credit Facility
Pursuant to an exemptive order issued by the SEC, the Funds, along with other registered investment companies having management contracts with the Manager, may participate in a credit facility whereby each Fund, under certain conditions, is permitted to lend money directly to and borrow directly from other participating Funds for temporary purposes. The interfund credit facility is advantageous to the Funds because it provides added liquidity, and eliminates the need to maintain higher cash balances to meet redemptions. This situation could arise when shareholder redemptions exceed anticipated volumes and certain funds have insufficient cash on hand to satisfy such redemptions or when sales of securities do not settle as expected, resulting in a cash shortfall for a fund. When a Fund liquidates portfolio securities to meet redemption requests, they often do not receive payment in settlement for up to three days (or longer for certain foreign transactions). Redemption requests normally are satisfied on the next business day. The credit facility provides a source of immediate, short-term liquidity pending settlement of the sale of portfolio securities. The credit facility is administered by a credit facility team consisting of professionals from the Manager’s asset management, compliance, and accounting areas who report the activities of the credit facility to the Board. During the year ended December 31, 2017, the Ionic Strategic Arbitrage Fund borrowed on average $3,653,217 for 3 days at an average interest rate of 1.48% with interest charges paid of $446. The amount is included in “Other Expenses” on the Statements of Operations. The AHL Managed Futures Strategy Fund did not utilize the credit facility.
47
American Beacon FundsSM
Notes to Financial Statements
December 31, 2017
Expense Reimbursement Plan
The Manager contractually agreed to reduce fees and/or reimburse expenses for the classes of the Funds to the extent that total operating expenses exceed the Funds’ expense cap. During the year ended December 31, 2017, the Manager waived and/or reimbursed expenses as follows:
| | | | | | | | | | | | | | | | | | |
| | | | | Expense Cap | | | | | | | | | Expiration of
Reimbursed
Expenses | |
Fund | | Class | | 1/1/2017 -
12/31/2017 | | | Reimbursed
Expenses | | | (Recouped)
Expenses | | |
AHL Managed Futures Strategy | | Institutional | | | 1.54 | % | | $ | 1,661,183 | | | $ | - | | | | 2020 | |
AHL Managed Futures Strategy | | Y | | | 1.64 | % | | | 293,904 | | | | - | | | | 2020 | |
AHL Managed Futures Strategy | | Investor | | | 1.92 | % | | | 64,965 | | | | - | | | | 2020 | |
AHL Managed Futures Strategy | | A | | | 1.94 | % | | | 59,814 | | | | - | | | | 2020 | |
AHL Managed Futures Strategy | | C | | | 2.69 | % | | | 19,503 | | | | - | | | | 2020 | |
Ionic Strategic Arbitrage | | Institutional | | | 1.54 | % | | | 93,674 | | | | - | | | | 2020 | |
Ionic Strategic Arbitrage | | Y | | | 1.64 | % | | | 117,183 | | | | (5,231 | ) | | | 2020 | |
Ionic Strategic Arbitrage | | Investor | | | 1.92 | % | | | 3,226 | | | | (1,656 | ) | | | 2020 | |
Ionic Strategic Arbitrage | | A | | | 1.94 | % | | | 203 | | | | (26 | ) | | | 2020 | |
Ionic Strategic Arbitrage | | C | | | 2.69 | % | | | 47 | | | | (28 | ) | | | 2020 | |
Of these amounts, $1,087,897 and $112,876 were disclosed as a receivable from the Manager on the Statements of Assets and Liabilities at December 31, 2017 for the AHL Managed Futures Strategy Fund and Ionic Strategic Arbitrage Fund, respectively.
The Funds have adopted an Expense Reimbursement Plan whereby the Manager may seek repayment of such fee reductions and expense reimbursements. Under the policy, the Manager can be reimbursed by the Funds for any contractual or voluntary fee reductions or expense reimbursements if reimbursement to the Manager (a) occurs within three years after the Manager’s own waiver or reimbursement and (b) does not cause the Funds’ annual operating expenses to exceed the lesser of the contractual percentage limit in effect at the time of the waiver/reimbursement or time of recoupment. The reimbursed expenses listed above will expire in 2020. The Fund did not record a liability for potential reimbursement, due to the current assessment that a reimbursement is unlikely. The carryover of excess expenses potentially reimbursable to the Manager are as follows:
| | | | | | | | | | | | | | | | |
Fund | | Recovered
Expenses | | | Excess Expense
Carryover | | | Expired Expense
Carryover | | | Expiration of
Reimbursed
Expenses | |
AHL Managed Futures Strategy | | $ | - | | | $ | 416,132 | | | $ | - | | | | 2018 | |
AHL Managed Futures Strategy | | | - | | | | 1,444,427 | | | | - | | | | 2019 | |
Ionic Strategic Arbitrage | | | (6,941 | ) | | | 108,786 | | | | - | | | | 2018 | |
Ionic Strategic Arbitrage | | | - | | | | 33,392 | | | | - | | | | 2019 | |
Sales Commissions
The Funds’ distributor, Foreside Fund Services, LLC (“Foreside”), may receive a portion of A Class sales charges from broker dealers and it may be used to offset distribution related expenses. During the year ended December 31, 2017, Foreside collected $2,876 and $38 in sales commissions for AHL Managed Futures Strategy Fund and Ionic Strategic Arbitrage Fund, respectively, from the sale of Class A Shares.
A CDSC of 0.50% will be deducted with respect to Class A Shares on certain purchases of $1,000,000 or more that are redeemed in whole or part within 18 months of purchase, unless waived as discussed in the Funds’ Prospectus. Any applicable CDSC will be 0.50% of the lesser of the original purchase price or the value of the redemption of the Class A Shares redeemed. During the year ended December 31, 2017, there were no CDSC fees collected for Class A Shares of the Funds.
A CDSC of 1.00% will be deducted with respect to Class C Shares redeemed within 12 months of purchase, unless waived as discussed in the Funds’ Prospectus. Any applicable CDSC will be 1.00% of the lesser of the original
48
American Beacon FundsSM
Notes to Financial Statements
December 31, 2017
purchase price or the value of the redemption of the Class C Shares redeemed. During the year ended December 31, 2017, CDSC fees of $1,909 were collected for Class C Shares of the AHL Managed Futures Strategy Fund. There were no CDSC fees collected for Class C Shares of the Ionic Strategic Arbitrage Fund.
Trustee Fees and Expenses
As compensation for their service to the Trust, the American Beacon Select Funds and the American Beacon Institutional Funds Trust, each Trustee receives an annual retainer of $120,000, plus $10,000 for each Board meeting attended in person or via teleconference, $2,500 for attendance by Committee members at meetings of the Audit Committee and the Investment Committee, and $1,500 for attendance by Committee members at meetings of the Nominating and Governance Committee, plus reimbursement of reasonable expenses incurred in attending Board meetings, Committee meetings, and relevant educational seminars. The Trustees also may be compensated for attendance at special Board and/or Committee meetings from time to time. The Board Chairman receives an additional annual retainer of $50,000 as well as a single $10,000 fee each quarter for his attendance at the committee meetings. The Chairpersons of the Audit Committee and the Investment Committee each receive an additional annual retainer of $25,000 and the Chairman of the Nominating and Governance Committee receives an additional annual retainer of $10,000. These expenses are allocated on a prorated basis to each Fund of the Trusts according to its respective net assets.
Concentration of Ownership
From time to time, the Funds may have a concentration of one or more accounts constituting a significant percentage of shares outstanding. Investment activities by holders of accounts that represent a significant ownership of more than 5% of the Funds’ outstanding shares could have a material impact on the Funds. As of December 31, 2017, based on management’s evaluation of the shareholder account base, exclusive of omnibus accounts, one account has been identified as representing a non-affiliated significant ownership of approximately 7% of the AHL Managed Futures Strategy Fund’s outstanding shares.
3. Security Valuation and Fair Value Measurements
Investments are valued at the close of the New York Stock Exchange (the “Exchange”), normally at 4:00 p.m. Eastern Time, each day that the Exchange is open for business. Equity securities, including exchange-traded funds (“ETFs”) for which market quotations are available are valued at the last sale price or official closing price (closing bid price or last evaluated quote if no sale has occurred) on the primary market or exchange on which they trade.
Debt securities normally are valued on the basis of prices provided by an independent pricing service and may take into account appropriate factors such as institution-size trading in similar groups of securities, yield, quality, coupon rate, maturity, type of issue, trading characteristics, and other market data. Prices of debt securities may be determined using quotes obtained from brokers.
Investments in open-end mutual funds are valued at the closing NAV per share of the mutual fund on the day of valuation.
Securities for which the market prices are not readily available or are not reflective of the fair value of the security, as determined by the Manager, will be priced at fair value following procedures approved by the Board.
For valuation purposes, the last quoted prices of non-U.S. equity securities may be adjusted under the circumstances described below. If the Manager determines that developments between the close of a foreign market and the close of the Exchange will, in its judgment, materially affect the value of some or all of a Fund’s portfolio securities, the Manager will adjust the previous closing prices to reflect what it believes to be the fair value of the securities as of the close of the Exchange. In deciding whether it is necessary to adjust closing prices
49
American Beacon FundsSM
Notes to Financial Statements
December 31, 2017
to reflect fair value, the Manager reviews a variety of factors, including developments in foreign markets, the performance of U.S. securities markets, and the performance of instruments trading in U.S. markets that represent foreign securities and baskets of foreign securities. In addition, the Funds may use fair value pricing for securities primarily traded in non-U.S. markets because most foreign markets close well before the Funds’ pricing time of 4:00 p.m. Eastern Time. The earlier close of these foreign markets gives rise to the possibility that significant events, including broad market moves, may have occurred in the interim and may materially affect the value of those securities. These securities are fair valued using a pricing service and are categorized as Level 2 in the fair value hierarchy. The pricing service, using methods approved by the Board, considers the correlation of the trading patterns of the foreign security to intraday trading in the U.S. markets, based on indices of domestic securities and other appropriate indicators such as prices of relevant American Depository Receipts (“ADR”) and futures contracts. The Valuation Committee, established by the Board, may also fair value securities in other situations, such as when a particular foreign market is closed but a Fund is open. The Funds use outside pricing services to provide closing prices and information to evaluate and/or adjust those prices. As a means of evaluating its security valuation process, the Valuation Committee routinely compares closing prices, the next day’s opening prices in the same markets, and adjusted prices.
Futures contracts are valued based upon their quoted daily settlement prices. Upon entering into a futures contract, the Funds are required to deposit with their futures broker, an amount of cash or U.S. Government and Agency Obligations in accordance with the initial margin requirements of the broker or exchange. Futures contracts are marked-to-market daily and an appropriate payable or receivable for the change in value (“variation margin”) is recorded by the Funds. Gains or losses are recognized, but not considered realized until the contracts expire or are closed. Futures contracts involve, to varying degrees, risk of loss in excess of the variation margin disclosed on the Statements of Assets and Liabilities.
Other investments, including restricted securities and those financial instruments for which the above valuation procedures are inappropriate or are deemed not to reflect fair value, are stated at fair value, as determined in good faith by the Manager’s Valuation Committee, pursuant to procedures established by the Board.
Valuation Inputs
Various inputs may be used to determine the fair value of the Funds’ investments. These inputs are summarized in three broad levels for financial statement purposes. The inputs or methodologies used to value securities are not necessarily an indication of the risk associated with investing in those securities.
| | | | |
| Level 1 | | - | | Quoted prices in active markets for identical securities. |
| | |
| Level 2 | | - | | Prices determined using other significant observable inputs. These may include quoted prices for similar securities, interest rates, prepayment speeds, credit risk, and others. |
| | |
| Level 3 | | - | | Prices determined using other significant unobservable inputs. Unobservable inputs reflect the Fund’s own assumptions about the factors market participants would use in pricing an investment. |
Level 1 and Level 2 trading assets and trading liabilities, at fair value
Common stocks, ETFs, preferred securities, and financial derivative instruments, such as futures contracts or options that are traded on a national securities exchange, are stated at the last reported sale or settlement price on the day of valuation. To the extent these securities are actively traded and valuation adjustments are not applied, they are categorized as Level 1 of the fair value hierarchy. Valuation adjustments may be applied to certain securities that are solely traded on a foreign exchange to account for the market movement between the close of the foreign market and the close of the Exchange. These securities are valued using pricing service providers that consider the correlation of the trading patterns of the foreign security to the intraday trading in the U.S. markets for investments. Securities using these valuation adjustments are categorized as Level 2 of the fair value hierarchy. Preferred securities and other equities traded on inactive markets or valued by reference to similar instruments are also categorized as Level 2 of the fair value hierarchy.
50
American Beacon FundsSM
Notes to Financial Statements
December 31, 2017
Fixed-income securities including corporate, convertible and municipal bonds and notes, U.S. government agencies, U.S. Treasury obligations, sovereign issues, bank loans, convertible preferred securities, and non-U.S. bonds are normally valued by pricing service providers that use broker dealer quotations, reported trades or valuation estimates from their internal pricing models. The service providers’ internal models use inputs that are observable such as issuer details, interest rates, yield curves, prepayment speeds, credit risks/spreads, default rates, and quoted prices for similar assets. Securities that use similar valuation techniques and inputs as described above are categorized as Level 2 of the fair value hierarchy. Fixed-income securities purchased on a delayed-delivery basis are marked-to-market daily until settlement at the forward settlement date and are categorized as Level 2 of the fair value hierarchy.
Mortgage-related and asset-backed securities are usually issued as separate tranches, or classes, of securities within each deal. These securities are also normally valued by pricing service providers that use broker-dealer quotations or valuation estimates from their internal pricing models. The pricing models for these securities usually consider tranche-level attributes, current market data, estimated cash flows, and market-based yield spreads for each tranche, and incorporates deal collateral performance, as available. Mortgage-related and asset-backed securities that use similar valuation techniques and inputs as described above are categorized as Level 2 of the fair value hierarchy.
Investments in registered open-end investment management companies will be valued based upon the NAVs of such investments and are categorized as Level 1 of the fair value hierarchy.
Over-the-counter (“OTC”) financial derivative instruments, such as foreign currency contracts derive their value from underlying asset prices, indices, reference rates, and other inputs or a combination of these factors. These contracts are normally valued on the basis of broker dealer quotations or pricing service providers. Depending on the product and the terms of the transaction, the fair value of the financial derivative contracts can be estimated by a pricing service provider using a series of techniques, including simulation pricing models. The pricing models use inputs that are observed from actively quoted markets such as issuer details, indices, spreads, interest rates, curves, dividends, and exchange rates. Financial derivatives that use similar valuation techniques and inputs as described above are categorized as Level 2 of the fair value hierarchy.
Level 3 trading assets and trading liabilities, at fair value
The valuation techniques and significant inputs used in determining the fair values of financial instruments classified as Level 3 of the fair value hierarchy are as follows.
Securities and other assets for which market quotes are not readily available are valued at fair value as determined in good faith by the Board or persons acting at their direction and may be categorized as Level 3 of the fair value hierarchy.
Market quotes are considered not readily available in circumstances where there is an absence of current or reliable market-based data (e.g., trade information or broker quotes), including where events occur after the close of the relevant market, but prior to the Exchange close, that materially affect the values of the Fund’s securities or assets. In addition, market quotes are considered not readily available when, due to extraordinary circumstances, the exchanges or markets on which the securities trade, do not open for trading for the entire day and no other market prices are available. The Board has delegated to the Manager the responsibility for monitoring significant events that may materially affect the fair values of a Fund’s securities or assets and for determining whether the value of the applicable securities or assets should be re-evaluated in light of such significant events.
The Board has adopted methods for valuing securities and other assets in circumstances where market quotes are not readily available, and has delegated the responsibility for applying the valuation methods to the Manager. For instances in which daily market quotes are not readily available, investments may be valued pursuant to guidelines established by the Board. In the event that the security or asset cannot be valued, pursuant to one of the valuation methods established by the Board, the fair value of the security or asset will be determined in good faith by the Valuation Committee, generally based upon recommendations provided by the Manager.
51
American Beacon FundsSM
Notes to Financial Statements
December 31, 2017
When a Fund uses fair valuation methods applied by the Manager that use significant unobservable inputs to determine its NAV, the securities priced using this methodology are categorized as Level 3 of the fair value hierarchy. These methods may require subjective determinations about the value of a security. While the Trust’s policy is intended to result in a calculation of the Fund’s NAV that fairly reflects security values as of the time of pricing, the Trust cannot guarantee that values determined by the Board or persons acting at their direction would accurately reflect the price that a Fund could obtain for a security if it were to dispose of that security as of the time of pricing (for instance, in a forced or distressed sale). The prices used by a Fund may differ from the value that would be realized if the securities were sold.
4. Securities and Other Investments
Agency Mortgage-Backed Securities
Certain mortgage-backed securities (“MBS”) may be issued or guaranteed by the U.S. government or a government sponsored entity, such as the Federal National Mortgage Association (“Fannie Mae”) or the Federal Home Loan Mortgage Corporation (“Freddie Mac”). Although these instruments may be guaranteed by the U.S. government or a government sponsored entity, many such MBS are not backed by the full faith and credit of the United States and are still exposed to the risk of non-payment.
American Depositary Receipts (“ADRs”)
ADRs are depositary receipts for foreign issuers in registered form traded in U.S. securities markets. Depositary receipts may not be denominated in the same currency as the securities into which they may be converted. Investing in depositary receipts entails substantially the same risks as direct investment in foreign securities. There is generally less publicly available information about foreign companies and there may be less governmental regulation and supervision of foreign stock exchanges, brokers, and listed companies. In addition, such companies may use different accounting and financial standards (and certain currencies may become unavailable for transfer from a foreign currency), resulting in the Fund’s possible inability to convert immediately into U.S. currency proceeds realized upon the sale of portfolio securities of the affected foreign companies. In addition, the Funds may invest in unsponsored depositary receipts, the issuers of which are not obligated to disclose material information about the underlying securities to investors in the United States. Ownership of unsponsored depositary receipts may not entitle the Funds to the same benefits and rights as ownership of a sponsored depositary receipt or the underlying security.
Commodity Instruments
Exposure to physical commodities may subject the AHL Managed Futures Strategy Fund to greater volatility than investments in traditional securities. The value of such investments may be affected by overall market movements, commodity index volatility, changes in interest rates, or factors affecting a particular industry or commodity, such as supply and demand, drought, floods, weather, embargoes, tariffs and international economic, political and regulatory developments. Their value may also respond to investor perception of instability in the national or international economy, whether or not justified by the facts. However, these investments may help to moderate fluctuations in the value of the Fund’s other holdings, because these investments may not correlate with investments in traditional securities. Economic and other events (whether real or perceived) can reduce the demand for commodities, which may reduce market prices and cause the value of the Fund’s shares to fall. No active trading market may exist for certain commodities investments, which may impair the ability of the Fund to sell or realize the full value of such investments in the event of the need to liquidate such investments. Certain commodities are subject to limited pricing flexibility because of supply and demand factors. Others are subject to broad price fluctuations as a result of the volatility of the prices for certain raw materials and the instability of supplies of other materials. These additional variables may create additional investment risks and result in greater volatility than investments in traditional securities. Because physical commodities do not generate investment income, the return on such investments will be derived solely from the appreciation or depreciation on such
52
American Beacon FundsSM
Notes to Financial Statements
December 31, 2017
investments. Certain types of commodities instruments (such as commodity-linked swaps and commodity-linked structured notes) are subject to the risk that the counterparty to the instrument will not perform or will be unable to perform in accordance with the terms of the instrument.
Common Stock
Common stock generally takes the form of shares in a corporation which represent an ownership interest. It ranks below preferred stock and debt securities in claims for dividends and for assets of the company in a liquidation or bankruptcy. The value of a company’s common stock may fall as a result of factors directly relating to that company, such as decisions made by its management or decreased demand for the company’s products or services. A stock’s value may also decline because of factors affecting not just the company, but also companies in the same industry or sector. The price of a company’s stock may also be affected by changes in financial markets that are relatively unrelated to the company, such as changes in interest rates, currency exchange rates or industry regulation. Companies that elect to pay dividends on their common stock generally only do so after they invest in their own business and make required payments to bondholders and on other debt and preferred stock. Therefore, the value of a company’s common stock will usually be more volatile than its bonds, other debt and preferred stock. Common stock may be exchange-traded or over-the-counter (“OTC”). OTC stock may be less liquid than exchange-traded stock.
Convertible Securities
Convertible securities include corporate bonds, notes, preferred stock or other securities that may be converted into or exchanged for a prescribed amount of common stock of the same or a different issuer within a particular period of time at a specified price or formula. A convertible security entitles the holder to receive interest paid or accrued on debt or dividends paid on preferred stock until the convertible security matures or is redeemed, converted or exchanged. While no securities investment is without some risk, investments in convertible securities generally entail less risk than the issuer’s common stock, although the extent to which such risk is reduced depends in large measure upon the degree to which the convertible security sells above its value as a fixed income security. The market value of convertible securities tends to decline as interest rates increase and, conversely, to increase as interest rates decline. While convertible securities generally offer lower interest or dividend yields than non-convertible debt securities of similar quality, they do enable the investor to benefit from increases in the market price of the underlying common stock. Holders of convertible securities have a claim on the assets of the issuer prior to the common stockholders, but may be subordinated to holders of similar non-convertible securities of the same issuer. Because of the conversion feature, certain convertible securities may be considered equity equivalents.
Exchange-Traded Notes (“ETNs”)
The Ionic Strategic Arbitrage Fund may invest in ETNs. ETNs are debt obligations that are traded on exchanges and the returns of which are linked to the performance of market indexes. In addition to trading ETNs on exchanges, investors may redeem ETNs directly with the issuer on a weekly basis, typically in a minimum amount of 50,000 units, or hold the ETNs until maturity. ETNs may be riskier than ordinary debt securities and may have no principal protection. The Fund’s investment in an ETN may be influenced by many unpredictable factors, including highly volatile commodities prices, changes in supply and demand relationships, weather, agriculture, trade, changes in interest rates, and monetary and other governmental policies, action and inaction. Investing in ETNs is not equivalent to investing directly in index components or the relevant index itself. Because ETNs are debt securities, they possess credit risk; if the issuer has financial difficulties or goes bankrupt, the investor may not receive the return it was promised. Because ETNs are unsecured, unsubordinated debt securities, an investment in an ETN exposes the Fund to the risk that an ETN’s issuer may be unable to repay the note upon maturity. As a result, the value of the ETN may decline, including to zero. In addition, as with investments in ETFs and investment companies, the Fund will bear its proportionate share of the fees and expenses of the ETN, which may cause the Fund’s operating expenses to be higher and its performance to be lower than it would if it invested directly in the
53
American Beacon FundsSM
Notes to Financial Statements
December 31, 2017
securities of the index or other reference assets of the ETN. There may be times when an ETN share trades at a premium or discount to its market benchmark. The Fund’s decision to sell its ETN holdings may be limited by the availability of a liquid market. If the Fund must sell some or all of its ETN holdings and the market for such ETN is weak, it may have to sell such holdings at a discount.
Fixed-Income Investments
The Funds may hold debt, including government and corporate debt, and other fixed-income securities. Typically, the values of fixed-income securities change inversely with prevailing interest rates. Therefore, a fundamental risk of fixed-income securities is interest rate risk, which is the risk that their value will generally decline as prevailing interest rates rise, which may cause the Funds’ net asset value to likewise decrease, and vice versa. How specific fixed-income securities may react to changes in interest rates will depend on the specific characteristics of each security.
Foreign Securities
The Funds may invest in U.S. dollar-denominated and non-U.S. dollar denominated equity and debt securities of foreign issuers and foreign branches of U.S. banks, including negotiable CDs, bankers’ acceptances, and commercial paper. Foreign issuers are issuers organized and doing business principally outside the United States and include corporations, banks, non-U.S. governments, and quasi-governmental organizations. While investments in foreign securities may be intended to reduce risk by providing further diversification, such investments involve sovereign and other risks, in addition to the credit and market risks normally associated with domestic securities. These additional risks include the possibility of adverse political and economic developments (including political or social instability, nationalization, expropriation, or confiscatory taxation); the potentially adverse effects of unavailability of public information regarding issuers, different governmental supervision and regulation of financial markets, reduced liquidity of certain financial markets, and the lack of uniform accounting, auditing, and financial reporting standards or the application of standards that are different or less stringent than those applied in the United States; different laws and customs governing securities tracking; and possibly limited access to the courts to enforce the Funds’ rights as an investor.
Illiquid and Restricted Securities
The Funds may invest in securities that are subject to legal or contractual restrictions on resale. These securities may be sold privately, but are required to be registered or exempted from such registration before being sold to the public. Private placement securities are generally considered to be restricted except for those securities traded between qualified institutional investors under the provisions of Rule 144A of the Securities Act of 1933 (the “Securities Act”). Illiquid securities have included securities that have not been registered under the Securities Act, securities that are otherwise not readily marketable, and repurchase agreements having a remaining maturity of longer than seven calendar days. Disposal of both illiquid and restricted securities may involve time-consuming negotiations and expenses, and prompt sale at an acceptable price may be difficult to achieve. Restricted securities outstanding during the year ended December 31, 2017 are disclosed in the Notes to the Schedules of Investments. The Funds did not hold any illiquid securities as of the year ended December 31, 2017.
Interest-Only and Principal-Only Mortgage-Backed Securities
Stripped mortgage-backed securities (“SMBS”) are derivative multi-class mortgage securities. SMBS may be issued by agencies or instrumentalities of the U.S. Government and private originators of, or investors in, mortgage loans, including savings and loan associations, mortgage banks, commercial banks, investment banks and special purpose entities of the foregoing. SMBS are usually structured with two classes that receive different proportions of the interest and principal distributions on a pool of mortgage assets. A common type of SMBS will have one class receiving some of the interest and most of the principal from the mortgage assets, while the other class will receive most of the interest and the remainder of the principal. In the most extreme case, one class will receive all
54
American Beacon FundsSM
Notes to Financial Statements
December 31, 2017
of the interest (the “IO” class), while the other class will receive the entire principal (the principal-only or “PO” class). The yield to maturity on an IO class is extremely sensitive to the rate of principal payments (including pre-payments) on the related underlying mortgage assets, and a rapid rate of principal payments may have a material adverse effect on a Fund’s yield to maturity from these securities. If the underlying mortgage assets experience greater than anticipated pre-payments of principal, a Fund may fail to recoup some or all of its initial investment in these securities even if the security is in one of the highest rating categories.
Interest-only instruments generally increase in value in a rising interest rate environment, which typically results in a slower rate of prepayments on the underlying mortgages and extends the period during which interest payments are required to be made on the IO security. Interest only securities are subject to prepayment risk, which is the risk that prepayments will accelerate in a declining interest rate environment and will reduce the number of remaining interest payments even though there is no default on the underlying mortgages. Principal only instruments generally increase in value in a declining interest rate environment, which typically results in a faster rate of prepayments on the underlying mortgages. Since a PO security is usually purchased at a discount, faster prepayments result in a higher rate of return when the face value of the security is paid back sooner than expected.
Mortgage-Backed Securities
MBS often have stated maturities of up to thirty years when they are issued, depending upon the length of the mortgages underlying the securities. In practice however, unscheduled or early payments of principal and interest on the underlying mortgages may make the securities’ effective maturity shorter than this, and the prevailing interest rates may be higher or lower than the current yield of the Funds’ portfolio at the time resulting in reinvestment risk.
Rising or high interest rates may result in slower than expected principal payments which may tend to extend the duration of MBS, making them more volatile and more sensitive to changes in interest rates. This is known as extension risk.
MBS may have less potential for capital appreciation than comparable fixed-income securities due to the likelihood of increased prepayments of mortgages resulting from foreclosures or declining interest rates. These foreclosed or refinanced mortgages are paid off at face value (par) or less, causing a loss, particularly for any investor who may have purchased the security at a premium or a price above par. In such an environment, this risk limits the potential price appreciation of these securities.
Mortgage-Related and Other Asset-Backed Securities
The Funds may invest in mortgage or other ABS. These securities may include mortgage instruments issued by U.S. government agencies (“agency mortgages”) or those issued by private entities (“non-agency mortgages”). Specific types of instruments may include mortgage pass-through securities, collateralized mortgage obligations (“CMOs”), commercial mortgage-backed securities, mortgage dollar rolls, CMO residuals, stripped mortgage-backed securities and other securities that directly or indirectly represent a participation in, or are secured by a payable from, mortgage loans on real property. The value of the Funds’ MBS may be affected by, among other things, changes or perceived changes in interest rates, factors concerning the interests in and structure of the issuer or the originator of the mortgage, or the quality of the underlying assets. The mortgages underlying the securities may default or decline in quality or value. Through its investments in MBS, a Fund has exposure to subprime loans, Alt-A loans and non-conforming loans as well as to the mortgage and credit markets generally. Underlying collateral related to subprime, Alt-A and non-conforming mortgage loans has become increasingly susceptible to defaults and declines in quality or value, especially in a declining residential real estate market. In addition, regulatory or tax changes may adversely affect the mortgage securities markets as a whole.
55
American Beacon FundsSM
Notes to Financial Statements
December 31, 2017
Other Investment Company Securities and Other Exchange-Traded Products
The Funds may invest in shares of other investment companies, including open-end funds, closed-end funds, ETFs, unit investment trusts, and other investment companies of the Trust. The Funds may invest in investment company securities advised by the Manager or a sub-advisor. Investments in the securities of other investment companies may involve duplication of advisory fees and certain other expenses. By investing in another investment company, the Funds become a shareholder of that investment company. As a result, the Funds’ shareholders indirectly will bear the Funds’ proportionate share of the fees and expenses paid by shareholders of the other investment company, in addition to the fees and expenses the Funds’ shareholders directly bear in connection with the Funds’ own operations. These other fees and expenses are reflected as Acquired Fund Fees and Expenses and are included in the Fees and Expenses Table for the Funds in their Prospectus, if applicable. Investments in other investment companies may involve the payment of substantial premiums above the value of such issuer’s portfolio securities.
Preferred Stock
A preferred stock blends the characteristics of a bond and common stock. It can offer the higher yield of a bond and has priority over common stock in equity ownership, but does not have the seniority of a bond and its participation in the issuer’s growth may be limited. Preferred stock generally has preference over common stock in the receipt of dividends and in any residual assets after payment to creditors should the issuer be dissolved. Although the dividend is set at a fixed or variable rate, in some circumstances it can be changed or omitted by the issuer. Preferred stocks are subject to the risks associated with other types of equity securities, as well as additional risks, such as credit risk, interest rate risk, potentially greater volatility and risks related to deferral, non-cumulative dividends, subordination, liquidity, limited voting rights, and special redemption rights.
Real Estate Investment Trusts
The Funds may own shares of real estate investment trusts (“REITs”) which report information on the source of their distributions annually. The Funds re-characterize distributions received from REIT investments based on information provided by the REITs into the following categories: ordinary income, long-term capital gains, and return of capital. If information is not available on a timely basis from the REITs, the re-characterization will be estimated based on available information, which may include the previous year allocation. If new or additional information becomes available from the REITs at a later date, a re-characterization will be made the following year.
Rights and Warrants
Rights are short-term warrants issued in conjunction with new stock or bond issues. Warrants are options to purchase an issuer’s securities at a stated price during a stated term. If the market price of the underlying common stock does not exceed the warrant’s exercise price during the life of the warrant, the warrant will expire worthless. Warrants usually have no voting rights, pay no dividends and have no rights with respect to the assets of the corporation issuing them. The percentage increase or decrease in the value of a warrant may be greater than the percentage increase or decrease in the value of the underlying common stock. Warrants may be purchased with values that vary depending on the change in value of one or more specified indices (“index warrants”). Index warrants are generally issued by banks or other financial institutions and give the holder the right, at any time during the term of the warrant, to receive upon exercise of the warrant a cash payment from the issuer based on the value of the underlying index at the time of the exercise. The market for warrants or rights may be very limited and it may be difficult to sell them promptly at an acceptable price. There is no specific limit on the percentage of assets the Funds may invest in rights and warrants.
Short Sales
The Funds may enter into short sale transactions. A short sale is a transaction in which a Fund sells a security it does not own in anticipation of a decline in the market price of the security. Securities sold in short sale
56
American Beacon FundsSM
Notes to Financial Statements
December 31, 2017
transactions and the dividends and interest payable on such securities, if any, are reflected as a liability on the Statement of Assets and Liabilities. A Fund is obligated to deliver the security at the market price at the time the short position is closed. The risk of loss on a short sale transaction is theoretically unlimited, because there is no limit to the cost of replacing the security sold short, whereas losses from purchase transactions cannot exceed the total amount invested. As of December 31, 2017, short positions were held by the Funds and are disclosed in the Schedules of Investments.
Special Purpose Acquisition Company
A special purpose acquisition company (“SPAC”) is a collective investment structure that allows public stock market investors to invest in private equity type transactions, particular leveraged buyouts. SPACs are shell or blank-check companies, governed by the SEC, that have no operations but go public with the intention of merging with or acquiring a company with the proceeds of the SPAC’s initial public offering (“IPO”). For the year ended December 31, 2017, the Ionic Strategic Arbitrage Fund did not hold SPAC securities in the portfolio.
U.S. Treasury Obligations
U.S. Treasury obligations include bills (initial maturities of one year or less), notes (initial maturities between two and ten years), and bonds (initial maturities over ten years) issued by the U.S. Treasury, Separately Traded Registered Interest and Principal component parts of such obligations (known as “STRIPS”) and inflation-indexed securities. The prices of these securities (like all debt securities) change between issuance and maturity in response to fluctuating market interest rates. U.S. Treasury obligations are subject to credit risk and interest rate risk.
Variable or Floating Rate Obligations
The interest rates payable on certain fixed-income securities in which the Ionic Strategic Arbitrage Fund may invest are not fixed and may fluctuate based upon changes in market rates. A variable rate obligation has an interest rate which is adjusted at predesignated periods in response to changes in the market rate of interest on which the interest rate is based. Variable and floating rate obligations are less effective than fixed rate instruments at locking in a particular yield. Nevertheless, such obligations may fluctuate in value in response to interest rate changes if there is a delay between changes in market interest rates and the interest reset date for the obligation, or for other reasons.
The Fund may invest in floating rate debt instruments (“floaters”) and engage in credit spread trades. The interest rate on a floater is a variable rate which is tied to another interest rate, such as a money-market index or U.S. Treasury bill rate. The interest rate on a floater resets periodically, typically every six months. While, because of the interest rate reset feature, floaters provide the Fund with a certain degree of protection against rises in interest rates, the Fund will participate in any declines in interest rates as well. A credit spread trade is an investment position relating to a difference in the prices or interest rates of two securities or currencies, where the value of the investment position is determined by movements in the difference between the prices or interest rates, as the case may be, of the respective securities or currencies.
5. Financial Derivative Instruments
The Funds may utilize derivative instruments to market exposure on cash balances or reduce market exposure in anticipation of liquidity needs. When considering the Funds’ use of derivatives, it is important to note that the Funds do not use derivatives for the purpose of creating financial leverage.
Forward Foreign Currency Contracts
The AHL Managed Futures Strategy Fund may enter into forward foreign currency contracts to hedge the exchange rate risk on investment transactions or to hedge the value of the Fund’s securities denominated in
57
American Beacon FundsSM
Notes to Financial Statements
December 31, 2017
foreign currencies. Forward foreign currency contracts are valued at the forward exchange rate prevailing on the day of valuation. The Fund may also use currency contracts to increase exposure to a foreign currency or to shift exposure to foreign currency fluctuations from one country to another. The Fund bears the market risk that arises from changes in foreign exchange rates, and accordingly, the unrealized gain (loss) on these contracts is reflected in the accompanying financial statements. The Fund also bears the credit risk if the counterparty fails to perform under the contract.
During the year ended December 31, 2017, the AHL Managed Futures Strategy Fund entered into forward foreign currency contracts primarily for speculative purposes.
The Fund’s forward foreign currency contract notional dollar values outstanding fluctuate throughout the operating year as required to meet strategic requirements. The following table illustrates the average quarterly volume of forward currency contracts. For the purpose of this disclosure, volume is measured by the amounts bought and sold in USD at each quarter end.
| | | | | | | | | | | | |
Average Forward Foreign Currency Notional Amount Outstanding
Year Ended December 31, 2017 | |
| Fund | | Purchased Contracts | | | | | | Sold Contracts | |
| AHL Managed Futures Strategy | | $ | 267,384,748 | | | | | | | $ | 178,703,967 | |
Futures Contracts
Futures contracts are contracts to buy or sell a standard quantity of securities at a specified price on a future date. The Funds may enter into financial futures contracts as a method for keeping assets readily convertible to cash if needed to meet shareholder redemptions or for other needs while maintaining exposure to the stock or bond market, as applicable. The primary risks associated with the use of futures contracts are the possibility of illiquid markets or imperfect correlation between the values of the contracts and the underlying securities or that the counterparty will fail to perform its obligations.
Upon entering into a futures contract, the Funds are required to set aside or deposit with a broker an amount, termed the initial margin, which typically represents a portion of the face value of the futures contract. The Funds usually reflects this amount on the Schedules of Investments as a U.S. Treasury Bill held as collateral for futures contracts or as cash deposited with broker on the Statements of Assets and Liabilities. Payments to and from the broker, known as variation margin, are required to be made on a daily basis as the price of the futures contract fluctuates. Changes in initial settlement values are accounted for as unrealized appreciation (depreciation) until the contracts are terminated, at which time realized gains and losses are recognized. Futures contracts are valued at the most recent settlement price established each day by the exchange on which they are traded.
During the year ended December 31, 2017, the Funds entered into future contracts primarily for exposing cash to markets.
The Funds’ average futures contracts outstanding fluctuate throughout the operating year as required to meet strategic requirements. The following table illustrates the average quarterly volume of futures contracts. For purpose of this disclosure, volume is measured by contracts outstanding at each quarter end.
| | | | |
Average Futures Contracts Outstanding | |
Fund | | Year Ended December 31, 2017 | |
AHL Managed Futures Strategy | | | 26,043 | |
Ionic Strategic Arbitrage | | | 79 | |
Options Contracts
The Ionic Strategic Arbitrage Fund may write (1) call and put options on futures, swaps (“swaptions”), securities, commodities or currencies it owns or in which it may invest and (2) inflation-capped options. Writing put
58
American Beacon FundsSM
Notes to Financial Statements
December 31, 2017
options tends to increase the Fund’s exposure to unfavorable movements of the underlying instrument in exchange for an upfront premium. Writing call options tends to decrease the Fund’s exposure to favorable movements of the underlying instrument in exchange for an upfront premium. When the Fund writes a call, put, or inflation-capped option, an amount equal to the premium received is recorded as a liability and subsequently marked to market to reflect the current value of the option written. The purpose of inflation-capped options is to protect the buyer from inflation erosion above a certain rate on a given notional exposure. A floor can be used to give downside protection to investments in inflation-linked products. These liabilities are reflected as written options outstanding on the Statements of Assets and Liabilities. Certain options may be written with premiums to be determined on a future date. Premiums received from writing options which expire are treated as realized gains. Premiums received from writing options which are exercised or closed are added to the proceeds or offset against amounts paid on the underlying futures, swap, security or currency transaction to determine the realized gain or loss when the underlying transaction is sold. The Fund, as a writer of an option has no control over whether the underlying instrument may be sold (call) or purchased (put) and as a result bears the market risk of an unfavorable change in the price of the instrument underlying the written option. There is the risk the Fund may not be able to enter into a closing transaction because of an illiquid market.
The Fund may also purchase put and call options. Purchasing call options tends to increase the Fund’s exposure to favorable movements of the underlying instrument in exchange for paying an upfront premium. Purchasing put options tends to decrease the Fund’s exposure to unfavorable movements of the underlying instrument. The Fund pays a premium which is included on the Fund’s Statement of Assets and Liabilities as an investment and subsequently marked to market to reflect the current value of the option. Premiums paid for purchasing options which expire are treated as realized losses. Certain options may be purchased with premiums to be determined on a future date. The premiums for these options are based upon implied volatility parameters at specified terms. The risk associated with purchasing put and call options is limited to the premium paid. Premiums paid for purchasing options which are exercised or closed are added to the amounts paid or offset against the proceeds on the underlying investment transaction to determine the realized gain or loss when the underlying transaction is sold.
During the year ended December 31, 2017, the Ionic Strategic Arbitrage Fund purchased/sold options primarily for return enhancement and hedging.
The Fund’s option contracts outstanding fluctuate throughout the operating year as required to meet strategic requirements. The following table illustrates the average quarterly volume of options contracts. For the purpose of this disclosure, volume is measured by the notional value of contracts outstanding at each quarter end.
| | | | |
Average Purchased Option Notional Amounts Outstanding | |
Fund | | Year Ended December 31, 2017 | |
Ionic Strategic Arbitrage | | $ | 4,155,275 | |
| | | | |
Average Written Option Notional Amounts Outstanding | |
Fund | | Year Ended December 31, 2017 | |
Ionic Strategic Arbitrage | | $ | 1,366,425 | |
Straddle Options
The Funds may enter into differing forms of straddle options. A straddle is an investment strategy that uses combinations of options that allow a Fund to profit based on the future price movements of the underlying security, regardless of the direction of those movements. A written straddle involves simultaneously writing a call option and a put option on the same security with the same strike price and expiration date. The written straddle increases in value when the underlying security price has little volatility before the expiration date. A purchased straddle involves simultaneously purchasing a call option and a put option on the same security with the same strike price and expiration date. The purchased straddle increases in value when the underlying security price has high volatility, regardless of direction, before the expiration date.
59
American Beacon FundsSM
Notes to Financial Statements
December 31, 2017
Swap Agreements
A swap is a transaction in which the Fund and a counterparty agree to pay or receive payments at specified dates based upon or calculated by reference to changes in specified prices or rates (e.g., interest rates in the case of interest rate swaps) or the performance of specified securities or indices based on a specified amount (the “notional” amount). Nearly any type of derivative, including forward contracts, can be structured as a swap.
Swap agreements can be structured to provide exposure to a variety of different types of investments or market factors. For example, in an interest rate swap, fixed-rate payments may be exchanged for floating rate payments; in a currency swap, U.S. dollar-denominated payments may be exchanged for payments denominated in a foreign currency; and in a total return swap, payments tied to the investment return on a particular asset, group of assets or index may be exchanged for payments that are effectively equivalent to interest payments or for payments tied to the return on another asset, group of assets, or index. Swaps may have a leverage component, and adverse changes in the value or level of the underlying asset, reference rate or index can result in gains or losses that are substantially greater than the amount invested in the swap itself.
Some swaps currently are, and more in the future will be, centrally cleared. Swaps that are centrally-cleared are exposed to the creditworthiness of the clearing organizations (and, consequently, that of their members – generally, banks and broker-dealers) involved in the transaction. For example, an investor could lose margin payments it has deposited with the clearing organization as well as the net amount of gains not yet paid by the clearing organization if it breaches its agreement with the investor or becomes insolvent or goes into bankruptcy. In the event of bankruptcy of the clearing organization, the investor may be able to recover only a portion of the net amount of gains on its transactions and of the margin owed to it, potentially resulting in losses to the investor.
Swaps that are not centrally cleared, involve the risk that a loss may be sustained as a result of the insolvency or bankruptcy of the counterparty or the failure of the counterparty to make required payments or otherwise comply with the terms of the agreement. To mitigate this risk, the Fund will only enter into swap agreements with counterparties considered by a Sub-Advisor to present minimum risk of default and the Fund normally obtains collateral to secure its exposure. Changing conditions in a particular market area, whether or not directly related to the referenced assets that underlie the swap agreement, may have an adverse impact on the creditworthiness of a counterparty.
The centrally cleared and OTC swap agreements into which the Fund enters normally provide for the obligations of the Fund and its counterparty in the event of a default or other early termination to be determined on a net basis. Similarly, periodic payments on a swap transaction that are due by each party on the same day normally are netted. To the extent that a swap agreement is subject to netting, the Fund’s cover and asset segregation responsibilities will normally be with respect to the net amount owed by the Fund. However, the Fund may be required to segregate liquid assets equal to the full notional amount of certain swaps, such as written credit default swaps on physically settled forwards or written options. The amount that the Fund must segregate may be reduced by the value of any collateral that it has pledged to secure its own obligations under the swap.
Total Return Swap Agreements
The Ionic Strategic Arbitrage Fund may enter into total return swaps in order to take a “long” or “short” position with respect to an underlying referenced asset. The Fund is subject to market price volatility of the underlying referenced asset. A total return swap involves commitments to pay interest in exchange for a market linked return based on a notional amount. To the extent that the total return of the security, group of securities or index underlying the transaction exceeds or falls short of the offsetting interest obligation, the Fund will receive a payment from or make a payment to the counterparty.
60
American Beacon FundsSM
Notes to Financial Statements
December 31, 2017
The Fund’s total return swap contracts outstanding fluctuate throughout the operating year as required to meet strategic requirements. The following table illustrates the average quarterly volume of total return swap contracts. For the purpose of this disclosure, volume is measured by the notional value of contracts outstanding at each quarter end:
| | | | |
Average Total Return Swap Notional Amounts Outstanding | |
Fund | | Year Ended December 31, 2017 | |
Ionic Strategic Arbitrage | | | 15,843,687 | |
The following is a summary of the fair valuations of the Funds’ derivative instruments categorized by risk exposure(1):
AHL Managed Futures Strategy Fund
| | | | | | | | | | | | | | | | | | | | | | | | | | | | | | | | | | | | | | | | | | | | | | | | | | | | | | | |
| Fair values of financial instruments on the Statements of Assets and Liabilities as of December 31, 2017: | |
|
Derivatives not accounted for as hedging instruments |
| | | | | | | | | | | |
Assets: | | Credit
contracts | | | | Foreign
exchange
contracts | | | | Commodity
contracts | | | | Interest rate
contracts | | | | Equity
contracts | | | | Total |
| Receivable for variation margin from open futures contracts(2) | | | $ | | | | | | | | | | $ | 3,171,672 | | | | | | | | | $ | 11,926,492 | | | | | | | | | $ | 739,904 | | | | | | | | | $ | 3,379,892 | | | | | | | | | $ | 19,217,960 | |
| Unrealized appreciation from forward foreign currency contracts | | | | - | | | | | | | | | | 2,603,085 | | | | | | | | | | - | | | | | | | | | | - | | | | | | | | | | - | | | | | | | | | | 2,603,085 | |
| | | | | | | | | | | | | | | | | | | | | | | | | | | | | | | | | | | | | | | | | | | | | | | | | | | | | | | |
| | | | | | | | | | | |
Liabilities: | | Credit
contracts | | | | Foreign
exchange
contracts | | | | Commodity
contracts | | | | Interest rate
contracts | | | | Equity
contracts | | | | Total |
| Payable for variation margin from open futures contracts(2) | | | $ | - | | | | | | | | | $ | (965,830 | ) | | | | | | | | $ | (7,595,735 | ) | | | | | | | | $ | (1,455,356 | ) | | | | | | | | $ | (1,595,300 | ) | | | | | | | | $ | (11,612,221 | ) |
| Unrealized depreciation from forward foreign currency contracts | | | | - | | | | | | | | | | (3,084,017 | ) | | | | | | | | | - | | | | | | | | | | - | | | | | | | | | | - | | | | | | | | | | (3,084,017 | ) |
| | | | | | | | | | | | | | | | | | | | | | | | | | | | | | | | | | | | | | | | | | | | | | | | | | | | | | | |
| The effect of financial derivative instruments on the Statements of Operations as of December 31, 2017: | |
|
Derivatives not accounted for as hedging instruments |
| | | | | | | | | | | |
Realized gain (loss) from derivatives
recognized as a result of operations: | | Credit
contracts | | | | Foreign
exchange
contracts | | | | Commodity
contracts | | | | Interest rate
contracts | | | | Equity
contracts | | | | Total |
| Forward foreign currency contracts | | | $ | - | | | | | | | | | $ | (3,743,646 | ) | | | | | | | | $ | - | | | | | | | | | $ | - | | | | | | | | | $ | - | | | | | | | | | $ | (3,743,646 | ) |
| Futures contracts | | | | - | | | | | | | | | | (6,654,751 | ) | | | | | | | | | (8,620,671 | ) | | | | | | | | | (21,988,702 | ) | | | | | | | | | 70,534,147 | | | | | | | | | | 33,270,023 | |
| | | | | | | | | | | |
Net change in unrealized appreciation
(depreciation) of derivatives
recognized as a result from
operations: | | Credit
contracts | | | | Foreign
exchange
contracts | | | | Commodity
contracts | | | | Interest rate
contracts | | | | Equity
contracts | | | | Total |
| Forward foreign currency contracts | | | $ | - | | | | | | | | | $ | 1,244,061 | | | | | | | | | $ | - | | | | | | | | | $ | - | | | | | | | | | $ | - | | | | | | | | | $ | 1,244,061 | |
| Futures contracts | | | | - | | | | | | | | | | 402,555 | | | | | | | | | | (224,922 | ) | | | | | | | | | (1,680,766 | ) | | | | | | | | | (392,735 | ) | | | | | | | | | (1,895,868 | ) |
61
American Beacon FundsSM
Notes to Financial Statements
December 31, 2017
Ionic Strategic Arbitrage Fund
| | | | | | | | | | | | | | | | | | | | | | | | | | | | | | | | | | | | | | | | | | | | | | | | | | | | | | | |
| Fair values of financial instruments on the Statements of Assets and Liabilities as of December 31, 2017: | |
|
Derivatives not accounted for as hedging instruments |
| | | | | | | | | | | |
Assets: | | Credit
contracts | | | | Foreign
exchange
contracts | | | | Commodity
contracts | | | | Interest rate
contracts | | | | Equity
contracts | | | | Total |
| Purchased options contracts outstanding | | | $ | - | | | | | | | | | $ | - | | | | | | | | | $ | - | | | | | | | | | $ | - | | | | | | | | | $ | 6,464,733 | | | | | | | | | $ | 6,464,733 | |
| Receivable for variation margin from open futures contracts(2) | | | | - | | | | | | | | | | - | | | | | | | | | | - | | | | | | | | | | - | | | | | | | | | | 95,148 | | | | | | | | | | 95,148 | |
| Unrealized appreciation from swap agreements | | | | - | | | | | | | | | | - | | | | | | | | | | - | | | | | | | | | | - | | | | | | | | | | 435,083 | | | | | | | | | | 435,083 | |
| | | | | | | | | | | |
Liabilities: | | Credit
contracts | | | | Foreign
exchange
contracts | | | | Commodity
contracts | | | | Interest rate
contracts | | | | Equity
contracts | | | | Total |
| Written options contracts outstanding | | | $ | - | | | | | | | | | $ | - | | | | | | | | | $ | - | | | | | | | | | $ | - | | | | | | | | | $ | (3,744,290 | ) | | | | | | | | $ | (3,744,290 | ) |
| Unrealized depreciation from swap agreements | | | | - | | | | | | | | | | - | | | | | | | | | | - | | | | | | | | | | - | | | | | | | | | | (361,853 | ) | | | | | | | | | (361,853 | ) |
| | | | | | | | | | | | | | | | | | | | | | | | | | | | | | | | | | | | | | | | | | | | | | | | | | | | | | | |
| The effect of financial derivative instruments on the Statements of Operations as of December 31, 2017: | |
|
Derivatives not accounted for as hedging instruments |
| | | | | | | | | | | |
Realized gain (loss) from derivatives
recognized as a result of operations: | | Credit
contracts | | | | Foreign
exchange
contracts | | | | Commodity
contracts | | | | Interest rate
contracts | | | | Equity
contracts | | | | Total |
| Purchased options contracts | | | $ | - | | | | | | | | | $ | - | | | | | | | | | $ | - | | | | | | | | | $ | (174,963 | ) | | | | | | | | $ | (4,520,273 | ) | | | | | | | | $ | (4,695,236 | ) |
| Futures contracts | | | | - | | | | | | | | | | 134,431 | | | | | | | | | | - | | | | | | | | | | (2,270 | ) | | | | | | | | | 1,687,773 | | | | | | | | | | 1,819,934 | |
| Swap agreements | | | | - | | | | | | | | | | - | | | | | | | | | | - | | | | | | | | | | - | | | | | | | | | | 186,831 | | | | | | | | | | 186,831 | |
| Written options contracts | | | | - | | | | | | | | | | - | | | | | | | | | | - | | | | | | | | | | - | | | | | | | | | | (479,820 | ) | | | | | | | | | (479,820 | ) |
| | | | | | | | | | | |
Net change in unrealized appreciation
(depreciation) of derivatives
recognized as a result from
operations: | | Credit
contracts | | | | Foreign
exchange
contracts | | | | Commodity
contracts | | | | Interest rate
contracts | | | | Equity
contracts | | | | Total |
| Purchased options contracts | | | $ | - | | | | | | | | | $ | - | | | | | | | | | $ | - | | | | | | | | | $ | - | | | | | | | | | $ | 1,424,834 | | | | | | | | | $ | 1,424,834 | |
| Futures contracts | | | | - | | | | | | | | | | - | | | | | | | | | | - | | | | | | | | | | - | | | | | | | | | | (24,181 | ) | | | | | | | | | (24,181 | ) |
| Swap agreements | | | | - | | | | | | | | | | - | | | | | | | | | | - | | | | | | | | | | - | | | | | | | | | | 73,230 | | | | | | | | | | 73,230 | |
| Written options contracts | | | | - | | | | | | | | | | - | | | | | | | | | | - | | | | | | | | | | - | | | | | | | | | | (1,923,885 | ) | | | | | | | | | (1,923,885 | ) |
(1) See Note 3 in the Notes to Financial Statements for additional information.
(2) Includes cumulative appreciation (depreciation) of futures contracts as reported in the Funds’ Schedules of Investments footnotes. Only current day’s variation margin is reported within the Statements of Assets and Liabilities.
Master Agreements
International Swaps and Derivatives Association, Inc. Master Agreements (“ISDA Master Agreements”) with counterparties govern transactions in over-the-counter (“OTC”) derivative and foreign exchange contracts entered into by the Funds and those counterparties. The ISDA Master Agreements contain provisions for general obligations, representations, agreements, collateral and events of default or termination. Events of termination include conditions that may entitle counterparties to elect to terminate early and cause settlement of all outstanding transactions under the applicable ISDA Master Agreement. Any election to terminate early could be material to the financial statements. Since different types of forward and OTC financial derivative transactions have different mechanics and are sometimes traded out of different legal entities of a particular counterparty organization, each type of transaction may be covered by a different Master Agreement, resulting in the need for multiple agreements with a single counterparty. As the Master Agreements are specific to unique operations of different asset types,
62
American Beacon FundsSM
Notes to Financial Statements
December 31, 2017
they allow a Fund to net its total exposure to a counterparty in the event of a default with respect to all the transactions governed under a single agreement with a counterparty.
Master Securities Forward Transaction Agreements (“Master Forward Agreements”) govern the considerations and factors surrounding the settlement of certain forward settling transactions, such as delayed delivery or sale-buyback financing transactions by and between a Fund and select counterparties. The Master Forward Agreements maintain provisions for, among other things, initiation and confirmation, payment and transfer, events of default, termination, and maintenance of collateral.
6. Principal Risks
Investing in the Funds may involve certain risks including, but not limited to, those described below.
Allocation and Correlation Risk
The sub-advisor’s judgments about, and allocations between arbitrage strategies, asset classes and market exposures may adversely affect the Funds’ performance. There can be no assurance, particularly during periods of market disruption and stress, that the Funds will, in fact, experience a low level of correlation with a traditional portfolio of stocks and bonds or with the debt or equity markets generally. This risk may be increased by the use of derivatives to increase allocations to various market exposures.
Arbitrage Risk
The Ionic Strategic Arbitrage Fund may use a variety of arbitrage strategies in pursuing its investment strategy. The underlying relationships among securities in which the Fund takes long and short positions may change in an adverse manner, or may fail to change in the manner expected, in which case the Fund may realize losses. The expected gain on an individual arbitrage investment is normally considerably smaller than the possible loss should the transaction be unexpectedly terminated.
The expected timing of each transaction is also important since the length of time that the Fund’s capital must be committed to any given transaction may affect the rate of return realized by the Fund, and unanticipated delays could cause the Fund to lose money or not achieve the desired rate of return.
The success of the Fund’s investment strategies is dependent on the sub-advisor’s ability to exploit pricing inefficiencies among interrelated instruments. Although arbitrage positions are considered to have a lower risk profile than directional trades as the former attempt to exploit price differentials rather than overall price movements, such strategies are by no means without risk. Pricing inefficiencies, even if correctly identified, may not converge within the time frame within which the Fund maintains its positions. Even pure “riskless” arbitrage – which is rare – can result in significant losses if the arbitrage cannot be sustained (due, for example, to margin calls) until expiration. The Fund’s strategies are subject to the risks of disruptions in historical price relationships, the restricted availability of credit and the obsolescence or inaccuracy of valuation models. Market disruptions may also force the Fund to close out one or more positions. Such disruptions have in the past resulted in substantial losses for funds employing similar strategies.
The Fund expects a major component of its investment strategies to involve spreads between two or more securities. To the extent the price relationships between such securities remain constant, no gain or loss may occur. Such spread strategies do, however, entail a substantial risk that the price differential could change unfavorably and result in losses.
Commodities Risk
The AHL Managed Futures Strategy Fund’s investments in commodity-linked derivative instruments may subject the Fund to greater volatility than investments in traditional securities. The value of commodity-linked
63
American Beacon FundsSM
Notes to Financial Statements
December 31, 2017
derivative instruments may be affected by changes in overall market movements, commodity index volatility, changes in interest rates, or factors affecting a particular industry or commodity, such as changes in supply and demand, drought, floods, weather, livestock disease, embargoes, tariffs, war, acts of terrorism and international economic, political and regulatory developments. The Fund and the Subsidiary each may concentrate its assets in a particular sector of the commodities market (such as oil, metal or agricultural products). As a result, the Fund and the Subsidiary may be more susceptible to risks associated with those sectors. The Fund’s investments in commodity-related instruments may lead to losses in excess of the Fund’s investment in such products. Such losses can significantly and adversely affect the NAV of the Fund and, consequently, a shareholder’s interest in the Fund.
Counterparty Risk
The Funds are subject to the risk that a party or participant to a transaction, such as a broker or derivative counterparty, will be unwilling or unable to satisfy its obligation to make timely principal, interest or settlement payments or to otherwise honor its obligations to the Funds.
Credit Risk
The Funds are subject to the risk that the issuer or guarantor of a debt security, or the counterparty to a derivatives contract or a loan, will fail to make timely payment of interest or principal or otherwise honor its obligations or default completely.
Currency Risk
The Funds may have exposure to foreign currencies by making direct investments in non-U.S. currencies or in securities denominated in non-U.S. currencies, purchasing or selling forward foreign currency exchange contracts in non-U.S. currencies, including both non-deliverable forwards (“NDFs”) and deliverable forwards, non-U.S. currency futures contracts, options (including non-deliverable options (“NDOs”) on non-U.S. currencies and non-U.S. currency futures) and swaps for cross-currency investments. Foreign currencies may decline in value relative to the U.S. dollar and other currencies and thereby affect the Fund’s investments in foreign (non-U.S.) currencies.
Derivatives Risk
Derivatives may involve significant risk. The use of derivative instruments may expose the Funds to additional risks that they would not be subject to if they invested directly in the securities or other instruments underlying those derivatives, including the high degree of leverage often embedded in such instruments, and potential material and prolonged deviations between the theoretical value and realizable value of a derivative. Some derivatives have the potential for unlimited loss, regardless of the size of the Funds’ initial investment. Derivatives may be illiquid and may be more volatile than other types of investments. The Funds may buy or sell derivatives not traded on an exchange and which may be subject to heightened liquidity and valuation risk. Derivative investments can increase portfolio turnover and transaction costs. Derivatives also are subject to counterparty risk. As a result, the Funds may obtain no recovery of their investment or may only obtain a limited recovery, and any recovery may be delayed. Not all derivative transactions require a counterparty to post collateral, which may expose the Funds to greater losses in the event of a default by a counterparty.
Equity Investment Risk
Equity securities are subject to market risk. The Funds’ investments in equity securities may include common stocks, preferred stocks, securities convertible into or exchangeable for common stocks, REITs, depositary receipts, and U.S. dollar-denominated foreign stocks traded on U.S. exchanges. Such investments may expose the Funds to additional risk. The value of a company’s common stock may fall as a result of factors affecting the company, companies in the same industry or sector, or the financial markets overall. Common stock generally is
64
American Beacon FundsSM
Notes to Financial Statements
December 31, 2017
subordinate to preferred stock upon the liquidation or bankruptcy of the issuing company. Preferred stocks and convertible securities are sensitive to movements in interest rates. Preferred stocks may be less liquid than common stocks and, unlike common stocks, participation in the growth of an issuer may be limited. Distributions on preferred stocks generally are payable at the discretion of an issuer and after required payments to bond holders. Convertible securities are subject to the risk that the credit standing of the issuer may have an effect on the convertible securities’ investment value. Investments in REITs are subject to the risks associated with investing in the real estate industry such as adverse developments affecting the real estate industry and real property values. Depositary receipts and U.S. dollar-denominated foreign stocks traded on U.S. exchanges are subject to certain of the risks associated with investing directly in foreign securities, including, but not limited to, currency fluctuations and political and financial instability in the home country of a particular depositary receipt or foreign stock.
Foreign Investing Risk
The Funds may invest in securities issued by foreign companies through ADRs and U.S. dollar-denominated foreign stocks traded on U.S. exchanges. The Funds may also invest in local currency investments. ADRs are subject to many of the risks inherent in currency fluctuations and political and financial instability in the home country of a particular ADR or foreign stock. Non-U.S. investments carry potential risks not associated with U.S. investments. Such risks include, but are not limited to: (1) currency exchange rate fluctuations, (2) political and financial instability, (3) less liquidity and greater volatility, (4) lack of uniform accounting, auditing and financial reporting standards, (5) increased price volatility, (6) less government regulation and supervision of foreign stock exchanges, brokers and listed companies, and (7) delays in transaction settlement in some foreign markets.
Futures Contracts Risk
Futures contracts are derivative instruments where one party pays a fixed price for an agreed amount of securities or other underlying assets at an agreed date. The use of such derivative instruments may expose the Funds to additional risks that they would not be subject to if they invested directly in the securities underlying those derivatives. Futures contracts may experience potentially dramatic price changes (losses) and imperfect correlation between the price of the contract and the underlying security or index, which will increase the volatility of the Funds and may involve a small investment of cash (the amount of initial and variation margin) relative to the magnitude of the risk assumed (the potential increase or decrease in the price of the futures contract).
Hedging Risk
If the Funds use a hedging instrument at the wrong time or judges the market conditions incorrectly, or the hedged instrument does not correlate to the risk sought to be hedged, the hedge might be unsuccessful, reduce the Funds’ return, or create a loss.
High Portfolio Turnover Risk
Portfolio turnover is a measure of the Fund’s trading activity over a one-year period. A portfolio turnover rate of 100% would indicate that the Fund sold and replaced the entire value of its securities holdings during the period. High portfolio turnover could increase the Fund’s transaction costs because of increased broker commissions resulting from such transactions. These costs are not reflected in the Fund’s annual operating expenses or in the expense example, but they can have a negative impact on performance. Frequent trading by the Fund could also result in increased realized net capital gains, distributions of which are taxable to the Fund’s shareholders (including net short-term capital gain distributions, which are taxable to them as ordinary income).
High-Yield Securities Risk
Investing in high-yield, below investment-grade securities (commonly referred to as “junk bonds”) generally involves significantly greater risks of loss of your money than an investment in investment grade securities. High-yield
65
American Beacon FundsSM
Notes to Financial Statements
December 31, 2017
debt securities may fluctuate more widely in price and yield and may fall in price when the economy is weak or expected to become weak. High-yield securities are considered to be speculative with respect to an issuer’s ability to pay interest and principal and carry a greater risk that the issuers of lower-rated securities will default on the timely payment of principal and interest. Below investment grade securities may experience greater price volatility and less liquidity than investment grade securities.
Illiquid and Restricted Securities Risk
Securities not registered in the U.S. under the Securities Act of 1933, as amended (the “Securities Act”), including Rule 144A securities, are restricted as to their resale. Such securities may not be listed on an exchange and may have no active trading market. They may be more difficult to purchase or sell at an advantageous time or price because such securities may not be readily marketable in broad public markets. The Funds may not be able to sell a restricted security when the sub-advisor considers it desirable to do so and/or may have to sell the security at a lower price than the Funds believe is its fair market value. In addition, transaction costs may be higher for restricted securities and the Funds may receive only limited information regarding the issuer of a restricted security. The Funds may have to bear the expense of registering restricted securities for resale and the risk of substantial delays in effecting the registration.
Interest Rate Risk
The Funds are subject to the risk that the market value of fixed-income securities or derivatives it holds, particularly mortgage backed and other asset backed securities, will decline due to rising interest rates. Generally, the value of investments with interest rate risk, such as fixed-income securities, will move in the opposite direction to movements in interest rates. The Federal Reserve raised the federal funds rate in December 2016, March 2017, June 2017, and December 2017 and has signaled additional increases in 2018. Interest rates may rise, perhaps significantly and/or rapidly, potentially resulting in substantial losses to the Funds. The prices of fixed-income securities or derivatives are also affected by their duration. Fixed-income securities or derivatives with longer duration generally have greater sensitivity to changes in interest rates. An increase in interest rates can impact markets broadly as well.
Leverage Risk
The Funds’ use of futures, forward foreign currency contracts, swaps, other derivative instruments and selling securities short will have the economic effect of financial leverage. Financial leverage magnifies the exposure to the swings in prices of an asset or class of assets underlying a derivative instrument and results in increased volatility, which means that the Funds will have the potential for greater losses than if the Funds do not use the derivative instruments that have a leveraging effect. Leverage may result in losses that exceed the amount originally invested and may accelerate the rate of losses. Leverage tends to magnify, sometimes significantly, the effect of an increase or decrease in the Funds’ exposure to an asset or class of assets and may cause the Funds’ NAV to be volatile.
Liquidity Risk
The Funds are susceptible to the risk that certain fixed-income investments, may have limited marketability or be subject to restrictions on sale, and may be difficult or impossible to purchase or sell at favorable times or prices. The Funds could lose money if they are unable to dispose of an investment at a time that is most beneficial to the Funds. The Funds may be required to dispose of investments at unfavorable times or prices to satisfy obligations, which may result in losses or may be costly to the Funds. For example, the Funds may be forced to sell certain investments at unfavorable prices to meet redemption requests or other cash needs. Judgment plays a greater role in pricing illiquid investments than in investments with more active markets.
Market Direction Risk
Since the Funds will typically hold both long and short positions, an investment in the Funds will involve market risks associated with different types of investment decisions than those made for a typical “long only”
66
American Beacon FundsSM
Notes to Financial Statements
December 31, 2017
fund. The Funds’ results could suffer both when there is a general market advance and the Funds hold significant “short” positions, and when there is a general market decline and the Funds hold significant “long” positions.
Market Risk
Since the financial crisis that started in 2008, the U.S. and many foreign economies continue to experience its after-effects, which have resulted, and may continue to result, in fixed-income instruments experiencing unusual liquidity issues, increased price volatility and, in some cases, credit downgrades and increased likelihood of default. These events have reduced the willingness and ability of some lenders to extend credit, and have made it more difficult for some borrowers to obtain financing on attractive terms, if at all. In addition, global economies and financial markets are becoming increasingly interconnected, which increases the possibilities that conditions in one country or region might adversely impact issuers in a different country or region. The severity or duration of adverse economic conditions may also be affected by policy changes made by governments or quasi-governmental organizations.
In addition, political events within the U.S. and abroad may affect investor and consumer confidence and may adversely impact financial markets and the broader economy, perhaps suddenly and to a significant degree. High public debt in the U.S. and other countries creates ongoing systemic and market risks and policymaking uncertainty. Because the impact on the markets has been widespread, it may be difficult to identify both risks and opportunities using past models of the interplay of market forces, or to predict the duration of these market conditions. Interest rates have been unusually low in recent years in the U.S. and abroad. Because there is little precedent for this situation, it is difficult to predict the impact on various markets of a significant rate increase, whether brought about by U.S. policy makers or by dislocations in world markets. In addition, there is a risk that the prices of goods and services in the U.S. and many foreign economies may decline over time, known as deflation (the opposite of inflation). Deflation may have an adverse effect on stock prices and creditworthiness and may make defaults on debt more likely.
Mortgage-Backed and Mortgage Related Securities Risk
Certain mortgage-backed and mortgage related securities may include securities backed by pools of loans made to “subprime” borrowers or borrowers with blemished credit histories; the risk of defaults is generally higher in the case of mortgage pools that include such subprime mortgages. A security backed by the U.S. Treasury or the full faith and credit of the United States is guaranteed by the applicable entity only as to the timely payment of interest and principal when held to maturity. The market prices for such securities are not guaranteed and will fluctuate. Additionally, circumstances could arise that would prevent the payment of interest or principal. This could result in losses to the Funds. Securities held by the Funds that are issued by government-sponsored enterprises, such as the Fannie Mae, Freddie Mac, and FHLB are not guaranteed by the U.S. Treasury, are not backed by the full faith and credit of the U.S. Government and no assurance can be given that the U.S. Government will provide financial support. U.S. Government securities and securities of government sponsored enterprises are also subject to credit risk, interest rate risk and market risk. The Funds’ investment in CMOs may offer a higher yield than U.S. government securities, but they may also be subject to greater price fluctuation and credit risk. The cash flows and yields on IO and PO are extremely sensitive to the rate of principal payments (including prepayments) on the underlying mortgage loans or mortgage-backed securities. A rapid rate of principal payments may adversely affect the yield to maturity of IOs. A slow rate of principal payments may adversely affect the yield to maturity of POs. Inverse IOs and POs, which are fixed-income securities with a floating or variable rate of interest, may exhibit substantially greater price volatility than fixed rate obligations having similar credit quality, redemption provisions and maturity.
Non-Diversification Risk
The Funds are non-diversified, which means the Funds may focus their investments in the securities of a comparatively small number of issuers. Investments in securities of a limited number of issuers exposes the Funds to greater market risk and potential losses than if assets were diversified among the securities of a greater number of issuers.
67
American Beacon FundsSM
Notes to Financial Statements
December 31, 2017
Obsolescence Risk
The Funds are unlikely to be successful in its quantitative trading strategies unless the assumptions underlying the models are realistic and either remain realistic and relevant in the future or are adjusted to account for changes in the overall market environment. If such assumptions are inaccurate or become inaccurate and are not promptly adjusted, it is likely that profitable trading signals will not be generated. If and to the extent that the models do not reflect certain factors, and the sub-advisor does not successfully address such omission through its testing and evaluation and modify the models accordingly, major losses may result – all of which will be borne by the Funds.
Options Risk
In order for a call option to be profitable, the market price of the underlying security must rise sufficiently above the exercise price to cover the premium and transaction costs. These costs will reduce an profit that might have realized had it bought the underlying security at the time it purchased the call option. For a put option to be profitable, the market price of the underlying security must decline sufficiently below the exercise price to cover the premium and transaction costs. By using put options in this manner, the Funds will reduce any profit it might otherwise have realized from appreciation of the underlying security by the premium paid for the put option and by transaction costs. If the Funds sell a put option, there is a risk that the Funds may be required to buy the underlying asset at a disadvantageous price. If the Funds sell a call option, there is a risk that the Funds may be required to sell the underlying asset at a disadvantageous price. If the Funds sell a call option on an underlying asset that the Funds own and the underlying asset has increased in value when the call option is exercised, the Funds will be required to sell the underlying asset at the call price and will not be able to realize any of the underlying asset’s value above the call price.
Other Investment Companies Risk
The Funds may invest in shares of other registered investment companies, including ETFs and money market funds. To the extent that the Funds invest in shares of other registered investment companies, the Funds will indirectly bear the fees and expenses charged by the underlying funds in addition to the Funds’ direct fees and expenses and will be subject to the risks associated with investments in those funds.
Prepayment and Extension Risk
Prepayment risk is the risk that the principal amount of a bond may be repaid prior to the bond’s maturity date. Due to a decline in interest rates or excess cash flow, a debt security may be called or otherwise prepaid before maturity. If this occurs, no additional interest will be paid on the investment and the Funds may have to invest at a lower rate, may not benefit from an increase in value that may result from declining interest rates, and may lose any premium it paid to acquire the security. Variable and floating rate securities may be less sensitive to prepayment risk. Extension risk is the risk that a decrease in prepayments may, as a result of higher interest rates or other factors, result in the extension of a security’s effective maturity, heighten interest rate risk and increase the potential for a decline in price.
Short Position Risk
The Funds will incur a loss as a result of a short position if the price of the instrument sold short increases in value between the date of the short sale and the date on which an offsetting position is purchased. Short positions may be considered speculative transactions and involve special risks, including greater reliance on the sub-advisor’s ability to accurately anticipate the future value of a security or instrument. The Funds’ losses are potentially unlimited in a short position transaction.
Subsidiary Risk
By investing in the Subsidiary, the AHL Managed Futures Strategy Fund is indirectly exposed to the risk associated with the Subsidiary’s Investments. The derivatives and other investments held by the Subsidiary are
68
American Beacon FundsSM
Notes to Financial Statements
December 31, 2017
generally similar to those that are permitted to be held by the Fund and are subject to the same risks that apply to similar investments if held directly by the Fund. There can be no assurance that the investment objective of the Fund or the Subsidiary will be achieved.
The Subsidiary is not registered under the 1940 Act, and, unless otherwise noted in this Report, is not subject to all the investor protections of the 1940 Act. In addition, changes in the laws of the United States and/or the Cayman Islands could result in the inability of the Fund and/or the Subsidiary to operate as described in the Fund’s Prospectus and SAI and could adversely affect the Fund’s performance.
Swap Agreement Risk
Swaps can involve greater risks than a direct investment in an underlying asset, because swaps typically include a certain amount of embedded leverage and as such are subject to leveraging risk. If swaps are used as a hedging strategy, the Funds are subject to the risk that the hedging strategy may not eliminate the risk that is intended to offset, due to, among other reasons, the occurrence of unexpected price movements or the non-occurrence of expected price movements. Swaps also may be difficult to value. Interest rate swaps, total return swaps, currency swaps, credit default swaps and commodities swaps are subject to counterparty risk, credit risk and liquidity risk. In addition, interest rate swaps are subject to interest rate risk, total return swaps are subject to market risk, and interest rate risk if the underlying securities are bonds or other debt obligations, currency swaps are subject to currency risk, and commodities swaps are subject to commodities risk.
Tax Risk
To qualify as a regulated investment company under Subchapter M (“RIC”), the AHL Managed Futures Strategy Fund must derive at least 90 percent of its gross income for each taxable year from qualifying income, which is described in more detail in the SAI. Income from certain commodity-linked derivative instruments in which the AHL Managed Futures Strategy Fund invests is not considered qualifying income. The Fund will therefore restrict the income from direct investments in commodity-linked derivative instruments that do not generate qualifying income, such as commodity-linked swaps, to a maximum of 10 percent of its gross income for each taxable year. The Fund’s investment in the Subsidiary is expected to provide the Fund with exposure to the commodities markets within the limitations of the federal tax requirements of Subchapter M.
The Internal Revenue Service (“IRS”) has issued a large number of private letter rulings (which the AHL Managed Futures Strategy Fund may not cite as precedent) beginning in 2006 that income a RIC derives from a wholly owned foreign subsidiary (such as the Subsidiary) that earns income derived from commodity-linked derivative instruments is qualifying income. The IRS suspended the issuance of new such rulings in July 2011 but has not taken any actions regarding its previously issued rulings. According, the Fund has not sought to obtain such a ruling and is relying on the advice of counsel regarding the tax treating of distributions by the Subsidiary to the Fund of such income. The tax treatment of the Fund’s commodity-linked investments may be materially adversely affected by future legislation, Treasury regulations, and/or guidance issued by the IRS that could affect whether income from such investments is qualifying income under Subchapter M, or otherwise materially affect the character, timing and/or amount of the Fund’s taxable income or any gains and distributions made by the Fund.
Valuation Risk
The Funds may value certain assets at a price different from the price at which they can be sold. This risk may be especially pronounced for investments, such as certain derivatives, which may be illiquid or which may become illiquid.
Volatility Risk
The Funds may have investments that appreciate or decrease significantly in value over short periods of time. This may cause the Funds’ NAV to experience significant increases or declines in value over short periods of time.
69
American Beacon FundsSM
Notes to Financial Statements
December 31, 2017
Warrants Risk
Warrants may be more speculative than certain other types of investments because warrants do not carry with them dividend or voting rights with respect to the underlying securities, or any rights in the assets of the issuer. In addition, the value of a warrant does not necessarily change with the value of the underlying securities, and a warrant ceases to have value if it is not exercised prior to its expiration date.
Offsetting Assets and Liabilities
The Funds are parties to enforceable master netting agreements between brokers and counterparties which provide for the right to offset under certain circumstances. The Funds employ multiple money managers and counterparties and have elected not to offset qualifying financial and derivative instruments on the Statements of Assets and Liabilities, as such all financial and derivative instruments are presented on a gross basis. The impacts of netting arrangements that provide the right to offset are detailed below. The net amount represents the net receivable or payable that would be due from or to the counterparty in the event of default. Exposure from borrowings and other financing agreements such as repurchase agreements can only be netted across transactions governed by the same Master Agreement with the same legal entity. All amounts reported below represent the balance as of the report date, December 31, 2017.
AHL Managed Futures Strategy Fund
| | | | | | | | | | | | |
| Offsetting of Financial and Derivative Assets as of December 31, 2017: | |
| | | Assets | | | | | | Liabilities | |
| Futures Contracts | | $ | 19,217,960 | | | | | | | $ | 11,612,221 | |
| Forward Foreign Currency Contracts | | | 2,603,085 | | | | | | | | 3,084,017 | |
| | | | | | | | | | | | |
| Total derivative assets and liabilities in the Statements of Assets and Liabilities | | $ | 21,821,045 | | | | | | | $ | 14,696,238 | |
| | | | | | | | | | | | |
| Derivatives not subject to a Master Netting Agreement or similar agreement (“MNA”) | | | (19,217,960 | ) | | | | | | | (11,612,221 | ) |
| | | | | | | | | | | | |
| Total derivative assets and liabilities subject to an MNA | | $ | 2,603,085 | | | | | | | $ | 3,084,017 | |
| | | | | | | | | | | | |
| | | | | | | | | | | | | | | | | | | | | | | | | | | | | | | | | | | | |
| Financial Assets, Derivatives, and Collateral Received/(Pledged) by Counterparty as of December 31, 2017: | |
| | | | | | | | | | | | | | | Gross Amounts Not Offset in the
Statements of Assets and Liabilities | | | | | | | |
Counterparty | | Gross Amounts of
Assets Presented in
the Statements of
Assets and Liabilities | | | | | | Derivatives
Available for
Offset | | | | | | Non-Cash Collateral
Pledged | | | | | | Cash Collateral
Pledged | | | | | | Net Amount | |
| Deutsche Bank AG | | $ | 1,698,157 | | | | | | | $ | (38,758 | ) | | | | | | $ | - | | | | | | | $ | - | | | | | | | $ | 1,659,399 | |
| HSBC Bank (USA) | | | 761,397 | | | | | | | | (761,397 | ) | | | | | | | - | | | | | | | | - | | | | | | | | - | |
| Royal Bank of Scotland PLC | | | 143,531 | | | | | | | | (143,531 | ) | | | | | | | - | | | | | | | | - | | | | | | | | - | |
| | | | | | | | | | | | | | | | | | | | | | | | | | | | | | | | | | | | |
Total | | $ | 2,603,085 | | | | | | | $ | (943,686 | ) | | | | | | $ | - | | | | | | | $ | - | | | | | | | $ | 1,659,399 | |
| | | | | | | | | | | | | | | | | | | | | | | | | | | | | | | | | | | | |
| | | | | | | |
| | | | | | | | | | | | | | | Gross Amounts Not Offset in the
Statements of Assets and Liabilities | | | | | | | |
Counterparty | | Gross Amounts of
Liabilities Presented in
the Statements of
Assets and Liabilities | | | | | | Derivatives
Available for
Offset | | | | | | Non-Cash Collateral
Received | | | | | | Cash Collateral
Received | | | | | | Net Amount | |
| Deutsche Bank AG | | $ | 38,758 | | | | | | | $ | (38,758 | ) | | | | | | $ | - | | | | | | | $ | - | | | | | | | $ | - | |
| HSBC Bank (USA) | | | 2,474,372 | | | | | | | | (761,397 | ) | | | | | | | - | | | | | | | | - | | | | | | | | 1,712,975 | |
| Royal Bank of Scotland PLC | | | 570,887 | | | | | | | | (143,531 | ) | | | | | | | - | | | | | | | | - | | | | | | | | 427,356 | |
| | | | | | | | | | | | | | | | | | | | | | | | | | | | | | | | | | | | |
Total | | $ | 3,084,017 | | | | | | | $ | (943,686 | ) | | | | | | $ | - | | | | | | | $ | - | | | | | | | $ | 2,140,331 | |
| | | | | | | | | | | | | | | | | | | | | | | | | | | | | | | | | | | | |
70
American Beacon FundsSM
Notes to Financial Statements
December 31, 2017
Ionic Strategic Arbitrage Fund
| | | | | | | | | | | | |
| Offsetting of Financial and Derivative Assets as of December 31, 2017: | | | | | | | | | | | | |
| | | Assets | | | | | | Liabilities | |
| Futures Contracts | | $ | 95,148 | | | | | | | $ | - | |
| Swap Agreement—OTC | | | 435,083 | | | | | | | | 361,853 | |
| Purchased Options Contracts | | | 6,464,733 | | | | | | | | - | |
| Written Options Contracts | | | - | | | | | | | | 3,744,290 | |
| | | | | | | | | | | | |
| Total derivative assets and liabilities in the Statements of Assets and Liabilities | | $ | 6,994,964 | | | | | | | $ | 4,106,143 | |
| | | | | | | | | | | | |
| Derivatives not subject to a Master Netting Agreement or similar agreement (“MNA”) | | | (6,339,622 | ) | | | | | | | (3,744,290 | ) |
| | | | | | | | | | | | |
| Total derivative assets and liabilities subject to an MNA | | $ | 655,342 | | | | | | | $ | 361,853 | |
| | | | | | | | | | | | |
| | | | | | | | | | | | | | | | | | | | | | | | | | | | | | | | | | | | |
| Financial Assets, Derivatives, and Collateral Received/(Pledged) by Counterparty as of December 31, 2017: | |
| | | | | | | | | | | | | | | Gross Amounts Not Offset in the
Statements of Assets and Liabilities | | | | | | | |
Counterparty | | Gross Amounts of
Assets Presented in
the Statements of
Assets and Liabilities | | | | | | Derivatives
Available for
Offset | | | | | | Non-Cash Collateral
Pledged | | | | | | Cash Collateral
Pledged | | | | | | Net Amount | |
| Deutsche Bank AG | | $ | 655,342 | | | | | | | $ | (361,853 | ) | | | | | | $ | - | | | | | | | $ | - | | | | | | | $ | 293,489 | |
| | | | | | | | | | | | | | | | | | | | | | | | | | | | | | | | | | | | |
Total | | $ | 655,342 | | | | | | | $ | (361,853 | ) | | | | | | $ | - | | | | | | | $ | - | | | | | | | $ | 293,489 | |
| | | | | | | | | | | | | | | | | | | | | | | | | | | | | | | | | | | | |
| | | | | | | |
| | | | | | | | | | | | | | | Gross Amounts Not Offset in the
Statements of Assets and Liabilities | | | | | | | |
Counterparty | | Gross Amounts of
Liabilities Presented in
the Statements of
Assets and Liabilities | | | | | | Derivatives
Available for
Offset | | | | | | Non-Cash Collateral
Received | | | | | | Cash Collateral
Received | | | | | | Net Amount | |
| Deutsche Bank AG | | $ | 361,853 | | | | | | | $ | (361,853 | ) | | | | | | $ | - | | | | | | | $ | - | | | | | | | $ | - | |
| | | | | | | | | | | | | | | | | | | | | | | | | | | | | | | | | | | | |
Total | | $ | 361,853 | | | | | | | $ | (361,853 | ) | | | | | | $ | - | | | | | | | $ | - | | | | | | | $ | - | |
| | | | | | | | | | | | | | | | | | | | | | | | | | | | | | | | | | | | |
7. Federal Income and Excise Taxes
It is the policy of each Fund to qualify as a regulated investment company, by complying with all applicable provisions of Subchapter M of the Internal Revenue Code, as amended, and to make distributions of taxable income sufficient to relieve it from substantially all federal income and excise taxes. For federal income tax purposes, each Fund is treated as a single entity for the purpose of determining such qualification.
The Funds do not have any unrecorded tax liabilities in the accompanying financial statements. Each of the tax years of the AHL Managed Futures Strategy Fund in the four year period ended December 31, 2017 remain subject to examination by the IRS. Each of the tax years of the Ionic Strategic Arbitrage Fund in the two year period ended December 31, 2017 remain subject to examination by the IRS. If applicable, the Funds recognize interest accrued related to unrecognized tax benefits in interest expense and penalties in “Other expenses” on the Statements of Operations.
The Funds may be subject to taxes imposed by countries in which it invests. Such taxes are generally based on returns of income earned or gains realized or repatriated. Taxes are accrued and applied to net investment income, net realized capital gains and net unrealized appreciation (depreciation), as applicable, as the income is earned or capital gains are recorded.
Dividends are categorized in accordance with income tax regulations which may treat certain transactions differently than U.S. GAAP. Accordingly, the character of distributions and composition of net assets for tax purposes may differ from those reflected in the accompanying financial statements. The Funds also utilize earnings and profits distributed to shareholders on redemptions of shares as part of the dividends paid deduction.
71
American Beacon FundsSM
Notes to Financial Statements
December 31, 2017
The tax character of distributions paid were as follows:
| | | | | | | | | | | | | | | | | | | | | | | | | | | | |
| | | AHL Managed Futures Strategy Fund | | | | | | Ionic Strategic Arbitrage Fund | |
| | | Year Ended
December 31, 2017 | | | | | | Year Ended
December 31, 2016 | | | | | | Year Ended
December 31, 2017 | | | | | | Year Ended
December 31, 2016 | |
Distributions paid from: | |
Ordinary income* | |
Institutional Class | | $ | 13,769,404 | | | | | | | $ | - | | | | | | | $ | 2,056,670 | | | | | | | $ | 9,569,309 | |
Y Class | | | 3,358,319 | | | | | | | | - | | | | | | | | 5,500,240 | | | | | | | | 5,862,263 | |
Investors Class | | | 705,603 | | | | | | | | - | | | | | | | | 117,474 | | | | | | | | 136,202 | |
A Class | | | 128,958 | | | | | | | | - | | | | | | | | 8,349 | | | | | | | | 11,251 | |
C Class | | | 208,478 | | | | | | | | - | | | | | | | | 5,449 | | | | | | | | 15,725 | |
Long-term capital gains | |
Institutional Class | | | 1,407,014 | | | | | | | | - | | | | | | | | - | | | | | | | | - | |
Y Class | | | 343,167 | | | | | | | | - | | | | | | | | - | | | | | | | | - | |
Investors Class | | | 72,102 | | | | | | | | - | | | | | | | | - | | | | | | | | - | |
A Class | | | 13,177 | | | | | | | | - | | | | | | | | - | | | | | | | | - | |
C Class | | | 21,303 | | | | | | | | - | | | | | | | | - | | | | | | | | - | |
| | | | | | | | | | | | | | | | | | | | | | | | | | | | |
Total distributions paid | | $ | 20,027,525 | | | | | | | $ | - | | | | | | | $ | 7,688,182 | | | | | | | $ | 15,594,750 | |
| | | | | | | | | | | | | | | | | | | | | | | | | | | | |
*For tax purposes, short-term capital gains are considered ordinary income distributions.
As of December 31, 2017 the components of distributable earnings (deficits) on a tax basis were as follows:
| | | | | | | | | | | | | | | | | | | | | | | | | | | | |
Fund | | Tax Cost | | | | | | Unrealized
Appreciation | | | | | | Unrealized
(Depreciation) | | | | | | Net Unrealized
Appreciation
(Depreciation) | |
| AHL Managed Futures Strategy | | $ | 498,591,619 | | | | | | | $ | 1,555,212 | | | | | | | $ | (13,761,752 | ) | | | | | | $ | (12,206,540 | ) |
| Ionic Strategic Arbitrage | | | 122,933,099 | | | | | | | | - | | | | | | | | (21,563,329 | ) | | | | | | | (21,563,329 | ) |
| | | | | | | | | | | | | | | | | | | | | | | | | | | | | | | | | | | | | | | | | | | | |
Fund | | Net Unrealized
Appreciation
(Depreciation) | | | | | | Undistributed
Ordinary
Income | | | | | | Undistributed
Long-Term
Capital Gains | | | | | | Accumulated
Capital and
Other (Losses) | | | | | | Other
Temporary
Differences | | | | | | Distributable
Earnings | |
| AHL Managed Futures Strategy | | $ | (12,206,540 | ) | | | | | | $ | 5,441,699 | | | | | | | $ | - | | | | | | | $ | (2,348,474 | ) | | | | | | $ | - | | | | | | | $ | (9,113,315 | ) |
| Ionic Strategic Arbitrage | | | (21,563,329 | ) | | | | | | | 1,649,537 | | | | | | | | - | | | | | | | | (2,767,009 | ) | | | | | | | - | | | | | | | | (22,680,801 | ) |
Financial reporting records are adjusted for permanent book/tax differences to reflect tax character. Financial records are not adjusted for temporary differences. The temporary differences between financial reporting and tax-basis reporting of unrealized appreciation (depreciation) are attributable primarily to the realization of unrealized gains (losses) from certain derivative instruments, the tax deferral of losses from wash sales, deemed distributions on convertible obligations, CPDI, unsettled short positions, straddles, and the realization for tax purposes of unrealized gain (loss) on investments in passive foreign investment companies.
Due to inherent differences in the recognition of income, expenses, and realized gains (losses) under U.S. GAAP and federal income tax regulations, permanent differences between book and tax reporting have been identified and appropriately reclassified on the Statements of Assets and Liabilities.
Accordingly, the following amounts represent current year permanent differences derived from foreign currency re-classes, paydowns, gains (losses) from sales of investments in passive foreign investments companies, reclassifications of income from closed-end funds, reclassification of income from investment subsidiary, sales of CPDI securities, non-utilization of net operating losses, and dividend reclassed as of December 31, 2017:
| | | | | | | | | | | | | | | | | | | | | | | | | | | | | | | | |
Fund | | Paid-In-Capital | | | | | | Undistributed
(Overdistribution of)
Net Investment
Income | | | | | | Accumulated Net
Realized Gain (Loss) | | | | | | Net Unrealized
Appreciation
(Depreciation) | | | | |
| AHL Managed Futures Strategy | | $ | (8,297,581 | ) | | | | | | $ | 3,027,347 | | | | | | | $ | 5,270,234 | | | | | | | $ | – | | | | | |
| Ionic Strategic Arbitrage | | | (6,955 | ) | | | | | | | 6,254,471 | | | | | | | | (6,247,516 | ) | | | | | | | – | | | | | |
72
American Beacon FundsSM
Notes to Financial Statements
December 31, 2017
Under the Regulated Investment Company Modernization Act of 2010 (“RIC MOD”), net capital losses recognized by the Funds in taxable years beginning after December 22, 2010 are carried forward indefinitely and retain their character as short-term and/or long-term losses.
During the year December 31, 2017 the Funds had the following post RIC MOD capital loss carryforwards:
| | | | | | | | | | | | |
Fund | | Short-Term Capital
Loss Carryforwards | | | | | | Long-Term Capital
Loss Carryforwards | |
| AHL Managed Futures Strategy | | $ | - | | | | | | | $ | - | |
| Ionic Strategic Arbitrage | | | 2,767,009 | | | | | | | | - | |
The AHL Managed Futures Strategy Fund utilized $9,365,911 short-term and $2,267,413 long-term capital loss carryforwards.
The Funds are permitted for tax purposes to defer into its next fiscal year qualified late year losses. Qualified late year capital losses are any capital losses incurred after October 31 through the Fund’s fiscal year end, December 31, 2017. Qualified late year ordinary losses are specified losses generally incurred after October 31 through the Fund’s fiscal year end, December 31, 2017. For the period ended December 31, 2017, AHL Managed Futures Strategy Fund deferred $2,348,474 of long-term capital losses to January 1, 2018.
8. Investment Transactions
The aggregate cost of purchases and proceeds from sales and maturities of investments, other than short-term obligations, for the year ended December 31, 2017 were as follows:
| | | | | | | | | | | | | | | | | | | | | | | | | | | | |
Fund | | Purchases
(non-U.S. Government
Securities) | | | | | | Purchases of U.S.
Government
Securities | | | | | | Sales
(non-U.S. Government
Securities) | | | | | | Sales of U.S.
Government
Securities | |
| AHL Managed Futures Strategy | | $ | – | | | | | | | $ | – | | | | | | | $ | – | | | | | | | $ | – | |
| Ionic Strategic Arbitrage | | | 725,542,306 | | | | | | | | – | | | | | | | | 731,347,717 | | | | | | | | 251,560 | |
A summary of the Funds’ transactions in the USG Select Fund for the year ended December 31, 2017 are as follows:
| | | | | | | | | | | | | | | | | | | | | | | | | | | | | | | | | | | | | | | | | | | | | | |
Fund | | Type of
Transaction | | | | | December 31,
2016
Share/Fair
Value | | | | | | Purchases | | | | | | Sales | | | | | | December 31,
2017
Share/Fair
Value | | | | | | Dividend
Income | | | | |
| AHL Managed Futures Strategy Fund | | Direct | | | | | | $ | 6,472,219 | | | | | | | $ | 522,068,349 | | | | | | | $ | 507,990,951 | | | | | | | $ | 20,549,617 | | | | | | | $ | – | | | | | |
| Ionic Strategic Arbitrage Fund | | Direct | | | | | | | 26,003,015 | | | | | | | | 185,333,342 | | | | | | | | 191,809,149 | | | | | | | | 19,527,208 | | | | | | | | 126,844 | | | | | |
9. Borrowing Arrangements
Effective November 16, 2017, the Funds, along with certain other funds managed by the Manager (“Participating Funds”), entered into a committed revolving line of credit (the “Committed Line”) agreement with State Street Bank and Trust Company (the “Bank”) to be used to facilitate portfolio liquidity. The maximum borrowing amount under the Committed Line is $50 million with interest at a rate equal to the higher of (a) one-month London Inter-Bank Offered Rate (“LIBOR”) plus 1.25% per annum or (b) the Federal Funds rate plus 1.25% per annum on amounts borrowed. Each of the Participating Funds will pay a commitment fee at a rate of 0.25% per annum on the unused portion of the Committed Line amount. The Committed Line expires November 15, 2018, unless extended by the Bank or terminated by the Participating Funds in accordance with the agreement.
Effective November 16, 2017, the Funds, along with certain other Participating Funds managed by the Manager, entered into an uncommitted discretionary demand revolving line of credit (the “Uncommitted Line”)
73
American Beacon FundsSM
Notes to Financial Statements
December 31, 2017
agreement with the Bank to be used to facilitate portfolio liquidity. The maximum borrowing amount under the Uncommitted Line is $50 million with interest at a rate equal to the higher of (a) one-month LIBOR plus 1.25% per annum or (b) the Federal Funds rate. The Uncommitted Line expires November 15, 2018, unless extended by the Bank or terminated by the Participating Funds in accordance with the agreement.
The Participating Funds paid administration, legal and arrangement fees, which are recognized as a component of “Other expenses” on the Statements of Operations, along with commitment fees, that have been allocated among the Participating Funds based on average daily net assets. During the year ended December 31, 2017, the Funds did not utilize this facility.
10. Capital Share Transactions
The tables below summarize the activity in capital shares for each Class of the Funds:
| | | | | | | | | | | | | | | | | | | | | | | | | | | | |
| | | Institutional Class | |
| | | Year Ended December 31, | |
| | | 2017 | | | | | | 2016 | |
AHL Managed Futures Strategy Fund | | Shares | | | | | | Amount | | | | | | Shares | | | | | | Amount | |
| Shares sold | | | 7,451,038 | | | | | | | $ | 78,692,257 | | | | | | | | 36,676,562 | | | | | | | $ | 405,489,405 | |
| Reinvestment of dividends | | | 1,287,360 | | | | | | | | 13,568,774 | | | | | | | | – | | | | | | | | – | |
| Shares redeemed | | | (5,564,778 | ) | | | | | | | (59,037,244 | ) | | | | | | | (4,808,709 | ) | | | | | | | (50,573,425 | ) |
| | | | | | | | | | | | | | | | | | | | | | | | | | | | |
| Net increase in shares outstanding | | | 3,173,620 | | | | | | | $ | 33,223,787 | | | | | | | | 31,867,853 | | | | | | | $ | 354,915,980 | |
| | | | | | | | | | | | | | | | | | | | | | | | | | | | |
| | | | |
| | | Y Class | |
| | | Year Ended December 31, | |
| | | 2017 | | | | | | 2016 | |
AHL Managed Futures Strategy Fund | | Shares | | | | | | Amount | | | | | | Shares | | | | | | Amount | |
| Shares sold | | | 6,676,574 | | | | | | | $ | 70,665,751 | | | | | | | | 7,234,887 | | | | | | | $ | 77,938,263 | |
| Reinvestment of dividends | | | 309,816 | | | | | | | | 3,253,064 | | | | | | | | – | | | | | | | | – | |
| Shares redeemed | | | (2,374,706 | ) | | | | | | | (25,121,656 | ) | | | | | | | (5,440,111 | ) | | | | | | | (56,680,165 | ) |
| | | | | | | | | | | | | | | | | | | | | | | | | | | | |
| Net increase in shares outstanding | | | 4,611,684 | | | | | | | $ | 48,797,159 | | | | | | | | 1,794,776 | | | | | | | $ | 21,258,098 | |
| | | | | | | | | | | | | | | | | | | | | | | | | | | | |
| | | | |
| | | Investor Class | |
| | | Year Ended December 31, | |
| | | 2017 | | | | | | 2016 | |
AHL Managed Futures Strategy Fund | | Shares | | | | | | Amount | | | | | | Shares | | | | | | Amount | |
| Shares sold | | | 1,687,457 | | | | | | | $ | 17,930,723 | | | | | | | | 1,675,967 | | | | | | | $ | 17,882,088 | |
| Reinvestment of dividends | | | 73,170 | | | | | | | | 760,973 | | | | | | | | – | | | | | | | | – | |
| Shares redeemed | | | (2,839,239 | ) | | | | | | | (29,951,903 | ) | | | | | | | (2,228,763 | ) | | | | | | | (23,475,932 | ) |
| | | | | | | | | | | | | | | | | | | | | | | | | | | | |
| Net increase (decrease) in shares outstanding | | | (1,078,612 | ) | | | | | | $ | (11,260,207 | ) | | | | | | | (552,796 | ) | | | | | | $ | (5,593,844 | ) |
| | | | | | | | | | | | | | | | | | | | | | | | | | | | |
| | | | |
| | | A Class | |
| | | Year Ended December 31, | |
| | | 2017 | | | | | | 2016 | |
AHL Managed Futures Strategy Fund | | Shares | | | | | | Amount | | | | | | Shares | | | | | | Amount | |
| Shares sold | | | 264,861 | | | | | | | $ | 2,796,774 | | | | | | | | 2,367,863 | | | | | | | $ | 25,330,655 | |
| Reinvestment of dividends | | | 13,126 | | | | | | | | 136,644 | | | | | | | | – | | | | | | | | – | |
| Shares redeemed | | | (2,205,353 | ) | | | | | | | (23,344,020 | ) | | | | | | | (1,063,982 | ) | | | | | | | (11,177,116 | ) |
| | | | | | | | | | | | | | | | | | | | | | | | | | | | |
| Net increase (decrease) in shares outstanding | | | (1,927,366 | ) | | | | | | $ | (20,410,602 | ) | | | | | | | 1,303,881 | | | | | | | $ | 14,153,539 | |
| | | | | | | | | | | | | | | | | | | | | | | | | | | | |
| | | | |
| | | C Class | |
| | | Year Ended December 31, | |
| | | 2017 | | | | | | 2016 | |
AHL Managed Futures Strategy Fund | | Shares | | | | | | Amount | | | | | | Shares | | | | | | Amount | |
| Shares sold | | | 208,982 | | | | | | | $ | 2,170,664 | | | | | | | | 311,614 | | | | | | | $ | 3,284,849 | |
| Reinvestment of dividends | | | 19,028 | | | | | | | | 193,514 | | | | | | | | - | | | | | | | | - | |
| Shares redeemed | | | (90,329 | ) | | | | | | | (925,948 | ) | | | | | | | (97,924 | ) | | | | | | | (1,005,405 | ) |
| | | | | | | | | | | | | | | | | | | | | | | | | | | | |
| Net increase in shares outstanding | | | 137,681 | | | | | | | $ | 1,438,230 | | | | | | | | 213,690 | | | | | | | $ | 2,279,444 | |
| | | | | | | | | | | | | | | | | | | | | | | | | | | | |
| | | | |
74
American Beacon FundsSM
Notes to Financial Statements
December 31, 2017
| | | | | | | | | | | | | | | | | | | | | | | | | | | | |
| | | Institutional Class | |
| | | Year Ended December 31, | |
| | | 2017 | | | | | | 2016 | |
Ionic Strategic Arbitrage Fund | | Shares | | | | | | Amount | | | | | | Shares | | | | | | Amount | |
| Shares sold | | | 1,293,798 | | | | | | | $ | 11,685,820 | | | | | | | | 10,355,095 | | | | | | | $ | 101,720,394 | |
| Reinvestment of dividends | | | 245,805 | | | | | | | | 2,052,471 | | | | | | | | 1,059,724 | | | | | | | | 9,569,308 | |
| Shares redeemed | | | (10,088,419 | ) | | | | | | | (91,015,474 | ) | | | | | | | (6,125,998 | ) | | | | | | | (60,759,740 | ) |
| | | | | | | | | | | | | | | | | | | | | | | | | | | | |
| Net increase (decrease) in shares outstanding | | | (8,548,816 | ) | | | | | | $ | (77,277,183 | ) | | | | | | | 5,228,821 | | | | | | | $ | 50,529,962 | |
| | | | | | | | | | | | | | | | | | | | | | | | | | | | |
| | | | |
| | | Y Class | |
| | | Year Ended December 31, | |
| | | 2017 | | | | | | 2016 | |
Ionic Strategic Arbitrage Fund | | Shares | | | | | | Amount | | | | | | Shares | | | | | | Amount | |
| Shares sold | | | 4,718,667 | | | | | | | $ | 42,559,363 | | | | | | | | 4,591,033 | | | | | | | $ | 45,246,870 | |
| Reinvestment of dividends | | | 646,428 | | | | | | | | 5,397,670 | | | | | | | | 642,526 | | | | | | | | 5,808,428 | |
| Shares redeemed | | | (3,685,753 | ) | | | | | | | (33,003,848 | ) | | | | | | | (1,105,881 | ) | | | | | | | (10,870,913 | ) |
| | | | | | | | | | | | | | | | | | | | | | | | | | | | |
| Net increase in shares outstanding | | | 1,679,342 | | | | | | | $ | 14,953,185 | | | | | | | | 4,127,678 | | | | | | | $ | 40,184,385 | |
| | | | | | | | | | | | | | | | | | | | | | | | | | | | |
| | | | |
| | | Investor Class | |
| | | Year Ended December 31, | |
| | | 2017 | | | | | | 2016 | |
Ionic Strategic Arbitrage Fund | | Shares | | | | | | Amount | | | | | | Shares | | | | | | Amount | |
| Shares sold | | | 184,473 | | | | | | | $ | 1,646,602 | | | | | | | | 439,879 | | | | | | | $ | 4,148,557 | |
| Reinvestment of dividends | | | 14,153 | | | | | | | | 117,475 | | | | | | | | 15,151 | | | | | | | | 136,202 | |
| Shares redeemed | | | (383,986 | ) | | | | | | | (3,434,249 | ) | | | | | | | (305,900 | ) | | | | | | | (3,016,109 | ) |
| | | | | | | | | | | | | | | | | | | | | | | | | | | | |
| Net increase (decrease) in shares outstanding | | | (185,360 | ) | | | | | | $ | (1,670,172 | ) | | | | | | | 149,130 | | | | | | | $ | 1,268,650 | |
| | | | | | | | | | | | | | | | | | | | | | | | | | | | |
| | | | |
| | | A Class | |
| | | Year Ended December 31, | |
| | | 2017 | | | | | | 2016 | |
Ionic Strategic Arbitrage Fund | | Shares | | | | | | Amount | | | | | | Shares | | | | | | Amount | |
| Shares sold | | | 530 | | | | | | | $ | 4,762 | | | | | | | | - | | | | | | | $ | - | |
| Reinvestment of dividends | | | 1,007 | | | | | | | | 8,349 | | | | | | | | 1,251 | | | | | | | | 11,251 | |
| Shares redeemed | | | (618 | ) | | | | | | | (5,483 | ) | | | | | | | (120 | ) | | | | | | | (1,082 | ) |
| | | | | | | | | | | | | | | | | | | | | | | | | | | | |
| Net increase in shares outstanding | | | 919 | | | | | | | $ | 7,628 | | | | | | | | 1,131 | | | | | | | $ | 10,169 | |
| | | | | | | | | | | | | | | | | | | | | | | | | | | | |
| | | | |
| | | C Class | |
| | | Year Ended December 31, | |
| | | 2017 | | | | | | 2016 | |
Ionic Strategic Arbitrage Fund | | Shares | | | | | | Amount | | | | | | Shares | | | | | | Amount | |
| Shares sold | | | 340 | | | | | | | $ | 3,000 | | | | | | | | 11,323 | | | | | | | $ | 111,100 | |
| Reinvestment of dividends | | | 664 | | | | | | | | 5,448 | | | | | | | | 1,771 | | | | | | | | 15,725 | |
| Shares redeemed | | | (8,370 | ) | | | | | | | (73,583 | ) | | | | | | | (9,268 | ) | | | | | | | (89,855 | ) |
| | | | | | | | | | | | | | | | | | | | | | | | | | | | |
| Net increase (decrease) in shares outstanding | | | (7,366 | ) | | | | | | $ | (65,135 | ) | | | | | | | 3,826 | | | | | | | $ | 36,970 | |
| | | | | | | | | | | | | | | | | | | | | | | | | | | | |
| | | | |
11. Subsequent Events
Management has evaluated subsequent events for possible recognition or disclosure in the financial statements through the date the financial statements are issued. Management has determined that there are no material events that would require disclosure in the Funds’ financial statements through this date.
75
American Beacon AHL Managed Futures Strategy FundSM
Financial Highlights
(For a share outstanding throughout the period)
| | | | | | | | | | | | | | | | | | | | | | | | | | | | |
| | | Institutional Class | |
| | | Year Ended December 31, | | | | | | August 19,
2014A to
December 31, | |
| | | | | | | | |
| | | 2017 | | | | | | 2016 | | | | | | 2015 | | | | | | 2014 | |
| | | | |
Net asset value, beginning of period | | $ | 10.44 | | | | | | | $ | 10.46 | | | | | | | $ | 10.95 | | | | | | | $ | 10.00 | |
| | | | | | | | | | | | | | | | | | | | | | | | | | | | |
Income (loss) from investment operations: | | | | | | | | | | | | | | | | | | | | | | | | | | | | |
Net investment income (loss) | | | (0.08 | ) | | | | | | | 0.20 | | | | | | | | (0.06 | ) | | | | | | | 0.24 | |
Net gains (losses) on investments (both realized and unrealized) | | | 0.63 | | | | | | | | (0.22 | ) | | | | | | | (0.07 | ) | | | | | | | 1.10 | |
| | | | | | | | | | | | | | | | | | | | | | | | | | | | |
Total income (loss) from investment operations | | | 0.55 | | | | | | | | (0.02 | ) | | | | | | | (0.13 | ) | | | | | | | 1.34 | |
| | | | | | | | | | | | | | | | | | | | | | | | | | | | |
Less distributions: | | | | | | | | | | | | | | | | | | | | | | | | | | | | |
Dividends from net investment income | | | - | | | | | | | | - | | | | | | | | (0.21 | ) | | | | | | | (0.31 | ) |
Distributions from net realized gains | | | (0.42 | ) | | | | | | | - | | | | | | | | (0.15 | ) | | | | | | | (0.08 | ) |
Tax return of capital | | | - | | | | | | | | - | | | | | | | | (0.00 | )B | | | | | | | - | |
| | | | | | | | | | | | | | | | | | | | | | | | | | | | |
Total distributions | | | (0.42 | ) | | | | | | | - | | | | | | | | (0.36 | ) | | | | | | | (0.39 | ) |
| | | | | | | | | | | | | | | | | | | | | | | | | | | | |
Net asset value, end of period | | $ | 10.57 | | | | | | | $ | 10.44 | | | | | | | $ | 10.46 | | | | | | | $ | 10.95 | |
| | | | | | | | | | | | | | | | | | | | | | | | | | | | |
Total returnC | | | 5.31 | % | | | | | | | (0.19 | )% | | | | | | | (1.15 | )% | | | | | | | 13.43 | %D |
| | | | | | | | | | | | | | | | | | | | | | | | | | | | |
|
Ratios and supplemental data: | |
Net assets, end of period | | $ | 391,617,624 | | | | | | | $ | 353,601,987 | | | | | | | $ | 20,932,502 | | | | | | | $ | 28,765,259 | |
Ratios to average net assets: | | | | | | | | | | | | | | | | | | | | | | | | | | | | |
Expenses, before reimbursements | | | 1.98 | % | | | | | | | 1.90 | % | | | | | | | 2.25 | % | | | | | | | 4.97 | %E |
Expenses, net of reimbursements | | | 1.54 | % | | | | | | | 1.54 | % | | | | | | | 1.54 | % | | | | | | | 1.54 | %E |
Net investment income (loss), before expense reimbursements | | | (1.20 | )% | | | | | | | (1.69 | )% | | | | | | | (2.29 | )% | | | | | | | 2.73 | %E |
Net investment income (loss), net of reimbursements | | | (0.77 | )% | | | | | | | (1.33 | )% | | | | | | | (1.57 | )% | | | | | | | 6.17 | %E |
Portfolio turnover rateF | | | - | % | | | | | | | - | % | | | | | | | - | % | | | | | | | - | % |
| A | Commencement of operations. |
| B | The return of capital is based on outstanding shares at the time of distribution. Amounts are less than $0.01 per share. |
| C | Based on net asset value, which does not reflect the sales charge, redemption fee, or contingent deferred sales charge, if applicable. May include adjustments in accordance with U.S. GAAP and as such, the net asset value for reporting purposes and the returns based upon those net asset values may differ from the net asset value and returns for shareholder transactions. |
| F | Portfolio turnover is based on the lesser of long-term purchases or sales divided by the average long-term fair value during the period. The Fund did not invest in any long-term securities during the reporting period. |
See accompanying notes
76
American Beacon AHL Managed Futures Strategy FundSM
Financial Highlights
(For a share outstanding throughout the period)
| | | | | | | | | | | | | | | | | | | | | | | | | | | | |
| | | Y Class | |
| | | Year Ended December 31, | | | | | | August 19,
2014A to
December 31, | |
| | | | | | | | |
| | | 2017 | | | | | | 2016 | | | | | | 2015 | | | | | | 2014 | |
| | | | |
Net asset value, beginning of period | | $ | 10.41 | | | | | | | $ | 10.45 | | | | | | | $ | 10.94 | | | | | | | $ | 10.00 | |
| | | | | | | | | | | | | | | | | | | | | | | | | | | | |
Income (loss) from investment operations: | | | | | | | | | | | | | | | | | | | | | | | | | | | | |
Net investment income (loss) | | | (0.07 | ) | | | | | | | (0.08 | ) | | | | | | | (0.05 | ) | | | | | | | 0.30 | |
Net gains (losses) on investments (both realized and unrealized) | | | 0.61 | | | | | | | | 0.04 | | | | | | | | (0.08 | ) | | | | | | | 1.03 | |
| | | | | | | | | | | | | | | | | | | | | | | | | | | | |
Total income (loss) from investment operations | | | 0.54 | | | | | | | | (0.04 | ) | | | | | | | (0.13 | ) | | | | | | | 1.33 | |
| | | | | | | | | | | | | | | | | | | | | | | | | | | | |
Less distributions: | | | | | | | | | | | | | | | | | | | | | | | | | | | | |
Dividends from net investment income | | | - | | | | | | | | - | | | | | | | | (0.21 | ) | | | | | | | (0.31 | ) |
Distributions from net realized gains | | | (0.42 | ) | | | | | | | - | | | | | | | | (0.15 | ) | | | | | | | (0.08 | ) |
Tax return of capital | | | - | | | | | | | | - | | | | | | | | (0.00 | )B | | | | | | | - | |
| | | | | | | | | | | | | | | | | | | | | | | | | | | | |
Total distributions | | | (0.42 | ) | | | | | | | - | | | | | | | | (0.36 | ) | | | | | | | (0.39 | ) |
| | | | | | | | | | | | | | | | | | | | | | | | | | | | |
Net asset value, end of period | | $ | 10.53 | | | | | | | $ | 10.41 | | | | | | | $ | 10.45 | | | | | | | $ | 10.94 | |
| | | | | | | | | | | | | | | | | | | | | | | | | | | | |
Total returnC | | | 5.23 | % | | | | | | | (0.38 | )% | | | | | | | (1.15 | )% | | | | | | | 13.33 | %D |
| | | | | | | | | | | | | | | | | | | | | | | | | | | | |
|
Ratios and supplemental data: | |
Net assets, end of period | | $ | 101,513,775 | | | | | | | $ | 52,391,912 | | | | | | | $ | 33,817,374 | | | | | | | $ | 464,644 | |
Ratios to average net assets: | | | | | | | | | | | | | | | | | | | | | | | | | | | | |
Expenses, before reimbursements | | | 2.04 | % | | | | | | | 1.97 | % | | | | | | | 2.28 | % | | | | | | | 7.71 | %E |
Expenses, net of reimbursements | | | 1.64 | % | | | | | | | 1.64 | % | | | | | | | 1.64 | % | | | | | | | 1.64 | %E |
Net investment income (loss), before expense reimbursements | | | (1.25 | )% | | | | | | | (1.76 | )% | | | | | | | (1.70 | )% | | | | | | | 12.50 | %E |
Net investment income (loss), net of reimbursements | | | (0.84 | )% | | | | | | | (1.44 | )% | | | | | | | (1.06 | )% | | | | | | | 18.58 | %E |
Portfolio turnover rateF | | | – | % | | | | | | | – | % | | | | | | | – | % | | | | | | | – | % |
| A | Commencement of operations. |
| B | The return of capital is based on outstanding shares at the time of distribution. Amounts are less than $0.01 per share. |
| C | Based on net asset value, which does not reflect the sales charge, redemption fee, or contingent deferred sales charge, if applicable. May include adjustments in accordance with U.S. GAAP and as such, the net asset value for reporting purposes and the returns based upon those net asset values may differ from the net asset value and returns for shareholder transactions. |
| F | Portfolio turnover is based on the lesser of long-term purchases or sales divided by the average long-term fair value during the period. The Fund did not invest in any long-term securities during the reporting period. |
See accompanying notes
77
American Beacon AHL Managed Futures Strategy FundSM
Financial Highlights
(For a share outstanding throughout the period)
| | | | | | | | | | | | | | | | | | | | | | | | | | | | |
| | | Investor Class | |
| | | Year Ended December 31, | | | | | | August 19,
2014A to
December 31, | |
| | | | | | | | |
| | | 2017 | | | | | | 2016 | | | | | | 2015 | | | | | | 2014 | |
| | | | |
Net asset value, beginning of period | | $ | 10.35 | | | | | | | $ | 10.41 | | | | | | | $ | 10.93 | | | | | | | $ | 10.00 | |
| | | | | | | | | | | | | | | | | | | | | | | | | | | | |
Income (loss) from investment operations: | | | | | | | | | | | | | | | | | | | | | | | | | | | | |
Net investment income (loss) | | | (0.11 | ) | | | | | | | (0.25 | ) | | | | | | | (0.09 | ) | | | | | | | 0.30 | |
Net gains (losses) on investments (both realized and unrealized) | | | 0.62 | | | | | | | | 0.19 | | | | | | | | (0.08 | ) | | | | | | | 1.02 | |
| | | | | | | | | | | | | | | | | | | | | | | | | | | | |
Total income (loss) from investment operations | | | 0.51 | | | | | | | | (0.06 | ) | | | | | | | (0.17 | ) | | | | | | | 1.32 | |
| | | | | | | | | | | | | | | | | | | | | | | | | | | | |
Less distributions: | | | | | | | | | | | | | | | | | | | | | | | | | | | | |
Dividends from net investment income | | | - | | | | | | | | - | | | | | | | | (0.20 | ) | | | | | | | (0.31 | ) |
Distributions from net realized gains | | | (0.42 | ) | | | | | | | - | | | | | | | | (0.15 | ) | | | | | | | (0.08 | ) |
Tax return of capital | | | - | | | | | | | | - | | | | | | | | (0.00 | )B | | | | | | | - | |
| | | | | | | | | | | | | | | | | | | | | | | | | | | | |
Total distributions | | | (0.42 | ) | | | | | | | - | | | | | | | | (0.35 | ) | | | | | | | (0.39 | ) |
| | | | | | | | | | | | | | | | | | | | | | | | | | | | |
Net asset value, end of period | | $ | 10.44 | | | | | | | $ | 10.35 | | | | | | | $ | 10.41 | | | | | | | $ | 10.93 | |
| | | | | | | | | | | | | | | | | | | | | | | | | | | | |
Total returnC | | | 4.98 | % | | | | | | | (0.58 | )% | | | | | | | (1.54 | )% | | | | | | | 13.23 | %D |
| | | | | | | | | | | | | | | | | | | | | | | | | | | | |
|
Ratios and supplemental data: | |
Net assets, end of period | | $ | 20,241,387 | | | | | | | $ | 31,223,150 | | | | | | | $ | 37,185,001 | | | | | | | $ | 3,023,636 | |
Ratios to average net assets: | | | | | | | | | | | | | | | | | | | | | | | | | | | | |
Expenses, before reimbursements | | | 2.20 | % | | | | | | | 2.13 | % | | | | | | | 2.40 | % | | | | | | | 5.98 | %E |
Expenses, net of reimbursements | | | 1.92 | % | | | | | | | 1.92 | % | | | | | | | 1.92 | % | | | | | | | 1.92 | %E |
Net investment income (loss), before expense reimbursements | | | (1.48 | )% | | | | | | | (1.93 | )% | | | | | | | (2.07 | )% | | | | | | | 10.41 | %E |
Net investment income (loss), net of reimbursements | | | (1.20 | )% | | | | | | | (1.72 | )% | | | | | | | (1.59 | )% | | | | | | | 14.47 | %E |
Portfolio turnover rateF | | | – | % | | | | | | | – | % | | | | | | | – | % | | | | | | | – | % |
| A | Commencement of operations. |
| B | The return of capital is based on outstanding shares at the time of distribution. Amounts are less than $0.01 per share. |
| C | Based on net asset value, which does not reflect the sales charge, redemption fee, or contingent deferred sales charge, if applicable. May include adjustments in accordance with U.S. GAAP and as such, the net asset value for reporting purposes and the returns based upon those net asset values may differ from the net asset value and returns for shareholder transactions. |
| F | Portfolio turnover is based on the lesser of long-term purchases or sales divided by the average long-term fair value during the period. The Fund did not invest in any long-term securities during the reporting period. |
See accompanying notes
78
American Beacon AHL Managed Futures Strategy FundSM
Financial Highlights
(For a share outstanding throughout the period)
| | | | | | | | | | | | | | | | | | | | | | | | | | | | |
| | | A Class | |
| | | Year Ended December 31, | | | | | | August 19,
2014A to
December 31, | |
| | | | | | | | |
| | | 2017 | | | | | | 2016 | | | | | | 2015 | | | | | | 2014 | |
| | | | |
Net asset value, beginning of period | | $ | 10.36 | | | | | | | $ | 10.44 | | | | | | | $ | 10.93 | | | | | | | $ | 10.00 | |
| | | | | | | | | | | | | | | | | | | | | | | | | | | | |
Income (loss) from investment operations: | | | | | | | | | | | | | | | | | | | | | | | | | | | | |
Net investment income (loss) | | | (0.41 | ) | | | | | | | 0.23 | | | | | | | | (0.52 | ) | | | | | | | 0.32 | |
Net gains (losses) on investments (both realized and unrealized) | | | 1.00 | | | | | | | | (0.31 | ) | | | | | | | 0.36 | | | | | | | | 1.00 | |
| | | | | | | | | | | | | | | | | | | | | | | | | | | | |
Total income (loss) from investment operations | | | 0.59 | | | | | | | | (0.08 | ) | | | | | | | (0.16 | ) | | | | | | | 1.32 | |
| | | | | | | | | | | | | | | | | | | | | | | | | | | | |
Less distributions: | | | | | | | | | | | | | | | | | | | | | | | | | | | | |
Dividends from net investment income | | | - | | | | | | | | - | | | | | | | | (0.18 | ) | | | | | | | (0.31 | ) |
Distributions from net realized gains | | | (0.42 | ) | | | | | | | - | | | | | | | | (0.15 | ) | | | | | | | (0.08 | ) |
Tax return of capital | | | - | | | | | | | | - | | | | | | | | (0.00 | )B | | | | | | | - | |
| | | | | | | | | | | | | | | | | | | | | | | | | | | | |
Total distributions | | | (0.42 | ) | | | | | | | - | | | | | | | | (0.33 | ) | | | | | | | (0.39 | ) |
| | | | | | | | | | | | | | | | | | | | | | | | | | | | |
Net asset value, end of period | | $ | 10.53 | | | | | | | $ | 10.36 | | | | | | | $ | 10.44 | | | | | | | $ | 10.93 | |
| | | | | | | | | | | | | | | | | | | | | | | | | | | | |
Total returnC | | | 5.77 | % | | | | | | | (0.77 | )% | | | | | | | (1.45 | )% | | | | | | | 13.23 | %D |
| | | | | | | | | | | | | | | | | | | | | | | | | | | | |
|
Ratios and supplemental data: | |
Net assets, end of period | | $ | 3,408,861 | | | | | | | $ | 23,330,824 | | | | | | | $ | 9,890,720 | | | | | | | $ | 9,019,308 | |
Ratios to average net assets: | | | | | | | | | | | | | | | | | | | | | | | | | | | | |
Expenses, before reimbursements | | | 2.35 | % | | | | | | | 2.29 | % | | | | | | | 2.55 | % | | | | | | | 5.31 | %E |
Expenses, net of reimbursements | | | 1.94 | % | | | | | | | 1.94 | % | | | | | | | 1.94 | % | | | | | | | 1.94 | %E |
Net investment income (loss), before expense reimbursements | | | (1.62 | )% | | | | | | | (2.08 | )% | | | | | | | (3.59 | )% | | | | | | | 32.48 | %E |
Net investment income (loss), net of reimbursements | | | (1.21 | )% | | | | | | | (1.74 | )% | | | | | | | (2.98 | )% | | | | | | | 35.85 | %E |
Portfolio turnover rateF | | | - | % | | | | | | | - | % | | | | | | | - | % | | | | | | | - | % |
| A | Commencement of operations. |
| B | The return of capital is based on outstanding shares at the time of distribution. Amounts are less than $0.01 per share. |
| C | Based on net asset value, which does not reflect the sales charge, redemption fee, or contingent deferred sales charge, if applicable. May include adjustments in accordance with U.S. GAAP and as such, the net asset value for reporting purposes and the returns based upon those net asset values may differ from the net asset value and returns for shareholder transactions. |
| F | Portfolio turnover is based on the lesser of long-term purchases or sales divided by the average long-term fair value during the period. The Fund did not invest in any long-term securities during the reporting period. |
See accompanying notes
79
American Beacon AHL Managed Futures Strategy FundSM
Financial Highlights
(For a share outstanding throughout the period)
| | | | | | | | | | | | | | | | | | | | | | | | | | | | |
| | | C Class | |
| | | Year Ended December 31, | | | | | | August 19,
2014A to
December 31, | |
| | | | | | | | |
| | | 2017 | | | | | | 2016 | | | | | | 2015 | | | | | | 2014 | |
| | | | |
Net asset value, beginning of period | | $ | 10.20 | | | | | | | $ | 10.34 | | | | | | | $ | 10.90 | | | | | | | $ | 10.00 | |
| | | | | | | | | | | | | | | | | | | | | | | | | | | | |
Income (loss) from investment operations: | | | | | | | | | | | | | | | | | | | | | | | | | | | | |
Net investment income (loss) | | | (0.17 | ) | | | | | | | (0.08 | ) | | | | | | | (0.09 | ) | | | | | | | 0.27 | |
Net gains (losses) on investments (both realized and unrealized) | | | 0.58 | | | | | | | | (0.06 | ) | | | | | | | (0.16 | ) | | | | | | | 1.02 | |
| | | | | | | | | | | | | | | | | | | | | | | | | | | | |
Total income (loss) from investment operations | | | 0.41 | | | | | | | | (0.14 | ) | | | | | | | (0.25 | ) | | | | | | | 1.29 | |
| | | | | | | | | | | | | | | | | | | | | | | | | | | | |
Less distributions: | | | | | | | | | | | | | | | | | | | | | | | | | | | | |
Dividends from net investment income | | | – | | | | | | | | – | | | | | | | | (0.16 | ) | | | | | | | (0.31 | ) |
Distributions from net realized gains | | | (0.42 | ) | | | | | | | – | | | | | | | | (0.15 | ) | | | | | | | (0.08 | ) |
Tax return of capital | | | – | | | | | | | | – | | | | | | | | (0.00 | )B | | | | | | | – | |
| | | | | | | | | | | | | | | | | | | | | | | | | | | | |
Total distributions | | | (0.42 | ) | | | | | | | – | | | | | | | | (0.31 | ) | | | | | | | (0.39 | ) |
| | | | | | | | | | | | | | | | | | | | | | | | | | | | |
Net asset value, end of period | | $ | 10.19 | | | | | | | $ | 10.20 | | | | | | | $ | 10.34 | | | | | | | $ | 10.90 | |
| | | | | | | | | | | | | | | | | | | | | | | | | | | | |
Total returnC | | | 4.06 | % | | | | | | | (1.35 | )% | | | | | | | (2.30 | )% | | | | | | | 12.93 | %D |
| | | | | | | | | | | | | | | | | | | | | | | | | | | | |
| | | | | | | |
Ratios and supplemental data: | | | | | | | | | | | | | | | | | | | | | | | | | | | | |
Net assets, end of period | | $ | 5,702,799 | | | | | | | $ | 4,300,637 | | | | | | | $ | 2,151,492 | | | | | | | $ | 401,475 | |
Ratios to average net assets: | | | | | | | | | | | | | | | | | | | | | | | | | | | | |
Expenses, before reimbursements | | | 3.10 | % | | | | | | | 3.04 | % | | | | | | | 3.32 | % | | | | | | | 8.75 | %E |
Expenses, net of reimbursements | | | 2.69 | % | | | | | | | 2.69 | % | | | | | | | 2.69 | % | | | | | | | 2.68 | %E |
Net investment income (loss), before expense reimbursements | | | (2.31 | )% | | | | | | | (2.84 | )% | | | | | | | (2.88 | )% | | | | | | | 7.02 | %E |
Net investment income (loss), net of reimbursements | | | (1.90 | )% | | | | | | | (2.49 | )% | | | | | | | (2.25 | )% | | | | | | | 13.09 | %E |
Portfolio turnover rateF | | | – | % | | | | | | | – | % | | | | | | | – | % | | | | | | | – | % |
| A | Commencement of operations. |
| B | The return of capital is based on outstanding shares at the time of distribution. Amounts are less than $0.01 per share. |
| C | Based on net asset value, which does not reflect the sales charge, redemption fee, or contingent deferred sales charge, if applicable. May include adjustments in accordance with U.S. GAAP and as such, the net asset value for reporting purposes and the returns based upon those net asset values may differ from the net asset value and returns for shareholder transactions. |
| F | Portfolio turnover is based on the lesser of long-term purchases or sales divided by the average long-term fair value during the period. The Fund did not invest in any long-term securities during the reporting period. |
See accompanying notes
80
American Beacon Ionic Strategic Arbitrage FundSM
Financial Highlights
(For a share outstanding throughout the period)
| | | | | | | | | | | | | | | | | | | | |
| | | Institutional Class | |
| | | Year Ended December 31, | | | June 30, 2015A to
December 31, | |
| | | | | |
| | | 2017 | | | | | | 2016 | | | | | | 2015 | |
| | | | |
Net asset value, beginning of period | | $ | 9.06 | | | | | | | $ | 9.89 | | | | | | | $ | 10.00 | |
| | | | | | | | | | | | | | | | | | | | |
Income (loss) from investment operations: | | | | | | | | | | | | | | | | | | | | |
Net investment income | | | 0.33 | | | | | | | | 0.16 | | | | | | | | 0.04 | |
Net gains (losses) on investments (both realized and unrealized) | | | (0.34 | ) | | | | | | | (0.02 | ) | | | | | | | 0.11 | |
| | | | | | | | | | | | | | | | | | | | |
Total income (loss) from investment operations | | | (0.01 | ) | | | | | | | 0.14 | | | | | | | | 0.15 | |
| | | | | | | | | | | | | | | | | | | | |
Less distributions: | | | | | | | | | | | | | | | | | | | | |
Dividends from net investment income | | | (0.61 | ) | | | | | | | (0.45 | ) | | | | | | | (0.06 | ) |
Distributions from net realized gains | | | (0.07 | ) | | | | | | | (0.52 | ) | | | | | | | (0.20 | ) |
| | | | | | | | | | | | | | | | | | | | |
Total distributions | | | (0.68 | ) | | | | | | | (0.97 | ) | | | | | | | (0.26 | ) |
| | | | | | | | | | | | | | | | | | | | |
Net asset value, end of period | | $ | 8.37 | | | | | | | $ | 9.06 | | | | | | | $ | 9.89 | |
| | | | | | | | | | | | | | | | | | | | |
Total returnB | | | (0.15 | )% | | | | | | | 1.39 | % | | | | | | | 1.46 | %C |
| | | | | | | | | | | | | | | | | | | | |
|
Ratios and supplemental data: | |
Net assets, end of period | | $ | 26,386,023 | | | | | | | $ | 105,989,910 | | | | | | | $ | 63,421,998 | |
Ratios to average net assets: | | | | | | | | | | | | | | | | | | | | |
Expenses, before reimbursements | | | 2.67 | % | | | | | | | 3.14 | % | | | | | | | 3.55 | %D |
Expenses, net of reimbursementsE | | | 2.47 | % | | | | | | | 3.10 | % | | | | | | | 2.84 | %D |
Net investment income (loss), before expense reimbursements | | | 0.15 | % | | | | | | | 1.05 | % | | | | | | | (0.31 | )%D |
Net investment income, net of reimbursements | | | 0.35 | % | | | | | | | 1.09 | % | | | | | | | 0.40 | %D |
Portfolio turnover rate | | | 390 | % | | | | | | | 436 | % | | | | | | | 159 | %C |
| A | Commencement of operations. |
| B | Based on net asset value, which does not reflect the sales charge, redemption fee, or contingent deferred sales charge, if applicable. May include adjustments in accordance with U.S. GAAP and as such, the net asset value for reporting purposes and the returns based upon those net asset values may differ from the net asset value and returns for shareholder transactions. |
| E | Includes non-operating expenses consisting of prime broker fees and dividends from securities sold short. The Expenses, net of reimbursements, excluding non-operating expenses is 1.54% for the year ended December 31, 2017. |
See accompanying notes
81
American Beacon Ionic Strategic Arbitrage FundSM
Financial Highlights
(For a share outstanding throughout the period)
| | | | | | | | | | | | | | | | | | | | |
| | | Y Class | |
| | | Year Ended December 31, | | | June 30,
2015A to
December 31, | |
| | | | | |
| | | 2017 | | | | | | 2016 | | | | | | 2015 | |
| | | | |
Net asset value, beginning of period | | $ | 9.06 | | | | | | | $ | 9.90 | | | | | | | $ | 10.00 | |
| | | | | | | | | | | | | | | | | | | | |
Income (loss) from investment operations: | | | | | | | | | | | | | | | | | | | | |
Net investment income | | | 0.02 | | | | | | | | 0.10 | | | | | | | | 0.06 | |
Net gains (losses) on investments (both realized and unrealized) | | | (0.04 | ) | | | | | | | 0.03 | | | | | | | | 0.10 | |
| | | | | | | | | | | | | | | | | | | | |
Total income (loss) from investment operations | | | (0.02 | ) | | | | | | | 0.13 | | | | | | | | 0.16 | |
| | | | | | | | | | | | | | | | | | | | |
Less distributions: | | | | | | | | | | | | | | | | | | | | |
Dividends from net investment income | | | (0.61 | ) | | | | | | | (0.45 | ) | | | | | | | (0.06 | ) |
Distributions from net realized gains | | | (0.07 | ) | | | | | | | (0.52 | ) | | | | | | | (0.20 | ) |
| | | | | | | | | | | | | | | | | | | | |
Total distributions | | | (0.68 | ) | | | | | | | (0.97 | ) | | | | | | | (0.26 | ) |
| | | | | | | | | | | | | | | | | | | | |
Net asset value, end of period | | $ | 8.36 | | | | | | | $ | 9.06 | | | | | | | $ | 9.90 | |
| | | | | | | | | | | | | | | | | | | | |
Total returnB | | | (0.27 | )% | | | | | | | 1.28 | % | | | | | | | 1.56 | %C |
| | | | | | | | | | | | | | | | | | | | |
|
Ratios and supplemental data: | |
Net assets, end of period | | $ | 70,589,684 | | | | | | | $ | 61,253,803 | | | | | | | $ | 26,059,687 | |
Ratios to average net assets: | | | | | | | | | | | | | | | | | | | | |
Expenses, before reimbursements or recoupments | | | 2.94 | % | | | | | | | 3.31 | % | | | | | | | 3.83 | %D |
Expenses, net of reimbursements or recoupmentsE | | | 2.79 | % | | | | | | | 3.30 | % | | | | | | | 3.27 | %D |
Net investment income, before expense reimbursements or recoupments | | | 0.08 | % | | | | | | | 0.88 | % | | | | | | | 0.83 | %D |
Net investment income, net of reimbursements or recoupments | | | 0.23 | % | | | | | | | 0.88 | % | | | | | | | 1.40 | %D |
Portfolio turnover rate | | | 390 | % | | | | | | | 436 | % | | | | | | | 159 | %C |
| A | Commencement of operations. |
| B | Based on net asset value, which does not reflect the sales charge, redemption fee, or contingent deferred sales charge, if applicable. May include adjustments in accordance with U.S. GAAP and as such, the net asset value for reporting purposes and the returns based upon those net asset values may differ from the net asset value and returns for shareholder transactions. |
| E | Includes non-operating expenses consisting of prime broker fees and dividends from securities sold short. The Expenses, net of reimbursements, excluding non-operating expenses is 1.64% for the year ended December 31, 2017. |
See accompanying notes
82
American Beacon Ionic Strategic Arbitrage FundSM
Financial Highlights
(For a share outstanding throughout the period)
| | | | | | | | | | | | | | | | | | | | |
| | | Investor Class | |
| | | Year Ended December 31, | | | June 30,
2015A to
December 31, | |
| | | | | |
| | | 2017 | | | | | | 2016 | | | | | | 2015 | |
| | | | |
Net asset value, beginning of period | | $ | 9.01 | | | | | | | $ | 9.88 | | | | | | | $ | 10.00 | |
| | | | | | | | | | | | | | | | | | | | |
Income (loss) from investment operations: | | | | | | | | | | | | | | | | | | | | |
Net investment income | | | 0.08 | | | | | | | | 0.30 | | | | | | | | 0.02 | |
Net gains (losses) on investments (both realized and unrealized) | | | (0.12 | ) | | | | | | | (0.20 | ) | | | | | | | 0.12 | |
| | | | | | | | | | | | | | | | | | | | |
Total income (loss) from investment operations | | | (0.04 | ) | | | | | | | 0.10 | | | | | | | | 0.14 | |
| | | | | | | | | | | | | | | | | | | | |
Less distributions: | | | | | | | | | | | | | | | | | | | | |
Dividends from net investment income | | | (0.58 | ) | | | | | | | (0.45 | ) | | | | | | | (0.06 | ) |
Distributions from net realized gains | | | (0.07 | ) | | | | | | | (0.52 | ) | | | | | | | (0.20 | ) |
| | | | | | | | | | | | | | | | | | | | |
Total distributions | | | (0.65 | ) | | | | | | | (0.97 | ) | | | | | | | (0.26 | ) |
| | | | | | | | | | | | | | | | | | | | |
Net asset value, end of period | | $ | 8.32 | | | | | | | $ | 9.01 | | | | | | | $ | 9.88 | |
| | | | | | | | | | | | | | | | | | | | |
Total returnB | | | (0.49 | )% | | | | | | | 0.98 | % | | | | | | | 1.36 | %C |
| | | | | | | | | | | | | | | | | | | | |
| | | | | |
Ratios and supplemental data: | | | | | | | | | | | | | | | | | | | | |
Net assets, end of period | | $ | 1,539,554 | | | | | | | $ | 3,339,009 | | | | | | | $ | 2,186,944 | |
Ratios to average net assets: | | | | | | | | | | | | | | | | | | | | |
Expenses, before reimbursements or recoupments | | | 3.00 | % | | | | | | | 3.47 | % | | | | | | | 4.23 | %D |
Expenses, net of reimbursements or recoupmentsE | | | 2.93 | % | | | | | | | 3.50 | % | | | | | | | 3.23 | %D |
Net investment income (loss), before expense reimbursements or recoupments | | | (0.08 | )% | | | | | | | 0.32 | % | | | | | | | (1.52 | )%D |
Net investment income (loss), net of reimbursements or recoupments | | | (0.01 | )% | | | | | | | 0.29 | % | | | | | | | (0.53 | )%D |
Portfolio turnover rate | | | 390 | % | | | | | | | 436 | % | | | | | | | 159 | %C |
| A | Commencement of operations. |
| B | Based on net asset value, which does not reflect the sales charge, redemption fee, or contingent deferred sales charge, if applicable. May include adjustments in accordance with U.S. GAAP and as such, the net asset value for reporting purposes and the returns based upon those net asset values may differ from the net asset value and returns for shareholder transactions. |
| E | Includes non-operating expenses consisting of prime broker fees and dividends from securities sold short. The Expenses, net of reimbursements, excluding non-operating expenses is 1.92% for the year ended December 31, 2017. |
See accompanying notes
83
American Beacon Ionic Strategic Arbitrage FundSM
Financial Highlights
(For a share outstanding throughout the period)
| | | | | | | | | | | | | | | | | | | | |
| | | A Class | |
| | | Year Ended December 31, | | | June 30,
2015A to
December 31, | |
| | | | | |
| | | 2017 | | | | | | 2016 | | | | | | 2015 | |
| | | | |
Net asset value, beginning of period | | $ | 9.01 | | | | | | | $ | 9.88 | | | | | | | $ | 10.00 | |
| | | | | | | | | | | | | | | | | | | | |
Income (loss) from investment operations: | | | | | | | | | | | | | | | | | | | | |
Net investment income | | | 0.03 | | | | | | | | 0.07 | | | | | | | | 0.08 | |
Net gains (losses) on investments (both realized and unrealized) | | | (0.07 | ) | | | | | | | 0.03 | | | | | | | | 0.06 | |
| | | | | | | | | | | | | | | | | | | | |
Total income (loss) from investment operations | | | (0.04 | ) | | | | | | | 0.10 | | | | | | | | 0.14 | |
| | | | | | | | | | | | | | | | | | | | |
Less distributions: | | | | | | | | | | | | | | | | | | | | |
Dividends from net investment income | | | (0.59 | ) | | | | | | | (0.45 | ) | | | | | | | (0.06 | ) |
Distributions from net realized gains | | | (0.07 | ) | | | | | | | (0.52 | ) | | | | | | | (0.20 | ) |
| | | | | | | | | | | | | | | | | | | | |
Total distributions | | | (0.66 | ) | | | | | | | (0.97 | ) | | | | | | | (0.26 | ) |
| | | | | | | | | | | | | | | | | | | | |
Net asset value, end of period | | $ | 8.31 | | | | | | | $ | 9.01 | | | | | | | $ | 9.88 | |
| | | | | | | | | | | | | | | | | | | | |
Total returnB | | | (0.51 | )% | | | | | | | 0.98 | % | | | | | | | 1.36 | %C |
| | | | | | | | | | | | | | | | | | | | |
|
Ratios and supplemental data: | |
Net assets, end of period | | $ | 113,957 | | | | | | | $ | 115,308 | | | | | | | $ | 115,261 | |
Ratios to average net assets: | | | | | | | | | | | | | | | | | | | | |
Expenses, before reimbursements or recoupments | | | 3.23 | % | | | | | | | 3.65 | % | | | | | | | 7.35 | %D |
Expenses, net of reimbursements or recoupmentsE | | | 3.08 | % | | | | | | | 3.58 | % | | | | | | | 3.37 | %D |
Net investment income (loss), before expense reimbursements or recoupments | | | (0.22 | )% | | | | | | | 0.27 | % | | | | | | | (3.54 | )%D |
Net investment income (loss), net of reimbursements or recoupments | | | (0.07 | )% | | | | | | | 0.34 | % | | | | | | | 0.44 | %D |
Portfolio turnover rate | | | 390 | % | | | | | | | 436 | % | | | | | | | 159 | %C |
| A | Commencement of operations. |
| B | Based on net asset value, which does not reflect the sales charge, redemption fee, or contingent deferred sales charge, if applicable. May include adjustments in accordance with U.S. GAAP and as such, the net asset value for reporting purposes and the returns based upon those net asset values may differ from the net asset value and returns for shareholder transactions. |
| E | Includes non-operating expenses consisting of prime broker fees and dividends from securities sold short. The Expenses, net of reimbursements, excluding non-operating expenses is 1.94% for the year ended December 31, 2017. |
See accompanying notes
84
American Beacon Ionic Strategic Arbitrage FundSM
Financial Highlights
(For a share outstanding throughout the period)
| | | | | | | | | | | | | | | | | | | | |
| | | C Class | |
| | | Year Ended December 31, | | | June 30,
2015A to
December 31, | |
| | | | | |
| | | 2017 | | | | | | 2016 | | | | | | 2015 | |
| | | | |
Net asset value, beginning of period | | $ | 8.90 | | | | | | | $ | 9.85 | | | | | | | $ | 10.00 | |
| | | | | | | | | | | | | | | | | | | | |
Income (loss) from investment operations: | | | | | | | | | | | | | | | | | | | | |
Net investment income (loss) | | | 0.00 | F | | | | | | | (0.01 | ) | | | | | | | 0.05 | |
Net gains (losses) on investments (both realized and unrealized) | | | (0.11 | ) | | | | | | | 0.03 | | | | | | | | 0.05 | |
| | | | | | | | | | | | | | | | | | | | |
Total income (loss) from investment operations | | | (0.11 | ) | | | | | | | 0.02 | | | | | | | | 0.10 | |
| | | | | | | | | | | | | | | | | | | | |
Less distributions: | | | | | | | | | | | | | | | | | | | | |
Dividends from net investment income | | | (0.49 | ) | | | | | | | (0.45 | ) | | | | | | | (0.05 | ) |
Distributions from net realized gains | | | (0.07 | ) | | | | | | | (0.52 | ) | | | | | | | (0.20 | ) |
| | | | | | | | | | | | | | | | | | | | |
Total distributions | | | (0.56 | ) | | | | | | | (0.97 | ) | | | | | | | (0.25 | ) |
| | | | | | | | | | | | | | | | | | | | |
Net asset value, end of period | | $ | 8.23 | | | | | | | $ | 8.90 | | | | | | | $ | 9.85 | |
| | | | | | | | | | | | | | | | | | | | |
Total returnB | | | (1.21 | )% | | | | | | | 0.17 | % | | | | | | | 1.00 | %C |
| | | | | | | | | | | | | | | | | | | | |
|
Ratios and supplemental data: | |
Net assets, end of period | | $ | 80,632 | | | | | | | $ | 152,859 | | | | | | | $ | 131,408 | |
Ratios to average net assets: | | | | | | | | | | | | | | | | | | | | |
Expenses, before reimbursements or recoupments | | | 3.75 | % | | | | | | | 4.40 | % | | | | | | | 8.14 | %D |
Expenses, net of reimbursements or recoupmentsE | | | 3.73 | % | | | | | | | 4.34 | % | | | | | | | 4.11 | %D |
Net investment (loss), before expense reimbursements or recoupments | | | (0.83 | )% | | | | | | | (0.46 | )% | | | | | | | (4.30 | )%D |
Net investment (loss), net of reimbursements or recoupments | | | (0.82 | )% | | | | | | | (0.40 | )% | | | | | | | (0.28 | )%D |
Portfolio turnover rate | | | 390 | % | | | | | | | 436 | % | | | | | | | 159 | %C |
| A | Commencement of operations. |
| B | Based on net asset value, which does not reflect the sales charge, redemption fee, or contingent deferred sales charge, if applicable. May include adjustments in accordance with U.S. GAAP and as such, the net asset value for reporting purposes and the returns based upon those net asset values may differ from the net asset value and returns for shareholder transactions. |
| E | Includes non-operating expenses consisting of prime broker fees and dividends from securities sold short. The Expenses, net of reimbursements, excluding non-operating expenses is 2.69% for the year ended December 31, 2017. |
| F | Amount represents less than 0.005% of average net assets. |
See accompanying notes
85
American Beacon FundsSM
Affirmation of the Commodity Pool Operator
December 31, 2017 (Unaudited)
To the best of my knowledge and belief, the information contained in the attached financial statements for the American Beacon AHL Managed Futures Strategy Fund for the period from January 1, 2017 to December 31, 2017, is accurate and complete.

Melinda G. Heika, Treasurer
American Beacon Advisors, Inc.
Commodity Pool Operator for the American Beacon AHL Managed Futures Strategy Fund
86
American Beacon FundsSM
Federal Tax Information
December 31, 2017 (Unaudited)
Certain tax information regarding the Funds is required to be provided to shareholders based upon the Funds’ income and distributions for the taxable year ended December 31, 2017. The information and distributions reported herein may differ from information and distributions taxable to the shareholders for the calendar year ended December 31, 2017.
The Funds designated the following items with regard to distributions paid during the fiscal year ended December 31, 2017. All designations are based on financial information available as of this annual report and, accordingly, are subject to change. For each item, it is the intention of the Funds to designate the maximum amount permitted under the Internal Revenue Code of 1986, as amended, and the regulations there under.
Corporate Dividends-Received Deduction:
| | | | |
AHL Managed Futures Strategy | | | 0.00 | % |
Ionic Strategic Arbitrage | | | 10.28 | % |
Qualified Dividend Income:
| | | | |
AHL Managed Futures Strategy | | | 0.00 | % |
Ionic Strategic Arbitrage | | | 12.81 | % |
Long-Term Capital Gain Distributions:
| | | | |
AHL Managed Futures Strategy | | $ | 1,856,763 | |
Ionic Strategic Arbitrage | | | - | |
Short-Term Capital Gain Distributions:
| | | | |
AHL Managed Futures Strategy | | $ | 18,170,762 | |
Ionic Strategic Arbitrage | | | 758,663 | |
Shareholders received notification in January 2018 of the applicable tax information necessary to prepare their 2017 income tax returns.
87
Trustees and Officers of the American Beacon FundsSM (Unaudited)
The Trustees and officers of the American Beacon Funds (the “Trust”) are listed below, together with their principal occupations during the past five years. The address of each person listed below is 220 Las Colinas Boulevard East, Suite 1200, Irving, Texas 75039. Each Trustee oversees thirty-five funds in the fund complex that includes the Trust, the American Beacon Select Funds and the American Beacon Institutional Funds Trust. The Trust’s Statement of Additional Information contains additional information about the Trustees and is available without charge by calling 1-800-658-5811.
| | | | |
Name, Age and Address | | Position, Term of Office and Length of Time Served with the Trust | | Principal Occupation(s) During Past 5 Years and Current Directorships |
| INTERESTED TRUSTEES | | Term | | |
| | Lifetime of Trust until removal, resignation or retirement* | | |
| | |
| Alan D. Feld** (81) | | Trustee since 1996 | | Sole Shareholder of a professional corporation which is a Partner in the law firm of Akin, Gump, Strauss, Hauer & Feld, LLP (law firm) (1960-Present); Trustee, American Beacon Mileage Funds (1996-2012); Trustee, American Beacon Select Funds (1999-Present); Trustee, American Beacon Master Trust (1996-2012); Trustee, American Beacon Institutional Funds Trust (2017-Present). |
| NON-INTERESTED TRUSTEES | | Term | | |
| | Lifetime of Trust until removal, resignation or retirement* | | |
| | |
| Gilbert G. Alvarado (48) | | Trustee since 2015 | | Director, Kura MD, Inc. (local telehealth organization) (2015-present); Vice President & CFO, Sierra Health Foundation (health conversion private foundation) (2006-Present); Vice President & CFO, Sierra Health Foundation: Center for Health Program Management (California public benefit corporation) (2012-Present); Director, Innovative North State (2012-2015); Director, Sacramento Regional Technology Alliance (2011-2016); Director, Women’s Empowerment (2009-2014); Director, Valley Healthcare Staffing (2017–present); Trustee, American Beacon Select Funds (2015-Present); Trustee, American Beacon Institutional Funds Trust (2017-Present). |
| | |
| Joseph B. Armes (55) | | Trustee since 2015 | | Chairman & CEO, CSW Industrials f/k/a Capital Southwest Corporation (investment company) (2015-Present); Chairman of the Board of Capital Southwest Corporation, predecessor to CSW Industrials, Inc. (2014-present) (investment company); CEO, Capital Southwest Corporation (2013-2015); President & CEO, JBA Investment Partners (family investment vehicle) (2010-Present); Director and Chair of Audit Committee, RSP Permian (oil and gas producer) (2013-Present); Trustee, American Beacon Select Funds (2015-Present); Trustee, American Beacon Institutional Funds Trust (2017-Present). |
| | |
| Gerard J. Arpey (59) | | Trustee since 2012 | | Director, The Home Depot, Inc. (2015-Present); Partner, Emerald Creek Group (private equity firm) (2011-Present); Director, S.C. Johnson & Son, Inc. (privately held company) (2008-present); Trustee, American Beacon Select Funds (2012-Present); Trustee, American Beacon Institutional Funds Trust (2017-Present). |
| | |
| Brenda A. Cline (57) | | Trustee since 2004 | | Executive Vice President, Chief Financial Officer, Treasurer and Secretary, Kimbell Art Foundation (1993-Present); Director, Range Resources Corporation (oil and natural gas company) (2015-Present); Director, Tyler Technologies, Inc. (public sector software solutions company) (2014-Present); Trustee, American Beacon Mileage Funds (2004-2012); Trustee, American Beacon Select Funds (2004-Present); Trustee, American Beacon Master Trust (2004-2012); Trustee, American Beacon Institutional Funds Trust (2017-Present). |
88
Trustees and Officers of the American Beacon FundsSM (Unaudited)
| | | | |
Name, Age and Address | | Position, Term of Office and Length of Time Served with the Trust | | Principal Occupation(s) During Past 5 Years and Current Directorships |
| NON-INTERESTED TRUSTEES (CONT.) | | Term | | |
| | |
| Eugene J. Duffy (63) | | Trustee since 2008 | | Managing Director, Institutional Services, Intercontinental Real Estate Corporation (2014-Present); Principal and Executive Vice President, Paradigm Asset Management (1994-2014); Director, Sunrise Bank of Atlanta (2008-2013); Trustee, American Beacon Mileage Funds (2008-2012); Trustee, American Beacon Select Funds (2008-Present); Trustee, American Beacon Master Trust (2008-2012); Trustee, American Beacon Institutional Funds Trust (2017-Present). |
| | |
| Thomas M. Dunning*** (75) | | Trustee since 2008 | | Chairman Emeritus, Lockton Dunning Benefits (consulting firm in employee benefits) (2008–Present); Board Director, Oncor Electric Delivery Company LLC (2007-Present); Trustee, American Beacon Mileage Funds (2008-2012); Trustee, American Beacon Select Funds (2008-Present); Trustee, American Beacon Master Trust (2008-2012); Trustee, American Beacon Institutional Funds Trust (2017-Present). |
| | |
| Richard A. Massman (74) | | Trustee since 2004 Chairman since 2008 | | Consultant and General Counsel Emeritus, Hunt Consolidated, Inc. (holding company engaged in oil and gas exploration and production, refining, real estate, farming, ranching and venture capital activities) (2009-Present); Trustee, American Beacon Mileage Funds (2004-2012); Trustee, American Beacon Select Funds (2004-Present); Trustee, American Beacon Master Trust (2004-2012); Trustee, American Beacon Institutional Funds Trust (2017-Present). |
| | |
| Barbara J. McKenna, CFA (54) | | Trustee since 2012 | | Managing Principal, Longfellow Investment Management Company (2005-Present); Trustee, American Beacon Select Funds (2012-Present); Trustee, American Beacon Institutional Funds Trust (2017-Present). |
| | |
| R. Gerald Turner (72) | | Trustee since 2001 | | President, Southern Methodist University (1995-Present); Director, J.C. Penney Company, Inc. (1996-Present); Director, Kronus Worldwide Inc. (chemical manufacturing) (2003-Present); Trustee, American Beacon Mileage Funds (2001-2012); Trustee, American Beacon Select Funds (2001-Present); Trustee, American Beacon Master Trust (2001-2012); Trustee, American Beacon Institutional Funds Trust (2017-Present). |
| OFFICERS | | Term | | |
| | One Year | | |
| | |
| Gene L. Needles, Jr. (63) | | President since 2009 | | President, CEO and Director, American Beacon Advisors, Inc. (2009-Present); President, CEO and Director, Resolute Investment Managers, Inc. (2015-Present); President, CEO and Director, Resolute Acquisition, Inc. (2015-Present); President, CEO and Director, Resolute Topco, Inc. (2015-Present), President & CEO, Resolute Investment Holdings, LLC (2015-Present); President, CEO and Director, Lighthouse Holdings, Inc. (2009-2015); President and CEO, Lighthouse Holdings Parent, Inc. (2009-2015); Manager, President and CEO, American Private Equity Management, LLC (2012-Present); President, American Beacon Cayman Managed Futures Strategy Fund, Ltd. (2014-Present); Director, Chairman, President and CEO, Alpha Quant Advisors, LLC (2016-Present); Director, ARK Investment Management LLC (2016-Present); Director, Shapiro Capital Management LLC (2017-Present); Member, Investment Advisory Committee, Employees Retirement System of Texas (2017-Present); Trustee, American Beacon NextShares Trust (2015-Present); President, American Beacon Select Funds (2009-Present); President, American Beacon Mileage Funds (2009-2012); President, American Beacon Master Trust (2009–2012); President, American Beacon Institutional Funds Trust (2017-Present). |
89
Trustees and Officers of the American Beacon FundsSM (Unaudited)
| | | | |
Name, Age and Address | | Position, Term of Office and Length of Time Served with the Trust | | Principal Occupation(s) During Past 5 Years and Current Directorships |
| OFFICERS (CONT.) | | Term | | |
| | |
| Rosemary K. Behan (58) | | VP, Secretary and Chief Legal Officer since 2006 | | Vice President and Secretary, American Beacon Advisors, Inc. (2006-Present); Secretary, Resolute Investment Holdings, LLC (2015-Present) Secretary, Resolute Investment Managers, Inc. (2015-Present); Secretary, Resolute Topco, Inc. (2015-Present); Secretary, Resolute Acquisition, Inc. (2015-Present); Secretary, Lighthouse Holdings, Inc. (2008-2015); Secretary, Lighthouse Holdings Parent, Inc. (2008-2015); Secretary, American Private Equity Management, LLC (2008-Present); Secretary, American Beacon Cayman Managed Futures Strategy Fund, Ltd. (2014-Present); Secretary, Alpha Quant Advisors, LLC (2016-Present); Chief Legal Officer, Vice President and Secretary, American Beacon Select Funds (2006-Present); Chief Legal Officer, Vice President and Secretary, American Beacon Mileage Funds (2006-2012); Chief Legal Officer, Vice President and Secretary, American Beacon Master Trust (2006-2012); Chief Legal Officer, Vice President and Secretary, American Beacon Institutional Funds Trust (2017-Present). |
| | |
| Brian E. Brett (57) | | VP since 2004 | | Senior Vice President (2012-Present) and Vice President (2004-2012), American Beacon Advisors, Inc.; Vice President, American Beacon Select Funds (2004-Present); Vice President, American Beacon Mileage Funds (2004-2012); Vice President, American Beacon Master Trust (2004-2012); Vice President, American Beacon Institutional Funds Trust (2017-Present). |
| | |
| Paul B. Cavazos (48) | | VP since 2016 | | Senior Vice President, American Beacon Advisors, Inc. (2016-Present); Chief Investment Officer and Assistant Treasurer, DTE Energy (2007-2016); Vice President, American Beacon Select Funds (2016-Present); Vice President, American Beacon Institutional Funds Trust (2017-Present). |
| | |
| Erica Duncan (47) | | VP Since 2011 | | Vice President, American Beacon Advisors, Inc. (2011-Present); Vice President, American Beacon Select Funds (2011-Present); Vice President, American Beacon Mileage Funds (2011-2012); Vice President, American Beacon Master Trust (2011-2012); Vice President, American Beacon Institutional Funds Trust (2017-Present). |
| | |
| Melinda G. Heika (56) | | Treasurer since 2010 | | Treasurer, American Beacon Advisors, Inc. (2010-Present); Resolute Investment Managers, Inc. (2015-Present); Treasurer, Resolute Acquisition, Inc. (2015-Present); Treasurer, Resolute Topco, Inc. (2015-Present); Treasurer, Resolute Investment Holdings, LLC. (2015-Present); Treasurer, Lighthouse Holdings, Inc. (2010-2015); Treasurer, Lighthouse Holdings Parent Inc., (2010-2015); Treasurer, American Private Equity Management, LLC (2012-Present); Director and Treasurer, American Beacon Cayman Managed Futures Strategy Fund, Ltd. (2014-Present); Treasurer, American Beacon Select Funds (2010-Present); Treasurer, American Beacon Mileage Funds (2010-2012); Treasurer, American Beacon Master Trust (2010-2012); Treasurer, American Beacon Institutional Funds Trust (2017-Present). |
| | |
| Terri L. McKinney (54) | | VP since 2010 | | Vice President (2009-Present) and Managing Director (2003-2009), American Beacon Advisors, Inc.; Vice President, Resolute Investment Managers, Inc. (2017-Present); Vice President, Alpha Quant Advisors, LLC (2016-Present); Vice President, American Beacon Select Funds (2010-Present); Vice President, American Beacon Mileage Funds (2010-2012); Vice President, American Beacon Master Trust (2010-2012); Vice President, American Beacon Institutional Funds Trust (2017-Present). |
90
Trustees and Officers of the American Beacon FundsSM (Unaudited)
| | | | |
Name, Age and Address | | Position, Term of Office and Length of Time Served with the Trust | | Principal Occupation(s) During Past 5 Years and Current Directorships |
| OFFICERS (CONT.) | | Term | | |
| | |
| Jeffrey K. Ringdahl (42) | | VP since 2010 | | Senior Vice President (2013-Present), Vice President (2010-2013), and Director (2015-Present), American Beacon Advisors, Inc.; Vice President, American Beacon Select Funds (2010-Present); Vice President, American Beacon Mileage Funds (2010-2012); Vice President, American Beacon Master Trust (2010-2012); Senior Vice President (2012-Present) and Manager (2015-Present), American Private Equity Management, LLC; Senior Vice President, Lighthouse Holdings, Inc. (2013-2015); Senior Vice President, Lighthouse Holdings Parent, Inc. (2013-2015); Director and Vice President, American Beacon Cayman Managed Futures Strategy Fund, Ltd. (2014-Present); Trustee, American Beacon NextShares Trust (2015-Present); Director and Senior Vice Present, Resolute Investment Holdings, LLC (2015-Present); Director and Senior Vice President, Resolute Topco, Inc. (2015-Present); Director and Senior Vice President, Resolute Acquisition, Inc. (2015-Present); Director and Senior Vice President, Resolute Investment Managers, Inc. (2015-Present); Director, Executive Vice President and Chief Operating Officer, Alpha Quant Advisors, LLC (2016-Present); Vice President, American Beacon Institutional Funds Trust (2017-President); Director, Shapiro Capital Management, LLC (2017-Present). |
| | |
| Samuel J. Silver (54) | | VP Since 2011 | | Vice President, American Beacon Advisors, Inc. (2011-Present); Vice President, American Beacon Select Funds (2011-Present); Vice President, American Beacon Mileage Funds (2011-2012); Vice President, American Beacon Master Trust (2011-2012); American Beacon Institutional Funds Trust (2011-Present). |
| | |
| Christina E. Sears (46) | | Chief Compliance Officer since 2004 and Asst. Secretary since 1999 | | Chief Compliance Officer, American Beacon Advisors, Inc. (2004-Present); Chief Compliance Officer, American Private Equity Management, LLC (2012-Present); Chief Compliance Officer and Vice President, Alpha Quant Advisors, LLC (2016-Present); Chief Compliance Officer (2004-Present) and Assistant Secretary (1999-Present), American Beacon Select Funds; Chief Compliance Officer (2004-2012) and Assistant Secretary (1999-2012), American Beacon Mileage Funds; Chief Compliance Officer (2004-2012) and Assistant Secretary (1999-2012), American Beacon Master Trust; Chief Compliance Officer and Assistant Secretary, American Beacon Institutional Funds Trust (2017-Present). |
| | |
| Sonia L. Bates (61) | | Asst. Treasurer since 2011 | | Assistant Treasurer, American Beacon Advisors, Inc. (2011-Present); Assistant Treasurer, Resolute Investment Managers, Inc. (2015-Present); Assistant Treasurer, Resolute Acquisition, Inc. (2015-Present); Assistant. Treasurer, Resolute Topco, Inc. (2015-Present); Assistant Treasurer, Resolute Investment Holdings, LLC.; Assistant Treasurer, Lighthouse Holdings, Inc. (2011-2015); Assistant Treasurer, Lighthouse Holdings Parent Inc. (2011-2015); Assistant Treasurer, American Private Equity Management, LLC (2012-Present); Assistant Treasurer, American Beacon Select Funds (2011-Present); Assistant Treasurer American Beacon Mileage Funds (2011-2012); Assistant Treasurer, American Beacon Master Trust (2011-2012); Assistant Treasurer, American Beacon Institutional Funds Trust (2017-Present). |
| | |
| Shelley D. Abrahams (43) | | Assistant Secretary since 2008 | | Assistant Secretary, American Beacon Advisors, Inc. (2008-Present); Assistant Secretary, American Beacon Select Funds (2008-Present); Assistant Secretary, American Beacon Mileage Funds (2008-2012); Assistant Secretary, American Beacon Master Trust (2008-2012); Assistant Secretary, American Beacon Institutional Funds Trust (2017-Present). |
91
Trustees and Officers of the American Beacon FundsSM (Unaudited)
| | | | |
Name, Age and Address | | Position, Term of Office and Length of Time Served with the Trust | | Principal Occupation(s) During Past 5 Years and Current Directorships |
| OFFICERS (CONT.) | | Term | | |
| | |
| Rebecca L. Harris (51) | | Assistant Secretary since 2010 | | Vice President, American Beacon Advisors, Inc. (2016-Present); Vice President, Resolute Investment Managers, Inc. (2017-Present); Vice President, Alpha Quant Advisors, LLC (2016-Present); Assistant Secretary, American Beacon Select Funds (2010-Present); Assistant Secretary, American Beacon Mileage Funds (2010-2012); Assistant Secretary, American Beacon Master Trust (2010-2012); Assistant Secretary, American Beacon Institutional Funds Trust (2017-Present). |
| | |
| Diana N. Lai (42) | | Assistant Secretary since 2012 | | Assistant Secretary, American Beacon Advisors, Inc. (2012-Present); Assistant Secretary, American Beacon Select Funds (2012-Present); Assistant Secretary, American Beacon Institutional Funds Trust (2017-Present). |
| | |
| Teresa A. Oxford (59) | | Assistant Secretary since 2015 | | Assistant Secretary, American Beacon Advisors, Inc. (2015-Present); Assistant Secretary, Alpha Quant Advisors, LLC (2016-Present); Assistant Secretary, American Beacon Select Funds (2015-Present); Assistant Secretary, American Beacon Institutional Funds Trust (2017-Present). |
* As of 11/12/2014, the Board adopted a retirement plan that requires Trustees to retire no later than the last day of the calendar year in which they reach the age of 75.
** Mr. Feld is deemed to be an “interested person” of the Trusts, as defined by the 1940 Act. Mr. Feld’s law firm of Akin, Gump, Strauss, Hauer & Feld LLP has provided legal services within the past two fiscal years to one or more of the Trust’s sub-advisors.
*** Mr. Dunning retired as of 12/31/2017. Douglas A. Lindgren became a new Trustee to each of the Trusts on 1/1/2018.
92
American Beacon FundsSM
Privacy Policy
December 31, 2017 (Unaudited)
The American Beacon Funds recognize and respect the privacy of our shareholders. We are providing this notice to you so you will understand how shareholder information may be collected and used.
We may collect nonpublic personal information about you from one or more of the following sources:
| | • | | information we receive from you on applications or other forms; |
| | • | | information about your transactions with us or our service providers; and |
| | • | | information we receive from third parties. |
We do not disclose any nonpublic personal information about our customers or former customers to anyone, except as permitted by law.
We restrict access to your nonpublic personal information to those employees or service providers who need to know that information to provide products or services to you. To ensure the confidentiality of your nonpublic personal information, we maintain safeguards that comply with federal standards.
93
This page intentionally left blank.
94
This page intentionally left blank.
95
This page intentionally left blank.
96

Delivery of Documents
eDelivery is NOW AVAILABLE - Stop traditional mail delivery and receive your
shareholder reports and summary prospectus on-line. Sign up at
www.americanbeaconfunds.com
If you invest in the Fund through a financial institution, you may be able to receive the Fund’s regulatory mailings, such as the Prospectus, Annual Report and Semi-Annual Report, by e-mail. If you are interested in this option, please go to www.icsdelivery.com and search for your financial institution’s name or contact your financial institution directly.
To obtain more information about the Fund:
| | |
 | |  |
| | |
| By E-mail: | | On the Internet: |
| american_beacon.funds@ambeacon.com | | Visit our website at www.americanbeaconfunds.com |
| | | |
| | | |
| | |

By Telephone: Call (800) 658-5811 | | 
By Mail: American Beacon Funds P.O. Box 219643 Kansas City, MO 64121-9643 |
| |
| |
| |
| | | |
| | | |
| Availability of Quarterly Portfolio Schedules | | Availability of Proxy Voting Policy and Records |
| | |
| In addition to the Schedule of Investments provided in each semi-annual and annual report, the Fund files a complete schedule of its portfolio holdings with the Securities and Exchange Commission (“SEC”) on Form N-Q as of the first and third fiscal quarters. The Fund’s Forms N-Q are available on the SEC’s website at www.sec.gov. The Forms N-Q may also be reviewed and copied at the SEC’s Public Reference Section, 100 F Street, NE, Washington, D.C. 20549-2736. Information regarding the operation of the SEC’s Public Reference Room may be obtained by calling (800)-SEC-0330. A complete schedule of the Fund’s portfolio holdings is also available at www.americanbeaconfunds.com approximately sixty days after the end of each month. | | A description of the policies and procedures the Fund uses to determine how to vote proxies relating to portfolio securities is available in the Fund’s Statement of Additional Information, is available free of charge on the Fund’s website www.americanbeaconfunds.com and by calling 1-800-967-9009 or by accessing the SEC’s website at www.sec.gov. The Fund’s proxy voting record for the most recent year ended June 30 is filed annually with the SEC on Form N-PX. The Fund’s Forms N-PX are available on the SEC’s website at www.sec.gov. The Fund’s proxy voting record may also be obtained by calling 1-800-967-9009. |
Fund Service Providers:
| | | | | | | | | | | | |
CUSTODIAN State Street Bank and Trust Boston, Massachusetts | | | | TRANSFER AGENT DST Asset Managers Solutions, Inc. Kansas City, Missouri | | | | INDEPENDENT REGISTERED PUBLIC ACCOUNTING FIRM Ernst & Young LLP Dallas, Texas | | | | DISTRIBUTOR Foreside Fund Services, LLC Portland, Maine |
This report is prepared for shareholders of the American Beacon Funds and may be distributed to others only if preceded or accompanied by a current Prospectus or Summary Prospectus.
American Beacon Funds, American Beacon AHL Managed Futures Strategy Fund and American Beacon Ionic Strategic Arbitrage Fund are service marks of American Beacon Advisors, Inc.
AR 12/17
The Trust adopted a code of ethics that applies to its principal executive and financial officers (the “Code”). The Trust amended its code March 24, 2017 to disclose the addition of the Institutional Funds Trust, disclose a change in the Principal Financial Officer and disclosure of conflicts due to Principal Officers serving in positions with affiliates, which also serve as sub-advisors. The Trust did not grant any waivers to the provisions of the Code during the period covered by the shareholder reports presented in Item 1. The Code is filed herewith as Exhibit 99.CODE ETH.
| ITEM 3. | AUDIT COMMITTEE FINANCIAL EXPERT. |
The Trust’s Board of Trustees has determined that Ms. Brenda A. Cline, a member of the Trust’s Audit and Compliance Committee, is an “audit committee financial expert” as defined in Form N-CSR. Ms. Brenda Cline is “independent” as defined in Form N-CSR.
| ITEM 4. | PRINCIPAL ACCOUNTANT FEES AND SERVICES. |
| | | | |
(a) Audit Fees | | Fiscal Year Ended | |
$270,762 | | | 12/31/2016 | |
$256,113 | | | 12/31/2017 | |
| |
(b) Audit-Related Fees | | Fiscal Year Ended | |
$0 | | | 12/31/2016 | |
$0 | | | 12/31/2017 | |
| |
(c) Tax Fees | | Fiscal Year Ended | |
$58,474 | | | 12/31/2016 | |
$172,043 | | | 12/31/2017 | |
| |
(d) All Other Fees | | Fiscal Year Ended | |
$0 | | | 12/31/2016 | |
$0 | | | 12/31/2017 | |
(e)(1) Pursuant to its charter, the Trust’s Audit and Compliance Committee shall have the following duties and powers pertaining to pre-approval of audit and non-audit services provided by the Trust’s principal accountant:
- to approve, prior to appointment, the engagement of auditors to annually audit and provide their opinion on the Trusts’ financial statements, and, in connection therewith, reviewing and evaluating matters potentially affecting the independence and capabilities of the auditors;
- to approve, prior to appointment, the engagement of the auditors to provide non-audit services to the Trusts, an investment adviser to any series of the Trusts or any entity controlling, controlled by, or under common control with an investment adviser (“adviser affiliate”) that provides ongoing services to the Trusts, if the engagement relates directly to the operations and financial reporting of the Trusts;
- to consider whether the non-audit services provided by a Trust’s auditor to an investment adviser or any adviser affiliate that provides ongoing services to a series of the Trusts, which services were not pre-approved by the Committee, are compatible with maintaining the auditor’s independence;
- to review the arrangements for and scope of the annual audit and any special audits; and
- to review and approving the fees proposed to be charged to the Trusts by the auditors for each audit and non-audit service.
The Audit and Compliance Committee may delegate any portion of its authority, including the authority to grant pre-approvals of audit and permitted non-audit services, to a subcommittee of one or more members. Any decisions of the subcommittee to grant pre-approvals shall be presented to the full audit committee at its next regularly scheduled meeting.
(e)(2) None of the fees disclosed in paragraphs (b) through (d) above were approved by the audit committee pursuant to paragraph (c)(7)(i)(C) of Rule 2-01 of Regulation S-X.
(f) Not applicable.
(g)
Aggregate Non-Audit Fees for Services Rendered to the:
| | | | | | | | | | | | |
Registrant | | | Adviser | | | Adviser’s Affiliates Providing Ongoing Services to Registrant | | Fiscal Year Ended | |
| $ | 58,474 | | | $ | 215,882 | | | N/A | | | 12/31/2016 | |
| $ | 172,043 | | | $ | 110,167 | | | N/A | | | 12/31/2017 | |
(h) Not applicable.
| ITEM 5. | AUDIT COMMITTEE OF LISTED REGISTRANTS. |
Not applicable.
| ITEM 6. | SCHEDULE OF INVESTMENTS. |
The schedules of investments for each series of the Trust are included in the shareholder reports presented in Item 1.
| ITEM 7. | DISCLOSURE OF PROXY VOTING POLICIES AND PROCEDURES FOR CLOSED-END MANAGEMENT INVESTMENT COMPANIES. |
Not applicable.
| ITEM 8. | PORTFOLIO MANAGERS OF CLOSED-END MANAGEMENT INVESTMENT COMPANIES. |
Not applicable.
| ITEM 9. | PURCHASES OF EQUITY SECURITIES BY CLOSED-END MANAGEMENT INVESTMENT COMPANY AND AFFILIATED PURCHASERS. |
Not applicable.
| ITEM 10. | SUBMISSION OF MATTERS TO A VOTE OF SECURITY HOLDERS. |
The Trust has made no material changes to the procedures by which shareholders may recommend nominees to the Trust’s Board of Trustees since the Trust last disclosed such procedures in Schedule 14A.
| ITEM 11. | CONTROLS AND PROCEDURES. |
(a) Based upon an evaluation within 90 days of the filing date of this report, the principal executive and financial officers concluded that the disclosure controls and procedures of the Trust are effective.
(b) There were no changes in the Trust’s internal control over financial reporting during the second fiscal quarter of the period covered by this report that has materially affected, or is reasonably likely to materially affect, the Trust’s internal control over financial reporting.
(a)(1) Filed herewith as EX-99.CODE ETH.
(a)(2) A separate certification for each principal executive officer and principal financial officer of the Trust as required by Rule 30a-2(a) under the Investment Company Act of 1940 is attached hereto as EX-99.CERT.
(a)(3) Not applicable.
(b) The certifications required by Rule 30a-2(b) under the Investment Company Act of 1940 are attached hereto as EX-99.906CERT.
SIGNATURES
Pursuant to the requirements of the Securities Exchange Act of 1934 and the Investment Company Act of 1940, the registrant has duly caused this report to be signed on its behalf by the undersigned, thereunto duly authorized.
(Registrant): American Beacon Funds
|
By /s/ Gene L. Needles, Jr. |
| Gene L. Needles, Jr. |
| President |
| American Beacon Funds |
Date: March 9, 2018
Pursuant to the requirements of the Securities Exchange Act of 1934 and the Investment Company Act of 1940, this report has been signed below by the following persons on behalf of the registrant and in the capacities and on the dates indicated.
|
By /s/ Gene L. Needles, Jr. |
| Gene L. Needles, Jr. |
| President |
| American Beacon Funds |
Date: March 9, 2018
|
By /s/ Melinda G. Heika |
| Melinda G. Heika |
| Treasurer |
| American Beacon Funds |
Date: March 9, 2018