UNITED STATES
SECURITIES AND EXCHANGE COMMISSION
Washington, D.C. 20549
FORM N-CSR/A
CERTIFIED SHAREHOLDER REPORT OF REGISTERED
MANAGEMENT INVESTMENT COMPANIES
Investment Company Act file number: 811-4984
AMERICAN BEACON FUNDS
(Exact name of registrant as specified in charter)
220 East Las Colinas Boulevard, Suite 1200
Irving, Texas 75039
(Address of principal executive offices)-(Zip code)
GENE L. NEEDLES, JR., PRESIDENT
220 East Las Colinas Boulevard, Suite 1200
Irving, Texas 75039
(Name and address of agent for service)
Registrant’s telephone number, including area code: (817) 391-6100
Date of fiscal year end: January 31, 2018
Date of reporting period: January 31, 2018
Form N-CSR is to be used by management investment companies to file reports with the Commission not later than 10 days after the transmission to stockholders of any report that is required to be transmitted to stockholders under Rule 30e-1 under the Investment Company Act of 1940 (17 CFR 270.30e-1). The Commission may use the information provided on Form N-CSR in its regulatory, disclosure review, inspection, and policymaking roles.
A registrant is required to disclose the information specified by Form N-CSR, and the Commission will make this information public. A registrant is not required to respond to the collection of information contained in Form N-CSR unless the Form displays a currently valid Office of Management and Budget (“OMB”) control number. Please direct comments concerning the accuracy of the information collection burden estimate and any suggestions for reducing the burden to Secretary, Securities and Exchange Commission, 450 Fifth Street, NW, Washington, DC 20549-0609. The OMB has reviewed this collection of information under the clearance requirements of 44 U.S.C. § 3507.
| ITEM 1. | REPORTS TO STOCKHOLDERS. |

About American Beacon Advisors
Since 1986, American Beacon Advisors has offered a variety of products and investment advisory services to numerous institutional and retail clients, including a variety of mutual funds, corporate cash management, and separate account management.
Our clients include defined benefit plans, defined contribution plans, foundations, endowments, corporations, financial planners, and other institutional investors. With American Beacon Advisors, you can put the experience of a multi-billion dollar asset management firm to work for your company.
ACADIAN EMERGING MARKETS MANAGED VOLATILITY FUND
Investing in foreign and emerging market securities may involve heightened risk due to currency fluctuations and economic and political risks. Investing in lower volatility securities may produce more modest gains than other stock funds as a trade-off for the potentially lower downside risk. The use of futures contracts for cash management may subject the Fund to losing more money than invested. The Fund participates in a securities lending program. Please see the prospectus for a complete discussion of the Fund’s risks. There can be no assurances that the investment objectives of this Fund will be met.
SGA GLOBAL GROWTH FUND
Investing in foreign and emerging market securities may involve heightened risk due to currency fluctuations and economic and political risks. Growth stocks typically are more volatile than value stocks; however, value stocks have a lower expected growth rate in earnings and sales. The use of futures contracts for cash management may subject the Fund to losing more money than invested. The Fund participates in a securities lending program. Please see the prospectus for a complete discussion of the Fund’s risks. There can be no assurances that the investment objectives of this Fund will be met.
Any opinions herein, including forecasts, reflect our judgment as of the end of the reporting period and are subject to change. Each advisor’s strategies and each Fund’s portfolio composition will change depending on economic and market conditions. This report is not a complete analysis of market conditions, and, therefore, should not be relied upon as investment advice. Although economic and market information has been compiled from reliable sources, American Beacon Advisors, Inc. makes no representation as to the completeness or accuracy of the statements contained herein.
American Beacon Funds | January 31, 2018 |
Contents
| | | | |
| |
Additional Fund Information | | | Back Cover | |
President’s Message
| | |
 | | Dear Shareholders, At American Beacon, we are proud to offer a broad range of equity, fixed- income and alternative mutual fund products for institutions and individuals. Our mutual funds – which span the domestic, international, global, frontier and emerging markets – are sub-advised by experienced portfolio managers who employ distinctive investment processes to manage assets through a variety of economic and market conditions. Together, we work diligently to help our clients and shareholders meet their long-term financial goals. Institutional wisdom, enduring value. Since our inception as a pension fiduciary in 1986, American Beacon has focused on identifying and overseeing institutional investment managers and portfolio risk management. In 1987, we leveraged our size and experience to launch a series of sub-advised, multi- |
manager mutual funds providing individual investors access to many of the same institutional managers as our pension clients. Following the financial crisis in 2008, we saw that investors were looking for unique solutions from managers who were not necessarily mainstream. In 2010, we began offering mutual funds from single managers with distinctive investment styles or asset classes. As we continue to expand our family of funds, our solutions- based approach provides innovative investments.
Guiding principles. Our “manager of managers” philosophy is built on a long-standing history of innovative thinking, discipline and consistency in applying our solutions-based approach. As a manager of managers, our goal is to engage the most effective money managers for each asset class, investment style or market strategy – whether through a single sub-advisor or a combination of sub-advisors. Because we take our fiduciary responsibilities very seriously, our thorough manager evaluation and selection process is rigorous and ongoing. Our guiding principles – predictability, style consistency, competitive pricing and long-term relationships – provide a strong foundation for our due-diligence process. Our broad range of mutual funds helps investors navigate the economic storms and market downturns in the U.S. and abroad. Our years of experience evaluating sub-advisors have led us to identify and partner with asset managers who have adhered to their disciplined processes for many years and through multiple market cycles.
Focus on asset protection and risk mitigation. We strive to provide innovative, long-term products without gimmicks. From offering some of the first multi-manager funds, one of the first retirement-income funds and the first open-end mutual fund in the U.S. to focus primarily on frontier-market debt, our robust history includes applying a disciplined, solutions-based approach to our product development process to help protect assets and mitigate risk.
Thank you for your continued interest in American Beacon. For additional information about our funds or to access your account information, please visit our website at www.americanbeaconfunds.com.
Best Regards,

Gene L. Needles, Jr.
President
American Beacon Funds
1
Global Equity and Emerging Markets Overview
January 31, 2018 (Unaudited)
Global equity markets produced very strong returns for the 12-month period ended January 31, 2018, evidenced by the 27.5% return of the MSCI All Country World Index. Market conditions characterized by low volatility, central-bank accommodation, low inflation and strong corporate results provided a healthy backdrop for equity markets.
Domestic small-cap stocks, represented by the Russell 2000 Index, returned 17.2%. Small caps underperformed large-cap stocks, represented by the S&P 500 Index, which returned 26.4%. Remarkably, the S&P 500 Index only had one instance during the period where it was down more than 0.5% on consecutive trading days. From a sector perspective within the S&P 500 Index, all sectors produced positive returns for the year. The top performers were Information Technology up 43.1% and Financials up 29.8%. On the other hand, lagging sectors included Telecommunications Services up 1.8%, Energy up 6.6% and Real Estate up 8.8%. From a style standpoint, investors favored growth stocks, which easily outperformed value as demonstrated by the Russell 3000 Growth Index return of 34.1% compared to the Russell 3000 Value Index return of 16.7%.
International, developed markets provided strong returns over the period as the MSCI EAFE Index was up 27.6%. In Europe, the high returns were broad-based – represented by the MSCI Italy Index up 47.2%, the MSCI France Index up 37.0%, the MSCI Germany Index up 31.2% and the MSCI United Kingdom Index up 24.4% – as investors bid up shares in an improving European economy. In Japan, the MSCI Japan Index returned an impressive 25.0% as Prime Minister Shinzo Abe’s market-friendly reform efforts continued to take hold.
In the developing world, emerging markets (“EMs”) had an extraordinary year as rising commodity prices and positive investor sentiment lifted stocks. The MSCI Emerging Markets Index returned 41.0%. China, the largest country classified as an EM, led the way during the period with the MSCI China Index up an astonishing 62.3%. Other notable EM markets included the MSCI Poland Index up 52.4%, the MSCI India Index up 37.6% and the MSCI Brazil Index up 31.0%. The MSCI Mexico Index was up 22.4%, weak relative to other EMs, as investors worried about the outcome of ongoing NAFTA negotiations and a presidential election in the summer of 2018.
2
American Beacon Acadian Emerging Markets Managed Volatility FundSM
Performance Overview
January 31, 2018 (Unaudited)
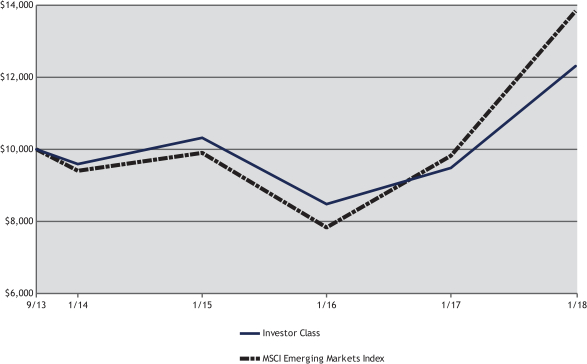
The Investor Class of the American Beacon Acadian Emerging Markets Managed Volatility Fund (the “Fund”) returned 29.78% for the twelve months ended January 31, 2018. The Fund underperformed the MSCI Emerging Markets Index (the “Index”) return of 41.01% for the period.
Comparison of Changes in Value of a $10,000 Investment for the period 9/27/2013 Through 1/31/2018
| | | | | | | | | | | | | | | | | | | | | | | | | |
| Total Returns for the Period ended January 31, 2018 | |
| | | Ticker | | 1 Year | | 3 Years | | Since Inception 9/27/2013 | | Value of $10,000 9/27/2013- 1/31/2018 |
Institutional Class (1,3) | | ACDIX | | | | 30.24 | % | | | | 6.45 | % | | | | 5.28 | % | | | $ | 12,505 | |
Y Class (1,3) | | ACDYX | | | | 30.12 | % | | | | 6.36 | % | | | | 5.17 | % | | | $ | 12,450 | |
Investor Class (1,3) | | ACDPX | | | | 29.78 | % | | | | 6.06 | % | | | | 4.89 | % | | | $ | 12,306 | |
A without Sales Charge (1,3) | | ACDAX | | | | 29.83 | % | | | | 6.03 | % | | | | 4.85 | % | | | $ | 12,286 | |
A with Sales Charge (1,3) | | ACDAX | | | | 22.37 | % | | | | 3.96 | % | | | | 3.43 | % | | | $ | 11,579 | |
C without Sales Charge (1,3) | | ACDCX | | | | 28.71 | % | | | | 5.24 | % | | | | 4.04 | % | | | $ | 11,878 | |
C with Sales Charge (1,3) | | ACDCX | | | | 27.71 | % | | | | 5.24 | % | | | | 4.04 | % | | | $ | 11,878 | |
| | | | | | | | | | | | | | | | | | | | | | | | | |
MSCI Emerging Markets Index (2) | | | | | | 41.01 | % | | | | 11.83 | % | | | | 7.76 | % | | | $ | 13,841 | |
| 1. | Performance shown is historical and is not indicative of future returns. Investment returns and principal value will vary, and shares may be worth more or less at redemption than at original purchase. Performance shown is calculated based on the published end of day net asset values as of the date indicated and current performance may be lower or higher than the performance data quoted. To obtain performance as of the most recent month end, please visit www.americanbeaconfunds.com or call 1-800-967-9009. Fund performance in the table above does not reflect the deduction of taxes a shareholder would pay on distributions or the redemption of shares. Generally accepted accounting principles require adjustments to be made to the net assets of the Fund at period end for financial reporting purposes only, and as such, the total return based on the unadjusted net asset value per share may differ from the total return reported in the financial highlights. A portion of the fees charged to each Class of the Fund has been waived since inception. Performance prior to waiving fees was lower than the actual returns shown since inception. A Class shares have a maximum sales charge of 5.75%. The maximum contingent deferred sales charge for the C Class is 1.00% for shares redeemed within one year of the date of purchase. Please note that the recent performance of the securities market has helped produce short-term returns that are not typical and may not continue in the future. |
| 2. | The MSCI Emerging Markets Index is a market capitalization weighted index composed of companies that are representative of the market structure of developing countries in Latin America, Asia, Eastern Europe, the Middle East and Africa. One cannot directly invest in an index. |
3
American Beacon Acadian Emerging Markets Managed Volatility FundSM
Performance Overview
January 31, 2018 (Unaudited)
| 3. | The Total Annual Fund Operating Expense ratios set forth in the most recent Fund prospectus for the Institutional, Y, Investor, A, and C Class shares were 1.48%, 1.56%, 1.78%, 1.91% and 2.68%, respectively. The expense ratios above may vary from the expense ratios presented in other sections of this report that are based on expenses incurred during the period covered by this report. |
The Fund underperformed the Index over the one-year period due to stock selection and country allocation.
Stock selections in Hong Kong and China detracted from relative performance during the period. This was partially offset by strong selections in Egypt and Malaysia. The primary detractors in Hong Kong (which was up 73.77%) included NVC Lighting Holdings Ltd. down 19.34%, Citic Ltd. up 9.83%, and Qinqin Foodstuffs Group down 18.37%. In China, another strong returning market for the year, up 55.30%, portfolio holdings in China Telecom Corp., Ltd. up 7.54%, PetroChina Co., Ltd. up 2.33%, and Bank of Communications Co. up 22.67% hurt relative performance. In Egypt, a position in Eastern Tobacco up 163.70% contributed positively to performance. In Malaysia, a position in Nestle (Malaysia) Bhd. up 74.76% added value to relative performance.
Relative contribution from country allocation was negative for the twelve month period. Underweighting Hong Kong up 73.77%, and overweighting Egypt up 7.58% were the largest detractors. On the other hand, underweighting Mexico up 22.44% contributed positively to relative performance during the period.
The Fund’s basic philosophy remains focused on investing in a well-diversified portfolio of low volatility stocks that aims to maximize risk-adjusted returns.
| | | | | | | | |
| Top Ten Holdings (% Net Assets) | |
| Public Bank Bhd | | | | | | | 1.5 | |
| Industrial & Commercial Bank of China Ltd., Class H | | | | | | | 1.5 | |
| CEZ A/S | | | | | | | 1.5 | |
| Tata Consultancy Services Ltd. | | | | | | | 1.5 | |
| China Construction Bank Corp., Class H | | | | | | | 1.5 | |
| Tencent Holdings Ltd. | | | | | | | 1.5 | |
| Bank of China Ltd., Class H | | | | | | | 1.5 | |
| Agricultural Bank of China Ltd., Class H | | | | | | | 1.5 | |
| Hindustan Unilever Ltd. | | | | | | | 1.4 | |
| Manila Electric Co. | | | | | | | 1.4 | |
| | |
| Total Fund Holdings | | | 211 | | | | | |
| | | | | | | | |
| Sector Allocation (% Equities) | |
| Financials | | | | | | | 21.7 | |
| Consumer Staples | | | | | | | 18.3 | |
| Telecommunication Services | | | | | | | 13.8 | |
| Information Technology | | | | | | | 12.8 | |
| Utilities | | | | | | | 8.4 | |
| Consumer Discretionary | | | | | | | 6.5 | |
| Industrials | | | | | | | 6.2 | |
| Energy | | | | | | | 5.0 | |
| Health Care | | | | | | | 3.9 | |
| Materials | | | | | | | 3.0 | |
| Real Estate | | | | | | | 0.4 | |
| | | | | | | | |
4
American Beacon Acadian Emerging Markets Managed Volatility FundSM
Performance Overview
January 31, 2018 (Unaudited)
| | | | | | | | |
| Country Allocation (% Equities) | |
| China | | | | | | | 24.1 | |
| India | | | | | | | 11.7 | |
| Republic of Korea | | | | | | | 11.0 | |
| Taiwan | | | | | | | 9.6 | |
| Malaysia | | | | | | | 5.3 | |
| Thailand | | | | | | | 4.9 | |
| Brazil | | | | | | | 4.2 | |
| Indonesia | | | | | | | 4.1 | |
| South Africa | | | | | | | 4.0 | |
| Philippines | | | | | | | 3.3 | |
| Chile | | | | | | | 3.0 | |
| Egypt | | | | | | | 2.6 | |
| Greece | | | | | | | 2.5 | |
| Hungary | | | | | | | 2.4 | |
| Czech Republic | | | | | | | 2.3 | |
| Hong Kong | | | | | | | 1.4 | |
| Peru | | | | | | | 1.3 | |
| Russia | | | | | | | 1.1 | |
| Mexico | | | | | | | 0.9 | |
| Poland | | | | | | | 0.3 | |
5
American Beacon SGA Global Growth FundSM
Performance Overview
January 31, 2018 (Unaudited)
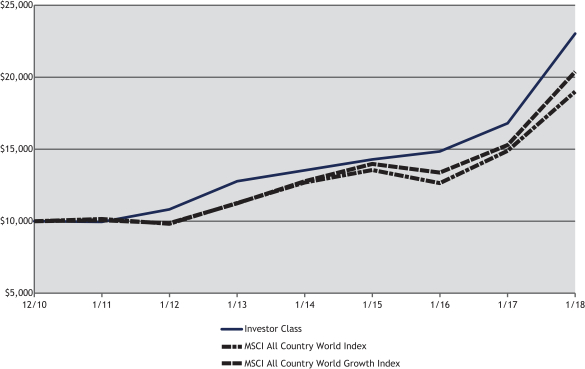
The Investor Class of the American Beacon SGA Global Growth Fund (the “Fund”) returned 37.16% for the twelve months ended January 31, 2018. The Fund outperformed the MSCI All Country World Index (the “Index”) return of 27.48% for the period.
Comparison of Change in Value of a $10,000 Investment for the period from 12/31/2010 through 1/31/2018
| | | | | | | | | | | | | | | | | | | | | | | | | | | | | | |
| Total Returns for the Period ended January 31, 2018 | |
| | | Ticker | | 1 Year | | 3 Years | | 5 Years | | Since Inception
(12/31/2010) | | Value of $10,000 12/31/2010- 1/31/2018 |
Institutional Class (1,7) | | SGAGX | | | | 37.64 | % | | | | 17.71 | % | | | | 12.89 | % | | | | 12.75 | % | | | $ | 23,406 | |
Y Class (1,2,7) | | SGAYX | | | | 37.52 | % | | | | 17.59 | % | | | | 12.78 | % | | | | 12.68 | % | | | $ | 23,298 | |
Investor Class (1,3,7) | | SGAPX | | | | 37.16 | % | | | | 17.26 | % | | | | 12.51 | % | | | | 12.49 | % | | | $ | 23,019 | |
A without Sales Charge (1,4,7) | | SGAAX | | | | 37.05 | % | | | | 17.23 | % | | | | 12.48 | % | | | | 12.47 | % | | | $ | 22,986 | |
A with Sales Charge (1,4,7) | | SGAAX | | | | 29.16 | % | | | | 14.95 | % | | | | 11.15 | % | | | | 11.53 | % | | | $ | 21,665 | |
C without Sales Charge (1,5,7) | | SGACX | | | | 36.04 | % | | | | 16.37 | % | | | | 11.75 | % | | | | 11.95 | % | | | $ | 22,254 | |
C with Sales Charge (1,5,7) | | SGACX | | | | 35.04 | % | | | | 16.37 | % | | | | 11.75 | % | | | | 11.95 | % | | | $ | 22,254 | |
| | | | | | | | | | | | | | | | | | | | | | | | | | | | | | |
MSCI All Country World Index (6) | | | | | | 27.48 | % | | | | 11.90 | % | | | | 11.02 | % | | | | 9.46 | % | | | $ | 18,983 | |
MSCI All Country World Growth Index (6) | | | | | | 33.27 | % | | | | 13.42 | % | | | | 12.65 | % | | | | 10.56 | % | | | $ | 20,376 | |
| 1. | Performance shown is historical and is not indicative of future returns. Investment returns and principal value will vary, and shares may be worth more or less at redemption than at original purchase. Performance shown is calculated based on the published end of day net asset values as of the date indicated and current performance may be lower or higher than the performance data quoted. To obtain performance as of the most recent month end, please visit www.americanbeaconfunds.com or call 1-800-967-9009. Fund performance in the table above does not reflect the deduction of taxes a shareholder would pay on distributions or the redemption of shares. Generally accepted accounting principles require adjustments to be made to the net assets of the Fund at period end for financial reporting purposes only, and as such, the total return based on the unadjusted net asset value per share may differ from the total return reported in the financial highlights. A portion of the fees charged to each Class of the Fund has been waived since Fund inception. Performance prior to waiving fees was lower than the actual returns shown since inception. Please note that the recent performance of the securities market has helped produce short-term returns that are not typical and may not continue in the future. |
6
American Beacon SGA Global Growth FundSM
Performance Overview
January 31, 2018 (Unaudited)
| 2. | Fund performance for the five-year and since inception periods represent the total returns achieved by the Institutional Class from 12/31/10 up to 10/4/13, the inception date of the Y Class, and the returns of the Y Class since its inception. Expenses of the Y Class are higher than those of the Institutional Class. As a result, total returns shown may be higher than they would have been had the Y Class been in existence since 12/31/10. |
| 3. | Fund performance for the five-year and since inception periods represent the total returns achieved by the Institutional Class from 12/31/10 up to 10/4/13, the inception date of the Investor Class, and the returns of the Investor Class since its inception. Expenses of the Investor Class are higher than those of the Institutional Class. As a result, total returns shown may be higher than they would have been had the Investor Class been in existence since 12/31/10. |
| 4. | Fund performance for the five-year and since inception periods represent the total returns achieved by the Institutional Class from 12/31/10 up to 10/4/13, the inception date of the A Class, and the returns of the A Class since its inception. Expenses of the A Class are higher than those of the Institutional Class. As a result, total returns shown may be higher than they would have been had the A Class been in existence since 12/31/10. The maximum sales charge for A Class is 5.75%. |
| 5. | Fund performance for the five-year and since inception periods represent the total returns achieved by the Institutional Class from 12/31/10 up to 10/4/13, the inception date of the C Class, and the returns of the C Class since its inception. Expenses of the C Class are higher than those of the Institutional Class. As a result, total returns shown may be higher than they would have been had the C Class been in existence since 12/31/10. The maximum contingent deferred sales charge for C Class is 1.00% for shares redeemed within one year of the date of purchase. |
| 6. | The MSCI All Country World Index (“ACWI”) is a free float-adjusted, market capitalization weighted index that is designed to measure the equity market performance of developed and emerging markets. The MSCI All Country World Growth Index is designed to measure equity market performance of companies with higher growth values in developed and emerging markets. One cannot directly invest in an index. |
| 7. | The Total Annual Fund Operating Expense ratios set forth in the most recent Fund prospectus for the Institutional, Y, Investor, A and C Class shares were 2.04%, 1.89%, 2.06%, 2.34% and 3.09%, respectively. The expense ratios above may vary from the expense ratios presented in other sections of this report that are based on expenses incurred during the period covered by this report. |
From a Fund perspective, stock selection and country allocation both added to performance relative to the Index over the one-year period.
Stock selections in the United States were the top contributor to the Fund’s relative performance during the period, including Mercadolibre Inc. (listed on NASDAQ, but headquartered in Argentina, up 127.3%), Whole Foods Market Inc. up 40.6% and Red Hat Inc. up 73.1%. Also adding to relative performance were stock selections in Hong Kong, led by Tencent Holdings Ltd. up 129.4% and AIA Group Ltd. up 40.6%. Stock selections in the Netherlands, including Core Laboratories N.V. which was flat for the year detracted from Fund performance.
From a country allocation perspective, overweighting Hong Kong up 54.6% and South Africa up 42.7% aided relative performance, overcoming value lost through null weighting Italy up 41.9%.
The Fund’s basic philosophy remains focused on investing in low-risk companies that offer predictable earnings and cash flow growth over the long term.
| | | | | | | | |
| Top Ten Holdings (% Net Assets) | | | | | | | | |
| AIA Group Ltd. | | | | | | | 3.9 | |
| SAP SE, Sponsored ADR | | | | | | | 3.9 | |
| Visa, Inc., Class A | | | | | | | 3.9 | |
| Novo Nordisk A/S, Class B | | | | | | | 3.3 | |
| Equinix, Inc., REIT | | | | | | | 3.0 | |
| Amazon.com, Inc. | | | | | | | 3.0 | |
| Tencent Holdings Ltd. | | | | | | | 3.0 | |
| NIKE, Inc., Class B | | | | | | | 2.9 | |
| salesforce.com, Inc. | | | | | | | 2.9 | |
| FleetCor Technologies, Inc. | | | | | | | 2.9 | |
| | |
| Total Fund Holdings | | | 35 | | | | | |
7
American Beacon SGA Global Growth FundSM
Performance Overview
January 31, 2018 (Unaudited)
| | | | | | | | |
| Sector Allocation (% Equities) | | | | | | | | |
| Information Technology | | | | | | | 33.8 | |
| Consumer Discretionary | | | | | | | 24.2 | |
| Consumer Staples | | | | | | | 13.1 | |
| Financials | | | | | | | 8.9 | |
| Health Care | | | | | | | 6.6 | |
| Industrials | | | | | | | 5.2 | |
| Energy | | | | | | | 5.0 | |
| Real Estate | | | | | | | 3.2 | |
| | | | | | | | |
| Country Allocation (% Equities) | | | | | | | | |
| United States | | | | | | | 55.4 | |
| China | | | | | | | 7.8 | |
| India | | | | | | | 5.6 | |
| South Africa | | | | | | | 5.1 | |
| Hong Kong | | | | | | | 4.2 | |
| Germany | | | | | | | 4.1 | |
| Denmark | | | | | | | 3.5 | |
| France | | | | | | | 3.1 | |
| Japan | | | | | | | 3.0 | |
| Republic of Korea | | | | | | | 2.1 | |
| Australia | | | | | | | 2.1 | |
| Argentina | | | | | | | 2.1 | |
| Mexico | | | | | | | 1.9 | |
8
American Beacon FundsSM
Expense Examples
January 31, 2018 (Unaudited)
Fund Expense Example
As a shareholder of a Fund, you incur two types of costs: (1) transaction costs, including sales charges (loads) on purchase payments and redemption fees, if applicable, and (2) ongoing costs, including management fees, distribution (12b-1) fees, sub-transfer agent fees, and other Fund expenses. The Examples are intended to help you understand the ongoing cost (in dollars) of investing in the Fund and to compare these costs with the ongoing costs of investing in other mutual funds. The Examples are based on an investment of $1,000 invested at the beginning of the period in each Class and held for the entire period from August 1, 2017 through January 31, 2018.
Actual Expenses
The “Actual” lines of the tables provide information about actual account values and actual expenses. You may use the information on this page, together with the amount you invested, to estimate the expenses that you paid over the period. Simply divide your account value by $1,000 (for example, an $8,600 account value divided by $1,000 = $8.60), then multiply the result by the “Expenses Paid During Period” to estimate the expenses you paid on your account during this period. Shareholders of the Investor and Institutional Classes that invest in the Fund through an IRA or Roth IRA may be subject to a custodial IRA fee of $15 that is typically deducted each December. If your account was subject to a custodial IRA fee during the period, your costs would have been $15 higher.
Hypothetical Example for Comparison Purposes
The “Hypothetical” lines of the tables provide information about hypothetical account values and hypothetical expenses based on the Fund’s actual expense ratio and an assumed 5% per year rate of return before expenses (not the Fund’s actual return). You may compare the ongoing costs of investing in the Fund with other funds by contrasting this 5% hypothetical example and the 5% hypothetical examples that appear in the shareholder reports of the other funds. The hypothetical account values and expenses may not be used to estimate the actual ending account balance or expenses you paid for the period. Shareholders of the Investor and Institutional Classes that invest in the Funds through an IRA or Roth IRA may be subject to a custodial IRA fee of $15 that is typically deducted each December. If your account was subject to a custodial IRA fee during the period, your costs would have been $15 higher.
You should also be aware that the expenses shown in the table highlight only your ongoing costs and do not reflect any transaction costs charged by the Fund, such as sales charges (loads) or redemption fees, as applicable. Similarly, the expense examples for other funds do not reflect any transaction costs charged by those funds, such as sales charges (loads), redemption fees or exchange fees. Therefore, the “Hypothetical” lines of the tables are useful in comparing ongoing costs only and will not help you determine the relative total costs of owning different funds. If you were subject to any transaction costs during the period, your costs would have been higher.
9
American Beacon FundsSM
Expense Examples
January 31, 2018 (Unaudited)
| | | | | | | | | | | | | | | |
| Acadian Emerging Markets Managed Volatility Fund | |
| | | Beginning Account Value
8/1/2017 | | Ending Account Value
1/31/2018 | | Expenses Paid During
Period
8/1/2017-1/31/2018* |
| Institutional Class | | | | | | | | | | | | | | | |
| Actual | | | | $1,000.00 | | | | | $1,153.50 | | | | | $7.27 | |
| Hypothetical** | | | | $1,000.00 | | | | | $1,018.50 | | | | | $6.82 | |
| Y Class | | | | | | | | | | | | | | | |
| Actual | | | | $1,000.00 | | | | | $1,152.10 | | | | | $7.87 | |
| Hypothetical** | | | | $1,000.00 | | | | | $1,017.90 | | | | | $7.38 | |
| Investor Class | | | | | | | | | | | | | | | |
| Actual | | | | $1,000.00 | | | | | $1,150.80 | | | | | $9.38 | |
| Hypothetical** | | | | $1,000.00 | | | | | $1,016.50 | | | | | $8.79 | |
| A Class | | | | | | | | | | | | | | | |
| Actual | | | | $1,000.00 | | | | | $1,151.50 | | | | | $9.49 | |
| Hypothetical** | | | | $1,000.00 | | | | | $1,016.40 | | | | | $8.89 | |
| C Class | | | | | | | | | | | | | | | |
| Actual | | | | $1,000.00 | | | | | $1,145.80 | | | | | $13.52 | |
| Hypothetical** | | | | $1,000.00 | | | | | $1,012.60 | | | | | $12.68 | |
| * | Expenses are equal to the Fund’s annualized expense ratios for the six-month period of 1.34%, 1.45%, 1.73%, 1.75%, and 2.50% for the Institutional, Y, Investor, A, and C Classes, respectively, multiplied by the average account value over the period, multiplied by the number derived by dividing the number of days in the most recent fiscal half-year (184) by days in the year (365) to reflect the half-year period. |
| ** | 5% return before expenses. |
| | | | | | | | | | | | | | | |
| SGA Global Growth Fund | |
| | | Beginning Account Value
8/1/2017 | | Ending Account Value
1/31/2018 | | Expenses Paid During
Period
8/1/2017-1/31/2018* |
| Institutional Class | | | | | | | | | | | | | | | |
| Actual | | | | $1,000.00 | | | | | $1,162.50 | | | | | $5.34 | |
| Hypothetical** | | | | $1,000.00 | | | | | $1,020.30 | | | | | $4.99 | |
| Y Class | | | | | | | | | | | | | | | |
| Actual | | | | $1,000.00 | | | | | $1,161.50 | | | | | $5.88 | |
| Hypothetical** | | | | $1,000.00 | | | | | $1,019.80 | | | | | $5.50 | |
| Investor Class | | | | | | | | | | | | | | | |
| Actual | | | | $1,000.00 | | | | | $1,160.50 | | | | | $7.41 | |
| Hypothetical** | | | | $1,000.00 | | | | | $1,018.30 | | | | | $6.92 | |
| A Class | | | | | | | | | | | | | | | |
| Actual | | | | $1,000.00 | | | | | $1,160.10 | | | | | $7.51 | |
| Hypothetical** | | | | $1,000.00 | | | | | $1,018.20 | | | | | $7.02 | |
| C Class | | | | | | | | | | | | | | | |
| Actual | | | | $1,000.00 | | | | | $1,155.60 | | | | | $11.57 | |
| Hypothetical** | | | | $1,000.00 | | | | | $1,014.50 | | | | | $10.82 | |
| * | Expenses are equal to the Fund’s annualized expense ratios for the six-month period of 0.98%, 1.08%, 1.36%, 1.38%, and 2.13% for the Institutional, Y, Investor, A, and C Classes, respectively, multiplied by the average account value over the period, multiplied by the number derived by dividing the number of days in the most recent fiscal half-year (184) by days in the year (365) to reflect the half-year period. |
| ** | 5% return before expenses. |
10
American Beacon FundsSM
Report of Independent Registered Public Accounting Firm
To the Board of Trustees of American Beacon Funds and Shareholders of American Beacon Acadian Emerging Markets Managed Volatility Fund and American Beacon SGA Global Growth Fund
Opinions on the Financial Statements
We have audited the accompanying statements of assets and liabilities, including the schedules of investments, of American Beacon Acadian Emerging Markets Managed Volatility Fund and American Beacon SGA Global Growth Fund (two of the series constituting American Beacon Funds, referred to hereafter as the “Funds”) as of January 31, 2018, the related statements of operations for the year ended January 31, 2018, the statements of changes in net assets for each of the two years in the period ended January 31, 2018, including the related notes, and the financial highlights for each of the two years in the period ended January 31, 2018 (collectively referred to as the “financial statements”). In our opinion, the financial statements present fairly, in all material respects, the financial position of each of the Funds as of January 31, 2018, the results of each of their operations for the year then ended, the changes in each of their net assets for each of the two years in the period ended January 31, 2018 and each of the financial highlights for each of the two years in the period ended January 31, 2018 in conformity with accounting principles generally accepted in the United States of America.
Basis for Opinions
These financial statements are the responsibility of the Funds’ management. Our responsibility is to express an opinion on the Funds’ financial statements based on our audits. We are a public accounting firm registered with the Public Company Accounting Oversight Board (United States) (“PCAOB”) and are required to be independent with respect to the Funds in accordance with the U.S. federal securities laws and the applicable rules and regulations of the Securities and Exchange Commission and the PCAOB.
We conducted our audits of these financial statements in accordance with the standards of the PCAOB. Those standards require that we plan and perform the audit to obtain reasonable assurance about whether the financial statements are free of material misstatement, whether due to error or fraud.
Our audits included performing procedures to assess the risks of material misstatement of the financial statements, whether due to error or fraud, and performing procedures that respond to those risks. Such procedures included examining, on a test basis, evidence regarding the amounts and disclosures in the financial statements. Our audits also included evaluating the accounting principles used and significant estimates made by management, as well as evaluating the overall presentation of the financial statements. Our procedures included confirmation of securities owned as of January 31, 2018 by correspondence with the custodian, transfer agent and brokers; when replies were not received from brokers, we performed other auditing procedures. We believe that our audits provide a reasonable basis for our opinions.
The financial statements of each of the Funds as of and for the year ended January 31, 2016 and the financial highlights for each of the periods ended on or prior to January 31, 2016 (not presented herein, other than the financial highlights) were audited by other auditors whose report dated March 31, 2016 expressed an unqualified opinion on those financial statements and financial highlights.
PricewaterhouseCoopers LLP
Boston, MA
March 27, 2018
We have served as the auditor of one or more American Beacon investment companies since 2016.
11
American Beacon Acadian Emerging Markets Managed Volatility FundSM
Schedule of Investments
January 31, 2018
| | | | | | | | | | | | | | | |
| | | Shares | | | | Fair Value |
| | | | | | | | | | | | | | | |
| Brazil - 4.09% | | | | | | | | | | | | | | | |
| Common Stocks - 3.50% | | | | | | | | | | | | | | | |
| Ambev S.A. | | | | 33,800 | | | | | | | | | $ | 232,866 | |
| Construtora Tenda S.A.A | | | | 4,900 | | | | | | | | | | 34,374 | |
| CPFL Energia S.A. | | | | 20,300 | | | | | | | | | | 136,671 | |
| Engie Brasil Energia S.A. | | | | 1,600 | | | | | | | | | | 18,049 | |
| Fleury S.A. | | | | 3,700 | | | | | | | | | | 34,840 | |
| Grendene S.A. | | | | 9,400 | | | | | | | | | | 86,299 | |
| Hypermarcas S.A. | | | | 46,800 | | | | | | | | | | 533,808 | |
| IRB Brasil Resseguros S/A | | | | 19,700 | | | | | | | | | | 232,183 | |
| SLC Agricola S.A. | | | | 1,700 | | | | | | | | | | 16,749 | |
| | | | | | | | | | | | | | | |
Total Common Stocks | | | | | | | | | | | | | | 1,325,839 | |
| | | | | | | | | | | | | | | |
| | | | | | | | | | | | | | | |
| Preferred Stocks - 0.59% | | | | | | | | | | | | | | | |
| | | | | | | | | | | | | | | |
| Centrais Eletricas Santa CatarinaA B | | | | 900 | | | | | | | | | | 7,627 | |
| Telefonica Brasil S.A.B | | | | 12,800 | | | | | | | | | | 216,347 | |
| | | | | | | | | | | | | | | |
Total Preferred Stocks | | | | | | | | | | | | | | 223,974 | |
| | | | | | | | | | | | | | | |
| | | | | | | | | | | | | | | |
Total Brazil (Cost $1,234,851) | | | | | | | | | | | | | | 1,549,813 | |
| | | | | | | | | | | | | | | |
| | | | | | | | | | | | | | | |
| Chile - 2.85% | | | | | | | | | | | | | | | |
| Common Stocks - 2.85% | | | | | | | | | | | | | | | |
| AntarChile S.A. | | | | 2,356 | | | | | | | | | | 46,160 | |
| Banco de Chile | | | | 4,633 | | | | | | | | | | 792 | |
| Blumar S.A. | | | | 29,423 | | | | | | | | | | 8,497 | |
| Cia Cervecerias Unidas S.A., Sponsored ADR | | | | 5,217 | | | | | | | | | | 153,223 | |
| Embotelladora Andina S.A., Class B, ADR | | | | 4,740 | | | | | | | | | | 137,697 | |
| Enel Chile S.A., ADR | | | | 9,077 | | | | | | | | | | 57,185 | |
| Enel Chile S.A. | | | | 2,043,335 | | | | | | | | | | 257,607 | |
| Inversiones Aguas Metropolitanas S.A. | | | | 6,607 | | | | | | | | | | 13,042 | |
| Sigdo Koppers S.A. | | | | 24,802 | | | | | | | | | | 52,375 | |
| SMU S.A.A | | | | 281,595 | | | | | | | | | | 92,018 | |
| Sociedad Punta del Cobre S.A., Class A | | | | 1,894 | | | | | | | | | | 12,890 | |
| Vina Concha y Toro S.A. | | | | 111,423 | | | | | | | | | | 247,677 | |
| | | | | | | | | | | | | | | |
Total Common Stocks | | | | | | | | | | | | | | 1,079,163 | |
| | | | | | | | | | | | | | | |
| | | | | | | | | | | | | | | |
Total Chile (Cost $802,458) | | | | | | | | | | | | | | 1,079,163 | |
| | | | | | | | | | | | | | | |
| | | | | | | | | | | | | | | |
| China - 23.39% | | | | | | | | | | | | | | | |
| Common Stocks - 23.39% | | | | | | | | | | | | | | | |
| Agricultural Bank of China Ltd., Class H | | | | 900,000 | | | | | | | | | | 552,242 | |
| Bank of China Ltd., Class H | | | | 919,000 | | | | | | | | | | 553,328 | |
| Bank of Communications Co., Ltd., Class H | | | | 613,000 | | | | | | | | | | 531,296 | |
| Beijing Jingkelong Co., Ltd., Class H | | | | 69,000 | | | | | | | | | | 18,523 | |
| Changshouhua Food Co., Ltd. | | | | 19,000 | | | | | | | | | | 9,424 | |
| China Construction Bank Corp., Class H | | | | 487,000 | | | | | | | | | | 561,541 | |
| China Merchants Bank Co., Ltd., Class H | | | | 78,000 | | | | | | | | | | 382,390 | |
| China Mobile Ltd. | | | | 42,500 | | | | | | | | | | 448,761 | |
| China Petroleum & Chemical Corp., Class H | | | | 482,000 | | | | | | | | | | 416,524 | |
| China Shenhua Energy Co., Ltd., Class H | | | | 97,000 | | | | | | | | | | 301,937 | |
| China Shineway Pharmaceutical Group Ltd. | | | | 73,000 | | | | | | | | | | 89,959 | |
| China Telecom Corp. Ltd., Class H | | | | 970,000 | | | | | | | | | | 479,876 | |
| China Unicom Hong Kong Ltd.A | | | | 156,000 | | | | | | | | | | 233,721 | |
| CITIC Ltd. | | | | 330,000 | | | | | | | | | | 520,565 | |
| CNOOC Ltd. | | | | 235,000 | | | | | | | | | | 365,899 | |
| COSCO SHIPPING International Hong Kong Co., Ltd. | | | | 64,000 | | | | | | | | | | 26,835 | |
| Dongyue Group Ltd. | | | | 220,000 | | | | | | | | | | 192,927 | |
See accompanying notes
12
American Beacon Acadian Emerging Markets Managed Volatility FundSM
Schedule of Investments
January 31, 2018
| | | | | | | | | | | | | | | |
| | | Shares | | | | Fair Value |
| | | | | | | | | | | | | | | |
| China - 23.39% (continued) | | | | | | | | | | | | | | | |
| Common Stocks - 23.39% (continued) | | | | | | | | | | | | | | | |
| Fuguiniao Co., Ltd., Class HA C | | | | 28,000 | | | | | | | | | $ | 358 | |
| Hengan International Group Co., Ltd. | | | | 20,500 | | | | | | | | | | 196,545 | |
| Huishang Bank Corp. Ltd., Class H | | | | 361,000 | | | | | | | | | | 199,359 | |
| Industrial & Commercial Bank of China Ltd., Class H | | | | 601,000 | | | | | | | | | | 568,528 | |
| Jiangsu Expressway Co., Ltd., Class H | | | | 134,000 | | | | | | | | | | 206,585 | |
| Lanzhou Zhuangyuan Pasture Co., Ltd., Class H | | | | 10,000 | | | | | | | | | | 11,748 | |
| NVC Lighting Holding Ltd. | | | | 1,961,000 | | | | | | | | | | 188,012 | |
| PetroChina Co., Ltd., Class H | | | | 650,000 | | | | | | | | | | 515,171 | |
| Ping An Insurance Group Co. of China Ltd., Class H | | | | 41,500 | | | | | | | | | | 491,518 | |
| Shanghai Pharmaceuticals Holding Co., Ltd., Class H | | | | 29,200 | | | | | | | | | | 76,521 | |
| Tencent Holdings Ltd. | | | | 9,400 | | | | | | | | | | 557,080 | |
| Tsingtao Brewery Co., Ltd., Class H | | | | 16,000 | | | | | | | | | | 89,177 | |
| Yuexiu Transport Infrastructure Ltd. | | | | 104,000 | | | | | | | | | | 76,445 | |
| | | | | | | | | | | | | | | |
Total Common Stocks | | | | | | | | | | | | | | 8,862,795 | |
| | | | | | | | | | | | | | | |
| | | | | | | | | | | | | | | |
Total China (Cost $6,742,128) | | | | | | | | | | | | | | 8,862,795 | |
| | | | | | | | | | | | | | | |
| | | | | | | | | | | | | | | |
| Czech Republic - 2.25% | | | | | | | | | | | | | | | |
| Common Stocks - 2.25% | | | | | | | | | | | | | | | |
| CEZ A/S | | | | 22,189 | | | | | | | | | | 568,415 | |
| Komercni banka A/S | | | | 3,272 | | | | | | | | | | 150,279 | |
| Philip Morris CR A/S | | | | 163 | | | | | | | | | | 135,316 | |
| | | | | | | | | | | | | | | |
Total Common Stocks | | | | | | | | | | | | | | 854,010 | |
| | | | | | | | | | | | | | | |
| | | | | | | | | | | | | | | |
Total Czech Republic (Cost $591,138) | | | | | | | | | | | | | | 854,010 | |
| | | | | | | | | | | | | | | |
| | | | | | | | | | | | | | | |
| Egypt - 2.52% | | | | | | | | | | | | | | | |
| Common Stocks - 2.52% | | | | | | | | | | | | | | | |
| Commercial International Bank Egypt SAE | | | | 56,599 | | | | | | | | | | 250,048 | |
| Credit Agricole Egypt SAE | | | | 8,236 | | | | | | | | | | 20,753 | |
| Eastern Tobacco | | | | 14,398 | | | | | | | | | | 379,109 | |
| ElSewedy Electric Co. | | | | 3,695 | | | | | | | | | | 32,431 | |
| Faisal Islamic Bank of Egypt | | | | 40,070 | | | | | | | | | | 38,119 | |
| Global Telecom Holding SAEA | | | | 19,187 | | | | | | | | | | 7,410 | |
| MM Group for Industry & International Trade SAEA | | | | 57 | | | | | | | | | | 52 | |
| Telecom Egypt Co. | | | | 303,809 | | | | | | | | | | 228,803 | |
| | | | | | | | | | | | | | | |
Total Common Stocks | | | | | | | | | | | | | | 956,725 | |
| | | | | | | | | | | | | | | |
| | | | | | | | | | | | | | | |
Total Egypt (Cost $677,384) | | | | | | | | | | | | | | 956,725 | |
| | | | | | | | | | | | | | | |
| | | | | | | | | | | | | | | |
| Greece - 2.43% | | | | | | | | | | | | | | | |
| Common Stocks - 2.43% | | | | | | | | | | | | | | | |
| Aegean Airlines S.A. | | | | 14,980 | | | | | | | | | | 170,548 | |
| Hellenic Telecommunications Organization S.A. | | | | 32,907 | | | | | | | | | | 516,824 | |
| Holding Co. ADMIE IPTO S.A.A | | | | 36,607 | | | | | | | | | | 95,671 | |
| Sarantis S.A. | | | | 6,826 | | | | | | | | | | 127,546 | |
| Thessaloniki Water Supply & Sewage Co. S.A. | | | | 1,610 | | | | | | | | | | 10,154 | |
| | | | | | | | | | | | | | | |
Total Common Stocks | | | | | | | | | | | | | | 920,743 | |
| | | | | | | | | | | | | | | |
| | | | | | | | | | | | | | | |
Total Greece (Cost $626,993) | | | | | | | | | | | | | | 920,743 | |
| | | | | | | | | | | | | | | |
| | | | | | | | | | | | | | | |
| Hong Kong - 1.36% | | | | | | | | | | | | | | | |
| Common Stocks - 1.36% | | | | | | | | | | | | | | | |
| Goldlion Holdings Ltd. | | | | 46,000 | | | | | | | | | | 18,229 | |
| Hopewell Highway Infrastructure Ltd. | | | | 493,500 | | | | | | | | | | 302,813 | |
| Organic Tea Cosmetics Holdings Co., Ltd. | | | | 29,118 | | | | | | | | | | 91,075 | |
| Road King Infrastructure Ltd. | | | | 50,000 | | | | | | | | | | 102,906 | |
| | | | | | | | | | | | | | | |
Total Common Stocks | | | | | | | | | | | | | | 515,023 | |
| | | | | | | | | | | | | | | |
| | | | | | | | | | | | | | | |
Total Hong Kong (Cost $397,005) | | | | | | | | | | | | | | 515,023 | |
| | | | | | | | | | | | | | | |
See accompanying notes
13
American Beacon Acadian Emerging Markets Managed Volatility FundSM
Schedule of Investments
January 31, 2018
| | | | | | | | | | | | | | | |
| | | Shares | | | | Fair Value |
| | | | | | | | | | | | | | | |
| Hungary - 2.29% | | | | | | | | | | | | | | | |
| Common Stocks - 2.29% | | | | | | | | | | | | | | | |
| Magyar Telekom Telecommunications PLC | | | | 276,642 | | | | | | | | | $ | 516,780 | |
| MOL Hungarian Oil & Gas PLC | | | | 2,320 | | | | | | | | | | 28,342 | |
| Richter Gedeon Nyrt | | | | 12,160 | | | | | | | | | | 312,519 | |
| Zwack Unicum Rt | | | | 124 | | | | | | | | | | 8,779 | |
| | | | | | | | | | | | | | | |
Total Common Stocks | | | | | | | | | | | | | | 866,420 | |
| | | | | | | | | | | | | | | |
| | | | | | | | | | | | | | | |
Total Hungary (Cost $653,599) | | | | | | | | | | | | | | 866,420 | |
| | | | | | | | | | | | | | | |
| | | | | | | | | | | | | | | |
| India - 11.35% | | | | | | | | | | | | | | | |
| Common Stocks - 11.35% | | | | | | | | | | | | | | | |
| Gillette India Ltd. | | | | 1,887 | | | | | | | | | | 194,356 | |
| GlaxoSmithKline Consumer Healthcare Ltd. | | | | 1,538 | | | | | | | | | | 162,012 | |
| Hawkins Cookers Ltd. | | | | 381 | | | | | | | | | | 18,623 | |
| HCL Technologies Ltd. | | | | 25,858 | | | | | | | | | | 400,064 | |
| Hinduja Global Solutions Ltd. | | | | 4,072 | | | | | | | | | | 59,121 | |
| Hindustan Unilever Ltd. | | | | 25,395 | | | | | | | | | | 545,122 | |
| Infosys Ltd. | | | | 9,703 | | | | | | | | | | 175,300 | |
| Infosys Ltd., Sponsored ADR | | | | 13,317 | | | | | | | | | | 239,839 | |
| Maruti Suzuki India Ltd. | | | | 900 | | | | | | | | | | 134,426 | |
| Nestle India Ltd. | | | | 2,457 | | | | | | | | | | 288,178 | |
| Omaxe Ltd. | | | | 6,736 | | | | | | | | | | 24,210 | |
| Oracle Financial Services Software Ltd. | | | | 5,183 | | | | | | | | | | 340,624 | |
| Pfizer Ltd. | | | | 7,381 | | | | | | | | | | 269,460 | |
| Tata Consultancy Services Ltd. | | | | 11,495 | | | | | | | | | | 562,273 | |
| Vakrangee Ltd. | | | | 64,441 | | | | | | | | | | 369,551 | |
| Wipro Ltd. | | | | 87,362 | | | | | | | | | | 418,997 | |
| Wipro Ltd., ADRD | | | | 17,962 | | | | | | | | | | 98,611 | |
| | | | | | | | | | | | | | | |
Total Common Stocks | | | | | | | | | | | | | | 4,300,767 | |
| | | | | | | | | | | | | | | |
| | | | | | | | | | | | | | | |
Total India (Cost $3,355,482) | | | | | | | | | | | | | | 4,300,767 | |
| | | | | | | | | | | | | | | |
| | | | | | | | | | | | | | | |
| Indonesia - 3.93% | | | | | | | | | | | | | | | |
| Common Stocks - 3.93% | | | | | | | | | | | | | | | |
| Bank Central Asia Tbk PT | | | | 216,600 | | | | | | | | | | 367,646 | |
| Bank Rakyat Indonesia Persero Tbk PT | | | | 48,000 | | | | | | | | | | 13,265 | |
| Gudang Garam Tbk PT | | | | 600 | | | | | | | | | | 3,632 | |
| Hanjaya Mandala Sampoerna Tbk PT | | | | 349,500 | | | | | | | | | | 127,912 | |
| Indofood CBP Sukses Makmur Tbk PT | | | | 224,900 | | | | | | | | | | 146,563 | |
| Indofood Sukses Makmur Tbk PT | | | | 577,400 | | | | | | | | | | 334,231 | |
| Multipolar Technology Tbk PT | | | | 558,900 | | | | | | | | | | 26,299 | |
| Sampoerna Agro PT | | | | 71,400 | | | | | | | | | | 13,546 | |
| Telekomunikasi Indonesia Persero Tbk PT | | | | 75,300 | | | | | | | | | | 22,441 | |
| Unilever Indonesia Tbk PT | | | | 107,000 | | | | | | | | | | 434,761 | |
| | | | | | | | | | | | | | | |
Total Common Stocks | | | | | | | | | | | | | | 1,490,296 | |
| | | | | | | | | | | | | | | |
| | | | | | | | | | | | | | | |
Total Indonesia (Cost $1,366,971) | | | | | | | | | | | | | | 1,490,296 | |
| | | | | | | | | | | | | | | |
| | | | | | | | | | | | | | | |
| Malaysia - 5.11% | | | | | | | | | | | | | | | |
| Common Stocks - 5.11% | | | | | | | | | | | | | | | |
| Batu Kawan Bhd | | | | 2,800 | | | | | | | | | | 14,224 | |
| Fraser & Neave Holdings Bhd | | | | 35,800 | | | | | | | | | | 267,828 | |
| Kim Loong Resources Bhd | | | | 8,700 | | | | | | | | | | 9,330 | |
| Kuala Lumpur Kepong Bhd | | | | 6,300 | | | | | | | | | | 40,763 | |
| Maxis Bhd | | | | 3,200 | | | | | | | | | | 4,992 | |
| Nestle Malaysia Bhd | | | | 16,900 | | | | | | | | | | 491,250 | |
| Public Bank Bhd | | | | 102,600 | | | | | | | | | | 578,577 | |
| Tenaga Nasional Bhd | | | | 130,900 | | | | | | | | | | 529,947 | |
| | | | | | | | | | | | | | | |
Total Common Stocks | | | | | | | | | | | | | | 1,936,911 | |
| | | | | | | | | | | | | | | |
| | | | | | | | | | | | | | | |
Total Malaysia (Cost $1,477,486) | | | | | | | | | | | | | | 1,936,911 | |
| | | | | | | | | | | | | | | |
See accompanying notes
14
American Beacon Acadian Emerging Markets Managed Volatility FundSM
Schedule of Investments
January 31, 2018
| | | | | | | | | | | | | | | |
| | | Shares | | | | Fair Value |
| | | | | | | | | | | | | | | |
| Mexico - 0.90% | | | | | | | | | | | | | | | |
| Common Stocks - 0.90% | | | | | | | | | | | | | | | |
| Industrias Bachoco S.A.B. de C.V., Series B | | | | 17,308 | | | | | | | | | $ | 89,127 | |
| Megacable Holdings S.A.B. de C.V.E | | | | 53,113 | | | | | | | | | | 243,395 | |
| Pena Verde S.A.B | | | | 18,193 | | | | | | | | | | 9,941 | |
| | | | | | | | | | | | | | | |
Total Common Stocks | | | | | | | | | | | | | | 342,463 | |
| | | | | | | | | | | | | | | |
| | | | | | | | | | | | | | | |
Total Mexico (Cost $278,560) | | | | | | | | | | | | | | 342,463 | |
| | | | | | | | | | | | | | | |
| | | | | | | | | | | | | | | |
| Peru - 1.28% | | | | | | | | | | | | | | | |
| Common Stocks - 1.28% | | | | | | | | | | | | | | | |
| Alicorp S.A.A. | | | | 133,443 | | | | | | | | | | 463,067 | |
| Union de Cervecerias Peruanas Backus y Johnston S.A.A. | | | | 3,546 | | | | | | | | | | 20,398 | |
| | | | | | | | | | | | | | | |
Total Common Stocks | | | | | | | | | | | | | | 483,465 | |
| | | | | | | | | | | | | | | |
| | | | | | | | | | | | | | | |
Total Peru (Cost $351,043) | | | | | | | | | | | | | | 483,465 | |
| | | | | | | | | | | | | | | |
| | | | | | | | | | | | | | | |
| Philippines - 3.24% | | | | | | | | | | | | | | | |
| Common Stocks - 3.24% | | | | | | | | | | | | | | | |
| Aboitiz Power Corp. | | | | 228,600 | | | | | | | | | | 182,702 | |
| Asia United Bank Corp. | | | | 19,880 | | | | | | | | | | 23,058 | |
| Bank of the Philippine Islands | | | | 6,810 | | | | | | | | | | 15,824 | |
| Cebu Air, Inc. | | | | 48,130 | | | | | | | | | | 92,976 | |
| China Banking Corp. | | | | 51,412 | | | | | | | | | | 36,379 | |
| Cosco Capital, Inc. | | | | 261,300 | | | | | | | | | | 36,674 | |
| East West Banking Corp. | | | | 47,000 | | | | | | | | | | 26,477 | |
| Manila Electric Co. | | | | 81,090 | | | | | | | | | | 535,225 | |
| Pepsi-Cola Products Philippines, Inc. | | | | 40,900 | | | | | | | | | | 2,312 | |
| Pilipinas Shell Petroleum Corp. | | | | 5,480 | | | | | | | | | | 6,671 | |
| RFM Corp. | | | | 171,000 | | | | | | | | | | 16,067 | |
| San Miguel Corp. | | | | 50,960 | | | | | | | | | | 143,046 | |
| San Miguel Pure Foods Co., Inc. | | | | 4,590 | | | | | | | | | | 55,563 | |
| Top Frontier Investment Holdings, Inc.A | | | | 1,480 | | | | | | | | | | 8,107 | |
| Union Bank of the Philippines | | | | 25,780 | | | | | | | | | | 45,253 | |
| | | | | | | | | | | | | | | |
Total Common Stocks | | | | | | | | | | | | | | 1,226,334 | |
| | | | | | | | | | | | | | | |
| | | | | | | | | | | | | | | |
Total Philippines (Cost $1,141,542) | | | | | | | | | | | | | | 1,226,334 | |
| | | | | | | | | | | | | | | |
| | | | | | | | | | | | | | | |
| Poland - 0.32% | | | | | | | | | | | | | | | |
| Common Stocks - 0.32% | | | | | | | | | | | | | | | |
| Boryszew S.A.A | | | | 2,086 | | | | | | | | | | 6,011 | |
| Dom Development S.A. | | | | 1,421 | | | | | | | | | | 35,255 | |
| Netia S.A. | | | | 10,180 | | | | | | | | | | 16,098 | |
| Neuca S.A. | | | | 175 | | | | | | | | | | 14,098 | |
| Stalexport Autostrady S.A. | | | | 29,864 | | | | | | | | | | 39,903 | |
| Zespol Elektrocieplowni Wroclawskich Kogeneracja S.A. | | | | 433 | | | | | | | | | | 10,898 | |
| | | | | | | | | | | | | | | |
Total Common Stocks | | | | | | | | | | | | | | 122,263 | |
| | | | | | | | | | | | | | | |
| | | | | | | | | | | | | | | |
Total Poland (Cost $106,749) | | | | | | | | | | | | | | 122,263 | |
| | | | | | | | | | | | | | | |
| | | | | | | | | | | | | | | |
| Republic of Korea - 10.71% | | | | | | | | | | | | | | | |
| Common Stocks - 10.71% | | | | | | | | | | | | | | | |
| Aju Capital Co., Ltd. | | | | 1,109 | | | | | | | | | | 7,405 | |
| Busan City Gas Co., Ltd. | | | | 333 | | | | | | | | | | 11,694 | |
| Daeduck Electronics Co. | | | | 1,412 | | | | | | | | | | 12,747 | |
| Daesung Energy Co., Ltd. | | | | 8,294 | | | | | | | | | | 46,602 | |
| Daewoo Shipbuilding & Marine Engineering Co., Ltd. | | | | 5,019 | | | | | | | | | | 113,977 | |
| Dong-Il Corp. | | | | 3,523 | | | | | | | | | | 176,505 | |
| ESTec Corp. | | | | 5,543 | | | | | | | | | | 60,473 | |
See accompanying notes
15
American Beacon Acadian Emerging Markets Managed Volatility FundSM
Schedule of Investments
January 31, 2018
| | | | | | | | | | | | | | | |
| | | Shares | | | | Fair Value |
| | | | | | | | | | | | | | | |
| Republic of Korea - 10.71% (continued) | | | | | | | | | | | | | | | |
| Common Stocks - 10.71% (continued) | | | | | | | | | | | | | | | |
| Green Cross Corp. | | | | 278 | | | | | | | | | $ | 61,570 | |
| Incheon City Gas Co., Ltd. | | | | 1,136 | | | | | | | | | | 32,234 | |
| Industrial Bank of Korea | | | | 3,180 | | | | | | | | | | 49,583 | |
| Jinro Distillers Co., Ltd. | | | | 1,536 | | | | | | | | | | 47,611 | |
| JLS Co., Ltd. | | | | 5,512 | | | | | | | | | | 39,075 | |
| Kia Motors Corp. | | | | 10,960 | | | | | | | | | | 355,634 | |
| KT Corp. | | | | 16,598 | | | | | | | | | | 460,861 | |
| LF Corp. | | | | 13,905 | | | | | | | | | | 445,986 | |
| LG Electronics, Inc. | | | | 4,893 | | | | | | | | | | 469,666 | |
| LG Uplus Corp. | | | | 19,687 | | | | | | | | | | 263,636 | |
| Namyang Dairy Products Co., Ltd. | | | | 191 | | | | | | | | | | 125,026 | |
| Saeron Automotive Corp. | | | | 2,901 | | | | | | | | | | 19,777 | |
| Samsung Electronics Co., Ltd. | | | | 160 | | | | | | | | | | 373,835 | |
| Samwonsteel Co., Ltd. | | | | 2,041 | | | | | | | | | | 6,154 | |
| Samyang Tongsang Co., Ltd. | | | | 868 | | | | | | | | | | 36,131 | |
| SAVEZONE I&C Corp. | | | | 6,608 | | | | | | | | | | 30,012 | |
| SK Hynix, Inc. | | | | 2,342 | | | | | | | | | | 161,200 | |
| SK Telecom Co., Ltd. | | | | 1,981 | | | | | | | | | | 492,537 | |
| TS Corp. | | | | 1,139 | | | | | | | | | | 26,399 | |
| YESCO Co., Ltd. | | | | 3,120 | | | | | | | | | | 130,603 | |
| | | | | | | | | | | | | | | |
Total Common Stocks | | | | | | | | | | | | | | 4,056,933 | |
| | | | | | | | | | | | | | | |
| | | | | | | | | | | | | | | |
Total Republic of Korea (Cost $3,189,047) | | | | | | | | | | | | | | 4,056,933 | |
| | | | | | | | | | | | | | | |
| | | | | | | | | | | | | | | |
| Russia - 1.05% | | | | | | | | | | | | | | | |
| Common Stocks - 1.05% | | | | | | | | | | | | | | | |
| Gazprom Neft PJSC, Sponsored ADR | | | | 8,178 | | | | | | | | | | 202,406 | |
| Rostelecom PJSC, Sponsored ADR | | | | 28,013 | | | | | | | | | | 196,651 | |
| | | | | | | | | | | | | | | |
Total Common Stocks | | | | | | | | | | | | | | 399,057 | |
| | | | | | | | | | | | | | | |
| | | | | | | | | | | | | | | |
Total Russia (Cost $350,829) | | | | | | | | | | | | | | 399,057 | |
| | | | | | | | | | | | | | | |
| | | | | | | | | | | | | | | |
| South Africa - 3.89% | | | | | | | | | | | | | | | |
| Common Stocks - 3.73% | | | | | | | | | | | | | | | |
| Aspen Pharmacare Holdings Ltd. | | | | 1,686 | | | | | | | | | | 38,527 | |
| Bid Corp. Ltd. | | | | 9,144 | | | | | | | | | | 204,705 | |
| Clover Industries Ltd. | | | | 54,461 | | | | | | | | | | 68,914 | |
| Combined Motor Holdings Ltd. | | | | 3,475 | | | | | | | | | | 7,911 | |
| Mondi Ltd. | | | | 13,511 | | | | | | | | | | 360,807 | |
| Tongaat Hulett Ltd. | | | | 30,497 | | | | | | | | | | 295,825 | |
| Vodacom Group Ltd. | | | | 31,503 | | | | | | | | | | 434,799 | |
| | | | | | | | | | | | | | | |
| | | | | | | | | | | | | | | |
Total Common Stocks | | | | | | | | | | | | | | 1,411,488 | |
| | | | | | | | | | | | | | | |
| | | | | | | | | | | | | | | |
| Preferred Stocks - 0.16% | | | | | | | | | | | | | | | |
| Absa Bank Ltd.B | | | | 1,084 | | | | | | | | | | 62,041 | |
| | | | | | | | | | | | | | | |
| | | | | | | | | | | | | | | |
Total South Africa (Cost $1,354,697) | | | | | | | | | | | | | | 1,473,529 | |
| | | | | | | | | | | | | | | |
| | | | | | | | | | | | | | | |
| Taiwan - 9.32% | | | | | | | | | | | | | | | |
| Common Stocks - 9.32% | | | | | | | | | | | | | | | |
| 104 Corp. | | | | 4,000 | | | | | | | | | | 24,429 | |
| Aurora Corp. | | | | 29,000 | | | | | | | | | | 87,262 | |
| Chunghwa Telecom Co., Ltd. | | | | 142,000 | | | | | | | | | | 528,624 | |
| Far Eastern International Bank | | | | 1,082,204 | | | | | | | | | | 358,686 | |
| First Financial Holding Co., Ltd. | | | | 52,000 | | | | | | | | | | 35,951 | |
| Great Taipei Gas Co., Ltd. | | | | 46,000 | | | | | | | | | | 43,087 | |
| Greatek Electronics, Inc. | | | | 133,000 | | | | | | | | | | 258,740 | |
See accompanying notes
16
American Beacon Acadian Emerging Markets Managed Volatility FundSM
Schedule of Investments
January 31, 2018
| | | | | | | | | | | | | | | |
| | | Shares | | | | Fair Value |
| | | | | | | | | | | | | | | |
| Taiwan - 9.32% (continued) | | | | | | | | | | | | | | | |
| Common Stocks - 9.32% (continued) | | | | | | | | | | | | | | | |
| Hon Hai Precision Industry Co., Ltd. | | | | 111,288 | | | | | | | | | $ | 352,053 | |
| Lian HWA Food Corp. | | | | 3,080 | | | | | | | | | | 3,625 | |
| Microlife Corp. | | | | 9,000 | | | | | | | | | | 21,739 | |
| Shanghai Commercial & Savings Bank Ltd. | | | | 436,331 | | | | | | | | | | 501,521 | |
| Sysage Technology Co., Ltd. | | | | 19,000 | | | | | | | | | | 20,405 | |
| Taichung Commercial Bank Co., Ltd. | | | | 1,192,309 | | | | | | | | | | 413,179 | |
| Taiwan Business Bank | | | | 364,759 | | | | | | | | | | 108,131 | |
| Taiwan Cooperative Financial Holding Co., Ltd. | | | | 99,842 | | | | | | | | | | 59,435 | |
| Taiwan Secom Co., Ltd. | | | | 71,105 | | | | | | | | | | 219,813 | |
| Taiwan Semiconductor Manufacturing Co., Ltd. | | | | 10,000 | | | | | | | | | | 87,492 | |
| Taiwan Shin Kong Security Co., Ltd. | | | | 157,170 | | | | | | | | | | 208,963 | |
| Ttet Union Corp. | | | | 11,000 | | | | | | | | | | 34,420 | |
| Union Bank Of Taiwan | | | | 308,000 | | | | | | | | | | 100,604 | |
| United Microelectronics Corp. | | | | 49,000 | | | | | | | | | | 23,957 | |
| Ve Wong Corp. | | | | 44,000 | | | | | | | | | | 40,384 | |
| | | | | | | | | | | | | | | |
Total Common Stocks | | | | | | | | | | | | | | 3,532,500 | |
| | | | | | | | | | | | | | | |
| | | | | | | | | | | | | | | |
Total Taiwan (Cost $2,975,991) | | | | | | | | | | | | | | 3,532,500 | |
| | | | | | | | | | | | | | | |
| | | | | | | | | | | | | | | |
| Thailand - 4.73% | | | | | | | | | | | | | | | |
| Common Stocks - 4.73% | | | | | | | | | | | | | | | |
| Advanced Information Technology PCL | | | | 60,500 | | | | | | | | | | 60,365 | |
| Amata B.Grimm Power Plant Infrasture FundE | | | | 76,400 | | | | | | | | | | 21,710 | |
| Bangkok Bank PCL | | | | 15,400 | | | | | | | | | | 101,782 | |
| Bangkok Bank PCL, NVDR | | | | 21,200 | | | | | | | | | | 140,115 | |
| Bangkok Insurance PCL, NVDR | | | | 1,900 | | | | | | | | | | 23,659 | |
| Kang Yong Electric PCL, NVDR | | | | 100 | | | | | | | | | | 1,526 | |
| Kang Yong Electric PCL | | | | 2,100 | | | | | | | | | | 32,050 | |
| Krung Thai Bank PCL, NVDR | | | | 571,200 | | | | | | | | | | 364,751 | |
| MBK PCL, NVDR | | | | 41,200 | | | | | | | | | | 28,151 | |
| MK Restaurants Group PCL | | | | 54,900 | | | | | | | | | | 153,376 | |
| Ratchaburi Electricity Generating Holding PCL | | | | 103,400 | | | | | | | | | | 180,752 | |
| Ratchaburi Electricity Generating Holding PCL, NVDR | | | | 103,000 | | | | | | | | | | 180,053 | |
| Siam Cement PCL, NVDR | | | | 32,000 | | | | | | | | | | 502,682 | |
| Thai Vegetable Oil PCL, NVDR | | | | 1,000 | | | | | | | | | | 1,085 | |
| | | | | | | | | | | | | | | |
Total Common Stocks | | | | | | | | | | | | | | 1,792,057 | |
| | | | | | | | | | | | | | | |
| | | | | | | | | | | | | | | |
Total Thailand (Cost $1,478,248) | | | | | | | | | | | | | | 1,792,057 | |
| | | | | | | | | | | | | | | |
| | | | | | | | | | | | | | | |
| SHORT-TERM INVESTMENTS - 1.57% (Cost $594,472) | | | | | | | | | | | | | | | |
| Investment Companies - 1.57% | | | | | | | | | | | | | | | |
American Beacon U.S. Government Money Market Select Fund, Select Class, 1.25%F G | | | | 594,472 | | | | | | | | | | 594,472 | |
| | | | | | | | | | | | | | | |
| | | | | | | | | | | | | | | |
| SECURITIES LENDING COLLATERAL - 0.26% (Cost $98,112) | | | | | | | | | | | | | | | |
| Investment Companies - 0.26% | | | | | | | | | | | | | | | |
American Beacon U.S. Government Money Market Select Fund, Select Class, 1.25%F G | | | | 98,112 | | | | | | | | | | 98,112 | |
| | | | | | | | | | | | | | | |
| | | | | | | | | | | | | | | |
TOTAL INVESTMENTS - 98.84% (Cost $29,844,785) | | | | | | | | | | | | | | 37,453,851 | |
OTHER ASSETS, NET OF LIABILITIES - 1.16% | | | | | | | | | | | | | | 440,837 | |
| | | | | | | | | | | | | | | |
TOTAL NET ASSETS - 100.00% | | | | | | | | | | | | | $ | 37,894,688 | |
| | | | | | | | | | | | | | | |
| Percentages are stated as a percent of net assets. | | | | | | | | | | | | | | | |
A Non-income producing security.
B A type of Preferred Stock that has no maturity date.
C Fair valued pursuant to procedures approved by the Board of Trustees. At period end, the value of these securities amounted to $358 or 0.00% of net assets. Value was determined using significant unobservable inputs.
D All or a portion of this security is on loan at January 31, 2018.
See accompanying notes
17
American Beacon Acadian Emerging Markets Managed Volatility FundSM
Schedule of Investments
January 31, 2018
E Unit - Usually consists of one common stock and/or rights and warrants.
F The Fund is affiliated by having the same investment advisor.
G 7-day yield.
ADR - American Depositary Receipt.
NVDR - Non Voting Depositary Receipt.
PCL - Public Company Limited (Thailand).
PJSC - Private Joint Stock Company.
PLC - Public Limited Company.
| | | | | | | | | | | | | | | | |
| Futures Contracts Open on January 31, 2018: | | | | | | | | | | | | |
| | | | | |
| Long Futures | | | | | | | | | | | | | |
| | | | | |
| Equity Futures Contracts | | | | | | | | | | | | | |
| Description | | Number of
Contracts | | Expiration Date | | Notional Amount | | | Contract Value | | | Unrealized
Appreciation
(Depreciation) | |
| Mini MSCI Emerging Markets Index Futures | | 16 | | March 2018 | | $ | 992,854 | | | $ | 1,006,240 | | | $ | 13,386 | |
| | | | | | | | | | | | | | | | |
| | $ | 992,854 | | | $ | 1,006,240 | | | $ | 13,386 | |
| | | | | | | | | | | | | | | | |
| | |
| Index Abbreviations: |
| MSCI | | Morgan Stanley Capital International. |
The Fund’s investments are summarized by level based on the inputs used to determine their values. As of January 31, 2018, the investments were classified as described below:
| | | | | | | | | | | | | | | | | | | | | | | | | | | | |
Acadian Emerging Markets Managed Volatility Fund | | Level 1 | | | | | | Level 2 | | | | | | Level 3 | | | | | | Total | |
Assets | |
Foreign Common Stocks | |
Brazil | | $ | 1,325,839 | | | | | | | $ | - | | | | | | | $ | - | | | | | | | $ | 1,325,839 | |
Chile | | | 1,079,163 | | | | | | | | - | | | | | | | | - | | | | | | | | 1,079,163 | |
China | | | 8,862,437 | | | | | | | | | | | | | | | | 358 | | | | | | | | 8,862,795 | |
Czech Republic | | | 854,010 | | | | | | | | - | | | | | | | | - | | | | | | | | 854,010 | |
Egypt | | | 956,725 | | | | | | | | - | | | | | | | | - | | | | | | | | 956,725 | |
Greece | | | 920,743 | | | | | | | | - | | | | | | | | - | | | | | | | | 920,743 | |
Hong Kong | | | 515,023 | | | | | | | | - | | | | | | | | - | | | | | | | | 515,023 | |
Hungary | | | 866,420 | | | | | | | | - | | | | | | | | - | | | | | | | | 866,420 | |
India | | | 4,300,767 | | | | | | | | - | | | | | | | | - | | | | | | | | 4,300,767 | |
Indonesia | | | 1,490,296 | | | | | | | | - | | | | | | | | - | | | | | | | | 1,490,296 | |
Malaysia | | | 1,936,911 | | | | | | | | - | | | | | | | | - | | | | | | | | 1,936,911 | |
Mexico | | | 342,463 | | | | | | | | - | | | | | | | | - | | | | | | | | 342,463 | |
Peru | | | 483,465 | | | | | | | | - | | | | | | | | - | | | | | | | | 483,465 | |
Philippines | | | 1,226,334 | | | | | | | | - | | | | | | | | - | | | | | | | | 1,226,334 | |
Poland | | | 122,263 | | | | | | | | - | | | | | | | | - | | | | | | | | 122,263 | |
Republic of Korea | | | 4,056,933 | | | | | | | | - | | | | | | | | - | | | | | | | | 4,056,933 | |
Russia | | | 399,057 | | | | | | | | - | | | | | | | | - | | | | | | | | 399,057 | |
South Africa | | | 1,411,488 | | | | | | | | - | | | | | | | | - | | | | | | | | 1,411,488 | |
Taiwan | | | 3,532,500 | | | | | | | | - | | | | | | | | - | | | | | | | | 3,532,500 | |
Thailand | | | 1,263,732 | | | | | | | | 528,325 | | | | | | | | - | | | | | | | | 1,792,057 | |
Foreign Preferred Stocks | |
Brazil | | | 223,974 | | | | | | | | - | | | | | | | | - | | | | | | | | 223,974 | |
South Africa | | | 62,041 | | | | | | | | - | | | | | | | | - | | | | | | | | 62,041 | |
Short-Term Investments | | | 594,472 | | | | | | | | - | | | | | | | | - | | | | | | | | 594,472 | |
Securities Lending Collateral | | | 98,112 | | | | | | | | - | | | | | | | | - | | | | | | | | 98,112 | |
| | | | | | | | | | | | | | | | | | | | | | | | | | | | |
Total Investments in Securities - Assets | | $ | 36,925,168 | | | | | | | $ | 528,325 | | | | | | | $ | 358 | | | | | | | $ | 37,453,851 | |
| | | | | | | | | | | | | | | | | | | | | | | | | | | | |
|
Financial Derivative Instruments - Assets | |
Futures Contracts | | $ | 13,386 | | | | | | | $ | - | | | | | | | $ | - | | | | | | | $ | 13,386 | |
| | | | | | | | | | | | | | | | | | | | | | | | | | | | |
Total Financial Derivative Instruments - Assets | | $ | 13,386 | | | | | | | $ | - | | | | | | | $ | - | | | | | | | $ | 13,386 | |
| | | | | | | | | | | | | | | | | | | | | | | | | | | | |
See accompanying notes
18
American Beacon Acadian Emerging Markets Managed Volatility FundSM
Schedule of Investments
January 31, 2018
U.S. GAAP requires all transfers between any levels to be disclosed. The end of period timing recognition has been adopted for the transfers between levels of the Fund’s assets and liabilities. During the period ended January 31, 2018, there were no transfers between levels.
The following table is a reconciliation of Level 3 assets within the Fund for which significant unobservable inputs were used to determine fair value. Transfers in or out of Level 3 represent the ending value of any security or instrument where a change in the level has occurred from the beginning to the end of the period:
| | | | | | | | | | | | | | | | | | | | | | | | | | | | | | | | | | | | | | |
| Security Type | | Balance as
of
10/31/2017 | | Net
Purchases | | | Net
Sales | | | Accrued
Discounts
(Premiums) | | | Realized
Gain (Loss) | | | Change in
Unrealized
Appreciation
(Depreciation) | | | Transfer
into
Level 3 | | | Transfer
out of
Level 3 | | | Balance as
of
1/31/2018 | | | Change in
Unrealized
Appreciation
(Depreciation)
at Period end** | |
| Foreign Common Stocks | | $13,966 | | $ | - | | | $ | - | | | $ | - | | | $ | - | | | $ | (13,608 | ) | | $ | - | | | $ | - | | | $ | 358 | | | $ | 13,966 | |
| ** | Change in unrealized appreciation (depreciation) attributable to Level 3 securities held at period end. This balance is included in the change in unrealized appreciation (depreciation) on the Statements of Operations. |
The foreign common stock classified as Level 3 was fair valued at a nominal value of 0.10 Hong Kong Dollar (HKD) due to lack of observable inputs.
See accompanying notes
19
American Beacon SGA Global Growth FundSM
Schedule of Investments
January 31, 2018
| | | | | | | | | | | | | | | |
| | | Shares | | | | Fair Value |
| | | | | | | | | | | | | | | |
| Argentina - 1.93% (Cost $584,229) | | | | | | | | | | | | | | | |
| Common Stocks - 1.93% | | | | | | | | | | | | | | | |
| MercadoLibre, Inc. | | | | 2,349 | | | | | | | | | $ | 909,298 | |
| | | | | | | | | | | | | | | |
| | | | | | | | | | | | | | | |
| Australia - 1.94% (Cost $913,872) | | | | | | | | | | | | | | | |
| Common Stocks - 1.94% | | | | | | | | | | | | | | | |
| MYOB Group Ltd. | | | | 332,670 | | | | | | | | | | 914,103 | |
| | | | | | | | | | | | | | | |
| | | | | | | | | | | | | | | |
| China - 7.38% | | | | | | | | | | | | | | | |
| Common Stocks - 7.38% | | | | | | | | | | | | | | | |
| Ctrip.com International Ltd., ADRA | | | | 19,627 | | | | | | | | | | 918,151 | |
| New Oriental Education & Technology Group, Inc., Sponsored ADR | | | | 12,610 | | | | | | | | | | 1,161,255 | |
| Tencent Holdings Ltd. | | | | 23,486 | | | | | | | | | | 1,391,870 | |
| | | | | | | | | | | | | | | |
Total Common Stocks | | | | | | | | | | | | | | 3,471,276 | |
| | | | | | | | | | | | | | | |
| | | | | | | | | | | | | | | |
Total China (Cost $2,547,794) | | | | | | | | | | | | | | 3,471,276 | |
| | | | | | | | | | | | | | | |
| | | | | | | | | | | | | | | |
| Denmark - 3.31% (Cost $1,144,812) | | | | | | | | | | | | | | | |
| Common Stocks - 3.31% | | | | | | | | | | | | | | | |
| Novo Nordisk A/S, Class B | | | | 28,007 | | | | | | | | | | 1,557,684 | |
| | | | | | | | | | | | | | | |
| France - 2.93% (Cost $1,149,704) | | | | | | | | | | | | | | | |
| Common Stocks - 2.93% | | | | | | | | | | | | | | | |
| Danone S.A. | | | | 15,950 | | | | | | | | | | 1,375,497 | |
| | | | | | | | | | | | | | | |
| Germany - 3.86% (Cost $1,424,898) | | | | | | | | | | | | | | | |
| Common Stocks - 3.86% | | | | | | | | | | | | | | | |
| SAP SE, Sponsored ADR | | | | 16,023 | | | | | | | | | | 1,814,605 | |
| | | | | | | | | | | | | | | |
| Hong Kong - 3.94% (Cost $1,356,051) | | | | | | | | | | | | | | | |
| Common Stocks - 3.94% | | | | | | | | | | | | | | | |
| AIA Group Ltd. | | | | 216,163 | | | | | | | | | | 1,851,409 | |
| | | | | | | | | | | | | | | |
| India - 5.32% | | | | | | | | | | | | | | | |
| Common Stocks - 5.32% | | | | | | | | | | | | | | | |
| HDFC Bank Ltd., ADR | | | | 10,563 | | | | | | | | | | 1,147,036 | |
| Infosys Ltd., Sponsored ADR | | | | 75,221 | | | | | | | | | | 1,354,730 | |
| | | | | | | | | | | | | | | |
Total Common Stocks | | | | | | | | | | | | | | 2,501,766 | |
| | | | | | | | | | | | | | | |
| | | | | | | | | | | | | | | |
Total India (Cost $1,934,730) | | | | | | | | | | | | | | 2,501,766 | |
| | | | | | | | | | | | | | | |
| | | | | | | | | | | | | | | |
| Japan - 2.89% (Cost $1,030,573) | | | | | | | | | | | | | | | |
| Common Stocks - 2.89% | | | | | | | | | | | | | | | |
| Fast Retailing Co., Ltd. | | | | 3,048 | | | | | | | | | | 1,359,413 | |
| | | | | | | | | | | | | | | |
| Mexico - 1.85% (Cost $778,433) | | | | | | | | | | | | | | | |
| Common Stocks - 1.85% | | | | | | | | | | | | | | | |
| Fomento Economico Mexicano S.A.B. de C.V., Series B, Sponsored ADR | | | | 8,921 | | | | | | | | | | 870,154 | |
| | | | | | | | | | | | | | | |
| Republic of Korea - 1.97% (Cost $932,056) | | | | | | | | | | | | | | | |
| Common Stocks - 1.97% | | | | | | | | | | | | | | | |
| Amorepacific Corp. | | | | 3,298 | | | | | | | | | | 924,990 | |
| | | | | | | | | | | | | | | |
| South Africa - 4.80% | | | | | | | | | | | | | | | |
| Common Stocks - 4.80% | | | | | | | | | | | | | | | |
| Sanlam Ltd. | | | | 130,321 | | | | | | | | | | 970,291 | |
| Shoprite Holdings Ltd. | | | | 61,699 | | | | | | | | | | 1,285,152 | |
| | | | | | | | | | | | | | | |
Total Common Stocks | | | | | | | | | | | | | | 2,255,443 | |
| | | | | | | | | | | | | | | |
| | | | | | | | | | | | | | | |
Total South Africa (Cost $1,538,782) | | | | | | | | | | | | | | 2,255,443 | |
| | | | | | | | | | | | | | | |
See accompanying notes
20
American Beacon SGA Global Growth FundSM
Schedule of Investments
January 31, 2018
| | | | | | | | | | | | | | | |
| | | Shares | | | | Fair Value |
| | | | | | | | | | | | | | | |
| United States - 52.34% | | | | | | | | | | | | | | | |
| Common Stocks - 52.34% | | | | | | | | | | | | | | | |
| Alphabet, Inc., Class CA | | | | 1,174 | | | | | | | | | $ | 1,373,510 | |
| Amazon.com, Inc.A | | | | 985 | | | | | | | | | | 1,429,127 | |
| Autodesk, Inc.A | | | | 11,685 | | | | | | | | | | 1,351,020 | |
| Core Laboratories N.V.B | | | | 7,714 | | | | | | | | | | 881,710 | |
| Equinix, Inc., REIT | | | | 3,142 | | | | | | | | | | 1,430,207 | |
| FleetCor Technologies, Inc.A | | | | 6,500 | | | | | | | | | | 1,381,250 | |
| IHS Markit Ltd.A | | | | 28,560 | | | | | | | | | | 1,363,169 | |
| Lowe’s Cos, Inc. | | | | 12,731 | | | | | | | | | | 1,333,318 | |
| Mondelez International, Inc., Class A | | | | 31,097 | | | | | | | | | | 1,380,707 | |
| Nielsen Holdings PLC | | | | 25,204 | | | | | | | | | | 942,882 | |
| NIKE, Inc., Class B | | | | 20,304 | | | | | | | | | | 1,385,139 | |
| Priceline Group, Inc.A | | | | 470 | | | | | | | | | | 898,663 | |
| Red Hat, Inc.A | | | | 10,230 | | | | | | | | | | 1,344,017 | |
| Regeneron Pharmaceuticals, Inc.A | | | | 3,673 | | | | | | | | | | 1,346,705 | |
| salesforce.com, Inc.A | | | | 12,155 | | | | | | | | | | 1,384,576 | |
| Schlumberger Ltd. | | | | 17,928 | | | | | | | | | | 1,319,142 | |
| TJX Companies, Inc. | | | | 16,873 | | | | | | | | | | 1,355,239 | |
| Ulta Salon Cosmetics & Fragrance, Inc.A | | | | 4,032 | | | | | | | | | | 895,507 | |
| Visa, Inc., Class A | | | | 14,593 | | | | | | | | | | 1,812,888 | |
| | | | | | | | | | | | | | | |
Total Common Stocks | | | | | | | | | | | | | | 24,608,776 | |
| | | | | | | | | | | | | | | |
| | | | | | | | | | | | | | | |
Total United States (Cost $19,637,814) | | | | | | | | | | | | | | 24,608,776 | |
| | | | | | | | | | | | | | | |
| | | | | | | | | | | | | | | |
| SHORT-TERM INVESTMENTS - 5.34% (Cost $2,508,026) | | | | | | | | | | | | | | | |
| Investment Companies - 5.34% | | | | | | | | | | | | | | | |
American Beacon U.S. Government Money Market Select Fund, Select Class, 1.25%C D | | | | 2,508,026 | | | | | | | | | | 2,508,026 | |
| | | | | | | | | | | | | | | |
| | | | | | | | | | | | | | | |
| SECURITIES LENDING COLLATERAL - 1.85% (Cost $868,249) | | | | | | | | | | | | | | | |
| Investment Companies - 1.85% | | | | | | | | | | | | | | | |
American Beacon U.S. Government Money Market Select Fund, Select Class, 1.25%C D | | | | 868,249 | | | | | | | | | | 868,249 | |
| | | | | | | | | | | | | | | |
| | | | | | | | | | | | | | | |
TOTAL INVESTMENTS - 101.65% (Cost $38,350,023) | | | | | | | | | | | | | | 47,790,689 | |
LIABILITIES, NET OF OTHER ASSETS - (1.65%) | | | | | | | | | | | | | | (775,004 | ) |
| | | | | | | | | | | | | | | |
TOTAL NET ASSETS - 100.00% | | | | | | | | | | | | | $ | 47,015,685 | |
| | | | | | | | | | | | | | | |
| Percentages are stated as a percent of net assets. | | | | | | | | | | | | | | | |
A Non-income producing security.
B All or a portion of this security is on loan at January 31, 2018.
C The Fund is affiliated by having the same investment advisor.
D 7-day yield.
ADR - American Depositary Receipt.
PLC - Public Limited Company.
REIT - Real Estate Investment Trust.
| | | | | | | | | | | | | | | | |
| Futures Contracts Open on January 31, 2018: | |
| | | | | |
| Long Futures | | | | | | | | | | | | | |
| | | | | |
| Equity Futures Contracts | | | | | | | | | | | | | |
| Description | | Number of
Contracts | | Expiration Date | | Notional Amount | | | Contract Value | | | Unrealized
Appreciation
(Depreciation) | |
| Mini MSCI EAFE Index Futures | | 8 | | March 2018 | | $ | 858,477 | | | $ | 858,200 | | | $ | (277 | ) |
See accompanying notes
21
American Beacon SGA Global Growth FundSM
Schedule of Investments
January 31, 2018
| | | | | | | | | | | | | | | | |
| Description | | Number of
Contracts | | Expiration Date | | Notional Amount | | | Contract Value | | | Unrealized
Appreciation
(Depreciation) | |
| Mini MSCI Emerging Markets Index Futures | | 2 | | March 2018 | | $ | 124,524 | | | $ | 125,780 | | | $ | 1,256 | |
| S&P 500 E-Mini Index Futures | | 8 | | March 2018 | | | 1,115,346 | | | | 1,130,320 | | | | 14,974 | |
| | | | | | | | | | | | | | | | |
| | | | | | $ | 2,098,347 | | | $ | 2,114,300 | | | $ | 15,953 | |
| | | | | | | | | | | | | | | | |
| | |
| Index Abbreviations: | | |
| MSCI | | Morgan Stanley Capital International |
| MSCI EAFE | | Morgan Stanley Capital International—Europe, Australasia, and Far East |
| S&P 500 | | Standard & Poor’s U.S. Equity Large-Cap Index |
The Fund’s investments are summarized by level based on the inputs used to determine their values. As of January 31, 2018, the investments were classified as described below:
| | | | | | | | | | | | | | | | | | | | | | | | | | | | |
SGA Global Growth Fund | | Level 1 | | | | | | Level 2 | | | | | | Level 3 | | | | | | Total | |
Assets | | | | | | | | | | | | | | | | | | | | | | | | | | | | |
Foreign Common Stocks | | | | | | | | | | | | | | | | | | | | | | | | | | | | |
Argentina | | $ | 909,298 | | | | | | | $ | - | | | | | | | $ | - | | | | | | | $ | 909,298 | |
Australia | | | 914,103 | | | | | | | | - | | | | | | | | - | | | | | | | | 914,103 | |
China | | | 3,471,276 | | | | | | | | - | | | | | | | | - | | | | | | | | 3,471,276 | |
Denmark | | | 1,557,684 | | | | | | | | - | | | | | | | | - | | | | | | | | 1,557,684 | |
France | | | 1,375,497 | | | | | | | | - | | | | | | | | - | | | | | | | | 1,375,497 | |
Germany | | | 1,814,605 | | | | | | | | - | | | | | | | | - | | | | | | | | 1,814,605 | |
Hong Kong | | | 1,851,409 | | | | | | | | - | | | | | | | | - | | | | | | | | 1,851,409 | |
India | | | 2,501,766 | | | | | | | | - | | | | | | | | - | | | | | | | | 2,501,766 | |
Japan | | | 1,359,413 | | | | | | | | - | | | | | | | | - | | | | | | | | 1,359,413 | |
Mexico | | | 870,154 | | | | | | | | - | | | | | | | | - | | | | | | | | 870,154 | |
Republic of Korea | | | 924,990 | | | | | | | | - | | | | | | | | - | | | | | | | | 924,990 | |
South Africa | | | 2,255,443 | | | | | | | | - | | | | | | | | - | | | | | | | | 2,255,443 | |
Common Stocks | | | | | | | | | | | | | | | | | | | | | | | | | | | | |
United States | | | 24,608,776 | | | | | | | | - | | | | | | | | - | | | | | | | | 24,608,776 | |
Short-Term Investments | | | 2,508,026 | | | | | | | | - | | | | | | | | - | | | | | | | | 2,508,026 | |
Securities Lending Collateral | | | 868,249 | | | | | | | | - | | | | | | | | - | | | | | | | | 868,249 | |
| | | | | | | | | | | | | | | | | | | | | | | | | | | | |
Total Investments in Securities - Assets | | $ | 47,790,689 | | | | | | | $ | - | | | | | | | $ | - | | | | | | | $ | 47,790,689 | |
| | | | | | | | | | | | | | | | | | | | | | | | | | | | |
| | | | | | | |
Financial Derivative Instruments - Assets | | | | | | | | | | | | | | | | | | | | | | | | | | | | |
Futures Contracts | | $ | 16,230 | | | | | | | $ | - | | | | | | | $ | - | | | | | | | $ | 16,230 | |
| | | | | | | | | | | | | | | | | | | | | | | | | | | | |
Total Financial Derivative Instruments - Assets | | $ | 16,230 | | | | | | | $ | - | | | | | | | $ | - | | | | | | | $ | 16,230 | |
| | | | | | | | | | | | | | | | | | | | | | | | | | | | |
| | | | | | | |
Financial Derivative Instruments - Liabilities | | | | | | | | | | | | | | | | | | | | | | | | | | | | |
Futures Contracts | | $ | (277 | ) | | | | | | $ | - | | | | | | | $ | - | | | | | | | $ | (277 | ) |
| | | | | | | | | | | | | | | | | | | | | | | | | | | | |
Total Financial Derivative Instruments - Liabilities | | $ | (277 | ) | | | | | | $ | - | | | | | | | $ | - | | | | | | | $ | (277 | ) |
| | | | | | | | | | | | | | | | | | | | | | | | | | | | |
U.S. GAAP requires all transfers between any levels to be disclosed. The end of period timing recognition has been adopted for the transfers between levels of the Fund’s assets and liabilities. During the period ended January 31, 2018, there were no transfers between levels.
See accompanying notes
22
American Beacon FundsSM
Statements of Assets and Liabilities
January 31, 2018
| | | | | | | | | | | | |
| | | Acadian Emerging
Markets Managed
Volatility Fund | | | | | | SGA Global
Growth Fund | |
Assets: | | | | | | | | | | | | |
Investments in unaffiliated securities, at fair value† § | | $ | 36,761,267 | | | | | | | $ | 44,414,414 | |
Investments in affiliated securities, at fair value‡ | | | 692,584 | | | | | | | | 3,376,275 | |
Foreign currency, at fair value^ | | | 484,636 | | | | | | | | - | |
Deposit with brokers for futures contracts | | | 33,453 | | | | | | | | 50,255 | |
Dividends and interest receivable | | | 53,728 | | | | | | | | 11,592 | |
Receivable for investments sold | | | 8,909 | | | | | | | | 297,650 | |
Receivable for fund shares sold | | | 193,410 | | | | | | | | 322,413 | |
Receivable for tax reclaims | | | - | | | | | | | | 11,578 | |
Receivable for expense reimbursement (Note 2) | | | 42,742 | | | | | | | | 24,639 | |
Receivable for variation margin on open futures contracts (Note 5) | | | 13,456 | | | | | | | | 16,033 | |
Prepaid expenses | | | 31,039 | | | | | | | | 28,998 | |
| | | | | | | | | | | | |
Total assets | | | 38,315,224 | | | | | | | | 48,553,847 | |
| | | | | | | | | | | | |
Liabilities: | | | | | | | | | | | | |
Payable for investments purchased | | | - | | | | | | | | 539,872 | |
Payable for fund shares redeemed | | | 68,319 | | | | | | | | 18,595 | |
Payable upon return of securities loaned (Note 9)§ | | | 98,112 | | | | | | | | 868,249 | |
Management and sub-advisory fees payable (Note 2) | | | 44,864 | | | | | | | | 34,534 | |
Service fees payable (Note 2) | | | 1,529 | | | | | | | | 6,903 | |
Transfer agent fees payable (Note 2) | | | 3,260 | | | | | | | | 1,062 | |
Custody and fund accounting fees payable | | | 127,236 | | | | | | | | 21,340 | |
Professional fees payable | | | 69,750 | | | | | | | | 41,880 | |
Trustee fees payable (Note 2) | | | 118 | | | | | | | | 137 | |
Payable for prospectus and shareholder reports | | | 7,122 | | | | | | | | 3,861 | |
Other liabilities | | | 226 | | | | | | | | 1,729 | |
| | | | | | | | | | | | |
Total liabilities | | | 420,536 | | | | | | | | 1,538,162 | |
| | | | | | | | | | | | |
Net assets | | $ | 37,894,688 | | | | | | | $ | 47,015,685 | |
| | | | | | | | | | | | |
Analysis of net assets: | | | | | | | | | | | | |
Paid-in-capital | | $ | 29,585,401 | | | | | | | $ | 36,453,282 | |
Undistributed (overdistribution of) net investment income | | | (47,833 | ) | | | | | | | 1,012 | |
Accumulated net realized gain | | | 734,239 | | | | | | | | 1,104,776 | |
Unrealized appreciation of investments in unaffiliated securitiesA | | | 7,609,066 | | | | | | | | 9,440,666 | |
Unrealized appreciation (depreciation) of foreign currency transactions | | | 429 | | | | | | | | (4 | ) |
Unrealized appreciation of futures contracts | | | 13,386 | | | | | | | | 15,953 | |
| | | | | | | | | | | | |
Net assets | | $ | 37,894,688 | | | | | | | $ | 47,015,685 | |
| | | | | | | | | | | | |
Shares outstanding at no par value (unlimited shares authorized): | | | | | | | | | | | | |
Institutional Class | | | 484,528 | | | | | | | | 791,305 | |
| | | | | | | | | | | | |
Y Class | | | 2,371,738 | | | | | | | | 286,447 | |
| | | | | | | | | | | | |
Investor Class | | | 258,675 | | | | | | | | 986,089 | |
| | | | | | | | | | | | |
A Class | | | 72,646 | | | | | | | | 194,427 | |
| | | | | | | | | | | | |
C Class | | | 43,555 | | | | | | | | 108,288 | |
| | | | | | | | | | | | |
Net assets: | | | | | | | | | | | | |
Institutional Class | | $ | 5,706,260 | | | | | | | $ | 15,912,971 | |
| | | | | | | | | | | | |
Y Class | | $ | 27,820,209 | | | | | | | $ | 5,732,352 | |
| | | | | | | | | | | | |
Investor Class | | $ | 3,016,153 | | | | | | | $ | 19,473,640 | |
| | | | | | | | | | | | |
A Class | | $ | 849,017 | | | | | | | $ | 3,835,023 | |
| | | | | | | | | | | | |
C Class | | $ | 503,049 | | | | | | | $ | 2,061,699 | |
| | | | | | | | | | | | |
Net asset value, offering and redemption price per share: | | | | | | | | | | | | |
Institutional Class | | $ | 11.78 | | | | | | | $ | 20.11 | |
| | | | | | | | | | | | |
Y Class | | $ | 11.73 | | | | | | | $ | 20.01 | |
| | | | | | | | | | | | |
Investor Class | | $ | 11.66 | | | | | | | $ | 19.75 | |
| | | | | | | | | | | | |
A Class | | $ | 11.69 | | | | | | | $ | 19.72 | |
| | | | | | | | | | | | |
A Class (offering price) | | $ | 12.40 | | | | | | | $ | 20.92 | |
| | | | | | | | | | | | |
C Class | | $ | 11.55 | | | | | | | $ | 19.04 | |
| | | | | | | | | | | | |
| | | |
† Cost of investments in unaffiliated securities | | $ | 29,152,201 | | | | | | | $ | 34,973,748 | |
‡ Cost of investments in affiliated securities | | $ | 692,584 | | | | | | | $ | 3,376,275 | |
§ Fair value of securities on loan | | $ | 93,676 | | | | | | | $ | 837,476 | |
^ Cost of foreign currency | | $ | 484,725 | | | | | | | $ | - | |
A The Fund’s investments in affiliated securities did not have unrealized appreciation (depreciation) at year end. | | | | | |
See accompanying notes
23
American Beacon FundsSM
Statements of Operations
For the year ended January 31, 2018
| | | | | | | | | | | | |
| | | Acadian Emerging
Markets Managed
Volatility Fund | | | | | | SGA Global
Growth Fund | |
Investment income: | | | | | | | | | | | | |
Dividend income from unaffiliated securities (net of foreign taxes)† | | $ | 1,225,667 | | | | | | | $ | 333,524 | |
Dividend income from affiliated securities | | | 11,252 | | | | | | | | 16,786 | |
Income derived from securities lending (Note 9) | | | 345 | | | | | | | | 5,433 | |
| | | | | | | | | | | | |
Total investment income | | | 1,237,264 | | | | | | | | 355,743 | |
| | | | | | | | | | | | |
Expenses: | | | | | | | | | | | | |
Management and sub-advisory fees (Note 2) | | | 434,047 | | | | | | | | 270,441 | |
Transfer agent fees: | | | | | | | | | | | | |
Institutional Class (Note 2) | | | 4,557 | | | | | | | | 3,562 | |
Y Class (Note 2) | | | 22,958 | | | | | | | | 2,608 | |
Investor Class | | | 1,733 | | | | | | | | 1,959 | |
A Class | | | 59 | | | | | | | | 156 | |
C Class | | | 130 | | | | | | | | 116 | |
Custody and fund accounting fees | | | 163,826 | | | | | | | | 28,259 | |
Professional fees | | | 94,794 | | | | | | | | 51,885 | |
Registration fees and expenses | | | 63,447 | | | | | | | | 69,015 | |
Service fees (Note 2): | | | | | | | | | | | | |
Y Class | | | 4,194 | | | | | | | | 295 | |
Investor Class | | | 8,757 | | | | | | | | 37,941 | |
A Class | | | 895 | | | | | | | | 3,641 | |
C Class | | | 756 | | | | | | | | 1,807 | |
Distribution fees (Note 2): | | | | | | | | | | | | |
A Class | | | 1,491 | | | | | | | | 6,068 | |
C Class | | | 5,037 | | | | | | | | 12,048 | |
Prospectus and shareholder report expenses | | | 21,913 | | | | | | | | 14,893 | |
Trustee fees (Note 2) | | | 3,061 | | | | | | | | 2,052 | |
Other expenses | | | 9,475 | | | | | | | | 4,980 | |
| | | | | | | | | | | | |
Total expenses | | | 841,130 | | | | | | | | 511,726 | |
| | | | | | | | | | | | |
Net fees waived and expenses (reimbursed) (Note 2) | | | (207,848 | ) | | | | | | | (96,126 | ) |
| | | | | | | | | | | | |
Net expenses | | | 633,282 | | | | | | | | 415,600 | |
| | | | | | | | | | | | |
Net investment income (loss) | | | 603,982 | | | | | | | | (59,857 | ) |
| | | | | | | | | | | | |
| | | |
Realized and unrealized gain (loss) from investments: | | | | | | | | | | | | |
Net realized gain (loss) from‡: | | | | | | | | | | | | |
Investments in unaffiliated securitiesA | | | 5,416,569 | | | | | | | | 2,217,773 | |
Commission recapture (Note 1) | | | 399 | | | | | | | | - | |
Foreign currency transactions | | | (120,660 | ) | | | | | | | (12,509 | ) |
Futures contracts | | | 458,277 | | | | | | | | 372,753 | |
Change in net unrealized appreciation (depreciation) of: | | | | | | | | | | | | |
Investments in unaffiliated securitiesB | | | 3,644,684 | | | | | | | | 8,150,524 | |
Foreign currency transactions | | | 2,227,380 | | | | | | | | 86,317 | |
Futures contracts | | | (36,652 | ) | | | | | | | 26,768 | |
| | | | | | | | | | | | |
Net gain from investments | | | 11,589,997 | | | | | | | | 10,841,626 | |
| | | | | | | | | | | | |
Net increase in net assets resulting from operations | | $ | 12,193,979 | | | | | | | $ | 10,781,769 | |
| | | | | | | | | | | | |
| | | |
† Foreign taxes | | $ | 174,134 | | | | | | | $ | 20,182 | |
‡ Net of foreign withholding taxes on capital gains | | $ | 83,902 | | | | | | | $ | - | |
A The Fund did not recognize net realized gains (losses) from the sale of investments in affiliated securities. | |
B The Fund’s investments in affiliated securities did not have a change in unrealized appreciation (depreciation) at the year end. | |
See accompanying notes
24
American Beacon FundsSM
Statements of Changes in Net Assets
| | | | | | | | | | | | | | | | | | | | | | | | | | | | |
| | | Acadian Emerging Markets Managed
Volatility Fund | | | | | | SGA Global Growth Fund | |
| | | Year Ended
January 31, 2018 | | | | | | Year Ended
January 31, 2017 | | | | | | Year Ended
January 31, 2018 | | | | | | Year Ended
January 31, 2017 | |
Increase (decrease) in net assets: | | | | | | | | | | | | | | | | | | | | | | | | | | | | |
Operations: | | | | | | | | | | | | | | | | | | | | | | | | | | | | |
Net investment income (loss) | | $ | 603,982 | | | | | | | $ | 1,039,953 | | | | | | | $ | (59,857 | ) | | | | | | $ | (15,199 | ) |
Net realized gain (loss) from investments in unaffiliated securities, commission recapture, foreign currency transactions, and futures contracts | | | 5,754,585 | | | | | | | | (1,812,960 | ) | | | | | | | 2,578,017 | | | | | | | | 487,996 | |
Change in net unrealized appreciation of investments in unaffiliated securities, foreign currency transactions, and futures contracts | | | 5,835,412 | | | | | | | | 9,550,142 | | | | | | | | 8,263,609 | | | | | | | | 629,370 | |
| | | | | | | | | | | | | | | | | | | | | | | | | | | | |
Net increase in net assets resulting from operations | | | 12,193,979 | | | | | | | | 8,777,135 | | | | | | | | 10,781,769 | | | | | | | | 1,102,167 | |
| | | | | | | | | | | | | | | | | | | | | | | | | | | | |
Distributions to shareholders: | |
Net investment income: | | | | | | | | | | | | | | | | | | | | | | | | | | | | |
Institutional Class | | | (100,822 | ) | | | | | | | (862,939 | ) | | | | | | | – | | | | | | | | – | |
Y Class | | | (480,371 | ) | | | | | | | (596,064 | ) | | | | | | | – | | | | | | | | – | |
Investor Class | | | (69,880 | ) | | | | | | | (52,099 | ) | | | | | | | – | | | | | | | | – | |
A Class | | | (14,170 | ) | | | | | | | (7,642 | ) | | | | | | | – | | | | | | | | – | |
C Class | | | (5,253 | ) | | | | | | | (3,871 | ) | | | | | | | – | | | | | | | | – | |
Net realized gain from investments: | | | | | | | | | | | | | | | | | | | | | | | | | | | | |
Institutional Class | | | – | | | | | | | | – | | | | | | | | (465,632 | ) | | | | | | | (249,734 | ) |
Y Class | | | – | | | | | | | | – | | | | | | | | (142,594 | ) | | | | | | | (59,401 | ) |
Investor Class | | | – | | | | | | | | – | | | | | | | | (592,350 | ) | | | | | | | (317,163 | ) |
A Class | | | – | | | | | | | | – | | | | | | | | (116,358 | ) | | | | | | | (26,647 | ) |
C Class | | | – | | | | | | | | – | | | | | | | | (54,664 | ) | | | | | | | (30,843 | ) |
| | | | | | | | | | | | | | | | | | | | | | | | | | | | |
Net distributions to shareholders | | | (670,496 | ) | | | | | | | (1,522,615 | ) | | | | | | | (1,371,598 | ) | | | | | | | (683,788 | ) |
| | | | | | | | | | | | | | | | | | | | | | | | | | | | |
| | | | | | | |
Capital share transactions (Note 10): | | | | | | | | | | | | | | | | | | | | | | | | | | | | |
Proceeds from sales of shares | | | 9,494,062 | | | | | | | | 26,100,204 | | | | | | | | 18,350,384 | | | | | | | | 16,749,538 | |
Reinvestment of dividends and distributions | | | 655,131 | | | | | | | | 1,516,697 | | | | | | | | 1,357,278 | | | | | | | | 669,589 | |
Cost of shares redeemed | | | (73,592,119 | ) | | | | | | | (15,811,551 | ) | | | | | | | (4,938,231 | ) | | | | | | | (2,525,553 | ) |
Redemption fees | | | 1,444 | | | | | | | | – | | | | | | | | – | | | | | | | | – | |
| | | | | | | | | | | | | | | | | | | | | | | | | | | | |
Net increase (decrease) in net assets from capital share transactions | | | (63,441,482 | ) | | | | | | | 11,805,350 | | | | | | | | 14,769,431 | | | | | | | | 14,893,574 | |
| | | | | | | | | | | | | | | | | | | | | | | | | | | | |
Net increase (decrease) in net assets | | | (51,917,999 | ) | | | | | | | 19,059,870 | | | | | | | | 24,179,602 | | | | | | | | 15,311,953 | |
| | | | | | | | | | | | | | | | | | | | | | | | | | | | |
Net assets: | | | | | | | | | | | | | | | | | | | | | | | | | | | | |
Beginning of period | | | 89,812,687 | | | | | | | | 70,752,817 | | | | | | | | 22,836,083 | | | | | | | | 7,524,130 | |
| | | | | | | | | | | | | | | | | | | | | | | | | | | | |
End of period* | | $ | 37,894,688 | | | | | | | $ | 89,812,687 | | | | | | | $ | 47,015,685 | | | | | | | $ | 22,836,083 | |
| | | | | | | | | | | | | | | | | | | | | | | | | | | | |
*Includes undistributed (overdistribution of) net investment income | | $ | (47,833 | ) | | | | | | $ | (469,952 | ) | | | | | | $ | 1,012 | | | | | | | $ | (1,910 | ) |
| | | | | | | | | | | | | | | | | | | | | | | | | | | | |
See accompanying notes
25
American Beacon FundsSM
Notes to Financial Statements
January 31, 2018
1. Organization and Significant Accounting Policies
American Beacon Funds (the “Trust”), is organized as a Massachusetts business trust. The Funds, each a series within the Trust, are registered under the Investment Company Act of 1940 (the “Act”), as amended, as diversified, open-end management investment companies. As of January 31, 2018, the Trust consists of thirty-three active series, two of which are presented in this filing: American Beacon Acadian Emerging Markets Managed Volatility Fund and American Beacon SGA Global Growth Fund (collectively, the “Funds” and each individually a “Fund”). The remaining thirty-one active series are reported in separate filings. Prior to August 24, 2017, the American Beacon SGA Global Growth Fund was registered under the Act as a non-diversified, open-end management investment company.
American Beacon Advisors, Inc. (the “Manager”) is a wholly-owned subsidiary of Resolute Investment Managers, Inc., which is indirectly owned by investment funds affiliated with Kelso & Company, L.P. and Estancia Capital Management, LLC, and was organized in 1986 to provide business management, advisory, administrative, and asset management consulting services to the Trust and other investors.
Class Disclosure
Each Fund has multiple classes of shares designed to meet the needs of different groups of investors. The following table sets forth the differences amongst the classes:
| | | | | | |
Class | | Eligible Investors | | Minimum Initial
Investments | |
| Institutional | | Large institutional investors - sold directly or through intermediary channels. | | $ | 250,000 | |
| Y Class | | Large institutional retirement plan investors - sold directly or through intermediary channels. | | $ | 100,000 | |
| Investor | | All investors using intermediary organizations, such as broker-dealers or retirement plan sponsors. | | $ | 2,500 | |
| A Class | | All investors who invest through intermediary organizations, such as broker-dealers or third party administrator. Retail investors who invest directly through a financial intermediary such as a broker, bank, or registered investment advisor which may include a front-end sales charge and a contingent deferred sales charge (“CDSC”). | | $ | 2,500 | |
| C Class | | Retail investors who invest directly through a financial intermediary such as a broker or through employee directed benefit plans with applicable sales charges which may include CDSC. | | $ | 1,000 | |
Each class offered by the Trust has equal rights as to assets and voting privileges. Income and non-class specific expenses are allocated daily to each class on the basis of the relative net assets. Realized and unrealized capital gains and losses of each class are allocated daily based on the relative net assets of each class of the respective Fund. Class specific expenses, where applicable, currently include service, distribution, transfer agent fees, and sub-transfer agent fees that vary amongst the classes as described more fully in Note 2.
Recently Adopted Accounting Pronouncements
In October 2016, the SEC adopted amendments to rules under the Investment Company Act of 1940 (“final rules”) intended to modernize the reporting and disclosure of information by registered investment companies. The final rules amend Regulation S-X and require funds to provide standardized, enhanced derivative disclosure in fund financial statements in a format designed for individual investors. The amendments to Regulation S-X also update the disclosures for other investments and investments in and advances to affiliates and amend the rules regarding the general form and content of fund financial statements. The compliance date for the amendments to Regulation S-X is August 1, 2017, and has been adopted accordingly.
Significant Accounting Policies
The following is a summary of significant accounting policies, consistently followed by the Funds in preparation of the financial statements. The Funds are considered investment companies and accordingly, follow
26
American Beacon FundsSM
Notes to Financial Statements
January 31, 2018
the investment company accounting and reporting guidance of the Financial Accounting Standards Board Accounting Standard Codification Topic 946, Financial Services – Investment Companies, a part of Generally Accepted Accounting Principles (“U.S. GAAP”).
Security Transactions and Investment Income
Security transactions are recorded on the trade date of the security purchase or sale. The Funds may purchase securities with delivery or payment to occur at a later date. At the time the Funds enter into a commitment to purchase a security, the transaction is recorded, and the value of the security is reflected in the Net Asset Value (“NAV”). The value of the security may vary with market fluctuations.
Dividend income, net of foreign taxes, is recorded on the ex-dividend date, except certain dividends from foreign securities which are recorded as soon as the information is available to the Funds. Interest income is earned from settlement date, recorded on the accrual basis, and adjusted, if necessary, for accretion of discounts and amortization of premiums. For financial and tax reporting purposes, realized gains and losses are determined on the basis of specific lot identification.
Commission Recapture
The Fund has established brokerage commission recapture arrangements with certain brokers or dealers. If a Funds’ investment advisor chooses to execute a transaction through a participating broker, the broker rebates a portion of the commission back to the Funds. Any collateral benefit received through participation in the commission recapture program is directed exclusively to the Funds. This amount is reported with the net realized gain in the Funds’ Statement of Operations, if applicable.
Currency Translation
All assets and liabilities initially expressed in foreign currency values are converted into U.S. dollar values at the mean of the bid and ask prices of such currencies against U.S. dollars as last quoted by a recognized dealer. Income, expenses, and purchases and sales of investments are translated into U.S. dollars at the rate of the exchange prevailing on the respective dates of such transactions. The effect of changes in foreign currency exchange rates on investments is separately identified from the fluctuations arising from changes in market values of securities held and is reported with all other foreign currency gains and losses on the Funds’ Statements of Operations.
Distributions to Shareholders
Distributions, if any, of net investment income are generally paid at least annually and recorded on the ex-dividend date. Distributions, if any, of net realized capital gains are generally paid at least annually and recorded on the ex-dividend date. Dividends to shareholders are determined in accordance with federal income tax regulations, which may differ in amount and character from net investment income and realized gains recognized for purposes of U.S. GAAP. To the extent necessary to fully distribute capital gains, the Funds may designate earnings and profits distributed to shareholders on the redemption of shares.
Allocation of Income, Trust Expenses, Gains, and Losses
Investment income, realized and unrealized gains and losses from investments of the Funds are allocated daily to each class of shares based upon the relative proportion of net assets of each class to the total net assets of the Funds. Expenses directly charged or attributable to any Fund will be paid from the assets of the Fund. Generally, expenses of the Trust will be allocated among and charged to the assets of the Funds on a basis that the Trust’s Board of Trustees (the “Board”) deems fair and equitable, which may be based on the relative net assets of the Funds or nature of the services performed and relative applicability to the Funds.
27
American Beacon FundsSM
Notes to Financial Statements
January 31, 2018
Use of Estimates
The preparation of financial statements in conformity with U.S. GAAP requires management to make estimates and assumptions that affect the amounts reported in the financial statements and accompanying notes. Actual results may differ from those estimated.
Redemption Fees
All Classes of the Acadian Emerging Markets Managed Volatility Fund impose a 2% redemption fee on shares held for less than 90 days. The fee is deducted from the redemption proceeds and is intended to offset the trading costs, market impact, and other costs associated with short-term trading activity in the Fund. The “first-in, first-out” method is used to determine the holding period. The fee is allocated to all classes of this Fund pro-rata based on the net assets.
Other
Under the Trust’s organizational documents, its officers and trustees are indemnified against certain liabilities arising out of the performance of their duties to the Trust. In the normal course of business, the Trust enters into contracts that provide indemnification to the other party or parties against potential costs or liabilities. The Trust’s maximum exposure under these arrangements is dependent on claims that may be made in the future and, therefore, cannot be estimated. The Trust has had no prior claims or losses pursuant to any such agreement.
2. Transactions with Affiliates
Management and Investment Sub-Advisory Agreements
The Funds and the Manager are parties to a Management Agreement that obligates the Manager to provide the Funds with investment advisory and administrative services. As compensation for performing the duties under the Management Agreement, the Manager will receive an annualized management fee based on a percentage of each Fund’s average daily net assets that is calculated and accrued daily according to the following schedule:
| | | | |
First $5 billion | | | 0.35 | % |
Next $5 billion | | | 0.325 | % |
Next $10 billion | | | 0.30 | % |
Over $20 billion | | | 0.275 | % |
The Trust, on behalf of the Funds, and the Manager have entered into an Investment Advisory Agreement with Acadian Asset Management LLC and Sustainable Growth Advisers, LP (“SGA”) (the “Sub-Advisors”) pursuant to which the Funds have agreed to pay an annualized sub-advisory fee that is calculated and accrued daily based on the Funds’ average daily net assets according to the following schedules:
Acadian Asset Management LLC
| | | | |
First $500 million | | | 0.65 | % |
Over $500 million | | | 0.60 | % |
Sustainable Growth Advisers, LP
| | | | |
First $100 million | | | 0.45 | % |
Next $900 million | | | 0.40 | % |
Over $1 billion | | | 0.35 | % |
28
American Beacon FundsSM
Notes to Financial Statements
January 31, 2018
The Management and Sub-Advisory Fees paid by the Funds for the year ended January 31, 2018 were as follows:
Acadian Emerging Markets Managed Volatility Fund
| | | | | | | | | | | | |
| | | Effective Fee Rate | | | | | | Amount of Fees Paid | |
Management Fees | | | 0.35 | % | | | | | | $ | 151,941 | |
Sub-Advisor Fees | | | 0.65 | % | | | | | | | 282,106 | |
| | | | | | | | | | | | |
Total | | | 1.00 | % | | | | | | $ | 434,047 | |
| | | | | | | | | | | | |
SGA Global Growth Fund
| | | | | | | | | | | | |
| | | Effective Fee Rate | | | | | | Amount of Fees Paid | |
Management Fees | | | 0.35 | % | | | | | | $ | 118,658 | |
Sub-Advisor Fees | | | 0.45 | % | | | | | | | 151,783 | |
| | | | | | | | | | | | |
Total | | | 0.80 | % | | | | | | $ | 270,441 | |
| | | | | | | | | | | | |
As compensation for services provided by the Manager in connection with securities lending activities conducted by the Funds, the lending Funds pay to the Manager, with respect to cash collateral posted by borrowers, a fee up to 10% of the net monthly interest income (the gross interest income earned by the investment of cash collateral, less the amount paid to borrowers and related expenses) from such activities and, with respect to loan fees paid by borrowers, a fee up to 10% of such loan fees. These fees are included in “Income derived from securities lending” and “Management and investment advisory fees” on the Statements of Operations. During the year ended January 31, 2018, the Manager received securities lending fees of $40 and $620 for the securities lending activities of the American Beacon Acadian Emerging Markets Managed Volatility Fund and American Beacon SGA Global Growth Fund, respectively.
Distribution Plans
The Funds, except for the A and C Classes, have adopted a “defensive” Distribution Plan (the “Plan”) in accordance with Rule 12b-1 under the Act, pursuant to which no separate fees may be charged to the Funds for distribution purposes. However, the Plan authorizes the management fee received by the Manager and the investment advisors hired by the Manager to be used for distribution purposes. Under this Plan, the Funds do not intend to compensate the Manager or any other party, either directly or indirectly, for the distribution of Fund shares.
Separate Distribution Plans (the “Distribution Plans”) have been adopted pursuant to Rule 12b-1 under the Act for the A and C Classes of the Funds. Under the Distribution Plans, as compensation for distribution assistance, the Manager receives an annual fee of 0.25% of the average daily net assets of the A Class and 1.00% of the average daily net assets of the C Class. The fee will be payable without regard to whether the amount of the fee is more or less than the actual expenses incurred in a particular month by the Manager for distribution assistance.
Service Plans
The Manager and the Trust entered into Service Plans that obligate the Manager to oversee additional shareholder servicing of the Y, Investor, A, and C Classes of the Funds. As compensation for performing the duties required under the Service Plans, the Manager receives an annualized fee up to 0.10% of the average daily net assets of the Y Class, up to 0.25% of the average daily net assets of the A and C Classes, and up to 0.375% of the average daily net assets of the Investor Class of the Funds. Effective April 1, 2017, the Funds terminated the Service Plan for the Y Class.
29
American Beacon FundsSM
Notes to Financial Statements
January 31, 2018
Sub-Transfer Agent Fees
The Manager has entered into agreements, which include servicing agreements, with financial intermediaries that provide recordkeeping, processing, shareholder communications and other services to customers of the intermediaries that hold positions in the Institutional Class of the Funds and has agreed to compensate the intermediaries for providing these services. Effective April 1, 2017, the Funds agreed to compensate the intermediaries for providing services to the Y Class. Intermediaries transact with the Funds primarily through the use of omnibus accounts on behalf of their customers who hold positions in the Funds. Certain services would have been provided by the Fund’s transfer agent and other service providers if the shareholders’ accounts were maintained directly by the Fund’s transfer agent. Accordingly, the Funds, pursuant to Board approval, has agreed to reimburse the Manager for certain non-distribution shareholder services provided by financial intermediaries for the Institutional and Y Classes. The reimbursement amounts (sub-transfer agent fees) paid to the Manager are subject to a fee limit of up to 0.10% of an intermediary’s average net assets in the Institutional and Y Classes on an annual basis. During the year ended January 31, 2018, the sub-transfer agent fees, as reflected in “Transfer agent fees” on the Statements of Operations, were as follows:
| | | | |
Fund | | Sub-Transfer Agent Fees | |
Acadian Emerging Markets Managed Volatility | | $ | 25,294 | |
SGA Global Growth | | | 4,766 | |
As of January 31, 2018, the Funds owed the Manager the following reimbursement of sub-transfer agent fees, as reflected in “Transfer agent fees payable” on the Statements of Assets and Liabilities:
| | | | |
Fund | | Reimbursement Sub-Transfer
Agent Fees | |
Acadian Emerging Markets Managed Volatility | | $ | 2,675 | |
SGA Global Growth | | | 472 | |
Investments in Affiliated Funds
The Funds may invest in the American Beacon U.S. Government Money Market Select Fund (the “USG Select Fund”). Cash collateral received by the Funds in connection with securities lending may also be invested in the USG Select Fund. The Funds and the USG Select Fund have the same investment advisor and therefore, are considered to be affiliated. The Manager serves as investment advisor to the USG Select Fund and receives management fees and administrative fees totaling 0.10% of the average daily net assets of the USG Select Fund. During the year ended January 31, 2018, the Manager earned fees on the Funds’ direct and indirect investments in the USG Select Fund as shown below:
| | | | | | | | | | | | |
Fund | | Direct Investments in
USG Select Fund | | | Securities Lending
Collateral in USG
Select Fund | | | Total | |
Acadian Emerging Markets Managed Volatility | | $ | 1,468 | | | $ | 84 | | | $ | 1,552 | |
SGA Global Growth | | | 1,889 | | | | 763 | | | | 2,652 | |
Interfund Credit Facility
Pursuant to an exemptive order issued by the Securities and Exchange Commission (“SEC”), the Funds, along with other registered investment companies having management contracts with the Manager, may participate in a credit facility whereby each Fund, under certain conditions, is permitted to lend money directly to and borrow directly from other participating Funds for temporary purposes. The interfund credit facility is advantageous to the Funds because it provides added liquidity, and eliminates the need to maintain higher cash balances to meet redemptions. This situation could arise when shareholder redemptions exceed anticipated volumes and certain funds have insufficient cash on hand to satisfy such redemptions or when sales of securities do not settle as
30
American Beacon FundsSM
Notes to Financial Statements
January 31, 2018
expected, resulting in a cash shortfall for a fund. When a Fund liquidates portfolio securities to meet redemption requests, they often do not receive payment in settlement for up to two days (or longer for certain foreign transactions). Redemption requests normally are satisfied on the next business day. The credit facility provides a source of immediate, short-term liquidity pending settlement of the sale of portfolio securities. The credit facility is administered by a credit facility team consisting of professionals from the Manager’s asset management, compliance, and accounting areas who report the activities of the credit facility to the Board. During the year ended January 31, 2018, the Acadian Emerging Markets Managed Volatility Fund borrowed on average $1,923,764 for 13 days at an average interest rate of 1.56% with interest charges of $956. During the year ended January 31, 2018, the SGA Global Growth Fund did not utilize the credit facility. These amounts are recorded within “Other expenses” on the accompanying Statements of Operations.
Expense Reimbursement Plan
The Manager contractually agreed to reduce fees and/or reimburse expenses for the classes of the Funds to the extent that total operating expenses exceed the Funds’ expense cap. During the year ended January 31, 2018, the Manager waived and/or reimbursed expenses as follows:
| | | | | | | | | | | | | | | | | | |
| | | | | Expense Cap | | | | | | | | | Expiration of
Reimbursed
Expenses | |
Fund | | Class | | 2/1/2017 -
1/31/2018 | | | Reimbursed
Expenses | | | (Recouped)
Expenses | | |
Acadian Emerging Markets Managed Volatility | | Institutional | | | 1.35 | % | | $ | 64,231 | | | $ | – | | | | 2021 | |
Acadian Emerging Markets Managed Volatility | | Y | | | 1.45 | % | | | 124,467 | | | | – | | | | 2021 | |
Acadian Emerging Markets Managed Volatility | | Investor | | | 1.73 | % | | | 13,684 | | | | – | | | | 2021 | |
Acadian Emerging Markets Managed Volatility | | A | | | 1.75 | % | | | 2,943 | | | | – | | | | 2021 | |
Acadian Emerging Markets Managed Volatility | | C | | | 2.50 | % | | | 2,523 | | | | – | | | | 2021 | |
SGA Global Growth | | Institutional | | | 0.98 | % | | | 41,851 | | | | – | | | | 2021 | |
SGA Global Growth | | Y | | | 1.08 | % | | | 10,332 | | | | – | | | | 2021 | |
SGA Global Growth | | Investor | | | 1.36 | % | | | 31,684 | | | | – | | | | 2021 | |
SGA Global Growth | | A | | | 1.38 | % | | | 8,153 | | | | – | | | | 2021 | |
SGA Global Growth | | C | | | 2.13 | % | | | 4,106 | | | | – | | | | 2021 | |
Of these amounts, $42,742 and $24,639 were disclosed as a receivable from the Manager on the Statements of Assets and Liabilities at January 31, 2018 for the Acadian Emerging Markets Managed Volatility Fund and SGA Global Growth Fund, respectively. The Funds have adopted an Expense Reimbursement Plan whereby the Manager may seek repayment of such fee reductions and expense reimbursements. Under the policy, the Manager can be reimbursed by the Funds for any contractual or voluntary fee reductions or expense reimbursements if reimbursement to the Manager (a) occurs within three years after the Manager’s own waiver or reimbursement and (b) does not cause the Funds’ annual operating expenses to exceed the lesser of the contractual percentage limit in effect at the time of the waiver/reimbursement or time of recoupment. The reimbursed expenses listed above will expire in 2021. The Funds did not record a liability for potential reimbursements due to the current assessment that reimbursements are unlikely. The carryover of excess expenses potentially reimbursable to the Manager are as follows:
| | | | | | | | | | | | | | | | |
Fund | | Recouped
Expenses | | | Excess Expense
Carryover | | | Expired Expense
Carryover | | | Expiration of
Reimbursed
Expenses | |
Acadian Emerging Markets Managed Volatility | | $ | – | | | $ | 120,326 | | | $ | – | | | | 2019 | |
Acadian Emerging Markets Managed Volatility | | | – | | | | 93,050 | | | | – | | | | 2020 | |
SGA Global Growth | | | – | | | | 118,368 | | | | – | | | | 2019 | |
SGA Global Growth | | | – | | | | 123,518 | | | | – | | | | 2020 | |
31
American Beacon FundsSM
Notes to Financial Statements
January 31, 2018
Sales Commissions
The Funds’ distributor, Foreside Fund Services, LLC (“Foreside”), may receive a portion of A Class sales charges from broker dealers and it may be used to offset distribution related expenses. During the year ended January 31, 2018, Foreside collected $390 and $3,009 for Acadian Emerging Markets Managed Volatility Fund and SGA Global Growth Fund, respectively, from the sale of Class A Shares.
A CDSC of 0.50% will be deducted with respect to Class A Shares on certain purchases of $1,000,000 or more that are redeemed in whole or part within 18 months of purchase, unless waived as discussed in the Funds’ Prospectus. Any applicable CDSC will be 0.50% of the lesser of the original purchase price or the value of the redemption of the Class A Shares redeemed. During the year ended January 31, 2018, there were no CDSC fees collected for Class A Shares of the Funds.
A CDSC of 1.00% will be deducted with respect to Class C Shares redeemed within 12 months of purchase, unless waived as discussed in the Funds’ Prospectus. Any applicable CDSC will be 1.00% of the lesser of the original purchase price or the value of the redemption of the Class C Shares redeemed. During the year ended January 31, 2018, CDSC fees of $3 and $189 were collected for Class C Shares of the Acadian Emerging Markets Managed Volatility Fund and SGA Global Growth Fund, respectively.
Trustee Fees and Expenses
As compensation for their service to the Trust, the American Beacon Select Funds and the American Beacon Institutional Funds Trust, each Trustee receives an annual retainer of $120,000, plus $10,000 for each Board meeting attended in person or via teleconference, $2,500 for attendance by Committee members at meetings of the Audit Committee and the Investment Committee, and $1,500 for attendance by Committee members at meetings of the Nominating and Governance Committee, plus reimbursement of reasonable expenses incurred in attending Board meetings, Committee meetings, and relevant educational seminars. The Trustees also may be compensated for attendance at special Board and/or Committee meetings from time to time. The Board Chairman receives an additional annual retainer of $50,000 as well as a $2,500 fee each quarter for his attendance at the committee meetings. Effective January 1, 2018, the Board Vice Chair receives an additional annual retainer of $10,000. The Chairpersons of the Audit Committee and the Investment Committee each receive an additional annual retainer of $25,000 and the Chairman of the Nominating and Governance Committee receives an additional annual retainer of $10,000. These expenses are allocated on a prorated basis to each Fund of the Trusts according to its respective net assets.
3. Security Valuation and Fair Value Measurements
Investments are valued at the close of the New York Stock Exchange (the “Exchange”), normally at 4:00 p.m. Eastern Time, each day that the Exchange is open for business. Equity securities, including exchange-traded funds (“ETFs”) for which market quotations are available are valued at the last sale price or official closing price (closing bid price or last evaluated quote if no sale has occurred) on the primary market or exchange on which they trade.
Investments in open-end mutual funds are valued at the closing NAV per share of the mutual fund on the day of valuation.
Securities for which the market prices are not readily available or are not reflective of the fair value of the security, as determined by the Manager, will be priced at fair value following procedures approved by the Board.
Futures contracts are valued based upon their quoted daily settlement prices. Upon entering into a futures contract, the Funds are required to deposit with their futures broker, an amount of cash or U.S. Government and Agency Obligations in accordance with the initial margin requirements of the broker or exchange. Futures contracts are marked-to-market daily and an appropriate payable or receivable for the change in value (“variation margin”)
32
American Beacon FundsSM
Notes to Financial Statements
January 31, 2018
is recorded by the Funds. Gains or losses are recognized, but not considered realized until the contracts expire or are closed. Futures contracts involve, to varying degrees, risk of loss in excess of the variation margin disclosed on the Statements of Assets and Liabilities.
Other investments, including restricted securities and those financial instruments for which the above valuation procedures are inappropriate or are deemed not to reflect fair value, are stated at fair value, as determined in good faith by the Manager’s Valuation Committee, pursuant to procedures established by the Board.
Valuation Inputs
Various inputs may be used to determine the fair value of the Funds’ investments. These inputs are summarized in three broad levels for financial statement purposes. The inputs or methodologies used to value securities are not necessarily an indication of the risk associated with investing in those securities.
| | | | |
| Level 1 | | - | | Quoted prices in active markets for identical securities. |
| | |
| Level 2 | | - | | Prices determined using other significant observable inputs. These may include quoted prices for similar securities, interest rates, prepayment speeds, credit risk, and others. |
| | |
| Level 3 | | - | | Prices determined using other significant unobservable inputs. Unobservable inputs reflect the Fund’s own assumptions about the factors market participants would use in pricing an investment. |
Level 1 and Level 2 trading assets and trading liabilities, at fair value
Common stocks, preferred securities, and financial derivative instruments, such as futures contracts that are traded on a national securities exchange, are stated at the last reported sale or settlement price on the day of valuation. To the extent these securities are actively traded and valuation adjustments are not applied, they are categorized as Level 1 of the fair value hierarchy. Preferred securities and other equities traded on inactive markets or valued by reference to similar instruments are generally categorized as Level 2 of the fair value hierarchy. Valuation adjustments may be applied to certain securities that are solely traded on a foreign exchange to account for the market movement between the close of the foreign market and the close of the Exchange. These securities are valued using pricing service providers that consider the correlation of the trading patterns of the foreign security to the intraday trading in the U.S. markets for investments. Securities using these valuation adjustments are categorized as Level 2 of the fair value hierarchy.
Investments in registered open-end investment management companies will be valued based upon the NAVs of such investments and are categorized as Level 1 of the fair value hierarchy.
Level 3 trading assets and trading liabilities, at fair value
The valuation techniques and significant inputs used in determining the fair values of financial instruments classified as Level 3 of the fair value hierarchy are as follows.
Securities and other assets for which market quotes are not readily available are valued at fair value as determined in good faith by the Board or persons acting at their direction and may be categorized as Level 3 of the fair value hierarchy.
Market quotes are considered not readily available in circumstances where there is an absence of current or reliable market-based data (e.g., trade information or broker quotes), including where events occur after the close of the relevant market, but prior to the Exchange close, that materially affect the values of the Fund’s securities or assets. In addition, market quotes are considered not readily available when, due to extraordinary circumstances, the exchanges or markets on which the securities trade, do not open for trading for the entire day and no other market prices are available. The Board has delegated to the Manager the responsibility for monitoring significant events that may materially affect the fair values of a Fund’s securities or assets and for determining whether the value of the applicable securities or assets should be re-evaluated in light of such significant events.
33
American Beacon FundsSM
Notes to Financial Statements
January 31, 2018
The Board has adopted methods for valuing securities and other assets in circumstances where market quotes are not readily available, and has delegated the responsibility for applying the valuation methods to the Manager. For instances in which daily market quotes are not readily available, investments may be valued pursuant to guidelines established by the Board. In the event that the security or asset cannot be valued, pursuant to one of the valuation methods established by the Board, the fair value of the security or asset will be determined in good faith by the Valuation Committee, generally based upon recommendations provided by the Manager.
When a Fund uses fair valuation methods applied by the Manager that use significant unobservable inputs to determine its NAV, the securities priced using this methodology are categorized as Level 3 of the fair value hierarchy. These methods may require subjective determinations about the value of a security. While the Trust’s policy is intended to result in a calculation of the Fund’s NAV that fairly reflects security values as of the time of pricing, the Trust cannot guarantee that values determined by the Board or persons acting at their direction would accurately reflect the price that a Fund could obtain for a security if it were to dispose of that security as of the time of pricing (for instance, in a forced or distressed sale). The prices used by a Fund may differ from the value that would be realized if the securities were sold.
4. Securities and Other Investments
American Depositary Receipts (“ADRs”) and Non-Voting Depositary Receipts (“NVDRs”)
ADRs are depositary receipts for foreign issuers in registered form traded in U.S. securities markets. NVDRs represent financial interests in an issuer but the holder is not entitled to any voting rights. Depositary receipts may not be denominated in the same currency as the securities into which they may be converted. Investing in depositary receipts entails substantially the same risks as direct investment in foreign securities. There is generally less publicly available information about foreign companies and there may be less governmental regulation and supervision of foreign stock exchanges, brokers, and listed companies. In addition, such companies may use different accounting and financial standards (and certain currencies may become unavailable for transfer from a foreign currency), resulting in the Fund’s possible inability to convert immediately into U.S. currency proceeds realized upon the sale of portfolio securities of the affected foreign companies. In addition, the Funds may invest in unsponsored depositary receipts, the issuers of which are not obligated to disclose material information about the underlying securities to investors in the United States. Ownership of unsponsored depositary receipts may not entitle the Funds to the same benefits and rights as ownership of a sponsored depositary receipt or the underlying security.
Common Stock
Common stock generally takes the form of shares in a corporation which represent an ownership interest. It ranks below preferred stock and debt securities in claims for dividends and for assets of the company in a liquidation or bankruptcy. The value of a company’s common stock may fall as a result of factors directly relating to that company, such as decisions made by its management or decreased demand for the company’s products or services. A stock’s value may also decline because of factors affecting not just the company, but also companies in the same industry or sector. The price of a company’s stock may also be affected by changes in financial markets that are relatively unrelated to the company, such as changes in interest rates, currency exchange rates or industry regulation. Companies that elect to pay dividends on their common stock generally only do so after they invest in their own business and make required payments to bondholders and on other debt and preferred stock. Therefore, the value of a company’s common stock will usually be more volatile than its bonds, other debt and preferred stock. Common stock may be exchange-traded or over-the-counter (“OTC”). OTC stock may be less liquid than exchange-traded stock.
Foreign Securities
The Funds may invest in U.S. dollar-denominated and non-U.S. dollar denominated equity and debt securities of foreign issuers and foreign branches of U.S. banks, including negotiable certificates of deposit,
34
American Beacon FundsSM
Notes to Financial Statements
January 31, 2018
bankers’ acceptances, and commercial paper. Foreign issuers are issuers organized and doing business principally outside the United States and include corporations, banks, non-U.S. governments, and quasi-governmental organizations. While investments in foreign securities may be intended to reduce risk by providing further diversification, such investments involve sovereign and other risks, in addition to the credit and market risks normally associated with domestic securities. These additional risks include the possibility of adverse political and economic developments (including political or social instability, nationalization, expropriation, or confiscatory taxation); the potentially adverse effects of unavailability of public information regarding issuers, different governmental supervision and regulation of financial markets, reduced liquidity of certain financial markets, and the lack of uniform accounting, auditing, and financial reporting standards or the application of standards that are different or less stringent than those applied in the United States; different laws and customs governing securities tracking; and possibly limited access to the courts to enforce the Funds’ rights as an investor.
Illiquid and Restricted Securities
The Funds may invest in securities that are subject to legal or contractual restrictions on resale. These securities may be sold privately, but are required to be registered or exempted from such registration before being sold to the public. Private placement securities are generally considered to be restricted except for those securities traded between qualified institutional investors under the provisions of Rule 144A of the Securities Act of 1933 (the “Securities Act”). Illiquid securities have included securities that have not been registered under the Securities Act, securities that are otherwise not readily marketable, and repurchase agreements having a remaining maturity of longer than seven calendar days. Disposal of both illiquid and restricted securities may involve time-consuming negotiations and expenses, and prompt sale at an acceptable price may be difficult to achieve. Restricted securities outstanding during the year ended January 31, 2018 are disclosed in the Fund’s Notes to the Schedule of Investments.
Regulation S under the Securities Act permits the sale abroad of securities that are not registered for sale in the United States and includes a provision for U.S. investors, such as the Funds, to purchase such unregistered securities if certain conditions are met.
Other Investment Company Securities and Other Exchange-Traded Products
The Funds may invest in shares of other investment companies, including open-end funds, closed-end funds, business development companies, ETFs, unit investment trusts, and other investment companies of the Trust . The Funds may invest in investment company securities advised by the Manager or a sub-advisor. Investments in the securities of other investment companies may involve duplication of advisory fees and certain other expenses. By investing in another investment company, the Funds become a shareholder of that investment company. As a result, the Funds’ shareholders indirectly will bear the Funds’ proportionate share of the fees and expenses paid by shareholders of the other investment company, in addition to the fees and expenses the Funds’ shareholders directly bear in connection with the Funds’ own operations. These other fees and expenses are reflected as Acquired Fund Fees and Expenses and are included in the Fees and Expenses Table for the Funds in their Prospectus, if applicable. Investments in other investment companies may involve the payment of substantial premiums above the value of such issuer’s portfolio securities.
Preferred Stock
A preferred stock blends the characteristics of a bond and common stock. It can offer the higher yield of a bond and has priority over common stock in equity ownership, but does not have the seniority of a bond and its participation in the issuer’s growth may be limited. Preferred stock generally has preference over common stock in the receipt of dividends and in any residual assets after payment to creditors should the issuer be dissolved. Although the dividend is set at a fixed or variable rate, in some circumstances it can be changed or omitted by the issuer.
35
American Beacon FundsSM
Notes to Financial Statements
January 31, 2018
Real Estate Investment Trusts
The Funds may own shares of real estate investment trusts (“REITs”) which report information on the source of their distributions annually. The Funds re-characterize distributions received from REIT investments based on information provided by the REITs into the following categories: ordinary income, long-term capital gains, and return of capital. If information is not available on a timely basis from the REITs, the re-characterization will be estimated based on available information, which may include the previous year allocation. If new or additional information becomes available from the REITs at a later date, a re-characterization will be made the following year.
5. Financial Derivative Instruments
The Funds may utilize derivative instruments to gain market exposure on cash balances or reduce market exposure in anticipation of liquidity needs. When considering the Funds’ use of derivatives, it is important to note that the Funds do not use derivatives for the purpose of creating financial leverage.
Futures Contracts
Futures contracts are contracts to buy or sell a standard quantity of securities at a specified price on a future date. The Funds may enter into financial futures contracts as a method for keeping assets readily convertible to cash if needed to meet shareholder redemptions or for other needs while maintaining exposure to the stock or bond market, as applicable. The primary risks associated with the use of futures contracts are the possibility of illiquid markets or imperfect correlation between the values of the contracts and the underlying securities or that the counterparty will fail to perform its obligations.
Upon entering into a futures contract, the Funds are required to set aside or deposit with a broker an amount, termed the initial margin, which typically represents a portion of the face value of the futures contract. The Funds usually reflect this amount on their Schedule of Investments as a U.S. Treasury Bill held as collateral for futures contracts or as cash deposited with broker on the Statements of Assets and Liabilities. Payments to and from the broker, known as variation margin, are required to be made on a daily basis as the price of the futures contract fluctuates. Changes in initial settlement values are accounted for as unrealized appreciation (depreciation) until the contracts are terminated, at which time realized gains and losses are recognized. Futures contracts are valued at the most recent settlement price established each day by the exchange on which they are traded.
During the year ended January 31, 2018, the Funds entered into futures contracts primarily for exposing cash to markets.
The Funds’ average futures contracts outstanding fluctuate throughout the operating year as required to meet strategic requirements. The following table illustrates the average quarterly volume of futures contracts. For purpose of this disclosure, volume is measured by contracts outstanding at each quarter end.
| | | | |
Average Futures Contracts Outstanding | |
Fund | | Year Ended
January 31, 2018 | |
Acadian Emerging Markets Managed Volatility | | | 17 | |
SGA Global Growth | | | 16 | |
36
American Beacon FundsSM
Notes to Financial Statements
January 31, 2018
The following is a summary of the fair valuations of the Funds’ derivative instruments categorized by risk exposure(1):
Acadian Emerging Markets Managed Volatility Fund
| | | | | | | | | | | | | | | | | | | | | | | | | | | | | | | | | | | | | | | | | | | | | | | | | | | | | | | |
| Fair values of financial instruments on the Statements of Assets and Liabilities as of January 31, 2018: | |
|
Derivatives not accounted for as hedging instruments |
| | | | | | | | | | | |
Assets: | | Credit contracts | | | | Foreign exchange
contracts | | | | Commodity
contracts | | | | Interest rate
contracts | | | | Equity contracts | | | | Total |
| Receivable for variation margin from open futures contracts(2) | | | $ | – | | | | | | | | | $ | – | | | | | | | | | $ | – | | | | | | | | | $ | – | | | | | | | | | $ | 13,386 | | | | | | | | | $ | 13,386 | |
| | | | | | | | | | | | | | | | | | | | | | | | | | | | | | | | | | | | | | | | | | | | | | | | | | | | | | | |
| The effect of financial derivative instruments on the Statements of Operations as of January 31, 2018: | |
|
Derivatives not accounted for as hedging instruments |
| | | | | | | | | | | |
Realized gain (loss) from derivatives
recognized as a result of operations: | | Credit contracts | | | | Foreign exchange
contracts | | | | Commodity
contracts | | | | Interest rate
contracts | | | | Equity contracts | | | | Total |
| Futures contracts | | | $ | – | | | | | | | | | $ | – | | | | | | | | | $ | – | | | | | | | | | $ | – | | | | | | | | | $ | 458,277 | | | | | | | | | $ | 458,277 | |
| | | | | | | | | | | |
Net change in unrealized appreciation
(depreciation) of derivatives recognized as
a result from operations: | | Credit contracts | | | | Foreign exchange
contracts | | | | Commodity
contracts | | | | Interest rate
contracts | | | | Equity contracts | | | | Total |
| Futures contracts | | | $ | – | | | | | | | | | $ | – | | | | | | | | | $ | – | | | | | | | | | $ | – | | | | | | | | | $ | (36,652 | ) | | | | | | | | $ | (36,652 | ) |
SGA Global Growth Fund
| | | | | | | | | | | | | | | | | | | | | | | | | | | | | | | | | | | | | | | | | | | | | | | | | | | | | | | |
| Fair values of financial instruments on the Statements of Assets and Liabilities as of January 31, 2018: | |
|
Derivatives not accounted for as hedging instruments |
| | | | | | | | | | | |
Assets: | | Credit contracts | | | | Foreign exchange
contracts | | | | Commodity
contracts | | | | Interest rate
contracts | | | | Equity contracts | | | | Total |
| Receivable for variation margin from open futures contracts(2) | | | $ | – | | | | | | | | | $ | – | | | | | | | | | $ | – | | | | | | | | | $ | – | | | | | | | | | $ | 16,230 | | | | | | | | | $ | 16,230 | |
| | | | | | | | | | | |
Liabilities: | | Credit contracts | | | | Foreign exchange
contracts | | | | Commodity
contracts | | | | Interest rate
contracts | | | | Equity contracts | | | | Total |
| Payable for variation margin from open futures contracts(2) | | | $ | – | | | | | | | | | $ | – | | | | | | | | | $ | – | | | | | | | | | $ | – | | | | | | | | | $ | (277 | ) | | | | | | | | $ | (277 | ) |
| | | | | | | | | | | | | | | | | | | | | | | | | | | | | | | | | | | | | | | | | | | | | | | | | | | | | | | |
| The effect of financial derivative instruments on the Statements of Operations as of January 31, 2018: | |
|
Derivatives not accounted for as hedging instruments |
| | | | | | | | | | | |
Realized gain (loss) from derivatives
recognized as a result of operations: | | Credit contracts | | | | Foreign exchange
contracts | | | | Commodity
contracts | | | | Interest rate
contracts | | | | Equity contracts | | | | Total |
| Futures contracts | | | $ | – | | | | | | | | | $ | – | | | | | | | | | $ | – | | | | | | | | | $ | – | | | | | | | | | $ | 372,753 | | | | | | | | | $ | 372,753 | |
| | | | | | | | | | | |
Net change in unrealized appreciation
(depreciation) of derivatives recognized as
a result from operations: | | Credit contracts | | | | Foreign exchange
contracts | | | | Commodity
contracts | | | | Interest rate
contracts | | | | Equity contracts | | | | Total |
| Futures contracts | | | $ | – | | | | | | | | | $ | – | | | | | | | | | $ | – | | | | | | | | | $ | – | | | | | | | | | $ | 26,768 | | | | | | | | | $ | 26,768 | |
(1) See Note 3 in the Notes to Financial Statements for additional information.
(2) Includes cumulative appreciation (depreciation) of futures contracts as reported in the Fund’s Schedules of Investments footnotes. Only current day’s variation margin is reported within the Statements of Assets and Liabilities.
37
American Beacon FundsSM
Notes to Financial Statements
January 31, 2018
6. Principal Risks
Investing in the Funds may involve certain risks including, but not limited to, those described below.
Counterparty Risk
The Funds are subject to the risk that a party or participant to a transaction, such as a broker or derivative counterparty, will be unwilling or unable to satisfy its obligation to make timely principal, interest or settlement payments or to otherwise honor its obligations to the Funds.
Currency Risk
The Funds may have exposure to foreign currencies by making direct investments in non-U.S. currencies, in securities denominated in non-U.S. currencies or by purchasing or selling forward foreign currency exchange contracts in non-U.S. currencies. Foreign currencies will fluctuate, and may decline in value relative to the U.S. dollar and other currencies and thereby affect the Funds’ investments in foreign (non-U.S.) currencies or in securities that traded in, and receive revenues in, or in derivatives that provide exposure to, foreign (non-U.S.) currencies.
Derivatives Risk
Derivatives may involve significant risk. The use of derivative instruments may expose the Funds to additional risks that they would not be subject to if they invested directly in the securities or other instruments underlying those derivatives, including the high degree of leverage often embedded in such instruments, and potential material and prolonged deviations between the theoretical value and realizable value of a derivative. Some derivatives have the potential for unlimited loss, regardless of the size of the Fund’s initial investment. Derivatives may be illiquid and may be more volatile than other types of investments. The Funds may buy or sell derivatives not traded on an exchange and which may be subject to heightened liquidity and valuation risk. Derivative investments can increase portfolio turnover and transaction costs. Derivatives also are subject to counterparty risk. As a result, the Funds may obtain no recovery of their investment or may only obtain a limited recovery, and any recovery may be delayed. Not all derivative transactions require a counterparty to post collateral, which may expose the Funds to greater losses in the event of a default by a counterparty.
Emerging Markets Risk
When investing in emerging markets, the risks of investing in foreign securities are heightened. Emerging markets are generally smaller, less developed, less liquid and more volatile than the securities markets of the U.S. and other developed markets. There are also risks of: greater political uncertainties; an economy’s dependence on revenues from particular commodities or on international aid or development assistance; currency transfer restrictions; a limited number of potential buyers for such securities; and delays and disruptions in securities settlement procedures.
Equity Investment Risk
Equity securities are subject to market risk. The Funds’ investments in equity securities may include common stocks, preferred stocks, securities convertible into or exchangeable for common stocks, REITs, and depositary receipts. Such investments may expose the Funds to additional risk. The value of a company’s common stock may fall as a result of factors affecting the company, companies in the same industry or sector, or the financial markets overall. Common stock generally is subordinate to preferred stock upon the liquidation or bankruptcy of the issuing company. Preferred stocks and convertible securities are sensitive to movements in interest rates. Preferred stocks may be less liquid than common stocks and, unlike common stocks, participation in the growth of an issuer may be limited. Distributions on preferred stocks generally are payable at the discretion of an issuer and after required payments to bond holders. Convertible securities are subject to the risk that the credit standing of the issuer may
38
American Beacon FundsSM
Notes to Financial Statements
January 31, 2018
have an effect on the convertible securities’ investment value. Investments in REITs are subject to the risks associated with investing in the real estate industry such as adverse developments affecting the real estate industry and real property values. Depositary receipts and U.S. dollar-denominated foreign stocks traded on U.S. exchanges are subject to certain of the risks associated with investing directly in foreign securities, including, but not limited to, currency fluctuations and political and financial instability in the home country of a particular depositary receipt or foreign stock.
Foreign Investing Risk
The Funds may invest in securities issued by foreign companies through ADRs and U.S. dollar-denominated foreign stocks traded on U.S. exchanges. The Funds may also invest in local currency investments. ADRs are subject to many of the risks inherent in currency fluctuations and political and financial instability in the home country of a particular ADR or foreign stock. Non-U.S. investments carry potential risks not associated with U.S. investments. Such risks include, but are not limited to: (1) currency exchange rate fluctuations, (2) political and financial instability, (3) less liquidity, (4) lack of uniform accounting, auditing and financial reporting standards, (5) increased price volatility, (6) less government regulation and supervision of foreign stock exchanges, brokers and listed companies, and (7) delays in transaction settlement in some foreign markets.
Futures Contracts Risk
Futures contracts are derivative instruments where one party pays a fixed price for an agreed amount of securities or other underlying assets at an agreed date. The use of such derivative instruments may expose the Funds to additional risks that they would not be subject to if they invested directly in the securities underlying those derivatives. Futures contracts may experience potentially dramatic price changes (losses) and imperfect correlation between the price of the contract and the underlying security or index, which will increase the volatility of the Funds and may involve a small investment of cash (the amount of initial and variation margin) relative to the magnitude of the risk assumed (the potential increase or decrease in the price of the futures contract).
Market Risk
The Fund is subject to the risk that the securities markets will move down, sometimes rapidly and unpredictably based on overall economic conditions and other factors. The value of a security may decline due to general market conditions which are not specifically related to a particular company, such as real or perceived adverse economic conditions, changes in the general outlook for corporate earnings, changes in interest or currency rates or adverse investment sentiment generally. Changes in the financial condition of a single issuer can impact a market as a whole.
Market Timing Risk
Frequent trading by Fund shareholders poses risks to other shareholders in that Fund, including (i) the dilution of the Fund’s NAV, (ii) an increase in the Fund’s expenses, and (iii) interference with the portfolio manager’s ability to execute efficient investment strategies. Because of specific types of securities in which the Fund may invest, it could be subject to the risk of market timing activities by shareholders.
Other Investment Companies Risk
The Funds may invest in shares of other registered investment companies, including money market funds. To the extent that the Funds invest in shares of other registered investment companies, the Funds will indirectly bear the fees and expenses charged by the underlying funds in addition to the Fund’s direct fees and expenses and will be subject to the risks associated with investments in those funds.
39
American Beacon FundsSM
Notes to Financial Statements
January 31, 2018
Securities Lending Risk
To the extent the Funds lends its securities, it may be subject to the following risks; i) borrowers of the Funds’ securities typically provide collateral in the form of cash that is reinvested in securities, ii) the securities in which the collateral is invested may not perform sufficiently to cover the return collateral payments owed to borrowers, iii) delays may occur in the recovery of securities from borrowers, which could interfere with the Funds’ ability to vote proxies or to settle transactions, and iv) there is the risk of possible loss of rights in the collateral should the borrower fail financially.
Valuation Risk
The Funds may value certain assets at a price different from the price at which they can be sold. This risk may be especially pronounced for investments, such as certain derivatives, which may be illiquid or which may become illiquid.
Offsetting Assets and Liabilities
The Funds are parties to enforceable master netting agreements between brokers and counterparties which provide for the right to offset under certain circumstances. The Funds employ multiple money managers and counterparties and have elected not to offset qualifying financial and derivative instruments on the Statements of Assets and Liabilities, as such all financial and derivative instruments are presented on a gross basis. The impacts of netting arrangements that provide the right to offset are detailed below. The net amount represents the net receivable or payable that would be due from or to the counterparty in the event of default. Exposure from borrowings and other financing agreements such as repurchase agreements can only be netted across transactions governed by the same Master Agreement with the same legal entity. All amounts reported below represent the balance as of the report date, January 31, 2018.
Acadian Emerging Markets Managed Volatility Fund
| | | | | | | | | | | | |
| Offsetting of Financial and Derivative Assets as of January 31, 2018: | |
| | | Assets | | | | | | Liabilities | |
| Futures Contracts | | $ | 13,386 | | | | | | | $ | - | |
| | | | | | | | | | | | |
| Total derivative assets and liabilities in the Statements of Assets and Liabilities | | $ | 13,386 | | | | | | | $ | - | |
| | | | | | | | | | | | |
| Derivatives not subject to a Master Netting Agreement or similar agreement (“MNA”) | | $ | (13,386 | ) | | | | | | $ | - | |
| | | | | | | | | | | | |
| | | | | | | | | | | | | | | | | | | | | | | | | | | | | | | | | | | | |
| | | Remaining Contractual Maturity of the Agreements
As of January 31, 2018 | |
| | | Overnight and
Continuous | | | | | | <30 days | | | | | | Between
30 & 90 days | | | | | | >90 days | | | | | | Total | |
| Securities Lending Transactions | | | | | | | | | | | | | | | | | | | | | | | | | | | | | | | | | | | | |
| Common Stocks | | $ | 98,112 | | | | | | | $ | - | | | | | | | $ | - | | | | | | | $ | - | | | | | | | $ | 98,112 | |
| | | | | | | | | | | | | | | | | | | | | | | | | | | | | | | | | | | | |
| Total Borrowings | | $ | 98,112 | | | | | | | $ | - | | | | | | | $ | - | | | | | | | $ | - | | | | | | | $ | 98,112 | |
| | | | | | | | | | | | | | | | | | | | | | | | | | | | | | | | | | | | |
| Gross amount of recognized liabilities for securities lending transactions | | | | | | | $ | 98,112 | |
| | | | | | | | | | | | | | | | | | | | | | | | | | | | | | | | | | | | |
SGA Global Growth Fund
| | | | | | | | | | | | |
| Offsetting of Financial and Derivative Assets as of January 31, 2018: | |
| | | Assets | | | | | | Liabilities | |
| Futures Contracts | | $ | 16,230 | | | | | | | $ | 277 | |
| | | | | | | | | | | | |
| Total derivative assets and liabilities in the Statements of Assets and Liabilities | | $ | 16,230 | | | | | | | $ | 277 | |
| | | | | | | | | | | | |
| Derivatives not subject to a Master Netting Agreement or similar agreement (“MNA”) | | $ | (16,230 | ) | | | | | | $ | (277 | ) |
| | | | | | | | | | | | |
40
American Beacon FundsSM
Notes to Financial Statements
January 31, 2018
| | | | | | | | | | | | | | | | | | | | | | | | | | | | | | | | | | | | |
| | | Remaining Contractual Maturity of the Agreements
As of January 31, 2018 | |
| | | Overnight and
Continuous | | | | | | <30 days | | | | | | Between
30 & 90 days | | | | | | >90 days | | | | | | Total | |
| Securities Lending Transactions | | | | | | | | | | | | | | | | | | | | | | | | | | | | | | | | | | | | |
| Common Stocks | | $ | 868,249 | | | | | | | $ | - | | | | | | | $ | - | | | | | | | $ | - | | | | | | | $ | 868,249 | |
| | | | | | | | | | | | | | | | | | | | | | | | | | | | | | | | | | | | |
| Total Borrowings | | $ | 868,249 | | | | | | | $ | - | | | | | | | $ | - | | | | | | | $ | - | | | | | | | $ | 868,249 | |
| | | | | | | | | | | | | | | | | | | | | | | | | | | | | | | | | | | | |
| Gross amount of recognized liabilities for securities lending transactions | | | | | | | $ | 868,249 | |
| | | | | | | | | | | | | | | | | | | | | | | | | | | | | | | | | | | | |
7. Federal Income and Excise Taxes
It is the policy of each Fund to qualify as a regulated investment company (“RIC”), by complying with all applicable provisions of Subchapter M of the Internal Revenue Code, as amended, and to make distributions of taxable income sufficient to relieve it from substantially all federal income and excise taxes. For federal income tax purposes, each Fund is treated as a single entity for the purpose of determining such qualification.
The Funds do not have any unrecognized tax benefits in the accompanying financial statements. Each of the tax years in the four year period ended January 31, 2018 remain subject to examination by the Internal Revenue Service. If applicable, the Funds recognize interest accrued related to unrecognized tax benefits in interest expense and penalties in “Other expenses” on the Statements of Operations.
The Funds may be subject to taxes imposed by countries in which it invests. Such taxes are generally based on returns of income earned or gains realized or repatriated. Taxes are accrued and applied to net investment income, net realized capital gains and net unrealized appreciation (depreciation), as applicable, as the income is earned or capital gains are recorded.
Dividends are categorized in accordance with income tax regulations which may treat certain transactions differently than U.S. GAAP. Accordingly, the character of distributions and composition of net assets for tax purposes may differ from those reflected in the accompanying financial statements. The Funds also utilize earnings and profits distributed to shareholders on redemptions of shares as part of the dividends paid deduction.
The tax character of distributions paid were as follows:
| | | | | | | | | | | | | | | | | | | | | | | | | | | | |
| | | Acadian Emerging Markets Managed
Volatility Fund | | | | | | SGA Global Growth Fund | |
| | | Year Ended
January 31, 2018 | | | | | | Year Ended
January 31, 2017 | | | | | | Year Ended
January 31, 2018 | | | | | | Year Ended
January 31, 2017 | |
Distributions paid from: | |
Ordinary income* | |
Institutional Class | | $ | 100,822 | | | | | | | $ | 862,939 | | | | | | | $ | 280,924 | | | | | | | $ | 45,901 | |
Y Class | | | 480,371 | | | | | | | | 596,064 | | | | | | | | 86,030 | | | | | | | | 10,918 | |
Investors Class | | | 69,880 | | | | | | | | 52,099 | | | | | | | | 357,376 | | | | | | | | 58,295 | |
A Class | | | 14,170 | | | | | | | | 7,642 | | | | | | | | 70,201 | | | | | | | | 4,898 | |
C Class | | | 5,253 | | | | | | | | 3,871 | | | | | | | | 32,980 | | | | | | | | 5,669 | |
Long-term capital gains | |
Institutional Class | | | – | | | | | | | | – | | | | | | | | 184,708 | | | | | | | | 203,833 | |
Y Class | | | – | | | | | | | | – | | | | | | | | 56,564 | | | | | | | | 48,483 | |
Investors Class | | | – | | | | | | | | – | | | | | | | | 234,974 | | | | | | | | 258,868 | |
A Class | | | – | | | | | | | | – | | | | | | | | 46,157 | | | | | | | | 21,749 | |
C Class | | | – | | | | | | | | – | | | | | | | | 21,684 | | | | | | | | 25,174 | |
| | | | | | | | | | | | | | | | | | | | | | | | | | | | |
Total distributions paid | | $ | 670,496 | | | | | | | $ | 1,522,615 | | | | | | | $ | 1,371,598 | | | | | | | $ | 683,788 | |
| | | | | | | | | | | | | | | | | | | | | | | | | | | | |
*For tax purposes, short-term capital gains are considered ordinary income distributions.
41
American Beacon FundsSM
Notes to Financial Statements
January 31, 2018
As of January 31, 2018 the components of distributable earnings (deficits) on a tax basis were as follows:
| | | | | | | | | | | | | | | | | | | | | | | | | | | | |
Fund | | Tax Cost | | | | | | Unrealized
Appreciation | | | | | | Unrealized
(Depreciation) | | | | | | Net Unrealized
Appreciation
(Depreciation) | |
| Acadian Emerging Markets Managed Volatility | | $ | 30,083,254 | | | | | | | $ | 7,883,843 | | | | | | | $ | (512,817 | ) | | | | | | $ | 7,371,026 | |
| SGA Global Growth | | | 38,388,238 | | | | | | | | 9,674,549 | | | | | | | | (271,090 | ) | | | | | | | 9,403,459 | |
| | | | | | | | | | | | | | | | | | | | | | | | | | | | | | | | | | | | | | | | | | | | |
Fund | | Net Unrealized
Appreciation
(Depreciation) | | | | | | Undistributed
Ordinary
Income | | | | | | Undistributed
Long-Term
Capital Gains | | | | | | Accumulated
Capital and
Other (Losses) | | | | | | Other Temporary
Differences | | | | | | Distributable
Earnings | |
| Acadian Emerging Markets Managed Volatility | | $ | 7,371,026 | | | | | | | $ | 540,542 | | | | | | | $ | 397,719 | | | | | | | $ | – | | | | | | | $ | – | | | | | | | $ | 8,309,287 | |
| SGA Global Growth | | | 9,403,459 | | | | | | | | 232,951 | | | | | | | | 925,993 | | | | | | | | – | | | | | | | | – | | | | | | | | 10,562,403 | |
Financial reporting records are adjusted for permanent book/tax differences to reflect tax character. Financial records are not adjusted for temporary differences. The temporary differences between financial reporting and tax-basis reporting of unrealized appreciation (depreciation) are attributable primarily to the tax deferral of losses from wash sales, the realization for tax purposes of unrealized gains (losses) on investments in passive foreign investment companies, and the realization for tax purposes of unrealized gains (losses) on certain derivative instruments.
Due to inherent differences in the recognition of income, expenses, and realized gains (losses) under U.S. GAAP and federal income tax regulations, permanent differences between book and tax reporting have been identified and appropriately reclassified on the Statements of Assets and Liabilities.
Accordingly, the following amounts represent current year permanent differences derived from partnership basis adjustments, disposal adjustments from investments in passive foreign investment companies, net operating losses used to offset short-term capital gains and non-utilization of net operating losses as of January 31, 2018:
| | | | | | | | | | | | | | | | | | | | | | | | | | | | |
Fund | | Paid-In-Capital | | | | | | Undistributed
(Overdistribution of)
Net Investment
Income | | | | | | Accumulated Net
Realized Gain (Loss) | | | | | | Net Unrealized
Appreciation
(Depreciation) | |
| Acadian Emerging Markets Managed Volatility | | $ | - | | | | | | | $ | 488,633 | | | | | | | $ | (488,633 | ) | | | | | | $ | - | |
| SGA Global Growth | | | 39 | | | | | | | | 62,779 | | | | | | | | (62,818 | ) | | | | | | | - | |
Under the Regulated Investment Company Modernization Act of 2010 (“RIC MOD”), net capital losses recognized by the Funds in taxable years beginning after December 22, 2010 are carried forward indefinitely and retain their character as short-term and/or long-term losses.
During the year January 31, 2018 the Funds did not have any capital loss carryforwards.
8. Investment Transactions
The aggregate cost of purchases and proceeds from sales and maturities of investments, other than short-term obligations, for the year ended January 31, 2018 were as follows:
| | | | | | | | | | | | | | | | | | | | | | | | | | | | |
Fund | | Purchases (non-U.S.
Government
Securities) | | | | | | Purchases of U.S.
Government
Securities | | | | | | Sales (non-U.S.
Government
Securities) | | | | | | Sales of U.S.
Government
Securities | |
| Acadian Emerging Markets Managed Volatility | | $ | 14,443,261 | | | | | | | $ | - | | | | | | | $ | 77,491,981 | | | | | | | $ | - | |
| SGA Global Growth | | | 22,443,774 | | | | | | | | - | | | | | | | | 10,002,931 | | | | | | | | - | |
42
American Beacon FundsSM
Notes to Financial Statements
January 31, 2018
A summary of the Funds’ transactions in the USG Select Fund for the year ended January 31, 2018 were as follows:
| | | | | | | | | | | | | | | | | | | | | | | | | | | | | | | | | | | | | | | | | | |
Fund | | Type of
Transaction | | | | | January 31,
2017
Shares/Fair
Value | | | | | | Purchases | | | | | | Sales | | | | | | January 31,
2018
Shares/Fair
Value | | | | | | Dividend
Income | |
| Acadian Emerging Markets Managed Volatility | | Direct | | | | | | $ | 1,304,383 | | | | | | | $ | 98,315,054 | | | | | | | $ | 99,024,965 | | | | | | | $ | 594,472 | | | | | | | $ | 11,252 | |
| Acadian Emerging Markets Managed Volatility | | Securities
Lending | | | | | | | - | | | | | | | | 2,841,546 | | | | | | | | 2,743,434 | | | | | | | | 98,112 | | | | | | | | N/A | |
| SGA Global Growth | | Direct | | | | | | | 1,365,262 | | | | | | | | 30,744,196 | | | | | | | | 29,601,432 | | | | | | | | 2,508,026 | | | | | | | | 16,786 | |
| SGA Global Growth | | Securities
Lending | | | | | | | - | | | | | | | | 19,310,970 | | | | | | | | 18,442,721 | | | | | | | | 868,249 | | | | | | | | N/A | |
9. Securities Lending
The Funds may lend their securities to qualified financial institutions, such as certain broker-dealers, to earn additional income. The borrowers are required to secure their loans continuously with collateral in an amount at least equal to the fair value of the securities loaned, initially in an amount at least equal to 102% of the fair value of domestic securities loaned and 105% of the fair value of international securities loaned. Collateral is monitored and marked-to-market daily. Daily mark-to-market amounts are required to be paid to the borrower or received from the borrower by the end of the following business day. This one day settlement for mark-to-market amounts may result in the collateral being temporarily less than the value of the securities on loan or temporarily more than the required minimum collateral.
To the extent that a loan is collateralized by cash, such cash collateral shall be invested by the securities lending agent (the “Agent”) in money market mutual funds and other short-term investments as designated by the Manager.
Securities lending income is generated from the demand premium (if any) paid by the borrower to borrow a specific security and from the return on investment of cash collateral, reduced by negotiated rebate fees paid to the borrower and transaction costs. To the extent that a loan is secured by non-cash collateral, securities lending income is generated as a demand premium reduced by transaction costs. The Funds, the Agent, and the Manager retained 80%, 10%, and 10%, respectively, of the income generated from securities lending.
While securities are on loan, the Funds continue to receive certain income associated with that security and any gain or loss in the market price that may occur during the term of the loan. In the case of domestic equities, the value of any dividend is received in the form of a substitute payment approximately equal to the dividend. In the case of foreign securities, a negotiated amount is received that is less than the actual dividend, but higher than the dividend amount minus the foreign tax that the Funds would be subject to on the dividend.
Securities lending transactions pose certain risks to the Funds, including that the borrower may not provide additional collateral when required or return the securities when due, that the value of the short-term investments will be less than the amount of cash collateral required to be returned to the borrower, that non-cash collateral may be subject to legal constraints in the event of a borrower bankruptcy, and that the cash collateral investments could become illiquid and unable to be used to return collateral to the borrower. The Funds could also experience delays and costs in gaining access to the collateral. The Funds bear the risk of any deficiency in the amount of the cash collateral available for return to the borrower and any action which impairs its ability to liquidate non-cash collateral to satisfy a borrower default.
43
American Beacon FundsSM
Notes to Financial Statements
January 31, 2018
As of January 31, 2018, the value of outstanding securities on loan and the value of collateral were as follows:
| | | | | | | | | | | | | | | | | | | | | | | | | | | | |
Fund | | Market Value of
Securities on Loan | | | | | | Cash Collateral
Received | | | | | | Non-Cash Collateral
Received | | | | | | Total Collateral
Received | |
| Acadian Emerging Markets Managed Volatility | | $ | 93,676 | | | | | | | $ | 98,112 | | | | | | | $ | - | | | | | | | $ | 98,112 | |
| SGA Global Growth | | | 837,476 | | | | | | | | 868,249 | | | | | | | | - | | | | | | | | 868,249 | |
Cash collateral is listed on the Funds’ Schedules of Investments and is shown on the Statements of Assets and Liabilities. Income earned on these investments is included in “Income derived from securities lending” on the Statements of Operations.
Non-cash collateral received by the Funds may not be sold or re-pledged except to satisfy a borrower default. Therefore, non-cash collateral is not included on the Funds’ Schedules of Investments or Statements of Assets and Liabilities.
10. Borrowing Arrangements
Effective November 16, 2017, the Funds, along with certain other funds managed by the Manager (“Participating Funds”), entered into a committed revolving line of credit (the “Committed Line”) agreement with State Street Bank and Trust Company (the “Bank”) to be used to facilitate portfolio liquidity. The maximum borrowing amount under the Committed Line is $50 million with interest at a rate equal to the higher of (a) one-month London Inter-Bank Offered Rate (“LIBOR”) plus 1.25% per annum or (b) the Federal Funds rate plus 1.25% per annum on amounts borrowed. Each of the Participating Funds will pay a commitment fee at a rate of 0.25% per annum on the unused portion of the Committed Line amount. The Committed Line expires November 15, 2018 unless extended by the Bank or terminated by the Participating Funds in accordance with the agreement.
Effective November 16, 2017, the Funds, along with certain other Participating Funds managed by the Manager, entered into an uncommitted discretionary demand revolving line of credit (the “Uncommitted Line”) agreement with the Bank to be used to facilitate portfolio liquidity. The maximum borrowing amount under the Uncommitted Line is $50 million with interest at a rate equal to the higher of (a) one-month LIBOR plus 1.25% per annum or (b) the Federal Funds rate. The Uncommitted Line expires November 15, 2018 unless extended by the Bank or terminated by the Participating Funds in accordance with the agreement.
The Participating Funds paid administration, legal and arrangement fees, which are recognized as a component of “Other expenses” on the Statements of Operations, along with commitment fees, that have been allocated among the Participating Funds based on average daily net assets. During the year ended January 31, 2018, the Funds did not utilize this facility.
11. Capital Share Transactions
The tables below summarize the activity in capital shares for each Class of the Funds:
| | | | | | | | | | | | | | | | | | | | | | | | | | | | |
| | | Institutional Class | |
| | | Year Ended January 31, | |
| | | 2018 | | | | | | 2017 | |
Acadian Emerging Markets Managed Volatility Fund | | Shares | | | | | | Amount | | | | | | Shares | | | | | | Amount | |
| Shares sold | | | 118,476 | | | | | | | $ | 1,193,050 | | | | | | | | 1,404,972 | | | | | | | $ | 12,824,980 | |
| Reinvestment of dividends | | | 9,318 | | | | | | | | 100,822 | | | | | | | | 98,509 | | | | | | | | 862,939 | |
| Shares redeemed | | | (5,369,441 | ) | | | | | | | (52,389,780 | ) | | | | | | | (602,712 | ) | | | | | | | (5,525,711 | ) |
| | | | | | | | | | | | | | | | | | | | | | | | | | | | |
| Net increase (decrease) in shares outstanding | | | (5,241,647 | ) | | | | | | $ | (51,095,908 | ) | | | | | | | 900,769 | | | | | | | $ | 8,162,208 | |
| | | | | | | | | | | | | | | | | | | | | | | | | | | | |
| | | | |
44
American Beacon FundsSM
Notes to Financial Statements
January 31, 2018
| | | | | | | | | | | | | | | | | | | | | | | | | | | | |
| | | Y Class | |
| | | Year Ended January 31, | |
| | | 2018 | | | | | | 2017 | |
Acadian Emerging Markets Managed Volatility Fund | | Shares | | | | | | Amount | | | | | | Shares | | | | | | Amount | |
| Shares sold | | | 661,605 | | | | | | | $ | 6,777,058 | | | | | | | | 1,348,877 | | | | | | | $ | 12,226,918 | |
| Reinvestment of dividends | | | 43,146 | | | | | | | | 465,116 | | | | | | | | 67,633 | | | | | | | | 590,432 | |
| Shares redeemed | | | (1,880,829 | ) | | | | | | | (18,422,329 | ) | | | | | | | (877,209 | ) | | | | | | | (7,851,190 | ) |
| | | | | | | | | | | | | | | | | | | | | | | | | | | | |
| Net increase (decrease) in shares outstanding | | | (1,176,078 | ) | | | | | | $ | (11,180,155 | ) | | | | | | | 539,301 | | | | | | | $ | 4,966,160 | |
| | | | | | | | | | | | | | | | | | | | | | | | | | | | |
| | | | |
| | | Investor Class | |
| | | Year Ended January 31, | |
| | | 2018 | | | | | | 2017 | |
Acadian Emerging Markets Managed Volatility Fund | | Shares | | | | | | Amount | | | | | | Shares | | | | | | Amount | |
| Shares sold | | | 104,015 | | | | | | | $ | 1,045,363 | | | | | | | | 92,875 | | | | | | | $ | 843,971 | |
| Reinvestment of dividends | | | 6,508 | | | | | | | | 69,770 | | | | | | | | 5,949 | | | | | | | | 51,813 | |
| Shares redeemed | | | (229,184 | ) | | | | | | | (2,397,931 | ) | | | | | | | (194,305 | ) | | | | | | | (1,674,075 | ) |
| | | | | | | | | | | | | | | | | | | | | | | | | | | | |
| Net (decrease) in shares outstanding | | | (118,661 | ) | | | | | | $ | (1,282,798 | ) | | | | | | | (95,481 | ) | | | | | | $ | (778,291 | ) |
| | | | | | | | | | | | | | | | | | | | | | | | | | | | |
| | | | |
| | | A Class | |
| | | Year Ended January 31, | |
| | | 2018 | | | | | | 2017 | |
Acadian Emerging Markets Managed Volatility Fund | | Shares | | | | | | Amount | | | | | | Shares | | | | | | Amount | |
| Shares sold | | | 24,494 | | | | | | | $ | 260,608 | | | | | | | | 16,930 | | | | | | | $ | 153,823 | |
| Reinvestment of dividends | | | 1,319 | | | | | | | | 14,170 | | | | | | | | 875 | | | | | | | | 7,642 | |
| Shares redeemed | | | (8,724 | ) | | | | | | | (88,067 | ) | | | | | | | (51,033 | ) | | | | | | | (445,718 | ) |
| | | | | | | | | | | | | | | | | | | | | | | | | | | | |
| Net increase (decrease) in shares outstanding | | | 17,089 | | | | | | | $ | 186,711 | | | | | | | | (33,228 | ) | | | | | | $ | (284,253 | ) |
| | | | | | | | | | | | | | | | | | | | | | | | | | | | |
| | | | |
| | | C Class | |
| | | Year Ended January 31, | |
| | | 2018 | | | | | | 2017 | |
Acadian Emerging Markets Managed Volatility Fund | | Shares | | | | | | Amount | | | | | | Shares | | | | | | Amount | |
| Shares sold | | | 22,464 | | | | | | | $ | 219,427 | | | | | | | | 5,586 | | | | | | | $ | 50,512 | |
| Reinvestment of dividends | | | 495 | | | | | | | | 5,253 | | | | | | | | 448 | | | | | | | | 3,871 | |
| Shares redeemed | | | (29,030 | ) | | | | | | | (294,012 | ) | | | | | | | (34,716 | ) | | | | | | | (314,857 | ) |
| | | | | | | | | | | | | | | | | | | | | | | | | | | | |
| Net (decrease) in shares outstanding | | | (6,071 | ) | | | | | | $ | (69,332 | ) | | | | | | | (28,682 | ) | | | | | | $ | (260,474 | ) |
| | | | | | | | | | | | | | | | | | | | | | | | | | | | |
| | | | |
| | | Institutional Class | |
| | | Year Ended January 31, | |
| | | 2018 | | | | | | 2017 | |
SGA Global Growth Fund | | Shares | | | | | | Amount | | | | | | Shares | | | | | | Amount | |
| Shares sold | | | 297,426 | | | | | | | $ | 5,174,249 | | | | | | | | 115,376 | | | | | | | $ | 1,734,578 | |
| Reinvestment of dividends | | | 24,913 | | | | | | | | 465,632 | | | | | | | | 17,070 | | | | | | | | 249,734 | |
| Shares redeemed | | | (40,518 | ) | | | | | | | (727,410 | ) | | | | | | | (74,095 | ) | | | | | | | (1,114,205 | ) |
| | | | | | | | | | | | | | | | | | | | | | | | | | | | |
| Net increase in shares outstanding | | | 281,821 | | | | | | | $ | 4,912,471 | | | | | | | | 58,351 | | | | | | | $ | 870,107 | |
| | | | | | | | | | | | | | | | | | | | | | | | | | | | |
| | | | |
| | | Y Class | |
| | | Year Ended January 31, | |
| | | 2018 | | | | | | 2017 | |
SGA Global Growth Fund | | Shares | | | | | | Amount | | | | | | Shares | | | | | | Amount | |
| Shares sold | | | 202,621 | | | | | | | $ | 3,631,956 | | | | | | | | 106,656 | | | | | | | $ | 1,654,360 | |
| Reinvestment of dividends | | | 7,121 | | | | | | | | 132,444 | | | | | | | | 3,512 | | | | | | | | 51,209 | |
| Shares redeemed | | | (36,662 | ) | | | | | | | (660,523 | ) | | | | | | | (6,078 | ) | | | | | | | (92,801 | ) |
| | | | | | | | | | | | | | | | | | | | | | | | | | | | |
| Net increase in shares outstanding | | | 173,080 | | | | | | | $ | 3,103,877 | | | | | | | | 104,090 | | | | | | | $ | 1,612,768 | |
| | | | | | | | | | | | | | | | | | | | | | | | | | | | |
| | | | |
| | | Investor Class | |
| | | Year Ended January 31, | |
| | | 2018 | | | | | | 2017 | |
SGA Global Growth Fund | | Shares | | | | | | Amount | | | | | | Shares | | | | | | Amount | |
| Shares sold | | | 338,281 | | | | | | | $ | 5,871,708 | | | | | | | | 775,795 | | | | | | | $ | 11,870,353 | |
| Reinvestment of dividends | | | 32,263 | | | | | | | | 592,350 | | | | | | | | 21,979 | | | | | | | | 317,163 | |
| Shares redeemed | | | (150,290 | ) | | | | | | | (2,633,764 | ) | | | | | | | (62,802 | ) | | | | | | | (979,822 | ) |
| | | | | | | | | | | | | | | | | | | | | | | | | | | | |
| Net increase in shares outstanding | | | 220,254 | | | | | | | $ | 3,830,294 | | | | | | | | 734,972 | | | | | | | $ | 11,207,694 | |
| | | | | | | | | | | | | | | | | | | | | | | | | | | | |
| | | | |
45
American Beacon FundsSM
Notes to Financial Statements
January 31, 2018
| | | | | | | | | | | | | | | | | | | | | | | | | | | | |
| | | A Class | |
| | | Year Ended January 31, | |
| | | 2018 | | | | | | 2017 | |
SGA Global Growth Fund | | Shares | | | | | | Amount | | | | | | Shares | | | | | | Amount | |
| Shares sold | | | 164,780 | | | | | | | $ | 2,822,687 | | | | | | | | 56,052 | | | | | | | $ | 833,835 | |
| Reinvestment of dividends | | | 6,125 | | | | | | | | 112,333 | | | | | | | | 1,440 | | | | | | | | 20,764 | |
| Shares redeemed | | | (45,538 | ) | | | | | | | (748,714 | ) | | | | | | | (13,720 | ) | | | | | | | (206,169 | ) |
| | | | | | | | | | | | | | | | | | | | | | | | | | | | |
| Net increase in shares outstanding | | | 125,367 | | | | | | | $ | 2,186,306 | | | | | | | | 43,772 | | | | | | | $ | 648,430 | |
| | | | | | | | | | | | | | | | | | | | | | | | | | | | |
| | | | |
| | | C Class | |
| | | Year Ended January 31, | |
| | | 2018 | | | | | | 2017 | |
SGA Global Growth Fund | | Shares | | | | | | Amount | | | | | | Shares | | | | | | Amount | |
| Shares sold | | | 47,361 | | | | | | | $ | 849,784 | | | | | | | | 44,531 | | | | | | | $ | 656,412 | |
| Reinvestment of dividends | | | 3,077 | | | | | | | | 54,519 | | | | | | | | 2,186 | | | | | | | | 30,719 | |
| Shares redeemed | | | (10,356 | ) | | | | | | | (167,820 | ) | | | | | | | (9,133 | ) | | | | | | | (132,556 | ) |
| | | | | | | | | | | | | | | | | | | | | | | | | | | | |
| Net increase in shares outstanding | | | 40,082 | | | | | | | $ | 736,483 | | | | | | | | 37,584 | | | | | | | $ | 554,575 | |
| | | | | | | | | | | | | | | | | | | | | | | | | | | | |
12. Subsequent Events
Sustainable Growth Advisers, Inc. (“SGA”), subadvisor to the American Beacon SGA Global Growth Fund (the “Fund”), advised American Beacon Advisors, Inc. that it will undergo a change in control following the acquisition of a majority interest in SGA by Virtus Investment Partners, Inc. The transaction is expected to close in mid-2018, subject to customary closing conditions and client approvals. The Fund’s management team at SGA will remain in place and there will be no impact to the Fund as a result of the change in control.
46
American Beacon Acadian Emerging Markets Managed Volatility FundSM
Financial Highlights
(For a share outstanding throughout the period)
| | | | | | | | | | | | | | | | | | | | | | | | | | | | | | | | | | | | |
| | | Institutional Class | |
| | | Year Ended January 31, | | | | | | September 27,
2013A to
January 31,
2014 | |
| | | 2018 | | | | | | 2017 | | | | | | 2016 | | | | | | 2015 | | | | | |
| | | | |
Net asset value, beginning of period | | $ | 9.22 | | | | | | | $ | 8.36 | | | | | | | $ | 10.24 | | | | | | | $ | 9.59 | | | | | | | $ | 10.00 | |
| | | | | | | | | | | | | | | | | | | | | | | | | | | | | | | | | | | | |
Income from investment operations: | | | | | | | | | | | | | | | | | | | | | | | | | | | | | | | | | | | | |
Net investment income (loss) | | | 0.12 | G | | | | | | | 0.13 | | | | | | | | 0.04 | | | | | | | | 0.13 | | | | | | | | 0.02 | |
Net gains (losses) on investments (both realized and unrealized) | | | 2.65 | | | | | | | | 0.90 | | | | | | | | (1.84 | ) | | | | | | | 0.64 | | | | | | | | (0.42 | ) |
| | | | | | | | | | | | | | | | | | | | | | | | | | | | | | | | | | | | |
Total income (loss) from investment operations | | | 2.77 | | | | | | | | 1.03 | | | | | | | | (1.80 | ) | | | | | | | 0.77 | | | | | | | | (0.40 | ) |
| | | | | | | | | | | | | | | | | | | | | | | | | | | | | | | | | | | | |
Less distributions: | | | | | | | | | | | | | | | | | | | | | | | | | | | | | | | | | | | | |
Dividends from net investment income | | | (0.21 | ) | | | | | | | (0.17 | ) | | | | | | | (0.08 | ) | | | | | | | (0.12 | ) | | | | | | | (0.01 | ) |
Distributions from net realized gains | | | - | | | | | | | | - | | | | | | | | - | | | | | | | | - | | | | | | | | - | |
Tax return of capital | | | - | | | | | | | | - | | | | | | | | (0.00 | )B | | | | | | | - | | | | | | | | - | |
| | | | | | | | | | | | | | | | | | | | | | | | | | | | | | | | | | | | |
Total distributions | | | (0.21 | ) | | | | | | | (0.17 | ) | | | | | | | (0.08 | ) | | | | | | | (0.12 | ) | | | | | | | (0.01 | ) |
| | | | | | | | | | | | | | | | | | | | | | | | | | | | | | | | | | | | |
Redemption fees added to beneficial interestsB | | | - | | | | | | | | - | | | | | | | | - | | | | | | | | - | | | | | | | | - | |
| | | | | | | | | | | | | | | | | | | | | | | | | | | | | | | | | | | | |
Net asset value, end of period | | $ | 11.78 | | | | | | | $ | 9.22 | | | | | | | $ | 8.36 | | | | | | | $ | 10.24 | | | | | | | $ | 9.59 | |
| | | | | | | | | | | | | | | | | | | | | | | | | | | | | | | | | | | | |
Total returnC | | | 30.24 | % | | | | | | | 12.37 | % | | | | | | | (17.58 | )% | | | | | | | 8.04 | % | | | | | | | (4.05 | )%D |
| | | | | | | | | | | | | | | | | | | | | | | | | | | | | | | | | | | | |
| | | | | | | | | |
Ratios and supplemental data: | | | | | | | | | | | | | | | | | | | | | | | | | | | | | | | | | | | | |
Net assets, end of period | | $ | 5,706,260 | | | | | | | $ | 52,787,468 | | | | | | | $ | 40,335,580 | | | | | | | $ | 13,079,558 | | | | | | | $ | 9,968,951 | |
Ratios to average net assets: | | | | | | | | | | | | | | | | | | | | | | | | | | | | | | | | | | | | |
Expenses, before reimbursements | | | 1.85 | % | | | | | | | 1.47 | % | | | | | | | 1.68 | % | | | | | | | 2.26 | % | | | | | | | 4.20 | %E |
Expenses, net of reimbursements | | | 1.35 | % | | | | | | | 1.35 | % | | | | | | | 1.35 | % | | | | | | | 1.35 | % | | | | | | | 1.35 | %E |
Net investment income (loss), before expense reimbursements | | | 0.74 | % | | | | | | | 1.18 | % | | | | | | | 1.16 | % | | | | | | | 0.44 | % | | | | | | | (2.30 | )%E |
Net investment income, net of reimbursements | | | 1.23 | % | | | | | | | 1.31 | % | | | | | | | 1.49 | % | | | | | | | 1.35 | % | | | | | | | 0.55 | %E |
Portfolio turnover rate | | | 34 | % | | | | | | | 32 | % | | | | | | | 35 | % | | | | | | | 22 | % | | | | | | | 9 | %F |
| A | Commencement of operations. |
| B | Amount represents less than $0.01 per share. |
| C | Based on net asset value, which does not reflect the sales charge, redemption fee, or contingent deferred sales charge, if applicable. May include adjustments in accordance with U.S. GAAP and as such, the net asset value for reporting purposes and the returns based upon those net asset values may differ from the net asset value and returns for shareholder transactions. |
| F | Portfolio turnover rate is for the period from September 27, 2013 through January 31, 2014 and is not annualized. |
| G | Per share amounts have been calculated using the average shares method. |
See accompanying notes
47
American Beacon Acadian Emerging Markets Managed Volatility FundSM
Financial Highlights
(For a share outstanding throughout the period)
| | | | | | | | | | | | | | | | | | | | | | | | | | | | | | | | | | | | |
| | | Y Class | |
| | | Year Ended January 31, | | | | | | September 27,
2013A to
January 31,
2014 | |
| | | 2018 | | | | | | 2017 | | | | | | 2016 | | | | | | 2015 | | | | | |
| | | | |
Net asset value, beginning of period | | $ | 9.19 | | | | | | | $ | 8.34 | | | | | | | $ | 10.22 | | | | | | | $ | 9.59 | | | | | | | $ | 10.00 | |
| | | | | | | | | | | | | | | | | | | | | | | | | | | | | | | | | | | | |
Income from investment operations: | | | | | | | | | | | | | | | | | | | | | | | | | | | | | | | | | | | | |
Net investment income | | | 0.13 | | | | | | | | 0.11 | | | | | | | | 0.14 | | | | | | | | 0.04 | | | | | | | | 0.01 | |
Net gains (losses) on investments (both realized and unrealized) | | | 2.62 | | | | | | | | 0.91 | | | | | | | | (1.94 | ) | | | | | | | 0.71 | | | | | | | | (0.41 | ) |
| | | | | | | | | | | | | | | | | | | | | | | | | | | | | | | | | | | | |
Total income (loss) from investment operations | | | 2.75 | | | | | | | | 1.02 | | | | | | | | (1.80 | ) | | | | | | | 0.75 | | | | | | | | (0.40 | ) |
| | | | | | | | | | | | | | | | | | | | | | | | | | | | | | | | | | | | |
Less distributions: | | | | | | | | | | | | | | | | | | | | | | | | | | | | | | | | | | | | |
Dividends from net investment income | | | (0.21 | ) | | | | | | | (0.17 | ) | | | | | | | (0.08 | ) | | | | | | | (0.12 | ) | | | | | | | (0.01 | ) |
Distributions from net realized gains | | | - | | | | | | | | - | | | | | | | | - | | | | | | | | - | | | | | | | | - | |
Tax return of capital | | | - | | | | | | | | - | | | | | | | | (0.00 | )B | | | | | | | - | | | | | | | | - | |
| | | | | | | | | | | | | | | | | | | | | | | | | | | | | | | | | | | | |
Total distributions | | | (0.21 | ) | | | | | | | (0.17 | ) | | | | | | | (0.08 | ) | | | | | | | (0.12 | ) | | | | | | | (0.01 | ) |
| | | | | | | | | | | | | | | | | | | | | | | | | | | | | | | | | | | | |
Redemption fees added to beneficial interestsB | | | - | | | | | | | | - | | | | | | | | - | | | | | | | | - | | | | | | | | - | |
| | | | | | | | | | | | | | | | | | | | | | | | | | | | | | | | | | | | |
Net asset value, end of period | | $ | 11.73 | | | | | | | $ | 9.19 | | | | | | | $ | 8.34 | | | | | | | $ | 10.22 | | | | | | | $ | 9.59 | |
| | | | | | | | | | | | | | | | | | | | | | | | | | | | | | | | | | | | |
Total returnC | | | 30.12 | % | | | | | | | 12.28 | % | | | | | | | (17.64 | )% | | | | | | | 7.83 | % | | | | | | | (4.05 | )%D |
| | | | | | | | | | | | | | | | | | | | | | | | | | | | | | | | | | | | |
| | | | | | | | | |
Ratios and supplemental data: | | | | | | | | | | | | | | | | | | | | | | | | | | | | | | | | | | | | |
Net assets, end of period | | $ | 27,820,209 | | | | | | | $ | 32,606,568 | | | | | | | $ | 25,098,823 | | | | | | | $ | 4,603,907 | | | | | | | $ | 488,729 | |
Ratios to average net assets: | | | | | | | | | | | | | | | | | | | | | | | | | | | | | | | | | | | | |
Expenses, before reimbursements | | | 1.93 | % | | | | | | | 1.55 | % | | | | | | | 1.77 | % | | | | | | | 2.12 | % | | | | | | | 6.19 | %E |
Expenses, net of reimbursements | | | 1.45 | % | | | | | | | 1.45 | % | | | | | | | 1.45 | % | | | | | | | 1.45 | % | | | | | | | 1.45 | %E |
Net investment income (loss), before expense reimbursements | | | 1.04 | % | | | | | | | 1.15 | % | | | | | | | 1.23 | % | | | | | | | 0.01 | % | | | | | | | (4.30 | )%E |
Net investment income, net of reimbursements | | | 1.52 | % | | | | | | | 1.25 | % | | | | | | | 1.55 | % | | | | | | | 0.68 | % | | | | | | | 0.44 | %E |
Portfolio turnover rate | | | 34 | % | | | | | | | 32 | % | | | | | | | 35 | % | | | | | | | 22 | % | | | | | | | 9 | %F |
| A | Commencement of operations. |
| B | Amount represents less than $0.01 per share. |
| C | Based on net asset value, which does not reflect the sales charge, redemption fee, or contingent deferred sales charge, if applicable. May include adjustments in accordance with U.S. GAAP and as such, the net asset value for reporting purposes and the returns based upon those net asset values may differ from the net asset value and returns for shareholder transactions. |
| F | Portfolio turnover rate is for the period from September 27, 2013 through January 31, 2014 and is not annualized. |
See accompanying notes
48
American Beacon Acadian Emerging Markets Managed Volatility FundSM
Financial Highlights
(For a share outstanding throughout the period)
| | | | | | | | | | | | | | | | | | | | | | | | | | | | | | | | | | | | |
| | | Investor Class | |
| | | Year Ended January 31, | | | | | | September 27,
2013A to
January 31,
2014 | |
| | | 2018 | | | | | | 2017 | | | | | | 2016 | | | | | | 2015 | | | | | |
| | | | |
Net asset value, beginning of period | | $ | 9.16 | | | | | | | $ | 8.32 | | | | | | | $ | 10.19 | | | | | | | $ | 9.58 | | | | | | | $ | 10.00 | |
| | | | | | | | | | | | | | | | | | | | | | | | | | | | | | | | | | | | |
Income from investment operations: | | | | | | | | | | | | | | | | | | | | | | | | | | | | | | | | | | | | |
Net investment income | | | 0.11 | | | | | | | | 0.11 | | | | | | | | 0.16 | | | | | | | | 0.07 | | | | | | | | 0.00 | B |
Net gains (losses) on investments (both realized and unrealized) | | | 2.60 | | | | | | | | 0.87 | | | | | | | | (1.98 | ) | | | | | | | 0.66 | | | | | | | | (0.41 | ) |
| | | | | | | | | | | | | | | | | | | | | | | | | | | | | | | | | | | | |
Total income (loss) from investment operations | | | 2.71 | | | | | | | | 0.98 | | | | | | | | (1.82 | ) | | | | | | | 0.73 | | | | | | | | (0.41 | ) |
| | | | | | | | | | | | | | | | | | | | | | | | | | | | | | | | | | | | |
Less distributions: | | | | | | | | | | | | | | | | | | | | | | | | | | | | | | | | | | | | |
Dividends from net investment income | | | (0.21 | ) | | | | | | | (0.14 | ) | | | | | | | (0.05 | ) | | | | | | | (0.12 | ) | | | | | | | (0.01 | ) |
Distributions from net realized gains | | | - | | | | | | | | - | | | | | | | | - | | | | | | | | - | | | | | | | | - | |
Tax return of capital | | | - | | | | | | | | - | | | | | | | | (0.00 | )B | | | | | | | - | | | | | | | | - | |
| | | | | | | | | | | | | | | | | | | | | | | | | | | | | | | | | | | | |
Total distributions | | | (0.21 | ) | | | | | | | (0.14 | ) | | | | | | | (0.05 | ) | | | | | | | (0.12 | ) | | | | | | | (0.01 | ) |
| | | | | | | | | | | | | | | | | | | | | | | | | | | | | | | | | | | | |
Redemption fees added to beneficial interestsB | | | - | | | | | | | | - | | | | | | | | - | | | | | | | | - | | | | | | | | - | |
| | | | | | | | | | | | | | | | | | | | | | | | | | | | | | | | | | | | |
Net asset value, end of period | | $ | 11.66 | | | | | | | $ | 9.16 | | | | | | | $ | 8.32 | | | | | | | $ | 10.19 | | | | | | | $ | 9.58 | |
| | | | | | | | | | | | | | | | | | | | | | | | | | | | | | | | | | | | |
Total returnC | | | 29.78 | % | | | | | | | 11.89 | % | | | | | | | (17.86 | )% | | | | | | | 7.63 | % | | | | | | | (4.15 | )%D |
| | | | | | | | | | | | | | | | | | | | | | | | | | | | | | | | | | | | |
| | | | | | | | | |
Ratios and supplemental data: | | | | | | | | | | | | | | | | | | | | | | | | | | | | | | | | | | | | |
Net assets, end of period | | $ | 3,016,153 | | | | | | | $ | 3,457,789 | | | | | | | $ | 3,933,437 | | | | | | | $ | 4,612,098 | | | | | | | $ | 1,326,164 | |
Ratios to average net assets: | | | | | | | | | | | | | | | | | | | | | | | | | | | | | | | | | | | | |
Expenses, before reimbursements | | | 2.12 | % | | | | | | | 1.77 | % | | | | | | | 1.98 | % | | | | | | | 2.42 | % | | | | | | | 5.46 | %E |
Expenses, net of reimbursements | | | 1.73 | % | | | | | | | 1.73 | % | | | | | | | 1.73 | % | | | | | | | 1.73 | % | | | | | | | 1.73 | %E |
Net investment income (loss), before expense reimbursements | | | 0.82 | % | | | | | | | 0.94 | % | | | | | | | 1.30 | % | | | | | | | 0.12 | % | | | | | | | (3.60 | )%E |
Net investment income, net of reimbursements | | | 1.21 | % | | | | | | | 0.98 | % | | | | | | | 1.55 | % | | | | | | | 0.81 | % | | | | | | | 0.13 | %E |
Portfolio turnover rate | | | 34 | % | | | | | | | 32 | % | | | | | | | 35 | % | | | | | | | 22 | % | | | | | | | 9 | %F |
| A | Commencement of operations. |
| B | Amount represents less than $0.01 per share. |
| C | Based on net asset value, which does not reflect the sales charge, redemption fee, or contingent deferred sales charge, if applicable. May include adjustments in accordance with U.S. GAAP and as such, the net asset value for reporting purposes and the returns based upon those net asset values may differ from the net asset value and returns for shareholder transactions. |
| F | Portfolio turnover rate is for the period from September 27, 2013 through January 31, 2014 and is not annualized. |
See accompanying notes
49
American Beacon Acadian Emerging Markets Managed Volatility FundSM
Financial Highlights
(For a share outstanding throughout the period)
| | | | | | | | | | | | | | | | | | | | | | | | | | | | | | | | | | | | |
| | | A Class | |
| | | Year Ended January 31, | | | | | | September 27,
2013A to
January 31,
2014 | |
| | | 2018 | | | | | | 2017 | | | | | | 2016 | | | | | | 2015 | | | | | |
| | | | |
Net asset value, beginning of period | | $ | 9.18 | | | | | | | $ | 8.34 | | | | | | | $ | 10.18 | | | | | | | $ | 9.58 | | | | | | | $ | 10.00 | |
| | | | | | | | | | | | | | | | | | | | | | | | | | | | | | | | | | | | |
Income from investment operations: | | | | | | | | | | | | | | | | | | | | | | | | | | | | | | | | | | | | |
Net investment income | | | 0.10 | | | | | | | | 0.13 | | | | | | | | 0.12 | | | | | | | | 0.06 | | | | | | | | 0.00 | B |
Net gains (losses) on investments (both realized and unrealized) | | | 2.62 | | | | | | | | 0.85 | | | | | | | | (1.94 | ) | | | | | | | 0.66 | | | | | | | | (0.41 | ) |
| | | | | | | | | | | | | | | | | | | | | | | | | | | | | | | | | | | | |
Total income (loss) from investment operations | | | 2.72 | | | | | | | | 0.98 | | | | | | | | (1.82 | ) | | | | | | | 0.72 | | | | | | | | (0.41 | ) |
| | | | | | | | | | | | | | | | | | | | | | | | | | | | | | | | | | | | |
Less distributions: | | | | | | | | | | | | | | | | | | | | | | | | | | | | | | | | | | | | |
Dividends from net investment income | | | (0.21 | ) | | | | | | | (0.14 | ) | | | | | | | (0.02 | ) | | | | | | | (0.12 | ) | | | | | | | (0.01 | ) |
Distributions from net realized gains | | | - | | | | | | | | - | | | | | | | | - | | | | | | | | - | | | | | | | | - | |
Tax return of capital | | | - | | | | | | | | - | | | | | | | | (0.00 | )B | | | | | | | - | | | | | | | | - | |
| | | | | | | | | | | | | | | | | | | | | | | | | | | | | | | | | | | | |
Total distributions | | | (0.21 | ) | | | | | | | (0.14 | ) | | | | | | | (0.02 | ) | | | | | | | (0.12 | ) | | | | | | | (0.01 | ) |
| | | | | | | | | | | | | | | | | | | | | | | | | | | | | | | | | | | | |
Redemption fees added to beneficial interestsB | | | - | | | | | | | | - | | | | | | | | - | | | | | | | | - | | | | | | | | - | |
| | | | | | | | | | | | | | | | | | | | | | | | | | | | | | | | | | | | |
Net asset value, end of period | | $ | 11.69 | | | | | | | $ | 9.18 | | | | | | | $ | 8.34 | | | | | | | $ | 10.18 | | | | | | | $ | 9.58 | |
| | | | | | | | | | | | | | | | | | | | | | | | | | | | | | | | | | | | |
Total returnC | | | 29.83 | % | | | | | | | 11.84 | % | | | | | | | (17.90 | )% | | | | | | | 7.53 | % | | | | | | | (4.15 | )%D |
| | | | | | | | | | | | | | | | | | | | | | | | | | | | | | | | | | | | |
| | | | | | | | | |
Ratios and supplemental data: | | | | | | | | | | | | | | | | | | | | | | | | | | | | | | | | | | | | |
Net assets, end of period | | $ | 849,017 | | | | | | | $ | 510,236 | | | | | | | $ | 740,272 | | | | | | | $ | 3,214,591 | | | | | | | $ | 554,182 | |
Ratios to average net assets: | | | | | | | | | | | | | | | | | | | | | | | | | | | | | | | | | | | | |
Expenses, before reimbursements | | | 2.24 | % | | | | | | | 1.90 | % | | | | | | | 2.10 | % | | | | | | | 2.49 | % | | | | | | | 7.71 | %E |
Expenses, net of reimbursements | | | 1.75 | % | | | | | | | 1.75 | %�� | | | | | | | 1.75 | % | | | | | | | 1.77 | % | | | | | | | 1.85 | %E |
Net investment income (loss), before expense reimbursements | | | 0.61 | % | | | | | | | 0.86 | % | | | | | | | 1.08 | % | | | | | | | 0.09 | % | | | | | | | (5.92 | )%E |
Net investment income (loss), net of reimbursements | | | 1.10 | % | | | | | | | 1.01 | % | | | | | | | 1.43 | % | | | | | | | 0.81 | % | | | | | | | (0.07 | )%E |
Portfolio turnover rate | | | 34 | % | | | | | | | 32 | % | | | | | | | 35 | % | | | | | | | 22 | % | | | | | | | 9 | %F |
| A | Commencement of operations. |
| B | Amount represents less than $0.01 per share. |
| C | Based on net asset value, which does not reflect the sales charge, redemption fee, or contingent deferred sales charge, if applicable. May include adjustments in accordance with U.S. GAAP and as such, the net asset value for reporting purposes and the returns based upon those net asset values may differ from the net asset value and returns for shareholder transactions. |
| F | Portfolio turnover rate is for the period from September 27, 2013 through January 31, 2014 and is not annualized. |
See accompanying notes
50
American Beacon Acadian Emerging Markets Managed Volatility FundSM
Financial Highlights
(For a share outstanding throughout the period)
| | | | | | | | | | | | | | | | | | | | | | | | | | | | | | | | | | | | |
| | | C Class | |
| | | Year Ended January 31, | | | | | | September 27,
2013A to
January 31,
2014 | |
| | | 2018 | | | | | | 2017 | | | | | | 2016 | | | | | | 2015 | | | | | |
| | | | |
Net asset value, beginning of period | | $ | 9.08 | | | | | | | $ | 8.23 | | | | | | | $ | 10.10 | | | | | | | $ | 9.55 | | | | | | | $ | 10.00 | |
| | | | | | | | | | | | | | | | | | | | | | | | | | | | | | | | | | | | |
Income from investment operations: | | | | | | | | | | | | | | | | | | | | | | | | | | | | | | | | | | | | |
Net investment income (loss) | | | 0.06 | | | | | | | | 0.02 | | | | | | | | 0.10 | | | | | | | | 0.02 | | | | | | | | (0.01 | ) |
Net gains (losses) on investments (both realized and unrealized) | | | 2.54 | | | | | | | | 0.89 | | | | | | | | (1.97 | ) | | | | | | | 0.62 | | | | | | | | (0.43 | ) |
| | | | | | | | | | | | | | | | | | | | | | | | | | | | | | | | | | | | |
Total income (loss) from investment operations | | | 2.60 | | | | | | | | 0.91 | | | | | | | | (1.87 | ) | | | | | | | 0.64 | | | | | | | | (0.44 | ) |
| | | | | | | | | | | | | | | | | | | | | | | | | | | | | | | | | | | | |
Less distributions: | | | | | | | | | | | | | | | | | | | | | | | | | | | | | | | | | | | | |
Dividends from net investment income | | | (0.13 | ) | | | | | | | (0.06 | ) | | | | | | | (0.00 | )B | | | | | | | (0.09 | ) | | | | | | | (0.01 | ) |
Distributions from net realized gains | | | - | | | | | | | | - | | | | | | | | - | | | | | | | | - | | | | | | | | - | |
Tax return of capital | | | - | | | | | | | | - | | | | | | | | (0.00 | )B | | | | | | | - | | | | | | | | - | |
| | | | | | | | | | | | | | | | | | | | | | | | | | | | | | | | | | | | |
Total distributions | | | (0.13 | ) | | | | | | | (0.06 | ) | | | | | | | (0.00 | )B | | | | | | | (0.09 | ) | | | | | | | (0.01 | ) |
| | | | | | | | | | | | | | | | | | | | | | | | | | | | | | | | | | | | |
Redemption fees added to beneficial interestsB | | | - | | | | | | | | - | | | | | | | | - | | | | | | | | - | | | | | | | | - | |
| | | | | | | | | | | | | | | | | | | | | | | | | | | | | | | | | | | | |
Net asset value, end of period | | $ | 11.55 | | | | | | | $ | 9.08 | | | | | | | $ | 8.23 | | | | | | | $ | 10.10 | | | | | | | $ | 9.55 | |
| | | | | | | | | | | | | | | | | | | | | | | | | | | | | | | | | | | | |
Total returnC | | | 28.71 | % | | | | | | | 11.11 | % | | | | | | | (18.50 | )% | | | | | | | 6.66 | % | | | | | | | (4.45 | )%D |
| | | | | | | | | | | | | | | | | | | | | | | | | | | | | | | | | | | | |
| | | | | | | | | |
Ratios and supplemental data: | | | | | | | | | | | | | | | | | | | | | | | | | | | | | | | | | | | | |
Net assets, end of period | | $ | 503,049 | | | | | | | $ | 450,626 | | | | | | | $ | 644,705 | | | | | | | $ | 623,506 | | | | | | | $ | 148,736 | |
Ratios to average net assets: | | | | | | | | | | | | | | | | | | | | | | | | | | | | | | | | | | | | |
Expenses, before reimbursements | | | 3.00 | % | | | | | | | 2.67 | % | | | | | | | 2.87 | % | | | | | | | 3.26 | % | | | | | | �� | 10.04 | %E |
Expenses, net of reimbursements | | | 2.50 | % | | | | | | | 2.50 | % | | | | | | | 2.50 | % | | | | | | | 2.52 | % | | | | | | | 2.60 | %E |
Net investment income (loss), before expense reimbursements | | | (0.01 | )% | | | | | | | 0.11 | % | | | | | | | 0.40 | % | | | | | | | (0.90 | )% | | | | | | | (8.13 | )%E |
Net investment income (loss), net of reimbursements | | | 0.49 | % | | | | | | | 0.28 | % | | | | | | | 0.77 | % | | | | | | | (0.16 | )% | | | | | | | (0.68 | )%E |
Portfolio turnover rate | | | 34 | % | | | | | | | 32 | % | | | | | | | 35 | % | | | | | | | 22 | % | | | | | | | 9 | %F |
| A | Commencement of operations. |
| B | Amount represents less than $0.01 per share. |
| C | Based on net asset value, which does not reflect the sales charge, redemption fee, or contingent deferred sales charge, if applicable. May include adjustments in accordance with U.S. GAAP and as such, the net asset value for reporting purposes and the returns based upon those net asset values may differ from the net asset value and returns for shareholder transactions. |
| F | Portfolio turnover rate is for the period from September 27, 2013 through January 31, 2014 and is not annualized. |
See accompanying notes
51
American Beacon SGA Global Growth FundSM
Financial Highlights
(For a share outstanding throughout the period)
| | | | | | | | | | | | | | | | | | | | | | | | | | | | | | | | | | | | | | | | | | | | |
| | | Institutional Class | |
| | | Year Ended January 31, | | | | | | Four Months
Ended
January 31,
2014 | | | | | | Year Ended
September 30,
2013 | |
| | | 2018 | | | | | | 2017 | | | | | | 2016 | | | | | | 2015 | | | | | |
| | | | |
Net asset value, beginning of period | | $ | 15.11 | | | | | | | $ | 13.79 | | | | | | | $ | 13.43 | | | | | | | $ | 13.05 | | | | | | | $ | 13.15 | | | | | | | $ | 12.04 | |
| | | | | | | | | | | | | | | | | | | | | | | | | | | | | | | | | | | | | | | | | | | | |
Income from investment operations: | | | | | | | | | | | | | | | | | | | | | | | | | | | | | | | | | | | | | | | | | | | | |
Net investment income (loss) | | | (0.01 | ) | | | | | | | 0.03 | | | | | | | | 0.03 | | | | | | | | 0.06 | | | | | | | | 0.01 | | | | | | | | (0.04 | )A |
Net gains on investments (both realized and unrealized) | | | 5.65 | | | | | | | | 1.84 | | | | | | | | 0.56 | | | | | | | | 0.72 | | | | | | | | 0.15 | | | | | | | | 1.36 | |
| | | | | | | | | | | | | | | | | | | | | | | | | | | | | | | | | | | | | | | | | | | | |
Total income from investment operations | | | 5.64 | | | | | | | | 1.87 | | | | | | | | 0.59 | | | | | | | | 0.78 | | | | | | | | 0.16 | | | | | | | | 1.32 | |
| | | | | | | | | | | | | | | | | | | | | | | | | | | | | | | | | | | | | | | | | | | | |
Less distributions: | | | | | | | | | | | | | | | | | | | | | | | | | | | | | | | | | | | | | | | | | | | | |
Dividends from net investment income | | | - | | | | | | | | - | | | | | | | | (0.02 | ) | | | | | | | (0.03 | ) | | | | | | | - | | | | | | | | - | |
Distributions from net realized gains | | | (0.64 | ) | | | | | | | (0.55 | ) | | | | | | | (0.21 | ) | | | | | | | (0.37 | ) | | | | | | | (0.26 | ) | | | | | | | (0.21 | ) |
| | | | | | | | | | | | | | | | | | | | | | | | | | | | | | | | | | | | | | | | | | | | |
Total distributions | | | (0.64 | ) | | | | | | | (0.55 | ) | | | | | | | (0.23 | ) | | | | | | | (0.40 | ) | | | | | | | (0.26 | ) | | | | | | | (0.21 | ) |
| | | | | | | | | | | | | | | | | | | | | | | | | | | | | | | | | | | | | | | | | | | | |
Net asset value, end of period | | $ | 20.11 | | | | | | | $ | 15.11 | | | | | | | $ | 13.79 | | | | | | | $ | 13.43 | | | | | | | $ | 13.05 | | | | | | | $ | 13.15 | |
| | | | | | | | | | | | | | | | | | | | | | | | | | | | | | | | | | | | | | | | | | | | |
Total returnB | | | 37.64 | % | | | | | | | 13.66 | % | | | | | | | 4.26 | % | | | | | | | 5.98 | % | | | | | | | 1.13 | %C | | | | | | | 11.21 | %D |
| | | | | | | | | | | | | | | | | | | | | | | | | | | | | | | | | | | | | | | | | | | | |
|
Ratios and supplemental data: | |
Net assets, end of period | | $ | 15,912,971 | | | | | | | $ | 7,698,159 | | | | | | | $ | 6,219,477 | | | | | | | $ | 5,106,079 | | | | | | | $ | 4,738,199 | | | | | | | $ | 4,351,023 | |
Ratios to average net assets: | | | | | | | | | | | | | | | | | | | | | | | | | | | | | | | | | | | | | | | | | | | | |
Expenses, before reimbursements | | | 1.34 | % | | | | | | | 2.03 | % | | | | | | | 2.62 | % | | | | | | | 3.82 | % | | | | | | | 5.28 | %E | | | | | | | 8.00 | % |
Expenses, net of reimbursements | | | 0.98 | % | | | | | | | 0.98 | % | | | | | | | 0.98 | % | | | | | | | 0.98 | % | | | | | | | 1.00 | %E | | | | | | | 1.75 | % |
Net investment (loss), before expense reimbursements | | | (0.28 | )% | | | | | | | (0.83 | )% | | | | | | | (1.37 | )% | | | | | | | (2.41 | )% | | | | | | | (4.12 | )%E | | | | | | | (6.56 | )% |
Net investment income (loss), net of reimbursements | | | 0.08 | % | | | | | | | 0.21 | % | | | | | | | 0.27 | % | | | | | | | 0.42 | % | | | | | | | 0.16 | %E | | | | | | | (0.31 | )% |
Portfolio turnover rate | | | 31 | % | | | | | | | 32 | % | | | | | | | 39 | % | | | | | | | 38 | % | | | | | | | 15 | %F | | | | | | | 39 | % |
| A | The Predecessor Fund calculated the change in undistributed net investment income based on average shares outstanding during the period. |
| B | Based on net asset value, which does not reflect the sales charge, redemption fee, or contingent deferred sales charge, if applicable. May include adjustments in accordance with U.S. GAAP and as such, the net asset value for reporting purposes and the returns based upon those net asset values may differ from the net asset value and returns for shareholder transactions. |
| D | Total returns would have been lower had expenses not been waived or absorbed by the Predecessor Fund. Returns shown do not reflect the deduction of taxes that a shareholder would pay on Fund distribution or the redemption of Fund shares. |
| F | Portfolio turnover rate is for the period from October 1, 2013 through January 31, 2014 and is not annualized. |
See accompanying notes
52
American Beacon SGA Global Growth FundSM
Financial Highlights
(For a share outstanding throughout the period)
| | | | | | | | | | | | | | | | | | | | | | | | | | | | | | | | | | | | |
| | | Y Class | |
| | | Year Ended January 31, | | | | | | October 4,
2013A to
January 31,
2014 | |
| | | 2018 | | | | | | 2017 | | | | | | 2016 | | | | | | 2015 | | | | | |
| | | | |
Net asset value, beginning of period | | $ | 15.05 | | | | | | | $ | 13.75 | | | | | | | $ | 13.41 | | | | | | | $ | 13.05 | | | | | | | $ | 13.25 | |
| | | | | | | | | | | | | | | | | | | | | | | | | | | | | | | | | | | | |
Income from investment operations: | | | | | | | | | | | | | | | | | | | | | | | | | | | | | | | | | | | | |
Net investment income (loss) | | | 0.00 | B | | | | | | | (0.03 | ) | | | | | | | 0.02 | | | | | | | | 0.04 | | | | | | | | 0.00 | B |
Net gains on investments (both realized and unrealized) | | | 5.60 | | | | | | | | 1.88 | | | | | | | | 0.55 | | | | | | | | 0.72 | | | | | | | | 0.06 | |
| | | | | | | | | | | | | | | | | | | | | | | | | | | | | | | | | | | | |
Total income from investment operations | | | 5.60 | | | | | | | | 1.85 | | | | | | | | 0.57 | | | | | | | | 0.76 | | | | | | | | 0.06 | |
| | | | | | | | | | | | | | | | | | | | | | | | | | | | | | | | | | | | |
Less distributions: | | | | | | | | | | | | | | | | | | | | | | | | | | | | | | | | | | | | |
Dividends from net investment income | | | - | | | | | | | | - | | | | | | | | (0.02 | ) | | | | | | | (0.03 | ) | | | | | | | - | |
Distributions from net realized gains | | | (0.64 | ) | | | | | | | (0.55 | ) | | | | | | | (0.21 | ) | | | | | | | (0.37 | ) | | | | | | | (0.26 | ) |
| | | | | | | | | | | | | | | | | | | | | | | | | | | | | | | | | | | | |
Total distributions | | | (0.64 | ) | | | | | | | (0.55 | ) | | | | | | | (0.23 | ) | | | | | | | (0.40 | ) | | | | | | | (0.26 | ) |
| | | | | | | | | | | | | | | | | | | | | | | | | | | | | | | | | | | | |
Net asset value, end of period | | $ | 20.01 | | | | | | | $ | 15.05 | | | | | | | $ | 13.75 | | | | | | | $ | 13.41 | | | | | | | $ | 13.05 | |
| | | | | | | | | | | | | | | | | | | | | | | | | | | | | | | | | | | | |
Total returnC | | | 37.52 | % | | | | | | | 13.55 | % | | | | | | | 4.12 | % | | | | | | | 5.83 | % | | | | | | | 0.37 | %D |
| | | | | | | | | | | | | | | | | | | | | | | | | | | | | | | | | | | | |
|
Ratios and supplemental data: | |
Net assets, end of period | | $ | 5,732,352 | | | | | | | $ | 1,706,678 | | | | | | | $ | 127,585 | | | | | | | $ | 119,680 | | | | | | | $ | 105,161 | |
Ratios to average net assets: | | | | | | | | | | | | | | | | | | | | | | | | | | | | | | | | | | | | |
Expenses, before reimbursements | | | 1.40 | % | | | | | | | 1.88 | % | | | | | | | 2.72 | % | | | | | | | 3.84 | % | | | | | | | 10.23 | %E |
Expenses, net of reimbursements | | | 1.08 | % | | | | | | | 1.07 | % | | | | | | | 1.08 | % | | | | | | | 1.08 | % | | | | | | | 1.08 | %E |
Net investment (loss), before expense reimbursements | | | (0.37 | )% | | | | | | | (0.96 | )% | | | | | | | (1.51 | )% | | | | | | | (2.44 | )% | | | | | | | (9.09 | )%E |
Net investment income (loss), net of reimbursements | | | (0.04 | )% | | | | | | | (0.15 | )% | | | | | | | 0.13 | % | | | | | | | 0.32 | % | | | | | | | 0.06 | %E |
Portfolio turnover rate | | | 31 | % | | | | | | | 32 | % | | | | | | | 39 | % | | | | | | | 38 | % | | | | | | | 15 | %F |
| A | Commencement of operations. |
| B | Amount represents less than $0.01 per share. |
| C | Based on net asset value, which does not reflect the sales charge, redemption fee, or contingent deferred sales charge, if applicable. May include adjustments in accordance with U.S. GAAP and as such, the net asset value for reporting purposes and the returns based upon those net asset values may differ from the net asset value and returns for shareholder transactions. |
| F | Portfolio turnover rate is for the period from October 1, 2013 through January 31, 2014 and is not annualized. |
See accompanying notes
53
American Beacon SGA Global Growth FundSM
Financial Highlights
(For a share outstanding throughout the period)
| | | | | | | | | | | | | | | | | | | | | | | | | | | | | | | | | | | | |
| | | Investor Class | |
| | | Year Ended January 31, | | | | | | October 4,
2013A to
January 31,
2014 | |
| | | 2018 | | | | | | 2017 | | | | | | 2016 | | | | | | 2015 | | | | | |
| | | | |
Net asset value, beginning of period | | $ | 14.90 | | | | | | | $ | 13.66 | | | | | | | $ | 13.36 | | | | | | | $ | 13.03 | | | | | | | $ | 13.25 | |
| | | | | | | | | | | | | | | | | | | | | | | | | | | | | | | | | | | | |
Income from investment operations: | | | | | | | | | | | | | | | | | | | | | | | | | | | | | | | | | | | | |
Net investment income (loss) | | | (0.04 | ) | | | | | | | 0.06 | | | | | | | | (0.04 | ) | | | | | | | 0.01 | | | | | | | | (0.01 | ) |
Net gains on investments (both realized and unrealized) | | | 5.53 | | | | | | | | 1.73 | | | | | | | | 0.57 | | | | | | | | 0.72 | | | | | | | | 0.05 | |
| | | | | | | | | | | | | | | | | | | | | | | | | | | | | | | | | | | | |
Total income from investment operations | | | 5.49 | | | | | | | | 1.79 | | | | | | | | 0.53 | | | | | | | | 0.73 | | | | | | | | 0.04 | |
| | | | | | | | | | | | | | | | | | | | | | | | | | | | | | | | | | | | |
Less distributions: | | | | | | | | | | | | | | | | | | | | | | | | | | | | | | | | | | | | |
Dividends from net investment income | | | - | | | | | | | | - | | | | | | | | (0.02 | ) | | | | | | | (0.03 | ) | | | | | | | - | |
Distributions from net realized gains | | | (0.64 | ) | | | | | | | (0.55 | ) | | | | | | | (0.21 | ) | | | | | | | (0.37 | ) | | | | | | | (0.26 | ) |
| | | | | | | | | | | | | | | | | | | | | | | | | | | | | | | | | | | | |
Total distributions | | | (0.64 | ) | | | | | | | (0.55 | ) | | | | | | | (0.23 | ) | | | | | | | (0.40 | ) | | | | | | | (0.26 | ) |
| | | | | | | | | | | | | | | | | | | | | | | | | | | | | | | | | | | | |
Net asset value, end of period | | $ | 19.75 | | | | | | | $ | 14.90 | | | | | | | $ | 13.66 | | | | | | | $ | 13.36 | | | | | | | $ | 13.03 | |
| | | | | | | | | | | | | | | | | | | | | | | | | | | | | | | | | | | | |
Total returnB | | | 37.16 | % | | | | | | | 13.20 | % | | | | | | | 3.84 | % | | | | | | | 5.60 | % | | | | | | | 0.22 | %C |
| | | | | | | | | | | | | | | | | | | | | | | | | | | | | | | | | | | | |
|
Ratios and supplemental data: | |
Net assets, end of period | | $ | 19,473,640 | | | | | | | $ | 11,414,261 | | | | | | | $ | 421,630 | | | | | | | $ | 108,458 | | | | | | | $ | 106,990 | |
Ratios to average net assets: | | | | | | | | | | | | | | | | | | | | | | | | | | | | | | | | | | | | |
Expenses, before reimbursements | | | 1.57 | % | | | | | | | 2.05 | % | | | | | | | 3.08 | % | | | | | | | 5.28 | % | | | | | | | 10.37 | %D |
Expenses, net of reimbursements | | | 1.36 | % | | | | | | | 1.34 | % | | | | | | | 1.36 | % | | | | | | | 1.36 | % | | | | | | | 1.36 | %D |
Net investment (loss), before expense reimbursements | | | (0.50 | )% | | | | | | | (1.14 | )% | | | | | | | (2.04 | )% | | | | | | | (3.88 | )% | | | | | | | (9.22 | )%D |
Net investment income (loss), net of reimbursements | | | (0.29 | )% | | | | | | | (0.43 | )% | | | | | | | (0.32 | )% | | | | | | | 0.05 | % | | | | | | | (0.22 | )%D |
Portfolio turnover rate | | | 31 | % | | | | | | | 32 | % | | | | | | | 39 | % | | | | | | | 38 | % | | | | | | | 15 | %E |
| A | Commencement of operations. |
| B | Based on net asset value, which does not reflect the sales charge, redemption fee, or contingent deferred sales charge, if applicable. May include adjustments in accordance with U.S. GAAP and as such, the net asset value for reporting purposes and the returns based upon those net asset values may differ from the net asset value and returns for shareholder transactions. |
| E | Portfolio turnover rate is for the period from October 1, 2013 through January 31, 2014 and is not annualized. |
See accompanying notes
54
American Beacon SGA Global Growth FundSM
Financial Highlights
(For a share outstanding throughout the period)
| | | | | | | | | | | | | | | | | | | | | | | | | | | | | | | | | | | | |
| | | A Class | |
| | | Year Ended January 31, | | | | | | October 4,
2013A to
January 31,
2014 | |
| | | 2018 | | | | | | 2017 | | | | | | 2016 | | | | | | 2015 | | | | | |
| | | | |
Net asset value, beginning of period | | $ | 14.89 | | | | | | | $ | 13.65 | | | | | | | $ | 13.35 | | | | | | | $ | 13.03 | | | | | | | $ | 13.25 | |
| | | | | | | | | | | | | | | | | | | | | | | | | | | | | | | | | | | | |
Income from investment operations: | | | | | | | | | | | | | | | | | | | | | | | | | | | | | | | | | | | | |
Net investment income (loss) | | | (0.02 | ) | | | | | | | 0.03 | | | | | | | | (0.03 | ) | | | | | | | 0.00 | B | | | | | | | 0.00 | B |
Net gains on investments (both realized and unrealized) | | | 5.49 | | | | | | | | 1.76 | | | | | | | | 0.56 | | | | | | | | 0.72 | | | | | | | | 0.04 | |
| | | | | | | | | | | | | | | | | | | | | | | | | | | | | | | | | | | | |
Total income from investment operations | | | 5.47 | | | | | | | | 1.79 | | | | | | | | 0.53 | | | | | | | | 0.72 | | | | | | | | 0.04 | |
| | | | | | | | | | | | | | | | | | | | | | | | | | | | | | | | | | | | |
Less distributions: | | | | | | | | | | | | | | | | | | | | | | | | | | | | | | | | | | | | |
Dividends from net investment income | | | - | | | | | | | | - | | | | | | | | (0.02 | ) | | | | | | | (0.03 | ) | | | | | | | - | |
Distributions from net realized gains | | | (0.64 | ) | | | | | | | (0.55 | ) | | | | | | | (0.21 | ) | | | | | | | (0.37 | ) | | | | | | | (0.26 | ) |
| | | | | | | | | | | | | | | | | | | | | | | | | | | | | | | | | | | | |
Total distributions | | | (0.64 | ) | | | | | | | (0.55 | ) | | | | | | | (0.23 | ) | | | | | | | (0.40 | ) | | | | | | | (0.26 | ) |
| | | | | | | | | | | | | | | | | | | | | | | | | | | | | | | | | | | | |
Net asset value, end of period | | $ | 19.72 | | | | | | | $ | 14.89 | | | | | | | $ | 13.65 | | | | | | | $ | 13.35 | | | | | | | $ | 13.03 | |
| | | | | | | | | | | | | | | | | | | | | | | | | | | | | | | | | | | | |
Total returnC | | | 37.05 | % | | | | | | | 13.21 | % | | | | | | | 3.84 | % | | | | | | | 5.53 | % | | | | | | | 0.22 | %D |
| | | | | | | | | | | | | | | | | | | | | | | | | | | | | | | | | | | | |
|
Ratios and supplemental data: | |
Net assets, end of period | | $ | 3,835,023 | | | | | | | $ | 1,028,223 | | | | | | | $ | 345,107 | | | | | | | $ | 434,636 | | | | | | | $ | 362,595 | |
Ratios to average net assets: | | | | | | | | | | | | | | | | | | | | | | | | | | | | | | | | | | | | |
Expenses, before reimbursements | | | 1.72 | % | | | | | | | 2.33 | % | | | | | | | 3.05 | % | | | | | | | 4.19 | % | | | | | | | 8.22 | %E |
Expenses, net of reimbursements | | | 1.38 | % | | | | | | | 1.38 | % | | | | | | | 1.38 | % | | | | | | | 1.42 | % | | | | | | | 1.48 | %E |
Net investment (loss), before expense reimbursements | | | (0.77 | )% | | | | | | | (1.22 | )% | | | | | | | (1.90 | )% | | | | | | | (2.78 | )% | | | | | | | (6.91 | )%E |
Net investment (loss), net of reimbursements | | | (0.43 | )% | | | | | | | (0.27 | )% | | | | | | | (0.22 | )% | | | | | | | (0.01 | )% | | | | | | | (0.17 | )%E |
Portfolio turnover rate | | | 31 | % | | | | | | | 32 | % | | | | | | | 39 | % | | | | | | | 38 | % | | | | | | | 15 | %F |
| A | Commencement of operations. |
| B | Amount represents less than $0.01 per share. |
| C | Based on net asset value, which does not reflect the sales charge, redemption fee, or contingent deferred sales charge, if applicable. May include adjustments in accordance with U.S. GAAP and as such, the net asset value for reporting purposes and the returns based upon those net asset values may differ from the net asset value and returns for shareholder transactions. |
| F | Portfolio turnover rate is for the period from October 1, 2013 through January 31, 2014 and is not annualized. |
See accompanying notes
55
American Beacon SGA Global Growth FundSM
Financial Highlights
(For a share outstanding throughout the period)
| | | | | | | | | | | | | | | | | | | | | | | | | | | | | | | | | | | | |
| | | C Class | |
| | | Year Ended January 31, | | | | | | October 4,
2013A to
January 31,
2014 | |
| | | 2018 | | | | | | 2017 | | | | | | 2016 | | | | | | 2015 | | | | | |
| | | | |
Net asset value, beginning of period | | $ | 14.50 | | | | | | | $ | 13.40 | | | | | | | $ | 13.21 | | | | | | | $ | 13.00 | | | | | | | $ | 13.25 | |
| | | | | | | | | | | | | | | | | | | | | | | | | | | | | | | | | | | | |
Income from investment operations: | | | | | | | | | | | | | | | | | | | | | | | | | | | | | | | | | | | | |
Net investment income (loss) | | | (0.04 | ) | | | | | | | 0.05 | | | | | | | | (0.12 | ) | | | | | | | (0.05 | ) | | | | | | | (0.04 | ) |
Net gains on investments (both realized and unrealized) | | | 5.22 | | | | | | | | 1.60 | | | | | | | | 0.54 | | | | | | | | 0.66 | | | | | | | | 0.05 | |
| | | | | | | | | | | | | | | | | | | | | | | | | | | | | | | | | | | | |
Total income from investment operations | | | 5.18 | | | | | | | | 1.65 | | | | | | | | 0.42 | | | | | | | | 0.61 | | | | | | | | 0.01 | |
| | | | | | | | | | | | | | | | | | | | | | | | | | | | | | | | | | | | |
Less distributions: | | | | | | | | | | | | | | | | | | | | | | | | | | | | | | | | | | | | |
Dividends from net investment income | | | - | | | | | | | | - | | | | | | | | (0.02 | ) | | | | | | | (0.03 | ) | | | | | | | - | |
Distributions from net realized gains | | | (0.64 | ) | | | | | | | (0.55 | ) | | | | | | | (0.21 | ) | | | | | | | (0.37 | ) | | | | | | | (0.26 | ) |
| | | | | | | | | | | | | | | | | | | | | | | | | | | | | | | | | | | | |
Total distributions | | | (0.64 | ) | | | | | | | (0.55 | ) | | | | | | | (0.23 | ) | | | | | | | (0.40 | ) | | | | | | | (0.26 | ) |
| | | | | | | | | | | | | | | | | | | | | | | | | | | | | | | | | | | | |
Net asset value, end of period | | $ | 19.04 | | | | | | | $ | 14.50 | | | | | | | $ | 13.40 | | | | | | | $ | 13.21 | | | | | | | $ | 13.00 | |
| | | | | | | | | | | | | | | | | | | | | | | | | | | | | | | | | | | | |
Total returnB | | | 36.04 | % | | | | | | | 12.41 | % | | | | | | | 3.04 | % | | | | | | | 4.69 | % | | | | | | | (0.01 | )%C |
| | | | | | | | | | | | | | | | | | | | | | | | | | | | | | | | | | | | |
|
Ratios and supplemental data: | |
Net assets, end of period | | $ | 2,061,699 | | | | | | | $ | 988,762 | | | | | | | $ | 410,331 | | | | | | | $ | 393,478 | | | | | | | $ | 109,489 | |
Ratios to average net assets: | | | | | | | | | | | | | | | | | | | | | | | | | | | | | | | | | | | | |
Expenses, before reimbursements | | | 2.47 | % | | | | | | | 3.08 | % | | | | | | | 3.76 | % | | | | | | | 4.77 | % | | | | | | | 11.36 | %D |
Expenses, net of reimbursements | | | 2.13 | % | | | | | | | 2.12 | % | | | | | | | 2.13 | % | | | | | | | 2.16 | % | | | | | | | 2.23 | %D |
Net investment (loss), before expense reimbursements | | | (1.42 | )% | | | | | | | (1.95 | )% | | | | | | | (2.51 | )% | | | | | | | (3.41 | )% | | | | | | | (10.22 | )%D |
Net investment (loss), net of reimbursements | | | (1.08 | )% | | | | | | | (1.00 | )% | | | | | | | (0.89 | )% | | | | | | | (0.80 | )% | | | | | | | (1.09 | )%D |
Portfolio turnover rate | | | 31 | % | | | | | | | 32 | % | | | | | | | 39 | % | | | | | | | 38 | % | | | | | | | 15 | %E |
| A | Commencement of operations. |
| B | Based on net asset value, which does not reflect the sales charge, redemption fee, or contingent deferred sales charge, if applicable. May include adjustments in accordance with U.S. GAAP and as such, the net asset value for reporting purposes and the returns based upon those net asset values may differ from the net asset value and returns for shareholder transactions. |
| E | Portfolio turnover rate is for the period from October 1, 2013 through January 31, 2014 and is not annualized. |
See accompanying notes
56
American Beacon FundsSM
Federal Tax Information
January 31, 2018 (Unaudited)
Certain tax information regarding the Funds is required to be provided to shareholders based upon the Funds’ income and distributions for the taxable year ended January 31, 2018. The information and distributions reported herein may differ from information and distributions taxable to the shareholders for the calendar year ended December 31, 2017.
The Funds designated the following items with regard to distributions paid during the fiscal year ended January 31, 2018. All designations are based on financial information available as of this annual report and, accordingly, are subject to change. For each item, it is the intention of the Funds to designate the maximum amount permitted under the Internal Revenue Code of 1986, as amended, and the regulations there under.
| | | | |
Corporate Dividends-Received Deduction: | | | | |
| |
Acadian Emerging Markets | | | N/A | |
SGA Global | | | 9.63 | % |
| |
Qualified Dividend Income: | | | | |
| |
Acadian Emerging Markets | | | 100.00 | % |
SGA Global | | | 31.39 | % |
| |
Long-Term Capital Gain Distributions: | | | | |
| |
Acadian Emerging Markets | | $ | - | |
SGA Global | | | 544,087 | |
| |
Short-Term Capital Gain Distributions: | | | | |
| |
Acadian Emerging Markets | | $ | - | |
SGA Global | | | 827,511 | |
Shareholders received notification in January 2018 of the applicable tax information necessary to prepare their 2017 income tax returns.
57
Trustees and Officers of the American Beacon FundsSM (Unaudited)
The Trustees and officers of the American Beacon Funds (the “Trust”) are listed below, together with their principal occupations during the past five years. The address of each person listed below is 220 Las Colinas Boulevard East, Suite 1200, Irving, Texas 75039. Each Trustee oversees thirty-five funds in the fund complex that includes the Trust, the American Beacon Select Funds and the American Beacon Institutional Funds Trust. The Trust’s Statement of Additional Information contains additional information about the Trustees and is available without charge by calling 1-800-658-5811.
| | | | |
Name, Age and Address | | Position, Term of Office and Length of Time Served with the Trust | | Principal Occupation(s) During Past 5 Years and Current Directorships |
| INTERESTED TRUSTEES | | Term | | |
| | Lifetime of Trust until removal, resignation or retirement* | | |
| | |
| Alan D. Feld** (81) | | Trustee since 1996 | | Sole Shareholder of a professional corporation which is a Partner in the law firm of Akin, Gump, Strauss, Hauer & Feld, LLP (law firm) (1960-Present); Trustee, American Beacon Mileage Funds (1996-2012); Trustee, American Beacon Select Funds (1999-Present); Trustee, American Beacon Master Trust (1996-2012); Trustee, American Beacon Institutional Funds Trust (2017-Present). |
| | |
| NON-INTERESTED TRUSTEES | | Term | | |
| | Lifetime of Trust until removal, resignation or retirement* | | |
| | |
| Gilbert G. Alvarado (48) | | Trustee since 2015 | | Director, Kura MD, Inc. (local telehealth organization) (2015-present); Vice President & CFO, Sierra Health Foundation (health conversion private foundation) (2006-Present); Vice President & CFO, Sierra Health Foundation: Center for Health Program Management (California public benefit corporation) (2012-Present); Director, Innovative North State (2012-2015); Director, Sacramento Regional Technology Alliance (2011-2016); Director, Women’s Empowerment (2009-2014); Director, Valley Healthcare Staffing (2017–present); Trustee, American Beacon Select Funds (2015-Present); Trustee, American Beacon Institutional Funds Trust (2017-Present). |
| | |
| Joseph B. Armes (55) | | Trustee since 2015 | | Chairman & CEO, CSW Industrials f/k/a Capital Southwest Corporation (investment company) (2015-Present); Chairman of the Board of Capital Southwest Corporation, predecessor to CSW Industrials, Inc. (2014-present) (investment company); CEO, Capital Southwest Corporation (2013-2015); President & CEO, JBA Investment Partners (family investment vehicle) (2010-Present); Director and Chair of Audit Committee, RSP Permian (oil and gas producer) (2013-Present); Trustee, American Beacon Select Funds (2015-Present); Trustee, American Beacon Institutional Funds Trust (2017-Present). |
| | |
| Gerard J. Arpey (59) | | Trustee since 2012 | | Director, The Home Depot, Inc. (2015-Present); Partner, Emerald Creek Group (private equity firm) (2011-Present); Director, S.C. Johnson & Son, Inc. (privately held company) (2008-present); Trustee, American Beacon Select Funds (2012-Present); Trustee, American Beacon Institutional Funds Trust (2017-Present). |
| | |
| Brenda A. Cline (57) | | Trustee since 2004 | | Executive Vice President, Chief Financial Officer, Treasurer and Secretary, Kimbell Art Foundation (1993-Present); Director, Range Resources Corporation (oil and natural gas company) (2015-Present); Director, Tyler Technologies, Inc. (public sector software solutions company) (2014-Present); Trustee, American Beacon Mileage Funds (2004-2012); Trustee, American Beacon Select Funds (2004-Present); Trustee, American Beacon Master Trust (2004-2012); Trustee, American Beacon Institutional Funds Trust (2017-Present). |
58
Trustees and Officers of the American Beacon FundsSM (Unaudited)
| | | | |
Name, Age and Address | | Position, Term of Office and Length of Time Served with the Trust | | Principal Occupation(s) During Past 5 Years and Current Directorships |
| NON-INTERESTEDTRUSTEES (CONT.) | | Term | | |
| | Lifetime of Trust until removal, resignation or retirement* | | |
| | |
| Eugene J. Duffy (63) | | Trustee since 2008 | | Managing Director, Global Investment Management Distribution, Mesirow Financial (2016-Present); Managing Director, Institutional Services, Intercontinental Real Estate Corporation (2014-Present); Principal and Executive Vice President, Paradigm Asset Management (1994-2014); Director, Sunrise Bank of Atlanta (2008-2013); Trustee, American Beacon Mileage Funds (2008-2012); Trustee, American Beacon Select Funds (2008-Present); Trustee, American Beacon Master Trust (2008-2012); Trustee, American Beacon Institutional Funds Trust (2017-Present). |
| | |
| Douglas A. Lindgren*** (56) | | Trustee since 2018 | | CEO North America, Carne Global Financial Services (2016-2017); Managing Director, IPS Investment Management and Global Head, Content Management, UBS Wealth Management (2010-2016); Managing Director, P&S Hedge Funds, UBS Wealth Management (2008-2010); Managing Director, Head of Alternative Investments, UBS Financial Services, Inc. (2005-2008). |
| | |
| Richard A. Massman (74) | | Trustee since 2004 Chairman since 2008 | | Consultant and General Counsel Emeritus, Hunt Consolidated, Inc. (holding company engaged in oil and gas exploration and production, refining, real estate, farming, ranching and venture capital activities) (2009-Present); Trustee, American Beacon Mileage Funds (2004-2012); Trustee, American Beacon Select Funds (2004-Present); Trustee, American Beacon Master Trust (2004-2012); Trustee, American Beacon Institutional Funds Trust (2017-Present). |
| | |
| Barbara J. McKenna, CFA (54) | | Trustee since 2012 | | Managing Principal, Longfellow Investment Management Company (2005-Present); Trustee, American Beacon Select Funds (2012-Present); Trustee, American Beacon Institutional Funds Trust (2017-Present). |
| | |
| R. Gerald Turner (72) | | Trustee since 2001 | | President, Southern Methodist University (1995-Present); Director, J.C. Penney Company, Inc. (1996-Present); Director, Kronus Worldwide Inc. (chemical manufacturing) (2003-Present); Trustee, American Beacon Mileage Funds (2001-2012); Trustee, American Beacon Select Funds (2001-Present); Trustee, American Beacon Master Trust (2001-2012); Trustee, American Beacon Institutional Funds Trust (2017-Present). |
| | |
| OFFICERS | | Term | | |
| | One Year | | |
| | |
| Gene L. Needles, Jr. (63) | | President since 2009 | | President, CEO and Director, American Beacon Advisors, Inc. (2009-Present); President, CEO and Director, Resolute Investment Managers, Inc. (2015-Present); President, CEO and Director, Resolute Acquisition, Inc. (2015-Present); President, CEO and Director, Resolute Topco, Inc. (2015-Present), President & CEO, Resolute Investment Holdings, LLC (2015-Present); President, CEO and Director, Lighthouse Holdings, Inc. (2009-2015); President and CEO, Lighthouse Holdings Parent, Inc. (2009-2015); Manager, President and CEO, American Private Equity Management, LLC (2012-Present); President, American Beacon Cayman Managed Futures Strategy Fund, Ltd. (2014-Present); Director, Chairman, President and CEO, Alpha Quant Advisors, LLC (2016-Present); Director, ARK Investment Management LLC (2016-Present); Director, Shapiro Capital Management LLC (2017-Present); Member, Investment Advisory Committee, Employees Retirement System of Texas (2017-Present); Trustee, American Beacon NextShares Trust (2015-Present); President, American Beacon Select Funds (2009-Present); President, American Beacon Mileage Funds (2009-2012); President, American Beacon Master Trust (2009-2012); President, American Beacon Institutional Funds Trust (2017-Present). |
59
Trustees and Officers of the American Beacon FundsSM (Unaudited)
| | | | |
Name, Age and Address | | Position, Term of Office and Length of Time Served with the Trust | | Principal Occupation(s) During Past 5 Years and Current Directorships |
| OFFICERS (CONT.) | | Term | | |
| | One Year | | |
| | |
| Rosemary K. Behan (58) | | VP, Secretary and Chief Legal Officer since 2006 | | Vice President and Secretary, American Beacon Advisors, Inc. (2006-Present); Secretary, Resolute Investment Holdings, LLC (2015-Present) Secretary, Resolute Investment Managers, Inc. (2015-Present); Secretary, Resolute Topco, Inc. (2015-Present); Secretary, Resolute Acquisition, Inc. (2015-Present); Secretary, Lighthouse Holdings, Inc. (2008-2015); Secretary, Lighthouse Holdings Parent, Inc. (2008-2015); Secretary, American Private Equity Management, LLC (2008-Present); Secretary, American Beacon Cayman Managed Futures Strategy Fund, Ltd. (2014-Present); Secretary, Alpha Quant Advisors, LLC (2016-Present); Chief Legal Officer, Vice President and Secretary, American Beacon Select Funds (2006-Present); Chief Legal Officer, Vice President and Secretary, American Beacon Mileage Funds (2006-2012); Chief Legal Officer, Vice President and Secretary, American Beacon Master Trust (2006-2012); Chief Legal Officer, Vice President and Secretary, American Beacon Institutional Funds Trust (2017-Present). |
| | |
| Brian E. Brett (57) | | VP since 2004 | | Senior Vice President (2012-Present) and Vice President (2004-2012), American Beacon Advisors, Inc.; Vice President, American Beacon Select Funds (2004-Present); Vice President, American Beacon Mileage Funds (2004-2012); Vice President, American Beacon Master Trust (2004-2012); Vice President, American Beacon Institutional Funds Trust (2017-Present). |
| | |
| Paul B. Cavazos (48) | | VP since 2016 | | Senior Vice President, American Beacon Advisors, Inc. (2016-Present); Chief Investment Officer and Assistant Treasurer, DTE Energy (2007-2016); Vice President, American Beacon Select Funds (2016-Present); Vice President, American Beacon Institutional Funds Trust (2017-Present). |
| | |
| Erica Duncan (47) | | VP Since 2011 | | Vice President, American Beacon Advisors, Inc. (2011-Present); Vice President, American Beacon Select Funds (2011-Present); Vice President, American Beacon Mileage Funds (2011-2012); Vice President, American Beacon Master Trust (2011-2012); Vice President, American Beacon Institutional Funds Trust (2017-Present). |
| | |
| Melinda G. Heika (56) | | Treasurer since 2010 | | Treasurer, American Beacon Advisors, Inc. (2010-Present); Resolute Investment Managers, Inc. (2015-Present); Treasurer, Resolute Acquisition, Inc. (2015-Present); Treasurer, Resolute Topco, Inc. (2015-Present); Treasurer, Resolute Investment Holdings, LLC. (2015-Present); Treasurer, Lighthouse Holdings, Inc. (2010-2015); Treasurer, Lighthouse Holdings Parent Inc., (2010-2015); Treasurer, American Private Equity Management, LLC (2012-Present); Director and Treasurer, American Beacon Cayman Managed Futures Strategy Fund, Ltd. (2014-Present); Treasurer, American Beacon Select Funds (2010-Present); Treasurer, American Beacon Mileage Funds (2010-2012); Treasurer, American Beacon Master Trust (2010-2012); Treasurer, American Beacon Institutional Funds Trust (2017-Present). |
| | |
| Terri L. McKinney (54) | | VP since 2010 | | Vice President (2009-Present) and Managing Director (2003-2009), American Beacon Advisors, Inc.; Vice President, Resolute Investment Managers, Inc. (2017-Present); Vice President, Alpha Quant Advisors, LLC (2016-Present); Vice President, American Beacon Select Funds (2010-Present); Vice President, American Beacon Mileage Funds (2010-2012); Vice President, American Beacon Master Trust (2010-2012); Vice President, American Beacon Institutional Funds Trust (2017-Present). |
60
Trustees and Officers of the American Beacon FundsSM (Unaudited)
| | | | |
Name, Age and Address | | Position, Term of Office and Length of Time Served with the Trust | | Principal Occupation(s) During Past 5 Years and Current Directorships |
| OFFICERS (CONT.) | | Term | | |
| | One Year | | |
| | |
| Jeffrey K. Ringdahl (42) | | VP since 2010 | | Senior Vice President (2013-Present), Vice President (2010-2013), and Director (2015-Present), American Beacon Advisors, Inc.; Vice President, American Beacon Select Funds (2010-Present); Vice President, American Beacon Mileage Funds (2010-2012); Vice President, American Beacon Master Trust (2010-2012); Senior Vice President (2012-Present) and Manager (2015-Present), American Private Equity Management, LLC; Senior Vice President, Lighthouse Holdings, Inc. (2013-2015); Senior Vice President, Lighthouse Holdings Parent, Inc. (2013-2015); Director and Vice President, American Beacon Cayman Managed Futures Strategy Fund, Ltd. (2014-Present); Trustee, American Beacon NextShares Trust (2015-Present); Director and Senior Vice Present, Resolute Investment Holdings, LLC (2015-Present); Director and Senior Vice President, Resolute Topco, Inc. (2015-Present); Director and Senior Vice President, Resolute Acquisition, Inc. (2015-Present); Director and Senior Vice President, Resolute Investment Managers, Inc. (2015-Present); Director, Executive Vice President and Chief Operating Officer, Alpha Quant Advisors, LLC (2016-Present); Vice President, American Beacon Institutional Funds Trust (2017-President); Director, Shapiro Capital Management, LLC (2017-Present). |
| | |
| Samuel J. Silver (54) | | VP Since 2011 | | Vice President, American Beacon Advisors, Inc. (2011-Present); Vice President, American Beacon Select Funds (2011-Present); Vice President, American Beacon Mileage Funds (2011-2012); Vice President, American Beacon Master Trust (2011-2012); American Beacon Institutional Funds Trust (2011-Present). |
| | |
| Christina E. Sears (46) | | Chief Compliance Officer since 2004 and Asst. Secretary since 1999 | | Chief Compliance Officer, American Beacon Advisors, Inc. (2004-Present); Chief Compliance Officer, American Private Equity Management, LLC (2012-Present); Chief Compliance Officer and Vice President, Alpha Quant Advisors, LLC (2016-Present); Chief Compliance Officer (2004-Present) and Assistant Secretary (1999-Present), American Beacon Select Funds; Chief Compliance Officer (2004-2012) and Assistant Secretary (1999-2012), American Beacon Mileage Funds; Chief Compliance Officer (2004-2012) and Assistant Secretary (1999-2012), American Beacon Master Trust; Chief Compliance Officer and Assistant Secretary, American Beacon Institutional Funds Trust (2017-Present). |
| | |
| Sonia L. Bates (61) | | Asst. Treasurer since 2011 | | Assistant Treasurer, American Beacon Advisors, Inc. (2011-Present); Assistant Treasurer, Resolute Investment Managers, Inc. (2015-Present); Assistant Treasurer, Resolute Acquisition, Inc. (2015-Present); Assistant. Treasurer, Resolute Topco, Inc. (2015-Present); Assistant Treasurer, Resolute Investment Holdings, LLC.; Assistant Treasurer, Lighthouse Holdings, Inc. (2011-2015); Assistant Treasurer, Lighthouse Holdings Parent Inc. (2011-2015); Assistant Treasurer, American Private Equity Management, LLC (2012-Present); Assistant Treasurer, American Beacon Select Funds (2011-Present); Assistant Treasurer American Beacon Mileage Funds (2011-2012); Assistant Treasurer, American Beacon Master Trust (2011-2012); Assistant Treasurer, American Beacon Institutional Funds Trust (2017-Present). |
| | |
| Shelley D. Abrahams (43) | | Assistant Secretary since 2008 | | Assistant Secretary, American Beacon Advisors, Inc. (2008-Present); Assistant Secretary, American Beacon Select Funds (2008-Present); Assistant Secretary, American Beacon Mileage Funds (2008-2012); Assistant Secretary, American Beacon Master Trust (2008-2012); Assistant Secretary, American Beacon Institutional Funds Trust (2017-Present). |
61
Trustees and Officers of the American Beacon FundsSM (Unaudited)
| | | | |
Name, Age and Address | | Position, Term of Office and Length of Time Served with the Trust | | Principal Occupation(s) During Past 5 Years and Current Directorships |
| OFFICERS (CONT.) | | Term | | |
| | One Year | | |
| | |
| Rebecca L. Harris (51) | | Assistant Secretary since 2010 | | Vice President, American Beacon Advisors, Inc. (2016-Present); Vice President, Resolute Investment Managers, Inc. (2017-Present); Vice President, Alpha Quant Advisors, LLC (2016-Present); Assistant Secretary, American Beacon Select Funds (2010-Present); Assistant Secretary, American Beacon Mileage Funds (2010-2012); Assistant Secretary, American Beacon Master Trust (2010-2012); Assistant Secretary, American Beacon Institutional Funds Trust (2017-Present). |
| | |
| Diana N. Lai (42) | | Assistant Secretary since 2012 | | Assistant Secretary, American Beacon Advisors, Inc. (2012-Present); Assistant Secretary, American Beacon Select Funds (2012-Present); Assistant Secretary, American Beacon Institutional Funds Trust (2017-Present). |
| | |
| Teresa A. Oxford (59) | | Assistant Secretary since 2015 | | Assistant Secretary, American Beacon Advisors, Inc. (2015-Present); Assistant Secretary, Alpha Quant Advisors, LLC (2016-Present); Assistant Secretary, American Beacon Select Funds (2015-Present); Assistant Secretary, American Beacon Institutional Funds Trust (2017-Present). |
* As of 11/12/2014, the Board adopted a retirement plan that requires Trustees to retire no later than the last day of the calendar year in which they reach the age of 75.
** Mr. Feld is deemed to be an “interested person” of the Trusts, as defined by the 1940 Act. Mr. Feld’s law firm of Akin, Gump, Strauss, Hauer & Feld LLP has provided legal services within the past two fiscal years to one or more of the Trust’s sub-advisors.
*** Douglas A. Lindgren became a new Trustee to each of the Trusts on 1/1/2018.
62
American Beacon FundsSM
Privacy Policy
January 31, 2018 (Unaudited)
The American Beacon Funds recognize and respect the privacy of our shareholders. We are providing this notice to you so you will understand how shareholder information may be collected and used.
We may collect nonpublic personal information about you from one or more of the following sources:
| | • | | information we receive from you on applications or other forms; |
| | • | | information about your transactions with us or our service providers; and |
| | • | | information we receive from third parties. |
We do not disclose any nonpublic personal information about our customers or former customers to anyone, except as permitted by law.
We restrict access to your nonpublic personal information to those employees or service providers who need to know that information to provide products or services to you. To ensure the confidentiality of your nonpublic personal information, we maintain safeguards that comply with federal standards.
63
This page intentionally left blank.
64

Delivery of Documents
eDelivery is NOW AVAILABLE - Stop traditional mail delivery and receive your
shareholder reports and summary prospectus on-line. Sign up at
www.americanbeaconfunds.com
If you invest in the Fund through a financial institution, you may be able to receive the Fund’s regulatory mailings, such as the Prospectus, Annual Report and Semi-Annual Report, by e-mail. If you are interested in this option, please go to www.icsdelivery.com and search for your financial institution’s name or contact your financial institution directly.
To obtain more information about the Fund:
| | |
 | |  |
| | |
| By E-mail: | | On the Internet: |
| american_beacon.funds@ambeacon.com | | Visit our website at www.americanbeaconfunds.com |
| | | |
| | | |
| | |

By Telephone: Call (800) 658-5811 | | 
By Mail: American Beacon Funds P.O. Box 219643 Kansas City, MO 64121-9643 |
| | | |
| Availability of Quarterly Portfolio Schedules | | Availability of Proxy Voting Policy and Records |
| | |
| In addition to the Schedule of Investments provided in each semi-annual and annual report, the Fund files a complete schedule of its portfolio holdings with the Securities and Exchange Commission (“SEC”) on Form N-Q as of the first and third fiscal quarters. The Fund’s Forms N-Q are available on the SEC’s website at www.sec.gov. The Forms N-Q may also be reviewed and copied at the SEC’s Public Reference Section, 100 F Street, NE, Washington, D.C. 20549-2736. Information regarding the operation of the SEC’s Public Reference Room may be obtained by calling (800)-SEC-0330. A complete schedule of the American Beacon Acadian Emerging Markets Managed Volatility Fund’s portfolio holdings is also available at www.americanbeaconfunds.com approximately sixty days after the end of each quarter. A complete schedule of the American Beacon SGA Global Growth Fund’s portfolio holdings is also available on the website approximately twenty days after the end of each month. | | A description of the policies and procedures the Fund uses to determine how to vote proxies relating to portfolio securities is available in the Fund’s Statement of Additional Information, is available free of charge on the Fund’s website www.americanbeaconfunds.com and by calling 1-800-967-9009 or by accessing the SEC’s website at www.sec.gov. The Fund’s proxy voting record for the most recent year ended June 30 is filed annually with the SEC on Form N-PX. The Fund’s Forms N-PX are available on the SEC’s website at www.sec.gov. The Fund’s proxy voting record may also be obtained by calling 1-800-967-9009. |
Fund Service Providers:
| | | | | | | | | | | | |
CUSTODIAN State Street Bank and Trust Boston, Massachusetts | | | | TRANSFER AGENT DST Asset Manager Solutions, Inc. Kansas City, Missouri | | | | INDEPENDENT REGISTERED PUBLIC ACCOUNTING FIRM PricewaterhouseCoopers LLP Boston, Massachusetts | | | | DISTRIBUTOR Resolute Investment Distributors, Inc. Irving, Texas |
This report is prepared for shareholders of the American Beacon Funds and may be distributed to others only if preceded or accompanied by a current Prospectus or Summary Prospectus.
American Beacon Funds, American Beacon Acadian Emerging Markets Managed Volatility Fund and American Beacon SGA Global Growth Fund are service marks of American Beacon Advisors, Inc.
AR 1/18

About American Beacon Advisors
Since 1986, American Beacon Advisors has offered a variety of products and investment advisory services to numerous institutional and retail clients, including a variety of mutual funds, corporate cash management, and separate account management.
Our clients include defined benefit plans, defined contribution plans, foundations, endowments, corporations, financial planners, and other institutional investors. With American Beacon Advisors, you can put the experience of a multi-billion dollar asset management firm to work for your company.
CRESCENT SHORT DURATION HIGH INCOME FUND
The Fund’s investments in high-yield securities, including loans, restricted securities and floating rate securities are subject to greater levels of credit, interest rate, market and liquidity risks than investment-grade securities. Investing in foreign securities may involve heightened risk due to currency fluctuations and economic and political risks. Please see the prospectus for a complete discussion of the Fund’s risks. There can be no assurances that the investment objectives of this Fund will be met.
Any opinions herein, including forecasts, reflect our judgment as of the end of the reporting period and are subject to change. Each advisor’s strategies and each Fund’s portfolio composition will change depending on economic and market conditions. This report is not a complete analysis of market conditions, and, therefore, should not be relied upon as investment advice. Although economic and market information has been compiled from reliable sources, American Beacon Advisors, Inc. makes no representation as to the completeness or accuracy of the statements contained herein.
American Beacon Funds | January 31, 2018 |
Contents
President’s Message
| | |
 | | Dear Shareholders, At American Beacon, we are proud to offer a broad range of equity, fixed-income and alternative mutual fund products for institutions and individuals. Our mutual funds – which span the domestic, international, global, frontier and emerging markets – are sub-advised by experienced portfolio managers who employ distinctive investment processes to manage assets through a variety of economic and market conditions. Together, we work diligently to help our clients and shareholders meet their long-term financial goals. Institutional wisdom, enduring value. Since our inception as a pension fiduciary in 1986, American Beacon has focused on identifying and overseeing institutional investment managers and portfolio risk management. In 1987, we leveraged our size and experience to launch a series of sub-advised, multi- |
manager mutual funds providing individual investors access to many of the same institutional managers as our pension clients. Following the financial crisis in 2008, we saw that investors were looking for unique solutions from managers who were not necessarily mainstream. In 2010, we began offering mutual funds from single managers with distinctive investment styles or asset classes. As we continue to expand our family of funds, our solutions- based approach provides innovative investments.
Guiding principles. Our “manager of managers” philosophy is built on a long-standing history of innovative thinking, discipline and consistency in applying our solutions-based approach. As a manager of managers, our goal is to engage the most effective money managers for each asset class, investment style or market strategy – whether through a single sub-advisor or a combination of sub-advisors. Because we take our fiduciary responsibilities very seriously, our thorough manager evaluation and selection process is rigorous and ongoing. Our guiding principles – predictability, style consistency, competitive pricing and long-term relationships – provide a strong foundation for our due-diligence process. Our broad range of mutual funds helps investors navigate the economic storms and market downturns in the U.S. and abroad. Our years of experience evaluating sub-advisors have led us to identify and partner with asset managers who have adhered to their disciplined processes for many years and through multiple market cycles.
Focus on asset protection and risk mitigation. We strive to provide innovative, long-term products without gimmicks. From offering some of the first multi-manager funds, one of the first retirement-income funds and the first open-end mutual fund in the U.S. to focus primarily on frontier-market debt, our robust history includes applying a disciplined, solutions-based approach to our product development process to help protect assets and mitigate risk.
Thank you for your continued interest in American Beacon. For additional information about our funds or to access your account information, please visit our website at www.americanbeaconfunds.com.
Best Regards,

Gene L. Needles, Jr.
President
American Beacon Funds
1
High Yield Bond Market Overview
January 31, 2018 (Unaudited)
The global bond market produced positive returns over the 12-month period ended January 31, 2018, evidenced by the Bloomberg Barclays Global Aggregate Index return of 7.5%.
In response to better economic conditions, the U.S. Federal Reserve (“the Fed”) hiked rates at their March, June and December meetings during the 2017 calendar year. The rate hikes were highly anticipated and, thus, did not move markets as economic indicators and investor sentiment improved throughout the year. The U.S. Congress passed a tax-reform package in December, which gave the credit cycle an additional boost. The yield curve started flattening toward the end of the period, indicating the Fed’s rate hikes would help keep inflation in check. Other central banks, including the European Central Bank (“ECB”) and the Bank of Japan (“BOJ”), have not yet started raising rates, signifying some divergence among the three largest central banks.
Volatility throughout the period remained low by historical standards, which proved to be a healthy environment for credit markets as spreads moved lower. In the U.S., both high- and low-quality corporate credits had solid periods as investors continued to search for yield. The ICE BofAML US Corporate Index (Investment Grade) returned 5.1% and the ICE BofAML US High Yield Index returned 6.7% for the period.
Emerging and frontier market bonds performed well over the period as initial concerns over U.S. protectionism were replaced by optimism following a pickup in global growth and higher commodity prices. Market sentiment was occasionally shaken by country-specific news from countries like Brazil, Venezuela, South Africa and Turkey, as well as NAFTA negotiations exposing large conceptual disagreement. The JPMorgan Emerging Market Bond Index-Global Diversified (hard currency) posted a solid 8.6% return for the period. Local currency emerging-market results were even stronger as the JPMorgan Government Bond Index-Emerging Markets Global Diversified Index was up 17.7%. The smaller, less-developed frontier economies also produced strong results, represented by the JPMorgan Next Generation Markets Index, which returned 14.8%.
The period ended with optimism as the theme of synchronized global growth continues to play out. However, many risks could develop since the domestic environment is tightening and U.S. Treasury yields are expected to rise. It remains to be seen how the markets will react when other central banks, such as ECB and BOJ, begin to phase out accommodative policies or inflation meaningfully picks up.
2
American Beacon Crescent Short Duration High Income FundSM
Performance Overview
January 31, 2018 (Unaudited)
The Investor Class of the American Beacon Crescent Short Duration High Income Fund (the “Fund”) returned 4.04% for the twelve-month period ended January 31, 2018, underperforming (net of fees) the Bank of America Merrill Lynch U.S. High Yield Cash Pay BB-B 1-5 Year Index (the “Index”) return of 5.15%.
Comparison of Change in Value of a $10,000 Investment for the period from 10/1/2014 through 1/31/2018
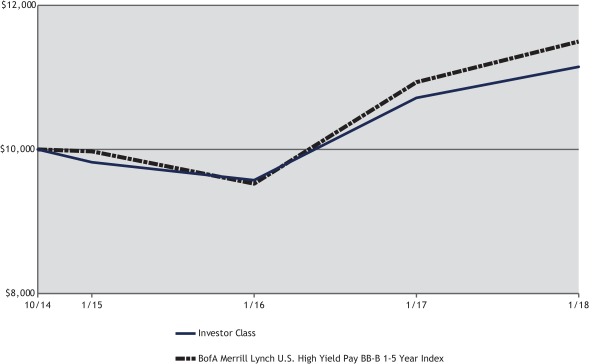
| | | | | | | | | | | | | | | | | | | | | | | | | |
| Total Returns for the Period ended January 31, 2018 | |
| | | Ticker | | 1 Year | | 3 Years | | Since Inception 10/1/2014 | | Value of $10,000 10/1/2014- 1/31/2018 |
Institutional Class (1,3) | | ACHIX | | | | 4.45 | % | | | | 4.69 | % | | | | 3.70 | % | | | $ | 11,286 | |
Y Class (1,3) | | ACHYX | | | | 4.33 | % | | | | 4.57 | % | | | | 3.57 | % | | | $ | 11,242 | |
Investor Class (1,3) | | ACHPX | | | | 4.04 | % | | | | 4.31 | % | | | | 3.31 | % | | | $ | 11,147 | |
A without Sales Charge (1,3) | | ACHAX | | | | 4.02 | % | | | | 4.25 | % | | | | 3.25 | % | | | $ | 11,127 | |
A with Sales Charge (1,3) | | ACHAX | | | | 1.39 | % | | | | 3.36 | % | | | | 2.46 | % | | | $ | 10,845 | |
C without Sales Charge (1,3) | | ACHCX | | | | 3.24 | % | | | | 3.48 | % | | | | 2.49 | % | | | $ | 10,855 | |
C with Sales Charge (1,3) | | ACHCX | | | | 2.24 | % | | | | 3.48 | % | | | | 2.49 | % | | | $ | 10,855 | |
| | | | | | | | | | | | | | | | | | | | | | | | | |
BofA Merrill Lynch U.S High Yield Cash Pay BB-B 1-5 Year Index (2) ....... | | | | | | 5.15 | % | | | | 4.85 | % | | | | 4.27 | % | | | $ | 11,496 | |
| 1. | Performance shown is historical and is not indicative of future returns. Investment returns and principal value will vary, and shares may be worth more or less at redemption than at original purchase. Performance shown is calculated based on the published end of day net asset values as of the date indicated and current performance may be lower or higher than the performance data quoted. To obtain performance as of the most recent month end, please visit www.americanbeaconfunds.com or call 1-800-967-9009. Fund performance in the table above does not reflect the deduction of taxes a shareholder would pay on distributions or the redemption of shares. Generally accepted accounting principles require adjustments to be made to the net assets of the Fund at period end for financial reporting purposes only, and as such, the total return based on the unadjusted net asset value per share may differ from the total return reported in the financial highlights. A portion of the fees charged to each Class of the Fund has been waived since Fund inception. Performance prior to waiving fees was lower than the actual returns shown since inception. A Class shares have a maximum sales charge of 2.50%. The maximum contingent deferred sales charge for the C Class is 1.00% for shares redeemed within one year of the date of purchase. |
| 2. | The BofA Merrill Lynch U.S. High Yield Cash Pay BB-B 1-5 Year Index is an unmanaged index that generally tracks the performance of BB-B rated U.S. dollar-denominated corporate bonds publicly issued in the U.S. domestic market with maturities of 1 to 5 years. One cannot directly invest in an index. |
3
American Beacon Crescent Short Duration High Income FundSM
Performance Overview
January 31, 2018 (Unaudited)
| 3. | The Total Annual Fund Operating Expense ratios set forth in the most recent Fund prospectus for the Institutional, Y, Investor, A, and C Class shares were 1.27%, 1.37%, 1.57%, 1.67% and 2.42%, respectively. The expense ratios above may vary from the expense ratios presented in other sections of this report that are based on expenses incurred during the period covered by this report. |
The Fund’s sub-advisor actively allocates among traditional high-yield, floating-rate bank loan and private-debt sectors of the bond market to seek attractive risk-adjusted returns with lower volatility than that of the high-yield market overall. This flexibility also allows for the opportunity to invest in securities outside of the traditional indices.
On average during the period, the Fund held approximately 77% of assets in traditional high yield, 13% in floating-rate bank loans and 10% in private debt. The decision to overweight high yield bonds and underweight bank loans added value as fixed rate securities outperformed floating rate for most of the period.
The Fund had good security selection in the Technology & Electronics, Basic Industry and Leisure sectors which contributed positively to relative performance. Conversely, an underweight positioning and weak security selection in the Energy sector detracted from relative performance, as Energy was one of the top performing sectors in the Index during the period. From a ratings standpoint, the Fund benefited from good security selection in BB–rated issuers, although this was slightly offset by poor security selection in CCC.
Overall, the Fund performed as expected during the period and delivered attractive risk-adjusted returns. The Fund’s consistent approach to short-duration, high-yield investing is positioned to continue adding value with less volatility than the Index.
| | | | | | | | |
| Top Ten Holdings (% Net Assets) | | | | | | | | |
| Sprint Corp., 7.250%, Due 9/15/2021 | | | | | | | 1.2 | |
| T-Mobile USA, Inc., 6.625%, Due 4/1/2023 | | | | | | | 1.2 | |
| Navient Corp., 5.875%, Due 3/25/2021 | | | | | | | 1.2 | |
| New Gold, Inc., 6.250%, Due 11/15/2022 | | | | | | | 0.8 | |
| Calpine Corp., 5.250%, Due 6/1/2026 | | | | | | | 0.8 | |
| Energizer Holdings, Inc., 5.500%, Due 6/15/2025 | | | | | | | 0.8 | |
| Sirius XM Radio, Inc., 3.875%, Due 8/1/2022 | | | | | | | 0.7 | |
| Hess Infrastructure Partners LP / Hess Infrastructure Partners Finance Corp., 5.625%, Due 2/15/2026 | | | | | | | 0.7 | |
| Block Communications, Inc., 6.875%, Due 2/15/2025 | | | | | | | 0.7 | |
| Intesa Sanpaolo SpA | | | | | | | 0.7 | |
| | |
| Total Fund Holdings | | | 345 | | | | | |
| | | | | | | | |
| Sector Allocation (% Investments) | | | | | | | | |
| Consumer, Non-Cyclical | | | | | | | 14.2 | |
| Communications | | | | | | | 13.8 | |
| Energy | | | | | | | 13.5 | |
| Consumer, Cyclical | | | | | | | 12.8 | |
| Financial | | | | | | | 10.1 | |
| Industrial | | | | | | | 7.6 | |
| Technology | | | | | | | 7.5 | |
| Basic Materials | | | | | | | 6.7 | |
| Service | | | | | | | 3.7 | |
| Utilities | | | | | | | 3.3 | |
| Consumer | | | | | | | 2.5 | |
| Manufacturing | | | | | | | 1.9 | |
| Health Care | | | | | | | 0.9 | |
| Telecommunications | | | | | | | 0.9 | |
| Media | | | | | | | 0.3 | |
| Transportation | | | | | | | 0.3 | |
4
American Beacon Crescent Short Duration High Income FundSM
Expense Examples
January 31, 2018 (Unaudited)
Fund Expense Example
As a shareholder of a Fund, you incur two types of costs: (1) transaction costs, including sales charges (loads) on purchase payments and redemption fees, if applicable, and (2) ongoing costs, including management fees, distribution (12b-1) fees, sub-transfer agent fees, and other Fund expenses. The Examples are intended to help you understand the ongoing cost (in dollars) of investing in the Fund and to compare these costs with the ongoing costs of investing in other mutual funds. The Examples are based on an investment of $1,000 invested at the beginning of the period in each Class and held for the entire period from August 1, 2017 through January 31, 2018.
Actual Expenses
The “Actual” lines of the tables provide information about actual account values and actual expenses. You may use the information on this page, together with the amount you invested, to estimate the expenses that you paid over the period. Simply divide your account value by $1,000 (for example, an $8,600 account value divided by $1,000 = $8.60), then multiply the result by the “Expenses Paid During Period” to estimate the expenses you paid on your account during this period. Shareholders of the Investor and Institutional Classes that invest in the Fund through an IRA or Roth IRA may be subject to a custodial IRA fee of $15 that is typically deducted each December. If your account was subject to a custodial IRA fee during the period, your costs would have been $15 higher.
Hypothetical Example for Comparison Purposes
The “Hypothetical” lines of the tables provide information about hypothetical account values and hypothetical expenses based on the Fund’s actual expense ratio and an assumed 5% per year rate of return before expenses (not the Fund’s actual return). You may compare the ongoing costs of investing in the Fund with other funds by contrasting this 5% hypothetical example and the 5% hypothetical examples that appear in the shareholder reports of the other funds. The hypothetical account values and expenses may not be used to estimate the actual ending account balance or expenses you paid for the period. Shareholders of the Investor and Institutional Classes that invest in the Funds through an IRA or Roth IRA may be subject to a custodial IRA fee of $15 that is typically deducted each December. If your account was subject to a custodial IRA fee during the period, your costs would have been $15 higher.
You should also be aware that the expenses shown in the table highlight only your ongoing costs and do not reflect any transaction costs charged by the Fund, such as sales charges (loads) or redemption fees, as applicable. Similarly, the expense examples for other funds do not reflect any transaction costs charged by those funds, such as sales charges (loads), redemption fees or exchange fees. Therefore, the “Hypothetical” lines of the tables are useful in comparing ongoing costs only and will not help you determine the relative total costs of owning different funds. If you were subject to any transaction costs during the period, your costs would have been higher.
5
American Beacon Crescent Short Duration High Income FundSM
Expense Examples
January 31, 2018 (Unaudited)
| | | | | | | | | | | | | | | |
| Crescent Short Duration High Income Fund | |
| | | Beginning Account Value
8/1/2017 | | Ending Account Value
1/31/2018 | | Expenses Paid During
Period
8/1/2017-1/31/2018* |
| Institutional Class | | | | | | | | | | | | | | | |
| Actual | | | | $1,000.00 | | | | | $1,013.40 | | | | | $4.31 | |
| Hypothetical** | | | | $1,000.00 | | | | | $1,020.90 | | | | | $4.33 | |
| Y Class | | | | | | | | | | | | | | | |
| Actual | | | | $1,000.00 | | | | | $1,012.90 | | | | | $4.82 | |
| Hypothetical** | | | | $1,000.00 | | | | | $1,020.40 | | | | | $4.84 | |
| Investor Class | | | | | | | | | | | | | | | |
| Actual | | | | $1,000.00 | | | | | $1,011.40 | | | | | $6.24 | |
| Hypothetical** | | | | $1,000.00 | | | | | $1,019.00 | | | | | $6.26 | |
| A Class | | | | | | | | | | | | | | | |
| Actual | | | | $1,000.00 | | | | | $1,011.30 | | | | | $6.34 | |
| Hypothetical** | | | | $1,000.00 | | | | | $1,018.90 | | | | | $6.36 | |
| C Class | | | | | | | | | | | | | | | |
| Actual | | | | $1,000.00 | | | | | $1,007.50 | | | | | $10.12 | |
| Hypothetical** | | | | $1,000.00 | | | | | $1,015.10 | | | | | $10.16 | |
| * | Expenses are equal to the Fund’s annualized expense ratios for the six-month period of 0.85%, 0.95%, 1.23%, 1.25%, and 2.00% for the Institutional, Y, Investor, A, and C Classes, respectively, multiplied by the average account value over the period, multiplied by the number derived by dividing the number of days in the most recent fiscal half-year (184) by days in the year (365) to reflect the half-year period. |
| ** | 5% return before expenses. |
6
American Beacon FundsSM
Report of Independent Registered Public Accounting Firm
To the Board of Trustees of American Beacon Funds and Shareholders of American Beacon Crescent Short Duration High Income Fund
Opinion on the Financial Statements
We have audited the accompanying statement of assets and liabilities, including the schedule of investments, of American Beacon Crescent Short Duration High Income Fund (one of the series constituting American Beacon Funds, referred to hereafter as the “Fund”) as of January 31, 2018, the related statement of operations for the year ended January 31, 2018, the statement of changes in net assets for each of the two years in the period ended January 31, 2018, including the related notes, and the financial highlights for each of the two years in the period ended January 31, 2018 (collectively referred to as the “financial statements”). In our opinion, the financial statements present fairly, in all material respects, the financial position of the Fund as of January 31, 2018, the results of its operations for the year then ended, the changes in its net assets for each of the two years in the period ended January 31, 2018 and the financial highlights for each of the two years in the period ended January 31, 2018 in conformity with accounting principles generally accepted in the United States of America.
Basis for Opinion
These financial statements are the responsibility of the Fund’s management. Our responsibility is to express an opinion on the Fund’s financial statements based on our audits. We are a public accounting firm registered with the Public Company Accounting Oversight Board (United States) (“PCAOB”) and are required to be independent with respect to the Fund in accordance with the U.S. federal securities laws and the applicable rules and regulations of the Securities and Exchange Commission and the PCAOB.
We conducted our audits of these financial statements in accordance with the standards of the PCAOB. Those standards require that we plan and perform the audit to obtain reasonable assurance about whether the financial statements are free of material misstatement, whether due to error or fraud.
Our audits included performing procedures to assess the risks of material misstatement of the financial statements, whether due to error or fraud, and performing procedures that respond to those risks. Such procedures included examining, on a test basis, evidence regarding the amounts and disclosures in the financial statements. Our audits also included evaluating the accounting principles used and significant estimates made by management, as well as evaluating the overall presentation of the financial statements. Our procedures included confirmation of securities owned as of January 31, 2018 by correspondence with the custodian, transfer agents and agent banks; when replies were not received from agent banks, we performed other auditing procedures. We believe that our audits provide a reasonable basis for our opinion.
The financial statements as of and for the year ended January 31, 2016 and the financial highlights for each of the periods ended on or prior to January 31, 2016 (not presented herein, other than the financial highlights) were audited by other auditors whose report dated March 31, 2016 expressed an unqualified opinion on those financial statements and financial highlights.
PricewaterhouseCoopers LLP
Boston, MA
March 27, 2018
We have served as the auditor of one or more American Beacon investment companies since 2016.
7
American Beacon Crescent Short Duration High Income FundSM
Schedule of Investments
January 31, 2018
| | | | | | | | | | | | | | | |
| | | Shares | | | | Fair Value |
| | | | | | | | | | | | | | | |
| COMMON STOCKS - 0.00% | | | | | | | | | | | | | | | |
| Energy - 0.00% | | | | | | | | | | | | | | | |
| Oil, Gas & Consumable Fuels - 0.00% | | | | | | | | | | | | | | | |
| Energy Exploration AssetA B | | | | 3 | | | | | | | | | $ | - | |
| | | | | | | | | | | | | | | |
| | | | | | | | | | | | | | | |
| Health Care - 0.00% | | | | | | | | | | | | | | | |
| Pharmaceuticals - 0.00% | | | | | | | | | | | | | | | |
| Millennium Health LLCA B | | | | 4,651 | | | | | | | | | | 507 | |
| | | | | | | | | | | | | | | |
| | | | | | | | | | | | | | | |
Total Common Stocks (Cost $26,255) | | | | | | | | | | | | | | 507 | |
| | | | | | | | | | | | | | | |
| | | | | | | | | | | | | | | |
| | | Principal Amount | | | | |
| BANK LOAN OBLIGATIONSC - 14.31% | | | | | | | | | | | | | | | |
| Basic Materials - 0.44% | | | | | | | | | | | | | | | |
Golden Nugget, Inc., 4.878%, Due 10/4/2023, 2017 Incremental Term Loan, (3 mo. LIBOR + 3.250%) | | | $ | 124,370 | | | | | | | | | | 125,756 | |
Phoenix Services International LLC, Due 1/26/2025, Term LoanD | | | | 125,000 | | | | | | | | | | 124,375 | |
PQ Corp., 5.022%, Due 11/4/2022, 2017 USD Term Loan, (3 mo. LIBOR + 3.250%) | | | | 124,330 | | | | | | | | | | 125,076 | |
Univar Inc., 4.074%, Due 7/1/2024, 2017 USD Term Loan B, (1 mo. LIBOR + 2.500%) | | | | 9,551 | | | | | | | | | | 9,639 | |
| | | | | | | | | | | | | | | |
| | | | | | | | | | | | | | 384,846 | |
| | | | | | | | | | | | | | | |
| | | | | | | | | | | | | | | |
| Consumer - 2.33% | | | | | | | | | | | | | | | |
Alphabet Holding Co., Inc., 5.074%, Due 9/26/2024, 2017 1st Lien Term Loan, (1 mo. LIBOR + 3.500%) | | | | 124,688 | | | | | | | | | | 123,222 | |
Arby’s Restaurant Group, Inc., Due 1/17/2025, 1st Lien Term LoanD | | | | 125,000 | | | | | | | | | | 126,641 | |
Capri Finance LLC, 5.022%, Due 11/1/2024, USD 2017 1st Lien Term Loan, (3 mo. LIBOR + 3.250%) | | | | 125,000 | | | | | | | | | | 125,104 | |
Casablanca US Holdings, Inc., 6.522%, Due 3/15/2024, 1st Lien Term Loan, (2 mo. LIBOR + 4.750%) | | | | 29,775 | | | | | | | | | | 29,750 | |
Global Appliance Inc., 5.570%, Due 9/29/2024, Term Loan B, (1 mo. LIBOR + 4.000%) | | | | 124,688 | | | | | | | | | | 126,325 | |
iHeartCommunications, Inc., 8.443%, Due 1/30/2019, Term Loan D, (3 mo. LIBOR + 6.750%) | | | | 43,315 | | | | | | | | | | 33,106 | |
NVA Holdings, Inc., Due 1/29/2025, Term Loan B3D | | | | 125,000 | | | | | | | | | | 125,235 | |
P.F. Chang’s China Bistro Inc., 6.509%, Due 8/18/2022, 2017 Term Loan B, (6 mo. LIBOR + 5.000%) | | | | 124,688 | | | | | | | | | | 120,947 | |
Paradigm Acquisition Corp., 5.943%, Due 10/11/2024, 1st Lien Term Loan, (3 mo. LIBOR + 4.250%) | | | | 187,000 | | | | | | | | | | 188,053 | |
Realogy Corp., Due 1/25/2025, 2018 Term Loan BD | | | | 11,303 | | | | | | | | | | 11,382 | |
RSC Acquisition, Inc., 6.943%, Due 11/30/2022, Term Loan, (3 mo. LIBOR + 5.250%) | | | | 245,004 | | | | | | | | | | 241,329 | |
SMG (Stadium Management Group), 4.890%, Due 1/11/2025, 2017 1st Lien Term Loan, (2 mo. LIBOR + 3.250%) | | | | 125,000 | | | | | | | | | | 126,406 | |
Strategic Partners, Inc., 6.074%, Due 6/30/2023, 2016 Term Loan, (1 mo. LIBOR + 4.500%) | | | | 118,802 | | | | | | | | | | 119,396 | |
TGP Holdings III LLC, | | | | | | | | | | | | | | | |
Due 9/25/2024, Delayed Draw Term LoanD E | | | | 22,102 | | | | | | | | | | 22,350 | |
6.693%, Due 9/25/2024, 1st Lien Term Loan, (3 mo. LIBOR + 5.000%) | | | | 140,546 | | | | | | | | | | 142,127 | |
10.193%, Due 9/25/2025, 2nd Lien Term Loan, (3 mo. LIBOR + 8.500%) | | | | 50,000 | | | | | | | | | | 50,500 | |
TriMark USA LLC, | | | | | | | | | | | | | | | |
Due 8/28/2024, Delayed Draw Term LoanD | | | | 5,342 | | | | | | | | | | 5,390 | |
5.070%, Due 8/28/2024, 2017 1st Lien Term Loan, (1 mo. LIBOR + 3.500%) | | | | 119,359 | | | | | | | | | | 120,433 | |
Varsity Brands, Inc., 5.074%, Due 12/15/2024, 2017 Term Loan B, (1 mo. LIBOR + 3.500%) | | | | 125,000 | | | | | | | | | | 126,303 | |
William Morris Endeavor Entertainment LLC, 8.824%, Due 5/6/2022, 2nd Lien Term Loan,
(1 mo. LIBOR + 7.250%) | | | | 84,000 | | | | | | | | | | 84,315 | |
| | | | | | | | | | | | | | | |
| | | | | | | | | | | | | | 2,048,314 | |
| | | | | | | | | | | | | | | |
| | | | | | | | | | | | | | | |
| Energy - 0.73% | | | | | | | | | | | | | | | |
California Resources Corp., | | | | | | | | | | | | | | | |
11.936%, Due 12/31/2021, Second Out Term Loan, (1 mo. LIBOR + 10.375%) | | | | 12,000 | | | | | | | | | | 13,590 | |
Due 12/31/2022, 2017 1st Lien Term Loan, (1 mo. LIBOR + 4.750%)D | | | | 13,000 | | | | | | | | | | 13,228 | |
Chief Exploration & Development LLC, 7.959%, Due 5/16/2021, 2nd Lien Term Loan, (3 mo. LIBOR + 6.500%) | | | | 250,000 | | | | | | | | | | 249,062 | |
Cortes NP Acquisition Corp., 5.568%, Due 11/30/2023, 2017 Term Loan B, (1 mo. LIBOR + 4.000%) | | | | 78,111 | | | | | | | | | | 78,892 | |
Energy & Exploration Partners, Inc., 5.000%, Due 5/13/2022, 2016 2nd Lien PIK Term Loan, PIK (5.000%) | | | | 6,506 | | | | | | | | | | 65 | |
Energy Future Intermediate Holding Co. LLC, 4.567%, Due 6/30/2018, 2017 DIP Term Loan, (1 mo. LIBOR + 3.000%) | | | | 125,000 | | | | | | | | | | 125,424 | |
Medallion Midland Acquisition LLC, 4.824%, Due 10/30/2024, 1st Lien Term Loan, (1 mo. LIBOR + 3.250%) | | | | 125,000 | | | | | | | | | | 125,625 | |
Peabody Energy Corp., 5.074%, Due 3/31/2022, Exit Term Loan, (1 mo. LIBOR + 3.500%) | | | | 35,387 | | | | | | | | | | 35,844 | |
| | | | | | | | | | | | | | | |
| | | | | | | | | | | | | | 641,730 | |
| | | | | | | | | | | | | | | |
See accompanying notes
8
American Beacon Crescent Short Duration High Income FundSM
Schedule of Investments
January 31, 2018
| | | | | | | | | | | | | | | |
| | | Principal Amount | | | | Fair Value |
| | | | | | | | | | | | | | | |
| BANK LOAN OBLIGATIONS - 14.31% (continued) | | | | | | | | | | | | | | | |
| Financial - 1.32% | | | | | | | | | | | | | | | |
Acrisure LLC, 5.991%, Due 11/22/2023, 2017 Term Loan B, (3 mo. LIBOR + 4.250%) | | | $ | 127,489 | | | | | | | | | $ | 129,521 | |
AssuredPartners, Inc., 5.074%, Due 10/22/2024, 2017 1st Lien Add-On Term Loan, (1 mo. LIBOR + 3.500%) | | | | 134,332 | | | | | | | | | | 135,536 | |
Asurion LLC, 7.574%, Due 8/4/2025, 2017 2nd Lien Term Loan, (1 mo. LIBOR + 6.000%) | | | | 125,000 | | | | | | | | | | 128,906 | |
Capital Automotive L.P., 7.580%, Due 3/24/2025, 2017 2nd Lien Term Loan, (1 mo. LIBOR + 6.000%) | | | | 123,031 | | | | | | | | | | 125,492 | |
EIG Management Co. LLC, Due 1/31/2025, 2018 Term Loan BD | | | | 104,000 | | | | | | | | | | 103,610 | |
Endo Luxembourg Finance Co. I S.a r.l., 5.875%, Due 4/29/2024, 2017 Term Loan B, (1 mo. LIBOR + 4.250%) | | | | 124,375 | | | | | | | | | | 124,437 | |
Focus Financial Partners LLC, 4.443%, Due 7/3/2024, 2018 1st Lien Term Loan, (3 mo. LIBOR + 2.750%) | | | | 124,688 | | | | | | | | | | 125,622 | |
Jane Street Group LLC, 6.074%, Due 8/25/2022, 2017 Term Loan B, (1 mo. LIBOR + 4.500%) | | | | 64,509 | | | | | | | | | | 65,356 | |
Nautilus Power LLC, 5.824%, Due 5/16/2024, Term Loan B, (1 mo. LIBOR + 4.250%) | | | | 24,471 | | | | | | | | | | 24,838 | |
VFH Parent LLC, 4.945%, Due 12/30/2021, 2017 Refinanced Term Loan B, (3 mo. LIBOR + 3.250%) | | | | 71,353 | | | | | | | | | | 72,290 | |
VICI Properties LLC, 3.811%, Due 12/20/2024, Replacement Term Loan B, (1 mo. LIBOR + 2.250%) | | | | 125,000 | | | | | | | | | | 125,924 | |
WEX, Inc., Due 6/30/2023, 2017 Term Loan B2D | | | | 3,274 | | | | | | | | | | 3,310 | |
| | | | | | | | | | | | | | | |
| | | | | | | | | | | | | | 1,164,842 | |
| | | | | | | | | | | | | | | |
| | | | | | | | | | | | | | | |
| Health Care - 0.88% | | | | | | | | | | | | | | | |
Affordable Care Holding Corp., 6.404%, Due 10/22/2022, 2015 1st Lien Term Loan, (2 mo. LIBOR + 4.750%) | | | | 47,526 | | | | | | | | | | 47,526 | |
Amneal Pharmaceuticals LLC, 5.193%, Due 11/1/2019, New Term Loan, (3 mo. LIBOR + 3.500%) | | | | 64,840 | | | | | | | | | | 65,144 | |
Avantor, Inc., 5.561%, Due 11/21/2024, 2017 1st Lien Term Loan, (3 mo. LIBOR + 4.000%) | | | | 125,000 | | | | | | | | | | 126,719 | |
Beaver-Visitec International, Inc., 6.693%, Due 8/21/2023, 1st Lien Term Loan, (3 mo. LIBOR + 5.000%) | | | | 74,622 | | | | | | | | | | 74,622 | |
Curo Health Services Holdings, Inc., 5.413%, Due 2/7/2022, 2015 1st Lien Term Loan, (3 mo. LIBOR + 4.000%) | | | | 114,111 | | | | | | | | | | 114,539 | |
EAB Global, Inc., 5.484%, Due 11/15/2024, 1st Lien Term Loan, (3 mo. LIBOR + 3.750%) | | | | 125,000 | | | | | | | | | | 125,704 | |
Onex Carestream Finance LP, 5.693%, Due 6/7/2019, 1st Lien Term Loan, (3 mo. LIBOR + 4.000%) | | | | 61,938 | | | | | | | | | | 62,058 | |
Prospect Medical Holdings, Inc., 7.500%, Due 6/30/2022, Term Loan, (6 mo. LIBOR + 6.000%) | | | | 73,875 | | | | | | | | | | 73,875 | |
Team Health Holdings, Inc., Due 2/6/2024, 1st Lien Term LoanD | | | | 22,000 | | | | | | | | | | 21,560 | |
Valeant Pharmaceuticals International, Inc., 5.060%, Due 4/1/2022, Term Loan B F4, (1 mo. LIBOR + 3.500%) | | | | 57,558 | | | | | | | | | | 58,415 | |
| | | | | | | | | | | | | | | |
| | | | | | | | | | | | | | 770,162 | |
| | | | | | | | | | | | | | | |
| Manufacturing - 1.82% | | | | | | | | | | | | | | | |
American Bath Group LLC, 6.943%, Due 9/30/2023, 2017 Term Loan B, (3 mo. LIBOR + 5.250%) | | | | 247,494 | | | | | | | | | | 249,555 | |
ASP Chromaflo Dutch B.V., 5.574%, Due 11/18/2023, Term Loan B2, (1 mo. LIBOR + 4.000%) | | | | 69,953 | | | | | | | | | | 70,259 | |
ASP Chromaflo Intermediate Holdings, Inc., 5.574%, Due 11/18/2023, Term Loan B1, (1 mo. LIBOR + 4.000%) | | | | 53,797 | | | | | | | | | | 54,032 | |
Berlin Packaging LLC, 4.863%, Due 10/1/2021, 2017 Term Loan B, (3 mo. LIBOR + 3.250%) | | | | 124,044 | | | | | | | | | | 125,027 | |
BWAY Holding Co., 4.958%, Due 4/3/2024, 2017 Term Loan B, (2 mo. LIBOR + 3.250%) | | | | 48,755 | | | | | | | | | | 49,121 | |
Consolidated Container Co. LLC, 5.074%, Due 5/22/2024, 2017 1st Lien Term Loan, (1 mo. LIBOR + 3.500%) | | | | 124,688 | | | | | | | | | | 125,259 | |
CPG International, Inc., 5.593%, Due 5/3/2024, 2017 Term Loan, (6 mo. LIBOR + 3.750%) | | | | 122,350 | | | | | | | | | | 123,574 | |
Emerald Performance Materials LLC, 5.074%, Due 8/1/2021, New 1st Lien Term Loan, (1 mo. LIBOR + 3.500%) | | | | 124,800 | | | | | | | | | | 125,789 | |
Flex Acquisition Co., Inc., 4.695%, Due 12/29/2023, 1st Lien Term Loan, (3 mo. LIBOR + 3.000%) | | | | 124,063 | | | | | | | | | | 124,896 | |
Netsmart Technologies, Inc., 6.193%, Due 4/19/2023, 2016 Term Loan C1, (3 mo. LIBOR + 4.500%) | | | | 39,499 | | | | | | | | | | 40,042 | |
Road Infrastructure Investment LLC, 5.067%, Due 6/13/2023, 2016 1st Lien Term Loan, (PRIME + 2.500%) | | | | 77,030 | | | | | | | | | | 77,030 | |
SHO Holding Corp., 6.568%, Due 10/27/2022, Term Loan, (1 mo. LIBOR + 5.000%) | | | | 245,000 | | | | | | | | | | 232,750 | |
Tank Holding Corp., 5.927%, Due 3/16/2022, Refi Term Loan, (3 mo. LIBOR + 4.250%) | | | | 83,043 | | | | | | | | | | 83,459 | |
Vencore, Inc., 6.443%, Due 11/23/2019, 1st Lien Term Loan, (3 mo. LIBOR + 4.750%) | | | | 123,552 | | | | | | | | | | 124,787 | |
| | | | | | | | | | | | | | | |
| | | | | | | | | | | | | | 1,605,580 | |
| | | | | | | | | | | | | | | |
| | | | | | | | | | | | | | | |
| Media - 0.30% | | | | | | | | | | | | | | | |
Meredith Corp., Due 1/17/2025, Term Loan BD | | | | 125,000 | | | | | | | | | | 126,320 | |
Radiate Holdco LLC, Due 2/1/2024, 1st Lien Term LoanD | | | | 138,312 | | | | | | | | | | 138,683 | |
| | | | | | | | | | | | | | | |
| | | | | | | | | | | | | | 265,003 | |
| | | | | | | | | | | | | | | |
| | | | | | | | | | | | | | | |
See accompanying notes
9
American Beacon Crescent Short Duration High Income FundSM
Schedule of Investments
January 31, 2018
| | | | | | | | | | | | | | | |
| | | Principal Amount | | | | Fair Value |
| | | | | | | | | | | | | | | |
| BANK LOAN OBLIGATIONS - 14.31% (continued) | | | | | | | | | | | | | | | |
| Service - 3.46% | | | | | | | | | | | | | | | |
Academy, Ltd., 5.546%, Due 7/1/2022, 2015 Term Loan B, (3 mo. LIBOR + 4.000%) | | | $ | 15,000 | | | | | | | | | $ | 12,037 | |
Albany Molecular Research, Inc., 4.824%, Due 8/30/2024, 2017 1st Lien Term Loan, (1 mo. LIBOR + 3.250%) | | | | 124,688 | | | | | | | | | | 125,155 | |
Allied Universal Holdco LLC, 5.443%, Due 7/28/2022, 2015 Term Loan, (3 mo. LIBOR + 3.750%) | | | | 61,247 | | | | | | | | | | 60,591 | |
ATI Holdings Acquisition, Inc., 5.204%, Due 5/10/2023, 2016 Term Loan, (3 mo. LIBOR + 3.500%) | | | | 99,385 | | | | | | | | | | 100,255 | |
BioClinica, Inc., 6.000%, Due 10/20/2023, 1st Lien Term Loan, (3 mo. LIBOR + 4.250%) | | | | 85,811 | | | | | | | | | | 83,666 | |
Brand Energy & Infrastructure Services, Inc., 5.996%, Due 6/21/2024, 2017 Term Loan, (3 mo. LIBOR + 4.250%) | | | | 124,375 | | | | | | | | | | 125,874 | |
Brickman Group Ltd. LLC, 8.056%, Due 12/17/2021, Initial Term Loan (Second Lien), (1 mo. LIBOR + 6.500%) | | | | 58,511 | | | | | | | | | | 58,862 | |
California Pizza Kitchen, Inc., 7.580%, Due 8/23/2022, 2016 Term Loan, (1 mo. LIBOR + 6.000%) | | | | 246,875 | | | | | | | | | | 241,320 | |
Camelot UK Holdco Ltd., Due 10/3/2023, 2017 Repriced Term LoanD | | | | 69,825 | | | | | | | | | | 70,502 | |
CareerBuilder LLC, 8.443%, Due 7/26/2023, Term Loan, (3 mo. LIBOR + 6.750%) | | | | 35,550 | | | | | | | | | | 35,461 | |
Fort Dearborn Co., 5.696%, Due 10/19/2023, 2016 1st Lien Term Loan, (2 mo. LIBOR + 4.000%) | | | | 32,803 | | | | | | | | | | 32,865 | |
IG Investment Holdings LLC, 5.193%, Due 10/29/2021, 2017 1st Lien Term Loan, (3 mo. LIBOR + 3.500%) | | | | 65,523 | | | | | | | | | | 66,178 | |
Institutional Shareholder Services, Inc., | | | | | | | | | | | | | | | |
Due 10/16/2024, 2017 Delayed Draw Term LoanD E | | | | 8,333 | | | | | | | | | | 8,361 | |
5.470%, Due 10/16/2024, 2017 1st Lien Term Loan, (3 mo. LIBOR + 3.750%) | | | | 91,667 | | | | | | | | | | 91,972 | |
9.470%, Due 10/16/2025, 2017 2nd Lien Term Loan, (3 mo. LIBOR + 7.750%) | | | | 25,000 | | | | | | | | | | 25,125 | |
Kingpin Intermediate Holdings LLC, 5.730%, Due 6/28/2024, 2017 1st Lien Term Loan B, (3 mo. LIBOR + 4.250%) | | | | 124,375 | | | | | | | | | | 126,396 | |
Lakeland Tours LLC, | | | | | | | | | | | | | | | |
Due 12/15/2024, 2017 Delayed Draw Term LoanD E | | | | 9,511 | | | | | | | | | | 9,654 | |
5.589%, Due 12/15/2024, 2017 1st Lien Term Loan B, (3 mo. LIBOR + 4.000%) | | | | 115,489 | | | | | | | | | | 117,221 | |
Mister Car Wash Holdings, Inc., 4.904%, Due 8/20/2021, Term Loan B, (2 mo. LIBOR + 3.250%) | | | | 123,592 | | | | | | | | | | 124,210 | |
NMSC Holdings, Inc., 6.693%, Due 4/19/2023, 1st Lien Term Loan, (3 mo. LIBOR + 5.000%) | | | | 250,000 | | | | | | | | | | 248,125 | |
Packers Holdings LLC, 4.737%, Due 12/4/2024, 2017 Term Loan B, (3 mo. LIBOR + 3.250%) | | | | 125,000 | | | | | | | | | | 125,104 | |
Playpower, Inc., 6.443%, Due 6/23/2021, 2015 1st Lien Term Loan, (3 mo. LIBOR + 4.750%) | | | | 244,975 | | | | | | | | | | 245,587 | |
Red Ventures LLC, 5.574%, Due 11/8/2024, 1st Lien Term Loan, (1 mo. LIBOR + 4.000%) | | | | 124,688 | | | | | | | | | | 126,059 | |
Rentpath, Inc., 6.330%, Due 12/17/2021, 2017 Term Loan, (1 mo. LIBOR + 4.750%) | | | | 119,404 | | | | | | | | | | 119,777 | |
Tribune Media Co., 4.574%, Due 12/27/2020, Term Loan, (1 mo. LIBOR + 3.000%) | | | | 4,219 | | | | | | | | | | 4,222 | |
TruGreen Limited Partnership, 5.536%, Due 4/13/2023, 2017 Term Loan, (3 mo. LIBOR + 4.000%) | | | | 65,436 | | | | | | | | | | 66,131 | |
Vestcom Parent Holdings, Inc., 5.574%, Due 12/19/2023, 2016 1st Lien Term Loan, (1 mo. LIBOR + 4.000%) | | | | 124,060 | | | | | | | | | | 124,680 | |
Vistage Worldwide, Inc., 7.074%, Due 8/19/2021, Term Loan B, (1 mo. LIBOR + 5.500%) | | | | 98,111 | | | | | | | | | | 98,111 | |
Vivid Seats Ltd., 5.574%, Due 6/30/2024, 2017 1st Lien Term Loan, (1 mo. LIBOR + 4.000%) | | | | 124,375 | | | | | | | | | | 124,272 | |
World Triathlon Corp., 5.943%, Due 6/26/2021, Term Loan, (3 mo. LIBOR + 4.250%) | | | | 248,072 | | | | | | | | | | 248,072 | |
| | | | | | | | | | | | | | | |
| | | | | | | | | | | | | | 3,045,845 | |
| | | | | | | | | | | | | | | |
| | | | | | | | | | | | | | | |
| Technology - 1.53% | | | | | | | | | | | | | | | |
Almonde, Inc., | | | | | | | | | | | | | | | |
4.979%, Due 6/13/2024, USD 1st Lien Term Loan, (3 mo. LIBOR + 3.500%) | | | | 57,017 | | | | | | | | | | 57,308 | |
8.729%, Due 6/13/2025, USD 2nd Lien Term Loan, (3 mo. LIBOR + 7.250%) | | | | 124,825 | | | | | | | | | | 125,543 | |
Applied Systems, Inc., 4.943%, Due 9/19/2024, 2017 1st Lien Term Loan, (3 mo. LIBOR + 3.250%) | | | | 124,688 | | | | | | | | | | 125,917 | |
Compuware Corp., 5.900%, Due 12/15/2021, Term Loan B3, (2 mo. LIBOR + 4.250%) | | | | 106,779 | | | | | | | | | | 107,247 | |
Convergint Technologies LLC, | | | | | | | | | | | | | | | |
Due 1/24/2025, 2018 Delayed Draw Term LoanD | | | | 12,097 | | | | | | | | | | 12,157 | |
Due 1/25/2025, 2018 1st Lien Term LoanD | | | | 112,903 | | | | | | | | | | 113,468 | |
Epicor Software Corp., 5.330%, Due 6/1/2022, 1st Lien Term Loan, (1 mo. LIBOR + 3.750%) | | | | 124,680 | | | | | | | | | | 125,459 | |
Marketo, Inc., Due 1/30/2025, 2018 1st Lien Term LoanD | | | | 125,000 | | | | | | | | | | 124,375 | |
MH Sub I LLC, 5.339%, Due 9/13/2024, 2017 1st Lien Term Loan, (3 mo. LIBOR + 3.750%) | | | | 124,688 | | | | | | | | | | 125,217 | |
Navicure, Inc., 5.318%, Due 11/1/2024, 1st Lien Term Loan B, (1 mo. LIBOR + 3.750%) | | | | 125,000 | | | | | | | | | | 125,469 | |
Omnitracs, Inc., 5.450%, Due 11/25/2020, 1st Lien Term Loan, (3 mo. LIBOR + 3.750%) | | | | 73,594 | | | | | | | | | | 74,123 | |
Scientific Games International, Inc., 4.824%, Due 8/14/2024, 2017 Term Loan B4, (1 mo. LIBOR + 3.250%) | | | | 124,688 | | | | | | | | | | 125,328 | |
SMS Systems Maintenance Services, Inc., 6.567%, Due 10/30/2023, 2016 1st Lien Term Loan, (1 mo. LIBOR + 5.000%) | | | | 31,348 | | | | | | | | | | 26,803 | |
Triple Point Technology, Inc., 5.943%, Due 7/10/2020, 1st Lien Term Loan, (3 mo. LIBOR + 4.250%) | | | | 83,867 | | | | | | | | | | 75,942 | |
| | | | | | | | | | | | | | | |
| | | | | | | | | | | | | | 1,344,356 | |
| | | | | | | | | | | | | | | |
| | | | | | | | | | | | | | | |
| Telecommunications - 0.81% | | | | | | | | | | | | | | | |
Avaya, Inc., 6.310%, Due 12/15/2024, Exit Term Loan B, (1 mo. LIBOR + 4.750%) | | | | 125,000 | | | | | | | | | | 125,572 | |
Charter Communications Operating LLC, Due 4/30/2025, 2017 Term Loan B D | | | | 125,000 | | | | | | | | | | 125,684 | |
See accompanying notes
10
American Beacon Crescent Short Duration High Income FundSM
Schedule of Investments
January 31, 2018
| | | | | | | | | | | | | | | |
| | | Principal Amount | | | | Fair Value |
| | | | | | | | | | | | | | | |
| BANK LOAN OBLIGATIONS - 14.31% (continued) | | | | | | | | | | | | | | | |
| Telecommunications - 0.81% (continued) | | | | | | | | | | | | | | | |
CSC Holdings LLC, Due 1/25/2026, 2018 Term Loan BD | | | $ | 125,000 | | | | | | | | | $ | 125,860 | |
Merrill Communications LLC, 7.022%, Due 6/1/2022, 2015 Term Loan, (3 mo. LIBOR + 5.250%) | | | | 79,727 | | | | | | | | | | 80,524 | |
NeuStar, Inc., 5.147%, Due 8/8/2024, Term Loan B2, (3 mo. LIBOR + 3.750%) | | | | 124,688 | | | | | | | | | | 125,934 | |
Peak 10, Inc., 5.193%, Due 8/1/2024, 2017 1st Lien Term Loan, (3 mo. LIBOR + 3.500%) | | | | 124,688 | | | | | | | | | | 125,259 | |
| | | | | | | | | | | | | | | |
| | | | | | | | | | | | | | 708,833 | |
| | | | | | | | | | | | | | | |
| Transportation - 0.29% | | | | | | | | | | | | | | | |
American Tire Distributors Holdings, Inc., 5.824%, Due 9/1/2021, 2015 Term Loan, (1 mo. LIBOR + 4.250%) | | | | 124,043 | | | | | | | | | | 125,517 | |
Boing US Holdco Inc., 4.885%, Due 10/3/2024, 2017 1st Lien Term Loan, (3 mo. LIBOR + 3.500%) | | | | 125,000 | | | | | | | | | | 125,937 | |
| | | | | | | | | | | | | | | |
| | | | | | | | | | | | | | 251,454 | |
| | | | | | | | | | | | | | | |
| | | | | | | | | | | | | | | |
| Utilities - 0.40% | | | | | | | | | | | | | | | |
Compass Power Generation LLC, 5.391%, Due 12/20/2024, 2017 Term Loan B, (3 mo. LIBOR + 3.750%) | | | | 125,000 | | | | | | | | | | 126,485 | |
Helix Gen Funding LLC, 5.443%, Due 6/2/2024, Term Loan B, (3 mo. LIBOR + 3.750%) | | | | 104,832 | | | | | | | | | | 105,763 | |
TPF II Power LLC, 5.324%, Due 10/2/2023, Term Loan B, (1 mo. LIBOR + 3.750%) | | | | 121,191 | | | | | | | | | | 122,783 | |
| | | | | | | | | | | | | | | |
| | | | | | | | | | | | | | 355,031 | |
| | | | | | | | | | | | | | | |
| | | | | | | | | | | | | | | |
Total Bank Loan Obligations (Cost $12,520,411) | | | | | | | | | | | | | | 12,585,996 | |
| | | | | | | | | | | | | | | |
| | | | | | | | | | | | | | | |
| CORPORATE OBLIGATIONS - 61.91% | | | | | | | | | | | | | | | |
| Basic Materials - 3.81% | | | | | | | | | | | | | | | |
AK Steel Corp., 6.375%, Due 10/15/2025 | | | | 400,000 | | | | | | | | | | 395,000 | |
Aleris International, Inc., 9.500%, Due 4/1/2021G | | | | 150,000 | | | | | | | | | | 158,783 | |
CF Industries, Inc., | | | | | | | | | | | | | | | |
3.450%, Due 6/1/2023 | | | | 200,000 | | | | | | | | | | 195,440 | |
5.150%, Due 3/15/2034 | | | | 250,000 | | | | | | | | | | 252,187 | |
Chemours Co., | | | | | | | | | | | | | | | |
6.625%, Due 5/15/2023 | | | | 200,000 | | | | | | | | | | 210,750 | |
7.000%, Due 5/15/2025 | | | | 400,000 | | | | | | | | | | 437,000 | |
Freeport-McMoRan, Inc., 3.550%, Due 3/1/2022 | | | | 600,000 | | | | | | | | | | 595,500 | |
Hexion, Inc., 6.625%, Due 4/15/2020 | | | | 250,000 | | | | | | | | | | 227,813 | |
Huntsman International LLC, 5.125%, Due 11/15/2022 | | | | 250,000 | | | | | | | | | | 265,625 | |
PQ Corp., 6.750%, Due 11/15/2022G | | | | 100,000 | | | | | | | | | | 106,875 | |
United States Steel Corp., 8.375%, Due 7/1/2021G | | | | 159,000 | | | | | | | | | | 171,720 | |
Venator Finance Sarl / Venator Materials LLC, 5.750%, Due 7/15/2025G | | | | 325,000 | | | | | | | | | | 334,750 | |
| | | | | | | | | | | | | | | |
| | | | | | | | | | | | | | 3,351,443 | |
| | | | | | | | | | | | | | | |
| | | | | | | | | | | | | | | |
| Communications - 10.07% | | | | | | | | | | | | | | | |
AMC Networks, Inc., 5.000%, Due 4/1/2024 | | | | 125,000 | | | | | | | | | | 126,875 | |
Block Communications, Inc., 6.875%, Due 2/15/2025G | | | | 600,000 | | | | | | | | | | 624,000 | |
Cablevision Systems Corp., 5.875%, Due 9/15/2022 | | | | 550,000 | | | | | | | | | | 555,500 | |
CenturyLink, Inc., 7.500%, Due 4/1/2024, Series Y | | | | 325,000 | | | | | | | | | | 327,437 | |
Cequel Communications Holdings I LLC / Cequel Capital Corp., 5.125%, Due 12/15/2021G | | | | 250,000 | | | | | | | | | | 250,938 | |
DISH DBS Corp., | | | | | | | | | | | | | | | |
6.750%, Due 6/1/2021 | | | | 250,000 | | | | | | | | | | 261,875 | |
5.000%, Due 3/15/2023 | | | | 250,000 | | | | | | | | | | 234,463 | |
5.875%, Due 11/15/2024 | | | | 200,000 | | | | | | | | | | 189,625 | |
Frontier Communications Corp., | | | | | | | | | | | | | | | |
7.125%, Due 3/15/2019 | | | | 250,000 | | | | | | | | | | 252,187 | |
10.500%, Due 9/15/2022 | | | | 250,000 | | | | | | | | | | 206,563 | |
9.000%, Due 8/15/2031 | | | | 65,000 | | | | | | | | | | 42,413 | |
Level 3 Financing, Inc., | | | | | | | | | | | | | | | |
5.375%, Due 1/15/2024 | | | | 400,000 | | | | | | | | | | 398,000 | |
5.250%, Due 3/15/2026 | | | | 250,000 | | | | | | | | | | 245,313 | |
Nielsen Finance LLC / Nielsen Finance Co., 5.000%, Due 4/15/2022G | | | | 250,000 | | | | | | | | | | 254,062 | |
Plantronics, Inc., 5.500%, Due 5/31/2023G | | | | 500,000 | | | | | | | | | | 517,500 | |
Qwest Corp., 6.750%, Due 12/1/2021 | | | | 25,000 | | | | | | | | | | 26,750 | |
Salem Media Group, Inc., 6.750%, Due 6/1/2024G | | | | 75,000 | | | | | | | | | | 73,313 | |
Sinclair Television Group, Inc., | | | | | | | | | | | | | | | |
5.375%, Due 4/1/2021 | | | | 250,000 | | | | | | | | | | 253,437 | |
6.125%, Due 10/1/2022 | | | | 150,000 | | | | | | | | | | 154,313 | |
See accompanying notes
11
American Beacon Crescent Short Duration High Income FundSM
Schedule of Investments
January 31, 2018
| | | | | | | | | | | | | | | |
| | | Principal Amount | | | | Fair Value |
| | | | | | | | | | | | | | | |
| CORPORATE OBLIGATIONS - 61.91% (continued) | | | | | | | | | | | | | | | |
| Communications - 10.07% (continued) | | | | | | | | | | | | | | | |
Sirius XM Radio, Inc., 3.875%, Due 8/1/2022G | | | $ | 650,000 | | | | | | | | | $ | 647,562 | |
Sprint Communications, Inc., 6.000%, Due 11/15/2022 | | | | 425,000 | | | | | | | | | | 423,406 | |
Sprint Corp., 7.250%, Due 9/15/2021 | | | | 1,000,000 | | | | | | | | | | 1,062,710 | |
T-Mobile USA, Inc., 6.625%, Due 4/1/2023 | | | | 1,000,000 | | | | | | | | | | 1,039,300 | |
Townsquare Media, Inc., 6.500%, Due 4/1/2023G | | | | 175,000 | | | | | | | | | | 168,000 | |
Univision Communications, Inc., | | | | | | | | | | | | | | | |
5.125%, Due 5/15/2023G | | | | 425,000 | | | | | | | | | | 423,087 | |
5.125%, Due 2/15/2025G | | | | 100,000 | | | | | | | | | | 97,000 | |
| | | | | | | | | | | | | | | |
| | | | | | | | | | | | | | 8,855,629 | |
| | | | | | | | | | | | | | | |
| | | | | | | | | | | | | | | |
| Consumer, Cyclical - 8.78% | | | | | | | | | | | | | | | |
Allison Transmission, Inc., 5.000%, Due 10/1/2024G | | | | 500,000 | | | | | | | | | | 505,000 | |
Ashton Woods USA LLC / Ashton Woods Finance Co., 6.875%, Due 2/15/2021G | | | | 298,000 | | | | | | | | | | 302,470 | |
AV Homes, Inc., 6.625%, Due 5/15/2022 | | | | 300,000 | | | | | | | | | | 313,500 | |
CEC Entertainment, Inc., 8.000%, Due 2/15/2022 | | | | 500,000 | | | | | | | | | | 495,000 | |
Century Communities, Inc., 5.875%, Due 7/15/2025 | | | | 350,000 | | | | | | | | | | 354,813 | |
EMI Music Publishing Group North America Holdings, Inc., 7.625%, Due 6/15/2024G | | | | 225,000 | | | | | | | | | | 247,500 | |
Golden Nugget, Inc., 6.750%, Due 10/15/2024G | | | | 350,000 | | | | | | | | | | 361,812 | |
Guitar Center, Inc., 6.500%, Due 4/15/2019G | | | | 250,000 | | | | | | | | | | 244,375 | |
Intrepid Aviation Group Holdings LLC / Intrepid Finance Co., 6.875%, Due 2/15/2019G | | | | 500,000 | | | | | | | | | | 497,500 | |
KFC Holding Co. / Pizza Hut Holdings LLC / Taco Bell of America LLC, 5.250%, Due 6/1/2026G | | | | 125,000 | | | | | | | | | | 127,500 | |
M/I Homes, Inc., 5.625%, Due 8/1/2025 | | | | 200,000 | | | | | | | | | | 203,500 | |
MDC Holdings, Inc., 5.500%, Due 1/15/2024 | | | | 500,000 | | | | | | | | | | 525,000 | |
Navistar International Corp., 6.625%, Due 11/1/2025G | | | | 375,000 | | | | | | | | | | 391,987 | |
Neiman Marcus Group Ltd. LLC, 8.000%, Due 10/15/2021G | | | | 300,000 | | | | | | | | | | 191,250 | |
PF Chang’s China Bistro, Inc., 10.250%, Due 6/30/2020G | | | | 350,000 | | | | | | | | | | 310,625 | |
Pinnacle Entertainment, Inc., 5.625%, Due 5/1/2024 | | | | 125,000 | | | | | | | | | | 133,750 | |
Scientific Games International, Inc., 10.000%, Due 12/1/2022 | | | | 500,000 | | | | | | | | | | 548,125 | |
Springs Industries, Inc., 6.250%, Due 6/1/2021 | | | | 375,000 | | | | | | | | | | 382,969 | |
Tempur Sealy International, Inc., 5.625%, Due 10/15/2023 | | | | 475,000 | | | | | | | | | | 489,250 | |
Tesla, Inc., 5.300%, Due 8/15/2025G | | | | 250,000 | | | | | | | | | | 238,000 | |
United Continental Holdings, Inc., 4.250%, Due 10/1/2022 | | | | 500,000 | | | | | | | | | | 502,500 | |
Wynn Las Vegas LLC / Wynn Las Vegas Capital Corp., 5.500%, Due 3/1/2025G | | | | 350,000 | | | | | | | | | | 353,281 | |
| | | | | | | | | | | | | | | |
| | | | | | | | | | | | | | 7,719,707 | |
| | | | | | | | | | | | | | | |
| | | | | | | | | | | | | | | |
| Consumer, Non-Cyclical - 11.50% | | | | | | | | | | | | | | | |
APX Group, Inc., 7.875%, Due 12/1/2022 | | | | 350,000 | | | | | | | | | | 375,375 | |
Cardtronics, Inc., 5.125%, Due 8/1/2022 | | | | 250,000 | | | | | | | | | | 241,875 | |
Cardtronics, Inc. / Cardtronics USA, Inc., 5.500%, Due 5/1/2025G | | | | 300,000 | | | | | | | | | | 278,250 | |
CHS/Community Health Systems, Inc., | | | | | | | | | | | | | | | |
8.000%, Due 11/15/2019 | | | | 350,000 | | | | | | | | | | 328,125 | |
6.250%, Due 3/31/2023 | | | | 100,000 | | | | | | | | | | 92,500 | |
Cott Holdings, Inc., 5.500%, Due 4/1/2025G | | | | 175,000 | | | | | | | | | | 178,281 | |
DaVita, Inc., | | | | | | | | | | | | | | | |
5.750%, Due 8/15/2022 | | | | 100,000 | | | | | | | | | | 103,063 | |
5.125%, Due 7/15/2024 | | | | 500,000 | | | | | | | | | | 503,765 | |
Dean Foods Co., 6.500%, Due 3/15/2023G | | | | 600,000 | | | | | | | | | | 594,000 | |
Encompass Health Corp., 5.750%, Due 11/1/2024 | | | | 300,000 | | | | | | | | | | 306,000 | |
Endo Finance LLC / Endo Finco, Inc., 5.375%, Due 1/15/2023G | | | | 250,000 | | | | | | | | | | 195,000 | |
First Quality Finance Co., Inc., 5.000%, Due 7/1/2025G | | | | 250,000 | | | | | | | | | | 251,875 | |
HCA, Inc., | | | | | | | | | | | | | | | |
5.875%, Due 5/1/2023 | | | | 500,000 | | | | | | | | | | 536,250 | |
5.375%, Due 2/1/2025 | | | | 100,000 | | | | | | | | | | 102,125 | |
Herc Rentals, Inc., 7.500%, Due 6/1/2022G | | | | 418,000 | | | | | | | | | | 448,827 | |
Hertz Corp., 5.875%, Due 10/15/2020 | | | | 225,000 | | | | | | | | | | 225,000 | |
Horizon Pharma, Inc., 6.625%, Due 5/1/2023 | | | | 90,000 | | | | | | | | | | 90,675 | |
Horizon Pharma, Inc. / Horizon Pharma USA, Inc., 8.750%, Due 11/1/2024G | | | | 75,000 | | | | | | | | | | 81,563 | |
Kronos Acquisition Holdings, Inc., 9.000%, Due 8/15/2023G | | | | 175,000 | | | | | | | | | | 171,938 | |
LifePoint Health, Inc., | | | | | | | | | | | | | | | |
5.875%, Due 12/1/2023 | | | | 525,000 | | | | | | | | | | 525,656 | |
5.375%, Due 5/1/2024 | | | | 150,000 | | | | | | | | | | 144,563 | |
MEDNAX, Inc., 5.250%, Due 12/1/2023G | | | | 225,000 | | | | | | | | | | 229,781 | |
Midas Intermediate Holdco II LLC / Midas Intermediate Holdco II Finance, Inc., 7.875%, Due 10/1/2022G | | | | 200,000 | | | | | | | | | | 204,440 | |
Monitronics International, Inc., 9.125%, Due 4/1/2020 | | | | 300,000 | | | | | | | | | | 262,312 | |
Rent-A-Center, Inc., 4.750%, Due 5/1/2021 | | | | 200,000 | | | | | | | | | | 185,500 | |
Spectrum Brands, Inc., 5.750%, Due 7/15/2025 | | | | 550,000 | | | | | | | | | | 578,875 | |
See accompanying notes
12
American Beacon Crescent Short Duration High Income FundSM
Schedule of Investments
January 31, 2018
| | | | | | | | | | | | | | | |
| | | Principal Amount | | | | Fair Value |
| | | | | | | | | | | | | | | |
| CORPORATE OBLIGATIONS - 61.91% (continued) | | | | | | | | | | | | | | | |
| Consumer, Non-Cyclical - 11.50% (continued) | | | | | | | | | | | | | | | |
Syniverse Foreign Holdings Corp., 9.125%, Due 1/15/2022G | | | $ | 500,000 | | | | | | | | | $ | 518,125 | |
Tenet Healthcare Corp., | | | | | | | | | | | | | | | |
4.750%, Due 6/1/2020 | | | | 200,000 | | | | | | | | | | 204,000 | |
6.750%, Due 6/15/2023 | | | | 200,000 | | | | | | | | | | 197,020 | |
United Rentals North America, Inc., | | | | | | | | | | | | | | | |
5.750%, Due 11/15/2024 | | | | 150,000 | | | | | | | | | | 157,875 | |
5.500%, Due 7/15/2025 | | | | 250,000 | | | | | | | | | | 263,750 | |
5.500%, Due 5/15/2027 | | | | 200,000 | | | | | | | | | | 210,000 | |
Universal Health Services, Inc., 4.750%, Due 8/1/2022G | | | | 350,000 | | | | | | | | | | 358,330 | |
Universal Hospital Services, Inc., 7.625%, Due 8/15/2020 | | | | 450,000 | | | | | | | | | | 452,250 | |
Vector Group Ltd., 6.125%, Due 2/1/2025G | | | | 500,000 | | | | | | | | | | 518,750 | |
| | | | | | | | | | | | | | | |
| | | | | | | | | | | | | | 10,115,714 | |
| | | | | | | | | | | | | | | |
| | | | | | | | | | | | | | | |
| Energy - 9.39% | | | | | | | | | | | | | | | |
Antero Resources Corp., 5.125%, Due 12/1/2022 | | | | 300,000 | | | | | | | | | | 306,453 | |
Archrock Partners LP / Archrock Partners Finance Corp., 6.000%, Due 4/1/2021 | | | | 250,000 | | | | | | | | | | 253,125 | |
Calfrac Holdings LP, 7.500%, Due 12/1/2020G | | | | 350,000 | | | | | | | | | | 346,500 | |
Carrizo Oil & Gas, Inc., 7.500%, Due 9/15/2020 | | | | 145,000 | | | | | | | | | | 147,900 | |
Cheniere Energy Partners LP, 5.250%, Due 10/1/2025G | | | | 200,000 | | | | | | | | | | 203,750 | |
Chesapeake Energy Corp., | | | | | | | | | | | | | | | |
8.000%, Due 12/15/2022G | | | | 24,000 | | | | | | | | | | 25,740 | |
8.000%, Due 6/15/2027G | | | | 275,000 | | | | | | | | | | 273,281 | |
Continental Resources, Inc., 5.000%, Due 9/15/2022 | | | | 100,000 | | | | | | | | | | 101,250 | |
Crestwood Midstream Partners LP / Crestwood Midstream Finance Corp., 6.250%, Due 4/1/2023 | | | | 200,000 | | | | | | | | | | 208,500 | |
CSI Compressco LP / CSI Compressco Finance, Inc., 7.250%, Due 8/15/2022 | | | | 300,000 | | | | | | | | | | 295,500 | |
Denbury Resources, Inc., 9.000%, Due 5/15/2021G | | | | 250,000 | | | | | | | | | | 255,625 | |
Diamond Offshore Drilling, Inc., 4.875%, Due 11/1/2043 | | | | 75,000 | | | | | | | | | | 57,375 | |
EP Energy LLC / Everest Acquisition Finance, Inc., 8.000%, Due 11/29/2024G | | | | 175,000 | | | | | | | | | | 184,188 | |
Gulfport Energy Corp., 6.375%, Due 1/15/2026G | | | | 500,000 | | | | | | | | | | 507,500 | |
Hess Infrastructure Partners LP / Hess Infrastructure Partners Finance Corp., 5.625%, Due 2/15/2026G | | | | 625,000 | | | | | | | | | | 634,375 | |
Hilcorp Energy I LP / Hilcorp Finance Co., 5.000%, Due 12/1/2024G | | | | 300,000 | | | | | | | | | | 301,500 | |
Jones Energy Holdings LLC / Jones Energy Finance Corp., 6.750%, Due 4/1/2022 | | | | 350,000 | | | | | | | | | | 266,000 | |
Laredo Petroleum, Inc., 5.625%, Due 1/15/2022 | | | | 400,000 | | | | | | | | | | 405,000 | |
Nabors Industries, Inc., 5.500%, Due 1/15/2023 | | | | 425,000 | | | | | | | | | | 425,000 | |
Newfield Exploration Co., 5.375%, Due 1/1/2026 | | | | 425,000 | | | | | | | | | | 448,906 | |
Oceaneering International, Inc., 4.650%, Due 11/15/2024 | | | | 500,000 | | | | | | | | | | 486,250 | |
Parker Drilling Co., 6.750%, Due 7/15/2022 | | | | 250,000 | | | | | | | | | | 215,000 | |
Parsley Energy LLC / Parsley Finance Corp., 5.375%, Due 1/15/2025G | | | | 200,000 | | | | | | | | | | 202,000 | |
Peabody Energy Corp., 6.000%, Due 3/31/2022G | | | | 75,000 | | | | | | | | | | 77,903 | |
Pioneer Energy Services Corp., 6.125%, Due 3/15/2022 | | | | 200,000 | | | | | | | | | | 179,000 | |
QEP Resources, Inc., 5.625%, Due 3/1/2026 | | | | 350,000 | | | | | | | | | | 357,000 | |
SESI LLC, 7.125%, Due 12/15/2021 | | | | 500,000 | | | | | | | | | | 511,875 | |
SM Energy Co., 5.625%, Due 6/1/2025 | | | | 175,000 | | | | | | | | | | 173,250 | |
Summit Midstream Holdings LLC / Summit Midstream Finance Corp., 5.500%, Due 8/15/2022 | | | | 125,000 | | | | | | | | | | 126,250 | |
Sunoco LP / Sunoco Finance Corp., 4.875%, Due 1/15/2023G | | | | 100,000 | | | | | | | | | | 101,852 | |
WPX Energy, Inc., 7.500%, Due 8/1/2020 | | | | 168,000 | | | | | | | | | | 181,440 | |
| | | | | | | | | | | | | | | |
| | | | | | | | | | | | | | 8,259,288 | |
| | | | | | | | | | | | | | | |
| | | | | | | | | | | | | | | |
| Financial - 6.81% | | | | | | | | | | | | | | | |
Acrisure LLC / Acrisure Finance, Inc., 7.000%, Due 11/15/2025G | | | | 425,000 | | | | | | | | | | 421,812 | |
Ally Financial, Inc., 5.125%, Due 9/30/2024 | | | | 300,000 | | | | | | | | | | 316,125 | |
Cornerstone Chemical Co., 6.750%, Due 8/15/2024G | | | | 100,000 | | | | | | | | | | 100,250 | |
Credit Acceptance Corp., | | | | | | | | | | | | | | | |
6.125%, Due 2/15/2021 | | | | 575,000 | | | | | | | | | | 580,750 | |
7.375%, Due 3/15/2023 | | | | 100,000 | | | | | | | | | | 104,500 | |
CyrusOne LP / CyrusOne Finance Corp., 5.375%, Due 3/15/2027 | | | | 125,000 | | | | | | | | | | 130,000 | |
Equinix, Inc., | | | | | | | | | | | | | | | |
5.375%, Due 1/1/2022 | | | | 250,000 | | | | | | | | | | 259,063 | |
5.875%, Due 1/15/2026 | | | | 250,000 | | | | | | | | | | 265,625 | |
FelCor Lodging LP, 5.625%, Due 3/1/2023 | | | | 375,000 | | | | | | | | | | 384,375 | |
Greystar Real Estate Partners LLC, 5.750%, Due 12/1/2025G | | | | 50,000 | | | | | | | | | | 51,375 | |
Icahn Enterprises LP / Icahn Enterprises Finance Corp., | | | | | | | | | | | | | | | |
6.000%, Due 8/1/2020 | | | | 300,000 | | | | | | | | | | 307,035 | |
6.250%, Due 2/1/2022 | | | | 100,000 | | | | | | | | | | 102,750 | |
iStar, Inc., 4.625%, Due 9/15/2020 | | | | 300,000 | | | | | | | | | | 303,750 | |
See accompanying notes
13
American Beacon Crescent Short Duration High Income FundSM
Schedule of Investments
January 31, 2018
| | | | | | | | | | | | | | | |
| | | Principal Amount | | | | Fair Value |
| | | | | | | | | | | | | | | |
| CORPORATE OBLIGATIONS - 61.91% (continued) | | | | | | | | | | | | | | | |
| Financial - 6.81% (continued) | | | | | | | | | | | | | | | |
Ladder Capital Finance Holdings LLLP / Ladder Capital Finance Corp., 5.875%, Due 8/1/2021G | | | $ | 90,000 | | | | | | | | | $ | 92,925 | |
LPL Holdings, Inc., 5.750%, Due 9/15/2025G | | | | 425,000 | | | | | | | | | | 433,500 | |
Navient Corp., 5.875%, Due 3/25/2021 | | | | 1,000,000 | | | | | | | | | | 1,030,000 | |
Oxford Finance LLC / Oxford Finance Co-Issuer II, Inc., 6.375%, Due 12/15/2022G | | | | 175,000 | | | | | | | | | | 180,661 | |
SBA Communications Corp., 4.875%, Due 7/15/2022 | | | | 400,000 | | | | | | | | | | 409,500 | |
Springleaf Finance Corp., 5.250%, Due 12/15/2019 | | | | 500,000 | | | | | | | | | | 515,000 | |
| | | | | | | | | | | | | | | |
| | | | | | | | | | | | | | 5,988,996 | |
| | | | | | | | | | | | | | | |
| | | | | | | | | | | | | | | |
| Industrial - 4.57% | | | | | | | | | | | | | | | |
Energizer Holdings, Inc., 5.500%, Due 6/15/2025G | | | | 650,000 | | | | | | | | | | 666,250 | |
Gibraltar Industries, Inc., 6.250%, Due 2/1/2021 | | | | 250,000 | | | | | | | | | | 253,750 | |
Grinding Media, Inc. / Moly-Cop AltaSteel Ltd., 7.375%, Due 12/15/2023G | | | | 575,000 | | | | | | | | | | 612,375 | |
Ingram Micro, Inc., | | | | | | | | | | | | | | | |
5.000%, Due 8/10/2022 | | | | 100,000 | | | | | | | | | | 99,760 | |
5.450%, Due 12/15/2024 | | | | 350,000 | | | | | | | | | | 346,685 | |
Novelis Corp., 5.875%, Due 9/30/2026G | | | | 500,000 | | | | | | | | | | 515,295 | |
Plastipak Holdings, Inc., 6.250%, Due 10/15/2025G | | | | 175,000 | | | | | | | | | | 181,563 | |
Standard Industries, Inc., 5.375%, Due 11/15/2024G | | | | 500,000 | | | | | | | | | | 517,500 | |
TransDigm, Inc., 6.000%, Due 7/15/2022 | | | | 550,000 | | | | | | | | | | 564,437 | |
Tutor Perini Corp., 6.875%, Due 5/1/2025G | | | | 250,000 | | | | | | | | | | 266,250 | |
| | | | | | | | | | | | | | | |
| | | | | | | | | | | | | | 4,023,865 | |
| | | | | | | | | | | | | | | |
| | | | | | | | | | | | | | | |
| Technology - 4.32% | | | | | | | | | | | | | | | |
Advanced Micro Devices, Inc., 7.000%, Due 7/1/2024 | | | | 500,000 | | | | | | | | | | 525,000 | |
BMC Software Finance, Inc., 8.125%, Due 7/15/2021G | | | | 500,000 | | | | | | | | | | 500,625 | |
First Data Corp., 7.000%, Due 12/1/2023G | | | | 425,000 | | | | | | | | | | 447,580 | |
Harland Clarke Holdings Corp., 8.375%, Due 8/15/2022G | | | | 75,000 | | | | | | | | | | 78,188 | |
Infor Software Parent LLC / Infor Software Parent, Inc., 7.125%, Due 5/1/2021, Cash (7.125%) or PIK (7.875%)G | | | | 150,000 | | | | | | | | | | 153,000 | |
j2 Cloud Services LLC / j2 Global Co-Obligor, Inc., 6.000%, Due 7/15/2025G | | | | 500,000 | | | | | | | | | | 528,750 | |
Micron Technology, Inc., 5.500%, Due 2/1/2025 | | | | 33,000 | | | | | | | | | | 34,609 | |
NCR Corp., 5.000%, Due 7/15/2022 | | | | 500,000 | | | | | | | | | | 510,150 | |
Solera LLC / Solera Finance, Inc., 10.500%, Due 3/1/2024G | | | | 425,000 | | | | | | | | | | 476,531 | |
Western Digital Corp., 7.375%, Due 4/1/2023G | | | | 500,000 | | | | | | | | | | 544,375 | |
| | | | | | | | | | | | | | | |
| | | | | | | | | | | | | | 3,798,808 | |
| | | | | | | | | | | | | | | |
| | | | | | | | | | | | | | | |
| Utilities - 2.66% | | | | | | | | | | | | | | | |
AES Corp., | | | | | | | | | | | | | | | |
5.500%, Due 3/15/2024 | | | | 250,000 | | | | | | | | | | 257,575 | |
6.000%, Due 5/15/2026 | | | | 125,000 | | | | | | | | | | 134,063 | |
Calpine Corp., 5.250%, Due 6/1/2026G | | | | 700,000 | | | | | | | | | | 686,875 | |
Dynegy, Inc., 7.375%, Due 11/1/2022 | | | | 500,000 | | | | | | | | | | 528,200 | |
NRG Energy, Inc., | | | | | | | | | | | | | | | |
6.250%, Due 7/15/2022 | | | | 100,000 | | | | | | | | | | 103,625 | |
6.250%, Due 5/1/2024 | | | | 250,000 | | | | | | | | | | 261,345 | |
Talen Energy Supply LLC, 9.500%, Due 7/15/2022G | | | | 350,000 | | | | | | | | | | 365,925 | |
| | | | | | | | | | | | | | | |
| | | | | | | | | | | | | | 2,337,608 | |
| | | | | | | | | | | | | | | |
| | | | | | | | | | | | | | | |
Total Corporate Obligations (Cost $54,180,211) | | | | | | | | | | | | | | 54,451,058 | |
| | | | | | | | | | | | | | | |
| | | | | | | | | | | | | | | |
| FOREIGN CORPORATE OBLIGATIONS - 17.94% | | | | | | | | | | | | | | | |
| Basic Materials - 2.05% | | | | | | | | | | | | | | | |
Alcoa Nederland Holding B.V., 7.000%, Due 9/30/2026G | | | | 350,000 | | | | | | | | | | 387,975 | |
Constellium N.V., 5.750%, Due 5/15/2024G | | | | 100,000 | | | | | | | | | | 102,250 | |
INEOS Group Holdings S.A., 5.625%, Due 8/1/2024G | | | | 250,000 | | | | | | | | | | 256,563 | |
New Gold, Inc., 6.250%, Due 11/15/2022G | | | | 700,000 | | | | | | | | | | 717,500 | |
NOVA Chemicals Corp., 4.875%, Due 6/1/2024G | | | | 125,000 | | | | | | | | | | 125,781 | |
Perstorp Holding AB, 8.500%, Due 6/30/2021G | | | | 204,000 | | | | | | | | | | 217,362 | |
| | | | | | | | | | | | | | | |
| | | | | | | | | | | | | | 1,807,431 | |
| | | | | | | | | | | | | | | |
| | | | | | | | | | | | | | | |
| Communications - 2.93% | | | | | | | | | | | | | | | |
Altice Luxembourg S.A., 7.750%, Due 5/15/2022G | | | | 100,000 | | | | | | | | | | 96,000 | |
SFR Group S.A., 6.000%, Due 5/15/2022G | | | | 350,000 | | | | | | | | | | 341,583 | |
Telecom Italia SpA, 5.303%, Due 5/30/2024G | | | | 400,000 | | | | | | | | | | 422,500 | |
Virgin Media Finance PLC, 6.375%, Due 4/15/2023G | | | | 500,000 | | | | | | | | | | 515,000 | |
VTR Finance B.V., 6.875%, Due 1/15/2024G | | | | 290,000 | | | | | | | | | | 305,225 | |
See accompanying notes
14
American Beacon Crescent Short Duration High Income FundSM
Schedule of Investments
January 31, 2018
| | | | | | | | | | | | | | | |
| | | Principal Amount | | | | Fair Value |
| | | | | | | | | | | | | | | |
| FOREIGN CORPORATE OBLIGATIONS - 17.94% (continued) | | | | | | | | | | | | | | | |
| Communications - 2.93% (continued) | | | | | | | | | | | | | | | |
Wind Tre SpA, 5.000%, Due 1/20/2026G | | | $ | 500,000 | | | | | | | | | $ | 453,810 | |
Ziggo Bond Finance B.V., 6.000%, Due 1/15/2027G | | | | 150,000 | | | | | | | | | | 147,750 | |
Ziggo Secured Finance B.V., 5.500%, Due 1/15/2027G | | | | 300,000 | | | | | | | | | | 297,750 | |
| | | | | | | | | | | | | | | |
| | | | | | | | | | | | | | 2,579,618 | |
| | | | | | | | | | | | | | | |
| | | | | | | | | | | | | | | |
| Consumer, Cyclical - 3.29% | | | | | | | | | | | | | | | |
1011778 BC ULC / New Red Finance, Inc., 4.250%, Due 5/15/2024G | | | | 500,000 | | | | | | | | | | 491,250 | |
Aston Martin Capital Holdings Ltd., 6.500%, Due 4/15/2022G | | | | 400,000 | | | | | | | | | | 422,500 | |
Fiat Chrysler Automobiles N.V., 5.250%, Due 4/15/2023 | | | | 150,000 | | | | | | | | | | 158,700 | |
International Game Technology PLC, 6.500%, Due 2/15/2025G | | | | 500,000 | | | | | | | | | | 556,250 | |
Mclaren Finance PLC, 5.750%, Due 8/1/2022G | | | | 375,000 | | | | | | | | | | 384,563 | |
Melco Resorts Finance Ltd., 4.875%, Due 6/6/2025G | | | | 225,000 | | | | | | | | | | 224,781 | |
Silversea Cruise Finance Ltd., 7.250%, Due 2/1/2025G | | | | 250,000 | | | | | | | | | | 269,500 | |
Viking Cruises Ltd., 6.250%, Due 5/15/2025G | | | | 300,000 | | | | | | | | | | 310,500 | |
VOC Escrow Ltd., 5.000%, Due 2/15/2028G | | | | 75,000 | | | | | | | | | | 74,625 | |
| | | | | | | | | | | | | | | |
| | | | | | | | | | | | | | 2,892,669 | |
| | | | | | | | | | | | | | | |
| | | | | | | | | | | | | | | |
| Consumer, Non-Cyclical - 1.91% | | | | | | | | | | | | | | | |
Clearwater Seafoods, Inc., 6.875%, Due 5/1/2025G | | | | 100,000 | | | | | | | | | | 102,000 | |
IHS Markit Ltd., 5.000%, Due 11/1/2022G | | | | 325,000 | | | | | | | | | | 344,906 | |
Mallinckrodt International Finance S.A. / Mallinckrodt CB LLC, 5.625%, Due 10/15/2023G | | | | 350,000 | | | | | | | | | | 299,250 | |
Valeant Pharmaceuticals International, Inc., | | | | | | | | | | | | | | | |
7.000%, Due 3/15/2024G | | | | 500,000 | | | | | | | | | | 531,720 | |
6.125%, Due 4/15/2025G | | | | 450,000 | | | | | | | | | | 402,840 | |
| | | | | | | | | | | | | | | |
| | | | | | | | | | | | | | 1,680,716 | |
| | | | | | | | | | | | | | | |
| | | | | | | | | | | | | | | |
| Energy - 2.60% | | | | | | | | | | | | | | | |
Ensco PLC, 5.750%, Due 10/1/2044 | | | | 225,000 | | | | | | | | | | 160,594 | |
MEG Energy Corp., | | | | | | | | | | | | | | | |
6.375%, Due 1/30/2023G | | | | 300,000 | | | | | | | | | | 258,000 | |
7.000%, Due 3/31/2024G | | | | 50,000 | | | | | | | | | | 43,313 | |
Noble Holding International Ltd., 7.750%, Due 1/15/2024 | | | | 325,000 | | | | | | | | | | 301,437 | |
Transocean, Inc., 8.375%, Due 12/15/2021 | | | | 250,000 | | | | | | | | | | 276,875 | |
Weatherford International Ltd., | | | | | | | | | | | | | | | |
5.125%, Due 9/15/2020 | | | | 500,000 | | | | | | | | | | 512,500 | |
4.500%, Due 4/15/2022 | | | | 250,000 | | | | | | | | | | 236,250 | |
Welltec A/S, 9.500%, Due 12/1/2022G | | | | 475,000 | | | | | | | | | | 496,612 | |
| | | | | | | | | | | | | | | |
| | | | | | | | | | | | | | 2,285,581 | |
| | | | | | | | | | | | | | | |
| | | | | | | | | | | | | | | |
| Financial - 1.38% | | | | | | | | | | | | | | | |
goeasy Ltd., 7.875%, Due 11/1/2022G | | | | 325,000 | | | | | | | | | | 346,938 | |
Intesa Sanpaolo SpA, 5.017%, Due 6/26/2024G | | | | 600,000 | | | | | | | | | | 612,474 | |
Royal Bank of Scotland Group PLC, 4.700%, Due 7/3/2018 | | | | 250,000 | | | | | | | | | | 252,524 | |
| | | | | | | | | | | | | | | |
| | | | | | | | | | | | | | 1,211,936 | |
| | | | | | | | | | | | | | | |
| | | | | | | | | | | | | | | |
| Industrial - 2.54% | | | | | | | | | | | | | | | |
Ardagh Packaging Finance PLC , 7.250%, Due 5/15/2024G | | | | 300,000 | | | | | | | | | | 322,410 | |
Ardagh Packaging Finance PLC / Ardagh Holdings USA, Inc., 4.625%, Due 5/15/2023G | | | | 50,000 | | | | | | | | | | 50,500 | |
Bombardier, Inc., 6.000%, Due 10/15/2022G | | | | 550,000 | | | | | | | | | | 550,000 | |
Cemex S.A.B. de C.V., 7.750%, Due 4/16/2026G | | | | 500,000 | | | | | | | | | | 566,250 | |
Park Aerospace Holdings Ltd., | | | | | | | | | | | | | | | |
5.250%, Due 8/15/2022G | | | | 250,000 | | | | | | | | | | 246,875 | |
5.500%, Due 2/15/2024G | | | | 500,000 | | | | | | | | | | 495,000 | |
| | | | | | | | | | | | | | | |
| | | | | | | | | | | | | | 2,231,035 | |
| | | | | | | | | | | | | | | |
| | | | | | | | | | | | | | | |
| Technology - 1.24% | | | | | | | | | | | | | | | |
Open Text Corp., 5.875%, Due 6/1/2026G | | | | 550,000 | | | | | | | | | | 578,875 | |
Seagate HDD Cayman, 4.750%, Due 6/1/2023 | | | | 500,000 | | | | | | | | | | 514,375 | |
| | | | | | | | | | | | | | | |
| | | | | | | | | | | | | | 1,093,250 | |
| | | | | | | | | | | | | | | |
| | | | | | | | | | | | | | | |
Total Foreign Corporate Obligations (Cost $15,663,957) | | | | | | | | | | | | | | 15,782,236 | |
| | | | | | | | | | | | | | | |
See accompanying notes
15
American Beacon Crescent Short Duration High Income FundSM
Schedule of Investments
January 31, 2018
| | | | | | | | | | | | | | | |
| | | Shares | | | | Fair Value |
| | | | | | | | | | | | | | | |
| SHORT-TERM INVESTMENTS - 2.48% (Cost $2,182,064) | | | | | | | | | | | | | | | |
| Investment Companies - 2.48% | | | | | | | | | | | | | | | |
American Beacon U.S. Government Money Market Select Fund, Select Class, 1.25%F H | | | | 2,182,064 | | | | | | | | | $ | 2,182,064 | |
| | | | | | | | | | | | | | | |
| | | | | | | | | | | | | | | |
TOTAL INVESTMENTS - 96.64% (Cost $84,572,898) | | | | | | | | | | | | | | 85,001,861 | |
OTHER ASSETS, NET OF LIABILITIES - 3.36% | | | | | | | | | | | | | | 2,953,931 | |
| | | | | | | | | | | | | | | |
TOTAL NET ASSETS - 100.00% | | | | | | | | | | | | | $ | 87,955,792 | |
| | | | | | | | | | | | | | | |
| | | | | | | | | | | | | | | |
| Percentages are stated as a percent of net assets. | | | | | | | | | | | | | | | |
A Non-income producing security.
B Fair valued pursuant to procedures approved by the Board of Trustees. At period end, the value of these securities amounted to $507 or 0.00% of net assets. Value was determined using significant unobservable inputs.
C Bank loan obligations, unless otherwise stated, carry a floating rate of interest. The coupon rate shown on floating or adjustable rate securities represents the rate at period end.
D Coupon rates may not be available for bank loans that are unsettled and/or unfunded as of January 31, 2018.
E Unfunded Loan Commitment. At period end, the amount of unfunded loan commitments was $39,946 or 0.05% of net assets. Of this amount, $8,333 relates to Institutional Shareholder Services, Inc., $9,511 relates to Lakeland Tours LLC, and $22,102 relates to TGP Holdings III LLC.
F 7-day yield.
G Security exempt from registration under the Securities Act of 1933. These securities may be resold to qualified institutional buyers pursuant to Rule 144A. At the period end, the value of these securities amounted to $35,932,850 or 40.85% of net assets. The Fund has no right to demand registration of these securities.
H The Fund is affiliated by having the same investment advisor.
DIP - Debtor in Possession.
LIBOR - London Interbank Offered Rate.
LLC - Limited Liability Company.
LLLP - Limited Liability Limited Partnership.
LP - Limited Partnership.
PIK - Payment in Kind.
PLC - Public Limited Company.
PRIME - A rate, charged by banks, based on the U.S. Federal Funds rate.
The Fund’s investments are summarized by level based on the inputs used to determine their values. As of January 31, 2018, the investments were classified as described below:
| | | | | | | | | | | | | | | | | | | | | | | | | | | | |
Crescent Short Duration High Income Fund | | Level 1 | | | | | | Level 2 | | | | | | Level 3 | | | | | | Total | |
Assets | | | | | | | | | | | | | | | | | | | | | | | | | | | | |
Common Stocks | | $ | - | | | | | | | $ | - | | | | | | | $ | 507 | | | | | | | $ | 507 | |
Bank Loan Obligations | | | - | | | | | | | | 12,585,996 | | | | | | | | - | | | | | | | | 12,585,996 | |
Corporate Obligations | | | - | | | | | | | | 54,451,058 | | | | | | | | - | | | | | | | | 54,451,058 | |
Foreign Corporate Obligations | | | - | | | | | | | | 15,782,236 | | | | | | | | - | | | | | | | | 15,782,236 | |
Short-Term Investments | | | 2,182,064 | | | | | | | | - | | | | | | | | - | | | | | | | | 2,182,064 | |
| | | | | | | | | | | | | | | | | | | | | | | | | | | | |
Total Investments in Securities – Assets | | $ | 2,182,064 | | | | | | | $ | 82,819,290 | | | | | | | $ | 507 | | | | | | | $ | 85,001,861 | |
| | | | | | | | | | | | | | | | | | | | | | | | | | | | |
U.S. GAAP requires all transfers between any levels to be disclosed. The end of period timing recognition has been adopted for the transfers between levels of the Fund’s assets and liabilities. During the year ended January 31, 2018, there were transfers from Level 1 to Level 3, with a fair value of $507, due to the security being priced by a single broker quote.
The following table is a reconciliation of Level 3 assets within the Fund for which significant unobservable inputs were used to determine fair value. Transfers in or out of Level 3 represent the ending value of any security or instrument where a change in the level has occurred from the beginning to the end of the period:
See accompanying notes
16
American Beacon Crescent Short Duration High Income FundSM
Schedule of Investments
January 31, 2018
| | | | | | | | | | | | | | | | | | | | | | | | | | | | | | | | | | |
| Security Type | | Balance as
of
1/31/2017 | | Net
Purchases | | Net
Sales | | Accrued
Discounts
(Premiums) | | | Realized
Gain (Loss) | | | Change in
Unrealized
Appreciation
(Depreciation) | | | Transfer into Level 3 | | | Transfer
out of
Level 3 | | | Balance as
of
1/31/2018 | | | Change in
Unrealized
Appreciation
(Depreciation)
at Period end** | |
| Common Stocks | | $- | | $- | | $- | | $ | - | | | $ | - | | | $ | - | | | $ | 507 | | | $ | - | | | $ | 507 | | | $ | 507 | |
| ** | Change in unrealized appreciation (depreciation) attributable to Level 3 securities held at period end. This balance is included in the change in unrealized appreciation (depreciation) on the Statement of Operations. |
The common stocks classified as Level 3 were fair valued using private valuation reports provided to the Fund’s Sub-Advisor from a pricing vendor.
See accompanying notes
17
American Beacon Crescent Short Duration High Income FundSM
Statement of Assets and Liabilities
January 31, 2018
| | | | |
Assets: | | | | |
Investments in unaffiliated securities, at fair value† | | $ | 82,819,797 | |
Investments in affiliated securities, at fair value‡ | | | 2,182,064 | |
Cash | | | 16,644 | |
Dividends and interest receivable | | | 1,178,117 | |
Receivable for investments sold | | | 4,601,394 | |
Receivable for fund shares sold | | | 478,557 | |
Receivable for expense reimbursement (Note 2) | | | 33,172 | |
Prepaid expenses | | | 27,897 | |
| | | | |
Total assets | | | 91,337,642 | |
| | | | |
Liabilities: | | | | |
Payable for investments purchased | | | 3,070,808 | |
Payable for fund shares redeemed | | | 93,696 | |
Dividends payable | | | 2,321 | |
Unfunded loan commitments | | | 39,946 | |
Management and sub-advisory fees payable (Note 2) | | | 54,556 | |
Service fees payable (Note 2) | | | 1,363 | |
Transfer agent fees payable (Note 2) | | | 1,339 | |
Custody and fund accounting fees payable | | | 43,804 | |
Professional fees payable | | | 62,204 | |
Trustee fees payable (Note 2) | | | 280 | |
Payable for prospectus and shareholder reports | | | 7,743 | |
Other liabilities | | | 3,790 | |
| | | | |
Total liabilities | | | 3,381,850 | |
| | | | |
Net assets | | $ | 87,955,792 | |
| | | | |
Analysis of net assets: | | | | |
Paid-in-capital | | $ | 89,965,244 | |
Undistributed net investment income | | | 30,552 | |
Accumulated net realized (loss) | | | (2,468,967 | ) |
Unrealized appreciation of investments in unaffiliated securitiesA | | | 428,963 | |
| | | | |
Net assets | | $ | 87,955,792 | |
| | | | |
Shares outstanding at no par value (unlimited shares authorized): | | | | |
Institutional Class | | | 8,230,944 | |
| | | | |
Y Class | | | 614,123 | |
| | | | |
Investor Class | | | 102,123 | |
| | | | |
A Class | | | 171,455 | |
| | | | |
C Class | | | 55,924 | |
| | | | |
Net assets: | | | | |
Institutional Class | | $ | 78,914,147 | |
| | | | |
Y Class | | $ | 5,883,759 | |
| | | | |
Investor Class | | $ | 979,646 | |
| | | | |
A Class | | $ | 1,642,414 | |
| | | | |
C Class | | $ | 535,826 | |
| | | | |
Net asset value, offering and redemption price per share: | | | | |
Institutional Class | | $ | 9.59 | |
| | | | |
Y Class | | $ | 9.58 | |
| | | | |
Investor Class | | $ | 9.59 | |
| | | | |
A Class | | $ | 9.58 | |
| | | | |
A Class (offering price) | | $ | 9.83 | |
| | | | |
C Class | | $ | 9.58 | |
| | | | |
| |
† Cost of investments in unaffiliated securities | | $ | 82,390,834 | |
‡ Cost of investments in affiliated securities | | $ | 2,182,064 | |
A The Fund’s investments in affiliated securities did not have unrealized appreciation (depreciation) at year end. | | | | |
See accompanying notes
18
American Beacon Crescent Short Duration High Income FundSM
Statement of Operations
For the year ended January 31, 2018
| | | | |
Investment income: | | | | |
Dividend income from affiliated securities | | $ | 34,409 | |
Interest income | | | 4,572,529 | |
| | | | |
Total investment income | | | 4,606,938 | |
| | | | |
Expenses: | | | | |
Management and sub-advisory fees (Note 2) | | | 602,428 | |
Transfer agent fees: | | | | |
Institutional Class (Note 2) | | | 7,379 | |
Y Class (Note 2) | | | 4,414 | |
Investor Class | | | 1,706 | |
A Class | | | 12 | |
Custody and fund accounting fees | | | 57,941 | |
Professional fees | | | 80,629 | |
Registration fees and expenses | | | 69,195 | |
Service fees (Note 2): | | | | |
Y Class | | | 980 | |
Investor Class | | | 4,858 | |
A Class | | | 2,426 | |
C Class | | | 870 | |
Distribution fees (Note 2): | | | | |
A Class | | | 4,043 | |
C Class | | | 5,799 | |
Prospectus and shareholder report expenses | | | 24,634 | |
Trustee fees (Note 2) | | | 4,559 | |
Other expenses | | | 13,302 | |
| | | | |
Total expenses | | | 885,175 | |
| | | | |
Net fees waived and expenses (reimbursed) (Note 2) | | | (175,701 | ) |
| | | | |
Net expenses | | | 709,474 | |
| | | | |
Net investment income | | | 3,897,464 | |
| | | | |
| |
Realized and unrealized gain (loss) from investments: | | | | |
Net realized gain from: | | | | |
Investments in unaffiliated securitiesA | | | 323,728 | |
Change in net unrealized appreciation of: | | | | |
Investments in unaffiliated securitiesB | | | (801,438 | ) |
| | | | |
Net (loss) from investments | | | (477,710 | ) |
| | | | |
Net increase in net assets resulting from operations | | $ | 3,419,754 | |
| | | | |
|
A The Fund did not recognize net realized gains (losses) from the sale of investments in affiliated securities. | |
B The Fund’s investments in affiliated securities did not have a change in unrealized appreciation (depreciation) at year end. | |
See accompanying notes
19
American Beacon Crescent Short Duration High Income FundSM
Statement of Changes in Net Assets
| | | | | | | | | | | | |
| | | Year Ended
January 31, 2018 | | | | | | Year Ended
January 31, 2017 | |
Increase (decrease) in net assets: | | | | | | | | | | | | |
Operations: | | | | | | | | | | | | |
Net investment income | | $ | 3,897,464 | | | | | | | $ | 2,419,008 | |
Net realized gain (loss) from investments in unaffiliated securities | | | 323,728 | | | | | | | | (1,100,111 | ) |
Change in net unrealized appreciation (depreciation) of investments in unaffiliated securities | | | (801,438 | ) | | | | | | | 4,409,874 | |
| | | | | | | | | | | | |
Net increase in net assets resulting from operations | | | 3,419,754 | | | | | | | | 5,728,771 | |
| | | | | | | | | | | | |
Distributions to shareholders: | |
Net investment income: | | | | | | | | | | | | |
Institutional Class | | | (3,407,440 | ) | | | | | | | (1,882,382 | ) |
Y Class | | | (295,367 | ) | | | | | | | (321,091 | ) |
Investor Class | | | (86,903 | ) | | | | | | | (147,957 | ) |
A Class | | | (72,041 | ) | | | | | | | (50,709 | ) |
C Class | | | (21,430 | ) | | | | | | | (16,867 | ) |
| | | | | | | | | | | | |
Net distributions to shareholders | | | (3,883,181 | ) | | | | | | | (2,419,006 | ) |
| | | | | | | | | | | | |
| | | |
Capital share transactions (Note 9): | | | | | | | | | | | | |
Proceeds from sales of shares | | | 32,726,092 | | | | | | | | 19,803,117 | |
Reinvestment of dividends and distributions | | | 3,843,806 | | | | | | | | 2,333,667 | |
Cost of shares redeemed | | | (10,553,290 | ) | | | | | | | (13,547,704 | ) |
| | | | | | | | | | | | |
Net increase in net assets from capital share transactions | | | 26,016,608 | | | | | | | | 8,589,080 | |
| | | | | | | | | | | | |
Net increase in net assets | | | 25,553,181 | | | | | | | | 11,898,845 | |
| | | | | | | | | | | | |
Net assets: | | | | | | | | | | | | |
Beginning of period | | | 62,402,611 | | | | | | | | 50,503,766 | |
| | | | | | | | | | | | |
End of period* | | $ | 87,955,792 | | | | | | | $ | 62,402,611 | |
| | | | | | | | | | | | |
*Includes undistributed net investment income | | $ | 30,552 | | | | | | | $ | 310 | |
| | | | | | | | | | | | |
See accompanying notes
20
American Beacon Crescent Short Duration High Income FundSM
Notes to Financial Statements
January 31, 2018
1. Organization and Significant Accounting Policies
American Beacon Funds (the “Trust”), is organized as a Massachusetts business trust. The Fund, a series within the Trust, is registered under the Investment Company Act of 1940 (the “Act”), as amended, as a diversified, open-end management investment company. As of January 31, 2018, the Trust consists of thirty-three active series, one of which is presented in this filing: American Beacon Crescent Short Duration High Income Fund (the “Fund”). The remaining thirty-two active series are reported in separate filings.
American Beacon Advisors, Inc. (the “Manager”) is a wholly-owned subsidiary of Resolute Investment Managers, Inc., which is indirectly owned by investment funds affiliated with Kelso & Company, L.P. and Estancia Capital Management, LLC, and was organized in 1986 to provide business management, advisory, administrative, and asset management consulting services to the Trust and other investors.
Class Disclosure
The Fund has multiple classes of shares designed to meet the needs of different groups of investors. The following table sets forth the differences amongst the classes:
| | | | | | |
Class | | Eligible Investors | | Minimum Initial
Investments | |
| Institutional | | Large institutional investors - sold directly or through intermediary channels. | | $ | 250,000 | |
| Y Class | | Large institutional retirement plan investors - sold directly or through intermediary channels. | | $ | 100,000 | |
| Investor | | All investors using intermediary organizations, such as broker-dealers or retirement plan sponsors. | | $ | 2,500 | |
| A Class | | All investors who invest through intermediary organizations, such as broker-dealers or third party administrator. Retail investors who invest directly through a financial intermediary such as a broker, bank, or registered investment advisor which may include a front-end sales charge and a contingent deferred sales charge (“CDSC”). | | $ | 2,500 | |
| C Class | | Retail investors who invest directly through a financial intermediary such as a broker or through employee directed benefit plans with applicable sales charges which may include CDSC. | | $ | 1,000 | |
Each class offered by the Trust has equal rights as to assets and voting privileges. Income and non-class specific expenses are allocated daily to each class on the basis of the relative net assets. Realized and unrealized capital gains and losses of each class are allocated daily based on the relative net assets of each class of the respective Fund. Class specific expenses, where applicable, currently include service, distribution, transfer agent fees, and sub-transfer agent fees that vary amongst the classes as described more fully in Note 2.
Recently Adopted Accounting Pronouncements
In October 2016, the SEC adopted amendments to rules under the Investment Company Act of 1940 (“final rules”) intended to modernize the reporting and disclosure of information by registered investment companies. The final rules amend Regulation S-X and require funds to provide standardized, enhanced derivative disclosure in fund financial statements in a format designed for individual investors. The amendments to Regulation S-X also update the disclosures for other investments and investments in and advances to affiliates and amend the rules regarding the general form and content of fund financial statements. The compliance date for the amendments to Regulation S-X is August 1, 2017, and has been adopted accordingly.
Significant Accounting Policies
The following is a summary of significant accounting policies, consistently followed by the Fund in preparation of the financial statements. The Fund is considered an investment company and accordingly, follows
21
American Beacon Crescent Short Duration High Income FundSM
Notes to Financial Statements
January 31, 2018
the investment company accounting and reporting guidance of the Financial Accounting Standards Board Accounting Standard Codification Topic 946, Financial Services - Investment Companies, a part of Generally Accepted Accounting Principles (“U.S. GAAP”).
Security Transactions and Investment Income
Security transactions are recorded on the trade date of the security purchase or sale. The Fund may purchase securities with delivery or payment to occur at a later date. At the time the Fund enters into a commitment to purchase a security, the transaction is recorded, and the value of the security is reflected in the Net Asset Value (“NAV”). The value of the security may vary with market fluctuations.
Dividend income, net of foreign taxes, is recorded on the ex-dividend date, except certain dividends from foreign securities which are recorded as soon as the information is available to the Fund. Interest income is earned from settlement date, recorded on the accrual basis, and adjusted, if necessary, for accretion of discounts and amortization of premiums. For financial and tax reporting purposes, realized gains and losses are determined on the basis of specific lot identification.
Distributions to Shareholders
Distributions, if any, of net investment income are generally paid monthly and recorded on the ex-dividend date. Distributions, if any, of net realized capital gains are generally paid at least annually and recorded on the ex-dividend date. Dividends to shareholders are determined in accordance with federal income tax regulations, which may differ in amount and character from net investment income and realized gains recognized for purposes of U.S. GAAP.
Allocation of Income, Trust Expenses, Gains, and Losses
Investment income, realized and unrealized gains and losses from investments of the Fund is allocated daily to each class of shares based upon the relative proportion of net assets of each class to the total net assets of the Fund. Expenses directly charged or attributable to any Fund will be paid from the assets of the Fund. Generally, expenses of the Trust will be allocated among and charged to the assets of the Fund on a basis that the Trust’s Board of Trustees (the “Board”) deems fair and equitable, which may be based on the relative net assets of the Fund or nature of the services performed and relative applicability to the Fund.
Use of Estimates
The preparation of financial statements in conformity with U.S. GAAP requires management to make estimates and assumptions that affect the amounts reported in the financial statements and accompanying notes. Actual results may differ from those estimated.
Other
Under the Trust’s organizational documents, its officers and trustees are indemnified against certain liabilities arising out of the performance of their duties to the Trust. In the normal course of business, the Trust enters into contracts that provide indemnification to the other party or parties against potential costs or liabilities. The Trust’s maximum exposure under these arrangements is dependent on claims that may be made in the future and, therefore, cannot be estimated. The Trust has had no prior claims or losses pursuant to any such agreement.
Concentration of Ownership
From time to time, the Fund may have a concentration of one or more accounts constituting a significant percentage of shares outstanding. Investment activities by holders of accounts that represent a significant
22
American Beacon Crescent Short Duration High Income FundSM
Notes to Financial Statements
January 31, 2018
ownership of more than 5% of the Fund’s outstanding shares could have a material impact on the Fund. As of January 31, 2018, based on management’s evaluation of the shareholder account base, two accounts in the Crescent Short Duration High Income Fund have been identified as representing an unaffiliated significant ownership of approximately 43% of the Fund’s outstanding shares.
2. Transactions with Affiliates
Management and Investment Sub-Advisory Agreements
The Fund and the Manager are parties to a Management Agreement that obligates the Manager to provide the Fund with investment advisory and administrative services. As compensation for performing the duties under the Management Agreement, the Manager will receive an annualized management fee based on a percentage of the Fund’s average daily net assets that is calculated and accrued daily according to the following schedule:
| | | | |
First $5 billion | | | 0.35 | % |
Next $5 billion | | | 0.325 | % |
Next $10 billion | | | 0.30 | % |
Over $20 billion | | | 0.275 | % |
The Trust, on behalf of the Fund, and the Manager have entered into an Investment Advisory Agreement with the following Sub-Advisor pursuant to which the Fund has agreed to pay an annualized sub-advisory fee that is calculated and accrued daily based on the Fund’s average daily net assets according to the following schedule:
| | | | |
First $250 million | | | 0.40 | % |
Next $750 million | | | 0.35 | % |
Over $1 billion | | | 0.30 | % |
The Management and Sub-Advisory Fees paid by the Fund during the year ended January 31, 2018 were as follows:
| | | | | | | | | | | | |
| | | Effective Fee Rate | | | | | | Amount of Fees Paid | |
| Management Fees | | | 0.35 | % | | | | | | $ | 281,133 | |
| Sub-Advisor Fees | | | 0.40 | % | | | | | | | 321,295 | |
| | | | | | | | | | | | |
| Total | | | 0.75 | % | | | | | | $ | 602,428 | |
| | | | | | | | | | | | |
Distribution Plans
The Fund, except for the A and C Classes of the Fund, has adopted a “defensive” Distribution Plan (the “Plan”) in accordance with Rule 12b-1 under the Act, pursuant to which no separate fees may be charged to the Fund for distribution purposes. However, the Plan authorizes the management fee received by the Manager and the investment advisors hired by the Manager to be used for distribution purposes. Under this Plan, the Fund does not intend to compensate the Manager or any other party, either directly or indirectly, for the distribution of Fund shares.
Separate Distribution Plans (the “Distribution Plans”) have been adopted pursuant to Rule 12b-1 under the Act for the A and C Classes of the Fund. Under the Distribution Plans, as compensation for distribution assistance, the Manager receives an annual fee of 0.25% of the average daily net assets of the A Class and 1.00% of the average daily net assets of the C Class. The fee will be payable without regard to whether the amount of the fee is more or less than the actual expenses incurred in a particular month by the Manager for distribution assistance.
Service Plans
The Manager and the Trust entered into Service Plans that obligates the Manager to oversee additional shareholder servicing of the Y, Investor, A, and C Classes of the Fund. As compensation for performing the duties
23
American Beacon Crescent Short Duration High Income FundSM
Notes to Financial Statements
January 31, 2018
required under the Service Plans, the Manager receives an annualized fee up to 0.10% of the average daily net assets of the Y Class, up to 0.25% of the average daily net assets of the A and C Classes, and up to 0.375% of the average daily net assets of the Investor Class of the Fund. Effective April 1, 2017, the Fund terminated the service plan for the Y Class.
Sub-Transfer Agent Fees
The Manager has entered into agreements, which include servicing agreements, with financial intermediaries that provide recordkeeping, processing, shareholder communications and other services to customers of the intermediaries that hold positions in the Institutional Class of the Fund and has agreed to compensate the intermediaries for providing these services. Effective April 1, 2017 the Fund agreed to compensate the intermediary for providing services to Y class. Intermediaries transact with the Fund primarily through the use of omnibus accounts on behalf of their customers who hold positions in the Fund. Certain services would have been provided by the Fund’s transfer agent and other service providers if the shareholders’ accounts were maintained directly by the Fund’s transfer agent. Accordingly, the Fund, pursuant to Board approval, has agreed to reimburse the Manager for certain non-distribution shareholder services provided by financial intermediaries for the Institutional and Y Classes. The reimbursement amounts (sub-transfer agent fees) paid to the Manager are subject to a fee limit of up to 0.10% of an intermediary’s average net assets in the Institutional and Y Classes on an annual basis. During the year ended January 31, 2018, the sub-transfer agent fees, as reflected in “Transfer agent fees” on the Statement of Operations, were as follows:
| | | | |
Fund | | Sub-Transfer Agent Fees | |
Crescent Short Duration High Income | | $ | 8,811 | |
As of January 31, 2018, the Fund owed the Manager the following reimbursement of sub-transfer agent fees, as reflected in “Transfer agent fees payable” on the Statement of Assets and Liabilities:
| | | | |
Fund | | Reimbursement
Sub-Transfer Agent Fees | |
Crescent Short Duration High Income | | $ | 603 | |
Investments in Affiliated Funds
The Fund may invest in the American Beacon U.S. Government Money Market Select Fund (the “USG Select Fund”). Cash collateral received by the Fund in connection with securities lending may also be invested in the USG Select Fund. The Fund and the USG Select Fund have the same investment advisor and therefore, are considered to be affiliated. The Manager serves as investment advisor to the USG Select Fund and receives management fees and administrative fees totaling 0.10% of the average daily net assets of the USG Select Fund. During the year ended January 31, 2018, the Manager earned fees on the Fund’s direct investments in the USG Select Fund as shown below:
| | | | |
Fund | | Direct Investments in
USG Select Fund | |
Crescent Short Duration High Income | | $ | 4,167 | |
Interfund Credit Facility
Pursuant to an exemptive order issued by the Securities and Exchange Commission (“SEC”), the Fund, along with other registered investment companies having management contracts with the Manager, may participate in a credit facility whereby each Fund, under certain conditions, is permitted to lend money directly to and borrow directly from other participating Funds for temporary purposes. The interfund credit facility is advantageous to the Funds because it provides added liquidity, and eliminates the need to maintain higher cash balances to meet redemptions. This situation could arise when shareholder redemptions exceed anticipated volumes and certain
24
American Beacon Crescent Short Duration High Income FundSM
Notes to Financial Statements
January 31, 2018
funds have insufficient cash on hand to satisfy such redemptions or when sales of securities do not settle as expected, resulting in a cash shortfall for a fund. When a Fund liquidates portfolio securities to meet redemption requests, they often do not receive payment in settlement for up to two days (or longer for certain foreign transactions). Redemption requests normally are satisfied on the next business day. The credit facility provides a source of immediate, short-term liquidity pending settlement of the sale of portfolio securities. The credit facility is administered by a credit facility team consisting of professionals from the Manager’s asset management, compliance, and accounting areas who report the activities of the credit facility to the Board. During the year ended January 31, 2018, the Fund did not utilize the credit facility.
Expense Reimbursement Plan
The Manager contractually agreed to reduce fees and/or reimburse expenses for the classes of the Fund to the extent that total operating expenses exceed the Fund’s expense cap. During the year ended January 31, 2018, the Manager waived and/or reimbursed expenses as follows:
| | | | | | | | | | | | | | | | | | |
| | | | | Expense Cap | | | | | | | | | Expiration of
Reimbursed
Expenses | |
Fund | | Class | | 2/1/2017 -
1/31/2018 | | | Reimbursed
Expenses | | | (Recouped)
Expenses | | |
Crescent Short Duration High Income | | Institutional | | | 0.85 | % | | $ | 155,995 | | | $ | - | | | | 2021 | |
Crescent Short Duration High Income | | Y | | | 0.95 | % | | | 12,077 | | | | - | | | | 2021 | |
Crescent Short Duration High Income | | Investor | | | 1.23 | % | | | 3,090 | | | | - | | | | 2021 | |
Crescent Short Duration High Income | | A | | | 1.25 | % | | | 3,350 | | | | - | | | | 2021 | |
Crescent Short Duration High Income | | C | | | 2.00 | % | | | 1,189 | | | | - | | | | 2021 | |
Of these amounts, $33,172 is disclosed as a receivable from the Manager to the Crescent Short Duration High Income Fund on the Statement of Assets and Liabilities at January 31, 2018. The Fund has adopted an Expense Reimbursement Plan whereby the Manager may seek repayment of such fee reductions and expense reimbursements. Under the policy, the Manager can be reimbursed by the Fund for any contractual or voluntary fee reductions or expense reimbursements if reimbursement to the Manager (a) occurs within three years after the Manager’s own waiver or reimbursement and (b) does not cause the Fund’s annual operating expenses to exceed the lesser of the contractual percentage limit in effect at the time of the waiver/reimbursement or time of recoupment. The reimbursed expenses listed above will expire in 2021. The Fund did not record a liability for potential reimbursements due to the current assessment that reimbursements are unlikely. The carryover of excess expenses potentially reimbursable to the Manager are as follows:
| | | | | | | | | | | | | | | | |
Fund | | Recouped
Expenses | | | Excess Expense
Carryover | | | Expired Expense
Carryover | | | Expiration of
Reimbursed
Expenses | |
Crescent Short Duration High Income | | $ | - | | | $ | 180,253 | | | $ | - | | | | 2019 | |
Crescent Short Duration High Income | | | - | | | | 201,928 | | | | - | | | | 2020 | |
Sales Commissions
The Fund’s distributor, Foreside Fund Services, LLC (“Foreside”), may receive a portion of A Class sales charges from broker dealers and it may be used to offset distribution related expenses. During the year ended January 31, 2018, Foreside collected $1,403 for the Fund from the sale of Class A Shares.
A CDSC of 0.50% will be deducted with respect to Class A Shares on certain purchases of $1,000,000 or more that are redeemed in whole or part within 18 months of purchase, unless waived as discussed in the Fund’s Prospectus. Any applicable CDSC will be 0.50% of the lesser of the original purchase price or the value of the redemption of the Class A Shares redeemed. During the year ended January 31, 2018, there were no CDSC fees collected for Class A Shares of the Fund.
25
American Beacon Crescent Short Duration High Income FundSM
Notes to Financial Statements
January 31, 2018
A CDSC of 1.00% will be deducted with respect to Class C Shares redeemed within 12 months of purchase, unless waived as discussed in the Fund’s Prospectus. Any applicable CDSC will be 1.00% of the lesser of the original purchase price or the value of the redemption of the Class C Shares redeemed. During the year ended January 31, 2018, CDSC fees of $329 were collected for Class C Shares of the Fund.
Trustee Fees and Expenses
As compensation for their service to the Trust, the American Beacon Select Funds and the American Beacon Institutional Funds Trust, each Trustee receives an annual retainer of $120,000, plus $10,000 for each Board meeting attended in person or via teleconference, $2,500 for attendance by Committee members at meetings of the Audit Committee and the Investment Committee, and $1,500 for attendance by Committee members at meetings of the Nominating and Governance Committee, plus reimbursement of reasonable expenses incurred in attending Board meetings, Committee meetings, and relevant educational seminars. The Trustees also may be compensated for attendance at special Board and/or Committee meetings from time to time. The Board Chairman receives an additional annual retainer of $50,000 as well as a $2,500 fee each quarter for his attendance at the committee meetings. Effective January 1, 2018, the Board Vice Chair receives an additional annual retainer of $10,000. The Chairpersons of the Audit Committee and the Investment Committee each receive an additional annual retainer of $25,000 and the Chairman of the Nominating and Governance Committee receives an additional annual retainer of $10,000. These expenses are allocated on a prorated basis to each Fund of the Trusts according to its respective net assets.
3. Security Valuation and Fair Value Measurements
Investments are valued at the close of the New York Stock Exchange (the “Exchange”), normally at 4:00 p.m. Eastern Time, each day that the Exchange is open for business. Equity securities, including exchange-traded funds (“ETFs”) for which market quotations are available are valued at the last sale price or official closing price (closing bid price or last evaluated quote if no sale has occurred) on the primary market or exchange on which they trade.
Debt securities normally are valued on the basis of prices provided by an independent pricing service and may take into account appropriate factors such as institution-size trading in similar groups of securities, yield, quality, coupon rate, maturity, type of issue, trading characteristics, and other market data. Prices of debt securities may be determined using quotes obtained from brokers.
Investments in open-end mutual funds are valued at the closing NAV per share of the mutual fund on the day of valuation.
Securities for which the market prices are not readily available or are not reflective of the fair value of the security, as determined by the Manager, will be priced at fair value following procedures approved by the Board.
Other investments, including restricted securities and those financial instruments for which the above valuation procedures are inappropriate or are deemed not to reflect fair value, are stated at fair value, as determined in good faith by the Manager’s Valuation Committee, pursuant to procedures established by the Board.
Valuation Inputs
Various inputs may be used to determine the fair value of the Fund’s investments. These inputs are summarized in three broad levels for financial statement purposes. The inputs or methodologies used to value securities are not necessarily an indication of the risk associated with investing in those securities.
| | | | |
| Level 1 | | - | | Quoted prices in active markets for identical securities. |
| | |
| Level 2 | | - | | Prices determined using other significant observable inputs. These may include quoted prices for similar securities, interest rates, prepayment speeds, credit risk, and others. |
26
American Beacon Crescent Short Duration High Income FundSM
Notes to Financial Statements
January 31, 2018
| | | | |
| | |
| Level 3 | | - | | Prices determined using other significant unobservable inputs. Unobservable inputs reflect the Fund’s own assumptions about the factors market participants would use in pricing an investment. |
Level 1 and Level 2 trading assets and trading liabilities, at fair value
Fixed-income securities including corporate, convertible and municipal bonds and notes, U.S. government agencies, U.S. Treasury obligations, sovereign issues, bank loans, convertible preferred securities, and non-U.S. bonds are normally valued by pricing service providers that use broker dealer quotations, reported trades or valuation estimates from their internal pricing models. The service providers’ internal models use inputs that are observable such as issuer details, interest rates, yield curves, prepayment speeds, credit risks/spreads, default rates, and quoted prices for similar assets. Securities that use similar valuation techniques and inputs as described above are categorized as Level 2 of the fair value hierarchy. Fixed-income securities purchased on a delayed-delivery basis are marked-to-market daily until settlement at the forward settlement date and are categorized as Level 2 of the fair value hierarchy.
Common stocks that are traded on a national securities exchange, are stated at the last reported sale or settlement price on the day of valuation. To the extent these securities are actively traded and valuation adjustments are not applied, they are categorized as Level 1 of the fair value hierarchy. Securities using valuation adjustments are categorized as Level 2 of the fair value hierarchy. Preferred securities and other equities traded on inactive markets or valued by reference to similar instruments are generally categorized as Level 2 of the fair value hierarchy.
Investments in registered open-end investment management companies will be valued based upon the NAVs of such investments and are categorized as Level 1 of the fair value hierarchy.
Level 3 trading assets and trading liabilities, at fair value
The valuation techniques and significant inputs used in determining the fair values of financial instruments classified as Level 3 of the fair value hierarchy are as follows:
Securities and other assets for which market quotes are not readily available are valued at fair value as determined in good faith by the Board or persons acting at their direction and may be categorized as Level 3 of the fair value hierarchy.
Market quotes are considered not readily available in circumstances where there is an absence of current or reliable market-based data (e.g., trade information or broker quotes), including where events occur after the close of the relevant market, but prior to the Exchange close, that materially affect the values of the Fund’s securities or assets. In addition, market quotes are considered not readily available when, due to extraordinary circumstances, the exchanges or markets on which the securities trade, do not open for trading for the entire day and no other market prices are available. The Board has delegated to the Manager the responsibility for monitoring significant events that may materially affect the fair values of a Fund’s securities or assets and for determining whether the value of the applicable securities or assets should be re-evaluated in light of such significant events.
The Board has adopted methods for valuing securities and other assets in circumstances where market quotes are not readily available, and has delegated the responsibility for applying the valuation methods to the Manager. For instances in which daily market quotes are not readily available, investments may be valued pursuant to guidelines established by the Board. In the event that the security or asset cannot be valued, pursuant to one of the valuation methods established by the Board, the fair value of the security or asset will be determined in good faith by the Valuation Committee, generally based upon recommendations provided by the Manager.
When a Fund uses fair valuation methods applied by the Manager that use significant unobservable inputs to determine its NAV, the securities priced using this methodology are categorized as Level 3 of the fair value
27
American Beacon Crescent Short Duration High Income FundSM
Notes to Financial Statements
January 31, 2018
hierarchy. These methods may require subjective determinations about the value of a security. While the Trust’s policy is intended to result in a calculation of the Fund’s NAV that fairly reflects security values as of the time of pricing, the Trust cannot guarantee that values determined by the Board or persons acting at their direction would accurately reflect the price that a Fund could obtain for a security if it were to dispose of that security as of the time of pricing (for instance, in a forced or distressed sale). The prices used by a Fund may differ from the value that would be realized if the securities were sold.
4. Securities and Other Investments
Bank Loans and Senior Loans
Loans are typically administered by a bank, insurance company, finance company or other financial institution (the “agent”) for a lending syndicate of financial institutions. In a typical loan, the agent administers the terms of the loan agreement and is responsible for the collection of principal and interest and fee payments from the borrower and the apportionment of these payments to all lenders that are parties to the loan agreement. In addition, an institution (which may be the agent) may hold collateral on behalf of the lenders. Typically, under loan agreements, the agent is given broad authority in monitoring the borrower’s performance and is obligated to use the same care it would use in the management of its own property. In asserting rights against a borrower, the Fund normally will be dependent on the willingness of the lead bank to assert these rights, or upon a vote of all the lenders to authorize the action. If an agent becomes insolvent, or has a receiver, conservator, or similar official appointed for it by the appropriate regulatory authority, or becomes a debtor in a bankruptcy proceeding, the agent’s appointment may be terminated and a successor agent would be appointed. If an appropriate regulator or court determines that assets held by the agent for the benefit of purchasers of loans are subject to the claims of the agent’s general or secured creditors, the Fund might incur certain costs and delays in realizing payment on a loan or suffer a loss of principal and/or interest. The Fund may be subject to similar risks when it buys a participation interest or an assignment from an intermediary.
Bank loans can be fixed and floating rate loans arranged through private negotiations between a company or a non-U.S. government and one or more financial institutions (lenders). The Fund may invest in senior loans, which are floating rate loans that hold a senior position in the capital structure of U.S. and foreign corporations, partnerships or other business entities that, under normal circumstances, allow them to have priority of claim ahead of other obligations of a borrower in the event of liquidation. Bank loans and senior loans may be collateralized or uncollateralized. They pay interest at rates that float above, or are adjusted periodically based on, a benchmark that reflects current interest rates. The Fund may invest in such loans in the form of participations in loans and assignments of all or a portion of loans from third parties. In connection with purchasing participations in such instruments, the Fund generally will have no right to enforce compliance by the borrower with the terms of the loan agreement relating to the loan, nor any rights of set-off against the borrower, and the Fund may not benefit directly from any collateral supporting the loan in which it has purchased the participation. When the Fund purchases assignments from lenders, the Fund will acquire direct rights against the borrower on the loan.
The Fund earns a commitment fee, typically set as a percentage of the commitment amount. Such fee income, which is included in “Interest income” on the Statement of Operations, is recognized ratably over the commitment period. Unfunded floating rate loan interests are marked-to-market daily, and any unrealized appreciation (depreciation) is included on the Statement of Assets and Liabilities and Statement of Operations.
Common Stock
Common stock generally takes the form of shares in a corporation which represent an ownership interest. It ranks below preferred stock and debt securities in claims for dividends and for assets of the company in a liquidation or bankruptcy. The value of a company’s common stock may fall as a result of factors directly relating to that company, such as decisions made by its management or decreased demand for the company’s products or
28
American Beacon Crescent Short Duration High Income FundSM
Notes to Financial Statements
January 31, 2018
services. A stock’s value may also decline because of factors affecting not just the company, but also companies in the same industry or sector. The price of a company’s stock may also be affected by changes in financial markets that are relatively unrelated to the company, such as changes in interest rates, currency exchange rates or industry regulation. Companies that elect to pay dividends on their common stock generally only do so after they invest in their own business and make required payments to bondholders and on other debt and preferred stock. Therefore, the value of a company’s common stock will usually be more volatile than its bonds, other debt and preferred stock. Common stock may be exchange-traded or over-the-counter (“OTC”). OTC stock may be less liquid than exchange-traded stock.
Corporate Debt and Other Fixed-Income Securities
Typically, the values of fixed-income securities change inversely with prevailing interest rates. Therefore, a fundamental risk of fixed-income securities is interest rate risk, which is the risk that their value will generally decline as prevailing interest rates rise, which may cause a Fund’s net asset value to likewise decrease, and vice versa. How specific fixed-income securities may react to changes in interest rates will depend on specific characteristics of each security. Fixed-income securities are also subject to credit risk, which is the risk that the credit strength of an issuer of a fixed-income security will weaken and/or that the issuer will be unable to make timely principal and interest payments and that the security may go into default.
Delayed Funding Loans and Revolving Credit Facilities
A Fund may enter into, or acquire participations in, delayed funding loans and revolving credit facilities. Delayed funding loans and revolving credit facilities are borrowing arrangements in which the lender agrees to make loans up to a maximum amount upon demand by the borrower during a specific term. A revolving credit facility differs from a delayed funding loan in that as the borrower repays the loan, an amount equal to the repayment may be borrowed again during the term of the revolving credit facility. Delayed funding loans and revolving credit facilities usually provide for floating or variable rates of interest. These commitments may have the effect of requiring a Fund to increase its investment in a company at a time when it might not otherwise decide to do so (including at a time when the company’s financial condition makes it unlikely that such amounts will be repaid). To the extent that a Fund is committed to advance additional funds, it will at all times segregate or “earmark” assets, determined to be liquid in accordance with procedures established by the Trust’s Board, in an amount sufficient to meet such commitments.
A Fund may invest in delayed funding loans and revolving credit facilities with credit quality comparable to that of issuers of its securities investments. Delayed funding loans and revolving credit facilities may be subject to restrictions on transfer, and only limited opportunities may exist to resell such instruments. As a result, a Fund may be unable to sell such investments at an opportune time or may have to resell them at less than fair market value.
Floating Rate Loan Interest
The Fund may invest in floating rate loan interests. The floating rate loan interests held by the Fund are typically issued to companies (the “borrower”) by banks, other financial institutions, and privately and publicly offered corporations (the “lender”). Floating rate loan interests are generally non-investment grade, often involve borrowers whose financial condition is troubled or uncertain and companies that are highly leveraged. The Fund may invest in obligations of borrowers who are in bankruptcy proceedings. Floating rate loan interests may include fully funded term loans or revolving lines of credit. Floating rate loan interests are typically senior in the corporate capital structure of the borrower. Floating rate loan interests generally pay interest at rates that are periodically determined by reference to a base lending rate plus a premium. The base lending rates are generally the lending rate offered by one or more European banks, such as the London Interbank Offered Rate (“LIBOR”), the prime rate offered by one or more U.S. banks or the certificate of deposit rate. Floating rate loan interests may involve foreign borrowers, and investments may be denominated in foreign currencies. The Fund considers these investments to be investments in debt securities for purposes of its investment policies.
29
American Beacon Crescent Short Duration High Income FundSM
Notes to Financial Statements
January 31, 2018
When the Fund purchases a floating rate loan interest it may receive a facility fee and when it sells a floating rate loan interest, it may pay a facility fee. On an ongoing basis, the Fund may receive a commitment fee based on the undrawn portion of the underlying line of credit amount of a floating rate loan interest. Facility and commitment fees are typically amortized to income over the term of the loan or term of the commitment, respectively. Consent and amendment fees are recorded to income as earned. Prepayment penalty fees, which may be received by the Fund upon the prepayment of a floating rate loan interest by a borrower, are recorded as realized gains. The Fund may invest in multiple series or tranches of a loan. A different series or tranche may have varying terms and carry different associated risks.
Floating rate loan interests are usually freely callable at the borrower’s option. The Fund may invest in such loans in the form of participations in loans (“Participations”) or assignments (“Assignments”) of all or a portion of loans from third parties. Participations typically will result in the Fund having a contractual relationship only with the lender, not with the borrower. The Fund will have the right to receive payments of principal, interest and any fees to which it is entitled only from the lender selling the Participation and only upon receipt by the lender of the payments from the borrower. In connection with purchasing Participations, the Fund generally will have no right to enforce compliance by the borrower with the terms of the loan agreement, nor any rights of offset against the borrower, and the Fund may not benefit directly from any collateral supporting the loan in which it has purchased the Participation. As a result, the Fund will assume the credit risk of both the borrower and the lender that is selling the Participation. The Fund’s investment in Participations involves the risk of insolvency of the financial intermediaries who are parties to the transactions. In the event of the insolvency of the lender selling the Participation, the Fund may be treated as a general creditor of the lender and may not benefit from any offset between the lender and the borrower. Assignments typically result in the Fund having a direct contractual relationship with the borrower, and the Fund may enforce compliance by the borrower with the terms of the loan agreement.
In connection with floating rate loan interests, the Fund may also enter into unfunded floating rate loan interests (“commitments”). In connection with these commitments, the Fund earns a commitment fee, typically set as a percentage of the commitment amount. Such fee income, which is included in “Interest income” on the Statement of Operations, is recognized ratably over the commitment period. Unfunded floating rate loan interests are marked-to-market daily, and any unrealized appreciation (depreciation) is included on the Statement of Assets and Liabilities and Statement of Operations.
Foreign Debt Securities
The Fund may invest in foreign fixed and floating rate income securities (including emerging market securities) all or a portion of which may be non-U.S. dollar denominated and which include: (a) debt obligations issued or guaranteed by foreign national, provincial, state, municipal or other governments with taxing authority or by their agencies or instrumentalities, including Brady Bonds; (b) debt obligations of supranational entities; (c) debt obligations of the U.S. Government issued in non-dollar securities; (d) debt obligations and other fixed income securities of foreign corporate issuers (both dollar and non-dollar denominated); and (e) U.S. corporate issuers (both Eurodollar and non-dollar denominated). There is no minimum rating criteria for the Fund’s investments in such securities. Investing in the securities of foreign issuers involves special considerations that are not typically associated with investing in the securities of U.S. issuers. In addition, emerging markets are markets that have risks that are different and higher than those in more developed markets.
High-Yield Securities
Non-investment-grade securities are rated below the four highest credit grades by at least one of the public rating agencies (or are unrated if not publicly rated). Participation in high-yielding securities transactions generally involves greater returns in the form of higher average yields. However, participation in such transactions involves greater risks, including sensitivity to economic changes, solvency, and relative liquidity in the secondary trading market. Lower ratings may reflect a greater possibility that the financial condition of the issuer, or adverse
30
American Beacon Crescent Short Duration High Income FundSM
Notes to Financial Statements
January 31, 2018
changes in general economic conditions, or both, may impair the ability of the issuer to make payments of interest and principal. The prices and yields of lower-rated securities generally fluctuate more than higher-quality securities, and such prices may decline significantly in periods of general economic difficulty or rising interest.
Illiquid and Restricted Securities
The Fund may invest in securities that are subject to legal or contractual restrictions on resale. These securities may be sold privately, but are required to be registered or exempted from such registration before being sold to the public. Private placement securities are generally considered to be restricted except for those securities traded between qualified institutional investors under the provisions of Rule 144A of the Securities Act of 1933 (the “Securities Act”). Illiquid securities have included securities that have not been registered under the Securities Act, securities that are otherwise not readily marketable, and repurchase agreements having a remaining maturity of longer than seven calendar days. Disposal of both illiquid and restricted securities may involve time-consuming negotiations and expenses, and prompt sale at an acceptable price may be difficult to achieve. Restricted securities outstanding during the year ended January 31, 2018 are disclosed in the Fund’s Notes to the Schedule of Investments.
Other Investment Company Securities and Other Exchange-Traded Products
The Fund may invest in shares of other investment companies, including open-end funds, closed-end funds, business development companies, ETFs, unit investment trusts, and other investment companies of the Trust. The Fund may invest in investment company securities advised by the Manager or a sub-advisor. Investments in the securities of other investment companies may involve duplication of advisory fees and certain other expenses. By investing in another investment company, the Fund becomes a shareholder of that investment company. As a result, the Fund’s shareholders indirectly will bear the Fund’s proportionate share of the fees and expenses paid by shareholders of the other investment company, in addition to the fees and expenses the Fund’s shareholders directly bear in connection with the Fund’s own operations. These other fees and expenses are reflected as Acquired Fund Fees and Expenses and are included in the Fees and Expenses Table for the Funds in its Prospectus, if applicable. Investments in other investment companies may involve the payment of substantial premiums above the value of such issuer’s portfolio securities.
Payment-In-Kind Securities
The Fund may invest in payment-in-kind securities (“PIKs”). PIKs give the issuer the option at each interest payment date of making interest payments in either cash or additional debt securities. Those additional debt securities usually have the same terms, including maturity dates and interest rates, and associated risks as the original bonds. The daily market quotations of the original bonds may include the accrued interest (referred to as a dirty price) and require a pro-rata adjustment from the “Unrealized appreciation (depreciation) of investments” to “Dividend and interest receivable” in the Statement of Assets and Liabilities.
5. Principal Risks
Investing in the Fund may involve certain risks including, but not limited to, those described below.
Credit Risk
The Fund is subject to the risk that the issuer or guarantor of a debt security, or the counterparty to a derivatives contract or a loan, will fail to make timely payment of interest or principal or otherwise honor its obligations or default completely.
31
American Beacon Crescent Short Duration High Income FundSM
Notes to Financial Statements
January 31, 2018
Floating Rate Securities Risk
The interest rates payable on floating rate securities are not fixed and may fluctuate based upon changes in market rates. The interest rate on a floating rate security is a variable rate which is tied to another interest rate, such as a money-market index or Treasury bill rate. Floating rate securities are subject to interest rate risk and credit risk. As short-term interest rates decline, interest payable on floating rate securities typically decreases. Alternatively, during periods of rising interest rates, interest payable on floating rate securities typically increases. Changes in interest rates on floating rate securities may lag behind changes in market rates or may have limits on the maximum increases in interest rates. The value of floating rate securities may decline if their interest rates do not rise as much, or as quickly, as interest rates in general. Conversely, floating rate securities will not generally increase in value if interest rates decline.
High-Yield Securities Risk
Investing in high-yield, below investment-grade securities (commonly referred to as “junk bonds”) generally involves significantly greater risks of loss of your money than an investment in investment grade securities. High-yield debt securities may fluctuate more widely in price and yield and may fall in price when the economy is weak or expected to become weak. High-yield securities are considered to be speculative with respect to an issuer’s ability to pay interest and principal and carry a greater risk that the issuers of lower-rated securities will default on the timely payment of principal and interest. Below investment grade securities may experience greater price volatility and less liquidity than investment grade securities.
Illiquid and Restricted Securities Risk
Securities not registered in the U.S. under the Securities Act of 1933, as amended (the “Securities Act”), including Rule 144A securities, are restricted as to their resale. Such securities may not be listed on an exchange and may have no active trading market. They may be more difficult to purchase or sell at an advantageous time or price because such securities may not be readily marketable in broad public markets. The Fund may not be able to sell a restricted security when the sub-advisor considers it desirable to do so and/or may have to sell the security at a lower price than the Fund believes is its fair market value. In addition, transaction costs may be higher for restricted securities and the Fund may receive only limited information regarding the issuer of a restricted security. The Fund may have to bear the expense of registering restricted securities for resale and the risk of substantial delays in effecting the registration.
Interest Rate Risk
The Fund is subject to the risk that the market value of fixed-income securities or derivatives it holds, particularly mortgage backed and other asset backed securities, will decline due to rising interest rates. Generally, the value of investments with interest rate risk, such as fixed-income securities, will move in the opposite direction to movements in interest rates. The Federal Reserve raised the federal funds rate in December 2016, March 2017, June 2017, and December 2017 and has signaled additional increases in 2018. Interest rates may rise, perhaps significantly and/or rapidly, potentially resulting in substantial losses to the Fund. The prices of fixed-income securities or derivatives are also affected by their duration. Fixed-income securities or derivatives with longer duration generally have greater sensitivity to changes in interest rates. An increase in interest rates can impact markets broadly as well.
Liquidity Risk
The Fund is susceptible to the risk that certain investments held by the Fund may have limited marketability or be subject to restrictions on sale, and may be difficult to sell at favorable times or prices. The Fund could lose money if it is unable to dispose of an investment at a time that is most beneficial to the Fund. For example, the Fund may be forced to sell certain investments at unfavorable prices to meet redemption requests or other cash needs.
32
American Beacon Crescent Short Duration High Income FundSM
Notes to Financial Statements
January 31, 2018
Loan Interests Risk
Unlike publicly traded common stocks which trade on national exchanges, there is no central place or exchange for loans, including bank loans and senior loans, to trade. Loans trade in an over-the-counter market, and confirmation and settlement, which are effected through standardized procedures and documentation, may take significantly longer than seven days to complete. Extended trade settlement periods may, in unusual market conditions with a high volume of shareholder redemptions, present risk to shareholders regarding a Fund’s ability to pay redemption proceeds within the allowable time periods stated in its prospectus. The secondary market for floating rate loans also may be subject to irregular trading activity and wide bid/ask spreads. The lack of an active trading market for certain loans may impair the ability of a Fund to sell its loan interests at a time when it may otherwise be desirable to do so or may require a Fund to sell them at prices that are less than what a Fund regards as their fair market value and may make it difficult to value such loans. Interest in loans made to finance highly leveraged companies or transactions, such as corporate acquisitions, may be especially vulnerable to adverse changes in economic or market conditions. When a Fund’s loan interest is a participation, the Fund is subject to the risk that the party selling the participation interest will not remit a Fund’s pro rata share of loan payments to the Fund, and the Fund may have less control over the exercise of remedies than the party selling the participation interest.
Market Risk
Since the financial crisis that started in 2008, the U.S. and many foreign economies continue to experience its after-effects, which have resulted, and may continue to result, in fixed-income instruments experiencing unusual liquidity issues, increased price volatility and, in some cases, credit downgrades and increased likelihood of default. These events have reduced the willingness and ability of some lenders to extend credit, and have made it more difficult for some borrowers to obtain financing on attractive terms, if at all. In addition, global economies and financial markets are becoming increasingly interconnected, which increases the possibilities that conditions in one country or region might adversely impact issuers in a different country or region. The severity or duration of adverse economic conditions may also be affected by policy changes made by governments or quasi-governmental organizations.
In addition, political events within the U.S. and abroad may affect investor and consumer confidence and may adversely impact financial markets and the broader economy, perhaps suddenly and to a significant degree. High public debt in the U.S. and other countries creates ongoing systemic and market risks and policymaking uncertainty. Because the impact on the markets has been widespread, it may be difficult to identify both risks and opportunities using past models of the interplay of market forces, or to predict the duration of these market conditions. Interest rates have been unusually low in recent years in the U.S. and abroad. Because there is little precedent for this situation, it is difficult to predict the impact on various markets of a significant rate increase, whether brought about by U.S. policy makers or by dislocations in world markets. In addition, there is a risk that the prices of goods and services in the U.S. and many foreign economies may decline over time, known as deflation (the opposite of inflation). Deflation may have an adverse effect on stock prices and creditworthiness and may make defaults on debt more likely.
Other Investment Companies Risk
The Fund may invest in shares of other registered investment companies, including money market funds. To the extent that the Fund invests in shares of other registered investment companies, the Fund will indirectly bear the fees and expenses charged by the underlying funds in addition to the Fund’s direct fees and expenses and will be subject to the risks associated with investments in those funds.
33
American Beacon Crescent Short Duration High Income FundSM
Notes to Financial Statements
January 31, 2018
Prepayment and Extension Risk
Prepayment risk is the risk that the principal amount of a bond may be repaid prior to the bond’s maturity date. Due to a decline in interest rates or excess cash flow, a debt security may be called or otherwise prepaid before maturity. If this occurs, no additional interest will be paid on the investment and the Fund may have to invest at a lower rate, may not benefit from an increase in value that may result from declining interest rates, and may lose any premium it paid to acquire the security. Variable and floating rate securities may be less sensitive to prepayment risk. Extension risk is the risk that a decrease in prepayments may, as a result of higher interest rates or other factors, result in the extension of a security’s effective maturity, heighten interest rate risk and increase the potential for a decline in price.
Unrated Securities Risk
Because the Fund may purchase securities that are not rated by any rating organization, the sub-advisor, after assessing their credit quality, may internally assign ratings to certain of those securities in categories similar to those of rating organizations. Some unrated securities may not have an active trading market or may be difficult to value, which means a Fund might have difficulty selling them promptly at an acceptable price. Unrated securities may be subject to greater liquidity risk and price volatility.
6. Federal Income and Excise Taxes
It is the policy of the Fund to qualify as a regulated investment company (“RIC”), by complying with all applicable provisions of Subchapter M of the Internal Revenue Code, as amended, and to make distributions of taxable income sufficient to relieve it from substantially all federal income and excise taxes. For federal income tax purposes, the Fund is treated as a single entity for the purpose of determining such qualification.
The Fund does not have any unrecorded tax liabilities in the accompanying financial statements. Each of the tax years in the four year period ended January 31, 2018 remain subject to examination by the Internal Revenue Service. If applicable, the Fund recognizes interest accrued related to unrecognized tax benefits in interest expense and penalties in “Other expenses” on the Statement of Operations.
The Fund may be subject to taxes imposed by countries in which it invests. Such taxes are generally based on returns of income earned or gains realized or repatriated. Taxes are accrued and applied to net investment income, net realized capital gains and net unrealized appreciation (depreciation), as applicable, as the income is earned or capital gains are recorded.
Dividends are categorized in accordance with income tax regulations which may treat certain transactions differently than U.S. GAAP. Accordingly, the character of distributions and composition of net assets for tax purposes may differ from those reflected in the accompanying financial statements.
The tax character of distributions paid were as follows:
| | | | | | | | | | | | |
| | | Year Ended
January 31, 2018 | | | | | | Year Ended
January 31, 2017 | |
Distributions paid from: | | | | | | | | | | | | |
Ordinary income* | | | | | | | | | | | | |
Institutional Class | | $ | 3,407,440 | | | | | | | $ | 1,882,382 | |
Y Class | | | 295,367 | | | | | | | | 321,091 | |
Investors Class | | | 86,903 | | | | | | | | 147,957 | |
A Class | | | 72,041 | | | | | | | | 50,709 | |
C Class | | | 21,430 | | | | | | | | 16,867 | |
| | | | | | | | | | | | |
Total distributions paid | | $ | 3,883,181 | | | | | | | $ | 2,419,006 | |
| | | | | | | | | | | | |
* For tax purposes, short-term capital gains are considered ordinary income distributions.
34
American Beacon Crescent Short Duration High Income FundSM
Notes to Financial Statements
January 31, 2018
As of January 31, 2018 the components of distributable earnings (deficits) on a tax basis were as follows:
| | | | | | | | | | | | | | | | | | | | | | | | | | | | |
Fund | | Tax Cost | | | | | | Unrealized
Appreciation | | | | | | Unrealized
(Depreciation) | | | | | | Net Unrealized
Appreciation
(Depreciation) | |
| Crescent Short Duration High Income | | $ | 84,578,961 | | | | | | | $ | 1,222,972 | | | | | | | $ | (800,072 | ) | | | | | | $ | 422,900 | |
| | | | | | | | | | | | | | | | | | | | | | | | | | | | | | | | | | | | | | | | | | | | |
Fund | | Net Unrealized
Appreciation
(Depreciation) | | | | | | Undistributed
Ordinary Income | | | | | | Undistributed
Long-Term
Capital Gains | | | | | | Accumulated
Capital and
Other (Losses) | | | | | | Other Temporary
Differences | | | | | | Distributable
Earnings | |
| Crescent Short Duration High Income | | $ | 422,900 | | | | | | | $ | 32,873 | | | | | | | $ | - | | | | | | | $ | (2,462,904 | ) | | | | | | $ | (2,321 | ) | | | | | | $ | (2,009,452 | ) |
Financial reporting records are adjusted for permanent book/tax differences to reflect tax character. Financial records are not adjusted for temporary differences. The temporary differences between financial reporting and tax-basis reporting of unrealized appreciation (depreciation) are attributable primarily to the tax deferral of losses from wash sales and dividends payable.
Due to inherent differences in the recognition of income, expenses, and realized gains (losses) under U.S. GAAP and federal income tax regulations, permanent differences between book and tax reporting have been identified and appropriately reclassified on the Statement of Assets and Liabilities.
Accordingly, the following amounts represent current year permanent differences derived from paydown reclasses as of January 31, 2018:
| | | | | | | | | | | | | | | | | | | | | | | | | | | | |
Fund | | Paid-In-Capital | | | | | | Undistributed
(Overdistribution of)
Net Investment
Income | | | | | | Accumulated
Net Realized
Gain (Loss) | | | | | | Net Unrealized
Appreciation
(Depreciation) | |
| Crescent Short Duration High Income | | $ | - | | | | | | | $ | 15,959 | | | | | | | $ | (15,959 | ) | | | | | | $ | - | |
Under the Regulated Investment Company Modernization Act of 2010 (“RIC MOD”), net capital losses recognized by the Fund in taxable years beginning after December 22, 2010 are carried forward indefinitely and retain their character as short-term and/or long-term losses.
During the year January 31, 2018, the Fund had the following post RIC MOD capital loss carryforwards:
| | | | | | | | | | | | |
Fund | | Short-Term Capital
Loss Carryforwards | | | | | | Long-Term Capital
Loss Carryforwards | |
| Crescent Short Duration High Income | | $ | 1,116,531 | | | | | | | $ | 1,346,373 | |
The Fund utilized $275,396 in long-term capital loss carryforwards. The ability to utilize capital loss carryforwards in the future may be limited under the Internal Revenue Code and related regulations based on the results of future transactions.
7. Investment Transactions
The aggregate cost of purchases and proceeds from sales and maturities of investments, other than short-term obligations, for the year ended January 31, 2018 were as follows:
| | | | | | | | | | | | | | | | | | | | | | | | | | | | |
Fund | | Purchases (non-U.S.
Government
Securities) | | | | | | Purchases of U.S.
Government
Securities | | | | | | Sales (non-U.S.
Government
Securities) | | | | | | Sales of U.S.
Government
Securities | |
| Crescent Short Duration High Income | | $ | 82,806,687 | | | | | | | $ | - | | | | | | | $ | 56,850,121 | | | | | | | $ | - | |
35
American Beacon Crescent Short Duration High Income FundSM
Notes to Financial Statements
January 31, 2018
A summary of the Fund’s transactions in the USG Select Fund for the year ended January 31, 2018 were as follows:
| | | | | | | | | | | | | | | | | | | | | | | | | | | | | | | | | | | | | | | | | | | | |
Fund | | Type of
Transaction | | | | | | January 31,
2017
Share/Fair
Value | | | | | | Purchases | | | | | | Sales | | | | | | January 31,
2018
Share/Fair
Value | | | | | | Dividend
Income | |
| Crescent Short Duration High Income | | | Direct | | | | | | | $ | 2,498,843 | | | | | | | $ | 50,617,922 | | | | | | | $ | 50,934,701 | | | | | | | $ | 2,182,064 | | | | | | | $ | 34,409 | |
8. Borrowing Arrangements
Effective November 16, 2017, the Fund, along with certain other funds managed by the Manager (“Participating Funds”), entered into a committed revolving line of credit (the “Committed Line”) agreement with State Street Bank and Trust Company (the “Bank”) to be used to facilitate portfolio liquidity. The maximum borrowing amount under the Committed Line is $50 million with interest at a rate equal to the higher of (a) one-month London Inter-Bank Offered Rate (“LIBOR”) plus 1.25% per annum or (b) the Federal Funds rate plus 1.25% per annum on amounts borrowed. Each of the Participating Funds will pay a commitment fee at a rate of 0.25% per annum on the unused portion of the Committed Line amount. The Committed Line expires November 15, 2018 unless extended by the Bank or terminated by the Participating Funds in accordance with the agreement.
Effective November 16, 2017, the Fund, along with certain other Participating Funds managed by the Manager, entered into an uncommitted discretionary demand revolving line of credit (the “Uncommitted Line”) agreement with the Bank to be used to facilitate portfolio liquidity. The maximum borrowing amount under the Uncommitted Line is $50 million with interest at a rate equal to the higher of (a) one-month LIBOR plus 1.25% per annum or (b) the Federal Funds rate. The Uncommitted Line expires November 15, 2018 unless extended by the Bank or terminated by the Participating Funds in accordance with the agreement.
The Participating Funds paid administration, legal and arrangement fees, which are recognized as a component of “Other expenses” on the Statement of Operations, along with commitment fees, that have been allocated among the Participating Funds based on average daily net assets. During the year ended January 31, 2018, the Fund did not utilize this facility.
9. Capital Share Transactions
The tables below summarize the activity in capital shares for each Class of the Fund:
| | | | | | | | | | | | | | | | | | | | | | | | | | | | |
| | | Institutional Class | |
| | | Year Ended January 31, | |
| | | 2018 | | | | | | 2017 | |
Crescent Short Duration High Income Fund | | Shares | | | | | | Amount | | | | | | Shares | | | | | | Amount | |
| Shares sold | | | 3,035,175 | | | | | | | $ | 29,281,462 | | | | | | | | 1,604,936 | | | | | | | $ | 15,345,755 | |
| Reinvestment of dividends | | | 353,215 | | | | | | | | 3,406,053 | | | | | | | | 199,329 | | | | | | | | 1,878,899 | |
| Shares redeemed | | | (536,404 | ) | | | | | | | (5,189,606 | ) | | | | | | | (530,776 | ) | | | | | | | (4,904,046 | ) |
| | | | | | | | | | | | | | | | | | | | | | | | | | | | |
| Net increase in shares outstanding | | | 2,851,986 | | | | | | | $ | 27,497,909 | | | | | | | | 1,273,489 | | | | | | | $ | 12,320,608 | |
| | | | | | | | | | | | | | | | | | | | | | | | | | | | |
| | | | |
| | | Y Class | |
| | | Year Ended January 31, | |
| | | 2018 | | | | | | 2017 | |
Crescent Short Duration High Income Fund | | Shares | | | | | | Amount | | | | | | Shares | | | | | | Amount | |
| Shares sold | | | 216,234 | | | | | | | $ | 2,083,182 | | | | | | | | 374,672 | | | | | | | $ | 3,523,009 | |
| Reinvestment of dividends | | | 29,095 | | | | | | | | 280,460 | | | | | | | | 30,309 | | | | | | | | 285,423 | |
| Shares redeemed | | | (283,003 | ) | | | | | | | (2,725,395 | ) | | | | | | | (695,631 | ) | | | | | | | (6,454,380 | ) |
| | | | | | | | | | | | | | | | | | | | | | | | | | | | |
| Net (decrease) in shares outstanding | | | (37,674 | ) | | | | | | $ | (361,753 | ) | | | | | | | (290,650 | ) | | | | | | $ | (2,645,948 | ) |
| | | | | | | | | | | | | | | | | | | | | | | | | | | | |
36
American Beacon Crescent Short Duration High Income FundSM
Notes to Financial Statements
January 31, 2018
| | | | | | | | | | | | | | | | | | | | | | | | | | | | |
| | | Investor Class | |
| | | Year Ended January 31, | |
| | | 2018 | | | | | | 2017 | |
Crescent Short Duration High Income Fund | | Shares | | | | | | Amount | | | | | | Shares | | | | | | Amount | |
| Shares sold | | | 28,126 | | | | | | | $ | 271,672 | | | | | | | | 45,154 | | | | | | | $ | 424,004 | |
| Reinvestment of dividends | | | 7,617 | | | | | | | | 73,541 | | | | | | | | 11,800 | | | | | | | | 111,013 | |
| Shares redeemed | | | (211,566 | ) | | | | | | | (2,043,360 | ) | | | | | | | (174,202 | ) | | | | | | | (1,643,102 | ) |
| | | | | | | | | | | | | | | | | | | | | | | | | | | | |
| Net (decrease) in shares outstanding | | | (175,823 | ) | | | | | | $ | (1,698,147 | ) | | | | | | | (117,248 | ) | | | | | | $ | (1,108,085 | ) |
| | | | | | | | | | | | | | | | | | | | | | | | | | | | |
| | | | |
| | | A Class | |
| | | Year Ended January 31, | |
| | | 2018 | | | | | | 2017 | |
Crescent Short Duration High Income Fund | | Shares | | | | | | Amount | | | | | | Shares | | | | | | Amount | |
| Shares sold | | | 83,232 | | | | | | | $ | 802,939 | | | | | | | | 26,753 | | | | | | | $ | 254,321 | |
| Reinvestment of dividends | | | 6,732 | | | | | | | | 64,862 | | | | | | | | 4,742 | | | | | | | | 44,656 | |
| Shares redeemed | | | (41,404 | ) | | | | | | | (399,151 | ) | | | | | | | (23,427 | ) | | | | | | | (221,496 | ) |
| | | | | | | | | | | | | | | | | | | | | | | | | | | | |
| Net increase in shares outstanding | | | 48,560 | | | | | | | $ | 468,650 | | | | | | | | 8,068 | | | | | | | $ | 77,481 | |
| | | | | | | | | | | | | | | | | | | | | | | | | | | | |
| | | | |
| | | C Class | |
| | | Year Ended January 31, | |
| | | 2018 | | | | | | 2017 | |
Crescent Short Duration High Income Fund | | Shares | | | | | | Amount | | | | | | Shares | | | | | | Amount | |
| Shares sold | | | 29,843 | | | | | | | $ | 286,837 | | | | | | | | 27,226 | | | | | | | $ | 256,028 | |
| Reinvestment of dividends | | | 1,959 | | | | | | | | 18,890 | | | | | | | | 1,451 | | | | | | | | 13,676 | |
| Shares redeemed | | | (20,299 | ) | | | | | | | (195,778 | ) | | | | | | | (34,989 | ) | | | | | | | (324,680 | ) |
| | | | | | | | | | | | | | | | | | | | | | | | | | | | |
| Net increase (decrease) in shares outstanding | | | 11,503 | | | | | | | $ | 109,949 | | | | | | | | (6,312 | ) | | | | | | $ | (54,976 | ) |
| | | | | | | | | | | | | | | | | | | | | | | | | | | | |
10. Subsequent Events
Management has evaluated subsequent events for possible recognition or disclosure in the financial statements through the date the financial statements are issued. Management has determined that there are no material events that would require disclosure in the Fund’s financial statements through this date.
37
American Beacon Crescent Short Duration High Income FundSM
Financial Highlights
(For a share outstanding throughout the period)
| | | | | | | | | | | | | | | | | | | | | | | | | | | | |
| | | Institutional Class | |
| | | Year Ended January 31, | | | | | | October 1,
2014A to
January 31, | |
| | | | | | | | |
| | | 2018 | | | | | | 2017 | | | | | | 2016 | | | | | | 2015 | |
| | | | |
Net asset value, beginning of period | | $ | 9.64 | | | | | | | $ | 9.01 | | | | | | | $ | 9.68 | | | | | | | $ | 10.00 | |
| | | | | | | | | | | | | | | | | | | | | | | | | | | | |
Income (loss) from investment operations: | | | | | | | | | | | | | | | | | | | | | | | | | | | | |
Net investment income | | | 0.47 | | | | | | | | 0.46 | | | | | | | | 0.47 | | | | | | | | 0.16 | |
Net gains (losses) on investments (both realized and unrealized) | | | (0.05 | ) | | | | | | | 0.63 | | | | | | | | (0.67 | ) | | | | | | | (0.32 | ) |
| | | | | | | | | | | | | | | | | | | | | | | | | | | | |
Total income (loss) from investment operations | | | 0.42 | | | | | | | | 1.09 | | | | | | | | (0.20 | ) | | | | | | | (0.16 | ) |
| | | | | | | | | | | | | | | | | | | | | | | | | | | | |
Less distributions: | | | | | | | | | | | | | | | | | | | | | | | | | | | | |
Dividends from net investment income | | | (0.47 | ) | | | | | | | (0.46 | ) | | | | | | | (0.47 | ) | | | | | | | (0.16 | ) |
Distributions from net realized gains | | | - | | | | | | | | - | | | | | | | | - | | | | | | | | - | |
| | | | | | | | | | | | | | | | | | | | | | | | | | | | |
Total distributions | | | (0.47 | ) | | | | | | | (0.46 | ) | | | | | | | (0.47 | ) | | | | | | | (0.16 | ) |
| | | | | | | | | | | | | | | | | | | | | | | | | | | | |
Net asset value, end of period | | $ | 9.59 | | | | | | | $ | 9.64 | | | | | | | $ | 9.01 | | | | | | | $ | 9.68 | |
| | | | | | | | | | | | | | | | | | | | | | | | | | | | |
Total returnB | | | 4.45 | % | | | | | | | 12.38 | % | | | | | | | (2.23 | )% | | | | | | | (1.65 | )%C |
| | | | | | | | | | | | | | | | | | | | | | | | | | | | |
| | | | | | | |
Ratios and supplemental data: | | | | | | | | | | | | | | | | | | | | | | | | | | | | |
Net assets, end of period | | $ | 78,914,147 | | | | | | | $ | 51,834,666 | | | | | | | $ | 36,971,459 | | | | | | | $ | 33,903,138 | |
Ratios to average net assets: | | | | | | | | | | | | | | | | | | | | | | | | | | | | |
Expenses, before reimbursements | | | 1.07 | % | | | | | | | 1.26 | % | | | | | | | 1.27 | % | | | | | | | 2.24 | %D |
Expenses, net of reimbursements | | | 0.85 | % | | | | | | | 0.85 | % | | | | | | | 0.85 | % | | | | | | | 0.85 | %D |
Net investment income, before expense reimbursements | | | 4.66 | % | | | | | | | 4.51 | % | | | | | | | 4.41 | % | | | | | | | 3.37 | %D |
Net investment income, net of reimbursements | | | 4.89 | % | | | | | | | 4.93 | % | | | | | | | 4.83 | % | | | | | | | 4.76 | %D |
Portfolio turnover rate | | | 75 | % | | | | | | | 95 | % | | | | | | | 72 | % | | | | | | | 31 | %E |
| A | October 1, 2014 is the inception date of the Crescent Short Duration High Income Fund. |
| B | Based on net asset value, which does not reflect the sales charge, redemption fee, or contingent deferred sales charge, if applicable. May include adjustments in accordance with U.S. GAAP and as such, the net asset value for reporting purposes and the returns based upon those net asset values may differ from the net asset value and returns for shareholder transactions. |
| E | Portfolio turnover rate is for the period from October 1, 2014 through January 31, 2015 and is not annualized. |
See accompanying notes
38
American Beacon Crescent Short Duration High Income FundSM
Financial Highlights
(For a share outstanding throughout the period)
| | | | | | | | | | | | | | | | | | | | | | | | | | | | |
| | | Y Class | |
| | | Year Ended January 31, | | | | | | October 1,
2014A to January 31, | |
| | | | | | | | |
| | | 2018 | | | | | | 2017 | | | | | | 2016 | | | | | | 2015 | |
| | | | |
Net asset value, beginning of period | | $ | 9.63 | | | | | | | $ | 9.00 | | | | | | | $ | 9.68 | | | | | | | $ | 10.00 | |
| | | | | | | | | | | | | | | | | | | | | | | | | | | | |
Income (loss) from investment operations: | | | | | | | | | | | | | | | | | | | | | | | | | | | | |
Net investment income | | | 0.46 | | | | | | | | 0.45 | | | | | | | | 0.46 | | | | | | | | 0.15 | |
Net gains (losses) on investments (both realized and unrealized) | | | (0.05 | ) | | | | | | | 0.63 | | | | | | | | (0.68 | ) | | | | | | | (0.32 | ) |
| | | | | | | | | | | | | | | | | | | | | | | | | | | | |
Total income (loss) from investment operations | | | 0.41 | | | | | | | | 1.08 | | | | | | | | (0.22 | ) | | | | | | | (0.17 | ) |
| | | | | | | | | | | | | | | | | | | | | | | | | | | | |
Less distributions: | | | | | | | | | | | | | | | | | | | | | | | | | | | | |
Dividends from net investment income | | | (0.46 | ) | | | | | | | (0.45 | ) | | | | | | | (0.46 | ) | | | | | | | (0.15 | ) |
Distributions from net realized gains | | | - | | | | | | | | - | | | | | | | | - | | | | | | | | - | |
| | | | | | | | | | | | | | | | | | | | | | | | | | | | |
Total distributions | | | (0.46 | ) | | | | | | | (0.45 | ) | | | | | | | (0.46 | ) | | | | | | | (0.15 | ) |
| | | | | | | | | | | | | | | | | | | | | | | | | | | | |
Net asset value, end of period | | $ | 9.58 | | | | | | | $ | 9.63 | | | | | | | $ | 9.00 | | | | | | | $ | 9.68 | |
| | | | | | | | | | | | | | | | | | | | | | | | | | | | |
Total returnB | | | 4.33 | % | | | | | | | 12.27 | % | | | | | | | (2.39 | )% | | | | | | | (1.68 | )%C |
| | | | | | | | | | | | | | | | | | | | | | | | | | | | |
| | | | | | | |
Ratios and supplemental data: | | | | | | | | | | | | | | | | | | | | | | | | | | | | |
Net assets, end of period | | $ | 5,883,759 | | | | | | | $ | 6,277,416 | | | | | | | $ | 8,481,991 | | | | | | | $ | 98,343 | |
Ratios to average net assets: | | | | | | | | | | | | | | | | | | | | | | | | | | | | |
Expenses, before reimbursements | | | 1.14 | % | | | | | | | 1.36 | % | | | | | | | 1.29 | % | | | | | | | 7.71 | %D |
Expenses, net of reimbursements | | | 0.95 | % | | | | | | | 0.95 | % | | | | | | | 0.95 | % | | | | | | | 0.95 | %D |
Net investment income (loss), before expense reimbursements | | | 4.59 | % | | | | | | | 4.42 | % | | | | | | | 4.80 | % | | | | | | | (2.11 | )%D |
Net investment income, net of reimbursements | | | 4.78 | % | | | | | | | 4.83 | % | | | | | | | 5.14 | % | | | | | | | 4.64 | %D |
Portfolio turnover rate | | | 75 | % | | | | | | | 95 | % | | | | | | | 72 | % | | | | | | | 31 | %E |
| A | October 1, 2014 is the inception date of the Crescent Short Duration High Income Fund. |
| B | Based on net asset value, which does not reflect the sales charge, redemption fee, or contingent deferred sales charge, if applicable. May include adjustments in accordance with U.S. GAAP and as such, the net asset value for reporting purposes and the returns based upon those net asset values may differ from the net asset value and returns for shareholder transactions. |
| E | Portfolio turnover rate is for the period from October 1, 2014 through January 31, 2015 and is not annualized. |
See accompanying notes
39
American Beacon Crescent Short Duration High Income FundSM
Financial Highlights
(For a share outstanding throughout the period)
| | | | | | | | | | | | | | | | | | | | | | | | | | | | |
| | | Investor Class | |
| | | Year Ended January 31, | | | | | | October 1,
2014A to
January 31, | |
| | | | | | | | |
| | | 2018 | | | | | | 2017 | | | | | | 2016 | | | | | | 2015 | |
| | | | |
Net asset value, beginning of period | | $ | 9.64 | | | | | | | $ | 9.01 | | | | | | | $ | 9.69 | | | | | | | $ | 10.00 | |
| | | | | | | | | | | | | | | | | | | | | | | | | | | | |
Income (loss) from investment operations: | | | | | | | | | | | | | | | | | | | | | | | | | | | | |
Net investment income | | | 0.44 | | | | | | | | 0.43 | | | | | | | | 0.44 | | | | | | | | 0.14 | |
Net gains (losses) on investments (both realized and unrealized) | | | (0.06 | ) | | | | | | | 0.63 | | | | | | | | (0.68 | ) | | | | | | | (0.31 | ) |
| | | | | | | | | | | | | | | | | | | | | | | | | | | | |
Total income (loss) from investment operations | | | 0.38 | | | | | | | | 1.06 | | | | | | | | (0.24 | ) | | | | | | | (0.17 | ) |
| | | | | | | | | | | | | | | | | | | | | | | | | | | | |
Less distributions: | | | | | | | | | | | | | | | | | | | | | | | | | | | | |
Dividends from net investment income | | | (0.43 | ) | | | | | | | (0.43 | ) | | | | | | | (0.44 | ) | | | | | | | (0.14 | ) |
Distributions from net realized gains | | | - | | | | | | | | - | | | | | | | | - | | | | | | | | - | |
| | | | | | | | | | | | | | | | | | | | | | | | | | | | |
Total distributions | | | (0.43 | ) | | | | | | | (0.43 | ) | | | | | | | (0.44 | ) | | | | | | | (0.14 | ) |
| | | | | | | | | | | | | | | | | | | | | | | | | | | | |
Net asset value, end of period | | $ | 9.59 | | | | | | | $ | 9.64 | | | | | | | $ | 9.01 | | | | | | | $ | 9.69 | |
| | | | | | | | | | | | | | | | | | | | | | | | | | | | |
Total returnB | | | 4.04 | % | | | | | | | 11.96 | % | | | | | | | (2.67 | )% | | | | | | | (1.67 | )%C |
| | | | | | | | | | | | | | | | | | | | | | | | | | | | |
| | | | | | | |
Ratios and supplemental data: | | | | | | | | | | | | | | | | | | | | | | | | | | | | |
Net assets, end of period | | $ | 979,646 | | | | | | | $ | 2,679,338 | | | | | | | $ | 3,560,159 | | | | | | | $ | 189,898 | |
Ratios to average net assets: | | | | | | | | | | | | | | | | | | | | | | | | | | | | |
Expenses, before reimbursements | | | 1.39 | % | | | | | | | 1.56 | % | | | | | | | 1.46 | % | | | | | | | 6.21 | %D |
Expenses, net of reimbursements | | | 1.23 | % | | | | | | | 1.23 | % | | | | | | | 1.23 | % | | | | | | | 1.23 | %D |
Net investment income (loss), before expense reimbursements | | | 4.33 | % | | | | | | | 4.22 | % | | | | | | | 4.44 | % | | | | | | | (0.41 | )%D |
Net investment income, net of reimbursements | | | 4.49 | % | | | | | | | 4.55 | % | | | | | | | 4.68 | % | | | | | | | 4.57 | %D |
Portfolio turnover rate | | | 75 | % | | | | | | | 95 | % | | | | | | | 72 | % | | | | | | | 31 | %E |
| A | October 1, 2014 is the inception date of the Crescent Short Duration High Income Fund. |
| B | Based on net asset value, which does not reflect the sales charge, redemption fee, or contingent deferred sales charge, if applicable. May include adjustments in accordance with U.S. GAAP and as such, the net asset value for reporting purposes and the returns based upon those net asset values may differ from the net asset value and returns for shareholder transactions. |
| E | Portfolio turnover rate is for the period from October 1, 2014 through January 31, 2015 and is not annualized. |
See accompanying notes
40
American Beacon Crescent Short Duration High Income FundSM
Financial Highlights
(For a share outstanding throughout the period)
| | | | | | | | | | | | | | | | | | | | | | | | | | | | |
| | | A Class | |
| | | Year Ended January 31, | | | | | | October 1,
2014A to
January 31, | |
| | | | | | | | |
| | | 2018 | | | | | | 2017 | | | | | | 2016 | | | | | | 2015 | |
| | | | |
Net asset value, beginning of period | | $ | 9.63 | | | | | | | $ | 9.00 | | | | | | | $ | 9.68 | | | | | | | $ | 10.00 | |
| | | | | | | | | | | | | | | | | | | | | | | | | | | | |
Income (loss) from investment operations: | | | | | | | | | | | | | | | | | | | | | | | | | | | | |
Net investment income | | | 0.43 | | | | | | | | 0.43 | | | | | | | | 0.43 | | | | | | | | 0.14 | |
Net gains (losses) on investments (both realized and unrealized) | | | (0.05 | ) | | | | | | | 0.63 | | | | | | | | (0.68 | ) | | | | | | | (0.32 | ) |
| | | | | | | | | | | | | | | | | | | | | | | | | | | | |
Total income (loss) from investment operations | | | 0.38 | | | | | | | | 1.06 | | | | | | | | (0.25 | ) | | | | | | | (0.18 | ) |
| | | | | | | | | | | | | | | | | | | | | | | | | | | | |
Less distributions: | | | | | | | | | | | | | | | | | | | | | | | | | | | | |
Dividends from net investment income | | | (0.43 | ) | | | | | | | (0.43 | ) | | | | | | | (0.43 | ) | | | | | | | (0.14 | ) |
Distributions from net realized gains | | | - | | | | | | | | - | | | | | | | | - | | | | | | | | - | |
| | | | | | | | | | | | | | | | | | | | | | | | | | | | |
Total distributions | | | (0.43 | ) | | | | | | | (0.43 | ) | | | | | | | (0.43 | ) | | | | | | | (0.14 | ) |
| | | | | | | | | | | | | | | | | | | | | | | | | | | | |
Net asset value, end of period | | $ | 9.58 | | | | | | | $ | 9.63 | | | | | | | $ | 9.00 | | | | | | | $ | 9.68 | |
| | | | | | | | | | | | | | | | | | | | | | | | | | | | |
Total returnB | | | 4.02 | % | | | | | | | 11.94 | % | | | | | | | (2.71 | )% | | | | | | | (1.78 | )%C |
| | | | | | | | | | | | | | | | | | | | | | | | | | | | |
| | | | | | | |
Ratios and supplemental data: | | | | | | | | | | | | | | | | | | | | | | | | | | | | |
Net assets, end of period | | $ | 1,642,414 | | | | | | | $ | 1,183,362 | | | | | | | $ | 1,033,329 | | | | | | | $ | 98,255 | |
Ratios to average net assets: | | | | | | | | | | | | | | | | | | | | | | | | | | | | |
Expenses, before reimbursements | | | 1.46 | % | | | | | | | 1.66 | % | | | | | | | 1.55 | % | | | | | | | 7.97 | %D |
Expenses, net of reimbursements | | | 1.25 | % | | | | | | | 1.25 | % | | | | | | | 1.25 | % | | | | | | | 1.25 | %D |
Net investment income (loss), before expense reimbursements | | | 4.26 | % | | | | | | | 4.13 | % | | | | | | | 4.28 | % | | | | | | | (2.37 | )%D |
Net investment income, net of reimbursements | | | 4.47 | % | | | | | | | 4.54 | % | | | | | | | 4.59 | % | | | | | | | 4.36 | %D |
Portfolio turnover rate | | | 75 | % | | | | | | | 95 | % | | | | | | | 72 | % | | | | | | | 31 | %E |
| A | October 1, 2014 is the inception date of the Crescent Short Duration High Income Fund. |
| B | Based on net asset value, which does not reflect the sales charge, redemption fee, or contingent deferred sales charge, if applicable. May include adjustments in accordance with U.S. GAAP and as such, the net asset value for reporting purposes and the returns based upon those net asset values may differ from the net asset value and returns for shareholder transactions. |
| E | Portfolio turnover rate is for the period from October 1, 2014 through January 31, 2015 and is not annualized. |
See accompanying notes
41
American Beacon Crescent Short Duration High Income FundSM
Financial Highlights
(For a share outstanding throughout the period)
| | | | | | | | | | | | | | | | | | | | | | | | | | | | |
| | | C Class | |
| | | Year Ended January 31, | | | | | | October 1,
2014A to
January 31, | |
| | | | | | | | |
| | | 2018 | | | | | | 2017 | | | | | | 2016 | | | | | | 2015 | |
| | | | |
Net asset value, beginning of period | | $ | 9.63 | | | | | | | $ | 9.00 | | | | | | | $ | 9.68 | | | | | | | $ | 10.00 | |
| | | | | | | | | | | | | | | | | | | | | | | | | | | | |
Income (loss) from investment operations: | | | | | | | | | | | | | | | | | | | | | | | | | | | | |
Net investment income | | | 0.36 | | | | | | | | 0.35 | | | | | | | | 0.36 | | | | | | | | 0.12 | |
Net gains (losses) on investments (both realized and unrealized) | | | (0.05 | ) | | | | | | | 0.63 | | | | | | | | (0.68 | ) | | | | | | | (0.32 | ) |
| | | | | | | | | | | | | | | | | | | | | | | | | | | | |
Total income (loss) from investment operations | | | 0.31 | | | | | | | | 0.98 | | | | | | | | (0.32 | ) | | | | | | | (0.20 | ) |
| | | | | | | | | | | | | | | | | | | | | | | | | | | | |
Less distributions: | | | | | | | | | | | | | | | | | | | | | | | | | | | | |
Dividends from net investment income | | | (0.36 | ) | | | | | | | (0.35 | ) | | | | | | | (0.36 | ) | | | | | | | (0.12 | ) |
Distributions from net realized gains | | | - | | | | | | | | - | | | | | | | | - | | | | | | | | - | |
| | | | | | | | | | | | | | | | | | | | | | | | | | | | |
Total distributions | | | (0.36 | ) | | | | | | | (0.35 | ) | | | | | | | (0.36 | ) | | | | | | | (0.12 | ) |
| | | | | | | | | | | | | | | | | | | | | | | | | | | | |
Net asset value, end of period | | $ | 9.58 | | | | | | | $ | 9.63 | | | | | | | $ | 9.00 | | | | | | | $ | 9.68 | |
| | | | | | | | | | | | | | | | | | | | | | | | | | | | |
Total returnB | | | 3.24 | % | | | | | | | 11.10 | % | | | | | | | (3.40 | )% | | | | | | | (2.03 | )%C |
| | | | | | | | | | | | | | | | | | | | | | | | | | | | |
| | | | | | | |
Ratios and supplemental data: | | | | | | | | | | | | | | | | | | | | | | | | | | | | |
Net assets, end of period | | $ | 535,826 | | | | | | | $ | 427,829 | | | | | | | $ | 456,828 | | | | | | | $ | 97,911 | |
Ratios to average net assets: | | | | | | | | | | | | | | | | | | | | | | | | | | | | |
Expenses, before reimbursements | | | 2.21 | % | | | | | | | 2.41 | % | | | | | | | 2.36 | % | | | | | | | 8.70 | %D |
Expenses, net of reimbursements | | | 2.00 | % | | | | | | | 2.00 | % | | | | | | | 2.00 | % | | | | | | | 2.00 | %D |
Net investment income (loss), before expense reimbursements | | | 3.51 | % | | | | | | | 3.37 | % | | | | | | | 3.76 | % | | | | | | | (3.12 | )%D |
Net investment income, net of reimbursements | | | 3.71 | % | | | | | | | 3.78 | % | | | | | | | 4.12 | % | | | | | | | 3.59 | %D |
Portfolio turnover rate | | | 75 | % | | | | | | | 95 | % | | | | | | | 72 | % | | | | | | | 31 | %E |
| A | October 1, 2014 is the inception date of the Crescent Short Duration High Income Fund. |
| B | Based on net asset value, which does not reflect the sales charge, redemption fee, or contingent deferred sales charge, if applicable. May include adjustments in accordance with U.S. GAAP and as such, the net asset value for reporting purposes and the returns based upon those net asset values may differ from the net asset value and returns for shareholder transactions. |
| E | Portfolio turnover rate is for the period from October 1, 2014 through January 31, 2015 and is not annualized. |
See accompanying notes
42
American Beacon Crescent Short Duration High Income FundSM
Federal Tax Information
January 31, 2018 (Unaudited)
Certain tax information regarding the Fund is required to be provided to shareholders based upon the Fund’s income and distributions for the taxable year ended January 31, 2018. The information and distributions reported herein may differ from information and distributions taxable to the shareholders for the calendar year ended December 31, 2017.
The Fund designated the following items with regard to distributions paid during the fiscal year ended January 31, 2018. All designations are based on financial information available as of this annual report and, accordingly, are subject to change. For each item, it is the intention of the Fund to designate the maximum amount permitted under the Internal Revenue Code of 1986, as amended, and the regulations there under.
Long-Term Capital Gain Distributions:
| | | | |
Crescent Short Duration High Income | | $ | - | |
Short-Term Capital Gain Distributions:
| | | | |
Crescent Short Duration High Income | | $ | - | |
Shareholders received notification in January 2018 of the applicable tax information necessary to prepare their 2017 income tax returns.
43
Trustees and Officers of the American Beacon FundsSM (Unaudited)
The Trustees and officers of the American Beacon Funds (the “Trust”) are listed below, together with their principal occupations during the past five years. The address of each person listed below is 220 Las Colinas Boulevard East, Suite 1200, Irving, Texas 75039. Each Trustee oversees thirty-five funds in the fund complex that includes the Trust, the American Beacon Select Funds and the American Beacon Institutional Funds Trust. The Trust’s Statement of Additional Information contains additional information about the Trustees and is available without charge by calling 1-800-658-5811.
| | | | |
Name, Age and Address | | Position, Term of Office and Length of Time Served with the Trust | | Principal Occupation(s) During Past 5 Years and Current Directorships |
| INTERESTED TRUSTEES | | Term | | |
| | Lifetime of Trust until removal, resignation or retirement* | | |
| | |
| Alan D. Feld** (81) | | Trustee since 1996 | | Sole Shareholder of a professional corporation which is a Partner in the law firm of Akin, Gump, Strauss, Hauer & Feld, LLP (law firm) (1960-Present); Trustee, American Beacon Mileage Funds (1996-2012); Trustee, American Beacon Select Funds (1999-Present); Trustee, American Beacon Master Trust (1996-2012); Trustee, American Beacon Institutional Funds Trust (2017-Present). |
| | |
| NON-INTERESTED TRUSTEES | | Term | | |
| | Lifetime of Trust until removal, resignation or retirement* | | |
| | |
| Gilbert G. Alvarado (48) | | Trustee since 2015 | | Director, Kura MD, Inc. (local telehealth organization) (2015-present); Vice President & CFO, Sierra Health Foundation (health conversion private foundation) (2006-Present); Vice President & CFO, Sierra Health Foundation: Center for Health Program Management (California public benefit corporation) (2012-Present); Director, Innovative North State (2012-2015); Director, Sacramento Regional Technology Alliance (2011-2016); Director, Women’s Empowerment (2009-2014); Director, Valley Healthcare Staffing (2017–present); Trustee, American Beacon Select Funds (2015-Present); Trustee, American Beacon Institutional Funds Trust (2017-Present). |
| | |
| Joseph B. Armes (55) | | Trustee since 2015 | | Chairman & CEO, CSW Industrials f/k/a Capital Southwest Corporation (investment company) (2015-Present); Chairman of the Board of Capital Southwest Corporation, predecessor to CSW Industrials, Inc. (2014-present) (investment company); CEO, Capital Southwest Corporation (2013-2015); President & CEO, JBA Investment Partners (family investment vehicle) (2010-Present); Director and Chair of Audit Committee, RSP Permian (oil and gas producer) (2013-Present); Trustee, American Beacon Select Funds (2015-Present); Trustee, American Beacon Institutional Funds Trust (2017-Present). |
| | |
| Gerard J. Arpey (59) | | Trustee since 2012 | | Director, The Home Depot, Inc. (2015-Present); Partner, Emerald Creek Group (private equity firm) (2011-Present); Director, S.C. Johnson & Son, Inc. (privately held company) (2008-present); Trustee, American Beacon Select Funds (2012-Present); Trustee, American Beacon Institutional Funds Trust (2017-Present). |
| | |
| Brenda A. Cline (57) | | Trustee since 2004 | | Executive Vice President, Chief Financial Officer, Treasurer and Secretary, Kimbell Art Foundation (1993-Present); Director, Range Resources Corporation (oil and natural gas company) (2015-Present); Director, Tyler Technologies, Inc. (public sector software solutions company) (2014-Present); Trustee, American Beacon Mileage Funds (2004-2012); Trustee, American Beacon Select Funds (2004-Present); Trustee, American Beacon Master Trust (2004-2012); Trustee, American Beacon Institutional Funds Trust (2017-Present). |
44
Trustees and Officers of the American Beacon FundsSM (Unaudited)
| | | | |
Name, Age and Address | | Position, Term of Office and Length of Time Served with the Trust | | Principal Occupation(s) During Past 5 Years and Current Directorships |
| NON-INTERESTED TRUSTEES (CONT.) | | Term | | |
| | Lifetime of Trust until removal, resignation or retirement* | | |
| | |
| Eugene J. Duffy (63) | | Trustee since 2008 | | Managing Director, Global Investment Management Distribution, Mesirow Financial (2016-Present); Managing Director, Institutional Services, Intercontinental Real Estate Corporation (2014-Present); Principal and Executive Vice President, Paradigm Asset Management (1994-2014); Director, Sunrise Bank of Atlanta (2008-2013); Trustee, American Beacon Mileage Funds (2008-2012); Trustee, American Beacon Select Funds (2008-Present); Trustee, American Beacon Master Trust (2008-2012); Trustee, American Beacon Institutional Funds Trust (2017-Present). |
| | Lifetime of Trust until removal, resignation or retirement* | | |
| | |
| Douglas A. Lindgren*** (56) | | Trustee since 2018 | | CEO North America, Carne Global Financial Services (2016-2017); Managing Director, IPS Investment Management and Global Head, Content Management, UBS Wealth Management (2010-2016); Managing Director, P&S Hedge Funds, UBS Wealth Management (2008-2010); Managing Director, Head of Alternative Investments, UBS Financial Services, Inc. (2005-2008). |
| | |
| Richard A. Massman (74) | | Trustee since 2004 Chairman since 2008 | | Consultant and General Counsel Emeritus, Hunt Consolidated, Inc. (holding company engaged in oil and gas exploration and production, refining, real estate, farming, ranching and venture capital activities) (2009-Present); Trustee, American Beacon Mileage Funds (2004-2012); Trustee, American Beacon Select Funds (2004-Present); Trustee, American Beacon Master Trust (2004-2012); Trustee, American Beacon Institutional Funds Trust (2017-Present). |
| | |
| Barbara J. McKenna, CFA (54) | | Trustee since 2012 | | Managing Principal, Longfellow Investment Management Company (2005-Present); Trustee, American Beacon Select Funds (2012-Present); Trustee, American Beacon Institutional Funds Trust (2017-Present). |
| | |
| R. Gerald Turner (72) | | Trustee since 2001 | | President, Southern Methodist University (1995-Present); Director, J.C. Penney Company, Inc. (1996-Present); Director, Kronus Worldwide Inc. (chemical manufacturing) (2003-Present); Trustee, American Beacon Mileage Funds (2001-2012); Trustee, American Beacon Select Funds (2001-Present); Trustee, American Beacon Master Trust (2001-2012); Trustee, American Beacon Institutional Funds Trust (2017-Present). |
| | |
| OFFICERS | | Term | | |
| | One Year | | |
| | |
| Gene L. Needles, Jr. (63) | | President since 2009 | | President, CEO and Director, American Beacon Advisors, Inc. (2009-Present); President, CEO and Director, Resolute Investment Managers, Inc. (2015-Present); President, CEO and Director, Resolute Acquisition, Inc. (2015-Present); President, CEO and Director, Resolute Topco, Inc. (2015-Present), President & CEO, Resolute Investment Holdings, LLC (2015-Present); President, CEO and Director, Lighthouse Holdings, Inc. (2009-2015); President and CEO, Lighthouse Holdings Parent, Inc. (2009-2015); Manager, President and CEO, American Private Equity Management, LLC (2012-Present); President, American Beacon Cayman Managed Futures Strategy Fund, Ltd. (2014-Present); Director, Chairman, President and CEO, Alpha Quant Advisors, LLC (2016-Present); Director, ARK Investment Management LLC (2016-Present); Director, Shapiro Capital Management LLC (2017-Present); Member, Investment Advisory Committee, Employees Retirement System of Texas (2017-Present); Trustee, American Beacon NextShares Trust (2015-Present); President, American Beacon Select Funds (2009-Present); President, American Beacon Mileage Funds (2009-2012); President, American Beacon Master Trust (2009–2012); President, American Beacon Institutional Funds Trust (2017-Present). |
45
Trustees and Officers of the American Beacon FundsSM (Unaudited)
| | | | |
Name, Age and Address | | Position, Term of Office and Length of Time Served with the Trust | | Principal Occupation(s) During Past 5 Years and Current Directorships |
| OFFICERS (CONT.) | | Term | | |
| | One Year | | |
| | |
| Rosemary K. Behan (58) | | VP, Secretary and Chief Legal Officer since 2006 | | Vice President and Secretary, American Beacon Advisors, Inc. (2006-Present); Secretary, Resolute Investment Holdings, LLC (2015-Present) Secretary, Resolute Investment Managers, Inc. (2015-Present); Secretary, Resolute Topco, Inc. (2015-Present); Secretary, Resolute Acquisition, Inc. (2015 – Present); Secretary, Lighthouse Holdings, Inc. (2008-2015); Secretary, Lighthouse Holdings Parent, Inc. (2008-2015); Secretary, American Private Equity Management, LLC (2008-Present); Secretary, American Beacon Cayman Managed Futures Strategy Fund, Ltd. (2014-Present); Secretary, Alpha Quant Advisors, LLC (2016-Present); Chief Legal Officer, Vice President and Secretary, American Beacon Select Funds (2006-Present); Chief Legal Officer, Vice President and Secretary, American Beacon Mileage Funds (2006-2012); Chief Legal Officer, Vice President and Secretary, American Beacon Master Trust (2006-2012); Chief Legal Officer, Vice President and Secretary, American Beacon Institutional Funds Trust (2017-Present). |
| | |
| Brian E. Brett (57) | | VP since 2004 | | Senior Vice President (2012-Present) and Vice President (2004-2012), American Beacon Advisors, Inc.; Vice President, American Beacon Select Funds (2004-Present); Vice President, American Beacon Mileage Funds (2004-2012); Vice President, American Beacon Master Trust (2004-2012); Vice President, American Beacon Institutional Funds Trust (2017-Present). |
| | |
| Paul B. Cavazos(48) | | VP since 2016 | | Senior Vice President, American Beacon Advisors, Inc. (2016-Present); Chief Investment Officer and Assistant Treasurer, DTE Energy (2007-2016); Vice President, American Beacon Select Funds (2016-Present); Vice President, American Beacon Institutional Funds Trust (2017-Present). |
| | |
| Erica Duncan (47) | | VP Since 2011 | | Vice President, American Beacon Advisors, Inc. (2011-Present); Vice President, American Beacon Select Funds (2011-Present); Vice President, American Beacon Mileage Funds (2011-2012); Vice President, American Beacon Master Trust (2011-2012); Vice President, American Beacon Institutional Funds Trust (2017-Present). |
| | |
| Melinda G. Heika (56) | | Treasurer since 2010 | | Treasurer, American Beacon Advisors, Inc. (2010-Present); Resolute Investment Managers, Inc. (2015-Present); Treasurer, Resolute Acquisition, Inc. (2015-Present); Treasurer, Resolute Topco, Inc. (2015-Present); Treasurer, Resolute Investment Holdings, LLC. (2015-Present); Treasurer, Lighthouse Holdings, Inc. (2010-2015); Treasurer, Lighthouse Holdings Parent Inc., (2010-2015); Treasurer, American Private Equity Management, LLC (2012-Present); Director and Treasurer, American Beacon Cayman Managed Futures Strategy Fund, Ltd. (2014-Present); Treasurer, American Beacon Select Funds (2010-Present); Treasurer, American Beacon Mileage Funds (2010-2012); Treasurer, American Beacon Master Trust (2010-2012); Treasurer, American Beacon Institutional Funds Trust (2017-Present). |
| | |
| Terri L. McKinney (54) | | VP since 2010 | | Vice President (2009-Present) and Managing Director (2003-2009), American Beacon Advisors, Inc.; Vice President, Resolute Investment Managers, Inc. (2017-Present); Vice President, Alpha Quant Advisors, LLC (2016-Present); Vice President, American Beacon Select Funds (2010-Present); Vice President, American Beacon Mileage Funds (2010-2012); Vice President, American Beacon Master Trust (2010-2012); Vice President, American Beacon Institutional Funds Trust (2017-Present). |
46
Trustees and Officers of the American Beacon FundsSM (Unaudited)
| | | | |
Name, Age and Address | | Position, Term of Office and Length of Time Served with the Trust | | Principal Occupation(s) During Past 5 Years and Current Directorships |
| OFFICERS (CONT.) | | Term | | |
| | One Year | | |
| | |
| Jeffrey K. Ringdahl (42) | | VP since 2010 | | Senior Vice President (2013-Present), Vice President (2010-2013), and Director (2015-Present), American Beacon Advisors, Inc.; Vice President, American Beacon Select Funds (2010-Present); Vice President, American Beacon Mileage Funds (2010-2012); Vice President, American Beacon Master Trust (2010-2012); Senior Vice President (2012-Present) and Manager (2015-Present), American Private Equity Management, LLC; Senior Vice President, Lighthouse Holdings, Inc. (2013-2015); Senior Vice President, Lighthouse Holdings Parent, Inc. (2013-2015); Director and Vice President, American Beacon Cayman Managed Futures Strategy Fund, Ltd. (2014-Present); Trustee, American Beacon NextShares Trust (2015-Present); Director and Senior Vice Present, Resolute Investment Holdings, LLC (2015-Present); Director and Senior Vice President, Resolute Topco, Inc. (2015-Present); Director and Senior Vice President, Resolute Acquisition, Inc. (2015-Present); Director and Senior Vice President, Resolute Investment Managers, Inc. (2015-Present); Director, Executive Vice President and Chief Operating Officer, Alpha Quant Advisors, LLC (2016-Present); Vice President, American Beacon Institutional Funds Trust (2017-President); Director, Shapiro Capital Management, LLC (2017-Present). |
| | |
| Samuel J. Silver (54) | | VP Since 2011 | | Vice President, American Beacon Advisors, Inc. (2011-Present); Vice President, American Beacon Select Funds (2011-Present); Vice President, American Beacon Mileage Funds (2011-2012); Vice President, American Beacon Master Trust (2011-2012); American Beacon Institutional Funds Trust (2011-Present). |
| | |
| Christina E. Sears (46) | | Chief Compliance Officer since 2004 and Asst. Secretary since 1999 | | Chief Compliance Officer, American Beacon Advisors, Inc. (2004-Present); Chief Compliance Officer, American Private Equity Management, LLC (2012-Present); Chief Compliance Officer and Vice President, Alpha Quant Advisors, LLC (2016-Present); Chief Compliance Officer (2004-Present) and Assistant Secretary (1999-Present), American Beacon Select Funds; Chief Compliance Officer (2004-2012) and Assistant Secretary (1999-2012), American Beacon Mileage Funds; Chief Compliance Officer (2004-2012) and Assistant Secretary (1999-2012), American Beacon Master Trust; Chief Compliance Officer and Assistant Secretary, American Beacon Institutional Funds Trust (2017-Present). |
| | |
| Sonia L. Bates (61) | | Asst. Treasurer since 2011 | | Assistant Treasurer, American Beacon Advisors, Inc. (2011-Present); Assistant Treasurer, Resolute Investment Managers, Inc. (2015-Present); Assistant Treasurer, Resolute Acquisition, Inc. (2015-Present); Assistant. Treasurer, Resolute Topco, Inc. (2015-Present); Assistant Treasurer, Resolute Investment Holdings, LLC.; Assistant Treasurer, Lighthouse Holdings, Inc. (2011-2015); Assistant Treasurer, Lighthouse Holdings Parent Inc. (2011-2015); Assistant Treasurer, American Private Equity Management, LLC (2012-Present); Assistant Treasurer, American Beacon Select Funds (2011-Present); Assistant Treasurer American Beacon Mileage Funds (2011-2012); Assistant Treasurer, American Beacon Master Trust (2011-2012); Assistant Treasurer, American Beacon Institutional Funds Trust (2017-Present). |
| | |
| Shelley D. Abrahams (43) | | Assistant Secretary since 2008 | | Assistant Secretary, American Beacon Advisors, Inc. (2008-Present); Assistant Secretary, American Beacon Select Funds (2008-Present); Assistant Secretary, American Beacon Mileage Funds (2008-2012); Assistant Secretary, American Beacon Master Trust (2008-2012); Assistant Secretary, American Beacon Institutional Funds Trust (2017-Present). |
47
Trustees and Officers of the American Beacon FundsSM (Unaudited)
| | | | |
Name, Age and Address | | Position, Term of Office and Length of Time Served with the Trust | | Principal Occupation(s) During Past 5 Years and Current Directorships |
| OFFICERS (CONT.) | | Term | | |
| | One Year | | |
| | |
| Rebecca L. Harris (51) | | Assistant Secretary since 2010 | | Vice President, American Beacon Advisors, Inc. (2016-Present); Vice President, Resolute Investment Managers, Inc. (2017-Present); Vice President, Alpha Quant Advisors, LLC (2016-Present); Assistant Secretary, American Beacon Select Funds (2010-Present); Assistant Secretary, American Beacon Mileage Funds (2010-2012); Assistant Secretary, American Beacon Master Trust (2010-2012); Assistant Secretary, American Beacon Institutional Funds Trust (2017-Present). |
| | |
| Diana N. Lai (42) | | Assistant Secretary since 2012 | | Assistant Secretary, American Beacon Advisors, Inc. (2012-Present); Assistant Secretary, American Beacon Select Funds (2012-Present); Assistant Secretary, American Beacon Institutional Funds Trust (2017-Present). |
| | |
| Teresa A. Oxford (59) | | Assistant Secretary since 2015 | | Assistant Secretary, American Beacon Advisors, Inc. (2015-Present); Assistant Secretary, Alpha Quant Advisors, LLC (2016-Present); Assistant Secretary, American Beacon Select Funds (2015-Present); Assistant Secretary, American Beacon Institutional Funds Trust (2017-Present). |
* As of 11/12/2014, the Board adopted a retirement plan that requires Trustees to retire no later than the last day of the calendar year in which they reach the age of 75.
** Mr. Feld is deemed to be an “interested person” of the Trusts, as defined by the 1940 Act. Mr. Feld’s law firm of Akin, Gump, Strauss, Hauer & Feld LLP has provided legal services within the past two fiscal years to one or more of the Trust’s sub-advisors.
*** Douglas A. Lindgren became a new Trustee to each of the Trusts on 1/1/2018.
48
American Beacon FundsSM
Privacy Policy
January 31, 2018 (Unaudited)
The American Beacon Funds recognize and respect the privacy of our shareholders. We are providing this notice to you so you will understand how shareholder information may be collected and used.
We may collect nonpublic personal information about you from one or more of the following sources:
| | • | | information we receive from you on applications or other forms; |
| | • | | information about your transactions with us or our service providers; and |
| | • | | information we receive from third parties. |
We do not disclose any nonpublic personal information about our customers or former customers to anyone, except as permitted by law.
We restrict access to your nonpublic personal information to those employees or service providers who need to know that information to provide products or services to you. To ensure the confidentiality of your nonpublic personal information, we maintain safeguards that comply with federal standards.
49
This page intentionally left blank.
50
This page intentionally left blank.
51
This page intentionally left blank.
52

Delivery of Documents
eDelivery is NOW AVAILABLE - Stop traditional mail delivery and receive your
shareholder reports and summary prospectus on-line. Sign up at
www.americanbeaconfunds.com
If you invest in the Fund through a financial institution, you may be able to receive the Fund’s regulatory mailings, such as the Prospectus, Annual Report and Semi-Annual Report, by e-mail. If you are interested in this option, please go to www.icsdelivery.com and search for your financial institution’s name or contact your financial institution directly.
To obtain more information about the Fund:
| | |
 | |  |
| | |
| By E-mail: | | On the Internet: |
| american_beacon.funds@ambeacon.com | | Visit our website at www.americanbeaconfunds.com |
| | | |
| | | |
| | |

By Telephone: Call (800) 658-5811 | | 
By Mail: American Beacon Funds P.O. Box 219643 Kansas City, MO 64121-9643 |
| |
| |
| |
| | | |
| Availability of Quarterly Portfolio Schedules | | Availability of Proxy Voting Policy and Records |
| | |
| In addition to the Schedule of Investments provided in each semi-annual and annual report, the Fund files a complete schedule of its portfolio holdings with the Securities and Exchange Commission (“SEC”) on Form N-Q as of the first and third fiscal quarters. The Fund’s Forms N-Q are available on the SEC’s website at www.sec.gov. The Forms N-Q may also be reviewed and copied at the SEC’s Public Reference Section, 100 F Street, NE, Washington, D.C. 20549-2736. Information regarding the operation of the SEC’s Public Reference Room may be obtained by calling (800)-SEC-0330. A complete schedule of the Fund’s portfolio holdings is also available at www.americanbeaconfunds.com approximately sixty days after the end of each quarter. | | A description of the policies and procedures the Fund uses to determine how to vote proxies relating to portfolio securities is available in the Fund’s Statement of Additional Information, is available free of charge on the Fund’s website www.americanbeaconfunds.com and by calling 1-800-967-9009 or by accessing the SEC’s website at www.sec.gov. The Fund’s proxy voting record for the most recent year ended June 30 is filed annually with the SEC on Form N-PX. The Fund’s Forms N-PX are available on the SEC’s website at www.sec.gov. The Fund’s proxy voting record may also be obtained by calling 1-800-967-9009. |
| | |
| | | |
Fund Service Providers:
| | | | | | | | | | | | |
CUSTODIAN State Street Bank and Trust Boston, Massachusetts | | | | TRANSFER AGENT DST Asset Manager Solutions, Inc. Kansas City, Missouri | | | | INDEPENDENT REGISTERED PUBLIC ACCOUNTING FIRM PricewaterhouseCoopers LLP Boston, Massachusetts | | | | DISTRIBUTOR Resolute Investment Distributors, Inc. Irving, Texas |
This report is prepared for shareholders of the American Beacon Funds and may be distributed to others only if preceded or accompanied by a current Prospectus or Summary Prospectus.
American Beacon Funds and American Beacon Crescent Short Duration High Income Fund are service marks of American Beacon Advisors, Inc.
AR 1/18

About American Beacon Advisors
Since 1986, American Beacon Advisors has offered a variety of products and investment advisory services to numerous institutional and retail clients, including a variety of mutual funds, corporate cash management, and separate account management.
Our clients include defined benefit plans, defined contribution plans, foundations, endowments, corporations, financial planners, and other institutional investors. With American Beacon Advisors, you can put the experience of a multi-billion dollar asset management firm to work for your company.
GLOBAL EVOLUTION FRONTIER MARKETS INCOME FUND
Investing in foreign, emerging and frontier market securities may involve heightened risk due to currency fluctuations and economic and political risks. Investing in derivative instruments involves liquidity, credit, interest rate and market risks. The use of fixed-income securities entails interest rate and credit risks. Please see the prospectus for a complete discussion of the Fund’s risks. There can be no assurances that the investment objectives of this Fund will be met.
GLG TOTAL RETURN FUND
Investing in foreign and emerging market securities may involve heightened risk due to currency fluctuations and economic and political risks. Investing in derivative instruments involves liquidity, credit, interest rate and market risks. The use of fixed-income securities entails interest rate and credit risks. Because the Fund may invest in fewer issuers than a more diversified portfolio, the fluctuating value of a single holding may have a greater effect on the value of the Fund. Please see the prospectus for a complete discussion of the Fund’s risks. There can be no assurances that the investment objectives of this Fund will be met.
Any opinions herein, including forecasts, reflect our judgment as of the end of the reporting period and are subject to change. Each advisor’s strategies and each Fund’s portfolio composition will change depending on economic and market conditions. This report is not a complete analysis of market conditions, and, therefore, should not be relied upon as investment advice. Although economic and market information has been compiled from reliable sources, American Beacon Advisors, Inc. makes no representation as to the completeness or accuracy of the statements contained herein.
American Beacon Funds | January 31, 2018 |
Contents
President’s Message
| | |
 | | Dear Shareholders, At American Beacon, we are proud to offer a broad range of equity, fixed- income and alternative mutual fund products for institutions and individuals. Our mutual funds – which span the domestic, international, global, frontier and emerging markets – are sub-advised by experienced portfolio managers who employ distinctive investment processes to manage assets through a variety of economic and market conditions. Together, we work diligently to help our clients and shareholders meet their long-term financial goals. Institutional wisdom, enduring value. Since our inception as a pension fiduciary in 1986, American Beacon has focused on identifying and overseeing institutional investment managers and portfolio risk management. In 1987, we leveraged our size and experience to launch a series of sub-advised, multi- |
manager mutual funds providing individual investors access to many of the same institutional managers as our pension clients. Following the financial crisis in 2008, we saw that investors were looking for unique solutions from managers who were not necessarily mainstream. In 2010, we began offering mutual funds from single managers with distinctive investment styles or asset classes. As we continue to expand our family of funds, our solutions- based approach provides innovative investments.
Guiding principles. Our “manager of managers” philosophy is built on a long-standing history of innovative thinking, discipline and consistency in applying our solutions-based approach. As a manager of managers, our goal is to engage the most effective money managers for each asset class, investment style or market strategy – whether through a single sub-advisor or a combination of sub-advisors. Because we take our fiduciary responsibilities very seriously, our thorough manager evaluation and selection process is rigorous and ongoing. Our guiding principles – predictability, style consistency, competitive pricing and long-term relationships – provide a strong foundation for our due-diligence process. Our broad range of mutual funds helps investors navigate the economic storms and market downturns in the U.S. and abroad. Our years of experience evaluating sub-advisors have led us to identify and partner with asset managers who have adhered to their disciplined processes for many years and through multiple market cycles.
Focus on asset protection and risk mitigation. We strive to provide innovative, long-term products without gimmicks. From offering some of the first multi-manager funds, one of the first retirement-income funds and the first open-end mutual fund in the U.S. to focus primarily on frontier-market debt, our robust history includes applying a disciplined, solutions-based approach to our product development process to help protect assets and mitigate risk.
Thank you for your continued interest in American Beacon. For additional information about our funds or to access your account information, please visit our website at www.americanbeaconfunds.com.
Best Regards,

Gene L. Needles, Jr.
President
American Beacon Funds
1
Global Fixed-Income Market Overview
January 31, 2018 (Unaudited)
The global bond market produced positive returns over the 12-month period ended January 31, 2018, evidenced by the Bloomberg Barclays Global Aggregate Index return of 7.5%.
In response to better economic conditions, the U.S. Federal Reserve (the “Fed”) hiked rates at their March, June and December meetings during the 2017 calendar year. The rate hikes were highly anticipated and, thus, did not move markets as economic indicators and investor sentiment improved throughout the year. The U.S. Congress passed a tax-reform package in December, which gave the credit cycle an additional boost. The yield curve started flattening toward the end of the period, indicating the Fed’s rate hikes would help keep inflation in check. Other central banks, including the European Central Bank (“ECB”) and the Bank of Japan (“BOJ”), have not yet started raising rates, signifying some divergence among the three largest central banks.
Volatility throughout the period remained low by historical standards, which proved to be a healthy environment for credit markets as spreads moved lower. In the U.S., both high- and low-quality corporate credits had solid periods as investors continued to search for yield. The ICE BofAML US Corporate Index (Investment Grade) returned 5.1% and the ICE BofAML US High Yield Index returned 6.7% for the period.
Emerging and frontier market bonds performed well over the period as initial concerns over U.S. protectionism were replaced by optimism following a pickup in global growth and higher commodity prices. Market sentiment was occasionally shaken by country-specific news from countries like Brazil, Venezuela, South Africa and Turkey, as well as NAFTA negotiations exposing large conceptual disagreement. The JPMorgan Emerging Market Bond Index-Global Diversified (hard currency) posted a solid 8.6% return for the period. Local currency emerging-market results were even stronger as the JPMorgan Government Bond Index-Emerging Markets Global Diversified Index was up 17.7%. The smaller, less-developed frontier economies also produced strong results, represented by the JPMorgan Next Generation Markets Index, which returned 14.8%.
The period ended with optimism as the theme of synchronized global growth continues to play out. However, many risks could develop since the domestic environment is tightening and U.S. Treasury yields are expected to rise. It remains to be seen how the markets will react when other central banks, such as ECB and BOJ, begin to phase out accommodative policies or inflation meaningfully picks up.
2
American Beacon Global Evolution Frontier Markets Income FundSM Performance Overview
January 31, 2018 (Unaudited)
The Investor Class of the American Beacon Global Evolution Frontier Markets Income Fund (the “Fund”) returned 15.47% for the twelve-month period ending January 31, 2018. The Fund outperformed the JPMorgan EMBI Global Diversified Index (the “Index”) (hard currency) return of 8.64% for the period. For additional comparison, the JPMorgan GBI-EM Global Diversified Index (local currency) returned 17.72%, and the JP Morgan NEXGEM Index (local currency frontier markets) returned 14.76%.
Comparison of Change in Value of a $10,000 Investment for the period from 2/25/2014 through 1/31/2018
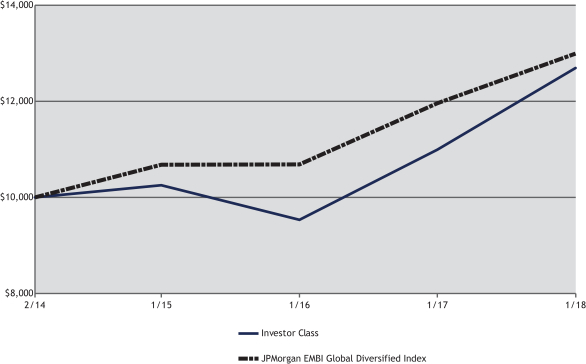
| | | | | | | | | | | | | | | | | | | | | | | | | |
| Total Returns for the Period ended January 31, 2018 | |
| | | Ticker | | 1 Year | | 3 Years | | Since Inception
2/25/2014 | | Value of $10,000
2/25/2014- 1/31/2018 |
Institutional Class (1,3) | | AGEIX | | | | 15.92 | % | | | | 7.81 | % | | | | 6.64 | % | | | $ | 12,879 | |
Y Class (1,3) | | AGEYX | | | | 15.84 | % | | | | 7.63 | % | | | | 6.54 | % | | | $ | 12,830 | |
Investor Class (1,3) | | AGEPX | | | | 15.47 | % | | | | 7.38 | % | | | | 6.24 | % | | | $ | 12,690 | |
A without Sales Charge (1,3) | | AGUAX | | | | 15.39 | % | | | | 7.37 | % | | | | 6.22 | % | | | $ | 12,679 | |
A with Sales Charge (1,3) | | AGUAX | | | | 9.88 | % | | | | 5.65 | % | | | | 4.91 | % | | | $ | 12,076 | |
C without Sales Charge (1,3) | | AGECX | | | | 14.54 | % | | | | 6.56 | % | | | | 5.39 | % | | | $ | 12,297 | |
C with Sales Charge (1,3) | | AGECX | | | | 13.54 | % | | | | 6.56 | % | | | | 5.39 | % | | | $ | 12,297 | |
| | | | | | | | | | | | | | | | | | | | | | | | | |
JPMorgan EMBI Global Diversified Index (2) | | | | | | 8.64 | % | | | | 6.77 | % | | | | 6.88 | % | | | $ | 12,994 | |
| 1. | Performance shown is historical and is not indicative of future returns. Investment returns and principal value will vary, and shares may be worth more or less at redemption than at original purchase. Performance shown is calculated based on the published end of day net asset values as of date indicated, and current performance may be lower or higher than the performance data quoted. To obtain performance as of the most recent month end, please call 1-800-967-9009 or visit www.americanbeaconfunds.com. Fund performance in the table above does not reflect the deduction of taxes a shareholder would pay on distributions or the redemption of shares. Generally accepted accounting principles require adjustments to be made to the net assets of the Fund at period end for financial reporting purposes only, and as such, the total return based on the unadjusted net asset value per share may differ from the total return reported in the financial highlights. A portion of the fees charged to each Class of the Fund was waived from Fund inception through 2015 and partially recovered in 2016. Performance prior to waiving fees was lower than actual returns shown through 2015. A Class shares have a maximum sales charge of 4.75%. The maximum contingent deferred sales charge for the C Class is 1.00% for shares redeemed within one year of the date of purchase. Please note that the recent performance of the securities market has helped produce short-term returns that are not typical and may not continue in the future. |
3
American Beacon Global Evolution Frontier Markets Income FundSM Performance Overview
January 31, 2018 (Unaudited)
| 2. | The JPMorgan EMBI Global Diversified Index is an emerging market debt benchmark that tracks dollar-denominated bonds issued by frontier and emerging market governments. One cannot directly invest in an index. |
| 3. | The Total Annual Fund Operating Expense ratios set forth in the most recent Fund prospectus for the Institutional, Y, Investor, A, and C Class shares were 1.41%, 1.49%, 1.73%, 1.79% and 2.56%, respectively. The expense ratios above may vary from the expense ratios presented in other sections of this report that are based on expenses incurred during the period covered by this report. |
Frontier markets performed well in the period as initial concerns over U.S. protectionism were replaced by optimism following a pickup in global growth and higher commodity prices. The Fund started the year with a small overweight in local currency exposure that steadily increased throughout the period.
The largest contributor to positive performance for the period was the overweight to local fixed income in Africa. In Zambia, the local currency position was a top contributor as the monetary easing cycle led to large capital gains as well as a contribution from high carry. Another top contributor was a local currency position in Mozambique where the commodity price recovery provided a tailwind and the currency appreciated after a multi-year currency crisis. A local currency position in Egypt performed strongly due to support provided by the IMF program which stabilized the Egyptian pound and allowed the high carry to contribute to performance. Additionally, local currency positions in Uganda and Nigeria were additive to performance.
The largest negative contributions to performance came from just three positions in Tajikistan, Ukraine and Algeria.
The sub-advisor’s investment process involves a top-down approach to assess macroeconomic factors affecting the relationships between developed, emerging and frontier countries, and a bottom-up process to identify fundamentally attractive investments. The sub-advisor also examines relative valuations across countries to identify appropriate risk-adjusted opportunities. This investment process has remained consistent since the Fund’s inception.
| | | | | | | | |
| Top Ten Holdings (% Net Assets) | | | | | | | | |
| Dominican Republic International Bond, 11.500%, Due 5/10/2024 | | | | | | | 2.3 | |
| Mongolia Government International Bond, 8.750%, Due 3/9/2024 | | | | | | | 2.3 | |
| Angolan Government International Bond, 9.500%, Due 11/12/2025 | | | | | | | 2.2 | |
| Costa Rica Titulos de Propiedad, 9.660%, Due 9/30/2026 | | | | | | | 1.9 | |
| Ivory Coast Government International Bond, 5.750%, Due 12/31/2032 | | | | | | | 1.9 | |
| Republic of Cameroon International Bond, 9.500%, Due 11/19/2025 | | | | | | | 1.9 | |
| Iraq International Bond, 5.800%, Due 1/15/2028 | | | | | | | 1.8 | |
| Zambia Government Bond, 13.000%, Due 8/29/2026 | | | | | | | 1.7 | |
| Mozambique Government Bonds (Issuer ICBC Standard Bank PLC) | | | | | | | 1.6 | |
| Republic of Tajikistan International Bond, 7.125%, Due 9/14/2027 | | | | | | | 1.6 | |
| | |
| Total Fund Holdings | | | 117 | | | | | |
| | | | | | | | |
| Top Ten Country Weightings (% Investments) | | | | | | | | |
| Egypt | | | | | | | 5.2 | |
| Sri Lanka | | | | | | | 5.1 | |
| Ghana | | | | | | | 5.1 | |
| Zambia | | | | | | | 5.1 | |
| Nigeria | | | | | | | 5.0 | |
| Argentina | | | | | | | 4.9 | |
| Iraq | | | | | | | 3.9 | |
| Uganda | | | | | | | 3.8 | |
| Kenya | | | | | | | 3.7 | |
| Ivory Coast | | | | | | | 3.6 | |
| | | | | | | | |
| Sector Allocation (% Investments) | | | | | | | | |
| Foreign Sovereign Obligations | | | | | | | 79.0 | |
| Credit-Linked Notes | | | | | | | 19.7 | |
| Financial | | | | | | | 1.3 | |
| | | | | | | | |
4
American Beacon Global Evolution Frontier Markets Income FundSM Performance Overview
January 31, 2018 (Unaudited)
| | | | | | | | |
| Country Allocation (% Investments) | | | | | | | | |
| Egypt | | | | | | | 5.2 | |
| Sri Lanka | | | | | | | 5.1 | |
| Ghana | | | | | | | 5.1 | |
| Zambia | | | | | | | 5.1 | |
| Nigeria | | | | | | | 5.0 | |
| Argentina | | | | | | | 4.9 | |
| Iraq | | | | | | | 3.9 | |
| Uganda | | | | | | | 3.8 | |
| Kenya | | | | | | | 3.7 | |
| Ivory Coast | | | | | | | 3.6 | |
| Dominican Republic | | | | | | | 3.5 | |
| Ecuador | | | | | | | 3.4 | |
| Ukraine | | | | | | | 3.4 | |
| Uruguay | | | | | | | 3.3 | |
| Angola | | | | | | | 3.2 | |
| Costa Rica | | | | | | | 3.1 | |
| Mongolia | | | | | | | 3.0 | |
| Mozambique | | | | | | | 2.8 | |
| Nicaragua | | | | | | | 2.7 | |
| Kazakhstan | | | | | | | 2.3 | |
| Cameroon | | | | | | | 2.2 | |
| Georgia | | | | | | | 1.9 | |
| Tajikistan | | | | | | | 1.8 | |
| Supranational | | | | | | | 1.7 | |
| Netherlands | | | | | | | 1.5 | |
| United Kingdom | | | | | | | 1.4 | |
| Ethiopia | | | | | | | 1.3 | |
| Azerbaijan | | | | | | | 1.2 | |
| Gabon | | | | | | | 1.2 | |
| Tunisia | | | | | | | 1.2 | |
| Paraguay | | | | | | | 1.1 | |
| Suriname | | | | | | | 1.0 | |
| Gambia | | | | | | | 1.0 | |
| United States | | | | | | | 1.0 | |
| Malawi | | | | | | | 0.9 | |
| Rwanda | | | | | | | 0.9 | |
| Armenia | | | | | | | 0.9 | |
| Senegal | | | | | | | 0.8 | |
| Belarus | | | | | | | 0.8 | |
| Bosnia & Herzegovina | | | | | | | 0.1 | |
5
American Beacon GLG Total Return FundSM
Performance Overview
January 31, 2018 (Unaudited)
The Investor Class of the American Beacon GLG Total Return Fund (the “Fund”) returned -1.05% for the twelve-month period ended January 31, 2018. The Fund underperformed the BofA Merrill Lynch 3 Month LIBOR Constant Maturity Index (the “Index”) return of 1.16% for the same period. For additional comparison, the JP Morgan EMBI Global Index (hard currency) returned 7.56%, and the JP Morgan GBI-EM Global Diversified Index (local currency) returned 17.72 %.
Comparison of Change in Value of a $10,000 Investment for the period from 5/20/2016 through 1/31/2018
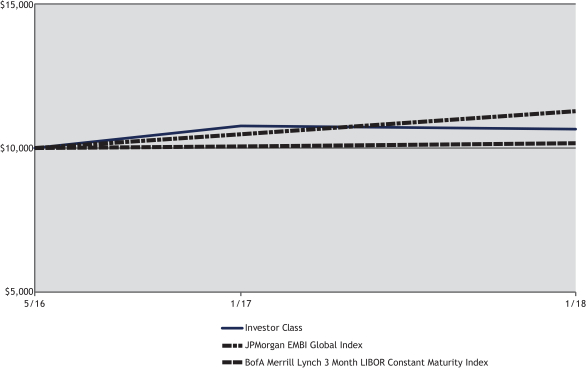
| | | | | | | | | | | | | | | | | | | | |
| Total Returns for the Period ended January 31, 2018 | |
| | | Ticker | | 1 Year | | Since Inception 5/20/2016 | | Value of $10,000
5/20/2016- 1/31/2018 |
Institutional Class (1,3) | | GLGIX | | | | -0.64 | % | | | | 4.21 | % | | | $ | 10,726 | |
Y Class (1,3) | | GLGYX | | | | -0.78 | % | | | | 4.06 | % | | | $ | 10,701 | |
Investor Class (1,3) | | GLGPX | | | | -1.05 | % | | | | 3.78 | % | | | $ | 10,652 | |
A without Sales Charge (1,3) | | GLGAX | | | | -1.15 | % | | | | 3.72 | % | | | $ | 10,641 | |
A Class with Sales Charge (1,3) | | GLGAX | | | | -5.83 | % | | | | 0.79 | % | | | $ | 10,135 | |
C without Sales Charge (1,3) | | GLGCX | | | | -1.86 | % | | | | 2.94 | % | | | $ | 10,506 | |
C Class with Sales Charge (1,3) | | GLGCX | | | | -2.86 | % | | | | 2.94 | % | | | $ | 10,506 | |
Ultra Class (1,3) | | GLGUX | | | | -0.57 | % | | | | 4.25 | % | | | $ | 10,734 | |
| | | | | | | | | | | | | | | | | | | | |
BofA Merrill Lynch 3-Month LIBOR Constant Maturity Index (2) | | | | | | 1.16 | % | | | | 0.98 | % | | | $ | 10,167 | |
JPMorgan EMBI Global Index (2) | | | | | | 7.56 | % | | | | 7.27 | % | | | $ | 11,269 | |
| 1. | Performance shown is historical and is not indicative of future returns. Investment returns and principal value will vary, and shares may be worth more or less at redemption than at original purchase. Performance shown is calculated based on the published end of day net asset values as of the date indicated, and current performance may be lower or higher than the performance data quoted. To obtain performance as of the most recent month end, please visit www.americanbeaconfunds.com or call 1-800-967-9009. Fund performance in the table above does not reflect the deduction of taxes a shareholder would pay on distributions or the redemption of shares. Generally accepted accounting principles require adjustments to be made to the net assets of the Fund at period end for financial reporting purposes only, and as such, the total return based on the unadjusted net asset value per share may differ from the total return reported in the financial highlights. A portion of the fees charged to each Class of the Fund has been waived since Fund inception. Performance |
6
American Beacon GLG Total Return FundSM
Performance Overview
January 31, 2018 (Unaudited)
| | prior to waiving fees was lower than the actual returns shown since inception. A Class shares have a maximum sales charge of 4.75%. The maximum contingent deferred sales charge for the C Class is 1.00% for shares redeemed within one year of the date of purchase. |
| 2. | The BofA Merrill Lynch 3-Month LIBOR Constant Maturity Index represents the London Interbank Offered Rate (LIBOR) with a constant 3-month average maturity. LIBOR is a composite of the rates of interest at which banks borrow from one another in the London market, and it is a widely used benchmark for short-term interest rates. The JPMorgan EMBI Global Index is an emerging market debt benchmark that tracks dollar-denominated bonds issued by emerging market governments. One cannot directly invest in an index. |
| 3. | The Total Annual Fund Operating Expense ratios set forth in the most recent Fund prospectus for the Institutional, Y, Investor, A, C, and Ultra Class shares were 2.10%, 5.32%, 5.15%, 5.63%, 6.38% and 2.10%, respectively. The expense ratios above may vary from the expense ratios presented in other sections of this report that are based on expenses incurred during the period covered by this report. |
Emerging-market debt continued to post strong returns during the period as investors flocked to the incremental yield and diversification of the asset class. In early 2017, however, the Fund began to adopt a defensive posture toward the market as valuations appeared to become stretched and investor exposures had become crowded. The Fund did maintain positions in higher-quality, short-duration sovereign and quasi-sovereign bonds denominated in U.S. dollars to generate income for the Fund, but the broader emerging-market exposures were significantly reduced.
The Fund reduced its exposures to local currencies early in the period, and by mid-2017, the Fund held a net short position in currency. The primary shorts were in the Brazilian real, Indonesian rupiah, South Korean won and Russian ruble. The Fund held a long position in the Mexican peso that added value, but overall, the Fund was short currency.
In addition, the Fund reduced its credit exposure to a variety of emerging market countries as credit spreads became too narrow to justify the risk. The Fund developed this position primarily by entering into credit default swap transactions wherein the Fund purchased credit protection on the sovereign issuers. This resulted in net short exposure to emerging market credit risk. By period end, the largest short positions were in Argentina, Indonesia, South Africa, Lebanon and Russia.
Investor sentiment toward emerging market credit had become significantly overweight, and the fundamentals in many countries were weakening (current account balances, inflation expectations, currency valuations, fiscal spending, etc.). Credit spreads also had become historically narrow as investors searched for yield. As a result, the Fund positioned itself for an eventual reversal in the markets.
The sub-advisor has maintained a consistent top-down and bottom-up approach toward the markets since the Fund’s inception, and the sub-advisor seeks to generate attractive long-term results with lower volatility than that of the emerging markets over a full market cycle.
| | | | | | | | |
| Top Ten Holdings (% Net Assets) | | | | | | | | |
| U.S. Treasury Bills, 0.010%, Due 3/1/2018 | | | | | | | 28.4 | |
| U.S. Treasury Bills, 0.010%, Due 5/3/2018 | | | | | | | 14.4 | |
| U.S. Treasury Bills, 0.010%, Due 4/26/2018 | | | | | | | 9.4 | |
| U.S. Treasury Bills, Due 2/1/2018 | | | | | | | 8.8 | |
| U.S. Treasury Bills, 0.010%, Due 3/29/2018 | | | | | | | 8.6 | |
| U.S. Treasury Bills, Due 5/31/2018 | | | | | | | 6.7 | |
| Turkey Government International Bond, 6.750%, Due 4/3/2018 | | | | | | | 4.5 | |
| U.S. Treasury Bills, 0.010%, Due 6/14/2018 | | | | | | | 3.4 | |
| Banco Nacional de Desenvolvimento Economico e Social, 6.369%, Due 6/16/2018 | | | | | | | 1.7 | |
| Republic of South Africa Government International Fund, 6.875%, Due 5/27/2019 | | | | | | | 1.5 | |
| | |
| Total Fund Holdings | | | 27 | | | | | |
7
American Beacon GLG Total Return FundSM
Performance Overview
January 31, 2018 (Unaudited)
| | | | | | | | | | | | |
| Sector Exposures (%) | | | | | |
| Fund1
Long/(Short) |
|
| Foreign Sovereign | | | | | | | | | | | 10.4 | |
Turkey | | | | | | | 4.5 | | | | | |
South Africa | | | | | | | 2.7 | | | | | |
Brazil | | | | | | | 1.8 | | | | | |
Indonesia | | | | | | | 0.8 | | | | | |
Colombia | | | | | | | 0.6 | | | | | |
| Foreign Corporate Obligations | | | | | | | | | | | 6.3 | |
Energy | | | | | | | 4.2 | | | | | |
Financial | | | | | | | 1.4 | | | | | |
Utilities | | | | | | | 0.7 | | | | | |
| Cash & Cash Equivalent | | | | | | | | | | | 79.7 | |
| |
| U.S. dollar denominated. | | | | | |
| 1 | Percentages represent the Fund’s risk-based, notional exposure as a percentage of the Fund’s total net assets. Due to the use of derivative instruments, which typically introduce leverage, percentages may not add to 100%. |
| | | | | | | | |
| Country Allocation (% Investments) | | | | | | | | |
| United States | | | | | | | 83.0 | |
| Turkey | | | | | | | 5.0 | |
| South Africa | | | | | | | 2.7 | |
| Mexico | | | | | | | 2.5 | |
| Brazil | | | | | | | 2.1 | |
| British Virgin Islands | | | | | | | 1.4 | |
| Indonesia | | | | | | | 0.9 | |
| India | | | | | | | 0.8 | |
| Israel | | | | | | | 0.6 | |
| Colombia | | | | | | | 0.6 | |
| Malaysia | | | | | | | 0.4 | |
8
American Beacon FundsSM
Expense Examples
January 31, 2018 (Unaudited)
Fund Expense Example
As a shareholder of a Fund, you incur two types of costs: (1) transaction costs, including sales charges (loads) on purchase payments and redemption fees, if applicable, and (2) ongoing costs, including management fees, distribution (12b-1) fees, sub-transfer agent fees, and other Fund expenses. The Examples are intended to help you understand the ongoing cost (in dollars) of investing in the Fund and to compare these costs with the ongoing costs of investing in other mutual funds. The Examples are based on an investment of $1,000 invested at the beginning of the period in each Class and held for the entire period from August 1, 2017 through January 31, 2018.
Actual Expenses
The “Actual” lines of the tables provide information about actual account values and actual expenses. You may use the information on this page, together with the amount you invested, to estimate the expenses that you paid over the period. Simply divide your account value by $1,000 (for example, an $8,600 account value divided by $1,000 = $8.60), then multiply the result by the “Expenses Paid During Period” to estimate the expenses you paid on your account during this period. Shareholders of the Investor and Institutional Classes that invest in the Fund through an IRA or Roth IRA may be subject to a custodial IRA fee of $15 that is typically deducted each December. If your account was subject to a custodial IRA fee during the period, your costs would have been $15 higher.
Hypothetical Example for Comparison Purposes
The “Hypothetical” lines of the tables provide information about hypothetical account values and hypothetical expenses based on the Fund’s actual expense ratio and an assumed 5% per year rate of return before expenses (not the Fund’s actual return). You may compare the ongoing costs of investing in the Fund with other funds by contrasting this 5% hypothetical example and the 5% hypothetical examples that appear in the shareholder reports of the other funds. The hypothetical account values and expenses may not be used to estimate the actual ending account balance or expenses you paid for the period. Shareholders of the Investor and Institutional Classes that invest in the Funds through an IRA or Roth IRA may be subject to a custodial IRA fee of $15 that is typically deducted each December. If your account was subject to a custodial IRA fee during the period, your costs would have been $15 higher.
You should also be aware that the expenses shown in the table highlight only your ongoing costs and do not reflect any transaction costs charged by the Fund, such as sales charges (loads) or redemption fees, as applicable. Similarly, the expense examples for other funds do not reflect any transaction costs charged by those funds, such as sales charges (loads), redemption fees or exchange fees. Therefore, the “Hypothetical” lines of the tables are useful in comparing ongoing costs only and will not help you determine the relative total costs of owning different funds. If you were subject to any transaction costs during the period, your costs would have been higher.
9
American Beacon FundsSM
Expense Examples
January 31, 2018 (Unaudited)
| | | | | | | | | | | | | | | |
| American Beacon Global Evolution Frontier Markets Income Fund | |
| | | Beginning Account Value
8/1/2017 | | Ending Account Value
1/31/2018 | | Expenses Paid During
Period
8/1/2017-1/31/2018* |
| Institutional Class | | | | | | | | | | | | | | | |
| Actual | | | | $1,000.00 | | | | | $1,062.00 | | | | | $5.98 | |
| Hypothetical** | | | | $1,000.00 | | | | | $1,019.40 | | | | | $5.85 | |
| Y Class | | | | | | | | | | | | | | | |
| Actual | | | | $1,000.00 | | | | | $1,060.50 | | | | | $6.49 | |
| Hypothetical** | | | | $1,000.00 | | | | | $1,018.90 | | | | | $6.36 | |
| Investor Class | | | | | | | | | | | | | | | |
| Actual | | | | $1,000.00 | | | | | $1,059.00 | | | | | $8.15 | |
| Hypothetical** | | | | $1,000.00 | | | | | $1,017.30 | | | | | $7.98 | |
| A Class | | | | | | | | | | | | | | | |
| Actual | | | | $1,000.00 | | | | | $1,058.90 | | | | | $8.04 | |
| Hypothetical** | | | | $1,000.00 | | | | | $1,017.40 | | | | | $7.88 | |
| C Class | | | | | | | | | | | | | | | |
| Actual | | | | $1,000.00 | | | | | $1,054.80 | | | | | $11.91 | |
| Hypothetical** | | | | $1,000.00 | | | | | $1,013.60 | | | | | $11.67 | |
| * | Expenses are equal to the Fund’s annualized expense ratios for the six-month period of 1.15%, 1.25%, 1.57%, 1.55%, and 2.30% for the Institutional, Y, Investor, A, and C Classes, respectively, multiplied by the average account value over the period, multiplied by the number derived by dividing the number of days in the most recent fiscal half-year (184) by days in the year (365) to reflect the half-year period. |
| ** | 5% return before expenses. |
| | | | | | | | | | | | | | | |
| American Beacon GLG Total Return Fund | |
| | | Beginning Account Value
8/1/2017 | | Ending Account Value
1/31/2018 | | Expenses Paid During
Period
8/1/2017-1/31/2018* |
| Institutional Class | | | | | | | | | | | | | | | |
| Actual | | | | $1,000.00 | | | | | $985.40 | | | | | $5.25 | |
| Hypothetical** | | | | $1,000.00 | | | | | $1,019.90 | | | | | $5.35 | |
| Y Class | | | | | | | | | | | | | | | |
| Actual | | | | $1,000.00 | | | | | $984.30 | | | | | $5.75 | |
| Hypothetical** | | | | $1,000.00 | | | | | $1,019.40 | | | | | $5.85 | |
| Investor Class | | | | | | | | | | | | | | | |
| Actual | | | | $1,000.00 | | | | | $983.10 | | | | | $7.15 | |
| Hypothetical** | | | | $1,000.00 | | | | | $1,018.00 | | | | | $7.27 | |
| A Class | | | | | | | | | | | | | | | |
| Actual | | | | $1,000.00 | | | | | $983.10 | | | | | $7.25 | |
| Hypothetical** | | | | $1,000.00 | | | | | $1,017.90 | | | | | $7.38 | |
| C Class | | | | | | | | | | | | | | | |
| Actual | | | | $1,000.00 | | | | | $978.60 | | | | | $10.97 | |
| Hypothetical** | | | | $1,000.00 | | | | | $1,014.10 | | | | | $11.17 | |
| Ultra Class | | | | | | | | | | | | | | | |
| Actual | | | | $1,000.00 | | | | | $985.40 | | | | | $4.75 | |
| Hypothetical** | | | | $1,000.00 | | | | | $1,020.40 | | | | | $4.84 | |
| * | Expenses are equal to the Fund’s annualized expense ratios for the six-month period of 1.05%, 1.15%, 1.43%, 1.45%, 2.20%, and 0.95% for the Institutional, Y, Investor, A, C, and Ultra Classes, respectively, multiplied by the average account value over the period, multiplied by the number derived by dividing the number of days in the most recent fiscal half-year (184) by days in the year (365) to reflect the half-year period. |
| ** | 5% return before expenses. |
10
American Beacon FundsSM
Report of Independent Registered Public Accounting Firm
To the Board of Trustees of American Beacon Funds and Shareholders of American Beacon Global Evolution Frontier Markets Income Fund and American Beacon GLG Total Return Fund
Opinions on the Financial Statements
We have audited the accompanying statements of assets and liabilities, including the schedules of investments, of American Beacon Global Evolution Frontier Markets Income Fund and American Beacon GLG Total Return Fund (two of the series constituting American Beacon Funds, referred to hereafter as the “Funds”) as of January 31, 2018, the related statements of operations for the year ended January 31, 2018, the statements of changes in net assets for each of the periods listed in the table below, including the related notes, and the financial highlights for each of the periods listed in the table below (collectively referred to as the “financial statements”). In our opinion, the financial statements present fairly, in all material respects, the financial position of each of the Funds as of January 31, 2018, the results of each of their operations for the year then ended, the changes in each of their net assets for each of the periods listed in the table below and each of the financial highlights for each of the periods listed in the table below in conformity with accounting principles generally accepted in the United States of America.
| | |
| Fund Name | | Statements of changes in net assets and financial
highlights |
American Beacon Global Evolution Frontier Markets Income Fund | | Each of the two years in the period ended January 31, 2018 |
| American Beacon GLG Total Return Fund | | Period May 20, 2016 (commencement of operations) through January 31, 2017 and the year ended January 31, 2018 |
Basis for Opinions
These financial statements are the responsibility of the Funds’ management. Our responsibility is to express an opinion on the Funds’ financial statements based on our audits. We are a public accounting firm registered with the Public Company Accounting Oversight Board (United States) (“PCAOB”) and are required to be independent with respect to the Funds in accordance with the U.S. federal securities laws and the applicable rules and regulations of the Securities and Exchange Commission and the PCAOB.
We conducted our audits of these financial statements in accordance with the standards of the PCAOB. Those standards require that we plan and perform the audit to obtain reasonable assurance about whether the financial statements are free of material misstatement, whether due to error or fraud.
Our audits included performing procedures to assess the risks of material misstatement of the financial statements, whether due to error or fraud, and performing procedures that respond to those risks. Such procedures included examining, on a test basis, evidence regarding the amounts and disclosures in the financial statements. Our audits also included evaluating the accounting principles used and significant estimates made by management, as well as evaluating the overall presentation of the financial statements. Our procedures included confirmation of securities owned as of January 31, 2018 by correspondence with the custodian, transfer agent and brokers; when replies were not received from brokers, we performed other auditing procedures. We believe that our audits provide a reasonable basis for our opinions.
With respect to the American Beacon Global Evolution Frontier Markets Income Fund, the financial statements as of and for the year ended January 31, 2016 and the financial highlights for each of the periods ended on or prior to January 31, 2016 (not presented herein, other than the financial highlights) were audited by other auditors whose report dated March 31, 2016 expressed an unqualified opinion on those financial statements and financial highlights.
PricewaterhouseCoopers LLP
Boston, MA
March 27, 2018
We have served as the auditor of one or more American Beacon investment companies since 2016.
11
American Beacon Global Evolution Frontier Markets Income FundSM
Schedule of Investments
January 31, 2018
| | | | | | | | | | | | | | | |
| | | Principal Amount* | | | | Fair Value |
| | | | | | | | | | | | | | | |
| Angola - 2.74% | | | | | | | | | | | | | | | |
| Credit-Linked Notes - 0.55% | | | | | | | | | | | | | | | |
| Republic of Angola (Issuer Aurora Australis B.V.), 8.032%, Due 12/19/2023, (6 mo. USD LIBOR + 6.250%)A B | | | $ | 1,125,000 | | | | | | | | | $ | 1,098,258 | |
| | | | | | | | | | | | | | | |
| | | | | | | | | | | | | | | |
| Foreign Sovereign Obligations - 2.19% | | | | | | | | | | | | | | | |
| Angolan Government International Bond, 9.500%, Due 11/12/2025A | | | | 3,750,000 | | | | | | | | | | 4,390,650 | |
| | | | | | | | | | | | | | | |
| | | | | | | | | | | | | | | |
Total Angola (Cost $5,023,852) | | | | | | | | | | | | | | 5,488,908 | |
| | | | | | | | | | | | | | | |
| | | | | | | | | | | | | | | |
| Argentina - 4.05% | | | | | | | | | | | | | | | |
| Foreign Sovereign Obligations - 4.05% | | | | | | | | | | | | | | | |
| Argentina Bonar Bonds, | | | | | | | | | | | | | | | |
25.730%, Due 3/1/2018, (BADLARP Index + 2.750%)B | | | ARS | 28,388,072 | | | | | | | | | | 1,449,181 | |
25.466%, Due 3/11/2019, (BADLARP Index + 2.500%)B | | | ARS | 44,841,687 | | | | | | | | | | 2,334,041 | |
24.897%, Due 4/3/2022, (BADLARP Index + 2.000%)B | | | ARS | 36,500,000 | | | | | | | | | | 1,980,448 | |
| Argentine Bonos del Tesoro, | | | | | | | | | | | | | | | |
22.750%, Due 3/5/2018 | | | ARS | 17,750,000 | | | | | | | | | | 901,310 | |
21.200%, Due 9/19/2018 | | | ARS | 12,100,000 | | | | | | | | | | 613,864 | |
16.000%, Due 10/17/2023 | | | ARS | 16,250,000 | | | | | | | | | | 830,017 | |
| | | | | | | | | | | | | | | |
Total Foreign Sovereign Obligations | | | | | | | | | | | | | | 8,108,861 | |
| | | | | | | | | | | | | | | |
| | | | | | | | | | | | | | | |
Total Argentina (Cost $9,358,880) | | | | | | | | | | | | | | 8,108,861 | |
| | | | | | | | | | | | | | | |
| | | | | | | | | | | | | | | |
| Armenia - 0.76% (Cost $1,500,000) | | | | | | | | | | | | | | | |
| Credit-Linked Notes - 0.76% | | | | | | | | | | | | | | | |
| Republic of Armenia Treasury Bonds (Issuer Frontera Capital B.V.), 10.000%, Due 5/7/2021C D | | | | 1,500,000 | | | | | | | | | | 1,519,657 | |
| | | | | | | | | | | | | | | |
| | | | | | | | | | | | | | | |
| Azerbaijan - 1.00% (Cost $2,000,000) | | | | | | | | | | | | | | | |
| Credit-Linked Notes - 1.00% | | | | | | | | | | | | | | | |
| Republic of Azerbaijan (Issuer Frontera Capital B.V.), 14.000%, Due 3/30/2020C D | | | | 2,000,000 | | | | | | | | | | 2,002,972 | |
| | | | | | | | | | | | | | | |
| | | | | | | | | | | | | | | |
| Belarus - 0.68% | | | | | | | | | | | | | | | |
| Foreign Sovereign Obligations - 0.68% | | | | | | | | | | | | | | | |
| Republic of Belarus International Bond, | | | | | | | | | | | | | | | |
6.875%, Due 2/28/2023A | | | | 510,000 | | | | | | | | | | 561,122 | |
7.625%, Due 6/29/2027A | | | | 685,000 | | | | | | | | | | 796,381 | |
| | | | | | | | | | | | | | | |
Total Foreign Sovereign Obligations | | | | | | | | | | | | | | 1,357,503 | |
| | | | | | | | | | | | | | | |
| | | | | | | | | | | | | | | |
Total Belarus (Cost $1,189,716) | | | | | | | | | | | | | | 1,357,503 | |
| | | | | | | | | | | | | | | |
| | | | | | | | | | | | | | | |
| Bosnia & Herzegovina - 0.09% (Cost $210,081) | | | | | | | | | | | | | | | |
| Foreign Sovereign Obligations - 0.09% | | | | | | | | | | | | | | | |
| Bosnia & Herzegovina Government International Bond, 0.500%, Due 12/20/2021, Series B, (6 mo. EUR LIBOR + 0.813%)A B H | | | EUR | 333,333 | | | | | | | | | | 176,155 | |
| | | | | | | | | | | | | | | |
| | | | | | | | | | | | | | | |
| Cameroon, United Republic Of - 1.89% (Cost $3,466,231) | | | | | | | | | | | | | | | |
| Foreign Sovereign Obligations - 1.89% | | | | | | | | | | | | | | | |
| Republic of Cameroon International Bond, 9.500%, Due 11/19/2025A | | | | 3,200,000 | | | | | | | | | | 3,794,112 | |
| | | | | | | | | | | | | | | |
| | | | | | | | | | | | | | | |
| Costa Rica - 2.67% | | | | | | | | | | | | | | | |
| Foreign Sovereign Obligations - 2.67% | | | | | | | | | | | | | | | |
| Costa Rica Titulos de Propiedad, | | | | | | | | | | | | | | | |
9.660%, Due 9/30/2026A | | | CRC | 2,250,000,000 | | | | | | | | | | 3,901,141 | |
10.580%, Due 9/26/2029A | | | CRC | 800,000,000 | | | | | | | | | | 1,440,777 | |
| | | | | | | | | | | | | | | |
Total Foreign Sovereign Obligations | | | | | | | | | | | | | | 5,341,918 | |
| | | | | | | | | | | | | | | |
| | | | | | | | | | | | | | | |
Total Costa Rica (Cost $5,427,877) | | | | | | | | | | | | | | 5,341,918 | |
| | | | | | | | | | | | | | | |
| | | | | | | | | | | | | | | |
See accompanying notes
12
American Beacon Global Evolution Frontier Markets Income FundSM
Schedule of Investments
January 31, 2018
| | | | | | | | | | | | | | | |
| | | Principal Amount* | | | | Fair Value |
| | | | | | | | | | | | | | | |
| Dominican Republic - 2.97% | | | | | | | | | | | | | | | |
| Foreign Sovereign Obligations - 2.97% | | | | | | | | | | | | | | | |
| Dominican Republic Bond, 10.500%, Due 4/7/2023A | | | DOP | 57,000,000 | | | | | | | | | $ | 1,301,600 | |
| Dominican Republic International Bond, 11.500%, Due 5/10/2024A | | | DOP | 200,000,000 | | | | | | | | | | 4,652,351 | |
| | | | | | | | | | | | | | | |
Total Foreign Sovereign Obligations | | | | | | | | | | | | | | 5,953,951 | |
| | | | | | | | | | | | | | | |
| | | | | | | | | | | | | | | |
Total Dominican Republic (Cost $5,901,582) | | | | | | | | | | | | | | 5,953,951 | |
| | | | | | | | | | | | | | | |
| | | | | | | | | | | | | | | |
| Ecuador - 2.95% | | | | | | | | | | | | | | | |
| Foreign Sovereign Obligations - 2.95% | | | | | | | | | | | | | | | |
| Ecuador Government International Bond, | | | | | | | | | | | | | | | |
10.500%, Due 3/24/2020A | | | $ | 1,400,000 | | | | | | | | | | 1,536,500 | |
8.750%, Due 6/2/2023A | | | | 660,000 | | | | | | | | | | 726,000 | |
9.650%, Due 12/13/2026A | | | | 1,550,000 | | | | | | | | | | 1,767,000 | |
9.625%, Due 6/2/2027A | | | | 500,000 | | | | | | | | | | 567,500 | |
8.875%, Due 10/23/2027A | | | | 1,200,000 | | | | | | | | | | 1,306,500 | |
| | | | | | | | | | | | | | | |
Total Foreign Sovereign Obligations | | | | | | | | | | | | | | 5,903,500 | |
| | | | | | | | | | | | | | | |
| | | | | | | | | | | | | | | |
Total Ecuador (Cost $5,436,293) | | | | | | | | | | | | | | 5,903,500 | |
| | | | | | | | | | | | | | | |
| | | | | | | | | | | | | | | |
| Egypt - 4.46% | | | | | | | | | | | | | | | |
| Foreign Sovereign Obligations - 4.46% | | | | | | | | | | | | | | | |
| Egypt Government Bond, 17.180%, Due 5/9/2027, Series 10YR | | | EGP | 14,500,000 | | | | | | | | | | 919,564 | |
| Egypt Treasury Bills, | | | | | | | | | | | | | | | |
18.400%, Due 11/27/2018 | | | EGP | 10,000,000 | | | | | | | | | | 497,520 | |
18.700%, Due 6/5/2018, Series 273D | | | EGP | 19,000,000 | | | | | | | | | | 1,015,732 | |
21.200%, Due 7/24/2018, Series 364D | | | EGP | 10,000,000 | | | | | | | | | | 522,651 | |
17.500%, Due 10/16/2018, Series 364D | | | EGP | 10,000,000 | | | | | | | | | | 506,065 | |
17.700%, Due 11/13/2018, Series 364D | | | EGP | 33,000,000 | | | | | | | | | | 1,651,383 | |
17.901%, Due 12/11/2018, Series 364D | | | EGP | 12,000,000 | | | | | | | | | | 593,582 | |
17.343%, Due 1/8/2019, Series 364D | | | EGP | 41,000,000 | | | | | | | | | | 2,002,383 | |
16.810%, Due 1/22/2019, Series 364D | | | EGP | 25,000,000 | | | | | | | | | | 1,215,585 | |
| | | | | | | | | | | | | | | |
Total Foreign Sovereign Obligations | | | | | | | | | | | | | | 8,924,465 | |
| | | | | | | | | | | | | | | |
| | | | | | | | | | | | | | | |
Total Egypt (Cost $8,733,165) | | | | | | | | | | | | | | 8,924,465 | |
| | | | | | | | | | | | | | | |
| | | | | | | | | | | | | | | |
| Ethiopia - 1.11% | | | | | | | | | | | | | | | |
| Foreign Sovereign Obligations - 1.11% | | | | | | | | | | | | | | | |
| Ethiopia International Bond, | | | | | | | | | | | | | | | |
6.625%, Due 12/11/2024A | | | | 1,600,000 | | | | | | | | | | 1,690,336 | |
6.625%, Due 12/11/2024A | | | | 500,000 | | | | | | | | | | 528,230 | |
| | | | | | | | | | | | | | | |
Total Foreign Sovereign Obligations | | | | | | | | | | | | | | 2,218,566 | |
| | | | | | | | | | | | | | | |
| | | | | | | | | | | | | | | |
Total Ethiopia (Cost $2,077,418) | | | | | | | | | | | | | | 2,218,566 | |
| | | | | | | | | | | | | | | |
| | | | | | | | | | | | | | | |
| Gabon - 1.04% | | | | | | | | | | | | | | | |
| Foreign Sovereign Obligations - 1.04% | | | | | | | | | | | | | | | |
| Gabon Government International Bond, | | | | | | | | | | | | | | | |
6.375%, Due 12/12/2024A | | | | 1,150,000 | | | | | | | | | | 1,161,730 | |
6.950%, Due 6/16/2025A | | | | 900,000 | | | | | | | | | | 929,178 | |
| | | | | | | | | | | | | | | |
Total Foreign Sovereign Obligations | | | | | | | | | | | | | | 2,090,908 | |
| | | | | | | | | | | | | | | |
| | | | | | | | | | | | | | | |
Total Gabon (Cost $2,011,956) | | | | | | | | | | | | | | 2,090,908 | |
| | | | | | | | | | | | | | | |
| | | | | | | | | | | | | | | |
| Gambia - 0.80% (Cost $1,599,718) | | | | | | | | | | | | | | | |
| Credit-Linked Notes - 0.80% | | | | | | | | | | | | | | | |
| Republic of Gambia (Issuer Frontera Capital B.V.), 11.180%, Due 8/9/2021C D | | | | 1,600,000 | | | | | | | | | | 1,600,755 | |
| | | | | | | | | | | | | | | |
| | | | | | | | | | | | | | | |
| Georgia - 1.58% | | | | | | | | | | | | | | | |
| Credit-Linked Notes - 1.58% | | | | | | | | | | | | | | | |
| Georgia Government (Issuer Frontera Capital B.V.), 10.000%, Due 8/4/2021A C | | | $ | 1,250,000 | | | | | | | | | | 1,231,845 | |
| Georgia Government (Issuer Zambezi B.V.), 9.500%, Due 8/9/2022D | | | | 2,000,000 | | | | | | | | | | 1,929,687 | |
| | | | | | | | | | | | | | | |
Total Credit-Linked Notes | | | | | | | | | | | | | | 3,161,532 | |
| | | | | | | | | | | | | | | |
| | | | | | | | | | | | | | | |
Total Georgia (Cost $3,250,000) | | | | | | | | | | | | | | 3,161,532 | |
| | | | | | | | | | | | | | | |
| | | | | | | | | | | | | | | |
See accompanying notes
13
American Beacon Global Evolution Frontier Markets Income FundSM
Schedule of Investments
January 31, 2018
| | | | | | | | | | | | | | | |
| | | Principal Amount* | | | | Fair Value |
| | | | | | | | | | | | | | | |
| Ghana - 4.37% | | | | | | | | | | | | | | | |
| Credit-Linked Notes - 0.14% | | | | | | | | | | | | | | | |
| Ghana Promissory Notes (Issued Saderea DAC), 12.500%, Due 11/30/2026A | | | $ | 252,874 | | | | | | | | | $ | 283,534 | |
| | | | | | | | | | | | | | | |
| | | | | | | | | | | | | | | |
| Foreign Sovereign Obligations - 4.23% | | | | | | | | | | | | | | | |
| Ghana Government Bond, | | | | | | | | | | | | | | | |
24.750%, Due 3/1/2021 | | | GHS | 3,900,000 | | | | | | | | | | 1,051,535 | |
24.750%, Due 7/19/2021 | | | GHS | 5,300,000 | | | | | | | | | | 1,455,725 | |
18.250%, Due 7/25/2022 | | | GHS | 11,225,000 | | | | | | | | | | 2,706,880 | |
19.000%, Due 11/2/2026, Series 10Y | | | GHS | 9,775,000 | | | | | | | | | | 2,534,876 | |
21.000%, Due 3/23/2020, Series 5YR | | | GHS | 1,000,000 | | | | | | | | | | 242,155 | |
18.750%, Due 1/24/2022, Series 5YR | | | GHS | 2,000,000 | | | | | | | | | | 486,806 | |
| | | | | | | | | | | | | | | |
Total Foreign Sovereign Obligations | | | | | | | | | | | | | | 8,477,977 | |
| | | | | | | | | | | | | | | |
| | | | | | | | | | | | | | | |
Total Ghana (Cost $8,273,117) | | | | | | | | | | | | | | 8,761,511 | |
| | | | | | | | | | | | | | | |
| | | | | | | | | | | | | | | |
| Iraq - 3.37% | | | | | | | | | | | | | | | |
| Foreign Sovereign Obligations - 3.37% | | | | | | | | | | | | | | | |
| Iraq International Bond, | | | | | | | | | | | | | | | |
6.752%, Due 3/9/2023A | | | | 2,580,000 | | | | | | | | | | 2,680,625 | |
5.800%, Due 1/15/2028A | | | | 3,600,000 | | | | | | | | | | 3,562,632 | |
5.800%, Due 1/15/2028A | | | | 500,000 | | | | | | | | | | 494,810 | |
| | | | | | | | | | | | | | | |
Total Foreign Sovereign Obligations | | | | | | | | | | | | | | 6,738,067 | |
| | | | | | | | | | | | | | | |
| | | | | | | | | | | | | | | |
Total Iraq (Cost $6,023,705) | | | | | | | | | | | | | | 6,738,067 | |
| | | | | | | | | | | | | | | |
| | | | | | | | | | | | | | | |
| Ivory Coast - 3.12% | | | | | | | | | | | | | | | |
| Foreign Sovereign Obligations - 3.12% | | | | | | | | | | | | | | | |
| Ivory Coast Government International Bond, | | | | | | | | | | | | | | | |
6.375%, Due 3/3/2028A | | | | 500,000 | | | | | | | | | | 530,514 | |
5.750%, Due 12/31/2032A C E | | | | 3,921,750 | | | | | | | | | | 3,889,200 | |
5.750%, Due 12/31/2032A C E | | | | 1,842,750 | | | | | | | | | | 1,827,455 | |
| | | | | | | | | | | | | | | |
Total Foreign Sovereign Obligations | | | | | | | | | | | | | | 6,247,169 | |
| | | | | | | | | | | | | | | |
| | | | | | | | | | | | | | | |
Total Ivory Coast (Cost $6,084,499) | | | | | | | | | | | | | | 6,247,169 | |
| | | | | | | | | | | | | | | |
| | | | | | | | | | | | | | | |
| Kazakhstan - 2.01% | | | | | | | | | | | | | | | |
| Credit-Linked Notes - 2.01% | | | | | | | | | | | | | | | |
| National Bank of Kazakhstan (Issuer Citigroup Global Markets Holdings, Inc.), | | | | | | | | | | | | | | | |
9.450%, Due 3/3/2018A | | | KZT | 115,000,000 | | | | | | | | | | 352,892 | |
7.750%, Due 4/2/2018A | | | KZT | 485,000,000 | | | | | | | | | | 1,481,082 | |
7.750%, Due 9/11/2018A | | | KZT | 128,806,961 | | | | | | | | | | 379,256 | |
7.900%, Due 10/15/2018 | | | KZT | 618,439,888 | | | | | | | | | | 1,820,919 | |
| | | | | | | | | | | | | | | |
Total Credit-Linked Notes | | | | | | | | | | | | | | 4,034,149 | |
| | | | | | | | | | | | | | | |
| | | | | | | | | | | | | | | |
Total Kazakhstan (Cost $3,834,404) | | | | | | | | | | | | | | 4,034,149 | |
| | | | | | | | | | | | | | | |
| | | | | | | | | | | | | | | |
| Kenya - 3.20% | | | | | | | | | | | | | | | |
| Foreign Sovereign Obligations - 3.20% | | | | | | | | | | | | | | | |
| Kenya Infrastructure Bond, | | | | | | | | | | | | | | | |
12.500%, Due 11/18/2024 | | | KES | 100,000,000 | | | | | | | | | | 1,005,847 | |
12.000%, Due 9/18/2023, Series 12YR | | | KES | 57,400,000 | | | | | | | | | | 551,699 | |
11.000%, Due 10/12/2026, Series 12YR | | | KES | 100,000,000 | | | | | | | | | | 945,730 | |
12.000%, Due 10/6/2031, Series 15YR | | | KES | 288,000,000 | | | | | | | | | | 2,818,028 | |
11.000%, Due 12/2/2024, Series 9YR | | | KES | 75,000,000 | | | | | | | | | | 712,654 | |
12.500%, Due 5/12/2025, Series 9YR | | | KES | 36,000,000 | | | | | | | | | | 363,118 | |
| | | | | | | | | | | | | | | |
Total Foreign Sovereign Obligations | | | | | | | | | | | | | | 6,397,076 | |
| | | | | | | | | | | | | | | |
| | | | | | | | | | | | | | | |
Total Kenya (Cost $6,297,519) | | | | | | | | | | | | | | 6,397,076 | |
| | | | | | | | | | | | | | | |
| | | | | | | | | | | | | | | |
| Kyrgyzstan - 1.00% (Cost $1,999,999) | | | | | | | | | | | | | | | |
| Credit-Linked Notes - 1.00% | | | | | | | | | | | | | | | |
| Kyrgyz Republic (Issuer Frontera Capital B.V.), 8.000%, Due 1/31/2020D | | | $ | 132,958,171 | | | | | | | | | | 1,999,957 | |
| | | | | | | | | | | | | | | |
See accompanying notes
14
American Beacon Global Evolution Frontier Markets Income FundSM
Schedule of Investments
January 31, 2018
| | | | | | | | | | | | | | | |
| | | Principal Amount* | | | | Fair Value |
| | | | | | | | | | | | | | | |
| Malawi - 0.77% | | | | | | | | | | | | | | | |
| Credit-Linked Notes - 0.77% | | | | | | | | | | | | | | | |
| Republic of Malawi (Issuer Zambezi B.V.), | | | | | | | | | | | | | | | |
15.100%, Due 10/19/2018D | | | $ | 450,000 | | | | | | | | | $ | 466,425 | |
12.000%, Due 10/8/2020D | | | | 1,100,000 | | | | | | | | | | 1,070,935 | |
| | | | | | | | | | | | | | | |
Total Credit-Linked Notes | | | | | | | | | | | | | | 1,537,360 | |
| | | | | | | | | | | | | | | |
| | | | | | | | | | | | | | | |
Total Malawi (Cost $1,571,406) | | | | | | | | | | | | | | 1,537,360 | |
| | | | | | | | | | | | | | | |
| | | | | | | | | | | | | | | |
| Mongolia - 2.61% | | | | | | | | | | | | | | | |
| Foreign Sovereign Obligations - 2.61% | | | | | | | | | | | | | | | |
| Mongolia Government International Bond, | | | | | | | | | | | | | | | |
8.750%, Due 3/9/2024A | | | | 600,000 | | | | | | | | | | 696,023 | |
8.750%, Due 3/9/2024A | | | | 3,900,000 | | | | | | | | | | 4,524,148 | |
| | | | | | | | | | | | | | | |
Total Foreign Sovereign Obligations | | | | | | | | | | | | | | 5,220,171 | |
| | | | | | | | | | | | | | | |
| | | | | | | | | | | | | | | |
Total Mongolia (Cost $5,036,296) | | | | | | | | | | | | | | 5,220,171 | |
| | | | | | | | | | | | | | | |
| | | | | | | | | | | | | | | |
| Mozambique - 2.42% | | | | | | | | | | | | | | | |
| Credit-Linked Notes - 1.60% | | | | | | | | | | | | | | | |
| Mozambique Government Bonds (Issuer ICBC Standard Bank PLC), | | | | | | | | | | | | | | | |
1.000%, Due 4/23/2019C | | | MZN | 30,000,000 | | | | | | | | | | 330,051 | |
27.000%, Due 2/26/2020 | | | MZN | 180,000,000 | | | | | | | | | | 2,877,099 | |
| | | | | | | | | | | | | | | |
| | | | | | | | | | | | | | | |
Total Credit-Linked Notes | | | | | | | | | | | | | | 3,207,150 | |
| | | | | | | | | | | | | | | |
| | | | | | | | | | | | | | | |
| Foreign Sovereign Obligations - 0.82% | | | | | | | | | | | | | | | |
| Mozambique International Bond, 10.500%, Due 1/18/2023A | | | | 1,900,000 | | | | | | | | | | 1,632,100 | |
| | | | | | | | | | | | | | | |
| | | | | | | | | | | | | | | |
Total Mozambique (Cost $4,842,805) | | | | | | | | | | | | | | 4,839,250 | |
| | | | | | | | | | | | | | | |
| | | | | | | | | | | | | | | |
| Netherlands - 0.31% (Cost $650,000) | | | | | | | | | | | | | | | |
| Foreign Corporate Obligations - 0.31% | | | | | | | | | | | | | | | |
| Nederlandse Financierings Maatschappij voor Ontwikkelingslanden N.V., 7.350%, Due 9/11/2020A | | | | 650,000 | | | | | | | | | | 629,210 | |
| | | | | | | | | | | | | | | |
| | | | | | | | | | | | | | | |
| Nicaragua - 2.29% | | | | | | | | | | | | | | | |
| Credit-Linked Notes - 2.16% | | | | | | | | | | | | | | | |
| Empresa Administadora de Aeropuertos Internacionales (Issuer Zambezi B.V.), 7.000%, Due 4/8/2024C D | | | | 2,000,000 | | | | | | | | | | 1,916,167 | |
| Republic of Nicaragua (Issuer Zambezi B.V.), 6.750%, Due 8/5/2022D | | | | 2,400,000 | | | | | | | | | | 2,407,489 | |
| | | | | | | | | | | | | | | |
| | | | | | | | | | | | | | | |
Total Credit-Linked Notes | | | | | | | | | | | | | | 4,323,656 | |
| | | | | | | | | | | | | | | |
| | | | | | | | | | | | | | | |
| Foreign Sovereign Obligations - 0.13% | | | | | | | | | | | | | | | |
| Nicaragua Government International Bond, 5.000%, Due 2/1/2019C E | | | $ | 275,834 | | | | | | | | | | 266,180 | |
| | | | | | | | | | | | | | | |
| | | | | | | | | | | | | | | |
Total Nicaragua (Cost $4,672,705) | | | | | | | | | | | | | | 4,589,836 | |
| | | | | | | | | | | | | | | |
| | | | | | | | | | | | | | | |
| Nigeria - 4.24% | | | | | | | | | | | | | | | |
| Foreign Sovereign Obligations - 4.24% | | | | | | | | | | | | | | | |
| Nigeria Government Bond, | | | | | | | | | | | | | | | |
16.250%, Due 4/18/2037 | | | NGN | 888,958,000 | | | | | | | | | | 2,975,177 | |
16.288%, Due 3/17/2027, Series 10YR | | | NGN | 663,000,000 | | | | | | | | | | 2,102,500 | |
| Nigeria Treasury Bills, | | | | | | | | | | | | | | | |
21.913%, Due 7/5/2018 | | | NGN | 320,000,000 | | | | | | | | | | 834,482 | |
20.359%, Due 8/2/2018 | | | NGN | 1,000,000,000 | | | | | | | | | | 2,585,042 | |
| | | | | | | | | | | | | | | |
Total Foreign Sovereign Obligations | | | | | | | | | | | | | | 8,497,201 | |
| | | | | | | | | | | | | | | |
| | | | | | | | | | | | | | | |
Total Nigeria (Cost $8,022,064) | | | | | | | | | | | | | | 8,497,201 | |
| | | | | | | | | | | | | | | |
| | | | | | | | | | | | | | | |
| Paraguay - 0.91% (Cost $2,000,475) | | | | | | | | | | | | | | | |
| Credit-Linked Notes - 0.91% | | | | | | | | | | | | | | | |
| Municipalidad De Asuncion (Issuer Zambezi B.V.), 11.000%, Due 3/23/2027D | | | | 2,000,000 | | | | | | | | | | 1,820,822 | |
| | | | | | | | | | | | | | | |
| | | | | | | | | | | | | | | |
See accompanying notes
15
American Beacon Global Evolution Frontier Markets Income FundSM
Schedule of Investments
January 31, 2018
| | | | | | | | | | | | | | | |
| | | Principal Amount* | | | | Fair Value |
| | | | | | | | | | | | | | | |
| Rwanda - 0.79% (Cost $1,494,407) | | | | | | | | | | | | | | | |
| Foreign Sovereign Obligations - 0.79% | | | | | | | | | | | | | | | |
| Rwanda International Government Bond, 6.625%, Due 5/2/2023A | | | NGN | 1,500,000 | | | | | | | | | $ | 1,575,000 | |
| | | | | | | | | | | | | | | |
| | | | | | | | | | | | | | | |
| Senegal - 0.72% (Cost $1,355,928) | | | | | | | | | | | | | | | |
| Foreign Sovereign Obligations - 0.72% | | | | | | | | | | | | | | | |
| Senegal Government International Bond, 6.250%, Due 7/30/2024A | | | | 1,350,000 | | | | | | | | | | 1,435,860 | |
| | | | | | | | | | | | | | | |
| | | | | | | | | | | | | | | |
| Sri Lanka - 4.39% | | | | | | | | | | | | | | | |
| Foreign Sovereign Obligations - 4.39% | | | | | | | | | | | | | | | |
| Sri Lanka Government Bonds, | | | | | | | | | | | | | | | |
11.500%, Due 9/1/2028 | | | LKR | 68,000,000 | | | | | | | | | | 488,114 | |
10.750%, Due 3/1/2021, Series A | | | LKR | 26,000,000 | | | | | | | | | | 175,028 | |
9.000%, Due 5/1/2021, Series A | | | LKR | 465,000,000 | | | | | | | | | | 2,985,700 | |
11.000%, Due 8/1/2021, Series A | | | LKR | 300,000,000 | | | | | | | | | | 2,043,170 | |
11.400%, Due 1/1/2024, Series A | | | LKR | 200,000,000 | | | | | | | | | | 1,393,017 | |
11.000%, Due 8/1/2024, Series A | | | LKR | 245,000,000 | | | | | | | | | | 1,695,823 | |
| | | | | | | | | | | | | | | |
Total Foreign Sovereign Obligations | | | | | | | | | | | | | | 8,780,852 | |
| | | | | | | | | | | | | | | |
| | | | | | | | | | | | | | | |
Total Sri Lanka (Cost $8,489,077) | | | | | | | | | | | | | | 8,780,852 | |
| | | | | | | | | | | | | | | |
| | | | | | | | | | | | | | | |
| Supranational - 1.49% | | | | | | | | | | | | | | | |
| Foreign Sovereign Obligations - 1.49% | | | | | | | | | | | | | | | |
| European Bank for Reconstruction & Development, | | | | | | | | | | | | | | | |
7.090%, Due 12/6/2018C | | | GEL | 2,200,000 | | | | | | | | | | 878,633 | |
6.940%, Due 12/20/2018C | | | GEL | 2,900,000 | | | | | | | | | | 1,162,883 | |
13.750%, Due 10/9/2019A | | | | 1,142,857 | | | | | | | | | | 937,257 | |
| | | | | | | | | | | | | | | |
Total Foreign Sovereign Obligations | | | | | | | | | | | | | | 2,978,773 | |
| | | | | | | | | | | | | | | |
| | | | | | | | | | | | | | | |
Total Supranational (Cost $2,920,488) | | | | | | | | | | | | | | 2,978,773 | |
| | | | | | | | | | | | | | | |
| | | | | | | | | | | | | | | |
| Suriname - 0.84% (Cost $1,617,439) | | | | | | | | | | | | | | | |
| Foreign Sovereign Obligations - 0.84% | | | | | | | | | | | | | | | |
| Republic of Suriname, 9.250%, Due 10/26/2026A | | | | 1,600,000 | | | | | | | | | | 1,688,000 | |
| | | | | | | | | | | | | | | |
| | | | | | | | | | | | | | | |
| Tajikistan - 1.57% (Cost $3,199,147) | | | | | | | | | | | | | | | |
| Foreign Sovereign Obligations - 1.57% | | | | | | | | | | | | | | | |
| Republic of Tajikistan International Bond, 7.125%, Due 9/14/2027A | | | | 3,230,000 | | | | | | | | | | 3,142,144 | |
| | | | | | | | | | | | | | | |
| | | | | | | | | | | | | | | |
| Tunisia - 0.99% (Cost $1,914,361) | | | | | | | | | | | | | | | |
| Foreign Sovereign Obligations - 0.99% | | | | | | | | | | | | | | | |
| Banque Centrale de Tunisie International Bond, 5.750%, Due 1/30/2025A | | | $ | 2,000,000 | | | | | | | | | | 1,981,200 | |
| | | | | | | | | | | | | | | |
| | | | | | | | | | | | | | | |
| Uganda - 3.25% | | | | | | | | | | | | | | | |
| Foreign Sovereign Obligations - 3.25% | | | | | | | | | | | | | | | |
| Republic of Uganda Government Bonds, | | | | | | | | | | | | | | | |
10.750%, Due 9/6/2018 | | | UGX | 1,925,000,000 | | | | | | | | | | 539,643 | |
16.500%, Due 5/13/2021 | | | UGX | 4,355,000,000 | | | | | | | | | | 1,352,130 | |
16.750%, Due 10/28/2021 | | | UGX | 6,940,000,000 | | | | | | | | | | 2,181,643 | |
14.125%, Due 7/7/2022 | | | UGX | 5,000,000,000 | | | | | | | | | | 1,440,135 | |
16.000%, Due 5/6/2027 | | | UGX | 2,500,000,000 | | | | | | | | | | 762,686 | |
16.125%, Due 3/22/2018, Series 2YR | | | UGX | 800,000,000 | | | | | | | | | | 223,210 | |
| | | | | | | | | | | | | | | |
Total Foreign Sovereign Obligations | | | | | | | | | | | | | | 6,499,447 | |
| | | | | | | | | | | | | | | |
| | | | | | | | | | | | | | | |
Total Uganda (Cost $6,253,731) | | | | | | | | | | | | | | 6,499,447 | |
| | | | | | | | | | | | | | | |
| | | | | | | | | | | | | | | |
| Ukraine - 4.60% | | | | | | | | | | | | | | | |
| Credit-Linked Notes - 3.90% | | | | | | | | | | | | | | | |
| Ukraine Government Bonds (Issuer Citigroup Global Markets Holdings, Inc.), | | | | | | | | | | | | | | | |
13.300%, Due 8/2/2019A | | | UAH | 15,150,000 | | | | | | | | | | 534,528 | |
13.460%, Due 6/12/2020A | | | UAH | 14,840,000 | | | | | | | | | | 523,248 | |
13.500%, Due 8/21/2020A | | | UAH | 37,000,000 | | | | | | | | | | 1,321,238 | |
14.160%, Due 10/14/2022A | | | UAH | 52,000,000 | | | | | | | | | | 1,829,749 | |
14.160%, Due 10/17/2022A | | | UAH | 45,000,000 | | | | | | | | | | 1,601,278 | |
| Ukraine Government Bonds (Issuer ICBC Standard Bank PLC), 14.910%, Due 10/14/2022 | | | UAH | 54,000,000 | | | | | | | | | | 2,006,149 | |
| | | | | | | | | | | | | | | |
| | | | | | | | | | | | | | | |
Total Credit-Linked Notes | | | | | | | | | | | | | | 7,816,190 | |
| | | | | | | | | | | | | | | |
| | | | | | | | | | | | | | | |
See accompanying notes
16
American Beacon Global Evolution Frontier Markets Income FundSM
Schedule of Investments
January 31, 2018
| | | | | | | | | | | | | | | |
| | | Principal Amount* | | | | Fair Value |
| | | | | | | | | | | | | | | |
| Foreign Sovereign Obligations - 0.70% | | | | | | | | | | | | | | | |
| Ukraine Government International Bond, | | | | | | | | | | | | | | | |
7.750%, Due 9/1/2023A | | | UAH | 500,000 | | | | | | | | | $ | 543,215 | |
7.750%, Due 9/1/2025A | | | | 800,000 | | | | | | | | | | 861,904 | |
| | | | | | | | | | | | | | | |
Total Foreign Sovereign Obligations | | | | | | | | | | | | | | 1,405,119 | |
| | | | | | | | | | | | | | | |
| | | | | | | | | | | | | | | |
Total Ukraine (Cost $9,662,644) | | | | | | | | | | | | | | 9,221,309 | |
| | | | | | | | | | | | | | | |
| | | | | | | | | | | | | | | |
| Uruguay - 2.79% | | | | | | | | | | | | | | | |
| Foreign Sovereign Obligations - 2.79% | | | | | | | | | | | | | | | |
| Uruguay Government International Bond, | | | | | | | | | | | | | | | |
9.875%, Due 6/20/2022A | | | UYU | 48,203,000 | | | | | | | | | | 1,760,250 | |
8.500%, Due 3/15/2028A | | | UYU | 65,802,000 | | | | | | | | | | 2,250,002 | |
| Uruguay Notas del Tesoro, 13.900%, Due 7/29/2020, Series 8 | | | UYU | 40,750,000 | | | | | | | | | | 1,579,741 | |
| | | | | | | | | | | | | | | |
Total Foreign Sovereign Obligations | | | | | | | | | | | | | | 5,589,993 | |
| | | | | | | | | | | | | | | |
| | | | | | | | | | | | | | | |
Total Uruguay (Cost $5,457,517) | | | | | | | | | | | | | | 5,589,993 | |
| | | | | | | | | | | | | | | |
| | | | | | | | | | | | | | | |
| Zambia - 4.35% | | | | | | | | | | | | | | | |
| Foreign Sovereign Obligations - 4.35% | | | | | | | | | | | | | | | |
| Zambia Government Bond, | | | | | | | | | | | | | | | |
13.000%, Due 8/29/2026 | | | ZMW | 42,500,000 | | | | | | | | | | 3,366,402 | |
11.000%, Due 9/1/2019, Series 5YR | | | ZMW | 4,800,000 | | | | | | | | | | 445,138 | |
11.000%, Due 2/16/2020, Series 5YR | | | ZMW | 500,000 | | | | | | | | | | 45,269 | |
11.000%, Due 5/26/2020, Series 5YR | | | ZMW | 23,100,000 | | | | | | | | | | 2,066,019 | |
12.000%, Due 5/23/2023, Series 7YR | | | ZMW | 6,100,000 | | | | | | | | | | 508,225 | |
12.000%, Due 11/21/2023, Series 7YR | | | ZMW | 14,900,000 | | | | | | | | | | 1,221,354 | |
| Zambia Government International Bond, 8.970%, Due 7/30/2027A | | | | 950,000 | | | | | | | | | | 1,053,769 | |
| | | | | | | | | | | | | | | |
Total Foreign Sovereign Obligations | | | | | | | | | | | | | | 8,706,176 | |
| | | | | | | | | | | | | | | |
| | | | | | | | | | | | | | | |
Total Zambia (Cost $8,561,213) | | | | | | | | | | | | | | 8,706,176 | |
| | | | | | | | | | | | | | | |
| | | |
| | | Shares | | | | |
| | | | | | | | | | | | | | | |
| SHORT-TERM INVESTMENTS - 13.91% (Cost $27,848,722) | | | | | | | | | | | | | | | |
| Investment Companies - 13.91% | | | | | | | | | | | | | | | |
| American Beacon U.S. Government Money Market Select Fund, Select Class, 1.25%F G | | | | 27,848,722 | | | | | | | | | | 27,848,722 | |
| | | | | | | | | | | | | | | |
| | | | | | | | | | | | | | | |
TOTAL INVESTMENTS - 99.03% (Cost $195,270,437) | | | | | | | | | | | | | | 198,403,018 | |
OTHER ASSETS, NET OF LIABILITIES - 0.97% | | | | | | | | | | | | | | 1,944,971 | |
| | | | | | | | | | | | | | | |
TOTAL NET ASSETS - 100.00% | | | | | | | | | | | | | $ | 200,347,989 | |
| | | | | | | | | | | | | | | |
| | | | | | | | | | | | | | | |
Percentages are stated as a percent of net assets. *In U.S. Dollars unless otherwise noted. | | | | | | | | | | | | | | | |
A Reg S - Security purchased under the Securities Act of 1933, which exempts from registration securities offered and sold outside of the United States. Such a security cannot be sold in the United States without either an effective registration statement filed pursuant to the Securities Act of 1933, or pursuant to an exemption from registration.
B Variable, floating, or adjustable rate securities with an interest rate that changes periodically. Rates are periodically reset with rates that are based on a predetermined benchmark such as a widely followed interest rate such as T-bills, LIBOR or PRIME plus a fixed spread. The interest rate disclosed reflects the rate in effect on January 31, 2018.
C Coupon rate may change based on changes of the underlying collateral or prepayments of principal. The coupon rate shown represents the rate at period end.
D Security exempt from registration under the Securities Act of 1933. These securities may be resold to qualified institutional buyers pursuant to Rule 144A. At the period end, the value of these securities amounted to $16,709,827 or 8.35% of net assets. The Fund has no right to demand registration of these securities.
E Step Up/Down - A zero coupon bond that converts to a fixed rate or variable interest rate at a designated future date. The rate disclosed represents the coupon rate at January 31, 2018. The maturity date disclosed represents the final maturity date.
F The Fund is affiliated by having the same investment advisor.
G 7-day yield.
H Value was determined using significant unobservable inputs.
BADLARP - Benchmark rate provided by the Banco Central de la Republica Argentina.
LIBOR - London Interbank Offered Rate.
PLC - Public Limited Company.
See accompanying notes
17
American Beacon Global Evolution Frontier Markets Income FundSM
Schedule of Investments
January 31, 2018
| | | | | | | | | | | | | | | | | | | | | | | | | | | | | | |
| Forward Foreign Currency Contracts Open on January 31, 2018: | |
| Currency Purchased* | | | Currency Sold* | | | Settlement
Date | | | Counter- party | | | Unrealized
Appreciation | | | Unrealized
(Depreciation) | | | Net Unrealized
Appreciation
(Depreciation) | |
| KZT | | | 515,629 | | | USD | | | 500,000 | | | | 2/12/2018 | | | | ICBC | | | $ | 15,629 | | | $ | - | | | $ | 15,629 | |
| UAH | | | 487,761 | | | USD | | | 500,000 | | | | 3/12/2018 | | | | ICBC | | | | - | | | | (12,239 | ) | | | (12,239 | ) |
| KZT | | | 1,598,196 | | | USD | | | 1,500,000 | | | | 3/14/2018 | | | | ICBC | | | | 98,196 | | | | - | | | | 98,196 | |
| KZT | | | 513,467 | | | USD | | | 500,000 | | | | 5/29/2018 | | | | ICBC | | | | 13,467 | | | | - | | | | 13,467 | |
| GEL | | | 666,880 | | | USD | | | 700,000 | | | | 8/22/2018 | | | | ICBC | | | | - | | | | (33,120 | ) | | | (33,120 | ) |
| DZD | | | 160,413 | | | USD | | | 150,000 | | | | 8/28/2018 | | | | ICBC | | | | 10,413 | | | | - | | | | 10,413 | |
| KZT | | | 1,247,071 | | | USD | | | 1,200,000 | | | | 10/26/2018 | | | | ICBC | | | | 47,071 | | | | - | | | | 47,071 | |
| | | | | | | | | | | | | | | | | | | | | | | | | | | | | | |
| | | $ | 184,776 | | | $ | (45,359 | ) | | $ | 139,417 | |
| | | | | | | | | | | | | | | | | | | | | | | | | | | | | | |
| * | All values denominated in USD. |
| | |
| Glossary: | | |
| | |
| Counterparty Abbreviations: |
| ICBC | | ICBC Standard Bank PLC |
| | |
| Currency Abbreviations: |
| ARS | | Argentine Peso |
| CRC | | Costa Rican Colon |
| DOP | | Dominican Peso |
| DZD | | Algerian Dinars |
| EGP | | Egyptian Pound |
| EUR | | Euro |
| GEL | | Georgian Lari |
| GHS | | Ghanaian Cedi |
| KES | | Kenyan Shilling |
| KZT | | Kazakhstani Tenge |
| LKR | | Sri Lankan Rupee |
| MZN | | Mozambique Metical |
| NGN | | Nigerian Naira |
| UAH | | Ukrainian Hryvnia |
| UGX | | Ugandan Shilling |
| UYU | | Uruguayan Peso |
| USD | | United States Dollar |
| ZMW | | Zambian Kwacha |
The Fund’s investments are summarized by level based on the inputs used to determine their values. As of January 31, 2018, the investments were classified as described below:
| | | | | | | | | | | | | | | | | | | | | | | | | | | | |
Global Evolution Frontier Markets Income Fund | | Level 1 | | | | | | Level 2 | | | | | | Level 3 | | | | | | Total | |
Assets | | | | | | | | | | | | | | | | | | | | | | | | | | | | |
Credit-Linked Notes | | | | | | | | | | | | | | | | | | | | | | | | | | | | |
Angola | | $ | - | | | | | | | $ | 1,098,258 | | | | | | | $ | - | | | | | | | $ | 1,098,258 | |
Armenia | | | - | | | | | | | | 1,519,657 | | | | | | | | - | | | | | | | | 1,519,657 | |
Azerbaijan | | | - | | | | | | | | 2,002,972 | | | | | | | | - | | | | | | | | 2,002,972 | |
Gambia | | | - | | | | | | | | 1,600,755 | | | | | | | | - | | | | | | | | 1,600,755 | |
Georgia | | | - | | | | | | | | 3,161,532 | | | | | | | | - | | | | | | | | 3,161,532 | |
Ghana | | | - | | | | | | | | 283,534 | | | | | | | | - | | | | | | | | 283,534 | |
Kazakhstan | | | - | | | | | | | | 4,034,149 | | | | | | | | - | | | | | | | | 4,034,149 | |
Kyrgyzstan | | | - | | | | | | | | 1,999,957 | | | | | | | | - | | | | | | | | 1,999,957 | |
Malawi | | | - | | | | | | | | 1,537,360 | | | | | | | | - | | | | | | | | 1,537,360 | |
Mozambique | | | - | | | | | | | | 3,207,150 | | | | | | | | - | | | | | | | | 3,207,150 | |
Nicaragua | | | - | | | | | | | | 4,323,656 | | | | | | | | - | | | | | | | | 4,323,656 | |
Paraguay | | | - | | | | | | | | 1,820,822 | | | | | | | | - | | | | | | | | 1,820,822 | |
Ukraine | | | - | | | | | | | | 7,816,190 | | | | | | | | - | | | | | | | | 7,816,190 | |
See accompanying notes
18
American Beacon Global Evolution Frontier Markets Income FundSM
Schedule of Investments
January 31, 2018
| | | | | | | | | | | | | | | | | | | | | | | | | | | | |
Global Evolution Frontier Markets Income Fund | | Level 1 | | | | | | Level 2 | | | | | | Level 3 | | | | | | Total | |
Assets (continued) | | | | | | | | | | | | | | | | | | | | | | | | | | | | |
Foreign Sovereign Obligations | | | | | | | | | | | | | | | | | | | | | | | | | | | | |
Angola | | $ | - | | | | | | | $ | 4,390,650 | | | | | | | $ | - | | | | | | | $ | 4,390,650 | |
Argentina | | | - | | | | | | | | 8,108,861 | | | | | | | | - | | | | | | | | 8,108,861 | |
Belarus | | | - | | | | | | | | 1,357,503 | | | | | | | | - | | | | | | | | 1,357,503 | |
Bosnia & Herzegovina | | | - | | | | | | | | - | | | | | | | | 176,155 | | | | | | | | 176,155 | |
Cameroon | | | - | | | | | | | | 3,794,112 | | | | | | | | - | | | | | | | | 3,794,112 | |
Costa Rica | | | - | | | | | | | | 5,341,918 | | | | | | | | - | | | | | | | | 5,341,918 | |
Dominican Republic | | | - | | | | | | | | 5,953,951 | | | | | | | | - | | | | | | | | 5,953,951 | |
Ecuador | | | - | | | | | | | | 5,903,500 | | | | | | | | - | | | | | | | | 5,903,500 | |
Egypt | | | - | | | | | | | | 8,924,465 | | | | | | | | - | | | | | | | | 8,924,465 | |
Ethiopia | | | - | | | | | | | | 2,218,566 | | | | | | | | - | | | | | | | | 2,218,566 | |
Gabon | | | - | | | | | | | | 2,090,908 | | | | | | | | - | | | | | | | | 2,090,908 | |
Ghana | | | - | | | | | | | | 8,477,977 | | | | | | | | - | | | | | | | | 8,477,977 | |
Iraq | | | - | | | | | | | | 6,738,067 | | | | | | | | - | | | | | | | | 6,738,067 | |
Ivory Coast | | | - | | | | | | | | 6,247,169 | | | | | | | | - | | | | | | | | 6,247,169 | |
Kenya | | | - | | | | | | | | 6,397,076 | | | | | | | | - | | | | | | | | 6,397,076 | |
Mongolia | | | - | | | | | | | | 5,220,171 | | | | | | | | - | | | | | | | | 5,220,171 | |
Mozambique | | | - | | | | | | | | 1,632,100 | | | | | | | | - | | | | | | | | 1,632,100 | |
Nicaragua | | | - | | | | | | | | 266,180 | | | | | | | | - | | | | | | | | 266,180 | |
Nigeria | | | - | | | | | | | | 8,497,201 | | | | | | | | - | | | | | | | | 8,497,201 | |
Rwanda | | | - | | | | | | | | 1,575,000 | | | | | | | | - | | | | | | | | 1,575,000 | |
Senegal | | | - | | | | | | | | 1,435,860 | | | | | | | | - | | | | | | | | 1,435,860 | |
Sri Lanka | | | - | | | | | | | | 8,780,852 | | | | | | | | - | | | | | | | | 8,780,852 | |
Supranational | | | - | | | | | | | | 2,978,773 | | | | | | | | - | | | | | | | | 2,978,773 | |
Suriname | | | - | | | | | | | | 1,688,000 | | | | | | | | - | | | | | | | | 1,688,000 | |
Tajikistan | | | - | | | | | | | | 3,142,144 | | | | | | | | - | | | | | | | | 3,142,144 | |
Tunisia | | | - | | | | | | | | 1,981,200 | | | | | | | | - | | | | | | | | 1,981,200 | |
Uganda | | | - | | | | | | | | 6,499,447 | | | | | | | | - | | | | | | | | 6,499,447 | |
Ukraine | | | - | | | | | | | | 1,405,119 | | | | | | | | - | | | | | | | | 1,405,119 | |
Uruguay | | | - | | | | | | | | 5,589,993 | | | | | | | | - | | | | | | | | 5,589,993 | |
Zambia | | | - | | | | | | | | 8,706,176 | | | | | | | | - | | | | | | | | 8,706,176 | |
Foreign Corporate Obligations | | | | | | | | | | | | | | | | | | | | | | | | | | | | |
Netherlands | | | - | | | | | | | | 629,210 | | | | | | | | - | | | | | | | | 629,210 | |
Short-Term Investments | | | 27,848,722 | | | | | | | | - | | | | | | | | - | | | | | | | | 27,848,722 | |
| | | | | | | | | | | | | | | | | | | | | | | | | | | | |
Total Investments in Securities - Assets | | $ | 27,848,722 | | | | | | | $ | 170,378,141 | | | | | | | $ | 176,155 | | | | | | | $ | 198,403,018 | |
| | | | | | | | | | | | | | | | | | | | | | | | | | | | |
| | | | | | | |
Financial Derivative Instruments - Assets | | | | | | | | | | | | | | | | | | | | | | | | | | | | |
Forward Foreign Currency Contracts | | $ | - | | | | | | | $ | 184,776 | | | | | | | $ | - | | | | | | | $ | 184,776 | |
| | | | | | | | | | | | | | | | | | | | | | | | | | | | |
Total Financial Derivative Instruments - Assets | | $ | - | | | | | | | $ | 184,776 | | | | | | | $ | - | | | | | | | $ | 184,776 | |
| | | | | | | | | | | | | | | | | | | | | | | | | | | | |
| | | | | | | |
Financial Derivative Instruments - Liabilities | | | | | | | | | | | | | | | | | | | | | | | | | | | | |
Forward Foreign Currency Contracts | | $ | - | | | | | | | $ | (45,359 | ) | | | | | | $ | - | | | | | | | $ | (45,359 | ) |
| | | | | | | | | | | | | | | | | | | | | | | | | | | | |
Total Financial Derivative Instruments - Liabilities | | $ | - | | | | | | | $ | (45,359 | ) | | | | | | $ | - | | | | | | | $ | (45,359 | ) |
| | | | | | | | | | | | | | | | | | | | | | | | | | | | |
U.S. GAAP requires all transfers between any levels to be disclosed. The end of period timing recognition has been adopted for the transfers between levels of the Fund’s assets and liabilities. During the year ended January 31, 2018, there were transfers from Level 3 to Level 2, with a fair value of $6,132,505.
See accompanying notes
19
American Beacon Global Evolution Frontier Markets Income FundSM
Schedule of Investments
January 31, 2018
The following table is a reconciliation of Level 3 assets within the Fund for which significant unobservable inputs were used to determine fair value. Transfers in or out of Level 3 represent the ending value of any security or instrument where a change in the level has occurred from the beginning to the end of the period:
| | | | | | | | | | | | | | | | | | | | | | | | | | | | | | | | | | | | | | | | |
| Security Type | | Balance as
of
1/31/2017 | | | Purchases | | | Sales | | | Accrued
Discounts
(Premiums) | | | Realized
Gain (Loss) | | | Change in
Unrealized
Appreciation
(Depreciation) | | | Transfer
into
Level 3 | | | Transfer
out of
Level 3 | | | Balance as
of
1/31/2018 | | | Change in
Unrealized
Appreciation
(Depreciation)
at Period end** | |
| Credit Linked Notes | | $ | 13,898,654 | | | $ | - | | | $ | 10,457,456 | | | $ | 134,361 | | | $ | (1,244,012 | ) | | $ | 3,534,778 | | | $ | - | | | $ | 5,866,325 | | | $ | - | | | $ | - | |
| Foreign Sovereign Obligations | | | 2,273,510 | | | | - | | | | 350,536 | | | | 9,221 | | | | (13,684 | ) | | | (1,476,176 | ) | | | - | | | | 266,180 | | | | 176,155 | | | | 37,263 | |
| | | | |
| | $ | 16,172,164 | | | $ | - | | | $ | 10,807,992 | | | $ | 143,582 | | | $ | (1,257,696 | ) | | $ | 2,058,602 | | | $ | - | | | $ | 6,132,505 | | | $ | 176,155 | | | $ | 37,263 | |
| | | | |
| ** | Change in unrealized appreciation (depreciation) attributable to Level 3 securities held at period end. This balance is included in the change in unrealized appreciation (depreciation) on the Statements of Operations. |
The credit-linked notes and foreign government obligations, classified as Level 3, were valued using single broker quotes. The principal amount of these securities, valued at $176,155, have been deemed level 3 due to limited market transparency and/or lack of corroboration to support the quoted prices.
See accompanying notes
20
American Beacon GLG Total Return FundSM
Schedule of Investments
January 31, 2018
| | | | | | | | | | | | | | | |
| | | Principal Amount | | | | Fair Value |
| | | | | | | | | | | | | | | |
| Brazil - 2.04% | | | | | | | | | | | | | | | |
| Foreign Corporate Obligations - 0.21% | | | | | | | | | | | | | | | |
| Itau Unibanco Holding S.A., 2.850%, Due 5/26/2018A | | | $ | 1,600,000 | | | | | | | | | $ | 1,600,720 | |
| | | | | | | | | | | | | | | |
| | | | | | | | | | | | | | | |
| Foreign Sovereign Obligations - 1.83% | | | | | | | | | | | | | | | |
| Banco Nacional de Desenvolvimento Economico e Social, | | | | | | | | | | | | | | | |
6.369%, Due 6/16/2018A | | | | 12,495,000 | | | | | | | | | | 12,649,938 | |
4.000%, Due 4/14/2019A | | | | 1,000,000 | | | | | | | | | | 1,012,500 | |
| | | | | | | | | | | | | | | |
Total Foreign Sovereign Obligations | | | | | | | | | | | | | | 13,662,438 | |
| | | | | | | | | | | | | | | |
| | | | | | | | | | | | | | | |
Total Brazil (Cost $15,282,348) | | | | | | | | | | | | | | 15,263,158 | |
| | | | | | | | | | | | | | | |
| | | | | | | | | | | | | | | |
| British Virgin Islands - 1.39% | | | | | | | | | | | | | | | |
| Foreign Corporate Obligations - 1.39% | | | | | | | | | | | | | | | |
| CNOOC Finance 2013 Ltd., 1.750%, Due 5/9/2018 | | | | 3,534,000 | | | | | | | | | | 3,526,992 | |
| CNPC General Capital Ltd., 2.750%, Due 5/14/2019A | | | | 4,850,000 | | | | | | | | | | 4,844,527 | |
| Sinopec Group Overseas Development 2013 Ltd., 2.500%, Due 10/17/2018A | | | | 1,500,000 | | | | | | | | | | 1,498,587 | |
| Sinopec Group Overseas Development 2014 Ltd., 2.750%, Due 4/10/2019A | | | | 250,000 | | | | | | | | | | 249,679 | |
| Sinopec Group Overseas Development 2016 Ltd., 2.125%, Due 5/3/2019A | | | | 250,000 | | | | | | | | | | 247,827 | |
| | | | | | | | | | | | | | | |
Total Foreign Corporate Obligations | | | | | | | | | | | | | | 10,367,612 | |
| | | | | | | | | | | | | | | |
| | | | | | | | | | | | | | | |
Total British Virgin Islands (Cost $10,417,868) | | | | | | | | | | | | | | 10,367,612 | |
| | | | | | | | | | | | | | | |
| | | | | | | | | | | | | | | |
| Colombia - 0.57% (Cost $4,232,853) | | | | | | | | | | | | | | | |
| Foreign Sovereign Obligations - 0.57% | | | | | | | | | | | | | | | |
| Colombia Government International Bond, 7.375%, Due 3/18/2019 | | | | 4,000,000 | | | | | | | | | | 4,210,000 | |
| | | | | | | | | | | | | | | |
| | | | | | | | | | | | | | | |
| India - 0.82% | | | | | | | | | | | | | | | |
| Foreign Corporate Obligations - 0.82% | | | | | | | | | | | | | | | |
| ICICI Bank Ltd., | | | | | | | | | | | | | | | |
4.700%, Due 2/21/2018A | | | | 1,200,000 | | | | | | | | | | 1,201,290 | |
4.800%, Due 5/22/2019A | | | | 4,339,000 | | | | | | | | | | 4,437,764 | |
| State Bank of India, 3.622%, Due 4/17/2019A | | | | 500,000 | | | | | | | | | | 504,108 | |
| | | | | | | | | | | | | | | |
Total Foreign Corporate Obligations | | | | | | | | | | | | | | 6,143,162 | |
| | | | | | | | | | | | | | | |
| | | | | | | | | | | | | | | |
Total India (Cost $6,174,365) | | | | | | | | | | | | | | 6,143,162 | |
| | | | | | | | | | | | | | | |
| | | | | | | | | | | | | | | |
| Indonesia - 0.87% | | | | | | | | | | | | | | | |
| Foreign Corporate Obligations - 0.09% | | | | | | | | | | | | | | | |
| Majapahit Holding B.V., 8.000%, Due 8/7/2019A | | | | 650,000 | | | | | | | | | | 699,270 | |
| | | | | | | | | | | | | | | |
| | | | | | | | | | | | | | | |
| Foreign Sovereign Obligations - 0.78% | | | | | | | | | | | | | | | |
| Indonesia Government International Bond, 11.625%, Due 3/4/2019A | | | | 5,300,000 | | | | | | | | | | 5,812,038 | |
| | | | | | | | | | | | | | | |
Total Indonesia (Cost $6,544,213) | | | | | | | | | | | | | | 6,511,308 | |
| | | | | | | | | | | | | | | |
| | | | | | | | | | | | | | | |
| Israel - 0.58% (Cost $4,355,329) | | | | | | | | | | | | | | | |
| Foreign Corporate Obligations - 0.58% | | | | | | | | | | | | | | | |
| Israel Electric Corp. Ltd., 5.625%, Due 6/21/2018A | | | | 4,300,000 | | | | | | | | | | 4,338,614 | |
| | | | | | | | | | | | | | | |
| | | | | | | | | | | | | | | |
| Malaysia - 0.39% (Cost $2,942,891) | | | | | | | | | | | | | | | |
| Foreign Corporate Obligations - 0.39% | | | | | | | | | | | | | | | |
| Petronas Capital Ltd., 5.250%, Due 8/12/2019A | | | | 2,810,000 | | | | | | | | | | 2,917,089 | |
| | | | | | | | | | | | | | | |
| | | | | | | | | | | | | | | |
| Mexico - 2.45% | | | | | | | | | | | | | | | |
| Foreign Corporate Obligations - 2.45% | | | | | | | | | | | | | | | |
| Petroleos Mexicanos, | | | | | | | | | | | | | | | |
5.500%, Due 2/4/2019 | | | | 8,300,000 | | | | | | | | | | 8,528,250 | |
6.000%, Due 3/5/2020 | | | | 9,200,000 | | | | | | | | | | 9,734,980 | |
| | | | | | | | | | | | | | | |
Total Foreign Corporate Obligations | | | | | | | | | | | | | | 18,263,230 | |
| | | | | | | | | | | | | | | |
| | | | | | | | | | | | | | | |
Total Mexico (Cost $18,198,108) | | | | | | | | | | | | | | 18,263,230 | |
| | | | | | | | | | | | | | | |
| | | | | | | | | | | | | | | |
See accompanying notes
21
American Beacon GLG Total Return FundSM
Schedule of Investments
January 31, 2018
| | | | | | | | | | | | | | | |
| | | Principal Amount | | | | Fair Value |
| | | | | | | | | | | | | | | |
| South Africa - 2.68% | | | | | | | | | | | | | | | |
| Foreign Sovereign Obligations - 2.68% | | | | | | | | | | | | | | | |
| Republic of South Africa Government International Bond, | | | | | | | | | | | | | | | |
6.875%, Due 5/27/2019 | | | $ | 10,750,000 | | | | | | | | | $ | 11,275,137 | |
5.500%, Due 3/9/2020 | | | | 8,300,000 | | | | | | | | | | 8,689,104 | |
| | | | | | | | | | | | | | | |
Total Foreign Sovereign Obligations | | | | | | | | | | | | | | 19,964,241 | |
| | | | | | | | | | | | | | | |
| | | | | | | | | | | | | | | |
Total South Africa (Cost $20,082,869) | | | | | | | | | | | | | | 19,964,241 | |
| | | | | | | | | | | | | | | |
| | | | | | | | | | | | | | | |
| Turkey - 4.87% | | | | | | | | | | | | | | | |
| Foreign Corporate Obligations - 0.36% | | | | | | | | | | | | | | | |
| Akbank Turk A/S, 6.500%, Due 3/9/2018A | | | | 2,650,000 | | | | | | | | | | 2,655,878 | |
| | | | | | | | | | | | | | | |
| | | | | | | | | | | | | | | |
| Foreign Sovereign Obligations - 4.51% | | | | | | | | | | | | | | | |
| Turkey Government International Bond, 6.750%, Due 4/3/2018 | | | | 33,400,000 | | | | | | | | | | 33,625,450 | |
| | | | | | | | | | | | | | | |
| | | | | | | | | | | | | | | |
Total Turkey (Cost $36,297,947) | | | | | | | | | | | | | | 36,281,328 | |
| | | | | | | | | | | | | | | |
| | | | | | | | | | | | | | | |
| | | |
| | | Shares | | | | |
| | | | | | | | | | | | | | | |
| SHORT-TERM INVESTMENTS - 81.56% | | | | | | | | | | | | | | | |
| Investment Companies - 1.87% | | | | | | | | | | | | | | | |
| American Beacon U.S. Government Money Market Select Fund, Select Class, 1.25%B C | | | | 13,961,256 | | | | | | | | | | 13,961,256 | |
| | | | | | | | | | | | | | | |
| | | | | | | | | | | | | | | |
| | | |
| | | Par Amount | | | | |
| | | | | | | | | | | | | | | |
| U.S. Treasury Obligations - 79.69% | | | | | | | | | | | | | | | |
| U.S. Treasury Bills, | | | | | | | | | | | | | | | |
1.045%, Due 2/1/2018 | | | $ | 65,700,000 | | | | | | | | | | 65,700,000 | |
1.107%, Due 3/1/2018 | | | | 212,000,000 | | | | | | | | | | 211,768,950 | |
1.127%, Due 3/29/2018 | | | | 64,000,000 | | | | | | | | | | 63,868,805 | |
1.123%, Due 4/26/2018 | | | | 70,000,000 | | | | | | | | | | 69,767,849 | |
1.403%, Due 5/3/2018 | | | | 108,000,000 | | | | | | | | | | 107,604,832 | |
1.473%, Due 5/31/2018 | | | | 50,000,000 | | | | | | | | | | 49,754,152 | |
1.500%, Due 6/14/2018 | | | | 25,800,000 | | | | | | | | | | 25,656,117 | |
| | | | | | | | | | | | | | | |
Total U.S. Treasury Obligations | | | | | | | | | | | | | | 594,120,705 | |
| | | | | | | | | | | | | | | |
| | | | | | | | | | | | | | | |
Total Short-Term Investments (Cost $608,236,232) | | | | | | | | | | | | | | 608,081,961 | |
| | | | | | | | | | | | | | | |
| | | | | | | | | | | | | | | |
TOTAL INVESTMENTS - 98.22% (Cost $732,765,023) | | | | | | | | | | | | | | 732,341,703 | |
OTHER ASSETS, NET OF LIABILITIES - 1.78% | | | | | | | | | | | | | | 13,242,579 | |
| | | | | | | | | | | | | | | |
TOTAL NET ASSETS - 100.00% | | | | | | | | | | | | | $ | 745,584,282 | |
| | | | | | | | | | | | | | | |
| | | | | | | | | | | | | | | |
| Percentages are stated as a percent of net assets. | | | | | | | | | | | | | | | |
A Reg S - Security purchased under the Securities Act of 1933, which exempts from registration securities offered and sold outside of the United States. Such a security cannot be sold in the United States without either an effective registration statement filed pursuant to the Securities Act of 1933, or pursuant to an exemption from registration.
B The Fund is affiliated by having the same investment advisor.
See accompanying notes
22
American Beacon GLG Total Return FundSM
Schedule of Investments
January 31, 2018
| | | | | | | | | | | | | | | | | | |
| OTC Swap Agreements Outstanding on January 31, 2018: |
| | | | | | | | | | | | | | | | | | | | | | | | | | | | | | |
| Credit Default Swaps on Corporate and Sovereign Securities - Buy Protection(1) | |
| Reference Entity | | Counter-
Party | | Fixed
Rate (%) | | Expiration
Date | | Implied
Credit
Spread at
1/31/2018(3)
(%) | | | Curr | | | Notional
Amount(4)
(000s) | | | Premiums
Paid
(Received) | | | Fair
Value | | | Unrealized
Appreciation
(Depreciation) | |
| Lebanese Republic | | BRC | | 1.00 | | 12/20/2019 | | | 3.9521 | | | | USD | | | | 150 | | | $ | 8,623 | | | $ | 6,232 | | | $ | (2,391 | ) |
| Lebanese Republic | | BCC | | 1.00 | | 6/20/2021 | | | 3.9521 | | | | USD | | | | 200 | | | | 22,100 | | | | 17,271 | | | | (4,829 | ) |
| Lebanese Republic | | BRC | | 1.00 | | 6/20/2021 | | | 3.9521 | | | | USD | | | | 275 | | | | 32,469 | | | | 23,747 | | | | (8,722 | ) |
| Russian Federation | | BRC | | 1.00 | | 6/20/2021 | | | 0.7254 | | | | USD | | | | 500 | | | | 21,085 | | | | (4,581 | ) | | | (25,666 | ) |
| Lebanese Republic | | BCC | | 1.00 | | 12/20/2021 | | | 3.9521 | | | | USD | | | | 15,000 | | | | 1,746,488 | | | | 1,514,399 | | | | (232,089 | ) |
| Lebanese Republic | | BRC | | 1.00 | | 12/20/2021 | | | 3.9521 | | | | USD | | | | 800 | | | | 95,165 | | | | 80,768 | | | | (14,397 | ) |
| Lebanese Republic | | BRC | | 1.00 | | 12/20/2021 | | | 3.9521 | | | | USD | | | | 3,000 | | | | 423,041 | | | | 302,880 | | | | (120,161 | ) |
| Republic Of Indonesia | | BRC | | 1.00 | | 12/20/2021 | | | 0.6500 | | | | USD | | | | 800 | | | | 15,034 | | | | (11,166 | ) | | | (26,200 | ) |
| Republic Of Indonesia | | BRC | | 1.00 | | 12/20/2021 | | | 0.6500 | | | | USD | | | | 1,000 | | | | 19,833 | | | | (13,957 | ) | | | (33,790 | ) |
| Republic Of Kazakhstan | | BRC | | 1.00 | | 12/20/2021 | | | 0.7654 | | | | USD | | | | 250 | | | | 9,193 | | | | (2,716 | ) | | | (11,909 | ) |
| Republic Of Kazakhstan | | BRC | | 1.00 | | 12/20/2021 | | | 0.7654 | | | | USD | | | | 800 | | | | 18,632 | | | | (8,690 | ) | | | (27,322 | ) |
| Republic Of Kazakhstan | | BRC | | 1.00 | | 12/20/2021 | | | 0.7654 | | | | USD | | | | 3,000 | | | | 107,235 | | | | (32,588 | ) | | | (139,823 | ) |
| Republic Of Kazakhstan | | BRC | | 1.00 | | 12/20/2021 | | | 0.7654 | | | | USD | | | | 15,000 | | | | 360,575 | | | | (162,941 | ) | | | (523,516 | ) |
| Republic Of South Africa | | BRC | | 1.00 | | 12/20/2021 | | | 1.1422 | | | | USD | | | | 1,500 | | | | 55,698 | | | | 6,074 | | | | (49,624 | ) |
| Republic Of South Africa | | BRC | | 1.00 | | 12/20/2021 | | | 1.1422 | | | | USD | | | | 2,000 | | | | 77,650 | | | | 8,099 | | | | (69,551 | ) |
| Republic Of South Africa | | BRC | | 1.00 | | 12/20/2021 | | | 1.1422 | | | | USD | | | | 6,000 | | | | 225,389 | | | | 24,297 | | | | (201,092 | ) |
| Republic Of Kazakhstan | | CBK | | 1.00 | | 12/20/2021 | | | 0.7654 | | | | USD | | | | 300 | | | | 10,188 | | | | (3,259 | ) | | | (13,447 | ) |
| Russian Federation | | CBK | | 1.00 | | 12/20/2021 | | | 0.7254 | | | | USD | | | | 3,000 | | | | 131,913 | | | | (20,117 | ) | | | (152,030 | ) |
| Russian Federation | | CBK | | 1.00 | | 12/20/2021 | | | 0.7254 | | | | USD | | | | 13,000 | | | | 358,004 | | | | (87,174 | ) | | | (445,178 | ) |
| Republic Of Colombia | | FBF | | 1.00 | | 12/20/2021 | | | 0.2400 | | | | USD | | | | 4,000 | | | | 51,974 | | | | (52,444 | ) | | | (104,418 | ) |
| Republic Of Indonesia | | HUS | | 1.00 | | 12/20/2021 | | | 0.6500 | | | | USD | | | | 1,800 | | | | 33,264 | | | | (25,123 | ) | | | (58,387 | ) |
| Republic Of Indonesia | | UAG | | 1.00 | | 12/20/2021 | | | 0.6500 | | | | USD | | | | 3,000 | | | | 44,001 | | | | (41,871 | ) | | | (85,872 | ) |
| Republic Of Turkey | | BCC | | 1.00 | | 6/20/2022 | | | 1.5175 | | | | USD | | | | 5,000 | | | | 276,747 | | | | 100,974 | | | | (175,773 | ) |
| Republic Of Turkey | | BCC | | 1.00 | | 6/20/2022 | | | 1.5175 | | | | USD | | | | 9,375 | | | | 514,148 | | | | 189,326 | | | | (324,822 | ) |
| Russian Federation | | BCC | | 1.00 | | 6/20/2022 | | | 0.7254 | | | | USD | | | | 4,500 | | | | 126,960 | | | | (7,611 | ) | | | (134,571 | ) |
| Lebanese Republic | | BRC | | 1.00 | | 6/20/2022 | | | 3.9521 | | | | USD | | | | 12,500 | | | | 1,743,994 | | | | 1,486,328 | | | | (257,666 | ) |
| Republic Of Indonesia | | BRC | | 1.00 | | 6/20/2022 | | | 0.6500 | | | | USD | | | | 5,000 | | | | 34,549 | | | | (55,876 | ) | | | (90,425 | ) |
| Russian Federation | | BRC | | 1.00 | | 6/20/2022 | | | 0.7254 | | | | USD | | | | 2,600 | | | | 45,226 | | | | (4,397 | ) | | | (49,623 | ) |
| Russian Federation | | BRC | | 1.00 | | 6/20/2022 | | | 0.7254 | | | | USD | | | | 4,300 | | | | 122,592 | | | | (7,272 | ) | | | (129,864 | ) |
| Republic Of South Africa | | CBK | | 1.00 | | 6/20/2022 | | | 1.1422 | | | | USD | | | | 2,500 | | | | 112,081 | | | | 30,090 | | | | (81,991 | ) |
| Republic Of South Africa | | CBK | | 1.00 | | 6/20/2022 | | | 1.1422 | | | | USD | | | | 4,000 | | | | 160,901 | | | | 48,143 | | | | (112,758 | ) |
| Republic Of South Africa | | CBK | | 1.00 | | 6/20/2022 | | | 1.1422 | | | | USD | | | | 5,500 | | | | 214,479 | | | | 66,197 | | | | (148,282 | ) |
| Republic Of Turkey | | CBK | | 1.00 | | 6/20/2022 | | | 1.5175 | | | | USD | | | | 4,000 | | | | 152,034 | | | | 80,779 | | | | (71,255 | ) |
| Republic Of Indonesia | | HUS | | 1.00 | | 6/20/2022 | | | 0.6500 | | | | USD | | | | 3,000 | | | | 36,034 | | | | (33,526 | ) | | | (69,560 | ) |
| Lebanese Republic | | BOA | | 1.00 | | 12/20/2022 | | | 3.9521 | | | | USD | | | | 3,000 | | | | 452,784 | | | | 408,000 | | | | (44,784 | ) |
| Lebanese Republic | | BOA | | 1.00 | | 12/20/2022 | | | 3.9521 | | | | USD | | | | 5,000 | | | | 764,118 | | | | 679,999 | | | | (84,119 | ) |
| Republic Of South Africa | | BOA | | 1.00 | | 12/20/2022 | | | 1.1422 | | | | USD | | | | 4,300 | | | | 182,115 | | | | 85,152 | | | | (96,963 | ) |
| Argentine Republic | | BRC | | 5.00 | | 12/20/2022 | | | 2.3400 | | | | USD | | | | 2,500 | | | | (285,843 | ) | | | (287,965 | ) | | | (2,122 | ) |
| Argentine Republic | | BRC | | 5.00 | | 12/20/2022 | | | 2.3400 | | | | USD | | | | 3,000 | | | | (340,331 | ) | | | (345,558 | ) | | | (5,227 | ) |
| Argentine Republic | | BRC | | 5.00 | | 12/20/2022 | | | 2.3400 | | | | USD | | | | 11,000 | | | | (1,225,545 | ) | | | (1,267,046 | ) | | | (41,501 | ) |
| Argentine Republic | | BRC | | 5.00 | | 12/20/2022 | | | 2.3400 | | | | USD | | | | 13,000 | | | | (1,454,493 | ) | | | (1,497,418 | ) | | | (42,925 | ) |
| Argentine Republic | | BRC | | 5.00 | | 12/20/2022 | | | 2.3400 | | | | USD | | | | 17,000 | | | | (1,809,362 | ) | | | (1,958,162 | ) | | | (148,800 | ) |
| Kingdom Of Saudi Arabia | | BRC | | 1.00 | | 12/20/2022 | | | 0.7900 | | | | USD | | | | 11,000 | | | | (25,269 | ) | | | (115,442 | ) | | | (90,173 | ) |
| Republic Of Indonesia | | BRC | | 1.00 | | 12/20/2022 | | | 0.6500 | | | | USD | | | | 2,000 | | | | (5,432 | ) | | | (16,909 | ) | | | (11,477 | ) |
| Republic Of Indonesia | | BRC | | 1.00 | | 12/20/2022 | | | 0.6500 | | | | USD | | | | 4,500 | | | | (33,471 | ) | | | (33,471 | ) | | | - | |
| Republic Of Indonesia | | BRC | | 1.00 | | 12/20/2022 | | | 0.6500 | | | | USD | | | | 4,900 | | | | (2,213 | ) | | | (41,426 | ) | | | (39,213 | ) |
| Republic Of Korea | | BRC | | 1.00 | | 12/20/2022 | | | 0.5009 | | | | USD | | | | 3,100 | | | | (33,823 | ) | | | (72,487 | ) | | | (38,664 | ) |
| Republic Of Korea | | BRC | | 1.00 | | 12/20/2022 | | | 0.5009 | | | | USD | | | | 7,800 | | | | (85,102 | ) | | | (182,386 | ) | | | (97,284 | ) |
| Republic Of South Africa | | BRC | | 1.00 | | 12/20/2022 | | | 1.1422 | | | | USD | | | | 3,000 | | | | 112,839 | | | | 59,409 | | | | (53,430 | ) |
| Republic Of South Africa | | BRC | | 1.00 | | 12/20/2022 | | | 1.1422 | | | | USD | | | | 8,600 | | | | 358,715 | | | | 170,304 | | | | (188,411 | ) |
| Republic Of Turkey | | BRC | | 1.00 | | 12/20/2022 | | | 1.5175 | | | | USD | | | | 1,500 | | | | 54,770 | | | | 43,173 | | | | (11,597 | ) |
| Republic Of Turkey | | BRC | | 1.00 | | 12/20/2022 | | | 1.5175 | | | | USD | | | | 3,000 | | | | 113,483 | | | | 86,346 | | | | (27,137 | ) |
| Republic Of Turkey | | BRC | | 1.00 | | 12/20/2022 | | | 1.5175 | | | | USD | | | | 8,600 | | | | 448,100 | | | | 247,526 | | | | (200,574 | ) |
| Argentine Republic | | CBK | | 5.00 | | 12/20/2022 | | | 2.3400 | | | | USD | | | | 7,000 | | | | (768,372 | ) | | | (806,302 | ) | | | (37,930 | ) |
| Argentine Republic | | CBK | | 5.00 | | 12/20/2022 | | | 2.3400 | | | | USD | | | | 8,000 | | | | (898,870 | ) | | | (921,488 | ) | | | (22,618 | ) |
See accompanying notes
23
American Beacon GLG Total Return FundSM
Schedule of Investments
January 31, 2018
| | | | | | | | | | | | | | | | | | | | | | | | | | | | | | |
| Reference Entity | | Counter-
Party | | Fixed
Rate (%) | | Expiration
Date | | Implied
Credit
Spread at
1/31/2018(3)
(%) | | | Curr | | | Notional
Amount(4)
(000s) | | | Premiums
Paid
(Received) | | | Fair
Value | | | Unrealized
Appreciation
(Depreciation) | |
| Kingdom Of Saudi Arabia | | CBK | | 1.00 | | 12/20/2022 | | | 0.7900 | | | | USD | | | | 2,000 | | | $ | (15,567 | ) | | $ | (20,989 | ) | | $ | (5,422 | ) |
| Republic Of Indonesia | | CBK | | 1.00 | | 12/20/2022 | | | 0.6500 | | | | USD | | | | 3,500 | | | | (11,077 | ) | | | (29,590 | ) | | | (18,513 | ) |
| Republic Of Indonesia | | CBK | | 1.00 | | 12/20/2022 | | | 0.6500 | | | | USD | | | | 4,500 | | | | 1 | | | | (38,044 | ) | | | (38,045 | ) |
| Republic Of South Africa | | CBK | | 1.00 | | 12/20/2022 | | | 1.1422 | | | | USD | | | | 8,600 | | | | 364,229 | | | | 170,304 | | | | (193,925 | ) |
| Republic Of South Africa | | CBK | | 1.00 | | 12/20/2022 | | | 1.1422 | | | | USD | | | | 8,600 | | | | 362,392 | | | | 170,304 | | | | (192,088 | ) |
| Republic Of South Africa | | CBK | | 1.00 | | 12/20/2022 | | | 1.1422 | | | | USD | | | | 13,000 | | | | 525,342 | | | | 257,437 | | | | (267,905 | ) |
| Republic Of Turkey | | CBK | | 1.00 | | 12/20/2022 | | | 1.5175 | | | | USD | | | | 8,600 | | | | 458,945 | | | | 247,526 | | | | (211,419 | ) |
| Russian Federation | | CBK | | 1.00 | | 12/20/2022 | | | 0.7254 | | | | USD | | | | 3,000 | | | | 39,894 | | | | 9,628 | | | | (30,266 | ) |
| Lebanese Republic | | DUB | | 1.00 | | 12/20/2022 | | | 3.9521 | | | | USD | | | | 700 | | | | 121,632 | | | | 95,200 | | | | (26,432 | ) |
| Lebanese Republic | | DUB | | 1.00 | | 12/20/2022 | | | 3.9521 | | | | USD | | | | 1,100 | | | | 190,938 | | | | 149,600 | | | | (41,338 | ) |
| Lebanese Republic | | DUB | | 1.00 | | 12/20/2022 | | | 3.9521 | | | | USD | | | | 1,600 | | | | 272,776 | | | | 217,600 | | | | (55,176 | ) |
| Argentine Republic | | HUS | | 5.00 | | 12/20/2022 | | | 2.3400 | | | | USD | | | | 3,500 | | | | (387,492 | ) | | | (403,151 | ) | | | (15,659 | ) |
| Argentine Republic | | HUS | | 5.00 | | 12/20/2022 | | | 2.3400 | | | | USD | | | | 8,200 | | | | (907,458 | ) | | | (944,525 | ) | | | (37,067 | ) |
| Republic Of Indonesia | | HUS | | 1.00 | | 12/20/2022 | | | 0.6500 | | | | USD | | | | 4,000 | | | | (903 | ) | | | (33,817 | ) | | | (32,914 | ) |
| Republic Of Indonesia | | HUS | | 1.00 | | 12/20/2022 | | | 0.6500 | | | | USD | | | | 4,500 | | | | 1 | | | | (38,044 | ) | | | (38,045 | ) |
| Republic Of Indonesia | | HUS | | 1.00 | | 12/20/2022 | | | 0.6500 | | | | USD | | | | 6,100 | | | | (2,755 | ) | | | (51,571 | ) | | | (48,816 | ) |
| Republic Of Indonesia | | HUS | | 1.00 | | 12/20/2022 | | | 0.6500 | | | | USD | | | | 8,500 | | | | - | | | | (71,862 | ) | | | (71,862 | ) |
| Republic Of Indonesia | | UAG | | 1.00 | | 12/20/2022 | | | 0.6500 | | | | USD | | | | 5,500 | | | | (2,484 | ) | | | (46,499 | ) | | | (44,015 | ) |
| Republic Of Indonesia | | UAG | | 1.00 | | 12/20/2022 | | | 0.6500 | | | | USD | | | | 5,500 | | | | (3,106 | ) | | | (46,499 | ) | | | (43,393 | ) |
| | | | | | | | | | | | | | | | | | | | | | | | | | | | | | |
| | | | | | | | | | | | | | | | | | | | $ | 3,931,405 | | | $ | (2,762,848 | ) | | $ | (6,694,253 | ) |
| | | | | | | | | | | | | | | | | | | | | | | | | | | | | | |
| | | | | | | | | | | | | | | | | | | | | | | | | | | | | | |
| Credit Default Swaps on Corporate and Sovereign Securities - Sell Protection(2) | |
| Reference Entity | | Counter-
Party | | Fixed
Rate (%) | | Expiration
Date | | Implied Credit
Spread at
1/31/2018(3)
(%) | | | Curr | | | Notional
Amount(4)
(000s) | | | Premiums
Paid
(Received) | | | Fair
Value | | | Unrealized
Appreciation
(Depreciation) | |
| Republic Of Philippines | | BCC | | 1.00 | | 12/20/2019 | | | 0.2300 | | | | USD | | | | 3,000 | | | $ | 20,539 | | | | $ 42,363 | | | $ | 21,824 | |
| Republic Of Philippines | | BRC | | 1.00 | | 12/20/2019 | | | 0.2300 | | | | USD | | | | 500 | | | | 2,582 | | | | 7,060 | | | | 4,478 | |
| Republic Of Colombia | | HUS | | 1.00 | | 12/20/2021 | | | 0.2400 | | | | USD | | | | 7,000 | | | | 29,713 | | | | 87,011 | | | | 57,298 | |
| | | | | | | | | | | | | | | | | | | | | | | | | | | | | | |
| | | | | | | | | | | | | | | | | | | | $ | 52,834 | | | | $ 136,434 | | | $ | 83,600 | |
| | | | | | | | | | | | | | | | | | | | | | | | | | | | | | |
| | | | | | | | | | | | | | | | | | | | | | | | | | | | | | |
| Interest Rate Swaps | |
Pay/Receive
Floating Rate | | Floating Rate
Index | | Counter-
Party | | Fixed
Rate (%) | | | Expiration
Date | | | Curr | | Notional
Amount(4)
(000s) | | | Premiums
Paid
(Received) | | | Fair
Value | | | Unrealized
Appreciation
(Depreciation) | |
| Pay | | 1-Day BRL-CDI | | BOA | | | 9.10 | | | | 1/4/2021 | | | BRL | | | 70,000 | | | $ | - | | | | $ (256,366 | ) | | $ | (256,366 | ) |
| Pay | | 1-Day BRL-CDI | | HUS | | | 8.75 | | | | 1/4/2021 | | | BRL | | | 24,500 | | | | - | | | | (31,740 | ) | | | (31,740 | ) |
| Pay | | 1-Day BRL-CDI | | HUS | | | 9.30 | | | | 1/4/2021 | | | BRL | | | 24,800 | | | | - | | | | (183,915 | ) | | | (183,915 | ) |
| Pay | | 1-Day BRL-CDI | | HUS | | | 9.12 | | | | 1/4/2021 | | | BRL | | | 30,100 | | | | - | | | | (104,956 | ) | | | (104,956 | ) |
| Pay | | 1-Day BRL-CDI | | UAG | | | 9.17 | | | | 1/4/2021 | | | BRL | | | 191,800 | | | | - | | | | (864,246 | ) | | | (864,246 | ) |
| Receive | | 1-Day BRL-CDI | | UAG | | | 10.36 | | | | 1/4/2021 | | | BRL | | | 76,400 | | | | - | | | | (1,016,476 | ) | | | (1,016,476 | ) |
| Receive | | 1-Day BRL-CDI | | UAG | | | 9.84 | | | | 1/4/2021 | | | BRL | | | 41,000 | | | | - | | | | (771,820 | ) | | | (771,820 | ) |
| Receive | | 1-Day BRL-CDI | | UAG | | | 10.26 | | | | 1/4/2021 | | | BRL | | | 80,900 | | | | - | | | | (1,019,231 | ) | | | (1,019,231 | ) |
| Receive | | 1-Day BRL-CDI | | UAG | | | 9.53 | | | | 1/4/2021 | | | BRL | | | 187,700 | | | $ | - | | | | $ (1,346,634 | ) | | $ | (1,346,634 | ) |
| | | | | | | | | | | | | | | | | | | | | | | | | | | | | | |
| | | | | | | | | | | | | | | | | | | | $ | - | | | | $ (5,595,384 | ) | | $ | (5,595,384 | ) |
| | | | | | | | | | | | | | | | | | | | | | | | | | | | | | |
| (1) | If the Fund is a buyer of protection and a credit event occurs, as defined under the terms of that particular swap agreement, the Fund will either (i) receive from the seller of protection an amount equal to the notional amount of the swap and deliver the referenced obligation or underlying securities comprising the referenced index or (ii) receive a net settlement amount in the form of cash or securities equal to the notional amount of the swap less the recovery value of the referenced obligation or underlying securities comprising the referenced index. |
| (2) | If the Fund is a seller of protection and a credit event occurs, as defined under the terms of that particular swap agreement, the Fund will either (i) pay to the buyer of protection an amount equal to the notional amount of the swap and take delivery of the referenced obligation or underlying securities comprising the referenced index or (ii) pay a net settlement amount in the form of cash or securities equal to the notional amount of the swap less the recovery value of the referenced obligation or underlying securities comprising the referenced index. |
See accompanying notes
24
American Beacon GLG Total Return FundSM
Schedule of Investments
January 31, 2018
| (3) | Implied credit spreads, represented in absolute terms, utilized in determining the fair value of credit default swaps agreements on corporate issues and sovereign issues of an emerging country as of period end serve as an indicator of the current status of the payment/performance risk and represent the likelihood or risk of default for the credit derivative. The implied credit spread of a particular referenced entity reflects the cost of buying/selling protection and may include upfront payments required to be made to enter into the agreement. Wider credit spreads represent a deterioration of the referenced entity’s credit soundness and a greater likelihood or risk of default or other credit event occurring as defined under the terms of the agreement. |
| (4) | The maximum potential amount the Fund could be required to pay as a seller of credit protection or receive as a buyer of credit protection if a credit event occurs as defined under the terms of that particular swap agreement. |
| | | | | | | | | | | | | | | | | | | | | | | | | | | | | | |
| Forward Foreign Currency Contracts Open on January 31, 2018: | |
| Currency Purchased* | | | Currency Sold* | | | Settlement
Date | | | Counter-
party | | | Unrealized
Appreciation | | | Unrealized
(Depreciation) | | | Net Unrealized
Appreciation
(Depreciation) | |
| BRL | | | 14,700,039 | | | USD | | | 14,468,435 | | | | 2/2/2018 | | | | HUS | | | $ | 231,604 | | | $ | - | | | $ | 231,604 | |
| BRL | | | 14,700,039 | | | USD | | | 14,466,200 | | | | 2/2/2018 | | | | HUS | | | | 233,839 | | | | - | | | | 233,839 | |
| BRL | | | 14,700,039 | | | USD | | | 14,468,435 | | | | 2/2/2018 | | | | HUS | | | | 231,604 | | | | - | | | | 231,604 | |
| BRL | | | 14,700,039 | | | USD | | | 14,466,201 | | | | 2/2/2018 | | | | HUS | | | | 233,838 | | | | - | | | | 233,838 | |
| BRL | | | 14,700,039 | | | USD | | | 14,475,143 | | | | 2/2/2018 | | | | HUS | | | | 224,896 | | | | - | | | | 224,896 | |
| USD | | | 30,332,156 | | | BRL | | | 30,817,699 | | | | 2/2/2018 | | | | HUS | | | | - | | | | (485,543 | ) | | | (485,543 | ) |
| USD | | | 30,332,156 | | | BRL | | | 30,817,699 | | | | 2/2/2018 | | | | HUS | | | | - | | | | (485,543 | ) | | | (485,543 | ) |
| USD | | | 7,220,000 | | | BRL | | | 7,505,537 | | | | 2/2/2018 | | | | HUS | | | | - | | | | (285,537 | ) | | | (285,537 | ) |
| USD | | | 2,600,000 | | | BRL | | | 2,698,744 | | | | 2/2/2018 | | | | HUS | | | | - | | | | (98,744 | ) | | | (98,744 | ) |
| USD | | | 1,600,000 | | | BRL | | | 1,660,515 | | | | 2/2/2018 | | | | HUS | | | | - | | | | (60,515 | ) | | | (60,515 | ) |
| ZAR | | | 5,621,194 | | | USD | | | 4,523,000 | | | | 3/8/2018 | | | | HUS | | | | 1,098,194 | | | | - | | | | 1,098,194 | |
| ZAR | | | 5,848,289 | | | USD | | | 4,697,000 | | | | 3/8/2018 | | | | HUS | | | | 1,151,289 | | | | - | | | | 1,151,289 | |
| USD | | | 9,416,313 | | | ZAR | | | 11,448,522 | | | | 3/8/2018 | | | | HUS | | | | - | | | | (2,032,209 | ) | | | (2,032,209 | ) |
| USD | | | 5,707,000 | | | ZAR | | | 6,400,467 | | | | 3/8/2018 | | | | HUS | | | | - | | | | (693,467 | ) | | | (693,467 | ) |
| USD | | | 5,035,999 | | | ZAR | | | 5,649,455 | | | | 3/8/2018 | | | | HUS | | | | - | | | | (613,456 | ) | | | (613,456 | ) |
| USD | | | 4,029,000 | | | ZAR | | | 4,518,266 | | | | 3/8/2018 | | | | HUS | | | | - | | | | (489,266 | ) | | | (489,266 | ) |
| USD | | | 37,920,705 | | | EUR | | | 39,039,392 | | | | 4/4/2018 | | | | HUS | | | | - | | | | (1,118,687 | ) | | | (1,118,687 | ) |
| USD | | | 3,926,040 | | | IDR | | | 4,075,669 | | | | 4/30/2018 | | | | HUS | | | | - | | | | (149,629 | ) | | | (149,629 | ) |
| USD | | | 3,926,040 | | | IDR | | | 4,073,629 | | | | 4/30/2018 | | | | HUS | | | | - | | | | (147,589 | ) | | | (147,589 | ) |
| USD | | | 3,926,030 | | | IDR | | | 4,070,705 | | | | 4/30/2018 | | | | HUS | | | | - | | | | (144,675 | ) | | | (144,675 | ) |
| USD | | | 3,926,020 | | | IDR | | | 4,070,694 | | | | 4/30/2018 | | | | HUS | | | | - | | | | (144,674 | ) | | | (144,674 | ) |
| USD | | | 3,926,020 | | | IDR | | | 4,050,297 | | | | 4/30/2018 | | | | HUS | | | | - | | | | (124,277 | ) | | | (124,277 | ) |
| USD | | | 3,926,010 | | | IDR | | | 4,050,287 | | | | 4/30/2018 | | | | HUS | | | | - | | | | (124,277 | ) | | | (124,277 | ) |
| USD | | | 3,926,010 | | | IDR | | | 4,049,413 | | | | 4/30/2018 | | | | HUS | | | | - | | | | (123,403 | ) | | | (123,403 | ) |
| USD | | | 3,926,010 | | | IDR | | | 4,048,247 | | | | 4/30/2018 | | | | HUS | | | | - | | | | (122,237 | ) | | | (122,237 | ) |
| USD | | | 3,610,000 | | | IDR | | | 3,714,092 | | | | 4/30/2018 | | | | HUS | | | | - | | | | (104,092 | ) | | | (104,092 | ) |
| USD | | | 750,000 | | | IDR | | | 763,721 | | | | 4/30/2018 | | | | HUS | | | | - | | | | (13,721 | ) | | | (13,721 | ) |
| USD | | | 479,778 | | | IDR | | | 494,965 | | | | 4/30/2018 | | | | HUS | | | | - | | | | (15,187 | ) | | | (15,187 | ) |
| USD | | | 14,336,453 | | | BRL | | | 14,556,280 | | | | 5/3/2018 | | | | HUS | | | | - | | | | (219,827 | ) | | | (219,827 | ) |
| USD | | | 14,330,750 | | | BRL | | | 14,556,280 | | | | 5/3/2018 | | | | HUS | | | | - | | | | (225,530 | ) | | | (225,530 | ) |
| USD | | | 14,330,312 | | | BRL | | | 14,556,280 | | | | 5/3/2018 | | | | HUS | | | | - | | | | (225,968 | ) | | | (225,968 | ) |
| USD | | | 14,328,558 | | | BRL | | | 14,556,280 | | | | 5/3/2018 | | | | HUS | | | | - | | | | (227,722 | ) | | | (227,722 | ) |
| USD | | | 14,326,805 | | | BRL | | | 14,556,280 | | | | 5/3/2018 | | | | HUS | | | | - | | | | (229,475 | ) | | | (229,475 | ) |
| USD | | | 2,200,000 | | | BRL | | | 2,196,605 | | | | 5/3/2018 | | | | HUS | | | | 3,395 | | | | - | | | | 3,395 | |
| | | | | | | | | | | | | | | | | | | | | | | | | | | | | | |
| | | $ | 3,408,659 | | | $ | (8,705,250 | ) | | $ | (5,296,591 | ) |
| | | | | | | | | | | | | | | | | | | | | | | | | | | | | | |
| * | All values denominated in USD. |
See accompanying notes
25
American Beacon GLG Total Return FundSM
Schedule of Investments
January 31, 2018
| | |
| Glossary: | | |
| | |
| Counterparty Abbreviations: |
| BCC | | Barclays Capital, Inc. |
| BOA | | Bank of America, N.A. |
| BRC | | Barclays Bank PLC |
| CBK | | Citibank, N.A. |
| DUB | | Deutsche Bank AG |
| FBF | | Credit Suisse International |
| HUS | | HSBC Bank (USA) |
| UAG | | UBS AG |
| | |
| Currency Abbreviations: |
| BRL | | Brazilian Real |
| EUR | | Euro |
| IDR | | Indonesian Rupiah |
| USD | | United States Dollar |
| ZAR | | South African Rand |
| | |
| Exchange Abbreviations: |
| OTC | | Over-the-Counter |
| | |
| Other Abbreviations: |
| CDI | | Chess Depository Interest |
The Fund’s investments are summarized by level based on the inputs used to determine their values. As of January 31, 2018, the investments were classified as described below:
| | | | | | | | | | | | | | | | | | | | | | | | | | | | |
GLG Total Return Fund | | Level 1 | | | | | | Level 2 | | | | | | Level 3 | | | | | | Total | |
Assets | | | | | | | | | | | | | | | | | | | | | | | | | | | | |
Foreign Corporate Obligations | | | | | | | | | | | | | | | | | | | | | | | | | | | | |
Brazil | | $ | - | | | | | | | $ | 1,600,720 | | | | | | | $ | - | | | | | | | $ | 1,600,720 | |
British Virgin Islands | | | - | | | | | | | | 10,367,612 | | | | | | | | - | | | | | | | | 10,367,612 | |
India | | | - | | | | | | | | 6,143,162 | | | | | | | | - | | | | | | | | 6,143,162 | |
Indonesia | | | - | | | | | | | | 699,270 | | | | | | | | - | | | | | | | | 699,270 | |
Israel | | | - | | | | | | | | 4,338,614 | | | | | | | | - | | | | | | | | 4,338,614 | |
Malaysia | | | - | | | | | | | | 2,917,089 | | | | | | | | - | | | | | | | | 2,917,089 | |
Mexico | | | - | | | | | | | | 18,263,230 | | | | | | | | - | | | | | | | | 18,263,230 | |
Turkey | | | - | | | | | | | | 2,655,878 | | | | | | | | - | | | | | | | | 2,655,878 | |
Foreign Sovereign Obligations | |
Brazil | | | - | | | | | | | | 13,662,438 | | | | | | | | - | | | | | | | | 13,662,438 | |
Colombia | | | - | | | | | | | | 4,210,000 | | | | | | | | - | | | | | | | | 4,210,000 | |
Indonesia | | | - | | | | | | | | 5,812,038 | | | | | | | | - | | | | | | | | 5,812,038 | |
South Africa | | | - | | | | | | | | 19,964,241 | | | | | | | | - | | | | | | | | 19,964,241 | |
Turkey | | | - | | | | | | | | 33,625,450 | | | | | | | | - | | | | | | | | 33,625,450 | |
Short-Term Investments | |
Investment Companies | | | 13,961,256 | | | | | | | | - | | | | | | | | - | | | | | | | | 13,961,256 | |
U.S. Treasury Obligations | | | - | | | | | | | | 594,120,705 | | | | | | | | - | | | | | | | | 594,120,705 | |
| | | | | | | | | | | | | | | | | | | | | | | | | | | | |
Total Investments in Securities - Assets | | $ | 13,961,256 | | | | | | | $ | 718,380,447 | | | | | | | $ | - | | | | | | | $ | 732,341,703 | |
| | | | | | | | | | | | | | | | | | | | | | | | | | | | |
Financial Derivative Instruments - Assets | | | | | | | | | | | | | | | | | | | | | | | | | | | | |
Swap Contract Agreements | | $ | - | | | | | | | $ | 83,600 | | | | | | | $ | - | | | | | | | $ | 83,600 | |
Forward Foreign Currency Contracts | | | - | | | | | | | | 3,408,659 | | | | | | | | - | | | | | | | | 3,408,659 | |
| | | | | | | | | | | | | | | | | | | | | | | | | | | | |
Total Financial Derivative Instruments - Assets | | $ | - | | | | | | | $ | 3,492,259 | | | | | | | $ | - | | | | | | | $ | 3,492,259 | |
| | | | | | | | | | | | | | | | | | | | | | | | | | | | |
Financial Derivative Instruments - Liabilities | | | | | | | | | | | | | | | | | | | | | | | | | | | | |
Swap Contract Agreements | | $ | - | | | | | | | $ | (12,289,637 | ) | | | | | | $ | - | | | | | | | $ | (12,289,637 | ) |
Forward Foreign Currency Contracts | | | - | | | | | | | | (8,705,250 | ) | | | | | | | - | | | | | | | | (8,705,250 | ) |
| | | | | | | | | | | | | | | | | | | | | | | | | | | | |
Total Financial Derivative Instruments - Liabilities | | $ | - | | | | | | | $ | (20,994,887 | ) | | | | | | $ | - | | | | | | | $ | (20,994,887 | ) |
| | | | | | | | | | | | | | | | | | | | | | | | | | | | |
See accompanying notes
26
American Beacon GLG Total Return FundSM
Schedule of Investments
January 31, 2018
U.S. GAAP requires all transfers between any levels to be disclosed. The end of period timing recognition has been adopted for the transfers between levels of the Fund’s assets and liabilities. During the year ended January 31, 2018, there were no transfers between levels.
See accompanying notes
27
American Beacon FundsSM
Statements of Assets and Liabilities
January 31, 2018
| | | | | | | | | | | | |
| | | Global Evolution
Frontier Markets
Income Fund | | | | | | GLG Total
Return Fund | |
Assets: | |
Investments in unaffiliated securities, at fair value† | | $ | 170,554,296 | | | | | | | $ | 718,380,447 | |
Investments in affiliated securities, at fair value‡ | | | 27,848,722 | | | | | | | | 13,961,256 | |
Foreign currency, at fair value^ | | | 1,434,349 | | | | | | | | 309 | |
Cash | | | 5,681 | | | | | | | | – | |
Swap premium paid | | | – | | | | | | | | 12,283,207 | |
Swap income receivable | | | – | | | | | | | | 12,528 | |
Cash collateral held at custodian for the benefit of the broker | | | – | | | | | | | | 22,965,000 | |
Dividends and interest receivable | | | 4,330,873 | | | | | | | | 2,376,156 | |
Receivable for investments sold | | | – | | | | | | | | 4,805,250 | |
Receivable for fund shares sold | | | 3,157,464 | | | | | | | | 3,222,307 | |
Receivable for expense reimbursement (Note 2) | | | – | | | | | | | | 203,872 | |
Unrealized appreciation from swap agreements | | | – | | | | | | | | 83,600 | |
Unrealized appreciation from forward foreign currency contracts | | | 184,776 | | | | | | | | 3,408,659 | |
Prepaid expenses | | | 65,249 | | | | | | | | 29,410 | |
| | | | | | | | | | | | |
Total assets | | | 207,581,410 | | | | | | | | 781,732,001 | |
| | | | | | | | | | | | |
Liabilities: | | | | | | | | | | | | |
Payable for investments purchased | | | 6,736,827 | | | | | | | | 4,466,529 | |
Payable for fund shares redeemed | | | 90,941 | | | | | | | | 545,240 | |
Payable under excess expense reimbursement plan (Note 2) | | | 16,374 | | | | | | | | – | |
Swap premium received | | | – | | | | | | | | 8,298,968 | |
Cash collateral held at broker for the benefit of the custodian | | | – | | | | | | | | 230,000 | |
Swap income payable | | | – | | | | | | | | 813,829 | |
Management and sub-advisory fees payable (Note 2) | | | 140,040 | | | | | | | | 567,641 | |
Service fees payable (Note 2) | | | 16,594 | | | | | | | | 260 | |
Transfer agent fees payable (Note 2) | | | 7,656 | | | | | | | | 59,077 | |
Custody and fund accounting fees payable | | | 92,143 | | | | | | | | 35,171 | |
Professional fees payable | | | 70,142 | | | | | | | | 45,748 | |
Trustee fees payable (Note 2) | | | 591 | | | | | | | | 2,345 | |
Payable for prospectus and shareholder reports | | | 3,678 | | | | | | | | 10,749 | |
Unrealized depreciation from swap agreements | | | – | | | | | | | | 12,289,637 | |
Unrealized depreciation from forward foreign currency contracts | | | 45,359 | | | | | | | | 8,705,250 | |
Other liabilities | | | 13,076 | | | | | | | | 77,275 | |
| | | | | | | | | | | | |
Total liabilities | | | 7,233,421 | | | | | | | | 36,147,719 | |
| | | | | | | | | | | | |
Net assets | | $ | 200,347,989 | | | | | | | $ | 745,584,282 | |
| | | | | | | | | | | | |
Analysis of net assets: | | | | | | | | | | | | |
Paid-in-capital | | $ | 211,472,180 | | | | | | | $ | 762,439,644 | |
Undistributed (overdistribution of) net investment income | | | 1,041,079 | | | | | | | | 1,078,927 | |
Accumulated net realized gain (loss) | | | (15,463,988 | ) | | | | | | | (8,344 | ) |
Unrealized appreciation (depreciation) of investments in unaffiliated securitiesA | | | 3,132,581 | | | | | | | | (423,320 | ) |
Unrealized (depreciation) of forward foreign currency contracts | | | 139,417 | | | | | | | | (5,296,591 | ) |
Unrealized appreciation of foreign currency transactions | | | 26,720 | | | | | | | | 3 | |
Unrealized (depreciation) of swap agreements | | | – | | | | | | | | (12,206,037 | ) |
| | | | | | | | | | | | |
Net assets | | $ | 200,347,989 | | | | | | | $ | 745,584,282 | |
| | | | | | | | | | | | |
See accompanying notes
28
American Beacon FundsSM
Statements of Assets and Liabilities
January 31, 2018
| | | | | | | | | | | | |
| | | Global Evolution
Frontier Markets
Income Fund | | | | | | GLG Total
Return Fund | |
Shares outstanding at no par value (unlimited shares authorized): | | | | | | | | | | | | |
Institutional Class | | | 7,030,878 | | | | | | | | 30,646 | |
| | | | | | | | | | | | |
Y Class | | | 8,206,266 | | | | | | | | 99,228 | |
| | | | | | | | | | | | |
Investor Class | | | 4,323,491 | | | | | | | | 14,472 | |
| | | | | | | | | | | | |
A Class | | | 387,375 | | | | | | | | 10,212 | |
| | | | | | | | | | | | |
C Class | | | 876,841 | | | | | | | | 10,160 | |
| | | | | | | | | | | | |
Ultra Class | | | N/A | | | | | | | | 70,874,882 | |
| | | | | | | | | | | | |
Net assets: | | | | | | | | | | | | |
Institutional Class | | $ | 67,653,731 | | | | | | | $ | 321,683 | |
| | | | | | | | | | | | |
Y Class | | $ | 79,007,953 | | | | | | | $ | 1,038,736 | |
| | | | | | | | | | | | |
Investor Class | | $ | 41,560,845 | | | | | | | $ | 150,889 | |
| | | | | | | | | | | | |
A Class | | $ | 3,726,687 | | | | | | | $ | 106,439 | |
| | | | | | | | | | | | |
C Class | | $ | 8,398,773 | | | | | | | $ | 105,096 | |
| | | | | | | | | | | | |
Ultra Class | | | N/A | | | | | | | $ | 743,861,439 | |
| | | | | | | | | | | | |
Net asset value, offering and redemption price per share: | | | | | | | | | | | | |
Institutional Class | | $ | 9.62 | | | | | | | $ | 10.50 | |
| | | | | | | | | | | | |
Y Class | | $ | 9.63 | | | | | | | $ | 10.47 | |
| | | | | | | | | | | | |
Investor Class | | $ | 9.61 | | | | | | | $ | 10.43 | |
| | | | | | | | | | | | |
A Class | | $ | 9.62 | | | | | | | $ | 10.42 | |
| | | | | | | | | | | | |
A Class (offering price) | | $ | 10.10 | | | | | | | $ | 10.94 | |
| | | | | | | | | | | | |
C Class | | $ | 9.58 | | | | | | | $ | 10.34 | |
| | | | | | | | | | | | |
Ultra Class | | | N/A | | | | | | | $ | 10.50 | |
| | | | | | | | | | | | |
| | | |
† Cost of investments in unaffiliated securities | | $ | 167,421,715 | | | | | | | $ | 718,803,767 | |
‡ Cost of investments in affiliated securities | | $ | 27,848,722 | | | | | | | $ | 13,961,256 | |
^ Cost of foreign currency | | $ | 1,414,123 | | | | | | | $ | 306 | |
| A The Fund’s investments in affiliated securities did not have unrealized appreciation (depreciation) at year end. | |
See accompanying notes
29
American Beacon FundsSM
Statements of Operations
For the year ended January 31, 2018
| | | | | | | | | | | | |
| | | Global Evolution
Frontier Markets
Income Fund | | | | | | GLG Total
Return Fund | |
Investment income: | | | | | | | | | | | | |
Dividend income from affiliated securities | | $ | 130,139 | | | | | | | $ | 188,529 | |
Interest income (net of foreign taxes)† | | | 12,534,263 | | | | | | | | 7,564,654 | |
| | | | | | | | | | | | |
Total investment income | | | 12,664,402 | | | | | | | | 7,753,183 | |
| | | | | | | | | | | | |
Expenses: | | | | | | | | | | | | |
Management and sub-advisory fees (Note 2) | | | 1,056,247 | | | | | | | | 5,159,325 | |
Transfer agent fees: | | | | | | | | | | | | |
Institutional Class (Note 2) | | | 8,365 | | | | | | | | 60 | |
Y Class (Note 2) | | | 41,011 | | | | | | | | 591 | |
Investor Class | | | 2,546 | | | | | | | | 1,240 | |
A Class | | | 260 | | | | | | | | - | |
C Class | | | 141 | | | | | | | | - | |
Ultra Class | | | - | | | | | | | | 290,566 | |
Custody and fund accounting fees | | | 122,927 | | | | | | | | 46,909 | |
Professional fees | | | 132,866 | | | | | | | | 89,833 | |
Registration fees and expenses | | | 86,471 | | | | | | | | 191,316 | |
Service fees (Note 2): | | | | | | | | | | | | |
Y Class | | | 4,303 | | | | | | | | 911 | |
Investor Class | | | 78,685 | | | | | | | | 378 | |
A Class | | | 2,384 | | | | | | | | 163 | |
C Class | | | 4,738 | | | | | | | | 161 | |
Distribution fees (Note 2): | | | | | | | | | | | | |
A Class | | | 9,917 | | | | | | | | 271 | |
C Class | | | 33,380 | | | | | | | | 1,076 | |
Prospectus and shareholder report expenses | | | 19,013 | | | | | | | | 41,113 | |
Trustee fees (Note 2) | | | 5,205 | | | | | | | | 31,468 | |
Dividends and interest on securities sold short | | | - | | | | | | | | 4,909 | |
Other expenses | | | 10,037 | | | | | | | | 30,387 | |
| | | | | | | | | | | | |
Total expenses | | | 1,618,496 | | | | | | | | 5,890,677 | |
| | | | | | | | | | | | |
Net fees waived and expenses (reimbursed) / recouped (Note 2) | | | 25,376 | | | | | | | | (669,221 | ) |
| | | | | | | | | | | | |
Net expenses | | | 1,643,872 | | | | | | | | 5,221,456 | |
| | | | | | | | | | | | |
Net investment income | | | 11,020,530 | | | | | | | | 2,531,727 | |
| | | | | | | | | | | | |
| | | |
Realized and unrealized gain (loss) from investments: | | | | | | | | | | | | |
Net realized gain (loss) from: | | | | | | | | | | | | |
Investments in unaffiliated securitiesA | | | (1,997,048 | ) | | | | | | | 3,954,107 | |
Foreign currency transactions | | | (19,358 | ) | | | | | | | 105,469 | |
Forward foreign currency contracts | | | (7,711 | ) | | | | | | | 2,752,629 | |
Futures contracts | | | - | | | | | | | | (9 | ) |
Swap agreements | | | - | | | | | | | | (3,678,687 | ) |
Change in net unrealized appreciation (depreciation) of: | | | | | | | | | | | | |
Investments in unaffiliated securitiesB | | | 5,649,676 | | | | | | | | (269,730 | ) |
Foreign currency transactions | | | 1,882,321 | | | | | | | | 42,665 | |
Forward foreign currency contracts | | | 146,096 | | | | | | | | (6,318,307 | ) |
Swap agreements | | | - | | | | | | | | (12,110,142 | ) |
| | | | | | | | | | | | |
Net gain (loss) from investments | | | 5,653,976 | | | | | | | | (15,522,005 | ) |
| | | | | | | | | | | | |
Net increase (decrease) in net assets resulting from operations | | $ | 16,674,506 | | | | | | | $ | (12,990,278 | ) |
| | | | | | | | | | | | |
| | | |
† Foreign taxes | | $ | 277,097 | | | | | | | $ | - | |
A The Fund did not recognize net realized gains (losses) from the sale of investments in affiliated securities. | |
B The Fund’s investments in affiliated securities did not have a change in unrealized appreciation (depreciation) at year end. | |
See accompanying notes
30
American Beacon FundsSM
Statements of Changes in Net Assets
| | | | | | | | | | | | | | | | | | | | | | | | | | | | |
| | | Global Evolution Frontier Markets
Income Fund | | | | | | GLG Total Return Fund | |
| | | Year Ended
January 31, 2018 | | | | | | Year Ended
January 31, 2017 | | | | | | Year Ended
January 31, 2018 | | | | | | May 20, 2016A to
January 31, 2017 | |
Increase (decrease) in net assets: | | | | | | | | | | | | | | | | | | | | | | | | | | | | |
Operations: | | | | | | | | | | | | | | | | | | | | | | | | | | | | |
Net investment income | | $ | 11,020,530 | | | | | | | $ | 5,714,964 | | | | | | | $ | 2,531,727 | | | | | | | $ | 373,398 | |
Net realized gain (loss) from investments in unaffiliated securities, foreign currency transactions, forward foreign currency contracts, futures contracts, and swap agreements | | | (2,024,117 | ) | | | | | | | (3,144,932 | ) | | | | | | | 3,133,509 | | | | | | | | 1,150,406 | |
Change in net unrealized appreciation (depreciation) of investments in unaffiliated securities, foreign currency transactions, forward foreign currency contracts, and swap agreements | | | 7,678,093 | | | | | | | | 5,440,998 | | | | | | | | (18,655,514 | ) | | | | | | | 729,569 | |
| | | | | | | | | | | | | | | | | | | | | | | | | | | | |
Net increase (decrease) in net assets resulting from operations | | | 16,674,506 | | | | | | | | 8,011,030 | | | | | | | | (12,990,278 | ) | | | | | | | 2,253,373 | |
| | | | | | | | | | | | | | | | | | | | | | | | | | | | |
Distributions to shareholders: | | | | | | | | | | | | | | | | | | | | | | | | | | | | |
Net investment income: | | | | | | | | | | | | | | | | | | | | | | | | | | | | |
Institutional Class | | | (2,845,735 | ) | | | | | | | (95,303 | ) | | | | | | | (34,454 | ) | | | | | | | (93,409 | ) |
Y Class | | | (3,511,778 | ) | | | | | | | (188,232 | ) | | | | | | | (6,291 | ) | | | | | | | (953 | ) |
Investor Class | | | (2,275,358 | ) | | | | | | | (128,864 | ) | | | | | | | (1,298 | ) | | | | | | | (1,131 | ) |
A Class | | | (293,772 | ) | | | | | | | (52,461 | ) | | | | | | | (987 | ) | | | | | | | (953 | ) |
C Class | | | (214,080 | ) | | | | | | | (14,541 | ) | | | | | | | (422 | ) | | | | | | | (953 | ) |
Ultra Class | | | - | | | | | | | | - | | | | | | | | (4,299,303 | ) | | | | | | | (459,958 | ) |
Net realized gain from investments: | | | | | | | | | | | | | | | | | | | | | | | | | | | | |
Institutional Class | | | - | | | | | | | | - | | | | | | | | (517 | ) | | | | | | | (6,972 | ) |
Y Class | | | - | | | | | | | | - | | | | | | | | (1,675 | ) | | | | | | | (71 | ) |
Investor Class | | | - | | | | | | | | - | | | | | | | | (244 | ) | | | | | | | (85 | ) |
A Class | | | - | | | | | | | | - | | | | | | | | (173 | ) | | | | | | | (71 | ) |
C Class | | | - | | | | | | | | - | | | | | | | | (172 | ) | | | | | | | (71 | ) |
Ultra Class | | | - | | | | | | | | - | | | | | | | | (1,163,013 | ) | | | | | | | (45,281 | ) |
Return of capital: | | | | | | | | | | | | | | | | | | | | | | | | | | | | |
Institutional Class | | | - | | | | | | | | (769,911 | ) | | | | | | | (152 | ) | | | | | | | - | |
Y Class | | | - | | | | | | | | (1,520,652 | ) | | | | | | | (491 | ) | | | | | | | - | |
Investor Class | | | - | | | | | | | | (1,041,038 | ) | | | | | | | (72 | ) | | | | | | | - | |
A Class | | | - | | | | | | | | (423,814 | ) | | | | | | | (51 | ) | | | | | | | - | |
C Class | | | - | | | | | | | | (117,474 | ) | | | | | | | (50 | ) | | | | | | | - | |
Ultra Class | | | - | | | | | | | | - | | | | | | | | (341,068 | ) | | | | | | | - | |
| | | | | | | | | | | | | | | | | | | | | | | | | | | | |
Net distributions to shareholders | | | (9,140,723 | ) | | | | | | | (4,352,290 | ) | | | | | | | (5,850,433 | ) | | | | | | | (609,908 | ) |
| | | | | | | | | | | | | | | | | | | | | | | | | | | | |
| | | | | | | |
Capital share transactions (Note 10): | | | | | | | | | | | | | | | | | | | | | | | | | | | | |
Proceeds from sales of shares | | | 148,370,285 | | | | | | | | 25,553,537 | | | | | | | | 793,714,239 | | | | | | | | 78,842,000 | |
Reinvestment of dividends and distributions | | | 8,065,854 | | | | | | | | 4,251,801 | | | | | | | | 184,104 | | | | | | | | 105,707 | |
Cost of shares redeemed | | | (26,890,130 | ) | | | | | | | (35,677,428 | ) | | | | | | | (104,815,311 | ) | | | | | | | (10,249,211 | ) |
Redemption fees | | | 11,114 | | | | | | | | 7,270 | | | | | | | | - | | | | | | | | - | |
| | | | | | | | | | | | | | | | | | | | | | | | | | | | |
Net increase (decrease) in net assets from capital share transactions | | | 129,557,123 | | | | | | | | (5,864,820 | ) | | | | | | | 689,083,032 | | | | | | | | 68,698,496 | |
| | | | | | | | | | | | | | | | | | | | | | | | | | | | |
Net increase (decrease) in net assets | | | 137,090,906 | | | | | | | | (2,206,080 | ) | | | | | | | 670,242,321 | | | | | | | | 70,341,961 | |
| | | | | | | | | | | | | | | | | | | | | | | | | | | | |
Net assets: | | | | | | | | | | | | | | | | | | | | | | | | | | | | |
Beginning of period | | | 63,257,083 | | | | | | | | 65,463,163 | | | | | | | | 75,341,961 | | | | | | | | 5,000,000 | B |
| | | | | | | | | | | | | | | | | | | | | | | | | | | | |
End of period* | | $ | 200,347,989 | | | | | | | $ | 63,257,083 | | | | | | | $ | 745,584,282 | | | | | | | $ | 75,341,961 | |
| | | | | | | | | | | | | | | | | | | | | | | | | | | | |
*Includes undistributed (overdistribution of) net investment income | | $ | 1,041,079 | | | | | | | $ | 6,679 | | | | | | | $ | 1,078,927 | | | | | | | $ | 609,498 | |
| | | | | | | | | | | | | | | | | | | | | | | | | | | | |
A Commencement of operations. | | | | | | | | | | | | | | | | | | | | | | | | | | | | |
B Seed capital. | | | | | | | | | | | | | | | | | | | | | | | | | | | | |
See accompanying notes
31
American Beacon FundsSM
Notes to Financial Statements
January 31, 2018
1. Organization and Significant Accounting Policies
American Beacon Funds (the “Trust”) is organized as a Massachusetts business trust. The Funds, each a series within the Trust, are registered under the Investment Company Act of 1940 (the “Act”), as amended, as diversified, open-end management investment companies. As of January 31, 2018, the Trust consists of thirty-three active series, two of which are presented in this filing: American Beacon Global Evolution Frontier Markets Income Fund and American Beacon GLG Total Return Fund (collectively, the “Funds” and each individually a “Fund”). The remaining thirty-one active series are reported in separate filings. Prior to August 24, 2017, the American Beacon Global Evolution Frontier Markets Income Fund was registered under the Act as a non-diversified, open-end management investment company.
American Beacon Advisors, Inc. (the “Manager”) is a wholly-owned subsidiary of Resolute Investment Managers, Inc., which is indirectly owned by investment funds affiliated with Kelso & Company, L.P. and Estancia Capital Management, LLC, and was organized in 1986 to provide business management, advisory, administrative, and asset management consulting services to the Trust and other investors.
Class Disclosure
Each Fund has multiple classes of shares designed to meet the needs of different groups of investors; however, not all of the Funds offer all classes. The following table sets forth the differences amongst the classes:
| | | | | | |
Class | | Eligible Investors | | Minimum Initial
Investments | |
| Institutional | | Large institutional investors - sold directly or through intermediary channels. | | $ | 250,000 | |
| Y Class | | Large institutional retirement plan investors—sold directly or through intermediary channels. | | $ | 100,000 | |
| Investor | | All investors using intermediary organizations such as broker-dealers or retirement plan sponsors - sold directly through intermediary channels. | | $ | 2,500 | |
| A Class | | All investors who invest through intermediary organizations, such as broker-dealers or third party administrator. Retail investors who invest directly through a financial intermediary such as a broker, bank, or registered investment advisor which may include a front-end sales charge and a contingent deferred sales charge (“CDSC”). | | $ | 2,500 | |
| C Class | | Retail investors who invest directly through a financial intermediary such as a broker or through employee directed benefit plans with applicable sales charges which may include CDSC. | | $ | 1,000 | |
| Ultra | | Large institutional investors - sold directly or through intermediary channels. | | $ | 500,000,000 | |
Each class offered by the Trust has equal rights as to assets and voting privileges. Income and non-class specific expenses are allocated daily to each class on the basis of the relative net assets. Realized and unrealized capital gains and losses of each class are allocated daily based on the relative net assets of each class of the respective Fund. Class specific expenses, where applicable, currently include service, distribution, transfer agent fees, and sub-transfer agent fees that vary amongst the classes as described more fully in Note 2.
Recently Adopted Accounting Pronouncements
In October 2016, the SEC adopted amendments to rules under the Investment Company Act of 1940 (“final rules”) intended to modernize the reporting and disclosure of information by registered investment companies. The final rules amend Regulation S-X and require funds to provide standardized, enhanced derivative disclosure in fund financial statements in a format designed for individual investors. The amendments to Regulation S-X also update the disclosures for other investments and investments in and advances to affiliates and amend the rules regarding the general form and content of fund financial statements. The compliance date for the amendments to Regulation S-X is August 1, 2017, and has been adopted accordingly.
32
American Beacon FundsSM
Notes to Financial Statements
January 31, 2018
Significant Accounting Policies
The following is a summary of significant accounting policies, consistently followed by the Funds in preparation of the financial statements. The Funds are considered investment companies and accordingly, follow the investment company accounting and reporting guidance of the Financial Accounting Standards Board Accounting Standard Codification Topic 946, Financial Services – Investment Companies, a part of the Generally Accepted Accounting Principles (“U.S. GAAP”).
Security Transactions and Investment Income
Security transactions are recorded on the trade date of the security purchase or sale. The Funds may purchase securities with delivery or payment to occur at a later date. At the time the Funds enter into a commitment to purchase a security, the transaction is recorded, and the value of the security is reflected in the Net Asset Value (“NAV”). The value of the security may vary with market fluctuations.
Dividend income, net of foreign taxes, is recorded on the ex-dividend date, except certain dividends from foreign securities which are recorded as soon as the information is available to the Funds. Interest income is earned from settlement date, recorded on the accrual basis, and adjusted, if necessary, for accretion of discounts and amortization of premiums. For financial and tax reporting purposes, realized gains and losses are determined on the basis of specific lot identification.
Currency Translation
All assets and liabilities initially expressed in foreign currency values are converted into U.S. dollar values at the mean of the bid and ask prices of such currencies against U.S. dollars as last quoted by a recognized dealer. Income, expenses, and purchases and sales of investments are translated into U.S. dollars at the rate of the exchange prevailing on the respective dates of such transactions. The effect of changes in foreign currency exchange rates on investments is separately identified from the fluctuations arising from changes in market values of securities held and is reported with all other foreign currency gains and losses on the Funds’ Statements of Operations.
Distributions to Shareholders
Distributions, if any, of net investment income are generally paid at least annually and recorded on the ex-dividend date. Distributions, if any, of net realized capital gains are generally paid at least annually and recorded on the ex-dividend date. Dividends to shareholders are determined in accordance with federal income tax regulations, which may differ in amount and character from net investment income and realized gains recognized for purposes of U.S. GAAP.
Allocation of Income, Trust Expenses, Gains, and Losses
Investment income, realized and unrealized gains and losses from investments of the Funds are allocated daily to each class of shares based upon the relative proportion of net assets of each class to the total net assets of the Funds. Expenses directly charged or attributable to any Fund will be paid from the assets of the Fund. Generally, expenses of the Trust will be allocated among and charged to the assets of the Funds on a basis that the Trust’s Board of Trustees (the “Board”) deems fair and equitable, which may be based on the relative net assets of the Funds or nature of the services performed and relative applicability to the Funds.
Use of Estimates
The preparation of financial statements in conformity with U.S. GAAP requires management to make estimates and assumptions that affect the amounts reported in the financial statements and accompanying notes. Actual results may differ from those estimated.
33
American Beacon FundsSM
Notes to Financial Statements
January 31, 2018
Redemption Fees
All Classes of the Global Evolution Fund impose a 2% redemption fee on shares held for less than 90 days. The fee is deducted from the redemption proceeds and is intended to offset the trading costs, market impact, and other costs associated with short-term trading activity in the Fund. The “first-in, first-out” method is used to determine the holding period. The fee is allocated to all classes of this Fund pro-rata based on the net assets.
Other
Under the Trust’s organizational documents, its officers and trustees are indemnified against certain liabilities arising out of the performance of their duties to the Trust. In the normal course of business, the Trust enters into contracts that provide indemnification to the other party or parties against potential costs or liabilities. The Trust’s maximum exposure under these arrangements is dependent on claims that may be made in the future and, therefore, cannot be estimated. The Trust has had no prior claims or losses pursuant to any such agreement.
2. Transactions with Affiliates
Management and Investment Sub-Advisory Agreements
The Funds and the Manager are parties to a Management Agreement that obligates the Manager to provide the Funds with investment advisory and administrative services. As compensation for performing the duties under the Management Agreement, the Manager will receive an annualized management fee based on a percentage of each Fund’s average daily net assets that is calculated and accrued daily according to the following schedule:
| | | | |
First $5 billion | | | 0.35 | % |
Next $5 billion | | | 0.325 | % |
Next $10 billion | | | 0.30 | % |
Over $20 billion | | | 0.275 | % |
The Trust, on behalf of the Funds, and the Manager have entered into an Investment Advisory Agreement with Global Evolution USA, LLC and GLG LLC (the “Sub-Advisors”) pursuant to which the Funds have agreed to pay an annualized sub-advisory fee that is calculated and accrued daily based on the Funds’ average daily net assets according to the following schedules:
Global Evolution USA, LLC
GLG LLC
| | | | |
First $500 million | | | 0.60 | % |
Next $500 million | | | 0.55 | % |
Over $1 billion | | | 0.50 | % |
The Management and Sub-Advisory Fees paid by the Funds for the year ended January 31, 2018 were as follows:
Global Evolution Frontier Markets Income Fund
| | | | | | | | | | | | |
| | | Effective Fee Rate | | | | | | Amount of Fees Paid | |
| Management Fees | | | 0.35 | % | | | | | | $ | 434,925 | |
| Sub-Advisor Fees | | | 0.50 | % | | | | | | | 621,322 | |
| | | | | | | | | | | | |
| Total | | | 0.85 | % | | | | | | $ | 1,056,247 | |
| | | | | | | | | | | | |
34
American Beacon FundsSM
Notes to Financial Statements
January 31, 2018
GLG Total Return Fund
| | | | | | | | | | | | |
| | | Effective Fee Rate | | | | | | Amount of Fees Paid | |
| Management Fees | | | 0.35 | % | | | | | | $ | 1,918,840 | |
| Sub-Advisor Fees | | | 0.59 | % | | | | | | | 3,240,485 | |
| | | | | | | | | | | | |
| Total | | | 0.94 | % | | | | | | $ | 5,159,325 | |
| | | | | | | | | | | | |
Distribution Plans
The Funds, except for the A and C Classes of the Funds, have adopted a “defensive” Distribution Plan (the “Plan”) in accordance with Rule 12b-1 under the Act, pursuant to which no separate fees may be charged to the Funds for distribution purposes. However, the Plan authorizes the management fee received by the Manager and the investment advisors hired by the Manager to be used for distribution purposes. Under this Plan, the Funds do not intend to compensate the Manager or any other party, either directly or indirectly, for the distribution of Fund shares.
Separate Distribution Plans (the “Distribution Plans”) have been adopted pursuant to Rule 12b-1 under the Act for the A and C Classes of the Funds. Under the Distribution Plans, as compensation for distribution assistance, the Manager receives an annual fee of 0.25% of the average daily net assets of the A Class and 1.00% of the average daily net assets of the C Class. The fee will be payable without regard to whether the amount of the fee is more or less than the actual expenses incurred in a particular month by the Manager for distribution assistance.
Service Plans
The Manager and the Trust entered into Service Plans that obligates the Manager to oversee additional shareholder servicing of the Y, Investor, A, and C Classes of the Funds. As compensation for performing the duties required under the Service Plans, the Manager receives an annualized fee up to 0.10% of the average daily net assets of the Y Class, up to 0.25% of the average daily net assets of the A and C Classes, and up to 0.375% of the average daily net assets of the Investor Class of the Funds. Effective April 1, 2017, the Fund terminated the service plan for the Y Class.
Sub-Transfer Agent Fees
The Manager has entered into agreements, which include servicing agreements, with financial intermediaries that provide recordkeeping, processing, shareholder communications and other services to customers of the intermediaries that hold positions in the Institutional Class of the Funds and has agreed to compensate the intermediaries for providing these services. Effective April 1, 2017, the Funds agreed to compensate the intermediaries for providing services to the Y Class. Intermediaries transact with the Funds primarily through the use of omnibus accounts on behalf of their customers who hold positions in the Funds. Certain services would have been provided by the Fund’s transfer agent and other service providers if the shareholders’ accounts were maintained directly by the Fund’s transfer agent. Accordingly, the Funds, pursuant to Board approval, has agreed to reimburse the Manager for certain non-distribution shareholder services provided by financial intermediaries for the Institutional and Y Classes. The reimbursement amounts (sub-transfer agent fees) paid to the Manager are subject to a fee limit of up to 0.10% of an intermediary’s average net assets in the Institutional and Y Classes on an annual basis. During the year ended January 31, 2018, the sub-transfer agent fees, as reflected in “Transfer agent fees” on the Statements of Operations, were as follows:
| | | | |
Fund | | Sub-Transfer Agent Fees | |
Global Evolution Frontier Markets Income | | $ | 45,635 | |
GLG Total Return | | | 597 | |
35
American Beacon FundsSM
Notes to Financial Statements
January 31, 2018
As of January 31, 2018, the Funds owed the Manager the following reimbursement of sub-transfer agent fees, as reflected in “Transfer agent fees payable” on the Statements of Assets and Liabilities:
| | | | |
Fund | | Reimbursement Sub-Transfer
Agent Fees | |
Global Evolution Frontier Markets Income | | $ | 6,390 | |
GLG Total Return | | | 80 | |
Investments in Affiliated Funds
The Funds may invest in the American Beacon U.S. Government Money Market Select Fund (the “USG Select Fund”). Cash collateral received by the Funds in connection with securities lending may also be invested in the USG Select Fund. The Funds and the USG Select Fund have the same investment advisor and therefore, are considered to be affiliated. The Manager serves as investment advisor to the USG Select Fund and receives management fees and administrative fees totaling 0.10% of the average daily net assets of the USG Select Fund. During the year ended January 31, 2018, the Manager earned fees on the Funds’ direct investments in the USG Select Fund as shown below:
| | | | |
Fund | | Direct Investments in
USG Select Fund | |
Global Evolution Frontier Markets Income | | $ | 13,820 | |
GLG Total Return | | | 22,068 | |
Interfund Credit Facility
Pursuant to an exemptive order issued by the Securities and Exchange Commission (“SEC”), the Funds, along with other registered investment companies having management contracts with the Manager, may participate in a credit facility whereby each Fund, under certain conditions, is permitted to lend money directly to and borrow directly from other participating Funds for temporary purposes. The interfund credit facility is advantageous to the Funds because it provides added liquidity, and eliminates the need to maintain higher cash balances to meet redemptions. This situation could arise when shareholder redemptions exceed anticipated volumes and certain funds have insufficient cash on hand to satisfy such redemptions or when sales of securities do not settle as expected, resulting in a cash shortfall for a fund. When a Fund liquidates portfolio securities to meet redemption requests, they often do not receive payment in settlement for up to two days (or longer for certain foreign transactions). Redemption requests normally are satisfied on the next business day. The credit facility provides a source of immediate, short-term liquidity pending settlement of the sale of portfolio securities. The credit facility is administered by a credit facility team consisting of professionals from the Manager’s asset management, compliance, and accounting areas who report the activities of the credit facility to the Board. During the year ended January 31, 2018, the Funds did not utilize the credit facility.
Expense Reimbursement Plan
The Manager contractually agreed to reduce fees and/or reimburse expenses for the classes of the Funds to the extent that total operating expenses exceed the Funds’ expense cap. During the year ended January 31, 2018, the Manager waived and/or reimbursed expenses as follows:
| | | | | | | | | | | | | | | | | | |
| | | | | Expense Cap | | | | | | | | | Expiration of
Reimbursed
Expenses | |
Fund | | Class | | 2/1/2017 -
1/31/2018 | | | Reimbursed
Expenses | | | (Recouped)
Expenses | | |
Global Evolution Frontier Markets Income | | Institutional | | | 1.15 | % | | $ | 8,156 | | | $ | – | | | | 2021 | |
Global Evolution Frontier Markets Income | | Y | | | 1.25 | % | | | – | | | | (526 | ) | | | 2021 | |
36
American Beacon FundsSM
Notes to Financial Statements
January 31, 2018
| | | | | | | | | | | | | | | | | | |
| | | | | Expense Cap | | | | | | | | | Expiration of
Reimbursed
Expenses | |
Fund | | Class | | 2/1/2017 -
1/31/2018 | | | Reimbursed
Expenses | | | (Recouped)
Expenses | | |
Global Evolution Frontier Markets Income | | Investor | | | 1.53 | % | | $ | – | | | $ | (29,904 | ) | | | 2021 | |
Global Evolution Frontier Markets Income | | A | | | 1.55 | % | | | – | | | | (2,902 | ) | | | 2021 | |
Global Evolution Frontier Markets Income | | C | | | 2.30 | % | | | – | | | | (200 | ) | | | 2021 | |
GLG Total Return | | Institutional | | | 1.05 | % | | | – | | | | (156 | ) | | | 2021 | |
GLG Total Return | | Y | | | 1.15 | % | | | 300 | | | | – | | | | 2021 | |
GLG Total Return | | Investor | | | 1.43 | % | | | 994 | | | | – | | | | 2021 | |
GLG Total Return | | A | | | 1.45 | % | | | – | | | | (35 | ) | | | 2021 | |
GLG Total Return | | C | | | 2.20 | % | | | – | | | | (35 | ) | | | 2021 | |
GLG Total Return | | Ultra | | | 0.95 | % | | | 668,153 | | | | – | | | | 2021 | |
Of these amounts, $203,872 was disclosed as a receivable from the Manager on the Statements of Assets and Liabilities at January 31, 2018 for the GLG Total Return Fund and $16,374 was disclosed as a payable to the Manager on the Statements of Assets and Liabilities at January 31, 2018 for the Global Evolution Frontier Markets Income Fund.
The Funds have adopted an Expense Reimbursement Plan whereby the Manager may seek repayment of such fee reductions and expense reimbursements. Under the policy, the Manager can be reimbursed by the Funds for any contractual or voluntary fee reductions or expense reimbursements if reimbursement to the Manager (a) occurs within three years after the Manager’s own waiver or reimbursement and (b) does not cause the Funds’ annual operating expenses to exceed the lesser of the contractual percentage limit in effect at the time of the waiver/reimbursement or time of recoupment. The reimbursed expenses listed above will expire in 2021. The carryover of excess expenses potentially reimbursable to the Manager, but not recorded as a liability are as follows:
| | | | | | | | | | | | | | | | |
Fund | | Recouped
Expenses | | | Excess Expense
Carryover | | | Expired Expense
Carryover | | | Expiration of
Reimbursed
Expenses | |
Global Evolution Frontier Markets Income | | $ | 33,532 | | | $ | 66,857 | | | $ | – | | | | 2018 | |
Global Evolution Frontier Markets Income | | | – | | | | 18,592 | | | | – | | | | 2019 | |
Global Evolution Frontier Markets Income | | | – | | | | 63,671 | (1) | | | – | | | | 2020 | |
GLG Total Return | | | 226 | | | | 263,456 | | | | – | | | | 2020 | |
| (1) | Contractual expense caps were removed from the Institutional, Y, Investor, and A Classes on May 29, 2016. Voluntary expense caps were reinstated November 29, 2016 for the Institutional, Y, Investor, and A Classes. |
Sales Commissions
The Funds’ distributor, Foreside Fund Services, LLC (“Foreside”), may receive a portion of A Class sales charges from broker dealers and it may be used to offset distribution related expenses. During the year ended January 31, 2018, Foreside collected $10,006 for Global Evolution Frontier Markets Income Fund, from the sale of Class A Shares.
A CDSC of 0.50% will be deducted with respect to Class A Shares on certain purchases of $1,000,000 or more that are redeemed in whole or part within 18 months of purchase, unless waived as discussed in the Funds’ Prospectus. Any applicable CDSC will be 0.50% of the lesser of the original purchase price or the value of the redemption of the Class A Shares redeemed. During the year ended January 31, 2018, there were no CDSC fees collected for Class A Shares of the Funds.
A CDSC of 1.00% will be deducted with respect to Class C Shares redeemed within 12 months of purchase, unless waived as discussed in the Funds’ Prospectus. Any applicable CDSC will be 1.00% of the lesser of the original purchase price or the value of the redemption of the Class C Shares redeemed. During the year ended January 31, 2018, CDSC fees of $562 were collected for Class C Shares of the Global Evolution Frontier Markets Income Fund.
37
American Beacon FundsSM
Notes to Financial Statements
January 31, 2018
Concentration of Ownership
From time to time, the Funds may have a concentration of one or more accounts constituting a significant percentage of shares outstanding. Investment activities by holders of accounts that represent a significant ownership of more than 5% of the Funds’ outstanding shares could have a material impact on the Funds. As of January 31, 2018, based on management’s evaluation of the shareholder account base, one account in the Global Evolution Frontier Markets Income Fund has been identified as representing an unaffiliated significant ownership of approximately 7% of the Fund’s outstanding shares.
Trustee Fees and Expenses
As compensation for their service to the Trust, the American Beacon Select Funds and the American Beacon Institutional Funds Trust, each Trustee receives an annual retainer of $120,000, plus $10,000 for each Board meeting attended in person or via teleconference, $2,500 for attendance by Committee members at meetings of the Audit Committee and the Investment Committee, and $1,500 for attendance by Committee members at meetings of the Nominating and Governance Committee, plus reimbursement of reasonable expenses incurred in attending Board meetings, Committee meetings, and relevant educational seminars. The Trustees also may be compensated for attendance at special Board and/or Committee meetings from time to time. The Board Chairman receives an additional annual retainer of $50,000 as well as a $2,500 fee each quarter for his attendance at the committee meetings. Effective January 1, 2018, the Board Vice Chair receives an additional annual retainer of $10,000. The Chairpersons of the Audit Committee and the Investment Committee each receive an additional annual retainer of $25,000 and the Chairman of the Nominating and Governance Committee receives an additional annual retainer of $10,000. These expenses are allocated on a prorated basis to each Fund of the Trusts according to its respective net assets.
3. Security Valuation and Fair Value Measurements
Investments are valued at the close of the New York Stock Exchange (the “Exchange”), normally at 4:00 p.m. Eastern Time, each day that the Exchange is open for business. Equity securities, including exchange-traded funds (“ETFs”) for which market quotations are available are valued at the last sale price or official closing price (closing bid price or last evaluated quote if no sale has occurred) on the primary market or exchange on which they trade.
Debt securities normally are valued on the basis of prices provided by an independent pricing service and may take into account appropriate factors such as institution-size trading in similar groups of securities, yield, quality, coupon rate, maturity, type of issue, trading characteristics, and other market data. Prices of debt securities may be determined using quotes obtained from brokers.
Investments in open-end mutual funds are valued at the closing NAV per share of the mutual fund on the day of valuation.
Securities for which the market prices are not readily available or are not reflective of the fair value of the security, as determined by the Manager, will be priced at fair value following procedures approved by the Board.
Other investments, including restricted securities and those financial instruments for which the above valuation procedures are inappropriate or are deemed not to reflect fair value, are stated at fair value, as determined in good faith by the Manager’s Valuation Committee, pursuant to procedures established by the Board.
Forward foreign currency contracts are valued using the prevailing forward exchange rate and are categorized as Level 2 in the fair value hierarchy. Swap contracts are valued at prices furnished by independent swap dealers or by an independent pricing service and are generally categorized as a Level 2 in the fair value hierarchy. Forward foreign currency contracts and swap contracts involve, to varying degrees, risk of loss in excess of the unrealized appreciation (depreciation) on the Statement of Assets and Liabilities.
38
American Beacon FundsSM
Notes to Financial Statements
January 31, 2018
Valuation Inputs
Various inputs may be used to determine the fair value of the Funds’ investments. These inputs are summarized in three broad levels for financial statement purposes. The inputs or methodologies used to value securities are not necessarily an indication of the risk associated with investing in those securities.
| | | | |
| Level 1 | | - | | Quoted prices in active markets for identical securities. |
| | |
| Level 2 | | - | | Prices determined using other significant observable inputs. These may include quoted prices for similar securities, interest rates, prepayment speeds, credit risk, and others. |
| | |
| Level 3 | | - | | Prices determined using other significant unobservable inputs. Unobservable inputs reflect the Fund’s own assumptions about the factors market participants would use in pricing an investment. |
Level 1 and Level 2 trading assets and trading liabilities, at fair value
Fixed-income securities including corporate, convertible and municipal bonds and notes, U.S. government agencies, U.S. Treasury obligations, sovereign issues, bank loans, convertible preferred securities, and non-U.S. bonds are normally valued by pricing service providers that use broker dealer quotations, reported trades or valuation estimates from their internal pricing models. The service providers’ internal models use inputs that are observable such as issuer details, interest rates, yield curves, prepayment speeds, credit risks/spreads, default rates, and quoted prices for similar assets. Securities that use similar valuation techniques and inputs as described above are categorized as Level 2 of the fair value hierarchy. Fixed-income securities purchased on a delayed-delivery basis are marked-to- market daily until settlement at the forward settlement date and are categorized as Level 2 of the fair value hierarchy.
Common stocks, preferred securities, and financial derivative instruments, such as futures contracts that are traded on a national securities exchange, are stated at the last reported sale or settlement price on the day of valuation. To the extent these securities are actively traded and valuation adjustments are not applied, they are categorized as Level 1 of the fair value hierarchy. Preferred securities and other equities traded on inactive markets or valued by reference to similar instruments are generally categorized as Level 2 of the fair value hierarchy.
Investments in registered open-end investment management companies will be valued based upon the NAVs of such investments and are categorized as Level 1 of the fair value hierarchy.
Over-the-counter (“OTC”) financial derivative instruments, such as foreign currency contracts and structured notes, derive their value from underlying asset prices, indices, reference rates, and other inputs or a combination of these factors. These contracts are normally valued on the basis of broker dealer quotations or pricing service providers. Depending on the product and the terms of the transaction, the fair value of the financial derivative contracts can be estimated by a pricing service provider using a series of techniques, including simulation pricing models. The pricing models use inputs that are observed from actively quoted markets such as issuer details, indices, spreads, interest rates, curves, dividends, and exchange rates. Financial derivatives that use similar valuation techniques and inputs as described above are categorized as Level 2 of the fair value hierarchy.
Level 3 trading assets and trading liabilities, at fair value
The valuation techniques and significant inputs used in determining the fair values of financial instruments classified as Level 3 of the fair value hierarchy are as follows.
Securities and other assets for which market quotes are not readily available are valued at fair value as determined in good faith by the Board or persons acting at their direction and may be categorized as Level 3 of the fair value hierarchy.
39
American Beacon FundsSM
Notes to Financial Statements
January 31, 2018
Market quotes are considered not readily available in circumstances where there is an absence of current or reliable market-based data (e.g., trade information or broker quotes), including where events occur after the close of the relevant market, but prior to the Exchange close, that materially affect the values of the Fund’s securities or assets. In addition, market quotes are considered not readily available when, due to extraordinary circumstances, the exchanges or markets on which the securities trade, do not open for trading for the entire day and no other market prices are available. The Board has delegated to the Manager the responsibility for monitoring significant events that may materially affect the fair values of a Fund’s securities or assets and for determining whether the value of the applicable securities or assets should be re-evaluated in light of such significant events.
The Board has adopted methods for valuing securities and other assets in circumstances where market quotes are not readily available, and has delegated the responsibility for applying the valuation methods to the Manager. For instances in which daily market quotes are not readily available, investments may be valued pursuant to guidelines established by the Board. In the event that the security or asset cannot be valued, pursuant to one of the valuation methods established by the Board, the fair value of the security or asset will be determined in good faith by the Valuation Committee, generally based upon recommendations provided by the Manager.
When a Fund uses fair valuation methods applied by the Manager that use significant unobservable inputs to determine its NAV, the securities priced using this methodology are categorized as Level 3 of the fair value hierarchy. These methods may require subjective determinations about the value of a security. While the Trust’s policy is intended to result in a calculation of the Fund’s NAV that fairly reflects security values as of the time of pricing, the Trust cannot guarantee that values determined by the Board or persons acting at their direction would accurately reflect the price that a Fund could obtain for a security if it were to dispose of that security as of the time of pricing (for instance, in a forced or distressed sale). The prices used by a Fund may differ from the value that would be realized if the securities were sold.
4. Securities and Other Investments
Credit-Linked Notes
Credit-linked notes (“CLNs”) are derivative debt obligations that are issued by limited purpose entities or by financial firms, such as banks, securities firms or their affiliates, and that are structured so that their performance is linked to that of an underlying bond or other debt obligation (a “reference asset”), normally by means of an embedded or underlying credit default swap. The reference assets for the CLNs in which the Fund may invest will be limited to sovereign or quasi-sovereign debt instruments or other investments in which the Fund’s investment policies permit it to invest directly. The Fund may invest in CLNs when the Fund’s Sub-Advisor believes that doing so is more efficient than investing in the reference assets directly or when such direct investment by the Fund is not feasible due to legal or other restrictions.
The issuer or one of the affiliates of the issuer of the CLNs in which the Fund will invest, normally will purchase the reference asset underlying the CLN directly, but in some cases it may gain exposure to the reference asset through a credit default swap or other derivative. Under the terms of a CLN, the Fund will receive a fixed or variable rate of interest on the outstanding principal amount of the CLN, which in turn will be subject to reduction (potentially down to zero) if a “credit event” occurs with respect to the underlying reference asset or its issuer. Such credit events will include payment defaults on the reference asset, and normally will also include events that do not involve an actual default, such as actual or potential insolvencies, repudiations of indebtedness, moratoria on payments, reference asset restructurings, limits on the convertibility or repatriation of currencies, and the imposition of ownership restrictions. If a credit event occurs, payments on the CLN would terminate, and the Fund normally would receive delivery of the underlying reference asset (or, in some cases, a comparable “deliverable” asset) in lieu of the repayment of principal. In some cases, however, including but not limited to instances where there has been a market disruption or in which it is or has become illegal, impossible or impracticable for the Fund to purchase, hold or receive the reference assets, the Fund may receive a cash settlement based on the value of the reference asset or a comparable instrument, less fees charged and certain expenses incurred by the CLN issuer.
40
American Beacon FundsSM
Notes to Financial Statements
January 31, 2018
CLNs are debt obligations of the CLN issuers, and the Fund would have no ownership or other property interest in the reference assets (other than following a credit event that results in the reference assets being delivered to the Fund) or any direct recourse to the issuers of those reference assets. Thus, the Fund will be exposed to the credit risk of the issuers of the reference assets that underlie its CLNs, as well as to the credit risk of the issuers of the CLNs themselves. CLNs will also be subject to currency risk, liquidity risk, valuation risks, and the other risks of a credit default swap. Various determinations that may need to be made with respect to the CLNs, including the occurrence of a credit event, the selection of deliverable assets (where applicable) and the valuation of the reference asset for purposes of determining any cash settlement amount, normally will be made by the issuer or sponsor of the CLN. The interests of such issuer or sponsor may not be aligned with those of the Fund or other investors in the CLN. Accordingly, CLNs may also be subject to potential conflicts of interest. There may be no established trading market for the Fund’s CLNs, in which event they may constitute illiquid investments.
Fixed-Income Investments
The Funds may hold debt, including government and corporate debt, and other fixed-income securities. Typically, the values of fixed-income securities change inversely with prevailing interest rates. Therefore, a fundamental risk of fixed-income securities is interest rate risk, which is the risk that their value will generally decline as prevailing interest rates rise, which may cause the Funds’ net asset value to likewise decrease, and vice versa. How specific fixed-income securities may react to changes in interest rates will depend on the specific characteristics of each security. For example, while securities with longer maturities tend to produce higher yields, they also tend to be more sensitive to changes in prevailing interest rates and are, therefore, more volatile than shorter-term securities and are subject to greater market fluctuations as a result of changes in interest rates. Fixed-income securities are also subject to credit risk, which is the risk that the credit strength of an issuer of a fixed-income security will weaken and/or that the issuer will be unable to make timely principal and interest payments and that the security may go into default. In addition, there is prepayment risk, which is the risk that during periods of falling interest rates, certain fixed-income securities with higher interest rates, such as mortgage- and asset-backed securities, may be prepaid by their issuers thereby reducing the amount of interest payments. This may result in a Fund having to reinvest its proceeds in lower yielding securities. Securities underlying mortgage- and asset-backed securities, which may include subprime mortgages, also may be subject to a higher degree of credit risk, valuation risk, and liquidity risk.
Foreign Debt Securities
The Funds may invest in foreign fixed and floating rate income securities (including emerging market securities) all or a portion of which may be non-U.S. dollar denominated and which include: (a) debt obligations issued or guaranteed by foreign national, provincial, state, municipal or other governments with taxing authority or by their agencies or instrumentalities, including Brady Bonds; (b) debt obligations of supranational entities; (c) debt obligations of the U.S. Government issued in non-dollar securities; (d) debt obligations and other fixed income securities of foreign corporate issuers (both dollar and non-dollar denominated); and (e) U.S. corporate issuers (both Eurodollar and non-dollar denominated). There is no minimum rating criteria for the Funds’ investments in such securities. Investing in the securities of foreign issuers involves special considerations that are not typically associated with investing in the securities of U.S. issuers. In addition, emerging markets are markets that have risks that are different and higher than those in more developed markets.
Foreign Securities
The Funds may invest in U.S. dollar-denominated and non-U.S. dollar denominated equity and debt securities of foreign issuers and foreign branches of U.S. banks, including negotiable certificates of deposit, bankers’ acceptances, and commercial paper. Foreign issuers are issuers organized and doing business principally outside the United States and include corporations, banks, non-U.S. governments, and quasi-governmental organizations. While investments in foreign securities may be intended to reduce risk by providing further diversification, such investments involve sovereign and other risks, in addition to the credit and market risks
41
American Beacon FundsSM
Notes to Financial Statements
January 31, 2018
normally associated with domestic securities. These additional risks include the possibility of adverse political and economic developments (including political or social instability, nationalization, expropriation, or confiscatory taxation); the potentially adverse effects of unavailability of public information regarding issuers, different governmental supervision and regulation of financial markets, reduced liquidity of certain financial markets, and the lack of uniform accounting, auditing, and financial reporting standards or the application of standards that are different or less stringent than those applied in the United States; different laws and customs governing securities tracking; and possibly limited access to the courts to enforce the Funds’ rights as an investor.
Frontier and Emerging Market Investments
The Funds may invest in the securities and derivatives with exposure to various countries with emerging capital markets. Investments in the securities and derivatives with exposure to countries with emerging capital markets involve significantly higher risks not involved in investments in securities in more developed capital markets, such as (i) low or non-existent trading volume, resulting in a lack of liquidity and increased volatility in prices for such securities, as compared to securities from more developed capital markets, (ii) uncertain national policies and social, political and economic instability, increasing the potential for expropriation of assets, confiscatory taxation, high rates of inflation or unfavorable diplomatic developments, (iii) possible fluctuations in exchange rates, differing legal systems and the existence or possible imposition of exchange controls, custodial restrictions or other non-U.S. or U.S. governmental laws or restrictions applicable to such investments, (iv) national policies that may limit the Fund’s investment opportunities such as restrictions on investment in issuers or industries deemed sensitive to national interests, (v) the lack or relatively early development of legal structures governing private and foreign investments and private property, and (vi) less diverse or immature economic structures. In addition to withholding taxes on investment income, some countries with emerging capital markets may impose differential capital gain taxes on foreign investors.
Illiquid and Restricted Securities
The Funds may invest in securities that are subject to legal or contractual restrictions on resale. These securities may be sold privately, but are required to be registered or exempted from such registration before being sold to the public. Private placement securities are generally considered to be restricted except for those securities traded between qualified institutional investors under the provisions of Rule 144A of the Securities Act of 1933 (the “Securities Act”). Illiquid securities have included securities that have not been registered under the Securities Act, securities that are otherwise not readily marketable, and repurchase agreements having a remaining maturity of longer than seven calendar days. Disposal of both illiquid and restricted securities may involve time-consuming negotiations and expenses, and prompt sale at an acceptable price may be difficult to achieve. Restricted securities outstanding during the year ended January 31, 2018 are disclosed in the Fund’s Notes to the Schedule of Investments.
Regulation S under the Securities Act permits the sale abroad of securities that are not registered for sale in the United States and includes a provision for U.S. investors, such as the Funds, to purchase such unregistered securities if certain conditions are met.
Inflation-Indexed Bonds
The Funds may invest in inflation-indexed bonds. Inflation-indexed bonds are fixed-income securities whose principal value is periodically adjusted based on the rate of inflation. The interest rate on these bonds is generally fixed at issuance at a rate lower than typical bonds. Over the life of an inflation-indexed bond, however, interest will be paid based on principal value, which is adjusted for inflation. Any increase or decrease in the principal amount of an inflation-indexed bond will be included as interest income on the Statement of Operations, even though investors do not receive their principal until maturity.
42
American Beacon FundsSM
Notes to Financial Statements
January 31, 2018
Other Investment Company Securities and Other Exchange-Traded Products
The Funds may invest in shares of other investment companies, including open-end funds, closed-end funds, business development companies, ETFs, unit investment trusts, and other investment companies of the Trust. The Funds may invest in investment company securities advised by the Manager or a sub-advisor. Investments in the securities of other investment companies may involve duplication of advisory fees and certain other expenses. By investing in another investment company, the Funds become a shareholder of that investment company. As a result, the Funds’ shareholders indirectly will bear the Funds’ proportionate share of the fees and expenses paid by shareholders of the other investment company, in addition to the fees and expenses the Funds’ shareholders directly bear in connection with the Funds’ own operations. These other fees and expenses are reflected as Acquired Fund Fees and Expenses and are included in the Fees and Expenses Table for the Funds in their Prospectus, if applicable. Investments in other investment companies may involve the payment of substantial premiums above the value of such issuer’s portfolio securities.
Sovereign and Quasi-Sovereign Government and Supranational Debt
The Funds can invest in debt securities issued or guaranteed by foreign governments and their political subdivisions or agencies which involve special risks. Sovereign debt differs from debt obligations issued by private entities in that, generally, remedies for defaults must be pursued in the courts of the defaulting party. Sovereign debt securities may include: debt securities issued or guaranteed by governments, governmental agencies or instrumentalities and political subdivisions located in emerging market countries; debt securities issued by government owned, controlled or sponsored entities located in emerging market countries; interests in entities organized and operated for the purpose of restructuring the investment characteristics of instruments issued by government owned, controlled or sponsored entities located in emerging market countries; interests in entities organized and operated for the purpose of restructuring the investment characteristics of instruments issued by any of the above issuers; participations in loans between emerging market governments and financial institutions; and Brady Bonds, which are debt securities issued under the framework of the Brady Plan as a means for debtor nations to restructure their outstanding external indebtedness.
Supranational entities may also issue debt securities. Supranational organizations are entities designated or supported by a government or governmental group to promote economic development. Included among these organizations are the Asian Development Bank, the European Investment Bank, the Inter-American Development Bank, the International Monetary Fund, the United Nations, the World Bank and the European Bank for Reconstruction and Development. Supranational organizations have no taxing authority and are dependent on their members for payments of interest and principal to the extent their assets are insufficient. Further, the lending activities of such entities are limited to a percentage of their total capital, reserves and net income.
Variable or Floating Rate Obligations
The interest rates payable on certain fixed-income securities in which the Funds may invest are not fixed and may fluctuate based upon changes in market rates. A variable rate obligation has an interest rate which is adjusted at predesignated periods in response to changes in the market rate of interest on which the interest rate is based. Variable and floating rate obligations are less effective than fixed rate instruments at locking in a particular yield. Nevertheless, such obligations may fluctuate in value in response to interest rate changes if there is a delay between changes in market interest rates and the interest reset date for the obligation, or for other reasons.
5. Financial Derivative Instruments
The Funds may utilize derivative instruments to enhance return, hedge risk, gain efficient exposure to an asset class or to manage liquidity. When considering the Funds’ use of derivatives, it is important to note that the Funds do not use derivatives for the purpose of creating financial leverage.
43
American Beacon FundsSM
Notes to Financial Statements
January 31, 2018
Forward Foreign Currency Contracts
The Funds may enter into forward foreign currency contracts to hedge the exchange rate risk on investment transactions or to hedge the value of the Funds’ securities denominated in foreign currencies. Forward foreign currency contracts are valued at the forward exchange rate prevailing on the day of valuation. The Funds may also use currency contracts to increase exposure to a foreign currency or to shift exposure to foreign currency fluctuations from one country to another. The Funds bear the market risk that arises from changes in foreign exchange rates, and accordingly, the unrealized gain (loss) on these contracts is reflected in the accompanying financial statements. The Funds also bear the credit risk if the counterparty fails to perform under the contract.
During the year ended January 31, 2018, the Funds entered into forward foreign currency contracts primarily for hedging foreign currency fluctuations.
The Funds’ forward foreign currency contract notional dollar values outstanding fluctuate throughout the operating year as required to meet strategic requirements. The following table illustrates the average quarterly volume of forward foreign currency contracts. For the purpose of this disclosure, volume is measured by the amounts bought and sold in USD at each quarter end.
| | | | | | | | |
Average Forward Foreign Currency Notional Amount Outstanding
Year ended January 31, 2018 | |
Fund | | Purchased Contracts | | | Sold Contracts | |
Global Evolution Frontier Markets Income | | $ | 2,644,169 | | | $ | - | |
GLG Total Return | | | 173,709,065 | | | | 308,054,272 | |
Futures Contracts
Futures contracts are contracts to buy or sell a standard quantity of securities at a specified price on a future date. The Funds may enter into financial futures contracts as a method for keeping assets readily convertible to cash if needed to meet shareholder redemptions or for other needs while maintaining exposure to the stock or bond market, as applicable. The primary risks associated with the use of futures contracts are the possibility of illiquid markets or imperfect correlation between the values of the contracts and the underlying securities or that the counterparty will fail to perform its obligations.
Upon entering into a futures contract, the Funds are required to set aside or deposit with a broker an amount, termed the initial margin, which typically represents a portion of the face value of the futures contract. The Funds usually reflects this amount on the Schedules of Investments as a U.S. Treasury Bill held as collateral for futures contracts or as cash deposited with broker on the Statements of Assets and Liabilities. Payments to and from the broker, known as variation margin, are required to be made on a daily basis as the price of the futures contract fluctuates. Changes in initial settlement values are accounted for as unrealized appreciation (depreciation) until the contracts are terminated, at which time realized gains and losses are recognized. Futures contracts are valued at the most recent settlement price established each day by the exchange on which they are traded.
During the year ended January 31, 2018, the GLG Total Return Fund entered into futures contracts primarily for exposing cash to markets.
The GLG Total Return Fund invested in an insignificant volume of futures contracts during the year, and no positions were held as of January 31, 2018.
Swap Agreements
The Funds may invest in swap agreements. Swap agreements are negotiated between the Fund and a counterparty to exchange or swap investment cash flows, assets, foreign currencies, or market-linked returns at
44
American Beacon FundsSM
Notes to Financial Statements
January 31, 2018
specified, future intervals. Swap agreements are either privately negotiated in the over-the-counter market (“OTC Swaps”) or cleared in a central clearing house (“Centrally Cleared Swaps”). The Fund may enter into credit default, cross-currency, interest rate and other forms of swap agreements to manage its exposure to credit, currency, interest rate, and inflation risk. In connection with these agreements, securities or cash may be identified as collateral in accordance with the terms of the respective swap agreements to provide assets of value and recourse in the event of default or bankruptcy/insolvency.
Swaps are marked to market daily based upon values from third party vendors or quotations from market makers to the extent available and the change in value, if any, is recorded as an unrealized gain or loss on the Statement of Assets and Liabilities. Daily fluctuations in the value of centrally cleared swaps are recorded in variation margin on the Statement of Assets and Liabilities and recorded as unrealized gain or loss. In the event that market quotes are not readily available and the swap cannot be valued pursuant to one of the valuation methods, the value of the swap will be determined in good faith by the Valuation Committee pursuant to procedures approved by the Board.
For OTC swaps payments received or made at the beginning of the measurement period are reflected as such on the Statement of Assets and Liabilities and represent payments made or received upon entering into the swap agreement to compensate for differences between the stated terms of the swap agreement and prevailing market conditions (credit spreads, currency exchange rates, interest rates, and other relevant factors). Centrally cleared swaps provide the same rights to the protection buyer and seller except the payments between parties, including upfront premiums, are settled through a central clearing agent through variation margin payments. Upfront and periodic payments for OTC and centrally cleared swapsare recorded as realized gains or losses on the Statement of Operations upon termination or maturity of the swap. A liquidation payment received or made at the termination of the swap is recorded as realized gain or loss on the Statement of Operations. Net periodic payments received or paid by the Fund are included as part of realized gains or losses on the Statement of Operations.
Entering into these agreements involves, to varying degrees, elements of credit, market and documentation risk in excess of the amounts recognized on the Statement of Assets and Liabilities. Such risks involve the possibility that there will be no liquid market for these agreements, that the counterparty to the agreements may default on its obligation to perform or disagree as to the meaning of contractual terms in the agreements and that there may be unfavorable changes in interest rates.
The Fund’s maximum risk of loss from counterparty credit risk is the discounted net value of the cash flows to be received from the counterparty over the contract’s remaining life, to the extent that amount is positive. The risk is mitigated by having a master netting arrangement between the Fund and the counterparty and by the posting of collateral to the Fund to cover the Fund’s exposure to the counterparty.
Credit Default Swap Agreements
Credit default swap agreements involve one party making a stream of payments (referred to as the buyer of protection) to another party (the seller of protection) in exchange for the right to receive a specified return in the event of a default or other credit event for the referenced entity, obligation or index. As a seller of protection on credit default swap agreements, the Fund will generally receive from the buyer of protection a fixed rate of periodic premiums throughout the term of the swap provided that there is no credit event. As the seller, the Fund would effectively add leverage to its portfolio because, in addition to its total net assets, the Fund would be subject to investment exposure up to the notional amount of the swap.
If the Fund is a seller of protection and a credit event occurs, as defined under the terms of that particular swap agreement, the Fund will either (i) pay to the buyer of protection an amount equal to the notional amount of the swap and take delivery of the referenced obligation, other deliverable obligations or underlying securities comprising the referenced index or (ii) pay a net settlement amount in the form of cash or securities equal to the notional amount of the swap less the recovery value of the referenced obligation or underlying securities comprising the referenced index. If the Fund is a buyer of protection and a credit event occurs, as defined under
45
American Beacon FundsSM
Notes to Financial Statements
January 31, 2018
the terms of that particular swap agreement, the Fund will either (i) receive from the seller of protection an amount equal to the notional amount of the swap and deliver the referenced obligation, other deliverable obligations or underlying securities comprising the referenced index or (ii) receive a net settlement amount in the form of cash or securities equal to the notional amount of the swap less the recovery value of the referenced obligation or underlying securities comprising the referenced index. Recovery values are estimated by market makers considering either industry standard recovery rates or entity specific factors and considerations until a credit event occurs. If a credit event has occurred, the recovery value is determined by a facilitated auction whereby a minimum number of allowable broker bids, together with a specified valuation method, are used to calculate the settlement value.
Credit default swap agreements on corporate issues, sovereign issues of an emerging country or U.S. municipal issues involve one party making a stream of payments to another party in exchange for the right to receive a specified return in the event of a default or other credit event. If a credit event occurs and cash settlement is not elected, a variety of other deliverable obligations may be delivered in lieu of the specific referenced obligation. The ability to deliver other obligations may result in a cheapest-to-deliver option (the buyer of protection’s right to choose the deliverable obligation with the lowest value following a credit event). The Fund may use credit default swaps on corporate issues, sovereign issues of an emerging country or U.S. municipal issues to provide a measure of protection against defaults of the issuers (i.e., to reduce risk where the Fund owns or has exposure to the referenced obligation) or to take an active long or short position with respect to the likelihood of a particular issuer’s default.
Credit default swap agreements on asset-backed securities involve one party making a stream of payments to another party in exchange for the right to receive a specified return in the event of a default or other credit event. Unlike credit default swaps on corporate issues, sovereign issues of an emerging country or U.S. municipal issues, deliverable obligations in most instances would be limited to the specific referenced obligation as performance for asset-backed securities can vary across deals. Prepayments, principal paydowns, and other writedown or loss events on the underlying mortgage loans will reduce the outstanding principal balance of the referenced obligation. These reductions may be temporary or permanent as defined under the terms of the swap agreement and the notional amount for the swap agreement will be adjusted by corresponding amounts. The Fund may use credit default swaps on asset-backed securities to provide a measure of protection against defaults of the referenced obligation that the Fund owns or to take an active long or short position with respect to the likelihood of a particular referenced obligation’s default that the Fund does not own.
Credit default swap agreements on credit indices involve one party making a stream of payments to another party in exchange for the right to receive a specified return in the event of a write-down, principal shortfall, interest shortfall or default of all or part of the referenced entities comprising the credit index. A credit index is a basket of credit instruments or exposures designed to be representative of some part of the credit market as a whole. These indices are made up of reference credits that are judged by a poll of dealers to be the most liquid entities in the credit default swap market based on the sector of the index. Components of the indices may include, but are not limited to, investment grade securities, high yield securities, asset-backed securities, emerging markets, and/or various credit ratings within each sector. Credit indices are traded using credit default swaps with standardized terms including a fixed spread and standard maturity dates. An index credit default swap references all the names in the index, and if there is a default, the credit event is settled based on that name’s weight in the index. The composition of the indices changes periodically, usually every six months, and for most indices, each name has an equal weight in the index. The Fund may use credit default swaps on credit indices to hedge a portfolio of credit default swaps or bonds, which is less expensive than it would be to buy many credit default swaps to achieve a similar effect. Credit default swaps on indices are benchmarks for protecting investors owning bonds against default, and traders use them to speculate on changes in credit quality.
Implied credit spreads, represented in absolute terms, utilized in determining the market value of credit default swap agreements on corporate issues, sovereign issues of an emerging country or U.S. municipal issues as of period end are disclosed in the Notes to the Schedule of Investments and serve as an indicator of the current status of the payment/performance risk and represent a market participant view of the likelihood or risk of default for
46
American Beacon FundsSM
Notes to Financial Statements
January 31, 2018
the underlying referenced security to credit derivative. The implied credit spread of a particular referenced entity reflects the cost of buying/selling protection and may include upfront payments required to be made to enter into the agreement. For credit default swap agreements on asset-backed securities and credit indices, the quoted market prices and resulting values serve as the indicator of the current status of the payment/performance risk. Wider credit spreads represent a deterioration of the referenced entity’s credit soundness and a greater likelihood or risk of default or other credit event occurring as defined under the terms of the agreement.
The maximum potential amount of future payments (undiscounted) that the Fund as a seller of protection could be required to make under a credit default swap agreement would be an amount equal to the notional amount of the agreement. Notional amounts of each individual credit default swap agreement outstanding as of January 31, 2018, for which the Fund is the seller of protection is disclosed in the Notes to the Schedule of Investments. These potential amounts would be partially offset by any recovery values of the respective referenced obligations, upfront payments received upon entering into the agreement, or net amounts received from the settlement of buy protection credit default swap agreements entered into by the Fund for the same referenced entity or entities.
During the year ended January 31, 2018, the GLG Total Return Fund entered into credit default swaps primarily for return enhancement, hedging, and exposing cash to markets.
The Fund’s credit default swap contract notional amounts outstanding fluctuate throughout the operating year as required to meet the strategic requirements. The following table illustrates the average quarterly volume of credit default swap contracts. For the purpose of this disclosure, the volume is measure by the notional amounts outstanding at each quarter end.
| | | | |
Average Credit Default Swap Notional Amounts Outstanding | |
Fund | | Year ended
January 31, 2018 | |
GLG Total Return | | $ | 221,525,000 | |
Interest Rate Swap Agreements
The GLG Total Return Fund is subject to interest rate risk exposure in the normal course of pursuing its investment objectives. Because the Fund holds fixed rate bonds, the value of these bonds may decrease if interest rates rise. To help hedge against this risk and to maintain its ability to generate income at prevailing market rates, the Fund may enter into interest rate swap agreements. Interest rate swap agreements involve the exchange by the Fund with another party of their respective commitments to pay or receive interest with respect to the notional amount of principal.
During the year ended January 31, 2018, the GLG Total Return Fund entered into interest rate swaps primarily for return enhancement, hedging and exposing cash to markets.
The Fund’s interest rate swap contract notional amounts outstanding fluctuate throughout the operating year as required to meet the strategic requirements. The following table illustrates the average quarterly volume of interest rate swap contracts. For the purpose of this disclosure, the volume is measured by the notional amounts outstanding at each quarter end.
| | | | |
Average Interest Rate Swap Notional Amounts Outstanding | |
Fund | | Year ended
January 31, 2018 | |
GLG Total Return | | | 435,075,000 | |
47
American Beacon FundsSM
Notes to Financial Statements
January 31, 2018
The following is a summary of the fair valuations of the Funds’ derivative instruments categorized by risk exposure(1):
Global Evolution Frontier Markets Income Fund
| | | | | | | | | | | | | | | | | | | | | | | | | | | | | | | | | | | | | | | | | | | | | | | | | | | | | | | |
| Fair values of financial instruments on the Statements of Assets and Liabilities as of January 31, 2018: | |
|
Derivatives not accounted for as hedging instruments |
| | | | | | | | | | | |
Assets: | | Credit contracts | | | | Foreign exchange
contracts | | | | Commodity
contracts | | | | Interest rate
contracts | | | | Equity contracts | | | | Total |
| Unrealized appreciation of forward foreign currency contracts | | | $ | - | | | | | | | | | $ | 184,776 | | | | | | | | | $ | - | | | | | | | | | $ | - | | | | | | | | | $ | - | | | | | | | | | $ | 184,776 | |
| | | | | | | | | | | |
Liabilities: | | Credit contracts | | | | Foreign exchange
contracts | | | | Commodity
contracts | | | | Interest rate
contracts | | | | Equity contracts | | | | Total |
| Unrealized depreciation of forward foreign currency contracts | | | $ | - | | | | | | | | | $ | (45,359 | ) | | | | | | | | $ | - | | | | | | | | | $ | - | | | | | | | | | $ | - | | | | | | | | | $ | (45,359 | ) |
| | | | | | | | | | | | | | | | | | | | | | | | | | | | | | | | | | | | | | | | | | | | | | | | | | | | | | | |
| The effect of financial derivative instruments on the Statements of Operations as of January 31, 2018: | |
|
Derivatives not accounted for as hedging instruments |
| | | | | | | | | | | |
Realized gain (loss) from derivatives
recognized as a result of operations: | | Credit contracts | | | | Foreign exchange
contracts | | | | Commodity
contracts | | | | Interest rate
contracts | | | | Equity contracts | | | | Total |
| Forward foreign currency contracts | | | $ | - | | | | | | | | | $ | (7,711 | ) | | | | | | | | $ | - | | | | | | | | | $ | - | | | | | | | | | $ | - | | | | | | | | | $ | (7,711 | ) |
| | | | | | | | | | | |
Net change in unrealized appreciation
(depreciation) of derivatives recognized
as a result from operations: | | Credit contracts | | | | Foreign exchange
contracts | | | | Commodity
contracts | | | | Interest rate
contracts | | | | Equity contracts | | | | Total |
| Forward foreign currency contracts | | | $ | - | | | | | | | | | $ | 146,096 | | | | | | | | | $ | - | | | | | | | | | $ | - | | | | | | | | | $ | - | | | | | | | | | $ | 146,096 | |
GLG Total Return Fund
| | | | | | | | | | | | | | | | | | | | | | | | | | | | | | | | | | | | | | | | | | | | | | | | | | | | | | | |
| Fair values of financial instruments on the Statement of Assets and Liabilities as of January 31, 2018: | |
|
Derivatives not accounted for as hedging instruments |
| | | | | | | | | | | |
Assets: | | Credit contracts | | | | Foreign exchange
contracts | | | | Commodity
contracts | | | | Interest rate
contracts | | | | Equity contracts | | | | Total |
| Unrealized appreciation of forward foreign currency contracts | | | $ | - | | | | | | | | | $ | 3,408,659 | | | | | | | | | $ | - | | | | | | | | | $ | - | | | | | | | | | $ | - | | | | | | | | | $ | 3,408,659 | |
| Unrealized appreciation from swap agreements | | | | 83,600 | | | | | | | | | | - | | | | | | | | | | - | | | | | | | | | | - | | | | | | | | | | - | | | | | | | | | | 83,600 | |
| | | | | | | | | | | |
Liabilities: | | Credit contracts | | | | Foreign exchange
contracts | | | | Commodity
contracts | | | | Interest rate
contracts | | | | Equity contracts | | | | Total |
| Unrealized depreciation of forward foreign currency contracts | | | $ | - | | | | | | | | | $ | (8,705,250 | ) | | | | | | | | $ | - | | | | | | | | | $ | - | | | | | | | | | $ | - | | | | | | | | | $ | (8,705,250 | ) |
| Unrealized depreciation from swap agreements | | | | (6,694,253 | ) | | | | | | | | | - | | | | | | | | | | - | | | | | | | | | | (5,595,384 | ) | | | | | | | | | - | | | | | | | | | | (12,289,637 | ) |
48
American Beacon FundsSM
Notes to Financial Statements
January 31, 2018
| | | | | | | | | | | | | | | | | | | | | | | | | | | | | | | | | | | | | | | | | | | | | | | | | | | | | | | |
| The effect of financial derivative instruments on the Statement of Operations as of January 31, 2018: | |
|
Derivatives not accounted for as hedging instruments |
| | | | | | | | | | | |
Realized gain (loss) from derivatives
recognized as a result of operations: | | Credit contracts | | | | Foreign exchange
contracts | | | | Commodity
contracts | | | | Interest rate
contracts | | | | Equity contracts | | | | Total |
| Forward foreign currency contracts | | | $ | - | | | | | | | | | $ | 2,752,629 | | | | | | | | | $ | - | | | | | | | | | $ | - | | | | | | | | | $ | - | | | | | | | | | $ | 2,752,629 | |
| Futures contracts | | | | - | | | | | | | | | | - | | | | | | | | | | - | | | | | | | | | | (9 | ) | | | | | | | | | - | | | | | | | | | | (9 | ) |
| Swap agreements | | | | (3,678,687 | ) | | | | | | | | | - | | | | | | | | | | - | | | | | | | | | | - | | | | | | | | | | - | | | | | | | | | | (3,678,687 | ) |
| | | | | | | | | | | | | | | | | | | | | | | | | | | | | | | | | | | | | | | | | | | | | | | | | | | | | | | |
| | | | | | | | | | | |
Net change in unrealized appreciation
(depreciation) of derivatives
recognized as a result from
operations: | | Credit contracts | | | | Foreign exchange
contracts | | | | Commodity
contracts | | | | Interest rate
contracts | | | | Equity contracts | | | | Total |
| Forward foreign currency contracts | | | $ | - | | | | | | | | | $ | (6,318,307 | ) | | | | | | | | $ | - | | | | | | | | | $ | - | | | | | | | | | $ | - | | | | | | | | | $ | (6,318,307 | ) |
| Swap agreements | | | | (6,514,758 | ) | | | | | | | | | - | | | | | | | | | | - | | | | | | | | | | (5,595,384 | ) | | | | | | | | | - | | | | | | | | | | (12,110,142 | ) |
(1) See Note 3 in the Notes to Financial Statements for additional information.
Master Agreements
International Swaps and Derivatives Association, Inc. Master Agreements (“ISDA Master Agreements”) with counterparties govern transactions in OTC derivative and foreign exchange contracts entered into by the Funds and those counterparties. The ISDA Master Agreements contain provisions for general obligations, representations, agreements, collateral and events of default or termination. Events of termination include conditions that may entitle counterparties to elect to terminate early and cause settlement of all outstanding transactions under the applicable ISDA Master Agreement. Any election to terminate early could be material to the financial statements. Since different types of forward and OTC financial derivative transactions have different mechanics and are sometimes traded out of different legal entities of a particular counterparty organization, each type of transaction may be covered by a different Master Agreement, resulting in the need for multiple agreements with a single counterparty. As the Master Agreements are specific to unique operations of different asset types, they allow a Fund to net its total exposure to a counterparty in the event of a default with respect to all the transactions governed under a single agreement with a counterparty.
Master Securities Forward Transaction Agreements (“Master Forward Agreements”) govern the considerations and factors surrounding the settlement of certain forward settling transactions, such as delayed delivery or sale-buyback financing transactions by and between a Fund and select counterparties. The Master Forward Agreements maintain provisions for, among other things, initiation and confirmation, payment and transfer, events of default, termination, and maintenance of collateral.
6. Principal Risks
Investing in the Funds may involve certain risks including, but not limited to, those described below.
Counterparty Risk
The Funds are subject to the risk that a party or participant to a transaction, such as a broker or derivative counterparty, will be unwilling or unable to satisfy its obligation to make timely principal, interest or settlement payments or to otherwise honor its obligations to the Funds.
Credit Risk
The Funds are subject to the risk that the issuer or guarantor of a debt security, or the counterparty to a derivatives contract or a loan, will fail to make timely payment of interest or principal or otherwise honor its obligations or default completely. Credit risk is typically greater for securities with ratings that are below
49
American Beacon FundsSM
Notes to Financial Statements
January 31, 2018
investment grade (commonly referred to as “junk bonds”). Since the Fund can invest significantly in lower-quality debt securities considered speculative in nature, this risk will be substantial.
Currency Risk
The Funds may have exposure to foreign currencies by making direct investments in non-U.S. currencies or in securities denominated in non-U.S. currencies, purchasing or selling forward foreign currency exchange contracts in non- U.S. currencies, non-U.S. currency futures contracts and swaps for cross-currency investments. Foreign currencies will fluctuate, and may decline, in value relative to the U.S. dollar and other currencies and thereby affect the Funds’ investments in foreign (non-U.S.) currencies or in securities that trade in, and receive revenues in, or in derivatives that provide exposure to, foreign (non-U.S.) currencies.
Custody Risk
The Funds may invest in markets that are less developed than those in the U.S., which may expose the Funds to risks in the process of clearing and settling trades and the holding of securities by foreign banks, agents and depositories. Investments in frontier and emerging markets may be subject to greater custody risks than investments in more developed markets.
Derivatives Risk
Derivatives may involve significant risk. The use of derivative instruments may expose the Funds to additional risks that they would not be subject to if they invested directly in the securities or other instruments underlying those derivatives, including the high degree of leverage often embedded in such instruments, and potential material and prolonged deviations between the theoretical value and realizable value of a derivative. Some derivatives have the potential for unlimited loss, regardless of the size of the Funds’ initial investment. Derivatives may be illiquid and may be more volatile than other types of investments. The Funds may buy or sell derivatives not traded on an exchange and which may be subject to heightened liquidity and valuation risk. Derivative investments can increase portfolio turnover and transaction costs. Derivatives also are subject to counterparty risk. As a result, the Funds may obtain no recovery of their investment or may only obtain a limited recovery, and any recovery may be delayed. Not all derivative transactions require a counterparty to post collateral, which may expose the Funds to greater losses in the event of a default by a counterparty.
Emerging and Frontier Markets Risk
When investing in emerging markets, the risks of investing in foreign securities are heightened. Emerging markets are generally smaller, less developed, less liquid and more volatile than the securities markets of the U.S. and other developed markets. There are also risks of: greater political uncertainties; an economy’s dependence on revenues from particular commodities or on international aid or development assistance; currency transfer restrictions; a limited number of potential buyers for such securities; and delays and disruptions in securities settlement procedures. Frontier market countries generally have smaller economies and less developed capital markets or legal, regulatory and political systems than traditional emerging market countries. As a result, the risks of investing in emerging market countries are magnified in frontier market countries.
Forward Foreign Currency Contracts Risk
Forward foreign currency contracts, including non-deliverable forwards, are derivative instruments pursuant to a contract with a counterparty to pay a fixed price for an agreed amount of securities or other underlying assets at an agreed date or to buy or sell a specific currency at a future date at a price set at the time of the contract. The use of forward foreign currency contracts may expose the Funds to additional risks that it would not be subject to if it invested directly in the securities or currencies underlying the forward foreign currency contract.
50
American Beacon FundsSM
Notes to Financial Statements
January 31, 2018
High Portfolio Turnover Risk
Portfolio turnover is a measure of the Funds’ trading activity over a one-year period. A portfolio turnover rate of 100% would indicate that the Funds sold and replaced the entire value of its securities holdings during the period. High portfolio turnover could increase the Funds’ transaction costs, have a negative impact on performance, and generate higher capital gain distributions to shareholders than if the Funds have a lower portfolio turnover rate.
Interest Rate Risk
The Funds are subject to the risk that the market value of fixed-income securities or derivatives it holds, particularly mortgage backed and other asset backed securities, will decline due to rising interest rates. Generally, the value of investments with interest rate risk, such as fixed-income securities, will move in the opposite direction to movements in interest rates. The Federal Reserve raised the federal funds rate in December 2016, March 2017, June 2017, and December 2017. Interest rates may rise, perhaps significantly and/or rapidly, potentially resulting in substantial losses to the Funds. The prices of fixed-income securities or derivatives are also affected by their duration. Fixed-income securities or derivatives with longer duration generally have greater sensitivity to changes in interest rates. An increase in interest rates can impact markets broadly as well. Some investors buy securities with borrowed money; an increase in interest rates can cause a decline in those markets.
Leverage Risk
The GLG Total Return Fund’s use of futures, forward foreign currency contracts, swaps, other derivative instruments and selling securities short will have the economic effect of financial leverage. Financial leverage magnifies the exposure to the swings in prices of an asset or class of assets underlying a derivative instrument and results in increased volatility, which means that the Fund will have the potential for greater losses than if the Fund does not use the derivative instruments that have a leveraging effect. Leverage may result in losses that exceed the amount originally invested and may accelerate the rate of losses. Leverage tends to magnify, sometimes significantly, the effect of an increase or decrease in the Fund’s exposure to an asset or class of assets and may cause the Fund’s NAV to be volatile.
Liquidity Risk
The Funds are susceptible to the risk that certain fixed-income investments, may have limited marketability or be subject to restrictions on sale, and may be difficult or impossible to purchase or sell at favorable times or prices. The Funds could lose money if they are unable to dispose of an investment at a time that is most beneficial to the Funds. The Funds may be required to dispose of investments at unfavorable times or prices to satisfy obligations, which may result in losses or may be costly to the Funds. For example, the Funds may be forced to sell certain investments at unfavorable prices to meet redemption requests or other cash needs. Judgment plays a greater role in pricing illiquid investments than in investments with more active markets.
Market Risk
The Fund is subject to the risk that the securities markets will move down, sometimes rapidly and unpredictably based on overall economic conditions and other factors. The value of a security may decline due to general market conditions which are not specifically related to a particular company, such as real or perceived adverse economic conditions, changes in the general outlook for corporate earnings, changes in interest or currency rates or adverse investment sentiment generally. Changes in the financial condition of a single issuer can impact a market as a whole.
51
American Beacon FundsSM
Notes to Financial Statements
January 31, 2018
Market Timing Risk
Because the Fund invests in foreign securities, it is particularly subject to the risk of market timing activities. Frequent trading by Fund shareholders poses risks to other shareholders in the Fund, including (i) the dilution of the Fund’s NAV, (ii) an increase in the Fund’s expenses, and (iii) interference with the portfolio manager’s ability to execute efficient investment strategies. Because of specific securities in which the Fund may invest, it could be subject to the risk of market timing activities by shareholders.
Other Investment Companies Risk
The Funds may invest in shares of other registered investment companies, including ETFs and money market funds. To the extent that the Funds invest in shares of other registered investment companies, the Funds will indirectly bear the fees and expenses charged by the underlying funds in addition to the Funds’ direct fees and expenses and will be subject to the risks associated with investments in those funds. For example, ETF shares may trade at a premium or discount to their net asset value. An ETF that tracks an index may not precisely replicate the returns of its benchmark index.
Sovereign and Quasi Sovereign Debt Risk
The Funds normally will have significant investments in sovereign and quasi-sovereign debt securities. These investments are subject to risk of payment delays or defaults due to (1) country cash flow problems, (2) insufficient foreign currency reserves, (3) political considerations, (4) large debt positions relative to the country’s economy, (5) policies toward foreign lenders or investors, (6) the failure to implement economic reforms required by the International Monetary Fund or other multilateral agencies, or (7) an inability or unwillingness to repay debts. It may be particularly difficult to enforce the rights of debt holders in frontier and emerging markets. A governmental entity that defaults on an obligation may request additional time in which to pay or further loans or may seek to restructure its obligations to reduce interest rates or outstanding principal. There is no legal process for collecting sovereign and quasi-sovereign debt that a government does not pay nor are there bankruptcy proceedings through which all or part of the sovereign debt that a governmental entity has not repaid may be collected. Sovereign and quasi-sovereign debt risk is increased for emerging and frontier markets issuers, which are among the largest debtors to commercial banks and foreign governments. At times, certain emerging market countries have declared moratoria on the payment of principal and interest on external debt. Certain emerging market countries have experienced difficulty in servicing their sovereign debt on a timely basis, which has led to defaults and the restructuring of certain indebtedness.
Variable and Floating Rate Securities Risk
The interest rates payable on variable and floating-rate securities are not fixed and may fluctuate based upon changes in market rates. The interest rate on a floating rate security is a variable rate which is tied to another interest rate, such as a money-market index or Treasury bill rate. Variable and floating rate securities are subject to interest rate risk and credit risk.
As short-term interest rates decline, interest payable on floating-rate securities typically decreases. Alternatively, during periods of rising interest rates, interest payable on floating-rate securities typically increases. Changes in the interest rates of floating-rate securities may lag behind changes in market rates or may have limits on the maximum rate change for a given period of time. The value of floating-rate securities may decline if their interest rates do not rise as much, or as quickly, as interest rates in general. Conversely, floating rate securities will not generally increase in value if interest rates decline.
52
American Beacon FundsSM
Notes to Financial Statements
January 31, 2018
Offsetting Assets and Liabilities
The Funds are parties to enforceable master netting agreements between brokers and counterparties which provide for the right to offset under certain circumstances. The Funds employ multiple money managers and counterparties and have elected not to offset qualifying financial and derivative instruments on the Statements of Assets and Liabilities, as such all financial and derivative instruments are presented on a gross basis. The impacts of netting arrangements that provide the right to offset are detailed below. The net amount represents the net receivable or payable that would be due from or to the counterparty in the event of default. Exposure from borrowings and other financing agreements such as repurchase agreements can only be netted across transactions governed by the same Master Agreement with the same legal entity. All amounts reported below represent the balance as of the report date, January 31, 2018.
Global Evolution Frontier Markets Income Fund
| | | | | | | | | | | | |
| Offsetting of Financial and Derivative Assets as of January 31, 2018: | |
| | | Assets | | | | | | Liabilities | |
| Forward Foreign Currency Contracts | | $ | 184,776 | | | | | | | $ | 45,359 | |
| | | | | | | | | | | | |
| Total derivative assets and liabilities in the Statement of Assets and Liabilities | | $ | 184,776 | | | | | | | $ | 45,359 | |
| | | | | | | | | | | | |
| Total derivative assets and liabilities subject to an MNA | | $ | 184,776 | | | | | | | $ | 45,359 | |
| | | | | | | | | | | | |
| | | | | | | | | | | | | | | | | | | | | | | | | | | | | | | | | | | | |
| Financial Assets, Derivatives, and Collateral Received/(Pledged) by Counterparty as of January 31, 2018: | |
| | | | | | | | | | | | | | | Gross Amounts Not Offset in the
Statement of Assets and Liabilities | | | | | | | |
Counterparty | | Gross Amounts of Assets
Presented in the Statement
of Assets and Liabilities | | | | | | Derivatives
Available
for Offset | | | | | | Non-Cash Collateral
Pledged | | | | | | Cash Collateral
Pledged | | | | | | Net Amount | |
| ICBC STANDARD BANK PLC | | $ | 184,776 | | | | | | | $ | - | | | | | | | $ | - | | | | | | | $ | - | | | | | | | $ | 184,776 | |
| | | | | | | |
| | | | | | | | | | | | | | | Gross Amounts Not Offset in the
Statement of Assets and Liabilities | | | | | | | |
Counterparty | | Gross Amounts of Liabilities
Presented in the Statement
of Assets and Liabilities | | | | | | Derivatives
Available
for Offset | | | | | | Non-Cash Collateral
Received | | | | | | Cash Collateral
Received | | | | | | Net Amount | |
| ICBC STANDARD BANK PLC | | $ | 45,359 | | | | | | | $ | - | | | | | | | $ | - | | | | | | | $ | - | | | | | | | $ | 45,359 | |
GLG Total Return Fund
| | | | | | | | | | | | |
| Offsetting of Financial and Derivative Assets as of January 31, 2018: | |
| | | Assets | | | | | | Liabilities | |
| Swap Agreement - OTC | | $ | 83,600 | | | | | | | $ | 12,289,637 | |
| Forward Foreign Currency Contracts | | | 3,408,659 | | | | | | | | 8,705,250 | |
| | | | | | | | | | | | |
| Total derivative assets and liabilities in the Statement of Assets and Liabilities | | $ | 3,492,259 | | | | | | | $ | 20,994,887 | |
| | | | | | | | | | | | |
| Total derivative assets and liabilities subject to an MNA | | $ | 3,492,259 | | | | | | | $ | 20,994,887 | |
| | | | | | | | | | | | |
53
American Beacon FundsSM
Notes to Financial Statements
January 31, 2018
| | | | | | | | | | | | | | | | | | | | | | | | | | | | | | | | | | | | |
| Financial Assets, Derivatives, and Collateral Received/(Pledged) by Counterparty as of January 31, 2018: | |
| | | | | | | | | | | | | | | Gross Amounts Not Offset in the
Statement of Assets and Liabilities | | | | | | | |
Counterparty | | Gross Amounts of Assets
Presented in the Statement
of Assets and Liabilities | | | | | | Derivatives
Available
for Offset | | | | | | Non-Cash Collateral
Pledged | | | | | | Cash Collateral
Pledged | | | | | | Net Amount | |
| Barclays Bank PLC | | $ | 4,478 | | | | | | | $ | (4,478 | ) | | | | | | $ | - | | | | | | | $ | - | | | | | | | $ | - | |
| Barclays Capital, Inc. | | | 21,824 | | | | | | | | (21,824 | ) | | | | | | | - | | | | | | | | - | | | | | | | | - | |
| HSBC Bank (USA) | | | 3,465,957 | | | | | | | | (3,465,957 | ) | | | | | | | - | | | | | | | | - | | | | | | | | - | |
| | | | | | | | | | | | | | | | | | | | | | | | | | | | | | | | | | | | |
| Total | | $ | 3,492,259 | | | | | | | $ | (3,492,259 | ) | | | | | | $ | - | | | | | | | $ | - | | | | | | | $ | - | |
| | | | | | | | | | | | | | | | | | | | | | | | | | | | | | | | | | | | |
| | | | | | | |
| | | | | | | | | | | | | | | Gross Amounts Not Offset in the
Statement of Assets and Liabilities | | | | | | | |
Counterparty | | Gross Amounts of Liabilities
Presented in the Statement
of Assets and Liabilities | | | | | | Derivatives
Available
for Offset | | | | | | Non-Cash Collateral
Received | | | | | | Cash Collateral
Received | | | | | | Net Amount | |
| Bank of America, N.A. | | $ | 482,232 | | | | | | | $ | - | | | | | | | $ | - | | | | | | | $ | 230,000 | | | | | | | $ | 252,232 | |
| Barclays Bank PLC | | | 2,780,277 | | | | | | | | (4,478 | ) | | | | | | | - | | | | | | | | - | | | | | | | | 2,775,799 | |
| Barclays Capital, Inc. | | | 872,084 | | | | | | | | (21,824 | ) | | | | | | | - | | | | | | | | - | | | | | | | | 850,260 | |
| Citibank, N.A. | | | 2,043,072 | | | | | | | | - | | | | | | | | - | | | | | | | | - | | | | | | | | 2,043,072 | |
| Credit Suisse International | | | 104,418 | | | | | | | | - | | | | | | | | - | | | | | | | | - | | | | | | | | 104,418 | |
| Deutsche Bank AG | | | 122,946 | | | | | | | | - | | | | | | | | - | | | | | | | | - | | | | | | | | 122,946 | |
| HSBC Bank (USA) | | | 9,398,171 | | | | | | | | (3,465,957 | ) | | | | | | | - | | | | | | | | - | | | | | | | | 5,932,214 | |
| UBS AG | | | 5,191,687 | | | | | | | | - | | | | | | | | - | | | | | | | | - | | | | | | | | 5,191,687 | |
| | | | | | | | | | | | | | | | | | | | | | | | | | | | | | | | | | | | |
| Total | | $ | 20,994,887 | | | | | | | $ | (3,492,259 | ) | | | | | | $ | - | | | | | | | $ | 230,000 | | | | | | | $ | 17,272,628 | |
| | | | | | | | | | | | | | | | | | | | | | | | | | | | | | | | | | | | |
7. Federal Income and Excise Taxes
It is the policy of each Fund to qualify as a regulated investment company (“RIC”), by complying with all applicable provisions of Subchapter M of the Internal Revenue Code, as amended, and to make distributions of taxable income sufficient to relieve it from substantially all federal income and excise taxes. For federal income tax purposes, each Fund is treated as a single entity for the purpose of determining such qualification.
The Funds do not have any unrecorded tax liabilities in the accompanying financial statements. For the Global Evolution Frontier Markets Income Fund, each of the tax years in the 4 year period ended January 31, 2018 and for the GLG Total Return Fund, each of the tax years in the 2 year period ended January 31, 2018 remain subject to examination by the Internal Revenue Service. If applicable, the Funds recognize interest accrued related to unrecognized tax benefits in interest expense and penalties in “Other expenses” on the Statements of Operations.
The Funds may be subject to taxes imposed by countries in which it invests. Such taxes are generally based on returns of income earned or gains realized or repatriated. Taxes are accrued and applied to net investment income, net realized capital gains and net unrealized appreciation (depreciation), as applicable, as the income is earned or capital gains are recorded.
Dividends are categorized in accordance with income tax regulations which may treat certain transactions differently than U.S. GAAP. Accordingly, the character of distributions and composition of net assets for tax purposes may differ from those reflected in the accompanying financial statements. The Funds also utilize earnings and profits distributed to shareholders on redemptions of shares as part of the dividends paid deduction.
54
American Beacon FundsSM
Notes to Financial Statements
January 31, 2018
The tax character of distributions paid were as follows:
| | | | | | | | | | | | | | | | | | | | | | | | | | | | |
| | | Global Evolution Frontier Markets
Income Fund | | | | | | GLG Total Return Fund | |
| | | Year Ended
January 31, 2018 | | | | | | Year Ended
January 31, 2017 | | | | | | Year Ended
January 31, 2018 | | | | | | From May 20, 2016
to
January 31, 2017 | |
Distributions paid from: | | | | | | | | | | | | | | | | | | | | | | | | | | | | |
Ordinary income* | | | | | | | | | | | | | | | | | | | | | | | | | | | | |
Institutional Class | | $ | 2,845,735 | | | | | | | $ | 95,303 | | | | | | | $ | 34,961 | | | | | | | $ | 99,988 | |
Y Class | | | 3,511,778 | | | | | | | | 188,232 | | | | | | | | 7,933 | | | | | | | | 1,020 | |
Investors Class | | | 2,275,358 | | | | | | | | 128,864 | | | | | | | | 1,537 | | | | | | | | 1,211 | |
A Class | | | 293,772 | | | | | | | | 52,461 | | | | | | | | 1,157 | | | | | | | | 1,020 | |
C Class | | | 214,080 | | | | | | | | 14,541 | | | | | | | | 591 | | | | | | | | 1,020 | |
Ultra Class | | | - | | | | | | | | - | | | | | | | | 5,439,268 | | | | | | | | 502,688 | |
Long-term capital gains | | | | | | | | | | | | | | | | | | | | | | | | | | | | |
Institutional Class | | | - | | | | | | | | 769,911 | | | | | | | | 10 | | | | | | | | 393 | |
Y Class | | | - | | | | | | | | 1,520,652 | | | | | | | | 33 | | | | | | | | 4 | |
Investors Class | | | - | | | | | | | | 1,041,038 | | | | | | | | 5 | | | | | | | | 5 | |
A Class | | | - | | | | | | | | 423,814 | | | | | | | | 3 | | | | | | | | 4 | |
C Class | | | - | | | | | | | | 117,474 | | | | | | | | 3 | | | | | | | | 4 | |
Ultra Class | | | - | | | | | | | | - | | | | | | | | 23,048 | | | | | | | | 2,551 | |
Return of capital | | | | | | | | | | | | | | | | | | | | | | | | | | | | |
Institutional Class | | | - | | | | | | | | - | | | | | | | | 152 | | | | | | | | - | |
Y Class | | | - | | | | | | | | - | | | | | | | | 491 | | | | | | | | - | |
Investors Class | | | - | | | | | | | | - | | | | | | | | 72 | | | | | | | | - | |
A Class | | | - | | | | | | | | - | | | | | | | | 51 | | | | | | | | - | |
C Class | | | | | | | | | | | - | | | | | | | | 50 | | | | | | | | - | |
Ultra Class | | | - | | | | | | | | - | | | | | | | | 341,068 | | | | | | | | - | |
| | | | | | | | | | | | | | | | | | | | | | | | | | | | |
Total distributions paid | | $ | 9,140,723 | | | | | | | $ | 4,352,290 | | | | | | | $ | 5,850,433 | | | | | | | $ | 609,908 | |
| | | | | | | | | | | | | | | | | | | | | | | | | | | | |
* For tax purposes, short-term capital gains are considered ordinary income distributions.
As of January 31, 2018 the components of distributable earnings (deficits) on a tax basis were as follows:
| | | | | | | | | | | | | | | | | | | | | | | | | | | | |
Fund | | Tax Cost | | | | | | Unrealized
Appreciation | | | | | | Unrealized
(Depreciation) | | | | | | Net
Unrealized
Appreciation
(Depreciation) | |
| Global Evolution Frontier Markets Income | | $ | 195,519,577 | | | | | | | $ | 5,353,385 | | | | | | | $ | (2,303,807 | ) | | | | | | $ | 3,049,578 | |
| GLG Total Return | | | 732,770,889 | | | | | | | | 5,334,322 | | | | | | | | (12,572,650 | ) | | | | | | | (7,238,328 | ) |
| | | | | | | | | | | | | | | | | | | | | | | | | | | | | | | | | | | | | | | | | | | | |
Fund | | Net Unrealized
Appreciation
(Depreciation) | | | | | | Undistributed
Ordinary
Income | | | | | | Undistributed
Long-Term
Capital Gains | | | | | | Accumulated
Capital and
Other (Losses) | | | | | | Other Temporary
Differences | | | | | | Distributable
Earnings | |
| Global Evolution Frontier Markets Income | | $ | 3,049,578 | | | | | | | $ | 1,290,220 | | | | | | | $ | - | | | | | | | $ | (15,463,989 | ) | | | | | | $ | - | | | | | | | $ | (11,124,191 | ) |
| GLG Total Return | | | (7,238,328 | ) | | | | | | | - | | | | | | | | - | | | | | | | | (9,615,471 | ) | | | | | | | (1,563 | ) | | | | | | | (16,855,362 | ) |
Financial reporting records are adjusted for permanent book/tax differences to reflect tax character. Financial records are not adjusted for temporary differences. The temporary differences between financial reporting and tax-basis reporting of unrealized appreciation (depreciation) are attributable primarily to the tax deferral of losses from wash sales, amortization of organizational costs, defaulted bond income accruals, straddle deferrals, and the realization for tax purposes of unrealized gains (losses) on certain derivative instruments.
Due to inherent differences in the recognition of income, expenses, and realized gains (losses) under U.S. GAAP and federal income tax regulations, permanent differences between book and tax reporting have been identified and appropriately reclassified on the Statements of Assets and Liabilities.
55
American Beacon FundsSM
Notes to Financial Statements
January 31, 2018
Accordingly, the following amounts represent current year permanent differences derived from foreign currency reclasses, paydown reclasses, swap income reclasses, net operating loss not utilized, and dividends that have been redesignated as of January 31, 2018:
| | | | | | | | | | | | | | | | | | | | | | | | | | | | |
Fund | | Paid-In-Capital | | | | | | Undistributed
(Overdistribution of)
Net Investment
Income | | | | | | Accumulated Net
Realized Gain (Loss) | | | | | | Net Unrealized
Appreciation
(Depreciation) | |
| Global Evolution Frontier Markets Income | | $ | - | | | | | | | $ | (845,407 | ) | | | | | | $ | 845,407 | | | | | | | $ | - | |
| GLG Total Return | | | - | | | | | | | | 2,280,457 | | | | | | | | (2,280,457 | ) | | | | | | | - | |
Under the Regulated Investment Company Modernization Act of 2010 (“RIC MOD”), net capital losses recognized by the Funds in taxable years beginning after December 22, 2010 are carried forward indefinitely and retain their character as short-term and/or long-term losses.
During the year January 31, 2018 the Funds had the following post RIC MOD capital loss carryforwards:
| | | | | | | | | | | | |
Fund | | Short-Term
Capital Loss
Carryforwards | | | | | | Long-Term
Capital Loss
Carryforwards | |
| Global Evolution Frontier Markets Income | | $ | 3,882,282 | | | | | | | $ | 11,581,707 | |
| GLG Total Return | | | - | | | | | | | | - | |
The Funds are permitted for tax purposes to defer into their next fiscal year qualified late year losses. Qualified late year capital losses are any capital losses incurred after October 31 through the Fund’s fiscal year ending January 31, 2018. Qualified late year ordinary losses are specified losses generally incurred after October 31 and ordinary losses incurred after December 31 through the end of the Fund’s fiscal year, January 31, 2018. For the period ended January 31, 2018, GLG deferred $2,013 in short-term capital losses, $465 in long-term capital losses, and $9,612,993 in late year ordinary losses to February 1, 2018.
8. Investment Transactions
The aggregate cost of purchases and proceeds from sales and maturities of investments, other than short-term obligations, for the year ended January 31, 2018 were as follows:
| | | | | | | | | | | | | | | | | | | | | | | | | | | | |
Fund | | Purchases (non-U.S.
Government
Securities) | | | | | | Purchases of U.S.
Government
Securities | | | | | | Sales (non-U.S.
Government
Securities) | | | | | | Sales of U.S.
Government
Securities | |
| Global Evolution Frontier Markets Income | | $ | 123,720,101 | | | | | | | $ | - | | | | | | | $ | 21,323,344 | | | | | | | $ | - | |
| GLG Total Return | | | 127,224,460 | | | | | | | | 218,113,609 | | | | | | | | 58,783,585 | | | | | | | | 241,353,206 | |
A summary of the Funds’ transactions in the USG Select Fund for the year ended January 31, 2018 were as follows:
| | | | | | | | | | | | | | | | | | | | | | | | | | | | | | | | | | | | | | | | | | | | |
Fund | | Type of
Transaction | | | | | | January 31,
2017
Shares/Fair
Value | | | | | | Purchases | | | | | | Sales | | | | | | January 31,
2018
Shares/Fair
Value | | | | | | Dividend
Income | |
| Global Evolution Frontier Markets Income | | | Direct | | | | | | | $ | 2,688,411 | | | | | | | $ | 113,554,726 | | | | | | | $ | 88,394,415 | | | | | | | $ | 27,848,722 | | | | | | | $ | 130,139 | |
| GLG Total Return | | | Direct | | | | | | | | 1,673,669 | | | | | | | | 871,972,563 | | | | | | | | 859,684,976 | | | | | | | | 13,961,256 | | | | | | | | 188,529 | |
56
American Beacon FundsSM
Notes to Financial Statements
January 31, 2018
9. Borrowing Arrangements
Effective November 16, 2017, the Funds, along with certain other funds managed by the Manager (“Participating Funds”), entered into a committed revolving line of credit (the “Committed Line”) agreement with State Street Bank and Trust Company (the “Bank”) to be used to facilitate portfolio liquidity. The maximum borrowing amount under the Committed Line is $50 million with interest at a rate equal to the higher of (a) one-month London Inter-Bank Offered Rate (“LIBOR”) plus 1.25% per annum or (b) the Federal Funds rate plus 1.25% per annum on amounts borrowed. Each of the Participating Funds will pay a commitment fee at a rate of 0.25% per annum on the unused portion of the Committed Line amount. The Committed Line expires November 15, 2018 unless extended by the Bank or terminated by the Participating Funds in accordance with the agreement.
Effective November 16, 2017, the Funds, along with certain other Participating Funds managed by the Manager, entered into an uncommitted discretionary demand revolving line of credit (the “Uncommitted Line”) agreement with the Bank to be used to facilitate portfolio liquidity. The maximum borrowing amount under the Uncommitted Line is $50 million with interest at a rate equal to the higher of (a) one-month LIBOR plus 1.25% per annum or (b) the Federal Funds rate. The Uncommitted Line expires November 15, 2018 unless extended by the Bank or terminated by the Participating Funds in accordance with the agreement.
The Participating Funds paid administration, legal and arrangement fees, which are recognized as a component of “Other expenses” on the Statements of Operations, along with commitment fees, that have been allocated among the Participating Funds based on average daily net assets. During the year ended January 31, 2018, the Funds did not utilize this facility.
10. Capital Share Transactions
The tables below summarize the activity in capital shares for each Class of the Funds:
| | | | | | | | | | | | | | | | | | | | | | | | | | | | |
| | | Institutional Class | |
| | | Year Ended January 31, | |
| | | 2018 | | | | | | 2017 | |
Global Evolution Frontier Markets Income Fund | | Shares | | | | | | Amount | | | | | | Shares | | | | | | Amount | |
| Shares sold | | | 6,139,305 | | | | | | | $ | 57,844,697 | | | | | | | | 493,702 | | | | | | | $ | 4,414,663 | |
| Reinvestment of dividends | | | 194,497 | | | | | | | | 1,822,176 | | | | | | | | 95,060 | | | | | | | | 846,663 | |
| Shares redeemed | | | (759,494 | ) | | | | | | | (7,164,036 | ) | | | | | | | (393,043 | ) | | | | | | | (3,450,022 | ) |
| Redemption fees | | | - | | | | | | | | (626 | ) | | | | | | | - | | | | | | | | 1,420 | |
| | | | | | | | | | | | | | | | | | | | | | | | | | | | |
| Net increase in shares outstanding | | | 5,574,308 | | | | | | | $ | 52,502,211 | | | | | | | | 195,719 | | | | | | | $ | 1,812,724 | |
| | | | | | | | | | | | | | | | | | | | | | | | | | | | |
| | | | |
| | | Y Class | |
| | | Year Ended January 31, | |
| | | 2018 | | | | | | 2017 | |
Global Evolution Frontier Markets Income Fund | | Shares | | | | | | Amount | | | | | | Shares | | | | | | Amount | |
| Shares sold | | | 5,977,636 | | | | | | | $ | 56,371,234 | | | | | | | | 961,556 | | | | | | | $ | 8,569,138 | |
| Reinvestment of dividends | | | 371,040 | | | | | | | | 3,480,135 | | | | | | | | 186,466 | | | | | | | | 1,661,715 | |
| Shares redeemed | | | (787,633 | ) | | | | | | | (7,423,091 | ) | | | | | | | (2,031,446 | ) | | | | | | | (17,271,103 | ) |
| Redemption fees | | | - | | | | | | | | 6,934 | | | | | | | | - | | | | | | | | 2,746 | |
| | | | | | | | | | | | | | | | | | | | | | | | | | | | |
| Net increase/(decrease) in shares outstanding | | | 5,561,043 | | | | | | | $ | 52,435,212 | | | | | | | | (883,424 | ) | | | | | | $ | (7,037,504 | ) |
| | | | | | | | | | | | | | | | | | | | | | | | | | | | |
| | | | |
| | | Investor Class | |
| | | Year Ended January 31, | |
| | | 2018 | | | | | | 2017 | |
Global Evolution Frontier Markets Income Fund | | Shares | | | | | | Amount | | | | | | Shares | | | | | | Amount | |
| Shares sold | | | 2,670,141 | | | | | | | $ | 24,877,596 | | | | | | | | 1,143,932 | | | | | | | $ | 10,163,789 | |
| Reinvestment of dividends | | | 242,444 | | | | | | | | 2,266,383 | | | | | | | | 129,099 | | | | | | | | 1,148,901 | |
| Shares redeemed | | | (836,260 | ) | | | | | | | (7,768,266 | ) | | | | | | | (933,950 | ) | | | | | | | (8,233,420 | ) |
| Redemption fees | | | - | | | | | | | | 3,588 | | | | | | | | - | | | | | | | | 2,061 | |
| | | | | | | | | | | | | | | | | | | | | | | | | | | | |
| Net increase in shares outstanding | | | 2,076,325 | | | | | | | $ | 19,379,301 | | | | | | | | 339,081 | | | | | | | $ | 3,081,331 | |
| | | | | | | | | | | | | | | | | | | | | | | | | | | | |
| | | | |
57
American Beacon FundsSM
Notes to Financial Statements
January 31, 2018
| | | | | | | | | | | | | | | | | | | | | | | | | | | | |
| | | A Class | |
| | | Year Ended January 31, | |
| | | 2018 | | | | | | 2017 | |
Global Evolution Frontier Markets Income Fund | | Shares | | | | | | Amount | | | | | | Shares | | | | | | Amount | |
| Shares sold | | | 246,600 | | | | | | | $ | 2,317,510 | | | | | | | | 232,584 | | | | | | | $ | 2,079,763 | |
| Reinvestment of dividends | | | 30,605 | | | | | | | | 284,937 | | | | | | | | 52,708 | | | | | | | | 469,460 | |
| Shares redeemed | | | (408,936 | ) | | | | | | | (3,828,759 | ) | | | | | | | (665,786 | ) | | | | | | | (5,800,487 | ) |
| Redemption fees | | | - | | | | | | | | 616 | | | | | | | | - | | | | | | | | 792 | |
| | | | | | | | | | | | | | | | | | | | | | | | | | | | |
| Net (decrease) in shares outstanding | | | (131,731 | ) | | | | | | $ | (1,225,696 | ) | | | | | | | (380,494 | ) | | | | | | $ | (3,250,472 | ) |
| | | | | | | | | | | | | | | | | | | | | | | | | | | | |
| | | | |
| | | C Class | |
| | | Year Ended January 31, | |
| | | 2018 | | | | | | 2017 | |
Global Evolution Frontier Markets Income Fund | | Shares | | | | | | Amount | | | | | | Shares | | | | | | Amount | |
| Shares sold | | | 736,515 | | | | | | | $ | 6,959,248 | | | | | | | | 36,625 | | | | | | | $ | 326,184 | |
| Reinvestment of dividends | | | 22,677 | | | | | | | | 212,223 | | | | | | | | 14,074 | | | | | | | | 125,062 | |
| Shares redeemed | | | (75,480 | ) | | | | | | | (705,978 | ) | | | | | | | (103,328 | ) | | | | | | | (922,396 | ) |
| Redemption fees | | | - | | | | | | | | 602 | | | | | | | | - | | | | | | | | 251 | |
| | | | | | | | | | | | | | | | | | | | | | | | | | | | |
| Net increase/(decrease) in shares outstanding | | | 683,712 | | | | | | | $ | 6,466,095 | | | | | | | | (52,629 | ) | | | | | | $ | (470,899 | ) |
| | | | | | | | | | | | | | | | | | | | | | | | | | | | |
| | | | |
| | | Institutional Class | |
| | | Year Ended January 31, | |
| | | 2018 | | | | | | 2017 | |
GLG Total Return Fund | | Shares | | | | | | Amount | | | | | | Shares | | | | | | Amount | |
| Shares sold | | | - | | | | | | | $ | - | | | | | | | | 530,000 | A | | | | | | $ | 5,300,000 | A |
| Reinvestment of dividends | | | 3,291 | | | | | | | | 35,124 | | | | | | | | 9,624 | | | | | | | | 100,381 | |
| Shares redeemed | | | (679,807 | ) | | | | | | | (7,300,030 | ) | | | | | | | (282,462 | ) | | | | | | | (3,000,000 | ) |
| | | | | | | | | | | | | | | | | | | | | | | | | | | | |
| Net increase/(decrease) in shares outstanding | | | (676,516 | ) | | | | | | $ | (7,264,906 | ) | | | | | | | 257,162 | | | | | | | $ | 2,400,381 | |
| | | | | | | | | | | | | | | | | | | | | | | | | | | | |
| | | | |
| | | Y Class | |
| | | Year Ended January 31, | |
| | | 2018 | | | | | | 2017 | |
GLG Total Return Fund | | Shares | | | | | | Amount | | | | | | Shares | | | | | | Amount | |
| Shares sold | | | 99,879 | | | | | | | $ | 1,076,470 | | | | | | | | - | A | | | | | | $ | - | A |
| Reinvestment of dividends | | | 794 | | | | | | | | 8,458 | | | | | | | | 98 | | | | | | | | 1,024 | |
| Shares redeemed | | | (11,543 | ) | | | | | | | (124,763 | ) | | | | | | | - | | | | | | | | - | |
| | | | | | | | | | | | | | | | | | | | | | | | | | | | |
| Net increase in shares outstanding | | | 89,130 | | | | | | | $ | 960,165 | | | | | | | | 98 | | | | | | | $ | 1,024 | |
| | | | | | | | | | | | | | | | | | | | | | | | | | | | |
| | | | |
| | | Investor Class | |
| | | Year Ended January 31, | |
| | | 2018 | | | | | | 2017 | |
GLG Total Return Fund | | Shares | | | | | | Amount | | | | | | Shares | | | | | | Amount | |
| Shares sold | | | 2,242 | | | | | | | $ | 24,098 | | | | | | | | 1,961 | A | | | | | | $ | 20,010 | A |
| Reinvestment of dividends | | | 152 | | | | | | | | 1,614 | | | | | | | | 116 | | | | | | | | 1,216 | |
| | | | | | | | | | | | | | | | | | | | | | | | | | | | |
| Net increase in shares outstanding | | | 2,394 | | | | | | | $ | 25,712 | | | | | | | | 2,077 | | | | | | | $ | 21,226 | |
| | | | | | | | | | | | | | | | | | | | | | | | | | | | |
| | | | |
| | | A Class | |
| | | Year Ended January 31, | |
| | | 2018 | | | | | | 2017 | |
GLG Total Return Fund | | Shares | | | | | | Amount | | | | | | Shares | | | | | | Amount | |
| Shares sold | | | - | | | | | | | $ | - | | | | | | | | - | A | | | | | | $ | - | A |
| Reinvestment of dividends | | | 114 | | | | | | | | 1,210 | | | | | | | | 98 | | | | | | | | 1,024 | |
| | | | | | | | | | | | | | | | | | | | | | | | | | | | |
| Net increase in shares outstanding | | | 114 | | | | | | | $ | 1,210 | | | | | | | | 98 | | | | | | | $ | 1,024 | |
| | | | | | | | | | | | | | | | | | | | | | | | | | | | |
| | | | |
| | | C Class | |
| | | Year Ended January 31, | |
| | | 2018 | | | | | | 2017 | |
GLG Total Return Fund | | Shares | | | | | | Amount | | | | | | Shares | | | | | | Amount | |
| Shares sold | | | - | | | | | | | $ | - | | | | | | | | - | A | | | | | | $ | - | A |
| Reinvestment of dividends | | | 62 | | | | | | | | 644 | | | | | | | | 99 | | | | | | | | 1,024 | |
| | | | | | | | | | | | | | | | | | | | | | | | | | | | |
| Net increase in shares outstanding | | | 62 | | | | | | | $ | 644 | | | | | | | | 99 | | | | | | | $ | 1,024 | |
| | | | | | | | | | | | | | | | | | | | | | | | | | | | |
| | | | |
58
American Beacon FundsSM
Notes to Financial Statements
January 31, 2018
| | | | | | | | | | | | | | | | | | | | | | | | | | | | |
| | | Ultra Class | |
| | | Year Ended January 31, | |
| | | 2018 | | | | | | 2017 | |
GLG Total Return Fund | | Shares | | | | | | Amount | | | | | | Shares | | | | | | Amount | |
| Shares sold | | | 73,646,676 | | | | | | | $ | 792,613,671 | | | | | | | | 6,974,431 | A | | | | | | $ | 73,521,990 | A |
| Reinvestment of dividends | | | 12,855 | | | | | | | | 137,054 | | | | | | | | 99 | | | | | | | | 1,038 | |
| Shares redeemed | | | (9,080,295 | ) | | | | | | | (97,390,518 | ) | | | | | | | (688,884 | ) | | | | | | | (7,249,211 | ) |
| | | | | | | | | | | | | | | | | | | | | | | | | | | | |
| Net increase in shares outstanding | | | 64,579,236 | | | | | | | $ | 695,360,207 | | | | | | | | 6,285,646 | | | | | | | $ | 66,273,817 | |
| | | | | | | | | | | | | | | | | | | | | | | | | | | | |
A Seed capital was received in the amount of $4,500,000 for the Institutional, and $100,000 each for Y, Investor, A, C and Ultra Classes, respectively. As a result, shares were issued in the amount of 450,000 for the Institutional class and 100,000 for each remaining classes, respectively.
11. Subsequent Events
Global Evolution USA, LLC (“Global Evolution”), subadvisor to the American Beacon Global Evolution Frontier Markets Income Fund (the “Fund”), advised American Beacon Advisors, Inc. that it will undergo a change in control following the acquisition of a 45 percent interest in Global Evolution’s parent company by Conning Holdings Limited. The transaction is expected to close in March 2018, subject to customary regulatory approvals and closing conditions. The Fund’s management team at Global Evolution will remain in place and there will be no impact to the Fund as a result in the change in control.
59
American Beacon Global Evolution Frontier Markets Income FundSM
Financial Highlights
(For a share outstanding throughout the period)
| | | | | | | | | | | | | | | | | | | | | | | | | | | | |
| | | Institutional Class | |
| | | Year Ended January 31, | | | | | | February 25,
2014A to
January 31, | |
| | | | | | | | |
| | | 2018 | | | | | | 2017 | | | | | | 2016 | | | | | | 2015 | |
| | | | |
Net asset value, beginning of period | | $ | 8.96 | | | | | | | $ | 8.35 | | | | | | | $ | 9.68 | | | | | | | $ | 10.00 | |
| | | | | | | | | | | | | | | | | | | | | | | | | | | | |
Income (loss) from investment operations: | | | | | | | | | | | | | | | | | | | | | | | | | | | | |
Net investment income | | | 0.77 | | | | | | | | 0.88 | | | | | | | | 0.67 | | | | | | | | 0.59 | |
Net gains (losses) on investments (both realized and unrealized) | | | 0.61 | | | | | | | | 0.44 | | | | | | | | (1.30 | ) | | | | | | | (0.30 | ) |
| | | | | | | | | | | | | | | | | | | | | | | | | | | | |
Total income (loss) from investment operations | | | 1.38 | | | | | | | | 1.32 | | | | | | | | (0.63 | ) | | | | | | | 0.29 | |
| | | | | | | | | | | | | | | | | | | | | | | | | | | | |
Less distributions: | | | | | | | | | | | | | | | | | | | | | | | | | | | | |
Dividends from net investment income | | | (0.72 | ) | | | | | | | (0.08 | ) | | | | | | | (0.50 | ) | | | | | | | (0.59 | ) |
Distributions from net realized gains | | | - | | | | | | | | - | | | | | | | | - | | | | | | | | (0.02 | ) |
Tax return of capital | | | - | | | | | | | | (0.63 | )H | | | | | | | (0.20 | )H | | | | | | | - | |
| | | | | | | | | | | | | | | | | | | | | | | | | | | | |
Total distributions | | | (0.72 | ) | | | | | | | (0.71 | ) | | | | | | | (0.70 | ) | | | | | | | (0.61 | ) |
| | | | | | | | | | | | | | | | | | | | | | | | | | | | |
Redemption fees added to beneficial interestsB | | | - | | | | | | | | - | | | | | | | | - | | | | | | | | - | |
| | | | | | | | | | | | | | | | | | | | | | | | | | | | |
Net asset value, end of period | | $ | 9.62 | | | | | | | $ | 8.96 | | | | | | | $ | 8.35 | | | | | | | $ | 9.68 | |
| | | | | | | | | | | | | | | | | | | | | | | | | | | | |
Total returnC | | | 15.92 | % | | | | | | | 16.20 | % | | | | | | | (6.98 | )% | | | | | | | 2.76 | %D |
| | | | | | | | | | | | | | | | | | | | | | | | | | | | |
|
Ratios and supplemental data: | |
Net assets, end of period | | $ | 67,653,731 | | | | | | | $ | 13,047,515 | | | | | | | $ | 10,531,288 | | | | | | | $ | 9,225,629 | |
Ratios to average net assets: | | | | | | | | | | | | | | | | | | | | | | | | | | | | |
Expenses, before reimbursements or recoupments | | | 1.17 | % | | | | | | | 1.40 | % | | | | | | | 1.14 | % | | | | | | | 1.95 | %E |
Expenses, net of reimbursements or recoupments | | | 1.15 | % | | | | | | | 1.27 | %F | | | | | | | 1.15 | % | | | | | | | 1.15 | %E |
Net investment income, before expense reimbursements or recoupments | | | 9.04 | % | | | | | | | 9.98 | % | | | | | | | 7.14 | % | | | | | | | 5.43 | %E |
Net investment income, net of reimbursements or recoupments | | | 9.06 | % | | | | | | | 10.11 | % | | | | | | | 7.13 | % | | | | | | | 6.22 | %E |
Portfolio turnover rate | | | 22 | % | | | | | | | 69 | % | | | | | | | 68 | % | | | | | | | 23 | %G |
| A | February 25, 2014 is the inception date of the Global Evolution Frontier Markets Income Fund. |
| B | Amount represents less than $0.01 per share. |
| C | Based on net asset value, which does not reflect the sales charge, redemption fee, or contingent deferred sales charge, if applicable. May include adjustments in accordance with U.S. GAAP and as such, the net asset value for reporting purposes and the returns based upon those net asset values may differ from the net asset value and returns for shareholder transactions. |
| F | Voluntary expense cap. See Note 2 of the Notes to the Financial Statements. |
| G | Portfolio turnover rate is for the period from February 25, 2014 through January 31, 2015 and is not annualized. |
| H | Return of capital is calculated based on outstanding shares at the time of distribution. |
See accompanying notes
60
American Beacon Global Evolution Frontier Markets Income FundSM
Financial Highlights
(For a share outstanding throughout the period)
| | | | | | | | | | | | | | | | | | | | | | | | | | | | |
| | | Y Class | |
| | | Year Ended January 31, | | | | | | February 25,
2014A to
January 31, | |
| | | | | | | | |
| | | 2018 | | | | | | 2017 | | | | | | 2016 | | | | | | 2015 | |
| | | | |
Net asset value, beginning of period | | $ | 8.97 | | | | | | | $ | 8.34 | | | | | | | $ | 9.69 | | | | | | | $ | 10.00 | |
| | | | | | | | | | | | | | | | | | | | | | | | | | | | |
Income (loss) from investment operations: | | | | | | | | | | | | | | | | | | | | | | | | | | | | |
Net investment income | | | 0.79 | | | | | | | | 0.90 | | | | | | | | 0.61 | | | | | | | | 0.58 | |
Net gains (losses) on investments (both realized and unrealized) | | | 0.58 | | | | | | | | 0.44 | | | | | | | | (1.28 | ) | | | | | | | (0.28 | ) |
| | | | | | | | | | | | | | | | | | | | | | | | | | | | |
Total income (loss) from investment operations | | | 1.37 | | | | | | | | 1.34 | | | | | | | | (0.67 | ) | | | | | | | 0.30 | |
| | | | | | | | | | | | | | | | | | | | | | | | | | | | |
Less distributions: | | | | | | | | | | | | | | | | | | | | | | | | | | | | |
Dividends from net investment income | | | (0.71 | ) | | | | | | | (0.08 | ) | | | | | | | (0.50 | ) | | | | | | | (0.59 | ) |
Distributions from net realized gains | | | - | | | | | | | | - | | | | | | | | - | | | | | | | | (0.02 | ) |
Tax return of capital | | | - | | | | | | | | (0.63 | )H | | | | | | | (0.18 | )H | | | | | | | - | |
| | | | | | | | | | | | | | | | | | | | | | | | | | | | |
Total distributions | | | (0.71 | ) | | | | | | | (0.71 | ) | | | | | | | (0.68 | ) | | | | | | | (0.61 | ) |
| | | | | | | | | | | | | | | | | | | | | | | | | | | | |
Redemption fees added to beneficial interestsB | | | - | | | | | | | | - | | | | | | | | - | | | | | | | | - | |
| | | | | | | | | | | | | | | | | | | | | | | | | | | | |
Net asset value, end of period | | $ | 9.63 | | | | | | | $ | 8.97 | | | | | | | $ | 8.34 | | | | | | | $ | 9.69 | |
| | | | | | | | | | | | | | | | | | | | | | | | | | | | |
Total returnC | | | 15.83 | % | | | | | | | 16.37 | % | | | | | | | (7.40 | )% | | | | | | | 2.87 | %D |
| | | | | | | | | | | | | | | | | | | | | | | | | | | | |
|
Ratios and supplemental data: | |
Net assets, end of period | | $ | 79,007,953 | | | | | | | $ | 23,715,300 | | | | | | | $ | 29,434,613 | | | | | | | $ | 138,082,358 | |
Ratios to average net assets: | | | | | | | | | | | | | | | | | | | | | | | | | | | | |
Expenses, before reimbursements or recoupments | | | 1.25 | % | | | | | | | 1.48 | % | | | | | | | 1.18 | % | | | | | | | 1.50 | %E |
Expenses, net of reimbursements or recoupments | | | 1.25 | % | | | | | | | 1.37 | %F | | | | | | | 1.25 | % | | | | | | | 1.25 | %E |
Net investment income, before expense reimbursements or recoupments | | | 8.94 | % | | | | | | | 10.49 | % | | | | | | | 7.35 | % | | | | | | | 6.33 | %E |
Net investment income, net of reimbursements or recoupments | | | 8.94 | % | | | | | | | 10.61 | % | | | | | | | 7.28 | % | | | | | | | 6.59 | %E |
Portfolio turnover rate | | | 22 | % | | | | | | | 69 | % | | | | | | | 68 | % | | | | | | | 23 | %G |
| A | February 25, 2014 is the inception date of the Global Evolution Frontier Markets Income Fund. |
| B | Amount represents less than $0.01 per share. |
| C | Based on net asset value, which does not reflect the sales charge, redemption fee, or contingent deferred sales charge, if applicable. May include adjustments in accordance with U.S. GAAP and as such, the net asset value for reporting purposes and the returns based upon those net asset values may differ from the net asset value and returns for shareholder transactions. |
| F | Voluntary expense cap. See Note 2 of the Notes to the Financial Statements. |
| G | Portfolio turnover rate is for the period from February 25, 2014 through January 31, 2015 and is not annualized. |
| H | Return of capital is calculated based on outstanding shares at the time of distribution. |
See accompanying notes
61
American Beacon Global Evolution Frontier Markets Income FundSM
Financial Highlights
(For a share outstanding throughout the period)
| | | | | | | | | | | | | | | | | | | | | | | | | | | | |
| | | Investor Class | |
| | | Year Ended January 31, | | | | | | February 25,
2014A to
January 31, | |
| | | | | | | | |
| | | 2018 | | | | | | 2017 | | | | | | 2016 | | | | | | 2015 | |
| | | | |
Net asset value, beginning of period | | $ | 8.95 | | | | | | | $ | 8.35 | | | | | | | $ | 9.68 | | | | | | | $ | 10.00 | |
| | | | | | | | | | | | | | | | | | | | | | | | | | | | |
Income (loss) from investment operations: | | | | | | | | | | | | | | | | | | | | | | | | | | | | |
Net investment income | | | 0.78 | | | | | | | | 0.85 | | | | | | | | 0.63 | | | | | | | | 0.55 | |
Net gains (losses) on investments (both realized and unrealized) | | | 0.57 | | | | | | | | 0.43 | | | | | | | | (1.30 | ) | | | | | | | (0.29 | ) |
| | | | | | | | | | | | | | | | | | | | | | | | | | | | |
Total income (loss) from investment operations | | | 1.35 | | | | | | | | 1.28 | | | | | | | | (0.67 | ) | | | | | | | 0.26 | |
| | | | | | | | | | | | | | | | | | | | | | | | | | | | |
Less distributions: | | | | | | | | | | | | | | | | | | | | | | | | | | | | |
Dividends from net investment income | | | (0.69 | ) | | | | | | | (0.07 | ) | | | | | | | (0.47 | ) | | | | | | | (0.56 | ) |
Distributions from net realized gains | | | - | | | | | | | | - | | | | | | | | - | | | | | | | | (0.02 | ) |
Tax return of capital | | | - | | | | | | | | (0.61 | )H | | | | | | | (0.19 | )H | | | | | | | - | |
| | | | | | | | | | | | | | | | | | | | | | | | | | | | |
Total distributions | | | (0.69 | ) | | | | | | | (0.68 | ) | | | | | | | (0.66 | ) | | | | | | | (0.58 | ) |
| | | | | | | | | | | | | | | | | | | | | | | | | | | | |
Redemption fees added to beneficial interestsB | | | - | | | | | | | | - | | | | | | | | - | | | | | | | | - | |
| | | | | | | | | | | | | | | | | | | | | | | | | | | | |
Net asset value, end of period | | $ | 9.61 | | | | | | | $ | 8.95 | | | | | | | $ | 8.35 | | | | | | | $ | 9.68 | |
| | | | | | | | | | | | | | | | | | | | | | | | | | | | |
Total returnC | | | 15.59 | % | | | | | | | 15.69 | % | | | | | | | (7.33 | )% | | | | | | | 2.47 | %D |
| | | | | | | | | | | | | | | | | | | | | | | | | | | | |
|
Ratios and supplemental data: | |
Net assets, end of period | | $ | 41,560,845 | | | | | | | $ | 20,120,332 | | | | | | | $ | 15,934,048 | | | | | | | $ | 13,987,805 | |
Ratios to average net assets: | | | | | | | | | | | | | | | | | | | | | | | | | | | | |
Expenses, before reimbursements or recoupments | | | 1.41 | % | | | | | | | 1.72 | % | | | | | | | 1.44 | % | | | | | | | 1.78 | %E |
Expenses, net of reimbursements or recoupments | | | 1.51 | % | | | | | | | 1.63 | %F | | | | | | | 1.53 | % | | | | | | | 1.53 | %E |
Net investment income, before expense reimbursements or recoupments | | | 8.73 | % | | | | | | | 9.62 | % | | | | | | | 6.84 | % | | | | | | | 5.86 | %E |
Net investment income, net of reimbursements or recoupments | | | 8.64 | % | | | | | | | 9.71 | % | | | | | | | 6.76 | % | | | | | | | 6.12 | %E |
Portfolio turnover rate | | | 22 | % | | | | | | | 69 | % | | | | | | | 68 | % | | | | | | | 23 | %G |
| A | February 25, 2014 is the inception date of the Global Evolution Frontier Markets Income Fund. |
| B | Amount represents less than $0.01 per share. |
| C | Based on net asset value, which does not reflect the sales charge, redemption fee, or contingent deferred sales charge, if applicable. May include adjustments in accordance with U.S. GAAP and as such, the net asset value for reporting purposes and the returns based upon those net asset values may differ from the net asset value and returns for shareholder transactions. |
| F | Voluntary expense cap. See Note 2 of the Notes to the Financial Statements. |
| G | Portfolio turnover rate is for the period from February 25, 2014 through January 31, 2015 and is not annualized. |
| H | Return of capital is calculated based on outstanding shares at the time of distribution. |
See accompanying notes
62
American Beacon Global Evolution Frontier Markets Income FundSM
Financial Highlights
(For a share outstanding throughout the period)
| | | | | | | | | | | | | | | | | | | | | | | | | | | | |
| | | A Class | |
| | | Year Ended January 31, | | | | | | February 25,
2014A to
January 31, | |
| | | | | | | | |
| | | 2018 | | | | | | 2017 | | | | | | 2016 | | | | | | 2015 | |
| | | | |
Net asset value, beginning of period | | $ | 8.96 | | | | | | | $ | 8.35 | | | | | | | $ | 9.68 | | | | | | | $ | 10.00 | |
| | | | | | | | | | | | | | | | | | | | | | | | | | | | |
Income (loss) from investment operations: | | | | | | | | | | | | | | | | | | | | | | | | | | | | |
Net investment income | | | 0.81 | | | | | | | | 0.90 | | | | | | | | 0.62 | | | | | | | | 0.54 | |
Net gains (losses) on investments (both realized and unrealized) | | | 0.53 | | | | | | | | 0.39 | | | | | | | | (1.29 | ) | | | | | | | (0.29 | ) |
| | | | | | | | | | | | | | | | | | | | | | | | | | | | |
Total income (loss) from investment operations | | | 1.34 | | | | | | | | 1.29 | | | | | | | | (0.67 | ) | | | | | | | 0.25 | |
| | | | | | | | | | | | | | | | | | | | | | | | | | | | |
Less distributions: | | | | | | | | | | | | | | | | | | | | | | | | | | | | |
Dividends from net investment income | | | (0.68 | ) | | | | | | | (0.07 | ) | | | | | | | (0.47 | ) | | | | | | | (0.55 | ) |
Distributions from net realized gains | | | - | | | | | | | | - | | | | | | | | - | | | | | | | | (0.02 | ) |
Tax return of capital | | | - | | | | | | | | (0.61 | )H | | | | | | | (0.19 | )H | | | | | | | - | |
| | | | | | | | | | | | | | | | | | | | | | | | | | | | |
Total distributions | | | (0.68 | ) | | | | | | | (0.68 | ) | | | | | | | (0.66 | ) | | | | | | | (0.57 | ) |
| | | | | | | | | | | | | | | | | | | | | | | | | | | | |
Redemption fees added to beneficial interestsB | | | - | | | | | | | | - | | | | | | | | - | | | | | | | | - | |
| | | | | | | | | | | | | | | | | | | | | | | | | | | | |
Net asset value, end of period | | $ | 9.62 | | | | | | | $ | 8.96 | | | | | | | $ | 8.35 | | | | | | | $ | 9.68 | |
| | | | | | | | | | | | | | | | | | | | | | | | | | | | |
Total returnC | | | 15.51 | % | | | | | | | 15.77 | % | | | | | | | (7.36 | )% | | | | | | | 2.42 | %D |
| | | | | | | | | | | | | | | | | | | | | | | | | | | | |
|
Ratios and supplemental data: | |
Net assets, end of period | | $ | 3,726,687 | | | | | | | $ | 4,648,954 | | | | | | | $ | 7,513,980 | | | | | | | $ | 15,782,502 | |
Ratios to average net assets: | | | | | | | | | | | | | | | | | | | | | | | | | | | | |
Expenses, before reimbursements or recoupments | | | 1.48 | % | | | | | | | 1.78 | % | | | | | | | 1.52 | % | | | | | | | 1.88 | %E |
Expenses, net of reimbursements or recoupments | | | 1.55 | % | | | | | | | 1.67 | %F | | | | | | | 1.55 | % | | | | | | | 1.55 | %E |
Net investment income, before expense reimbursements or recoupments | | | 8.65 | % | | | | | | | 9.85 | % | | | | | | | 6.89 | % | | | | | | | 5.82 | %E |
Net investment income, net of reimbursements or recoupments | | | 8.58 | % | | | | | | | 9.96 | % | | | | | | | 6.86 | % | | | | | | | 6.15 | %E |
Portfolio turnover rate | | | 22 | % | | | | | | | 69 | % | | | | | | | 68 | % | | | | | | | 23 | %G |
| A | February 25, 2014 is the inception date of the Global Evolution Frontier Markets Income Fund. |
| B | Amount represents less than $0.01 per share. |
| C | Based on net asset value, which does not reflect the sales charge, redemption fee, or contingent deferred sales charge, if applicable. May include adjustments in accordance with U.S. GAAP and as such, the net asset value for reporting purposes and the returns based upon those net asset values may differ from the net asset value and returns for shareholder transactions. |
| F | Voluntary expense cap. See Note 2 of the Notes to the Financial Statements. |
| G | Portfolio turnover rate is for the period from February 25, 2014 through January 31, 2015 and is not annualized. |
| H | Return of capital is calculated based on outstanding shares at the time of distribution. |
See accompanying notes
63
American Beacon Global Evolution Frontier Markets Income FundSM
Financial Highlights
(For a share outstanding throughout the period)
| | | | | | | | | | | | | | | | | | | | | | | | | | | | |
| | | C Class | |
| | | Year Ended January 31, | | | February 25,
2014 to
January 31, | | | | | | Year EndedA
January 31, | |
| | | 2018 | | | | | | 2017 | | | | | | 2016 | | | | | | 2015 | |
| | | | |
Net asset value, beginning of period | | $ | 8.93 | | | | | | | $ | 8.34 | | | | | | | $ | 9.67 | | | | | | | $ | 10.00 | |
| | | | | | | | | | | | | | | | | | | | | | | | | | | | |
Income (loss) from investment operations: | | | | | | | | | | | | | | | | | | | | | | | | | | | | |
Net investment income | | | 0.65 | | | | | | | | 0.83 | | | | | | | | 0.56 | | | | | | | | 0.47 | |
Net gains (losses) on investments (both realized and unrealized) | | | 0.62 | | | | | | | | 0.39 | | | | | | | | (1.30 | ) | | | | | | | (0.30 | ) |
| | | | | | | | | | | | | | | | | | | | | | | | | | | | |
Total income (loss) from investment operations | | | 1.27 | | | | | | | | 1.22 | | | | | | | | (0.74 | ) | | | | | | | 0.17 | |
| | | | | | | | | | | | | | | | | | | | | | | | | | | | |
Less distributions: | | | | | | | | | | | | | | | | | | | | | | | | | | | | |
Dividends from net investment income | | | (0.62 | ) | | | | | | | (0.07 | ) | | | | | | | (0.42 | ) | | | | | | | (0.48 | ) |
Distributions from net realized gains | | | - | | | | | | | | - | | | | | | | | - | | | | | | | | (0.02 | ) |
Tax return of capital | | | - | | | | | | | | (0.56 | )H | | | | | | | (0.17 | )H | | | | | | | - | |
| | | | | | | | | | | | | | | | | | | | | | | | | | | | |
Total distributions | | | (0.62 | ) | | | | | | | (0.63 | ) | | | | | | | (0.59 | ) | | | | | | | (0.50 | ) |
| | | | | | | | | | | | | | | | | | | | | | | | | | | | |
Redemption fees added to beneficial interestsB | | | - | | | | | | | | - | | | | | | | | - | | | | | | | | - | |
| | | | | | | | | | | | | | | | | | | | | | | | | | | | |
Net asset value, end of period | | $ | 9.58 | | | | | | | $ | 8.93 | | | | | | | $ | 8.34 | | | | | | | $ | 9.67 | |
| | | | | | | | | | | | | | | | | | | | | | | | | | | | |
Total returnC | | | 14.66 | % | | | | | | | 14.90 | % | | | | | | | (8.06 | )% | | | | | | | 1.60 | %D |
| | | | | | | | | | | | | | | | | | | | | | | | | | | | |
|
Ratios and supplemental data: | |
Net assets, end of period | | $ | 8,398,773 | | | | | | | $ | 1,724,982 | | | | | | | $ | 2,049,234 | | | | | | | $ | 1,244,636 | |
Ratios to average net assets: | | | | | | | | | | | | | | | | | | | | | | | | | | | | |
Expenses, before reimbursements or recoupments | | | 2.29 | % | | | | | | | 2.55 | % | | | | | | | 2.31 | % | | | | | | | 3.01 | %E |
Expenses, net of reimbursements or recoupments | | | 2.30 | % | | | | | | | 2.30 | % | | | | | | | 2.30 | % | | | | | | | 2.31 | %E |
Net investment income, before expense reimbursements or recoupments | | | 7.81 | % | | | | | | | 8.90 | % | | | | | | | 5.89 | % | | | | | | | 4.62 | %E |
Net investment income, net of reimbursements or recoupments | | | 7.81 | % | | | | | | | 9.14 | % | | | | | | | 5.90 | % | | | | | | | 5.33 | %E |
Portfolio turnover rate | | | 22 | % | | | | | | | 69 | % | | | | | | | 68 | % | | | | | | | 23 | %F |
| A | February 25, 2014 is the inception date of the Global Evolution Frontier Markets Income Fund. |
| B | Amount represents less than $0.01 per share. |
| C | Based on net asset value, which does not reflect the sales charge, redemption fee, or contingent deferred sales charge, if applicable. May include adjustments in accordance with U.S. GAAP and as such, the net asset value for reporting purposes and the returns based upon those net asset values may differ from the net asset value and returns for shareholder transactions. |
| F | Portfolio turnover rate is for the period from February 25, 2014 through January 31, 2015 and is not annualized. |
| H | Return of capital is calculated based on outstanding shares at the time of distribution. |
See accompanying notes
64
American Beacon GLG Total Return FundSM
Financial Highlights
(For a share outstanding throughout the period)
| | | | | | | | | | | | |
| | | Institutional Class | |
| | | Year Ended
January 31, | | | | | | May 20, 2016A to January 31, | |
| | | 2018 | | | | | | 2017 | |
| | | | |
Net asset value, beginning of period | | $ | 10.69 | | | | | | | $ | 10.00 | |
| | | | | | | | | | | | |
Income (loss) from investment operations: | | | | | | | | | | | | |
Net investment income (loss) | | | 0.06 | F | | | | | | | 0.07 | |
Net gains on investments (both realized and unrealized) | | | (0.12 | ) | | | | | | | 0.73 | |
| | | | | | | | | | | | |
Total income (loss) from investment operations | | | (0.06 | ) | | | | | | | 0.80 | |
| | | | | | | | | | | | |
Less distributions: | | | | | | | | | | | | |
Dividends from net investment income | | | (0.11 | ) | | | | | | | (0.10 | ) |
Distributions from net realized gains | | | (0.02 | ) | | | | | | | (0.01 | ) |
Tax return of capital | | | (0.00 | )G H | | | | | | | - | |
| | | | | | | | | | | | |
Total distributions | | | (0.13 | ) | | | | | | | (0.11 | ) |
| | | | | | | | | | | | |
Net asset value, end of period | | $ | 10.50 | | | | | | | $ | 10.69 | |
| | | | | | | | | | | | |
Total returnB | | | (0.64 | )% | | | | | | | 7.95 | %C |
| | | | | | | | | | | | |
| | | |
Ratios and supplemental data: | | | | | | | | | | | | |
Net assets, end of period | | $ | 321,683 | | | | | | | $ | 7,560,278 | |
Ratios to average net assets: | | | | | | | | | | | | |
Expenses, before reimbursements or recoupments | | | 1.03 | % | | | | | | | 2.09 | %D |
Expenses, net of reimbursements or recoupments | | | 1.05 | % | | | | | | | 1.05 | %D |
Net investment income, before expense reimbursements or recoupments | | | 0.49 | % | | | | | | | 0.01 | %D |
Net investment income, net of reimbursements or recoupments | | | 0.46 | % | | | | | | | 1.05 | %D |
Portfolio turnover rate | | | 248 | % | | | | | | | 311 | %E |
| A | May 20, 2016 is the inception date of the GLG Total Return Fund. |
| B | Based on net asset value, which does not reflect the sales charge, redemption fee, or contingent deferred sales charge, if applicable. May include adjustments in accordance with U.S. GAAP and as such, the net asset value for reporting purposes and the returns based upon those net asset values may differ from the net asset value and returns for shareholder transactions. |
| E | Portfolio turnover rate is for the period from May 20, 2016 through January 31, 2017 and is not annualized. |
| F | Per share amounts have been calculated using the average shares method. |
| G | Return of capital is calculated based on shares outstanding at the time of distribution. |
| H | Amount represents less than $0.01 per share. |
See accompanying notes
65
American Beacon GLG Total Return FundSM
Financial Highlights
(For a share outstanding throughout the period)
| | | | | | | | | | | | |
| | | Y Class | |
| | | Year Ended
January 31, | | | | | | May 20, 2016A to January 31, | |
| | | 2018 | | | | | | 2017 | |
| | | | |
Net asset value, beginning of period | | $ | 10.68 | | | | | | | $ | 10.00 | |
| | | | | | | | | | | | |
Income (loss) from investment operations: | | | | | | | | | | | | |
Net investment income | | | 0.09 | | | | | | | | 0.07 | |
Net gains (losses) on investments (both realized and unrealized) | | | (0.17 | ) | | | | | | | 0.72 | |
| | | | | | | | | | | | |
Total income (loss) from investment operations | | | (0.08 | ) | | | | | | | 0.79 | |
| | | | | | | | | | | | |
Less distributions: | | | | | | | | | | | | |
Dividends from net investment income | | | (0.10 | ) | | | | | | | (0.10 | ) |
Distributions from net realized gains | | | (0.02 | ) | | | | | | | (0.01 | ) |
Tax return of capital | | | (0.01 | )F | | | | | | | - | |
| | | | | | | | | | | | |
Total distributions | | | (0.13 | ) | | | | | | | (0.11 | ) |
| | | | | | | | | | | | |
Net asset value, end of period | | $ | 10.47 | | | | | | | $ | 10.68 | |
| | | | | | | | | | | | |
Total returnB | | | (0.78 | )% | | | | | | | 7.85 | %C |
| | | | | | | | | | | | |
| | | |
Ratios and supplemental data: | | | | | | | | | | | | |
Net assets, end of period | | $ | 1,038,736 | | | | | | | $ | 107,884 | |
Ratios to average net assets: | | | | | | | | | | | | |
Expenses, before reimbursements or recoupments | | | 1.18 | % | | | | | | | 5.31 | %D |
Expenses, net of reimbursements or recoupments | | | 1.15 | % | | | | | | | 1.15 | %D |
Net investment income (loss), before expense reimbursements or recoupments | | | 0.18 | % | | | | | | | (3.21 | )%D |
Net investment income, net of reimbursements or recoupments | | | 0.21 | % | | | | | | | 0.95 | %D |
Portfolio turnover rate | | | 248 | % | | | | | | | 311 | %E |
| A | May 20, 2016 is the inception date of the GLG Total Return Fund. |
| B | Based on net asset value, which does not reflect the sales charge, redemption fee, or contingent deferred sales charge, if applicable. May include adjustments in accordance with U.S. GAAP and as such, the net asset value for reporting purposes and the returns based upon those net asset values may differ from the net asset value and returns for shareholder transactions. |
| E | Portfolio turnover rate is for the period from May 20, 2016 through January 31, 2017 and is not annualized. |
| F | Return of capital is calculated based on shares outstanding at the time of distribution. |
See accompanying notes
66
American Beacon GLG Total Return FundSM
Financial Highlights
(For a share outstanding throughout the period)
| | | | | | | | | | | | |
| | | Investor Class | |
| | | Year Ended January 31, | | | | | | May 20, 2016A
to January 31, | |
| | | 2018 | | | | | | 2017 | |
| | | | |
Net asset value, beginning of period | | $ | 10.66 | | | | | | | $ | 10.00 | |
| | | | | | | | | | | | |
Income (loss) from investment operations: | | | | | | | | | | | | |
Net investment income | | | 0.02 | | | | | | | | 0.05 | |
Net gains (losses) on investments (both realized and unrealized) | | | (0.13 | ) | | | | | | | 0.72 | |
| | | | | | | | | | | | |
Total income (loss) from investment operations | | | (0.11 | ) | | | | | | | 0.77 | |
| | | | | | | | | | | | |
Less distributions: | | | | | | | | | | | | |
Dividends from net investment income | | | (0.09 | ) | | | | | | | (0.10 | ) |
Distributions from net realized gains | | | (0.02 | ) | | | | | | | (0.01 | ) |
Tax return of capital | | | (0.01 | )F | | | | | | | - | |
| | | | | | | | | | | | |
Total distributions | | | (0.12 | ) | | | | | | | (0.11 | ) |
| | | | | | | | | | | | |
Net asset value, end of period | | $ | 10.43 | | | | | | | $ | 10.66 | |
| | | | | | | | | | | | |
Total returnB | | | (1.05 | )% | | | | | | | 7.65 | %C |
| | | | | | | | | | | | |
| | | |
Ratios and supplemental data: | | | | | | | | | | | | |
Net assets, end of period | | $ | 150,889 | | | | | | | $ | 128,790 | |
Ratios to average net assets: | | | | | | | | | | | | |
Expenses, before reimbursements or recoupments | | | 2.09 | % | | | | | | | 5.14 | %D |
Expenses, net of reimbursements or recoupments | | | 1.43 | % | | | | | | | 1.43 | %D |
Net investment (loss), before expense reimbursements or recoupments | | | (0.62 | )% | | | | | | | (3.04 | )%D |
Net investment income, net of reimbursements or recoupments | | | 0.03 | % | | | | | | | 0.67 | %D |
Portfolio turnover rate | | | 248 | % | | | | | | | 311 | %E |
| A | May 20, 2016 is the inception date of the GLG Total Return Fund. |
| B | Based on net asset value, which does not reflect the sales charge, redemption fee, or contingent deferred sales charge, if applicable. May include adjustments in accordance with U.S. GAAP and as such, the net asset value for reporting purposes and the returns based upon those net asset values may differ from the net asset value and returns for shareholder transactions. |
| E | Portfolio turnover rate is for the period from May 20, 2016 through January 31, 2017 and is not annualized. |
| F | Return of capital is calculated based on shares outstanding at the time of distribution. |
See accompanying notes
67
American Beacon GLG Total Return FundSM
Financial Highlights
(For a share outstanding throughout the period)
| | | | | | | | | | | | |
| | | A Class | |
| | | Year Ended
January 31,
2018 | | | | | | May 20, 2016A
to January 31,
2017 | |
| | | | |
Net asset value, beginning of period | | $ | 10.66 | | | | | | | $ | 10.00 | |
| | | | | | | | | | | | |
Income (loss) from investment operations: | | | | | | | | | | | | |
Net investment income | | | 0.00 | B | | | | | | | 0.05 | |
Net gains (losses) on investments (both realized and unrealized) | | | (0.12 | ) | | | | | | | 0.72 | |
| | | | | | | | | | | | |
Total income (loss) from investment operations | | | (0.12 | ) | | | | | | | 0.77 | |
| | | | | | | | | | | | |
Less distributions: | | | | | | | | | | | | |
Dividends from net investment income | | | (0.10 | ) | | | | | | | (0.10 | ) |
Distributions from net realized gains | | | (0.02 | ) | | | | | | | (0.01 | ) |
Tax return of capital | | | (0.00 | )B G | | | | | | | - | |
| | | | | | | | | | | | |
Total distributions | | | (0.12 | ) | | | | | | | (0.11 | ) |
| | | | | | | | | | | | |
Net asset value, end of period | | $ | 10.42 | | | | | | | $ | 10.66 | |
| | | | | | | | | | | | |
Total returnC | | | (1.15 | )% | | | | | | | 7.65 | %D |
| | | | | | | | | | | | |
|
Ratios and supplemental data: | |
Net assets, end of period | | $ | 106,439 | | | | | | | $ | 107,660 | |
Ratios to average net assets: | | | | | | | | | | | | |
Expenses, before reimbursements or recoupments | | | 1.42 | % | | | | | | | 5.62 | %E |
Expenses, net of reimbursements or recoupments | | | 1.45 | % | | | | | | | 1.45 | %E |
Net investment income (loss), before expense reimbursements or recoupments | | | 0.05 | % | | | | | | | (3.51 | )%E |
Net investment income, net of reimbursements or recoupments | | | 0.02 | % | | | | | | | 0.65 | %E |
Portfolio turnover rate | | | 248 | % | | | | | | | 311 | %F |
| A | May 20, 2016 is the inception date of the GLG Total Return Fund. |
| B | Amount represents less than $0.01 per share. |
| C | Based on net asset value, which does not reflect the sales charge, redemption fee, or contingent deferred sales charge, if applicable. May include adjustments in accordance with U.S. GAAP and as such, the net asset value for reporting purposes and the returns based upon those net asset values may differ from the net asset value and returns for shareholder transactions. |
| F | Portfolio turnover rate is for the period from May 20, 2016 through January 31, 2017 and is not annualized. |
| G | Return of capital is calculated based on shares outstanding at the time of distribution. |
See accompanying notes
68
American Beacon GLG Total Return FundSM
Financial Highlights
(For a share outstanding throughout the period)
| | | | | | | | | | | | |
| | | C Class | |
| | | Year Ended
January 31,
2018 | | | | | | May 20, 2016A
to January 31,
2017 | |
| | | | |
Net asset value, beginning of period | | $ | 10.61 | | | | | | | $ | 10.00 | |
| | | | | | | | | | | | |
Income (loss) from investment operations: | | | | | | | | | | | | |
Net investment (loss) | | | (0.08 | ) | | | | | | | (0.01 | ) |
Net gains (losses) on investments (both realized and unrealized) | | | (0.12 | ) | | | | | | | 0.73 | |
| | | | | | | | | | | | |
Total income (loss) from investment operations | | | (0.20 | ) | | | | | | | 0.72 | |
| | | | | | | | | | | | |
Less distributions: | | | | | | | | | | | | |
Dividends from net investment income | | | (0.04 | ) | | | | | | | (0.10 | ) |
Distributions from net realized gains | | | (0.02 | ) | | | | | | | (0.01 | ) |
Tax return of capital | | | (0.01 | )F | | | | | | | - | |
| | | | | | | | | | | | |
Total distributions | | | (0.07 | ) | | | | | | | (0.11 | ) |
| | | | | | | | | | | | |
Net asset value, end of period | | $ | 10.34 | | | | | | | $ | 10.61 | |
| | | | | | | | | | | | |
Total returnB | | | (1.95 | )% | | | | | | | 7.15 | %C |
| | | | | | | | | | | | |
|
Ratios and supplemental data: | |
Net assets, end of period | | $ | 105,096 | | | | | | | $ | 107,101 | |
Ratios to average net assets: | | | | | | | | | | | | |
Expenses, before reimbursements or recoupments | | | 2.17 | % | | | | | | | 6.37 | %D |
Expenses, net of reimbursements or recoupments | | | 2.20 | % | | | | | | | 2.20 | %D |
Net investment (loss), before expense reimbursements or recoupments | | | (0.70 | )% | | | | | | | (4.27 | )%D |
Net investment (loss), net of reimbursements or recoupments | | | (0.73 | )% | | | | | | | (0.10 | )%D |
Portfolio turnover rate | | | 248 | % | | | | | | | 311 | %E |
| A | May 20, 2016 is the inception date of the GLG Total Return Fund. |
| B | Based on net asset value, which does not reflect the sales charge, redemption fee, or contingent deferred sales charge, if applicable. May include adjustments in accordance with U.S. GAAP and as such, the net asset value for reporting purposes and the returns based upon those net asset values may differ from the net asset value and returns for shareholder transactions. |
| E | Portfolio turnover rate is for the period from May 20, 2016 through January 31, 2017 and is not annualized. |
| F | Return of capital is calculated based on shares outstanding at the time of distribution. |
See accompanying notes
69
American Beacon GLG Total Return FundSM
Financial Highlights
(For a share outstanding throughout the period)
| | | | | | | | | | | | |
| | | Ultra | |
| | | Year Ended
January 31,
2018 | | | | | | May 20, 2016A
to January 31,
2017 | |
| | | | |
Net asset value, beginning of period | | $ | 10.69 | | | | | | | $ | 10.00 | |
| | | | | | | | | | | | |
Income (loss) from investment operations: | | | | | | | | | | | | |
Net investment income | | | 0.11 | | | | | | | | 0.07 | |
Net gains (losses) on investments (both realized and unrealized) | | | (0.17 | ) | | | | | | | 0.73 | |
| | | | | | | | | | | | |
Total income (loss) from investment operations | | | (0.06 | ) | | | | | | | 0.80 | |
| | | | | | | | | | | | |
Less distributions: | | | | | | | | | | | | |
Dividends from net investment income | | | (0.10 | ) | | | | | | | (0.10 | ) |
Distributions from net realized gains | | | (0.02 | ) | | | | | | | (0.01 | ) |
Tax return of capital | | | (0.01 | )F | | | | | | | - | |
| | | | | | | | | | | | |
Total distributions | | | (0.13 | ) | | | | | | | (0.11 | ) |
| | | | | | | | | | | | |
Net asset value, end of period | | $ | 10.50 | | | | | | | $ | 10.69 | |
| | | | | | | | | | | | |
Total returnB | | | (0.57 | )% | | | | | | | 7.95 | %C |
| | | | | | | | | | | | |
|
Ratios and supplemental data: | |
Net assets, end of period | | $ | 743,861,439 | | | | | | | $ | 67,330,248 | |
Ratios to average net assets: | | | | | | | | | | | | |
Expenses, before reimbursements or recoupments | | | 1.07 | % | | | | | | | 2.09 | %D |
Expenses, net of reimbursements or recoupments | | | 0.95 | % | | | | | | | 0.95 | %D |
Net investment income, before expense reimbursements or recoupments | | | 0.34 | % | | | | | | | 0.76 | %D |
Net investment income, net of reimbursements or recoupments | | | 0.46 | % | | | | | | | 1.91 | %D |
Portfolio turnover rate | | | 248 | % | | | | | | | 311 | %E |
| A | May 20, 2016 is the inception date of the GLG Total Return Fund. |
| B | Based on net asset value, which does not reflect the sales charge, redemption fee, or contingent deferred sales charge, if applicable. May include adjustments in accordance with U.S. GAAP and as such, the net asset value for reporting purposes and the returns based upon those net asset values may differ from the net asset value and returns for shareholder transactions. |
| E | Portfolio turnover rate is for the period from May 20, 2016 through January 31, 2017 and is not annualized. |
| F | Return of capital is calculated based on shares outstanding at the time of distribution. |
See accompanying notes
70
American Beacon FundsSM
Federal Tax Information
January 31, 2018 (Unaudited)
Certain tax information regarding the Funds is required to be provided to shareholders based upon the Funds’ income and distributions for the taxable year ended January 31, 2018. The information and distributions reported herein may differ from information and distributions taxable to the shareholders for the calendar year ended December 31, 2017.
The Funds designated the following items with regard to distributions paid during the fiscal year ended January 31, 2018. All designations are based on financial information available as of this annual report and, accordingly, are subject to change. For each item, it is the intention of the Funds to designate the maximum amount permitted under the Internal Revenue Code of 1986, as amended, and the regulations there under.
| | | | |
Long-Term Capital Gain Distributions: | | | | |
| |
Global Evolution Frontier Markets Income | | $ | - | |
GLG Total Return | | | 23,102 | |
| |
Short-Term Capital Gain Distributions: | | | | |
| |
Global Evolution Frontier Markets Income | | $ | - | |
GLG Total Return | | | 1,136,382 | |
Shareholders received notification in January 2018 of the applicable tax information necessary to prepare their 2017 income tax returns.
71
Trustees and Officers of the American Beacon FundsSM (Unaudited)
The Trustees and officers of the American Beacon Funds (the “Trust”) are listed below, together with their principal occupations during the past five years. The address of each person listed below is 220 Las Colinas Boulevard East, Suite 1200, Irving, Texas 75039. Each Trustee oversees thirty-five funds in the fund complex that includes the Trust, the American Beacon Select Funds and the American Beacon Institutional Funds Trust. The Trust’s Statement of Additional Information contains additional information about the Trustees and is available without charge by calling 1-800-658-5811.
| | | | |
Name, Age and Address | | Position, Term of Office and Length of Time Served with the Trust | | Principal Occupation(s) During Past 5 Years and Current Directorships |
| INTERESTED TRUSTEES | | Term | | |
| | Lifetime of Trust until removal, resignation or retirement* | | |
| | |
| Alan D. Feld** (81) | | Trustee since 1996 | | Sole Shareholder of a professional corporation which is a Partner in the law firm of Akin, Gump, Strauss, Hauer & Feld, LLP (law firm) (1960-Present); Trustee, American Beacon Mileage Funds (1996-2012); Trustee, American Beacon Select Funds (1999-Present); Trustee, American Beacon Master Trust (1996-2012); Trustee, American Beacon Institutional Funds Trust (2017-Present). |
| | |
| NON-INTERESTED TRUSTEES | | Term | | |
| | Lifetime of Trust until removal, resignation or retirement* | | |
| | |
| Gilbert G. Alvarado (48) | | Trustee since 2015 | | Director, Kura MD, Inc. (local telehealth organization) (2015-present); Vice President & CFO, Sierra Health Foundation (health conversion private foundation) (2006-Present); Vice President & CFO, Sierra Health Foundation: Center for Health Program Management (California public benefit corporation) (2012-Present); Director, Innovative North State (2012-2015); Director, Sacramento Regional Technology Alliance (2011-2016); Director, Women’s Empowerment (2009-2014); Director, Valley Healthcare Staffing (2017–present); Trustee, American Beacon Select Funds (2015-Present); Trustee, American Beacon Institutional Funds Trust (2017-Present). |
| | |
| Joseph B. Armes (55) | | Trustee since 2015 | | Chairman & CEO, CSW Industrials f/k/a Capital Southwest Corporation (investment company) (2015-Present); Chairman of the Board of Capital Southwest Corporation, predecessor to CSW Industrials, Inc. (2014-present) (investment company); CEO, Capital Southwest Corporation (2013-2015); President & CEO, JBA Investment Partners (family investment vehicle) (2010-Present); Director and Chair of Audit Committee, RSP Permian (oil and gas producer) (2013-Present); Trustee, American Beacon Select Funds (2015-Present); Trustee, American Beacon Institutional Funds Trust (2017-Present). |
| | |
| Gerard J. Arpey (59) | | Trustee since 2012 | | Director, The Home Depot, Inc. (2015-Present); Partner, Emerald Creek Group (private equity firm) (2011-Present); Director, S.C. Johnson & Son, Inc. (privately held company) (2008-present); Trustee, American Beacon Select Funds (2012-Present); Trustee, American Beacon Institutional Funds Trust (2017-Present). |
| | |
| Brenda A. Cline (57) | | Trustee since 2004 | | Executive Vice President, Chief Financial Officer, Treasurer and Secretary, Kimbell Art Foundation (1993-Present); Director, Range Resources Corporation (oil and natural gas company) (2015-Present); Director, Tyler Technologies, Inc. (public sector software solutions company) (2014-Present); Trustee, American Beacon Mileage Funds (2004-2012); Trustee, American Beacon Select Funds (2004-Present); Trustee, American Beacon Master Trust (2004-2012); Trustee, American Beacon Institutional Funds Trust (2017-Present). |
72
Trustees and Officers of the American Beacon FundsSM (Unaudited)
| | | | |
Name, Age and Address | | Position, Term of Office and Length of Time Served with the Trust | | Principal Occupation(s) During Past 5 Years and Current Directorships |
| NON-INTERESTED TRUSTEES (CONT.) | | Term | | |
| | Lifetime of Trust until removal, resignation or retirement* | | |
| | |
| Eugene J. Duffy (63) | | Trustee since 2008 | | Managing Director, Global Investment Management Distribution, Mesirow Financial (2016-Present); Managing Director, Institutional Services, Intercontinental Real Estate Corporation (2014-Present); Principal and Executive Vice President, Paradigm Asset Management (1994-2014); Director, Sunrise Bank of Atlanta (2008-2013); Trustee, American Beacon Mileage Funds (2008-2012); Trustee, American Beacon Select Funds (2008-Present); Trustee, American Beacon Master Trust (2008-2012); Trustee, American Beacon Institutional Funds Trust (2017-Present). |
| | |
| Douglas A. Lindgren*** (56) | | Trustee since 2018 | | CEO North America, Carne Global Financial Services (2016-2017); Managing Director, IPS Investment Management and Global Head, Content Management, UBS Wealth Management (2010-2016); Managing Director, P&S Hedge Funds, UBS Wealth Management (2008-2010); Managing Director, Head of Alternative Investments, UBS Financial Services, Inc. (2005-2008). |
| | |
| Richard A. Massman (74) | | Trustee since 2004 Chairman since 2008 | | Consultant and General Counsel Emeritus, Hunt Consolidated, Inc. (holding company engaged in oil and gas exploration and production, refining, real estate, farming, ranching and venture capital activities) (2009-Present); Trustee, American Beacon Mileage Funds (2004-2012); Trustee, American Beacon Select Funds (2004-Present); Trustee, American Beacon Master Trust (2004-2012); Trustee, American Beacon Institutional Funds Trust (2017-Present). |
| | |
| Barbara J. McKenna, CFA (54) | | Trustee since 2012 | | Managing Principal, Longfellow Investment Management Company (2005-Present); Trustee, American Beacon Select Funds (2012-Present); Trustee, American Beacon Institutional Funds Trust (2017-Present). |
| | |
| R. Gerald Turner (72) | | Trustee since 2001 | | President, Southern Methodist University (1995-Present); Director, J.C. Penney Company, Inc. (1996-Present); Director, Kronus Worldwide Inc. (chemical manufacturing) (2003-Present); Trustee, American Beacon Mileage Funds (2001-2012); Trustee, American Beacon Select Funds (2001-Present); Trustee, American Beacon Master Trust (2001-2012); Trustee, American Beacon Institutional Funds Trust (2017-Present). |
| | |
| OFFICERS | | Term | | |
| | One Year | | |
| | |
| Gene L. Needles, Jr. (63) | | President since 2009 | | President, CEO and Director, American Beacon Advisors, Inc. (2009-Present); President, CEO and Director, Resolute Investment Managers, Inc. (2015-Present); President, CEO and Director, Resolute Acquisition, Inc. (2015-Present); President, CEO and Director, Resolute Topco, Inc. (2015-Present), President & CEO, Resolute Investment Holdings, LLC (2015-Present); President, CEO and Director, Lighthouse Holdings, Inc. (2009-2015); President and CEO, Lighthouse Holdings Parent, Inc. (2009-2015); Manager, President and CEO, American Private Equity Management, LLC (2012-Present); President, American Beacon Cayman Managed Futures Strategy Fund, Ltd. (2014-Present); Director, Chairman, President and CEO, Alpha Quant Advisors, LLC (2016-Present); Director, ARK Investment Management LLC (2016-Present); Director, Shapiro Capital Management LLC (2017-Present); Member, Investment Advisory Committee, Employees Retirement System of Texas (2017-Present); Trustee, American Beacon NextShares Trust (2015-Present); President, American Beacon Select Funds (2009-Present); President, American Beacon Mileage Funds (2009-2012); President, American Beacon Master Trust (2009–2012); President, American Beacon Institutional Funds Trust (2017-Present). |
73
Trustees and Officers of the American Beacon FundsSM (Unaudited)
| | | | |
Name, Age and Address | | Position, Term of Office and Length of Time Served with the Trust | | Principal Occupation(s) During Past 5 Years and Current Directorships |
| OFFICERS (CONT.) | | Term | | |
| | One Year | | |
| | |
| Rosemary K. Behan (58) | | VP, Secretary and Chief Legal Officer since 2006 | | Vice President and Secretary, American Beacon Advisors, Inc. (2006-Present); Secretary, Resolute Investment Holdings, LLC (2015-Present) Secretary, Resolute Investment Managers, Inc. (2015-Present); Secretary, Resolute Topco, Inc. (2015-Present); Secretary, Resolute Acquisition, Inc. (2015-Present); Secretary, Lighthouse Holdings, Inc. (2008-2015); Secretary, Lighthouse Holdings Parent, Inc. (2008-2015); Secretary, American Private Equity Management, LLC (2008-Present); Secretary, American Beacon Cayman Managed Futures Strategy Fund, Ltd. (2014-Present); Secretary, Alpha Quant Advisors, LLC (2016-Present); Chief Legal Officer, Vice President and Secretary, American Beacon Select Funds (2006-Present); Chief Legal Officer, Vice President and Secretary, American Beacon Mileage Funds (2006-2012); Chief Legal Officer, Vice President and Secretary, American Beacon Master Trust (2006-2012); Chief Legal Officer, Vice President and Secretary, American Beacon Institutional Funds Trust (2017-Present). |
| | |
| Brian E. Brett (57) | | VP since 2004 | | Senior Vice President (2012-Present) and Vice President (2004-2012), American Beacon Advisors, Inc.; Vice President, American Beacon Select Funds (2004-Present); Vice President, American Beacon Mileage Funds (2004-2012); Vice President, American Beacon Master Trust (2004-2012); Vice President, American Beacon Institutional Funds Trust (2017-Present). |
| | |
| Paul B. Cavazos (48) | | VP since 2016 | | Senior Vice President, American Beacon Advisors, Inc. (2016-Present); Chief Investment Officer and Assistant Treasurer, DTE Energy (2007-2016); Vice President, American Beacon Select Funds (2016-Present); Vice President, American Beacon Institutional Funds Trust (2017-Present). |
| | |
| Erica Duncan (47) | | VP Since 2011 | | Vice President, American Beacon Advisors, Inc. (2011-Present); Vice President, American Beacon Select Funds (2011-Present); Vice President, American Beacon Mileage Funds (2011-2012); Vice President, American Beacon Master Trust (2011-2012); Vice President, American Beacon Institutional Funds Trust (2017-Present). |
| | |
| Melinda G. Heika (56) | | Treasurer since 2010 | | Treasurer, American Beacon Advisors, Inc. (2010-Present); Resolute Investment Managers, Inc. (2015-Present); Treasurer, Resolute Acquisition, Inc. (2015-Present); Treasurer, Resolute Topco, Inc. (2015-Present); Treasurer, Resolute Investment Holdings, LLC. (2015-Present); Treasurer, Lighthouse Holdings, Inc. (2010-2015); Treasurer, Lighthouse Holdings Parent Inc., (2010-2015); Treasurer, American Private Equity Management, LLC (2012-Present); Director and Treasurer, American Beacon Cayman Managed Futures Strategy Fund, Ltd. (2014-Present); Treasurer, American Beacon Select Funds (2010-Present); Treasurer, American Beacon Mileage Funds (2010-2012); Treasurer, American Beacon Master Trust (2010-2012); Treasurer, American Beacon Institutional Funds Trust (2017-Present). |
| | |
| Terri L. McKinney (54) | | VP since 2010 | | Vice President (2009-Present) and Managing Director (2003-2009), American Beacon Advisors, Inc.; Vice President, Resolute Investment Managers, Inc. (2017-Present); Vice President, Alpha Quant Advisors, LLC (2016-Present); Vice President, American Beacon Select Funds (2010-Present); Vice President, American Beacon Mileage Funds (2010-2012); Vice President, American Beacon Master Trust (2010-2012); Vice President, American Beacon Institutional Funds Trust (2017-Present). |
74
Trustees and Officers of the American Beacon FundsSM (Unaudited)
| | | | |
Name, Age and Address | | Position, Term of Office and Length of Time Served with the Trust | | Principal Occupation(s) During Past 5 Years and Current Directorships |
| OFFICERS (CONT.) | | Term | | |
| | One Year | | |
| | |
| Jeffrey K. Ringdahl (42) | | VP since 2010 | | Senior Vice President (2013-Present), Vice President (2010-2013), and Director (2015-Present), American Beacon Advisors, Inc.; Vice President, American Beacon Select Funds (2010-Present); Vice President, American Beacon Mileage Funds (2010-2012); Vice President, American Beacon Master Trust (2010-2012); Senior Vice President (2012-Present) and Manager (2015-Present), American Private Equity Management, LLC; Senior Vice President, Lighthouse Holdings, Inc. (2013-2015); Senior Vice President, Lighthouse Holdings Parent, Inc. (2013-2015); Director and Vice President, American Beacon Cayman Managed Futures Strategy Fund, Ltd. (2014-Present); Trustee, American Beacon NextShares Trust (2015-Present); Director and Senior Vice Present, Resolute Investment Holdings, LLC (2015-Present); Director and Senior Vice President, Resolute Topco, Inc. (2015-Present); Director and Senior Vice President, Resolute Acquisition, Inc. (2015-Present); Director and Senior Vice President, Resolute Investment Managers, Inc. (2015-Present); Director, Executive Vice President and Chief Operating Officer, Alpha Quant Advisors, LLC (2016-Present); Vice President, American Beacon Institutional Funds Trust (2017-President); Director, Shapiro Capital Management, LLC (2017-Present). |
| | |
| Samuel J. Silver (54) | | VP Since 2011 | | Vice President, American Beacon Advisors, Inc. (2011-Present); Vice President, American Beacon Select Funds (2011-Present); Vice President, American Beacon Mileage Funds (2011-2012); Vice President, American Beacon Master Trust (2011-2012); American Beacon Institutional Funds Trust (2011-Present). |
| | |
| Christina E. Sears (46) | | Chief Compliance Officer since 2004 and Asst. Secretary since 1999 | | Chief Compliance Officer, American Beacon Advisors, Inc. (2004-Present); Chief Compliance Officer, American Private Equity Management, LLC (2012-Present); Chief Compliance Officer and Vice President, Alpha Quant Advisors, LLC (2016-Present); Chief Compliance Officer (2004-Present) and Assistant Secretary (1999-Present), American Beacon Select Funds; Chief Compliance Officer (2004-2012) and Assistant Secretary (1999-2012), American Beacon Mileage Funds; Chief Compliance Officer (2004-2012) and Assistant Secretary (1999-2012), American Beacon Master Trust; Chief Compliance Officer and Assistant Secretary, American Beacon Institutional Funds Trust (2017-Present). |
| | |
| Sonia L. Bates (61) | | Asst. Treasurer since 2011 | | Assistant Treasurer, American Beacon Advisors, Inc. (2011-Present); Assistant Treasurer, Resolute Investment Managers, Inc. (2015-Present); Assistant Treasurer, Resolute Acquisition, Inc. (2015-Present); Assistant. Treasurer, Resolute Topco, Inc. (2015-Present); Assistant Treasurer, Resolute Investment Holdings, LLC.; Assistant Treasurer, Lighthouse Holdings, Inc. (2011-2015); Assistant Treasurer, Lighthouse Holdings Parent Inc. (2011-2015); Assistant Treasurer, American Private Equity Management, LLC (2012-Present); Assistant Treasurer, American Beacon Select Funds (2011-Present); Assistant Treasurer American Beacon Mileage Funds (2011-2012); Assistant Treasurer, American Beacon Master Trust (2011-2012); Assistant Treasurer, American Beacon Institutional Funds Trust (2017-Present). |
| | |
| Shelley D. Abrahams (43) | | Assistant Secretary since 2008 | | Assistant Secretary, American Beacon Advisors, Inc. (2008-Present); Assistant Secretary, American Beacon Select Funds (2008-Present); Assistant Secretary, American Beacon Mileage Funds (2008-2012); Assistant Secretary, American Beacon Master Trust (2008-2012); Assistant Secretary, American Beacon Institutional Funds Trust (2017-Present). |
75
Trustees and Officers of the American Beacon FundsSM (Unaudited)
| | | | |
Name, Age and Address | | Position, Term of Office and Length of Time Served with the Trust | | Principal Occupation(s) During Past 5 Years and Current Directorships |
| OFFICERS (CONT.) | | Term | | |
| | One Year | | |
| | |
| Rebecca L. Harris (51) | | Assistant Secretary since 2010 | | Vice President, American Beacon Advisors, Inc. (2016-Present); Vice President, Resolute Investment Managers, Inc. (2017-Present); Vice President, Alpha Quant Advisors, LLC (2016-Present); Assistant Secretary, American Beacon Select Funds (2010-Present); Assistant Secretary, American Beacon Mileage Funds (2010-2012); Assistant Secretary, American Beacon Master Trust (2010-2012); Assistant Secretary, American Beacon Institutional Funds Trust (2017-Present). |
| | |
| Diana N. Lai (42) | | Assistant Secretary since 2012 | | Assistant Secretary, American Beacon Advisors, Inc. (2012-Present); Assistant Secretary, American Beacon Select Funds (2012-Present); Assistant Secretary, American Beacon Institutional Funds Trust (2017-Present). |
| | |
| Teresa A. Oxford (59) | | Assistant Secretary since 2015 | | Assistant Secretary, American Beacon Advisors, Inc. (2015-Present); Assistant Secretary, Alpha Quant Advisors, LLC (2016-Present); Assistant Secretary, American Beacon Select Funds (2015-Present); Assistant Secretary, American Beacon Institutional Funds Trust (2017-Present). |
* As of 11/12/2014, the Board adopted a retirement plan that requires Trustees to retire no later than the last day of the calendar year in which they reach the age of 75.
** Mr. Feld is deemed to be an “interested person” of the Trusts, as defined by the 1940 Act. Mr. Feld’s law firm of Akin, Gump, Strauss, Hauer & Feld LLP has provided legal services within the past two fiscal years to one or more of the Trust’s sub-advisors.
*** Douglas A. Lindgren became a new Trustee to each of the Trusts on 1/1/2018.
76
American Beacon FundsSM
Privacy Policy
January 31, 2018 (Unaudited)
The American Beacon Funds recognize and respect the privacy of our shareholders. We are providing this notice to you so you will understand how shareholder information may be collected and used.
We may collect nonpublic personal information about you from one or more of the following sources:
| | • | | information we receive from you on applications or other forms; |
| | • | | information about your transactions with us or our service providers; and |
| | • | | information we receive from third parties. |
We do not disclose any nonpublic personal information about our customers or former customers to anyone, except as permitted by law.
We restrict access to your nonpublic personal information to those employees or service providers who need to know that information to provide products or services to you. To ensure the confidentiality of your nonpublic personal information, we maintain safeguards that comply with federal standards.
77
This page intentionally left blank.
78
This page intentionally left blank.
79
This page intentionally left blank.
80

Delivery of Documents
eDelivery is NOW AVAILABLE - Stop traditional mail delivery and receive your
shareholder reports and summary prospectus on-line. Sign up at
www.americanbeaconfunds.com
If you invest in the Fund through a financial institution, you may be able to receive the Fund’s regulatory mailings, such as the Prospectus, Annual Report and Semi-Annual Report, by e-mail. If you are interested in this option, please go to www.icsdelivery.com and search for your financial institution’s name or contact your financial institution directly.
To obtain more information about the Fund:
| | |
 | |  |
| | |
| By E-mail: | | On the Internet: |
| american_beacon.funds@ambeacon.com | | Visit our website at www.americanbeaconfunds.com |
| | | |
| | | |
| | |

By Telephone: Call (800) 658-5811 | | 
By Mail: American Beacon Funds P.O. Box 219643 Kansas City, MO 64121-9643 |
| |
| |
| |
| | | |
| | | |
| Availability of Quarterly Portfolio Schedules | | Availability of Proxy Voting Policy and Records |
| | |
| In addition to the Schedule of Investments provided in each semi-annual and annual report, the Fund files a complete schedule of its portfolio holdings with the Securities and Exchange Commission (“SEC”) on Form N-Q as of the first and third fiscal quarters. The Fund’s Forms N-Q are available on the SEC’s website at www.sec.gov. The Forms N-Q may also be reviewed and copied at the SEC’s Public Reference Section, 100 F Street, NE, Washington, D.C. 20549-2736. Information regarding the operation of the SEC’s Public Reference Room may be obtained by calling (800)-SEC-0330. A complete schedule of each Fund’s portfolio holdings is also available at www.americanbeaconfunds.com approximately twenty days after the end of each month. | | A description of the policies and procedures the Fund uses to determine how to vote proxies relating to portfolio securities is available in the Fund’s Statement of Additional Information, is available free of charge on the Fund’s website www.americanbeaconfunds.com and by calling 1-800-967-9009 or by accessing the SEC’s website at www.sec.gov. The Fund’s proxy voting record for the most recent year ended June 30 is filed annually with the SEC on Form N-PX. The Fund’s Forms N-PX are available on the SEC’s website at www.sec.gov. The Fund’s proxy voting record may also be obtained by calling 1-800-967-9009. |
Fund Service Providers:
| | | | | | | | | | | | |
CUSTODIAN State Street Bank and Trust Boston, Massachusetts | | | | TRANSFER AGENT DST Asset Manager Solutions, Inc. Kansas City, Missouri | | | | INDEPENDENT REGISTERED PUBLIC ACCOUNTING FIRM PricewaterhouseCoopers LLP Boston, Massachusetts | | | | DISTRIBUTOR Resolute Investment Distributors, Inc. Irving, Texas |
This report is prepared for shareholders of the American Beacon Funds and may be distributed to others only if preceded or accompanied by a current Prospectus or Summary Prospectus.
American Beacon Funds, American Beacon Global Evolution Frontier Markets Income Fund and American Beacon GLG Total Return Fund are service marks of American Beacon Advisors, Inc.
AR 1/18
About American Beacon Advisors
Since 1986, American Beacon Advisors has offered a variety of products and investment advisory services to numerous institutional and retail clients, including a variety of mutual funds, corporate cash management, and separate account management.
Our clients include defined benefit plans, defined contribution plans, foundations, endowments, corporations, financial planners, and other institutional investors. With American Beacon Advisors, you can put the experience of a multi-billion dollar asset management firm to work for your company.
GROSVENOR LONG/SHORT FUND
Because the Fund may invest in fewer issuers than a more diversified portfolio, the fluctuating value of a single holding may have a greater effect on the value of the Fund. The Fund may have high portfolio turnover risk, which could increase the Fund’s transaction costs and possibly have a negative impact on performance. Investing in small- or mid-capitalization stocks may involve greater volatility and lower liquidity than larger company stocks. Investing in foreign securities may involve heightened risk due to currency fluctuations and economic and political risks. Investing in derivative instruments involves liquidity, credit, interest rate and market risks and in some cases the addition of financial leverage, which can magnify these risks. Short sales involve special risks, including greater reliance on the sub-advisor’s ability to accurately anticipate the future value of a security or instrument; the Fund’s losses are potentially unlimited in a short sale.
NUMERIC INTEGRATED ALPHA FUND
Short sales involve special risks, including greater reliance on the sub-advisor’s ability to accurately anticipate the future value of a security or instrument; the Fund’s losses are potentially unlimited in a short sale. Investing in derivative instruments involves liquidity, credit, interest rate and market risks and in some cases the addition of financial leverage, which can magnify these risks. Investing in foreign and emerging market securities may involve heightened risk due to currency fluctuations and economic and political risks. Because the Fund may invest in fewer issuers than a more diversified portfolio, the fluctuating value of a single holding may have a greater effect on the value of the Fund. The Fund may have high portfolio turnover risk, which could increase the Fund’s transaction costs and possibly have a negative impact on performance. Investing in small- or mid-capitalization stocks may involve greater volatility and lower liquidity than larger company stocks.
Please see the prospectus for a complete discussion of the Funds’ risks. There can be no assurances that the investment objectives of the Funds will be met.
Any opinions herein, including forecasts, reflect our judgment as of the end of the reporting period and are subject to change. Each advisor’s strategies and each Fund’s portfolio composition will change depending on economic and market conditions. This report is not a complete analysis of market conditions, and, therefore, should not be relied upon as investment advice. Although economic and market information has been compiled from reliable sources, American Beacon Advisors, Inc. makes no representation as to the completeness or accuracy of the statements contained herein.
American Beacon Funds | January 31, 2018 |
Contents
| | | | |
| |
Additional Fund Information | | | Back Cover | |
President’s Message
| | |
 | | Dear Shareholders, At American Beacon, we are proud to offer a broad range of equity, fixed- income and alternative mutual fund products for institutions and individuals. Our mutual funds – which span the domestic, international, global, frontier and emerging markets – are sub-advised by experienced portfolio managers who employ distinctive investment processes to manage assets through a variety of economic and market conditions. Together, we work diligently to help our clients and shareholders meet their long-term financial goals. Institutional wisdom, enduring value. Since our inception as a pension fiduciary in 1986, American Beacon has focused on identifying and overseeing institutional investment managers and portfolio risk management. In 1987, we leveraged our size and experience to launch a series of sub-advised, multi- |
manager mutual funds providing individual investors access to many of the same institutional managers as our pension clients. Following the financial crisis in 2008, we saw that investors were looking for unique solutions from managers who were not necessarily mainstream. In 2010, we began offering mutual funds from single managers with distinctive investment styles or asset classes. As we continue to expand our family of funds, our solutions- based approach provides innovative investments.
Guiding principles. Our “manager of managers” philosophy is built on a long-standing history of innovative thinking, discipline and consistency in applying our solutions-based approach. As a manager of managers, our goal is to engage the most effective money managers for each asset class, investment style or market strategy – whether through a single sub-advisor or a combination of sub-advisors. Because we take our fiduciary responsibilities very seriously, our thorough manager evaluation and selection process is rigorous and ongoing. Our guiding principles – predictability, style consistency, competitive pricing and long-term relationships – provide a strong foundation for our due-diligence process. Our broad range of mutual funds helps investors navigate the economic storms and market downturns in the U.S. and abroad. Our years of experience evaluating sub-advisors have led us to identify and partner with asset managers who have adhered to their disciplined processes for many years and through multiple market cycles.
Focus on asset protection and risk mitigation. We strive to provide innovative, long-term products without gimmicks. From offering some of the first multi-manager funds, one of the first retirement-income funds and the first open-end mutual fund in the U.S. to focus primarily on frontier-market debt, our robust history includes applying a disciplined, solutions-based approach to our product development process to help protect assets and mitigate risk.
Thank you for your continued interest in American Beacon. For additional information about our funds or to access your account information, please visit our website at www.americanbeaconfunds.com.
Best Regards,

Gene L. Needles, Jr.
President
American Beacon Funds
1
Global Equity Market Overview
January 31, 2018 (Unaudited)
Global equity markets produced very strong returns for the 12-month period ended January 31, 2018, evidenced by the 27.5% return of the MSCI All Country World Index. Market conditions characterized by low volatility, central-bank accommodation, low inflation and strong corporate results provided a healthy backdrop for equity markets.
Domestic small-cap stocks, represented by the Russell 2000 Index, returned 17.2%. Small caps underperformed large-cap stocks, represented by the S&P 500 Index, which returned 26.4%. Remarkably, the S&P 500 Index only had one instance during the period where it was down more than 0.5% on consecutive trading days. From a sector perspective within the S&P 500 Index, all sectors produced positive returns for the year. The top performers were Information Technology up 43.1% and Financials up 29.8%. On the other hand, lagging sectors included Telecommunications Services up 1.8%, Energy up 6.6% and Real Estate up 8.8%. From a style standpoint, investors favored growth stocks, which easily outperformed value as demonstrated by the Russell 3000 Growth Index return of 34.1% compared to the Russell 3000 Value Index return of 16.7%.
International, developed markets provided strong returns over the period as the MSCI EAFE Index was up 27.6%. In Europe, the high returns were broad-based – represented by the MSCI Italy Index up 47.2%, the MSCI France Index up 37.0%, the MSCI Germany Index up 31.2% and the MSCI United Kingdom Index up 24.4% – as investors bid up shares in an improving European economy. In Japan, the MSCI Japan Index returned an impressive 25.0% as Prime Minister Shinzo Abe’s market-friendly reform efforts continued to take hold.
In the developing world, emerging markets (“EMs”) had an extraordinary year as rising commodity prices and positive investor sentiment lifted stocks. The MSCI Emerging Markets Index returned 41.0%. China, the largest country classified as an EM, led the way during the period with the MSCI China Index up an astonishing 62.3%. Other notable EM markets included the MSCI Poland Index up 52.4%, the MSCI India Index up 37.6% and the MSCI Brazil Index up 31.0%. The MSCI Mexico Index was up 22.4%, weak relative to other EMs, as investors worried about the outcome of ongoing NAFTA negotiations and a presidential election in the summer of 2018.
2
American Beacon Grosvenor Long/Short FundSM
Performance Overview
January 31, 2018 (Unaudited)
The Investor Class of the American Beacon Grosvenor Long/Short Fund (the “Fund”) returned 13.99% for the twelve months ended January 31, 2018. The Fund underperformed the long-only MSCI World Index (the “Index”) return of 25.83%, and for additional comparison, the Fund outperformed the Morningstar Long/Short Equity category average return of 13.39%.
Comparison of Change in Value of a $10,000 Investment for the period from 10/1/2015 through 1/31/2018
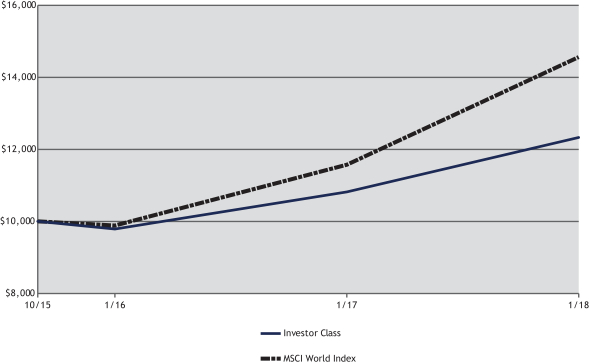
| | | | | | | | | | | | | | | | | | | | |
| Total Returns for the Period ended January 31, 2018 | |
| | | Ticker | | 1 Year | | Since Inception
10/1/2015 | | Value of $10,000
10/01/2015-
1/31/2018 |
Institutional Class (1,3) | | GVRIX | | | | 14.39 | % | | | | 9.80 | % | | | $ | 12,437 | |
Y Class (1,3) | | GVRYX | | | | 14.32 | % | | | | 9.68 | % | | | $ | 12,406 | |
Investor Class (1,3) | | GVRPX | | | | 13.99 | % | | | | 9.37 | % | | | $ | 12,326 | |
A without Sales Charge (1,3) | | GSVAX | | | | 13.89 | % | | | | 9.33 | % | | | $ | 12,315 | |
A with Sales Charge (1,3) | | GSVAX | | | | 7.31 | % | | | | 6.59 | % | | | $ | 11,607 | |
C without Sales Charge (1,3) | | GVRCX | | | | 13.07 | % | | | | 8.52 | % | | | $ | 12,102 | |
C with Sales Charge (1,3) | | GVRCX | | | | 12.07 | % | | | | 8.52 | % | | | $ | 12,102 | |
Ultra Class (1,3) | | GVRUX | | | | 14.38 | % | | | | 9.79 | % | | | $ | 12,437 | |
| | | | | | | | | | | | | | | | | | | | |
MSCI World Index (2) | | | | | | 25.83 | % | | | | 17.44 | % | | | $ | 14,560 | |
| 1. | Performance shown is historical and is not indicative of future returns. Investment returns and principal value will vary, and shares may be worth more or less at redemption than at original purchase. Performance shown is calculated based on the published end of day net asset values as of the date indicated and current performance may be lower or higher than the performance data quoted. To obtain performance as of the most recent month end, please visit www.americanbeaconfunds.com or call 1-800-967-9009. Fund performance in the table above does not reflect the deduction of taxes a shareholder would pay on distributions or the redemption of shares. Generally accepted accounting principles require adjustments to be made to the net assets of the Fund at period end for financial reporting purposes only, and as such, the total return based on the unadjusted net asset value per share may differ from the total return reported in the financial highlights. A portion of the fees charged to each Class of the Fund has been waived since Fund inception. Performance prior to waiving fees was lower than the actual returns shown since inception. A Class shares have a maximum sales charge of 5.75%. The maximum contingent deferred sales charge for the C Class is 1.00% for shares redeemed within one year of the date of purchase. |
3
American Beacon Grosvenor Long/Short FundSM
Performance Overview
January 31, 2018 (Unaudited)
| 2. | The MSCI World Index is a free float-adjusted market capitalization weighted index that is designed to measure the equity market performance of developed markets. One cannot directly invest in an index. |
| 3. | The Total Annual Fund Operating Expense ratios set forth in the most recent Fund prospectus for the Institutional, Y, Investor, A, C and Ultra Class shares were 4.29%, 4.76%, 5.02%, 5.06%, 5.80%, and 4.33% respectively. The expense ratios above may vary from the expense ratios presented in other sections of this report that are based on expenses incurred during the period covered by this report. |
During this twelve month period, global equity and credit markets experienced strong performance, and the Fund captured gains on both an absolute basis and relative to its long/short equity peer group. Corporate earnings resumed positive growth rates across a number of sectors, and macroeconomic trends were positive given the modest uptick in global GDP growth. Labor markets in many major economies are near full employment, and volatility remained suppressed well below historical levels despite widening divisions between the major central bank approaches toward monetary policy. Cyclical sectors generally outperformed defensives and drove strong gains in the Fund’s allocations to information technology, industrials, materials and financials. The Fund’s holdings in consumer discretionary, including online retail and entertainment, were beneficial as well.
The Fund’s lead sub-advisor, Grosvenor Capital Management, provides a distinct investment process consisting of thorough manager due diligence and dynamic manager allocation. Comprehensive analysis is performed by three separate teams covering the areas of investment research, risk management and operations of each manager and continues with ongoing monitoring. This investment process has remained consistent since the Fund’s inception.
| | | | | | | | |
| Top 10 Long Exposures (% Net Assets) | | | | | | | | |
| Lowe’s Cos, Inc. | | | | | | | 1.6 | |
| Teck Resources Ltd. | | | | | | | 1.6 | |
| Caesars Entertainment Corp. | | | | | | | 1.3 | |
| FirstEnergy Corp. | | | | | | | 1.3 | |
| SS&C Technologies Holdings, Inc. | | | | | | | 1.2 | |
| OneMain Holdings, Inc. | | | | | | | 1.2 | |
| Domino’s Pizza, Inc. | | | | | | | 1.2 | |
| LKQ Corp. | | | | | | | 1.2 | |
| Exelon Corp. | | | | | | | 1.1 | |
| Middleby Corp. | | | | | | | 1.1 | |
| | | | | | | | |
| Top 10 Short Exposures (% Net Assets) | | | | | | | | |
| Consumer Discretionary Select Sector SPDR Fund | | | | | | | (2.0 | ) |
| Vanguard Total International Bond ETF | | | | | | | (1.0 | ) |
| Consumer Staples Select Sector SPDR Fund | | | | | | | (0.9 | ) |
| iShares 20+ Year Treasury Bond ETF | | | | | | | (0.7 | ) |
| Health Care Select Sector SPDR Fund | | | | | | | (0.6 | ) |
| Technology Select Sector SPDR Fund | | | | | | | (0.6 | ) |
| Xcel Energy, Inc. | | | | | | | (0.4 | ) |
| Duke Energy Corp. | | | | | | | (0.4 | ) |
| iShares 7-10 Year Treasury Bond ETF | | | | | | | (0.3 | ) |
| Vanguard REIT ETF | | | | | | | (0.3 | ) |
4
American Beacon Grosvenor Long/Short FundSM
Performance Overview
January 31, 2018 (Unaudited)
| | | | |
| Net Sector Exposures (% Investments) | |
| Consumer Discretionary | | | 28.2 | |
| Financials | | | 20.9 | |
| Information Technology | | | 19.0 | |
| Industrials | | | 14.5 | |
| Materials | | | 11.5 | |
| Utilities | | | 8.3 | |
| Consumer Staples | | | 3.3 | |
| Energy | | | 2.9 | |
| Telecommunication Services | | | 2.1 | |
| Investment Companies | | | 1.8 | |
| Health Care | | | 1.6 | |
| Real Estate | | | 1.1 | |
| Exchange-Traded Instruments | | | (15.2 | ) |
| | | | |
| Fund Level Exposure (% Net Assets) | | | Fund | |
| Net Exposure | | | 55.2 | |
| Gross Exposure | | | 101.6 | |
| Long Exposure | | | 78.4 | |
| Short Exposure | | | 23.2 | |
5
American Beacon Numeric Integrated Alpha FundSM
Performance Overview
January 31, 2018 (Unaudited)
The Investor Class of the American Beacon Numeric Integrated Alpha Fund (the “Fund”) returned -1.06% for the twelve months ended January 31, 2018.
Comparison of Change in Value of a $10,000 Investment for the period from 11/01/2016 through 1/31/2018
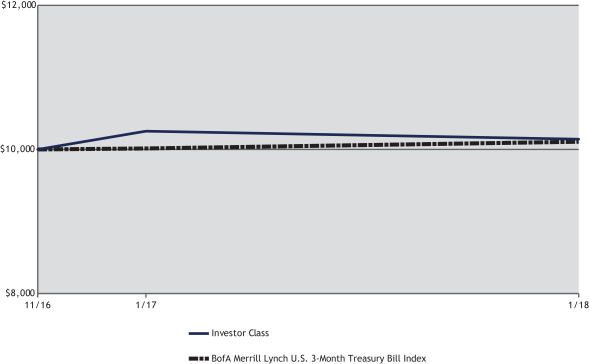
| | | | | | | | | | | | | | | | | | | | |
| Total Returns for the Period ended January 31, 2018 | |
| | | Ticker | | 1 Year | | Since Inception
11/1/2016 | | Value of $10,000
11/1/2016-
1/31/2018 |
Institutional Class (1,3) | | NIAIX | | | | (0.67 | )% | | | | 1.45 | % | | | | 10,182 | |
Y Class (1,3) | | NIAYX | | | | (0.79 | )% | | | | 1.43 | % | | | | 10,179 | |
Investor Class (1,3) | | NIAPX | | | | (1.06 | )% | | | | 1.13 | % | | | | 10,141 | |
Ultra Class (1,3) | | NIAUX | | | | (0.57 | )% | | | | 1.69 | % | | | | 10,211 | |
| | | | | | | | | | | | | | | | | | | | |
BofA Merrill Lynch U.S. 3-Month Treasury Bill Index (2) | | | | | | 0.93 | % | | | | 0.83 | % | | | | 10,104 | |
| 1. | Performance shown is historical and is not indicative of future returns. Investment returns and principal value will vary, and shares may be worth more or less at redemption than at original purchase. Performance shown is calculated based on the published end of day net asset values as of the date indicated and current performance may be lower or higher than the performance data quoted. To obtain performance as of the most recent month end, please visit www.americanbeaconfunds.com or call 1-800-967-9009. Fund performance in the table above does not reflect the deduction of taxes a shareholder would pay on distributions or the redemption of shares. Generally accepted accounting principles require adjustments to be made to the net assets of the Fund at period end for financial reporting purposes only, and as such, the total return based on the unadjusted net asset value per share may differ from the total return reported in the financial highlights. A portion of the fees charged to each Class of the Fund has been waived since Fund inception. Performance prior to waiving fees was lower than the actual returns shown since inception. |
| 2. | The BofA Merrill Lynch 3-Month U.S. Treasury Bill Index is designed to measure the total return on cash, including price and interest income, based on short-term government Treasury bills of about 90-day maturity. One cannot directly invest in an index. |
| 3. | The Total Annual Fund Operating Expense ratios set forth in the most recent Fund prospectus for the Institutional, Y, Investor, and Ultra Class shares were 6.17%, 6.27%, 6.55%, and 6.07%, respectively. The expense ratios above may vary from the expense ratios presented in other sections of this report that are based on expenses incurred during the period covered by this report. |
6
American Beacon Numeric Integrated Alpha FundSM
Performance Overview
January 31, 2018 (Unaudited)
Among the Fund’s strategies, the Core Market Neutral component was the primary detractor from performance during the period. This strategy develops a market-neutral, long-short equity portfolio that seeks to identify mispriced securities caused by valuation discrepancies, investor sentiment, seasonal trends and other events that cause equity prices to fluctuate around fundamental valuations. The Fund’s U.S. equity exposures detracted from returns during the period, but European equities were the top contributors.
Within Core Market Neutral, the Fund also employs industry-specific models in both Retail and Real Estate Investment Trust (REIT). The Retail model detracted from performance during the period, while the REIT model contributed positively.
The Fund’s Dynamic Beta component contributed positively to returns during the period. This strategy uses global equity indices and U.S. Treasuries to add long exposure to the Fund through futures contracts when the models identify opportunity. During this period, exposures to all equity indices benefitted the Fund, led by the Emerging Markets, EAFE and U.S. equities in order of significance. Exposure to ten-year U.S. Treasuries, however, detracted slightly.
Lastly, the Dislocation and the Sector components of the Fund’s strategies both detracted from performance during the period. The Dislocation strategy seeks to benefit from market-neutral long and short positions in companies whose stock prices have been dislocated, or moved, beyond typical ranges due to news headlines, earnings results, analyst opinions or other announcements. The Fund seeks to benefit when prices revert to more appropriate levels.
The Sector strategy seeks to benefit from market-neutral long and short positions by utilizing S&P 500 Index Sector Exchange Traded Funds. To the extent that valuation discrepancies across equity sectors become abnormally large, the Fund seeks to benefit from their return to more appropriate levels.
The sub-advisor’s systematic investment process utilizes a fundamentals-based approach that combines a diversified set of uncorrelated quantitative strategies. This investment process has remained consistent since the Fund’s inception.
| | | | | | | | |
| Top Ten Long Exposures (% Net Assets) | |
| Technology Select Sector SPDR Fund | | | | | | | 3.4 | |
| Consumer Discretionary Select Sector SPDR Fund | | | | | | | 2.5 | |
| Domino’s Pizza, Inc. | | | | | | | 1.3 | |
| Equinix, Inc. | | | | | | | 1.3 | |
| Ameriprise Financial, Inc. | | | | | | | 1.2 | |
| Empire State Realty Trust, Inc., Class A | | | | | | | 1.2 | |
| QTS Realty Trust, Inc., Class A | | | | | | | 1.2 | |
| CoreSite Realty Corp. | | | | | | | 1.2 | |
| Forest City Realty Trust, Inc., Class A | | | | | | | 1.2 | |
| GameStop Corp. | | | | | | | 1.2 | |
| | |
| Total Fund Holdings | | | 179 | | | | | |
| | | | | | | | |
| Top Ten Short Exposures (% Net Assets) | |
| Real Estate Select Sector SPDR Fund | | | | | | | (2.6 | ) |
| Utilities Select Sector SPDR Fund | | | | | | | (1.9 | ) |
| Consumer Staples Select SPDR Fund | | | | | | | (1.5 | ) |
| Financial Select Sector SPDR Fund | | | | | | | (1.4 | ) |
| Tesla, Inc. | | | | | | | (1.3 | ) |
| Tapestry, Inc. | | | | | | | (1.3 | ) |
| Murphy USA, Inc. | | | | | | | (1.2 | ) |
| Wabtec Corp. | | | | | | | (1.2 | ) |
| Hersha Hospitality Trust | | | | | | | (1.2 | ) |
| Omega Healthcare Investors, Inc. | | | | | | | (1.2 | ) |
| | |
| Total Fund Holdings | | | 90 | | | | | |
7
American Beacon Numeric Integrated Alpha FundSM
Performance Overview
January 31, 2018 (Unaudited)
| | | | | | | | |
| Sector Exposure (%) | | | Portfolio Long | | | | Portfolio Short | |
| Real Estate | | | 15.4 | | | | (15.8 | ) |
| Consumer Discretionary | | | 9.1 | | | | (9.6 | ) |
| Exchange-Traded Instruments | | | 7.9 | | | | (7.9 | ) |
| Information Technology | | | 6.2 | | | | (2.9 | ) |
| Industrials | | | 6.0 | | | | (2.8 | ) |
| Financials | | | 5.0 | | | | (3.9 | ) |
| Energy | | | 3.9 | | | | (4.2 | ) |
| Health Care | | | 3.6 | | | | (1.0 | ) |
| Consumer Staples | | | 2.5 | | | | (0.1 | ) |
| Utilities | | | 1.3 | | | | (1.8 | ) |
| Materials | | | 0.7 | | | | (0.3 | ) |
| Telecommunication Services | | | 0.1 | | | | (0.0 | ) |
8
American Beacon FundsSM
Expense Example
January 31, 2018 (Unaudited)
Fund Expense Example
As a shareholder of a Fund, you incur two types of costs: (1) transaction costs, including sales charges (loads) on purchase payments and redemption fees, if applicable, and (2) ongoing costs, including management fees, distribution (12b-1) fees, sub-transfer agent fees, and other Fund expenses. The Examples are intended to help you understand the ongoing cost (in dollars) of investing in the Fund and to compare these costs with the ongoing costs of investing in other mutual funds. The Examples are based on an investment of $1,000 invested at the beginning of the period in each Class and held for the entire period from August 1, 2017 through January 31, 2018.
Actual Expenses
The “Actual” lines of the tables provide information about actual account values and actual expenses. You may use the information on this page, together with the amount you invested, to estimate the expenses that you paid over the period. Simply divide your account value by $1,000 (for example, an $8,600 account value divided by $1,000 = $8.60), then multiply the result by the “Expenses Paid During Period” to estimate the expenses you paid on your account during this period. Shareholders of the Investor and Institutional Classes that invest in the Fund through an IRA or Roth IRA may be subject to a custodial IRA fee of $15 that is typically deducted each December. If your account was subject to a custodial IRA fee during the period, your costs would have been $15 higher.
Hypothetical Example for Comparison Purposes
The “Hypothetical” lines of the tables provide information about hypothetical account values and hypothetical expenses based on the Fund’s actual expense ratio and an assumed 5% per year rate of return before expenses (not the Fund’s actual return). You may compare the ongoing costs of investing in the Fund with other funds by contrasting this 5% hypothetical example and the 5% hypothetical examples that appear in the shareholder reports of the other funds. The hypothetical account values and expenses may not be used to estimate the actual ending account balance or expenses you paid for the period. Shareholders of the Investor and Institutional Classes that invest in the Funds through an IRA or Roth IRA may be subject to a custodial IRA fee of $15 that is typically deducted each December. If your account was subject to a custodial IRA fee during the period, your costs would have been $15 higher.
You should also be aware that the expenses shown in the table highlight only your ongoing costs and do not reflect any transaction costs charged by the Fund, such as sales charges (loads) or redemption fees, as applicable. Similarly, the expense examples for other funds do not reflect any transaction costs charged by those funds, such as sales charges (loads), redemption fees or exchange fees. Therefore, the “Hypothetical” lines of the tables are useful in comparing ongoing costs only and will not help you determine the relative total costs of owning different funds. If you were subject to any transaction costs during the period, your costs would have been higher.
9
American Beacon FundsSM
Expense Example
January 31, 2018 (Unaudited)
| | | | | | | | | | | | | | | |
| Grosvenor Long/Short Fund | | | | | | | | | | | | | | | |
| | | Beginning Account Value
8/1/2017 | | Ending Account Value
1/31/2018 | | Expenses Paid During
Period
8/1/2017-1/31/2018* |
| Institutional Class | | | | | | | | | | |
| Actual | | | | $1,000.00 | | | | | $1,094.60 | | | | | $20.70 | |
| Hypothetical** | | | | $1,000.00 | | | | | $1,005.40 | | | | | $19.81 | |
| Y Class | | | | | | | | | | | | | | | |
| Actual | | | | $1,000.00 | | | | | $1,093.80 | | | | | $21.32 | |
| Hypothetical** | | | | $1,000.00 | | | | | $1,004.80 | | | | | $20.41 | |
| Investor Class | | | | | | | | | | | | | | | |
| Actual | | | | $1,000.00 | | | | | $1,092.50 | | | | | $22.52 | |
| Hypothetical** | | | | $1,000.00 | | | | | $1,003.70 | | | | | $21.57 | |
| A Class | | | | | | | | | | | | | | | |
| Actual | | | | $1,000.00 | | | | | $1,091.60 | | | | | $22.77 | |
| Hypothetical** | | | | $1,000.00 | | | | | $1,003.40 | | | | | $21.81 | |
| C Class | | | | | | | | | | | | | | | |
| Actual | | | | $1,000.00 | | | | | $1,087.20 | | | | | $26.78 | |
| Hypothetical** | | | | $1,000.00 | | | | | $999.50 | | | | | $25.65 | |
| Ultra ClassA | | | | | | | | | | | | | | | |
| Actual | | | | $1,000.00 | | | | | $1,080.90 | | | | | $7.14 | |
| Hypothetical** | | | | $1,000.00 | | | | | $1,009.00 | | | | | $16.25 | |
| * | Expenses are equal to the Fund’s annualized expense ratios (including non-operating expenses (See Financial Highlights for more information)) for the six-month period of 3.92%, 4.04%, 4.27%, 4.32%, 5.09%, and 3.21% for the Institutional, Y, Investor, A, C, and Ultra Classes, respectively, multiplied by the average account value over the period, multiplied by the number derived by dividing the number of days in the most recent fiscal half-year (184) by days in the year (365) to reflect the half-year period. |
| ** | 5% return before expenses. |
| A | Commencement of operations, November 14, 2017 through January 31, 2018. |
| | | | | | | | | | | | | | | |
| Numeric Integrated Alpha Fund | | | | | | | | | | | | | | | |
| | | Beginning Account Value
8/1/2017 | | Ending Account Value
1/31/2018 | | Expenses Paid During
Period
8/1/2017-1/31/2018* |
| Institutional Class | | | | | | | | | | |
| Actual | | | | $1,000.00 | | | | | $1,007.10 | | | | | $27.82 | |
| Hypothetical** | | | | $1,000.00 | | | | | $997.50 | | | | | $27.69 | |
| Y Class | | | | | | | | | | | | | | | |
| Actual | | | | $1,000.00 | | | | | $1,006.80 | | | | | $28.33 | |
| Hypothetical** | | | | $1,000.00 | | | | | $997.00 | | | | | $28.19 | |
| Investor Class | | | | | | | | | | | | | | | |
| Actual | | | | $1,000.00 | | | | | $1,005.10 | | | | | $29.72 | |
| Hypothetical** | | | | $1,000.00 | | | | | $995.60 | | | | | $29.58 | |
| Ultra Class | | | | | | | | | | | | | | | |
| Actual | | | | $1,000.00 | | | | | $1,008.00 | | | | | $26.42 | |
| Hypothetical** | | | | $1,000.00 | | | | | $998.90 | | | | | $26.30 | |
| * | Expenses are equal to the Fund’s annualized expense ratios (including non-operating expenses (See Financial Highlights for more information)) for the six-month period of 5.50%, 5.60%, 5.88%, and 5.22% for the Institutional, Y, Investor, and Ultra Classes, respectively, multiplied by the average account value over the period, multiplied by the number derived by dividing the number of days in the most recent fiscal half-year (184) by days in the year (365) to reflect the half-year period. |
| ** | 5% return before expenses. |
10
American Beacon FundsSM
Report of Independent Registered Public Accounting Firm
To the Board of Trustees of American Beacon Funds and Shareholders of American Beacon Grosvenor Long/Short Fund and American Beacon Numeric Integrated Alpha Fund
Opinions on the Financial Statements
We have audited the accompanying statements of assets and liabilities, including the schedules of investments, of American Beacon Grosvenor Long/Short Fund and American Beacon Numeric Integrated Alpha Fund (two of the series constituting American Beacon Funds, referred to hereafter as the “Funds”) as of January 31, 2018, the related statements of operations for the year ended January 31, 2018, the statements of changes in net assets for each of the periods listed in the table below, including the related notes, and the financial highlights for each of the periods listed in the table below (collectively referred to as the “financial statements”). In our opinion, the financial statements present fairly, in all material respects, the financial position of each of the Funds as of January 31, 2018, the results of each of their operations for the year then ended, the changes in each of their net assets for each of the periods listed in the table below and each of the financial highlights for each of the periods listed in the table below in conformity with accounting principles generally accepted in the United States of America.
| | |
Fund Name | | Statement of changes in net assets and
financial highlights |
| American Beacon Grosvenor Long/Short Fund | | Each of the two years in the period ended January 31, 2018 |
| American Beacon Numeric Integrated Alpha Fund | | Period November 1, 2016 (commencement of operations) through January 31, 2017 and year ended January 31, 2018 |
Basis for Opinions
These financial statements are the responsibility of the Funds’ management. Our responsibility is to express an opinion on the Funds’ financial statements based on our audits. We are a public accounting firm registered with the Public Company Accounting Oversight Board (United States) (“PCAOB”) and are required to be independent with respect to the Funds in accordance with the U.S. federal securities laws and the applicable rules and regulations of the Securities and Exchange Commission and the PCAOB.
We conducted our audits of these financial statements in accordance with the standards of the PCAOB. Those standards require that we plan and perform the audit to obtain reasonable assurance about whether the financial statements are free of material misstatement, whether due to error or fraud.
Our audits included performing procedures to assess the risks of material misstatement of the financial statements, whether due to error or fraud, and performing procedures that respond to those risks. Such procedures included examining, on a test basis, evidence regarding the amounts and disclosures in the financial statements. Our audits also included evaluating the accounting principles used and significant estimates made by management, as well as evaluating the overall presentation of the financial statements. Our procedures included confirmation of securities owned as of January 31, 2018 by correspondence with the custodian, transfer agent and brokers; when replies were not received from brokers, we performed other auditing procedures. We believe that our audits provide a reasonable basis for our opinions.
With respect to the American Beacon Grosvenor Long/Short Fund, the financial statements as of January 31, 2016 and for the period October 1, 2015 to January 31, 2016 and the financial highlights for the period October 1, 2015 to January 31, 2016 (not presented herein, other than the financial highlights) were audited by other auditors whose report dated March 31, 2016 expressed an unqualified opinion on those financial statements and financial highlights.
PricewaterhouseCoopers LLP
Boston, MA
March 27, 2018
We have served as the auditor of one or more American Beacon investment companies since 2016.
11
American Beacon Grosvenor Long/Short FundSM
Schedule of Investments
January 31, 2018
| | | | | | | | | | | | | | | |
| | | Shares | | | | Fair Value |
| | | | | | | | | | | | | | | |
| SECURITIES HELD LONG | | | | | | | | | | | | | | | |
| COMMON STOCKS - 77.07% | | | | | | | | | | | | | | | |
| Consumer Discretionary - 18.05% | | | | | | | | | | | | | | | |
| Auto Components - 0.09% | | | | | | | | | | | | | | | |
| Cia Energetica de Minas Gerais, Sponsored ADR | | | | 6,973 | | | | | | | | | $ | 16,247 | |
| Commencement BankA | | | | 17 | | | | | | | | | | 264 | |
| Mountain Commerce Bancorp, Inc.A | | | | 146 | | | | | | | | | | 2,635 | |
| | | | | | | | | | | | | | | |
| | | | | | | | | | | | | | 19,146 | |
| | | | | | | | | | | | | | | |
| | | | | | | | | | | | | | | |
| Automobiles - 0.32% | | | | | | | | | | | | | | | |
| Harley-Davidson, Inc. | | | | 1,350 | | | | | | | | | | 65,421 | |
| | | | | | | | | | | | | | | |
| | | | | | | | | | | | | | | |
| Distributors - 1.16% | | | | | | | | | | | | | | | |
| LKQ Corp.A B | | | | 5,651 | | | | | | | | | | 237,512 | |
| | | | | | | | | | | | | | | |
| | | | | | | | | | | | | | | |
| Hotels, Restaurants & Leisure - 5.33% | | | | | | | | | | | | | | | |
| Caesars Entertainment Corp.A B | | | | 19,186 | | | | | | | | | | 267,645 | |
| Carnival Corp. | | | | 1,910 | | | | | | | | | | 136,775 | |
| Domino’s Pizza, Inc. | | | | 1,123 | | | | | | | | | | 243,523 | |
| Marriott International, Inc., Class A | | | | 187 | | | | | | | | | | 27,553 | |
| Melco Resorts & Entertainment Ltd., ADR | | | | 2,964 | | | | | | | | | | 88,268 | |
| Norwegian Cruise Line Holdings Ltd.A | | | | 2,888 | | | | | | | | | | 175,417 | |
| SeaWorld Entertainment, Inc.A | | | | 2,198 | | | | | | | | | | 33,519 | |
| Wyndham Worldwide Corp. | | | | 970 | | | | | | | | | | 120,406 | |
| Yum! Brands, Inc. | | | | 5 | | | | | | | | | | 423 | |
| | | | | | | | | | | | | | | |
| | | | | | | | | | | | | | 1,093,529 | |
| | | | | | | | | | | | | | | |
| | | | | | | | | | | | | | | |
| Household Durables - 2.15% | | | | | | | | | | | | | | | |
| AV Homes, Inc.A | | | | 650 | | | | | | | | | | 10,985 | |
| Century Communities, Inc.A | | | | 1,164 | | | | | | | | | | 36,782 | |
| DR Horton, Inc. | | | | 1,700 | | | | | | | | | | 83,385 | |
| iRobot Corp.A | | | | 340 | | | | | | | | | | 30,175 | |
| Lennar Corp., Class A | | | | 417 | | | | | | | | | | 26,129 | |
| M/I Homes, Inc.A | | | | 693 | | | | | | | | | | 22,412 | |
| Meritage Homes Corp.A | | | | 223 | | | | | | | | | | 10,581 | |
| Mohawk Industries, Inc.A B | | | | 641 | | | | | | | | | | 180,160 | |
| Taylor Morrison Home Corp., Class AA | | | | 1,037 | | | | | | | | | | 26,371 | |
| William Lyon Homes, Class AA | | | | 501 | | | | | | | | | | 13,602 | |
| | | | | | | | | | | | | | | |
| | | | | | | | | | | | | | 440,582 | |
| | | | | | | | | | | | | | | |
| | | | | | | | | | | | | | | |
| Internet & Direct Marketing Retail - 1.52% | | | | | | | | | | | | | | | |
| JD.com, Inc., ADRA | | | | 796 | | | | | | | | | | 39,187 | |
| Netflix, Inc.A | | | | 235 | | | | | | | | | | 63,520 | |
| Priceline Group, Inc.A | | | | 96 | | | | | | | | | | 183,557 | |
| Yoox Net-A-Porter Group SpAA | | | | 531 | | | | | | | | | | 24,953 | |
| | | | | | | | | | | | | | | |
| | | | | | | | | | | | | | 311,217 | |
| | | | | | | | | | | | | | | |
| | | | | | | | | | | | | | | |
| Leisure Products - 0.30% | | | | | | | | | | | | | | | |
| Brunswick Corp. | | | | 983 | | | | | | | | | | 61,713 | |
| | | | | | | | | | | | | | | |
| | | | | | | | | | | | | | | |
| Media - 2.54% | | | | | | | | | | | | | | | |
| CBS Corp., Class B, NVDR | | | | 2,302 | | | | | | | | | | 132,618 | |
| Liberty Media Corp-Liberty SiriusXM, Tracking Stock, Class AA B C | | | | 3,956 | | | | | | | | | | 178,060 | |
| Liberty Media Corp-Liberty SiriusXM, Tracking Stock, Class CA B C | | | | 908 | | | | | | | | | | 40,688 | |
| Viacom, Inc., Class B | | | | 5,058 | | | | | | | | | | 169,038 | |
| | | | | | | | | | | | | | | |
| | | | | | | | | | | | | | 520,404 | |
| | | | | | | | | | | | | | | |
| | | | | | | | | | | | | | | |
| Multiline Retail - 1.03% | | | | | | | | | | | | | | | |
| B&M European Value Retail S.A. | | | | 21,348 | | | | | | | | | | 126,063 | |
See accompanying notes
12
American Beacon Grosvenor Long/Short FundSM
Schedule of Investments
January 31, 2018
| | | | | | | | | | | | | | | |
| | | Shares | | | | Fair Value |
| | | | | | | | | | | | | | | |
| COMMON STOCKS - 77.07% (continued) | | | | | | | | | | | | | | | |
| Consumer Discretionary - 18.05% (continued) | | | | | | | | | | | | | | | |
| Multiline Retail - 1.03% (continued) | | | | | | | | | | | | | | | |
| Macy’s, Inc. | | | | 305 | | | | | | | | | $ | 7,915 | |
| Target Corp. | | | | 1,034 | | | | | | | | | | 77,777 | |
| | | | | | | | | | | | | | | |
| | | | | | | | | | | | | | 211,755 | |
| | | | | | | | | | | | | | | |
| | | | | | | | | | | | | | | |
| Specialty Retail - 3.28% | | | | | | | | | | | | | | | |
| Five Below, Inc.A | | | | 275 | | | | | | | | | | 17,856 | |
| Lowe’s Cos, Inc.B | | | | 3,228 | | | | | | | | | | 338,068 | |
| MarineMax, Inc.A | | | | 4,070 | | | | | | | | | | 93,407 | |
| O’Reilly Automotive, Inc.A | | | | 783 | | | | | | | | | | 207,252 | |
| Tile Shop Holdings, Inc. | | | | 1,761 | | | | | | | | | | 16,465 | |
| | | | | | | | | | | | | | | |
| | | | | | | | | | | | | | 673,048 | |
| | | | | | | | | | | | | | | |
| | | | | | | | | | | | | | | |
| Textiles, Apparel & Luxury Goods - 0.33% | | | | | | | | | | | | | | | |
| Deckers Outdoor Corp.A | | | | 304 | | | | | | | | | | 26,056 | |
| Moncler SpA | | | | 556 | | | | | | | | | | 18,321 | |
| Swatch Group AG | | | | 49 | | | | | | | | | | 22,453 | |
| | | | | | | | | | | | | | | |
| | | | | | | | | | | | | | 66,830 | |
| | | | | | | | | | | | | | | |
| | | | | | | | | | | | | | | |
Total Consumer Discretionary | | | | | | | | | | | | | | 3,701,157 | |
| | | | | | | | | | | | | | | |
| | | | | | | | | | | | | | | |
| Consumer Staples - 2.35% | | | | | | | | | | | | | | | |
| Beverages - 0.84% | | | | | | | | | | | | | | | |
| Anheuser-Busch InBev S.A., Sponsored ADR | | | | 966 | | | | | | | | | | 109,622 | |
| Constellation Brands, Inc., Class A | | | | 285 | | | | | | | | | | 62,549 | |
| | | | | | | | | | | | | | | |
| | | | | | | | | | | | | | 172,171 | |
| | | | | | | | | | | | | | | |
| | | | | | | | | | | | | | | |
| Food & Staples Retailing - 0.09% | | | | | | | | | | | | | | | |
| Koninklijke Ahold Delhaize N.V. | | | | 800 | | | | | | | | | | 17,849 | |
| | | | | | | | | | | | | | | |
| | | | | | | | | | | | | | | |
| Food Products - 0.61% | | | | | | | | | | | | | | | |
| Mondelez International, Inc., Class A | | | | 2,811 | | | | | | | | | | 124,808 | |
| | | | | | | | | | | | | | | |
| | | | | | | | | | | | | | | |
| Household Products - 0.81% | | | | | | | | | | | | | | | |
| Procter & Gamble Co. | | | | 1,933 | | | | | | | | | | 166,895 | |
| | | | | | | | | | | | | | | |
| | | | | | | | | | | | | | | |
Total Consumer Staples | | | | | | | | | | | | | | 481,723 | |
| | | | | | | | | | | | | | | |
| | | | | | | | | | | | | | | |
| Energy - 1.82% | | | | | | | | | | | | | | | |
| Oil, Gas & Consumable Fuels - 1.82% | | | | | | | | | | | | | | | |
| Hess Corp. | | | | 2,863 | | | | | | | | | | 144,610 | |
| Kunlun Energy Co., Ltd. | | | | 12,000 | | | | | | | | | | 11,856 | |
| Laredo Petroleum, Inc.A | | | | 4,614 | | | | | | | | | | 44,894 | |
| Novatek PJSC, GDR | | | | 436 | | | | | | | | | | 58,032 | |
| PetroChina Co., Ltd., Class H | | | | 76,000 | | | | | | | | | | 60,236 | |
| YPF S.A., Sponsored ADR | | | | 2,201 | | | | | | | | | | 53,154 | |
| | | | | | | | | | | | | | | |
| | | | | | | | | | | | | | 372,782 | |
| | | | | | | | | | | | | | | |
| | | | | | | | | | | | | | | |
| Financials - 15.69% | | | | | | | | | | | | | | | |
| Banks - 9.72% | | | | | | | | | | | | | | | |
| 1st Capital BankA | | | | 2,265 | | | | | | | | | | 35,311 | |
| American Business BankA B | | | | 2,775 | | | | | | | | | | 113,081 | |
| American River Bankshares | | | | 2,042 | | | | | | | | | | 30,793 | |
| American Riviera BankA B | | | | 2,244 | | | | | | | | | | 43,197 | |
| Atlantic Capital Bancshares, Inc.A | | | | 1,517 | | | | | | | | | | 27,079 | |
| Bank of Ireland Group PLCA | | | | 4,957 | | | | | | | | | | 48,496 | |
| Bank of the James Financial Group, Inc.B | | | | 3,536 | | | | | | | | | | 51,909 | |
| Baycom Corp.A | | | | 2,038 | | | | | | | | | | 40,658 | |
See accompanying notes
13
American Beacon Grosvenor Long/Short FundSM
Schedule of Investments
January 31, 2018
| | | | | | | | | | | | | | | |
| | | Shares | | | | Fair Value |
| | | | | | | | | | | | | | | |
| COMMON STOCKS - 77.07% (continued) | | | | | | | | | | | | | | | |
| Financials - 15.69% (continued) | | | | | | | | | | | | | | | |
| Banks - 9.72% (continued) | | | | | | | | | | | | | | | |
| Bridge Bancorp, Inc.B | | | | 3,696 | | | | | | | | | $ | 126,773 | |
| Burke & Herbert Bank & Trust Co. | | | | 3 | | | | | | | | | | 8,253 | |
| California Bancorp, Inc.A | | | | 881 | | | | | | | | | | 20,748 | |
| Cambridge BancorpB | | | | 914 | | | | | | | | | | 70,378 | |
| Chemung Financial Corp. | | | | 541 | | | | | | | | | | 24,167 | |
| Commerce West BankB | | | | 1,605 | | | | | | | | | | 39,403 | |
| Community Financial Corp.B | | | | 2,139 | | | | | | | | | | 78,801 | |
| Delmarva Bancshares, Inc.A | | | | 1,193 | | | | | | | | | | 8,852 | |
| DNB Financial Corp. | | | | 136 | | | | | | | | | | 4,631 | |
| Eagle Financial Services, Inc. | | | | 69 | | | | | | | | | | 2,180 | |
| Embassy Bancorp, Inc. | | | | 42 | | | | | | | | | | 701 | |
| ENB Financial Corp. | | | | 23 | | | | | | | | | | 791 | |
| Esquire Financial Holdings, Inc.A | | | | 2,470 | | | | | | | | | | 56,217 | |
| Exchange Bank | | | | 136 | | | | | | | | | | 24,315 | |
| Farmers & Merchants Bank of Long Beach | | | | 7 | | | | | | | | | | 56,140 | |
| First Foundation, Inc.A | | | | 5,146 | | | | | | | | | | 100,090 | |
| First Northern Community BancorpA | | | | 2,422 | | | | | | | | | | 32,818 | |
| First of Long Island Corp.B | | | | 2,713 | | | | | | | | | | 76,235 | |
| First Savings Financial Group, Inc. | | | | 155 | | | | | | | | | | 9,843 | |
| First United Corp.A | | | | 563 | | | | | | | | | | 9,768 | |
| Franklin Financial Network, Inc.A | | | | 736 | | | | | | | | | | 23,736 | |
| Independent Bank Corp. | | | | 821 | | | | | | | | | | 18,924 | |
| Meridian BankA | | | | 2,342 | | | | | | | | | | 42,531 | |
| Metro Bank PLCA | | | | 611 | | | | | | | | | | 31,526 | |
| Metropolitan Bank Holding Corp.A | | | | 1,369 | | | | | | | | | | 65,014 | |
| MidSouth Bancorp, Inc. | | | | 595 | | | | | | | | | | 8,419 | |
| Oak Valley Bancorp | | | | 391 | | | | | | | | | | 7,867 | |
| Old Point Financial Corp. | | | | 155 | | | | | | | | | | 4,548 | |
| Pacific City Financial Corp. | | | | 2,148 | | | | | | | | | | 32,327 | |
| Peapack Gladstone Financial Corp.B | | | | 2,143 | | | | | | | | | | 76,119 | |
| Premier Commercial BancorpA | | | | 1,462 | | | | | | | | | | 17,383 | |
| Premier Financial Bancorp, Inc. | | | | 707 | | | | | | | | | | 13,447 | |
| Private Bancorp of America, Inc.A | | | | 417 | | | | | | | | | | 10,429 | |
| Sandy Spring Bancorp, Inc. | | | | 1,638 | | | | | | | | | | 61,949 | |
| Seacoast Banking Corp. of FloridaA B | | | | 2,087 | | | | | | | | | | 53,824 | |
| Seacoast Commerce Banc Holdings | | | | 1,185 | | | | | | | | | | 24,482 | |
| Shore Bancshares, Inc. | | | | 1,940 | | | | | | | | | | 35,347 | |
| Stewardship Financial Corp. | | | | 2,013 | | | | | | | | | | 22,445 | |
| Sussex BancorpB | | | | 1,956 | | | | | | | | | | 56,920 | |
| Tri City Bankshares Corp. | | | | 690 | | | | | | | | | | 14,283 | |
| UniCredit SpAA | | | | 4,776 | | | | | | | | | | 105,227 | |
| Veritex Holdings, Inc.A B | | | | 1,729 | | | | | | | | | | 49,294 | |
| WTB Financial Corp., Class B | | | | 206 | | | | | | | | | | 75,190 | |
| | | | | | | | | | | | | | | |
| | | | | | | | | | | | | | 1,992,859 | |
| | | | | | | | | | | | | | | |
| | | | | | | | | | | | | | | |
| Capital Markets - 1.03% | | | | | | | | | | | | | | | |
| S&P Global, Inc.B | | | | 1,162 | | | | | | | | | | 210,438 | |
| | | | | | | | | | | | | | | |
| | | | | | | | | | | | | | | |
| Consumer Finance - 2.36% | | | | | | | | | | | | | | | |
| Ally Financial, Inc.B | | | | 4,351 | | | | | | | | | | 129,529 | |
| OneMain Holdings, Inc.A B | | | | 7,553 | | | | | | | | | | 247,059 | |
| Regional Management Corp.A B | | | | 3,762 | | | | | | | | | | 106,690 | |
| | | | | | | | | | | | | | | |
| | | | | | | | | | | | | | 483,278 | |
| | | | | | | | | | | | | | | |
| | | | | | | | | | | | | | | |
| Diversified Financial Services - 0.17% | | | | | | | | | | | | | | | |
| Marlin Business Services Corp. | | | | 1,489 | | | | | | | | | | 35,289 | |
| | | | | | | | | | | | | | | |
| | | | | | | | | | | | | | | |
See accompanying notes
14
American Beacon Grosvenor Long/Short FundSM
Schedule of Investments
January 31, 2018
| | | | | | | | | | | | | | | |
| | | Shares | | | | Fair Value |
| | | | | | | | | | | | | | | |
| COMMON STOCKS - 77.07% (continued) | | | | | | | | | | | | | | | |
| Financials - 15.69% (continued) | | | | | | | | | | | | | | | |
| Thrifts & Mortgage Finance - 2.41% | | | | | | | | | | | | | | | |
| BofI Holding, Inc.A B | | | | 1,360 | | | | | | | | | $ | 48,919 | |
| Charter Court Financial Services Group PLCA C | | | | 10,214 | | | | | | | | | | 46,843 | |
| Home Capital Group, Inc. | | | | 603 | | | | | | | | | | 8,383 | |
| Merchants BancorpA | | | | 4,538 | | | | | | | | | | 92,122 | |
| Meta Financial Group, Inc. | | | | 353 | | | | | | | | | | 41,301 | |
| OneSavings Bank PLC | | | | 5,943 | | | | | | | | | | 33,685 | |
| PennyMac Financial Services, Inc., Class AA B | | | | 4,129 | | | | | | | | | | 91,664 | |
| Provident Bancorp, Inc.A B | | | | 1,968 | | | | | | | | | | 47,330 | |
| Sterling Bancorp, Inc.A | | | | 6,583 | | | | | | | | | | 83,538 | |
| | | | | | | | | | | | | | | |
| | | | | | | | | | | | | | 493,785 | |
| | | | | | | | | | | | | | | |
| | | | | | | | | | | | | | | |
Total Financials | | | | | | | | | | | | | | 3,215,649 | |
| | | | | | | | | | | | | | | |
| | | | | | | | | | | | | | | |
| Health Care - 0.96% | | | | | | | | | | | | | | | |
| Health Care Providers & Services - 0.79% | | | | | | | | | | | | | | | |
| Cigna Corp. | | | | 502 | | | | | | | | | | 104,592 | |
| Express Scripts Holding Co.A | | | | 37 | | | | | | | | | | 2,930 | |
| Universal Health Services, Inc., Class B | | | | 445 | | | | | | | | | | 54,067 | |
| | | | | | | | | | | | | | | |
| | | | | | | | | | | | | | 161,589 | |
| | | | | | | | | | | | | | | |
| | | | | | | | | | | | | | | |
| Pharmaceuticals - 0.17% | | | | | | | | | | | | | | | |
| Takeda Pharmaceutical Co., Ltd. | | | | 591 | | | | | | | | | | 34,728 | |
| | | | | | | | | | | | | | | |
| | | | | | | | | | | | | | | |
Total Health Care | | | | | | | | | | | | | | 196,317 | |
| | | | | | | | | | | | | | | |
| | | | | | | | | | | | | | | |
| Industrials - 10.41% | | | | | | | | | | | | | | | |
| Aerospace & Defense - 0.91% | | | | | | | | | | | | | | | |
| Meggitt PLC | | | | 8,925 | | | | | | | | | | 58,824 | |
| Spirit AeroSystems Holdings, Inc., Class A | | | | 342 | | | | | | | | | | 35,007 | |
| TransDigm Group, Inc. | | | | 291 | | | | | | | | | | 92,221 | |
| | | | | | | | | | | | | | | |
| | | | | | | | | | | | | | 186,052 | |
| | | | | | | | | | | | | | | |
| | | | | | | | | | | | | | | |
| Air Freight & Logistics - 0.46% | | | | | | | | | | | | | | | |
| FedEx Corp. | | | | 360 | | | | | | | | | | 94,493 | |
| | | | | | | | | | | | | | | |
| | | | | | | | | | | | | | | |
| Airlines - 0.57% | | | | | | | | | | | | | | | |
| Alaska Air Group, Inc. | | | | 447 | | | | | | | | | | 29,381 | |
| Copa Holdings S.A., Class A | | | | 222 | | | | | | | | | | 30,709 | |
| Southwest Airlines Co. | | | | 916 | | | | | | | | | | 55,693 | |
| | | | | | | | | | | | | | | |
| | | | | | | | | | | | | | 115,783 | |
| | | | | | | | | | | | | | | |
| | | | | | | | | | | | | | | |
| Building Products - 1.78% | | | | | | | | | | | | | | | |
| AO Smith Corp. | | | | 323 | | | | | | | | | | 21,570 | |
| Builders FirstSource, Inc.A | | | | 1,236 | | | | | | | | | | 26,475 | |
| Daikin Industries Ltd. | | | | 400 | | | | | | | | | | 47,980 | |
| Fortune Brands Home & Security, Inc. | | | | 1,752 | | | | | | | | | | 124,270 | |
| Masco Corp. | | | | 3,241 | | | | | | | | | | 144,743 | |
| | | | | | | | | | | | | | | |
| | | | | | | | | | | | | | 365,038 | |
| | | | | | | | | | | | | | | |
| | | | | | | | | | | | | | | |
| Commercial Services & Supplies - 1.39% | | | | | | | | | | | | | | | |
| Advanced Disposal Services, Inc.A | | | | 3,333 | | | | | | | | | | 81,225 | |
| China Everbright International Ltd. | | | | 29,000 | | | | | | | | | | 44,338 | |
| KAR Auction Services, Inc.B | | | | 2,915 | | | | | | | | | | 158,984 | |
| | | | | | | | | | | | | | | |
| | | | | | | | | | | | | | 284,547 | |
| | | | | | | | | | | | | | | |
| | | | | | | | | | | | | | | |
| Construction & Engineering - 0.44% | | | | | | | | | | | | | | | |
| AECOMA | | | | 1,481 | | | | | | | | | | 57,922 | |
See accompanying notes
15
American Beacon Grosvenor Long/Short FundSM
Schedule of Investments
January 31, 2018
| | | | | | | | | | | | | | | |
| | | Shares | | | | Fair Value |
| | | | | | | | | | | | | | | |
| COMMON STOCKS - 77.07% (continued) | | | | | | | | | | | | | | | |
| Industrials - 10.41% (continued) | | | | | | | | | | | | | | | |
| Construction & Engineering - 0.44% (continued) | | | | | | | | | | | | | | | |
| Beijing Urban Construction Design & Development Group Co., Ltd., Class HD | | | | 54,000 | | | | | | | | | $ | 32,927 | |
| | | | | | | | | | | | | | | |
| | | | | | | | | | | | | | 90,849 | |
| | | | | | | | | | | | | | | |
| | | | | | | | | | | | | | | |
| Electrical Equipment - 0.59% | | | | | | | | | | | | | | | |
| Enphase Energy, Inc.A | | | | 13,591 | | | | | | | | | | 29,900 | |
| Philips Lighting N.V.D | | | | 1,116 | | | | | | | | | | 43,923 | |
| Zhuzhou CRRC Times Electric Co., Ltd., Class H | | | | 8,400 | | | | | | | | | | 46,496 | |
| | | | | | | | | | | | | | | |
| | | | | | | | | | | | | | 120,319 | |
| | | | | | | | | | | | | | | |
| | | | | | | | | | | | | | | |
| Machinery - 2.68% | | | | | | | | | | | | | | | |
| China Conch Venture Holdings Ltd. | | | | 9,500 | | | | | | | | | | 26,596 | |
| Deere & Co. | | | | 342 | | | | | | | | | | 56,916 | |
| Gates Industrial Corp. PLCA | | | | 685 | | | | | | | | | | 13,426 | |
| Kennametal, Inc. | | | | 368 | | | | | | | | | | 17,951 | |
| Middleby Corp.A B | | | | 1,614 | | | | | | | | | | 219,924 | |
| Navistar International Corp.A | | | | 2,490 | | | | | | | | | | 114,117 | |
| Tadano Ltd. | | | | 383 | | | | | | | | | | 6,680 | |
| Trinity Industries, Inc. | | | | 2,180 | | | | | | | | | | 75,144 | |
| Wabtec Corp. | | | | 112 | | | | | | | | | | 9,076 | |
| Xylem, Inc. | | | | 127 | | | | | | | | | | 9,177 | |
| | | | | | | | | | | | | | | |
| | | | | | | | | | | | | | 549,007 | |
| | | | | | | | | | | | | | | |
| | | | | | | | | | | | | | | |
| Professional Services - 0.20% | | | | | | | | | | | | | | | |
| IHS Markit Ltd.A | | | | 868 | | | | | | | | | | 41,430 | |
| | | | | | | | | | | | | | | |
| | | | | | | | | | | | | | | |
| Road & Rail - 0.56% | | | | | | | | | | | | | | | |
| Genesee & Wyoming, Inc., Class AA | | | | 96 | | | | | | | | | | 7,665 | |
| Kansas City Southern | | | | 953 | | | | | | | | | | 107,813 | |
| | | | | | | | | | | | | | | |
| | | | | | | | | | | | | | 115,478 | |
| | | | | | | | | | | | | | | |
| | | | | | | | | | | | | | | |
| Trading Companies & Distributors - 0.83% | | | | | | | | | | | | | | | |
| AerCap Holdings N.V.A B | | | | 1,809 | | | | | | | | | | 97,867 | |
| Air Lease Corp.B | | | | 1,163 | | | | | | | | | | 56,545 | |
| BOC Aviation Ltd.D | | | | 2,747 | | | | | | | | | | 16,153 | |
| | | | | | | | | | | | | | | |
| | | | | | | | | | | | | | 170,565 | |
| | | | | | | | | | | | | | | |
| | | | | | | | | | | | | | | |
Total Industrials | | | | | | | | | | | | | | 2,133,561 | |
| | | | | | | | | | | | | | | |
| | | | | | | | | | | | | | | |
| Information Technology - 10.75% | | | | | | | | | | | | | | | |
| Communications Equipment - 0.73% | | | | | | | | | | | | | | | |
| Palo Alto Networks, Inc.A | | | | 951 | | | | | | | | | | 150,135 | |
| | | | | | | | | | | | | | | |
| | | | | | | | | | | | | | | |
| Electronic Equipment, Instruments & Components - 0.82% | | | | | | | | | | | | | | | |
| Itron, Inc.A | | | | 752 | | | | | | | | | | 55,046 | |
| Landis+Gyr Group AGA | | | | 777 | | | | | | | | | | 64,281 | |
| Universal Display Corp. | | | | 300 | | | | | | | | | | 47,820 | |
| | | | | | | | | | | | | | | |
| | | | | | | | | | | | | | 167,147 | |
| | | | | | | | | | | | | | | |
| | | | | | | | | | | | | | | |
| Internet Software & Services - 2.25% | | | | | | | | | | | | | | | |
| Alibaba Group Holding Ltd., Sponsored ADRA | | | | 769 | | | | | | | | | | 157,099 | |
| Alphabet, Inc., Class AA B | | | | 163 | | | | | | | | | | 192,702 | |
| Auto Trader Group PLCD | | | | 5,240 | | | | | | | | | | 26,791 | |
| Facebook, Inc., Class AA | | | | 121 | | | | | | | | | | 22,614 | |
| Five9, Inc.A | | | | 2,351 | | | | | | | | | | 61,150 | |
| | | | | | | | | | | | | | | |
| | | | | | | | | | | | | | 460,356 | |
| | | | | | | | | | | | | | | |
See accompanying notes
16
American Beacon Grosvenor Long/Short FundSM
Schedule of Investments
January 31, 2018
| | | | | | | | | | | | | | | |
| | | Shares | | | | Fair Value |
| | | | | | | | | | | | | | | |
| COMMON STOCKS - 77.07% (continued) | | | | | | | | | | | | | | | |
| Information Technology - 10.75% (continued) | | | | | | | | | | | | | | | |
| IT Services - 2.20% | | | | | | | | | | | | | | | |
| Fidelity National Information Services, Inc.B | | | | 1,585 | | | | | | | | | $ | 162,241 | |
| PayPal Holdings, Inc.A | | | | 1,158 | | | | | | | | | | 98,800 | |
| Worldpay, Inc., Class AA | | | | 2,352 | | | | | | | | | | 188,889 | |
| | | | | | | | | | | | | | | |
| | | | | | | | | | | | | | 449,930 | |
| | | | | | | | | | | | | | | |
| | | | | | | | | | | | | | | |
| Semiconductors & Semiconductor Equipment - 0.09% | | | | | | | | | | | | | | | |
| Micron Technology, Inc.A | | | | 431 | | | | | | | | | | 18,843 | |
| | | | | | | | | | | | | | | |
| | | | | | | | | | | | | | | |
| Software - 4.58% | | | | | | | | | | | | | | | |
| Activision Blizzard, Inc. | | | | 908 | | | | | | | | | | 67,310 | |
| CDK Global, Inc. | | | | 3,068 | | | | | | | | | | 218,718 | |
| LINE Corp., Sponsored ADRA | | | | 3,091 | | | | | | | | | | 137,209 | |
| Microsoft Corp. | | | | 688 | | | | | | | | | | 65,367 | |
| Nintendo Co., Ltd. | | | | 99 | | | | | | | | | | 43,501 | |
| Red Hat, Inc.A | | | | 620 | | | | | | | | | | 81,456 | |
| ServiceNow, Inc.A | | | | 492 | | | | | | | | | | 73,244 | |
| SS&C Technologies Holdings, Inc.B | | | | 5,026 | | | | | | | | | | 252,707 | |
| | | | | | | | | | | | | | | |
| | | | | | | | | | | | | | 939,512 | |
| | | | | | | | | | | | | | | |
| | | | | | | | | | | | | | | |
| Technology Hardware, Storage & Peripherals - 0.08% | | | | | | | | | | | | | | | |
| Apple, Inc. | | | | 103 | | | | | | | | | | 17,245 | |
| | | | | | | | | | | | | | | |
| | | | | | | | | | | | | | | |
Total Information Technology | | | | | | | | | | | | | | 2,203,168 | |
| | | | | | | | | | | | | | | |
| | | | | | | | | | | | | | | |
| Materials - 6.99% | | | | | | | | | | | | | | | |
| Chemicals - 1.70% | | | | | | | | | | | | | | | |
| DowDuPont, Inc. | | | | 1,112 | | | | | | | | | | 84,045 | |
| Mosaic Co. | | | | 1,522 | | | | | | | | | | 41,551 | |
| Olin Corp. | | | | 1,671 | | | | | | | | | | 62,295 | |
| Sherwin-Williams Co.B | | | | 384 | | | | | | | | | | 160,170 | |
| | | | | | | | | | | | | | | |
| | | | | | | | | | | | | | 348,061 | |
| | | | | | | | | | | | | | | |
| | | | | | | | | | | | | | | |
| Construction Materials - 0.78% | | | | | | | | | | | | | | | |
| Buzzi Unicem SpA | | | | 980 | | | | | | | | | | 28,775 | |
| Forterra, Inc.A | | | | 3,258 | | | | | | | | | | 22,643 | |
| Loma Negra Cia Industrial Argentina S.A., Sponsored ADRA | | | | 2,252 | | | | | | | | | | 53,507 | |
| Summit Materials, Inc., Class AA | | | | 1,747 | | | | | | | | | | 55,817 | |
| | | | | | | | | | | | | | | |
| | | | | | | | | | | | | | 160,742 | |
| | | | | | | | | | | | | | | |
| | | | | | | | | | | | | | | |
| Metals & Mining - 3.38% | | | | | | | | | | | | | | | |
| China Molybdenum Co., Ltd., Class H | | | | 48,000 | | | | | | | | | | 36,939 | |
| First Quantum Minerals Ltd. | | | | 11,942 | | | | | | | | | | 178,062 | |
| Teck Resources Ltd., Class B | | | | 11,345 | | | | | | | | | | 329,572 | |
| voestalpine AG | | | | 1,060 | | | | | | | | | | 68,803 | |
| Warrior Met Coal, Inc. | | | | 2,802 | | | | | | | | | | 78,372 | |
| | | | | | | | | | | | | | | |
| | | | | | | | | | | | | | 691,748 | |
| | | | | | | | | | | | | | | |
| | | | | | | | | | | | | | | |
| Paper & Forest Products - 1.13% | | | | | | | | | | | | | | | |
| Canfor Corp.A | | | | 6,414 | | | | | | | | | | 150,442 | |
| West Fraser Timber Co., Ltd. | | | | 1,171 | | | | | | | | | | 81,932 | |
| | | | | | | | | | | | | | | |
| | | | | | | | | | | | | | 232,374 | |
| | | | | | | | | | | | | | | |
| | | | | | | | | | | | | | | |
Total Materials | | | | | | | | | | | | | | 1,432,925 | |
| | | | | | | | | | | | | | | |
| | | | | | | | | | | | | | | |
| Real Estate - 0.97% | | | | | | | | | | | | | | | |
| Real Estate Management & Development - 0.97% | | | | | | | | | | | | | | | |
| Realogy Holdings Corp. | | | | 7,243 | | | | | | | | | | 199,255 | |
| | | | | | | | | | | | | | | |
See accompanying notes
17
American Beacon Grosvenor Long/Short FundSM
Schedule of Investments
January 31, 2018
| | | | | | | | | | | | | | | |
| | | Shares | | | | Fair Value |
| | | | | | | | | | | | | | | |
| COMMON STOCKS - 77.07% (continued) | | | | | | | | | | | | | | | |
| Telecommunication Services - 1.18% | | | | | | | | | | | | | | | |
| Diversified Telecommunication Services - 0.32% | | | | | | | | | | | | | | | |
| Telefonica Deutschland Holding AG | | | | 13,021 | | | | | | | | | $ | 65,796 | |
| | | | | | | | | | | | | | | |
| | | | | | | | | | | | | | | |
| Wireless Telecommunication Services - 0.86% | | | | | | | | | | | | | | | |
| TIM Participacoes S.A., ADR | | | | 6,131 | | | | | | | | | | 128,874 | |
| XL Axiata Tbk PTA | | | | 214,405 | | | | | | | | | | 47,882 | |
| | | | | | | | | | | | | | | |
| | | | | | | | | | | | | | 176,756 | |
| | | | | | | | | | | | | | | |
| | | | | | | | | | | | | | | |
Total Telecommunication Services | | | | | | | | | | | | | | 242,552 | |
| | | | | | | | | | | | | | | |
| | | | | | | | | | | | | | | |
| Utilities - 7.90% | | | | | | | | | | | | | | | |
| Electric Utilities - 5.17% | | | | | | | | | | | | | | | |
| Avangrid, Inc. | | | | 2,184 | | | | | | | | | | 106,404 | |
| Edison International | | | | 792 | | | | | | | | | | 49,524 | |
| Exelon Corp. | | | | 5,788 | | | | | | | | | | 222,896 | |
| FirstEnergy Corp. | | | | 8,062 | | | | | | | | | | 265,240 | |
| NextEra Energy, Inc. | | | | 1,014 | | | | | | | | | | 160,638 | |
| PG&E Corp. | | | | 3,412 | | | | | | | | | | 144,771 | |
| Enel SpA | | | | 17,503 | | | | | | | | | | 111,045 | |
| | | | | | | | | | | | | | | |
| | | | | | | | | | | | | | 1,060,518 | |
| | | | | | | | | | | | | | | |
| | | | | | | | | | | | | | | |
| Gas Utilities - 0.24% | | | | | | | | | | | | | | | |
| ENN Energy Holdings Ltd. | | | | 6,519 | | | | | | | | | | 50,334 | |
| | | | | | | | | | | | | | | |
| | | | | | | | | | | | | | | |
| Independent Power & Renewable Electricity Producers - 1.18% | | | | | | | | | | | | | | | |
| AES Corp. | | | | 13,402 | | | | | | | | | | 154,927 | |
| 8Point3 Energy Partners LP | | | | 1,683 | | | | | | | | | | 24,656 | |
| NRG Energy, Inc. | | | | 2,374 | | | | | | | | | | 61,748 | |
| | | | | | | | | | | | | | | |
| | | | | | | | | | | | | | 241,331 | |
| | | | | | | | | | | | | | | |
| | | | | | | | | | | | | | | |
| Multi-Utilities - 0.52% | | | | | | | | | | | | | | | |
| RWE AGA | | | | 2,962 | | | | | | | | | | 59,281 | |
| NiSource, Inc. | | | | 1,930 | | | | | | | | | | 47,632 | |
| | | | | | | | | | | | | | | |
| | | | | | | | | | | | | | 106,913 | |
| | | | | | | | | | | | | | | |
| | | | | | | | | | | | | | | |
| Water Utilities - 0.79% | | | | | | | | | | | | | | | |
| Guangdong Investment Ltd. | | | | 44,000 | | | | | | | | | | 65,472 | |
| Beijing Enterprises Water Group Ltd.A | | | | 132,817 | | | | | | | | | | 95,589 | |
| | | | | | | | | | | | | | | |
| | | | | | | | | | | | | | 161,061 | |
| | | | | | | | | | | | | | | |
| | | | | | | | | | | | | | | |
Total Utilities | | | | | | | | | | | | | | 1,620,157 | |
| | | | | | | | | | | | | | | |
| | | | | | | | | | | | | | | |
Total Common Stocks (Cost $13,620,273) | | | | | | | | | | | | | | 15,799,246 | |
| | | | | | | | | | | | | | | |
| | | | | | | | | | | | | | | |
| RIGHTS - 0.00% (Cost $0) | | | | | | | | | | | | | | | |
| Financials - 0.00% | | | | | | | | | | | | | | | |
| Banks - 0.00% | | | | | | | | | | | | | | | |
| UniCredit SpA, Withdrawal RightsA E | | | | 4,776 | | | | | | | | | | - | |
| | | | | | | | | | | | | | | |
| | | | | | | | | | | | | | | |
| INVESTMENT COMPANIES - 1.01% (Cost $157,778) | | | | | | | | | | | | | | | |
| Closed-End Funds - 1.01% | | | | | | | | | | | | | | | |
| Altaba, Inc.A | | | | 2,590 | | | | | | | | | | 206,889 | |
| | | | | | | | | | | | | | | |
| | | | | | | | | | | | | | | |
| EXCHANGE-TRADED INSTRUMENTS - 0.29% (Cost $61,559) | | | | | | | | | | | | | | | |
| Exchange-Traded Funds - 0.29% | | | | | | | | | | | | | | | |
| Nikkei 225 Bull 2x ETF | | | | 290 | | | | | | | | | | 59,637 | |
| | | | | | | | | | | | | | | |
See accompanying notes
18
American Beacon Grosvenor Long/Short FundSM
Schedule of Investments
January 31, 2018
| | | | | | | | | | | | | | | |
| | | Shares | | | | Fair Value |
| | | | | | | | | | | | | | | |
| SHORT-TERM INVESTMENTS - 19.35% (Cost $3,966,444) | | | | | | | | | | | | | | | |
| Investment Companies - 19.35% | | | | | | | | | | | | | | | |
| American Beacon U.S. Government Money Market Select Fund, Select Class, 1.25%F G | | | | 3,966,444 | | | | | | | | | $ | 3,966,444 | |
| | | | | | | | | | | | | | | |
| | | | | | | | | | | | | | | |
TOTAL SECURITIES HELD LONG (Cost $17,806,054) | | | | | | | | | | | | | | 20,032,216 | |
| | | | | | | | | | | | | | | |
| | | | | | | | | | | | | | | |
| SECURITIES HELD SHORT | | | | | | | | | | | | | | | |
| COMMON STOCKS - (14.49%) | | | | | | | | | | | | | | | |
| Consumer Discretionary - (2.48%) | | | | | | | | | | | | | | | |
| Automobiles - (0.12%) | | | | | | | | | | | | | | | |
| Ford Motor Co. | | | | (749 | ) | | | | | | | | | (8,217 | ) |
| General Motors Co. | | | | (374 | ) | | | | | | | | | (15,861 | ) |
| | | | | | | | | | | | | | | |
| | | | | | | | | | | | | | (24,078 | ) |
| | | | | | | | | | | | | | | |
| | | | | | | | | | | | | | | |
| Hotels, Restaurants & Leisure - (0.34%) | | | | | | | | | | | | | | | |
| Cheesecake Factory, Inc. | | | | (308 | ) | | | | | | | | | (15,150 | ) |
| Darden Restaurants, Inc. | | | | (128 | ) | | | | | | | | | (12,269 | ) |
| Red Robin Gourmet Burgers, Inc.A | | | | (72 | ) | | | | | | | | | (3,791 | ) |
| Vail Resorts, Inc. | | | | (37 | ) | | | | | | | | | (8,087 | ) |
| Wyndham Worldwide Corp. | | | | (222 | ) | | | | | | | | | (27,557 | ) |
| Wynn Macau Ltd. | | | | (794 | ) | | | | | | | | | (2,801 | ) |
| | | | | | | | | | | | | | | |
| | | | | | | | | | | | | | (69,655 | ) |
| | | | | | | | | | | | | | | |
| | | | | | | | | | | | | | | |
| Household Durables - (0.66%) | | | | | | | | | | | | | | | |
| DR Horton, Inc. | | | | (286 | ) | | | | | | | | | (14,028 | ) |
| Installed Building Products, Inc.A | | | | (81 | ) | | | | | | | | | (5,828 | ) |
| KB Home | | | | (403 | ) | | | | | | | | | (12,703 | ) |
| Leggett & Platt, Inc. | | | | (115 | ) | | | | | | | | | (5,349 | ) |
| LGI Homes, Inc.A | | | | (167 | ) | | | | | | | | | (11,302 | ) |
| Meritage Homes Corp.A | | | | (590 | ) | | | | | | | | | (27,995 | ) |
| Newell Brands, Inc. | | | | (270 | ) | | | | | | | | | (7,139 | ) |
| NVR, Inc.A | | | | (1 | ) | | | | | | | | | (3,178 | ) |
| PulteGroup, Inc. | | | | (683 | ) | | | | | | | | | (21,740 | ) |
| Roku, Inc.A | | | | (114 | ) | | | | | | | | | (4,631 | ) |
| Tempur Sealy International, Inc.A | | | | (87 | ) | | | | | | | | | (5,189 | ) |
| Toll Brothers, Inc. | | | | (112 | ) | | | | | | | | | (5,217 | ) |
| TopBuild Corp.A | | | | (139 | ) | | | | | | | | | (10,639 | ) |
| | | | | | | | | | | | | | | |
| | | | | | | | | | | | | | (134,938 | ) |
| | | | | | | | | | | | | | | |
| | | | | | | | | | | | | | | |
| Media - (0.53%) | | | | | | | | | | | | | | | |
| Altice USA, Inc., Class AA | | | | (877 | ) | | | | | | | | | (18,829 | ) |
| AMC Networks, Inc., Class AA | | | | (309 | ) | | | | | | | | | (15,941 | ) |
| Interpublic Group of Companies, Inc. | | | | (498 | ) | | | | | | | | | (10,901 | ) |
| Omnicom Group, Inc. | | | | (159 | ) | | | | | | | | | (12,188 | ) |
| ProSiebenSat.1 Media SE | | | | (639 | ) | | | | | | | | | (24,427 | ) |
| Publicis Groupe S.A. | | | | (164 | ) | | | | | | | | | (11,337 | ) |
| WPP PLC | | | | (774 | ) | | | | | | | | | (14,045 | ) |
| | | | | | | | | | | | | | | |
| | | | | | | | | | | | | | (107,668 | ) |
| | | | | | | | | | | | | | | |
| | | | | | | | | | | | | | | |
| Multiline Retail - (0.08%) | | | | | | | | | | | | | | | |
| Dollarama, Inc. | | | | (43 | ) | | | | | | | | | (5,879 | ) |
| Next PLC | | | | (92 | ) | | | | | | | | | (6,652 | ) |
| Nordstrom, Inc. | | | | (70 | ) | | | | | | | | | (3,452 | ) |
| | | | | | | | | | | | | | | |
| | | | | | | | | | | | | | (15,983 | ) |
| | | | | | | | | | | | | | | |
| | | | | | | | | | | | | | | |
| Specialty Retail - (0.47%) | | | | | | | | | | | | | | | |
| AutoNation, Inc.A | | | | (154 | ) | | | | | | | | | (9,274 | ) |
| Best Buy Co., Inc. | | | | (28 | ) | | | | | | | | | (2,046 | ) |
| CarMax, Inc.A | | | | (232 | ) | | | | | | | | | (16,558 | ) |
| Floor & Decor Holdings, Inc., Class AA | | | | (139 | ) | | | | | | | | | (6,519 | ) |
See accompanying notes
19
American Beacon Grosvenor Long/Short FundSM
Schedule of Investments
January 31, 2018
| | | | | | | | | | | | | | | |
| | | Shares | | | | Fair Value |
| | | | | | | | | | | | | | | |
| COMMON STOCKS - (14.49%) (continued) | | | | | | | | | | | | | | | |
| Consumer Discretionary - (2.48%) (continued) | | | | | | | | | | | | | | | |
| Specialty Retail - (0.47%) (continued) | | | | | | | | | | | | | | | |
| Hennes & Mauritz AB, Class B | | | | (320 | ) | | | | | | | | $ | (5,658 | ) |
| Home Depot, Inc. | | | | (22 | ) | | | | | | | | | (4,439 | ) |
| Lithia Motors, Inc., Class A | | | | (67 | ) | | | | | | | | | (8,372 | ) |
| Monro, Inc. | | | | (200 | ) | | | | | | | | | (11,300 | ) |
| Penske Automotive Group, Inc. | | | | (551 | ) | | | | | | | | | (28,757 | ) |
| Tractor Supply Co. | | | | (57 | ) | | | | | | | | | (4,346 | ) |
| | | | | | | | | | | | | | | |
| | | | | | | | | | | | | | (97,269 | ) |
| | | | | | | | | | | | | | | |
| | | | | | | | | | | | | | | |
| Textiles, Apparel & Luxury Goods - (0.28%) | | | | | | | | | | | | | | | |
| Gildan Activewear, Inc. | | | | (190 | ) | | | | | | | | | (6,461 | ) |
| HUGO BOSS AG | | | | (41 | ) | | | | | | | | | (3,766 | ) |
| Pandora A/S | | | | (209 | ) | | | | | | | | | (19,817 | ) |
| Ralph Lauren Corp. | | | | (247 | ) | | | | | | | | | (28,235 | ) |
| | | | | | | | | | | | | | | |
| | | | | | | | | | | | | | (58,279 | ) |
| | | | | | | | | | | | | | | |
| | | | | | | | | | | | | | | |
Total Consumer Discretionary | | | | | | | | | | | | | | (507,870 | ) |
| | | | | | | | | | | | | | | |
| | | | | | | | | | | | | | | |
| Consumer Staples - (0.54%) | | | | | | | | | | | | | | | |
| Beverages - (0.05%) | | | | | | | | | | | | | | | |
| Boston Beer Co., Inc., Class AA | | | | (51 | ) | | | | | | | | | (9,682 | ) |
| | | | | | | | | | | | | | | |
| | | | | | | | | | | | | | | |
| Food & Staples Retailing - (0.32%) | | | | | | | | | | | | | | | |
| Costco Wholesale Corp. | | | | (59 | ) | | | | | | | | | (11,498 | ) |
| ICA Gruppen AB | | | | (183 | ) | | | | | | | | | (7,148 | ) |
| Loblaw Companies Ltd. | | | | (123 | ) | | | | | | | | | (6,663 | ) |
| Metro, Inc. | | | | (121 | ) | | | | | | | | | (4,049 | ) |
| SUPERVALU, Inc.A | | | | (592 | ) | | | | | | | | | (9,377 | ) |
| Wal-Mart Stores, Inc. | | | | (160 | ) | | | | | | | | | (17,056 | ) |
| Wm Morrison Supermarkets PLC | | | | (3,104 | ) | | | | | | | | | (9,784 | ) |
| | | | | | | | | | | | | | | |
| | | | | | | | | | | | | | (65,575 | ) |
| | | | | | | | | | | | | | | |
| | | | | | | | | | | | | | | |
| Food Products - (0.04%) | | | | | | | | | | | | | | | |
| Blue Buffalo Pet Products, Inc.A | | | | (58 | ) | | | | | | | | | (1,971 | ) |
| Danone S.A. | | | | (77 | ) | | | | | | | | | (6,640 | ) |
| | | | | | | | | | | | | | | |
| | | | | | | | | | | | | | (8,611 | ) |
| | | | | | | | | | | | | | | |
| | | | | | | | | | | | | | | |
| Tobacco - (0.13%) | | | | | | | | | | | | | | | |
| Japan Tobacco, Inc. | | | | (833 | ) | | | | | | | | | (27,561 | ) |
| | | | | | | | | | | | | | | |
| | | | | | | | | | | | | | | |
Total Consumer Staples | | | | | | | | | | | | | | (111,429 | ) |
| | | | | | | | | | | | | | | |
| | | | | | | | | | | | | | | |
| Energy - (0.25%) | | | | | | | | | | | | | | | |
| Oil, Gas & Consumable Fuels - (0.25%) | | | | | | | | | | | | | | | |
| Snam SpA | | | | (10,297 | ) | | | | | | | | | (50,101 | ) |
| | | | | | | | | | | | | | | |
| | | | | | | | | | | | | | | |
| Financials - (4.15%) | | | | | | | | | | | | | | | |
| Banks - (3.04%) | | | | | | | | | | | | | | | |
| 1st Source Corp. | | | | (626 | ) | | | | | | | | | (32,733 | ) |
| AIB Group PLC | | | | (4,893 | ) | | | | | | | | | (34,110 | ) |
| Aldermore Group PLCA | | | | (958 | ) | | | | | | | | | (4,236 | ) |
| City Holding Co. | | | | (427 | ) | | | | | | | | | (29,378 | ) |
| Commerce Bancshares, Inc. | | | | (888 | ) | | | | | | | | | (51,957 | ) |
| Cullen/Frost Bankers, Inc. | | | | (333 | ) | | | | | | | | | (35,434 | ) |
| CVB Financial Corp. | | | | (2,234 | ) | | | | | | | | | (52,276 | ) |
| CYBG PLC | | | | (1,813 | ) | | | | | | | | | (8,253 | ) |
| First Financial Bankshares, Inc. | | | | (1,031 | ) | | | | | | | | | (47,890 | ) |
See accompanying notes
20
American Beacon Grosvenor Long/Short FundSM
Schedule of Investments
January 31, 2018
| | | | | | | | | | | | | | | |
| | | Shares | | | | Fair Value |
| | | | | | | | | | | | | | | |
| COMMON STOCKS - (14.49%) (continued) | | | | | | | | | | | | | | | |
| Financials - (4.15%) (continued) | | | | | | | | | | | | | | | |
| Banks - (3.04%) (continued) | | | | | | | | | | | | | | | |
| German American Bancorp, Inc. | | | | (842 | ) | | | | | | | | $ | (29,209 | ) |
| Glacier Bancorp, Inc. | | | | (1,486 | ) | | | | | | | | | (58,281 | ) |
| Heritage Financial Corp. | | | | (1,241 | ) | | | | | | | | | (38,223 | ) |
| Independent Bank Corp. | | | | (455 | ) | | | | | | | | | (32,464 | ) |
| Lakeland Financial Corp. | | | | (924 | ) | | | | | | | | | (44,417 | ) |
| S&T Bancorp, Inc. | | | | (191 | ) | | | | | | | | | (7,709 | ) |
| South State Corp. | | | | (600 | ) | | | | | | | | | (53,160 | ) |
| Webster Financial Corp. | | | | (1,113 | ) | | | | | | | | | (63,018 | ) |
| | | | | | | | | | | | | | | |
| | | | | | | | | | | | | | (622,748 | ) |
| | | | | | | | | | | | | | | |
| | | | | | | | | | | | | | | |
| Capital Markets - (0.04%) | | | | | | | | | | | | | | | |
| Close Brothers Group PLC | | | | (391 | ) | | | | | | | | | (8,738 | ) |
| | | | | | | | | | | | | | | |
| | | | | | | | | | | | | | | |
| Consumer Finance - (0.45%) | | | | | | | | | | | | | | | |
| Discover Financial Services | | | | (424 | ) | | | | | | | | | (33,835 | ) |
| Enova International, Inc.A | | | | (749 | ) | | | | | | | | | (13,407 | ) |
| Synchrony Financial | | | | (683 | ) | | | | | | | | | (27,101 | ) |
| World Acceptance Corp.A | | | | (151 | ) | | | | | | | | | (17,826 | ) |
| | | | | | | | | | | | | | | |
| | | | | | | | | | | | | | (92,169 | ) |
| | | | | | | | | | | | | | | |
| | | | | | | | | | | | | | | |
| Thrifts & Mortgage Finance - (0.62%) | | | | | | | | | | | | | | | |
| Beneficial Bancorp, Inc. | | | | (1,893 | ) | | | | | | | | | (30,761 | ) |
| Clifton Bancorp, Inc. | | | | (851 | ) | | | | | | | | | (13,897 | ) |
| Kearny Financial Corp. | | | | (1,439 | ) | | | | | | | | | (19,858 | ) |
| Meridian Bancorp, Inc. | | | | (760 | ) | | | | | | | | | (15,542 | ) |
| WSFS Financial Corp. | | | | (937 | ) | | | | | | | | | (47,881 | ) |
| | | | | | | | | | | | | | | |
| | | | | | | | | | | | | | (127,939 | ) |
| | | | | | | | | | | | | | | |
| | | | | | | | | | | | | | | |
Total Financials | | | | | | | | | | | | | | (851,594 | ) |
| | | | | | | | | | | | | | | |
| | | | | | | | | | | | | | | |
| Health Care - (0.08%) | | | | | | | | | | | | | | | |
| Biotechnology - (0.02%) | | | | | | | | | | | | | | | |
| Celgene Corp.A | | | | (32 | ) | | | | | | | | | (3,237 | ) |
| Incyte Corp.A | | | | (9 | ) | | | | | | | | | (813 | ) |
| | | | | | | | | | | | | | | |
| | | | | | | | | | | | | | (4,050 | ) |
| | | | | | | | | | | | | | | |
| | | | | | | | | | | | | | | |
| Health Care Providers & Services - (0.02%) | | | | | | | | | | | | | | | |
| Aetna, Inc. | | | | (13 | ) | | | | | | | | | (2,429 | ) |
| HCA Healthcare, Inc.A | | | | (29 | ) | | | | | | | | | (2,933 | ) |
| | | | | | | | | | | | | | | |
| | | | | | | | | | | | | | (5,362 | ) |
| | | | | | | | | | | | | | | |
| | | | | | | | | | | | | | | |
| Pharmaceuticals - (0.04%) | | | | | | | | | | | | | | | |
| Mallinckrodt PLCA | | | | (166 | ) | | | | | | | | | (2,998 | ) |
| Teva Pharmaceutical Industries Ltd., Sponsored ADR | | | | (228 | ) | | | | | | | | | (4,653 | ) |
| | | | | | | | | | | | | | | |
| | | | | | | | | | | | | | (7,651 | ) |
| | | | | | | | | | | | | | | |
| | | | | | | | | | | | | | | |
Total Health Care | | | | | | | | | | | | | | (17,063 | ) |
| | | | | | | | | | | | | | | |
| | | | | | | | | | | | | | | |
| Industrials - (2.40%) | | | | | | | | | | | | | | | |
| Air Freight & Logistics - (0.17%) | | | | | | | | | | | | | | | |
| United Parcel Service, Inc., Class B | | | | (269 | ) | | | | | | | | | (34,249 | ) |
| | | | | | | | | | | | | | | |
| | | | | | | | | | | | | | | |
| Airlines - (0.13%) | | | | | | | | | | | | | | | |
| Norwegian Air Shuttle ASAA | | | | (382 | ) | | | | | | | | | (11,194 | ) |
| SAS ABA | | | | (5,220 | ) | | | | | | | | | (12,633 | ) |
| United Continental Holdings, Inc.A | | | | (52 | ) | | | | | | | | | (3,527 | ) |
| | | | | | | | | | | | | | | |
| | | | | | | | | | | | | | (27,354 | ) |
| | | | | | | | | | | | | | | |
See accompanying notes
21
American Beacon Grosvenor Long/Short FundSM
Schedule of Investments
January 31, 2018
| | | | | | | | | | | | | | | |
| | | Shares | | | | Fair Value |
| | | | | | | | | | | | | | | |
| COMMON STOCKS - (14.49%) (continued) | | | | | | | | | | | | | | | |
| Industrials - (2.40%) (continued) | | | | | | | | | | | | | | | |
| Building Products - (0.10%) | | | | | | | | | | | | | | | |
| American Woodmark Corp.A | | | | (58 | ) | | | | | | | | $ | (7,879 | ) |
| Simpson Manufacturing Co., Inc. | | | | (95 | ) | | | | | | | | | (5,580 | ) |
| USG Corp.A | | | | (186 | ) | | | | | | | | | (7,191 | ) |
| | | | | | | | | | | | | | | |
| | | | | | | | | | | | | | (20,650 | ) |
| | | | | | | | | | | | | | | |
| | | | | | | | | | | | | | | |
| Commercial Services & Supplies - (0.34%) | | | | | | | | | | | | | | | |
| ADT, Inc.A | | | | (1,441 | ) | | | | | | | | | (17,984 | ) |
| Cintas Corp. | | | | (65 | ) | | | | | | | | | (10,949 | ) |
| Republic Services, Inc. | | | | (448 | ) | | | | | | | | | (30,822 | ) |
| Ritchie Bros Auctioneers, Inc. | | | | (299 | ) | | | | | | | | | (9,724 | ) |
| | | | | | | | | | | | | | | |
| | | | | | | | | | | | | | (69,479 | ) |
| | | | | | | | | | | | | | | |
| | | | | | | | | | | | | | | |
| Construction & Engineering - (0.16%) | | | | | | | | | | | | | | | |
| Valmont Industries, Inc. | | | | (200 | ) | | | | | | | | | (32,720 | ) |
| | | | | | | | | | | | | | | |
| | | | | | | | | | | | | | | |
| Electrical Equipment - (0.68%) | | | | | | | | | | | | | | | |
| Eaton Corp. PLC | | | | (273 | ) | | | | | | | | | (22,924 | ) |
| Generac Holdings, Inc.A | | | | (1,298 | ) | | | | | | | | | (63,511 | ) |
| Regal Beloit Corp. | | | | (687 | ) | | | | | | | | | (53,517 | ) |
| | | | | | | | | | | | | | | |
| | | | | | | | | | | | | | (139,952 | ) |
| | | | | | | | | | | | | | | |
| | | | | | | | | | | | | | | |
| Machinery - (0.50%) | | | | | | | | | | | | | | | |
| Flowserve Corp. | | | | (734 | ) | | | | | | | | | (33,265 | ) |
| Kone OYJ, Class B | | | | (189 | ) | | | | | | | | | (10,818 | ) |
| SKF AB, Class B | | | | (1,067 | ) | | | | | | | | | (26,371 | ) |
| Timken Co. | | | | (444 | ) | | | | | | | | | (23,332 | ) |
| Volvo AB, Class B | | | | (449 | ) | | | | | | | | | (9,165 | ) |
| | | | | | | | | | | | | | | |
| | | | | | | | | | | | | | (102,951 | ) |
| | | | | | | | | | | | | | | |
| | | | | | | | | | | | | | | |
| Marine - (0.11%) | | | | | | | | | | | | | | | |
| Kirby Corp.A | | | | (295 | ) | | | | | | | | | (22,095 | ) |
| | | | | | | | | | | | | | | |
| | | | | | | | | | | | | | | |
| Road & Rail - (0.09%) | | | | | | | | | | | | | | | |
| Canadian National Railway Co. | | | | (112 | ) | | | | | | | | | (8,974 | ) |
| Schneider National, Inc., Class B | | | | (308 | ) | | | | | | | | | (9,018 | ) |
| | | | | | | | | | | | | | | |
| | | | | | | | | | | | | | (17,992 | ) |
| | | | | | | | | | | | | | | |
| | | | | | | | | | | | | | | |
| Trading Companies & Distributors - (0.12%) | | | | | | | | | | | | | | | |
| Aircastle Ltd. | | | | (1,032 | ) | | | | | | | | | (24,376 | ) |
| | | | | | | | | | | | | | | |
| | | | | | | | | | | | | | | |
Total Industrials | | | | | | | | | | | | | | (491,818 | ) |
| | | | | | | | | | | | | | | |
| | | | | | | | | | | | | | | |
| Information Technology - (0.25%) | | | | | | | | | | | | | | | |
| Communications Equipment - (0.02%) | | | | | | | | | | | | | | | |
| Cisco Systems, Inc. | | | | (78 | ) | | | | | | | | | (3,240 | ) |
| | | | | | | | | | | | | | | |
| | | | | | | | | | | | | | | |
| IT Services - (0.07%) | | | | | | | | | | | | | | | |
| Accenture PLC, Class A | | | | (90 | ) | | | | | | | | | (14,463 | ) |
| | | | | | | | | | | | | | | |
| | | | | | | | | | | | | | | |
| Software - (0.13%) | | | | | | | | | | | | | | | |
| Adobe Systems, Inc.A | | | | (25 | ) | | | | | | | | | (4,994 | ) |
| Atlassian Corp. PLC, Class AA | | | | (50 | ) | | | | | | | | | (2,699 | ) |
| Blackline, Inc.A | | | | (24 | ) | | | | | | | | | (798 | ) |
| Check Point Software Technologies Ltd.A | | | | (4 | ) | | | | | | | | | (414 | ) |
| Fortinet, Inc.A | | | | (56 | ) | | | | | | | | | (2,578 | ) |
| Snap, Inc., Class AA | | | | (295 | ) | | | | | | | | | (3,988 | ) |
| Ultimate Software Group, Inc.A | | | | (38 | ) | | | | | | | | | (8,850 | ) |
See accompanying notes
22
American Beacon Grosvenor Long/Short FundSM
Schedule of Investments
January 31, 2018
| | | | | | | | | | | | | | | |
| | | Shares | | | | Fair Value |
| | | | | | | | | | | | | | | |
| COMMON STOCKS - (14.49%) (continued) | | | | | | | | | | | | | | | |
| Information Technology - (0.25%) (continued) | | | | | | | | | | | | | | | |
| Software - (0.13%) (continued) | | | | | | | | | | | | | | | |
| Zendesk, Inc.A | | | | (53 | ) | | | | | | | | $ | (2,042 | ) |
| | | | | | | | | | | | | | | |
| | | | | | | | | | | | | | (26,363 | ) |
| | | | | | | | | | | | | | | |
| | | | | | | | | | | | | | | |
| Technology Hardware, Storage & Peripherals - (0.03%) | | | | | | | | | | | | | | | |
| Logitech International S.A. | | | | (156 | ) | | | | | | | | | (6,547 | ) |
| | | | | | | | | | | | | | | |
| | | | | | | | | | | | | | | |
Total Information Technology | | | | | | | | | | | | | | (50,613 | ) |
| | | | | | | | | | | | | | | |
| | | | | | | | | | | | | | | |
| Materials - (0.67%) | | | | | | | | | | | | | | | |
| Chemicals - (0.38%) | | | | | | | | | | | | | | | |
| Albemarle Corp. | | | | (302 | ) | | | | | | | | | (33,700 | ) |
| Eastman Chemical Co. | | | | (170 | ) | | | | | | | | | (16,861 | ) |
| Methanex Corp. | | | | (452 | ) | | | | | | | | | (28,453 | ) |
| | | | | | | | | | | | | | | |
| | | | | | | | | | | | | | (79,014 | ) |
| | | | | | | | | | | | | | | |
| | | | | | | | | | | | | | | |
| Metals & Mining - (0.05%) | | | | | | | | | | | | | | | |
| Kaiser Aluminum Corp. | | | | (92 | ) | | | | | | | | | (10,142 | ) |
| | | | | | | | | | | | | | | |
| | | | | | | | | | | | | | | |
| Paper & Forest Products - (0.24%) | | | | | | | | | | | | | | | |
| Domtar Corp. | | | | (438 | ) | | | | | | | | | (22,496 | ) |
| Louisiana-Pacific Corp.A | | | | (882 | ) | | | | | | | | | (26,116 | ) |
| | | | | | | | | | | | | | | |
| | | | | | | | | | | | | | (48,612 | ) |
| | | | | | | | | | | | | | | |
| | | | | | | | | | | | | | | |
Total Materials | | | | | | | | | | | | | | (137,768 | ) |
| | | | | | | | | | | | | | | |
| | | | | | | | | | | | | | | |
| Real Estate - (0.34%) | | | | | | | | | | | | | | | |
| Equity Real Estate Investment Trusts (REITs) - (0.34%) | | | | | | | | | | | | | | | |
| Camden Property Trust | | | | (73 | ) | | | | | | | | | (6,319 | ) |
| Empire State Realty Trust, Inc., Class A | | | | (210 | ) | | | | | | | | | (4,105 | ) |
| Federal Realty Investment Trust | | | | (22 | ) | | | | | | | | | (2,658 | ) |
| Host Hotels & Resorts, Inc. | | | | (1,146 | ) | | | | | | | | | (23,791 | ) |
| Public Storage, REIT | | | | (10 | ) | | | | | | | | | (1,958 | ) |
| Regency Centers Corp. | | | | (72 | ) | | | | | | | | | (4,529 | ) |
| Ryman Hospitality Properties, Inc. | | | | (298 | ) | | | | | | | | | (22,812 | ) |
| UDR, Inc. | | | | (117 | ) | | | | | | | | | (4,274 | ) |
| | | | | | | | | | | | | | | |
| | | | | | | | | | | | | | (70,446 | ) |
| | | | | | | | | | | | | | | |
| | | | | | | | | | | | | | | |
Total Real Estate | | | | | | | | | | | | | | (70,446 | ) |
| | | | | | | | | | | | | | | |
| | | | | | | | | | | | | | | |
| Utilities - (3.33%) | | | | | | | | | | | | | | | |
| Electric Utilities - (2.01%) | | | | | | | | | | | | | | | |
| Southern Co. | | | | (1,416 | ) | | | | | | | | | (63,876 | ) |
| American Electric Power Co., Inc. | | | | (540 | ) | | | | | | | | | (37,141 | ) |
| Duke Energy Corp. | | | | (921 | ) | | | | | | | | | (72,299 | ) |
| PPL Corp. | | | | (1,999 | ) | | | | | | | | | (63,708 | ) |
| Xcel Energy, Inc. | | | | (1,777 | ) | | | | | | | | | (81,102 | ) |
| Terna Rete Elettrica Nazionale SpA | | | | (11,318 | ) | | | | | | | | | (68,124 | ) |
| Orsted A/SD | | | | (413 | ) | | | | | | | | | (25,078 | ) |
| | | | | | | | | | | | | | | |
| | | | | | | | | | | | | | (411,328 | ) |
| | | | | | | | | | | | | | | |
| | | | | | | | | | | | | | | |
| Multi-Utilities - (0.97%) | | | | | | | | | | | | | | | |
| Avista Corp. | | | | (235 | ) | | | | | | | | | (11,912 | ) |
| Consolidated Edison, Inc. | | | | (833 | ) | | | | | | | | | (66,940 | ) |
| DTE Energy Co. | | | | (531 | ) | | | | | | | | | (56,095 | ) |
| WEC Energy Group, Inc. | | | | (445 | ) | | | | | | | | | (28,613 | ) |
| Innogy SED | | | | (943 | ) | | | | | | | | | (35,943 | ) |
| | | | | | | | | | | | | | | |
| | | | | | | | | | | | | | (199,503 | ) |
| | | | | | | | | | | | | | | |
See accompanying notes
23
American Beacon Grosvenor Long/Short FundSM
Schedule of Investments
January 31, 2018
| | | | | | | | | | | | | | | |
| | | Shares | | | | Fair Value |
| | | | | | | | | | | | | | | |
| COMMON STOCKS - (14.49%) (continued) | | | | | | | | | | | | | | | |
| Utilities - (3.33%) (continued) | | | | | | | | | | | | | | | |
| Water Utilities - (0.35%) | | | | | | | | | | | | | | | |
| American Water Works Co., Inc. | | | | (574 | ) | | | | | | | | $ | (47,740 | ) |
| AquaVenture Holdings Ltd.A | | | | (1,568 | ) | | | | | | | | | (23,849 | ) |
| | | | | | | | | | | | | | | |
| | | | | | | | | | | | | | (71,589 | ) |
| | | | | | | | | | | | | | | |
| | | | | | | | | | | | | | | |
Total Utilities | | | | | | | | | | | | | | (682,420 | ) |
| | | | | | | | | | | | | | | |
| | | | | | | | | | | | | | | |
TOTAL COMMON STOCKS (Proceeds $(2,780,177)) | | | | | | | | | | | | | | (2,971,122 | ) |
| | | | | | | | | | | | | | | |
| | | | | | | | | | | | | | | |
| EXCHANGE-TRADED INSTRUMENTS - (8.70%) | | | | | | | | | | | | | | | |
| Exchange-Traded Funds - (8.70%) | | | | | | | | | | | | | | | |
| Consumer Discretionary Select Sector SPDR Fund | | | | (3,755 | ) | | | | | | | | | (404,827 | ) |
| Consumer Staples Select Sector SPDR Fund | | | | (3,125 | ) | | | | | | | | | (180,687 | ) |
| Energy Select Sector SPDR Fund | | | | (120 | ) | | | | | | | | | (8,982 | ) |
| Health Care Select Sector SPDR Fund | | | | (1,434 | ) | | | | | | | | | (126,335 | ) |
| Industrial Select Sector SPDR Fund | | | | (681 | ) | | | | | | | | | (54,296 | ) |
| iShares 20+ Year Treasury Bond ETF | | | | (1,228 | ) | | | | | | | | | (150,712 | ) |
| iShares 7-10 Year Treasury Bond ETF, Class B | | | | (676 | ) | | | | | | | | | (69,831 | ) |
| iShares MSCI Brazil ETF | | | | (201 | ) | | | | | | | | | (9,365 | ) |
| iShares MSCI Emerging Markets ETF | | | | (1,065 | ) | | | | | | | | | (54,347 | ) |
| iShares Russell 1000 Growth ETF | | | | (205 | ) | | | | | | | | | (29,528 | ) |
| iShares Russell 2000 ETF | | | | (97 | ) | | | | | | | | | (15,167 | ) |
| iShares STOXX Europe 600 UCITS ETF | | | | (1,036 | ) | | | | | | | | | (50,003 | ) |
| iShares U.S. Home Construction ETF | | | | (245 | ) | | | | | | | | | (10,506 | ) |
| Materials Select Sector SPDR Fund | | | | (260 | ) | | | | | | | | | (16,367 | ) |
| PowerShares QQQ Trust Series 1 | | | | (281 | ) | | | | | | | | | (47,601 | ) |
| Real Estate Select Sector SPDR Fund | | | | (753 | ) | | | | | | | | | (24,329 | ) |
| SPDR S&P 500 ETF Trust | | | | (104 | ) | | | | | | | | | (29,318 | ) |
| SPDR S&P MidCap 400 ETF Trust | | | | (19 | ) | | | | | | | | | (6,745 | ) |
| SPDR S&P Regional Banking ETF | | | | (110 | ) | | | | | | | | | (6,853 | ) |
| SPDR S&P Telecom ETF | | | | (471 | ) | | | | | | | | | (33,017 | ) |
| Technology Select Sector SPDR Fund | | | | (1,678 | ) | | | | | | | | | (114,859 | ) |
| Utilities Select Sector SPDR Fund | | | | (1,076 | ) | | | | | | | | | (54,919 | ) |
| VanEck Vectors Semiconductor ETF | | | | (137 | ) | | | | | | | | | (14,592 | ) |
| Vanguard REIT ETF | | | | (877 | ) | | | | | | | | | (69,678 | ) |
| Vanguard Total International Bond ETF | | | | (3,692 | ) | | | | | | | | | (199,590 | ) |
| | | | | | | | | | | | | | | |
| | | | | | | | | | | | | | | |
Total Exchange-Traded Funds | | | | | | | | | | | | | | (1,782,454 | ) |
| | | | | | | | | | | | | | | |
| | | | | | | | | | | | | | | |
TOTAL EXCHANGE-TRADED INSTRUMENTS (Proceeds $(1,560,729)) | | | | | | | | | | | | | | (1,782,454 | ) |
| | | | | | | | | | | | | | | |
| | | | | | | | | | | | | | | |
TOTAL SECURITIES SOLD SHORT (Proceeds $(4,340,906)) | | | | | | | | | | | | | | (4,753,576 | ) |
| | | | | | | | | | | | | | | |
| | | | | | | | | | | | | | | |
TOTAL INVESTMENTS IN SECURITIES (EXCLUDES SECURITIES SOLD SHORT) - 97.72%
(Cost $17,806,054) | | | | | | | | | | | | | | 20,032,216 | |
TOTAL PURCHASED OPTIONS CONTRACTS - 0.10% (Premiums Paid $25,214) | | | | | | | | | | | | | | 21,249 | |
TOTAL SECURITIES SOLD SHORT - (23.19%) (Proceeds $(4,340,906)) | | | | | | | | | | | | | | (4,753,576 | ) |
OTHER ASSETS, NET OF LIABILITIES - 25.37% | | | | | | | | | | | | | | 5,200,628 | |
| | | | | | | | | | | | | | | |
NET ASSETS - 100.00% | | | | | | | | | | | | | $ | 20,500,517 | |
| | | | | | | | | | | | | | | |
| | | | | | | | | | | | | | | |
| Percentages are stated as a percent of net assets. | | | | | | | | | | | | | | | |
A Non-income producing security.
B This security or a piece thereof is held as segregated collateral.
C Tracking Stock - A form of common stock that is issued by a parent company and tracks the performance of a specific division of that parent company. It allows investors the chance to invest in an individual sector of a company while the parent company maintains overall control.
See accompanying notes
24
American Beacon Grosvenor Long/Short FundSM
Schedule of Investments
January 31, 2018
D Security exempt from registration under the Securities Act of 1933. These securities may be resold to qualified institutional buyers pursuant to Rule 144A. At the period end, the value of these securities amounted to $105,616 or 0.52% of net assets. The Fund has no right to demand registration of these securities.
E Fair valued pursuant to procedures approved by the Board of Trustees. At period end, the value of these securities amounted to $0 or 0.00% of net assets. Value was determined using significant unobservable inputs.
F The Fund is affiliated by having the same investment advisor.
G 7-day yield.
ADR - American Depositary Receipt.
ETF - Exchange-Traded Fund.
GDR - Global Depositary Receipt.
LP - Limited Partnership.
MSCI - Morgan Stanley Capital International.
NVDR - Non Voting Depositary Receipt.
PJSC - Private Joint Stock Company.
PLC - Public Limited Company.
S&P - Standard & Poor’s.
S&P 500 - Standard & Poor’s U.S. Equity Large-Cap Index.
SPDR - Standard & Poor���s Depositary Receipt.
UCITS - Undertaking for Collective Investments in Transferable Securities.
| | | | | | | | | | |
| OTC Swap Agreements Outstanding on January 31, 2018: |
|
| OTC Swap Agreement Contracts for Difference – Equity |
| | | | | | | | | | | | | | | | | | | | | | | | |
| Reference Entity | | Counter-
party | | Long/
Short | | Currency | | Financing
Rate | | Expiration
Date | | | Notional
Amount | | | Premiums
Paid
(Received) | | | Unrealized
Appreciation
(Depreciation) | |
| CEZ A/S | | MSC | | Long | | CZK | | 0.800% | | | 1/30/2020 | | | | 653 | | | $ | 16,751 | | | $ | (15 | ) |
| Aeroports de Paris | | MSC | | Long | | EUR | | 0.145% | | | 1/13/2020 | | | | 138 | | | | 28,220 | | | | 437 | |
| Cellnex Telecom S.A. | | MSC | | Long | | EUR | | 0.145% | | | 1/13/2020 | | | | 3,994 | | | | 105,166 | | | | 541 | |
| Electricite de France S.A. | | MSC | | Long | | EUR | | 0.145% | | | 1/13/2020 | | | | 5,850 | | | | 80,909 | | | | (498 | ) |
| Ferrovial S.A. | | MSC | | Long | | EUR | | 0.145% | | | 1/13/2020 | | | | 3,954 | | | | 90,333 | | | | (69 | ) |
| Fortum OYJ | | MSC | | Long | | EUR | | 0.145% | | | 1/13/2020 | | | | 4,838 | | | | 107,578 | | | | (3,196 | ) |
| Obrascon Huarte Lain S.A. | | MSC | | Long | | EUR | | 0.145% | | | 1/13/2020 | | | | 7,101 | | | | 44,557 | | | | (731 | ) |
| Suez | | MSC | | Long | | EUR | | 0.145% | | | 1/13/2020 | | | | 7,063 | | | | 101,933 | | | | 2,907 | |
| Veolia Environnement S.A. | | MSC | | Long | | EUR | | 0.145% | | | 1/13/2020 | | | | 4,915 | | | | 122,767 | | | | 462 | |
| Glencore PLC | | MSC | | Long | | GBP | | 0.500% | | | 1/30/2020 | | | | 9,302 | | | | 53,873 | | | | (867 | ) |
| Aena SME S.A. | | MSC | | Short | | EUR | | 0.855% | | | 1/13/2020 | | | | (169 | ) | | | 36,570 | | | | (232 | ) |
| EDP-Energias de Portugal S.A. | | MSC | | Short | | EUR | | 0.678% | | | 1/13/2020 | | | | (9,386 | ) | | | 33,264 | | | | 458 | |
| Enagas S.A. | | MSC | | Short | | EUR | | 0.855% | | | 1/13/2020 | | | | (1,155 | ) | | | 31,116 | | | | (351 | ) |
| Endesa S.A. | | MSC | | Short | | EUR | | 0.855% | | | 1/13/2020 | | | | (730 | ) | | | 16,337 | | | | (62 | ) |
| Engie S.A. | | MSC | | Short | | EUR | | 0.755% | | | 1/13/2020 | | | | (6,935 | ) | | | 121,614 | | | | 3,721 | |
| Red Electrica Corp S.A. | | MSC | | Short | | EUR | | 0.855% | | | 1/13/2020 | | | | (2,632 | ) | | | 55,630 | | | | (133 | ) |
| Stoxx Europe 600 Utilities | | MSC | | Short | | EUR | | 0.450% | | | 1/30/2020 | | | | (377 | ) | | | 131,385 | | | | - | |
| Vinci S.A. | | MSC | | Short | | EUR | | 0.755% | | | 1/13/2020 | | | | (346 | ) | | | 37,380 | | | | 18 | |
| CGN Power Co Ltd. | | MSC | | Short | | HKD | | 0.405% | | | 1/30/2020 | | | | (59,000 | ) | | | 16,802 | | | | 128 | |
| China Gas Holdings Ltd. | | MSC | | Short | | HKD | | 0.405% | | | 1/30/2020 | | | | (8,800 | ) | | | 26,685 | | | | 914 | |
| CRRC Corp Ltd. | | MSC | | Short | | HKD | | 0.405% | | | 1/30/2020 | | | | (18,000 | ) | | | 17,940 | | | | 100 | |
| HK Electric Investments & HK Electric Investments Ltd. | | MSC | | Short | | HKD | | 0.280% | | | 1/30/2020 | | | | (48,000 | ) | | | 44,319 | | | | (61 | ) |
| | | | | | | | | | | | | | | | | | | | | | | | |
| | | $ | 1,321,129 | | | $ | 3,471 | |
| | | | | | | | | | | | | | | | | | | | | | | | |
See accompanying notes
25
American Beacon Grosvenor Long/Short FundSM
Schedule of Investments
January 31, 2018
| | | | | | | | | | | | | | | | | | | | | | | | | | |
| Total Return Swap Agreements | |
Pay/Receive
Floating Rate | | Description | | Reference Entity | | Counter-
party | | Floating
Rate | | Expiration
Date | | Reference
Quantity | | | Notional
Amount* | | | Premiums
Paid
(Received) | | | Unrealized
Appreciation
(Depreciation) | |
| Pay | | 1-Month HKD-HONIA | | Air China Ltd. | | MSC | | 1.850% | | 2/22/2018 | | | 14,143 | | | | 111,081 | | | $ | (46 | ) | | $ | 6,530 | |
| Pay | | 1-Month HKD-HONIA | | Tencent
Holdings Ltd. | | MSC | | 1.850% | | 2/22/2018 | | | 408 | | | | 160,199 | | | | (22 | ) | | | 3,723 | |
| Pay | | 1-Month EUR-EURIBOR | | Accor S.A. | | MSC | | 0.130% | | 8/24/2018 | | | 1,091 | | | | 41,318 | | | | (122 | ) | | | 10,929 | |
| Pay | | 1-Month USD-FEDEF | | Alphabet, Inc. | | MSC | | 1.920% | | 10/2/2018 | | | 84 | | | | 68,344 | | | | - | | | | 30,962 | |
| Pay | | 1-Month USD-FEDEF | | Caterpillar, Inc. | | MSC | | 1.920% | | 10/2/2018 | | | 805 | | | | 76,201 | | | | - | | | | 54,837 | |
| Pay | | 1-Month USD-FEDEF | | Delta Air Lines,
Inc. | | MSC | | 1.920% | | 10/2/2018 | | | 757 | | | | 39,125 | | | | - | | | | 3,850 | |
| Pay | | 1-Day USD-FEDEF | | Knight-Swift
Transportation
Holdings, Inc. | | MSC | | 1.920% | | 10/2/2018 | | | 1,951 | | | | 58,782 | | | | (1 | ) | | | 38,358 | |
| Pay | | 1-Month USD-FEDEF | | Las Vegas Sands
Corp. | | MSC | | 1.920% | | 10/2/2018 | | | 1,304 | | | | 78,312 | | | | - | | | | 22,774 | |
| Pay | | 1-Month USD-FEDEF | | Monster
Beverage Corp. | | MSC | | 1.920% | | 10/2/2018 | | | 975 | | | | 45,798 | | | | - | | | | 20,726 | |
| Pay | | 1-Day USD-FEDEF | | NVR, Inc. | | MSC | | 1.920% | | 10/2/2018 | | | 87 | | | | 148,278 | | | | - | | | | 128,223 | |
| Pay | | 1-Day USD-FEDEF | | Rio Tinto PLC | | MSC | | 1.920% | | 10/2/2018 | | | 3,357 | | | | 135,512 | | | | - | | | | 52,850 | |
| Pay | | 1-Day USD-FEDEF | | Take-Two
Interactive
Software, Inc. | | MSC | | 1.920% | | 10/2/2018 | | | 1,745 | | | | 86,092 | | | | - | | | | 134,947 | |
| Pay | | 1-Month EUR-EURIBOR | | Air France-KLM | | MSC | | 0.130% | | 10/5/2018 | | | 2,042 | | | | 25,504 | | | | - | | | | 51 | |
| Pay | | 1-Month GBP-LIBOR | | Anglo American
PLC | | MSC | | 0.990% | | 10/5/2018 | | | 260 | | | | 4,470 | | | | - | | | | (40 | ) |
| Pay | | 1-Month GBP-LIBOR | | Antofagasta PLC | | MSC | | 0.990% | | 10/5/2018 | | | 2,811 | | | | 22,071 | | | | - | | | | 5,821 | |
| Pay | | 1-Month EUR-EURIBOR | | Cie Plastic
Omnium S.A. | | MSC | | 0.130% | | 10/5/2018 | | | 1,130 | | | | 33,710 | | | | - | | | | 16,243 | |
| Pay | | 1-Month GBP-LIBOR | | easyJet PLC | | MSC | | 0.990% | | 10/5/2018 | | | 527 | | | | 6,671 | | | | - | | | | 2,949 | |
| Pay | | 1-Month GBP-LIBOR | | International
Consolidated
Airlines Group
S.A. | | MSC | | 0.990% | | 10/5/2018 | | | 4,106 | | | | 20,803 | | | | - | | | | 7,785 | |
| Pay | | 1-Month EUR-EURIBOR | | Kering | | MSC | | 0.130% | | 10/5/2018 | | | 40 | | | | 9,546 | | | | - | | | | 8,400 | |
| Pay | | 1-Month GBP-LIBOR | | Rio Tinto PLC | | MSC | | 0.990% | | 10/5/2018 | | | 764 | | | | 25,291 | | | | - | | | | 6,634 | |
| Pay | | 1-Month EUR-EURIBOR | | Ryanair
Holdings | | MSC | | 0.130% | | 10/5/2018 | | | 768 | | | | 12,798 | | | | - | | | | - | |
| Pay | | 1-Month GBP-LIBOR | | Smurfit Kappa
Group PLC | | MSC | | 0.990% | | 10/5/2018 | | | 1,700 | | | | 37,107 | | | | - | | | | 6,982 | |
| Receive | | 1-Day USD-FEDEF | | Utilities Select
Sector Index | | MSC | | 1.270% | | 11/12/2018 | | | 43 | | | | 97,163 | | | | - | | | | 6,323 | |
| Receive | | 1-Day USD-FEDEF | | Consumer
Discretionary
Select Sector
Index | | MSC | | 1.420% | | 12/14/2018 | | | 35 | | | | 97,453 | | | | - | | | | (16,806 | ) |
| Receive | | 1-Month EUR-EURIBOR | | Jeronimo
Martins SGPS SA | | MSC | | 0.500% | | 2/23/2019 | | | 109 | | | | 1,904 | | | | - | | | | 42 | |
| Receive | | 1-Day USD-FEDEF | | NASDAQ 100
Total Return
Index | | MSC | | 1.570% | | 11/8/2019 | | | 14 | | | | 100,061 | | | | - | | | | (10,374 | ) |
| Receive | | 1-Day USD-FEDEF | | Consumer
Staples Select
Sector Index | | MSC | | 1.270% | | 11/12/2019 | | | 44 | | | | 97,013 | | | | - | | | | (10,354 | ) |
| Receive | | 1-Day USD-FEDEF | | S&P 500 Total
Return Index | | MSC | | 1.620% | | 11/12/2019 | | | 19 | | | | 95,686 | | | | - | | | | (9,027 | ) |
| Pay | | 1-Month EUR-EURIBOR | | Accor S.A. | | MSC | | 0.550% | | 1/17/2020 | | | 2,913 | | | | 108,731 | | | | (66 | ) | | | 30,894 | |
See accompanying notes
26
American Beacon Grosvenor Long/Short FundSM
Schedule of Investments
January 31, 2018
| | | | | | | | | | | | | | | | | | | | | | | | | | | | | | |
Pay/Receive
Floating Rate | | Description | | Reference Entity | | Counter-
party | | Floating
Rate | | | Expiration
Date | | | Reference
Quantity | | | Notional
Amount* | | | Premiums
Paid
(Received) | | | Unrealized
Appreciation
(Depreciation) | |
| Pay | | 1-Day EUR-EONIA | | FinecoBank
Banca Fineco
SpA | | MSC | | | 0.550% | | | | 1/17/2020 | | | | 6,954 | | | | 44,507 | | | $ | (7 | ) | | $ | 31,173 | |
| Receive | | 1-Day EUR-EONIA | | Casino Guichard
Perrachon S.A. | | MSC | | | 0.400% | | | | 1/17/2020 | | | | 159 | | | | 8,291 | | | | (7 | ) | | | 1,005 | |
| Receive | | 1-Day EUR-EONIA | | Eutelsat
Communications
S.A. | | MSC | | | 0.420% | | | | 1/17/2020 | | | | 975 | | | | 18,454 | | | | - | | | | 1,461 | |
| Receive | | 1-Day GBP-SONIA | | Ted Baker PLC | | MSC | | | 0.430% | | | | 1/17/2020 | | | | 46 | | | | 1,361 | | | | - | | | | (27 | ) |
| Receive | | 1-Month IDR-SOR | | Telekomunikasi
Indonesia
Persero Tbk PT | | MSC | | | 2.580% | | | | 1/17/2020 | | | | 34,741 | | | | 139,965,514 | | | | - | | | | 101 | |
| Receive | | 1-Day TWD-FEDEF | | China Steel
Corp. | | MSC | | | 1.110% | | | | 1/21/2020 | | | | 4,020 | | | | 81,547 | | | | - | | | | (636 | ) |
| Receive | | 1-Day BRL-FEDEF | | Raia Drogasil
S.A. | | MSC | | | 0.300% | | | | 1/21/2020 | | | | 41 | | | | 2,826 | | | | - | | | | (199 | ) |
| Receive | | 1-Day BRL-FEDEF | | Telefonica
Brasil S.A. | | MSC | | | 0.420% | | | | 1/21/2020 | | | | 1,148 | | | | 51,279 | | | | - | | | | (3,309 | ) |
| | | | | | | | | | | | | | | | | | | | | | | | | | | | | | |
| | | | | | | | | | | | | | | | | | | | | | | | $ | (271 | ) | | $ | 583,801 | |
| | | | | | | | | | | | | | | | | | | | | | | | | | | | | | |
| * | Notional amounts are denominated in local currency. |
| | | | | | | | | | | | | | | | | | |
| Purchased Options Contracts Open on January 31, 2018: | | | | | | | | |
| | | | | | | | | | | | | | | | | | | | | | | | | | | | |
| | | | | | | | | |
| Equity Options | | | | | | | | | | | | | | | | | | | | | | | |
| Description | | Counter-
party | | | Exercise
Price | | Expiration
Date | | Currency | | Number of
Contracts | | Notional
Amount | | | Premiums
Paid | | | Fair Value | | | Unrealized
Appreciation
(Depreciation) | |
| Call - ServiceNow, Inc. | | | CCP | | | 157.50 | | 2/2/2018 | | USD | | 4 | | | 400 | | | $ | 895 | | | $ | 648 | | | $ | (247 | ) |
| Put - Cigna Corp. | | | CCP | | | 220.00 | | 2/2/2018 | | USD | | 1 | | | 100 | | | | 193 | | | | 1,000 | | | | 807 | |
| Put - Cigna Corp. | | | CCP | | | 207.50 | | 2/2/2018 | | USD | | 3 | | | 300 | | | | 1,060 | | | | 1,060 | | | | - | |
| Call - Procter & Gamble Co. | | | CCP | | | 97.50 | | 2/16/2018 | | USD | | 43 | | | 4,300 | | | | 1,028 | | | | 86 | | | | (942 | ) |
| Call - Bed Bath & Beyond, Inc. | | | CCP | | | 25.00 | | 2/16/2018 | | USD | | 10 | | | 1,000 | | | | 1,334 | | | | 170 | | | | (1,164 | ) |
| Call - Mondelez International, Inc. | | | CCP | | | 46.00 | | 2/16/2018 | | USD | | 11 | | | 1,100 | | | | 370 | | | | 506 | | | | 136 | |
| Call - Palo Alto Networks, Inc. | | | CCP | | | 160.00 | | 2/16/2018 | | USD | | 3 | | | 300 | | | | 615 | | | | 909 | | | | 294 | |
| Call - Viacom, Inc. | | | CCP | | | 35.00 | | 2/16/2018 | | USD | | 13 | | | 1,300 | | | | 740 | | | | 1,040 | | | | 300 | |
| Call - Melco Resorts & Entertainment Ltd. | | | CCP | | | 30.00 | | 2/16/2018 | | USD | | 24 | | | 2,400 | | | | 1,825 | | | | 2,280 | | | | 455 | |
| Call - Viacom, Inc. | | | CCP | | | 40.00 | | 2/16/2018 | | USD | | 16 | | | 1,600 | | | | 878 | | | | 320 | | | | (558 | ) |
| Put - Hennes & Mauritz AB | | | MSC | | | 140.00 | | 2/16/2018 | | SEK | | 26 | | | 2,600 | | | | 378 | | | | 1,501 | | | | 1,123 | |
| Put - Fortinet, Inc. | | | CCP | | | 42.00 | | 2/16/2018 | | USD | | 7 | | | 700 | | | | 672 | | | | 350 | | | | (322 | ) |
| Put - Tractor Supply Co. | | | CCP | | | 74.00 | | 2/16/2018 | | USD | | 4 | | | 400 | | | | 512 | | | | 700 | | | | 188 | |
| Call - Procter & Gamble Co. | | | CCP | | | 95.00 | | 3/16/2018 | | USD | | 30 | | | 3,000 | | | | 1,592 | | | | 210 | | | | (1,382 | ) |
| Call - CBS Corp. | | | CCP | | | 65.00 | | 3/16/2018 | | USD | | 9 | | | 900 | | | | 674 | | | | 477 | | | | (197 | ) |
| Call - Procter & Gamble Co. | | | CCP | | | 92.50 | | 3/16/2018 | | USD | | 1 | | | 100 | | | | 134 | | | | 16 | | | | (118 | ) |
| Put - Hennes & Mauritz AB | | | MSC | | | 180.00 | | 3/16/2018 | | SEK | | 8 | | | 800 | | | | 343 | | | | 4,061 | | | | 3,718 | |
| Put - Tesla, Inc. | | | CCP | | | 280.00 | | 3/16/2018 | | USD | | 1 | | | 100 | | | | 448 | | | | 256 | | | | (192 | ) |
| Put - Tesla, Inc. | | | CCP | | | 300.00 | | 3/16/2018 | | USD | | 1 | | | 100 | | | | 448 | | | | 470 | | | | 22 | |
| Put - Costco Wholesale Corp. | | | CCP | | | 175.00 | | 3/16/2018 | | USD | | 4 | | | 400 | | | | 376 | | | | 380 | | | | 4 | |
| Put - Facebook, Inc. | | | CCP | | | 170.00 | | 3/16/2018 | | USD | | 2 | | | 200 | | | | 416 | | | | 444 | | | | 28 | |
| Put - Apple, Inc. | | | CCP | | | 155.00 | | 3/16/2018 | | USD | | 2 | | | 200 | | | | 295 | | | | 490 | | | | 195 | |
| Put - Costco Wholesale Corp. | | | CCP | | | 165.00 | | 7/20/2018 | | USD | | 3 | | | 300 | | | | 613 | | | | 603 | | | | (10 | ) |
| Call - Koninklijke Ahold N.V. | | | MSC | | | 22.00 | | 12/21/2018 | | EUR | | 4 | | | 400 | | | | 848 | | | | 93 | | | | (755 | ) |
| Call - Koninklijke Ahold N.V. | | | MSC | | | 22.03 | | 12/21/2018 | | EUR | | 2 | | | 200 | | | | 169 | | | | 45 | | | | (124 | ) |
| | | | | | | | | | | | | | | | | | | | | | | | | | | | |
| | | $ | 16,856 | | | $ | 18,115 | | | $ | 1,259 | |
| | | | | | | | | | | | | | | | | | | | | | | | | | | | |
See accompanying notes
27
American Beacon Grosvenor Long/Short FundSM
Schedule of Investments
January 31, 2018
| | | | | | | | | | | | | | | | | | | | | | | | | | | | | | |
| Exchange-Traded Fund Options | | | | | | | | | | | | | | | | | | | | |
| Description | | Counter-
party | | Exercise
Price | | Expiration
Date | | Currency | | | Number of
Contracts | | | Notional
Amount | | | Premiums
Paid | | | Fair Value | | | Unrealized
Appreciation
(Depreciation) | |
| Put - PowerShares QQQ Trust Series 1 | | CCP | | 160.00 | | 2/16/2018 | | | USD | | | | 13 | | | | 1,300 | | | $ | 1,333 | | | $ | 650 | | | $ | (683 | ) |
| Put - PowerShares QQQ Trust Series 1 | | CCP | | 165.00 | | 2/16/2018 | | | USD | | | | 6 | | | | 600 | | | | 699 | | | | 702 | | | | 3 | |
| Put - Financial Select Sector SPDR Fund | | CCP | | 25.00 | | 3/16/2018 | | | USD | | | | 204 | | | | 20,400 | | | | 4,780 | | | | 816 | | | | (3,964 | ) |
| Put - VanEck Vectors Semiconductor ETF | | CCP | | 97.00 | | 3/16/2018 | | | USD | | | | 4 | | | | 400 | | | | 351 | | | | 416 | | | | 65 | |
| Put - iShares Core S&P Small-Cap ETF | | CCP | | 58.00 | | 5/18/2018 | | | USD | | | | 20 | | | | 2,000 | | | | 1,195 | | | | 550 | | | | (645 | ) |
| | | | | | | | | | | | | | | | | | | | | | | | | | | | | | |
| | | $ | 8,358 | | | $ | 3,134 | | | $ | (5,224 | ) |
| | | | | | | | | | | | | | | | | | | | | | | | | | | | | | |
| | | | | | | | | | | | | | | | | | | | | | | | | | |
| Forward Foreign Currency Contracts Open on January 31, 2018: | | | | | | | | | |
| Currency Purchased* | | Currency Sold* | | Settlement
Date | | | Counterparty | | | Unrealized
Appreciation | | | Unrealized
(Depreciation) | | | Net Unrealized
Appreciation
(Depreciation) | |
| JPY | | 4,402 | | USD | | 4,265 | | | 2/28/2018 | | | | MSC | | | $ | 137 | | | $ | - | | | $ | 137 | |
| CAD | | 4,736 | | USD | | 4,728 | | | 2/28/2018 | | | | MSC | | | | 8 | | | | - | | | | 8 | |
| GBP | | 4,969 | | USD | | 4,967 | | | 2/28/2018 | | | | MSC | | | | 2 | | | | - | | | | 2 | |
| GBP | | 5,474 | | USD | | 5,482 | | | 2/28/2018 | | | | MSC | | | | - | | | | (8 | ) | | | (8 | ) |
| CAD | | 6,095 | | USD | | 6,041 | | | 2/28/2018 | | | | MSC | | | | 54 | | | | - | | | | 54 | |
| CAD | | 6,726 | | USD | | 6,516 | | | 2/28/2018 | | | | MSC | | | | 210 | | | | - | | | | 210 | |
| NOK | | 8,609 | | USD | | 7,948 | | | 2/28/2018 | | | | MSC | | | | 661 | | | | - | | | | 661 | |
| SEK | | 33,431 | | USD | | 31,617 | | | 2/28/2018 | | | | MSC | | | | 1,814 | | | | - | | | | 1,814 | |
| USD | | 360,282 | | CAD | | 375,946 | | | 2/28/2018 | | | | MSC | | | | - | | | | (15,664 | ) | | | (15,664 | ) |
| USD | | 84,186 | | EUR | | 87,583 | | | 2/28/2018 | | | | MSC | | | | - | | | | (3,397 | ) | | | (3,397 | ) |
| USD | | 24,590 | | GBP | | 25,970 | | | 2/28/2018 | | | | MSC | | | | - | | | | (1,380 | ) | | | (1,380 | ) |
| USD | | 19,524 | | JPY | | 20,207 | | | 2/28/2018 | | | | MSC | | | | - | | | | (683 | ) | | | (683 | ) |
| USD | | 18,305 | | CHF | | 19,284 | | | 2/28/2018 | | | | MSC | | | | - | | | | (979 | ) | | | (979 | ) |
| USD | | 10,058 | | CAD | | 10,232 | | | 2/28/2018 | | | | MSC | | | | - | | | | (174 | ) | | | (174 | ) |
| USD | | 9,882 | | CAD | | 10,029 | | | 2/28/2018 | | | | MSC | | | | - | | | | (147 | ) | | | (147 | ) |
| USD | | 5,986 | | CAD | | 6,089 | | | 2/28/2018 | | | | MSC | | | | - | | | | (103 | ) | | | (103 | ) |
| USD | | 5,770 | | EUR | | 5,933 | | | 2/28/2018 | | | | MSC | | | | - | | | | (163 | ) | | | (163 | ) |
| USD | | 5,543 | | EUR | | 5,769 | | | 2/28/2018 | | | | MSC | | | | - | | | | (226 | ) | | | (226 | ) |
| USD | | 5,306 | | CAD | | 5,456 | | | 2/28/2018 | | | | MSC | | | | - | | | | (150 | ) | | | (150 | ) |
| USD | | 5,182 | | CAD | | 5,285 | | | 2/28/2018 | | | | MSC | | | | - | | | | (103 | ) | | | (103 | ) |
| USD | | 5,062 | | EUR | | 5,269 | | | 2/28/2018 | | | | MSC | | | | - | | | | (207 | ) | | | (207 | ) |
| USD | | 5,069 | | GBP | | 5,260 | | | 2/28/2018 | | | | MSC | | | | - | | | | (191 | ) | | | (191 | ) |
| USD | | 4,997 | | CAD | | 5,093 | | | 2/28/2018 | | | | MSC | | | | - | | | | (96 | ) | | | (96 | ) |
| USD | | 4,576 | | GBP | | 4,844 | | | 2/28/2018 | | | | MSC | | | | - | | | | (268 | ) | | | (268 | ) |
| USD | | 4,668 | | CAD | | 4,744 | | | 2/28/2018 | | | | MSC | | | | - | | | | (76 | ) | | | (76 | ) |
| USD | | 4,527 | | JPY | | 4,614 | | | 2/28/2018 | | | | MSC | | | | - | | | | (87 | ) | | | (87 | ) |
| USD | | 4,564 | | CAD | | 4,580 | | | 2/28/2018 | | | | MSC | | | | - | | | | (16 | ) | | | (16 | ) |
| USD | | 4,334 | | GBP | | 4,528 | | | 2/28/2018 | | | | MSC | | | | - | | | | (194 | ) | | | (194 | ) |
| SEK | | 18,017 | | USD | | 17,659 | | | 4/18/2018 | | | | MSC | | | | 358 | | | | - | | | | 358 | |
| DKK | | 21,157 | | USD | | 20,804 | | | 4/18/2018 | | | | MSC | | | | 353 | | | | - | | | | 353 | |
| EUR | | 26,243 | | USD | | 26,218 | | | 4/18/2018 | | | | MSC | | | | 25 | | | | - | | | | 25 | |
| EUR | | 47,151 | | USD | | 47,121 | | | 4/18/2018 | | | | MSC | | | | 30 | | | | - | | | | 30 | |
| USD | | 305,168 | | EUR | | 310,063 | | | 4/18/2018 | | | | MSC | | | | - | | | | (4,895 | ) | | | (4,895 | ) |
| USD | | 139,809 | | JPY | | 142,334 | | | 4/18/2018 | | | | MSC | | | | - | | | | (2,525 | ) | | | (2,525 | ) |
| USD | | 59,757 | | GBP | | 61,312 | | | 4/18/2018 | | | | MSC | | | | - | | | | (1,555 | ) | | | (1,555 | ) |
| USD | | 7,757 | | CAD | | 8,132 | | | 6/1/2018 | | | | MSC | | | | - | | | | (375 | ) | | | (375 | ) |
| EUR | | 9,716 | | USD | | 9,706 | | | 6/4/2018 | | | | MSC | | | | 10 | | | | - | | | | 10 | |
| GBP | | 59,898 | | USD | | 56,956 | | | 6/4/2018 | | | | MSC | | | | 2,942 | | | | - | | | | 2,942 | |
| USD | | 75,558 | | GBP | | 79,753 | | | 6/4/2018 | | | | MSC | | | | - | | | | (4,195 | ) | | | (4,195 | ) |
| USD | | 30,588 | | GBP | | 32,215 | | | 6/4/2018 | | | | MSC | | | | - | | | | (1,627 | ) | | | (1,627 | ) |
| USD | | 18,425 | | GBP | | 18,891 | | | 6/4/2018 | | | | MSC | | | | - | | | | (466 | ) | | | (466 | ) |
| USD | | 17,231 | | GBP | | 17,293 | | | 6/4/2018 | | | | MSC | | | | - | | | | (62 | ) | | | (62 | ) |
See accompanying notes
28
American Beacon Grosvenor Long/Short FundSM
Schedule of Investments
January 31, 2018
| | | | | | | | | | | | | | | | | | | | | | | | | | |
| Currency Purchased* | | Currency Sold* | | Settlement
Date | | | Counterparty | | | Unrealized
Appreciation | | | Unrealized
(Depreciation) | | | Net Unrealized
Appreciation
(Depreciation) | |
| USD | | 14,627 | | EUR | | 15,226 | | | 6/4/2018 | | | | MSC | | | $ | - | | | $ | (599 | ) | | $ | (599 | ) |
| USD | | 4,110 | | EUR | | 4,177 | | | 6/4/2018 | | | | MSC | | | | - | | | | (67 | ) | | | (67 | ) |
| USD | | 3,173 | | EUR | | 3,281 | | | 6/4/2018 | | | | MSC | | | | - | | | | (108 | ) | | | (108 | ) |
| USD | | 2,186 | | EUR | | 2,296 | | | 6/4/2018 | | | | MSC | | | | - | | | | (110 | ) | | | (110 | ) |
| | | | | | | | | | | | | | | | | | | | | | | | | | |
| | | $ | 6,604 | | | $ | (40,896 | ) | | $ | (34,292 | ) |
| | | | | | | | | | | | | | | | | | | | | | | | | | |
| * | All values denominated in USD. |
| | |
| Glossary: |
| | |
| Counterparty Abbreviations: |
| MSC | | Morgan Stanley & Co. Inc. |
|
| Currency Abbreviations: |
| BRL | | Brazilian Real |
| CAD | | Canadian Dollar |
| CHF | | Swiss Franc |
| DKK | | Danish Krone |
| EUR | | Euro |
| GBP | | Pound Sterling |
| HKD | | Hong Kong Dollar |
| IDR | | Indonesian Rupiah |
| JPY | | Japanese Yen |
| NOK | | Norwegian Krone |
| SEK | | Swedish Krona |
| TWD | | Taiwan Dollar |
| USD | | United States Dollar |
|
| Other Abbreviations: |
| CCP | | Central Counterparty Clearing House |
| EONIA | | Euro Overnight Index Average |
| ETF | | Exchange-Traded Fund |
| EURIBOR | | Euro Interbank Offered Rate. |
| FEDEF | | Effective Federal Funds Rate |
| HONIA | | Hong Kong Dollar Overnight Index Average |
| LIBOR | | London Interbank Offered Rate |
| LP | | Limited Partnership |
| NASDAQ | | National Association of Securities Dealers Automated Quotations |
| PLC | | Public Limited Company |
| S&P 500 | | Standard & Poor’s U.S. Equity Large-cap Index |
| SONIA | | Sterling Overnight Index Average |
| SOR | | Swap Offer Rate |
| SPDR | | Standard & Poor’s Depositary Receipt |
See accompanying notes
29
American Beacon Grosvenor Long/Short FundSM
Schedule of Investments
January 31, 2018
The Fund’s investments are summarized by level based on the inputs used to determine their values. As of January 31, 2018, the investments were classified as described below:
| | | | | | | | | | | | | | | | | | | | | | | | | | | | |
Grosvenor Long/Short Fund | | Level 1 | | | | | | Level 2 | | | | | | Level 3 | | | | | | Total | |
Assets | | | | | | | | | | | | | | | | | | | | | | | | | | | | |
Common Stocks | | $ | 15,799,246 | | | | | | | $ | - | | | | | | | $ | - | | | | | | | $ | 15,799,246 | |
Rights | | | - | | | | | | | | - | | | | | | | | - | (1) | | | | | | | - | |
Investment Companies | | | 206,889 | | | | | | | | - | | | | | | | | - | | | | | | | | 206,889 | |
Exchange-Traded Instruments | | | 59,637 | | | | | | | | - | | | | | | | | - | | | | | | | | 59,637 | |
Short-Term Investments | | | 3,966,444 | | | | | | | | - | | | | | | | | - | | | | | | | | 3,966,444 | |
| | | | | | | | | | | | | | | | | | | | | | | | | | | | |
Total Investments in Securities - Assets | | $ | 20,032,216 | | | | | | | $ | - | | | | | | | $ | - | | | | | | | $ | 20,032,216 | |
| | | | | | | | | | | | | | | | | | | | | | | | | | | | |
|
Liabilities | |
Common Stocks (Sold Short) | | $ | (2,971,122 | ) | | | | | | $ | - | | | | | | | $ | - | | | | | | | $ | (2,971,122 | ) |
Exchange-Traded Instruments (Sold Short) | | | (1,782,454 | ) | | | | | | | - | | | | | | | | - | | | | | | | | (1,782,454 | ) |
| | | | | | | | | | | | | | | | | | | | | | | | | | | | |
Total Investments in Securities - Liabilities | | | (4,753,576 | ) | | | | | | | - | | | | | | | | - | | | | | | | | (4,753,576 | ) |
| | | | | | | | | | | | | | | | | | | | | | | | | | | | |
Total Investments in Securities | | $ | 15,278,640 | | | | | | | $ | - | | | | | | | $ | - | | | | | | | $ | 15,278,640 | |
| | | | | | | | | | | | | | | | | | | | | | | | | | | | |
|
Financial Derivative Instruments - Assets | |
OTC Swap Agreement Contracts for Difference - Equity | | $ | - | | | | | | | $ | 9,686 | | | | | | | $ | - | | | | | | | $ | 9,686 | |
Swap Contract Agreements | | | - | | | | | | | | 634,573 | | | | | | | | - | | | | | | | | 634,573 | |
Purchased Options | | | 21,249 | | | | | | | | - | | | | | | | | - | | | | | | | | 21,249 | |
Forward Foreign Currency Contracts | | | - | | | | | | | | 6,604 | | | | | | | | - | | | | | | | | 6,604 | |
| | | | | | | | | | | | | | | | | | | | | | | | | | | | |
Total Financial Derivative Instruments - Assets | | $ | 21,249 | | | | | | | $ | 650,863 | | | | | | | $ | - | | | | | | | $ | 672,112 | |
| | | | | | | | | | | | | | | | | | | | | | | | | | | | |
|
Financial Derivative Instruments - Liabilities | |
OTC Swap Agreement Contracts for Difference - Equity | | $ | - | | | | | | | $ | (6,215 | ) | | | | | | $ | - | | | | | | | $ | (6,215 | ) |
Swap Contract Agreements | | | - | | | | | | | | (50,772 | ) | | | | | | | - | | | | | | | | (50,772 | ) |
Forward Foreign Currency Contracts | | | - | | | | | | | | (40,896 | ) | | | | | | | - | | | | | | | | (40,896 | ) |
| | | | | | | | | | | | | | | | | | | | | | | | | | | | |
Total Financial Derivative Instruments - Liabilities | | $ | - | | | | | | | $ | (97,883 | ) | | | | | | $ | - | | | | | | | $ | (97,883 | ) |
| | | | | | | | | | | | | | | | | | | | | | | | | | | | |
| (1) | Investment held in the Fund’s portfolio with $0 fair value. |
U.S. GAAP requires all transfers between any levels to be disclosed. The end of period timing recognition has been adopted for the transfers between levels of the Fund’s assets and liabilities. As of January 31, 2018, there were no transfers between levels.
The following table is a reconciliation of Level 3 assets within the Fund for which significant unobservable inputs were used to determine fair value. Transfers in or out of Level 3 represent the ending value of any security or instrument where a change in the level has occurred from the beginning to the end of the period:
| | | | | | | | | | | | | | | | | | | | | | | | | | | | | | | | | | | | | | | | |
| Security Type | | Balance as
of
1/31/2017 | | | Net
Purchases | | | Net
Sales | | | Accrued
Discounts
(Premiums) | | | Realized
Gain (Loss) | | | Change in
Unrealized
Appreciation
(Depreciation) | | | Transfer
into
Level 3 | | | Transfer
out of
Level 3 | | | Balance as
of
1/31/2018 | | | Change in
Unrealized
Appreciation
(Depreciation)
at Period end** | |
| Rights | | $ | - | | | $ | - | (1) | | $ | - | | | $ | - | | | $ | - | | | $ | - | | | $ | - | | | $ | - | | | $ | - | (1) | | $ | - | |
| ** | Change in unrealized appreciation (depreciation) attributable to Level 3 securities held at period end. This balance is included in the change in unrealized appreciation (depreciation) on the Statements of Operations. |
| (1) | Investment held in the Fund’s portfolio with $0 fair value. |
The rights classified as Level 3 were fair valued using private valuation reports provided to the Fund’s Sub-Advisor from a pricing vendor.
See accompanying notes
30
American Beacon Numeric Integrated Alpha FundSM
Schedule of Investments
January 31, 2018
| | | | | | | | | | | | | | | |
| | | Shares | | | | Fair Value |
| | | | | | | | | | | | | | | |
| SECURITIES HELD LONG | | | | | | | | | | | | | | | |
| COMMON STOCKS - 53.83% | | | | | | | | | | | | | | | |
| Consumer Discretionary - 9.10% | | | | | | | | | | | | | | | |
| Diversified Consumer Services - 0.12% | | | | | | | | | | | | | | | |
| K12, Inc.A | | | | 12,000 | | | | | | | | | $ | 208,200 | |
| | | | | | | | | | | | | | | |
| | | | | | | | | | | | | | | |
| Hotels, Restaurants & Leisure - 3.29% | | | | | | | | | | | | | | | |
| BBX Capital Corp. | | | | 24,300 | | | | | | | | | | 221,373 | |
| Bojangles’, Inc.A | | | | 3,500 | | | | | | | | | | 42,875 | |
| Carrols Restaurant Group, Inc. | | | | 86,200 | | | | | | | | | | 1,073,190 | |
| Chipotle Mexican Grill, Inc.A | | | | 580 | | | | | | | | | | 188,361 | |
| Dave & Buster’s Entertainment, Inc.A | | | | 4,300 | | | | | | | | | | 202,100 | |
| Del Frisco’s Restaurant Group, Inc.A | | | | 5,700 | | | | | | | | | | 99,750 | |
| Del Taco Restaurants, Inc.A | | | | 40,700 | | | | | | | | | | 515,669 | |
| Domino’s Pizza, Inc. | | | | 10,600 | | | | | | | | | | 2,298,610 | |
| International Game Technology PLC | | | | 16,800 | | | | | | | | | | 488,376 | |
| McDonald’s Corp. | | | | 600 | | | | | | | | | | 102,684 | |
| Papa John’s International, Inc. | | | | 1,300 | | | | | | | | | | 84,357 | |
| Texas Roadhouse, Inc. | | | | 8,300 | | | | | | | | | | 487,376 | |
| | | | | | | | | | | | | | | |
| | | | | | | | | | | | | | 5,804,721 | |
| | | | | | | | | | | | | | | |
| | | | | | | | | | | | | | | |
| Household Durables - 0.60% | | | | | | | | | | | | | | | |
| Taylor Morrison Home Corp., Class AA | | | | 41,900 | | | | | | | | | | 1,065,517 | |
| | | | | | | | | | | | | | | |
| | | | | | | | | | | | | | | |
| Internet & Direct Marketing Retail - 0.10% | | | | | | | | | | | | | | | |
| Shutterfly, Inc.A | | | | 2,600 | | | | | | | | | | 177,190 | |
| | | | | | | | | | | | | | | |
| | | | | | | | | | | | | | | |
| Leisure Products - 0.15% | | | | | | | | | | | | | | | |
| MCBC Holdings, Inc.A | | | | 4,500 | | | | | | | | | | 108,765 | |
| Vista Outdoor, Inc.A | | | | 10,500 | | | | | | | | | | 159,075 | |
| | | | | | | | | | | | | | | |
| | | | | | | | | | | | | | 267,840 | |
| | | | | | | | | | | | | | | |
| | | | | | | | | | | | | | | |
| Multiline Retail - 0.31% | | | | | | | | | | | | | | | |
| JC Penney Co., Inc. | | | | 148,300 | | | | | | | | | | 550,193 | |
| | | | | | | | | | | | | | | |
| | | | | | | | | | | | | | | |
| Specialty Retail - 4.23% | | | | | | | | | | | | | | | |
| Advance Auto Parts, Inc. | | | | 1,700 | | | | | | | | | | 198,883 | |
| Bed Bath & Beyond, Inc. | | | | 11,800 | | | | | | | | | | 272,344 | |
| Dick’s Sporting Goods, Inc. | | | | 200 | | | | | | | | | | 6,292 | |
| Finish Line, Inc., Class A | | | | 31,500 | | | | | | | | | | 356,895 | |
| Floor & Decor Holdings, Inc., Class AA | | | | 25,700 | | | | | | | | | | 1,205,330 | |
| Foot Locker, Inc. | | | | 1,200 | | | | | | | | | | 58,980 | |
| GameStop Corp., Class A | | | | 121,000 | | | | | | | | | | 2,034,010 | |
| Hibbett Sports, Inc.A | | | | 1,500 | | | | | | | | | | 33,900 | |
| National Vision Holdings, Inc. | | | | 700 | | | | | | | | | | 27,384 | |
| Tractor Supply Co. | | | | 12,400 | | | | | | | | | | 945,500 | |
| Ulta Salon Cosmetics & Fragrance, Inc.A | | | | 8,200 | | | | | | | | | | 1,821,220 | |
| Zumiez, Inc.A | | | | 24,900 | | | | | | | | | | 516,675 | |
| | | | | | | | | | | | | | | |
| | | | | | | | | | | | | | 7,477,413 | |
| | | | | | | | | | | | | | | |
| | | | | | | | | | | | | | | |
| Textiles, Apparel & Luxury Goods - 0.30% | | | | | | | | | | | | | | | |
| Lakeland Industries, Inc.A | | | | 33,500 | | | | | | | | | | 472,350 | |
| Lululemon Athletica, Inc.A | | | | 800 | | | | | | | | | | 62,568 | |
| | | | | | | | | | | | | | | |
| | | | | | | | | | | | | | 534,918 | |
| | | | | | | | | | | | | | | |
| | | | | | | | | | | | | | | |
Total Consumer Discretionary | | | | | | | | | | | | | | 16,085,992 | |
| | | | | | | | | | | | | | | |
| | | | | | | | | | | | | | | |
| Consumer Staples - 2.50% | | | | | | | | | | | | | | | |
| Beverages - 0.06% | | | | | | | | | | | | | | | |
| Coca-Cola Bottling Co. Consolidated | | | | 500 | | | | | | | | | | 101,260 | |
| | | | | | | | | | | | | | | |
See accompanying notes
31
American Beacon Numeric Integrated Alpha FundSM
Schedule of Investments
January 31, 2018
| | | | | | | | | | | | | | | |
| | | Shares | | | | Fair Value |
| | | | | | | | | | | | | | | |
| COMMON STOCKS - 53.83% (continued) | | | | | | | | | | | | | | | |
| Consumer Staples - 2.50% (continued) | | | | | | | | | | | | | | | |
| Food & Staples Retailing - 1.17% | | | | | | | | | | | | | | | |
| Costco Wholesale Corp. | | | | 4,400 | | | | | | | | | $ | 857,428 | |
| Kroger Co. | | | | 18,600 | | | | | | | | | | 564,696 | |
| Performance Food Group Co. | | | | 3,200 | | | | | | | | | | 109,920 | |
| US Foods Holding Corp. | | | | 3,000 | | | | | | | | | | 97,205 | |
| Walgreens Boots Alliance, Inc. | | | | 5,900 | | | | | | | | | | 444,034 | |
| | | | | | | | | | | | | | | |
| | | | | | | | | | | | | | 2,073,283 | |
| | | | | | | | | | | | | | | |
| | | | | | | | | | | | | | | |
| Food Products - 1.01% | | | | | | | | | | | | | | | |
| Dean Foods Co. | | | | 35,600 | | | | | | | | | | 369,172 | |
| Fresh Del Monte Produce, Inc. | | | | 11,400 | | | | | | | | | | 539,334 | |
| Sanderson Farms, Inc. | | | | 2,300 | | | | | | | | | | 291,870 | |
| TreeHouse Foods, Inc.A | | | | 12,500 | | | | | | | | | | 589,500 | |
| | | | | | | | | | | | | | | |
| | | | | | | | | | | | | | 1,789,876 | |
| | | | | | | | | | | | | | | |
| | | | | | | | | | | | | | | |
| Personal Products - 0.09% | | | | | | | | | | | | | | | |
| Nu Skin Enterprises, Inc., Class A | | | | 200 | | | | | | | | | | 14,368 | |
| USANA Health Sciences, Inc.A | | | | 2,000 | | | | | | | | | | 149,300 | |
| | | | | | | | | | | | | | | |
| | | | | | | | | | | | | | 163,668 | |
| | | | | | | | | | | | | | | |
| | | | | | | | | | | | | | | |
| Tobacco - 0.17% | | | | | | | | | | | | | | | |
| Universal Corp. | | | | 6,200 | | | | | | | | | | 297,600 | |
| | | | | | | | | | | | | | | |
| | | | | | | | | | | | | | | |
Total Consumer Staples | | | | | | | | | | | | | | 4,425,687 | |
| | | | | | | | | | | | | | | |
| | | | | | | | | | | | | | | |
| Energy - 3.92% | | | | | | | | | | | | | | | |
| Energy Equipment & Services - 2.95% | | | | | | | | | | | | | | | |
| Archrock, Inc. | | | | 137,100 | | | | | | | | | | 1,275,030 | |
| Rowan Cos PLC, Class AA | | | | 131,100 | | | | | | | | | | 1,929,792 | |
| Transocean Ltd.A | | | | 185,200 | | | | | | | | | | 1,998,308 | |
| | | | | | | | | | | | | | | |
| | | | | | | | | | | | | | 5,203,130 | |
| | | | | | | | | | | | | | | |
| | | | | | | | | | | | | | | |
| Oil, Gas & Consumable Fuels - 0.97% | | | | | | | | | | | | | | | |
| Oasis Petroleum, Inc. | | | | 22,200 | | | | | | | | | | 192,252 | |
| SilverBow Resources, Inc. | | | | 500 | | | | | | | | | | 15,411 | |
| Whiting Petroleum Corp. | | | | 54,104 | | | | | | | | | | 1,510,584 | |
| | | | | | | | | | | | | | | |
| | | | | | | | | | | | | | 1,718,247 | |
| | | | | | | | | | | | | | | |
| | | | | | | | | | | | | | | |
Total Energy | | | | | | | | | | | | | | 6,921,377 | |
| | | | | | | | | | | | | | | |
| | | | | | | | | | | | | | | |
| Financials - 5.01% | | | | | | | | | | | | | | | |
| Banks - 0.01% | | | | | | | | | | | | | | | |
| Independent Bank Corp. | | | | 900 | | | | | | | | | | 20,745 | |
| | | | | | | | | | | | | | | |
| | | | | | | | | | | | | | | |
| Capital Markets - 1.95% | | | | | | | | | | | | | | | |
| Ameriprise Financial, Inc. | | | | 12,600 | | | | | | | | | | 2,125,620 | |
| Morgan Stanley | | | | 20,700 | | | | | | | | | | 1,170,585 | |
| Raymond James Financial, Inc. | | | | 1,600 | | | | | | | | | | 154,224 | |
| | | | | | | | | | | | | | | |
| | | | | | | | | | | | | | 3,450,429 | |
| | | | | | | | | | | | | | | |
| | | | | | | | | | | | | | | |
| Consumer Finance - 1.22% | | | | | | | | | | | | | | | |
| Navient Corp. | | | | 132,800 | | | | | | | | | | 1,892,400 | |
| Santander Consumer USA Holdings, Inc.A | | | | 14,800 | | | | | | | | | | 255,300 | |
| | | | | | | | | | | | | | | |
| | | | | | | | | | | | | | 2,147,700 | |
| | | | | | | | | | | | | | | |
| | | | | | | | | | | | | | | |
| Insurance - 1.83% | | | | | | | | | | | | | | | |
| Assured Guaranty Ltd. | | | | 33,100 | | | | | | | | | | 1,178,029 | |
| CNO Financial Group, Inc. | | | | 6,600 | | | | | | | | | | 162,294 | |
See accompanying notes
32
American Beacon Numeric Integrated Alpha FundSM
Schedule of Investments
January 31, 2018
| | | | | | | | | | | | | | | |
| | | Shares | | | | Fair Value |
| | | | | | | | | | | | | | | |
| COMMON STOCKS - 53.83% (continued) | | | | | | | | | | | | | | | |
| Financials - 5.01% (continued) | | | | | | | | | | | | | | | |
| Insurance - 1.83% (continued) | | | | | | | | | | | | | | | |
| Third Point Reinsurance Ltd.A | | | | 132,500 | | | | | | | | | $ | 1,888,125 | |
| | | | | | | | | | | | | | | |
| | | | | | | | | | | | | | 3,228,448 | |
| | | | | | | | | | | | | | | |
| | | | | | | | | | | | | | | |
Total Financials | | | | | | | | | | | | | | 8,847,322 | |
| | | | | | | | | | | | | | | |
| | | | | | | | | | | | | | | |
| Health Care - 3.61% | | | | | | | | | | | | | | | |
| Biotechnology - 0.63% | | | | | | | | | | | | | | | |
| Achillion Pharmaceuticals, Inc.A | | | | 91,500 | | | | | | | | | | 242,475 | |
| Applied Genetic Technologies Corp.A | | | | 57,900 | | | | | | | | | | 286,605 | |
| Celgene Corp.A | | | | 3,200 | | | | | | | | | | 323,712 | |
| CytomX Therapeutics, Inc.A | | | | 5,400 | | | | | | | | | | 144,450 | |
| Exelixis, Inc.A | | | | 2,300 | | | | | | | | | | 69,713 | |
| United Therapeutics Corp.A | | | | 400 | | | | | | | | | | 51,600 | |
| | | | | | | | | | | | | | | |
| | | | | | | | | | | | | | 1,118,555 | |
| | | | | | | | | | | | | | | |
| | | | | | | | | | | | | | | |
| Health Care Equipment & Supplies - 2.01% | | | | | | | | | | | | | | | |
| Boston Scientific Corp. | | | | 30,400 | | | | | | | | | | 849,984 | |
| FONAR Corp.A | | | | 3,896 | | | | | | | | | | 95,647 | |
| Hill-Rom Holdings, Inc. | | | | 5,100 | | | | | | | | | | 435,183 | |
| Hologic, Inc.A | | | | 9,900 | | | | | | | | | | 422,730 | |
| Masimo Corp.A | | | | 5,300 | | | | | | | | | | 499,472 | |
| NuVasive, Inc. | | | | 9,000 | | | | | | | | | | 439,830 | |
| Zimmer Biomet Holdings, Inc. | | | | 6,400 | | | | | | | | | | 813,568 | |
| | | | | | | | | | | | | | | |
| | | | | | | | | | | | | | 3,556,414 | |
| | | | | | | | | | | | | | | |
| | | | | | | | | | | | | | | |
| Health Care Providers & Services - 0.67% | | | | | | | | | | | | | | | |
| DaVita, Inc.A | | | | 9,900 | | | | | | | | | | 772,596 | |
| Owens & Minor, Inc. | | | | 15,700 | | | | | | | | | | 330,642 | |
| Premier, Inc., Class A | | | | 2,200 | | | | | | | | | | 71,390 | |
| | | | | | | | | | | | | | | |
| | | | | | | | | | | | | | 1,174,628 | |
| | | | | | | | | | | | | | | |
| | | | | | | | | | | | | | | |
| Health Care Technology - 0.04% | | | | | | | | | | | | | | | |
| athenahealth, Inc.A | | | | 600 | | | | | | | | | | 75,186 | |
| | | | | | | | | | | | | | | |
| | | | | | | | | | | | | | | |
| Life Sciences Tools & Services - 0.08% | | | | | | | | | | | | | | | |
| Charles River Laboratories International, Inc.A | | | | 1,300 | | | | | | | | | | 137,072 | |
| | | | | | | | | | | | | | | |
| | | | | | | | | | | | | | | |
| Pharmaceuticals - 0.18% | | | | | | | | | | | | | | | |
| Depomed, Inc.A | | | | 2,500 | | | | | | | | | | 18,375 | |
| Intersect ENT, Inc. | | | | 1,400 | | | | | | | | | | 52,290 | |
| Tetraphase Pharmaceuticals, Inc.A | | | | 43,700 | | | | | | | | | | 255,208 | |
| | | | | | | | | | | | | | | |
| | | | | | | | | | | | | | 325,873 | |
| | | | | | | | | | | | | | | |
| | | | | | | | | | | | | | | |
Total Health Care | | | | | | | | | | | | | | 6,387,728 | |
| | | | | | | | | | | | | | | |
| | | | | | | | | | | | | | | |
| Industrials - 6.04% | | | | | | | | | | | | | | | |
| Aerospace & Defense - 0.20% | | | | | | | | | | | | | | | |
| Vectrus, Inc.A | | | | 11,600 | | | | | | | | | | 352,640 | |
| | | | | | | | | | | | | | | |
| | | | | | | | | | | | | | | |
| Building Products - 0.10% | | | | | | | | | | | | | | | |
| Builders FirstSource, Inc.A | | | | 8,500 | | | | | | | | | | 182,070 | |
| | | | | | | | | | | | | | | |
| | | | | | | | | | | | | | | |
| Commercial Services & Supplies - 0.10% | | | | | | | | | | | | | | | |
| Pitney Bowes, Inc. | | | | 12,400 | | | | | | | | | | 174,964 | |
| | | | | | | | | | | | | | | |
| | | | | | | | | | | | | | | |
| Construction & Engineering - 0.09% | | | | | | | | | | | | | | | |
| Argan, Inc. | | | | 3,500 | | | | | | | | | | 152,600 | |
| | | | | | | | | | | | | | | |
See accompanying notes
33
American Beacon Numeric Integrated Alpha FundSM
Schedule of Investments
January 31, 2018
| | | | | | | | | | | | | | | |
| | | Shares | | | | Fair Value |
| | | | | | | | | | | | | | | |
| COMMON STOCKS - 53.83% (continued) | | | | | | | | | | | | | | | |
| Industrials - 6.04% (continued) | | | | | | | | | | | | | | | |
| Electrical Equipment - 0.02% | | | | | | | | | | | | | | | |
| Encore Wire Corp. | | | | 600 | | | | | | | | | $ | 30,360 | |
| | | | | | | | | | | | | | | |
| | | | | | | | | | | | | | | |
| Machinery - 2.08% | | | | | | | | | | | | | | | |
| Allison Transmission Holdings, Inc. | | | | 31,300 | | | | | | | | | | 1,384,712 | |
| Crane Co. | | | | 6,600 | | | | | | | | | | 659,604 | |
| Hurco Cos, Inc. | | | | 6,400 | | | | | | | | | | 288,960 | |
| ITT, Inc. | | | | 14,300 | | | | | | | | | | 800,800 | |
| Nordson Corp. | | | | 3,800 | | | | | | | | | | 546,136 | |
| | | | | | | | | | | | | | | |
| | | | | | | | | | | | | | 3,680,212 | |
| | | | | | | | | | | | | | | |
| | | | | | | | | | | | | | | |
| Professional Services - 1.02% | | | | | | | | | | | | | | | |
| FTI Consulting, Inc.A | | | | 4,400 | | | | | | | | | | 191,268 | |
| Heidrick & Struggles International, Inc. | | | | 2,400 | | | | | | | | | | 63,360 | |
| ManpowerGroup, Inc. | | | | 3,700 | | | | | | | | | | 486,143 | |
| RPX Corp.A | | | | 75,300 | | | | | | | | | | 1,057,212 | |
| | | | | | | | | | | | | | | |
| | | | | | | | | | | | | | 1,797,983 | |
| | | | | | | | | | | | | | | |
| | | | | | | | | | | | | | | |
| Road & Rail - 0.81% | | | | | | | | | | | | | | | |
| ArcBest Corp. | | | | 29,500 | | | | | | | | | | 1,048,725 | |
| Marten Transport Ltd. | | | | 3,700 | | | | | | | | | | 85,840 | |
| Werner Enterprises, Inc. | | | | 7,400 | | | | | | | | | | 301,415 | |
| | | | | | | | | | | | | | | |
| | | | | | | | | | | | | | 1,435,980 | |
| | | | | | | | | | | | | | | |
| | | | | | | | | | | | | | | |
| Trading Companies & Distributors - 1.62% | | | | | | | | | | | | | | | |
| GMS, Inc. | | | | 10,395 | | | | | | | | | | 356,341 | |
| MSC Industrial Direct Co., Inc., Class A | | | | 6,200 | | | | | | | | | | 582,056 | |
| Rush Enterprises, Inc., Class AA | | | | 35,800 | | | | | | | | | | 1,934,990 | |
| | | | | | | | | | | | | | | |
| | | | | | | | | | | | | | 2,873,387 | |
| | | | | | | | | | | | | | | |
| | | | | | | | | | | | | | | |
Total Industrials | | | | | | | | | | | | | | 10,680,196 | |
| | | | | | | | | | | | | | | |
| | | | | | | | | | | | | | | |
| Information Technology - 6.18% | | | | | | | | | | | | | | | |
| Communications Equipment - 0.89% | | | | | | | | | | | | | | | |
| CommScope Holding Co., Inc.A | | | | 7,100 | | | | | | | | | | 274,273 | |
| F5 Networks, Inc.A | | | | 3,400 | | | | | | | | | | 491,436 | |
| Juniper Networks, Inc. | | | | 20,600 | | | | | | | | | | 538,690 | |
| NETGEAR, Inc.A | | | | 2,200 | | | | | | | | | | 153,340 | |
| Plantronics, Inc. | | | | 2,000 | | | | | | | | | | 117,980 | |
| | | | | | | | | | | | | | | |
| | | | | | | | | | | | | | 1,575,719 | |
| | | | | | | | | | | | | | | |
| | | | | | | | | | | | | | | |
| Electronic Equipment, Instruments & Components - 1.33% | | | | | | | | | | | | | | | |
| Avnet, Inc. | | | | 12,300 | | | | | | | | | | 522,750 | |
| Benchmark Electronics, Inc.A | | | | 2,800 | | | | | | | | | | 81,060 | |
| PCM, Inc.A | | | | 12,000 | | | | | | | | | | 106,200 | |
| Vishay Intertechnology, Inc. | | | | 75,100 | | | | | | | | | | 1,648,445 | |
| | | | | | | | | | | | | | | |
| | | | | | | | | | | | | | 2,358,455 | |
| | | | | | | | | | | | | | | |
| | | | | | | | | | | | | | | |
| Internet Software & Services - 0.68% | | | | | | | | | | | | | | | |
| Akamai Technologies, Inc.A | | | | 6,300 | | | | | | | | | | 422,037 | |
| Blucora, Inc.A | | | | 6,249 | | | | | | | | | | 152,476 | |
| NIC, Inc. | | | | 3,500 | | | | | | | | | | 58,100 | |
| SPS Commerce, Inc.A | | | | 1,500 | | | | | | | | | | 78,900 | |
| Web.com Group, Inc.A | | | | 21,000 | | | | | | | | | | 488,250 | |
| | | | | | | | | | | | | | | |
| | | | | | | | | | | | | | 1,199,763 | |
| | | | | | | | | | | | | | | |
| | | | | | | | | | | | | | | |
| IT Services - 1.02% | | | | | | | | | | | | | | | |
| Booz Allen Hamilton Holding Corp. | | | | 1,300 | | | | | | | | | | 50,934 | |
See accompanying notes
34
American Beacon Numeric Integrated Alpha FundSM
Schedule of Investments
January 31, 2018
| | | | | | | | | | | | | | | |
| | | Shares | | | | Fair Value |
| | | | | | | | | | | | | | | |
| COMMON STOCKS - 53.83% (continued) | | | | | | | | | | | | | | | |
| Information Technology - 6.18% | | | | | | | | | | | | | | | |
| IT Services - 1.02% (continued) | | | | | | | | | | | | | | | |
| Cardtronics PLC, Class AA | | | | 6,700 | | | | | | | | | $ | 163,882 | |
| CSRA, Inc. | | | | 5,700 | | | | | | | | | | 189,696 | |
| Euronet Worldwide, Inc. | | | | 6,000 | | | | | | | | | | 563,220 | |
| Hackett Group, Inc. | | | | 3,000 | | | | | | | | | | 48,030 | |
| Science Applications International Corp. | | | | 10,200 | | | | | | | | | | 781,830 | |
| | | | | | | | | | | | | | | |
| | | | | | | | | | | | | | 1,797,592 | |
| | | | | | | | | | | | | | | |
| | | | | | | | | | | | | | | |
| Semiconductors & Semiconductor Equipment - 0.35% | | | | | | | | | | | | | | | |
| Kulicke & Soffa Industries, Inc.A | | | | 7,900 | | | | | | | | | | 181,779 | |
| Micron Technology, Inc.A | | | | 2,900 | | | | | | | | | | 126,788 | |
| MKS Instruments, Inc. | | | | 2,500 | | | | | | | | | | 255,750 | |
| Photronics, Inc.A | | | | 7,100 | | | | | | | | | | 59,640 | |
| | | | | | | | | | | | | | | |
| | | | | | | | | | | | | | 623,957 | |
| | | | | | | | | | | | | | | |
| | | | | | | | | | | | | | | |
| Software - 1.41% | | | | | | | | | | | | | | | |
| CA, Inc. | | | | 12,000 | | | | | | | | | | 430,200 | |
| CommVault Systems, Inc.A | | | | 2,500 | | | | | | | | | | 133,375 | |
| Finjan Holdings, Inc.A | | | | 73,000 | | | | | | | | | | 141,620 | |
| MicroStrategy, Inc., Class AA | | | | 1,800 | | | | | | | | | | 247,914 | |
| Progress Software Corp. | | | | 29,400 | | | | | | | | | | 1,465,002 | |
| Verint Systems, Inc.A | | | | 1,600 | | | | | | | | | | 66,800 | |
| | | | | | | | | | | | | | | |
| | | | | | | | | | | | | | 2,484,911 | |
| | | | | | | | | | | | | | | |
| | | | | | | | | | | | | | | |
| Technology Hardware, Storage & Peripherals - 0.50% | | | | | | | | | | | | | | | |
| Seagate Technology PLC | | | | 2,400 | | | | | | | | | | 132,480 | |
| Super Micro Computer, Inc.A | | | | 10,700 | | | | | | | | | | 244,227 | |
| Western Digital Corp. | | | | 4,900 | | | | | | | | | | 436,002 | |
| Xerox Corp. | | | | 1,800 | | | | | | | | | | 61,434 | |
| | | | | | | | | | | | | | | |
| | | | | | | | | | | | | | 874,143 | |
| | | | | | | | | | | | | | | |
| | | | | | | | | | | | | | | |
Total Information Technology | | | | | | | | | | | | | | 10,914,540 | |
| | | | | | | | | | | | | | | |
| | | | | | | | | | | | | | | |
| Materials - 0.68% | | | | | | | | | | | | | | | |
| Chemicals - 0.54% | | | | | | | | | | | | | | | |
| Axalta Coating Systems Ltd.A | | | | 11,300 | | | | | | | | | | 355,950 | |
| Cabot Corp. | | | | 1,800 | | | | | | | | | | 121,752 | |
| Huntsman Corp. | | | | 12,200 | | | | | | | | | | 421,754 | |
| Venator Materials PLC | | | | 2,400 | | | | | | | | | | 54,288 | |
| | | | | | | | | | | | | | | |
| | | | | | | | | | | | | | 953,744 | |
| | | | | | | | | | | | | | | |
| | | | | | | | | | | | | | | |
| Containers & Packaging - 0.07% | | | | | | | | | | | | | | | |
| Greif, Inc., Class B | | | | 1,900 | | | | | | | | | | 120,935 | |
| | | | | | | | | | | | | | | |
| | | | | | | | | | | | | | | |
| Paper & Forest Products - 0.07% | | | | | | | | | | | | | | | |
| Verso Corp., Class A | | | | 7,600 | | | | | | | | | | 122,056 | |
| | | | | | | | | | | | | | | |
| | | | | | | | | | | | | | | |
Total Materials | | | | | | | | | | | | | | 1,196,735 | |
| | | | | | | | | | | | | | | |
| | | | | | | | | | | | | | | |
| Real Estate - 15.41% | | | | | | | | | | | | | | | |
| Equity Real Estate Investment Trusts (REITs) - 15.41% | | | | | | | | | | | | | | | |
| American Assets Trust, Inc. | | | | 12,600 | | | | | | | | | | 444,276 | |
| American Homes 4 Rent, Class A | | | | 55,500 | | | | | | | | | | 1,153,845 | |
| AvalonBay Communities, Inc. | | | | 1,600 | | | | | | | | | | 272,640 | |
| Brixmor Property Group, Inc. | | | | 40,600 | | | | | | | | | | 658,938 | |
| CareTrust REIT, Inc. | | | | 48,105 | | | | | | | | | | 764,388 | |
| CBL & Associates Properties, Inc. | | | | 126,500 | | | | | | | | | | 703,340 | |
| CoreSite Realty Corp. | | | | 19,200 | | | | | | | | | | 2,079,744 | |
| Corporate Office Properties Trust | | | | 14,100 | | | | | | | | | | 384,930 | |
See accompanying notes
35
American Beacon Numeric Integrated Alpha FundSM
Schedule of Investments
January 31, 2018
| | | | | | | | | | | | | | | |
| | | Shares | | | | Fair Value |
| | | | | | | | | | | | | | | |
| COMMON STOCKS - 53.83% (continued) | | | | | | | | | | | | | | | |
| Real Estate - 15.41% (continued) | | | | | | | | | | | | | | | |
| Equity Real Estate Investment Trusts (REITs) - 15.41% (continued) | | | | | | | | | | | | | | | |
| CyrusOne, Inc. | | | | 14,400 | | | | | | | | | $ | 830,736 | |
| Empire State Realty Trust, Inc., Class A | | | | 107,900 | | | | | | | | | | 2,109,445 | |
| Equinix, Inc., REIT | | | | 4,890 | | | | | | | | | | 2,225,879 | |
| Equity LifeStyle Properties, Inc. | | | | 15,700 | | | | | | | | | | 1,355,224 | |
| Essex Property Trust, Inc. | | | | 500 | | | | | | | | | | 116,490 | |
| Federal Realty Investment Trust | | | | 500 | | | | | | | | | | 60,349 | |
| First Industrial Realty Trust, Inc. | | | | 17,200 | | | | | | | | | | 530,792 | |
| Forest City Realty Trust, Inc., Class A | | | | 87,600 | | | | | | | | | | 2,055,972 | |
| Global Net Lease, Inc. | | | | 35,900 | | | | | | | | | | 658,406 | |
| Healthcare Trust of America, Inc., Class A | | | | 35,700 | | | | | | | | | | 985,677 | |
| Hospitality Properties Trust | | | | 11,363 | | | | | | | | | | 322,823 | |
| Hudson Pacific Properties, Inc. | | | | 14,900 | | | | | | | | | | 476,353 | |
| Invitation Homes, Inc. | | | | 32,100 | | | | | | | | | | 721,929 | |
| Kite Realty Group Trust | | | | 27,800 | | | | | | | | | | 468,708 | |
| PS Business Parks, Inc. | | | | 5,400 | | | | | | | | | | 659,394 | |
| QTS Realty Trust, Inc., Class A | | | | 42,300 | | | | | | | | | | 2,106,540 | |
| Ryman Hospitality Properties, Inc. | | | | 10,200 | | | | | | | | | | 780,810 | |
| Simon Property Group, Inc. | | | | 10,400 | | | | | | | | | | 1,699,048 | |
| Tanger Factory Outlet Centers, Inc. | | | | 26,800 | | | | | | | | | | 674,824 | |
| VEREIT, Inc., REIT | | | | 88,600 | | | | | | | | | | 637,920 | |
| Vornado Realty Trust | | | | 18,200 | | | | | | | | | | 1,304,576 | |
| | | | | | | | | | | | | | | |
| | | | | | | | | | | | | | 27,243,996 | |
| | | | | | | | | | | | | | | |
| | | | | | | | | | | | | | | |
Total Real Estate | | | | | | | | | | | | | | 27,243,996 | |
| | | | | | | | | | | | | | | |
| | | | | | | | | | | | | | | |
| Telecommunication Services - 0.09% | | | | | | | | | | | | | | | |
| Diversified Telecommunication Services - 0.09% | | | | | | | | | | | | | | | |
| Cogent Communications Holdings, Inc. | | | | 3,400 | | | | | | | | | | 153,340 | |
| | | | | | | | | | | | | | | |
| | | | | | | | | | | | | | | |
| Utilities - 1.29% | | | | | | | | | | | | | | | |
| Independent Power & Renewable Electricity Producers - 0.80% | | | | | | | | | | | | | | | |
| Atlantica Yield PLC | | | | 67,500 | | | | | | | | | | 1,422,900 | |
| | | | | | | | | | | | | | | |
| | | | | | | | | | | | | | | |
| Multi-Utilities - 0.49% | | | | | | | | | | | | | | | |
| MDU Resources Group, Inc. | | | | 3,500 | | | | | | | | | | 92,680 | |
| SCANA Corp. | | | | 18,900 | | | | | | | | | | 768,096 | |
| | | | | | | | | | | | | | | |
| | | | | | | | | | | | | | 860,776 | |
| | | | | | | | | | | | | | | |
| | | | | | | | | | | | | | | |
Total Utilities | | | | | | | | | | | | | | 2,283,676 | |
| | | | | | | | | | | | | | | |
| | | | | | | | | | | | | | | |
Total Common Stocks (Cost $92,641,831) | | | | | | | | | | | | | | 95,140,589 | |
| | | | | | | | | | | | | | | |
| | | | | | | | | | | | | | | |
| EXCHANGE-TRADED INSTRUMENTS - 7.86% | | | | | | | | | | | | | | | |
| Exchange-Traded Funds - 7.86% | | | | | | | | | | | | | | | |
| Consumer Discretionary Select Sector SPDR FundB | | | | 40,900 | | | | | | | | | | 4,409,429 | |
| Energy Select Sector SPDR FundB | | | | 27,100 | | | | | | | | | | 2,028,435 | |
| Health Care Select Sector SPDR Fund | | | | 13,800 | | | | | | | | | | 1,221,478 | |
| Materials Select Sector SPDR Fund | | | | 3,900 | | | | | | | | | | 245,220 | |
| Technology Select Sector SPDR FundB | | | | 87,500 | | | | | | | | | | 5,989,375 | |
| | | | | | | | | | | | | | | |
| | | | | | | | | | | | | | | |
Total Exchange-Traded Funds | | | | | | | | | | | | | | 13,893,937 | |
| | | | | | | | | | | | | | | |
| | | | | | | | | | | | | | | |
Total Exchange-Traded Instruments (Cost $13,475,593) | | | | | | | | | | | | | | 13,893,937 | |
| | | | | | | | | | | | | | | |
| | | | | | | | | | | | | | | |
| SHORT-TERM INVESTMENTS - 15.01% (Cost $26,525,936) | | | | | | | | | | | | | | | |
| Investment Companies - 15.01% | | | | | | | | | | | | | | | |
| American Beacon U.S. Government Money Market Select Fund, Select Class, 1.25%C D | | | | 26,525,936 | | | | | | | | | | 26,525,936 | |
| | | | | | | | | | | | | | | |
| | | | | | | | | | | | | | | |
TOTAL SECURITIES HELD LONG (Cost $132,643,360) | | | | | | | | | | | | | | 135,560,462 | |
| | | | | | | | | | | | | | | |
See accompanying notes
36
American Beacon Numeric Integrated Alpha FundSM
Schedule of Investments
January 31, 2018
| | | | | | | | | | | | | | | |
| | | Shares | | | | Fair Value |
| | | | | | | | | | | | | | | |
| SECURITIES HELD SHORT | | | | | | | | | | | | | | | |
| COMMON STOCKS - (42.23%) | | | | | | | | | | | | | | | |
| Consumer Discretionary - (9.57%) | | | | | | | | | | | | | | | |
| Automobiles - (1.30%) | | | | | | | | | | | | | | | |
| Tesla, Inc.A | | | | (6,490 | ) | | | | | | | | $ | (2,299,472 | ) |
| | | | | | | | | | | | | | | |
| | | | | | | | | | | | | | | |
| Diversified Consumer Services - (0.37%) | | | | | | | | | | | | | | | |
| Weight Watchers International, Inc. | | | | (10,000 | ) | | | | | | | | | (642,900 | ) |
| | | | | | | | | | | | | | | |
| | | | | | | | | | | | | | | |
| Internet & Direct Marketing Retail - (0.18%) | | | | | | | | | | | | | | | |
| Overstock.com, Inc. | | | | (4,700 | ) | | | | | | | | | (322,890 | ) |
| | | | | | | | | | | | | | | |
| | | | | | | | | | | | | | | |
| Leisure Products - (0.98%) | | | | | | | | | | | | | | | |
| Mattel, Inc. | | | | (109,600 | ) | | | | | | | | | (1,736,064 | ) |
| | | | | | | | | | | | | | | |
| | | | | | | | | | | | | | | |
| Multiline Retail - (0.16%) | | | | | | | | | | | | | | | |
| Ollie’s Bargain Outlet Holdings, Inc. | | | | (5,100 | ) | | | | | | | | | (283,305 | ) |
| | | | | | | | | | | | | | | |
| | | | | | | | | | | | | | | |
| Specialty Retail - (3.71%) | | | | | | | | | | | | | | | |
| Chico’s FAS, Inc. | | | | (69,700 | ) | | | | | | | | | (662,847 | ) |
| Conn’s, Inc.A | | | | (52,800 | ) | | | | | | | | | (1,758,240 | ) |
| Guess?, Inc. | | | | (22,500 | ) | | | | | | | | | (413,325 | ) |
| Lumber Liquidators Holdings, Inc.A | | | | (11,300 | ) | | | | | | | | | (315,722 | ) |
| Murphy USA, Inc.A | | | | (25,700 | ) | | | | | | | | | (2,192,467 | ) |
| Tiffany & Co. | | | | (11,400 | ) | | | | | | | | | (1,215,810 | ) |
| | | | | | | | | | | | | | | |
| | | | | | | | | | | | | | (6,558,411 | ) |
| | | | | | | | | | | | | | | |
| | | | | | | | | | | | | | | |
| Textiles, Apparel & Luxury Goods - (2.87%) | | | | | | | | | | | | | | | |
| NIKE, Inc., Class B | | | | (20,600 | ) | | | | | | | | | (1,405,332 | ) |
| Tapestry, Inc. | | | | (47,500 | ) | | | | | | | | | (2,234,400 | ) |
| Under Armour, Inc., Class AA | | | | (75,600 | ) | | | | | | | | | (1,047,816 | ) |
| Under Armour, Inc., Class CA | | | | (30,100 | ) | | | | | | | | | (386,785 | ) |
| | | | | | | | | | | | | | | |
| | | | | | | | | | | | | | (5,074,333 | ) |
| | | | | | | | | | | | | | | |
| | | | | | | | | | | | | | | |
Total Consumer Discretionary | | | | | | | | | | | | | | (16,917,375 | ) |
| | | | | | | | | | | | | | | |
| | | | | | | | | | | | | | | |
| Consumer Staples - (0.13%) | | | | | | | | | | | | | | | |
| Food & Staples Retailing - (0.13%) | | | | | | | | | | | | | | | |
| CVS Health Corp. | | | | (700 | ) | | | | | | | | | (55,578 | ) |
| Wal-Mart Stores, Inc. | | | | (1,600 | ) | | | | | | | | | (171,700 | ) |
| | | | | | | | | | | | | | | |
| | | | | | | | | | | | | | (227,278 | ) |
| | | | | | | | | | | | | | | |
| | | | | | | | | | | | | | | |
Total Consumer Staples | | | | | | | | | | | | | | (227,278 | ) |
| | | | | | | | | | | | | | | |
| | | | | | | | | | | | | | | |
| Energy - (4.20%) | | | | | | | | | | | | | | | |
| Energy Equipment & Services - (0.37%) | | | | | | | | | | | | | | | |
| Baker Hughes a GE Co. | | | | (20,500 | ) | | | | | | | | | (659,075 | ) |
| | | | | | | | | | | | | | | |
| | | | | | | | | | | | | | | |
| Oil, Gas & Consumable Fuels - (3.83%) | | | | | | | | | | | | | | | |
| Cheniere Energy, Inc.A | | | | (26,800 | ) | | | | | | | | | (1,515,808 | ) |
| Golar LNG Ltd. | | | | (56,900 | ) | | | | | | | | | (1,552,801 | ) |
| Hess Corp. | | | | (4,400 | ) | | | | | | | | | (222,244 | ) |
| ONEOK, Inc. | | | | (15,400 | ) | | | | | | | | | (906,444 | ) |
| SemGroup Corp., Class A | | | | (37,200 | ) | | | | | | | | | (1,065,780 | ) |
| Targa Resources Corp. | | | | (30,200 | ) | | | | | | | | | (1,449,600 | ) |
| Williams Companies, Inc. | | | | (1,800 | ) | | | | | | | | | (56,694 | ) |
| | | | | | | | | | | | | | | |
| | | | | | | | | | | | | | (6,769,371 | ) |
| | | | | | | | | | | | | | | |
| | | | | | | | | | | | | | | |
Total Energy | | | | | | | | | | | | | | (7,428,446 | ) |
| | | | | | | | | | | | | | | |
| | | | | | | | | | | | | | | |
See accompanying notes
37
American Beacon Numeric Integrated Alpha FundSM
Schedule of Investments
January 31, 2018
| | | | | | | | | | | | | | | |
| | | Shares | | | | Fair Value |
| | | | | | | | | | | | | | | |
| COMMON STOCKS - (42.23%) (continued) | | | | | | | | | | | | | | | |
| Financials - (3.86%) | | | | | | | | | | | | | | | |
| Insurance - (2.32%) | | | | | | | | | | | | | | | |
| Chubb Ltd. | | | | (1,700 | ) | | | | | | | | $ | (265,455 | ) |
| Markel Corp.A | | | | (695 | ) | | | | | | | | | (797,645 | ) |
| RLI Corp. | | | | (19,400 | ) | | | | | | | | | (1,246,644 | ) |
| Trupanion, Inc. | | | | (20,100 | ) | | | | | | | | | (701,892 | ) |
| Willis Towers Watson PLC | | | | (6,800 | ) | | | | | | | | | (1,091,196 | ) |
| | | | | | | | | | | | | | | |
| | | | | | | | | | | | | | (4,102,832 | ) |
| | | | | | | | | | | | | | | |
| | | | | | | | | | | | | | | |
| Thrifts & Mortgage Finance - (1.54%) | | | | | | | | | | | | | | | |
| LendingTree, Inc.A | | | | (4,850 | ) | | | | | | | | | (1,784,072 | ) |
| Ocwen Financial Corp.A | | | | (244,400 | ) | | | | | | | | | (823,628 | ) |
| PHH Corp.A | | | | (10,700 | ) | | | | | | | | | (95,979 | ) |
| Walter Investment Management Corp.A | | | | (21,500 | ) | | | | | | | | | (14,474 | ) |
| | | | | | | | | | | | | | | |
| | | | | | | | | | | | | | (2,718,153 | ) |
| | | | | | | | | | | | | | | |
| | | | | | | | | | | | | | | |
Total Financials | | | | | | | | | | | | | | (6,820,985 | ) |
| | | | | | | | | | | | | | | |
| | | | | | | | | | | | | | | |
| Health Care - (0.97%) | | | | | | | | | | | | | | | |
| Biotechnology - (0.12%) | | | | | | | | | | | | | | | |
| Immunomedics, Inc.A | | | | (7,700 | ) | | | | | | | | | (128,359 | ) |
| Puma Biotechnology, Inc. | | | | (1,300 | ) | | | | | | | | | (86,083 | ) |
| | | | | | | | | | | | | | | |
| | | | | | | | | | | | | | (214,442 | ) |
| | | | | | | | | | | | | | | |
| | | | | | | | | | | | | | | |
| Health Care Equipment & Supplies - (0.13%) | | | | | | | | | | | | | | | |
| Nevro Corp. | | | | (2,800 | ) | | | | | | | | | (224,728 | ) |
| | | | | | | | | | | | | | | |
| | | | | | | | | | | | | | | |
| Health Care Providers & Services - (0.30%) | | | | | | | | | | | | | | | |
| Teladoc, Inc.A | | | | (9,853 | ) | | | | | | | | | (368,502 | ) |
| Tenet Healthcare Corp. | | | | (8,500 | ) | | | | | | | | | (160,480 | ) |
| | | | | | | | | | | | | | | |
| | | | | | | | | | | | | | (528,982 | ) |
| | | | | | | | | | | | | | | |
| | | | | | | | | | | | | | | |
| Pharmaceuticals - (0.42%) | | | | | | | | | | | | | | | |
| Reata Pharmaceuticals, Inc., Class AA | | | | (2,200 | ) | | | | | | | | | (62,700 | ) |
| Teva Pharmaceutical Industries Ltd., Sponsored ADR | | | | (33,800 | ) | | | | | | | | | (689,858 | ) |
| | | | | | | | | | | | | | | |
| | | | | | | | | | | | | | (752,558 | ) |
| | | | | | | | | | | | | | | |
| | | | | | | | | | | | | | | |
Total Health Care | | | | | | | | | | | | | | (1,720,710 | ) |
| | | | | | | | | | | | | | | |
| | | | | | | | | | | | | | | |
| Industrials - (2.80%) | | | | | | | | | | | | | | | |
| Building Products - (0.66%) | | | | | | | | | | | | | | | |
| Johnson Controls International PLC | | | | (29,600 | ) | | | | | | | | | (1,158,248 | ) |
| | | | | | | | | | | | | | | |
| | | | | | | | | | | | | | | |
| Commercial Services & Supplies - (0.16%) | | | | | | | | | | | | | | | |
| Covanta Holding Corp. | | | | (17,000 | ) | | | | | | | | | (277,950 | ) |
| | | | | | | | | | | | | | | |
| | | | | | | | | | | | | | | |
| Construction & Engineering - (0.68%) | | | | | | | | | | | | | | | |
| Chicago Bridge & Iron Co. N.V. | | | | (57,700 | ) | | | | | | | | | (1,204,199 | ) |
| | | | | | | | | | | | | | | |
| | | | | | | | | | | | | | | |
| Electrical Equipment - (0.03%) | | | | | | | | | | | | | | | |
| Babcock & Wilcox Enterprises, Inc. | | | | (8,500 | ) | | | | | | | | | (55,154 | ) |
| | | | | | | | | | | | | | | |
| | | | | | | | | | | | | | | |
| Machinery - (1.24%) | | | | | | | | | | | | | | | |
| Wabtec Corp. | | | | (27,000 | ) | | | | | | | | | (2,188,080 | ) |
| | | | | | | | | | | | | | | |
| | | | | | | | | | | | | | | |
| Road & Rail - (0.03%) | | | | | | | | | | | | | | | |
| Hertz Global Holdings, Inc.A | | | | (2,400 | ) | | | | | | | | | (55,032 | ) |
| | | | | | | | | | | | | | | |
| | | | | | | | | | | | | | | |
Total Industrials | | | | | | | | | | | | | | (4,938,663 | ) |
| | | | | | | | | | | | | | | |
See accompanying notes
38
American Beacon Numeric Integrated Alpha FundSM
Schedule of Investments
January 31, 2018
| | | | | | | | | | | | | | | |
| | | Shares | | | | Fair Value |
| | | | | | | | | | | | | | | |
| COMMON STOCKS - (42.23%) (continued) | | | | | | | | | | | | | | | |
| Information Technology - (2.87%) | | | | | | | | | | | | | | | |
| Communications Equipment - (0.94%) | | | | | | | | | | | | | | | |
| Lumentum Holdings, Inc.A | | | | (19,100 | ) | | | | | | | | $ | (884,330 | ) |
| ViaSat, Inc. | | | | (10,200 | ) | | | | | | | | | (771,324 | ) |
| | | | | | | | | | | | | | | |
| | | | | | | | | | | | | | (1,655,654 | ) |
| | | | | | | | | | | | | | | |
| | | | | | | | | | | | | | | |
| Internet Software & Services - (0.18%) | | | | | | | | | | | | | | | |
| Benefitfocus, Inc.A | | | | (12,600 | ) | | | | | | | | | (317,520 | ) |
| | | | | | | | | | | | | | | |
| | | | | | | | | | | | | | | |
| IT Services - (0.32%) | | | | | | | | | | | | | | | |
| WEX, Inc.A | | | | (3,700 | ) | | | | | | | | | (572,797 | ) |
| | | | | | | | | | | | | | | |
| | | | | | | | | | | | | | | |
| Semiconductors & Semiconductor Equipment - (1.09%) | | | | | | | | | | | | | | | |
| Impinj, Inc.A | | | | (53,500 | ) | | | | | | | | | (1,196,795 | ) |
| MACOM Technology Solutions Holdings, Inc.A | | | | (10,900 | ) | | | | | | | | | (338,990 | ) |
| PDF Solutions, Inc.A | | | | (28,600 | ) | | | | | | | | | (391,248 | ) |
| | | | | | | | | | | | | | | |
| | | | | | | | | | | | | | (1,927,033 | ) |
| | | | | | | | | | | | | | | |
| | | | | | | | | | | | | | | |
| Software - (0.16%) | | | | | | | | | | | | | | | |
| Autodesk, Inc. | | | | (1,000 | ) | | | | | | | | | (115,664 | ) |
| Snap, Inc., Class AA | | | | (11,900 | ) | | | | | | | | | (160,888 | ) |
| | | | | | | | | | | | | | | |
| | | | | | | | | | | | | | (276,552 | ) |
| | | | | | | | | | | | | | | |
| | | | | | | | | | | | | | | |
| Technology Hardware, Storage & Peripherals - (0.18%) | | | | | | | | | | | | | | | |
| 3D Systems Corp.A | | | | (31,700 | ) | | | | | | | | | (324,608 | ) |
| | | | | | | | | | | | | | | |
| | | | | | | | | | | | | | | |
Total Information Technology | | | | | | | | | | | | | | (5,074,164 | ) |
| | | | | | | | | | | | | | | |
| | | | | | | | | | | | | | | |
| Materials - (0.26%) | | | | | | | | | | | | | | | |
| Construction Materials - (0.26%) | | | | | | | | | | | | | | | |
| Forterra, Inc.A | | | | (66,500 | ) | | | | | | | | | (462,175 | ) |
| | | | | | | | | | | | | | | |
| | | | | | | | | | | | | | | |
| Real Estate - (15.79%) | | | | | | | | | | | | | | | |
| Equity Real Estate Investment Trusts (REITs) - (15.79%) | | | | | | | | | | | | | | | |
| Chatham Lodging Trust | | | | (93,000 | ) | | | | | | | | | (2,083,200 | ) |
| Chesapeake Lodging Trust | | | | (39,900 | ) | | | | | | | | | (1,092,063 | ) |
| Colony NorthStar, Inc., Class A | | | | (75,900 | ) | | | | | | | | | (681,582 | ) |
| Community Healthcare Trust, Inc. | | | | (7,800 | ) | | | | | | | | | (207,792 | ) |
| DDR Corp. | | | | (64,100 | ) | | | | | | | | | (520,492 | ) |
| Easterly Government Properties, Inc., REIT | | | | (29,900 | ) | | | | | | | | | (622,817 | ) |
| Equity Residential | | | | (33,900 | ) | | | | | | | | | (2,088,579 | ) |
| Farmland Partners, Inc. | | | | (66,300 | ) | | | | | | | | | (540,345 | ) |
| GEO Group, Inc. | | | | (40,600 | ) | | | | | | | | | (915,530 | ) |
| Government Properties Income Trust | | | | (19,900 | ) | | | | | | | | | (341,484 | ) |
| Hersha Hospitality Trust | | | | (117,600 | ) | | | | | | | | | (2,181,480 | ) |
| Iron Mountain, Inc. | | | | (55,600 | ) | | | | | | | | | (1,947,668 | ) |
| Kilroy Realty Corp. | | | | (2,800 | ) | | | | | | | | | (199,696 | ) |
| Life Storage, Inc. | | | | (23,500 | ) | | | | | | | | | (1,952,850 | ) |
| LTC Properties, Inc. | | | | (5,900 | ) | | | | | | | | | (241,782 | ) |
| Macerich Co. | | | | (32,500 | ) | | | | | | | | | (2,098,525 | ) |
| Medical Properties Trust, Inc. | | | | (42,100 | ) | | | | | | | | | (550,668 | ) |
| Omega Healthcare Investors, Inc. | | | | (79,000 | ) | | | | | | | | | (2,136,160 | ) |
| Rayonier, Inc. | | | | (25,700 | ) | | | | | | | | | (834,222 | ) |
| Seritage Growth Properties | | | | (45,500 | ) | | | | | | | | | (1,874,600 | ) |
| Spirit Realty Capital, Inc. | | | | (150,400 | ) | | | | | | | | | (1,228,768 | ) |
| Urban Edge Properties | | | | (16,600 | ) | | | | | | | | | (388,108 | ) |
| Whitestone REIT | | | | (157,800 | ) | | | | | | | | | (2,073,492 | ) |
| WP Carey, Inc. | | | | (16,900 | ) | | | | | | | | | (1,095,289 | ) |
| | | | | | | | | | | | | | | |
| | | | | | | | | | | | | | (27,897,192 | ) |
| | | | | | | | | | | | | | | |
| | | | | | | | | | | | | | | |
Total Real Estate | | | | | | | | | | | | | | (27,897,192 | ) |
| | | | | | | | | | | | | | | |
See accompanying notes
39
American Beacon Numeric Integrated Alpha FundSM
Schedule of Investments
January 31, 2018
| | | | | | | | | | | | | | | |
| | | Shares | | | | Fair Value |
| | | | | | | | | | | | | | | |
| COMMON STOCKS - (42.23%) (continued) | | | | | | | | | | | | | | | |
| Utilities - (1.78%) | | | | | | | | | | | | | | | |
| Electric Utilities - (0.97%) | | | | | | | | | | | | | | | |
| Southern Co. | | | | (38,100 | ) | | | | | | | | $ | (1,718,691 | ) |
| | | | | | | | | | | | | | | |
| | | | | | | | | | | | | | | |
| Independent Power & Renewable Electricity Producers - (0.03%) | | | | | | | | | | | | | | | |
| Vivint Solar, Inc.A | | | | (16,726 | ) | | | | | | | | | (57,705 | ) |
| | | | | | | | | | | | | | | |
| | | | | | | | | | | | | | | |
| Multi-Utilities - (0.78%) | | | | | | | | | | | | | | | |
| Dominion Energy, Inc. | | | | (18,000 | ) | | | | | | | | | (1,375,920 | ) |
| | | | | | | | | | | | | | | |
| | | | | | | | | | | | | | | |
Total Utilities | | | | | | | | | | | | | | (3,152,316 | ) |
| | | | | | | | | | | | | | | |
| | | | | | | | | | | | | | | |
TOTAL COMMON STOCKS (Proceeds $(71,442,793)) | | | | | | | | | | | | | | (74,639,304 | ) |
| | | | | | | | | | | | | | | |
| | | | | | | | | | | | | | | |
| EXCHANGE-TRADED INSTRUMENTS - (7.90%) | | | | | | | | | | | | | | | |
| Exchange-Traded Funds - (7.90%) | | | | | | | | | | | | | | | |
| Consumer Staples Select Sector SPDR Fund | | | | (47,100 | ) | | | | | | | | | (2,723,322 | ) |
| Financial Select Sector SPDR Fund | | | | (81,200 | ) | | | | | | | | | (2,417,481 | ) |
| Industrial Select Sector SPDR Fund | | | | (12,200 | ) | | | | | | | | | (971,974 | ) |
| Real Estate Select Sector SPDR Fund | | | | (141,200 | ) | | | | | | | | | (4,562,172 | ) |
| Utilities Select Sector SPDR Fund | | | | (64,500 | ) | | | | | | | | | (3,292,080 | ) |
| | | | | | | | | | | | | | | |
| | | | | | | | | | | | | | | |
Total Exchange-Traded Funds | | | | | | | | | | | | | | (13,967,029 | ) |
| | | | | | | | | | | | | | | |
| | | | | | | | | | | | | | | |
TOTAL EXCHANGE-TRADED INSTRUMENTS (Proceeds $(13,979,398)) | | | | | | | | | | | | | | (13,967,029 | ) |
| | | | | | | | | | | | | | | |
| | | | | | | | | | | | | | | |
TOTAL SECURITITES SOLD SHORT (Proceeds $(85,422,191)) | | | | | | | | | | | | | | (88,606,333 | ) |
| | | | | | | | | | | | | | | |
| | | | | | | | | | | | | | | |
TOTAL INVESTMENTS IN SECURITIES (EXCLUDES SECURITIES SOLD SHORT) - 76.70% (Cost $132,643,360) | | | | | | | | | | | | | | 135,560,462 | |
TOTAL SECURITIES SOLD SHORT - (50.13%) (Proceeds $(85,422,191)) | | | | | | | | | | | | | | (88,606,333 | ) |
OTHER ASSETS, NET OF LIABILITIES - 73.43% | | | | | | | | | | | | | | 129,786,292 | |
| | | | | | | | | | | | | | | |
NET ASSETS - 100.00% | | | | | | | | | | | | | $ | 176,740,421 | |
| | | | | | | | | | | | | | | |
| | | | | | | | | | | | | | | |
| Percentages are stated as a percent of net assets. | | | | | | | | | | | | | | | |
A Non-income producing security.
B This security or a piece thereof is held as segregated collateral.
C The Fund is affiliated by having the same investment advisor.
D 7-day yield.
ADR - American Depositary Receipt.
PLC - Public Limited Company.
SPDR - Standard & Poor’s Depositary Receipt.
| | | | | | | | | | | | | | | | |
| Futures Contracts Open on January 31, 2018: | | | | | | | | | |
| | | | | |
| Long Futures | | | | | | | | | | | | | |
| | | | | |
| Equity Futures Contracts | | | | | | | | | | | | | |
| Description | | Number of
Contracts | | Expiration Date | | Notional Amount | | | Contract Value | | | Unrealized
Appreciation
(Depreciation) | |
| Mini MSCI EAFE Index Futures | | 95 | | March 2018 | | $ | 9,640,362 | | | $ | 10,191,125 | | | $ | 550,763 | |
| Mini MSCI Emerging Markets Index Futures | | 67 | | March 2018 | | | 3,780,111 | | | | 4,213,630 | | | | 433,519 | |
| | | | | | | | | | | | | | | | |
| | | | | | $ | 13,420,473 | | | $ | 14,404,755 | | | $ | 984,282 | |
| | | | | | | | | | | | | | | | |
See accompanying notes
40
American Beacon Numeric Integrated Alpha FundSM
Schedule of Investments
January 31, 2018
| | | | | | | | | | | | | | | | |
| Short Futures | | | | | | | | | |
| | | | | |
| Equity Futures Contracts | | | | | | | | | | | | | |
| Description | | Number of
Contracts | | Expiration Date | | Notional Amount | | | Contract Value | | | Unrealized
Appreciation
(Depreciation) | |
| S&P 500 E-Mini Index Futures | | 92 | | March 2018 | | $ | (12,204,023 | ) | | $ | (12,998,680 | ) | | $ | (794,657 | ) |
| | | | | | | | | | | | | | | | |
| | | | | | $ | (12,204,023 | ) | | $ | (12,998,680 | ) | | $ | (794,657 | ) |
| | | | | | | | | | | | | | | | |
|
| OTC Swap Agreements Outstanding on January 31, 2018: |
| | | | | | | | | | | | | | | | | | | | | | | | |
| | | | |
| OTC Swap Agreement Contracts for Difference - Equity | | | | | | | | | | | | |
| Reference Entity | | Counter-
party | | Long/Short | | Currency | | Financing
Rate | | Expiration
Date | | | Notional
Amount | | | Premiums
Paid
(Received) | | | Unrealized
Appreciation
(Depreciation) | |
| Siegfried Holding AG | | MSC | | Long | | CHF | | 0.501% | | | 10/22/2018 | | | | 6,080 | | | $ | 2,123,396 | | | $ | (13,081 | ) |
| Sunrise Communications Group AG | | MSC | | Long | | CHF | | 0.501% | | | 10/22/2018 | | | | 590 | | | | 55,830 | | | | (295 | ) |
| Bavarian Nordic A/S | | MSC | | Long | | DKK | | 0.073% | | | 10/22/2018 | | | | 33,457 | | | | 1,342,307 | | | | (64,742 | ) |
| Dfds A/S | | MSC | | Long | | DKK | | 0.073% | | | 10/22/2018 | | | | 8,864 | | | | 524,874 | | | | (297 | ) |
| GN Store Nord A/S | | MSC | | Long | | DKK | | 0.073% | | | 10/22/2018 | | | | 28,430 | | | | 946,536 | | | | (476 | ) |
| Royal Unibrew A/S | | MSC | | Long | | DKK | | 0.073% | | | 10/22/2018 | | | | 37,377 | | | | 2,226,780 | | | | 13,764 | |
| Sydbank A/S | | MSC | | Long | | DKK | | 0.073% | | | 10/22/2018 | | | | 8,897 | | | | 365,301 | | | | (1,541 | ) |
| Arkema S.A. | | MSC | | Long | | EUR | | 0.119% | | | 10/22/2018 | | | | 4,160 | | | | 546,358 | | | | (22,284 | ) |
| ASTM SpA | | MSC | | Long | | EUR | | 0.069% | | | 10/22/2018 | | | | 5,770 | | | | 174,961 | | | | (20,845 | ) |
| AT&S Austria Technologie & Systemtechnik AG | | MSC | | Long | | EUR | | 0.069% | | | 3/20/2018 | | | | 3,480 | | | | 108,828 | | | | 1,668 | |
| Bauer AG | | MSC | | Long | | EUR | | 0.119% | | | 10/22/2018 | | | | 28,440 | | | | 993,033 | | | | (134,631 | ) |
| BE Semiconductor Industries N.V. | | MSC | | Long | | EUR | | 0.061% | | | 10/22/2018 | | | | 14,605 | | | | 1,446,674 | | | | (60,951 | ) |
| Beneteau S.A. | | MSC | | Long | | EUR | | 0.119% | | | 3/20/2018 | | | | 46,290 | | | | 1,268,849 | | | | (53,583 | ) |
| bet-at-home.com AG | | MSC | | Long | | EUR | | 0.119% | | | 10/22/2018 | | | | 2,760 | | | | 333,252 | | | | (9,236 | ) |
| Biesse SpA | | MSC | | Long | | EUR | | 0.069% | | | 10/22/2018 | | | | 2,490 | | | | 144,233 | | | | (6,204 | ) |
| Cewe Stiftung & Co. KGAA | | MSC | | Long | | EUR | | 0.119% | | | 10/22/2018 | | | | 3,056 | | | | 339,212 | | | | (11,040 | ) |
| CIE Automotive S.A. | | MSC | | Long | | EUR | | 0.069% | | | 10/22/2018 | | | | 6,420 | | | | 206,390 | | | | 11,197 | |
| Covestro AG | | MSC | | Long | | EUR | | 0.119% | | | 10/22/2018 | | | | 18,567 | | | | 2,129,152 | | | | (23,592 | ) |
| CTS Eventim AG & Co. KGaA | | MSC | | Long | | EUR | | 0.119% | | | 10/22/2018 | | | | 4,670 | | | | 233,664 | | | | (3,258 | ) |
| Derichebourg S.A. | | MSC | | Long | | EUR | | 0.119% | | | 10/22/2018 | | | | 144,311 | | | | 1,440,941 | | | | (12,584 | ) |
| Deutsche Beteiligungs AG | | MSC | | Long | | EUR | | 0.119% | | | 10/22/2018 | | | | 682 | | | | 43,031 | | | | (1,529 | ) |
| Deutsche Lufthansa AG | | MSC | | Long | | EUR | | 0.119% | | | 10/22/2018 | | | | 49,760 | | | | 1,773,334 | | | | (21,411 | ) |
| Deutz AG | | MSC | | Long | | EUR | | 0.119% | | | 10/22/2018 | | | | 229,975 | | | | 2,241,351 | | | | (138,948 | ) |
| Dialog Semiconductor PLC | | MSC | | Long | | EUR | | 0.119% | | | 10/22/2018 | | | | 38,820 | | | | 1,220,397 | | | | (56,581 | ) |
| Draegerwerk AG & Co. KGaA | | MSC | | Long | | EUR | | 0.119% | | | 10/22/2018 | | | | 2,118 | | | | 161,141 | | | | (1,847 | ) |
| El.En. SpA | | MSC | | Long | | EUR | | 0.069% | | | 10/22/2018 | | | | 3,266 | | | | 112,048 | | | | 8,281 | |
| Elmos Semiconductor AG | | MSC | | Long | | EUR | | 0.119% | | | 10/22/2018 | | | | 4,140 | | | | 129,593 | | | | (8,768 | ) |
| Ence Energia y Celulosa S.A. | | MSC | | Long | | EUR | | 0.069% | | | 10/22/2018 | | | | 313,437 | | | | 2,098,599 | | | | (113,235 | ) |
| Falck Renewables SpA | | MSC | | Long | | EUR | | 0.069% | | | 10/22/2018 | | | | 43,130 | | | | 109,644 | | | | (2,686 | ) |
| Faurecia | | MSC | | Long | | EUR | | 0.119% | | | 10/22/2018 | | | | 10,390 | | | | 936,877 | | | | (15,791 | ) |
| Fiat Chrysler Automobiles N.V. | | MSC | | Long | | EUR | | 0.069% | | | 10/22/2018 | | | | 6,120 | | | | 149,566 | | | | (1,188 | ) |
| ForFarmers N.V. | | MSC | | Long | | EUR | | 0.069% | | | 10/22/2018 | | | | 13,600 | | | | 171,952 | | | | (3,388 | ) |
| International Consolidated Airlines Group S.A. | | MSC | | Long | | EUR | | 0.069% | | | 10/22/2018 | | | | 75,900 | | | | 688,489 | | | | (7,942 | ) |
| IPSOS | | MSC | | Long | | EUR | | 0.119% | | | 10/22/2018 | | | | 6,210 | | | | 253,809 | | | | (20,114 | ) |
| Jacquet Metal Service | | MSC | | Long | | EUR | | 0.119% | | | 10/22/2018 | | | | 14,941 | | | | 585,759 | | | | (39,087 | ) |
| JOST Werke AG | | MSC | | Long | | EUR | | 0.119% | | | 10/22/2018 | | | | 3,890 | | | | 202,090 | | | | (8,474 | ) |
| Kaufman & Broad S.A. | | MSC | | Long | | EUR | | 0.106% | | | 10/22/2018 | | | | 12,753 | | | | 636,848 | | | | 20,335 | |
| La Doria SpA | | MSC | | Long | | EUR | | 0.069% | | | 10/22/2018 | | | | 4,795 | | | | 95,961 | | | | (5,459 | ) |
| Leoni AG | | MSC | | Long | | EUR | | 0.119% | | | 10/22/2018 | | | | 2,650 | | | | 210,523 | | | | (6,920 | ) |
| Mediaset Espana Comunicacion S.A. | | MSC | | Long | | EUR | | 0.069% | | | 10/22/2018 | | | | 41,300 | | | | 474,760 | | | | (12,312 | ) |
| Mersen S.A. | | MSC | | Long | | EUR | | 0.119% | | | 10/22/2018 | | | | 5,962 | | | | 296,556 | | | | (9,655 | ) |
| Neopost S.A. | | MSC | | Long | | EUR | | 0.119% | | | 10/22/2018 | | | | 32,776 | | | | 1,072,955 | | | | (111,060 | ) |
| NH Hotel Group S.A. | | MSC | | Long | | EUR | | 0.069% | | | 10/22/2018 | | | | 15,800 | | | | 118,854 | | | | (197 | ) |
| Peugeot S.A. | | MSC | | Long | | EUR | | 0.106% | | | 10/22/2018 | | | | 30,670 | | | | 714,307 | | | | (35,151 | ) |
| Pharming Group N.V. | | MSC | | Long | | EUR | | 0.069% | | | 10/22/2018 | | | | 146,000 | | | | 276,357 | | | | (182 | ) |
| PNE Wind AG | | MSC | | Long | | EUR | | 0.119% | | | 10/22/2018 | | | | 154,500 | | | | 596,872 | | | | (6,884 | ) |
See accompanying notes
41
American Beacon Numeric Integrated Alpha FundSM
Schedule of Investments
January 31, 2018
| | | | | | | | | | | | | | | | | | | | | | | | |
| Reference Entity | | Counter-
party | | Long/Short | | Currency | | Financing
Rate | | Expiration
Date | | | Notional
Amount | | | Premiums
Paid
(Received) | | | Unrealized
Appreciation
(Depreciation) | |
| Saeta Yield S.A. | | MSC | | Long | | EUR | | 0.069% | | | 10/22/2018 | | | | 48,394 | | | $ | 677,090 | | | $ | (10,852 | ) |
| Sanoma OYJ | | MSC | | Long | | EUR | | 0.069% | | | 10/22/2018 | | | | 4,090 | | | | 55,470 | | | | (3,210 | ) |
| Tom Tailor Holding SE | | MSC | | Long | | EUR | | 0.119% | | | 10/22/2018 | | | | 32,260 | | | | 456,010 | | | | (9,207 | ) |
| Ubisoft Entertainment S.A. | | MSC | | Long | | EUR | | 0.119% | | | 3/20/2018 | | | | 16,320 | | | | 1,375,199 | | | | 6,357 | |
| Unieuro SpA | | MSC | | Long | | EUR | | 0.069% | | | 10/22/2018 | | | | 53,764 | | | | 951,147 | | | | (29,470 | ) |
| Valmet OYJ | | MSC | | Long | | EUR | | 0.069% | | | 10/22/2018 | | | | 63,200 | | | | 1,423,153 | | | | (24,407 | ) |
| Van Lanschot Kempen N.V. | | MSC | | Long | | EUR | | 0.069% | | | 10/22/2018 | | | | 12,101 | | | | 401,772 | | | | 3,769 | |
| Wacker Neuson SE | | MSC | | Long | | EUR | | 0.119% | | | 10/22/2018 | | | | 2,620 | | | | 107,660 | | | | (1,893 | ) |
| Wuestenrot & Wuerttembergische AG | | MSC | | Long | | EUR | | 0.119% | | | 10/22/2018 | | | | 14,370 | | | | 435,734 | | | | (11,636 | ) |
| 3i Group PLC | | MSC | | Long | | GBP | | 0.744% | | | 10/22/2018 | | | | 163,610 | | | | 2,105,453 | | | | 23,266 | |
| Abcam PLC | | MSC | | Long | | GBP | | 0.744% | | | 10/22/2018 | | | | 134,760 | | | | 2,232,201 | | | | 84,320 | |
| Central Asia Metals PLC | | MSC | | Long | | GBP | | 0.744% | | | 10/22/2018 | | | | 121,578 | | | | 537,484 | | | | (24,326 | ) |
| Clinigen Healthcare Ltd. | | MSC | | Long | | GBP | | 0.744% | | | 10/22/2018 | | | | 7,976 | | | | 122,314 | | | | - | |
| Drax Group PLC | | MSC | | Long | | GBP | | 0.744% | | | 10/22/2018 | | | | 49,700 | | | | 194,219 | | | | (13,994 | ) |
| Evraz PLC | | MSC | | Long | | GBP | | 0.022% | | | 10/22/2018 | | | | 185,434 | | | | 1,024,032 | | | | (62,496 | ) |
| Fevertree Drinks PLC | | MSC | | Long | | GBP | | 0.744% | | | 10/22/2018 | | | | 1,580 | | | | 55,836 | | | | (981 | ) |
| Games Workshop Group PLC | | MSC | | Long | | GBP | | 0.744% | | | 10/22/2018 | | | | 11,437 | | | | 395,344 | | | | (21,143 | ) |
| Indivior PLC | | MSC | | Long | | GBP | | 0.744% | | | 10/22/2018 | | | | 48,943 | | | | 282,653 | | | | (7,517 | ) |
| Jackpotjoy PLC | | MSC | | Long | | GBP | | 0.744% | | | 10/22/2018 | | | | 57,725 | | | | 677,222 | | | | (24,626 | ) |
| Numis Corp. PLC | | MSC | | Long | | GBP | | 0.744% | | | 10/22/2018 | | | | 11,800 | | | | 56,340 | | | | (127 | ) |
| Plus500 Ltd. | | MSC | | Long | | GBP | | 0.744% | | | 10/22/2018 | | | | 114,641 | | | | 1,703,489 | | | | 102,275 | |
| SSP Group PLC | | MSC | | Long | | GBP | | 0.744% | | | 10/22/2018 | | | | 12,700 | | | | 111,821 | | | | (1,892 | ) |
| Stock Spirits Group PLC | | MSC | | Long | | GBP | | 0.744% | | | 10/22/2018 | | | | 34,650 | | | | 148,811 | | | | (1,725 | ) |
| Taylor Wimpey PLC | | MSC | | Long | | GBP | | 0.744% | | | 10/22/2018 | | | | 163,600 | | | | 445,445 | | | | (10,120 | ) |
| Vedanta Resources PLC | | MSC | | Long | | GBP | | 0.744% | | | 10/22/2018 | | | | 50,680 | | | | 631,661 | | | | (47,422 | ) |
| Wizz Air Holdings PLC | | MSC | | Long | | GBP | | 0.744% | | | 10/22/2018 | | | | 24,551 | | | | 1,201,492 | | | | (14,314 | ) |
| Austevoll Seafood ASA | | MSC | | Long | | NOK | | 1.040% | | | 10/22/2018 | | | | 68,584 | | | | 552,974 | | | | (25,017 | ) |
| BW Offshore Ltd. | | MSC | | Long | | NOK | | 1.040% | | | 10/22/2018 | | | | 88,600 | | | | 439,431 | | | | (6,925 | ) |
| DNO ASA | | MSC | | Long | | NOK | | 1.040% | | | 10/22/2018 | | | | 97,935 | | | | 130,649 | | | | (8,038 | ) |
| Grieg Seafood ASA | | MSC | | Long | | NOK | | 1.040% | | | 10/22/2018 | | | | 37,680 | | | | 337,346 | | | | (10,799 | ) |
| Kvaerner ASA | | MSC | | Long | | NOK | | 1.040% | | | 10/22/2018 | | | | 142,630 | | | | 314,523 | | | | (17,094 | ) |
| Scatec Solar ASA | | MSC | | Long | | NOK | | 1.040% | | | 10/22/2018 | | | | 35,200 | | | | 221,402 | | | | (16,567 | ) |
| SpareBank 1 Nord Norge | | MSC | | Long | | NOK | | 1.040% | | | 10/22/2018 | | | | 86,600 | | | | 714,751 | | | | 1,128 | |
| SpareBank 1 SMN | | MSC | | Long | | NOK | | 1.040% | | | 10/22/2018 | | | | 10,500 | | | | 115,905 | | | | 821 | |
| SpareBank 1 SR-Bank ASA | | MSC | | Long | | NOK | | 1.040% | | | 10/22/2018 | | | | 16,400 | | | | 193,755 | | | | (1,923 | ) |
| Boliden AB | | MSC | | Long | | SEK | | 0.181% | | | 10/22/2018 | | | | 1,520 | | | | 55,935 | | | | (938 | ) |
| Concentric AB | | MSC | | Long | | SEK | | 0.181% | | | 10/22/2018 | | | | 2,199 | | | | 42,713 | | | | (616 | ) |
| Dometic Group AB | | MSC | | Long | | SEK | | 0.181% | | | 10/22/2018 | | | | 15,700 | | | | 171,125 | | | | (924 | ) |
| Granges AB | | MSC | | Long | | SEK | | 0.181% | | | 10/22/2018 | | | | 10,700 | | | | 111,910 | | | | (1,499 | ) |
| LeoVegas AB | | MSC | | Long | | SEK | | 0.181% | | | 10/22/2018 | | | | 5,700 | | | | 77,004 | | | | 2,903 | |
| Loomis AB | | MSC | | Long | | SEK | | 0.181% | | | 10/22/2018 | | | | 2,880 | | | | 112,422 | | | | 3,079 | |
| Oriflame Holding AG | | MSC | | Long | | SEK | | 0.181% | | | 10/22/2018 | | | | 3,360 | | | | 150,592 | | | | 206 | |
| SAS AB | | MSC | | Long | | SEK | | 0.181% | | | 10/22/2018 | | | | 682,334 | | | | 1,699,155 | | | | (80,791 | ) |
| Vitrolife AB | | MSC | | Long | | SEK | | 0.181% | | | 10/22/2018 | | | | 7,174 | | | | 615,888 | | | | (457 | ) |
| Arbonia AG | | MSC | | Short | | CHF | | 1.426% | | | 10/22/2018 | | | | (3,020 | ) | | | 54,162 | | | | 492 | |
| COSMO Pharmaceuticals N.V. | | MSC | | Short | | CHF | | 1.426% | | | 10/22/2018 | | | | (2,935 | ) | | | 434,901 | | | | 9,089 | |
| LafargeHolcim Ltd. | | MSC | | Short | | CHF | | 1.101% | | | 10/22/2018 | | | | (8,780 | ) | | | 545,637 | | | | 25,501 | |
| Panalpina Welttransport Holding AG | | MSC | | Short | | CHF | | 1.379% | | | 10/22/2018 | | | | (3,098 | ) | | | 508,244 | | | | 11,664 | |
| Vifor Pharma AG | | MSC | | Short | | CHF | | 1.101% | | | 10/22/2018 | | | | (15,407 | ) | | | 2,155,521 | | | | (43,092 | ) |
| ALK-Abello A/S | | MSC | | Short | | DKK | | 0.673% | | | 10/22/2018 | | | | (6,021 | ) | | | 789,990 | | | | 33,630 | |
| AP Moller - Maersk A/S | | MSC | | Short | | DKK | | 0.020% | | | 10/22/2018 | | | | (138 | ) | | | 249,712 | | | | 6,814 | |
| Chr Hansen Holding A/S | | MSC | | Short | | DKK | | 0.673% | | | 10/22/2018 | | | | (15,050 | ) | | | 1,339,979 | | | | 42,826 | |
| Coloplast A/S | | MSC | | Short | | DKK | | 0.673% | | | 10/22/2018 | | | | (23,130 | ) | | | 2,001,060 | | | | (31,043 | ) |
| Accor S.A. | | MSC | | Short | | EUR | | 0.619% | | | 10/22/2018 | | | | (39,860 | ) | | | 2,260,059 | | | | 21,352 | |
| ALD S.A. | | MSC | | Short | | EUR | | 0.994% | | | 3/20/2018 | | | | (3,960 | ) | | | 70,097 | | | | (4 | ) |
| Banco BPM SpA | | MSC | | Short | | EUR | | 0.871% | | | 10/22/2018 | | | | (184,200 | ) | | | 689,747 | | | | (8,068 | ) |
| Biocartis N.V. | | MSC | | Short | | EUR | | 7.619% | | | 10/22/2018 | | | | (58,579 | ) | | | 994,705 | | | | (45,244 | ) |
| Bollore S.A. | | MSC | | Short | | EUR | | 0.619% | | | 10/22/2018 | | | | (384,500 | ) | | | 2,198,954 | | | | (5,748 | ) |
See accompanying notes
42
American Beacon Numeric Integrated Alpha FundSM
Schedule of Investments
January 31, 2018
| | | | | | | | | | | | | | | | | | | | | | | | | | |
| Reference Entity | | Counter-
party | | Long/Short | | Currency | | Financing
Rate | | | Expiration
Date | | | Notional
Amount | | | Premiums
Paid
(Received) | | | Unrealized
Appreciation
(Depreciation) | |
| Cairn Homes PLC | | MSC | | Short | | EUR | | | 0.619% | | | | 10/22/2018 | | | | (11,546 | ) | | $ | 27,018 | | | $ | 144 | |
| Carrefour S.A. | | MSC | | Short | | EUR | | | 0.619% | | | | 10/22/2018 | | | | (74,220 | ) | | | 1,679,033 | | | | (74,892 | ) |
| Delivery Hero AG | | MSC | | Short | | EUR | | | 0.619% | | | | 10/22/2018 | | | | (26,710 | ) | | | 1,128,969 | | | | (1,996 | ) |
| Deutsche Bank AG | | MSC | | Short | | EUR | | | 0.619% | | | | 10/22/2018 | | | | (92,540 | ) | | | 1,789,516 | | | | 114,129 | |
| Huhtamaki OYJ | | MSC | | Short | | EUR | | | 0.669% | | | | 10/22/2018 | | | | (13,440 | ) | | | 549,800 | | | | (16,408 | ) |
| Industria de Diseno Textil S.A. | | MSC | | Short | | EUR | | | 0.669% | | | | 10/22/2018 | | | | (35,500 | ) | | | 1,249,113 | | | | (6,634 | ) |
| Innogy SE | | MSC | | Short | | EUR | | | 0.619% | | | | 10/22/2018 | | | | (3,980 | ) | | | 154,503 | | | | 3,071 | |
| Kone OYJ | | MSC | | Short | | EUR | | | 0.669% | | | | 10/22/2018 | | | | (12,750 | ) | | | 711,677 | | | | (8,577 | ) |
| OCI N.V. | | MSC | | Short | | EUR | | | 1.328% | | | | 10/22/2018 | | | | (33,520 | ) | | | 865,282 | | | | 27,560 | |
| Parmalat SpA | | MSC | | Short | | EUR | | | 0.669% | | | | 10/22/2018 | | | | (5,790 | ) | | | 22,203 | | | | 36 | |
| Parrot S.A. | | MSC | | Short | | EUR | | | 11.324% | | | | 10/22/2018 | | | | (30,755 | ) | | | 306,334 | | | | - | |
| Porr AG | | MSC | | Short | | EUR | | | 4.244% | | | | 3/20/2018 | | | | (2,310 | ) | | | 83,912 | | | | 5,324 | |
| Rocket Internet SE | | MSC | | Short | | EUR | | | 1.244% | | | | 10/22/2018 | | | | (19,810 | ) | | | 545,594 | | | | (21,717 | ) |
| Salvatore Ferragamo SpA | | MSC | | Short | | EUR | | | 6.869% | | | | 10/22/2018 | | | | (73,270 | ) | | | 2,122,085 | | | | 89,451 | |
| Siemens AG | | MSC | | Short | | EUR | | | 0.619% | | | | 10/22/2018 | | | | (14,460 | ) | | | 2,203,119 | | | | 39,630 | |
| Siemens Gamesa Renewable Energy S.A. | | MSC | | Short | | EUR | | | 0.669% | | | | 10/22/2018 | | | | (142,240 | ) | | | 2,283,746 | | | | 94,800 | |
| Tenaris S.A. | | MSC | | Short | | EUR | | | 0.628% | | | | 10/22/2018 | | | | (85,020 | ) | | | 1,511,394 | | | | 51,368 | |
| Tod’s SpA | | MSC | | Short | | EUR | | | 6.619% | | | | 10/22/2018 | | | | (2,380 | ) | | | 177,284 | | | | 148 | |
| Umicore S.A. | | MSC | | Short | | EUR | | | 0.669% | | | | 10/22/2018 | | | | (17,900 | ) | | | 940,585 | | | | 11,818 | |
| Vallourec S.A. | | MSC | | Short | | EUR | | | 8.453% | | | | 10/22/2018 | | | | (37,965 | ) | | | 274,146 | | | | 17,783 | |
| Allied Minds PLC | | MSC | | Short | | GBP | | | 10.631% | | | | 10/22/2018 | | | | (60,504 | ) | | | 137,233 | | | | 1,205 | |
| Barclays PLC | | MSC | | Short | | GBP | | | 0.244% | | | | 10/22/2018 | | | | (208,600 | ) | | | 609,676 | | | | 27,304 | |
| Capital & Counties Properties PLC | | MSC | | Short | | GBP | | | 0.506% | | | | 10/22/2018 | | | | (422,500 | ) | | | 1,760,812 | | | | 20,428 | |
| Cobham PLC | | MSC | | Short | | GBP | | | 0.244% | | | | 10/22/2018 | | | | (489,400 | ) | | | 914,817 | | | | 11,098 | |
| Domino’s Pizza Group PLC | | MSC | | Short | | GBP | | | 0.244% | | | | 10/22/2018 | | | | (84,300 | ) | | | 416,085 | | | | 18,821 | |
| Fresnillo PLC | | MSC | | Short | | GBP | | | 0.244% | | | | 10/22/2018 | | | | (50,740 | ) | | | 984,408 | | | | 24,940 | |
| HSBC Holdings PLC | | MSC | | Short | | GBP | | | 0.244% | | | | 10/22/2018 | | | | (201,400 | ) | | | 2,206,683 | | | | 95,658 | |
| Mediclinic International PLC | | MSC | | Short | | GBP | | | 1.506% | | | | 10/22/2018 | | | | (115,100 | ) | | | 979,959 | | | | 20,296 | |
| Melrose Industries PLC | | MSC | | Short | | GBP | | | 0.244% | | | | 10/22/2018 | | | | (297,200 | ) | | | 953,864 | | | | 14,369 | |
| Metro Bank PLC | | MSC | | Short | | GBP | | | 0.429% | | | | 10/22/2018 | | | | (7,950 | ) | | | 406,161 | | | | 2,713 | |
| Ocado Group PLC | | MSC | | Short | | GBP | | | 0.118% | | | | 10/22/2018 | | | | (41,363 | ) | | | 304,215 | | | | 13,529 | |
| Phoenix Group Holdings | | MSC | | Short | | GBP | | | 0.244% | | | | 10/22/2018 | | | | (50,733 | ) | | | 562,316 | | | | 20,917 | |
| Purplebricks Group PLC | | MSC | | Short | | GBP | | | 13.131% | | | | 10/22/2018 | | | | (181,127 | ) | | | 1,065,514 | | | | (176,694 | ) |
| Reckitt Benckiser Group PLC | | MSC | | Short | | GBP | | | 0.244% | | | | 10/22/2018 | | | | (6,140 | ) | | | 592,693 | | | | 6,802 | |
| Royal Bank of Scotland Group PLC | | MSC | | Short | | GBP | | | 0.244% | | | | 10/22/2018 | | | | (271,400 | ) | | | 1,129,863 | | | | 37,932 | |
| Sirius Minerals PLC | | MSC | | Short | | GBP | | | 3.881% | | | | 10/22/2018 | | | | (2,227,254 | ) | | | 701,150 | | | | (32,306 | ) |
| Smart Metering Systems PLC | | MSC | | Short | | GBP | | | 2.756% | | | | 10/22/2018 | | | | (64,455 | ) | | | 705,765 | | | | 28,414 | |
| Sound Energy PLC | | MSC | | Short | | GBP | | | 18.506% | | | | 10/22/2018 | | | | (216,085 | ) | | | 157,537 | | | | 12,353 | |
| Travis Perkins PLC | | MSC | | Short | | GBP | | | 0.244% | | | | 10/22/2018 | | | | (58,890 | ) | | | 1,218,104 | | | | 17,168 | |
| Asetek A/S | | MSC | | Short | | NOK | | | 4.260% | | | | 10/22/2018 | | | | (7,584 | ) | | | 89,696 | | | | 2,470 | |
| Avanza Bank Holding AB | | MSC | | Short | | SEK | | | 1.094% | | | | 10/22/2018 | | | | (11,014 | ) | | | 581,182 | | | | (26,642 | ) |
| Eltel AB | | MSC | | Short | | SEK | | | 4.731% | | | | 10/22/2018 | | | | (40,151 | ) | | | 148,877 | | | | 6,236 | |
| Hennes & Mauritz AB | | MSC | | Short | | SEK | | | 0.781% | | | | 10/22/2018 | | | | (107,690 | ) | | | 2,099,241 | | | | 236,097 | |
| Nordea Bank AB | | MSC | | Short | | SEK | | | 0.781% | | | | 10/22/2018 | | | | (50,280 | ) | | | 632,484 | | | | 24,199 | |
| RaySearch Laboratories AB | | MSC | | Short | | SEK | | | 2.731% | | | | 10/22/2018 | | | | (10,347 | ) | | | 190,283 | | | | (12,250 | ) |
| Recipharm AB | | MSC | | Short | | SEK | | | 7.606% | | | | 10/22/2018 | | | | (15,800 | ) | | | 204,596 | | | | 16,294 | |
| Skanska AB | | MSC | | Short | | SEK | | | 0.781% | | | | 10/22/2018 | | | | (105,470 | ) | | | 2,130,622 | | | | 26,885 | |
| Telefonaktiebolaget LM Ericsson | | MSC | | Short | | SEK | | | 0.694% | | | | 10/22/2018 | | | | (151,300 | ) | | | 1,079,066 | | | | 128,675 | |
| | | | | | | | | | | | | | | | | | | | | | | | | | |
| | | | | | | | | | | | | | | | | | | | $ | 112,069,759 | | | $ | (366,908 | ) |
| | | | | | | | | | | | | | | | | | | | | | | | | | |
See accompanying notes
43
American Beacon Numeric Integrated Alpha FundSM
Schedule of Investments
January 31, 2018
| | |
| Glossary: |
| | |
| Counterparty Abbreviations: |
| MSC | | Morgan Stanley & Co., Inc. |
|
| Currency Abbreviations: |
| CHF | | Swiss Franc |
| DKK | | Danish Krone |
| EUR | | Euro |
| GBP | | Pound Sterling |
| NOK | | Norwegian Krone |
| SEK | | Swedish Krona |
|
| Index Abbreviations: |
| MSCI | | Morgan Stanley Capital International |
| MSCI EAFE | | Morgan Stanley Capital International—Europe, Australasia, and Far East |
| S&P 500 | | Standard & Poor’s U.S. Equity Large-Cap Index |
|
| Exchange Abbreviations: |
| OTC | | Over-the-Counter |
|
| Other Abbreviations: |
| PLC | | Public Limited Company |
The Fund’s investments are summarized by level based on the inputs used to determine their values. As of January 31, 2018, the investments were classified as described below:
| | | | | | | | | | | | | | | | | | | | | | | | | | | | |
Numeric Integrated Alpha Fund | | Level 1 | | | | | | Level 2 | | | | | | Level 3 | | | | | | Total | |
Assets | | | | | | | | | | | | | | | | | | | | | | | | | | | | |
Common Stocks | | $ | 95,140,589 | | | | | | | $ | - | | | | | | | $ | - | | | | | | | $ | 95,140,589 | |
Exchange-Traded Instruments | | | 13,893,937 | | | | | | | | - | | | | | | | | - | | | | | | | | 13,893,937 | |
Short-Term Investments | | | 26,525,936 | | | | | | | | - | | | | | | | | - | | | | | | | | 26,525,936 | |
| | | | | | | | | | | | | | | | | | | | | | | | | | | | |
Total Investments in Securities - Assets | | $ | 135,560,462 | | | | | | | $ | - | | | | | | | $ | - | | | | | | | $ | 135,560,462 | |
| | | | | | | | | | | | | | | | | | | | | | | | | | | | |
|
Liabilities | |
Common Stocks (Sold Short) | | $ | (74,639,304 | ) | | | | | | $ | - | | | | | | | $ | - | | | | | | | $ | (74,639,304 | ) |
Exchange-Traded Instruments (Sold Short) | | | (13,967,029 | ) | | | | | | | - | | | | | | | | - | | | | | | | | (13,967,029 | ) |
| | | | | | | | | | | | | | | | | | | | | | | | | | | | |
Total Investments in Securities - Liabilities | | | (88,606,333 | ) | | | | | | | - | | | | | | | | - | | | | | | | | (88,606,333 | ) |
| | | | | | | | | | | | | | | | | | | | | | | | | | | | |
Total Investments in Securities | | $ | 46,954,129 | | | | | | | $ | - | | | | | | | $ | - | | | | | | | $ | 46,954,129 | |
| | | | | | | | | | | | | | | | | | | | | | | | | | | | |
|
Financial Derivative Instruments - Assets | |
Futures Contracts | | $ | 984,282 | | | | | | | $ | - | | | | | | | $ | - | | | | | | | $ | 984,282 | |
OTC Swap Agreement Contracts for Difference - Equity | | | - | | | | | | | | 1,704,802 | | | | | | | | - | | | | | | | | 1,704,802 | |
| | | | | | | | | | | | | | | | | | | | | | | | | | | | |
Total Financial Derivative Instruments - Assets | | $ | 984,282 | | | | | | | $ | 1,704,802 | | | | | | | $ | - | | | | | | | $ | 2,689,084 | |
| | | | | | | | | | | | | | | | | | | | | | | | | | | | |
|
Financial Derivative Instruments - Liabilities | |
Futures Contracts | | $ | (794,657 | ) | | | | | | $ | - | | | | | | | $ | - | | | | | | | $ | (794,657 | ) |
OTC Swap Agreement Contracts for Difference - Equity | | | - | | | | | | | | (2,071,710 | ) | | | | | | | - | | | | | | | | (2,071,710 | ) |
| | | | | | | | | | | | | | | | | | | | | | | | | | | | |
Total Financial Derivative Instruments - Liabilities | | $ | (794,657 | ) | | | | | | $ | (2,071,710 | ) | | | | | | $ | - | | | | | | | $ | (2,866,367 | ) |
| | | | | | | | | | | | | | | | | | | | | | | | | | | | |
U.S. GAAP requires all transfers between any levels to be disclosed. The end of period timing recognition has been adopted for the transfers between levels of the Fund’s assets and liabilities. As of January 31, 2018, there were no transfers between levels.
See accompanying notes
44
American Beacon FundsSM
Statements of Assets and Liabilities
January 31, 2018
| | | | | | | | | | | | |
| | | Grosvenor
Long/Short Fund | | | | | | Numeric Integrated
Alpha Fund | |
Assets: | | | | | | | | | | | | |
Investments in unaffiliated securities, at fair value† | | $ | 16,065,772 | | | | | | | $ | 109,034,526 | |
Investments in affiliated securities, at fair value‡ | | | 3,966,444 | | | | | | | | 26,525,936 | |
Foreign currency, at fair value^ | | | 240,828 | | | | | | | | 645,438 | |
Purchased options contracts outstanding (premiums paid $25,214) | | | 21,249 | | | | | | | | - | |
Swap income receivable | | | 1,667 | | | | | | | | - | |
Cash with brokers | | | 3,951,678 | | | | | | | | 79,161,091 | |
Deposit with brokers for futures contracts | | | - | | | | | | | | 856,482 | |
Cash collateral held at custodian for the benefit of the broker | | | 1,841,899 | | | | | | | | 46,775,000 | |
Dividends and interest receivable | | | 10,844 | | | | | | | | 54,467 | |
Receivable for investments sold | | | 642,648 | | | | | | | | 13,312,755 | |
Receivable for fund shares sold | | | - | | | | | | | | 2,673,379 | |
Receivable for tax reclaims | | | 260 | | | | | | | | - | |
Receivable for expense reimbursement (Note 2) | | | 89,478 | | | | | | | | 17,975 | |
Receivable for variation margin from open futures contracts (Note 5) | | | - | | | | | | | | 190,135 | |
Unrealized appreciation from swap agreements | | | 644,259 | | | | | | | | 1,704,802 | |
Unrealized appreciation from forward foreign currency contracts | | | 6,604 | | | | | | | | - | |
Prepaid expenses | | | 27,115 | | | | | | | | 35,508 | |
| | | | | | | | | | | | |
Total assets | | | 27,510,745 | | | | | | | | 280,987,494 | |
| | | | | | | | | | | | |
Liabilities: | |
Payable for investments purchased | | | 971,057 | | | | | | | | 12,941,640 | |
Payable for fund shares redeemed | | | - | | | | | | | | 106,824 | |
Payable for foreign currency, at fair value1 | | | 134,530 | | | | | | | | - | |
Swap premium received | | | 271 | | | | | | | | - | |
Securities sold short, at fair value± | | | 4,753,576 | | | | | | | | 88,606,333 | |
Cash due to custodian | | | 870,541 | | | | | | | | - | |
Swap income payable | | | 6 | | | | | | | | 18,185 | |
Dividends and interest expense payable | | | 1,109 | | | | | | | | 112,417 | |
Management and sub-advisory fees payable (Note 2) | | | 34,848 | | | | | | | | 253,631 | |
Service fees payable (Note 2) | | | 404 | | | | | | | | 22 | |
Transfer agent fees payable (Note 2) | | | 2,644 | | | | | | | | 17,963 | |
Custody and fund accounting fees payable | | | 93,661 | | | | | | | | 51,237 | |
Professional fees payable | | | 48,722 | | | | | | | | 38,053 | |
Trustee fees payable (Note 2) | | | 63 | | | | | | | | 567 | |
Payable for prospectus and shareholder reports | | | 675 | | | | | | | | 14,142 | |
Unrealized depreciation from swap agreements | | | 56,987 | | | | | | | | 2,071,710 | |
Unrealized depreciation from forward foreign currency contracts | | | 40,896 | | | | | | | | - | |
Other liabilities | | | 238 | | | | | | | | 14,349 | |
| | | | | | | | | | | | |
Total liabilities | | | 7,010,228 | | | | | | | | 104,247,073 | |
| | | | | | | | | | | | |
Net assets | | $ | 20,500,517 | | | | | | | $ | 176,740,421 | |
| | | | | | | | | | | | |
Analysis of net assets: | | | | | | | | | | | | |
Paid-in-capital | | $ | 18,448,442 | | | | | | | $ | 179,493,005 | |
Undistributed (Overdistribution) of net investment income | | | (499,885 | ) | | | | | | | 342,188 | |
Accumulated net realized gain (loss) | | | 194,267 | | | | | | | | (2,655,321 | ) |
Unrealized appreciation of investments in unaffiliated securitiesA | | | 2,226,162 | | | | | | | | 2,917,102 | |
Unrealized (depreciation) of forward foreign currency contracts | | | (34,292 | ) | | | | | | | - | |
Unrealized appreciation (depreciation) of foreign currency transactions | | | (4,814 | ) | | | | | | | 4,872 | |
Unrealized appreciation of futures contracts | | | - | | | | | | | | 189,625 | |
Unrealized appreciation (depreciation) of swap agreements | | | 587,272 | | | | | | | | (366,908 | ) |
Unrealized (depreciation) of purchased options contracts | | | (3,965 | ) | | | | | | | - | |
Unrealized (depreciation) of short sales | | | (412,670 | ) | | | | | | | (3,184,142 | ) |
| | | | | | | | | | | | |
Net assets | | $ | 20,500,517 | | | | | | | $ | 176,740,421 | |
| | | | | | | | | | | | |
See accompanying notes
45
American Beacon FundsSM
Statements of Assets and Liabilities
January 31, 2018
| | | | | | | | | | | | |
| | | Grosvenor
Long/Short Fund | | | | | | Numeric Integrated
Alpha Fund | |
Shares outstanding at no par value (unlimited shares authorized): | | | | | | | | | | | | |
Institutional Class | | | 1,660,750 | | | | | | | | 12,247 | |
| | | | | | | | | | | | |
Y Class | | | 37,063 | | | | | | | | 10,169 | |
| | | | | | | | | | | | |
Investor Class | | | 79,020 | | | | | | | | 10,162 | |
| | | | | | | | | | | | |
A Class | | | 18,977 | | | | | | | | N/A | |
| | | | | | | | | | | | |
C Class | | | 16,593 | | | | | | | | N/A | |
| | | | | | | | | | | | |
Ultra Class | | | 9,574 | B | | | | | | | 17,608,042 | |
| | | | | | | | | | | | |
Net assets: | | | | | | | | | | | | |
Institutional Class | | $ | 18,701,925 | | | | | | | $ | 122,715 | |
| | | | | | | | | | | | |
Y Class | | $ | 416,381 | | | | | | | $ | 101,793 | |
| | | | | | | | | | | | |
Investor Class | | $ | 881,290 | | | | | | | $ | 101,438 | |
| | | | | | | | | | | | |
A Class | | $ | 211,579 | | | | | | | | N/A | |
| | | | | | | | | | | | |
C Class | | $ | 181,475 | | | | | | | | N/A | |
| | | | | | | | | | | | |
Ultra Class | | $ | 107,867 | B | | | | | | $ | 176,414,475 | |
| | | | | | | | | | | | |
Net asset value, offering and redemption price per share: | | | | | | | | | | | | |
Institutional Class | | $ | 11.26 | | | | | | | $ | 10.02 | |
| | | | | | | | | | | | |
Y Class | | $ | 11.23 | | | | | | | $ | 10.01 | |
| | | | | | | | | | | | |
Investor Class | | $ | 11.15 | | | | | | | $ | 9.98 | |
| | | | | | | | | | | | |
A Class | | $ | 11.15 | | | | | | | | N/A | |
| | | | | | | | | | | | |
A Class (offering price) | | $ | 11.83 | | | | | | | | N/A | |
| | | | | | | | | | | | |
C Class | | $ | 10.94 | | | | | | | | N/A | |
| | | | | | | | | | | | |
Ultra Class | | $ | 11.27 | B | | | | | | $ | 10.02 | |
| | | | | | | | | | | | |
| | | |
† Cost of investments in unaffiliated securities | | $ | 13,839,610 | | | | | | | $ | 106,117,424 | |
‡ Cost of investments in affiliated securities | | $ | 3,966,444 | | | | | | | $ | 26,525,936 | |
^ Cost of foreign currency | | $ | 237,523 | | | | | | | $ | - | |
+ Cost of foreign currency with broker | | $ | - | | | | | | | $ | 640,566 | |
± Proceeds of securities sold short | | $ | 4,340,906 | | | | | | | $ | 85,422,191 | |
1 Cost of payable for foreign currency | | $ | 130,990 | | | | | | | $ | - | |
| A The Fund’s investments in affiliated securities did not have unrealized appreciation (depreciation) at year end. | | | | | |
| B Class commenced operations November 14, 2017 (Note 1). | | | | | | | | | | | | |
See accompanying notes
46
American Beacon FundsSM
Statements of Operations
For the year ended January 31, 2018
| | | | | | | | | | | | |
| | | Grosvenor
Long/Short Fund | | | | | | Numeric Integrated
Alpha Fund | |
Investment income: | | | | | | | | | | | | |
Dividend income from unaffiliated securities (net of foreign taxes)† | | $ | 221,485 | A | | | | | | $ | 1,462,906 | |
Dividend income from affiliated securities | | | 30,098 | | | | | | | | 145,233 | |
Interest income | | | 182,829 | | | | | | | | 1,051,184 | |
| | | | | | | | | | | | |
Total investment income | | | 434,412 | | | | | | | | 2,659,323 | |
| | | | | | | | | | | | |
Expenses: | | | | | | | | | | | | |
Management and sub-advisory fees (Note 2) | | | 338,781 | | | | | | | | 2,536,362 | |
Transfer agent fees: | | | | | | | | | | | | |
Institutional Class (Note 2) | | | 1,426 | | | | | | | | 3 | |
Y Class (Note 2) | | | 173 | | | | | | | | 103 | |
Investor Class | | | 567 | | | | | | | | 1,213 | |
Ultra Class | | | 359 | B | | | | | | | 108,879 | |
Custody and fund accounting fees | | | 123,636 | | | | | | | | 46,819 | |
Professional fees | | | 118,277 | | | | | | | | 61,208 | |
Registration fees and expenses | | | 62,010 | | | | | | | | 116,331 | |
Service fees (Note 2): | | | | | | | | | | | | |
Y Class | | | 49 | | | | | | | | - | |
Investor Class | | | 1,487 | | | | | | | | 253 | |
A Class | | | 286 | | | | | | | | - | |
C Class | | | 303 | | | | | | | | - | |
Distribution fees (Note 2): | | | | | | | | | | | | |
A Class | | | 484 | | | | | | | | - | |
C Class | | | 2,019 | | | | | | | | - | |
Prospectus and shareholder report expenses | | | 14,247 | | | | | | | | 40,155 | |
Trustee fees (Note 2) | | | 1,017 | | | | | | | | 8,377 | |
Prime broker fees | | | 236,121 | | | | | | | | 1,150,935 | |
Dividends and interest on securities sold short | | | 137,850 | | | | | | | | 2,913,291 | |
Other expenses | | | 5,125 | | | | | | | | 16,123 | |
| | | | | | | | | | | | |
Total expenses | | | 1,044,217 | | | | | | | | 7,000,052 | |
| | | | | | | | | | | | |
Net fees waived and expenses (reimbursed) (Note 2) | | | (279,922 | ) | | | | | | | (282,447 | ) |
| | | | | | | | | | | | |
Net expenses | | | 764,295 | | | | | | | | 6,717,605 | |
| | | | | | | | | | | | |
Net investment (loss) | | | (329,883 | ) | | | | | | | (4,058,282 | ) |
| | | | | | | | | | | | |
| | | |
Realized and unrealized gain (loss) from investments: | | | | | | | | | | | | |
Net realized gain from: | | | | | | | | | | | | |
Investments in unaffiliated securitiesC | | | 1,812,506 | | | | | | | | 4,320,888 | |
Purchased options contracts | | | 33,179 | | | | | | | | - | |
Commission recapture (Note 1) | | | - | | | | | | | | 302 | |
Foreign currency transactions | | | (6,288 | ) | | | | | | | 88,943 | |
Forward foreign currency contracts | | | (22,278 | ) | | | | | | | - | |
Futures contracts | | | - | | | | | | | | 1,558,504 | |
Swap agreements | | | 201,842 | | | | | | | | 5,129,443 | |
Written options contracts | | | (8,889 | ) | | | | | | | - | |
Short sales | | | (453,437 | ) | | | | | | | (6,036,234 | ) |
Change in net unrealized appreciation of: | | | | | | | | | | | | |
Investments in unaffiliated securitiesD | | | 894,270 | | | | | | | | 2,690,427 | |
Purchased options contracts | | | 9,639 | | | | | | | | - | |
Foreign currency transactions | | | 20,734 | | | | | | | | 2,409 | |
Forward foreign currency contracts | | | (25,606 | ) | | | | | | | - | |
Futures contracts | | | - | | | | | | | | (7,658 | ) |
Swap agreements | | | 423,501 | | | | | | | | (747,877 | ) |
Written options contracts | | | 96 | | | | | | | | - | |
Short sales | | | (34,899 | ) | | | | | | | (3,006,767 | ) |
| | | | | | | | | | | | |
Net gain from investments | | | 2,844,370 | | | | | | | | 3,992,380 | |
| | | | | | | | | | | | |
Net increase (decrease) in net assets resulting from operations | | $ | 2,514,487 | | | | | | | $ | (65,902 | ) |
| | | | | | | | | | | | |
† Foreign taxes | | $ | 2,242 | | | | | | | $ | 26 | |
A Includes non-recurring dividends of $31,410. | |
B Class commenced operations November 14, 2017 (Note 1). | |
C The Fund did not recognize net realized gains (losses) from the sale of investments in affiliated securities. | |
D The Fund’s investments in affiliated securities did not have a change in unrealized appreciation (depreciation) at year end. | |
See accompanying notes
47
American Beacon FundsSM
Statements of Changes in Net Assets
| | | | | | | | | | | | | | | | | | | | | | | | | | | | |
| | | Grosvenor Long/Short Fund | | | | | | Numeric Integrated Alpha Fund | |
| | | Year Ended
January 31, 2018 | | | | | | Year Ended
January 31, 2017 | | | | | | Year Ended
January 31, 2018 | | | | | | November 1, 2016A
to January 31, 2017 | |
Increase (decrease) in net assets: | | | | | | | | | | | | | | | | | | | | | | | | | | | | |
Operations: | | | | | | | | | | | | | | | | | | | | | | | | | | | | |
Net investment (loss) | | $ | (329,883 | ) | | | | | | $ | (227,373 | ) | | | | | | $ | (4,058,282 | ) | | | | | | $ | (307,501 | ) |
Net realized gain from investments in unaffiliated securities, purchased options contracts, commission recapture, foreign currency transactions, forward foreign currency contracts, futures contracts, swap agreements, written options contracts, and short sales | | | 1,556,635 | | | | | | | | 603,723 | | | | | | | | 5,061,846 | | | | | | | | 270,104 | |
Change in net unrealized appreciation (depreciation) of investments in unaffiliated securities, purchased options contracts, foreign currency transactions, forward foreign currency contracts, futures contracts, swap agreements, written options contracts, and short sales | | | 1,287,735 | | | | | | | | 1,315,597 | | | | | | | | (1,069,466 | ) | | | | | | | 630,015 | |
| | | | | | | | | | | | | | | | | | | | | | | | | | | | |
Net increase (decrease) in net assets resulting from operations | | | 2,514,487 | | | | | | | | 1,691,947 | | | | | | | | (65,902 | ) | | | | | | | 592,618 | |
| | | | | | | | | | | | | | | | | | | | | | | | | | | | |
Distributions to shareholders: | |
Net investment income: | | | | | | | | | | | | | | | | | | | | | | | | | | | | |
Institutional Class | | | (88,770 | ) | | | | | | | - | | | | | | | | - | | | | | | | | - | |
Y Class | | | (2,016 | ) | | | | | | | - | | | | | | | | (71 | ) | | | | | | | - | |
Investor Class | | | (3,387 | ) | | | | | | | - | | | | | | | | - | | | | | | | | - | |
A Class | | | (1,022 | ) | | | | | | | - | | | | | | | | - | | | | | | | | - | |
C Class | | | (1,017 | ) | | | | | | | - | | | | | | | | - | | | | | | | | - | |
Ultra Class | | | (516 | )B | | | | | | | - | | | | | | | | (505,474 | ) | | | | | | | - | |
Net realized gain from investments: | | | | | | | | | | | | | | | | | | | | | | | | | | | | |
Institutional Class | | | (1,261,803 | ) | | | | | | | (309,752 | ) | | | | | | | (1,928 | ) | | | | | | | - | |
Y Class | | | (28,648 | ) | | | | | | | (4,695 | ) | | | | | | | (1,600 | ) | | | | | | | - | |
Investor Class | | | (48,133 | ) | | | | | | | (7,003 | ) | | | | | | | (1,600 | ) | | | | | | | - | |
A Class | | | (14,525 | ) | | | | | | | (3,589 | ) | | | | | | | - | | | | | | | | - | |
C Class | | | (14,710 | ) | | | | | | | (4,279 | ) | | | | | | | - | | | | | | | | - | |
Ultra Class | | | (7,334 | )B | | | | | | | - | | | | | | | | (2,768,627 | ) | | | | | | | - | |
| | | | | | | | | | | | | | | | | | | | | | | | | | | | |
Net distributions to shareholders | | | (1,471,879 | ) | | | | | | | (329,318 | ) | | | | | | | (3,279,300 | ) | | | | | | | - | |
| | | | | | | | | | | | | | | | | | | | | | | | | | | | |
| | | | | | | |
Capital share transactions (Note 10): | | | | | | | | | | | | | | | | | | | | | | | | | | | | |
Proceeds from sales of shares | | | 1,122,598 | | | | | | | | 196,119 | | | | | | | | 156,192,646 | | | | | | | | 63,420,763 | |
Reinvestment of dividends and distributions | | | 1,471,879 | | | | | | | | 329,318 | | | | | | | | 1,498,078 | | | | | | | | - | |
Cost of shares redeemed | | | (303,320 | ) | | | | | | | (861,941 | ) | | | | | | | (35,313,498 | ) | | | | | | | (11,304,984 | ) |
| | | | | | | | | | | | | | | | | | | | | | | | | | | | |
Net increase (decrease) in net assets from capital share transactions | | | 2,291,157 | | | | | | | | (336,504 | ) | | | | | | | 122,377,226 | | | | | | | | 52,115,779 | |
| | | | | | | | | | | | | | | | | | | | | | | | | | | | |
Net increase in net assets | | | 3,333,765 | | | | | | | | 1,026,125 | | | | | | | | 119,032,024 | | | | | | | | 52,708,397 | |
| | | | | | | | | | | | | | | | | | | | | | | | | | | | |
Net assets: | | | | | | | | | | | | | | | | | | | | | | | | | | | | |
Beginning of period | | | 17,166,752 | | | | | | | | 16,140,627 | | | | | | | | 57,708,397 | | | | | | | | 5,000,000 | C |
| | | | | | | | | | | | | | | | | | | | | | | | | | | | |
End of period * | | $ | 20,500,517 | | | | | | | $ | 17,166,752 | | | | | | | $ | 176,740,421 | | | | | | | $ | 57,708,397 | |
| | | | | | | | | | | | | | | | | | | | | | | | | | | | |
*Includes (overdistribution) of net investment income | | $ | (499,885 | ) | | | | | | $ | (191,094 | ) | | | | | | $ | 342,188 | | | | | | | $ | (82,585 | ) |
| | | | | | | | | | | | | | | | | | | | | | | | | | | | |
| A Commencement of operations. | | | | | | | | | | | | | | | | | | | | | | | | | | | | |
| B Class commenced operations November 14, 2017 (Note 1). | | | | | | | | | | | | | | | | | | | | | | | | | |
| C Seed capital. | | | | | | | | | | | | | | | | | | | | | | | | | | | | |
See accompanying notes
48
American Beacon FundsSM
Notes to Financial Statements
January 31, 2018
1. Organization and Significant Accounting Policies
American Beacon Funds (the “Trust”), is organized as a Massachusetts business trust. The Funds, each a series within the Trust, are registered under the Investment Company Act of 1940 (the “Act”), as amended, as non-diversified, open-end management investment companies. As of January 31, 2018, the Trust consists of thirty-three active series, two of which are presented in this filing: American Beacon Grosvenor Long/Short Fund and American Beacon Numeric Integrated Alpha Fund (collectively, the “Funds” and each individually a “Fund”). The remaining thirty-one active series are reported in separate filings.
American Beacon Advisors, Inc. (the “Manager”) is a wholly-owned subsidiary of Resolute Investment Managers, Inc., which is indirectly owned by investment funds affiliated with Kelso & Company, L.P. and Estancia Capital Management, LLC, and was organized in 1986 to provide business management, advisory, administrative, and asset management consulting services to the Trust and other investors.
Class Disclosure
On November 14, 2017, the Grosvenor Long/Short Fund created the Ultra Class, a new class made available for sale to large institutional investors pursuant to an amendment to the Fund’s registration statement filed with the U.S. Securities and Exchange Commission. Refer to the Fund’s prospectus for more details.
Each Fund has multiple classes of shares designed to meet the needs of different groups of investors; however, not all of the Funds offer all classes. The following table sets forth the differences amongst the classes:
| | | | | | |
Class | | Eligible Investors | | Minimum Initial
Investments | |
| Institutional | | Large institutional investors - sold directly or through intermediary channels. | | $ | 250,000 | |
| Y Class | | Large institutional retirement plan investors - sold directly or through intermediary channels. | | $ | 100,000 | |
| Investor | | All investors using intermediary organizations such as broker-dealers or retirement plan sponsors. | | $ | 2,500 | |
| A Class | | All investors who invest through intermediary organizations, such as broker-dealers or third party administrator. Retail investors who invest directly through a financial intermediary such as a broker, bank, or registered investment advisor, which may include a front-end sales charge and a contingent deferred sales charge (“CDSC”). | | $ | 2,500 | |
| C Class | | Retail investors who invest directly through a financial intermediary such as a broker or through employee directed benefit plans with applicable sales charges, which may include CDSC. | | $ | 1,000 | |
| Ultra | | Large institutional investors - sold directly or through intermediary channels. | | $ | 350,000,000 | |
Each class offered by the Trust has equal rights as to assets and voting privileges. Income and non-class specific expenses are allocated daily to each class on the basis of the relative net assets. Realized and unrealized capital gains and losses of each class are allocated daily based on the relative net assets of each class of the respective Fund. Class specific expenses, where applicable, currently include service, distribution, transfer agent fees, and sub-transfer agent fees that vary amongst the classes as described more fully in Note 2.
Recently Adopted Accounting Pronouncements
In October 2016, the SEC adopted amendments to rules under the Investment Company Act of 1940 (“final rules”) intended to modernize the reporting and disclosure of information by registered investment companies. The final rules amend Regulation S-X and require funds to provide standardized, enhanced derivative disclosure in fund financial statements in a format designed for individual investors. The amendments to Regulation S-X also update the disclosures for other investments and investments in and advances to affiliates and amend the rules regarding the general form and content of fund financial statements. The compliance date for the amendments to Regulation S-X is August 1, 2017, and has been adopted accordingly.
49
American Beacon FundsSM
Notes to Financial Statements
January 31, 2018
Significant Accounting Policies
The following is a summary of significant accounting policies, consistently followed by the Funds in preparation of the financial statements. The Funds are considered investment companies and accordingly, follow the investment company accounting and reporting guidance of the Financial Accounting Standards Board Accounting Standard Codification Topic 946, Financial Services – Investment Companies, a part of Generally Accepted Accounting Principles (“U.S. GAAP”).
Security Transactions and Investment Income
Security transactions are recorded on the trade date of the security purchase or sale. The Funds may purchase securities with delivery or payment to occur at a later date. At the time the Funds enter into a commitment to purchase a security, the transaction is recorded, and the value of the security is reflected in the Net Asset Value (“NAV”). The value of the security may vary with market fluctuations.
Dividend income, net of foreign taxes, is recorded on the ex-dividend date, except certain dividends from foreign securities which are recorded as soon as the information is available to the Funds. Interest income is earned from settlement date, recorded on the accrual basis, and adjusted, if necessary, for accretion of discounts and amortization of premiums. For financial and tax reporting purposes, realized gains and losses are determined on the basis of specific lot identification.
Commission Recapture
The Funds established brokerage commission recapture arrangements with certain brokers or dealers. If a Fund’s investment advisor chooses to execute a transaction through a participating broker, the broker rebates a portion of the commission back to the Funds. Any collateral benefit received through participation in the commission recapture program is directed exclusively to the Funds. This amount is reported with the net realized gain in the Fund’s Statement of Operations, if applicable.
Currency Translation
All assets and liabilities initially expressed in foreign currency values are converted into U.S. dollar values at the mean of the bid and ask prices of such currencies against U.S. dollars as last quoted by a recognized dealer. Income, expenses, and purchases and sales of investments are translated into U.S. dollars at the rate of the exchange prevailing on the respective dates of such transactions. The effect of changes in foreign currency exchange rates on investments is separately identified from the fluctuations arising from changes in market values of securities held and is reported with all other foreign currency gains and losses on the Funds’ Statements of Operations.
Distributions to Shareholders
Distributions, if any, of net investment income are generally paid at least annually and recorded on the ex-dividend date. Distributions, if any, of net realized capital gains are generally paid at least annually and recorded on the ex-dividend date. Dividends to shareholders are determined in accordance with federal income tax regulations, which may differ in amount and character from net investment income and realized gains recognized for purposes of U.S. GAAP. To the extent necessary to fully distribute capital gains, the Funds may designate earnings and profits distributed to shareholders on the redemption of shares.
Allocation of Income, Trust Expenses, Gains, and Losses
Investment income, realized and unrealized gains and losses from investments of the Funds are allocated daily to each class of shares based upon the relative proportion of net assets of each class to the total net assets of the Funds. Expenses directly charged or attributable to any Fund will be paid from the assets of the Fund.
50
American Beacon FundsSM
Notes to Financial Statements
January 31, 2018
Generally, expenses of the Trust will be allocated among and charged to the assets of the Funds on a basis that the Trust’s Board of Trustees (the “Board”) deems fair and equitable, which may be based on the relative net assets of the Funds or nature of the services performed and relative applicability to the Funds.
Use of Estimates
The preparation of financial statements in conformity with U.S. GAAP requires management to make estimates and assumptions that affect the amounts reported in the financial statements and accompanying notes. Actual results may differ from those estimated.
Other
Under the Trust’s organizational documents, its officers and trustees are indemnified against certain liabilities arising out of the performance of their duties to the Trust. In the normal course of business, the Trust enters into contracts that provide indemnification to the other party or parties against potential costs or liabilities. The Trust’s maximum exposure under these arrangements is dependent on claims that may be made in the future and, therefore, cannot be estimated. The Trust has had no prior claims or losses pursuant to any such agreement.
2. Transactions with Affiliates
Management and Investment Sub-Advisory Agreements
The Grosvenor Long/Short Fund operates in a manager of managers structure. The Manager has engaged Grosvenor Capital Management, L.P., an unaffiliated alternative investment advisory firm, to serve as the Fund’s lead Sub-Advisor (“Lead Sub-Advisor”). The Fund and the Manager have received an exemptive order from the Securities and Exchange Commission (“SEC”) that permits the Fund, subject to certain conditions and approval by the Board, to hire and replace Sub-Advisors (but not the Lead Sub-Advisor) that are unaffiliated with the Manager without approval of shareholders. The Manager has ultimate responsibility, subject to oversight by the Board, to oversee the Lead Sub-Advisor and Sub-Advisors and recommend their hiring, termination and replacement. The order also exempts the Fund from disclosing the advisory fees paid by the Fund to individual sub-advisors that are unaffiliated with the Manager in various documents filed with the SEC and provided to shareholders. Instead, the fees payable to unaffiliated sub-advisors are aggregated, and fees payable to sub-advisors that are affiliated with the Manager, if any, would be aggregated with fees payable to the Manager. Disclosure of the separate fees paid to an affiliated sub-advisor would be required. Whenever a sub-advisor change is proposed in reliance on the order, in order for the change to be implemented, the Board must approve the change. In addition, the Fund is required to provide shareholders with certain information regarding any new sub-advisor within 90 days of the hiring of any new sub-advisor. The Fund’s Sub-Advisors are set forth below.
| | • | | Basswood Capital Management, LLC |
| | • | | Electron Capital Partners, LLC (Effective 12/29/2017) |
| | • | | Impala Asset Management LLC |
| | • | | Incline Global Management, LLC |
| | • | | Pine River Capital Management L.P. (Terminated 11/17/2017) |
| | • | | River Canyon Fund Management LLC (Terminated 12/31/2017) |
The Grosvenor Long/Short Fund and the Manager are parties to a Management Agreement that obligates the Manager to provide the Fund with management, administrative, and supervisory services. The Manager is paid a management fee as compensation that is calculated and accrued daily equal to 1.85% of the Fund’s average daily net assets. As part of the fee, the Manager receives an annualized management fee equal to 0.35%. The remain portion of the fee is used by the Manager to compensate the Lead Sub-Advisor pursuant to a Lead Investment Advisory Agreement between the Trust, on behalf of the Fund, and the Manager. The fee is calculated and accrued daily equal to 1.50% of the Funds average daily assets. The Lead Sub-Advisor pays the fees of each Sub-Advisor.
51
American Beacon FundsSM
Notes to Financial Statements
January 31, 2018
The Numeric Integrated Alpha Fund and the Manager are parties to a Management Agreement that obligates the Manager to provide the Fund with management, administrative, and supervisory services. The Manager receives an annualized management fee based on a percentage of the Numeric Integrated Alpha Fund’s average daily net assets that is calculated and accrued daily in accordance to the following schedule:
| | | | |
First $1 billion | | | 0.425 | % |
Next $4 billion | | | 0.40 | % |
Next $5 billion | | | 0.375 | % |
Over $10 billion | | | 0.35 | % |
The Trust, on behalf of the Numeric Integrated Alpha Fund, and the Manager have entered into an Investment Advisory Agreement with Numeric Investors LLC (the “Sub-Advisor”) pursuant to which the Fund has agreed to pay an annualized sub-advisory fee that is calculated and accrued daily based on the Fund’s average daily net assets according to the following schedule:
| | | | |
First $800 million | | | 1.35 | % |
Over $800 million | | | 1.30 | % |
The Management and Sub-Advisory Fees paid by the Funds for the year ended January 31, 2018 were as follows:
Grosvenor Long/Short Fund
| | | | | | | | | | | | |
| | | Effective Fee Rate | | | | | | Amount of Fees Paid | |
Management Fees | | | 0.35 | % | | | | | | $ | 64,094 | |
Sub-Advisor Fees | | | 1.50 | % | | | | | | | 274,687 | |
| | | | | | | | | | | | |
Total | | | 1.85 | % | | | | | | $ | 338,781 | |
| | | | | | | | | | | | |
Numeric Integrated Alpha Fund
| | | | | | | | | | | | |
| | | Effective Fee Rate | | | | | | Amount of Fees Paid | |
Management Fees | | | 0.43 | % | | | | | | $ | 607,298 | |
Sub-Advisor Fees | | | 1.35 | % | | | | | | | 1,929,064 | |
| | | | | | | | | | | | |
Total | | | 1.78 | % | | | | | | $ | 2,536,362 | |
| | | | | | | | | | | | |
Distribution Plans
The Funds, except for the A and C Classes of the Funds, have adopted a “defensive” Distribution Plan (the “Plan”) in accordance with Rule 12b-1 under the Act, pursuant to which no separate fees may be charged to the Funds for distribution purposes. However, the Plan authorizes the management fee received by the Manager and the investment advisors hired by the Manager to be used for distribution purposes. Under this Plan, the Funds do not intend to compensate the Manager or any other party, either directly or indirectly, for the distribution of Fund shares.
Separate Distribution Plans (the “Distribution Plans”) have been adopted pursuant to Rule 12b-1 under the Act for the A and C Classes of the Funds. Under the Distribution Plans, as compensation for distribution assistance, the Manager receives an annual fee of 0.25% of the average daily net assets of the A Class and 1.00% of the average daily net assets of the C Class. The fee will be payable without regard to whether the amount of the fee is more or less than the actual expenses incurred in a particular month by the Manager for distribution assistance.
Service Plans
The Manager and the Trust entered into Service Plans that obligate the Manager to oversee additional shareholder servicing of the Y, Investor, A, and C Classes of the Grosvenor Long/Short Fund and the Investor Class
52
American Beacon FundsSM
Notes to Financial Statements
January 31, 2018
of the Numeric Integrated Alpha Fund. As compensation for performing the duties required under the Service Plans, the Manager receives an annualized fee of up to 0.10% of the average daily net assets of the Y Class, up to 0.25% of the average daily net assets of the A and C Classes, and up to 0.375% of the average daily net assets of the Investor Class of the Funds. Effective April 1, 2017, the Fund terminated the service plan for the Y Class.
Sub-Transfer Agent Fees
The Manager has entered into agreements, which include servicing agreements, with financial intermediaries that provide recordkeeping, processing, shareholder communications and other services to customers of the intermediaries that hold positions in the Institutional Class of the Grosvenor Long/Short Fund and the Institutional and Y Classes of the Numeric Integrated Alpha Fund and has agreed to compensate the intermediaries for providing these services. Effective April 1, 2017, the Grosvenor Long/Short Fund agreed to compensate the intermediaries for providing services to the Y Class. Intermediaries transact with the Fund primarily through the use of omnibus accounts on behalf of their customers who hold positions in the Fund. Certain services would have been provided by the Funds’ transfer agent and other service providers if the shareholders’ accounts were maintained directly by the Funds’ transfer agent. Accordingly, the Funds, pursuant to Board approval, have agreed to reimburse the Manager for certain non-distribution shareholder services provided by financial intermediaries for the Institutional and Y Classes. The reimbursement amounts (sub-transfer agent fees) paid to the Manager are subject to a fee limit of up to 0.10% of an intermediary’s average net assets in the Institutional and Y Classes on an annual basis. During the year ended January 31, 2018, the sub-transfer agent fees, as reflected in “Transfer agent fees” on the Statements of Operations, were as follows:
| | | | |
Fund | | Sub-Transfer Agent Fees | |
Grosvenor Long/Short | | $ | 1,442 | |
Numeric Integrated Alpha | | | 85 | |
As of January 31, 2018, the Funds owed the Manager the following reimbursement of sub-transfer agent fees, as reflected in “Transfer agent fees payable” on the Statements of Assets and Liabilities:
| | | | |
Fund | | Reimbursement
Sub-Transfer Agent Fees | |
Grosvenor Long/Short | | $ | 98 | |
Numeric Integrated Alpha | | | 9 | |
Investments in Affiliated Funds
The Funds may invest in the American Beacon U.S. Government Money Market Select Fund (the “USG Select Fund. The Funds and the USG Select Fund have the same investment advisor and therefore, are considered to be affiliated. The Manager serves as investment advisor to the USG Select Fund and receives management fees and administrative fees totaling 0.10% of the average daily net assets of the USG Select Fund.
| | | | |
Fund | | Direct Investments in
USG Select Fund | |
Grosvenor Long/Short | | $ | 3,365 | |
Numeric Integrated Alpha | | | 16,404 | |
Interfund Credit Facility
Pursuant to an exemptive order issued by the Securities and Exchange Commission (“SEC”), the Funds, along with other registered investment companies having management contracts with the Manager, may participate in a credit facility whereby each Fund, under certain conditions, is permitted to lend money directly to and borrow directly from other participating Funds for temporary purposes. The interfund credit facility is advantageous to the Funds because it provides added liquidity, and eliminates the need to maintain higher cash balances to meet redemptions. This situation could arise when shareholder redemptions exceed anticipated volumes and certain
53
American Beacon FundsSM
Notes to Financial Statements
January 31, 2018
funds have insufficient cash on hand to satisfy such redemptions or when sales of securities do not settle as expected, resulting in a cash shortfall for a fund. When a Fund liquidates portfolio securities to meet redemption requests, they often do not receive payment in settlement for up to two days (or longer for certain foreign transactions). Redemption requests normally are satisfied on the next business day. The credit facility provides a source of immediate, short-term liquidity pending settlement of the sale of portfolio securities. The credit facility is administered by a credit facility team consisting of professionals from the Manager’s asset management, compliance, and accounting areas who report the activities of the credit facility to the Board. During the year ended January 31, 2018, the Funds did not utilize the credit facility.
Expense Reimbursement Plan
The Manager contractually agreed to reduce fees and/or reimburse expenses for the classes of the Funds to the extent that total operating expenses exceed the Funds’ expense cap. During the year ended January 31, 2018, the Manager waived and/or reimbursed expenses as follows:
| | | | | | | | | | | | | | | | | | |
| | | | | Expense Cap | | | | | | | | | Expiration of
Reimbursed
Expenses | |
Fund | | Class | | 2/1/2017 -
1/31/2018 | | | Reimbursed
Expenses | | | (Recouped)
Expenses | | |
Grosvenor Long/Short | | Institutional | | | 2.10 | % | | $ | 258,274 | | | $ | - | | | | 2021 | |
Grosvenor Long/Short | | Y | | | 2.20 | % | | | 5,609 | | | | - | | | | 2021 | |
Grosvenor Long/Short | | Investor | | | 2.48 | % | | | 9,109 | | | | - | | | | 2021 | |
Grosvenor Long/Short | | A | | | 2.50 | % | | | 2,934 | | | | - | | | | 2021 | |
Grosvenor Long/Short | | C | | | 3.25 | % | | | 3,007 | | | | - | | | | 2021 | |
Grosvenor Long/Short | | Ultra | | | 1.99 | % | | | 989 | | | | - | | | | 2021 | |
Numeric Integrated Alpha | | Institutional | | | 1.95 | % | | | 26 | | | | - | | | | 2021 | |
Numeric Integrated Alpha | | Y | | | 2.05 | % | | | 20 | | | | - | | | | 2021 | |
Numeric Integrated Alpha | | Investor | | | 2.33 | % | | | 1,099 | | | | - | | | | 2021 | |
Numeric Integrated Alpha | | Ultra | | | 1.85 | % | | | 281,302 | | | | - | | | | 2021 | |
Of these amounts, $89,478 and $17,975 were disclosed as a receivable from the Manager on the Statements of Assets and Liabilities at January 31, 2018 for the Grosvenor Long/Short Fund and Numeric Integrated Alpha Fund, respectively. The Funds have adopted an Expense Reimbursement Plan whereby the Manager may seek repayment of such fee reductions and expense reimbursements. Under the policy, the Manager can be reimbursed by the Funds for any contractual or voluntary fee reductions or expense reimbursements if reimbursement to the Manager (a) occurs within three years after the Manager’s own waiver or reimbursement and (b) does not cause the Funds’ annual operating expenses to exceed the lesser of the contractual percentage limit in effect at the time of the waiver/reimbursement or time of recoupment. The reimbursed expenses listed above will expire in 2021. The Funds did not record a liability for potential reimbursements due to the current assessment that reimbursements are unlikely. The carryover of excess expenses potentially reimbursable to the Manager are as follows:
| | | | | | | | | | | | | | | | |
Fund | | Recouped
Expenses | | | Excess Expense
Carryover | | | Expired Expense
Carryover | | | Expiration of
Reimbursed
Expenses | |
Grosvenor Long/Short | | $ | - | | | $ | 426,070 | | | $ | - | | | | 2019 | |
Grosvenor Long/Short | | | - | | | | 281,244 | | | | - | | | | 2020 | |
Numeric Integrated Alpha | | | - | | | | 189,564 | | | | - | | | | 2020 | |
Sales Commissions
The Funds’ distributor, Foreside Fund Services, LLC (“Foreside”), may receive a portion of A Class sales charges from broker dealers and it may be used to offset distribution related expenses. During the year ended January 31, 2018, there were no fees collected by Foreside for the sale of Class A Shares of the Funds.
A CDSC of 0.50% will be deducted with respect to Class A Shares on certain purchases of $1,000,000 or more that are redeemed in whole or part within 18 months of purchase, unless waived as discussed in the Funds’
54
American Beacon FundsSM
Notes to Financial Statements
January 31, 2018
Prospectus. Any applicable CDSC will be 0.50% of the lesser of the original purchase price or the value of the redemption of the Class A Shares redeemed. During the year ended January 31, 2018, there were no CDSC fees collected for Class A Shares of the Funds.
A CDSC of 1.00% will be deducted with respect to Class C Shares redeemed within 12 months of purchase, unless waived as discussed in the Funds’ Prospectus. Any applicable CDSC will be 1.00% of the lesser of the original purchase price or the value of the redemption of the Class C Shares redeemed. During the year ended January 31, 2018, there were no CDSC fees collected for Class C Shares of the Funds.
Trustee Fees and Expenses
As compensation for their service to the Trust, the American Beacon Select Funds and the American Beacon Institutional Funds Trust, each Trustee receives an annual retainer of $120,000, plus $10,000 for each Board meeting attended in person or via teleconference, $2,500 for attendance by Committee members at meetings of the Audit Committee and the Investment Committee, and $1,500 for attendance by Committee members at meetings of the Nominating and Governance Committee, plus reimbursement of reasonable expenses incurred in attending Board meetings, Committee meetings, and relevant educational seminars. The Trustees also may be compensated for attendance at special Board and/or Committee meetings from time to time. The Board Chairman receives an additional annual retainer of $50,000 as well as a $2,500 fee each quarter for his attendance at the committee meetings. Effective January 1, 2018, the Board Vice Chair receives an additional annual retainer of $10,000. The Chairpersons of the Audit Committee and the Investment Committee each receive an additional annual retainer of $25,000 and the Chairman of the Nominating and Governance Committee receives an additional annual retainer of $10,000. These expenses are allocated on a prorated basis to each Fund of the Trusts according to its respective net assets.
Concentration of Ownership
From time to time, the Funds may have a concentration of one or more accounts constituting a significant percentage of shares outstanding. Investment activities by holders of accounts that represent a significant ownership of more than 5% of the Funds’ outstanding shares could have a material impact on the Funds. As of January 31, 2018, based on management’s evaluation of the shareholder account base, one account in the Grosvenor Long/Short Fund has been identified as representing an affiliated significant ownership of approximately 59% and one unaffiliated account of approximately 30% of the Fund’s outstanding shares.
3. Security Valuation and Fair Value Measurements
Investments are valued at the close of the New York Stock Exchange (the “Exchange”), normally at 4:00 p.m. Eastern Time, each day that the Exchange is open for business. Equity securities, including exchange-traded funds (“ETFs”) for which market quotations are available are valued at the last sale price or official closing price (closing bid price or last evaluated quote if no sale has occurred) on the primary market or exchange on which they trade.
Investments in open-end mutual funds are valued at the closing NAV per share of the mutual fund on the day of valuation.
Securities for which the market prices are not readily available or are not reflective of the fair value of the security, as determined by the Manager, will be priced at fair value following procedures approved by the Board.
For valuation purposes, the last quoted prices of non-U.S. equity securities may be adjusted under the circumstances described below. If the Manager determines that developments between the close of a foreign market and the close of the Exchange will, in its judgment, materially affect the value of some or all of a fund’s portfolio securities, the Manager will adjust the previous closing prices to reflect what it believes to be the fair value of the securities as of the close of the Exchange. In deciding whether it is necessary to adjust closing prices
55
American Beacon FundsSM
Notes to Financial Statements
January 31, 2018
to reflect fair value, the Manager reviews a variety of factors, including developments in foreign markets, the performance of U.S. securities markets, and the performance of instruments trading in U.S. markets that represent foreign securities and baskets of foreign securities. In addition, the Funds may use fair value pricing for securities primarily traded in non-U.S. markets because most foreign markets close well before the Funds’ pricing time of 4:00 p.m. Eastern Time. The earlier close of these foreign markets gives rise to the possibility that significant events, including broad market moves, may have occurred in the interim and may materially affect the value of those securities. These securities are fair valued using a pricing service and are categorized as Level 2 in the fair value hierarchy. The pricing service, using methods approved by the Board, considers the correlation of the trading patterns of the foreign security to intraday trading in the U.S. markets, based on indices of domestic securities and other appropriate indicators such as prices of relevant American Depository Receipts (ADRs) and futures contracts. The Valuation Committee, established by the Board, may also fair value securities in other situations, such as when a particular foreign market is closed but a Fund is open. The Funds use outside pricing services to provide closing prices and information to evaluate and/or adjust those prices. As a means of evaluating its security valuation process, the Valuation Committee routinely compares closing prices, the next day’s opening prices in the same markets, and adjusted prices.
Other investments, including restricted securities and those financial instruments for which the above valuation procedures are inappropriate or are deemed not to reflect fair value, are stated at fair value, as determined in good faith by the Manager’s Valuation Committee, pursuant to procedures established by the Board.
Futures contracts are valued based upon their quoted daily settlement prices. Upon entering into a futures contract, the Funds are required to deposit with their futures broker, an amount of cash or U.S. Government and Agency Obligations in accordance with the initial margin requirements of the broker or exchange. Futures contracts are marked-to-market daily and an appropriate payable or receivable for the change in value (“variation margin”) is recorded by the Funds. Gains or losses are recognized, but not considered realized until the contracts expire or are closed. Futures contracts involve, to varying degrees, risk of loss in excess of the variation margin disclosed on the Statements of Assets and Liabilities.
Forward foreign currency contracts are valued using the prevailing forward exchange rate and are categorized as Level 2 in the fair value hierarchy. Swap contracts are valued at prices furnished by independent swap dealers or by an independent pricing service and are generally categorized as a Level 2 in the fair value hierarchy. Forward foreign currency contracts and swap contracts involve, to varying degrees, risk of loss in excess of the unrealized appreciation (depreciation) on the Statement of Assets and Liabilities.
Valuation Inputs
Various inputs may be used to determine the fair value of the Funds’ investments. These inputs are summarized in three broad levels for financial statement purposes. The inputs or methodologies used to value securities are not necessarily an indication of the risk associated with investing in those securities.
| | | | |
| Level 1 | | - | | Quoted prices in active markets for identical securities. |
| | |
| Level 2 | | - | | Prices determined using other significant observable inputs. These may include quoted prices for similar securities, interest rates, prepayment speeds, credit risk, and others. |
| | |
| Level 3 | | - | | Prices determined using other significant unobservable inputs. Unobservable inputs reflect the Fund’s own assumptions about the factors market participants would use in pricing an investment. |
Level 1 and Level 2 trading assets and trading liabilities, at fair value
Common stocks, ETFs, and financial derivative instruments, such as futures contracts or options that are traded on a national securities exchange, are stated at the last reported sale or settlement price on the day of valuation. To the extent these securities are actively traded and valuation adjustments are not applied, they are categorized as Level 1 of the fair value hierarchy. Valuation adjustments may be applied to certain securities that
56
American Beacon FundsSM
Notes to Financial Statements
January 31, 2018
are solely traded on a foreign exchange to account for the market movement between the close of the foreign market and the close of the Exchange. These securities are valued using pricing service providers that consider the correlation of the trading patterns of the foreign security to the intraday trading in the U.S. markets for investments. Securities using these valuation adjustments are categorized as Level 2 of the fair value hierarchy. Preferred securities and other equities traded on inactive markets or valued by reference to similar instruments are generally categorized as Level 2 of the fair value hierarchy.
Investments in registered open-end investment management companies will be valued based upon the NAVs of such investments and are categorized as Level 1 of the fair value hierarchy.
Over-the-counter (“OTC”) financial derivative instruments, such as foreign currency contracts derive their value from underlying asset prices, indices, reference rates, and other inputs or a combination of these factors. These contracts are normally valued on the basis of broker dealer quotations or pricing service providers. Depending on the product and the terms of the transaction, the fair value of the financial derivative contracts can be estimated by a pricing service provider using a series of techniques, including simulation pricing models. The pricing models use inputs that are observed from actively quoted markets such as issuer details, indices, spreads, interest rates, curves, dividends, and exchange rates. Financial derivatives that use similar valuation techniques and inputs as described above are categorized as Level 2 of the fair value hierarchy.
Level 3 trading assets and trading liabilities, at fair value
The valuation techniques and significant inputs used in determining the fair values of financial instruments classified as Level 3 of the fair value hierarchy are as follows.
Securities and other assets for which market quotes are not readily available are valued at fair value as determined in good faith by the Board or persons acting at their direction and may be categorized as Level 3 of the fair value hierarchy.
Market quotes are considered not readily available in circumstances where there is an absence of current or reliable market-based data (e.g., trade information or broker quotes), including where events occur after the close of the relevant market, but prior to the Exchange close, that materially affect the values of the Fund’s securities or assets. In addition, market quotes are considered not readily available when, due to extraordinary circumstances, the exchanges or markets on which the securities trade, do not open for trading for the entire day and no other market prices are available. The Board has delegated to the Manager the responsibility for monitoring significant events that may materially affect the fair values of a Fund’s securities or assets and for determining whether the value of the applicable securities or assets should be re-evaluated in light of such significant events.
The Board has adopted methods for valuing securities and other assets in circumstances where market quotes are not readily available, and has delegated the responsibility for applying the valuation methods to the Manager. For instances in which daily market quotes are not readily available, investments may be valued pursuant to guidelines established by the Board. In the event that the security or asset cannot be valued, pursuant to one of the valuation methods established by the Board, the fair value of the security or asset will be determined in good faith by the Valuation Committee, generally based upon recommendations provided by the Manager.
When a Fund uses fair valuation methods applied by the Manager that use significant unobservable inputs to determine its NAV, the securities priced using this methodology are categorized as Level 3 of the fair value hierarchy. These methods may require subjective determinations about the value of a security. While the Trust’s policy is intended to result in a calculation of the Fund’s NAV that fairly reflects security values as of the time of pricing, the Trust cannot guarantee that values determined by the Board or persons acting at their direction would accurately reflect the price that a Fund could obtain for a security if it were to dispose of that security as of the time of pricing (for instance, in a forced or distressed sale). The prices used by a Fund may differ from the value that would be realized if the securities were sold.
57
American Beacon FundsSM
Notes to Financial Statements
January 31, 2018
4. Securities and Other Investments
American Depositary Receipts (“ADRs”)
ADRs are depositary receipts for foreign issuers in registered form traded in U.S. securities markets. Depositary receipts may not be denominated in the same currency as the securities into which they may be converted. Investing in depositary receipts entails substantially the same risks as direct investment in foreign securities. There is generally less publicly available information about foreign companies and there may be less governmental regulation and supervision of foreign stock exchanges, brokers, and listed companies. In addition, such companies may use different accounting and financial standards (and certain currencies may become unavailable for transfer from a foreign currency), resulting in the Fund’s possible inability to convert immediately into U.S. currency proceeds realized upon the sale of portfolio securities of the affected foreign companies. In addition, the Funds may invest in unsponsored depositary receipts, the issuers of which are not obligated to disclose material information about the underlying securities to investors in the United States. Ownership of unsponsored depositary receipts may not entitle the Funds to the same benefits and rights as ownership of a sponsored depositary receipt or the underlying security.
Common Stock
Common stock generally takes the form of shares in a corporation which represent an ownership interest. It ranks below preferred stock and debt securities in claims for dividends and for assets of the company in a liquidation or bankruptcy. The value of a company’s common stock may fall as a result of factors directly relating to that company, such as decisions made by its management or decreased demand for the company’s products or services. A stock’s value may also decline because of factors affecting not just the company, but also companies in the same industry or sector. The price of a company’s stock may also be affected by changes in financial markets that are relatively unrelated to the company, such as changes in interest rates, currency exchange rates or industry regulation. Companies that elect to pay dividends on their common stock generally only do so after they invest in their own business and make required payments to bondholders and on other debt and preferred stock. Therefore, the value of a company’s common stock will usually be more volatile than its bonds, other debt and preferred stock. Common stock may be exchange-traded or OTC. OTC stock may be less liquid than exchange-traded stock.
Foreign Securities
The Funds may invest in U.S. dollar-denominated and non-U.S. dollar denominated equity and debt securities of foreign issuers and foreign branches of U.S. banks, including negotiable CDs, bankers’ acceptances, and commercial paper. Foreign issuers are issuers organized and doing business principally outside the United States and include corporations, banks, non-U.S. governments, and quasi-governmental organizations. While investments in foreign securities may be intended to reduce risk by providing further diversification, such investments involve sovereign and other risks, in addition to the credit and market risks normally associated with domestic securities. These additional risks include the possibility of adverse political and economic developments (including political or social instability, nationalization, expropriation, or confiscatory taxation); the potentially adverse effects of unavailability of public information regarding issuers, different governmental supervision and regulation of financial markets, reduced liquidity of certain financial markets, and the lack of uniform accounting, auditing, and financial reporting standards or the application of standards that are different or less stringent than those applied in the United States; different laws and customs governing securities tracking; and possibly limited access to the courts to enforce the Funds’ rights as an investor.
Illiquid and Restricted Securities
The Funds may invest in securities that are subject to legal or contractual restrictions on resale. These securities may be sold privately, but are required to be registered or exempted from such registration before being
58
American Beacon FundsSM
Notes to Financial Statements
January 31, 2018
sold to the public. Private placement securities are generally considered to be restricted except for those securities traded between qualified institutional investors under the provisions of Rule 144A of the Securities Act of 1933 (the “Securities Act”). Illiquid securities have included securities that have not been registered under the Securities Act, securities that are otherwise not readily marketable, and repurchase agreements having a remaining maturity of longer than seven calendar days. Disposal of both illiquid and restricted securities may involve time-consuming negotiations and expenses, and prompt sale at an acceptable price may be difficult to achieve. Restricted securities outstanding during the year ended January 31, 2018 are disclosed in the Notes to the Schedules of Investments.
Regulation S under the Securities Act permits the sale abroad of securities that are not registered for sale in the United States and includes a provision for U.S. investors, such as the Funds, to purchase such unregistered securities if certain conditions are met.
Other Investment Company Securities and Other Exchange-Traded Products
The Funds may invest in shares of other investment companies, including open-end funds, closed-end funds, business development companies, ETFs, unit investment trusts, and other investment companies of the Trust. The Funds may invest in investment company securities advised by the Manager or a sub-advisor. Investments in the securities of other investment companies may involve duplication of advisory fees and certain other expenses. By investing in another investment company, the Funds become a shareholder of that investment company. As a result, the Funds’ shareholders indirectly will bear the Funds’ proportionate share of the fees and expenses paid by shareholders of the other investment company, in addition to the fees and expenses the Funds’ shareholders directly bear in connection with the Funds’ own operations. These other fees and expenses are reflected as Acquired Fund Fees and Expenses and are included in the Fees and Expenses Table for the Funds in their Prospectus, if applicable. Investments in other investment companies may involve the payment of substantial premiums above the value of such issuer’s portfolio securities.
Real Estate Investment Trusts
The Funds may own shares of real estate investment trusts (“REITs”) which report information on the source of their distributions annually. The Funds re-characterize distributions received from REIT investments based on information provided by the REITs into the following categories: ordinary income, long-term capital gains, and return of capital. If information is not available on a timely basis from the REITs, the re-characterization will be estimated based on available information, which may include the previous year allocation. If new or additional information becomes available from the REITs at a later date, a re-characterization will be made the following year.
Short Sales
The Funds may enter into short sale transactions. A short sale is a transaction in which a Fund sells a security it does not own in anticipation of a decline in the market price of the security. Securities sold in short sale transactions and the dividends and interest payable on such securities, if any, are reflected as a liability on the Statement of Assets and Liabilities. A Fund is obligated to deliver the security at the market price at the time the short position is closed. The risk of loss on a short sale transaction is theoretically unlimited, because there is no limit to the cost of replacing the security sold short, whereas losses from purchase transactions cannot exceed the total amount invested. As of January 31, 2018, short positions were held by the Funds and are detailed in the Schedules of Investments.
5. Financial Derivative Instruments
The Funds may utilize derivative instruments to gain market exposure on cash balances or reduce market exposure in anticipation of liquidity needs. When considering the Funds’ use of derivatives, it is important to note that the Funds do not use derivatives for the purpose of creating financial leverage.
59
American Beacon FundsSM
Notes to Financial Statements
January 31, 2018
Contracts for Difference
The Funds may utilize equity-related securities including total return swaps based on individual companies (also referred to as contracts for difference (“CFDs”)). A CFD is a form of equity swap in which its value is based on the fluctuating value of some underlying asset (e.g., shares of a particular stock or a stock index). A CFD is a contract between two parties, buyer and seller, stipulating that the seller will pay to the buyer the difference between the nominal value of the underlying stock at the opening of the contract and the stock’s value at the close of the contract. The size of the contract and the contract’s expiration date are typically negotiated by the parties to the CFD transaction. CFDs enable the Funds to take short or long positions on an underlying stock and thus potentially capture gains on movements in the share prices of the stock without the need to own the underlying stock. By entering into a CFD transaction, the Fund could incur losses because it would face many of the same types of risks as owning the underlying equity securities directly as well as the other risks associated with the investments in swaps. As with other types of swap transactions, CFDs also carry counterparty risk, i.e., the risk that the counterparty to the CFD transaction may be unable or unwilling to make payments or to otherwise honor its financial obligations under the terms of the contract. If the counterparty were to do so, the value of the contract, and of the Funds’ shares, may be reduced. Entry into a CFD transaction may, in certain circumstances, require the payment of an initial margin and adverse market movements against the underlying stock may require the buyer to make additional margin payments. The Fund’s use of swaps is intended to generate profits, adjust leverage, hedge exposures, and manager volatility.
The CFDs outstanding fluctuate throughout the operating year as required to meet strategic requirements. The following table illustrates the average quarterly volume of these contracts. For purpose of this disclosure, volume is measured by contracts outstanding at each quarter end.
| | | | |
Average Contracts for Difference Notional Amounts Outstanding | |
Fund | | Year Ended January 31, 2018 | |
Grosvenor Long/Short | | $ | 50,835 | |
Numeric Integrated Alpha | | | 12,573,093 | |
Forward Foreign Currency Contracts
The Grosvenor Long/Short Fund may enter into forward foreign currency contracts to hedge the exchange rate risk on investment transactions or to hedge the value of the Fund’s securities denominated in foreign currencies. Forward foreign currency contracts are valued at the forward exchange rate prevailing on the day of valuation. The Fund may also use currency contracts to increase exposure to a foreign currency or to shift exposure to foreign currency fluctuations from one country to another. The Fund bears the market risk that arises from changes in foreign exchange rates, and accordingly, the unrealized gain (loss) on these contracts is reflected in the accompanying financial statements. The Fund also bears the credit risk if the counterparty fails to perform under the contract.
During the year ended January 31, 2018, the Fund entered into forward foreign currency contracts primarily for speculative purposes.
The Funds’ forward foreign currency contract notional dollar values outstanding fluctuate throughout the operating year as required to meet strategic requirements. The following table illustrates the average quarterly volume of forward foreign currency contracts. For the purpose of this disclosure, volume is measured by the amounts bought and sold in USD at each quarter end.
| | | | | | | | | | | | |
Average Forward Foreign Currency Notional Amount Outstanding
Year Ended January 31, 2018 | |
Fund | | Purchased Contracts | | | | | | Sold Contracts | |
Grosvenor Long/Short | | $ | 203,987 | | | | | | | $ | 1,275,165 | |
60
American Beacon FundsSM
Notes to Financial Statements
January 31, 2018
Futures Contracts
Futures contracts are contracts to buy or sell a standard quantity of securities at a specified price on a future date. The Funds’ use of futures is intended to generate profits, adjust leverage, hedge exposures, and manage volatility. The Funds may also enter into financial futures contracts as a method for keeping assets readily convertible to cash if needed to meet shareholder redemptions or for other needs while maintaining exposure to the stock or bond market, as applicable. The primary risks associated with the use of futures contracts are the possibility of illiquid markets or imperfect correlation between the values of the contracts and the underlying securities or that the counterparty will fail to perform its obligations.
Upon entering into a futures contract, the Funds are required to set aside or deposit with a broker an amount, termed the initial margin, which typically represents a portion of the face value of the futures contract. The Funds usually reflects this amount on the Schedules of Investments as a U.S. Treasury Bill held as collateral for futures contracts or as cash deposited with broker on the Statements of Assets and Liabilities. Payments to and from the broker, known as variation margin, are required to be made on a daily basis as the price of the futures contract fluctuates. Changes in initial settlement values are accounted for as unrealized appreciation (depreciation) until the contracts are terminated, at which time realized gains and losses are recognized. Futures contracts are valued at the most recent settlement price established each day by the exchange on which they are traded.
The Funds’ average futures contracts outstanding fluctuate throughout the operating year as required to meet strategic requirements. The following table illustrates the average quarterly volume of futures contracts. For purpose of this disclosure, volume is measured by contracts outstanding at each quarter end.
| | | | |
Average Futures Contracts Outstanding | |
Fund | | Year Ended January 31, 2018 | |
Numeric Integrated Alpha | | | 357 | |
Options Contracts
The Grosvenor Long/Short Fund may write (1) call and put options on futures, swaps (“swaptions”), securities, commodities or currencies it owns or in which it may invest and (2) inflation-capped options. Writing put options tends to increase the Fund’s exposure to unfavorable movements of the underlying instrument in exchange for an upfront premium. Writing call options tends to decrease the Fund’s exposure to favorable movements of the underlying instrument in exchange for an upfront premium. When the Funds writes a call, put, or inflation-capped option, an amount equal to the premium received is recorded as a liability and subsequently marked to market to reflect the current value of the option written. The purpose of inflation-capped options is to protect the buyer from inflation erosion above a certain rate on a given notional exposure. A floor can be used to give downside protection to investments in inflation-linked products. These liabilities are reflected as written options outstanding on the Statement of Assets and Liabilities. Certain options may be written with premiums to be determined on a future date. Premiums received from writing options which expire are treated as realized gains. Premiums received from writing options which are exercised or closed are added to the proceeds or offset against amounts paid on the underlying futures, swap, security or currency transaction to determine the realized gain or loss when the underlying transaction is sold. The Funds, as a writer of an option has no control over whether the underlying instrument may be sold (call) or purchased (put) and as a result bears the market risk of an unfavorable change in the price of the instrument underlying the written option. There is the risk the Funds may not be able to enter into a closing transaction because of an illiquid market.
The Grosvenor Long/Short Fund may also purchase put and call options. Purchasing call options tends to increase the Funds’ exposure to favorable movements of the underlying instrument in exchange for paying an upfront premium. Purchasing put options tends to decrease the Funds’ exposure to unfavorable movements of the underlying instrument. The Funds pay a premium which is included on the Statement of Assets and Liabilities as an
61
American Beacon FundsSM
Notes to Financial Statements
January 31, 2018
investment and subsequently marked to market to reflect the current value of the option. Premiums paid for purchasing options which expire are treated as realized losses. Certain options may be purchased with premiums to be determined on a future date. The premiums for these options are based upon implied volatility parameters at specified terms. The risk associated with purchasing put and call options is limited to the premium paid. Premiums paid for purchasing options which are exercised or closed are added to the amounts paid or offset against the proceeds on the underlying investment transaction to determine the realized gain or loss when the underlying transaction is sold.
During the year ended January 31, 2018, the Grosvenor Long/Short Fund purchased/sold options primarily for return enhancement and hedging.
The Fund’s option contracts outstanding fluctuate throughout the operating year as required to meet strategic requirements. The following table illustrates the average quarterly volume of options contracts. For the purpose of this disclosure, volume is measured by contracts outstanding at each quarter end.
| | | | | | | | | | | | |
Average Option Notional Amount Outstanding
Year Ended January 31, 2018 | |
Fund | | Purchased | | | | | | Sold | |
Grosvenor Long/Short | | $ | 122,029 | | | | | | | $ | 1,025 | |
Total Return Swap Agreements
The Grosvenor Long/Short Fund may enter into total return swaps in order to take a “long” or “short” position with respect to an underlying referenced asset. The Fund is subject to market price volatility of the underlying referenced asset. A total return swap involves commitments to pay interest in exchange for a market linked return based on a notional amount. To the extent that the total return of the security, group of securities or index underlying the transaction exceeds or falls short of the offsetting interest obligation, the Fund will receive a payment from or make a payment to the counterparty.
The Fund’s total return swap contracts outstanding fluctuate throughout the operating year as required to meet strategic requirements. The following table illustrates the average quarterly volume of total return swap contracts. For the purpose of this disclosure, volume is measured by contracts outstanding at each quarter end:
| | | | |
Average Total Return Swap Contracts Outstanding | |
Fund | | Year Ended January 31, 2018 | |
Grosvenor Long/Short | | $ | 36,615,477 | |
The following is a summary of the fair valuations of the Funds’ derivative instruments categorized by risk exposure(1):
Grosvenor Long/Short Fund
| | | | | | | | | | | | | | | | | | | | | | | | | | | | | | | | | | | | | | | | | | | | | | | | | | | | | | | |
| Fair values of financial instruments on the Statements of Assets and Liabilities as of January 31, 2018: | |
|
Derivatives not accounted for as hedging instruments |
| | | | | | | | | | | |
Assets: | | Credit
contracts | | | | Foreign exchange
contracts | | | | Commodity
contracts | | | | Interest rate
contracts | | | | Equity
contracts | | | | Total |
| Purchased options outstanding | | | $ | - | | | | | | | | | $ | - | | | | | | | | | $ | - | | | | | | | | | $ | - | | | | | | | | | $ | 21,249 | | | | | | | | | $ | 21,249 | |
| Unrealized appreciation of forward foreign currency contracts | | | | - | | | | | | | | | | 6,604 | | | | | | | | | | - | | | | | | | | | | - | | | | | | | | | | - | | | | | | | | | | 6,604 | |
| Unrealized appreciation from swap agreements | | | | - | | | | | | | | | | - | | | | | | | | | | - | | | | | | | | | | - | | | | | | | | | | 644,259 | | | | | | | | | | 644,259 | |
62
American Beacon FundsSM
Notes to Financial Statements
January 31, 2018
| | | | | | | | | | | | | | | | | | | | | | | | | | | | | | | | | | | | | | | | | | | | | | | | | | | | | | | |
| | | | | | | | | | | |
Liabilities: | | Credit
contracts | | | | Foreign exchange
contracts | | | | Commodity
contracts | | | | Interest rate
contracts | | | | Equity
contracts | | | | Total |
| Unrealized depreciation of forward foreign currency contracts | | | $ | - | | | | | | | | | $ | (40,896 | ) | | | | | | | | $ | - | | | | | | | | | $ | - | | | | | | | | | $ | - | | | | | | | | | $ | (40,896 | ) |
| Unrealized depreciation from swap agreements | | | | - | | | | | | | | | | - | | | | | | | | | | - | | | | | | | | | | - | | | | | | | | | | (56,987 | ) | | | | | | | | | (56,987 | ) |
| | | | | | | | | | | | | | | | | | | | | | | | | | | | | | | | | | | | | | | | | | | | | | | | | | | | | | | |
| The effect of financial derivative instruments on the Statements of Operations as of January 31, 2018: | |
|
Derivatives not accounted for as hedging instruments |
| | | | | | | | | | | |
Realized gain (loss) from derivatives
recognized as a result of operations: | | Credit
contracts | | | | Foreign exchange
contracts | | | | Commodity
contracts | | | | Interest rate
contracts | | | | Equity
contracts | | | | Total |
| Purchased options contracts | | | $ | - | | | | | | | | | $ | (139 | ) | | | | | | | | $ | - | | | | | | | | | $ | - | | | | | | | | | $ | 33,318 | | | | | | | | | $ | 33,179 | |
| Forward foreign currency contracts | | | | - | | | | | | | | | | (22,278 | ) | | | | | | | | | - | | | | | | | | | | - | | | | | | | | | | - | | | | | | | | | | (22,278 | ) |
| Swap agreements | | | | - | | | | | | | | | | - | | | | | | | | | | - | | | | | | | | | | - | | | | | | | | | | 201,842 | | | | | | | | | | 201,842 | |
| Written options contracts | | | | - | | | | | | | | | | - | | | | | | | | | | - | | | | | | | | | | - | | | | | | | | | | (8,889 | ) | | | | | | | | | (8,889 | ) |
| | | | | | | | | | | |
Net change in unrealized appreciation
(depreciation) of derivatives recognized as a
result from operations: | | Credit
contracts | | | | Foreign exchange
contracts | | | | Commodity
contracts | | | | Interest rate
contracts | | | | Equity
contracts | | | | Total |
| Purchased options contracts | | | $ | - | | | | | | | | | $ | - | | | | | | | | | $ | - | | | | | | | | | $ | - | | | | | | | | | $ | 9,639 | | | | | | | | | $ | 9,639 | |
| Forward foreign currency contracts | | | | - | | | | | | | | | | (25,606 | ) | | | | | | | | | - | | | | | | | | | | - | | | | | | | | | | - | | | | | | | | | | (25,606 | ) |
| Swap agreements | | | | - | | | | | | | | | | - | | | | | | | | | | - | | | | | | | | | | - | | | | | | | | | | 423,501 | | | | | | | | | | 423,501 | |
| Written options contracts | | | | - | | | | | | | | | | - | | | | | | | | | | - | | | | | | | | | | - | | | | | | | | | | 96 | | | | | | | | | | 96 | |
Numeric Integrated Alpha Fund
| | | | | | | | | | | | | | | | | | | | | | | | | | | | | | | | | | | | | | | | | | | | |
| Fair values of financial instruments on the Statements of Assets and Liabilities as of January 31, 2018: | |
|
Derivatives not accounted for as hedging instruments | |
| | | | | | | | | | | |
Assets: | | Credit
contracts | | | | | | Foreign exchange
contracts | | | | | | Commodity
contracts | | | | | | Interest rate
contracts | | | | | | Equity
contracts | | | | | | Total | |
| Receivable for variation margin from open futures contracts(2) | | $ | - | | | | | | | $ | - | | | | | | | $ | - | | | | | | | $ | - | | | | | | | $ | 984,282 | | | | | | | $ | 984,282 | |
| Unrealized appreciation from swap agreements | | | - | | | | | | | | - | | | | | | | | - | | | | | | | | - | | | | | | | | 1,704,802 | | | | | | | | 1,704,802 | |
| | | | | | | | | | | |
Liabilities: | | Credit
contracts | | | | | | Foreign exchange
contracts | | | | | | Commodity
contracts | | | | | | Interest rate
contracts | | | | | | Equity
contracts | | | | | | Total | |
| Payable for variation margin from open futures contracts(2) | | $ | - | | | | | | | $ | - | | | | | | | $ | - | | | | | | | $ | - | | | | | | | $ | (794,657 | ) | | | | | | $ | (794,657 | ) |
| Unrealized depreciation from swap agreements | | | - | | | | | | | | - | | | | | | | | - | | | | | | | | - | | | | | | | | (2,071,710 | ) | | | | | | | (2,071,710 | ) |
| | | | | | | | | | | | | | | | | | | | | | | | | | | | | | | | | | | | | | | | | | | | | | | | | | | | | | | |
| The effect of financial derivative instruments on the Statements of Operations as of January 31, 2018: | |
|
Derivatives not accounted for as hedging instruments |
| | | | | | | | | | | |
Realized gain (loss) from derivatives
recognized as a result of operations: | | Credit
contracts | | | | Foreign exchange
contracts | | | | Commodity
contracts | | | | Interest rate
contracts | | | | Equity
contracts | | | | Total |
| Futures contracts | | | $ | - | | | | | | | | | $ | - | | | | | | | | | $ | - | | | | | | | | | $ | (242,372 | ) | | | | | | | | $ | 1,800,876 | | | | | | | | | $ | 1,558,504 | |
| Swap agreements | | | | - | | | | | | | | | | - | | | | | | | | | | - | | | | | | | | | | - | | | | | | | | | | 5,129,443 | | | | | | | | | | 5,129,443 | |
| | | | | | | | | | | |
Net change in unrealized appreciation
(depreciation) of derivatives recognized as a
result from operations: | | Credit
contracts | | | | Foreign exchange
contracts | | | | Commodity
contracts | | | | Interest rate
contracts | | | | Equity
contracts | | | | Total |
| Futures contracts | | | $ | - | | | | | | | | | $ | - | | | | | | | | | $ | - | | | | | | | | | $ | - | | | | | | | | | $ | (7,658 | ) | | | | | | | | $ | (7,658 | ) |
| Swap agreements | | | | - | | | | | | | | | | - | | | | | | | | | | - | | | | | | | | | | - | | | | | | | | | | (747,877 | ) | | | | | | | | | (747,877 | ) |
(1) See Note 3 in the Notes to Financial Statements for additional information.
(2) Includes cumulative appreciation (depreciation) of futures contracts as reported in the Fund’s Schedules of Investments footnotes. Only current day’s variation margin is reported within the Statements of Assets and Liabilities.
63
American Beacon FundsSM
Notes to Financial Statements
January 31, 2018
Master Agreements
International Swaps and Derivatives Association, Inc. Master Agreements (“ISDA Master Agreements”) with counterparties govern transactions in OTC derivative and foreign exchange contracts entered into by the Funds and those counterparties. The ISDA Master Agreements contain provisions for general obligations, representations, agreements, collateral and events of default or termination. Events of termination include conditions that may entitle counterparties to elect to terminate early and cause settlement of all outstanding transactions under the applicable ISDA Master Agreement. Any election to terminate early could be material to the financial statements. Since different types of forward and OTC financial derivative transactions have different mechanics and are sometimes traded out of different legal entities of a particular counterparty organization, each type of transaction may be covered by a different Master Agreement, resulting in the need for multiple agreements with a single counterparty. As the Master Agreements are specific to unique operations of different asset types, they allow a Fund to net its total exposure to a counterparty in the event of a default with respect to all the transactions governed under a single agreement with a counterparty.
Master Securities Forward Transaction Agreements (“Master Forward Agreements”) govern the considerations and factors surrounding the settlement of certain forward settling transactions, such as delayed delivery or sale-buyback financing transactions by and between a Fund and select counterparties. The Master Forward Agreements maintain provisions for, among other things, initiation and confirmation, payment and transfer, events of default, termination, and maintenance of collateral.
6. Principal Risks
Investing in the Funds may involve certain risks including, but not limited to, those described below.
Counterparty Risk
The Funds are subject to the risk that a party or participant to a transaction, such as a broker or derivative counterparty, will be unwilling or unable to satisfy its obligation to make timely principal, interest or settlement payments or to otherwise honor its obligations to the Funds.
Currency Risk
The Funds may have exposure to foreign currencies by making direct investments in non-U.S. currencies or in securities denominated in non-U.S. currencies, purchasing or selling forward foreign currency exchange contracts in non- U.S. currencies, non-U.S. currency futures contracts and swaps for cross-currency investments. Foreign currencies will fluctuate, and may decline, in value relative to the U.S. dollar and other currencies and thereby affect the Funds’ investments in foreign (non-U.S.) currencies or in securities that trade in, and receive revenues in, or in derivatives that provide exposure to, foreign (non-U.S.) currencies.
Derivatives Risk
Derivatives may involve significant risk. The use of derivative instruments may expose the Funds to additional risks that they would not be subject to if they invested directly in the securities or other instruments underlying those derivatives, including the high degree of leverage often embedded in such instruments, and potential material and prolonged deviations between the theoretical value and realizable value of a derivative. Some derivatives have the potential for unlimited loss, regardless of the size of the Funds’ initial investment. Derivatives may be illiquid and may be more volatile than other types of investments. The Funds may buy or sell derivatives not traded on an exchange and which may be subject to heightened liquidity and valuation risk. Derivative investments can increase portfolio turnover and transaction costs. Derivatives also are subject to counterparty risk. As a result, the Funds may obtain no recovery of their investment or may only obtain a limited recovery, and any recovery may be delayed. Not all derivative transactions require a counterparty to post collateral, which may expose the Funds to greater losses in the event of a default by a counterparty.
64
American Beacon FundsSM
Notes to Financial Statements
January 31, 2018
Emerging Markets Risk
When investing in emerging markets, the risks of investing in foreign securities are heightened. Emerging markets are generally smaller, less developed, less liquid and more volatile than the securities markets of the U.S. and other developed markets. There are also risks of: greater political uncertainties; an economy’s dependence on revenues from particular commodities or on international aid or development assistance; currency transfer restrictions; a limited number of potential buyers for such securities; and delays and disruptions in securities settlement procedures.
Forward Foreign Currency Contracts Risk
Forward foreign currency contracts, including non-deliverable forwards, are derivative instruments pursuant to a contract with a counterparty to pay a fixed price for an agreed amount of securities or other underlying assets at an agreed date or to buy or sell a specific currency at a future date at a price set at the time of the contract. The use of forward foreign currency contracts may expose the Funds to additional risks that it would not be subject to if it invested directly in the securities or currencies underlying the forward foreign currency contract.
Futures Contracts Risk
Futures contracts are derivative instruments where one party pays a fixed price for an agreed amount of securities or other underlying assets at an agreed date. The use of such derivative instruments may expose the Funds to additional risks that they would not be subject to if they invested directly in the securities underlying those derivatives. Futures contracts may experience potentially dramatic price changes (losses) and imperfect correlation between the price of the contract and the underlying security or index, which will increase the volatility of the Funds and may involve a small investment of cash (the amount of initial and variation margin) relative to the magnitude of the risk assumed (the potential increase or decrease in the price of the futures contract).
High Portfolio Turnover Risk
Portfolio turnover is a measure of the Funds’ trading activity over a one-year period. A portfolio turnover rate of 100% would indicate that the Funds sold and replaced the entire value of its securities holdings during the period. High portfolio turnover could increase the Funds’ transaction costs, have a negative impact on performance, and generate higher capital gain distributions to shareholders than if the Funds have a lower portfolio turnover rate.
Illiquid and Restricted Securities Risk
Securities not registered in the U.S. under the Securities Act of 1933, as amended (the “Securities Act”), including Rule 144A securities, are restricted as to their resale. Such securities may not be listed on an exchange and may have no active trading market. They may be more difficult to purchase or sell at an advantageous time or price because such securities may not be readily marketable in broad public markets. The Funds may not be able to sell a restricted security when the sub-advisor considers it desirable to do so and/or may have to sell the security at a lower price than the Funds believe is its fair market value. In addition, transaction costs may be higher for restricted securities and the Funds may receive only limited information regarding the issuer of a restricted security. The Funds may have to bear the expense of registering restricted securities for resale and the risk of substantial delays in effecting the registration.
Leverage Risk
The Funds’ use of futures, forward foreign currency contracts, swaps, other derivative instruments and selling securities short will have the economic effect of financial leverage. Financial leverage magnifies the
65
American Beacon FundsSM
Notes to Financial Statements
January 31, 2018
exposure to the swings in prices of an asset or class of assets underlying a derivative instrument and results in increased volatility, which means that the Funds will have the potential for greater losses than if the Funds do not use the derivative instruments that have a leveraging effect. Leverage may result in losses that exceed the amount originally invested and may accelerate the rate of losses. Leverage tends to magnify, sometimes significantly, the effect of an increase or decrease in the Funds’ exposure to an asset or class of assets and may cause the Funds’ NAV to be volatile.
Liquidity Risk
The Funds are susceptible to the risk that certain fixed-income investments, may have limited marketability or be subject to restrictions on sale, and may be difficult or impossible to purchase or sell at favorable times or prices. The Funds could lose money if they are unable to dispose of an investment at a time that is most beneficial to the Funds. The Funds may be required to dispose of investments at unfavorable times or prices to satisfy obligations, which may result in losses or may be costly to the Funds. For example, the Funds may be forced to sell certain investments at unfavorable prices to meet redemption requests or other cash needs. Judgment plays a greater role in pricing illiquid investments than in investments with more active markets.
Market Risk
Since the financial crisis that started in 2008, the U.S. and many foreign economies continue to experience its after-effects, which have resulted, and may continue to result, in an unusually high degree of volatility in the financial markets, both domestic and foreign. In addition, global economies and financial markets are becoming increasingly interconnected, which increases the possibilities that conditions in one country or region might adversely impact issuers in a different country or region. The severity or duration of adverse economic conditions may also be affected by policy changes made by governments or quasi-governmental organizations.
In addition, political events within the U.S. and abroad may affect investor and consumer confidence and may adversely impact financial markets and the broader economy, perhaps suddenly and to a significant degree. High public debt in the U.S. and other countries creates ongoing systemic and market risks and policymaking uncertainty. Because the impact on the markets has been widespread, it may be difficult to identify both risks and opportunities using past models of the interplay of market forces, or to predict the duration of these market conditions. Interest rates have been unusually low in recent years in the U.S. and abroad. Because there is little precedent for this situation, it is difficult to predict the impact of a rate increase on various markets. In addition, there is a risk that the prices of goods and services in the U.S. and many foreign economies may decline over time, known as deflation (the opposite of inflation). Deflation may have an adverse effect on stock prices and creditworthiness and may make defaults on debt more likely.
Multi-Manager Risk
The Grosvenor Long/Short Fund’s performance depends on, among other things, the Lead Sub-Advisor’s success in monitoring and allocating the Fund’s assets among the Sub-Advisors. The Sub-Advisors investment styles may not always be complementary. The Sub-Advisors make investment decisions independently of one another, and may make conflicting investment decisions. The Fund’s multi-manager approach may result in the Fund investing a significant percentage of its assets in certain types of securities, which could be beneficial or detrimental to the Fund’s performance depending on the performance of those securities and the overall market environment. The Sub-Advisors may underperform the market generally or underperform other investment managers that could have been selected for the Fund. The Lead Sub-Advisor and the Sub-Advisors also may use proprietary or licensed strategies that are based on considerations and factors that are not fully disclosed to the Board, the Manager or the Lead Sub-Advisor. The success of a particular Sub-Advisor in implementing its investment strategy is dependent on the expertise of its portfolio managers, and certain Sub-Advisors may have a limited number of investment management professionals. The loss of one or more of a Sub-Advisor’s key investment professionals could have a materially adverse effect on the performance of the Fund. A Sub-Advisor may have little or no experience
66
American Beacon FundsSM
Notes to Financial Statements
January 31, 2018
managing the assets of a registered investment company which, unlike the other accounts a Sub-Advisor may manage, is subject to daily inflows and outflows of investor cash and are subject to certain legal and tax-related restrictions on their investments and operations.
Non-Diversification Risk
The Funds are non-diversified, which means the Funds may focus their investments in the securities of a comparatively small number of issuers. Investments in securities of a limited number of issuers exposes the Funds to greater market risk and potential losses than if assets were diversified among the securities of a greater number of issuers.
Options Risk
In order for a call option to be profitable, the market price of the underlying security must rise sufficiently above the exercise price to cover the premium and transaction costs. These costs will reduce any profit that might have been realized had it bought the underlying security at the time it purchased the call option. For a put option to be profitable, the market price of the underlying security must decline sufficiently below the exercise price to cover the premium and transaction costs. By using put options in this manner, the Funds will reduce any profit it might otherwise have realized from appreciation of the underlying security by the premium paid for the put option and by transaction costs. If the Funds sell a put option, there is a risk that the Funds may be required to buy the underlying asset at a disadvantageous price. If the Funds sell a call option, there is a risk that the Funds may be required to sell the underlying asset at a disadvantageous price. If the Funds sell a call option on an underlying asset that the Funds own and the underlying asset has increased in value when the call option is exercised, the Funds will be required to sell the underlying asset at the call price and will not be able to realize any of the underlying asset’s value above the call price.
Other Investment Companies Risk
The Funds may invest in shares of other registered investment companies, including ETFs and money market funds. To the extent that the Funds invest in shares of other registered investment companies, the Funds will indirectly bear the fees and expenses charged by the underlying funds in addition to the Funds’ direct fees and expenses and will be subject to the risks associated with investments in those funds. For example, ETF shares may trade at a premium or discount to their net asset value. An ETF that tracks an index may not precisely replicate the returns of its benchmark index.
Short Position Risk
The Funds will incur a loss as a result of a short position if the price of the instrument sold short increases in value between the date of the short sale and the date on which an offsetting position is purchased. Short positions may be considered speculative transactions and involve special risks, including greater reliance on the sub-advisor’s ability to accurately anticipate the future value of a security or instrument. The Funds’ losses are potentially unlimited in a short position transaction.
Valuation Risk
The Funds may value certain assets at a price different from the price at which they can be sold. This risk may be especially pronounced for investments, such as certain derivatives, which may be illiquid or which may become illiquid.
67
American Beacon FundsSM
Notes to Financial Statements
January 31, 2018
Offsetting Assets and Liabilities
The Funds are parties to enforceable master netting agreements between brokers and counterparties which provide for the right to offset under certain circumstances. The Funds employ multiple money managers and counterparties and have elected not to offset qualifying financial and derivative instruments on the Statements of Assets and Liabilities, as such all financial and derivative instruments are presented on a gross basis. The impacts of netting arrangements that provide the right to offset are detailed below. The net amount represents the net receivable or payable that would be due from or to the counterparty in the event of default. Exposure from borrowings and other financing agreements such as repurchase agreements can only be netted across transactions governed by the same Master Agreement with the same legal entity. All amounts reported below represent the balance as of the report date, January 31, 2018.
Grosvenor Long/Short Fund
| | | | | | | | | | | | |
| Offsetting of Financial and Derivative Assets as of January 31, 2018: | |
| | | Assets | | | | | | Liabilities | |
| Swap Agreement - OTC | | $ | 644,259 | | | | | | | $ | 56,987 | |
| Purchased Options Contracts | | | 21,249 | | | | | | | | - | |
| Forward Foreign Currency Contracts | | | 6,604 | | | | | | | | 40,896 | |
| | | | | | | | | | | | |
| Total derivative assets and liabilities in the Statement of Assets and Liabilities | | $ | 672,112 | | | | | | | $ | 97,883 | |
| | | | | | | | | | | | |
| Derivatives not subject to a Master Netting Agreement or similar agreement (“MNA”) | | $ | 15,549 | | | | | | | $ | - | |
| | | | | | | | | | | | |
| Total derivative assets and liabilities subject to an MNA | | $ | 656,563 | | | | | | | $ | 97,883 | |
| | | | | | | | | | | | |
| | | | | | | | | | | | | | | | | | | | | | | | | | | | | | | | | | | | |
| Financial Assets, Derivatives, and Collateral Received/(Pledged) by Counterparty as of January 31, 2018: | |
| | | | | | | | | | | | | | | Gross Amounts Not Offset in the
Statement of Assets and Liabilities | | | | | | | |
Counterparty | | Gross Amounts of Assets
Presented in the Statement
of Assets and Liabilities | | | | | | Derivatives
Available for
Offset | | | | | | Non-Cash Collateral
Pledged | | | | | | Cash Collateral
Pledged | | | | | | Net Amount | |
| Morgan Stanley & Co. Inc. | | $ | 656,563 | | | | | | | $ | (97,883 | ) | | | | | | $ | (558,680 | ) | | | | | | $ | - | | | | | | | $ | - | |
| | | | | | | |
| | | | | | | | | | | | | | | Gross Amounts Not Offset in the
Statement of Assets and Liabilities | | | | | | | |
Counterparty | | Gross Amounts of Liabilities
Presented in the Statement
of Assets and Liabilities | | | | | | Derivatives
Available for
Offset | | | | | | Non-Cash Collateral
Received | | | | | | Cash Collateral
Received | | | | | | Net Amount | |
| Morgan Stanley & Co. Inc. | | $ | 97,883 | | | | | | | $ | (97,883 | ) | | | | | | $ | - | | | | | | | $ | - | | | | | | | $ | - | |
Numeric Integrated Alpha Fund
| | | | | | | | | | | | |
| Offsetting of Financial and Derivative Assets as of January 31, 2018: | |
| | | Assets | | | | | | Liabilities | |
| Futures Contracts | | $ | 984,282 | | | | | | | $ | 794,657 | |
| Swap Agreement - OTC | | | 1,704,802 | | | | | | | | 2,071,710 | |
| | | | | | | | | | | | |
| Total derivative assets and liabilities in the Statement of Assets and Liabilities | | $ | 2,689,084 | | | | | | | $ | 2,866,367 | |
| | | | | | | | | | | | |
| Derivatives not subject to a Master Netting Agreement or similar agreement (“MNA”) | | $ | (984,282 | ) | | | | | | $ | (794,657 | ) |
| | | | | | | | | | | | |
| Total derivative assets and liabilities subject to an MNA | | $ | 1,704,802 | | | | | | | $ | 2,071,710 | |
| | | | | | | | | | | | |
68
American Beacon FundsSM
Notes to Financial Statements
January 31, 2018
| | | | | | | | | | | | | | | | | | | | | | | | | | | | | | | | | | | | |
| Financial Assets, Derivatives, and Collateral Received/(Pledged) by Counterparty as of January 31, 2018: | |
| | | | | | | | | | | | | | | Gross Amounts Not Offset in the
Statement of Assets and Liabilities | | | | | | | |
Counterparty | | Gross Amounts of Assets
Presented in the Statement
of Assets and Liabilities | | | | | | Derivatives
Available for
Offset | | | | | | Non-Cash Collateral
Pledged | | | | | | Cash Collateral
Pledged | | | | | | Net Amount | |
| Morgan Stanley & Co., Inc. | | $ | 1,704,802 | | | | | | | $ | (1,704,802 | ) | | | | | | $ | - | | | | | | | $ | - | | | | | | | $ | - | |
| | | | | | | |
| | | | | | | | | | | | | | | Gross Amounts Not Offset in the
Statement of Assets and Liabilities | | | | | | | |
Counterparty | | Gross Amounts of Liabilities
Presented in the Statement
of Assets and Liabilities | | | | | | Derivatives
Available for
Offset | | | | | | Non-Cash Collateral
Received | | | | | | Cash Collateral
Received | | | | | | Net Amount | |
| Morgan Stanley & Co., Inc. | | $ | 2,071,710 | | | | | | | $ | (1,704,802 | ) | | | | | | $ | (366,908 | ) | | | | | | $ | - | | | | | | | $ | - | |
7. Federal Income and Excise Taxes
It is the policy of each Fund to qualify as a regulated investment company (“RIC”), by complying with all applicable provisions of Subchapter M of the Internal Revenue Code, as amended, and to make distributions of taxable income sufficient to relieve it from substantially all federal income and excise taxes. For federal income tax purposes, each Fund is treated as a single entity for the purpose of determining such qualification.
The Funds do not have any unrecorded tax liabilities in the accompanying financial statements. For the Grosvenor Long/Short Fund, each of the tax years in the 3 year period ended January 31, 2018 and for the Numeric Integrated Alpha Fund, each of the tax years in the 2 year period ended January 31, 2018 remain subject to examination by the Internal Revenue Service. If applicable, the Funds recognize interest accrued related to unrecognized tax benefits in interest expense and penalties in “Other expenses” on the Statements of Operations.
The Funds may be subject to taxes imposed by countries in which it invests. Such taxes are generally based on returns of income earned or gains realized or repatriated. Taxes are accrued and applied to net investment income, net realized capital gains and net unrealized appreciation (depreciation), as applicable, as the income is earned or capital gains are recorded.
Dividends are categorized in accordance with income tax regulations which may treat certain transactions differently than U.S. GAAP. Accordingly, the character of distributions and composition of net assets for tax purposes may differ from those reflected in the accompanying financial statements. The Funds also utilize earnings and profits distributed to shareholders on redemptions of shares as part of the dividends paid deduction.
69
American Beacon FundsSM
Notes to Financial Statements
January 31, 2018
The tax character of distributions paid were as follows:
| | | | | | | | | | | | | | | | | | | | | | | | | | | | |
| | | Grosvenor Long/Short Fund | | | | | | Numeric Integrated Alpha Fund | |
| | | Year Ended
January 31, 2018 | | | | | | Year Ended
January 31, 2017 | | | | | | Year Ended
January 31, 2018 | | | | | | From November 1, 2016
to January 31, 2017 | |
Distributions paid from: | | | | | | | | | | | | | | | | | | | | | | | | | | | | |
Ordinary income | | | | | | | | | | | | | | | | | | | | | | | | | | | | |
Institutional Class | | $ | 744,110 | | | | | | | $ | 294,627 | | | | | | | $ | 1,182 | | | | | | | $ | - | |
Y Class | | | 16,894 | | | | | | | | 4,466 | | | | | | | | 1,053 | | | | | | | | - | |
Investors Class | | | 28,384 | | | | | | | | 6,661 | | | | | | | | 982 | | | | | | | | - | |
A Class | | | 8,566 | | | | | | | | 3,414 | | | | | | | | - | | | | | | | | - | |
C Class | | | 8,657 | | | | | | | | 4,070 | | | | | | | | - | | | | | | | | - | |
Ultra Class | | | 4,325 | | | | | | | | - | | | | | | | | 2,205,298 | | | | | | | | - | |
Long-term capital gains | | | | | | | | | | | | | | | | | | | | | | | | | | | | |
Institutional Class | | | 606,463 | | | | | | | | 15,125 | | | | | | | | 746 | | | | | | | | - | |
Y Class | | | 13,770 | | | | | | | | 229 | | | | | | | | 618 | | | | | | | | - | |
Investors Class | | | 23,134 | | | | | | | | 342 | | | | | | | | 618 | | | | | | | | - | |
A Class | | | 6,981 | | | | | | | | 175 | | | | | | | | - | | | | | | | | - | |
C Class | | | 7,070 | | | | | | | | 209 | | | | | | | | - | | | | | | | | - | |
Ultra Class | | | 3,525 | | | | | | | | - | | | | | | | | 1,068,803 | | | | | | | | - | |
| | | | | | | | | | | | | | | | | | | | | | | | | | | | |
Total distributions paid | | $ | 1,471,879 | | | | | | | $ | 329,318 | | | | | | | $ | 3,279,300 | | | | | | | $ | - | |
| | | | | | | | | | | | | | | | | | | | | | | | | | | | |
*For tax purposes, short-term capital gains are considered ordinary income distributions.
As of January 31, 2018 the components of distributable earnings (deficits) on a tax basis were as follows:
| | | | | | | | | | | | | | | | | | | | | | | | | | | | |
Fund | | Tax Cost | | | | | | Unrealized
Appreciation | | | | | | Unrealized
(Depreciation) | | | | | | Net Unrealized
Appreciation
(Depreciation) | |
| Grosvenor Long/Short | | $ | 18,086,894 | | | | | | | $ | 2,983,813 | | | | | | | $ | (1,456,117 | ) | | | | | | $ | 1,527,696 | |
| Numeric Integrated Alpha | | | 135,490,589 | | | | | | | | 9,982,503 | | | | | | | | (13,091,901 | ) | | | | | | | (3,109,398 | ) |
| | | | | | | | | | | | | | | | | | | | | | | | | | | | | | | | | | | | | | | | | | | | |
Fund | | Net Unrealized
Appreciation
(Depreciation) | | | | | | Undistributed
Ordinary
Income | | | | | | Undistributed
Long-Term
Capital Gains | | | | | | Accumulated
Capital and
Other (Losses) | | | | | | Other
Temporary
Differences | | | | | | Distributable
Earnings | |
| Grosvenor Long/Short | | $ | 1,527,696 | | | | | | | $ | 329,827 | | | | | | | $ | 251,545 | | | | | | | $ | - | | | | | | | $ | (56,993 | ) | | | | | | $ | 2,052,075 | |
| Numeric Integrated Alpha | | | (3,109,398 | ) | | | | | | | 731,287 | | | | | | | | - | | | | | | | | (349,754 | ) | | | | | | | (24,719 | ) | | | | | | | (2,752,584 | ) |
Financial reporting records are adjusted for permanent book/tax differences to reflect tax character. Financial records are not adjusted for temporary differences. The temporary differences between financial reporting and tax-basis reporting of unrealized appreciation (depreciation) are attributable primarily to the tax deferral of losses from wash sales, the realization for tax purposes of unrealized gains (losses) on certain derivative instruments, amortization of organizational costs, deferral of losses from straddles, deferral of losses from unsettled short sales transactions, gains from constructive sales, and the realization for tax purposes of unrealized gains (losses) on investments in passive foreign investment companies.
Due to inherent differences in the recognition of income, expenses, and realized gains (losses) under U.S. GAAP and federal income tax regulations, permanent differences between book and tax reporting have been identified and appropriately reclassified on the Statements of Assets and Liabilities.
Accordingly, the following amounts represent current year permanent differences derived from foreign currency reclasses, reclassifications of income from real estate trusts and partnerships, disposal adjustments from investments in passive foreign investment companies, swap income reclasses, dividends that have been redesignated, and net operating losses that have been reclassified as of January 31, 2018:
| | | | | | | | | | | | | | | | | | | | | | | | | | | | |
Fund | | Paid-In-Capital | | | | | | Undistributed
(Overdistribution of)
Net Investment
Income | | | | | | Accumulated Net
Realized Gain (Loss) | | | | | | Net Unrealized
Appreciation
(Depreciation) | |
| Grosvenor Long/Short | | $ | - | | | | | | | $ | 117,818 | | | | | | | $ | (117,818 | ) | | | | | | $ | - | |
| Numeric Integrated Alpha | | | - | | | | | | | | 4,988,600 | | | | | | | | (4,988,600 | ) | | | | | | | - | |
70
American Beacon FundsSM
Notes to Financial Statements
January 31, 2018
Under the Regulated Investment Company Modernization Act of 2010 (“RIC MOD”), net capital losses recognized by the Funds in taxable years beginning after December 22, 2010 are carried forward indefinitely and retain their character as short-term and/or long-term losses.
For the year ended January 31, 2018, the Funds did not have any capital loss carryforwards.
The Funds are permitted for tax purposes to defer into their next fiscal year qualified late year losses. Qualified late year capital losses are any capital losses incurred after October 31 through the Fund’s fiscal year ending January 31, 2018. Qualified late year ordinary losses are specified losses generally incurred after October 31 and ordinary losses incurred after December 31 through the end of the Funds’ fiscal year, January 31, 2018. For the period ended January 31, 2018, Numeric deferred $349,754 in long-term capital losses to February 1, 2018.
8. Investment Transactions
The aggregate cost of purchases and proceeds from sales and maturities of investments, other than short-term obligations, for the year ended January 31, 2018 were as follows:
| | | | | | | | | | | | |
Fund | | Purchases (non-U.S.
Government
Securities) | | | | | | Sales (non-U.S.
Government
Securities) | |
| Grosvenor Long/Short | | $ | 36,805,790 | | | | | | | $ | 35,683,287 | |
| Numeric Integrated Alpha | | | 551,869,075 | | | | | | | | 533,743,529 | |
A summary of the Funds’ transactions in the USG Select Fund for the year ended January 31, 2018 are as follows:
| | | | | | | | | | | | | | | | | | | | | | | | | | | | | | | | | | | | | | | | | | | | |
Fund | | Type of
Transaction | | | | | | January 31,
2017
Shares/Fair
Value | | | | | | Purchases | | | | | | Sales | | | | | | January 31,
2018
Shares/Fair
Value | | | | | | Dividend
Income | |
| Grosvenor Long/Short | | | Direct | | | | | | | $ | 2,991,077 | | | | | | | $ | 31,512,751 | | | | | | | $ | 30,537,384 | | | | | | | $ | 3,966,444 | | | | | | | $ | 30,098 | |
| Numeric Integrated Alpha | | | Direct | | | | | | | | 3,929,099 | | | | | | | | 182,488,198 | | | | | | | | 159,891,361 | | | | | | | | 26,525,936 | | | | | | | | 145,233 | |
9. Borrowing Arrangements
Effective November 16, 2017, the Funds, along with certain other funds managed by the Manager (“Participating Funds”), entered into a committed revolving line of credit (the “Committed Line”) agreement with State Street Bank and Trust Company (the “Bank”) to be used to facilitate portfolio liquidity. The maximum borrowing amount under the Committed Line is $50 million with interest at a rate equal to the higher of (a) one-month London Inter-Bank Offered Rate (“LIBOR”) plus 1.25% per annum or (b) the Federal Funds rate plus 1.25% per annum on amounts borrowed. Each of the Participating Funds will pay a commitment fee at a rate of 0.25% per annum on the unused portion of the Committed Line amount. The Committed Line expires November 15, 2018 unless extended by the Bank or terminated by the Participating Funds in accordance with the agreement.
Effective November 16, 2017, the Funds, along with certain other Participating Funds managed by the Manager, entered into an uncommitted discretionary demand revolving line of credit (the “Uncommitted Line”) agreement with the Bank to be used to facilitate portfolio liquidity. The maximum borrowing amount under the Uncommitted Line is $50 million with interest at a rate equal to the higher of (a) one-month LIBOR plus 1.25% per annum or (b) the Federal Funds rate. The Uncommitted Line expires November 15, 2018 unless extended by the Bank or terminated by the Participating Funds in accordance with the agreement.
The Participating Funds paid administration, legal and arrangement fees, which are recognized as a component of “Other expenses” on the Statements of Operations, along with commitment fees, that have been allocated among the Participating Funds based on average daily net assets. During the year ended January 31, 2018, the Funds did not utilize this facility.
71
American Beacon FundsSM
Notes to Financial Statements
January 31, 2018
10. Capital Share Transactions
The tables below summarize the activity in capital shares for each Class of the Funds:
| | | | | | | | | | | | | | | | | | | | | | | | | | | | |
| | | Institutional Class | |
| | | Year Ended January 31, | |
| | | 2018 | | | | | | 2017 | |
Grosvenor Long/Short Fund | | Shares | | | | | | Amount | | | | | | Shares | | | | | | Amount | |
| Shares sold | | | 24,792 | | | | | | | $ | 275,000 | | | | | | | | - | | | | | | | $ | - | |
| Reinvestment of dividends | | | 124,822 | | | | | | | | 1,350,573 | | | | | | | | 29,613 | | | | | | | | 309,752 | |
| Shares redeemed | | | (1,252 | ) | | | | | | | (13,588 | ) | | | | | | | (58,796 | ) | | | | | | | (572,526 | ) |
| | | | | | | | | | | | | | | | | | | | | | | | | | | | |
| Net increase (decrease) in shares outstanding | | | 148,362 | | | | | | | $ | 1,611,985 | | | | | | | | (29,183 | ) | | | | | | $ | (262,774 | ) |
| | | | | | | | | | | | | | | | | | | | | | | | | | | | |
| | | | |
| | | Y Class | |
| | | Year Ended January 31, | |
| | | 2018 | | | | | | 2017 | |
Grosvenor Long/Short Fund | | Shares | | | | | | Amount | | | | | | Shares | | | | | | Amount | |
| Shares sold | | | 20,612 | | | | | | | $ | 225,000 | | | | | | | | 9,255 | | | | | | | $ | 96,500 | |
| Reinvestment of dividends | | | 2,839 | | | | | | | | 30,664 | | | | | | | | 449 | | | | | | | | 4,695 | |
| Shares redeemed | | | (12,642 | ) | | | | | | | (140,173 | ) | | | | | | | (436 | ) | | | | | | | (4,580 | ) |
| | | | | | | | | | | | | | | | | | | | | | | | | | | | |
| Net increase in shares outstanding | | | 10,809 | | | | | | | $ | 115,491 | | | | | | | | 9,268 | | | | | | | $ | 96,615 | |
| | | | | | | | | | | | | | | | | | | | | | | | | | | | |
| | | | |
| | | Investor Class | |
| | | Year Ended January 31, | |
| | | 2018 | | | | | | 2017 | |
Grosvenor Long/Short Fund | | Shares | | | | | | Amount | | | | | | Shares | | | | | | Amount | |
| Shares sold | | | 47,906 | | | | | | | $ | 522,598 | | | | | | | | 3,471 | | | | | | | $ | 33,712 | |
| Reinvestment of dividends | | | 4,806 | | | | | | | | 51,520 | | | | | | | | 673 | | | | | | | | 7,003 | |
| Shares redeemed | | | (7,889 | ) | | | | | | | (87,672 | ) | | | | | | | (18,720 | ) | | | | | | | (185,132 | ) |
| | | | | | | | | | | | | | | | | | | | | | | | | | | | |
| Net increase (decrease) in shares outstanding | | | 44,823 | | | | | | | $ | 486,446 | | | | | | | | (14,576 | ) | | | | | | $ | (144,417 | ) |
| | | | | | | | | | | | | | | | | | | | | | | | | | | | |
| | | | |
| | | A Class | |
| | | Year Ended January 31, | |
| | | 2018 | | | | | | 2017 | |
Grosvenor Long/Short Fund | | Shares | | | | | | Amount | | | | | | Shares | | | | | | Amount | |
| Shares sold | | | - | | | | | | | $ | - | | | | | | | | 1,211 | | | | | | | $ | 12,123 | |
| Reinvestment of dividends | | | 1,450 | | | | | | | | 15,547 | | | | | | | | 345 | | | | | | | | 3,589 | |
| Shares redeemed | | | - | | | | | | | | - | | | | | | | | (9,862 | ) | | | | | | | (99,703 | ) |
| | | | | | | | | �� | | | | | | | | | | | | | | | | | | | |
| Net increase/(decrease) in shares outstanding | | | 1,450 | | | | | | | $ | 15,547 | | | | | | | | (8,306 | ) | | | | | | $ | (83,991 | ) |
| | | | | | | | | | | | | | | | | | | | | | | | | | | | |
| | | | |
| | | C Class | |
| | | Year Ended January 31, | |
| | | 2018 | | | | | | 2017 | |
Grosvenor Long/Short Fund | | Shares | | | | | | Amount | | | | | | Shares | | | | | | Amount | |
| Shares sold | | | - | | | | | | | $ | - | | | | | | | | 5,482 | | | | | | | $ | 53,784 | |
| Reinvestment of dividends | | | 1,495 | | | | | | | | 15,726 | | | | | | | | 415 | | | | | | | | 4,279 | |
| Shares redeemed | | | (5,799 | ) | | | | | | | (61,887 | ) | | | | | | | - | | | | | | | | - | |
| | | | | | | | | | | | | | | | | | | | | | | | | | | | |
| Net increase (decrease) in shares outstanding | | | (4,304 | ) | | | | | | $ | (46,161 | ) | | | | | | | 5,897 | | | | | | | $ | 58,063 | |
| | | | | | | | | | | | | | | | | | | | | | | | | | | | |
| | | | |
| | | Ultra Class | |
| | | November 15,2017A
to January 31, 2018 | | | | | | | |
Grosvenor Long/Short Fund | | Shares | | | | | | Amount | | | | | | | | | | | | | |
| Shares sold | | | 8,849 | | | | | | | $ | 100,000 | | | | | | | | | | | | | | | | | |
| Reinvestment of dividends | | | 725 | | | | | | | | 7,849 | | | | | | | | | | | | | | | | | |
| | | | | | | | | | | | | | | | | | | | | | | | | | | | |
| Net increase in shares outstanding | | | 9,574 | | | | | | | $ | 107,849 | | | | | | | | | | | | | | | | | |
| | | | | | | | | | | | | | | | | | | | | | | | | | | | |
| | | | |
72
American Beacon FundsSM
Notes to Financial Statements
January 31, 2018
| | | | | | | | | | | | | | | | | | | | | | | | | | | | |
| | | Institutional Class | |
| | | Year Ended
January 31, 2018 | | | | | | November 1, 2016A to
January 31, 2017 | |
Numeric Integrated Alpha Fund | | Shares | | | | | | Amount | | | | | | Shares(1) | | | | | | AmountB | |
| Shares sold | | | - | | | | | | | $ | - | | | | | | | | 500,000 | | | | | | | $ | 5,000,000 | |
| Reinvestment of dividends | | | 195 | | | | | | | | 1,928 | | | | | | | | - | | | | | | | | - | |
| Shares redeemed | | | - | | | | | | | | - | | | | | | | | (957,948 | ) | | | | | | | (9,726,147 | ) |
| | | | | | | | | | | | | | | | | | | | | | | | | | | | |
| Net increase (decrease) in shares outstanding | | | 195 | | | | | | | $ | 1,928 | | | | | | | | (457,948 | ) | | | | | | $ | (4,726,147 | ) |
| | | | | | | | | | | | | | | | | | | | | | | | | | | | |
| | | | |
| | | Y Class | |
| | | Year Ended
January 31, 2018 | | | | | | November 1, 2016A to
January 31, 2017 | |
Numeric Integrated Alpha Fund | | Shares | | | | | | Amount | | | | | | Shares(1) | | | | | | AmountB | |
| Shares sold | | | - | | | | | | | $ | - | | | | | | | | - | | | | | | | $ | - | |
| Reinvestment of dividends | | | 169 | | | | | | | | 1,671 | | | | | | | | - | | | | | | | | - | |
| | | | | | | | | | | | | | | | | | | | | | | | | | | | |
| Net increase in shares outstanding | | | 169 | | | | | | | $ | 1,671 | | | | | | | | - | | | | | | | $ | - | |
| | | | | | | | | | | | | | | | | | | | | | | | | | | | |
| | | | |
| | | Investor Class | |
| | | Year Ended
January 31, 2018 | | | | | | November 1, 2016A to
January 31, 2017 | |
Numeric Integrated Alpha Fund | | Shares | | | | | | Amount | | | | | | Shares(1) | | | | | | AmountB | |
| Shares sold | | | - | | | | | | | $ | - | | | | | | | | - | | | | | | | $ | - | |
| Reinvestment of dividends | | | 162 | | | | | | | | 1,600 | | | | | | | | - | | | | | | | | - | |
| | | | | | | | | | | | | | | | | | | | | | | | | | | | |
| Net increase in shares outstanding | | | 162 | | | | | | | $ | 1,600 | | | | | | | | - | | | | | | | $ | - | |
| | | | | | | | | | | | | | | | | | | | | | | | | | | | |
| | | | |
| | | Ultra Class | |
| | | Year Ended
January 31, 2018 | | | | | | November 1, 2016A to
January 31, 2017 | |
Numeric Integrated Alpha Fund | | Shares | | | | | | Amount | | | | | | Shares(1) | | | | | | AmountB | |
| Shares sold | | | 15,360,264 | | | | | | | $ | 156,192,646 | | | | | | | | 5,733,727 | | | | | | | $ | 58,420,763 | |
| Reinvestment of dividends | | | 150,491 | | | | | | | | 1,492,879 | | | | | | | | - | | | | | | | | - | |
| Shares redeemed | | | (3,491,355 | ) | | | | | | | (35,313,498 | ) | | | | | | | (155,085 | ) | | | | | | | (1,578,837 | ) |
| | | | | | | | | | | | | | | | | | | | | | | | | | | | |
| Net increase in shares outstanding | | | 12,019,400 | | | | | | | $ | 122,372,027 | | | | | | | | 5,578,642 | | | | | | | $ | 56,841,926 | |
| | | | | | | | | | | | | | | | | | | | | | | | | | | | |
A Commencement of operations.
B Seed capital has been received in the amounts of $4,700,000 for Institutional class and $100,000 each for the Y, Investor, and Ultra classes, respectively. As a result, the shares were issued in the amounts of 470,000 for the Institutional Class and 10,000 for each remaining class, respectively.
11. Subsequent Events
Management has evaluated subsequent events for possible recognition or disclosure in the financial statements through the date the financial statements are issued. Management has determined that there are no material events that would require disclosure in the Funds’ financial statements through this date.
73
American Beacon Grosvenor Long/Short FundSM
Financial Highlights
(For a share outstanding throughout the period)
| | | | | | | | | | | | | | | | | | | | |
| | | Institutional Class | |
| | | Year Ended January 31, | | | October 1,
2015A to
January 31, | |
| | | | | |
| | | 2018 | | | | | | 2017 | | | | | | 2016 | |
| | | | |
Net asset value, beginning of period | | $ | 10.66 | | | | | | | $ | 9.79 | | | | | | | $ | 10.00 | |
| | | | | | | | | | | | | | | | | | | | |
Income (loss) from investment operations: | | | | | | | | | | | | | | | | | | | | |
Net investment (loss) | | | (0.16 | )F | | | | | | | (0.14 | ) | | | | | | | (0.02 | ) |
Net gains (losses) on investments (both realized and unrealized) | | | 1.65 | | | | | | | | 1.22 | | | | | | | | (0.19 | ) |
| | | | | | | | | | | | | | | | | | | | |
Total income (loss) from investment operations | | | 1.49 | | | | | | | | 1.08 | | | | | | | | (0.21 | ) |
| | | | | | | | | | | | | | | | | | | | |
Less distributions: | | | | | | | | | | | | | | | | | | | | |
Dividends from net investment income | | | (0.06 | ) | | | | | | | - | | | | | | | | - | |
Distributions from net realized gains | | | (0.83 | ) | | | | | | | (0.21 | ) | | | | | | | - | |
| | | | | | | | | | | | | | | | | | | | |
Total distributions | | | (0.89 | ) | | | | | | | (0.21 | ) | | | | | | | - | |
| | | | | | | | | | | | | | | | | | | | |
Net asset value, end of period | | $ | 11.26 | | | | | | | $ | 10.66 | | | | | | | $ | 9.79 | |
| | | | | | | | | | | | | | | | | | | | |
Total returnB | | | 14.29 | % | | | | | | | 11.06 | % | | | | | | | (2.10 | )%C |
| | | | | | | | | | | | | | | | | | | | |
| | | | | |
Ratios and supplemental data: | | | | | | | | | | | | | | | | | | | | |
Net assets, end of period | | $ | 18,701,925 | | | | | | | $ | 16,119,517 | | | | | | | $ | 15,098,172 | |
Ratios to average net assets: | | | | | | | | | | | | | | | | | | | | |
Expenses, before reimbursements | | | 5.67 | % | | | | | | | 6.13 | % | | | | | | | 11.84 | %D |
Expenses, net of reimbursementsE | | | 4.14 | % | | | | | | | 4.41 | % | | | | | | | 3.95 | %D |
Net investment (loss), before expense reimbursements | | | (3.30 | )% | | | | | | | (3.10 | )% | | | | | | | (10.23 | )%D |
Net investment (loss), net of reimbursements | | | (1.77 | )% | | | | | | | (1.37 | )% | | | | | | | (2.34 | )%D |
Portfolio turnover rate | | | 186 | % | | | | | | | 250 | % | | | | | | | 77 | %C |
| | | | |
| | | Y Class | |
| | | Year Ended January 31, | | | | | | October 1,
2015A to
January 31, | |
| | | | | |
| | | 2018 | | | | | | 2017 | | | | | | 2016 | |
| | | | |
Net asset value, beginning of period | | $ | 10.65 | | | | | | | $ | 9.79 | | | | | | | $ | 10.00 | |
| | | | | | | | | | | | | | | | | | | | |
Income (loss) from investment operations: | | | | | | | | | | | | | | | | | | | | |
Net investment (loss) | | | (0.15 | )F | | | | | | | (0.10 | ) | | | | | | | (0.01 | ) |
Net gains (losses) on investments (both realized and unrealized) | | | 1.62 | | | | | | | | 1.17 | | | | | | | | (0.20 | ) |
| | | | | | | | | | | | | | | | | | | | |
Total income (loss) from investment operations | | | 1.47 | | | | | | | | 1.07 | | | | | | | | (0.21 | ) |
| | | | | | | | | | | | | | | | | | | | |
Less distributions: | | | | | | | | | | | | | | | | | | | | |
Dividends from net investment income | | | (0.06 | ) | | | | | | | - | | | | | | | | - | |
Distributions from net realized gains | | | (0.83 | ) | | | | | | | (0.21 | ) | | | | | | | - | |
| | | | | | | | | | | | | | | | | | | | |
Total distributions | | | (0.89 | ) | | | | | | | (0.21 | ) | | | | | | | - | |
| | | | | | | | | | | | | | | | | | | | |
Net asset value, end of period | | $ | 11.23 | | | | | | | $ | 10.65 | | | | | | | $ | 9.79 | |
| | | | | | | | | | | | | | | | | | | | |
Total returnB | | | 14.11 | % | | | | | | | 10.96 | % | | | | | | | (2.10 | )%C |
| | | | | | | | | | | | | | | | | | | | |
| | | | | |
Ratios and supplemental data: | | | | | | | | | | | | | | | | | | | | |
Net assets, end of period | | $ | 416,381 | | | | | | | $ | 279,480 | | | | | | | $ | 166,300 | |
Ratios to average net assets: | | | | | | | | | | | | | | | | | | | | |
Expenses, before reimbursements | | | 5.75 | % | | | | | | | 6.58 | % | | | | | | | 14.92 | %D |
Expenses, net of reimbursementsE | | | 4.27 | % | | | | | | | 4.49 | % | | | | | | | 4.03 | %D |
Net investment (loss), before expense reimbursements | | | (3.36 | )% | | | | | | | (3.57 | )% | | | | | | | (13.32 | )%D |
Net investment (loss), net of reimbursements | | | (1.88 | )% | | | | | | | (1.48 | )% | | | | | | | (2.43 | )%D |
Portfolio turnover rate | | | 186 | % | | | | | | | 250 | % | | | | | | | 77 | %C |
| A | Commencement of operations. |
| B | Based on net asset value, which does not reflect the sales charge, redemption fee, or contingent deferred sales charge, if applicable. May include adjustments in accordance with U.S. GAAP and as such, the net asset value for reporting purposes and the returns based upon those net asset values may differ from the net asset value and returns for shareholder transactions. |
| E | Includes non-operating expenses consisting of prime broker fees and dividend from securities sold short. The expenses, net of reimbursements ratios excluding non-operating expenses are 2.10% and 2.20% for the Institutional and Y Classes, respectively, for the years(s) disclosed above. |
| F | Includes non-recurring dividends. Without these dividends, net investment income per share would have been $(0.18) and $(0.17) for Institutional Class and Y Class, respectively. |
See accompanying notes
74
American Beacon Grosvenor Long/Short FundSM
Financial Highlights
(For a share outstanding throughout the period)
| | | | | | | | | | | | | | | | | | | | |
| | | Investor Class | |
| | | Year Ended January 31, | | | October 1,
2015A to
January 31, | |
| | | | | |
| | | 2018 | | | | | | 2017 | | | | | | 2016 | |
| | | | |
Net asset value, beginning of period | | $ | 10.60 | | | | | | | $ | 9.78 | | | | | | | $ | 10.00 | |
| | | | | | | | | | | | | | | | | | | | |
Income (loss) from investment operations: | | | | | | | | | | | | | | | | | | | | |
Net investment (loss) | | | (0.02 | )F | | | | | | | (0.21 | ) | | | | | | | (0.01 | ) |
Net gains (losses) on investments (both realized and unrealized) | | | 1.46 | | | | | | | | 1.24 | | | | | | | | (0.21 | ) |
| | | | | | | | | | | | | | | | | | | | |
Total income (loss) from investment operations | | | 1.44 | | | | | | | | 1.03 | | | | | | | | (0.22 | ) |
| | | | | | | | | | | | | | | | | | | | |
Less distributions: | | | | | | | | | | | | | | | | | | | | |
Dividends from net investment income | | | (0.06 | ) | | | | | | | - | | | | | | | | - | |
Distributions from net realized gains | | | (0.83 | ) | | | | | | | (0.21 | ) | | | | | | | - | |
| | | | | | | | | | | | | | | | | | | | |
Total distributions | | | (0.89 | ) | | | | | | | (0.21 | ) | | | | | | | - | |
| | | | | | | | | | | | | | | | | | | | |
Net asset value, end of period | | $ | 11.15 | | | | | | | $ | 10.60 | | | | | | | $ | 9.78 | |
| | | | | | | | | | | | | | | | | | | | |
Total returnB | | | 13.89 | % | | | | | | | 10.56 | % | | | | | | | (2.20 | )%C |
| | | | | | | | | | | | | | | | | | | | |
| | | | | |
Ratios and supplemental data: | | | | | | | | | | | | | | | | | | | | |
Net assets, end of period | | $ | 881,290 | | | | | | | $ | 362,643 | | | | | | | $ | 477,097 | |
Ratios to average net assets: | | | | | | | | | | | | | | | | | | | | |
Expenses, before reimbursements | | | 6.04 | % | | | | | | | 6.89 | % | | | | | | | 15.21 | %D |
Expenses, net of reimbursementsE | | | 4.51 | % | | | | | | | 4.82 | % | | | | | | | 4.37 | %D |
Net investment (loss), before expense reimbursements | | | (3.66 | )% | | | | | | | (3.80 | )% | | | | | | | (13.54 | )%D |
Net investment (loss), net of reimbursements | | | (2.13 | )% | | | | | | | (1.73 | )% | | | | | | | (2.69 | )%D |
Portfolio turnover rate | | | 186 | % | | | | | | | 250 | % | | | | | | | 77 | %C |
| | | | |
| | | A Class | |
| | | Year Ended January 31, | | | October 1,
2015A to
January 31, | |
| | | | | |
| | | 2018 | | | | | | 2017 | | | | | | 2016 | |
| | | | |
Net asset value, beginning of period | | $ | 10.60 | | | | | | | $ | 9.78 | | | | | | | $ | 10.00 | |
| | | | | | | | | | | | | | | | | | | | |
Income (loss) from investment operations: | | | | | | | | | | | | | | | | | | | | |
Net investment (loss) | | | (0.20 | )F | | | | | | | (0.23 | ) | | | | | | | (0.02 | ) |
Net gains (losses) on investments (both realized and unrealized) | | | 1.64 | | | | | | | | 1.26 | | | | | | | | (0.20 | ) |
| | | | | | | | | | | | | | | | | | | | |
Total income (loss) from investment operations | | | 1.44 | | | | | | | | 1.03 | | | | | | | | (0.22 | ) |
| | | | | | | | | | | | | | | | | | | | |
Less distributions: | | | | | | | | | | | | | | | | | | | | |
Dividends from net investment income | | | (0.06 | ) | | | | | | | - | | | | | | | | - | |
Distributions from net realized gains | | | (0.83 | ) | | | | | | | (0.21 | ) | | | | | | | - | |
| | | | | | | | | | | | | | | | | | | | |
Total distributions | | | (0.89 | ) | | | | | | | (0.21 | ) | | | | | | | - | |
| | | | | | | | | | | | | | | | | | | | |
Net asset value, end of period | | $ | 11.15 | | | | | | | $ | 10.60 | | | | | | | $ | 9.78 | |
| | | | | | | | | | | | | | | | | | | | |
Total returnB | | | 13.89 | % | | | | | | | 10.56 | % | | | | | | | (2.20 | )%C |
| | | | | | | | | | | | | | | | | | | | |
| | | | | |
Ratios and supplemental data: | | | | | | | | | | | | | | | | | | | | |
Net assets, end of period | | $ | 211,579 | | | | | | | $ | 185,823 | | | | | | | $ | 252,710 | |
Ratios to average net assets: | | | | | | | | | | | | | | | | | | | | |
Expenses, before reimbursements | | | 6.06 | % | | | | | | | 6.96 | % | | | | | | | 14.66 | %D |
Expenses, net of reimbursementsE | | | 4.54 | % | | | | | | | 4.88 | % | | | | | | | 4.36 | %D |
Net investment (loss), before expense reimbursements | | | (3.69 | )% | | | | | | | (3.89 | )% | | | | | | | (13.03 | )%D |
Net investment (loss), net of reimbursements | | | (2.17 | )% | | | | | | | (1.80 | )% | | | | | | | (2.74 | )%D |
Portfolio turnover rate | | | 186 | % | | | | | | | 250 | % | | | | | | | 77 | %C |
| A | Commencement of operations. |
| B | Based on net asset value, which does not reflect the sales charge, redemption fee, or contingent deferred sales charge, if applicable. May include adjustments in accordance with U.S. GAAP and as such, the net asset value for reporting purposes and the returns based upon those net asset values may differ from the net asset value and returns for shareholder transactions. |
| E | Includes non-operating expenses consisting of prime broker fees and dividend from securities sold short. The expenses, net of reimbursements ratios excluding non-operating expenses are 2.48% and 2.50% for the Investor and A Classes, respectively, for the years(s) disclosed above. |
| F | Includes non-recurring dividends. Without these dividends, net investment income per share would have been $(0.03) and $(0.22) for Investor Class and A Class, respectively. |
See accompanying notes
75
American Beacon Grosvenor Long/Short FundSM
Financial Highlights
(For a share outstanding throughout the period)
| | | | | | | | | | | | | | | | | | | | |
| | | C Class | |
| | | Year Ended January 31, | | | October 1,
2015A to
January 31, | |
| | | | | |
| | | 2018 | | | | | | 2017 | | | | | | 2016 | |
| | | | |
Net asset value, beginning of period | | $ | 10.49 | | | | | | | $ | 9.76 | | | | | | | $ | 10.00 | |
| | | | | | | | | | | | | | | | | | | | |
Income (loss) from investment operations: | | | | | | | | | | | | | | | | | | | | |
Net investment (loss) | | | (0.43 | )F | | | | | | | (0.22 | ) | | | | | | | (0.05 | ) |
Net gains (losses) on investments (both realized and unrealized) | | | 1.77 | | | | | | | | 1.16 | | | | | | | | (0.19 | ) |
| | | | | | | | | | | | | | | | | | | | |
Total income (loss) from investment operations | | | 1.34 | | | | | | | | 0.94 | | | | | | | | (0.24 | ) |
| | | | | | | | | | | | | | | | | | | | |
Less distributions: | | | | | | | | | | | | | | | | | | | | |
Dividends from net investment income | | | (0.06 | ) | | | | | | | - | | | | | | | | - | |
Distributions from net realized gains | | | (0.83 | ) | | | | | | | (0.21 | ) | | | | | | | - | |
| | | | | | | | | | | | | | | | | | | | |
Total distributions | | | (0.89 | ) | | | | | | | (0.21 | ) | | | | | | | - | |
| | | | | | | | | | | | | | | | | | | | |
Net asset value, end of period | | $ | 10.94 | | | | | | | $ | 10.49 | | | | | | | $ | 9.76 | |
| | | | | | | | | | | | | | | | | | | | |
Total returnB | | | 13.07 | % | | | | | | | 9.66 | % | | | | | | | (2.40 | )%C |
| | | | | | | | | | | | | | | | | | | | |
| | | | | |
Ratios and supplemental data: | | | | | | | | | | | | | | | | | | | | |
Net assets, end of period | | $ | 181,475 | | | | | | | $ | 219,289 | | | | | | | $ | 146,348 | |
Ratios to average net assets: | | | | | | | | | | | | | | | | | | | | |
Expenses, before reimbursements | | | 6.80 | % | | | | | | | 7.62 | % | | | | | | | 16.08 | %D |
Expenses, net of reimbursementsE | | | 5.31 | % | | | | | | | 5.53 | % | | | | | | | 5.10 | %D |
Net investment (loss), before expense reimbursements | | | (4.40 | )% | | | | | | | (4.61 | )% | | | | | | | (14.48 | )%D |
Net investment (loss), net of reimbursements | | | (2.91 | )% | | | | | | | (2.52 | )% | | | | | | | (3.49 | )%D |
Portfolio turnover rate | | | 186 | % | | | | | | | 250 | % | | | | | | | 77 | %C |
| | | | |
| | | | |
| | | Ultra | |
| | | November 14,
2017A to
January 31, | |
| | | 2018 | |
| | | | |
Net asset value, beginning of period | | $ | 11.30 | |
| | | | |
Income (loss) from investment operations: | | | | |
Net investment (loss) | | | (0.02 | )F |
Net gains on investments (both realized and unrealized) | | | 0.88 | |
| | | | |
Total income (loss) from investment operations | | | 0.86 | |
| | | | |
Less distributions: | | | | |
Dividends from net investment income | | | (0.06 | ) |
Distributions from net realized gains | | | (0.83 | ) |
| | | | |
Total distributions | | | (0.89 | ) |
| | | | |
Net asset value, end of period | | $ | 11.27 | |
| | | | |
Total returnB | | | 7.90 | %C |
| | | | |
| |
Ratios and supplemental data: | | | | |
Net assets, end of period | | $ | 107,867 | |
Ratios to average net assets: | | | | |
Expenses, before reimbursements | | | 7.68 | %D |
Expenses, net of reimbursementsE | | | 3.21 | %D |
Net investment (loss), before expense reimbursements | | | (5.43 | )%D |
Net investment (loss), net of reimbursements | | | (0.96 | )%D |
Portfolio turnover rate | | | 186 | %C |
| A | Commencement of operations. |
| B | Based on net asset value, which does not reflect the sales charge, redemption fee, or contingent deferred sales charge, if applicable. May include adjustments in accordance with U.S. GAAP and as such, the net asset value for reporting purposes and the returns based upon those net asset values may differ from the net asset value and returns for shareholder transactions. |
| E | Includes non-operating expenses consisting of prime broker fees and dividend from securities sold short. The expenses, net of reimbursements ratio excluding non-operating expenses are 3.25% and 1.99% for the C and Ultra Classes, respectively, for the year(s) disclosed above. |
| F | Includes non-recurring dividends. Without these dividends, net investment income per share would have been $(0.45) and $(0.04) for C Class and Ultra Class, respectively. |
See accompanying notes
76
American Beacon Numeric Integrated Alpha FundSM
Financial Highlights
(For a share outstanding throughout the period)
| | | | | | | | | | | | |
| | | Institutional Class | |
| | | Year
Ended
January 31, | | | | | | November 1,
2016A to
January 31, | |
| | | 2018 | | | | | | 2017 | |
| | | | |
Net asset value, beginning of period | | $ | 10.28 | | | | | | | $ | 10.00 | |
| | | | | | | | | | | | |
Income (loss) from investment operations: | | | | | | | | | | | | |
Net investment (loss) | | | (0.23 | ) | | | | | | | (4.25 | ) |
Net gains on investments (both realized and unrealized) | | | 0.13 | | | | | | | | 4.53 | |
| | | | | | | | | | | | |
Total income (loss) from investment operations | | | (0.10 | ) | | | | | | | 0.28 | |
| | | | | | | | | | | | |
Less distributions: | | | | | | | | | | | | |
Dividends from net investment income | | | - | | | | | | | | - | |
Distributions from net realized gains | | | (0.16 | ) | | | | | | | - | |
| | | | | | | | | | | | |
Total distributions | | | (0.16 | ) | | | | | | | - | |
| | | | | | | | | | | | |
Net asset value, end of period | | $ | 10.02 | | | | | | | $ | 10.28 | |
| | | | | | | | | | | | |
Total returnB | | | (0.96 | )% | | | | | | | 2.80 | %C |
| | | | | | | | | | | | |
| | | |
Ratios and supplemental data: | | | | | | | | | | | | |
Net assets, end of period | | $ | 122,715 | | | | | | | $ | 123,935 | |
Ratios to average net assets: | | | | | | | | | | | | |
Expenses, before reimbursements | | | 4.82 | % | | | | | | | 6.48 | %D |
Expenses, net of reimbursementsE | | | 4.80 | % | | | | | | | 4.56 | %D |
Net investment (loss), before expense reimbursements | | | (3.02 | )% | | | | | | | (4.74 | )%D |
Net investment (loss), net of reimbursements | | | (3.00 | )% | | | | | | | (2.82 | )%D |
Portfolio turnover rate | | | 329 | % | | | | | | | 114 | %C |
| | | | |
| | | Y Class | |
| | | Year
Ended
January 31, | | | | | | November 1,
2016A to
January 31, | |
| | | 2018 | | | | | | 2017 | |
| | | | |
Net asset value, beginning of period | | $ | 10.26 | | | | | | | $ | 10.00 | |
| | | | | | | | | | | | |
Income (loss) from investment operations: | | | | | | | | | | | | |
Net investment (loss) | | | (0.31 | ) | | | | | | | (0.08 | ) |
Net gains on investments (both realized and unrealized) | | | 0.23 | | | | | | | | 0.34 | |
| | | | | | | | | | | | |
Total income (loss) from investment operations | | | (0.08 | ) | | | | | | | 0.26 | |
| | | | | | | | | | | | |
Less distributions: | | | | | | | | | | | | |
Dividends from net investment income | | | (0.01 | ) | | | | | | | - | |
Distributions from net realized gains | | | (0.16 | ) | | | | | | | - | |
| | | | | | | | | | | | |
Total distributions | | | (0.17 | ) | | | | | | | - | |
| | | | | | | | | | | | |
Net asset value, end of period | | $ | 10.01 | | | | | | | $ | 10.26 | |
| | | | | | | | | | | | |
Total returnB | | | (0.79 | )% | | | | | | | 2.60 | %C |
| | | | | | | | | | | | |
| | | |
Ratios and supplemental data: | | | | | | | | | | | | |
Net assets, end of period | | $ | 101,793 | | | | | | | $ | 102,596 | |
Ratios to average net assets: | | | | | | | | | | | | |
Expenses, before reimbursements | | | 4.92 | % | | | | | | | 12.24 | %D |
Expenses, net of reimbursementsE | | | 4.90 | % | | | | | | | 4.62 | %D |
Net investment (loss), before expense reimbursements | | | (3.12 | )% | | | | | | | (10.64 | )%D |
Net investment (loss), net of reimbursements | | | (3.10 | )% | | | | | | | (3.02 | )%D |
Portfolio turnover rate | | | 329 | % | | | | | | | 114 | %C |
| A | Commencement of operations. |
| B | Based on net asset value, which does not reflect the sales charge, redemption fee, or contingent deferred sales charge, if applicable. May include adjustments in accordance with U.S. GAAP and as such, the net asset value for reporting purposes and the returns based upon those net asset values may differ from the net asset value and returns for shareholder transactions. |
| E | Includes non-operating expenses consisting of prime broker fees and dividend from securities sold short. The expenses, net of reimbursements ratios excluding non-operating expenses are 1.95% and 2.05% for the Institutional and Y Classes, respectively, for the year(s) disclosed above. |
See accompanying notes
77
American Beacon Numeric Integrated Alpha FundSM
Financial Highlights
(For a share outstanding throughout the period)
| | | | | | | | | | | | |
| | | Investor Class | |
| | | Year
Ended
January 31, | | | | | | November 1,
2016A to
January 31, | |
| | | 2018 | | | | | | 2017 | |
| | | | |
Net asset value, beginning of period | | $ | 10.25 | | | | | | | $ | 10.00 | |
| | | | | | | | | | | | |
Income (loss) from investment operations: | | | | | | | | | | | | |
Net investment (loss) | | | (0.34 | ) | | | | | | | (0.08 | ) |
Net gains on investments (both realized and unrealized) | | | 0.23 | | | | | | | | 0.33 | |
| | | | | | | | | | | | |
Total income (loss) from investment operations | | | (0.11 | ) | | | | | | | 0.25 | |
| | | | | | | | | | | | |
Less distributions: | | | | | | | | | | | | |
Dividends from net investment income | | | - | | | | | | | | - | |
Distributions from net realized gains | | | (0.16 | ) | | | | | | | - | |
| | | | | | | | | | | | |
Total distributions | | | (0.16 | ) | | | | | | | - | |
| | | | | | | | | | | | |
Net asset value, end of period | | $ | 9.98 | | | | | | | $ | 10.25 | |
| | | | | | | | | | | | |
Total returnB | | | (1.06 | )% | | | | | | | 2.50 | %C |
| | | | | | | | | | | | |
| | | |
Ratios and supplemental data: | | | | | | | | | | | | |
Net assets, end of period | | $ | 101,438 | | | | | | | $ | 102,524 | |
Ratios to average net assets: | | | | | | | | | | | | |
Expenses, before reimbursements | | | 6.26 | % | | | | | | | 13.71 | %D |
Expenses, net of reimbursementsE | | | 5.18 | % | | | | | | | 4.90 | %D |
Net investment (loss), before expense reimbursements | | | (4.46 | )% | | | | | | | (12.11 | )%D |
Net investment (loss), net of reimbursements | | | (3.38 | )% | | | | | | | (3.30 | )%D |
Portfolio turnover rate | | | 329 | % | | | | | | | 114 | %C |
| | | | |
| | | Ultra | |
| | | Year
Ended
January 31, | | | | | | November 1,
2016A to
January 31, | |
| | | 2018 | | | | | | 2017 | |
| | | | |
Net asset value, beginning of period | | $ | 10.27 | | | | | | | $ | 10.00 | |
| | | | | | | | | | | | |
Income (loss) from investment operations: | | | | | | | | | | | | |
Net investment (loss) | | | (0.20 | ) | | | | | | | (0.05 | ) |
Net gains on investments (both realized and unrealized) | | | 0.14 | | | | | | | | 0.32 | |
| | | | | | | | | | | | |
Total income (loss) from investment operations | | | (0.06 | ) | | | | | | | 0.27 | |
| | | | | | | | | | | | |
Less distributions: | | | | | | | | | | | | |
Dividends from net investment income | | | (0.03 | ) | | | | | | | - | |
Distributions from net realized gains | | | (0.16 | ) | | | | | | | - | |
| | | | | | | | | | | | |
Total distributions | | | (0.19 | ) | | | | | | | - | |
| | | | | | | | | | | | |
Net asset value, end of period | | $ | 10.02 | | | | | | | $ | 10.27 | |
| | | | | | | | | | | | |
Total returnB | | | (0.57 | )% | | | | | | | 2.70 | %C |
| | | | | | | | | | | | |
| | | |
Ratios and supplemental data: | | | | | | | | | | | | |
Net assets, end of period | | $ | 176,414,475 | | | | | | | $ | 57,379,342 | |
Ratios to average net assets: | | | | | | | | | | | | |
Expenses, before reimbursements | | | 4.90 | % | | | | | | | 6.74 | %D |
Expenses, net of reimbursementsE | | | 4.70 | % | | | | | | | 4.87 | %D |
Net investment income (loss), before expense reimbursements | | | (3.04 | )% | | | | | | | (5.04 | )%D |
Net investment (loss), net of reimbursements | | | (2.84 | )% | | | | | | | (3.17 | )%D |
Portfolio turnover rate | | | 329 | % | | | | | | | 114 | %C |
| A | Commencement of operations. |
| B | Based on net asset value, which does not reflect the sales charge, redemption fee, or contingent deferred sales charge, if applicable. May include adjustments in accordance with U.S. GAAP and as such, the net asset value for reporting purposes and the returns based upon those net asset values may differ from the net asset value and returns for shareholder transactions. |
| E | Includes non-operating expenses consisting of prime broker fees and dividend from securities sold short. The expenses, net of reimbursements ratios excluding non-operating expenses are 2.33% and 1.85% for the Investor and Ultra Classes, respectively, for the year(s) disclosed above. |
See accompanying notes
78
American Beacon FundsSM
Federal Tax Information
January 31, 2018 (Unaudited)
Certain tax information regarding the Funds is required to be provided to shareholders based upon the Funds’ income and distributions for the taxable year ended January 31, 2018. The information and distributions reported herein may differ from information and distributions taxable to the shareholders for the calendar year ended December 31, 2017.
The Funds designated the following items with regard to distributions paid during the fiscal year ended January 31, 2018. All designations are based on financial information available as of this annual report and, accordingly, are subject to change. For each item, it is the intention of the Funds to designate the maximum amount permitted under the Internal Revenue Code of 1986, as amended, and the regulations there under.
Corporate Dividends-Received Deduction:
| | | | | | | | |
Grosvenor | | | 22.34 | % | | | | |
Numeric Integrated | | | 25.68 | % | | | | |
Qualified Dividend Income:
| | | | | | | | |
Grosvenor | | | 29.88 | % | | | | |
Numeric Integrated | | | 28.13 | % | | | | |
Long-Term Capital Gain Distributions:
| | | | | | | | |
Grosvenor | | $ | 660,943 | | | | | |
Numeric Integrated | | | 1,070,785 | | | | | |
Short-Term Capital Gain Distributions:
| | | | | | | | |
Grosvenor | | $ | 714,210 | | | | | |
Numeric Integrated | | | 1,896,772 | | | | | |
Shareholders received notification in January 2018 of the applicable tax information necessary to prepare their 2017 income tax returns.
79
Disclosure Regarding Approval of the Management and Investment Advisory Agreements (Unaudited)
Approval Related to American Beacon Grosvenor Long/Short Fund
At its August 22-23, 2017 meetings, the Board of Trustees (“Board”) considered the approval of a new investment advisory agreement among American Beacon Advisors, Inc. (“Manager”), Electron Capital Partners, LLC. (“Electron”) and Grosvenor Capital Management, L.P. (“Grosvenor”), with respect to the American Beacon Grosvenor Long/Short Fund (“Grosvenor Fund”), a series of the Trust (the “Electron Agreement”).
Prior to the Board meeting, the Board reviewed information provided by Electron in response to requests from the Board and/or the Manager in connection with the Board’s consideration of the Electron Agreement, and the Investment Committee of the Board met with representatives of Electron. Also in attendance at that Investment Committee meeting were representatives of the Manager and Grosvenor, the lead subadviser to the Grosvenor Fund, who explained the basis for Grosvenor’s recommendation of Electron.
Provided below is an overview of the primary factors the Board considered when it approved the Electron Agreement. The Board considered, among other things, the following factors: (1) the nature and quality of the services to be provided; (2) the investment performance of certain accounts managed by Electron; (3) the extent to which economies of scale, if any, have been taken into account in setting the fee schedule; (4) whether fee levels reflect these economies of scale, if any, for the benefit of investors; (5) comparisons of services and fees with contracts entered into by Electron with other clients; and (6) any other benefits anticipated to be derived by Electron from its relationship with the Grosvenor Fund. In addition, the Board considered that Electron would be compensated for its services exclusively by Grosvenor from its fixed rate advisory fee, and not by the Grosvenor Fund.
The Board did not identify any particular information that was most relevant to its consideration of the Electron Agreement, and each Trustee may have afforded different weight to the various factors. Legal counsel to the Independent Trustees provided the Board with a memorandum regarding its responsibilities pertaining to the approval of investment advisory contracts, such as the Electron Agreement. The memorandum explained the regulatory requirements surrounding the Trustees’ process for evaluating investment advisors and the terms of investment advisory contracts. Based on its evaluation, the Board unanimously concluded that the terms of the Electron Agreement were reasonable and fair and that the approval of the Electron Agreement was in the best interests of the Grosvenor Fund.
Additional Considerations With Respect to the Approval of the Electron Agreement
Nature, extent and quality of the services to be provided by Electron. The Board considered information regarding Electron’s principal business activities, its reputation, financial condition and overall capabilities to perform the services under the Electron Agreement. In addition, the Board considered the background and experience of the personnel who will be assigned responsibility for managing Electron’s allocation of the Grosvenor Fund. The Board also considered Electron’s investment resources, infrastructure and the adequacy of its compliance program. In addition, the Board took into consideration that Grosvenor had recommended Electron, and the Manager had not identified any issues that would warrant a contrary recommendation by it. The Board considered Electron’s representations regarding its financial condition and that its current staffing levels were adequate to service the Grosvenor Fund. Based on this information, the Board concluded that the nature, extent and quality of the advisory services to be provided by Electron were appropriate for the Grosvenor Fund in light of its investment objective, and, thus, supported a decision to approve the Electron Agreement.
Performance of Electron. The Board evaluated the information provided by Electron regarding the performance of a hedge fund managed by Electron (the “Hedge Fund”) relative to the performance of the MSCI World Utilities Index and the S&P 500 Index. The Board considered Electron’s representation that, for various periods ended June 30, 2017, the Hedge Fund’s performance relative to these benchmarks generally was favorable. The Board also considered Electron’s representation that the Grosvenor Fund’s strategy would not be identical to that of the Hedge Fund and that Electron does not currently manage any other accounts in a strategy that is similar to that of the Grosvenor Fund. Based on the foregoing information, the Board concluded that the historical investment performance record of Electron supported approval of the Electron Agreement.
80
Disclosure Regarding Approval of the Management and Investment Advisory Agreements (Unaudited)
Comparisons of the amounts to be paid under the Electron Agreement with those under contracts between Electron and its other clients. In evaluating the Electron Agreement, the Board reviewed the proposed advisory fee rate for services to be performed by Electron on behalf of the Grosvenor Fund. The Board considered Electron’s representation that it does not provide comparable services to its other clients. The Board also considered Electron’s representation that the investment advisory fee rate proposed for the Grosvenor Fund is lower than the standard fee for the Hedge Fund and the fee rate charged by Electron to any other fee-based account. After evaluating this information, the Board concluded that the advisory fee rate under the Electron Agreement was reasonable in light of the services to be provided to the Grosvenor Fund.
Costs of the services to be provided and profits to be realized by Electron and its affiliates from its relationship with the Grosvenor Fund. The Board did not consider the costs of the services to be provided and profits to be realized by Electron from its relationship with the Grosvenor Fund, noting instead the arm’s-length nature of the relationship between the Manager, Electron and Grosvenor with respect to the negotiation of the advisory fee rate on behalf of the Grosvenor Fund.
Economies of Scale. The Board considered Electron’s representation that potential future economies of scale were reflected in the proposed investment advisory fee rate under the Electron Agreement.
Benefits to be derived by Electron from the relationship with the Grosvenor Fund. The Board considered the “fall-out” or ancillary benefits that might accrue to Electron as a result of its relationship with the Grosvenor Fund, including Electron’s representation that it may receive soft dollar benefits in connection with Grosvenor Fund transactions. Based on the foregoing information, the Board concluded that the potential benefits accruing to Electron by virtue of its relationship with the Grosvenor Fund appear to be fair and reasonable.
Board’s Conclusion. Based on the various considerations described above, the Board, including a majority of Trustees who are not “interested persons” of the Fund, the Manager, Grosvenor or Electron, as that term is defined in the 1940 Act, concluded that the proposed investment advisory fee rate is fair and reasonable and that the approval of the Electron Agreement is in the best interests of the Grosvenor Fund and approved the Electron Agreement.
81
Trustees and Officers of the American Beacon FundsSM (Unaudited)
The Trustees and officers of the American Beacon Funds (the “Trust”) are listed below, together with their principal occupations during the past five years. The address of each person listed below is 220 Las Colinas Boulevard East, Suite 1200, Irving, Texas 75039. Each Trustee oversees thirty-five funds in the fund complex that includes the Trust, the American Beacon Select Funds and the American Beacon Institutional Funds Trust. The Trust’s Statement of Additional Information contains additional information about the Trustees and is available without charge by calling 1-800-658-5811.
| | | | |
Name, Age and Address | | Position, Term of Office and Length of Time Served with the Trust | | Principal Occupation(s) During Past 5 Years and Current Directorships |
| INTERESTED TRUSTEES | | Term | | |
| | Lifetime of Trust until removal, resignation or retirement* | | |
| | |
| Alan D. Feld** (81) | | Trustee since 1996 | | Sole Shareholder of a professional corporation which is a Partner in the law firm of Akin, Gump, Strauss, Hauer & Feld, LLP (law firm) (1960-Present); Trustee, American Beacon Mileage Funds (1996-2012); Trustee, American Beacon Select Funds (1999-Present); Trustee, American Beacon Master Trust (1996-2012); Trustee, American Beacon Institutional Funds Trust (2017-Present). |
| | |
| NON-INTERESTED TRUSTEES | | Term | | |
| | Lifetime of Trust until removal, resignation or retirement* | | |
| | |
| Gilbert G. Alvarado (48) | | Trustee since 2015 | | Director, Kura MD, Inc. (local telehealth organization) (2015-present); Vice President & CFO, Sierra Health Foundation (health conversion private foundation) (2006-Present); Vice President & CFO, Sierra Health Foundation: Center for Health Program Management (California public benefit corporation) (2012-Present); Director, Innovative North State (2012-2015); Director, Sacramento Regional Technology Alliance (2011-2016); Director, Women’s Empowerment (2009-2014); Director, Valley Healthcare Staffing (2017–present); Trustee, American Beacon Select Funds (2015-Present); Trustee, American Beacon Institutional Funds Trust (2017-Present). |
| | |
| Joseph B. Armes (55) | | Trustee since 2015 | | Chairman & CEO, CSW Industrials f/k/a Capital Southwest Corporation (investment company) (2015-Present); Chairman of the Board of Capital Southwest Corporation, predecessor to CSW Industrials, Inc. (2014-present) (investment company); CEO, Capital Southwest Corporation (2013-2015); President & CEO, JBA Investment Partners (family investment vehicle) (2010-Present); Director and Chair of Audit Committee, RSP Permian (oil and gas producer) (2013-Present); Trustee, American Beacon Select Funds (2015-Present); Trustee, American Beacon Institutional Funds Trust (2017-Present). |
| | |
| Gerard J. Arpey (59) | | Trustee since 2012 | | Director, The Home Depot, Inc. (2015-Present); Partner, Emerald Creek Group (private equity firm) (2011-Present); Director, S.C. Johnson & Son, Inc. (privately held company) (2008-present); Trustee, American Beacon Select Funds (2012-Present); Trustee, American Beacon Institutional Funds Trust (2017-Present). |
| | |
| Brenda A. Cline (57) | | Trustee since 2004 | | Executive Vice President, Chief Financial Officer, Treasurer and Secretary, Kimbell Art Foundation (1993-Present); Director, Range Resources Corporation (oil and natural gas company) (2015-Present); Director, Tyler Technologies, Inc. (public sector software solutions company) (2014-Present); Trustee, American Beacon Mileage Funds (2004-2012); Trustee, American Beacon Select Funds (2004-Present); Trustee, American Beacon Master Trust (2004-2012); Trustee, American Beacon Institutional Funds Trust (2017-Present). |
82
Trustees and Officers of the American Beacon FundsSM (Unaudited)
| | | | |
Name, Age and Address | | Position, Term of Office and Length of Time Served with the Trust | | Principal Occupation(s) During Past 5 Years and Current Directorships |
| NON-INTERESTED TRUSTEES (CONT.) | | Term | | |
| | Lifetime of Trust until removal, resignation or retirement* | | |
| | |
| Eugene J. Duffy (63) | | Trustee since 2008 | | Managing Director, Global Investment Management Distribution, Mesirow Financial (2016-Present); Managing Director, Institutional Services, Intercontinental Real Estate Corporation (2014-Present); Principal and Executive Vice President, Paradigm Asset Management (1994-2014); Director, Sunrise Bank of Atlanta (2008-2013); Trustee, American Beacon Mileage Funds (2008-2012); Trustee, American Beacon Select Funds (2008-Present); Trustee, American Beacon Master Trust (2008-2012); Trustee, American Beacon Institutional Funds Trust (2017-Present). |
| | |
| Douglas A. Lindgren*** (56) | | Trustee since 2018 | | CEO North America, Carne Global Financial Services (2016-2017); Managing Director, IPS Investment Management and Global Head, Content Management, UBS Wealth Management (2010-2016); Managing Director, P&S Hedge Funds, UBS Wealth Management (2008-2010); Managing Director, Head of Alternative Investments, UBS Financial Services, Inc. (2005-2008). |
| | |
| Richard A. Massman (74) | | Trustee since 2004 Chairman since 2008 | | Consultant and General Counsel Emeritus, Hunt Consolidated, Inc. (holding company engaged in oil and gas exploration and production, refining, real estate, farming, ranching and venture capital activities) (2009-Present); Trustee, American Beacon Mileage Funds (2004-2012); Trustee, American Beacon Select Funds (2004-Present); Trustee, American Beacon Master Trust (2004-2012); Trustee, American Beacon Institutional Funds Trust (2017-Present). |
| | |
| Barbara J. McKenna, CFA (54) | | Trustee since 2012 | | Managing Principal, Longfellow Investment Management Company (2005-Present); Trustee, American Beacon Select Funds (2012-Present); Trustee, American Beacon Institutional Funds Trust (2017-Present). |
| | |
| R. Gerald Turner (72) | | Trustee since 2001 | | President, Southern Methodist University (1995-Present); Director, J.C. Penney Company, Inc. (1996-Present); Director, Kronus Worldwide Inc. (chemical manufacturing) (2003-Present); Trustee, American Beacon Mileage Funds (2001-2012); Trustee, American Beacon Select Funds (2001-Present); Trustee, American Beacon Master Trust (2001-2012); Trustee, American Beacon Institutional Funds Trust (2017-Present). |
| | |
| OFFICERS | | Term | | |
| | One Year | | |
| | |
| Gene L. Needles, Jr. (63) | | President since 2009 | | President, CEO and Director, American Beacon Advisors, Inc. (2009-Present); President, CEO and Director, Resolute Investment Managers, Inc. (2015-Present); President, CEO and Director, Resolute Acquisition, Inc. (2015-Present); President, CEO and Director, Resolute Topco, Inc. (2015-Present), President & CEO, Resolute Investment Holdings, LLC (2015-Present); President, CEO and Director, Lighthouse Holdings, Inc. (2009-2015); President and CEO, Lighthouse Holdings Parent, Inc. (2009-2015); Manager, President and CEO, American Private Equity Management, LLC (2012-Present); President, American Beacon Cayman Managed Futures Strategy Fund, Ltd. (2014-Present); Director, Chairman, President and CEO, Alpha Quant Advisors, LLC (2016-Present); Director, ARK Investment Management LLC (2016-Present); Director, Shapiro Capital Management LLC (2017-Present); Member, Investment Advisory Committee, Employees Retirement System of Texas (2017-Present); Trustee, American Beacon NextShares Trust (2015-Present); President, American Beacon Select Funds (2009-Present); President, American Beacon Mileage Funds (2009-2012); President, American Beacon Master Trust (2009–2012); President, American Beacon Institutional Funds Trust (2017-Present). |
83
Trustees and Officers of the American Beacon FundsSM (Unaudited)
| | | | |
Name, Age and Address | | Position, Term of Office and Length of Time Served with the Trust | | Principal Occupation(s) During Past 5 Years and Current Directorships |
| OFFICERS (CONT.) | | Term | | |
| | One Year | | |
| | |
| Rosemary K. Behan (58) | | VP, Secretary and Chief Legal Officer since 2006 | | Vice President and Secretary, American Beacon Advisors, Inc. (2006-Present); Secretary, Resolute Investment Holdings, LLC (2015-Present) Secretary, Resolute Investment Managers, Inc. (2015-Present); Secretary, Resolute Topco, Inc. (2015-Present); Secretary, Resolute Acquisition, Inc. (2015-Present); Secretary, Lighthouse Holdings, Inc. (2008-2015); Secretary, Lighthouse Holdings Parent, Inc. (2008-2015); Secretary, American Private Equity Management, LLC (2008-Present); Secretary, American Beacon Cayman Managed Futures Strategy Fund, Ltd. (2014-Present); Secretary, Alpha Quant Advisors, LLC (2016-Present); Chief Legal Officer, Vice President and Secretary, American Beacon Select Funds (2006-Present); Chief Legal Officer, Vice President and Secretary, American Beacon Mileage Funds (2006-2012); Chief Legal Officer, Vice President and Secretary, American Beacon Master Trust (2006-2012); Chief Legal Officer, Vice President and Secretary, American Beacon Institutional Funds Trust (2017-Present). |
| | |
| Brian E. Brett (57) | | VP since 2004 | | Senior Vice President (2012-Present) and Vice President (2004-2012), American Beacon Advisors, Inc.; Vice President, American Beacon Select Funds (2004-Present); Vice President, American Beacon Mileage Funds (2004-2012); Vice President, American Beacon Master Trust (2004-2012); Vice President, American Beacon Institutional Funds Trust (2017-Present). |
| | |
| Paul B. Cavazos (48) | | VP since 2016 | | Senior Vice President, American Beacon Advisors, Inc. (2016-Present); Chief Investment Officer and Assistant Treasurer, DTE Energy (2007-2016); Vice President, American Beacon Select Funds (2016-Present); Vice President, American Beacon Institutional Funds Trust (2017-Present). |
| | |
| Erica Duncan (47) | | VP Since 2011 | | Vice President, American Beacon Advisors, Inc. (2011-Present); Vice President, American Beacon Select Funds (2011-Present); Vice President, American Beacon Mileage Funds (2011-2012); Vice President, American Beacon Master Trust (2011-2012); Vice President, American Beacon Institutional Funds Trust (2017-Present). |
| | |
| Melinda G. Heika (56) | | Treasurer since 2010 | | Treasurer, American Beacon Advisors, Inc. (2010-Present); Resolute Investment Managers, Inc. (2015-Present); Treasurer, Resolute Acquisition, Inc. (2015-Present); Treasurer, Resolute Topco, Inc. (2015-Present); Treasurer, Resolute Investment Holdings, LLC. (2015-Present); Treasurer, Lighthouse Holdings, Inc. (2010-2015); Treasurer, Lighthouse Holdings Parent Inc., (2010-2015); Treasurer, American Private Equity Management, LLC (2012-Present); Director and Treasurer, American Beacon Cayman Managed Futures Strategy Fund, Ltd. (2014-Present); Treasurer, American Beacon Select Funds (2010-Present); Treasurer, American Beacon Mileage Funds (2010-2012); Treasurer, American Beacon Master Trust (2010-2012); Treasurer, American Beacon Institutional Funds Trust (2017-Present). |
| | |
| Terri L. McKinney (54) | | VP since 2010 | | Vice President (2009-Present) and Managing Director (2003-2009), American Beacon Advisors, Inc.; Vice President, Resolute Investment Managers, Inc. (2017-Present); Vice President, Alpha Quant Advisors, LLC (2016-Present); Vice President, American Beacon Select Funds (2010-Present); Vice President, American Beacon Mileage Funds (2010-2012); Vice President, American Beacon Master Trust (2010-2012); Vice President, American Beacon Institutional Funds Trust (2017-Present). |
84
Trustees and Officers of the American Beacon FundsSM (Unaudited)
| | | | |
Name, Age and Address | | Position, Term of
Office and Length of Time Served
with the Trust | | Principal Occupation(s) During Past 5 Years and Current Directorships |
| OFFICERS (CONT.) | | Term | | |
| | One Year | | |
| | |
| Jeffrey K. Ringdahl (42) | | VP since 2010 | | Senior Vice President (2013-Present), Vice President (2010-2013), and Director (2015-Present), American Beacon Advisors, Inc.; Vice President, American Beacon Select Funds (2010-Present); Vice President, American Beacon Mileage Funds (2010-2012); Vice President, American Beacon Master Trust (2010-2012); Senior Vice President (2012-Present) and Manager (2015-Present), American Private Equity Management, LLC; Senior Vice President, Lighthouse Holdings, Inc. (2013-2015); Senior Vice President, Lighthouse Holdings Parent, Inc. (2013-2015); Director and Vice President, American Beacon Cayman Managed Futures Strategy Fund, Ltd. (2014-Present); Trustee, American Beacon NextShares Trust (2015-Present); Director and Senior Vice Present, Resolute Investment Holdings, LLC (2015-Present); Director and Senior Vice President, Resolute Topco, Inc. (2015-Present); Director and Senior Vice President, Resolute Acquisition, Inc. (2015-Present); Director and Senior Vice President, Resolute Investment Managers, Inc. (2015-Present); Director, Executive Vice President and Chief Operating Officer, Alpha Quant Advisors, LLC (2016-Present); Vice President, American Beacon Institutional Funds Trust (2017-President); Director, Shapiro Capital Management, LLC (2017-Present). |
| | |
| Samuel J. Silver (54) | | VP Since 2011 | | Vice President, American Beacon Advisors, Inc. (2011-Present); Vice President, American Beacon Select Funds (2011-Present); Vice President, American Beacon Mileage Funds (2011-2012); Vice President, American Beacon Master Trust (2011-2012); American Beacon Institutional Funds Trust (2011-Present). |
| | |
| Christina E. Sears (46) | | Chief Compliance Officer since 2004 and Asst. Secretary since 1999 | | Chief Compliance Officer, American Beacon Advisors, Inc. (2004-Present); Chief Compliance Officer, American Private Equity Management, LLC (2012-Present); Chief Compliance Officer and Vice President, Alpha Quant Advisors, LLC (2016-Present); Chief Compliance Officer (2004-Present) and Assistant Secretary (1999-Present), American Beacon Select Funds; Chief Compliance Officer (2004-2012) and Assistant Secretary (1999-2012), American Beacon Mileage Funds; Chief Compliance Officer (2004-2012) and Assistant Secretary (1999-2012), American Beacon Master Trust; Chief Compliance Officer and Assistant Secretary, American Beacon Institutional Funds Trust (2017-Present). |
| | |
| Sonia L. Bates (61) | | Asst. Treasurer since 2011 | | Assistant Treasurer, American Beacon Advisors, Inc. (2011-Present); Assistant Treasurer, Resolute Investment Managers, Inc. (2015-Present); Assistant Treasurer, Resolute Acquisition, Inc. (2015-Present); Assistant. Treasurer, Resolute Topco, Inc. (2015-Present); Assistant Treasurer, Resolute Investment Holdings, LLC.; Assistant Treasurer, Lighthouse Holdings, Inc. (2011-2015); Assistant Treasurer, Lighthouse Holdings Parent Inc. (2011-2015); Assistant Treasurer, American Private Equity Management, LLC (2012-Present); Assistant Treasurer, American Beacon Select Funds (2011-Present); Assistant Treasurer American Beacon Mileage Funds (2011-2012); Assistant Treasurer, American Beacon Master Trust (2011-2012); Assistant Treasurer, American Beacon Institutional Funds Trust (2017-Present). |
| | |
| Shelley D. Abrahams (43) | | Assistant Secretary since 2008 | | Assistant Secretary, American Beacon Advisors, Inc. (2008-Present); Assistant Secretary, American Beacon Select Funds (2008-Present); Assistant Secretary, American Beacon Mileage Funds (2008-2012); Assistant Secretary, American Beacon Master Trust (2008-2012); Assistant Secretary, American Beacon Institutional Funds Trust (2017-Present). |
85
Trustees and Officers of the American Beacon FundsSM (Unaudited)
| | | | |
Name, Age and Address | | Position, Term of
Office and Length of Time Served
with the Trust | | Principal Occupation(s) During Past 5 Years and Current Directorships |
| OFFICERS (CONT.) | | Term | | |
| | One Year | | |
| | |
| Rebecca L. Harris (51) | | Assistant Secretary since 2010 | | Vice President, American Beacon Advisors, Inc. (2016-Present); Vice President, Resolute Investment Managers, Inc. (2017-Present); Vice President, Alpha Quant Advisors, LLC (2016-Present); Assistant Secretary, American Beacon Select Funds (2010-Present); Assistant Secretary, American Beacon Mileage Funds (2010-2012); Assistant Secretary, American Beacon Master Trust (2010-2012); Assistant Secretary, American Beacon Institutional Funds Trust (2017-Present). |
| | |
| Diana N. Lai (42) | | Assistant Secretary since 2012 | | Assistant Secretary, American Beacon Advisors, Inc. (2012-Present); Assistant Secretary, American Beacon Select Funds (2012-Present); Assistant Secretary, American Beacon Institutional Funds Trust (2017-Present). |
| | |
| Teresa A. Oxford (59) | | Assistant Secretary since 2015 | | Assistant Secretary, American Beacon Advisors, Inc. (2015-Present); Assistant Secretary, Alpha Quant Advisors, LLC (2016-Present); Assistant Secretary, American Beacon Select Funds (2015-Present); Assistant Secretary, American Beacon Institutional Funds Trust (2017-Present). |
* As of 11/12/2014, the Board adopted a retirement plan that requires Trustees to retire no later than the last day of the calendar year in which they reach the age of 75.
** Mr. Feld is deemed to be an “interested person” of the Trusts, as defined by the 1940 Act. Mr. Feld’s law firm of Akin, Gump, Strauss, Hauer & Feld LLP has provided legal services within the past two fiscal years to one or more of the Trust’s sub-advisors.
*** Douglas A. Lindgren became a new Trustee to each of the Trusts on 1/1/2018.
86
American Beacon FundsSM
Privacy Policy
January 31, 2018 (Unaudited)
The American Beacon Funds recognize and respect the privacy of our shareholders. We are providing this notice to you so you will understand how shareholder information may be collected and used.
We may collect nonpublic personal information about you from one or more of the following sources:
| | • | | information we receive from you on applications or other forms; |
| | • | | information about your transactions with us or our service providers; and |
| | • | | information we receive from third parties. |
We do not disclose any nonpublic personal information about our customers or former customers to anyone, except as permitted by law.
We restrict access to your nonpublic personal information to those employees or service providers who need to know that information to provide products or services to you. To ensure the confidentiality of your nonpublic personal information, we maintain safeguards that comply with federal standards.
87
This page intentionally left blank.
88
This page intentionally left blank.
89
This page intentionally left blank.
90

Delivery of Documents
eDelivery is NOW AVAILABLE - Stop traditional mail delivery and receive your
shareholder reports and summary prospectus on-line. Sign up at
www.americanbeaconfunds.com
If you invest in the Fund through a financial institution, you may be able to receive the Fund’s regulatory mailings, such as the Prospectus, Annual Report and Semi-Annual Report, by e-mail. If you are interested in this option, please go to www.icsdelivery.com and search for your financial institution’s name or contact your financial institution directly.
To obtain more information about the Fund:
| | |
 | |  |
| | |
| By E-mail: | | On the Internet: |
| american_beacon.funds@ambeacon.com | | Visit our website at www.americanbeaconfunds.com |
| | | |
| | | |
| | |

By Telephone: Call (800) 658-5811 | | 
By Mail: American Beacon Funds P.O. Box 219643 Kansas City, MO 64121-9643 |
| |
| |
| |
| | | |
| | | |
| Availability of Quarterly Portfolio Schedules | | Availability of Proxy Voting Policy and Records |
| | |
| In addition to the Schedule of Investments provided in each semi-annual and annual report, the Fund files a complete schedule of its portfolio holdings with the Securities and Exchange Commission (“SEC”) on Form N-Q as of the first and third fiscal quarters. The Fund’s Forms N-Q are available on the SEC’s website at www.sec.gov. The Forms N-Q may also be reviewed and copied at the SEC’s Public Reference Section, 100 F Street, NE, Washington, D.C. 20549-2736. Information regarding the operation of the SEC’s Public Reference Room may be obtained by calling (800)-SEC-0330. A complete schedule of each Fund’s portfolio holdings is also available at www.americanbeaconfunds.com approximately sixty days after the end of each quarter. | | A description of the policies and procedures the Fund uses to determine how to vote proxies relating to portfolio securities is available in the Fund’s Statement of Additional Information, is available free of charge on the Fund’s website www.americanbeaconfunds.com and by calling 1-800-967-9009 or by accessing the SEC’s website at www.sec.gov. The Fund’s proxy voting record for the most recent year ended June 30 is filed annually with the SEC on Form N-PX. The Fund’s Forms N-PX are available on the SEC’s website at www.sec.gov. The Fund’s proxy voting record may also be obtained by calling 1-800-967-9009. |
Fund Service Providers:
| | | | | | | | | | | | |
CUSTODIAN State Street Bank and Trust Boston, Massachusetts | | | | TRANSFER AGENT DST Asset Manager Solutions, Inc. Kansas City, Missouri | | | | INDEPENDENT REGISTERED PUBLIC ACCOUNTING FIRM PricewaterhouseCoopers LLP Boston, Massachusetts | | | | DISTRIBUTOR Resolute Investment Distributors, Inc. Irving, Texas |
This report is prepared for shareholders of the American Beacon Funds and may be distributed to others only if preceded or accompanied by a current Prospectus or Summary Prospectus.
American Beacon Funds, American Beacon Grosvenor Long/Short Fund and American Beacon Numeric Integrated Alpha Fund are service marks of American Beacon Advisors, Inc.
AR 1/18
The Trust adopted a code of ethics that applies to its principal executive and financial officers (the “Code”). The Trust amended its code March 24, 2017 to disclose the addition of the Institutional Funds Trust, disclose a change in the Principal Financial Officer and disclosure of conflicts due to Principal Officers serving in positions with affiliates, which also serve as sub-advisors. The Trust did not grant any waivers to the provisions of the Code during the period covered by the shareholder reports presented in Item 1. The Code is filed herewith as Exhibit 99.CODE ETH.
| ITEM 3. | AUDIT COMMITTEE FINANCIAL EXPERT. |
The Trust’s Board of Trustees has determined that Ms. Brenda A. Cline, a member of the Trust’s Audit and Compliance Committee, is an “audit committee financial expert” as defined in Form N-CSR. Ms. Brenda Cline is “independent” as defined in Form N-CSR.
| ITEM 4. | PRINCIPAL ACCOUNTANT FEES AND SERVICES. |
| | | | |
(a) | |
Audit Fees | | Fiscal Year Ended | |
$295,750 | | | 1/31/2017 | |
$326,959 | | | 1/31/2018 | |
|
(b) | |
Audit-Related Fees | | Fiscal Year Ended | |
$0 | | | 1/31/2017 | |
$0 | | | 1/31/2018 | |
|
(c) | |
Tax Fees | | Fiscal Year Ended | |
$132,995 | | | 1/31/2017 | |
$127,409 | | | 1/31/2018 | |
|
(d) | |
All Other Fees | | Fiscal Year Ended | |
$0 | | | 1/31/2017 | |
$0 | | | 1/31/2018 | |
e)(1) Pursuant to its charter, the Trust’s Audit and Compliance Committee shall have the following duties and powers pertaining to pre-approval of audit and non-audit services provided by the Trust’s principal accountant:
- to approve, prior to appointment, the engagement of auditors to annually audit and provide their opinion on the Trusts’ financial statements, and, in connection therewith, reviewing and evaluating matters potentially affecting the independence and capabilities of the auditors;
- to approve, prior to appointment, the engagement of the auditors to provide non-audit services to the Trusts, an investment adviser to any series of the Trusts or any entity controlling, controlled by, or under common control with an investment adviser (“adviser affiliate”) that provides ongoing services to the Trusts, if the engagement relates directly to the operations and financial reporting of the Trusts;
- to consider whether the non-audit services provided by a Trust’s auditor to an investment adviser or any adviser affiliate that provides ongoing services to a series of the Trusts, which services were not pre-approved by the Committee, are compatible with maintaining the auditor’s independence;
- to review the arrangements for and scope of the annual audit and any special audits; and
- to review and approving the fees proposed to be charged to the Trusts by the auditors for each audit and non-audit service.
The Audit and Compliance Committee may delegate any portion of its authority, including the authority to grant pre-approvals of audit and permitted non-audit services, to a subcommittee of one or more members. Any decisions of the subcommittee to grant pre-approvals shall be presented to the full audit committee at its next regularly scheduled meeting.
(e)(2) None of the fees disclosed in paragraphs (b) through (d) above were approved by the audit committee pursuant to paragraph (c)(7)(i)(C) of Rule 2-01 of Regulation S-X.
(f) Not applicable.
(g)
Aggregate Non-Audit Fees for Services Rendered to the:
| | | | | | | | | | | | |
Registrant | | Adviser | | | Adviser’s Affiliates Providing
Ongoing Services to Registrant | | | Fiscal Year Ended | |
$132,995 | | $ | 215,882 | * | | | N/A | | | | 1/31/2017 | |
$127,409 | | $ | 110,167 | | | | N/A | | | | 1/31/2018 | |
* Fees are associated with Ernst & Young, LLP.
(h) Not applicable.
| ITEM 5. | AUDIT COMMITTEE OF LISTED REGISTRANTS. |
Not applicable.
| ITEM 6. | SCHEDULE OF INVESTMENTS. |
The schedules of investments for each series of the Trust are included in the shareholder reports presented in Item 1.
| ITEM 7. | DISCLOSURE OF PROXY VOTING POLICIES AND PROCEDURES FOR CLOSED-END MANAGEMENT INVESTMENT COMPANIES. |
Not applicable.
| ITEM 8. | PORTFOLIO MANAGERS OF CLOSED-END MANAGEMENT INVESTMENT COMPANIES. |
Not applicable.
| ITEM 9. | PURCHASES OF EQUITY SECURITIES BY CLOSED-END MANAGEMENT INVESTMENT COMPANY AND AFFILIATED PURCHASERS. |
Not applicable.
| ITEM 10. | SUBMISSION OF MATTERS TO A VOTE OF SECURITY HOLDERS. |
The Trust has made no material changes to the procedures by which shareholders may recommend nominees to the Trust’s Board of Trustees since the Trust last disclosed such procedures in Schedule 14A.
| ITEM 11. | CONTROLS AND PROCEDURES. |
(a) Based upon an evaluation within 90 days of the filing date of this report, the principal executive and financial officers concluded that the disclosure controls and procedures of the Trust are effective.
(b) There were no changes in the Trust’s internal control over financial reporting during the second fiscal quarter of the period covered by this report that has materially affected, or is reasonably likely to materially affect, the Trust’s internal control over financial reporting.
(a)(1) Filed herewith as EX-99.CODE ETH.
(a)(2) A separate certification for each principal executive officer and principal financial officer of the Trust as required by Rule 30a-2(a) under the Investment Company Act of 1940 is attached hereto as EX-99.CERT.
(a)(3) Not applicable.
(b) The certifications required by Rule 30a-2(b) under the Investment Company Act of 1940 are attached hereto as EX-99.906CERT.
SIGNATURES
Pursuant to the requirements of the Securities Exchange Act of 1934 and the Investment Company Act of 1940, the registrant has duly caused this report to be signed on its behalf by the undersigned, thereunto duly authorized.
|
| (Registrant): American Beacon Funds |
|
| By /s/ Gene L. Needles, Jr. |
| Gene L. Needles, Jr. |
| President |
| American Beacon Funds |
| Date: May 8, 2018 |
Pursuant to the requirements of the Securities Exchange Act of 1934 and the Investment Company Act of 1940, this report has been signed below by the following persons on behalf of the registrant and in the capacities and on the dates indicated.
|
|
| By /s/ Gene L. Needles, Jr. |
| Gene L. Needles, Jr. |
| President |
| American Beacon Funds |
| Date: May 8, 2018 |
|
|
| By /s/ Melinda G. Heika |
| Melinda G. Heika |
| Treasurer |
| American Beacon Funds |
| Date: May 8, 2018 |