UNITED STATES
SECURITIES AND EXCHANGE COMMISSION
Washington, D.C. 20549
FORM N-CSR
CERTIFIED SHAREHOLDER REPORT OF REGISTERED
MANAGEMENT INVESTMENT COMPANIES
Investment Company Act file number: 811-4984
AMERICAN BEACON FUNDS
(Exact name of registrant as specified in charter)
220 East Las Colinas Boulevard, Suite 1200
Irving, Texas 75039
(Address of principal executive offices)-(Zip code)
GENE L. NEEDLES, JR., PRESIDENT
220 East Las Colinas Boulevard, Suite 1200
Irving, Texas 75039
(Name and address of agent for service)
Registrant’s telephone number, including area code: (817) 391-6100
Date of fiscal year end: June 30, 2018
Date of reporting period: June 30, 2018
Form N-CSR is to be used by management investment companies to file reports with the Commission not later than 10 days after the transmission to stockholders of any report that is required to be transmitted to stockholders under Rule 30e-1 under the Investment Company Act of 1940 (17 CFR 270.30e-1). The Commission may use the information provided on Form N-CSR in its regulatory, disclosure review, inspection, and policymaking roles.
A registrant is required to disclose the information specified by Form N-CSR, and the Commission will make this information public. A registrant is not required to respond to the collection of information contained in Form N-CSR unless the Form displays a currently valid Office of Management and Budget (“OMB”) control number. Please direct comments concerning the accuracy of the information collection burden estimate and any suggestions for reducing the burden to Secretary, Securities and Exchange Commission, 450 Fifth Street, NW, Washington, DC 20549-0609. The OMB has reviewed this collection of information under the clearance requirements of 44 U.S.C. § 3507.
| ITEM 1. | REPORTS TO STOCKHOLDERS. |

About American Beacon Advisors
Since 1986, American Beacon Advisors has offered a variety of products and investment advisory services to numerous institutional and retail clients, including a variety of mutual funds, corporate cash management, and separate account management.
Our clients include defined benefit plans, defined contribution plans, foundations, endowments, corporations, financial planners, and other institutional investors. With American Beacon Advisors, you can put the experience of a multi-billion dollar asset management firm to work for your company.
ALPHA QUANT FUNDS
Investing in value stocks may limit downside risk over time; however, the Funds may produce more modest gains than riskier stock funds as a trade-off for this potentially lower risk. Investing in medium-capitalization stocks may involve greater volatility and lower liquidity than larger company stocks. The Funds are also subject to the following risks: American Beacon Alpha Quant Core Fund – growth stocks; American Beacon Alpha Quant Dividend Fund – dividend-paying stocks, growth stocks, fewer issuers; American Beacon Alpha Quant Quality Fund – growth stocks, fewer issuers; American Beacon Alpha Quant Value Fund – fewer issuers. Growth stocks typically are more volatile than value stocks; however, value stocks have a lower expected growth rate in earnings and sales. Investing in dividend-paying stocks may result in less earnings growth or capital appreciation than investing in non-dividend paying stocks. Because the Funds may invest in fewer issuers than a more diversified portfolio, the fluctuating value of a single holding may have a greater effect on the value of the Funds. Please see the prospectus for a complete discussion of the Funds’ risks. There can be no assurances that the investment objectives of the Funds will be met.
Any opinions herein, including forecasts, reflect our judgment as of the end of the reporting period and are subject to change. Each advisor’s strategies and each Fund’s portfolio composition will change depending on economic and market conditions. This report is not a complete analysis of market conditions, and, therefore, should not be relied upon as investment advice. Although economic and market information has been compiled from reliable sources, American Beacon Advisors, Inc. makes no representation as to the completeness or accuracy of the statements contained herein.
American Beacon Funds | June 30, 2018 |
Contents
| 1 | ||||
| 2 | ||||
| 11 | ||||
| 14 | ||||
| 15 | ||||
| 18 | ||||
| 21 | ||||
| 24 | ||||
| 26 | ||||
| 30 | ||||
| 46 | ||||
| 49 | ||||
| 52 | ||||
| 55 | ||||
| 58 | ||||
Disclosure Regarding Approvals of the Management and Investment Advisory Agreements | 59 | |||
| 65 | ||||
| 72 | ||||
| Back Cover | ||||
 | Dear Shareholders,
Since 1986, American Beacon has endeavored to provide investors with a disciplined approach to realizing long-term investment goals: Institutional wisdom + earned alpha = enduring value.
u We believe institutional wisdom comes from having more than 30 years of experience as manager of one of the country’s largest pension plans. As a fiduciary, we have built an investment due-diligence and oversight infrastructure, which we leverage across all our investment products. When selecting our investment managers, we focus on their people, processes and performance. We perform due-diligence reviews with each investment manager on a quarterly basis.
u We believe earned alpha – that is, the returns of an actively managed fund beyond a benchmark – comes from employing and engaging |
| investment managers we believe are best-in-class and who have defined, repeatable and proven processes. Our experience has shown us that, while it’s important to be mindful of short-term considerations, having a long-term focus helps manage expectations, mitigate risks and realize goals. Thus, we seek relationships with leading investment managers who display a willingness to undertake time-intensive research strategies. The resulting investment portfolios are differentiated from their peers and allow incremental changes to help address periods of market volatility and economic uncertainty. |
| u | We believe enduring value comes from “putting a portfolio in place and sticking with the plan.” Our mutual funds provide you with access to institutional-quality, research-intensive investment managers with diverse processes and styles. In the long run, having such access and spending time in the market – rather than trying to time the market – may better position you to reach your long-term investment goals. |
The markets and U.S. economy were robust during calendar year 2017. However, during periods of market volatility and economic uncertainty – such as what we’ve seen thus far in 2018 – investing for the long term requires conviction. It isn’t about identifying and anticipating the next big market move. It’s about identifying the right investment products for riding out those moves. It’s about developing an approach based on long-term participation, while seeking some measure of protection against ongoing volatility.
As a manager of managers, we strive to provide investment products that may enable investors to participate during market upswings while potentially insulating against market downswings. Many of the sub-advisors to our mutual funds pursue upside capture and/or downside protection using proprietary strategies. The investment teams behind our mutual funds seek to produce consistent, long-term results rather than focus only on short-term movements in the markets. In managing our investment products, we emphasize identifying opportunities that offer the potential for high quality and lower risk.
At American Beacon, our approach is more than a concept. It’s the cornerstone of our culture. And we strive to apply it at every turn as we seek to provide a well-diversified line of investment products for your portfolio.
Thank you for your continued interest in American Beacon. For additional information about our investment products or to access your account information, please visit our website at www.americanbeaconfunds.com.
Best Regards,

Gene L. Needles, Jr.
President
American Beacon Funds
1
June 30, 2018 (Unaudited)
Equity markets produced solid returns for the 12-month period ended June 30, 2018, as the MSCI ACWI Index returned 10.73%. Benign market conditions persisted in the first half of the period as low inflation and moderate global growth drove equities higher. Early February 2018 marked the return of volatility as investors grappled with the prospect of a new regime led by the Federal Reserve’s potential acceleration of its rate-hiking cycle. Fears of a global trade war continued to swirl as the Trump administration announced tariffs on steel and aluminum imports.
In the U.S., 10 of 11 sectors within the S&P 500 Index produced positive returns for the period. The top performers were Information Technology (up 31.30%), Consumer Discretionary (up 23.55%) and Energy (up 20.99%). Lagging were the defensive sectors, including Consumer Staples (down 3.93%), Telecommunications Services (up 1.39%) and Utilities (up 3.41%). From a style standpoint, the performance differential between growth and value stocks was stark, demonstrated by the Russell 3000 Growth Index return of 22.47% versus the Russell 3000 Value Index return of 7.25%. From a capitalization perspective, small-cap stocks – represented by the Russell 2000 Index, returned 17.57% – outperformed large-cap stocks, represented by the S&P 500 Index, which returned 14.37%.
International developed markets lagged the U.S. over the period, but still produced positive returns as the MSCI EAFE Index was up 6.84%. In Europe, the top-performing countries were Norway and Portugal, represented by the MSCI Norway Index (up 27.11%) and the MSCI Portugal Index (up 15.75%), respectively. The laggards in Europe were Sweden and Spain, represented by the MSCI Sweden Index (down 4.64%) and the MSCI Spain Index (down 3.55%), respectively. In Japan, equities were up as the MSCI Japan Index returned 10.51%.
Finally, in the developing world, emerging markets began the period with strong returns, but the last few months were less kind as the strengthening dollar and trade-war rhetoric caused a pullback. For the full period, returns were still positive as the MSCI Emerging Market Index returned 8.20%. China, the largest country in the Index, returned 21.23% as represented by the MSCI China Index. Other notable strong markets include the MSCI Peru Index (up 30.70%) and MSCI Russia Index (up 25.97%). As Mexico’s presidential election approached and NAFTA negotiations continued, the equity market suffered due to uncertainty as the MSCI Mexico Index was down 9.28%. Turkey also had a difficult period as the currency was down significantly and the MSCI Turkey Index declined -26.34%.
2
American Beacon Alpha Quant Core FundSM
Performance Overview
June 30, 2018 (Unaudited)
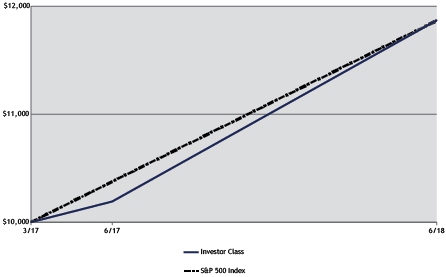
The Investor Class of the American Beacon Alpha Quant Core Fund (the “Fund”) returned 16.47% for the twelve months ended June 30, 2018, outperforming the S&P 500 Index (the “Index”) return of 14.37% for the same period.
Comparison of Changes in Value of a $10,000 Investment for the period 3/22/2017 through 6/30/2018
| Total Returns for the Period ended June 30, 2018 |
| |||||||||||||||||||||
Ticker | 1 Year | Since Inception | Value of $10,000 | |||||||||||||||||||
Institutional Class (1,3) | AQCIX | 16.85 | % | 14.77 | % | $ | 11,918.31 | |||||||||||||||
Y Class (1,3) | AQCYX | 16.75 | % | 14.69 | % | $ | 11,908.31 | |||||||||||||||
Investor Class (1,3) | AQCPX | 16.47 | % | 14.39 | % | $ | 11,868.07 | |||||||||||||||
S&P 500 Index (2) | 14.37 | % | 14.37 | % | $ | 11,865.29 | ||||||||||||||||
| 1. | Performance shown is historical and is not indicative of future returns. Investment returns and principal value will vary, and shares may be worth more or less at redemption than at original purchase. Performance shown is calculated based on the published end of day net asset values as of the date indicated and current performance may be lower or higher than the performance data quoted. To obtain performance as of the most recent month end, please visit www.americanbeaconfunds.com or call 1-800-967-9009. Fund performance in the table above does not reflect the deduction of taxes a shareholder would pay on distributions or the redemption of shares. Generally accepted accounting principles require adjustments to be made to the net assets of the Fund at period end for financial reporting purposes only; and as such, the total return based on the unadjusted net asset value per share may differ from the total return reported in the financial highlights. Please note that the recent performance of the securities market has helped produce short-term returns that are not typical and may not continue in the future. A portion of the fees charged to each Class of the Fund has been waived since Fund inception. Performance prior to waiving fees was lower than the actual returns shown since inception. |
| 2. | The S&P 500 Index is an unmanaged index of common stocks publicly traded in the United States. The S&P 500 Index is a product of S&P Dow Jones Indices LLC, a division of S&P Global or its affiliates (“SPDJI”), and has been licensed for use by American Beacon Advisors. Standard & Poor’s® and S&P® are registered trademarks of Standard & Poor’s Financial Services LLC, a division of S&P Global (“S&P”). Dow Jones® is a registered trademark of Dow Jones Trademark Holdings LLC (“Dow Jones”). The American Beacon Alpha Quant Core Fund is not sponsored, endorsed, sold or promoted by SPDJI, Dow Jones, S&P or their respective affiliates, and none of such parties make any representation regarding the advisability of investing in such product(s) nor do they have any liability for any errors, omissions or interruptions of the S&P 500 Index. One cannot directly invest in an index. |
| 3. | The Total Annual Fund Operating Expense ratios set forth in the most recent Fund prospectus for the Institutional, Y and Investor Class shares were 1.13%, 1.23% and 1.51%, respectively. The expense ratios above may vary from the expense ratios presented in other sections of this report that are based on expenses incurred during the period covered by this report. |
3
American Beacon Alpha Quant Core FundSM
Performance Overview
June 30, 2018 (Unaudited)
The Fund outperformed the Index due mostly to security selection, while sector allocation was a slight drag on relative performance.
During the period, stock selection in the Consumer Staples, Materials and Financials sectors contributed to relative performance. In the Consumer Staples sector, Sysco Corp. (up 39.3%) and Tyson Foods, Inc. (up 30.2%) were the largest contributors. In the Materials sector, CF Industries Holdings, Inc. (up 18.0%) and LyondellBasell Industries N.V. (up 35.4%) contributed positively to relative returns. Additionally, positions in the Financials sector helped relative performance, including Moody’s Corp. (up 46.4%) and S&P Global, Inc. (up 43.5%). Conversely, stock selection in the Health Care sector, McKesson Corp. (down 19.4%) and AmerisourceBergen Corp. (down 8.3%), detracted from performance.
From a sector allocation standpoint, an overweight to Consumer Staples and an underweight to Consumer Discretionary (down 4.6% and up 23.6%, respectively) dragged on performance. Slightly offsetting this performance was an overweight in Information Technology and an underweight in Financials (up 31.2% and up 9.7%, respectively).
The Fund’s sub-advisor remains focused on implementing a quantitative investment process rooted in fundamental factors that seeks to deliver shareholder value and above-market performance.
| Top Ten Holdings (% Net Assets) | ||||||||
| NetApp, Inc., Class A | 2.4 | |||||||
| Mastercard, Inc., Class A | 2.4 | |||||||
| F5 Networks, Inc. | 2.3 | |||||||
| VeriSign, Inc. | 2.2 | |||||||
| Intuit, Inc. | 2.2 | |||||||
| CF Industries Holdings, Inc. | 2.2 | |||||||
| Molson Coors Brewing Co. | 2.1 | |||||||
| Humana, Inc. | 2.0 | |||||||
| Best Buy Co., Inc. | 2.0 | |||||||
| Church & Dwight Co., Inc. | �� | 2.0 | ||||||
| Total Fund Holdings | 54 | |||||||
| Sector Allocation (% Equities) | ||||||||
| Information Technology | 29.6 | |||||||
| Consumer Staples | 19.9 | |||||||
| Health Care | 17.7 | |||||||
| Industrials | 16.1 | |||||||
| Materials | 7.3 | |||||||
| Energy | 5.6 | |||||||
| Consumer Discretionary | 3.8 | |||||||
4
American Beacon Alpha Quant Dividend FundSM
Performance Overview
June 30, 2018 (Unaudited)
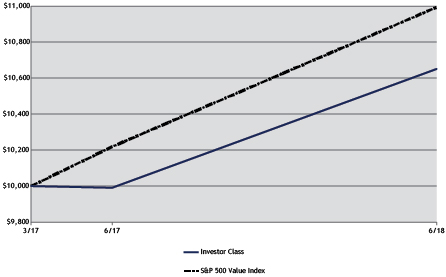
The Investor Class of the American Beacon Alpha Quant Dividend Fund (the “Fund”) returned 6.60% for the twelve months ended June 30, 2018, underperforming the S&P 500 Value Index (the “Index”) return of 7.58% for the same period.
Comparison of Changes in Value of a $10,000 Investment for the period 3/22/2017 through 6/30/2018
| Total Returns for the Period ended June 30, 2018 |
| |||||||||||||||||||||
Ticker | 1 Year | Since Inception | Value of $10,000 | |||||||||||||||||||
Institutional Class (1,3) | AQDIX | 7.00 | % | 5.46 | % | $ | 10,700.21 | |||||||||||||||
Y Class (1,3) | AQDYX | 7.01 | % | 5.38 | % | $ | 10,690.15 | |||||||||||||||
Investor Class (1,3) | AQDPX | 6.60 | % | 5.06 | % | $ | 10,649.60 | |||||||||||||||
S&P 500 Value Index (2) | 7.58 | % | 7.72 | % | $ | 10,993.08 | ||||||||||||||||
| 1. | Performance shown is historical and is not indicative of future returns. Investment returns and principal value will vary, and shares may be worth more or less at redemption than at original purchase. Performance shown is calculated based on the published end of day net asset values as of the date indicated and current performance may be lower or higher than the performance data quoted. To obtain performance as of the most recent month end, please visit www.americanbeaconfunds.com or call 1-800-967-9009. Fund performance in the table above does not reflect the deduction of taxes a shareholder would pay on distributions or the redemption of shares. Generally accepted accounting principles require adjustments to be made to the net assets of the Fund at period end for financial reporting purposes only; and as such, the total return based on the unadjusted net asset value per share may differ from the total return reported in the financial highlights. A portion of the fees charged to each Class of the Fund has been waived since Fund inception. Performance prior to waiving fees was lower than the actual returns shown since inception. |
| 2. | The S&P 500 Value Index is an unmanaged index of common stocks publicly traded in the United States, which represents the value companies, as determined by the index sponsor, of the S&P 500 Index. The S&P 500 Value Index measures the performance of large-capitalization value stocks. The S&P 500 Value Index is a product of S&P Dow Jones Indices LLC, a division of S&P Global or its affiliates (“SPDJI”), and has been licensed for use by American Beacon Advisors. Standard & Poor’s® and S&P® are registered trademarks of Standard & Poor’s Financial Services LLC, a division of S&P Global (“S&P”). Dow Jones® is a registered trademark of Dow Jones Trademark Holdings LLC (“Dow Jones”). The American Beacon Alpha Quant Dividend Fund is not sponsored, endorsed, sold or promoted by SPDJI, Dow Jones, S&P or their respective affiliates, and none of such parties make any representation regarding the advisability of investing in such product(s) nor do they have any liability for any errors, omissions or interruptions of the S&P 500 Value Index. One cannot directly invest in an index. |
5
American Beacon Alpha Quant Dividend FundSM
Performance Overview
June 30, 2018 (Unaudited)
| 3. | The Total Annual Fund Operating Expense ratios set forth in the most recent Fund prospectus for the Institutional, Y and Investor Class shares were 1.13%, 1.23%, and 1.51%, respectively. The expense ratios above may vary from the expense ratios presented in other sections of this report that are based on expenses incurred during the period covered by this report. |
The Fund underperformed the Index primarily due to sector allocation, while positive stock selection partially offset this performance.
As is relates to sector allocation, an underweight to Energy (up 21.7%), the best performing sector in the Index, hurt performance for the period. Overweighting both the Industrials and Real Estate sectors (down 0.6% and up 3.7%, respectively) also dragged on performance. Conversely, an overweight to Information Technology (up 20.0%), the second best performing sector in the Index, offset some of the negative allocation effect.
From a security selection standpoint, holdings in the Industrials, Consumer Discretionary and Utilities sectors contributed positively to performance. In Industrials, The Boeing Co. (up 50.0%) and Caterpillar, Inc. (up 37.5%) added value. Within the Consumer Discretionary sector, Target Corp. (up 51.0%), aided performance. Within Utilities, positions in Public Service Enterprise Group (up 31.0%) and Consolidated Edison, Inc. (up 10.3%) helped performance. Countering this performance, stock selection in Consumer Staples detracted. In Consumer Staples, Fund holdings in Altria Group, Inc. (down 20.1%), Kimberly Clark Corp. (down 15.5%) and General Mills, Inc. (down 20.0%) hurt relative returns.
The Fund’s sub-advisor remains focused on implementing a quantitative investment process rooted in fundamental factors that seeks to deliver shareholder value and above-market performance.
| Top Ten Holdings (% Net Assets) | ||||||||
| Valero Energy Corp. | 4.1 | |||||||
| Target Corp. | 3.9 | |||||||
| Public Service Enterprise Group, Inc. | 3.8 | |||||||
| Exxon Mobil Corp. | 3.7 | |||||||
| Cisco Systems, Inc. | 3.5 | |||||||
| Southern Co. | 3.5 | |||||||
| American Electric Power Co., Inc. | 3.5 | |||||||
| Amgen, Inc. | 3.5 | |||||||
| AvalonBay Communities, Inc. | 3.4 | |||||||
| Verizon Communications, Inc. | 3.4 | |||||||
| Total Fund Holdings | 30 | |||||||
| Sector Allocation (% Equities) | ||||||||
| Health Care | 12.9 | |||||||
| Industrials | 12.6 | |||||||
| Consumer Staples | 12.5 | |||||||
| Utilities | 11.0 | |||||||
| Materials | 9.9 | |||||||
| Information Technology | 9.8 | |||||||
| Energy | 7.8 | |||||||
| Consumer Discretionary | 7.3 | |||||||
| Telecommunication Services | 6.5 | |||||||
| Financials | 6.2 | |||||||
| Real Estate | 3.5 | |||||||
6
American Beacon Alpha Quant Quality FundSM
Performance Overview
June 30, 2018 (Unaudited)
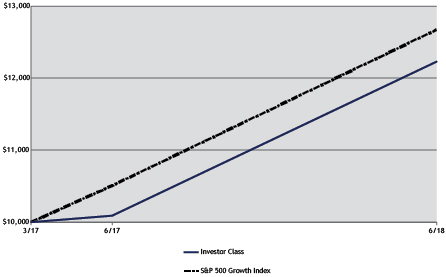
The Investor Class of the American Beacon Alpha Quant Quality Fund (the “Fund”) returned 21.18% for the twelve months ended June 30, 2018, outperforming the S&P 500 Growth Index (the “Index”) return of 20.64% for the same period.
Comparison of Changes in Value of a $10,000 Investment for the period 3/22/2017 through 6/30/2018
| Total Returns for the Period ended June 30, 2018 |
| |||||||||||||||||||||
Ticker | 1 Year | Since Inception | Value of $10,000 | |||||||||||||||||||
Institutional Class (1,3) | AQQIX | 21.66 | % | 17.55 | % | $ | 12,287.68 | |||||||||||||||
Y Class (1,3) | AQQYX | 21.68 | % | 17.48 | % | $ | 12,277.68 | |||||||||||||||
Investor Class (1,3) | AQQPX | 21.18 | % | 17.10 | % | $ | 12,227.48 | |||||||||||||||
S&P 500 Growth Index (2) | 20.64 | % | 20.44 | % | $ | 12,672.96 | ||||||||||||||||
| 1. | Performance shown is historical and is not indicative of future returns. Investment returns and principal value will vary, and shares may be worth more or less at redemption than at original purchase. Performance shown is calculated based on the published end of day net asset values as of the date indicated and current performance may be lower or higher than the performance data quoted. To obtain performance as of the most recent month end, please visit www.americanbeaconfunds.com or call 1-800-967-9009. Fund performance in the table above does not reflect the deduction of taxes a shareholder would pay on distributions or the redemption of shares. Generally accepted accounting principles require adjustments to be made to the net assets of the Fund at period end for financial reporting purposes only; and as such, the total return based on the unadjusted net asset value per share may differ from the total return reported in the financial highlights. Please note that the recent performance of the securities market has helped produce short-term returns that are not typical and may not continue in the future. A portion of the fees charged to each Class of the Fund has been waived since Fund inception. Performance prior to waiving fees was lower than the actual returns shown since inception. |
| 2. | The S&P 500 Growth Index is an unmanaged index of common stocks publicly traded in the United States, which represents the growth companies, as determined by the index sponsor, of the S&P 500 Index. The S&P 500 Growth Index is a product of S&P Dow Jones Indices LLC, a division of S&P Global or its affiliates (“SPDJI”), and has been licensed for use by American Beacon Advisors. Standard & Poor’s® and S&P® are registered trademarks of Standard & Poor’s Financial Services LLC, a division of S&P Global (“S&P”). Dow Jones® is a registered trademark of Dow Jones Trademark Holdings LLC (“Dow Jones”). The American Beacon Alpha Quant Quality Fund is not sponsored, endorsed, sold or promoted by SPDJI, Dow Jones, S&P or their respective affiliates, and none of such parties make any representation regarding the advisability of investing in such product(s) nor do they have any liability for any errors, omissions or interruptions of the S&P 500 Growth Index. One cannot directly invest in an index. |
| 3. | The Total Annual Fund Operating Expense ratios set forth in the most recent Fund prospectus for the Institutional, Y and Investor Class shares were 1.13%, 1.23% and 1.51%, respectively. The expense ratios above may vary from the expense ratios presented in other sections of this report that are based on expenses incurred during the period covered by this report. |
7
American Beacon Alpha Quant Quality FundSM
Performance Overview
June 30, 2018 (Unaudited)
The Fund outperformed the Index due to security selection, offset partially by sector allocation.
From a security selection standpoint, holdings in Consumer Staples, Financials and Industrials contributed the most to the relative outperformance. In the Consumer Staples sector, Sysco Corp. (up 38.8%) and Costco Wholesale Corp. (up 12.6%) contributed positively to performance. In the Financials sector, Moody’s Corp. (up 46.4%) and S&P Global, Inc. (up 43.6%) added value. Within the Industrials sector, The Boeing Co. (up 74.7%) and Expeditors International of Washington, Inc. (up 31.1%) helped performance as well. Slightly offsetting performance were positions in Biogen, Inc (down 8.9%) and Bristol Myers Squibb Co. (down 14.2%) within the Health Care sector.
As is relates to sector allocation, a substantial overweight to Consumer Staples (down 6.4%) detracted from performance as it was the worst performing sector for the Index. Additionally, underweighting Consumer Discretionary (up 28.5%), the second best performing sector of the Index, also detracted. Conversely, underweighting Health Care (up 10.0%) and an absence from the Real Estate sector (up 6.0%) added value to relative performance.
The Fund’s sub-advisor remains focused on implementing a quantitative investment process rooted in fundamental factors that seeks to deliver shareholder value and above-market performance.
| Top Ten Holdings (% Net Assets) | ||||||||
| Intuit, Inc. | 4.2 | |||||||
| Mastercard, Inc., Class A | 4.0 | |||||||
| VeriSign, Inc. | 3.9 | |||||||
| F5 Networks, Inc. | 3.8 | |||||||
| Valero Energy Corp. | 3.7 | |||||||
| Apple, Inc. | 3.6 | |||||||
| Best Buy Co., Inc. | 3.6 | |||||||
| Costco Wholesale Corp. | 3.6 | |||||||
| Amgen, Inc. | 3.5 | |||||||
| Sysco Corp. | 3.5 | |||||||
| Total Fund Holdings | 30 | |||||||
| Sector Allocation (% Equities) | ||||||||
| Information Technology | 32.1 | |||||||
| Industrials | 21.7 | |||||||
| Consumer Staples | 16.8 | |||||||
| Health Care | 15.6 | |||||||
| Consumer Discretionary | 6.7 | |||||||
| Energy | 3.7 | |||||||
| Materials | 3.4 | |||||||
8
American Beacon Alpha Quant Value FundSM
Performance Overview
June 30, 2018 (Unaudited)
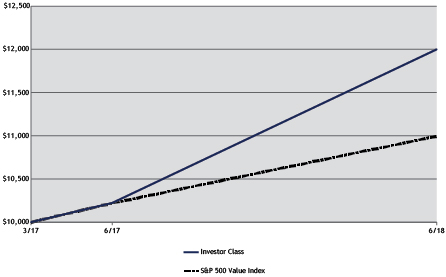
The Investor Class of the American Beacon Alpha Quant Value Fund (the “Fund”) returned 17.41% for the twelve months ended June 30, 2018, outperforming the S&P 500 Value Index (the “Index”) return of 7.58% for the same period.
Comparison of Changes in Value of a $10,000 Investment for the period 3/22/2017 through 6/30/2018
| Total Returns for the Period ended June 30, 2018 |
| |||||||||||||||||||||
Ticker | 1 Year | Since Inception | Value of $10,000 | |||||||||||||||||||
Institutional Class (1,3) | AQVVX | 17.88 | % | 15.84 | % | $ | 12,059.53 | |||||||||||||||
Y Class (1,3) | AQVYX | 17.79 | % | 15.76 | % | $ | 12,049.55 | |||||||||||||||
Investor Class (1,3) | AQVPX | 17.41 | % | 15.38 | % | $ | 11,999.25 | |||||||||||||||
S&P 500 Value Index (2) | 7.58 | % | 7.72 | % | $ | 10,993.08 | ||||||||||||||||
| 1. | Performance shown is historical and is not indicative of future returns. Investment returns and principal value will vary, and shares may be worth more or less at redemption than at original purchase. Performance shown is calculated based on the published end of day net asset values as of the date indicated and current performance may be lower or higher than the performance data quoted. To obtain performance as of the most recent month end, please visit www.americanbeaconfunds.com or call 1-800-967-9009. Fund performance in the table above does not reflect the deduction of taxes a shareholder would pay on distributions or the redemption of shares. Generally accepted accounting principles require adjustments to be made to the net assets of the Fund at period end for financial reporting purposes only; and as such, the total return based on the unadjusted net asset value per share may differ from the total return reported in the financial highlights. A portion of the fees charged to each Class of the Fund has been waived since Fund inception. Performance prior to waiving fees was lower than the actual returns shown since inception. Please note that the recent performance of the securities market has helped produce short-term returns that are not typical and may not continue in the future. |
| 2. | The S&P 500 Value Index is an unmanaged index of common stocks publicly traded in the United States, which represents the value companies, as determined by the index sponsor, of the S&P 500 Index. The S&P Value Index measures the performance of large-capitalization value stocks. The S&P 500 Value Index is a product of S&P Dow Jones Indices LLC, a division of S&P Global or its affiliates (“SPDJI”), and has been licensed for use by American Beacon Advisors. Standard & Poor’s® and S&P® are registered trademarks of Standard & Poor’s Financial Services LLC, a division of S&P Global (“S&P”). Dow Jones® is a registered trademark of Dow Jones Trademark Holdings LLC (“Dow Jones”). The American Beacon Alpha Quant Value Fund is not sponsored, endorsed, sold or promoted by SPDJI, Dow Jones, S&P or their respective affiliates, and none of such parties make any representation regarding the advisability of investing in such product(s) nor do they have any liability for any errors, omissions or interruptions of the S&P 500 Value Index. One cannot directly invest in an index. |
9
American Beacon Alpha Quant Value FundSM
Performance Overview
June 30, 2018 (Unaudited)
| 3. | The Total Annual Fund Operating Expense ratios set forth in the most recent Fund prospectus for the Institutional, Y and Investor Class shares were 1.13%, 1.23% and 1.51%, respectively. The expense ratios above may vary from the expense ratios presented in other sections of this report that are based on expenses incurred during the period covered by this report. |
The Fund’s performance benefited from both security selection and sector allocation for the period.
Security selection was the primary driver of performance and contributed positively across all sectors the Fund was allocated to for the period, led by the Information Technology, Health Care and Materials sectors. Within Information Technology, NetApp, Inc. (up 99.4%), F5 Networks, Inc. (up 35.0%) and Teradata Corp. (up 39.8%) were the leading contributors. In the Health Care sector, Centene Corp (up 53.7%) and Humana, Inc. (up 20.5%) added the most value. In addition, both LyondellBasell Industries (up 35.5%) and CF Industries Holdings, Inc. (up 18.2%) in the Materials sector contributed positively to performance.
From a sector allocation standpoint, a sizeable overweight to the Information Technology sector (up 20.0%) contributed to the relative outperformance as it was the second best performing sector within the Index. Additionally, an absence from both the Utilities and Telecommunication Services sectors (up 2.0% and down 1.0%, respectively) aided the Fund’s relative returns. Detracting slightly from relative performance was an overweight to Health Care (up 2.9%), as well as an absence from the Consumer Discretionary sector (up 14.6%).
The Fund’s sub-advisor remains focused on implementing a quantitative investment process rooted in fundamental factors that seeks to deliver shareholder value and above-market performance.
| Top Ten Holdings (% Net Assets) | ||||||||
| NetApp, Inc. | 4.0 | |||||||
| F5 Networks, Inc. | 3.8 | |||||||
| Juniper Networks, Inc. | 3.8 | |||||||
| Valero Energy Corp. | 3.7 | |||||||
| General Mills, Inc. | 3.7 | |||||||
| LyondellBasell Industries N.V., Class A | 3.7 | |||||||
| Western Digital Corp. | 3.6 | |||||||
| Cigna Corp. | 3.6 | |||||||
| HP, Inc. | 3.5 | |||||||
| Gilead Sciences, Inc. | 3.5 | |||||||
| Total Fund Holdings | 30 | |||||||
| Sector Allocation (% Equities) | ||||||||
| Information Technology | 25.4 | |||||||
| Health Care | 23.9 | |||||||
| Consumer Staples | 18.3 | |||||||
| Materials | 13.5 | |||||||
| Energy | 9.9 | |||||||
| Industrials | 9.0 | |||||||
10
American Beacon FundsSM
June 30, 2018 (Unaudited)
Fund Expense Example
As a shareholder of a Fund, you incur two types of costs: (1) transaction costs, including sales charges (loads) on purchase payments and redemption fees, if applicable, and (2) ongoing costs, including management fees, distribution (12b-1) fees, sub-transfer agent fees, and other Fund expenses. The Examples are intended to help you understand the ongoing cost (in dollars) of investing in the Funds and to compare these costs with the ongoing costs of investing in other mutual funds. The Examples are based on an investment of $1,000 invested at the beginning of the period in each Class and held for the entire period from January 1, 2018 through June 30, 2018.
Actual Expenses
The “Actual” lines of the tables provide information about actual account values and actual expenses. You may use the information on this page, together with the amount you invested, to estimate the expenses that you paid over the period. Simply divide your account value by $1,000 (for example, an $8,600 account value divided by $1,000 = $8.60), then multiply the result by the “Expenses Paid During Period” to estimate the expenses you paid on your account during this period. Shareholders of the Investor and Institutional Classes that invest in the Funds through an IRA or Roth IRA may be subject to a custodial IRA fee of $15 that is typically deducted each December. If your account was subject to a custodial IRA fee during the period, your costs would have been $15 higher.
Hypothetical Example for Comparison Purposes
The “Hypothetical” lines of the tables provide information about hypothetical account values and hypothetical expenses based on the Funds’ actual expense ratio and an assumed 5% per year rate of return before expenses (not the Funds’ actual return). You may compare the ongoing costs of investing in the Funds with other funds by contrasting this 5% hypothetical example and the 5% hypothetical examples that appear in the shareholder reports of the other funds. The hypothetical account values and expenses may not be used to estimate the actual ending account balance or expenses you paid for the period. Shareholders of the Investor and Institutional Classes that invest in the Funds through an IRA or Roth IRA may be subject to a custodial IRA fee of $15 that is typically deducted each December. If your account was subject to a custodial IRA fee during the period, your costs would have been $15 higher.
You should also be aware that the expenses shown in the table highlight only your ongoing costs and do not reflect any transaction costs charged by the Funds, such as sales charges (loads) or redemption fees, as applicable. Similarly, the expense examples for other funds do not reflect any transaction costs charged by those funds, such as sales charges (loads), redemption fees or exchange fees. Therefore, the “Hypothetical” lines of the tables are useful in comparing ongoing costs only and will not help you determine the relative total costs of owning different funds. If you were subject to any transaction costs during the period, your costs would have been higher.
11
American Beacon FundsSM
Expense Examples
June 30, 2018 (Unaudited)
| American Beacon Alpha Quant Core Fund |
| ||||||||||||||
| Beginning Account Value 1/1/2018 | Ending Account Value 6/30/2018 | Expenses Paid During Period 1/1/2018-6/30/2018* | |||||||||||||
| Institutional Class | |||||||||||||||
| Actual | $1,000.00 | $1,029.70 | $3.47 | ||||||||||||
| Hypothetical** | $1,000.00 | $1,021.40 | $3.46 | ||||||||||||
| Y Class | |||||||||||||||
| Actual | $1,000.00 | $1,029.70 | $3.98 | ||||||||||||
| Hypothetical** | $1,000.00 | $1,020.90 | $3.96 | ||||||||||||
| Investor Class | |||||||||||||||
| Actual | $1,000.00 | $1,028.90 | $5.38 | ||||||||||||
| Hypothetical** | $1,000.00 | $1,019.50 | $5.36 | ||||||||||||
| * | Expenses are equal to the Fund’s annualized expense ratios for the six-month period of 0.69%, 0.79%, and 1.07% for the Institutional, Y, and Investor Classes, respectively, multiplied by the average account value over the period, multiplied by the number derived by dividing the number of days in the most recent fiscal half-year (181) by days in the year (365) to reflect the half-year period. |
| ** | 5% return before expenses. |
| American Beacon Alpha Quant Dividend Fund |
| ||||||||||||||
| Beginning Account Value 1/1/2018 | Ending Account Value 6/30/2018 | Expenses Paid During Period 1/1/2018-6/30/2018* | |||||||||||||
| Institutional Class | |||||||||||||||
| Actual | $1,000.00 | $955.60 | $3.35 | ||||||||||||
| Hypothetical** | $1,000.00 | $1,021.40 | $3.46 | ||||||||||||
| Y Class | |||||||||||||||
| Actual | $1,000.00 | $955.50 | $3.83 | ||||||||||||
| Hypothetical** | $1,000.00 | $1,020.90 | $3.96 | ||||||||||||
| Investor Class | |||||||||||||||
| Actual | $1,000.00 | $954.50 | $5.19 | ||||||||||||
| Hypothetical** | $1,000.00 | $1,019.50 | $5.36 | ||||||||||||
| * | Expenses are equal to the Fund’s annualized expense ratios for the six-month period of 0.69%, 0.79%, and 1.07% for the Institutional, Y, and Investor Classes, respectively, multiplied by the average account value over the period, multiplied by the number derived by dividing the number of days in the most recent fiscal half-year (181) by days in the year (365) to reflect the half-year period. |
| ** | 5% return before expenses. |
12
American Beacon FundsSM
Expense Examples
June 30, 2018 (Unaudited)
| American Beacon Alpha Quant Quality Fund |
| ||||||||||||||
| Beginning Account Value 1/1/2018 | Ending Account Value 6/30/2018 | Expenses Paid During Period 1/1/2018-6/30/2018* | |||||||||||||
| Institutional Class | |||||||||||||||
| Actual | $1,000.00 | $1,057.20 | $3.52 | ||||||||||||
| Hypothetical** | $1,000.00 | $1,021.40 | $3.46 | ||||||||||||
| Y Class | |||||||||||||||
| Actual | $1,000.00 | $1,057.20 | $4.03 | ||||||||||||
| Hypothetical** | $1,000.00 | $1,020.90 | $3.96 | ||||||||||||
| Investor Class | |||||||||||||||
| Actual | $1,000.00 | $1,054.70 | $5.45 | ||||||||||||
| Hypothetical** | $1,000.00 | $1,019.50 | $5.36 | ||||||||||||
| * | Expenses are equal to the Fund’s annualized expense ratios for the six-month period of 0.69%, 0.79%, and 1.07% for the Institutional, Y, and Investor Classes, respectively, multiplied by the average account value over the period, multiplied by the number derived by dividing the number of days in the most recent fiscal half-year (181) by days in the year (365) to reflect the half-year period. |
| ** | 5% return before expenses. |
| American Beacon Alpha Quant Value Fund |
| ||||||||||||||
| Beginning Account Value 1/1/2018 | Ending Account Value 6/30/2018 | Expenses Paid During Period 1/1/2018-6/30/2018* | |||||||||||||
| Institutional Class | |||||||||||||||
| Actual | $1,000.00 | $1,033.00 | $3.48 | ||||||||||||
| Hypothetical** | $1,000.00 | $1,021.40 | $3.46 | ||||||||||||
| Y Class | |||||||||||||||
| Actual | $1,000.00 | $1,033.10 | $3.98 | ||||||||||||
| Hypothetical** | $1,000.00 | $1,020.90 | $3.96 | ||||||||||||
| Investor Class | |||||||||||||||
| Actual | $1,000.00 | $1,031.40 | $5.39 | ||||||||||||
| Hypothetical** | $1,000.00 | $1,019.50 | $5.36 | ||||||||||||
| * | Expenses are equal to the Fund’s annualized expense ratios for the six-month period of 0.69%, 0.79%, and 1.07% for the Institutional, Y, and Investor Classes, respectively, multiplied by the average account value over the period, multiplied by the number derived by dividing the number of days in the most recent fiscal half-year (181) by days in the year (365) to reflect the half-year period. |
| ** | 5% return before expenses. |
13
American Beacon FundsSM
Report of Independent Registered Public Accounting Firm
To the Board of Trustees of American Beacon Funds and Shareholders of American Beacon Alpha Quant Core Fund, American Beacon Alpha Quant Dividend Fund, American Beacon Alpha Quant Quality Fund, and American Beacon Alpha Quant Value Fund
Opinions on the Financial Statements
We have audited the accompanying statements of assets and liabilities, including the schedules of investments, of American Beacon Alpha Quant Core Fund, American Beacon Alpha Quant Dividend Fund, American Beacon Alpha Quant Quality Fund, and American Beacon Alpha Quant Value Fund (four of the series constituting American Beacon Funds, referred to hereafter as the “Funds”) as of June 30, 2018, the related statements of operations for the year ended June 30, 2018, and the statements of changes in net assets and the financial highlights for the year ended June 30, 2018, and for the period March 22, 2017 (commencement of operations) through June 30, 2017, including the related notes (collectively referred to as the “financial statements”). In our opinion, the financial statements present fairly, in all material respects, the financial position of each of the Funds as of June 30, 2018, the results of each of their operations for the year ended June 30, 2018, and the changes in each of their net assets and the financial highlights for the year ended June 30, 2018 and for the period March 22, 2017 (commencement of operations) through June 30, 2017 in conformity with accounting principles generally accepted in the United States of America.
Basis for Opinions
These financial statements are the responsibility of the Funds’ management. Our responsibility is to express an opinion on the Funds’ financial statements based on our audits. We are a public accounting firm registered with the Public Company Accounting Oversight Board (United States) (“PCAOB”) and are required to be independent with respect to the Funds in accordance with the U.S. federal securities laws and the applicable rules and regulations of the Securities and Exchange Commission and the PCAOB.
We conducted our audits of these financial statements in accordance with the standards of the PCAOB. Those standards require that we plan and perform the audit to obtain reasonable assurance about whether the financial statements are free of material misstatement, whether due to error or fraud.
Our audits included performing procedures to assess the risks of material misstatement of the financial statements, whether due to error or fraud, and performing procedures that respond to those risks. Such procedures included examining, on a test basis, evidence regarding the amounts and disclosures in the financial statements. Our audits also included evaluating the accounting principles used and significant estimates made by management, as well as evaluating the overall presentation of the financial statements. Our procedures included confirmation of securities owned as of June 30, 2018 by correspondence with the custodian, transfer agent and broker; when replies were not received from brokers, we performed other auditing procedures. We believe that our audits provide a reasonable basis for our opinions.
Boston, MA
August 24, 2018
We have served as the auditor of one or more American Beacon investment companies since 2016.
14
American Beacon Alpha Quant Core FundSM
Schedule of Investments
June 30, 2018
| Shares | Fair Value | ||||||||||||||
| COMMON STOCKS - 98.99% | |||||||||||||||
| Consumer Discretionary - 3.81% | |||||||||||||||
| Leisure Products - 1.78% | |||||||||||||||
| Hasbro, Inc. | 506 | $ | 46,709 | ||||||||||||
|
| ||||||||||||||
| Specialty Retail - 2.03% | |||||||||||||||
| Best Buy Co., Inc. | 718 | 53,548 | |||||||||||||
|
| ||||||||||||||
Total Consumer Discretionary | 100,257 | ||||||||||||||
|
| ||||||||||||||
| Consumer Staples - 19.75% | |||||||||||||||
| Beverages - 2.06% | |||||||||||||||
| Molson Coors Brewing Co., Class B | 795 | 54,092 | |||||||||||||
|
| ||||||||||||||
| Food & Staples Retailing - 6.95% | |||||||||||||||
| Costco Wholesale Corp. | 245 | 51,200 | |||||||||||||
| Sysco Corp. | 710 | 48,486 | |||||||||||||
| Walgreens Boots Alliance, Inc. | 636 | 38,170 | |||||||||||||
| Walmart, Inc. | 525 | 44,966 | |||||||||||||
|
| ||||||||||||||
| 182,822 | |||||||||||||||
|
| ||||||||||||||
| Food Products - 3.65% | |||||||||||||||
| Conagra Brands, Inc. | 1,225 | 43,769 | |||||||||||||
| General Mills, Inc. | 1,182 | 52,316 | |||||||||||||
|
| ||||||||||||||
| 96,085 | |||||||||||||||
|
| ||||||||||||||
| Health Care Providers & Services - 1.59% | |||||||||||||||
| CVS Health Corp. | 648 | 41,699 | |||||||||||||
|
| ||||||||||||||
| Household Products - 3.86% | |||||||||||||||
| Church & Dwight Co., Inc. | 1,005 | 53,426 | |||||||||||||
| Clorox Co. | 355 | 48,013 | |||||||||||||
|
| ||||||||||||||
| 101,439 | |||||||||||||||
|
| ||||||||||||||
| Tobacco - 1.64% | |||||||||||||||
| Altria Group, Inc. | 762 | 43,274 | |||||||||||||
|
| ||||||||||||||
Total Consumer Staples | 519,411 | ||||||||||||||
|
| ||||||||||||||
| Energy - 5.52% | |||||||||||||||
| Oil, Gas & Consumable Fuels - 5.52% | |||||||||||||||
| Exxon Mobil Corp. | 565 | 46,743 | |||||||||||||
| Marathon Petroleum Corp. | 645 | 45,253 | |||||||||||||
| Valero Energy Corp. | 481 | 53,309 | |||||||||||||
|
| ||||||||||||||
| 145,305 | |||||||||||||||
|
| ||||||||||||||
Total Energy | 145,305 | ||||||||||||||
|
| ||||||||||||||
| Health Care - 17.49% | |||||||||||||||
| Biotechnology - 5.27% | |||||||||||||||
| Amgen, Inc. | 256 | 47,255 | |||||||||||||
| Biogen, Inc.A | 154 | 44,697 | |||||||||||||
| Gilead Sciences, Inc. | 660 | 46,754 | |||||||||||||
|
| ||||||||||||||
| 138,706 | |||||||||||||||
|
| ||||||||||||||
| Health Care Providers & Services - 10.69% | |||||||||||||||
| AmerisourceBergen Corp. | 533 | 45,449 | |||||||||||||
| Cardinal Health, Inc. | 966 | 47,170 | |||||||||||||
| Cigna Corp. | 241 | 40,958 | |||||||||||||
See accompanying notes
15
American Beacon Alpha Quant Core FundSM
Schedule of Investments
June 30, 2018
| Shares | Fair Value | ||||||||||||||
| COMMON STOCKS - 98.99% (continued) | |||||||||||||||
| Health Care - 17.49% (continued) | |||||||||||||||
| Health Care Providers & Services - 10.69% (continued) | |||||||||||||||
| Express Scripts Holding Co.A | 603 | $ | 46,558 | ||||||||||||
| Humana, Inc. | 181 | 53,871 | |||||||||||||
| McKesson Corp. | 354 | 47,223 | |||||||||||||
|
| ||||||||||||||
| 281,229 | |||||||||||||||
|
| ||||||||||||||
| Pharmaceuticals - 1.53% | |||||||||||||||
| Bristol-Myers Squibb Co. | 727 | 40,232 | |||||||||||||
|
| ||||||||||||||
Total Health Care | 460,167 | ||||||||||||||
|
| ||||||||||||||
| Industrials - 15.89% | |||||||||||||||
| Aerospace & Defense - 3.59% | |||||||||||||||
| Boeing Co. | 158 | 53,011 | |||||||||||||
| Lockheed Martin Corp. | 140 | 41,360 | |||||||||||||
|
| ||||||||||||||
| 94,371 | |||||||||||||||
|
| ||||||||||||||
| Air Freight & Logistics - 3.78% | |||||||||||||||
| CH Robinson Worldwide, Inc. | 581 | 48,606 | |||||||||||||
| Expeditors International of Washington, Inc. | 695 | 50,805 | |||||||||||||
|
| ||||||||||||||
| 99,411 | |||||||||||||||
|
| ||||||||||||||
| Airlines - 3.31% | |||||||||||||||
| Delta Air Lines, Inc. | 962 | 47,657 | |||||||||||||
| Southwest Airlines Co. | 778 | 39,585 | |||||||||||||
|
| ||||||||||||||
| 87,242 | |||||||||||||||
|
| ||||||||||||||
| Electrical Equipment - 1.92% | |||||||||||||||
| Acuity Brands, Inc. | 436 | 50,519 | |||||||||||||
|
| ||||||||||||||
| Machinery - 1.51% | |||||||||||||||
| Cummins, Inc. | 298 | 39,634 | |||||||||||||
|
| ||||||||||||||
| Professional Services - 1.78% | |||||||||||||||
| Dun & Bradstreet Corp. | 382 | 46,852 | |||||||||||||
|
| ||||||||||||||
Total Industrials | 418,029 | ||||||||||||||
|
| ||||||||||||||
| Information Technology - 29.30% | |||||||||||||||
| Communications Equipment - 5.73% | |||||||||||||||
| Cisco Systems, Inc. | 1,086 | 46,731 | |||||||||||||
| F5 Networks, Inc.A | 349 | 60,185 | |||||||||||||
| Juniper Networks, Inc. | 1,600 | 43,872 | |||||||||||||
|
| ||||||||||||||
| 150,788 | |||||||||||||||
|
| ||||||||||||||
| Internet Software & Services - 5.82% | |||||||||||||||
| Alphabet, Inc., Class AA | 39 | 44,038 | |||||||||||||
| Facebook, Inc., Class AA | 261 | 50,718 | |||||||||||||
| VeriSign, Inc.A | 424 | 58,266 | |||||||||||||
|
| ||||||||||||||
| 153,022 | |||||||||||||||
|
| ||||||||||||||
| IT Services - 2.37% | |||||||||||||||
| Mastercard, Inc., Class A | 317 | 62,297 | |||||||||||||
|
| ||||||||||||||
| Semiconductors & Semiconductor Equipment - 5.01% | |||||||||||||||
| Applied Materials, Inc. | 900 | 41,571 | |||||||||||||
| KLA-Tencor Corp. | 432 | 44,293 | |||||||||||||
| Micron Technology, Inc.A | 875 | 45,885 | |||||||||||||
|
| ||||||||||||||
| 131,749 | |||||||||||||||
|
| ||||||||||||||
See accompanying notes
16
American Beacon Alpha Quant Core FundSM
Schedule of Investments
June 30, 2018
| Shares | Fair Value | ||||||||||||||
| COMMON STOCKS - 98.99% (continued) | |||||||||||||||
| Information Technology - 29.30% (continued) | |||||||||||||||
| Software - 2.20% | |||||||||||||||
| Intuit, Inc. | 283 | $ | 57,818 | ||||||||||||
|
| ||||||||||||||
| Technology Hardware, Storage & Peripherals - 8.17% | |||||||||||||||
| Apple, Inc. | 284 | 52,571 | |||||||||||||
| HP, Inc. | 2,184 | 49,555 | |||||||||||||
| NetApp, Inc. | 814 | 63,923 | |||||||||||||
| Western Digital Corp. | 631 | 48,846 | |||||||||||||
|
| ||||||||||||||
| 214,895 | |||||||||||||||
|
| ||||||||||||||
Total Information Technology | 770,569 | ||||||||||||||
|
| ||||||||||||||
| Materials - 7.23% | |||||||||||||||
| Chemicals - 3.94% | |||||||||||||||
| CF Industries Holdings, Inc. | 1,277 | 56,699 | |||||||||||||
| LyondellBasell Industries N.V., Class A | 427 | 46,906 | |||||||||||||
|
| ||||||||||||||
| 103,605 | |||||||||||||||
|
| ||||||||||||||
| Metals & Mining - 3.29% | |||||||||||||||
| Freeport-McMoRan, Inc. | 2,500 | 43,150 | |||||||||||||
| Newmont Mining Corp. | 1,149 | 43,329 | |||||||||||||
|
| ||||||||||||||
| 86,479 | |||||||||||||||
|
| ||||||||||||||
Total Materials | 190,084 | ||||||||||||||
|
| ||||||||||||||
Total Common Stocks (Cost $2,376,006) | 2,603,822 | ||||||||||||||
|
| ||||||||||||||
| SHORT-TERM INVESTMENTS - 0.98% (Cost $25,830) | |||||||||||||||
| Investment Companies - 0.98% | |||||||||||||||
| American Beacon U.S. Government Money Market Select Fund, Select Class, 1.82%B C | 25,830 | 25,830 | |||||||||||||
|
| ||||||||||||||
TOTAL INVESTMENTS - 99.97% (Cost $2,401,836) | 2,629,652 | ||||||||||||||
OTHER ASSETS, NET OF LIABILITIES - 0.03% | 658 | ||||||||||||||
|
| ||||||||||||||
TOTAL NET ASSETS - 100.00% | $ | 2,630,310 | |||||||||||||
|
| ||||||||||||||
| Percentages are stated as a percent of net assets. | |||||||||||||||
A Non-income producing security.
B The Fund is affiliated by having the same investment advisor.
C 7-day yield.
The Fund’s investments are summarized by level based on the inputs used to determine their values. As of June 30, 2018, the investments were classified as described below:
Alpha Quant Core Fund | Level 1 | Level 2 | Level 3 | Total | ||||||||||||||||||||||||
Assets | ||||||||||||||||||||||||||||
Common Stocks | $ | 2,603,822 | $ | - | $ | - | $ | 2,603,822 | ||||||||||||||||||||
Short-Term Investments | 25,830 | - | - | 25,830 | ||||||||||||||||||||||||
|
|
|
|
|
|
|
| |||||||||||||||||||||
Total Investments in Securities - Assets | $ | 2,629,652 | $ | - | $ | - | $ | 2,629,652 | ||||||||||||||||||||
|
|
|
|
|
|
|
| |||||||||||||||||||||
U.S. GAAP requires all transfers between any levels to be disclosed. The end of period timing recognition has been adopted for the transfers between levels of the Fund’s assets and liabilities. During the year ended June 30, 2018, there were no transfers between levels.
See accompanying notes
17
American Beacon Alpha Quant Dividend FundSM
Schedule of Investments
June 30, 2018
| Shares | Fair Value | ||||||||||||||
| COMMON STOCKS - 99.18% | |||||||||||||||
| Consumer Discretionary - 7.24% | |||||||||||||||
| Media - 3.31% | |||||||||||||||
| Omnicom Group, Inc. | 987 | $ | 75,279 | ||||||||||||
|
| ||||||||||||||
| Multiline Retail - 3.93% | |||||||||||||||
| Target Corp. | 1,176 | 89,517 | |||||||||||||
|
| ||||||||||||||
Total Consumer Discretionary | 164,796 | ||||||||||||||
|
| ||||||||||||||
| Consumer Staples - 12.44% | |||||||||||||||
| Beverages - 3.26% | |||||||||||||||
| Coca-Cola Co. | 1,692 | 74,211 | |||||||||||||
|
| ||||||||||||||
| Food Products - 3.06% | |||||||||||||||
| General Mills, Inc. | 1,573 | 69,621 | |||||||||||||
|
| ||||||||||||||
| Household Products - 3.23% | |||||||||||||||
| Kimberly-Clark Corp. | 698 | 73,527 | |||||||||||||
|
| ||||||||||||||
| Tobacco - 2.89% | |||||||||||||||
| Altria Group, Inc. | 1,160 | 65,877 | |||||||||||||
|
| ||||||||||||||
Total Consumer Staples | 283,236 | ||||||||||||||
|
| ||||||||||||||
| Energy - 7.74% | |||||||||||||||
| Oil, Gas & Consumable Fuels - 7.74% | |||||||||||||||
| Exxon Mobil Corp. | 1,012 | 83,723 | |||||||||||||
| Valero Energy Corp. | 835 | 92,543 | |||||||||||||
|
| ||||||||||||||
| 176,266 | |||||||||||||||
|
| ||||||||||||||
Total Energy | 176,266 | ||||||||||||||
|
| ||||||||||||||
| Financials - 6.09% | |||||||||||||||
| Banks - 3.27% | |||||||||||||||
| People’s United Financial, Inc. | 4,123 | 74,585 | |||||||||||||
|
| ||||||||||||||
| Insurance - 2.82% | |||||||||||||||
| Principal Financial Group, Inc. | 1,212 | 64,175 | |||||||||||||
|
| ||||||||||||||
Total Financials | 138,760 | ||||||||||||||
|
| ||||||||||||||
| Health Care - 12.83% | |||||||||||||||
| Biotechnology - 6.70% | |||||||||||||||
| Amgen, Inc. | 434 | 80,112 | |||||||||||||
| Gilead Sciences, Inc. | 1,024 | 72,540 | |||||||||||||
|
| ||||||||||||||
| 152,652 | |||||||||||||||
|
| ||||||||||||||
| Health Care Providers & Services - 2.83% | |||||||||||||||
| Cardinal Health, Inc. | 1,317 | 64,309 | |||||||||||||
|
| ||||||||||||||
| Pharmaceuticals - 3.30% | |||||||||||||||
| Pfizer, Inc. | 2,071 | 75,136 | |||||||||||||
|
| ||||||||||||||
Total Health Care | 292,097 | ||||||||||||||
|
| ||||||||||||||
| Industrials - 12.50% | |||||||||||||||
| Aerospace & Defense - 3.05% | |||||||||||||||
| Lockheed Martin Corp. | 235 | 69,426 | |||||||||||||
|
| ||||||||||||||
See accompanying notes
18
American Beacon Alpha Quant Dividend FundSM
Schedule of Investments
June 30, 2018
| Shares | Fair Value | ||||||||||||||
| COMMON STOCKS - 99.18% (continued) | |||||||||||||||
| Industrials - 12.50% (continued) | |||||||||||||||
| Air Freight & Logistics - 3.26% | |||||||||||||||
| United Parcel Service, Inc., Class B | 700 | $ | 74,361 | ||||||||||||
|
| ||||||||||||||
| Electrical Equipment - 3.34% | |||||||||||||||
| Emerson Electric Co. | 1,100 | 76,054 | |||||||||||||
|
| ||||||||||||||
| Machinery - 2.85% | |||||||||||||||
| Cummins, Inc. | 488 | 64,904 | |||||||||||||
|
| ||||||||||||||
Total Industrials | 284,745 | ||||||||||||||
|
| ||||||||||||||
| Information Technology - 9.69% | |||||||||||||||
| Communications Equipment - 3.54% | |||||||||||||||
| Cisco Systems, Inc. | 1,872 | 80,552 | |||||||||||||
|
| ||||||||||||||
| IT Services - 2.90% | |||||||||||||||
| International Business Machines Corp. | 473 | 66,078 | |||||||||||||
|
| ||||||||||||||
| Semiconductors & Semiconductor Equipment - 3.25% | |||||||||||||||
| QUALCOMM, Inc. | 1,317 | 73,910 | |||||||||||||
|
| ||||||||||||||
Total Information Technology | 220,540 | ||||||||||||||
|
| ||||||||||||||
| Materials - 9.85% | |||||||||||||||
| Chemicals - 9.85% | |||||||||||||||
| Air Products & Chemicals, Inc. | 492 | 76,619 | |||||||||||||
| International Flavors & Fragrances, Inc. | 575 | 71,277 | |||||||||||||
| Praxair, Inc. | 483 | 76,387 | |||||||||||||
|
| ||||||||||||||
| 224,283 | |||||||||||||||
|
| ||||||||||||||
Total Materials | 224,283 | ||||||||||||||
|
| ||||||||||||||
| Real Estate - 3.43% | |||||||||||||||
| Equity Real Estate Investment Trusts (REITs) - 3.43% | |||||||||||||||
| AvalonBay Communities, Inc. | 454 | 78,038 | |||||||||||||
|
| ||||||||||||||
| Telecommunication Services - 6.48% | |||||||||||||||
| Diversified Telecommunication Services - 6.48% | |||||||||||||||
| AT&T, Inc. | 2,174 | 69,807 | |||||||||||||
| Verizon Communications, Inc. | 1,544 | 77,679 | |||||||||||||
|
| ||||||||||||||
| 147,486 | |||||||||||||||
|
| ||||||||||||||
Total Telecommunication Services | 147,486 | ||||||||||||||
|
| ||||||||||||||
| Utilities - 10.89% | |||||||||||||||
| Electric Utilities - 7.04% | |||||||||||||||
| American Electric Power Co., Inc. | 1,158 | 80,192 | |||||||||||||
| Southern Co. | 1,733 | 80,255 | |||||||||||||
|
| ||||||||||||||
| 160,447 | |||||||||||||||
|
| ||||||||||||||
| Multi-Utilities - 3.85% | |||||||||||||||
| Public Service Enterprise Group, Inc. | 1,618 | 87,598 | |||||||||||||
|
| ||||||||||||||
Total Utilities | 248,045 | ||||||||||||||
|
| ||||||||||||||
Total Common Stocks (Cost $2,318,192) | 2,258,292 | ||||||||||||||
|
| ||||||||||||||
See accompanying notes
19
American Beacon Alpha Quant Dividend FundSM
Schedule of Investments
June 30, 2018
| Shares | Fair Value | ||||||||||||||
| SHORT-TERM INVESTMENTS - 0.64% (Cost $14,544) | |||||||||||||||
| Investment Companies - 0.64% | |||||||||||||||
| American Beacon U.S. Government Money Market Select Fund, Select Class, 1.82%A B | 14,544 | $ | 14,544 | ||||||||||||
|
| ||||||||||||||
TOTAL INVESTMENTS - 99.82% (Cost $2,332,736) | 2,272,836 | ||||||||||||||
OTHER ASSETS, NET OF LIABILITIES - 0.18% | 4,101 | ||||||||||||||
|
| ||||||||||||||
TOTAL NET ASSETS - 100.00% | $ | 2,276,937 | |||||||||||||
|
| ||||||||||||||
| Percentages are stated as a percent of net assets. | |||||||||||||||
A The Fund is affiliated by having the same investment advisor.
B 7-day yield.
The Fund’s investments are summarized by level based on the inputs used to determine their values. As of June 30, 2018, the investments were classified as described below:
Alpha Quant Dividend Fund | Level 1 | Level 2 | Level 3 | Total | ||||||||||||||||||||||||
Assets |
| |||||||||||||||||||||||||||
Common Stocks | $ | 2,258,292 | $ | - | $ | - | $ | 2,258,292 | ||||||||||||||||||||
Short-Term Investments | 14,544 | - | - | 14,544 | ||||||||||||||||||||||||
|
|
|
|
|
|
|
| |||||||||||||||||||||
Total Investments in Securities - Assets | $ | 2,272,836 | $ | - | $ | - | $ | 2,272,836 | ||||||||||||||||||||
|
|
|
|
|
|
|
| |||||||||||||||||||||
U.S. GAAP requires all transfers between any levels to be disclosed. The end of period timing recognition has been adopted for the transfers between levels of the Fund’s assets and liabilities. During the year ended June 30, 2018, there were no transfers between levels.
See accompanying notes
20
American Beacon Alpha Quant Quality FundSM
Schedule of Investments
June 30, 2018
| Shares | Fair Value | ||||||||||||||
| COMMON STOCKS - 99.36% | |||||||||||||||
| Consumer Discretionary - 6.63% | |||||||||||||||
| Leisure Products - 3.04% | |||||||||||||||
| Hasbro, Inc. | 819 | $ | 75,602 | ||||||||||||
|
| ||||||||||||||
| Specialty Retail - 3.59% | |||||||||||||||
| Best Buy Co., Inc. | 1,199 | 89,421 | |||||||||||||
|
| ||||||||||||||
Total Consumer Discretionary | 165,023 | ||||||||||||||
|
| ||||||||||||||
| Consumer Staples - 16.70% | |||||||||||||||
| Food & Staples Retailing - 7.08% | |||||||||||||||
| Costco Wholesale Corp. | 425 | 88,817 | |||||||||||||
| Sysco Corp. | 1,280 | 87,411 | |||||||||||||
|
| ||||||||||||||
| 176,228 | |||||||||||||||
|
| ||||||||||||||
| Household Products - 6.66% | |||||||||||||||
| Church & Dwight Co., Inc. | 1,535 | 81,600 | |||||||||||||
| Clorox Co. | 624 | 84,396 | |||||||||||||
|
| ||||||||||||||
| 165,996 | |||||||||||||||
|
| ||||||||||||||
| Tobacco - 2.96% | |||||||||||||||
| Altria Group, Inc. | 1,300 | 73,827 | |||||||||||||
|
| ||||||||||||||
Total Consumer Staples | 416,051 | ||||||||||||||
|
| ||||||||||||||
| Energy - 3.68% | |||||||||||||||
| Oil, Gas & Consumable Fuels - 3.68% | |||||||||||||||
| Valero Energy Corp. | 827 | 91,657 | |||||||||||||
|
| ||||||||||||||
| Health Care - 15.46% | |||||||||||||||
| Biotechnology - 6.39% | |||||||||||||||
| Amgen, Inc. | 477 | 88,049 | |||||||||||||
| Biogen, Inc.A | 245 | 71,109 | |||||||||||||
|
| ||||||||||||||
| 159,158 | |||||||||||||||
|
| ||||||||||||||
| Health Care Providers & Services - 6.32% | |||||||||||||||
| AmerisourceBergen Corp. | 850 | 72,479 | |||||||||||||
| Express Scripts Holding Co.A | 1,100 | 84,931 | |||||||||||||
|
| ||||||||||||||
| 157,410 | |||||||||||||||
|
| ||||||||||||||
| Pharmaceuticals - 2.75% | |||||||||||||||
| Bristol-Myers Squibb Co. | 1,240 | 68,622 | |||||||||||||
|
| ||||||||||||||
Total Health Care | 385,190 | ||||||||||||||
|
| ||||||||||||||
| Industrials - 21.59% | |||||||||||||||
| Aerospace & Defense - 6.29% | |||||||||||||||
| Boeing Co. | 260 | 87,233 | |||||||||||||
| Lockheed Martin Corp. | 235 | 69,426 | |||||||||||||
|
| ||||||||||||||
| 156,659 | |||||||||||||||
|
| ||||||||||||||
| Air Freight & Logistics - 6.75% | |||||||||||||||
| CH Robinson Worldwide, Inc. | 972 | 81,318 | |||||||||||||
| Expeditors International of Washington, Inc. | 1,188 | 86,843 | |||||||||||||
|
| ||||||||||||||
| 168,161 | |||||||||||||||
|
| ||||||||||||||
See accompanying notes
21
American Beacon Alpha Quant Quality FundSM
Schedule of Investments
June 30, 2018
| Shares | Fair Value | ||||||||||||||
| COMMON STOCKS - 99.36% (continued) | |||||||||||||||
| Industrials - 21.59% (continued) | |||||||||||||||
| Airlines - 5.58% | |||||||||||||||
| Delta Air Lines, Inc. | 1,608 | $ | 79,660 | ||||||||||||
| Southwest Airlines Co. | 1,167 | 59,377 | |||||||||||||
|
| ||||||||||||||
| 139,037 | |||||||||||||||
|
| ||||||||||||||
| Professional Services - 2.97% | |||||||||||||||
| Dun & Bradstreet Corp. | 602 | 73,835 | |||||||||||||
|
| ||||||||||||||
Total Industrials | 537,692 | ||||||||||||||
|
| ||||||||||||||
| Information Technology - 31.86% | |||||||||||||||
| Communications Equipment - 3.82% | |||||||||||||||
| F5 Networks, Inc.A | 552 | 95,192 | |||||||||||||
|
| ||||||||||||||
| Internet Software & Services - 10.31% | |||||||||||||||
| Alphabet, Inc., Class AA | 70 | 79,043 | |||||||||||||
| Facebook, Inc., Class AA | 420 | 81,615 | |||||||||||||
| VeriSign, Inc.A | 700 | 96,194 | |||||||||||||
|
| ||||||||||||||
| 256,852 | |||||||||||||||
|
| ||||||||||||||
| IT Services - 4.03% | |||||||||||||||
| Mastercard, Inc., Class A | 511 | 100,422 | |||||||||||||
|
| ||||||||||||||
| Semiconductors & Semiconductor Equipment - 5.87% | |||||||||||||||
| Applied Materials, Inc. | 1,575 | 72,749 | |||||||||||||
| KLA-Tencor Corp. | 715 | 73,309 | |||||||||||||
|
| ||||||||||||||
| 146,058 | |||||||||||||||
|
| ||||||||||||||
| Software - 4.19% | |||||||||||||||
| Intuit, Inc. | 511 | 104,400 | |||||||||||||
|
| ||||||||||||||
| Technology Hardware, Storage & Peripherals - 3.64% | |||||||||||||||
| Apple, Inc. | 490 | 90,704 | |||||||||||||
|
| ||||||||||||||
Total Information Technology | 793,628 | ||||||||||||||
|
| ||||||||||||||
| Materials - 3.44% | |||||||||||||||
| Chemicals - 3.44% | |||||||||||||||
| LyondellBasell Industries N.V., Class A | 780 | 85,683 | |||||||||||||
|
| ||||||||||||||
Total Common Stocks (Cost $2,208,351) | 2,474,924 | ||||||||||||||
|
| ||||||||||||||
| SHORT-TERM INVESTMENTS - 0.64% (Cost $15,913) | |||||||||||||||
| Investment Companies - 0.64% | |||||||||||||||
| American Beacon U.S. Government Money Market Select Fund, Select Class, 1.82%B C | 15,913 | 15,913 | |||||||||||||
|
| ||||||||||||||
TOTAL INVESTMENTS - 100.00% (Cost $2,224,264) | 2,490,837 | ||||||||||||||
LIABILITIES, NET OF OTHER ASSETS - 0.00% | (89 | ) | |||||||||||||
|
| ||||||||||||||
TOTAL NET ASSETS - 100.00% | $ | 2,490,748 | |||||||||||||
|
| ||||||||||||||
| Percentages are stated as a percent of net assets. | |||||||||||||||
A Non-income producing security.
B The Fund is affiliated by having the same investment advisor.
C 7-day yield.
See accompanying notes
22
American Beacon Alpha Quant Quality FundSM
Schedule of Investments
June 30, 2018
The Fund’s investments are summarized by level based on the inputs used to determine their values. As of June 30, 2018, the investments were classified as described below:
Alpha Quant Quality Fund | Level 1 | Level 2 | Level 3 | Total | ||||||||||||||||||||||||
Assets | ||||||||||||||||||||||||||||
Common Stocks | $ | 2,474,924 | $ | - | $ | - | $ | 2,474,924 | ||||||||||||||||||||
Short-Term Investments | 15,913 | - | - | 15,913 | ||||||||||||||||||||||||
|
|
|
|
|
|
|
| |||||||||||||||||||||
Total Investments in Securities - Assets | $ | 2,490,837 | $ | - | $ | - | $ | 2,490,837 | ||||||||||||||||||||
|
|
|
|
|
|
|
| |||||||||||||||||||||
U.S. GAAP requires all transfers between any levels to be disclosed. The end of period timing recognition has been adopted for the transfers between levels of the Fund’s assets and liabilities. During the year ended June 30, 2018, there were no transfers between levels.
See accompanying notes
23
American Beacon Alpha Quant Value FundSM
Schedule of Investments
June 30, 2018
| Shares | Fair Value | ||||||||||||||
| COMMON STOCKS - 99.14% | |||||||||||||||
| Consumer Staples - 18.18% | |||||||||||||||
| Beverages - 3.32% | |||||||||||||||
| Molson Coors Brewing Co., Class B | 1,743 | $ | 118,594 | ||||||||||||
|
| ||||||||||||||
| Food & Staples Retailing - 5.80% | |||||||||||||||
| Walgreens Boots Alliance, Inc. | 1,889 | 113,368 | |||||||||||||
| Walmart, Inc. | 1,091 | 93,444 | |||||||||||||
|
| ||||||||||||||
| 206,812 | |||||||||||||||
|
| ||||||||||||||
| Food Products - 6.46% | |||||||||||||||
| Conagra Brands, Inc. | 2,770 | 98,972 | |||||||||||||
| General Mills, Inc. | 2,967 | 131,320 | |||||||||||||
|
| ||||||||||||||
| 230,292 | |||||||||||||||
|
| ||||||||||||||
| Health Care Providers & Services - 2.60% | |||||||||||||||
| CVS Health Corp. | 1,441 | 92,728 | |||||||||||||
|
| ||||||||||||||
Total Consumer Staples | 648,426 | ||||||||||||||
|
| ||||||||||||||
| Energy - 9.81% | |||||||||||||||
| Oil, Gas & Consumable Fuels - 9.81% | |||||||||||||||
| Exxon Mobil Corp. | 1,262 | 104,405 | |||||||||||||
| Marathon Petroleum Corp. | 1,619 | 113,589 | |||||||||||||
| Valero Energy Corp. | 1,190 | 131,888 | |||||||||||||
|
| ||||||||||||||
| 349,882 | |||||||||||||||
|
| ||||||||||||||
Total Energy | 349,882 | ||||||||||||||
|
| ||||||||||||||
| Health Care - 23.75% | |||||||||||||||
| Biotechnology - 6.84% | |||||||||||||||
| Amgen, Inc. | 642 | 118,507 | |||||||||||||
| Gilead Sciences, Inc. | 1,768 | 125,245 | |||||||||||||
|
| ||||||||||||||
| 243,752 | |||||||||||||||
|
| ||||||||||||||
| Health Care Providers & Services - 16.91% | |||||||||||||||
| Cardinal Health, Inc. | 2,436 | 118,950 | |||||||||||||
| Cigna Corp. | 750 | 127,462 | |||||||||||||
| Express Scripts Holding Co.A | 1,543 | 119,135 | |||||||||||||
| Humana, Inc. | 412 | 122,624 | |||||||||||||
| McKesson Corp. | 862 | 114,991 | |||||||||||||
|
| ||||||||||||||
| 603,162 | |||||||||||||||
|
| ||||||||||||||
Total Health Care | 846,914 | ||||||||||||||
|
| ||||||||||||||
| Industrials - 8.89% | |||||||||||||||
| Aerospace & Defense - 3.45% | |||||||||||||||
| Boeing Co. | 367 | 123,132 | |||||||||||||
|
| ||||||||||||||
| Electrical Equipment - 3.10% | |||||||||||||||
| Acuity Brands, Inc. | 954 | 110,540 | |||||||||||||
|
| ||||||||||||||
| Machinery - 2.34% | |||||||||||||||
| Cummins, Inc. | 626 | 83,258 | |||||||||||||
|
| ||||||||||||||
Total Industrials | 316,930 | ||||||||||||||
|
| ||||||||||||||
See accompanying notes
24
American Beacon Alpha Quant Value FundSM
Schedule of Investments
June 30, 2018
| Shares | Fair Value | ||||||||||||||
| COMMON STOCKS - 99.14% (continued) | |||||||||||||||
| Information Technology - 25.15% | |||||||||||||||
| Communications Equipment - 10.79% | |||||||||||||||
| Cisco Systems, Inc. | 2,713 | $ | 116,740 | ||||||||||||
| F5 Networks, Inc.A | 778 | 134,166 | |||||||||||||
| Juniper Networks, Inc. | 4,878 | 133,755 | |||||||||||||
|
| ||||||||||||||
| 384,661 | |||||||||||||||
|
| ||||||||||||||
| Semiconductors & Semiconductor Equipment - 3.25% | |||||||||||||||
| Micron Technology, Inc.A | 2,214 | 116,102 | |||||||||||||
|
| ||||||||||||||
| Technology Hardware, Storage & Peripherals - 11.11% | |||||||||||||||
| HP, Inc. | 5,568 | 126,338 | |||||||||||||
| NetApp, Inc. | 1,804 | 141,668 | |||||||||||||
| Western Digital Corp. | 1,655 | 128,114 | |||||||||||||
|
| ||||||||||||||
| 396,120 | |||||||||||||||
|
| ||||||||||||||
Total Information Technology | 896,883 | ||||||||||||||
|
| ||||||||||||||
| Materials - 13.36% | |||||||||||||||
| Chemicals - 7.04% | |||||||||||||||
| CF Industries Holdings, Inc. | 2,710 | 120,324 | |||||||||||||
| LyondellBasell Industries N.V., Class A | 1,189 | 130,612 | |||||||||||||
|
| ||||||||||||||
| 250,936 | |||||||||||||||
|
| ||||||||||||||
| Metals & Mining - 6.32% | |||||||||||||||
| Freeport-McMoRan, Inc. | 6,798 | 117,333 | |||||||||||||
| Newmont Mining Corp. | 2,863 | 107,964 | |||||||||||||
|
| ||||||||||||||
| 225,297 | |||||||||||||||
|
| ||||||||||||||
Total Materials | 476,233 | ||||||||||||||
|
| ||||||||||||||
Total Common Stocks (Cost $3,285,914) | 3,535,268 | ||||||||||||||
|
| ||||||||||||||
| SHORT-TERM INVESTMENTS - 0.97% (Cost $34,476) | |||||||||||||||
| Investment Companies - 0.97% | |||||||||||||||
| American Beacon U.S. Government Money Market Select Fund, Select Class, 1.82%B C | 34,476 | 34,476 | |||||||||||||
|
| ||||||||||||||
TOTAL INVESTMENTS - 100.11% (Cost $3,320,390) | 3,569,744 | ||||||||||||||
LIABILITIES, NET OF OTHER ASSETS - (0.11%) | (3,758 | ) | |||||||||||||
|
| ||||||||||||||
TOTAL NET ASSETS - 100.00% | $ | 3,565,986 | |||||||||||||
|
| ||||||||||||||
| Percentages are stated as a percent of net assets. | |||||||||||||||
A Non-income producing security.
B The Fund is affiliated by having the same investment advisor.
C 7-day yield.
The Fund’s investments are summarized by level based on the inputs used to determine their values. As of June 30, 2018, the investments were classified as described below:
Alpha Quant Value Fund | Level 1 | Level 2 | Level 3 | Total | ||||||||||||||||||||||||
Assets | ||||||||||||||||||||||||||||
Common Stocks | $ | 3,535,268 | $ | - | $ | - | $ | 3,535,268 | ||||||||||||||||||||
Short-Term Investments | 34,476 | - | - | 34,476 | ||||||||||||||||||||||||
|
|
|
|
|
|
|
| |||||||||||||||||||||
Total Investments in Securities - Assets | $ | 3,569,744 | $ | - | $ | - | $ | 3,569,744 | ||||||||||||||||||||
|
|
|
|
|
|
|
| |||||||||||||||||||||
U.S. GAAP requires all transfers between any levels to be disclosed. The end of period timing recognition has been adopted for the transfers between levels of the Fund’s assets and liabilities. During the year ended June 30, 2018, there were no transfers between levels.
See accompanying notes
25
Statements of Assets and Liabilities
June 30, 2018
| Alpha Quant Core Fund | Alpha Quant Dividend Fund | Alpha Quant Quality Fund | Alpha Quant Value Fund | |||||||||||||||||||||||||
Assets: | ||||||||||||||||||||||||||||
Investments in unaffiliated securities, at fair value† | $ | 2,603,822 | $ | 2,258,292 | $ | 2,474,924 | $ | 3,535,268 | ||||||||||||||||||||
Investments in affiliated securities, at fair value‡ | 25,830 | 14,544 | 15,913 | 34,476 | ||||||||||||||||||||||||
Dividends and interest receivable | 1,848 | 5,024 | 941 | 3,299 | ||||||||||||||||||||||||
Receivable for expense reimbursement (Note 2) | 16,733 | 16,775 | 16,788 | 16,745 | ||||||||||||||||||||||||
Prepaid expenses | 19,881 | 19,879 | 19,886 | 23,535 | ||||||||||||||||||||||||
|
|
|
|
|
|
|
| |||||||||||||||||||||
Total assets | 2,668,114 | 2,314,514 | 2,528,452 | 3,613,323 | ||||||||||||||||||||||||
|
|
|
|
|
|
|
| |||||||||||||||||||||
Liabilities: |
| |||||||||||||||||||||||||||
Payable for investments purchased | - | - | - | 9,029 | ||||||||||||||||||||||||
Cash due to custodian | 24 | 23 | 23 | 23 | ||||||||||||||||||||||||
Management and sub-advisory fees payable (Note 2) | 1,318 | 1,133 | 1,249 | 1,736 | ||||||||||||||||||||||||
Transfer agent fees payable (Note 2) | 192 | 179 | 187 | 189 | ||||||||||||||||||||||||
Custody and fund accounting fees payable | 849 | 844 | 846 | 847 | ||||||||||||||||||||||||
Professional fees payable | 33,563 | 33,569 | 33,565 | 33,561 | ||||||||||||||||||||||||
Trustee fees payable (Note 2) | 1 | 2 | - | 1 | ||||||||||||||||||||||||
Payable for prospectus and shareholder reports | 1,327 | 1,304 | 1,327 | 1,333 | ||||||||||||||||||||||||
Other liabilities | 530 | 523 | 507 | 618 | ||||||||||||||||||||||||
|
|
|
|
|
|
|
| |||||||||||||||||||||
Total liabilities | 37,804 | 37,577 | 37,704 | 47,337 | ||||||||||||||||||||||||
|
|
|
|
|
|
|
| |||||||||||||||||||||
Net assets | $ | 2,630,310 | $ | 2,276,937 | $ | 2,490,748 | $ | 3,565,986 | ||||||||||||||||||||
|
|
|
|
|
|
|
| |||||||||||||||||||||
Analysis of net assets: |
| |||||||||||||||||||||||||||
Paid-in-capital | $ | 2,269,637 | $ | 2,199,188 | $ | 2,048,318 | $ | 3,181,516 | ||||||||||||||||||||
Undistributed net investment income | 10,310 | 13,856 | 7,406 | 16,044 | ||||||||||||||||||||||||
Accumulated net realized gain | 122,547 | 123,793 | 168,451 | 119,072 | ||||||||||||||||||||||||
Unrealized appreciation (depreciation) of investments in unaffiliated securitiesA | 227,816 | (59,900 | ) | 266,573 | 249,354 | |||||||||||||||||||||||
|
|
|
|
|
|
|
| |||||||||||||||||||||
Net assets | $ | 2,630,310 | $ | 2,276,937 | $ | 2,490,748 | $ | 3,565,986 | ||||||||||||||||||||
|
|
|
|
|
|
|
| |||||||||||||||||||||
Shares outstanding at no par value (unlimited shares authorized): |
| |||||||||||||||||||||||||||
Institutional Class | 200,663 | 194,345 | 181,294 | 192,528 | ||||||||||||||||||||||||
|
|
|
|
|
|
|
| |||||||||||||||||||||
Y Class | 11,863 | 12,774 | 11,796 | 89,034 | ||||||||||||||||||||||||
|
|
|
|
|
|
|
| |||||||||||||||||||||
Investor Class | 10,785 | 11,445 | 11,107 | 18,758 | ||||||||||||||||||||||||
|
|
|
|
|
|
|
| |||||||||||||||||||||
Net assets: |
| |||||||||||||||||||||||||||
Institutional Class | $ | 2,364,264 | $ | 2,025,327 | $ | 2,212,134 | $ | 2,287,739 | ||||||||||||||||||||
|
|
|
|
|
|
|
| |||||||||||||||||||||
Y Class | $ | 139,588 | $ | 132,924 | $ | 143,744 | $ | 1,056,453 | ||||||||||||||||||||
|
|
|
|
|
|
|
| |||||||||||||||||||||
Investor Class | $ | 126,458 | $ | 118,686 | $ | 134,870 | $ | 221,794 | ||||||||||||||||||||
|
|
|
|
|
|
|
| |||||||||||||||||||||
Net asset value, offering and redemption price per share: | ||||||||||||||||||||||||||||
Institutional Class | $ | 11.78 | $ | 10.42 | $ | 12.20 | $ | 11.88 | ||||||||||||||||||||
|
|
|
|
|
|
|
| |||||||||||||||||||||
Y Class | $ | 11.77 | $ | 10.41 | $ | 12.19 | $ | 11.87 | ||||||||||||||||||||
|
|
|
|
|
|
|
| |||||||||||||||||||||
Investor Class | $ | 11.73 | $ | 10.37 | $ | 12.14 | $ | 11.82 | ||||||||||||||||||||
|
|
|
|
|
|
|
| |||||||||||||||||||||
† Cost of investments in unaffiliated securities | $ | 2,376,006 | $ | 2,318,192 | $ | 2,208,351 | $ | 3,285,914 | ||||||||||||||||||||
‡ Cost of investments in affiliated securities | $ | 25,830 | $ | 14,544 | $ | 15,913 | $ | 34,476 | ||||||||||||||||||||
A The Fund’s investments in affiliated securities did not have unrealized appreciation (depreciation) at year end. |
| |||||||||||||||||||||||||||
See accompanying notes
26
American Beacon FundsSM
Statements of Operations
For the year ended June 30, 2018
| Alpha Quant Core Fund | Alpha Quant Dividend Fund | Alpha Quant Quality Fund | Alpha Quant Value Fund | |||||||||||||||||||||||||
Investment income: |
| |||||||||||||||||||||||||||
Dividend income from unaffiliated securitiesA | $ | 48,355 | $ | 73,847 | $ | 33,773 | $ | 63,668 | ||||||||||||||||||||
Dividend income from affiliated securities (Note 7) | 419 | 275 | 229 | 501 | ||||||||||||||||||||||||
Income derived from securities lending (Note 8) | 28 | 8 | 46 | - | ||||||||||||||||||||||||
|
|
|
|
|
|
|
| |||||||||||||||||||||
Total investment income | 48,802 | 74,130 | 34,048 | 64,169 | ||||||||||||||||||||||||
|
|
|
|
|
|
|
| |||||||||||||||||||||
Expenses: |
| |||||||||||||||||||||||||||
Management and sub-advisory fees (Note 2) | 14,204 | 13,211 | 13,785 | 14,832 | ||||||||||||||||||||||||
Transfer agent fees: | ||||||||||||||||||||||||||||
Institutional Class (Note 2) | 87 | 78 | 79 | 79 | ||||||||||||||||||||||||
Y Class (Note 2) | 106 | 105 | 102 | 72 | ||||||||||||||||||||||||
Investor Class | 1,243 | 1,235 | 1,234 | 1,255 | ||||||||||||||||||||||||
Custody and fund accounting fees | 5,791 | 5,776 | 5,784 | 5,787 | ||||||||||||||||||||||||
Professional fees | 39,314 | 39,242 | 39,308 | 39,328 | ||||||||||||||||||||||||
Registration fees and expenses | 59,613 | 59,606 | 59,588 | 56,003 | ||||||||||||||||||||||||
Service fees (Note 2): | ||||||||||||||||||||||||||||
Investor Class | 143 | 139 | 143 | 153 | ||||||||||||||||||||||||
Prospectus and shareholder report expenses | 8,651 | 8,476 | 8,551 | 8,631 | ||||||||||||||||||||||||
Trustee fees (Note 2) | 159 | 149 | 154 | 164 | ||||||||||||||||||||||||
Other expenses | 3,483 | 3,461 | 3,463 | 3,464 | ||||||||||||||||||||||||
|
|
|
|
|
|
|
| |||||||||||||||||||||
Total expenses | 132,794 | 131,478 | 132,191 | 129,768 | ||||||||||||||||||||||||
|
|
|
|
|
|
|
| |||||||||||||||||||||
Net fees waived and expenses (reimbursed) (Note 2) | (115,902 | ) | (115,728 | ) | (115,763 | ) | (111,926 | ) | ||||||||||||||||||||
|
|
|
|
|
|
|
| |||||||||||||||||||||
Net expenses | 16,892 | 15,750 | 16,428 | 17,842 | ||||||||||||||||||||||||
|
|
|
|
|
|
|
| |||||||||||||||||||||
Net investment income | 31,910 | 58,380 | 17,620 | 46,327 | ||||||||||||||||||||||||
|
|
|
|
|
|
|
| |||||||||||||||||||||
Realized and unrealized gain (loss) from investments: |
| |||||||||||||||||||||||||||
Net realized gain from: | ||||||||||||||||||||||||||||
Investments in unaffiliated securitiesB | 128,511 | 124,002 | 179,184 | 125,143 | ||||||||||||||||||||||||
Change in net unrealized appreciation (depreciation) of: | ||||||||||||||||||||||||||||
Investments in unaffiliated securitiesC | 188,355 | (45,759 | ) | 243,152 | 201,721 | |||||||||||||||||||||||
|
|
|
|
|
|
|
| |||||||||||||||||||||
Net gain from investments | 316,866 | 78,243 | 422,336 | 326,864 | ||||||||||||||||||||||||
|
|
|
|
|
|
|
| |||||||||||||||||||||
Net increase in net assets resulting from operations | $ | 348,776 | $ | 136,623 | $ | 439,956 | $ | 373,191 | ||||||||||||||||||||
|
|
|
|
|
|
|
| |||||||||||||||||||||
A Includes non-recurring dividends of $8,820 and $16,363, respectively for the Alpha Quant Core Fund and Alpha Quant Value Fund. |
| |||||||||||||||||||||||||||
B The Fund did not recognize net realized gains (losses) from the sale of investments in affiliated securities. |
| |||||||||||||||||||||||||||
C The Fund’s investments in affiliated securities did not have a change in unrealized appreciation (depreciation) at year end. |
| |||||||||||||||||||||||||||
See accompanying notes
27
American Beacon FundsSM
Statements of Changes in Net Assets
| Alpha Quant Core Fund | Alpha Quant Dividend Fund | |||||||||||||||||||||||||||
| Year Ended June 30, 2018 | From March 22, 2017A to June 30, 2017 | Year Ended June 30, 2018 | From March 22, 2017A to June 30, 2017 | |||||||||||||||||||||||||
Increase (decrease) in net assets: | ||||||||||||||||||||||||||||
Operations: | ||||||||||||||||||||||||||||
Net investment income | $ | 31,910 | $ | 5,929 | $ | 58,380 | $ | 13,213 | ||||||||||||||||||||
Net realized gain (loss) from investments in unaffiliated securities | 128,511 | (5,964 | ) | 124,002 | - | |||||||||||||||||||||||
Change in net unrealized appreciation (depreciation) of investments in unaffiliated securities | 188,355 | 39,461 | (45,759 | ) | (14,141 | ) | ||||||||||||||||||||||
|
|
|
|
|
|
|
| |||||||||||||||||||||
Net increase (decrease) in net assets resulting from operations | 348,776 | 39,426 | 136,623 | (928 | ) | |||||||||||||||||||||||
|
|
|
|
|
|
|
| |||||||||||||||||||||
Distributions to shareholders: |
| |||||||||||||||||||||||||||
Net investment income: | ||||||||||||||||||||||||||||
Institutional Class | (24,547 | ) | - | (51,025 | ) | - | ||||||||||||||||||||||
Y Class | (1,582 | ) | - | (3,219 | ) | - | ||||||||||||||||||||||
Investor Class | (1,400 | ) | - | (2,929 | ) | - | ||||||||||||||||||||||
Net realized gain from investments: | ||||||||||||||||||||||||||||
Institutional Class | - | - | (689 | ) | - | |||||||||||||||||||||||
Y Class | - | - | (45 | ) | - | |||||||||||||||||||||||
Investor Class | - | - | (39 | ) | - | |||||||||||||||||||||||
|
|
|
|
|
|
|
| |||||||||||||||||||||
Net distributions to shareholders | (27,529 | ) | - | (57,946 | ) | - | ||||||||||||||||||||||
|
|
|
|
|
|
|
| |||||||||||||||||||||
Capital share transactions (Note 10): | ||||||||||||||||||||||||||||
Proceeds from sales of shares | 240,724 | 3,000 | 239,050 | 3,000 | ||||||||||||||||||||||||
Reinvestment of dividends and distributions | 27,529 | - | 57,946 | - | ||||||||||||||||||||||||
Cost of shares redeemed | (1,616 | ) | - | (100,808 | ) | - | ||||||||||||||||||||||
|
|
|
|
|
|
|
| |||||||||||||||||||||
Net increase in net assets from capital share transactions | 266,637 | 3,000 | 196,188 | 3,000 | ||||||||||||||||||||||||
|
|
|
|
|
|
|
| |||||||||||||||||||||
Net increase in net assets | 587,884 | 42,426 | 274,865 | 2,072 | ||||||||||||||||||||||||
|
|
|
|
|
|
|
| |||||||||||||||||||||
Net assets: |
| |||||||||||||||||||||||||||
Beginning of period | 2,042,426 | 2,000,000 | B | 2,002,072 | 2,000,000 | B | ||||||||||||||||||||||
|
|
|
|
|
|
|
| |||||||||||||||||||||
End of period * | $ | 2,630,310 | $ | 2,042,426 | $ | 2,276,937 | $ | 2,002,072 | ||||||||||||||||||||
|
|
|
|
|
|
|
| |||||||||||||||||||||
*Includes undistributed net investment income | $ | 10,310 | $ | 5,929 | $ | 13,856 | $ | 12,964 | ||||||||||||||||||||
|
|
|
|
|
|
|
| |||||||||||||||||||||
A Commencement of operations. | ||||||||||||||||||||||||||||
B Seed capital. | ||||||||||||||||||||||||||||
See accompanying notes
28
American Beacon FundsSM
Statements of Changes in Net Assets
| Alpha Quant Quality Fund | Alpha Quant Value Fund | |||||||||||||||||||||||||||
| Year Ended June 30, 2018 | From March 22, 2017A to June 30, 2017 | Year Ended June 30, 2018 | From March 22, 2017A to June 30, 2017 | |||||||||||||||||||||||||
Increase (decrease) in net assets: | ||||||||||||||||||||||||||||
Operations: | ||||||||||||||||||||||||||||
Net investment income | $ | 17,620 | $ | 6,613 | $ | 46,327 | $ | 5,352 | ||||||||||||||||||||
Net realized gain (loss) from investments in unaffiliated securities | 179,184 | (10,733 | ) | 125,143 | (6,071 | ) | ||||||||||||||||||||||
Change in net unrealized appreciation of investments in unaffiliated securities | 243,152 | 23,421 | 201,721 | 47,633 | ||||||||||||||||||||||||
|
|
|
|
|
|
|
| |||||||||||||||||||||
Net increase in net assets resulting from operations | 439,956 | 19,301 | 373,191 | 46,914 | ||||||||||||||||||||||||
|
|
|
|
|
|
|
| |||||||||||||||||||||
Distributions to shareholders: |
| |||||||||||||||||||||||||||
Net investment income: | ||||||||||||||||||||||||||||
Institutional Class | (14,994 | ) | - | (31,446 | ) | - | ||||||||||||||||||||||
Y Class | (976 | ) | - | (2,250 | ) | - | ||||||||||||||||||||||
Investor Class | (857 | ) | - | (1,939 | ) | - | ||||||||||||||||||||||
|
|
|
|
|
|
|
| |||||||||||||||||||||
Net distributions to shareholders | (16,827 | ) | - | (35,635 | ) | - | ||||||||||||||||||||||
|
|
|
|
|
|
|
| |||||||||||||||||||||
Capital share transactions (Note 10): | ||||||||||||||||||||||||||||
Proceeds from sales of shares | 28,491 | 3,000 | 1,140,762 | 6,000 | ||||||||||||||||||||||||
Reinvestment of dividends and distributions | 16,827 | - | 35,635 | - | ||||||||||||||||||||||||
Cost of shares redeemed | - | - | (881 | ) | - | |||||||||||||||||||||||
|
|
|
|
|
|
|
| |||||||||||||||||||||
Net increase in net assets from capital share transactions | 45,318 | 3,000 | 1,175,516 | 6,000 | ||||||||||||||||||||||||
|
|
|
|
|
|
|
| |||||||||||||||||||||
Net increase in net assets | 468,447 | 22,301 | 1,513,072 | 52,914 | ||||||||||||||||||||||||
|
|
|
|
|
|
|
| |||||||||||||||||||||
Net assets: |
| |||||||||||||||||||||||||||
Beginning of period | 2,022,301 | 2,000,000 | B | 2,052,914 | 2,000,000 | B | ||||||||||||||||||||||
|
|
|
|
|
|
|
| |||||||||||||||||||||
End of period * | $ | 2,490,748 | $ | 2,022,301 | $ | 3,565,986 | $ | 2,052,914 | ||||||||||||||||||||
|
|
|
|
|
|
|
| |||||||||||||||||||||
*Includes undistributed net investment income | $ | 7,406 | $ | 6,613 | $ | 16,044 | $ | 5,352 | ||||||||||||||||||||
|
|
|
|
|
|
|
| |||||||||||||||||||||
A Commencement of operations. | ||||||||||||||||||||||||||||
B Seed capital. | ||||||||||||||||||||||||||||
See accompanying notes
29
Notes to Financial Statements
June 30, 2018
1. Organization and Significant Accounting Policies
American Beacon Funds (the “Trust”), is organized as a Massachusetts business trust. The Funds, each a series within the Trust, are registered under the Investment Company Act of 1940 (the “Act”), as amended, as diversified, open-end management investment companies. As of June 30, 2018, the Trust consists of thirty-three active series, four of which are presented in this filing: American Beacon Alpha Quant Core Fund, American Beacon Alpha Quant Dividend Fund, American Beacon Alpha Quant Quality Fund, and American Beacon Alpha Quant Value Fund (collectively, the “Funds” and each individually a “Fund”). The remaining twenty-nine active series are reported in separate filings.
American Beacon Advisors, Inc. (the “Manager”) is a Delaware corporation and a wholly-owned subsidiary of Resolute Investment Managers, Inc. (“RIM”) organized in 1986 to provide business management, advisory, administrative, and asset management consulting services to the Trust and other investors. RIM is, in turn, a wholly-owned subsidiary of Resolute Acquisition, Inc., which is a wholly-owned subsidiary of Resolute Topco, Inc., a wholly-owned subsidiary of Resolute Investment Holdings, LLC (“RIH”). RIH is owned primarily by Kelso Investment Associates VIII, L.P., KEP VI, LLC and Estancia Capital Partners L.P., investment funds affiliated with Kelso & Company, L.P. (“Kelso”) or Estancia Capital Management, LLC (“Estancia”), which are private equity firms.
Class Disclosure
Each Fund has multiple classes of shares designed to meet the needs of different groups of investors. The following table sets forth the differences amongst the classes:
Class | Eligible Investors | Minimum Initial Investments | ||||
| Institutional | Large institutional investors - sold directly through intermediary channels. | $ | 250,000 | |||
| Y Class | Large institutional retirement plan investors - sold directly or through intermediary channels. | $ | 100,000 | |||
| Investor | All investors using intermediary organizations such as broker-dealers or retirement plan sponsors - sold directly through intermediary channels. | $ | 2,500 | |||
Each class offered by the Trust has equal rights as to assets and voting privileges. Income and non-class specific expenses are allocated daily to each class on the basis of the relative net assets. Realized and unrealized capital gains and losses of each class are allocated daily based on the relative net assets of each class of the respective Fund. Class specific expenses, where applicable, currently include service, distribution, transfer agent fees, and sub-transfer agent fees that vary amongst the classes as described more fully in Note 2.
Significant Accounting Policies
The following is a summary of significant accounting policies, consistently followed by the Funds in preparation of the financial statements. The Funds are considered investment companies and accordingly, follow the investment company accounting and reporting guidance of the Financial Accounting Standards Board Accounting Standard Codification Topic 946, Financial Services - Investment Companies, a part of Generally Accepted Accounting Principles (“U.S. GAAP”).
Security Transactions and Investment Income
Security transactions are recorded as of the trade date for financial reporting purposes. Securities purchased or sold on a when-issued or delayed-delivery basis may be settled beyond a standard settlement period for the security after the trade date.
30
American Beacon FundsSM
Notes to Financial Statements
June 30, 2018
Dividend income, net of foreign taxes, is recorded on the ex-dividend date, except certain dividends from foreign securities which are recorded as soon as the information is available to the Funds. Interest income is earned from settlement date, recorded on the accrual basis, and adjusted, if necessary, for accretion of discounts and amortization of premiums. Realized gains (losses) from securities sold are determined on the basis of specific lot identification.
Distributions to Shareholders
Distributions, if any, of net investment income will generally be paid at least annually and recorded on the ex-dividend date. Distributions, if any, of net realized capital gains will generally be paid at least annually and recorded on the ex-dividend date. Dividends to shareholders are determined in accordance with federal income tax regulations, which may differ in amount and character from net investment income and realized gains recognized for purposes of U.S. GAAP. To the extent necessary to fully distribute capital gains, the Funds may designate earnings and profits distributed to shareholders on the redemption of shares.
Commission Recapture
The Funds have established brokerage commission recapture arrangements with certain brokers or dealers. If a Funds’ investment advisor chooses to execute a transaction through a participating broker, the broker rebates a portion of the commission back to the Funds. Any collateral benefit received through participation in the commission recapture program is directed exclusively to the Funds. This amount is reported with the net realized gain in the Funds’ Statements of Operations, if applicable. For the year ended June 30, 2018, the Funds did not have commission recapture income.
Allocation of Income, Trust Expenses, Gains, and Losses
Investment income, realized and unrealized gains and losses from investments of the Funds are allocated daily to each class of shares based upon the relative proportion of net assets of each class to the total net assets of the Funds. Expenses directly charged or attributable to any Fund will be paid from the assets of the Fund. Generally, expenses of the Trust will be allocated among and charged to the assets of the Funds on a basis that the Trust’s Board of Trustees (the “Board”) deems fair and equitable, which may be based on the relative net assets of the Funds or nature of the services performed and relative applicability to the Funds.
Organization and Offering Costs
Organizational costs consist of the costs of forming the Funds, drafting the bylaws, administration, custody and transfer agency agreements, and legal services in connection with the initial meeting of trustees, and were expensed immediately as incurred. Offering costs consist of the costs of preparation, review and filing with the SEC the Funds’ registration statement (including the Prospectus and the Statement of Additional Information), the costs of preparation, the costs associated with the printing, mailing or other distribution of the Prospectus, SAI and the amounts of associated filing fees and legal fees associated with the offering. Organizational costs and offering costs are subject to the Funds’ expense limitation agreement discussed in Note 2 and offering costs require amortization over twelve months on a straight-line basis from the commencement of operations.
Use of Estimates
The preparation of financial statements in conformity with U.S. GAAP requires management to make estimates and assumptions that affect the amounts reported in the financial statements and accompanying notes. Actual results may differ from those estimated.
31
American Beacon FundsSM
Notes to Financial Statements
June 30, 2018
Other
Under the Trust’s organizational documents, its officers and trustees are indemnified against certain liabilities arising out of the performance of their duties to the Trust. In the normal course of business, the Trust enters into contracts that provide indemnification to the other party or parties against potential costs or liabilities. The Trust’s maximum exposure under these arrangements is dependent on claims that may be made in the future and, therefore, cannot be estimated. The Trust has had no prior claims or losses pursuant to any such agreement.
2. Transactions with Affiliates
Management and Investment Sub-Advisory Agreements
The Funds and the Manager are parties to a Management Agreement that obligates the Manager to provide the Funds with investment advisory and administrative services. As compensation for performing the duties under the Management Agreement, the Manager will receive an annualized management fee based on a percentage of each Funds’ average daily net assets that is calculated and accrued daily according to the following schedule:
First $5 billion | 0.35 | % | ||
Next $5 billion | 0.325 | % | ||
Next $10 billion | 0.30 | % | ||
Over $20 billion | 0.275 | % |
The Trust, on behalf of the Funds, and the Manager have entered into an Investment Advisory Agreement with Alpha Quant Advisors, LLC (the “Sub-Advisor”), an affiliate of the Manager, pursuant to which each Fund has agreed to pay an annualized sub-advisory fee that is calculated and accrued daily based on the Funds’ average daily net assets according to the following schedule:
First $5 billion | 0.25 | % | ||
Over $5 billion | 0.20 | % |
The Management and Sub-Advisory Fees paid by the Funds for the year ended June 30, 2018 were as follows:
Alpha Quant Core Fund
| Effective Fee Rate | Amount of Fees Paid | |||||||||||
Management Fees | 0.35 | % | $ | 8,282 | ||||||||
Sub-Advisor Fees | 0.25 | % | 5,922 | |||||||||
|
|
|
| |||||||||
Total | 0.60 | % | $ | 14,204 | ||||||||
|
|
|
| |||||||||
Alpha Quant Dividend Fund
| Effective Fee Rate | Amount of Fees Paid | |||||||||||
Management Fees | 0.35 | % | $ | 7,704 | ||||||||
Sub-Advisor Fees | 0.25 | % | 5,507 | |||||||||
|
|
|
| |||||||||
Total | 0.60 | % | $ | 13,211 | ||||||||
|
|
|
| |||||||||
Alpha Quant Quality Fund
| Effective Fee Rate | Amount of Fees Paid | |||||||||||
Management Fees | 0.35 | % | $ | 8,039 | ||||||||
Sub-Advisor Fees | 0.25 | % | 5,746 | |||||||||
|
|
|
| |||||||||
Total | 0.60 | % | $ | 13,785 | ||||||||
|
|
|
| |||||||||
32
American Beacon FundsSM
Notes to Financial Statements
June 30, 2018
Alpha Quant Value Fund
| Effective Fee Rate | Amount of Fees Paid | |||||||||||
Management Fees | 0.35 | % | $ | 8,644 | ||||||||
Sub-Advisor Fees | 0.25 | % | 6,188 | |||||||||
|
|
|
| |||||||||
Total | 0.60 | % | $ | 14,832 | ||||||||
|
|
|
| |||||||||
As compensation for services provided by the Manager in connection with securities lending activities conducted by the Funds, the lending Fund pays to the Manager, with respect to cash collateral posted by borrowers, a fee up to 10% of the net monthly interest income (the gross interest income earned by the investment of cash collateral, less the amount paid to borrowers and related expenses) from such activities and, with respect to loan fees paid by borrowers, a fee up to 10% of such loan fees. These fees are included in “Income derived from securities lending” and “Management and investment advisory fees” on the Statements of Operations. During the year ended June 30, 2018, the Manager received securities lending fees of $3, $1, and $5 for the securities lending activities of the Alpha Quant Core Fund, Alpha Quant Dividend Fund, and Alpha Quant Quality Fund, respectively.
Distribution Plans
The Funds have adopted a “defensive” Distribution Plan (the “Plan”) in accordance with Rule 12b-1 under the Act, pursuant to which no separate fees may be charged to the Funds for distribution purposes. However, the Plan authorizes the management fee received by the Manager and the investment advisors hired by the Manager to be used for distribution purposes. Under this Plan, the Funds do not intend to compensate the Manager or any other party, either directly or indirectly, for the distribution of Fund shares.
Service Plans
The Manager and the Trust entered into a Service Plan that obligate the Manager to oversee additional shareholder servicing of the Investor Class of the Funds. As compensation for performing the duties required under the Service Plan, the Manager receives an annualized fee up to 0.375% of the average daily net assets of the Investor Class of the Funds.
Sub-Transfer Agent Fees
The Manager has entered into agreements, which include servicing agreements, with financial intermediaries that provide recordkeeping, processing, shareholder communications and other services to customers of the intermediaries that hold positions in the Institutional and Y Classes of the Funds and has agreed to compensate the intermediaries for providing these services. Intermediaries transact with the Funds primarily through the use of omnibus accounts on behalf of their customers who hold positions in the Funds. Certain services would have been provided by the Fund’s transfer agent and other service providers if the shareholders’ accounts were maintained directly by the Fund’s transfer agent. Accordingly, the Funds, pursuant to Board approval, have agreed to reimburse the Manager for certain non-distribution shareholder services provided by financial intermediaries for the Institutional and Y Classes. The reimbursement amounts (sub-transfer agent fees) paid to the Manager are subject to a fee limit of up to 0.10% of an intermediary’s average net assets in the Institutional and Y Classes on an annual basis. During the year ended June 30, 2018, the sub-transfer agent fees, as reflected in “Transfer agent fees” on the Statements of Operations, were as follows:
Fund | Sub-Transfer Agent Fees | |||
Alpha Quant Core | $ | 81 | ||
Alpha Quant Dividend | 78 | |||
Alpha Quant Quality | 80 | |||
Alpha Quant Value | 45 | |||
33
American Beacon FundsSM
Notes to Financial Statements
June 30, 2018
As of June 30, 2018, the Manager owed the Funds the following reimbursement of sub-transfer agent fees, as reflected in “Transfer agent fees payable” on the Statements of Assets and Liabilities:
Fund | Reimbursement Sub-Transfer Agent Fees* | |||
Alpha Quant Core | $ | 35 | ||
Alpha Quant Dividend | 44 | |||
Alpha Quant Quality | 36 | |||
Alpha Quant Value | 34 | |||
*These balances are presented as a contra liability as of June 30, 2018 for each Fund respectively.
Investments in Affiliated Funds
The Funds may invest in the American Beacon U.S. Government Money Market Select Fund (the “USG Select Fund”). Cash collateral received by the Funds in connection with securities lending may also be invested in the USG Select Fund. The Funds and the USG Select Fund have the same investment advisor and therefore, are considered to be affiliated. The Manager serves as investment advisor to the USG Select Fund and receives management fees and administrative fees totaling 0.10% of the average daily net assets of the USG Select Fund. During the year ended June 30, 2018, the Manager earned fees on the Funds’ direct investments in the USG Select Fund as shown below:
Fund | Direct Investments in USG Select Fund | Securities Lending Collateral in USG Select Fund | Total | |||||||||
Alpha Quant Core | $ | 36 | $ | 10 | $ | 46 | ||||||
Alpha Quant Dividend | 37 | 3 | 40 | |||||||||
Alpha Quant Quality | 29 | 16 | 45 | |||||||||
Alpha Quant Value | 48 | - | 48 | |||||||||
Interfund Credit Facility
Pursuant to an exemptive order issued by the Securities and Exchange Commission (“SEC”), the Funds, along with other registered investment companies having management contracts with the Manager, may participate in a credit facility whereby each Fund, under certain conditions, is permitted to lend money directly to and borrow directly from other participating Funds for temporary purposes. The interfund credit facility is advantageous to the Funds because it provides added liquidity, and eliminates the need to maintain higher cash balances to meet redemptions. This situation could arise when shareholder redemptions exceed anticipated volumes and certain funds have insufficient cash on hand to satisfy such redemptions or when sales of securities do not settle as expected, resulting in a cash shortfall for a fund. When a Fund liquidates portfolio securities to meet redemption requests, they often do not receive payment in settlement for up to two days (or longer for certain foreign transactions). Redemption requests normally are satisfied on the next business day. The credit facility provides a source of immediate, short-term liquidity pending settlement of the sale of portfolio securities. The credit facility is administered by a credit facility team consisting of professionals from the Manager’s asset management, compliance, and accounting areas who report the activities of the credit facility to the Board. During the year ended June 30, 2018, the Alpha Quant Quality Fund borrowed $1,508 for 1 day at an interest rate of 2.00% with interest charges of less than $1. These amounts are recorded as “Other expenses” in the Statements of Operations. For the year ended June 30, 2018, the Alpha Quant Core, Alpha Quant Dividend, and Alpha Quant Value Funds did not utilize the credit facility.
34
American Beacon FundsSM
Notes to Financial Statements
June 30, 2018
Expense Reimbursement Plan
The Manager contractually agreed to reduce fees and/or reimburse expenses for the classes of the Funds to the extent that total operating expenses exceed the Funds’ expense cap. During the year ended June 30, 2018, the Manager waived and/or reimbursed expenses as follows:
Fund | Class | Expense Cap | Reimbursed Expenses | (Recouped) Expenses | Expiration of Reimbursed Expenses | |||||||||||||
| 7/1/2017 - 6/30/2018 | ||||||||||||||||||
Alpha Quant Core | Institutional | 0.69 | % | $ | 103,285 | $ | - | 2021 | ||||||||||
Alpha Quant Core | Y | 0.79 | % | 5,998 | - | 2021 | ||||||||||||
Alpha Quant Core | Investor | 1.07 | % | 6,619 | - | 2021 | ||||||||||||
Alpha Quant Dividend | Institutional | 0.69 | % | 102,127 | - | 2021 | ||||||||||||
Alpha Quant Dividend | Y | 0.79 | % | 6,714 | - | 2021 | ||||||||||||
Alpha Quant Dividend | Investor | 1.07 | % | 6,887 | - | 2021 | ||||||||||||
Alpha Quant Quality | Institutional | 0.69 | % | 102,574 | - | 2021 | ||||||||||||
Alpha Quant Quality | Y | 0.79 | % | 6,217 | - | 2021 | ||||||||||||
Alpha Quant Quality | Investor | 1.07 | % | 6,972 | - | 2021 | ||||||||||||
Alpha Quant Value | Institutional | 0.69 | % | 92,461 | - | 2021 | ||||||||||||
Alpha Quant Value | Y | 0.79 | % | 12,323 | - | 2021 | ||||||||||||
Alpha Quant Value | Investor | 1.07 | % | 7,142 | - | 2021 | ||||||||||||
Of these amounts, $16,733, $16,775, $16,788, and $16,745 were disclosed as a receivable from the Manager on the Statements of Assets and Liabilities at June 30, 2018 for the Alpha Quant Core Fund, Alpha Quant Dividend Fund, Alpha Quant Quality Fund, and Alpha Quant Value Fund, respectively.
The Funds have adopted an Expense Reimbursement Plan whereby the Manager may seek repayment of such fee reductions and expense reimbursements. Under the policy, the Manager can be reimbursed by the Funds for any contractual or voluntary fee reductions or expense reimbursements if reimbursement to the Manager (a) occurs within three years after the Manager’s own waiver or reimbursement and (b) does not cause the Funds’ annual operating expenses to exceed the lesser of the contractual percentage limit in effect at the time of the waiver/reimbursement or time of recoupment. The reimbursed expenses listed above will expire in 2021. The Alpha Quant Core Fund, Alpha Quant Dividend Fund, Alpha Quant Quality Fund, and Alpha Quant Value Fund did not record a liability for potential reimbursements, due to the current assessments that a reimbursement is unlikely. The carryover of excess expenses potentially reimbursable to the Manager are as follows:
Fund | Recouped Expenses | Excess Expense Carryover | Expired Expense Carryover | Expiration of Reimbursed Expenses | ||||||||||||
Alpha Quant Core | $ | - | $ | 67,123 | $ | - | 2020 | |||||||||
Alpha Quant Dividend | - | 66,829 | - | 2020 | ||||||||||||
Alpha Quant Quality | - | 66,815 | - | 2020 | ||||||||||||
Alpha Quant Value | - | 66,877 | - | 2020 | ||||||||||||
Concentration of Ownership
From time to time, the Funds may have a concentration of one or more accounts constituting a significant percentage of shares outstanding. Investment activities by holders of accounts that represent a significant ownership of more than 5% of the Funds’ outstanding shares could have a material impact on the Funds. As of June 30, 2018, based on management’s evaluation of the shareholder account base, one account has been identified as representing an affiliated significant ownership of approximately 82%, 85%, 89%, and 61% for the Alpha Quant Core Fund, Alpha Quant Dividend Fund, Alpha Quant Quality Fund, and Alpha Quant Value Fund, respectively.
35
American Beacon FundsSM
Notes to Financial Statements
June 30, 2018
Trustee Fees and Expenses
As compensation for their service to the Trust, American Beacon Select Funds, American Beacon Institutional Funds Trust, American Beacon Sound Point Enhanced Income Fund, and American Beacon Apollo Total Return Fund each Trustee receives an annual retainer of $120,000, plus $10,000 for each Board meeting attended in person or via teleconference, $2,500 for attendance by Committee members at meetings of the Audit Committee and the Investment Committee, and $1,500 for attendance by Committee members at meetings of the Nominating and Governance Committee, plus reimbursement of reasonable expenses incurred in attending Board meetings, Committee meetings, and relevant educational seminars. The Trustees also may be compensated for attendance at special Board and/or Committee meetings from time to time. The Board Chairman receives an additional annual retainer of $50,000 as well as a $2,500 fee each quarter for his attendance at the committee meetings. Effective January 1, 2018, the Board Vice Chair receives an additional annual retainer of $10,000. The Chairpersons of the Audit Committee and the Investment Committee each receive an additional annual retainer of $25,000 and the Chairman of the Nominating and Governance Committee receives an additional annual retainer of $10,000. These expenses are allocated on a prorated basis to each Fund of the Trusts according to its respective net assets.
3. Security Valuation and Fair Value Measurements
The price of the Fund’s shares is based on its net asset value (“NAV”) per share. The Fund’s NAV is computed by adding total assets, subtracting all the Fund’s liabilities, and dividing the result by the total number of shares outstanding.
The NAV of each class of the Fund’s shares is determined based on a pro rata allocation of the Fund’s investment income, expenses and total capital gains and losses. The Fund’s NAV per share is determined each business day as of the regular close of trading on the New York Stock Exchange (“NYSE” or “Exchange”), which is typically 4:00 p.m. Eastern Time (“ET”). However, if trading on the NYSE closes at a time other than 4:00 p.m. ET, the Fund’s NAV per share typically would still be determined as of the regular close of trading on the NYSE. The Fund does not price its shares on days that the NYSE is closed. Foreign exchanges may permit trading in foreign securities on days when the Fund is not open for business, which may result in the value of the Fund’s portfolio investments being affected at a time when you are unable to buy or sell shares.
Equity securities and certain derivative instruments that are traded on an exchange are valued based on market value. Certain derivative instruments (other than short-term securities) usually are valued on the basis of prices provided by a pricing service. The price of debt securities generally is determined using pricing services or quotes obtained from broker/dealers who may consider a number of inputs and factors, such as comparable characteristics, yield curve, credit spreads, estimated default rates, coupon rates, underlying collateral and estimated cash flow. Investments in other mutual funds are valued at the closing NAV per share of the mutual funds on the day of valuation. Equity securities, including shares of closed-end funds and exchanged-traded funds (“ETFs”), are valued at the last sale price or official closing price.
The valuation of securities traded on foreign markets and certain fixed income securities will generally be based on prices determined as of the earlier closing time of the markets on which they primarily trade unless a significant event has occurred. When the Fund holds securities or other assets that are denominated in a foreign currency, the Fund will normally use the currency exchange rates as of 4:00 p.m. ET.
Securities may be valued at fair value, as determined in good faith and pursuant to procedures approved by the Board of Trustees, under certain limited circumstances. For example, fair value pricing will be used when market quotations are not readily available or reliable, as determined by the Manager, such as when (i) trading for a security is restricted or stopped; (ii) a security’s trading market is closed (other than customary closings); or (iii) a security has been de-listed from a national exchange. A security with limited market liquidity may require fair value pricing if the Manager determines that the available price does not reflect the security’s true market value. In addition, if a significant event that the Manager determines to affect the value of one or more securities held by
36
American Beacon FundsSM
Notes to Financial Statements
June 30, 2018
the Fund occurs after the close of a related exchange but before the determination of the Fund’s NAV, fair value pricing may be used on the affected security or securities. Securities of small-capitalization companies are also more likely to require a fair value determination using these procedures because they are more thinly traded and less liquid than the securities of larger-capitalization companies. The Fund may fair value securities as a result of significant events occurring after the close of the foreign markets in which the Fund invests as described below. In addition, the Fund may invest in illiquid securities requiring these procedures.
The Fund may use fair value pricing for securities primarily traded in non-U.S. markets because most foreign markets close well before the Fund’s pricing time of 4:00 p.m. ET. The earlier close of these foreign markets gives rise to the possibility that significant events, including broad market moves, may have occurred in the interim and may materially affect the value of those securities. If the Manager determines that the last quoted prices of non-U.S. securities will, in its judgment, materially affect the value of some or all its portfolio securities, the Manager can adjust the previous closing prices to reflect what it believes to be the fair value of the securities as of the close of the Exchange. In deciding whether it is necessary to adjust closing prices to reflect fair value, the Manager reviews a variety of factors, including developments in foreign markets, the performance of U.S. securities markets, and the performance of instruments trading in U.S. markets that represent foreign securities and baskets of foreign securities. These securities are fair valued using a pricing service, using methods approved by the Board, that considers the correlation of the trading patterns of the foreign security to intraday trading in the U.S. markets, based on indices of domestic securities and other appropriate indicators such as prices of relevant American Depositary Receipts (“ADRs”) and futures contracts. The Valuation Committee, established by the Board, may also fair value securities in other situations, such as when a particular foreign market is closed but the Fund is open. The Fund uses outside pricing services to provide closing prices and information to evaluate and/or adjust those prices. As a means of evaluating its security valuation process, the Valuation Committee routinely compares closing prices, the next day’s opening prices in the same markets and adjusted prices.
Attempts to determine the fair value of securities introduce an element of subjectivity to the pricing of securities. As a result, the price of a security determined through fair valuation techniques may differ from the price quoted or published by other sources and may not accurately reflect the market value of the security when trading resumes. If a reliable market quotation becomes available for a security formerly valued through fair valuation techniques, the Manager compares the new market quotation to the fair value price to evaluate the effectiveness of the Fund’s fair valuation procedures. If any significant discrepancies are found, the Manager may adjust the Fund’s fair valuation procedures.
Valuation Inputs
Various inputs may be used to determine the fair value of the Funds’ investments. These inputs are summarized in three broad levels for financial statement purposes. The inputs or methodologies used to value securities are not necessarily an indication of the risk associated with investing in those securities.
| Level 1 | - | Quoted prices in active markets for identical securities. | ||
| Level 2 | - | Prices determined using other significant observable inputs. These may include quoted prices for similar securities, interest rates, prepayment speeds, credit risk, and others. | ||
| Level 3 | - | Prices determined using other significant unobservable inputs. Unobservable inputs reflect the Fund’s own assumptions about the factors market participants would use in pricing an investment. | ||
Level 1 and Level 2 trading assets and trading liabilities, at fair value
Common stocks, ETFs, and financial derivative instruments, such as futures contracts or options that are traded on a national securities exchange, are stated at the last reported sale or settlement price on the day of valuation. To the extent these securities are actively traded and valuation adjustments are not applied, they are categorized as Level 1 of the fair value hierarchy. Preferred securities and other equities traded on inactive markets or valued by reference to similar instruments are generally categorized as Level 2 of the fair value hierarchy.
37
American Beacon FundsSM
Notes to Financial Statements
June 30, 2018
Investments in registered open-end investment management companies will be valued based upon the NAVs of such investments and are categorized as Level 1 of the fair value hierarchy.
The Funds did not hold any Level 2 securities at the year ended June 30, 2018.
4. Securities and Other Investments
Common Stock
Common stock generally takes the form of shares in a corporation which represent an ownership interest. It ranks below preferred stock and debt securities in claims for dividends and for assets of the company in a liquidation or bankruptcy. The value of a company’s common stock may fall as a result of factors directly relating to that company, such as decisions made by its management or decreased demand for the company’s products or services. A stock’s value may also decline because of factors affecting not just the company, but also companies in the same industry or sector. The price of a company’s stock may also be affected by changes in financial markets that are relatively unrelated to the company, such as changes in interest rates, currency exchange rates or industry regulation. Companies that elect to pay dividends on their common stock generally only do so after they invest in their own business and make required payments to bondholders and on other debt and preferred stock. Therefore, the value of a company’s common stock will usually be more volatile than its bonds, other debt and preferred stock. Common stock may be exchange-traded or over-the-counter (“OTC”). OTC stock may be less liquid than exchange-traded stock.
Other Investment Company Securities and Other Exchange-Traded Products
The Funds may invest in shares of other investment companies, including open-end funds, closed-end funds, business development companies, ETFs, unit investment trusts, and other investment companies of the Trust. The Funds may invest in investment company securities advised by the Manager or a sub-advisor. Investments in the securities of other investment companies may involve duplication of advisory fees and certain other expenses. By investing in another investment company, the Funds become a shareholder of that investment company. As a result, the Funds’ shareholders indirectly will bear the Funds’ proportionate share of the fees and expenses paid by shareholders of the other investment company, in addition to the fees and expenses the Funds’ shareholders directly bear in connection with the Funds’ own operations. These other fees and expenses are reflected as Acquired Fund Fees and Expenses and are included in the Fees and Expenses Table for the Funds in their Prospectus, if applicable. Investments in other investment companies may involve the payment of substantial premiums above the value of such issuer’s portfolio securities.
Real Estate Investment Trusts
The Funds may own shares of real estate investment trusts (“REITs”) which report information on the source of their distributions annually. The Funds re-characterize distributions received from REIT investments based on information provided by the REITs into the following categories: ordinary income, long-term capital gains, and return of capital. If information is not available on a timely basis from the REITs, the re-characterization will be estimated based on available information, which may include the previous year allocation. If new or additional information becomes available from the REITs at a later date, a re-characterization will be made the following year.
5. Principal Risks
Investing in the Funds may involve certain risks including, but not limited to, those described below.
Equity Investments Risk
Equity securities are subject to market risk. The Funds’ investments in equity securities may include common stocks, preferred stocks, securities convertible into or exchangeable for common stocks, REITs, depositary receipts,
38
American Beacon FundsSM
Notes to Financial Statements
June 30, 2018
and U.S. dollar-denominated foreign stocks traded on U.S. exchanges. Such investments may expose the Funds to additional risk. The value of a company’s common stock may fall as a result of factors affecting the company, companies in the same industry or sector, or the financial markets overall. Common stock generally is subordinate to preferred stock upon the liquidation or bankruptcy of the issuing company. Preferred stocks and convertible securities are sensitive to movements in interest rates. Preferred stocks may be less liquid than common stocks and, unlike common stocks, participation in the growth of an issuer may be limited. Distributions on preferred stocks generally are payable at the discretion of an issuer and after required payments to bond holders. Convertible securities are subject to the risk that the credit standing of the issuer may have an effect on the convertible securities’ investment value. Investments in REITs are subject to the risks associated with investing in the real estate industry such as adverse developments affecting the real estate industry and real property values. Depositary receipts and U.S. dollar-denominated foreign stocks traded on U.S. exchanges are subject to certain of the risks associated with investing directly in foreign securities, including, but not limited to, currency fluctuations and political and financial instability in the home country of a particular depositary receipt or foreign stock.
Focused Holdings Risk
Because the Funds may have a focused portfolio of fewer companies, the increase or decrease of the value of a single investment may have a greater impact on the Funds’ NAV and total return when compared to other diversified funds.
Market Risk
Since the financial crisis that started in 2008, the U.S. and many foreign economies continue to experience its after-effects. Conditions in the U.S. and many foreign economies have resulted, and may continue to result, in certain instruments experiencing unusual liquidity issues, increased price volatility and, in some cases, credit downgrades and increased likelihood of default. These events have reduced the willingness and ability of some lenders to extend credit, and have made it more difficult for some borrowers to obtain financing on attractive terms, if at all. In some cases, traditional market participants have been less willing to make a market in some types of debt instruments, which has affected the liquidity of those instruments. During times of market turmoil, investors tend to look to the safety of securities issued or backed by the U.S. Treasury, causing the prices of these securities to rise and the yields to decline. The reduced liquidity in fixed income and credit markets may negatively affect many issuers worldwide. In addition, global economies and financial markets are becoming increasingly interconnected, which increases the possibilities that conditions in one country or region might adversely impact issuers in a different country or region.
In response to the financial crisis, the U.S. and other governments and the Federal Reserve and certain foreign central banks have taken steps to support financial markets. In some countries where economic conditions are recovering, they are nevertheless perceived as still fragile. Withdrawal of government support, failure of efforts in response to the crisis, or investor perception that such efforts are not succeeding, could adversely impact the value and liquidity of certain securities. The severity or duration of adverse economic conditions may also be affected by policy changes made by governments or quasi-governmental organizations, including changes in tax laws. The impact of new financial regulation legislation on the markets and the practical implications for market participants may not be fully known for some time. Regulatory changes are causing some financial services companies to exit long-standing lines of business, resulting in dislocations for other market participants. In addition, political and diplomatic events within the U.S. and abroad, such as the U.S. government’s inability at times to agree on a long-term budget and deficit reduction plan, the threat of a federal government shutdown and threats not to increase the federal government’s debt limit, may affect investor and consumer confidence and may adversely impact financial markets and the broader economy, perhaps suddenly and to a significant degree. The results of the 2016 U.S. presidential election may result in significant changes in certain policies. These changes may result in lower corporate taxes, higher levels of public debt, higher interest rates, more restrictions on international trade, and less stringent prudential regulation of certain players in the financial markets.
39
American Beacon FundsSM
Notes to Financial Statements
June 30, 2018
Changes in market conditions will not have the same impact on all types of securities. Interest rates have been unusually low in recent years in the U.S. and abroad. Because there is little precedent for this situation, it is difficult to predict the impact of a significant rate increase on various markets. For example, because investors may buy securities or other investments with borrowed money, a significant increase in interest rates may cause a decline in the markets for those investments. Because of the sharp decline in the worldwide price of oil, there is a concern that oil producing nations may withdraw significant assets now held in U.S. Treasuries, which could force a substantial increase in interest rates. Regulators have expressed concern that rate increases may cause investors to sell fixed income securities faster than the market can absorb them, contributing to price volatility. In addition, there is a risk that the prices of goods and services in the U.S. and many foreign economies may decline over time, known as deflation (the opposite of inflation). Deflation may have an adverse effect on stock prices and creditworthiness and may make defaults on debt more likely. If a country’s economy slips into a deflationary pattern, it could last for a prolonged period and may be difficult to reverse. The abandonment of the euro or withdrawal from the European Union (“EU”) on the part of the United Kingdom or any other member could significantly adversely affect the value of the Fund’s investments in Europe. Particularly, the United Kingdom’s vote to leave the EU could lead to a prolonged period of uncertainty as to the exact terms of exit and the impact on different industry sectors and increased market volatility.
Other Investment Companies Risk
The Funds may invest in shares of other registered investment companies, including money market funds. To the extent that the Funds invest in shares of other registered investment companies, the Funds will indirectly bear the fees and expenses charged by those investment companies in addition to the Funds’ direct fees and expenses and will be subject to the risks associated with investments in those companies.
6. Federal Income and Excise Taxes
It is the policy of each Fund to qualify as a regulated investment company (“RIC”), by complying with all applicable provisions of Subchapter M of the Internal Revenue Code, as amended, and to make distributions of taxable income sufficient to relieve it from substantially all federal income and excise taxes. For federal income tax purposes, each Fund is treated as a single entity for the purpose of determining such qualification.
The Funds do not have any unrecorded tax liabilities in the accompanying financial statements. Each of the tax years in the two year period ended June 30, 2018 remain subject to examination by the Internal Revenue Service. If applicable, the Funds recognize interest accrued related to unrecognized tax benefits in interest expense and penalties in “Other expenses” on the Statements of Operations.
The Funds may be subject to taxes imposed by countries in which it invests. Such taxes are generally based on returns of income earned or gains realized or repatriated. Taxes are accrued and applied to net investment income, net realized capital gains and net unrealized appreciation (depreciation), as applicable, as the income is earned or capital gains are recorded.
Dividends are categorized in accordance with income tax regulations which may treat certain transactions differently than U.S. GAAP. Accordingly, the character of distributions and composition of net assets for tax purposes may differ from those reflected in the accompanying financial statements.
40
American Beacon FundsSM
Notes to Financial Statements
June 30, 2018
The tax character of distributions paid were as follows:
| Alpha Quant Core Fund | Alpha Quant Dividend Fund | |||||||||||||||||||||||||||
| Year Ended June 30, 2018 |
| From March 22, 2017A to June 30, 2017 | Year Ended June 30, 2018 | From March 22, 2017A to June 30, 2017 | ||||||||||||||||||||||||
Distributions paid from: | ||||||||||||||||||||||||||||
Ordinary income* | ||||||||||||||||||||||||||||
Institutional Class | $ | 24,547 | $ | - | $ | 51,214 | $ | - | ||||||||||||||||||||
Y Class | 1,582 | - | 3,231 | - | ||||||||||||||||||||||||
Investors Class | 1,400 | - | 2,940 | - | ||||||||||||||||||||||||
Long-term capital gains | ||||||||||||||||||||||||||||
Institutional Class | - | - | 500 | - | ||||||||||||||||||||||||
Y Class | - | - | 33 | - | ||||||||||||||||||||||||
Investors Class | - | - | 28 | - | ||||||||||||||||||||||||
|
|
|
|
|
|
|
| |||||||||||||||||||||
Total distributions paid | $ | 27,529 | $ | - | $ | 57,946 | $ | - | ||||||||||||||||||||
|
|
|
|
|
|
|
| |||||||||||||||||||||
| Alpha Quant Quality Fund | Alpha Quant Value Fund | |||||||||||||||||||||||||||
| Year Ended June 30, 2018 |
| From March 22, 2017A to June 30, 2017 | Year Ended June 30, 2018 | From March 22, 2017A to June 30, 2017 | ||||||||||||||||||||||||
Distributions paid from: | ||||||||||||||||||||||||||||
Ordinary income* | ||||||||||||||||||||||||||||
Institutional Class | $ | 14,994 | $ | - | $ | 31,446 | $ | - | ||||||||||||||||||||
Y Class | 976 | - | 2,250 | - | ||||||||||||||||||||||||
Investors Class | 857 | - | 1,939 | - | ||||||||||||||||||||||||
|
|
|
|
|
|
|
| |||||||||||||||||||||
Total distributions paid | $ | 16,827 | $ | - | $ | 35,635 | $ | - | ||||||||||||||||||||
|
|
|
|
|
|
|
| |||||||||||||||||||||
*For tax purposes, short-term capital gains are considered ordinary income distributions.
ACommencement of operations.
As of June 30, 2018 the components of distributable earnings (deficits) on a tax basis were as follows:
Fund | Tax Cost | Unrealized Appreciation | Unrealized (Depreciation) | Net Unrealized Appreciation (Depreciation) | ||||||||||||
Alpha Quant Core | $ | 2,401,836 | $ | 303,644 | $ | (75,828 | ) | $ | 227,816 | |||||||
Alpha Quant Dividend | 2,332,736 | 116,857 | (176,757 | ) | (59,900 | ) | ||||||||||
Alpha Quant Quality | 2,224,264 | 320,216 | (53,643 | ) | 266,573 | |||||||||||
Alpha Quant Value | 3,320,390 | 335,082 | (85,728 | ) | 249,354 | |||||||||||
Fund | Net Unrealized Appreciation (Depreciation) | Undistributed Ordinary Income | Undistributed Long-Term Capital Gains | Accumulated Capital and Other (Losses) | Other Temporary Differences | Distributable Earnings | ||||||||||||||||||
Alpha Quant Core | $ | 227,816 | $ | 41,738 | $ | 91,119 | $ | - | $ | - | $ | 360,673 | ||||||||||||
Alpha Quant Dividend | (59,900 | ) | 137,649 | - | - | - | 77,749 | |||||||||||||||||
Alpha Quant Quality | 266,573 | 54,000 | 121,857 | - | - | 442,430 | ||||||||||||||||||
Alpha Quant Value | 249,354 | 62,366 | 72,750 | - | - | 384,470 | ||||||||||||||||||
Financial reporting records are adjusted for permanent book/tax differences to reflect tax character. Financial records are not adjusted for temporary differences. The temporary differences between financial reporting and tax-basis reporting of unrealized appreciation (depreciation) are attributable primarily to the tax deferral of losses from wash sales.
Due to inherent differences in the recognition of income, expenses, and realized gains (losses) under U.S. GAAP and federal income tax regulations, permanent differences between book and tax reporting have been identified and appropriately reclassified on the Statements of Assets and Liabilities.
41
American Beacon FundsSM
Notes to Financial Statements
June 30, 2018
Accordingly, the following amounts represent current year permanent differences derived from reclassifications of income from real estate investment securities as of June 30, 2018:
Fund | Paid-In-Capital | Undistributed (Overdistribution of) Net Investment Income | Accumulated Net Realized Gain (Loss) | Net Unrealized Appreciation (Depreciation) | ||||||||||||
Alpha Quant Core | $ | - | $ | - | $ | - | $ | - | ||||||||
Alpha Quant Dividend | - | (315 | ) | 315 | - | |||||||||||
Alpha Quant Quality | - | - | - | - | ||||||||||||
Alpha Quant Value | - | - | - | - | ||||||||||||
Under the Regulated Investment Company Modernization Act of 2010 (“RIC MOD”), net capital losses recognized by the Funds in taxable years beginning after December 22, 2010 are carried forward indefinitely and retain their character as short-term and/or long-term losses.
During the year June 30, 2018, the Funds did not have any capital loss carryforwards. Alpha Quant Core utilized $5,964 short-term capital loss carryforward, Alpha Quant Quality utilized $10,733 short-term capital loss carryforward, and Alpha Quant Value utilized $6,071 short-term capital loss carryforward.
7. Investment Transactions
The aggregate cost of purchases and proceeds from sales and maturities of investments, other than short-term obligations, for the year ended June 30, 2018 were as follows:
Fund | Purchases (non-U.S. Government Securities) | Sales (non-U.S. Government Securities) | ||||||||||
| Alpha Quant Core | $ | 1,613,826 | $ | 1,291,593 | ||||||||
| Alpha Quant Dividend | 1,308,602 | 1,066,490 | ||||||||||
| Alpha Quant Quality | 1,512,997 | 1,405,990 | ||||||||||
| Alpha Quant Value | 2,519,785 | 1,293,575 | ||||||||||
A summary of the Funds’ transactions in the USG Select Fund for the year ended June 30, 2018 are as follows:
Fund | Type of Transaction | June 30, 2017 Shares/Fair Value | Purchases | Sales | June 30, 2018 Shares/Fair Value | Dividend Income | ||||||||||||||||||||||||||||||||||||
| Alpha Quant Core | Direct | $ | 56,058 | $ | 378,371 | $ | 408,599 | $ | 25,830 | $ | 419 | |||||||||||||||||||||||||||||||
| Alpha Quant Core | Securities Lending | - | 152,556 | 152,556 | - | 32 | ||||||||||||||||||||||||||||||||||||
| Alpha Quant Dividend | Direct | 94,818 | 323,408 | 403,682 | 14,544 | 275 | ||||||||||||||||||||||||||||||||||||
| Alpha Quant Dividend | Securities Lending | - | 71,681 | 71,681 | - | 45 | ||||||||||||||||||||||||||||||||||||
| Alpha Quant Quality | Direct | 55,343 | 185,814 | 225,244 | 15,913 | 229 | ||||||||||||||||||||||||||||||||||||
| Alpha Quant Quality | Securities Lending | - | 310,818 | 310,818 | - | N/A | ||||||||||||||||||||||||||||||||||||
| Alpha Quant Value | Direct | 49,352 | 1,285,534 | 1,300,410 | 34,476 | 501 | ||||||||||||||||||||||||||||||||||||
8. Securities Lending
The Funds may lend their securities to qualified financial institutions, such as certain broker-dealers, to earn additional income. The borrowers are required to secure their loans continuously with collateral in an amount at least equal to the fair value of the securities loaned, initially in an amount at least equal to 102% of the fair value of domestic securities loaned and 105% of the fair value of international securities loaned. Collateral is monitored and marked-to-market daily. Daily mark-to-market amounts are required to be paid to the borrower or received from the borrower by the end of the following business day. This one day settlement for mark-to-market amounts may result in the collateral being temporarily less than the value of the securities on loan or temporarily more than the required minimum collateral.
42
American Beacon FundsSM
Notes to Financial Statements
June 30, 2018
To the extent that a loan is collateralized by cash, such cash collateral shall be invested by the securities lending agent (the “Agent”) in money market mutual funds and other short-term investments, provided the investments meet certain quality and diversification requirements. Securities purchased with cash collateral proceeds are listed in the Funds’ Schedule of Investments and the collateral is shown on the Statement of Assets and Liabilities as a payable.
Securities lending income is generated from the demand premium (if any) paid by the borrower to borrow a specific security and from the return on investment of cash collateral, reduced by negotiated rebate fees paid to the borrower and transaction costs. To the extent that a loan is secured by non-cash collateral, securities lending income is generated as a demand premium reduced by transaction costs. The Funds, the Agent, and the Manager retained 80%, 10%, and 10%, respectively, of the income generated from securities lending.
While securities are on loan, the Funds continue to receive certain income associated with that security and any gain or loss in the market price that may occur during the term of the loan. In the case of domestic equities, the value of any dividend is received in the form of a substitute payment approximately equal to the dividend. In the case of foreign securities, a negotiated amount is received that is less than the actual dividend, but higher than the dividend amount minus the foreign tax that the Funds would be subject to on the dividend.
Securities lending transactions pose certain risks to the Funds, including that the borrower may not provide additional collateral when required or return the securities when due, that the value of the short-term investments will be less than the amount of cash collateral required to be returned to the borrower, that non-cash collateral may be subject to legal constraints in the event of a borrower bankruptcy, and that the cash collateral investments could become illiquid and unable to be used to return collateral to the borrower. The Funds could also experience delays and costs in gaining access to the collateral. The Funds bear the risk of any deficiency in the amount of the cash collateral available for return to the borrower and any action which impairs its ability to liquidate non-cash collateral to satisfy a borrower default.
As of June 30, 2018, the Funds did not have any outstanding securities on loan.
Cash collateral is listed on the Funds’ Schedules of Investments and is shown on the Statements of Assets and Liabilities. Income earned on these investments is included in “Income derived from securities lending” on the Statements of Operations.
Non-cash collateral received by the Funds may not be sold or re-pledged except to satisfy a borrower default. Therefore, non-cash collateral is not included on the Funds’ Schedules of Investments or Statements of Assets and Liabilities.
9. Borrowing Arrangements
Effective November 16, 2017, the Funds, along with certain other funds managed by the Manager (“Participating Funds”), entered into a committed revolving line of credit (the “Committed Line”) agreement with State Street Bank and Trust Company (the “Bank”) to be used to facilitate portfolio liquidity. The maximum borrowing amount under the Committed Line is $50 million with interest at a rate equal to the higher of (a) one-month London Inter-Bank Offered Rate (“LIBOR”) plus 1.25% per annum or (b) the Federal Funds rate plus 1.25% per annum on amounts borrowed. Each of the Participating Funds will pay a commitment fee at a rate of 0.25% per annum on the unused portion of the Committed Line amount. The Committed Line expires November 15, 2018, unless extended by the Bank or terminated by the Participating Funds in accordance with the agreement.
Effective November 16, 2017, the Funds, along with certain other Participating Funds managed by the Manager, entered into an uncommitted discretionary demand revolving line of credit (the “Uncommitted Line”) agreement with the Bank to be used to facilitate portfolio liquidity. The maximum borrowing amount under the Uncommitted Line is $50 million with interest at a rate equal to the higher of (a) one-month LIBOR plus 1.25% per annum or (b) the Federal Funds rate. The Uncommitted Line expires November 15, 2018 unless extended by the Bank or terminated by the Participating Funds in accordance with the agreement.
43
American Beacon FundsSM
Notes to Financial Statements
June 30, 2018
The Participating Funds paid administration, legal and arrangement fees, which are recognized as a component of “Other expenses” on the Statements of Operations, along with commitment fees, that have been allocated among the Participating Funds based on average daily net assets. During the year ended June 30, 2018, the Funds did not utilize this facility.
10. Capital Share Transactions
The tables below summarize the activity in capital shares for each Class of the Funds:
| Institutional Class | ||||||||||||||||||||||||||||
| Year Ended June 30, 2018 | March 22, 2017A to June 30, 2017 | |||||||||||||||||||||||||||
Alpha Quant Core Fund | Shares | Amount | Shares | Amount | ||||||||||||||||||||||||
| Shares sold | 18,666 | $ | 216,444 | - | B | $ | - | B | ||||||||||||||||||||
| Reinvestment of dividends | 2,136 | 24,547 | - | - | ||||||||||||||||||||||||
| Shares redeemed | (139 | ) | (1,616 | ) | - | - | ||||||||||||||||||||||
|
|
|
|
|
|
|
| |||||||||||||||||||||
| Net increase in shares outstanding | 20,663 | $ | 239,375 | - | $ | - | ||||||||||||||||||||||
|
|
|
|
|
|
|
| |||||||||||||||||||||
| Y Class | ||||||||||||||||||||||||||||
| Year Ended June 30, 2018 | March 22, 2017A to June 30, 2017 | |||||||||||||||||||||||||||
Alpha Quant Core Fund | Shares | Amount | Shares | Amount | ||||||||||||||||||||||||
| Shares sold | 1,725 | $ | 19,960 | - | B | $ | - | B | ||||||||||||||||||||
| Reinvestment of dividends | 138 | 1,582 | - | - | ||||||||||||||||||||||||
|
|
|
|
|
|
|
| |||||||||||||||||||||
| Net increase in shares outstanding | 1,863 | $ | 21,542 | - | $ | - | ||||||||||||||||||||||
|
|
|
|
|
|
|
| |||||||||||||||||||||
| Investor Class | ||||||||||||||||||||||||||||
| Year Ended June 30, 2018 | March 22, 2017A to June 30, 2017 | |||||||||||||||||||||||||||
Alpha Quant Core Fund | Shares | Amount | Shares | Amount | ||||||||||||||||||||||||
| Shares sold | 370 | $ | 4,320 | 293 | B | $ | 3,000 | B | ||||||||||||||||||||
| Reinvestment of dividends | 122 | 1,400 | - | - | ||||||||||||||||||||||||
|
|
|
|
|
|
|
| |||||||||||||||||||||
| Net increase in shares outstanding | 492 | $ | 5,720 | 293 | $ | 3,000 | ||||||||||||||||||||||
|
|
|
|
|
|
|
| |||||||||||||||||||||
| Institutional Class | ||||||||||||||||||||||||||||
| Year Ended June 30, 2018 | March 22, 2017A to June 30, 2017 | |||||||||||||||||||||||||||
Alpha Quant Dividend Fund | Shares | Amount | Shares | Amount | ||||||||||||||||||||||||
| Shares sold | 9,439 | $ | 100,806 | - | B | $ | - | B | ||||||||||||||||||||
| Reinvestment of dividends | 4,906 | 51,713 | - | - | ||||||||||||||||||||||||
|
|
|
|
|
|
|
| |||||||||||||||||||||
| Net increase in shares outstanding | 14,345 | $ | 152,519 | - | $ | - | ||||||||||||||||||||||
|
|
|
|
|
|
|
| |||||||||||||||||||||
| Y Class | ||||||||||||||||||||||||||||
| Year Ended June 30, 2018 | March 22, 2017A to June 30, 2017 | |||||||||||||||||||||||||||
Alpha Quant Dividend Fund | Shares | Amount | Shares | Amount | ||||||||||||||||||||||||
| Shares sold | 11,913 | $ | 128,860 | - | B | $ | - | B | ||||||||||||||||||||
| Reinvestment of dividends | 309 | 3,264 | - | - | ||||||||||||||||||||||||
| Shares redeemed | (9,448 | ) | (100,806 | ) | - | - | ||||||||||||||||||||||
|
|
|
|
|
|
|
| |||||||||||||||||||||
| Net increase in shares outstanding | 2,774 | $ | 31,318 | - | $ | - | ||||||||||||||||||||||
|
|
|
|
|
|
|
| |||||||||||||||||||||
| Investor Class | ||||||||||||||||||||||||||||
| Year Ended June 30, 2018 | March 22, 2017A to June 30, 2017 | |||||||||||||||||||||||||||
Alpha Quant Dividend Fund | Shares | Amount | Shares | Amount | ||||||||||||||||||||||||
| Shares sold | 865 | $ | 9,384 | 298 | B | $ | 3,000 | B | ||||||||||||||||||||
| Reinvestment of dividends | 282 | 2,969 | - | - | ||||||||||||||||||||||||
| Shares redeemed | - | (2 | ) | - | - | |||||||||||||||||||||||
|
|
|
|
|
|
|
| |||||||||||||||||||||
| Net increase in shares outstanding | 1,147 | $ | 12,351 | 298 | $ | 3,000 | ||||||||||||||||||||||
|
|
|
|
|
|
|
| |||||||||||||||||||||
44
American Beacon FundsSM
Notes to Financial Statements
June 30, 2018
| Institutional Class | ||||||||||||||||||||||||||||
| Year Ended June 30, 2018 | March 22, 2017A to June 30, 2017 | |||||||||||||||||||||||||||
Alpha Quant Quality Fund | Shares | Amount | Shares | Amount | ||||||||||||||||||||||||
| Reinvestment of dividends | 1,294 | $ | 14,994 | - | B | $ | - | B | ||||||||||||||||||||
|
|
|
|
|
|
|
| |||||||||||||||||||||
| Net increase in shares outstanding | 1,294 | $ | 14,994 | - | $ | - | ||||||||||||||||||||||
|
|
|
|
|
|
|
| |||||||||||||||||||||
| Y Class | ||||||||||||||||||||||||||||
| Year Ended June 30, 2018 | March 22, 2017A to June 30, 2017 | |||||||||||||||||||||||||||
Alpha Quant Quality Fund | Shares | Amount | Shares | Amount | ||||||||||||||||||||||||
| Shares sold | 1,712 | $ | 19,960 | - | B | $ | - | B | ||||||||||||||||||||
| Reinvestment of dividends | 84 | 976 | - | - | ||||||||||||||||||||||||
|
|
|
|
|
|
|
| |||||||||||||||||||||
| Net increase in shares outstanding | 1,796 | $ | 20,936 | - | $ | - | ||||||||||||||||||||||
|
|
|
|
|
|
|
| |||||||||||||||||||||
| Investor Class | ||||||||||||||||||||||||||||
| Year Ended June 30, 2018 | March 22, 2017A to June 30, 2017 | |||||||||||||||||||||||||||
Alpha Quant Quality Fund | Shares | Amount | Shares | Amount | ||||||||||||||||||||||||
| Shares sold | 739 | $ | 8,531 | 294 | B | $ | 3,000 | B | ||||||||||||||||||||
| Reinvestment of dividends | 74 | 857 | - | - | ||||||||||||||||||||||||
|
|
|
|
|
|
|
| |||||||||||||||||||||
| Net increase in shares outstanding | 813 | $ | 9,388 | 294 | $ | 3,000 | ||||||||||||||||||||||
|
|
|
|
|
|
|
| |||||||||||||||||||||
| Institutional Class | ||||||||||||||||||||||||||||
| Year Ended June 30, 2018 | March 22, 2017A to June 30, 2017 | |||||||||||||||||||||||||||
Alpha Quant Value Fund | Shares | Amount | Shares | Amount | ||||||||||||||||||||||||
| Shares sold | 9,808 | $ | 120,000 | - | B | $ | - | B | ||||||||||||||||||||
| Reinvestment of dividends | 2,720 | 31,446 | - | - | ||||||||||||||||||||||||
|
|
|
|
|
|
|
| |||||||||||||||||||||
| Net increase in shares outstanding | 12,528 | $ | 151,446 | - | $ | - | ||||||||||||||||||||||
|
|
|
|
|
|
|
| |||||||||||||||||||||
| Y Class | ||||||||||||||||||||||||||||
| Year Ended June 30, 2018 | March 22, 2017A to June 30, 2017 | |||||||||||||||||||||||||||
Alpha Quant Value Fund | Shares | Amount | Shares | Amount | ||||||||||||||||||||||||
| Shares sold | 78,892 | $ | 925,846 | - | B | $ | - | B | ||||||||||||||||||||
| Reinvestment of dividends | 195 | 2,250 | - | - | ||||||||||||||||||||||||
| Shares redeemed | (53 | ) | (650 | ) | - | - | ||||||||||||||||||||||
|
|
|
|
|
|
|
| |||||||||||||||||||||
| Net increase in shares outstanding | 79,034 | $ | 927,446 | - | $ | - | ||||||||||||||||||||||
|
|
|
|
|
|
|
| |||||||||||||||||||||
| Investor Class | ||||||||||||||||||||||||||||
| Year Ended June 30, 2018 | March 22, 2017A to June 30, 2017 | |||||||||||||||||||||||||||
Alpha Quant Value Fund | Shares | Amount | Shares | Amount | ||||||||||||||||||||||||
| Shares sold | 8,017 | $ | 94,916 | 592 | B | $ | 6,000 | B | ||||||||||||||||||||
| Reinvestment of dividends | 168 | 1,939 | - | - | ||||||||||||||||||||||||
| Shares redeemed | (19 | ) | (231 | ) | - | - | ||||||||||||||||||||||
|
|
|
|
|
|
|
| |||||||||||||||||||||
| Net increase in shares outstanding | 8,166 | $ | 96,624 | 592 | $ | 6,000 | ||||||||||||||||||||||
|
|
|
|
|
|
|
| |||||||||||||||||||||
A Commencement of operations.
B Seed capital was received on March 22, 2017 in the amount of $1,800,000, $100,000 and $100,000 for the Institutional, Y and Investor Classes, respectively. As a result, shares were issued in the amounts of 180,000, 10,000 and 10,000 for the Institutional, Y and Investor Classes, respectively.
11. Subsequent Events
Management has evaluated subsequent events for possible recognition or disclosure in the financial statements through the date the financial statements are issued. Management has determined that there are no material events that would require disclosure in the Funds’ financial statements through this date.
45
American Beacon Alpha Quant Core FundSM
Financial Highlights
(For a share outstanding throughout the period)
| Institutional Class | ||||||||||||
| Year Ended June 30, 2018 | March 22, 2017A to June 30, 2017 | |||||||||||
|
| |||||||||||
Net asset value, beginning of period | $ | 10.20 | $ | 10.00 | ||||||||
|
|
|
| |||||||||
Income from investment operations: | ||||||||||||
Net investment income | 0.15 | F | 0.03 | |||||||||
Net gains on investments (both realized and unrealized) | 1.56 | 0.17 | ||||||||||
|
|
|
| |||||||||
Total income from investment operations | 1.71 | 0.20 | ||||||||||
|
|
|
| |||||||||
Less distributions: | ||||||||||||
Dividends from net investment income | (0.13 | ) | - | |||||||||
|
|
|
| |||||||||
Total distributions | (0.13 | ) | - | |||||||||
|
|
|
| |||||||||
Net asset value, end of period | $ | 11.78 | $ | 10.20 | ||||||||
|
|
|
| |||||||||
Total returnB | 16.85 | % | 2.00 | %C | ||||||||
|
|
|
| |||||||||
Ratios and supplemental data: |
| |||||||||||
Net assets, end of period | $ | 2,364,264 | $ | 1,835,621 | ||||||||
Ratios to average net assets: | ||||||||||||
Expenses, before reimbursements | 5.55 | % | 12.23 | %D | ||||||||
Expenses, net of reimbursements | 0.69 | % | 0.69 | %D | ||||||||
Net investment (loss), before expense reimbursements | (3.49 | )% | (10.44 | )%D | ||||||||
Net investment income, net of reimbursements | 1.37 | % | 1.09 | %D | ||||||||
Portfolio turnover rate | 56 | % | 14 | %E | ||||||||
| A | Commencement of operations. |
| B | Based on net asset value, which does not reflect the sales charge, redemption fee, or contingent deferred sales charge, if applicable. May include adjustments in accordance with U.S. GAAP and as such, the net asset value for reporting purposes and the returns based upon those net asset values may differ from the net asset value and returns for shareholder transactions. |
| C | Not annualized. |
| D | Annualized. |
| E | Portfolio turnover rate is for the period from March 22, 2017 through June 30, 2017 and is not annualized. |
| F | Includes non-recurring dividends. Without these dividends, net investment income per share would have been $0.16. |
See accompanying notes
46
American Beacon Alpha Quant Core FundSM
Financial Highlights
(For a share outstanding throughout the period)
| Y Class | ||||||||||||
| Year Ended June 30, 2018 | March 22, 2017A to June 30, 2017 | |||||||||||
|
| |||||||||||
Net asset value, beginning of period | $ | 10.20 | $ | 10.00 | ||||||||
|
|
|
| |||||||||
Income from investment operations: | ||||||||||||
Net investment income | 0.13 | F | 0.03 | |||||||||
Net gains on investments (both realized and unrealized) | 1.57 | 0.17 | ||||||||||
|
|
|
| |||||||||
Total income from investment operations | 1.70 | 0.20 | ||||||||||
|
|
|
| |||||||||
Less distributions: | ||||||||||||
Dividends from net investment income | (0.13 | ) | - | |||||||||
|
|
|
| |||||||||
Total distributions | (0.13 | ) | - | |||||||||
|
|
|
| |||||||||
Net asset value, end of period | $ | 11.77 | $ | 10.20 | ||||||||
|
|
|
| |||||||||
Total returnB | 16.75 | % | 2.00 | %C | ||||||||
|
|
|
| |||||||||
Ratios and supplemental data: |
| |||||||||||
Net assets, end of period | $ | 139,588 | $ | 101,951 | ||||||||
Ratios to average net assets: | ||||||||||||
Expenses, before reimbursements | 5.63 | % | 17.45 | %D | ||||||||
Expenses, net of reimbursements | 0.79 | % | 0.79 | %D | ||||||||
Net investment (loss), before expense reimbursements | (3.59 | )% | (15.67 | )%D | ||||||||
Net investment income, net of reimbursements | 1.25 | % | 0.99 | %D | ||||||||
Portfolio turnover rate | 56 | % | 14 | %E | ||||||||
| A | Commencement of operations. |
| B | Based on net asset value, which does not reflect the sales charge, redemption fee, or contingent deferred sales charge, if applicable. May include adjustments in accordance with U.S. GAAP and as such, the net asset value for reporting purposes and the returns based upon those net asset values may differ from the net asset value and returns for shareholder transactions. |
| C | Not annualized. |
| D | Annualized. |
| E | Portfolio turnover rate is for the period from March 22, 2017 through June 30, 2017 and is not annualized. |
| F | Includes non-recurring dividends. Without these dividends, net investment income per share would have been $0.14. |
See accompanying notes
47
American Beacon Alpha Quant Core FundSM
Financial Highlights
(For a share outstanding throughout the period)
| Investor Class | ||||||||||||
| Year Ended June 30, 2018 | March 22, 2017A to June 30, 2017 | |||||||||||
|
| |||||||||||
Net asset value, beginning of period | $ | 10.19 | $ | 10.00 | ||||||||
|
|
|
| |||||||||
Income from investment operations: | ||||||||||||
Net investment income | 0.11 | F | 0.02 | |||||||||
Net gains on investments (both realized and unrealized) | 1.56 | 0.17 | ||||||||||
|
|
|
| |||||||||
Total income from investment operations | 1.67 | 0.19 | ||||||||||
|
|
|
| |||||||||
Less distributions: | ||||||||||||
Dividends from net investment income | (0.13 | ) | - | |||||||||
|
|
|
| |||||||||
Total distributions | (0.13 | ) | - | |||||||||
|
|
|
| |||||||||
Net asset value, end of period | $ | 11.73 | $ | 10.19 | ||||||||
|
|
|
| |||||||||
Total returnB | 16.47 | % | 1.90 | %C | ||||||||
|
|
|
| |||||||||
Ratios and supplemental data: |
| |||||||||||
Net assets, end of period | $ | 126,458 | $ | 104,854 | ||||||||
Ratios to average net assets: | ||||||||||||
Expenses, before reimbursements | 6.73 | % | 18.69 | %D | ||||||||
Expenses, net of reimbursements | 1.07 | % | 1.07 | %D | ||||||||
Net investment (loss), before expense reimbursements | (4.66 | )% | (16.91 | )%D | ||||||||
Net investment income, net of reimbursements | 1.01 | % | 0.71 | %D | ||||||||
Portfolio turnover rate | 56 | % | 14 | %E | ||||||||
| A | Commencement of operations. |
| B | Based on net asset value, which does not reflect the sales charge, redemption fee, or contingent deferred sales charge, if applicable. May include adjustments in accordance with U.S. GAAP and as such, the net asset value for reporting purposes and the returns based upon those net asset values may differ from the net asset value and returns for shareholder transactions. |
| C | Not annualized. |
| D | Annualized. |
| E | Portfolio turnover rate is for the period from March 22, 2017 through June 30, 2017 and is not annualized. |
| F | Includes non-recurring dividends. Without these dividends, net investment income per share would have been $0.12. |
See accompanying notes
48
American Beacon Alpha Quant Dividend FundSM
Financial Highlights
(For a share outstanding throughout the period)
| Institutional Class | ||||||||||||
| Year Ended June 30, 2018 | March 22, 2017A to June 30, 2017 | |||||||||||
|
| |||||||||||
Net asset value, beginning of period | $ | 10.00 | $ | 10.00 | ||||||||
|
|
|
| |||||||||
Income from investment operations: | ||||||||||||
Net investment income | 0.29 | 0.07 | ||||||||||
Net gains (losses) on investments (both realized and unrealized) | 0.41 | (0.07 | ) | |||||||||
|
|
|
| |||||||||
Total income (loss) from investment operations | 0.70 | - | ||||||||||
|
|
|
| |||||||||
Less distributions: | ||||||||||||
Dividends from net investment income | (0.28 | ) | - | |||||||||
Distributions from net realized gains | (0.00 | )B | - | |||||||||
|
|
|
| |||||||||
Total distributions | (0.28 | ) | - | |||||||||
|
|
|
| |||||||||
Net asset value, end of period | $ | 10.42 | $ | 10.00 | ||||||||
|
|
|
| |||||||||
Total returnC | 7.00 | % | 0.00 | %D | ||||||||
|
|
|
| |||||||||
Ratios and supplemental data: |
| |||||||||||
Net assets, end of period | $ | 2,025,327 | $ | 1,799,305 | ||||||||
Ratios to average net assets: | ||||||||||||
Expenses, before reimbursements | 5.91 | % | 12.37 | %E | ||||||||
Expenses, net of reimbursements | 0.69 | % | 0.69 | %E | ||||||||
Net investment (loss), before expense reimbursements | (2.42 | )% | (9.23 | )%E | ||||||||
Net investment income, net of reimbursements | 2.79 | % | 2.45 | %E | ||||||||
Portfolio turnover rate | 49 | % | 0 | %F | ||||||||
| A | Commencement of operations. |
| B | Amount is less than $0.01 per share. |
| C | Based on net asset value, which does not reflect the sales charge, redemption fee, or contingent deferred sales charge, if applicable. May include adjustments in accordance with U.S. GAAP and as such, the net asset value for reporting purposes and the returns based upon those net asset values may differ from the net asset value and returns for shareholder transactions. |
| D | Not annualized. |
| E | Annualized. |
| F | Portfolio turnover is based on the lesser of long-term purchases or sales divided by the average long-term fair value during the period. The Fund did not transact in any sales of long-term securities during the reporting period. |
See accompanying notes
49
American Beacon Alpha Quant Dividend FundSM
Financial Highlights
(For a share outstanding throughout the period)
| Y Class | ||||||||||||
| Year Ended June 30, 2018 | March 22, 2017A to June 30, 2017 | |||||||||||
|
| |||||||||||
Net asset value, beginning of period | $ | 9.99 | $ | 10.00 | ||||||||
|
|
|
| |||||||||
Income from investment operations: | ||||||||||||
Net investment income | 0.29 | 0.06 | ||||||||||
Net gains (losses) on investments (both realized and unrealized) | 0.41 | (0.07 | ) | |||||||||
|
|
|
| |||||||||
Total income (loss) from investment operations | 0.70 | (0.01 | ) | |||||||||
|
|
|
| |||||||||
Less distributions: | ||||||||||||
Dividends from net investment income | (0.28 | ) | - | |||||||||
Distributions from net realized gains | (0.00 | )B | - | |||||||||
|
|
|
| |||||||||
Total distributions | (0.28 | ) | - | |||||||||
|
|
|
| |||||||||
Net asset value, end of period | $ | 10.41 | $ | 9.99 | ||||||||
|
|
|
| |||||||||
Total returnC | 7.01 | % | (0.10 | )%D | ||||||||
|
|
|
| |||||||||
Ratios and supplemental data: |
| |||||||||||
Net assets, end of period | $ | 132,924 | $ | 99,934 | ||||||||
Ratios to average net assets: | ||||||||||||
Expenses, before reimbursements | 5.98 | % | 17.67 | %E | ||||||||
Expenses, net of reimbursements | 0.79 | % | 0.79 | %E | ||||||||
Net investment (loss), before expense reimbursements | (2.41 | )% | (14.54 | )%E | ||||||||
Net investment income, net of reimbursements | 2.79 | % | 2.34 | %E | ||||||||
Portfolio turnover rate | 49 | % | 0 | %F | ||||||||
| A | Commencement of operations. |
| B | Amount is less than $0.01 per share. |
| C | Based on net asset value, which does not reflect the sales charge, redemption fee, or contingent deferred sales charge, if applicable. May include adjustments in accordance with U.S. GAAP and as such, the net asset value for reporting purposes and the returns based upon those net asset values may differ from the net asset value and returns for shareholder transactions. |
| D | Not annualized. |
| E | Annualized. |
| F | Portfolio turnover is based on the lesser of long-term purchases or sales divided by the average long-term fair value during the period. The Fund did not transact in any sales of long-term securities during the reporting period. |
See accompanying notes
50
American Beacon Alpha Quant Dividend FundSM
Financial Highlights
(For a share outstanding throughout the period)
| Investor Class | ||||||||||||
Year Ended 2018 | March 22, 2017 | |||||||||||
|
| |||||||||||
Net asset value, beginning of period | $ | 9.99 | $ | 10.00 | ||||||||
|
|
|
| |||||||||
Income from investment operations: | ||||||||||||
Net investment income | 0.26 | 0.05 | ||||||||||
Net gains (losses) on investments (both realized and unrealized) | 0.40 | (0.06 | ) | |||||||||
|
|
|
| |||||||||
Total income (loss) from investment operations | 0.66 | (0.01 | ) | |||||||||
|
|
|
| |||||||||
Less distributions: | ||||||||||||
Dividends from net investment income | (0.28 | ) | - | |||||||||
Distributions from net realized gains | (0.00 | )B | - | |||||||||
|
|
|
| |||||||||
Total distributions | (0.28 | ) | - | |||||||||
|
|
|
| |||||||||
Net asset value, end of period | $ | 10.37 | $ | 9.99 | ||||||||
|
|
|
| |||||||||
Total returnC | 6.60 | % | (0.10 | )%D | ||||||||
|
|
|
| |||||||||
Ratios and supplemental data: | ||||||||||||
Net assets, end of period | $ | 118,686 | $ | 102,833 | ||||||||
Ratios to average net assets: | ||||||||||||
Expenses, before reimbursements | 7.11 | % | 18.92 | %E | ||||||||
Expenses, net of reimbursements | 1.07 | % | 1.07 | %E | ||||||||
Net investment (loss), before expense reimbursements | (3.63 | )% | (15.79 | )%E | ||||||||
Net investment income, net of reimbursements | 2.41 | % | 2.06 | %E | ||||||||
Portfolio turnover rate | 49 | % | 0 | %F | ||||||||
| A | Commencement of operations. |
| B | Amount is less than $0.01 per share. |
| C | Based on net asset value, which does not reflect the sales charge, redemption fee, or contingent deferred sales charge, if applicable. May include adjustments in accordance with U.S. GAAP and as such, the net asset value for reporting purposes and the returns based upon those net asset values may differ from the net asset value and returns for shareholder transactions. |
| D | Not annualized. |
| E | Annualized. |
| F | Portfolio turnover is based on the lesser of long-term purchases or sales divided by the average long-term fair value during the period. The Fund did not transact in any sales of long-term securities during the reporting period. |
See accompanying notes
51
American Beacon Alpha Quant Quality FundSM
Financial Highlights
(For a share outstanding throughout the period)
| Institutional Class | ||||||||||||
Year Ended 2018 | March 22, 2017 | |||||||||||
|
| |||||||||||
Net asset value, beginning of period | $ | 10.10 | $ | 10.00 | ||||||||
|
|
|
| |||||||||
Income from investment operations: | ||||||||||||
Net investment income | 0.09 | 0.03 | ||||||||||
Net gains on investments (both realized and unrealized) | 2.09 | 0.07 | ||||||||||
|
|
|
| |||||||||
Total income from investment operations | 2.18 | 0.10 | ||||||||||
|
|
|
| |||||||||
Less distributions: | ||||||||||||
Dividends from net investment income | (0.08 | ) | - | |||||||||
|
|
|
| |||||||||
Total distributions | (0.08 | ) | - | |||||||||
|
|
|
| |||||||||
Net asset value, end of period | $ | 12.20 | $ | 10.10 | ||||||||
|
|
|
| |||||||||
Total returnB | 21.66 | % | 1.00 | %C | ||||||||
|
|
|
| |||||||||
Ratios and supplemental data: | ||||||||||||
Net assets, end of period | $ | 2,212,134 | $ | 1,817,518 | ||||||||
Ratios to average net assets: | ||||||||||||
Expenses, before reimbursements | 5.69 | % | 12.24 | %D | ||||||||
Expenses, net of reimbursements | 0.69 | % | 0.69 | %D | ||||||||
Net investment (loss), before expense reimbursements | (4.21 | )% | (10.33 | )%D | ||||||||
Net investment income, net of reimbursements | 0.79 | % | 1.22 | %D | ||||||||
Portfolio turnover rate | 62 | % | 19 | %E | ||||||||
| A | Commencement of operations. |
| B | Based on net asset value, which does not reflect the sales charge, redemption fee, or contingent deferred sales charge, if applicable. May include adjustments in accordance with U.S. GAAP and as such, the net asset value for reporting purposes and the returns based upon those net asset values may differ from the net asset value and returns for shareholder transactions. |
| C | Not annualized. |
| D | Annualized. |
| E | Portfolio turnover rate is for the period from March 22, 2017 through June 30, 2017 and is not annualized. |
See accompanying notes
52
American Beacon Alpha Quant Quality FundSM
Financial Highlights
(For a share outstanding throughout the period)
| Y Class | ||||||||||||
Year Ended 2018 | March 22, 2017 | |||||||||||
|
| |||||||||||
Net asset value, beginning of period | $ | 10.09 | $ | 10.00 | ||||||||
|
|
|
| |||||||||
Income from investment operations: | ||||||||||||
Net investment income | 0.07 | 0.03 | ||||||||||
Net gains on investments (both realized and unrealized) | 2.11 | 0.06 | ||||||||||
|
|
|
| |||||||||
Total income from investment operations | 2.18 | 0.09 | ||||||||||
|
|
|
| |||||||||
Less distributions: | ||||||||||||
Dividends from net investment income | (0.08 | ) | - | |||||||||
|
|
|
| |||||||||
Total distributions | (0.08 | ) | - | |||||||||
|
|
|
| |||||||||
Net asset value, end of period | $ | 12.19 | $ | 10.09 | ||||||||
|
|
|
| |||||||||
Total returnB | 21.68 | % | 0.90 | %C | ||||||||
|
|
|
| |||||||||
Ratios and supplemental data: | ||||||||||||
Net assets, end of period | $ | 143,744 | $ | 100,946 | ||||||||
Ratios to average net assets: | ||||||||||||
Expenses, before reimbursements | 5.78 | % | 17.48 | %D | ||||||||
Expenses, net of reimbursements | 0.79 | % | 0.79 | %D | ||||||||
Net investment (loss), before expense reimbursements | (4.30 | )% | (15.57 | )%D | ||||||||
Net investment income, net of reimbursements | 0.68 | % | 1.12 | %D | ||||||||
Portfolio turnover rate | 62 | % | 19 | %E | ||||||||
| A | Commencement of operations. |
| B | Based on net asset value, which does not reflect the sales charge, redemption fee, or contingent deferred sales charge, if applicable. May include adjustments in accordance with U.S. GAAP and as such, the net asset value for reporting purposes and the returns based upon those net asset values may differ from the net asset value and returns for shareholder transactions. |
| C | Not annualized. |
| D | Annualized. |
| E | Portfolio turnover rate is for the period from March 22, 2017 through June 30, 2017 and is not annualized. |
See accompanying notes
53
American Beacon Alpha Quant Quality FundSM
Financial Highlights
(For a share outstanding throughout the period)
| Investor Class | ||||||||||||
Year Ended 2018 | March 22, 2017 | |||||||||||
|
| |||||||||||
Net asset value, beginning of period | $ | 10.09 | $ | 10.00 | ||||||||
|
|
|
| |||||||||
Income from investment operations: | ||||||||||||
Net investment income | 0.05 | 0.02 | ||||||||||
Net gains on investments (both realized and unrealized) | 2.08 | 0.07 | ||||||||||
|
|
|
| |||||||||
Total income from investment operations | 2.13 | 0.09 | ||||||||||
|
|
|
| |||||||||
Less distributions: | ||||||||||||
Dividends from net investment income | (0.08 | ) | - | |||||||||
|
|
|
| |||||||||
Total distributions | (0.08 | ) | - | |||||||||
|
|
|
| |||||||||
Net asset value, end of period | $ | 12.14 | $ | 10.09 | ||||||||
|
|
|
| |||||||||
Total returnB | 21.18 | % | 0.90 | %C | ||||||||
|
|
|
| |||||||||
Ratios and supplemental data: | ||||||||||||
Net assets, end of period | $ | 134,870 | $ | 103,837 | ||||||||
Ratios to average net assets: | ||||||||||||
Expenses, before reimbursements | 6.83 | % | 18.73 | %D | ||||||||
Expenses, net of reimbursements | 1.07 | % | 1.07 | %D | ||||||||
Net investment (loss), before expense reimbursements | (5.35 | )% | (16.82 | )%D | ||||||||
Net investment income, net of reimbursements | 0.41 | % | 0.84 | %D | ||||||||
Portfolio turnover rate | 62 | % | 19 | %E | ||||||||
| A | Commencement of operations. |
| B | Based on net asset value, which does not reflect the sales charge, redemption fee, or contingent deferred sales charge, if applicable. May include adjustments in accordance with U.S. GAAP and as such, the net asset value for reporting purposes and the returns based upon those net asset values may differ from the net asset value and returns for shareholder transactions. |
| C | Not annualized. |
| D | Annualized. |
| E | Portfolio turnover rate is for the period from March 22, 2017 through June 30, 2017 and is not annualized. |
See accompanying notes
54
American Beacon Alpha Quant Value FundSM
Financial Highlights
(For a share outstanding throughout the period)
| Institutional Class | ||||||||||||
Year Ended 2018 | March 22, 2017 | |||||||||||
|
| |||||||||||
Net asset value, beginning of period | $ | 10.23 | $ | 10.00 | ||||||||
|
|
|
| |||||||||
Income from investment operations: | ||||||||||||
Net investment income | 0.21 | F | 0.03 | |||||||||
Net gains on investments (both realized and unrealized) | 1.61 | 0.20 | ||||||||||
|
|
|
| |||||||||
Total income from investment operations | 1.82 | 0.23 | ||||||||||
|
|
|
| |||||||||
Less distributions: | ||||||||||||
Dividends from net investment income | (0.17 | ) | - | |||||||||
|
|
|
| |||||||||
Total distributions | (0.17 | ) | - | |||||||||
|
|
|
| |||||||||
Net asset value, end of period | $ | 11.88 | $ | 10.23 | ||||||||
|
|
|
| |||||||||
Total returnB | 17.88 | % | 2.30 | %C | ||||||||
|
|
|
| |||||||||
Ratios and supplemental data: |
| |||||||||||
Net assets, end of period | $ | 2,287,739 | $ | 1,842,294 | ||||||||
Ratios to average net assets: | ||||||||||||
Expenses, before reimbursements | 5.18 | % | 12.16 | %D | ||||||||
Expenses, net of reimbursements | 0.69 | % | 0.69 | %D | ||||||||
Net investment (loss), before expense reimbursements | (2.58 | )% | (10.48 | )%D | ||||||||
Net investment income, net of reimbursements | 1.91 | % | 0.99 | %D | ||||||||
Portfolio turnover rate | 53 | % | 11 | %E | ||||||||
| A | Commencement of operations. |
| B | Based on net asset value, which does not reflect the sales charge, redemption fee, or contingent deferred sales charge, if applicable. May include adjustments in accordance with U.S. GAAP and as such, the net asset value for reporting purposes and the returns based upon those net asset values may differ from the net asset value and returns for shareholder transactions. |
| C | Not annualized. |
| D | Annualized. |
| E | Portfolio turnover rate is for the period from March 22, 2017 through June 30, 2017 and is not annualized. |
| F | Includes non-recurring dividends. Without these dividends, net investment income per share would have been $0.22. |
See accompanying notes
55
American Beacon Alpha Quant Value FundSM
Financial Highlights
(For a share outstanding throughout the period)
| Y Class | ||||||||||||
Year Ended 2018 | March 22, 2017 | |||||||||||
|
| |||||||||||
Net asset value, beginning of period | $ | 10.23 | $ | 10.00 | ||||||||
|
|
|
| |||||||||
Income from investment operations: | ||||||||||||
Net investment income | 0.18 | F | 0.02 | |||||||||
Net gains on investments (both realized and unrealized) | 1.63 | 0.21 | ||||||||||
|
|
|
| |||||||||
Total income from investment operations | 1.81 | 0.23 | ||||||||||
|
|
|
| |||||||||
Less distributions: | ||||||||||||
Dividends from net investment income | (0.17 | ) | - | |||||||||
|
|
|
| |||||||||
Total distributions | (0.17 | ) | - | |||||||||
|
|
|
| |||||||||
Net asset value, end of period | $ | 11.87 | $ | 10.23 | ||||||||
|
|
|
| |||||||||
Total returnB | 17.79 | % | 2.30 | %C | ||||||||
|
|
|
| |||||||||
Ratios and supplemental data: |
| |||||||||||
Net assets, end of period | $ | 1,056,453 | $ | 102,322 | ||||||||
Ratios to average net assets: | ||||||||||||
Expenses, before reimbursements | 5.30 | % | 17.37 | %D | ||||||||
Expenses, net of reimbursements | 0.79 | % | 0.79 | %D | ||||||||
Net investment (loss), before expense reimbursements | (2.69 | )% | (15.69 | )%D | ||||||||
Net investment income, net of reimbursements | 1.82 | % | 0.89 | %D | ||||||||
Portfolio turnover rate | 53 | % | 11 | %E | ||||||||
| A | Commencement of operations. |
| B | Based on net asset value, which does not reflect the sales charge, redemption fee, or contingent deferred sales charge, if applicable. May include adjustments in accordance with U.S. GAAP and as such, the net asset value for reporting purposes and the returns based upon those net asset values may differ from the net asset value and returns for shareholder transactions. |
| C | Not annualized. |
| D | Annualized. |
| E | Portfolio turnover rate is for the period from March 22, 2017 through June 30, 2017 and is not annualized. |
| F | Includes non-recurring dividends. Without these dividends, net investment income per share would have been $0.19. |
See accompanying notes
56
American Beacon Alpha Quant Value FundSM
Financial Highlights
(For a share outstanding throughout the period)
| Investor Class | ||||||||||||
Year Ended 2018 | March 22, 2017 | |||||||||||
|
| |||||||||||
Net asset value, beginning of period | $ | 10.22 | $ | 10.00 | ||||||||
|
|
|
| |||||||||
Income from investment operations: | ||||||||||||
Net investment income | 0.17 | F | 0.02 | |||||||||
Net gains on investments (both realized and unrealized) | 1.60 | 0.20 | ||||||||||
|
|
|
| |||||||||
Total income from investment operations | 1.77 | 0.22 | ||||||||||
|
|
|
| |||||||||
Less distributions: | ||||||||||||
Dividends from net investment income | (0.17 | ) | - | |||||||||
|
|
|
| |||||||||
Total distributions | (0.17 | ) | - | |||||||||
|
|
|
| |||||||||
Net asset value, end of period | $ | 11.82 | $ | 10.22 | ||||||||
|
|
|
| |||||||||
Total returnB | 17.41 | % | 2.20 | %C | ||||||||
|
|
|
| |||||||||
Ratios and supplemental data: |
| |||||||||||
Net assets, end of period | $ | 221,794 | $ | 108,298 | ||||||||
Ratios to average net assets: | ||||||||||||
Expenses, before reimbursements | 6.21 | % | 18.47 | %D | ||||||||
Expenses, net of reimbursements | 1.07 | % | 1.07 | %D | ||||||||
Net investment (loss), before expense reimbursements | (3.68 | )% | (16.78 | )%D | ||||||||
Net investment income, net of reimbursements | 1.46 | % | 0.61 | %D | ||||||||
Portfolio turnover rate | 53 | % | 11 | %E | ||||||||
| A | Commencement of operations. |
| B | Based on net asset value, which does not reflect the sales charge, redemption fee, or contingent deferred sales charge, if applicable. May include adjustments in accordance with U.S. GAAP and as such, the net asset value for reporting purposes and the returns based upon those net asset values may differ from the net asset value and returns for shareholder transactions. |
| C | Not annualized. |
| D | Annualized. |
| E | Portfolio turnover rate is for the period from March 22, 2017 through June 30, 2017 and is not annualized. |
| F | Includes non-recurring dividends. Without these dividends, net investment income per share would have been $0.18. |
See accompanying notes
57
American Beacon FundsSM
June 30, 2018 (Unaudited)
Certain tax information regarding the Funds are required to be provided to shareholders based upon the Funds’ income and distributions for the taxable year ended June 30, 2018. The information and distributions reported herein may differ from information and distributions taxable to the shareholders for the calendar year ended December 31, 2017.
The Funds designated the following items with regard to distributions paid during the fiscal year ended June 30, 2018. All designations are based on financial information available as of this annual report and, accordingly, are subject to change. For each item, it is the intention of the Funds to designate the maximum amount permitted under the Internal Revenue Code of 1986, as amended, and the regulations there under.
Corporate Dividends-Received Deduction:
Alpha Quant Core | 100.00 | % | ||
Alpha Quant Dividend | 100.00 | % | ||
Alpha Quant Quality | 100.00 | % | ||
Alpha Quant Value | 100.00 | % |
Qualified Dividend Income:
Alpha Quant Core | 100.00 | % | ||
Alpha Quant Dividend | 100.00 | % | ||
Alpha Quant Quality | 100.00 | % | ||
Alpha Quant Value | 100.00 | % |
Long-Term Capital Gain Distributions:
Alpha Quant Core | $ | - | ||
Alpha Quant Dividend | 561 | |||
Alpha Quant Quality | - | |||
Alpha Quant Value | - |
Short-Term Capital Gain Distributions:
Alpha Quant Core | $ | - | ||
Alpha Quant Dividend | 212 | |||
Alpha Quant Quality | - | |||
Alpha Quant Value | - |
Shareholders will receive notification in January 2019 of the applicable tax information necessary to prepare their 2018 income tax returns.
58
Disclosure Regarding Approval of the Management and Investment Advisory Agreements (Unaudited)
At in-person meetings held on May 18, 2018 and June 5-6, 2018 (collectively, the “Meetings”), the Board of Trustees (“Board” or “Trustees”) considered and then, at its June 6, 2018 meeting, approved the renewal of:
(1) the Management Agreement between American Beacon Advisors, Inc. (“Manager”) and the American Beacon Funds (“Trust”), on behalf of the American Beacon Alpha Quant Core Fund (the “Core Fund”), the American Beacon Alpha Quant Dividend Fund (the “Dividend Fund”), the American Beacon Alpha Quant Quality Fund (the “Quality Fund”), and the American Beacon Alpha Quant Value Fund (the “Value Fund”) (each, a “Fund” and collectively, the “Funds”); and
(2) the Investment Advisory Agreement among the Manager, Alpha Quant Advisors, LLC (the “subadvisor”), and the Trust, on behalf of the Funds.
The Management Agreement and the Investment Advisory Agreement are collectively referred to herein as the “Agreements.” In preparation for its consideration of the renewal of the Agreements, the Board undertook steps to gather and consider information furnished by the Manager, the subadvisor, Broadridge, Inc. (“Broadridge”) and Morningstar, Inc. (“Morningstar”). The Board, with the assistance of independent legal counsel, requested and received certain relevant information from the Manager and the subadvisor.
In advance of the Meetings, the Board’s Investment Committee and/or the Manager coordinated the production of information from Broadridge and Morningstar regarding the performance, fees and expenses of the Funds as well as information from the Manager and the subadvisor. At the Meetings, the Board considered the information provided. Further, the Board took into consideration information furnished to the Board throughout the year at regular meetings of the Board and its committees, as well as information specifically prepared in connection with the renewal process.
In connection with the Board’s consideration of the Agreements, the Trustees received and evaluated such information as they deemed necessary. The information requested on behalf of the Board included, among other information, the following materials. References herein to the “firm” refer to the Manager and/or the subadvisor.
| • | comparisons of the performance of an appropriate share class of each Fund to comparable investment companies and appropriate benchmark indices, including peer group averages and performance analyses from Broadridge, and to the performance of any similar accounts or a composite of similar accounts, as applicable, managed by the firm; |
| • | comparisons of each Fund’s management and subadvisory fee rates and expense ratio with the management fee rates paid by comparable mutual funds and their expense ratios, including peer group averages and fee and expense analyses from Broadridge, and the advisory fee rates charged to other clients for which similar services are provided by a firm; |
| • | a description of any applicable fee waivers and/or expense reimbursements in place for each Fund during the past year, and any proposed changes to the expense limitation arrangements; |
| • | the Manager’s and the subadvisor’s profitability with respect to the services that each provided to each Fund; |
| • | any actual or anticipated economies of scale in relation to the services the firm provides or will provide to each Fund and whether the current fee rates charged or to be charged to each Fund reflect these economies of scale for the benefit of the Fund’s investors; |
| • | an evaluation of other benefits to the firm or Funds as a result of their relationship, if any; |
| • | information regarding administrative, accounting-related, cash management and securities lending services that the Manager provides to the Funds and the fees that the Manager receives for such services; and |
59
Disclosure Regarding Approval of the Management and Investment Advisory Agreements (Unaudited)
| • | information regarding a firm’s financial condition, the personnel of the Manager who are assigned primary responsibility for managing the Funds, staffing levels, portfolio managers’ compensation, insurance coverage, material pending litigation, code of ethics, compliance matters, actual or potential conflicts of interest that the firm experiences, or anticipates that it will experience, in providing services to the Funds, and the Manager’s disaster recovery plans. |
The Board noted that the Manager provides management and administrative services to the Funds pursuant to the Management Agreement. The Board considered that many mutual funds have separate contracts governing each type of service and observed that, with respect to such mutual funds, the actual management fee rates provided by Broadridge for peer group funds reflect the combined advisory and administrative expenses, reduced by any fee waivers and/or reimbursements.
A firm may not have been able to, or opted not to, provide information in response to certain information requests, in which case the Board conducted its evaluation of the firm based on information that was provided. In such cases, the Board determined that the omission of any such information was not material to its considerations. For each Fund, the class of shares used for comparative performance purposes was the share class with the lowest expenses available for purchase by the general public, which was the Institutional Class. The Board also considered that the use of Institutional Class performance generally facilitates a meaningful comparison for expense and performance purposes.
Provided below is an overview of certain factors the Board considered in connection with its renewal and approval of the Agreements. The Board did not identify any particular information that was most relevant to its consideration to renew or approve each Agreement, and each Trustee may have afforded different weight to the various factors. Legal counsel to the independent Trustees provided the Board with a memorandum regarding its responsibilities pertaining to the renewal and approval of investment advisory contracts, such as the Agreements. The memorandum explained the regulatory requirements surrounding the Trustees’ process for evaluating investment advisors and the terms of investment advisory contracts. Based on its evaluation, the Board unanimously concluded that the terms of each Agreement were reasonable and fair and that the renewal and approval of each Agreement was in the best interests of the Funds and their shareholders.
Considerations With Respect to the Renewal of the Management Agreement and the Investment Advisory Agreement
In determining whether to renew the Agreements, the Trustees considered the best interests of each Fund separately. While the Management Agreement and the Investment Advisory Agreement for the Funds were considered at the Meetings, the Board considered each Fund’s investment management and subadvisory relationships separately.
In each instance, the Board considered, among other things, the following factors: (1) the nature, extent and quality of the services provided; (2) the investment performance of the Funds; (3) the costs incurred by the Manager in rendering services to the Funds and its resulting profits or losses; (4) comparisons of services and fee rates with contracts entered into by the Manager or the subadvisor or their affiliates with other clients (such as pension funds and other institutional clients); (5) the extent to which economies of scale, if any, have been taken into account in setting each fee rate schedule; (6) whether fee rate levels reflect economies of scale, if any, for the benefit of Fund investors; and (7) any other benefits derived or anticipated to be derived by the Manager or the subadvisor from their relationships with the Funds.
Nature, Extent and Quality of Services. With respect to the renewal of the Management Agreement, the Board considered, among other factors: each Fund’s performance since its inception on March 22, 2017; the length of service of key investment personnel at the Manager; the cost structure of the Funds; the Manager’s culture of compliance and support that reduce risks to the Funds; the Manager’s quality of services; the Manager’s active role in monitoring and, as appropriate, recommending additional or replacement subadvisors; and the Manager’s efforts to retain key employees and maintain staffing levels.
60
Disclosure Regarding Approval of the Management and Investment Advisory Agreements (Unaudited)
With respect to the renewal of the Investment Advisory Agreement, the Board considered the level of staffing and the size of the subadvisor. The Board also considered the adequacy of the resources committed to the Funds by the subadvisor, and whether those resources were commensurate with the needs of the Funds and are sufficient to sustain appropriate levels of performance and compliance needs. In this regard, the Board considered the financial stability of the subadvisor. The Board also considered the subadvisor’s representations regarding its compliance program and code of ethics. Based on the foregoing information, the Board concluded that the nature, extent and quality of the management and advisory services provided by the Manager and the subadvisor were appropriate for each Fund.
Investment Performance. The Board evaluated the comparative information provided by Broadridge and the Manager regarding the performance of each Fund relative to its Broadridge performance universe, Morningstar Category, and benchmark index, as well as the Fund’s Morningstar rating. The Board considered the information provided by Broadridge regarding Broadridge’s independent methodology for selecting each Fund’s Broadridge performance universe. The Board also considered that the performance universes selected by Broadridge may not provide appropriate comparisons for a Fund. In addition, the Board considered the performance reports and discussions with management at Board and Committee meetings throughout the year. The Board also evaluated the comparative information provided by the subadvisor regarding the performance of each Fund relative to the performance of each Fund’s benchmark index and a composite of similar accounts. In addition, the Board considered the Manager’s recommendation to continue to retain the subadvisor. A discussion regarding the Board’s considerations with respect to each Fund’s performance appears below under “Additional Considerations and Conclusions with Respect to Each Fund.”
Costs of the Services Provided to the Funds and the Profits Realized by the Manager from its Relationship with the Funds. In analyzing the cost of services and profitability of the Manager, the Board considered the revenues earned and the expenses incurred by the Manager, before and after the payment of distribution-related expenses by the Manager. The profits or losses were noted at both an aggregate level for all funds within the group of mutual funds sponsored by the Manager (the “Fund Complex”) and at an individual Fund level, with the Manager sustaining a loss before and after the payment of distribution-related expenses by the Manager for each Fund. The Board also considered comparative information provided by the Manager regarding the Manager’s overall profitability with respect to the Fund Complex relative to the overall profitability of other firms in the mutual fund industry, as disclosed in publicly available sources. Although the Board noted that, in certain cases, the fee rates paid by other clients of the Manager are lower than the fee rates paid by the Funds, the Manager represented that, among other matters, the difference is attributable to the fact that the Manager does not perform administrative services for non-investment company clients and reflects the greater level of responsibility and regulatory requirements associated with managing the Funds.
The Board also noted that the Manager proposed to continue the expense waivers and reimbursements for the Funds that were in place during the last fiscal year. The Board further considered that, with respect to each Fund, the applicable Management Agreement provides for the Manager to receive a management fee comprised of an annualized fee that is retained by the Manager. In addition, the Board considered that the Manager receives fees for overseeing the securities lending program on behalf of the Funds. The Board also noted that certain share classes of the Funds maintain higher expense ratios in order to compensate third-party financial intermediaries.
In analyzing the fee rates charged by the subadvisor in connection with its investment advisory services to the Funds, the Board considered representations made by the subadvisor that the Manager has negotiated the lowest fee rate that the subadvisor charges for any comparable client accounts. The Board also considered the cost of services and profitability of the subadvisor, noting that the subadvisor had represented that it had not earned a profit with respect to the services that it provides to the Funds during the past year.
Based on the foregoing information, the Board concluded that the profitability levels of the Manager were reasonable in light of the services performed by the Manager and the profitability level of the subadvisor was reasonable in light of the services performed by the subadvisor. A discussion regarding the Board’s considerations with respect to each Fund’s fee rates is set forth below under “Additional Considerations and Conclusions with Respect to Each Fund.”
61
Disclosure Regarding Approval of the Management and Investment Advisory Agreements (Unaudited)
Economies of Scale. In considering the reasonableness of the management and investment advisory fees rates, the Board considered whether economies of scale will be realized as each Fund grows and whether fee rate levels reflect these economies of scale for the benefit of Fund shareholders. In this regard, the Board considered that the Manager has negotiated breakpoints in the subadvisory fee rate for the Funds.
In addition, the Board noted the Manager’s representation that the Management Agreement contains fee schedule breakpoints at higher asset levels with respect to each Fund. Based on the foregoing information, the Board concluded that the Manager and subadvisor fee rate schedules for each Fund provide for a reasonable sharing of benefits from any economies of scale with each Fund.
Benefits Derived from the Relationship with the Funds. The Board considered the “fall-out” or ancillary benefits that accrue to the Manager and/or the subadvisor as a result of the advisory relationships with the Funds, including greater exposure in the marketplace with respect to the Manager’s or subadvisor’s investment process and expanding the level of assets under management by the Manager and the subadvisor. The Board also considered that the Manager may invest the Fund’s cash balances and cash collateral provided by the borrowers of the Fund’s securities in the American Beacon U.S. Government Money Market Select Fund, which the Manager manages directly. Based on the foregoing information, the Board concluded that the potential benefits accruing to the Manager and the subadvisor by virtue of their relationships with the Funds appear to be fair and reasonable.
Additional Considerations and Conclusions with Respect to Each Fund
The performance comparisons below were made in comparison to each Fund’s Broadridge performance universe and Morningstar Category. With respect to the Broadridge performance universe, the 1st Quintile represents the top twenty percent of the universe based on performance and the 5th Quintile representing the bottom twenty percent of the universe based on performance. References below to each Fund’s Broadridge performance universe are to the universe of mutual funds with a comparable investment classification/objective included in the analysis provided by Broadridge.
The expense comparisons below were made in comparison to each Fund’s Broadridge expense universe and Broadridge expense group, with the 1st Quintile representing the top twenty percent of the universe or group based on lowest total expense and the 5th Quintile representing the bottom twenty percent of the universe or group based on highest total expense. References below to each Fund’s expense group and expense universe are to the respective group or universe of comparable mutual funds included in the analysis by Broadridge. A Broadridge expense group consists of the Fund and a representative sample of funds with similar operating structures and asset sizes, as selected by Broadridge. A Broadridge expense universe includes all funds in the investment classification/objective with a similar operating structure as the share class of the Fund included in the Broadridge comparative information and provides a broader view of expenses across the Fund’s investment classification/objective. The Trustees also considered each Fund’s Morningstar fee level category. In reviewing expenses, the Trustees considered the positive impact of fee waivers where applicable and the Manager’s agreement to continue the fee waivers. In addition, information regarding the subadvisor’s use of soft dollars was requested from the Manager and was considered by the Trustees.
Additional Considerations and Conclusions with Respect to the American Beacon Alpha Quant Core Fund
In considering the renewal of the Management Agreement and the Investment Advisory Agreement with the subadvisor for the Core Fund, the Trustees considered the following additional factors:
Broadridge Total Expense Analysis Excluding 12b-1 Fees and Morningstar Fee Level Ranking
Compared to Broadridge Expense Group | 1st Quintile | |
Compared to Broadridge Expense Universe | 3rd Quintile | |
Morningstar Fee Level Ranking – Institutional Class | Average Expense Ratio |
62
Disclosure Regarding Approval of the Management and Investment Advisory Agreements (Unaudited)
Subadvisor Performance (compared to Broadridge Performance Universe for period indicated, ending December 31, 2017)
Compared to Broadridge Performance Universe | Since Inception March 22, 2017 | 2nd Quintile | ||
Compared to Morningstar Category | 6 Months | 1st Quintile |
The Trustees also considered: (1) the subadvisor’s representation that the fee rate charged to the Core Fund is lower than the fee rate schedule for the subadvisor’s separate account clients in the same strategy as the Core Fund; and (2) the Manager’s recommendation to continue to retain the subadvisor based upon, among other factors, the relatively brief period that the Core Fund has been in operation.
Based on these and other considerations, the Trustees: (1) concluded that the fees paid to the Manager and the subadvisor under the Management and Investment Advisory Agreements are fair and reasonable; and (2) determined that the Core Fund and its shareholders would benefit from the Manager’s and subadvisor’s continued management of the Core Fund.
Additional Considerations and Conclusions with Respect to the American Beacon Alpha Quant Dividend Fund
In considering the renewal of the Management Agreement and the Investment Advisory Agreement with the subadvisor for the Dividend Fund, the Trustees considered the following additional factors:
Broadridge Total Expense Analysis Excluding 12b-1 Fees and Morningstar Fee Level Ranking
Compared to Broadridge Expense Group | 1st Quintile | |
Compared to Broadridge Expense Universe | 2nd Quintile | |
Morningstar Fee Level Ranking – Institutional Class | Average Expense Ratio |
Subadvisor Performance (compared to Broadridge Performance Universe for period indicated, ending December 31, 2017)
Compared to Broadridge Performance Universe | Since Inception March 22, 2017 | 2nd Quintile | ||
Compared to Morningstar Category | 6 Months | 1st Quintile |
The Trustees also considered: (1) the subadvisor’s representation that the fee rate charged to the Dividend Fund is lower than the fee rate schedule for the subadvisor’s separate account clients in the same strategy as the Dividend Fund; and (2) the Manager’s recommendation to continue to retain the subadvisor based upon, among other factors, the relatively brief period that the Dividend Fund has been in operation.
Based on these and other considerations, the Trustees: (1) concluded that the fees paid to the Manager and the subadvisor under the Management and Investment Advisory Agreements are fair and reasonable; and (2) determined that the Dividend Fund and its shareholders would benefit from the Manager’s and subadvisor’s continued management of the Dividend Fund.
Additional Considerations and Conclusions with Respect to the American Beacon Alpha Quant Quality Fund
In considering the renewal of the Management Agreement and the Investment Advisory Agreement with the subadvisor for the Quality Fund, the Trustees considered the following additional factors:
Broadridge Total Expense Analysis Excluding 12b-1 Fees and Morningstar Fee Level Ranking
Compared to Broadridge Expense Group | 1st Quintile | |
Compared to Broadridge Expense Universe | 2nd Quintile | |
Morningstar Fee Level Ranking – Institutional Class | Average Expense Ratio |
63
Disclosure Regarding Approval of the Management and Investment Advisory Agreements (Unaudited)
Subadvisor Performance (compared to Broadridge Performance Universe for period indicated, ending December 31, 2017)
Compared to Broadridge Performance Universe | Since Inception March 22, 2017 | 4th Quintile | ||
Compared to Morningstar Category | 6 Months | 1st Quintile |
The Trustees also considered: (1) the subadvisor’s representation that the fee rate charged to the Quality Fund is lower than the fee rate schedule for the subadvisor’s separate account clients in the same strategy as the Quality Fund; and (2) the Manager’s recommendation to continue to retain the subadvisor based upon, among other factors, the relatively brief period that the Quality Fund has been in operation.
Based on these and other considerations, the Trustees: (1) concluded that the fees paid to the Manager and the subadvisor under the Management and Investment Advisory Agreements are fair and reasonable; and (2) determined that the Quality Fund and its shareholders would benefit from the Manager’s and subadvisor’s continued management of the Quality Fund.
Additional Considerations and Conclusions with Respect to the American Beacon Alpha Quant Value Fund
In considering the renewal of the Management Agreement and the Investment Advisory Agreement with the subadvisor for the Value Fund, the Trustees considered the following additional factors:
Broadridge Total Expense Analysis Excluding 12b-1 Fees and Morningstar Fee Level Ranking
Compared to Broadridge Expense Group | 1st Quintile | |
Compared to Broadridge Expense Universe | 2nd Quintile | |
Morningstar Fee Level Ranking – Institutional Class | Average Expense Ratio |
Subadvisor Performance (compared to Broadridge Performance Universe for period indicated, ending December 31, 2017)
Compared to Broadridge Performance Universe | Since Inception March 22, 2017 | 1st Quintile | ||
Compared to Morningstar Category | 6 Months | 1st Quintile |
The Trustees also considered: (1) the subadvisor’s representation that the fee rate charged to the Value Fund is lower than the fee rate schedule for the subadvisor’s separate account clients in the same strategy as the Value Fund; and (2) the Manager’s recommendation to continue to retain the subadvisor based upon, among other factors, the relatively brief period that the Value Fund has been in operation.
Based on these and other considerations, the Trustees: (1) concluded that the fees paid to the Manager and the subadvisor under the Management and Investment Advisory Agreements are fair and reasonable; and (2) determined that the Value Fund and its shareholders would benefit from the Manager’s and subadvisor’s continued management of the Value Fund.
64
Trustees and Officers of the American Beacon FundsSM (Unaudited)
The Trustees and officers of the American Beacon Funds (the “Trust”) are listed below, together with their principal occupations during the past five years. The address of each person listed below is 220 Las Colinas Boulevard East, Suite 1200, Irving, Texas 75039. Each Trustee oversees thirty-six funds in the fund complex that includes the Trust, the American Beacon Select Funds, the American Beacon Institutional Funds Trust, the American Beacon Sound Point Enhanced Income Fund, and the American Beacon Apollo Total Return Fund. The Trust’s Statement of Additional Information contains additional information about the Trustees and is available without charge by calling 1-800-658-5811.
Name, Age and Address | Position, Term of Office and Length of Time Served with the Trust | Principal Occupation(s) During Past 5 Years and Current Directorships | ||
| INTERESTED TRUSTEES | Term | |||
Lifetime of Trust until removal, resignation or retirement* | ||||
| Alan D. Feld** (81) | Trustee since 1996 | Partner in the law firm of Akin, Gump, Strauss, Hauer & Feld, LLP (law firm) (1960-Present); Trustee, American Beacon Mileage Funds (1996-2012); Trustee, American Beacon Select Funds (1999-Present); Trustee, American Beacon Master Trust (1996-2012); Trustee, American Beacon Institutional Funds Trust (2017-Present); Trustee, American Beacon Sound Point Enhanced Income Fund (2018-Present); Trustee, American Beacon Apollo Total Return Fund (2018-Present). | ||
| NON-INTERESTED | Term | |||
| TRUSTEES | Lifetime of Trust until removal, resignation or retirement* | |||
| Gilbert G. Alvarado (48) | Trustee since 2015 | Director, Kura MD, Inc. (local telehealth organization) (2015-present); Vice President & CFO, Sierra Health Foundation (health conversion private foundation) (2006-Present); Vice President & CFO, Sierra Health Foundation: Center for Health Program Management (California public benefit corporation) (2012-Present); Director, Innovative North State (2012-2015); Director, Sacramento Regional Technology Alliance (2011-2016); Director, Women’s Empowerment (2009-2014); Director, Valley Healthcare Staffing (2017-present); Trustee, American Beacon Select Funds (2015-Present); Trustee, American Beacon Institutional Funds Trust (2017-Present); Trustee, American Beacon Sound Point Enhanced Income Fund (2018-Present); Trustee, American Beacon Apollo Total Return Fund (2018-Present). | ||
| Joseph B. Armes (56) | Trustee since 2015 | Chairman & CEO, CSW Industrials f/k/a Capital Southwest Corporation (investment company) (2015-Present); Chairman of the Board of Capital Southwest Corporation, predecessor to CSW Industrials, Inc. (2014-present) (investment company); CEO, Capital Southwest Corporation (2013-2015); President & CEO, JBA Investment Partners (family investment vehicle) (2010-Present); Director and Chair of Audit Committee, RSP Permian (oil and gas producer) (2013-Present); Trustee, American Beacon Select Funds (2015-Present); Trustee, American Beacon Institutional Funds Trust (2017-Present); Trustee, American Beacon Sound Point Enhanced Income Fund (2018-Present); Trustee, American Beacon Apollo Total Return Fund (2018-Present). | ||
| Gerard J. Arpey (60) | Trustee since 2012 | Director, The Home Depot, Inc. (2015-Present); Partner, Emerald Creek Group (private equity firm) (2011-Present); Director, S.C. Johnson & Son, Inc. (privately held company) (2008-present); Trustee, American Beacon Select Funds (2012-Present); Trustee, American Beacon Institutional Funds Trust (2017-Present); Trustee, American Beacon Sound Point Enhanced Income Fund (2018-Present); Trustee, American Beacon Apollo Total Return Fund (2018-Present). | ||
65
Trustees and Officers of the American Beacon FundsSM (Unaudited)
Name, Age and Address | Position, Term of Office and Length of Time Served with the Trust | Principal Occupation(s) During Past 5 Years and Current Directorships | ||
| TRUSTEES (CONT.) | Term | |||
Lifetime of Trust until removal, resignation or retirement* | ||||
| Brenda A. Cline (57) | Trustee since 2004 | Chief Financial Officer, Treasurer and Secretary, Kimbell Art Foundation (1993-Present); Director, Tyler Technologies, Inc. (public sector software solutions company) (2014-Present); Director, Range Resources Corporation (oil and natural gas company) (2015-Present); Trustee, Cushing Closed-End Funds (2017-Present); Trustee, American Beacon Mileage Funds (2004-2012); Trustee, American Beacon Select Funds (2004-Present); Trustee, American Beacon Master Trust (2004-2012); Trustee, American Beacon Institutional Funds Trust (2017-Present); Trustee, American Beacon Sound Point Enhanced Income Fund (2018-Present); Trustee, American Beacon Apollo Total Return Fund (2018-Present). | ||
| Eugene J. Duffy (63) | Trustee since 2008 | Managing Director, Global Investment Management Distribution, Mesirow Financial (2016-Present); Managing Director, Institutional Services, Intercontinental Real Estate Corporation (2014-Present); Principal and Executive Vice President, Paradigm Asset Management (1994-2014); Director, Sunrise Bank of Atlanta (2008-2013); Trustee, American Beacon Mileage Funds (2008-2012); Trustee, American Beacon Select Funds (2008-Present); Trustee, American Beacon Master Trust (2008-2012); Trustee, American Beacon Institutional Funds Trust (2017-Present); Trustee, American Beacon Sound Point Enhanced Income Fund (2018-Present); Trustee, American Beacon Apollo Total Return Fund (2018-Present). | ||
| Claudia A. Holz*** (60) | Trustee since 2018 | Partner, KPMG LLP (1990-2017); Trustee, American Beacon Select Funds (2018-Present); Trustee, American Beacon Institutional Funds Trust (2018-Present); Trustee, American Beacon Sound Point Enhanced Income Fund (2018-Present); Trustee, American Beacon Apollo Total Return Fund (2018-Present). | ||
| Douglas A. Lindgren**** (56) | Trustee since 2018 | CEO North America, Carne Global Financial Services (2016-2017); Managing Director, IPS Investment Management and Global Head, Content Management, UBS Wealth Management (2010-2016); Managing Director, P&S Hedge Funds, UBS Wealth Management (2008-2010); Managing Director, Head of Alternative Investments, UBS Financial Services, Inc. (2005-2008); Trustee, American Beacon Select Funds (2018-Present); Trustee, American Beacon Institutional Funds Trust (2018-Present); Trustee, American Beacon Sound Point Enhanced Income Fund (2018-Present); Trustee, American Beacon Apollo Total Return Fund (2018-Present). | ||
| Richard A. Massman (74) | Trustee since 2004 Chairman since 2008 | Consultant and General Counsel Emeritus, Hunt Consolidated, Inc. (holding company engaged in oil and gas exploration and production, refining, real estate, farming, ranching and venture capital activities) (2009-Present); Trustee, American Beacon Mileage Funds (2004-2012); Trustee, American Beacon Select Funds (2004-Present); Trustee, American Beacon Master Trust (2004-2012); Trustee, American Beacon Institutional Funds Trust (2017-Present); Trustee, American Beacon Sound Point Enhanced Income Fund (2018-Present); Trustee, American Beacon Apollo Total Return Fund (2018-Present). | ||
| Barbara J. McKenna, CFA (55) | Trustee since 2012 | Managing Principal, Longfellow Investment Management Company (2005-Present); Trustee, American Beacon Select Funds (2012-Present); Trustee, American Beacon Institutional Funds Trust (2017-Present); Trustee, American Beacon Sound Point Enhanced Income Fund (2018- Present); Trustee, American Beacon Apollo Total Return Fund (2018- Present). | ||
66
Trustees and Officers of the American Beacon FundsSM (Unaudited)
Name, Age and Address | Position, Term of Office and Length of Time Served with the Trust | Principal Occupation(s) During Past 5 Years and Current Directorships | ||
| TRUSTEES (CONT.) | Term | |||
Lifetime of Trust until removal, resignation or retirement* | ||||
| R. Gerald Turner (72) | Trustee since 2001 | President, Southern Methodist University (1995-Present); Director, J.C. Penney Company, Inc. (1996-Present); Director, Kronus Worldwide Inc. (chemical manufacturing) (2003-Present); Trustee, American Beacon Mileage Funds (2001-2012); Trustee, American Beacon Select Funds (2001-Present); Trustee, American Beacon Master Trust (2001-2012); Trustee, American Beacon Institutional Funds Trust (2017-Present); Trustee, American Beacon Sound Point Enhanced Income Fund (2018-Present); Trustee, American Beacon Apollo Total Return Fund (2018-Present). | ||
| OFFICERS | Term | |||
| One Year | ||||
| Gene L. Needles, Jr. (63) | President since 2009 | CEO and Director (2009-Present), and Chairman (2018-Present), American Beacon Advisors, Inc.; President, American Beacon Advisors (2009-2018); Chairman and CEO, Resolute Investment Managers, Inc. (2015-Present); Director, Resolute Acquisition, Inc. (2015-Present); President (2015-2018), Director, Resolute Topco, Inc. (2015-Present), President (2015-2018), CEO (2015-Present), and Chairman (2018-Present), Resolute Investment Holdings, LLC; President, CEO and Director, Lighthouse Holdings, Inc. (2009-2015); President and CEO, Lighthouse Holdings Parent, Inc. (2009-2015); Manager, President and CEO, American Private Equity Management, LLC (2012-Present); President, American Beacon Cayman Managed Futures Strategy Fund, Ltd. (2014-Present); Director, Chairman, President and CEO, Alpha Quant Advisors, LLC (2016-Present); Director, ARK Investment Management LLC (2016-Present); Director, Shapiro Capital Management LLC (2017-Present); Director and Vice President, American Beacon Cayman Transformational Innovation Company, LTD., (2017-Present); Vice President, American Beacon Delaware Transformational Innovation Corporation (2017-Present); Executive Vice President and Chief Operating Officer, Continuous Capital, LLC (2018-Present); Member, Investment Advisory Committee, Employees Retirement System of Texas (2017-Present); Trustee, American Beacon NextShares Trust (2015-Present); President, American Beacon Select Funds (2009-Present); President, American Beacon Mileage Funds (2009-2012); President, American Beacon Master Trust (2009-2012); President, American Beacon Institutional Funds Trust (2017-Present); President, American Beacon Sound Point Enhanced Income Fund (2018- Present); President, American Beacon Apollo Total Return Fund (2018-Present). | ||
67
Trustees and Officers of the American Beacon FundsSM (Unaudited)
Name, Age and Address | Position, Term of Office and Length of Time Served with the Trust | Principal Occupation(s) During Past 5 Years and Current Directorships | ||
| OFFICERS (CONT.) | Term | |||
One Year | ||||
| Rosemary K. Behan (59) | VP, Secretary and Chief Legal Officer since 2006 | Vice President and Secretary, American Beacon Advisors, Inc. (2006-Present); Secretary, Resolute Investment Holdings, LLC (2015-Present) Secretary, Resolute Investment Managers, Inc. (2015-Present); Secretary, Resolute Topco, Inc. (2015-Present); Secretary, Resolute Acquisition, Inc. (2015-Present); Secretary, Lighthouse Holdings, Inc. (2008-2015); Secretary, Lighthouse Holdings Parent, Inc. (2008-2015); Secretary, American Private Equity Management, LLC (2008-Present); Secretary, American Beacon Cayman Managed Futures Strategy Fund, Ltd. (2014-Present); Secretary, Alpha Quant Advisors, LLC (2016-Present); Secretary, American Beacon Cayman Transformational Innovation Company, Ltd. (2017-Present); Secretary, American Beacon Delaware Transformational Innovation Corporation (2017-Present); Secretary, Resolute Investment Distributors, Inc. (2017-Present); Vice President and Secretary, Continuous Capital, LLC (2018-Present); Chief Legal Officer, Vice President and Secretary, American Beacon Select Funds (2006-Present); Chief Legal Officer, Vice President and Secretary, American Beacon Mileage Funds (2006-2012); Chief Legal Officer, Vice President and Secretary, American Beacon Master Trust (2006-2012); Chief Legal Officer, Vice President and Secretary, American Beacon Institutional Funds Trust (2017-Present); Vice Chief Legal Officer, Vice President and Secretary, American Beacon Sound Point Enhanced Income Fund (2018-Present); Chief Legal Officer, Vice President and Secretary American Beacon Apollo Total Return Fund (2018-Present). | ||
| Brian E. Brett (58) | VP since 2004 | Senior Vice President (2012-Present) and Vice President (2004-2012), American Beacon Advisors, Inc.; Vice President, Resolute Investment Distributors, Inc. (2017-Present); Vice President, American Beacon Select Funds (2004-Present); Vice President, American Beacon Mileage Funds (2004-2012); Vice President, American Beacon Master Trust (2004-2012); Vice President, American Beacon Institutional Funds Trust (2017-Present); Vice President American Beacon Sound Point Enhanced Income Fund (2018-Present); Vice President American Beacon Apollo Total Return Fund (2018-Present). | ||
| Paul B. Cavazos(49) | VP since 2016 | Chief Investment Officer and Senior Vice President, American Beacon Advisors, Inc. (2016-Present); Chief Investment Officer and Assistant Treasurer, DTE Energy (2007-2016); Vice President, American Beacon Select Funds (2016-Present); Vice President, American Beacon Institutional Funds Trust (2017-Present); Vice President American Beacon Sound Point Enhanced Income Fund (2018-Present); Vice President American Beacon Apollo Total Return Fund (2018-Present). | ||
| Erica Duncan (47) | VP Since 2011 | Vice President, American Beacon Advisors, Inc. (2011-Present); Vice President, American Beacon Select Funds (2011-Present); Vice President, American Beacon Mileage Funds (2011-2012); Vice President, American Beacon Master Trust (2011-2012); Vice President, American Beacon Institutional Funds Trust (2017-Present); Vice President American Beacon Sound Point Enhanced Income Fund (2018-Present); Vice President American Beacon Apollo Total Return Fund (2018-Present).. | ||
68
Trustees and Officers of the American Beacon FundsSM (Unaudited)
Name, Age and Address | Position, Term of Office and Length of Time Served with the Trust | Principal Occupation(s) During Past 5 Years and Current Directorships | ||
| OFFICERS (CONT.) | Term | |||
One Year | ||||
| Melinda G. Heika (57) | Treasurer since 2010 | Treasurer, American Beacon Advisors, Inc. (2010-Present); Resolute Investment Managers, Inc. (2015-Present); Treasurer, Resolute Acquisition, Inc. (2015-Present); Treasurer, Resolute Topco, Inc. (2015-Present); Treasurer, Resolute Investment Holdings, LLC. (2015-Present); Treasurer, Lighthouse Holdings, Inc. (2010-2015); Treasurer, Lighthouse Holdings Parent Inc., (2010-2015); Treasurer, American Private Equity Management, LLC (2012-Present); Director and Treasurer, American Beacon Cayman Managed Futures Strategy Fund, Ltd. (2014-Present); Treasurer, Alpha Quant Advisors, LLC (2016-Present); Treasurer, American Beacon Cayman Transformational Innovation, Ltd. (2017-Present); Treasurer, American Beacon Delaware Transformational Innovation Corporation (2017-Present); Treasurer, Resolute Investment Distributors, Inc. (2017-2017); Treasurer and Chief Financial Officer, Continuous Capital, LLC (2018-Present); Treasurer, American Beacon Select Funds (2010-Present); Treasurer, American Beacon Mileage Funds (2010-2012); Treasurer, American Beacon Master Trust (2010-2012); Treasurer, American Beacon Institutional Funds Trust (2017-Present); Treasurer, American Beacon Sound Point Enhanced Income Fund (2018-Present); Treasurer, American Beacon Apollo Total Return Fund (2018-Present). | ||
| Terri L. McKinney (54) | VP since 2010 | Vice President (2009-Present) and Managing Director (2003-2009), American Beacon Advisors, Inc.; Vice President, Resolute Investment Managers, Inc. (2017-Present); Vice President, Alpha Quant Advisors, LLC (2016-Present); Vice President, Resolute Investment Managers, Inc. (2017-Present); Vice President, Continuous Capital, LLC (2018-Present); Vice President, American Beacon Select Funds (2010-Present); Vice President, American Beacon Mileage Funds (2010-2012); Vice President, American Beacon Master Trust (2010-2012); Vice President, American Beacon Institutional Funds Trust (2017-Present); Vice President, American Beacon Sound Point Enhanced Income Fund (2018-Present); Vice President, American Beacon Apollo Total Return Fund (2018-Present). | ||
69
Trustees and Officers of the American Beacon FundsSM (Unaudited)
Name, Age and Address | Position, Term of Office and Length of Time Served with the Trust | Principal Occupation(s) During Past 5 Years and Current Directorships | ||
| OFFICERS (CONT.) | Term | |||
One Year | ||||
| Jeffrey K. Ringdahl (43) | VP since 2010 | Chief Operating Officer (2010-Present), Vice President (2010-2013), Senior Vice President (2013-Present), Director (2015-Present), and President (2018-Present), American Beacon Advisors, Inc.; Vice President (2012-Present) and Manager (2015-Present), American Private Equity Management, LLC; Senior Vice President, Lighthouse Holdings, Inc. (2013-2015); Senior Vice President, Lighthouse Holdings Parent, Inc. (2013-2015); Director and Vice President, American Beacon Cayman Managed Futures Strategy Fund, Ltd. (2014-Present); Trustee, American Beacon NextShares Trust (2015-Present); Director (2015-Present), Senior Vice Present(2015-2018), and President (2018-Present), Resolute Investment Holdings, LLC; Director (2015-Present), Senior Vice President (2015-2018) and President (2018-Present), Resolute Topco, Inc.; Director (2015-Present), Senior Vice President (2015-Present), and President (2018-Present), Resolute Acquisition, Inc.; Director (2015-Present), Senior Vice President (2015-2018), and President (2018-Present), Resolute Investment Managers, Inc.; Director, Executive Vice President and Chief Operating Officer, Alpha Quant Advisors, LLC (2016-Present); Director (2017-Present), Executive Vice President (2017-2018), and President (2018-Present), Resolute Investment Services, Inc.; Director and Executive Vice President, Resolute Investment Distributors, Inc. (2017-Present); Director, Shapiro Capital Management, LLC (2017-Present); Director and Vice President, American Beacon Cayman Transformational Innovation Company, LTD., (2017-Present); Vice President, American Beacon Delaware Transformational Innovation Corporation (2017-Present); Executive Vice President and Chief Operating Officer, Continuous Capital, LLC (2018-Present); Vice President, American Beacon Select Funds (2010-Present); Vice President, American Beacon Institutional Funds Trust (2017-Present); Vice President, American Beacon Sound Point Enhanced Income Fund (2018-Present); Vice President, American Beacon Apollo Total Return Fund (2018-Present) | ||
| Samuel J. Silver (55) | VP Since 2011 | Vice President, American Beacon Advisors, Inc. (2011-Present); Vice President, American Beacon Select Funds (2011-Present); Vice President, American Beacon Mileage Funds (2011-2012); Vice President, American Beacon Master Trust (2011-2012); American Beacon Institutional Funds Trust (2011-Present); Vice President, American Beacon Sound Point Enhanced Income Fund (2018-Present); Vice President, American Beacon Apollo Total Return Fund (2018-Present). | ||
| Christina E. Sears (46) | Chief Compliance Officer since 2004 and Asst. Secretary since 1999 | Chief Compliance Officer, American Beacon Advisors, Inc. (2004-Present); Chief Compliance Officer, American Private Equity Management, LLC (2012-Present); Chief Compliance Officer and Vice President, Alpha Quant Advisors, LLC (2016-Present); Vice President, Resolute Investment Managers, Inc. (2017-Present); Vice President, Continuous Capital, LLC (2018-Present); Chief Compliance Officer (2004-Present) and Assistant Secretary (1999-Present), American Beacon Select Funds; Chief Compliance Officer (2004-2012) and Assistant Secretary (1999-2012), American Beacon Mileage Funds; Chief Compliance Officer (2004-2012) and Assistant Secretary (1999-2012), American Beacon Master Trust; Chief Compliance Officer and Assistant Secretary, American Beacon Institutional Funds Trust (2017-Present); Chief Compliance Officer and Assistant Secretary, American Beacon Sound Point Enhanced Income Fund (2018-Present); Chief Compliance Officer and Assistant Secretary, American Beacon Apollo Total Return Fund (2018-Present). | ||
70
Trustees and Officers of the American Beacon FundsSM (Unaudited)
Name, Age and Address | Position, Term of Office and Length of Time Served with the Trust | Principal Occupation(s) During Past 5 Years and Current Directorships | ||
| OFFICERS (CONT.) | Term | |||
| One Year | ||||
| Sonia L. Bates (61) | Asst. Treasurer since 2011 | Assistant Treasurer, American Beacon Advisors, Inc. (2011-Present); Assistant Treasurer, Resolute Investment Managers, Inc. (2015-Present); Assistant Treasurer, Resolute Acquisition, Inc. (2015-Present); Assistant. Treasurer, Resolute Topco, Inc. (2015-Present); Assistant Treasurer, Resolute Investment Holdings, LLC.; Assistant Treasurer, Lighthouse Holdings, Inc. (2011-2015); Assistant Treasurer, Lighthouse Holdings Parent Inc. (2011-2015); Assistant Treasurer, American Private Equity Management, LLC (2012-Present); Assistant Treasurer, American Beacon Cayman Transformational Innovation Company, Ltd. (2017-Present); Assistant Treasurer, American Beacon Select Funds (2011-Present); Assistant Treasurer American Beacon Mileage Funds (2011-2012); Assistant Treasurer, American Beacon Master Trust (2011-2012); Assistant Treasurer, American Beacon Institutional Funds Trust (2017-Present); Assistant Treasurer, American Beacon Sound Point Enhanced Income Fund (2018-Present); Assistant Treasurer, American Beacon Apollo Total Return Fund (2018-Present). | ||
| Shelley D. Abrahams (43) | Assistant Secretary since 2008 | Assistant Secretary, American Beacon Advisors, Inc. (2008-Present); Assistant Secretary, American Beacon Select Funds (2008-Present); Assistant Secretary, American Beacon Mileage Funds (2008-2012); Assistant Secretary, American Beacon Master Trust (2008-2012); Assistant Secretary, American Beacon Institutional Funds Trust (2017-Present); Assistant Secretary, American Beacon Sound Point Enhanced Income Fund (2018-Present); Assistant Secretary, American Beacon Apollo Total Return Fund (2018-Present). | ||
| Rebecca L. Harris (51) | Assistant Secretary since 2010 | Vice President, American Beacon Advisors, Inc. (2016-Present); Vice President, Resolute Investment Managers, Inc. (2017-Present); Vice President, Alpha Quant Advisors, LLC (2016-Present); Vice President, Continuous Capital, LLC (2018-Present); Assistant Secretary, American Beacon Select Funds (2010-Present); Assistant Secretary, American Beacon Mileage Funds (2010-2012); Assistant Secretary, American Beacon Master Trust (2010-2012); Assistant Secretary, American Beacon Institutional Funds Trust (2017-Present); Assistant Secretary, American Beacon Sound Point Enhanced Income Fund (2018-Present); Assistant Secretary, American Beacon Apollo Total Return Fund (2018-Present). | ||
| Diana N. Lai (42) | Assistant Secretary since 2012 | Assistant Secretary, American Beacon Advisors, Inc. (2012-Present); Assistant Secretary, American Beacon Cayman Transformational Innovation Company, Ltd. (2017-Present); Assistant Secretary, American Beacon Select Funds (2012-Present); Assistant Secretary, American Beacon Institutional Funds Trust (2017-Present); Assistant Secretary, American Beacon Sound Point Enhanced Income Fund (2018-Present); Assistant Secretary, American Beacon Apollo Total Return Fund (2018-Present). | ||
| Teresa A. Oxford (59) | Assistant Secretary since 2015 | Assistant Secretary, American Beacon Advisors, Inc. (2015-Present); Assistant Secretary, Alpha Quant Advisors, LLC (2016-Present); Assistant Secretary, American Beacon Select Funds (2015-Present); Assistant Secretary, American Beacon Institutional Funds Trust (2017-Present); Assistant Secretary, American Beacon Sound Point Enhanced Income Fund (2018-Present); Assistant Secretary, American Beacon Apollo Total Return Fund (2018-Present). | ||
* As of 11/12/2014, the Board adopted a retirement plan that requires Trustees to retire no later than the last day of the calendar year in which they reach the age of 75.
** Mr. Feld is deemed to be an “interested person” of the Trusts, as defined by the 1940 Act. Mr. Feld’s law firm of Akin, Gump, Strauss, Hauer & Feld LLP has provided legal services within the past two fiscal years to one or more of the Trust’s sub-advisors.
*** Claudia A. Holz became a new Trustee to each of the Trusts on 4/1/2018.
**** Douglas A. Lindren became a new Trustee to each of the Trusts on 1/1/2018.
71
American Beacon FundsSM
June 30, 2018 (Unaudited)
The American Beacon Funds recognize and respect the privacy of our shareholders. We are providing this notice to you so you will understand how shareholder information may be collected and used.
We may collect nonpublic personal information about you from one or more of the following sources:
| • | information we receive from you on applications or other forms; |
| • | information about your transactions with us or our service providers; and |
| • | information we receive from third parties. |
We do not disclose any nonpublic personal information about our customers or former customers to anyone, except as permitted by law.
We restrict access to your nonpublic personal information to those employees or service providers who need to know that information to provide products or services to you. To ensure the confidentiality of your nonpublic personal information, we maintain safeguards that comply with federal standards.
72

Delivery of Documents
eDelivery is NOW AVAILABLE - Stop traditional mail delivery and receive your
shareholder reports and summary prospectus on-line. Sign up at
www.americanbeaconfunds.com
If you invest in the Fund through a financial institution, you may be able to receive the Fund’s regulatory mailings, such as the Prospectus, Annual Report and Semi-Annual Report, by e-mail. If you are interested in this option, please go to www.icsdelivery.com and search for your financial institution’s name or contact your financial institution directly.
To obtain more information about the Fund:
 |  | |
| By E-mail: | On the Internet: | |
| american_beacon.funds@ambeacon.com | Visit our website at www.americanbeaconfunds.com | |
By Telephone: Call (800) 658-5811 |
By Mail: American Beacon Funds P.O. Box 219643 Kansas City, MO 64121-9643 | |
| Availability of Quarterly Portfolio Schedules | Availability of Proxy Voting Policy and Records | |
| In addition to the Schedule of Investments provided in each semi-annual and annual report, the Fund files a complete schedule of its portfolio holdings with the Securities and Exchange Commission (“SEC”) on Form N-Q as of the first and third fiscal quarters. The Fund’s Forms N-Q are available on the SEC’s website at www.sec.gov. The Forms N-Q may also be reviewed and copied at the SEC’s Public Reference Section, 100 F Street, NE, Washington, D.C. 20549-2736. Information regarding the operation of the SEC’s Public Reference Room may be obtained by calling (800)-SEC-0330. A complete schedule of the Fund’s portfolio holdings is also available at www.americanbeaconfunds.com approximately twenty days after the end of each month. | A description of the policies and procedures the Fund uses to determine how to vote proxies relating to portfolio securities is available in the Fund’s Statement of Additional Information, is available free of charge on the Fund’s website www.americanbeaconfunds.com and by calling 1-800-967-9009 or by accessing the SEC’s website at www.sec.gov. The Fund’s proxy voting record for the most recent year ended June 30 is filed annually with the SEC on Form N-PX. The Fund’s Forms N-PX are available on the SEC’s website at www.sec.gov. The Fund’s proxy voting record may also be obtained by calling 1-800-967-9009. | |


Fund Service Providers:
CUSTODIAN State Street Bank and Trust Boston, Massachusetts | TRANSFER AGENT DST Asset Manager Solutions, Inc. Quincy, Massachusetts | INDEPENDENT REGISTERED PUBLIC ACCOUNTING FIRM PricewaterhouseCoopers LLP Boston, Massachusetts | DISTRIBUTOR Resolute Investment Distributors, Inc. Irving, Texas |
This report is prepared for shareholders of the American Beacon Funds and may be distributed to others only if preceded or accompanied by a current Prospectus or Summary Prospectus.
American Beacon Funds, American Beacon Alpha Quant Core Fund, American Beacon Alpha Quant Dividend Fund, American Beacon Alpha Quant Quality Fund, and American Beacon Alpha Quant Value Fund are service marks of American Beacon Advisors, Inc.
AR 6/18
About American Beacon Advisors
Since 1986, American Beacon Advisors has offered a variety of products and investment advisory services to numerous institutional and retail clients, including a variety of mutual funds, corporate cash management, and separate account management.
Our clients include defined benefit plans, defined contribution plans, foundations, endowments, corporations, financial planners, and other institutional investors. With American Beacon Advisors, you can put the experience of a multi-billion dollar asset management firm to work for your company.
ARK TRANSFORMATIONAL INNOVATION FUND
Because the Fund may invest in fewer issuers than a more diversified portfolio, the fluctuating value of a single holding may have a greater effect on the value of the Fund. Companies that the sub-advisor believes are capitalizing on disruptive innovation and developing technologies to displace older technologies or create new markets may not in fact do so. Investing in foreign securities may involve heightened risk due to currency fluctuations and economic and political risks. Regulatory changes may impair the Fund’s ability to qualify for federal income tax treatment as a regulated investment company, which could result in the Fund and shareholders incurring significant income tax expense. To the extent the Fund invests more heavily in particular sectors, its performance will be sensitive to factors affecting those sectors. Information Technology sector companies may face intense competition and rapid product obsolescence, have limited product lines, markets, financial resources or personnel, and lose patent, copyright and trademark protections. Investing in Health Care sector companies involves risk due to government regulations, product litigation, competitive forces, and loss of patent protection. Industrials sector companies are subject to risk due to changes in government regulations, world events, economic conditions, environmental damages, product liability claims and exchange rates. Please see the prospectus for a complete discussion of the Fund’s risks. There can be no assurances that the investment objectives of this Fund will be met.
Any opinions herein, including forecasts, reflect our judgment as of the end of the reporting period and are subject to change. Each advisor’s strategies and each Fund’s portfolio composition will change depending on economic and market conditions. This report is not a complete analysis of market conditions, and, therefore, should not be relied upon as investment advice. Although economic and market information has been compiled from reliable sources, American Beacon Advisors, Inc. makes no representation as to the completeness or accuracy of the statements contained herein.
American Beacon Funds | June 30, 2018 |
Contents
| 1 | ||||
| 2 | ||||
| 5 | ||||
| 7 | ||||
| 8 | ||||
| 11 | ||||
| 14 | ||||
| 32 | ||||
| 35 | ||||
Disclosure Regarding Approvals of the Management and Investment Advisory Agreements | 36 | |||
| 40 | ||||
| 47 | ||||
| Back Cover | ||||
 | Dear Shareholders,
Since 1986, American Beacon has endeavored to provide investors with a disciplined approach to realizing long-term investment goals: Institutional wisdom + earned alpha = enduring value.
u We believe institutional wisdom comes from having more than 30 years of experience as manager of one of the country’s largest pension plans. As a fiduciary, we have built an investment due-diligence and oversight infrastructure, which we leverage across all our investment products. When selecting our investment managers, we focus on their people, processes and performance. We perform due-diligence reviews with each investment manager on a quarterly basis.
u We believe earned alpha – that is, the returns of an actively managed fund beyond a benchmark – comes from employing and engaging |
| investment managers we believe are best-in-class and who have defined, repeatable and proven processes. Our experience has shown us that, while it’s important to be mindful of short-term considerations, having a long-term focus helps manage expectations, mitigate risks and realize goals. Thus, we seek relationships with leading investment managers who display a willingness to undertake time-intensive research strategies. The resulting investment portfolios are differentiated from their peers and allow incremental changes to help address periods of market volatility and economic uncertainty. |
| u | We believe enduring value comes from “putting a portfolio in place and sticking with the plan.” Our mutual funds provide you with access to institutional-quality, research-intensive investment managers with diverse processes and styles. In the long run, having such access and spending time in the market – rather than trying to time the market – may better position you to reach your long-term investment goals. |
The markets and U.S. economy were robust during calendar year 2017. However, during periods of market volatility and economic uncertainty – such as what we’ve seen thus far in 2018 – investing for the long term requires conviction. It isn’t about identifying and anticipating the next big market move. It’s about identifying the right investment products for riding out those moves. It’s about developing an approach based on long-term participation, while seeking some measure of protection against ongoing volatility.
As a manager of managers, we strive to provide investment products that may enable investors to participate during market upswings while potentially insulating against market downswings. Many of the sub-advisors to our mutual funds pursue upside capture and/or downside protection using proprietary strategies. The investment teams behind our mutual funds seek to produce consistent, long-term results rather than focus only on short-term movements in the markets. In managing our investment products, we emphasize identifying opportunities that offer the potential for high quality and lower risk.
At American Beacon, our approach is more than a concept. It’s the cornerstone of our culture. And we strive to apply it at every turn as we seek to provide a well-diversified line of investment products for your portfolio.
Thank you for your continued interest in American Beacon. For additional information about our investment products or to access your account information, please visit our website at www.americanbeaconfunds.com.
Best Regards,

Gene L. Needles, Jr.
President
American Beacon Funds
1
June 30, 2018 (Unaudited)
Equity markets produced solid returns for the 12-month period ended June 30, 2018, as the MSCI ACWI Index returned 10.73%. Benign market conditions persisted in the first half of the period as low inflation and moderate global growth drove equities higher. Early February 2018 marked the return of volatility as investors grappled with the prospect of a new regime led by the Federal Reserve’s potential acceleration of its rate-hiking cycle. Fears of a global trade war continued to swirl as the Trump administration announced tariffs on steel and aluminum imports.
In the U.S., 10 of 11 sectors within the S&P 500 Index produced positive returns for the period. The top performers were Information Technology (up 31.30%), Consumer Discretionary (up 23.55%) and Energy (up 20.99%). Lagging were the defensive sectors, including Consumer Staples (down 3.93%), Telecommunications Services (up 1.39%) and Utilities (up 3.41%). From a style standpoint, the performance differential between growth and value stocks was stark, demonstrated by the Russell 3000 Growth Index return of 22.47% versus the Russell 3000 Value Index return of 7.25%. From a capitalization perspective, small-cap stocks – represented by the Russell 2000 Index, returned 17.57% – outperformed large-cap stocks, represented by the S&P 500 Index, which returned 14.37%.
International developed markets lagged the U.S. over the period, but still produced positive returns as the MSCI EAFE Index was up 6.84%. In Europe, the top-performing countries were Norway and Portugal, represented by the MSCI Norway Index (up 27.11%) and the MSCI Portugal Index (up 15.75%), respectively. The laggards in Europe were Sweden and Spain, represented by the MSCI Sweden Index (down 4.64%) and the MSCI Spain Index (down 3.55%), respectively. In Japan, equities were up as the MSCI Japan Index returned 10.51%.
Finally, in the developing world, emerging markets began the period with strong returns, but the last few months were less kind as the strengthening dollar and trade-war rhetoric caused a pullback. For the full period, returns were still positive as the MSCI Emerging Market Index returned 8.20%. China, the largest country in the Index, returned 21.23% as represented by the MSCI China Index. Other notable strong markets include the MSCI Peru Index (up 30.70%) and MSCI Russia Index (up 25.97%). As Mexico’s presidential election approached and NAFTA negotiations continued, the equity market suffered due to uncertainty as the MSCI Mexico Index was down 9.28%. Turkey also had a difficult period as the currency was down significantly and the MSCI Turkey Index declined -26.34%.
2
American Beacon ARK Transformational Innovation FundSM
Performance Overview
June 30, 2018 (Unaudited)
The Investor Class of the American Beacon ARK Transformational Innovation Fund (the “Fund”) returned 49.28% for the twelve months ended June 30, 2018. The Fund outperformed the S&P 500 Index (the “Index”) return of 14.37% for the same period.
Comparison of Changes in Value of a $10,000 Investment for the period 1/27/2017 through 6/30/2018
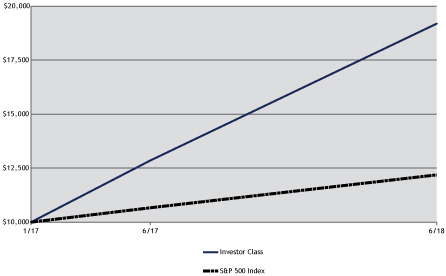
| Total Returns for the Period ended June 30, 2018 | ||||||||||||||||||||
Ticker | 1 Year | Since Inception | Value of $10,000 01/27/2017- 06/30/2018 | |||||||||||||||||
Institutional Class (1,3) | ADNIX | 49.76 | % | 58.64 | % | $ | 19,273.54 | |||||||||||||
Y Class (1,3) | ADNYX | 49.52 | % | 58.46 | % | $ | 19,243.27 | |||||||||||||
Investor Class (1,3) | ADNPX | 49.28 | % | 58.11 | % | $ | 19,182.34 | |||||||||||||
S&P 500 Index (2) | 14.37 | % | 14.94 | % | $ | 12,189.10 | ||||||||||||||
| 1. | Performance shown is historical and is not indicative of future returns. Investment returns and principal value will vary, and shares may be worth more or less at redemption than at original purchase. Performance shown is calculated based on the published end of day net asset values as of the date indicated and current performance may be lower or higher than the performance data quoted. To obtain performance as of the most recent month end, please visit www.americanbeaconfunds.com or call 1-800-967-9009. Fund performance in the table above does not reflect the deduction of taxes a shareholder would pay on distributions or the redemption of shares. Generally accepted accounting principles require adjustments to be made to the net assets of the Fund at period end for financial reporting purposes only; and as such, the total return based on the unadjusted net asset value per share may differ from the total return reported in the financial highlights. A portion of the fees charged to each Class of the Fund has been waived since Fund inception. Performance prior to waiving fees was lower than the actual returns shown since inception. The strategy employed by the Fund’s sub-advisor has the potential for more volatility than broad market averages, which may result in significant fluctuations in the Fund’s short-term returns, both positive and negative. Please note that the recent performance of the securities market has helped produce short-term returns that are not typical and may not continue in the future. |
| 2. | The S&P 500 Index is an unmanaged index of common stocks publicly traded in the United States. The S&P 500 Index is a product of S&P Dow Jones Indices LLC, a division of S&P Global or its affiliates (“SPDJI”), and has been licensed for use by American Beacon Advisors. Standard & Poor’s® and S&P® are registered trademarks of Standard & Poor’s Financial Services LLC, a division of S&P Global (“S&P”). Dow Jones® is a registered trademark of Dow Jones Trademark Holdings LLC (“Dow Jones”). The American Beacon ARK Transformational Innovation Fund is not sponsored, endorsed, sold or promoted by SPDJI, Dow Jones, S&P or their respective affiliates, and none of such parties make any representation regarding the advisability of investing in such product(s) nor do they have any liability for any errors, omissions or interruptions of the S&P 500 Index. One cannot directly invest in an index. |
| 3. | The Total Annual Fund Operating Expense ratios set forth in the most recent Fund prospectus for the Institutional, Y and Investor Class shares was 3.25%, 3.35% and 3.63%, respectively. The expense ratios above may vary from the expense ratios presented in other sections of this report that are based on expenses incurred during the period covered by this report. |
3
American Beacon ARK Transformational Innovation FundSM
Performance Overview
June 30, 2018 (Unaudited)
The Fund’s outperformance relative to the Index was mostly attributable to holdings in Biotechnology and Information Technology. At the beginning of the period, the Fund increased its holdings in the genomics space as Health Care stocks broadly succumbed to election year rhetoric around drug pricing as well as the post-election surge in generic drug approvals. Among the biggest movers throughout the period were Kite Pharma (up 72.4%), who agreed to a takeover by Gilead, which benefited other CAR-T technology (an immunotherapy that unleashes a patient’s own immune system against metastatic cancer) players including Juno Therapeutics (up 185.2%) and Bluebird Bio (up 53.9%). CRISPR (Clustered Regularly Interspaced Short Palindromic Repeats) genome-editing technology has taken the scientific community by storm by revolutionizing the pace of biological breakthroughs, and companies associated with this have benefited tremendously. Intellia Therapeutics (up 97.6%) had positive results from their one-year animal study that showcased their advancements in genome editing, getting them one step closer to developing medicine that could cure diseases now considered incurable. In the Information Technology sector, Twitter (up 137.2%) benefited from continued growth in Daily Active Users (DAUs), thanks to faster product execution, original streaming videos, and sustained user growth.
The portfolio benefited from sector allocation as well. Having a significant overweight to Information Technology, which was the best performing sector within the Index (up 31.2%), and having a null weight in the Consumer Staples sector, the worst performing sector within the Index (down 4.6%), contributed positively to relative returns.
On the negative side, within the Financials sector, Lending Club (down 39.0%) lowered near-term guidance and applied new algorithms to its data while cutting back on loans at the end of the prime category. Within the Information Technology sector, Stratasys (down 18.9%) also struggled after reporting weaker than expected printer sales and the resignation of its CEO.
The sub-advisor will continue to focus on identifying companies best positioned for long-term exponential growth and capital appreciation created by disruptive innovation.
| Top Ten Holdings (% Net Assets) |
| |||||||
| Tesla, Inc. | 7.7 | |||||||
| Intellia Therapeutics, Inc. | 7.1 | |||||||
| Stratasys Ltd. | 6.3 | |||||||
| Twitter, Inc. | 5.3 | |||||||
| Illumina, Inc. | 4.2 | |||||||
| Baidu, Inc., Sponsored ADR | 3.3 | |||||||
| Editas Medicine, Inc. | 3.3 | |||||||
| athenahealth, Inc. | 3.3 | |||||||
| Square, Inc., Class A | 3.0 | |||||||
| Invitae Corp. | 3.0 | |||||||
| Total Fund Holdings | 49 | |||||||
| Sector Allocation (% Investments) |
| |||||||
| Information Technology | 39.5 | |||||||
| Health Care | 37.5 | |||||||
| Consumer Discretionary | 16.9 | |||||||
| Financials | 4.5 | |||||||
| Real Estate | 1.2 | |||||||
| Industrials | 0.2 | |||||||
| Telecommunication Services | 0.2 | |||||||
4
American Beacon ARK Transformational Innovation FundSM
Expense Examples
June 30, 2018 (Unaudited)
Fund Expense Example
As a shareholder of a Fund, you incur two types of costs: (1) transaction costs, including sales charges (loads) on purchase payments and redemption fees, if applicable, and (2) ongoing costs, including management fees, distribution (12b-1) fees, sub-transfer agent fees, and other Fund expenses. The Examples are intended to help you understand the ongoing cost (in dollars) of investing in the Fund and to compare these costs with the ongoing costs of investing in other mutual funds. The Examples are based on an investment of $1,000 invested at the beginning of the period in each Class and held for the entire period from January 1, 2018 through June 30, 2018.
Actual Expenses
The “Actual” lines of the tables provide information about actual account values and actual expenses. You may use the information on this page, together with the amount you invested, to estimate the expenses that you paid over the period. Simply divide your account value by $1,000 (for example, an $8,600 account value divided by $1,000 = $8.60), then multiply the result by the “Expenses Paid During Period” to estimate the expenses you paid on your account during this period. Shareholders of the Investor and Institutional Classes that invest in the Fund through an IRA or Roth IRA may be subject to a custodial IRA fee of $15 that is typically deducted each December. If your account was subject to a custodial IRA fee during the period, your costs would have been $15 higher.
Hypothetical Example for Comparison Purposes
The “Hypothetical” lines of the tables provide information about hypothetical account values and hypothetical expenses based on the Fund’s actual expense ratio and an assumed 5% per year rate of return before expenses (not the Fund’s actual return). You may compare the ongoing costs of investing in the Fund with other funds by contrasting this 5% hypothetical example and the 5% hypothetical examples that appear in the shareholder reports of the other funds. The hypothetical account values and expenses may not be used to estimate the actual ending account balance or expenses you paid for the period. Shareholders of the Investor and Institutional Classes that invest in the Funds through an IRA or Roth IRA may be subject to a custodial IRA fee of $15 that is typically deducted each December. If your account was subject to a custodial IRA fee during the period, your costs would have been $15 higher.
You should also be aware that the expenses shown in the table highlight only your ongoing costs and do not reflect any transaction costs charged by the Fund, such as sales charges (loads) or redemption fees, as applicable. Similarly, the expense examples for other funds do not reflect any transaction costs charged by those funds, such as sales charges (loads), redemption fees or exchange fees. Therefore, the “Hypothetical” lines of the tables are useful in comparing ongoing costs only and will not help you determine the relative total costs of owning different funds. If you were subject to any transaction costs during the period, your costs would have been higher.
5
American Beacon ARK Transformational Innovation FundSM
Expense Examples
June 30, 2018 (Unaudited)
| American Beacon ARK Transformational Innovation Fund |
| ||||||||||||||
| Beginning Account Value 1/1/2018 | Ending Account Value 6/30/2018 | Expenses Paid During Period 1/1/2018-6/30/2018* | |||||||||||||
| Institutional Class | |||||||||||||||
| Actual | $1,000.00 | $1,145.30 | $5.53 | ||||||||||||
| Hypothetical** | $1,000.00 | $1,019.60 | $5.21 | ||||||||||||
| Y Class | |||||||||||||||
| Actual | $1,000.00 | $1,144.90 | $6.01 | ||||||||||||
| Hypothetical** | $1,000.00 | $1,019.20 | $5.66 | ||||||||||||
| Investor Class | |||||||||||||||
| Actual | $1,000.00 | $1,144.00 | $7.50 | ||||||||||||
| Hypothetical** | $1,000.00 | $1,017.80 | $7.05 | ||||||||||||
| * | Expenses are equal to the Fund’s annualized expense ratios for the six-month period of 1.04%, 1.13%, and 1.41% for the Institutional, Y, and Investor Classes, respectively, multiplied by the average account value over the period, multiplied by the number derived by dividing the number of days in the most recent fiscal half-year (181) by days in the year (365) to reflect the half-year period. |
| ** | 5% return before expenses. |
6
American Beacon ARK Transformational Innovation FundSM
Report of Independent Registered Public Accounting Firm
To the Board of Trustees of American Beacon Funds and Shareholders of American Beacon ARK Transformational Innovation Fund
Opinion on the Consolidated Financial Statements
We have audited the accompanying consolidated statement of assets and liabilities, including the consolidated schedule of investments, of American Beacon ARK Transformational Innovation Fund (one of the series constituting American Beacon Funds, referred to hereafter as the “Fund”) as of June 30, 2018, the related consolidated statement of operations for the year ended June 30, 2018, and the consolidated statement of changes in net assets and the financial highlights for the year ended June 30, 2018 and for the period January 27, 2017 (commencement of operations) through June 30, 2017, including the related notes (collectively referred to as the “financial statements”). In our opinion, the financial statements present fairly, in all material respects, the financial position of the Fund as of June 30, 2018, the results of its operations for the year ended June 30, 2018, and the changes in its net assets and the financial highlights for the year ended June 30, 2018 and for the period January 27, 2017 (commencement of operations) through June 30, 2017 in conformity with accounting principles generally accepted in the United States of America.
Basis for Opinion
These financial statements are the responsibility of the Fund’s management. Our responsibility is to express an opinion on the Fund’s financial statements based on our audits. We are a public accounting firm registered with the Public Company Accounting Oversight Board (United States) (“PCAOB”) and are required to be independent with respect to the Fund in accordance with the U.S. federal securities laws and the applicable rules and regulations of the Securities and Exchange Commission and the PCAOB.
We conducted our audits of these financial statements in accordance with the standards of the PCAOB. Those standards require that we plan and perform the audit to obtain reasonable assurance about whether the financial statements are free of material misstatement, whether due to error or fraud.
Our audits included performing procedures to assess the risks of material misstatement of the financial statements, whether due to error or fraud, and performing procedures that respond to those risks. Such procedures included examining, on a test basis, evidence regarding the amounts and disclosures in the financial statements. Our audits also included evaluating the accounting principles used and significant estimates made by management, as well as evaluating the overall presentation of the financial statements. Our procedures included confirmation of securities owned as of June 30, 2018 by correspondence with the custodian, transfer agent and broker; when replies were not received from brokers, we performed other auditing procedures. We believe that our audits provide a reasonable basis for our opinion.
Boston, MA
August 24, 2018
We have served as the auditor of one or more American Beacon investment companies since 2016.
7
American Beacon ARK Transformational Innovation FundSM
Consolidated Schedule of Investments
June 30, 2018
| Shares | Fair Value | ||||||||||||||
| COMMON STOCKS - 93.99% | |||||||||||||||
| Consumer Discretionary - 16.29% | |||||||||||||||
| Auto Components - 1.72% | |||||||||||||||
| Aptiv PLC | 4,589 | $ | 420,490 | ||||||||||||
|
| ||||||||||||||
| Automobiles - 7.70% | |||||||||||||||
| Tesla, Inc.A B | 5,484 | 1,880,738 | |||||||||||||
|
| ||||||||||||||
| Internet & Direct Marketing Retail - 6.75% | |||||||||||||||
| Amazon.com, Inc.A | 340 | 577,932 | |||||||||||||
| JD.com, Inc., ADRA | 12,795 | 498,365 | |||||||||||||
| Netflix, Inc.A | 1,468 | 574,619 | |||||||||||||
|
| ||||||||||||||
| 1,650,916 | |||||||||||||||
|
| ||||||||||||||
| Software - 0.12% | |||||||||||||||
| MGT Capital Investments, Inc.A | 38,644 | 28,964 | |||||||||||||
|
| ||||||||||||||
Total Consumer Discretionary | 3,981,108 | ||||||||||||||
|
| ||||||||||||||
| Financials - 2.11% | |||||||||||||||
| Consumer Finance - 2.11% | |||||||||||||||
| LendingClub Corp.A | 135,931 | 515,179 | |||||||||||||
|
| ||||||||||||||
| Health Care - 36.04% | |||||||||||||||
| Biotechnology - 20.77% | |||||||||||||||
| Bluebird Bio, Inc.A | 3,054 | 479,325 | |||||||||||||
| CRISPR Therapeutics AGA | 4,800 | 282,048 | |||||||||||||
| Editas Medicine, Inc.A | 22,371 | 801,553 | |||||||||||||
| Inovio Pharmaceuticals, Inc.A | 22,396 | 87,792 | |||||||||||||
| Intellia Therapeutics, Inc.A | 63,367 | 1,733,721 | |||||||||||||
| Invitae Corp.A B | 98,355 | 722,909 | |||||||||||||
| Organovo Holdings, Inc.A B | 131,786 | 184,501 | |||||||||||||
| Seres Therapeutics, Inc.A B | 36,375 | 312,825 | |||||||||||||
| Syros Pharmaceuticals, Inc.A | 17,643 | 180,135 | |||||||||||||
| Veracyte, Inc.A | 31,388 | 293,164 | |||||||||||||
|
| ||||||||||||||
| 5,077,973 | |||||||||||||||
|
| ||||||||||||||
| Health Care Equipment & Supplies - 1.72% | |||||||||||||||
| Cerus Corp.A | 63,256 | 421,918 | |||||||||||||
|
| ||||||||||||||
| Health Care Technology - 5.04% | |||||||||||||||
| athenahealth, Inc.A | 5,005 | 796,495 | |||||||||||||
| Medidata Solutions, Inc.A | 5,396 | 434,702 | |||||||||||||
|
| ||||||||||||||
| 1,231,197 | |||||||||||||||
|
| ||||||||||||||
| Life Sciences Tools & Services - 8.33% | |||||||||||||||
| Compugen Ltd.A B | 49,584 | 163,627 | |||||||||||||
| Illumina, Inc.A | 3,653 | 1,020,246 | |||||||||||||
| NanoString Technologies, Inc.A | 42,151 | 576,626 | |||||||||||||
| Pacific Biosciences of California, Inc.A B | 78,127 | 277,351 | |||||||||||||
|
| ||||||||||||||
| 2,037,850 | |||||||||||||||
|
| ||||||||||||||
| Pharmaceuticals - 0.18% | |||||||||||||||
| Bayer AG | 390 | 42,971 | |||||||||||||
|
| ||||||||||||||
Total Health Care | 8,811,909 | ||||||||||||||
|
| ||||||||||||||
| Industrials - 0.18% | |||||||||||||||
| Machinery - 0.18% | |||||||||||||||
| FANUC Corp. | 220 | 43,726 | |||||||||||||
|
| ||||||||||||||
| Information Technology - 38.04% | |||||||||||||||
| Internet Software & Services - 13.45% | |||||||||||||||
| Alibaba Group Holding Ltd., Sponsored ADRA | 1,183 | 219,482 | |||||||||||||
See accompanying notes
8
American Beacon ARK Transformational Innovation FundSM
Consolidated Schedule of Investments
June 30, 2018
| Shares | Fair Value | ||||||||||||||
| COMMON STOCKS - 93.99% (continued) | |||||||||||||||
| Information Technology - 38.04% (continued) | |||||||||||||||
| Internet Software & Services - 13.45% (continued) | |||||||||||||||
| Baidu, Inc., Sponsored ADRA | 3,305 | $ | 803,115 | ||||||||||||
| Facebook, Inc., Class AA | 681 | 132,332 | |||||||||||||
| MercadoLibre, Inc. | 582 | 173,977 | |||||||||||||
| Spotify Technology S.A.A | 1,809 | 304,346 | |||||||||||||
| Tencent Holdings Ltd., ADR | 7,107 | 357,127 | |||||||||||||
| Twitter, Inc.A | 29,715 | 1,297,654 | |||||||||||||
|
| ||||||||||||||
| 3,288,033 | |||||||||||||||
|
| ||||||||||||||
| IT Services - 2.96% | |||||||||||||||
| Square, Inc., Class AA | 11,733 | 723,222 | |||||||||||||
|
| ||||||||||||||
| Semiconductors & Semiconductor Equipment - 7.28% | |||||||||||||||
| NVIDIA Corp. | 2,056 | 487,066 | |||||||||||||
| Taiwan Semiconductor Manufacturing Co., Ltd., Sponsored ADR | 5,418 | 198,082 | |||||||||||||
| Teradyne, Inc. | 18,399 | 700,450 | |||||||||||||
| Xilinx, Inc. | 6,057 | 395,280 | |||||||||||||
|
| ||||||||||||||
| 1,780,878 | |||||||||||||||
|
| ||||||||||||||
| Software - 5.87% | |||||||||||||||
| Materialise N.V., ADRA B | 10,716 | 139,094 | |||||||||||||
| Microsoft Corp. | 2,246 | 221,478 | |||||||||||||
| Nintendo Co., Ltd. | 171 | 55,911 | |||||||||||||
| Red Hat, Inc.A | 2,913 | 391,420 | |||||||||||||
| salesforce.com, Inc.A | 2,725 | 371,690 | |||||||||||||
| Splunk, Inc.A | 2,574 | 255,109 | |||||||||||||
|
| ||||||||||||||
| 1,434,702 | |||||||||||||||
|
| ||||||||||||||
| Technology Hardware, Storage & Peripherals - 8.48% | |||||||||||||||
| Apple, Inc. | 2,929 | 542,187 | |||||||||||||
| Stratasys Ltd.A | 80,013 | 1,531,449 | |||||||||||||
|
| ||||||||||||||
| 2,073,636 | |||||||||||||||
|
| ||||||||||||||
Total Information Technology | 9,300,471 | ||||||||||||||
|
| ||||||||||||||
| Real Estate - 1.17% | |||||||||||||||
| Real Estate Management & Development - 1.17% | |||||||||||||||
| Redfin Corp.A B | 12,411 | 286,570 | |||||||||||||
|
| ||||||||||||||
| Telecommunication Services - 0.16% | |||||||||||||||
| Wireless Telecommunication Services - 0.16% | |||||||||||||||
| SoftBank Group Corp. | 555 | 39,968 | |||||||||||||
|
| ||||||||||||||
Total Common Stocks (Cost $20,119,320) | 22,978,931 | ||||||||||||||
|
| ||||||||||||||
| UNIT TRUSTS - 2.18% (Cost $135,671) | |||||||||||||||
| Financials - 2.18% | |||||||||||||||
| Bitcoin Investment TrustC | 62,428 | 532,511 | |||||||||||||
|
| ||||||||||||||
| SHORT-TERM INVESTMENTS - 3.03% (Cost $741,158) | |||||||||||||||
| Investment Companies - 3.03% | |||||||||||||||
| American Beacon U.S. Government Money Market Select Fund, Select Class, 1.82%D E | 741,158 | 741,158 | |||||||||||||
|
| ||||||||||||||
| SECURITIES LENDING COLLATERAL - 11.94% (Cost $2,919,466) | |||||||||||||||
| Investment Companies - 11.94% | |||||||||||||||
| American Beacon U.S. Government Money Market Select Fund, Select Class, 1.82%D E | 2,919,466 | 2,919,466 | |||||||||||||
|
| ||||||||||||||
TOTAL INVESTMENTS - 111.14% (Cost $23,915,615) | 27,172,066 | ||||||||||||||
LIABILITIES, NET OF OTHER ASSETS - (11.14%) | (2,723,785 | ) | |||||||||||||
|
| ||||||||||||||
TOTAL NET ASSETS - 100.00% | $ | 24,448,281 | |||||||||||||
|
| ||||||||||||||
| Percentages are stated as a percent of net assets. | |||||||||||||||
See accompanying notes
9
American Beacon ARK Transformational Innovation FundSM
Consolidated Schedule of Investments
June 30, 2018
A Non-income producing security.
B All or a portion of this security is on loan at June 30, 2018.
C All or a portion represents positions held by the American Beacon Cayman Transformational Innovation Company, Ltd. and American Beacon Delaware Transformational Innovation Corporation.
D The Fund is affiliated by having the same investment advisor.
E 7-day yield.
ADR - American Depositary Receipt.
PLC - Public Limited Company.
The Fund’s investments are summarized by level based on the inputs used to determine their values. As of June 30, 2018, the investments were classified as described below:
ARK Transformational Innovation Fund | Level 1 | Level 2 | Level 3 | Total | ||||||||||||||||||||||||
Assets | ||||||||||||||||||||||||||||
Common Stocks | $ | 22,978,931 | $ | - | $ | - | $ | 22,978,931 | ||||||||||||||||||||
Unit Trusts | 532,511 | - | - | 532,511 | ||||||||||||||||||||||||
Short-Term Investments | 741,158 | - | - | 741,158 | ||||||||||||||||||||||||
Securities Lending Collateral | 2,919,466 | - | - | 2,919,466 | ||||||||||||||||||||||||
|
|
|
|
|
|
|
| |||||||||||||||||||||
Total Investments in Securities - Assets | $ | 27,172,066 | $ | - | $ | - | $ | 27,172,066 | ||||||||||||||||||||
|
|
|
|
|
|
|
| |||||||||||||||||||||
U.S. GAAP requires all transfers between any levels to be disclosed. The end of period timing recognition has been adopted for the transfers between levels of the Fund’s assets and liabilities. During the year ended June 30, 2018, there were no transfers between levels.
See accompanying notes
10
American Beacon ARK Transformational Innovation FundSM
Consolidated Statement of Assets and Liabilities
June 30, 2018
Assets: |
| |||
Investments in unaffiliated securities, at fair value†§ | $ | 23,511,442 | ||
Investments in affiliated securities, at fair value‡ | 3,660,624 | |||
Foreign currency, at fair value^ | 1,200 | |||
Dividends and interest receivable | 7,094 | |||
Receivable for investments sold | 53,708 | |||
Receivable for fund shares sold | 184,447 | |||
Receivable for tax reclaims | 348 | |||
Receivable for expense reimbursement (Note 2) | 159,260 | |||
Prepaid expenses | 21,772 | |||
|
| |||
Total assets | 27,599,895 | |||
|
| |||
Liabilities: |
| |||
Payable for investments purchased | 53,354 | |||
Payable for fund shares redeemed | 3,929 | |||
Cash due to custodian | 23 | |||
Payable upon return of securities loaned (Note 8)§ | 2,919,466 | |||
Management and sub-advisory fees payable (Note 2) | 17,688 | |||
Transfer agent fees payable (Note 2) | 1,490 | |||
Custody and fund accounting fees payable | 3,897 | |||
Professional fees payable | 57,956 | |||
Trustee fees payable (Note 2) | 6 | |||
Payable for prospectus and shareholder reports | 3,668 | |||
Accrued income tax liability | 85,640 | |||
Other liabilities | 4,497 | |||
|
| |||
Total liabilities | 3,151,614 | |||
|
| |||
Net assets | $ | 24,448,281 | ||
|
| |||
Analysis of net assets: |
| |||
Paid-in-capital | $ | 19,891,384 | ||
Accumulated net realized gain | 1,300,439 | |||
Unrealized appreciation of investments in unaffiliated securitiesA | 3,256,451 | |||
Unrealized appreciation of foreign currency transactions | 7 | |||
|
| |||
Net assets | $ | 24,448,281 | ||
|
| |||
Shares outstanding at no par value (unlimited shares authorized): |
| |||
Institutional Class | 411,294 | |||
|
| |||
Y Class | 532,430 | |||
|
| |||
Investor Class | 373,366 | |||
|
| |||
Net assets: |
| |||
Institutional Class | $ | 7,650,448 | ||
|
| |||
Y Class | $ | 9,887,450 | ||
|
| |||
Investor Class | $ | 6,910,383 | ||
|
| |||
Net asset value, offering and redemption price per share: |
| |||
Institutional Class | $ | 18.60 | ||
|
| |||
Y Class | $ | 18.57 | ||
|
| |||
Investor Class | $ | 18.51 | ||
|
| |||
† Cost of investments in unaffiliated securities | $ | 20,254,991 | ||
‡ Cost of investments in affiliated securities | $ | 3,660,624 | ||
§ Fair value of securities on loan | $ | 2,797,419 | ||
^ Cost of foreign currency | $ | 1,202 | ||
A The Fund’s investments in affiliated securities did not have unrealized appreciation (depreciation) at year end. | ||||
See accompanying notes
11
American Beacon ARK Transformational Innovation FundSM
Consolidated Statement of Operations
For the year ended June 30, 2018
Investment income: | ||||
Dividend income from unaffiliated securities (net of foreign taxes)† | $ | 21,406 | ||
Dividend income from affiliated securities (Note 7) | 7,878 | |||
Income derived from securities lending (Note 8) | 32,786 | |||
Other income (Note 1) | 74,787 | |||
|
| |||
Total investment income | 136,857 | |||
|
| |||
Expenses: | ||||
Management and sub-advisory fees (Note 2) | 118,887 | |||
Transfer agent fees: | ||||
Institutional Class (Note 2) | 3 | |||
Y Class (Note 2) | 3,317 | |||
Investor Class | 1,108 | |||
Custody and fund accounting fees | 18,830 | |||
Professional fees | 279,990 | |||
Registration fees and expenses | 71,033 | |||
Service fees (Note 2): | ||||
Investor Class | 7,138 | |||
Prospectus and shareholder report expenses | 28,563 | |||
Trustee fees (Note 2) | 766 | |||
Income tax expense | 85,640 | |||
Other expenses | 985 | |||
|
| |||
Total expenses | 616,260 | |||
|
| |||
Net fees waived and expenses (reimbursed) (Note 2) | (468,018 | ) | ||
|
| |||
Net expenses | 148,242 | |||
|
| |||
Net investment (loss) | (11,385 | ) | ||
|
| |||
Realized and unrealized gain (loss) from investments: | ||||
Net realized gain (loss) from: | ||||
Investments in unaffiliated securitiesA | 1,572,499 | |||
Foreign currency transactions | (71 | ) | ||
Change in net unrealized appreciation (depreciation) of: | ||||
Investments in unaffiliated securitiesB | 2,516,597 | |||
Foreign currency transactions | (1 | ) | ||
|
| |||
Net gain from investments | 4,089,024 | |||
|
| |||
Net increase in net assets resulting from operations | $ | 4,077,639 | ||
|
| |||
† Foreign taxes | $ | 1,951 | ||
A The Fund did not recognize net realized gains (losses) from the sale of investments in affiliated securities. | ||||
B The Fund’s investments in affiliated securities did not have a change in unrealized appreciation (depreciation) at year end. |
| |||
See accompanying notes
12
American Beacon ARK Transformational Innovation FundSM
Consolidated Statement of Changes in Net Assets
| Year Ended June 30, 2018 | January 27, 2017A to June 30, 2017 | |||||||||||
Increase (decrease) in net assets: | ||||||||||||
Operations: | ||||||||||||
Net investment (loss) | $ | (11,385 | ) | $ | (11,031 | ) | ||||||
Net realized gain from investments in unaffiliated securities and foreign currency transactions | 1,572,428 | 135,700 | ||||||||||
Change in net unrealized appreciation of investments in unaffiliated securities and foreign currency transactions | 2,516,596 | 739,862 | ||||||||||
|
|
|
| |||||||||
Net increase in net assets resulting from operations | 4,077,639 | 864,531 | ||||||||||
|
|
|
| |||||||||
Distributions to shareholders: | ||||||||||||
Net investment income: | ||||||||||||
Institutional Class | (26,679 | ) | - | |||||||||
Y Class | (16,074 | ) | - | |||||||||
Investor Class | (18,772 | ) | - | |||||||||
Net realized gain from investments: | ||||||||||||
Institutional Class | (140,437 | ) | - | |||||||||
Y Class | (84,610 | ) | - | |||||||||
Investor Class | (98,701 | ) | - | |||||||||
|
|
|
| |||||||||
Net distributions to shareholders | (385,273 | ) | - | |||||||||
|
|
|
| |||||||||
Capital share transactions (Note 10): | ||||||||||||
Proceeds from sales of shares | 20,034,082 | 976,354 | ||||||||||
Reinvestment of dividends and distributions | 381,774 | - | ||||||||||
Cost of shares redeemed | (4,500,822 | ) | (4 | ) | ||||||||
|
|
|
| |||||||||
Net increase in net assets from capital share transactions | 15,915,034 | 976,350 | ||||||||||
|
|
|
| |||||||||
Net increase in net assets | 19,607,400 | 1,840,881 | ||||||||||
|
|
|
| |||||||||
Net assets: | ||||||||||||
Beginning of period | 4,840,881 | 3,000,000 | B | |||||||||
|
|
|
| |||||||||
End of period | $ | 24,448,281 | $ | 4,840,881 | ||||||||
|
|
|
| |||||||||
A Commencement of operations. | ||||||||||||
B Seed capital. | ||||||||||||
See accompanying notes
13
American Beacon ARK Transformational Innovation FundSM
June 30, 2018
1. Organization and Significant Accounting Policies
American Beacon Funds (the “Trust”), is organized as a Massachusetts business trust. The Fund, a series within the Trust, is registered under the Investment Company Act of 1940 (the “Act”), as amended, as a non-diversified, open-end management investment company. As of June 30, 2018, the Trust consists of thirty-three active series, one of which is presented in this filing: American Beacon ARK Transformational Innovation Fund (the “Fund”). The remaining thirty-two active series are reported in separate filings.
American Beacon Advisors, Inc. (the “Manager”) is a Delaware corporation and a wholly-owned subsidiary of Resolute Investment Managers, Inc. (“RIM”) organized in 1986 to provide business management, advisory, administrative, and asset management consulting services to the Trust and other investors. RIM is, in turn, a wholly-owned subsidiary of Resolute Acquisition, Inc., which is a wholly-owned subsidiary of Resolute Topco, Inc., a wholly-owned subsidiary of Resolute Investment Holdings, LLC (“RIH”). RIH is owned primarily by Kelso Investment Associates VIII, L.P., KEP VI, LLC and Estancia Capital Partners L.P., investment funds affiliated with Kelso & Company, L.P. (“Kelso”) or Estancia Capital Management, LLC (“Estancia”), which are private equity firms.
Class Disclosure
The Fund has multiple classes of shares designed to meet the needs of different groups of investors. The following table sets forth the differences amongst the classes:
Class | Eligible Investors | Minimum Initial Investments | ||||
| Institutional | Large institutional investors - sold directly through intermediary channels. | $ | 250,000 | |||
| Y Class | Large institutional retirement plan investors - sold directly or through intermediary channels. | $ | 100,000 | |||
| Investor | All investors using intermediary organizations such as broker-dealers or retirement plan sponsors - sold directly through intermediary channels. | $ | 2,500 | |||
Each class offered by the Trust has equal rights as to assets and voting privileges. Income and non-class specific expenses are allocated daily to each class on the basis of the relative net assets. Realized and unrealized capital gains and losses of each class are allocated daily based on the relative net assets of each class of the respective Fund. Class specific expenses, where applicable, currently include service, distribution, transfer agent fees, and sub-transfer agent fees that vary amongst the classes as described more fully in Note 2.
Consolidation of Subsidiaries
The consolidated Schedule of Investments of the ARK Transformational Innovation Fund, the controlled foreign corporation fund (“CFC Fund”), includes the accounts of the American Beacon Cayman Transformational Innovation Company, Ltd. (the “Cayman Subsidiary”) and American Beacon Delaware Transformational Innovation Corporation (the “Delaware Subsidiary”), wholly-owned and controlled subsidiaries (together, the “Subsidiaries”). The Delaware Subsidiary is organized under the laws of Delaware and the Cayman Subsidiary is organized under the laws of the Cayman Islands. Each Subsidiary is overseen by its own board of directors. The Fund is the sole shareholder of the Subsidiaries. All inter-company accounts and transactions have been eliminated in consolidation for the CFC Fund.
For Federal tax purposes, taxable income for the CFC Fund and each of its Subsidiaries are calculated separately. The Cayman Subsidiary is classified as a controlled foreign corporation under the Internal Revenue Code of 1986 (the “Code”) and the taxable income, if any, is included in the calculation of the CFC Fund’s taxable income. Net losses from the Cayman Subsidiary are not deductible by the CFC Fund either in the current period or future periods. The Delaware Subsidiary is classified for federal income tax purposes as a taxable regular corporation or so-called Subchapter “C” corporation. As a “C” corporation, the Delaware Subsidiary accrues a deferred tax liability for its future tax liability associated with any net income and gains that the Delaware Subsidiary may recognize on future sales of its sole investment, which is the Bitcoin Investment Trust, a Delaware
14
American Beacon ARK Transformational Innovation FundSM
Notes to Financial Statements
June 30, 2018
statutory trust that invests in bitcoin. The deferred tax expense represents an estimate of the Delaware Subsidiary’s potential tax expense if it were to recognize the unrealized gains in its portfolio. An estimate of deferred tax expense is dependent upon the Delaware Subsidiary’s net investment income and realized and unrealized gains on investments. Such expense may vary from year to year and from day to day depending on the performance of the Bitcoin Investment Trust. Therefore, any estimate of the Delaware Subsidiary’s deferred tax expense cannot be reliably predicted from year to year. The Manager has contractually agreed to reimburse the CFC Fund for the amount of any tax liability incurred by the Delaware Subsidiary in connection with sale of shares of the Bitcoin Investment Trust currently held in the Delaware Subsidiary. As such, the accrued deferred tax liability does not impact the CFC Fund’s net asset value per share. The Subsidiaries have a fiscal year end of June 30th for financial statement consolidation purposes.
The CFC Fund may invest up to 25% of its total assets in the Subsidiaries, which act as investment vehicles in order to effect certain investments consistent with the CFC Fund’s investment objectives and policies. The CFC Fund expects to achieve a significant portion of its exposure to an indirect investment in bitcoins through the Subsidiaries.
Fund | Inception Date of Subsidiary | Subsidiary Net Assets at June 30, 2018 | % of Total Net Assets of the CFC Fund at June 30, 2018 | Net Realized Gain (Loss) from Investments Held in Subsidiary | ||||||||||||
American Beacon Cayman Transformational Innovation Company, Ltd. | December 7, 2017 | $ | 41,933 | 0.2 | % | $ | - | |||||||||
American Beacon Delaware Transformational Innovation Corporation | December 7, 2017 | 490,577 | 2.0 | - | ||||||||||||
Significant Accounting Policies
The following is a summary of significant accounting policies, consistently followed by the Fund in preparation of the financial statements. The Fund is considered an investment company and accordingly, follows the investment company accounting and reporting guidance of the Financial Accounting Standards Board Accounting Standard Codification Topic 946, Financial Services – Investment Companies, a part of Generally Accepted Accounting Principles (“U.S. GAAP”).
Security Transactions and Investment Income
Security transactions are recorded as of the trade date for financial reporting purposes. Securities purchased or sold on a when-issued or delayed-delivery basis may be settled beyond a standard settlement period for the security after the trade date.
Dividend income, net of foreign taxes, is recorded on the ex-dividend date, except certain dividends from foreign securities which are recorded as soon as the information is available to the Fund. Interest income is earned from settlement date, recorded on the accrual basis, and adjusted, if necessary, for accretion of discounts and amortization of premiums. Realized gains (losses) from securities sold are determined on the basis of specific lot identification.
Currency Translation
All assets and liabilities initially expressed in foreign currency values are converted into U.S. dollar values at the mean of the bid and ask prices of such currencies against U.S. dollars as last quoted by a recognized dealer. Income, expenses, and purchases and sales of investments are translated into U.S. dollars at the rate of the exchange prevailing on the respective dates of such transactions. The effect of changes in foreign currency exchange rates on investments is separately identified from the fluctuations arising from changes in market values of securities held and is reported with all other foreign currency gains and losses on the Fund’s Consolidated Statement of Operations.
15
American Beacon ARK Transformational Innovation FundSM
Notes to Financial Statements
June 30, 2018
Distributions to Shareholders
Distributions, if any, of net investment income will generally be paid at least annually and recorded on the ex-dividend date. Distributions, if any, of net realized capital gains will generally be paid at least annually and recorded on the ex-dividend date. Dividends to shareholders are determined in accordance with federal income tax regulations, which may differ in amount and character from net investment income and realized gains recognized for purposes of U.S. GAAP. To the extent necessary to fully distribute capital gains, the Fund may designate earnings and profits distributed to shareholders on the redemption of shares.
Commission Recapture
The Fund has established brokerage commission recapture arrangements with certain brokers or dealers. If a Fund’s investment advisor chooses to execute a transaction through a participating broker, the broker rebates a portion of the commission back to the Fund. Any collateral benefit received through participation in the commission recapture program is directed exclusively to the Fund. This amount is reported with the net realized gain in the Fund’s Consolidated Statement of Operations, if applicable. For the year ended June 30, 2018, the Fund did not have commission recapture income.
Allocation of Income, Trust Expenses, Gains, and Losses
Investment income, realized and unrealized gains and losses from investments of the Fund is allocated daily to each class of shares based upon the relative proportion of net assets of each class to the total net assets of the Fund. Expenses directly charged or attributable to any Fund will be paid from the assets of the Fund. Generally, expenses of the Trust will be allocated among and charged to the assets of the Fund on a basis that the Trust’s Board of Trustees (the “Board”) deems fair and equitable, which may be based on the relative net assets of the Fund or nature of the services performed and relative applicability to the Fund.
Organization and Offering Costs
Organizational costs consist of the costs of forming the Fund, drafting the bylaws, administration, custody and transfer agency agreements, and legal services in connection with the initial meeting of trustees, and were expensed immediately as incurred. Offering costs consist of the costs of preparation, review and filing with the SEC the Fund’s registration statement (including the Prospectus and the Statement of Additional Information), the costs of preparation, the costs associated with the printing, mailing or other distribution of the Prospectus, SAI and the amounts of associated filing fees and legal fees associated with the offering. Organizational costs and offering costs are subject to the Fund’s expense limitation agreement discussed in Note 2 and offering costs require amortization over twelve months on a straight-line basis from the commencement of operations.
Use of Estimates
The preparation of financial statements in conformity with U.S. GAAP requires management to make estimates and assumptions that affect the amounts reported in the financial statements and accompanying notes. Actual results may differ from those estimated.
Distributions from Bitcoin Cash and Bitcoin Gold
On November 6, 2017 and December 4, 2017 (the “Record Dates”), Graystone Investments, LLC (the “Sponsor”) of the Bitcoin Investment Trust (“Trust”) declared distributions of a portion of the rights to Bitcoin Cash (BCH) coins (or units) and Bitcoin Gold (BTG) coins (or units), respectively, that were held in the Trust as a result of forks on August 1, 2017 (BCH) and October 24, 2017 (BTG) in the Bitcoin blockchain. The Fund was entitled to 0.09231058 units of BCH per each share held by the Trust on record date. The Fund owned 632 shares of the Trust amounting to 58.34 units of BCH. The Fund was also entitled to 0.09217291 units of BTG per each share held by the Trust on record date amounting to 58.25 units of BTG. The payments were expected to be cash distributions after the Sponsor liquidated the units of BCH and BTG within approximately 90 days of the Record Dates. The receivables were
16
American Beacon ARK Transformational Innovation FundSM
Notes to Financial Statements
June 30, 2018
booked on Record Date at the spot price of BCH or BTG at 4:00 p.m. ET on the respective dates. Thereafter, the receivables were revalued daily using the same pricing methodology. On December 18, 2017, the Fund received $71,539, the full distribution, net of expenses, related to BCH. On April 4, 2018, the Fund received $3,248, the full distribution, net of expenses, related to BTG. The income from BCH and BTG is reflected in “Other Income” on the Statement of Operations. The Manager continues to monitor public filings, press releases and communications with the Sponsor for any news related to additional forks in the blockchain and the Sponsor’s participation in such forks.
Other
Under the Trust’s organizational documents, its officers and trustees are indemnified against certain liabilities arising out of the performance of their duties to the Trust. In the normal course of business, the Trust enters into contracts that provide indemnification to the other party or parties against potential costs or liabilities. The Trust’s maximum exposure under these arrangements is dependent on claims that may be made in the future and, therefore, cannot be estimated. The Trust has had no prior claims or losses pursuant to any such agreement.
2. Transactions with Affiliates
Management and Investment Sub-Advisory Agreements
The Fund and the Manager are parties to a Management Agreement that obligates the Manager to provide the Fund with investment advisory and administrative services. As compensation for performing the duties under the Management Agreement, the Manager will receive an annualized management fee based on a percentage of the Fund’s average daily net assets that is calculated and accrued daily according to the following schedule:
First $5 billion | 0.35 | % | ||
Next $5 billion | 0.325 | % | ||
Next $10 billion | 0.30 | % | ||
Over $20 billion | 0.275 | % |
The Trust, on behalf of the Fund, and the Manager have entered into an Investment Advisory Agreement with ARK Investment Management LLC (the “Sub-Advisor”) pursuant to which the Fund has agreed to pay an annualized sub-advisory fee that is calculated and accrued daily based on the Fund’s average daily net assets according to the following schedule:
First $5 billion | 0.55 | % | ||
Next $5 billion | 0.525 | % | ||
Next $10 billion | 0.50 | % | ||
Over $20 billion | 0.475 | % |
The Management and Sub-Advisory Fees paid by the Fund for the year ended June 30, 2018 were as follows:
| Effective Fee Rate | Amount of Fees Paid | |||||||||||
Management Fees | 0.35 | % | $ | 48,236 | ||||||||
Sub-Advisor Fees | 0.55 | % | 70,651 | |||||||||
|
|
|
| |||||||||
Total | 0.90 | % | $ | 118,887 | ||||||||
|
|
|
| |||||||||
As compensation for services provided by the Manager in connection with securities lending activities conducted by the Fund, the lending Fund pays to the Manager, with respect to cash collateral posted by borrowers, a fee up to 10% of the net monthly interest income (the gross interest income earned by the investment of cash collateral, less the amount paid to borrowers and related expenses) from such activities and, with respect to loan fees paid by borrowers, a fee up to 10% of such loan fees. These fees are included in “Income derived from securities lending” and “Management and investment advisory fees” on the Consolidated Statement of Operations. During the year ended June 30, 2018, the Manager received securities lending fees of $4,131 for the securities lending activities of the Fund.
17
American Beacon ARK Transformational Innovation FundSM
Notes to Financial Statements
June 30, 2018
Distribution Plans
The Fund has adopted a “defensive” Distribution Plan (the “Plan”) in accordance with Rule 12b-1 under the Act, pursuant to which no separate fees may be charged to the Fund for distribution purposes. However, the Plan authorizes the management fee received by the Manager and the investment advisors hired by the Manager to be used for distribution purposes. Under this Plan, the Fund does not intend to compensate the Manager or any other party, either directly or indirectly, for the distribution of Fund shares.
Service Plans
The Manager and the Trust entered into Service Plans that obligates the Manager to oversee additional shareholder servicing of the Investor Classes of the Fund. As compensation for performing the duties required under the Service Plans, the Manager receives an annualized fee up to 0.375% of the average daily net assets of the Investor Class of the Fund.
Sub-Transfer Agent Fees
The Manager has entered into agreements, which include servicing agreements, with financial intermediaries that provide recordkeeping, processing, shareholder communications and other services to customers of the intermediaries that hold positions in the Institutional and Y Classes of the Fund and has agreed to compensate the intermediaries for providing these services. Intermediaries transact with the Fund primarily through the use of omnibus accounts on behalf of its customers who hold positions in the Fund. Certain services would have been provided by the Fund’s transfer agent and other service providers if the shareholders’ accounts were maintained directly by the Fund’s transfer agent. Accordingly, the Fund, pursuant to Board approval, has agreed to reimburse the Manager for certain non-distribution shareholder services provided by financial intermediaries for the Institutional and Y Classes. The reimbursement amounts (sub-transfer agent fees) paid to the Manager are subject to a fee limit of up to 0.10% of an intermediary’s average net assets in the Institutional and Y Classes on an annual basis. During the year ended June 30, 2018, the sub-transfer agent fees, as reflected in “Transfer agent fees” on the Consolidated Statement of Operations, were as follows:
Fund | Sub-Transfer Agent Fees | |||
ARK Transformational Innovation | $ | 1,233 | ||
As of June 30, 2018, the Fund owed the Manager the following reimbursement of sub-transfer agent fees, as reflected in “Transfer agent fees payable” on the Consolidated Statement of Assets and Liabilities:
Fund | Reimbursement Sub-Transfer Agent Fees | |||
ARK Transformational Innovation | $ | 719 | ||
Investments in Affiliated Funds
The Fund may invest in the American Beacon U.S. Government Money Market Select Fund (the “USG Select Fund”). Cash collateral received by the Fund in connection with securities lending may also be invested in the USG Select Fund. The Fund and the USG Select Fund have the same investment advisor and therefore, are considered to be affiliated. The Manager serves as investment advisor to the USG Select Fund and receives management fees and administrative fees totaling 0.10% of the average daily net assets of the USG Select Fund. During the year ended June 30, 2018, the Manager earned fees on the Fund’s direct investments and securities lending collateral investments in the USG Select Fund as shown below:
Fund | Direct Investments in USG Select Fund | Securities Lending Collateral in USG Select Fund | Total | |||||||||
ARK Transformational Innovation | $ | 574 | $ | 1,304 | $ | 1,878 | ||||||
18
American Beacon ARK Transformational Innovation FundSM
Notes to Financial Statements
June 30, 2018
Interfund Credit Facility
Pursuant to an exemptive order issued by the Securities and Exchange Commission (“SEC”), the Fund, along with other registered investment companies having management contracts with the Manager, may participate in a credit facility whereby each Fund, under certain conditions, is permitted to lend money directly to and borrow directly from other participating Funds for temporary purposes. The interfund credit facility is advantageous to the Funds because it provides added liquidity, and eliminates the need to maintain higher cash balances to meet redemptions. This situation could arise when shareholder redemptions exceed anticipated volumes and certain funds have insufficient cash on hand to satisfy such redemptions or when sales of securities do not settle as expected, resulting in a cash shortfall for a fund. When a Fund liquidates portfolio securities to meet redemption requests, they often do not receive payment in settlement for up to two days (or longer for certain foreign transactions). Redemption requests normally are satisfied on the next business day. The credit facility provides a source of immediate, short-term liquidity pending settlement of the sale of portfolio securities. The credit facility is administered by a credit facility team consisting of professionals from the Manager’s asset management, compliance, and accounting areas who report the activities of the credit facility to the Board. During the year ended June 30, 2018, the Fund borrowed on average $67,917 for 2 days at an average interest rate of 2.04% with interest charges of $8. These amounts are recorded as “Other expenses” in the Consolidated Statement of Operations.
Expense Reimbursement Plan
The Manager contractually agreed to reduce fees and/or reimburse expenses for the classes of the Fund to the extent that total operating expenses exceed the Fund’s expense cap. During the year ended June 30, 2018, the Manager waived and/or reimbursed expenses as follows:
| Expense Cap | Expiration of Reimbursed Expenses | |||||||||||||||||
Fund | Class | 7/1/2017 - 6/30/2018 | Reimbursed Expenses | (Recouped) Expenses | ||||||||||||||
ARK Transformational Innovation | Institutional | 0.99 | % | $ | 192,545 | $ | – | 2021 | ||||||||||
ARK Transformational Innovation | Y | 1.09 | % | 137,017 | – | 2021 | ||||||||||||
ARK Transformational Innovation | Investor | 1.37 | % | 138,456 | – | 2021 | ||||||||||||
Of these amounts, $159,260 was disclosed as a receivable from the Manager on the Consolidated Statement of Assets and Liabilities at June 30, 2018.
The Fund has adopted an Expense Reimbursement Plan whereby the Manager may seek repayment of such fee reductions and expense reimbursements. Under the policy, the Manager can be reimbursed by the Fund for any contractual or voluntary fee reductions or expense reimbursements if reimbursement to the Manager (a) occurs within three years after the Manager’s own waiver or reimbursement and (b) does not cause the Fund’s annual operating expenses to exceed the lesser of the contractual percentage limit in effect at the time of the waiver/reimbursement or time of recoupment. The reimbursed expenses listed above will expire in 2021. The Fund did not record a liability for potential reimbursement due to the current assessment that a reimbursement is unlikely. The carryover of excess expenses potentially reimbursable to the Manager are as follows:
Fund | Recouped Expenses | Excess Expense Carryover | Expired Expense Carryover | Expiration of Reimbursed Expenses | ||||||||||||
ARK Transformational Innovation | $ | – | $ | 141,632 | $ | – | 2020 | |||||||||
Concentration of Ownership
From time to time, the Fund may have a concentration of one or more accounts constituting a significant percentage of shares outstanding. Investment activities by holders of accounts that represent a significant ownership of more than 5% of the Fund’s outstanding shares could have a material impact on the Fund. As of June 30, 2018, based on management’s evaluation of the shareholder account base, one account in the Fund has been identified as representing an affiliated significant ownership of approximately 22% and two accounts in the Fund have been identified as representing an unaffiliated significant ownership of approximately 14% of the Fund’s outstanding shares.
19
American Beacon ARK Transformational Innovation FundSM
Notes to Financial Statements
June 30, 2018
Trustee Fees and Expenses
As compensation for their service to the Trust, American Beacon Select Funds, American Beacon Institutional Funds Trust, American Beacon Sound Point Enhanced Income Fund, and American Beacon Apollo Total Return Fund each Trustee receives an annual retainer of $120,000, plus $10,000 for each Board meeting attended in person or via teleconference, $2,500 for attendance by Committee members at meetings of the Audit Committee and the Investment Committee, and $1,500 for attendance by Committee members at meetings of the Nominating and Governance Committee, plus reimbursement of reasonable expenses incurred in attending Board meetings, Committee meetings, and relevant educational seminars. The Trustees also may be compensated for attendance at special Board and/or Committee meetings from time to time. The Board Chairman receives an additional annual retainer of $50,000 as well as a $2,500 fee each quarter for his attendance at the committee meetings. Effective January 1, 2018, the Board Vice Chair receives an additional annual retainer of $10,000. The Chairpersons of the Audit Committee and the Investment Committee each receive an additional annual retainer of $25,000 and the Chairman of the Nominating and Governance Committee receives an additional annual retainer of $10,000. These expenses are allocated on a prorated basis to each Fund of the Trusts according to its respective net assets.
3. Security Valuation and Fair Value Measurements
The price of the Fund’s shares is based on its net asset value (“NAV”) per share. The Fund’s NAV is computed by adding total assets, subtracting all the Fund’s liabilities, and dividing the result by the total number of shares outstanding.
The NAV of each class of the Fund’s shares is determined based on a pro rata allocation of the Fund’s investment income, expenses and total capital gains and losses. The Fund’s NAV per share is determined each business day as of the regular close of trading on the New York Stock Exchange (“NYSE” or “Exchange”), which is typically 4:00 p.m. Eastern Time (“ET”). However, if trading on the NYSE closes at a time other than 4:00 p.m. ET, the Fund’s NAV per share typically would still be determined as of the regular close of trading on the NYSE. The Fund does not price its shares on days that the NYSE is closed. Foreign exchanges may permit trading in foreign securities on days when the Fund is not open for business, which may result in the value of the Fund’s portfolio investments being affected at a time when you are unable to buy or sell shares.
Equity securities and certain derivative instruments that are traded on an exchange are valued based on market value. Certain derivative instruments (other than short-term securities) usually are valued on the basis of prices provided by a pricing service. The price of debt securities generally is determined using pricing services or quotes obtained from broker/dealers who may consider a number of inputs and factors, such as comparable characteristics, yield curve, credit spreads, estimated default rates, coupon rates, underlying collateral and estimated cash flow. Investments in other mutual funds are valued at the closing NAV per share of the mutual funds on the day of valuation. Equity securities, including shares of closed-end funds and exchanged-traded funds (“ETFs”), are valued at the last sale price or official closing price.
The valuation of securities traded on foreign markets and certain fixed income securities will generally be based on prices determined as of the earlier closing time of the markets on which they primarily trade unless a significant event has occurred. When the Fund holds securities or other assets that are denominated in a foreign currency, the Fund will normally use the currency exchange rates as of 4:00 p.m. ET.
Securities may be valued at fair value, as determined in good faith and pursuant to procedures approved by the Board of Trustees, under certain limited circumstances. For example, fair value pricing will be used when market quotations are not readily available or reliable, as determined by the Manager, such as when (i) trading for a security is restricted or stopped; (ii) a security’s trading market is closed (other than customary closings); or (iii) a security has been de-listed from a national exchange. A security with limited market liquidity may require fair value pricing if the Manager determines that the available price does not reflect the security’s true market value. In addition, if a significant event that the Manager determines to affect the value of one or more securities held by the Fund occurs after the close of a related exchange but before the determination of the Fund’s NAV, fair value
20
American Beacon ARK Transformational Innovation FundSM
Notes to Financial Statements
June 30, 2018
pricing may be used on the affected security or securities. Securities of small-capitalization companies are also more likely to require a fair value determination using these procedures because they are more thinly traded and less liquid than the securities of larger-capitalization companies. The Fund may fair value securities as a result of significant events occurring after the close of the foreign markets in which the Fund invests as described below. In addition, the Fund may invest in illiquid securities requiring these procedures.
The Fund may use fair value pricing for securities primarily traded in non-U.S. markets because most foreign markets close well before the Fund’s pricing time of 4:00 p.m. ET. The earlier close of these foreign markets gives rise to the possibility that significant events, including broad market moves, may have occurred in the interim and may materially affect the value of those securities. If the Manager determines that the last quoted prices of non-U.S. securities will, in its judgment, materially affect the value of some or all its portfolio securities, the Manager can adjust the previous closing prices to reflect what it believes to be the fair value of the securities as of the close of the Exchange. In deciding whether it is necessary to adjust closing prices to reflect fair value, the Manager reviews a variety of factors, including developments in foreign markets, the performance of U.S. securities markets, and the performance of instruments trading in U.S. markets that represent foreign securities and baskets of foreign securities. These securities are fair valued using a pricing service, using methods approved by the Board, that considers the correlation of the trading patterns of the foreign security to intraday trading in the U.S. markets, based on indices of domestic securities and other appropriate indicators such as prices of relevant American Depositary Receipts (“ADRs”) and futures contracts. The Valuation Committee, established by the Board, may also fair value securities in other situations, such as when a particular foreign market is closed but the Fund is open. The Fund uses outside pricing services to provide closing prices and information to evaluate and/or adjust those prices. As a means of evaluating its security valuation process, the Valuation Committee routinely compares closing prices, the next day’s opening prices in the same markets and adjusted prices.
Attempts to determine the fair value of securities introduce an element of subjectivity to the pricing of securities. As a result, the price of a security determined through fair valuation techniques may differ from the price quoted or published by other sources and may not accurately reflect the market value of the security when trading resumes. If a reliable market quotation becomes available for a security formerly valued through fair valuation techniques, the Manager compares the new market quotation to the fair value price to evaluate the effectiveness of the Fund’s fair valuation procedures. If any significant discrepancies are found, the Manager may adjust the Fund’s fair valuation procedures.
Valuation Inputs
Various inputs may be used to determine the fair value of the Fund’s investments. These inputs are summarized in three broad levels for financial statement purposes. The inputs or methodologies used to value securities are not necessarily an indication of the risk associated with investing in those securities.
| Level 1 | - | Quoted prices in active markets for identical securities. | ||
| Level 2 | - | Prices determined using other significant observable inputs. These may include quoted prices for similar securities, interest rates, prepayment speeds, credit risk, and others. | ||
| Level 3 | - | Prices determined using other significant unobservable inputs. Unobservable inputs reflect the Fund’s own assumptions about the factors market participants would use in pricing an investment. | ||
Level 1 and Level 2 trading assets and trading liabilities, at fair value
Common stocks, ETFs, and financial derivative instruments, such as futures contracts or options that are traded on a national securities exchange, are stated at the last reported sale or settlement price on the day of valuation. To the extent these securities are actively traded and valuation adjustments are not applied, they are categorized as Level 1 of the fair value hierarchy. Valuation adjustments may be applied to certain securities that are solely traded on a foreign exchange to account for the market movement between the close of the foreign market and the close of the Exchange. These securities are valued using pricing service providers that consider the correlation of the trading patterns of the foreign security to the intraday trading in the U.S. markets for investments.
21
American Beacon ARK Transformational Innovation FundSM
Notes to Financial Statements
June 30, 2018
Securities using these valuation adjustments are categorized as Level 2 of the fair value hierarchy. Preferred securities and other equities traded on inactive markets or valued by reference to similar instruments are generally categorized as Level 2 of the fair value hierarchy.
Investments in registered open-end investment management companies will be valued based upon the NAVs of such investments and are categorized as Level 1 of the fair value hierarchy.
The Fund did not hold any Level 2 securities at the year ended June 30, 2018.
4. Securities and Other Investments
American Depositary Receipts
American Depositary Receipts (“ADRs”) are depositary receipts for foreign issuers in registered form traded in U.S. securities markets. Depositary receipts may not be denominated in the same currency as the securities into which they may be converted. Investing in depositary receipts entails substantially the same risks as direct investment in foreign securities. There is generally less publicly available information about foreign companies and there may be less governmental regulation and supervision of foreign stock exchanges, brokers, and listed companies. In addition, such companies may use different accounting and financial standards (and certain currencies may become unavailable for transfer from a foreign currency), resulting in the Fund’s possible inability to convert immediately into U.S. currency proceeds realized upon the sale of portfolio securities of the affected foreign companies. In addition, the Fund may invest in unsponsored depositary receipts, the issuers of which are not obligated to disclose material information about the underlying securities to investors in the United States. Ownership of unsponsored depositary receipts may not entitle the Fund to the same benefits and rights as ownership of a sponsored depositary receipt or the underlying security.
Bitcoin
The Subsidiaries may invest in a Delaware statutory trust (“Bitcoin Trust”) that invests in bitcoins. From time to time, the Bitcoin Trust issues creation units in exchange for bitcoins and distributes bitcoins in exchange for redemption units. The performance of the Bitcoin Trust is intended to reflect changes in the value of the Bitcoin Trust’s bitcoin investments.
Bitcoin is a decentralized digital currency that enables instant transfers to anyone, anywhere in the world. Managing transactions in bitcoins occurs via an open source, cryptographic protocol central authority. The Bitcoin Network is an online, end-user-to-end-user network that hosts the public transaction ledger, known as the Blockchain, and the source code that comprises the basis for the cryptographic and algorithmic protocols governing the Bitcoin Network. No single entity owns or operates the Bitcoin Network, the infrastructure of which is collectively maintained by a decentralized user base. As the Bitcoin Network is decentralized, it does not rely on either governmental authorities or financial institutions to create, transmit or determine the value of bitcoins. Rather, the value of bitcoins is determined by the supply of and demand for bitcoins in the global bitcoin exchange market for the trading of bitcoins, which consists of transactions on electronic bitcoin exchanges (“Bitcoin Exchanges”). The price of bitcoins is set in transfers by mutual agreement or barter as well as the number of merchants that accept bitcoins. Because bitcoins are digital files that can be transferred without the involvement of intermediaries or third parties, there are little or no transaction costs in direct end-user-to-end-user transactions. Bitcoins can be used to pay for goods and services or can be converted to fiat currencies, such as the U.S. dollar, at rates determined by the Bitcoin Exchanges. Additionally, third party service providers such as Bitcoin Exchanges are also used for transfers but they may charge significant fees for processing transactions.
Common Stock
Common stock generally takes the form of shares in a corporation which represent an ownership interest. It ranks below preferred stock and debt securities in claims for dividends and for assets of the company in a liquidation
22
American Beacon ARK Transformational Innovation FundSM
Notes to Financial Statements
June 30, 2018
or bankruptcy. The value of a company’s common stock may fall as a result of factors directly relating to that company, such as decisions made by its management or decreased demand for the company’s products or services. A stock’s value may also decline because of factors affecting not just the company, but also companies in the same industry or sector. The price of a company’s stock may also be affected by changes in financial markets that are relatively unrelated to the company, such as changes in interest rates, currency exchange rates or industry regulation. Companies that elect to pay dividends on their common stock generally only do so after they invest in their own business and make required payments to bondholders and on other debt and preferred stock. Therefore, the value of a company’s common stock will usually be more volatile than its bonds, other debt and preferred stock. Common stock may be exchange-traded or over-the-counter (“OTC”). OTC stock may be less liquid than exchange-traded stock.
Foreign Securities
The Fund may invest in securities of foreign issuers. Foreign issuers are issuers organized and doing business principally outside the United States and include corporations, banks, non-U.S. governments, and quasi-governmental organizations. While investments in foreign securities are intended to reduce risk by providing further diversification, such investments involve sovereign and other risks, in addition to the credit and market risks normally associated with domestic securities. These additional risks include the possibility of adverse political and economic developments (including political or social instability, nationalization, expropriation, or confiscatory taxation); the potentially adverse effects of unavailability of public information regarding issuers, less governmental supervision and regulation of financial markets, reduced liquidity of certain financial markets, and the lack of uniform accounting, auditing, and financial reporting standards or the application of standards that are different or less stringent than those applied in the United States; different laws and customs governing securities tracking; and possibly limited access to the courts to enforce the Fund’s rights as an investor.
Other Investment Company Securities and Other Exchange-Traded Products
The Fund may invest in shares of other investment companies, including open-end funds, closed-end funds, business development companies, ETFs, unit investment trusts, and other investment companies of the Trust. The Fund may invest in investment company securities advised by the Manager or a sub-advisor. Investments in the securities of other investment companies may involve duplication of advisory fees and certain other expenses. By investing in another investment company, the Fund becomes a shareholder of that investment company. As a result, the Fund’s shareholders indirectly will bear the Fund’s proportionate share of the fees and expenses paid by shareholders of the other investment company, in addition to the fees and expenses the Fund’s shareholders directly bear in connection with the Fund’s own operations. These other fees and expenses are reflected as Acquired Fund Fees and Expenses and are included in the Fees and Expenses Table for the Fund in its Prospectus, if applicable. Investments in other investment companies may involve the payment of substantial premiums above the value of such issuer’s portfolio securities.
5. Principal Risks
Investing in the Fund may involve certain risks including, but not limited to, those described below.
Asset Selection Risk
Assets selected by the sub-advisor or the Manager for the Fund may not perform to expectations. The sub-advisor’s investment models may rely in part on data derived from third parties and may not perform as intended. This could result in the Fund’s underperformance compared to other funds with similar investment objectives.
Bitcoin Risk
The value of the Fund’s investment in the Bitcoin Investment Trust through the Subsidiaries is subject to fluctuations in the value of bitcoins. The value of bitcoins is determined by the supply of and demand for bitcoins in
23
American Beacon ARK Transformational Innovation FundSM
Notes to Financial Statements
June 30, 2018
the global market for the trading of bitcoins, which consists of transactions on Bitcoin Exchanges. Pricing on Bitcoin Exchanges and other venues can be volatile and can adversely affect the value of the Bitcoin Investment Trust. Currently, there is relatively small use of bitcoins in the retail and commercial marketplace in comparison to the relatively large use of bitcoins by speculators, thus contributing to price volatility that could adversely affect the Fund’s indirect investment in the Bitcoin Investment Trust. Bitcoin transactions are irrevocable, and stolen or incorrectly transferred bitcoins may be irretrievable. As a result, any incorrectly executed bitcoin transactions could adversely affect the value of the Fund’s indirect investment in the Bitcoin Investment Trust. Shares of the Bitcoin Investment Trust may trade at a premium or discount to the net asset value of the Bitcoin Investment Trust.
As bitcoins have grown in both popularity and market size, the U.S. Congress and a number of federal and state agencies (including the Financial Crimes Enforcement Network (FinCEN), the Securities and Exchange Commission, the Commodity Futures Trading Commission, the Financial Industry Regulatory Authority, the Consumer Financial Protection Bureau, the Department of Justice, the Department of Homeland Security, the Federal Bureau of Investigation, the IRS, and state financial institution regulators) have begun to examine the operations of the network that facilitates bitcoins, bitcoin users and the Bitcoin Exchanges, with particular focus on (1) the extent to which bitcoins can be used to launder the proceeds of illegal activities or fund criminal or terrorist enterprises, (2) the safety and soundness of the Bitcoin Exchange or other service-providers that hold bitcoins for users and (3) other risks to investors and consumers who hold and use bitcoins. Ongoing and future regulatory actions may alter, perhaps to a materially adverse extent, the value of the Fund’s indirect investment in the Bitcoin Investment Trust or the ability of the Bitcoin Investment Trust to continue to operate.
Currency Risk
The Fund may have exposure to foreign currencies by making direct investments in non-U.S. currencies, in securities denominated in non-U.S. currencies or by purchasing or selling forward foreign currency exchange contracts in non-U.S. currencies. Foreign currencies will fluctuate, and may decline in value relative to the U.S. dollar and other currencies and thereby affect the Fund’s investments in foreign (non-U.S.) currencies or in securities that traded in, and receive revenues in, or in derivatives that provide exposure to, foreign (non-U.S.) currencies.
Equity Investments Risk
Equity securities are subject to investment and market risk. The Fund’s investments in equity securities may include common stocks. Investing in such securities may expose the funds to additional risk. The value of a company’s common stock may fall as a result of factors affecting the company, companies in the same industry or sector, or the financial markets overall. Common stock generally is subordinate to preferred stock upon the liquidation or bankruptcy of the issuing company.
Foreign Investing Risk
Non-U.S. investments carry potential risks not associated with U.S. investments. Such risks include, but are not limited to: (1) currency exchange rate fluctuations, (2) political and financial instability, (3) less liquidity and greater volatility, (4) lack of uniform accounting, auditing and financial reporting standards, (5) increased price volatility, (6) less government regulation and supervision of foreign stock exchanges, brokers and listed companies, and (7) delays in transaction settlement in some foreign markets.
Market Risk
Since the financial crisis that started in 2008, the U.S. and many foreign economies continue to experience its after-effects. Conditions in the U.S. and many foreign economies have resulted, and may continue to result, in certain instruments experiencing unusual liquidity issues, increased price volatility and, in some cases, credit downgrades and increased likelihood of default. These events have reduced the willingness and ability of some lenders to extend credit, and have made it more difficult for some borrowers to obtain financing on attractive terms, if at all. In some cases, traditional market participants have been less willing to make a market in some types of debt instruments, which has affected the liquidity of those instruments. During times of market turmoil,
24
American Beacon ARK Transformational Innovation FundSM
Notes to Financial Statements
June 30, 2018
investors tend to look to the safety of securities issued or backed by the U.S. Treasury, causing the prices of these securities to rise and the yields to decline. The reduced liquidity in fixed income and credit markets may negatively affect many issuers worldwide. In addition, global economies and financial markets are becoming increasingly interconnected, which increases the possibilities that conditions in one country or region might adversely impact issuers in a different country or region.
In response to the financial crisis, the U.S. and other governments and the Federal Reserve and certain foreign central banks have taken steps to support financial markets. In some countries where economic conditions are recovering, they are nevertheless perceived as still fragile. Withdrawal of government support, failure of efforts in response to the crisis, or investor perception that such efforts are not succeeding, could adversely impact the value and liquidity of certain securities. The severity or duration of adverse economic conditions may also be affected by policy changes made by governments or quasi-governmental organizations, including changes in tax laws. The impact of new financial regulation legislation on the markets and the practical implications for market participants may not be fully known for some time. Regulatory changes are causing some financial services companies to exit long-standing lines of business, resulting in dislocations for other market participants. In addition, political and diplomatic events within the U.S. and abroad, such as the U.S. government’s inability at times to agree on a long-term budget and deficit reduction plan, the threat of a federal government shutdown and threats not to increase the federal government’s debt limit, may affect investor and consumer confidence and may adversely impact financial markets and the broader economy, perhaps suddenly and to a significant degree. The results of the 2016 U.S. presidential election may result in significant changes in certain policies. These changes may result in lower corporate taxes, higher levels of public debt, higher interest rates, more restrictions on international trade, and less stringent prudential regulation of certain players in the financial markets.
Changes in market conditions will not have the same impact on all types of securities. Interest rates have been unusually low in recent years in the U.S. and abroad. Because there is little precedent for this situation, it is difficult to predict the impact of a significant rate increase on various markets. For example, because investors may buy securities or other investments with borrowed money, a significant increase in interest rates may cause a decline in the markets for those investments. Because of the sharp decline in the worldwide price of oil, there is a concern that oil producing nations may withdraw significant assets now held in U.S. Treasuries, which could force a substantial increase in interest rates. Regulators have expressed concern that rate increases may cause investors to sell fixed income securities faster than the market can absorb them, contributing to price volatility. In addition, there is a risk that the prices of goods and services in the U.S. and many foreign economies may decline over time, known as deflation (the opposite of inflation). Deflation may have an adverse effect on stock prices and creditworthiness and may make defaults on debt more likely. If a country’s economy slips into a deflationary pattern, it could last for a prolonged period and may be difficult to reverse. The abandonment of the euro or withdrawal from the European Union (“EU”) on the part of the United Kingdom or any other member could significantly adversely affect the value of the Fund’s investments in Europe. Particularly, the United Kingdom’s vote to leave the EU could lead to a prolonged period of uncertainty as to the exact terms of exit and the impact on different industry sectors and increased market volatility.
Non-Diversification Risk
The Fund is non-diversified, which means the Fund may focus its investments in the securities of a comparatively small number of issuers. Investments in securities of a limited number of issuers exposes the Fund to greater market risk and potential losses than if assets were diversified among the securities of a greater number of issuers.
Other Investment Companies Risk
The Fund may invest in shares of other registered investment companies, including ETFs and money market funds that are advised by the Manager. To the extent that the Fund invests in shares of other registered investment companies, the Fund will indirectly bear the fees and expenses charged by those investment companies in addition to the Fund’s direct fees and expenses and will be subject to the risks associated with investments in those companies.
25
American Beacon ARK Transformational Innovation FundSM
Notes to Financial Statements
June 30, 2018
Securities Lending Risk
To the extent the Fund lends its securities, it may be subject to the following risks; i) borrowers of the Fund’s securities typically provide collateral in the form of cash that is reinvested in securities, ii) the securities in which the collateral is invested may not perform sufficiently to cover the return collateral payments owed to borrowers, iii) delays may occur in the recovery of securities from borrowers, which could interfere with the Fund’s ability to vote proxies or to settle transactions, and iv) there is the risk of possible loss of rights in the collateral should the borrower fail financially.
Subsidiaries Risk
There can be no assurance that the investment objective of each Subsidiary will be achieved. The Subsidiaries are not registered under the Investment Company Act and, unless otherwise noted in this Prospectus, are not subject to all the investor protections of the Investment Company Act. However, the Fund wholly owns and controls the Subsidiaries, and the Fund and the Subsidiaries are managed by the Manager and the sub-advisor pursuant to separate agreements, making it unlikely that the Subsidiaries will take action contrary to the interests of the Fund and its shareholders. The Board of Trustees has oversight responsibility for the investment activities of the Fund, including its investments in the subsidiaries, and the Fund’s role as sole shareholder of the Subsidiaries. Changes in the laws of the United States and/or Delaware, under which the Fund and the Delaware Subsidiary, respectively, are organized, and/or the Cayman Islands, under which the Cayman Subsidiary is organized, could result in the inability of the Fund and/or either or both Subsidiaries to operate as described in this Prospectus and could negatively affect the Fund and its shareholders. For example, the Cayman Islands government has undertaken not to impose any income, corporate or capital gains tax, estate duty, inheritance tax, gift tax or withholding tax on the Cayman Subsidiary. If Cayman Islands law changes such that the Cayman Subsidiary must pay Cayman Islands taxes, Fund shareholders would likely suffer decreased investment returns. Rulemaking by the CFTC or other regulatory initiatives may affect the Fund’s ability to use the Cayman Subsidiary to pursue its investment strategies. As of the date of this Prospectus, the potential impact of these initiatives on the Fund is uncertain.
Tax Risk
To qualify as a RIC and receive the “modified pass-through” tax treatment accorded thereto (as described in the SAI), the Fund must, among other things, derive at least 90% of its gross income for each taxable year from sources treated as “qualifying income” under Subchapter M. Although qualifying income does not include income derived directly from commodities – the IRS has ruled that bitcoin is “property,” which thus could be considered a commodity, and the Fund, therefore will restrict its gross income from direct investments therein (including shares of the Bitcoin Investment Trust) to a maximum of 10% of its gross income for each taxable year – the Fund’s investment in the Subsidiaries is expected to provide the Fund with indirect exposure to the Bitcoin Investment Trust within the limitations of the federal tax requirements of Subchapter M.
The IRS issued a large number of private letter rulings (which the Fund may not cite as precedent) from 2006 through 2011 that income a RIC derives from a wholly owned foreign subsidiary (a “controlled foreign corporation” or “CFC”) (such as the Cayman Subsidiary) that earns income derived from commodities – the IRS has ruled that bitcoin is “property,” which thus could be considered a commodity – is qualifying income. However, proposed Treasury regulations published on September 28, 2016, would limit qualifying income for a RIC from a CFC to distributions the CFC makes to the RIC out of its associated earnings and profits for the applicable taxable year. Although the Fund currently expects to receive distributions from the Cayman Subsidiary out of such earnings and profits each taxable year, if in one or more taxable years the Fund did not receive distributions thereof (or received less than all of same) or the IRS concluded that the amounts it did receive were not “distributions” for federal income tax purposes, the Fund might have difficulty in those years satisfying the source-of-income requirement to qualify as a RIC. Additional information regarding the federal income tax treatment by a RIC of income from a CFC is included in the “Tax Information” section of the SAI. The federal income tax treatment of the Fund’s income from the Cayman Subsidiary may be materially adversely affected by future legislation, the final version of the above mentioned proposed regulations or of other Treasury regulations, and/or guidance issued by
26
American Beacon ARK Transformational Innovation FundSM
Notes to Financial Statements
June 30, 2018
the IRS that could affect whether income from such investments is qualifying income under Subchapter M, or otherwise materially affect the character, timing or recognition, and/or amount of the Fund’s taxable income and/or net capital gains and, therefore, the distributions the Fund makes. If the Fund were unable to qualify as a RIC for one or more taxable years, it would incur potentially significant federal income tax expense. In certain such instances, its income available for distribution to shareholders would be reduced and all such distributions from current or accumulated earnings and profits would be taxable to them as dividend income.
Valuation Risk
The Fund may value certain assets at a price different from the price at which they can be sold. This risk may be especially pronounced for investments, such as certain derivatives, which may be illiquid or which may become illiquid.
Offsetting Assets and Liabilities
The Funds is a party to enforceable master netting agreements between brokers and counterparties which provide for the right to offset under certain circumstances. The Fund employs multiple money managers and counterparties and has elected not to offset qualifying financial and derivative instruments on the Consolidated Statement of Assets and Liabilities, as such all financial and derivative instruments are presented on a gross basis. The impacts of netting arrangements that provide the right to offset are detailed below. The net amount represents the net receivable or payable that would be due from or to the counterparty in the event of default. Exposure from borrowings and other financing agreements such as repurchase agreements can only be netted across transactions governed by the same Master Agreement with the same legal entity. All amounts reported below represent the balance as of the report date, June 30, 2018.
| Remaining Contractual Maturity of the Agreements As of June 30, 2018 | ||||||||||||||||||||||||||||||||||||
| Overnight and Continuous | <30 days | Between 30 & 90 days | >90 days | Total | ||||||||||||||||||||||||||||||||
Securities Lending Transactions | ||||||||||||||||||||||||||||||||||||
Common Stocks | $ | 2,919,466 | $ | - | $ | - | $ | - | $ | 2,919,466 | ||||||||||||||||||||||||||
|
|
|
|
|
|
|
|
|
| |||||||||||||||||||||||||||
Total Borrowings | $ | 2,919,466 | $ | - | $ | - | $ | - | $ | 2,919,466 | ||||||||||||||||||||||||||
|
|
|
|
|
|
|
|
|
| |||||||||||||||||||||||||||
Gross amount of recognized liabilities for securities lending transactions |
| $ | 2,919,466 | |||||||||||||||||||||||||||||||||
|
| |||||||||||||||||||||||||||||||||||
6. Federal Income and Excise Taxes
It is the policy of the Fund to qualify as a regulated investment company (“RIC”), by complying with all applicable provisions of Subchapter M of the Internal Revenue Code, as amended, and to make distributions of taxable income sufficient to relieve it from substantially all federal income and excise taxes. For federal income tax purposes, the Fund is treated as a single entity for the purpose of determining such qualification.
The Fund does not have any unrecognized tax benefits in the accompanying financial statements. Each of the tax years in the two year period ended June 30, 2018 remain subject to examination by the Internal Revenue Service. If applicable, the Fund recognizes interest accrued related to unrecognized tax benefits in interest expense and penalties in “Other expenses” on the Consolidated Statement of Operations.
The Fund may be subject to taxes imposed by countries in which it invests. Such taxes are generally based on returns of income earned or gains realized or repatriated. Taxes are accrued and applied to net investment income, net realized capital gains and net unrealized appreciation (depreciation), as applicable, as the income is earned or capital gains are recorded.
Dividends are categorized in accordance with income tax regulations which may treat certain transactions differently than U.S. GAAP. Accordingly, the character of distributions and composition of net assets for tax purposes may differ from those reflected in the accompanying financial statements.
27
American Beacon ARK Transformational Innovation FundSM
Notes to Financial Statements
June 30, 2018
The tax character of distributions paid were as follows:
| Year Ended June 30, 2018 | From January 27, 2017A to June 30, 2017 | |||||||||||
Distributions paid from: | ||||||||||||
Ordinary income* | ||||||||||||
Institutional Class | $ | 167,116 | $ | - | ||||||||
Y Class | 100,684 | - | ||||||||||
Investors Class | 117,473 | - | ||||||||||
|
|
|
| |||||||||
Total distributions paid | $ | 385,273 | $ | - | ||||||||
|
|
|
| |||||||||
*For tax purposes, short-term capital gains are considered ordinary income distributions.
ACommencement of operations.
As of June 30, 2018, the components of distributable earnings (deficits) on a tax basis were as follows:
Fund | Tax Cost | Unrealized Appreciation | Unrealized (Depreciation) | Net Unrealized Appreciation (Depreciation) | ||||||||||||
ARK Transformational Innovation | $ | 24,003,684 | $ | 4,776,721 | $ | (1,608,332 | ) | $ | 3,168,389 | |||||||
Fund | Net Unrealized Appreciation (Depreciation) | Undistributed Ordinary Income | Undistributed Long-Term Capital Gains | Accumulated Capital and Other (Losses) | Other Temporary Differences | Distributable Earnings | ||||||||||||||||||
ARK Transformational Innovation | $ | 3,168,389 | $ | 494,077 | $ | 894,431 | $ | - | $ | - | $ | 4,556,897 | ||||||||||||
Financial reporting records are adjusted for permanent book/tax differences to reflect tax character. Financial records are not adjusted for temporary differences. The temporary differences between financial reporting and tax-basis reporting of unrealized appreciation (depreciation) are attributable primarily to the tax deferral of losses from wash sales.
Due to inherent differences in the recognition of income, expenses, and realized gains (losses) under U.S. GAAP and federal income tax regulations, permanent differences between book and tax reporting have been identified and appropriately reclassified on the Consolidated Statement of Assets and Liabilities.
Accordingly, the following amounts represent current year permanent differences derived from foreign currency reclasses, trust expense adjustments, ordinary loss offset to short-term capital gain, and distribution re-designations as of June 30, 2018:
Fund | Paid-In-Capital | Undistributed (Overdistribution of) Net Investment Income | Accumulated Net Realized Gain (Loss) | Net Unrealized Appreciation (Depreciation) | ||||||||||||
ARK Transformational Innovation | $ | - | $ | 72,910 | $ | (72,910 | ) | $ | - | |||||||
Under the Regulated Investment Company Modernization Act of 2010 (“RIC MOD”), net capital losses recognized by the Fund in taxable years beginning after December 22, 2010 are carried forward indefinitely and retain their character as short-term and/or long-term losses.
During the year June 30, 2018, the Fund did not have any capital loss carryforwards.
28
American Beacon ARK Transformational Innovation FundSM
Notes to Financial Statements
June 30, 2018
7. Investment Transactions
The aggregate cost of purchases and proceeds from sales and maturities of investments, other than short-term obligations, for the year ended June 30, 2018 were as follows:
Fund | Purchases (non-U.S. Government Securities) | Sales (non-U.S. Government Securities) | ||||||||||
| ARK Transformational Innovation | $ | 22,041,945 | $ | 7,190,094 | ||||||||
A summary of the Fund’s transactions in the USG Select Fund for the year ended June 30, 2018 are as follows:
Fund | Type of Transaction | June 30, 2017 Shares/Fair Value | Purchases | Sales | June 30, 2018 Shares/Fair Value | Dividend Income | ||||||||||||||||||||||||||||||||||||
| ARK Transformational Innovation | Direct | $ | 228,421 | $ | 15,782,669 | $ | 15,269,932 | $ | 741,158 | $ | 7,878 | |||||||||||||||||||||||||||||||
| ARK Transformational Innovation | Securities Lending | - | 24,999,603 | 22,080,137 | 2,919,466 | N/A | ||||||||||||||||||||||||||||||||||||
8. Securities Lending
The Fund may lend its securities to qualified financial institutions, such as certain broker-dealers, to earn additional income. The borrowers are required to secure their loans continuously with collateral in an amount at least equal to the fair value of the securities loaned, initially in an amount at least equal to 102% of the fair value of domestic securities loaned and 105% of the fair value of international securities loaned. Collateral is monitored and marked-to-market daily. Daily mark-to-market amounts are required to be paid to the borrower or received from the borrower by the end of the following business day. This one day settlement for mark-to-market amounts may result in the collateral being temporarily less than the value of the securities on loan or temporarily more than the required minimum collateral.
To the extent that a loan is collateralized by cash, such cash collateral shall be invested by the securities lending agent (the “Agent”) in money market mutual funds and other short-term investments, provided the investments meet certain quality and diversification requirements. Securities purchased with cash collateral proceeds are listed in the Fund’s Consolidated Schedule of Investments and the collateral is shown on the Consolidated Statement of Assets and Liabilities as a payable.
Securities lending income is generated from the demand premium (if any) paid by the borrower to borrow a specific security and from the return on investment of cash collateral, reduced by negotiated rebate fees paid to the borrower and transaction costs. To the extent that a loan is secured by non-cash collateral, securities lending income is generated as a demand premium reduced by transaction costs. The Fund, the Agent, and the Manager retained 80%, 10%, and 10%, respectively, of the income generated from securities lending.
While securities are on loan, the Fund continues to receive certain income associated with that security and any gain or loss in the market price that may occur during the term of the loan. In the case of domestic equities, the value of any dividend is received in the form of a substitute payment approximately equal to the dividend. In the case of foreign securities, a negotiated amount is received that is less than the actual dividend, but higher than the dividend amount minus the foreign tax that the Fund would be subject to on the dividend.
Securities lending transactions pose certain risks to the Fund, including that the borrower may not provide additional collateral when required or return the securities when due, that the value of the short-term investments will be less than the amount of cash collateral required to be returned to the borrower, that non-cash collateral may be subject to legal constraints in the event of a borrower bankruptcy, and that the cash collateral investments
29
American Beacon ARK Transformational Innovation FundSM
Notes to Financial Statements
June 30, 2018
could become illiquid and unable to be used to return collateral to the borrower. The Fund could also experience delays and costs in gaining access to the collateral. The Fund bears the risk of any deficiency in the amount of the cash collateral available for return to the borrower and any action which impairs its ability to liquidate non-cash collateral to satisfy a borrower default.
As of June 30, 2018, the value of outstanding securities on loan and the value of collateral were as follows:
Fund | Market Value of Securities on Loan | Cash Collateral Received | Non-Cash Collateral Received | Total Collateral Received | ||||||||||||
ARK Transformational Innovation | $ | 2,797,419 | $ | 2,919,466 | $ | - | $ | 2,919,466 | ||||||||
Cash collateral is listed on the Fund’s Consolidated Schedule of Investments and is shown on the Consolidated Statement of Assets and Liabilities. Income earned on these investments is included in “Income derived from securities lending” on the Consolidated Statement of Operations.
Non-cash collateral received by the Fund may not be sold or re-pledged except to satisfy a borrower default. Therefore, non-cash collateral is not included on the Fund’s Consolidated Schedule of Investments or Consolidated Statement of Assets and Liabilities.
9. Borrowing Arrangements
Effective November 16, 2017, the Fund, along with certain other funds managed by the Manager (“Participating Funds”), entered into a committed revolving line of credit (the “Committed Line”) agreement with State Street Bank and Trust Company (the “Bank”) to be used to facilitate portfolio liquidity. The maximum borrowing amount under the Committed Line is $50 million with interest at a rate equal to the higher of (a) one-month London Inter-Bank Offered Rate (“LIBOR”) plus 1.25% per annum or (b) the Federal Funds rate plus 1.25% per annum on amounts borrowed. Each of the Participating Funds will pay a commitment fee at a rate of 0.25% per annum on the unused portion of the Committed Line amount. The Committed Line expires November 15, 2018, unless extended by the Bank or terminated by the Participating Funds in accordance with the agreement.
Effective November 16, 2017, the Fund, along with certain other Participating Funds managed by the Manager, entered into an uncommitted discretionary demand revolving line of credit (the “Uncommitted Line”) agreement with the Bank to be used to facilitate portfolio liquidity. The maximum borrowing amount under the Uncommitted Line is $50 million with interest at a rate equal to the higher of (a) one-month LIBOR plus 1.25% per annum or (b) the Federal Funds rate. The Uncommitted Line expires November 15, 2018 unless extended by the Bank or terminated by the Participating Funds in accordance with the agreement.
The Participating Funds paid administration, legal and arrangement fees, which are recognized as a component of “Other expenses” on the Consolidated Statement of Operations, along with commitment fees, that have been allocated among the Participating Funds based on average daily net assets. During the year ended June 30, 2018, the Fund did not utilize this facility.
30
American Beacon ARK Transformational Innovation FundSM
Notes to Financial Statements
June 30, 2018
10. Capital Share Transactions
The tables below summarize the activity in capital shares for each Class of the Fund:
| Institutional Class | ||||||||||||||||||||||||||||
| Year Ended June 30, 2018 | January 27, 2017A to June 30, 2017 | |||||||||||||||||||||||||||
ARK Transformational Innovation Fund | Shares | Amount | Shares | Amount | ||||||||||||||||||||||||
| Shares sold | 121,016 | $ | 2,224,632 | - | B | $ | - | B | ||||||||||||||||||||
| Reinvestment of dividends | 10,278 | 167,117 | - | - | ||||||||||||||||||||||||
| Shares redeemed | - | (3 | ) | - | - | |||||||||||||||||||||||
|
|
|
|
|
|
|
| |||||||||||||||||||||
| Net increase in shares outstanding | 131,294 | $ | 2,391,746 | - | $ | - | ||||||||||||||||||||||
|
|
|
|
|
|
|
| |||||||||||||||||||||
| Y Class | ||||||||||||||||||||||||||||
| Year Ended June 30, 2018 | January 27, 2017A to June 30, 2017 | |||||||||||||||||||||||||||
ARK Transformational Innovation Fund | Shares | Amount | Shares | Amount | ||||||||||||||||||||||||
| Shares sold | 542,353 | $ | 8,991,190 | 1,924 | B | $ | 25,000 | B | ||||||||||||||||||||
| Reinvestment of dividends | 6,000 | 97,436 | - | - | ||||||||||||||||||||||||
| Shares redeemed | (27,847 | ) | (457,807 | ) | - | - | ||||||||||||||||||||||
|
|
|
|
|
|
|
| |||||||||||||||||||||
| Net increase in shares outstanding | 520,506 | $ | 8,630,819 | 1,924 | $ | 25,000 | ||||||||||||||||||||||
|
|
|
|
|
|
|
| |||||||||||||||||||||
| Investor Class | ||||||||||||||||||||||||||||
| Year Ended June 30, 2018 | January 27, 2017A to June 30, 2017 | |||||||||||||||||||||||||||
ARK Transformational Innovation Fund | Shares | Amount | Shares | Amount | ||||||||||||||||||||||||
| Shares sold | 529,735 | $ | 8,818,260 | 74,335 | B | $ | 951,354 | B | ||||||||||||||||||||
| Reinvestment of dividends | 7,231 | 117,221 | - | - | ||||||||||||||||||||||||
| Shares redeemed | (247,935 | ) | (4,043,012 | ) | - | (4 | ) | |||||||||||||||||||||
|
|
|
|
|
|
|
| |||||||||||||||||||||
| Net increase in shares outstanding | 289,031 | $ | 4,892,469 | 74,335 | $ | 951,350 | ||||||||||||||||||||||
|
|
|
|
|
|
|
| |||||||||||||||||||||
A Commencement of operations.
B Seed capital was received on January 27, 2017 in the amount of $2,800,000, $100,000 and $100,000 for the Institutional, Y and Investor Classes, respectively. As a result, shares were issued in the amount of 280,000, 10,000 and 10,000 for the Institutional, Y and Investor Classes, respectively.
11. Subsequent Events
Management has evaluated subsequent events for possible recognition or disclosure in the financial statements through the date the financial statements are issued. Management has determined that there are no material events that would require disclosure in the Fund’s financial statements through this date.
31
American Beacon ARK Transformational Innovation FundSM
(For a share outstanding throughout the period)
| Institutional Class | ||||||||||||
Year Ended | January 27, 2017A to June 30, 2017 | |||||||||||
|
| |||||||||||
Net asset value, beginning of period | $ | 12.87 | $ | 10.00 | ||||||||
|
|
|
| |||||||||
Income (loss) from investment operations: | ||||||||||||
Net investment income (loss) | 0.06 | (0.03 | ) | |||||||||
Net gains on investments (both realized and unrealized) | 6.25 | 2.90 | ||||||||||
|
|
|
| |||||||||
Total income from investment operations | 6.31 | 2.87 | ||||||||||
|
|
|
| |||||||||
Less distributions: | ||||||||||||
Dividends from net investment income | (0.09 | ) | – | |||||||||
Distributions from net realized gains | (0.49 | ) | – | |||||||||
|
|
|
| |||||||||
Total distributions | (0.58 | ) | – | |||||||||
|
|
|
| |||||||||
Net asset value, end of period | $ | 18.60 | $ | 12.87 | ||||||||
|
|
|
| |||||||||
Total returnB | 49.76 | % | 28.70 | %C | ||||||||
|
|
|
| |||||||||
Ratios and supplemental data: | ||||||||||||
Net assets, end of period | $ | 7,650,448 | $ | 3,603,636 | ||||||||
Ratios to average net assets: | ||||||||||||
Expenses, before reimbursements | 4.74 | % | 10.29 | %D | ||||||||
Expenses, net of reimbursementsE | 1.02 | % | 0.99 | %D | ||||||||
Net investment (loss), before expense reimbursements | (3.59 | )% | (10.01 | )%D | ||||||||
Net investment income (loss), net of reimbursements | 0.14 | % | (0.70 | )%D | ||||||||
Portfolio turnover rate | 59 | % | 28 | %F | ||||||||
| A | Commencement of operations. |
| B | Based on net asset value, which does not reflect the sales charge, redemption fee, or contingent deferred sales charge, if applicable. May include adjustments in accordance with U.S. GAAP and as such, the net asset value for reporting purposes and the returns based upon those net asset values may differ from the net asset value and returns for shareholder transactions. |
| C | Not annualized. |
| D | Annualized. |
| E | Expense ratios may exceed stated expense caps in Note 2 due to security lending expenses. |
| F | Portfolio turnover rate is for the period from January 27, 2017 through June 30, 2017 and is not annualized. |
See accompanying notes
32
American Beacon ARK Transformational Innovation FundSM
Financial Highlights
(For a share outstanding throughout the period)
| Y Class | ||||||||||||
| Year Ended June 30, 2018 | January 27, 2017B to June 30, 2017 | |||||||||||
|
| |||||||||||
Net asset value, beginning of period | $ | 12.87 | $ | 10.00 | ||||||||
|
|
|
| |||||||||
Income (loss) from investment operations: | ||||||||||||
Net investment (loss) | (0.02 | )A | (0.03 | ) | ||||||||
Net gains on investments (both realized and unrealized) | 6.30 | 2.90 | ||||||||||
|
|
|
| |||||||||
Total income from investment operations | 6.28 | 2.87 | ||||||||||
|
|
|
| |||||||||
Less distributions: | ||||||||||||
Dividends from net investment income | (0.09 | ) | - | |||||||||
Distributions from net realized gains | (0.49 | ) | - | |||||||||
|
|
|
| |||||||||
Total distributions | (0.58 | ) | - | |||||||||
|
|
|
| |||||||||
Net asset value, end of period | $ | 18.57 | $ | 12.87 | ||||||||
|
|
|
| |||||||||
Total returnC | 49.52 | % | 28.70 | %D | ||||||||
|
|
|
| |||||||||
Ratios and supplemental data: | ||||||||||||
Net assets, end of period | $ | 9,887,450 | $ | 153,410 | ||||||||
Ratios to average net assets: | ||||||||||||
Expenses, before reimbursements | 4.84 | % | 14.30 | %E | ||||||||
Expenses, net of reimbursementsF | 1.12 | % | 1.09 | %E | ||||||||
Net investment (loss), before expense reimbursements | (3.85 | )% | (14.01 | )%E | ||||||||
Net investment (loss), net of reimbursements | (0.13 | )% | (0.81 | )%E | ||||||||
Portfolio turnover rate | 59 | % | 28 | %G | ||||||||
| A | Per share amounts have been calculated using the average shares method. |
| B | Commencement of operations. |
| C | Based on net asset value, which does not reflect the sales charge, redemption fee, or contingent deferred sales charge, if applicable. May include adjustments in accordance with U.S. GAAP and as such, the net asset value for reporting purposes and the returns based upon those net asset values may differ from the net asset value and returns for shareholder transactions. |
| D | Not annualized. |
| E | Annualized. |
| F | Expense ratios may exceed stated expense caps in Note 2 due to security lending expenses. |
| G | Portfolio turnover rate is for the period from January 27, 2017 through June 30, 2017 and is not annualized. |
See accompanying notes
33
American Beacon ARK Transformational Innovation FundSM
Financial Highlights
(For a share outstanding throughout the period)
| Investor Class | ||||||||||||
| Year Ended June 30, 2018 | January 27, 2017B to June 30, 2017 | |||||||||||
|
| |||||||||||
Net asset value, beginning of period | $ | 12.85 | $ | 10.00 | ||||||||
|
|
|
| |||||||||
Income (loss) from investment operations: | ||||||||||||
Net investment income (loss) | (0.06 | )A | (0.02 | ) | ||||||||
Net gains on investments (both realized and unrealized) | 6.30 | 2.87 | ||||||||||
|
|
|
| |||||||||
Total income from investment operations | 6.24 | 2.85 | ||||||||||
|
|
|
| |||||||||
Less distributions: | ||||||||||||
Dividends from net investment income | (0.09 | ) | – | |||||||||
Distributions from net realized gains | (0.49 | ) | – | |||||||||
|
|
|
| |||||||||
Total distributions | (0.58 | ) | – | |||||||||
|
|
|
| |||||||||
Net asset value, end of period | $ | 18.51 | $ | 12.85 | ||||||||
|
|
|
| |||||||||
Total returnC | 49.28 | % | 28.50 | %D | ||||||||
|
|
|
| |||||||||
Ratios and supplemental data: | ||||||||||||
Net assets, end of period | $ | 6,910,383 | $ | 1,083,835 | ||||||||
Ratios to average net assets: | ||||||||||||
Expenses, before reimbursements | 4.96 | % | 12.53 | %E | ||||||||
Expenses, net of reimbursementsF | 1.40 | % | 1.37 | %E | ||||||||
Net investment (loss), before expense reimbursements | (3.92 | )% | (12.37 | )%E | ||||||||
Net investment (loss), net of reimbursements | (0.36 | )% | (1.21 | )%E | ||||||||
Portfolio turnover rate | 59 | % | 28 | %G | ||||||||
| A | Per share amounts have been calculated using the average shares method. |
| B | Commencement of operations. |
| C | Based on net asset value, which does not reflect the sales charge, redemption fee, or contingent deferred sales charge, if applicable. May include adjustments in accordance with U.S. GAAP and as such, the net asset value for reporting purposes and the returns based upon those net asset values may differ from the net asset value and returns for shareholder transactions. |
| D | Not annualized. |
| E | Annualized. |
| F | Expense ratios may exceed stated expense caps in Note 2 due to security lending expenses. |
| G | Portfolio turnover rate is for the period from January 27, 2017 through June 30, 2017 and is not annualized. |
See accompanying notes
34
American Beacon ARK Transformational Innovation FundSM
Federal Tax Information
June 30, 2018 (Unaudited)
Certain tax information regarding the Fund is required to be provided to shareholders based upon the Fund’s income and distributions for the taxable year ended June 30, 2018. The information and distributions reported herein may differ from information and distributions taxable to the shareholders for the calendar year ended December 31, 2017.
The Fund designated the following items with regard to distributions paid during the fiscal year ended June 30, 2018. All designations are based on financial information available as of this annual report and, accordingly, are subject to change. For each item, it is the intention of the Fund to designate the maximum amount permitted under the Internal Revenue Code of 1986, as amended, and the regulations there under.
Corporate Dividends-Received Deduction:
ARK Transformational Innovation | 1.00 | % |
Qualified Dividend Income:
ARK Transformational Innovation | 1.83 | % |
Long-Term Capital Gain Distributions:
ARK Transformational Innovation | $ | - |
Short-Term Capital Gain Distributions:
ARK Transformational Innovation | $ | 385,273 |
Shareholders will receive notification in January 2019 of the applicable tax information necessary to prepare their 2018 income tax returns.
35
Disclosure Regarding Approval of the Management and Investment Advisory Agreements (Unaudited)
At in-person meetings held on May 18, 2018 and June 5-6, 2018 (collectively, the “Meetings”), the Board of Trustees (“Board” or “Trustees”) considered and then, at its June 6, 2018 meeting, approved the renewal of:
(1) the Management Agreement between American Beacon Advisors, Inc. (“Manager”) and the American Beacon Funds (“Trust”), on behalf of the American Beacon ARK Transformational Innovation Fund (“Fund”); and
(2) the Investment Advisory Agreement among the Manager, ARK Investment Management LLC (the “subadvisor”), and the Trust, on behalf of the Fund.
The Management Agreement and the Investment Advisory Agreement are collectively referred to herein as the “Agreements.” In preparation for its consideration of the renewal of the Agreements, the Board undertook steps to gather and consider information furnished by the Manager, the subadvisor, Broadridge, Inc. (“Broadridge”) and Morningstar, Inc. (“Morningstar”). The Board, with the assistance of independent legal counsel, requested and received certain relevant information from the Manager and the subadvisor.
In advance of the Meetings, the Board’s Investment Committee and/or the Manager coordinated the production of information from Broadridge and Morningstar regarding the performance, fees and expenses of the Fund as well as information from the Manager and the subadvisor. At the Meetings, the Board considered the information provided. Further, the Board took into consideration information furnished to the Board throughout the year at regular meetings of the Board and its committees, as well as information specifically prepared in connection with the renewal process.
In connection with the Board’s consideration of the Agreements, the Trustees received and evaluated such information as they deemed necessary. The information requested on behalf of the Board included, among other information, the following materials. References herein to the “firm” refer to the Manager and/or the subadvisor.
| • | comparisons of the performance of an appropriate share class of the Fund to comparable investment companies and appropriate benchmark indices, including peer group averages and performance analyses from Broadridge, and to the performance of any similar accounts or a composite of similar accounts, as applicable, managed by the firm; |
| • | comparisons of the Fund’s management and subadvisory fee rates and expense ratio with the management fee rates paid by comparable mutual funds and their expense ratios, including peer group averages and fee and expense analyses from Broadridge, and the advisory fee rates charged to other clients for which similar services are provided by a firm; |
| • | a description of any applicable fee waivers and/or expense reimbursements in place for the Fund during the past year, and any proposed changes to the expense limitation arrangements; |
| • | the Manager’s and the subadvisor’s profitability with respect to the services that each provided to the Fund; |
| • | any actual or anticipated economies of scale in relation to the services the firm provides or will provide to the Fund and whether the current fee rates charged or to be charged to the Fund reflect these economies of scale for the benefit of the Fund’s investors; |
| • | an evaluation of other benefits to the firm or Fund as a result of their relationship, if any; |
| • | information regarding administrative, accounting-related, cash management and securities lending services that the Manager provides to the Fund and the fees that the Manager receives for such services; and |
| • | information regarding a firm’s financial condition, the personnel of the Manager who are assigned primary responsibility for managing the Fund, staffing levels, portfolio managers’ compensation, insurance coverage, material pending litigation, code of ethics, compliance matters, actual or potential conflicts of interest that the firm experiences, or anticipates that it will experience, in providing services to the Fund, and the Manager’s disaster recovery plans. |
36
Disclosure Regarding Approval of the Management and Investment Advisory Agreements (Unaudited)
The Board noted that the Manager provides management and administrative services to the Fund pursuant to the Management Agreement. The Board considered that many mutual funds have separate contracts governing each type of service and observed that, with respect to such mutual funds, the actual management fee rates provided by Broadridge for peer group funds reflect the combined advisory and administrative expenses, reduced by any fee waivers and/or reimbursements.
A firm may not have been able to, or opted not to, provide information in response to certain information requests, in which case the Board conducted its evaluation of the firm based on information that was provided. In such cases, the Board determined that the omission of any such information was not material to its considerations. The class of shares used for comparative performance purposes was the share class with the lowest expenses available for purchase by the general public, which was the Institutional Class. The Board also considered that the use of Institutional Class performance generally facilitates a meaningful comparison for expense and performance purposes.
Provided below is an overview of certain factors the Board considered in connection with its renewal and approval of the Agreements. The Board did not identify any particular information that was most relevant to its consideration to renew or approve each Agreement, and each Trustee may have afforded different weight to the various factors. Legal counsel to the independent Trustees provided the Board with a memorandum regarding its responsibilities pertaining to the renewal and approval of investment advisory contracts, such as the Agreements. The memorandum explained the regulatory requirements surrounding the Trustees’ process for evaluating investment advisors and the terms of investment advisory contracts. Based on its evaluation, the Board unanimously concluded that the terms of each Agreement were reasonable and fair and that the renewal and approval of each Agreement was in the best interests of the Fund and its shareholders.
Considerations With Respect to the Renewal of the Management Agreement and the Investment Advisory Agreement
In determining whether to renew the Agreements, the Trustees considered the best interests of the Fund. While the Management Agreement and the Investment Advisory Agreement for the Fund were considered at the Meetings, the Board considered the Fund’s investment management and subadvisory relationships separately.
In each instance, the Board considered, among other things, the following factors: (1) the nature, extent and quality of the services provided; (2) the investment performance of the Fund; (3) the costs incurred by the Manager in rendering services to the Fund and its resulting profits or losses; (4) comparisons of services and fee rates with contracts entered into by the Manager or the subadvisor or their affiliates with other clients (such as pension funds and other institutional clients); (5) the extent to which economies of scale, if any, have been taken into account in setting each fee rate schedule; (6) whether fee rate levels reflect economies of scale, if any, for the benefit of Fund investors; and (7) any other benefits derived or anticipated to be derived by the Manager or the subadvisor from their relationships with the Fund.
Nature, Extent and Quality of Services. With respect to the renewal of the Management Agreement, the Board considered, among other factors: the Fund’s performance since its inception on January 27, 2017; the length of service of key investment personnel at the Manager; the cost structure of the Fund; the Manager’s culture of compliance and support that reduce risks to the Fund; the Manager’s quality of services; the Manager’s active role in monitoring and, as appropriate, recommending additional or replacement subadvisors; and the Manager’s efforts to retain key employees and maintain staffing levels.
With respect to the renewal of the Investment Advisory Agreement, the Board considered the level of staffing and the size of the subadvisor. The Board also considered the adequacy of the resources committed to the Fund by the subadvisor, and whether those resources were commensurate with the needs of the Fund and are sufficient to sustain appropriate levels of performance and compliance needs. In this regard, the Board considered the financial stability of the subadvisor. The Board also considered the subadvisor’s representations regarding its compliance program and code of ethics. Based on the foregoing information, the Board concluded that the nature, extent and quality of the management and advisory services provided by the Manager and the subadvisor were appropriate for the Fund.
37
Disclosure Regarding Approval of the Management and Investment Advisory Agreements (Unaudited)
Investment Performance. The Board evaluated the comparative information provided by Broadridge and the Manager regarding the performance of the Fund relative to its Broadridge performance universe, Morningstar Category, and benchmark index, as well as the Fund’s Morningstar rating. The Board considered the information provided by Broadridge regarding Broadridge’s independent methodology for selecting the Fund’s Broadridge performance universe. The Board also considered that the performance universes selected by Broadridge may not provide appropriate comparisons for the Fund. In addition, the Board considered the performance reports and discussions with management at Board and Committee meetings throughout the year. The Board also evaluated the comparative information provided by the subadvisor regarding the performance of the Fund relative to the performance of a comparable investment account managed by the subadvisor and the Fund’s benchmark index. In addition, the Board considered the Manager’s recommendation to continue to retain the subadvisor. A discussion regarding the Board’s considerations with respect to the Fund’s performance appears below under “Additional Considerations and Conclusions with Respect to the Fund.”
Costs of the Services Provided to the Fund and the Profits Realized by the Manager from its Relationship with the Fund. In analyzing the cost of services and profitability of the Manager, the Board considered the revenues earned and the expenses incurred by the Manager, before and after the payment of distribution-related expenses by the Manager. The profits or losses were noted at both an aggregate level for all funds within the group of mutual funds sponsored by the Manager (the “Fund Complex”) and at an individual Fund level, with the Manager sustaining a loss before and after the payment of distribution-related expenses by the Manager. The Board also considered comparative information provided by the Manager regarding the Manager’s overall profitability with respect to the Fund Complex relative to the overall profitability of other firms in the mutual fund industry, as disclosed in publicly available sources. Although the Board noted that, in certain cases, the fee rates paid by other clients of the Manager are lower than the fee rates paid by the Fund, the Manager represented that, among other matters, the difference is attributable to the fact that the Manager does not perform administrative services for non-investment company clients and reflects the greater level of responsibility and regulatory requirements associated with managing the Fund.
The Board also noted that the Manager proposed to continue the expense waivers and reimbursements for the Fund that were in place during the last fiscal year. The Board further considered that, with respect to the Fund, the applicable Management Agreement provides for the Manager to receive a management fee comprised of an annualized fee that is retained by the Manager. In addition, the Board considered that the Manager receives fees for overseeing the securities lending program on behalf of the Fund. The Board also noted that certain share classes of the Fund maintain higher expense ratios in order to compensate third-party financial intermediaries.
In analyzing the fee rates charged by the subadvisor in connection with its investment advisory services to the Fund, the Board considered representations made by the subadvisor that the Manager has negotiated the lowest fee rate that the subadvisor charges for any comparable client accounts. The Board also considered the cost of services and profitability of the subadvisor, noting that the subadvisor had represented that it had not earned a profit with respect to the services that it provides to the Fund during the past year.
Based on the foregoing information, the Board concluded that the profitability levels of the Manager were reasonable in light of the services performed by the Manager and the profitability level of the subadvisor was reasonable in light of the services performed by the subadvisor. A discussion regarding the Board’s considerations with respect to the Fund’s fee rates is set forth below under “Additional Considerations and Conclusions with Respect to the Fund.”
Economies of Scale. In considering the reasonableness of the management and investment advisory fees rates, the Board considered whether economies of scale will be realized as the Fund grows and whether fee rate levels reflect these economies of scale for the benefit of Fund shareholders. In this regard, the Board considered that the Manager has negotiated breakpoints in the subadvisory fee rate for the Fund.
In addition, the Board noted the Manager’s representation that the Management Agreement contains fee schedule breakpoints at higher asset levels with respect to the Fund. Based on the foregoing information, the Board concluded that the Manager and subadvisor fee rate schedules for the Fund provide for a reasonable sharing of benefits from any economies of scale with the Fund.
38
Disclosure Regarding Approval of the Management and Investment Advisory Agreements (Unaudited)
Benefits Derived from the Relationship with the Fund. The Board considered the “fall-out” or ancillary benefits that accrue to the Manager and/or the subadvisor as a result of the advisory relationships with the Fund, including greater exposure in the marketplace with respect to the Manager’s or subadvisor’s investment process and expanding the level of assets under management by the Manager and the subadvisor. The Board also considered that the Manager may invest the Fund’s cash balances and cash collateral provided by the borrowers of the Fund’s securities in the American Beacon U.S. Government Money Market Select Fund, which the Manager manages directly. In addition, the Board noted that the subadvisor benefits from soft dollar arrangements for proprietary and/or third-party research. Based on the foregoing information, the Board concluded that the potential benefits accruing to the Manager and the subadvisor by virtue of their relationships with the Fund appear to be fair and reasonable.
Additional Considerations and Conclusions with Respect to the Fund
The performance comparisons below were made in comparison to the Fund’s Broadridge performance universe and Morningstar Category. With respect to the Broadridge performance universe, the 1st Quintile represents the top twenty percent of the universe based on performance and the 5th Quintile representing the bottom twenty percent of the universe based on performance. References below to the Fund’s Broadridge performance universe are to the universe of mutual funds with a comparable investment classification/objective included in the analysis provided by Broadridge.
The expense comparisons below were made in comparison to the Fund’s Broadridge expense universe and Broadridge expense group, with the 1st Quintile representing the top twenty percent of the universe or group based on lowest total expense and the 5th Quintile representing the bottom twenty percent of the universe or group based on highest total expense. References below to the Fund’s expense group and expense universe are to the respective group or universe of comparable mutual funds included in the analysis by Broadridge. A Broadridge expense group consists of the Fund and a representative sample of funds with similar operating structures and asset sizes, as selected by Broadridge. A Broadridge expense universe includes all funds in the investment classification/objective with a similar operating structure as the share class of the Fund included in the Broadridge comparative information and provides a broader view of expenses across the Fund’s investment classification/objective. The Trustees also considered the Fund’s Morningstar fee level category. In reviewing expenses, the Trustees considered the positive impact of fee waivers where applicable and the Manager’s agreement to continue the fee waivers. In addition, information regarding the subadvisor’s use of soft dollars was requested from the Manager and was considered by the Trustees.
In considering the renewal of the Management Agreement and the Investment Advisory Agreement with the subadvisor for the Fund, the Trustees considered the following additional factors:
Broadridge Total Expense Analysis Excluding 12b-1 Fees and Morningstar Fee Level Ranking
Compared to Broadridge Expense Group | 2nd Quintile | |
Compared to Broadridge Expense Universe | 4th Quintile | |
Morningstar Fee Level Ranking – Institutional Class | Average Expense Ratio |
Broadridge and Morningstar Performance Analysis (for the period indicated ended December 31, 2017)
Compared to Broadridge Performance Universe | Since Inception January 27, 2017 | 1st Quintile | ||
Compared to Morningstar Category | 6 Months | 1st Quintile |
The Trustees also considered: (1) information provided by the subadvisor regarding fee rates charged for managing accounts in the same strategy as the subadvisor manages the Fund; and (2) the Manager’s recommendation to continue to retain the subadvisor, based upon, among other factors, the relatively brief period that this Fund has been in operation.
Based on these and other considerations, the Trustees: (1) concluded that the fees paid to the Manager and the subadvisor under the Management and Investment Advisory Agreements are fair and reasonable; and (2) determined that the Fund and its shareholders would benefit from the Manager’s and subadvisor’s continued management of the Fund.
39
Trustees and Officers of the American Beacon FundsSM (Unaudited)
The Trustees and officers of the American Beacon Funds (the “Trust”) are listed below, together with their principal occupations during the past five years. The address of each person listed below is 220 Las Colinas Boulevard East, Suite 1200, Irving, Texas 75039. Each Trustee oversees thirty-six funds in the fund complex that includes the Trust, the American Beacon Select Funds, the American Beacon Institutional Funds Trust, the American Beacon Sound Point Enhanced Income Fund, and the American Beacon Apollo Total Return Fund. The Trust’s Statement of Additional Information contains additional information about the Trustees and is available without charge by calling 1-800-658-5811.
Name, Age and Address | Position, Term of Office and Length of Time Served with the Trust | Principal Occupation(s) During Past 5 Years and Current Directorships | ||
| INTERESTED TRUSTEES | Term | |||
Lifetime of Trust until removal, resignation or retirement* | ||||
| Alan D. Feld** (81) | Trustee since 1996 | Partner in the law firm of Akin, Gump, Strauss, Hauer & Feld, LLP (law firm) (1960-Present); Trustee, American Beacon Mileage Funds (1996-2012); Trustee, American Beacon Select Funds (1999-Present); Trustee, American Beacon Master Trust (1996-2012); Trustee, American Beacon Institutional Funds Trust (2017-Present); Trustee, American Beacon Sound Point Enhanced Income Fund (2018-Present); Trustee, American Beacon Apollo Total Return Fund (2018 - Present). | ||
| NON-INTERESTED | Term | |||
| TRUSTEES | Lifetime of Trust until removal, resignation or retirement* | |||
| Gilbert G. Alvarado (48) | Trustee since 2015 | Director, Kura MD, Inc. (local telehealth organization) (2015-present); Vice President & CFO, Sierra Health Foundation (health conversion private foundation) (2006-Present); Vice President & CFO, Sierra Health Foundation: Center for Health Program Management (California public benefit corporation) (2012-Present); Director, Innovative North State (2012-2015); Director, Sacramento Regional Technology Alliance (2011-2016); Director, Women’s Empowerment (2009-2014); Director, Valley Healthcare Staffing (2017-present); Trustee, American Beacon Select Funds (2015-Present); Trustee, American Beacon Institutional Funds Trust (2017-Present); Trustee, American Beacon Sound Point Enhanced Income Fund (2018-Present); Trustee, American Beacon Apollo Total Return Fund (2018-Present). | ||
| Joseph B. Armes (56) | Trustee since 2015 | Chairman & CEO, CSW Industrials f/k/a Capital Southwest Corporation (investment company) (2015-Present); Chairman of the Board of Capital Southwest Corporation, predecessor to CSW Industrials, Inc. (2014-present) (investment company); CEO, Capital Southwest Corporation (2013-2015); President & CEO, JBA Investment Partners (family investment vehicle) (2010-Present); Director and Chair of Audit Committee, RSP Permian (oil and gas producer) (2013-Present); Trustee, American Beacon Select Funds (2015-Present); Trustee, American Beacon Institutional Funds Trust (2017-Present); Trustee, American Beacon Sound Point Enhanced Income Fund (2018-Present); Trustee, American Beacon Apollo Total Return Fund (2018-Present). | ||
| Gerard J. Arpey (60) | Trustee since 2012 | Director, The Home Depot, Inc. (2015-Present); Partner, Emerald Creek Group (private equity firm) (2011-Present); Director, S.C. Johnson & Son, Inc. (privately held company) (2008-present); Trustee, American Beacon Select Funds (2012-Present); Trustee, American Beacon Institutional Funds Trust (2017-Present); Trustee, American Beacon Sound Point Enhanced Income Fund (2018-Present); Trustee, American Beacon Apollo Total Return Fund (2018-Present). | ||
40
Trustees and Officers of the American Beacon FundsSM (Unaudited)
Name, Age and Address | Position, Term of Office and Length of Time Served with the Trust | Principal Occupation(s) During Past 5 Years and Current Directorships | ||
| TRUSTEES (CONT.) | Term | |||
Lifetime of Trust until removal, resignation or retirement* | ||||
| Brenda A. Cline (57) | Trustee since 2004 | Chief Financial Officer, Treasurer and Secretary, Kimbell Art Foundation (1993-Present); Director, Tyler Technologies, Inc. (public sector software solutions company) (2014-Present); Director, Range Resources Corporation (oil and natural gas company) (2015-Present); Trustee, Cushing Closed-End Funds (2017-Present); Trustee, American Beacon Mileage Funds (2004-2012); Trustee, American Beacon Select Funds (2004-Present); Trustee, American Beacon Master Trust (2004-2012); Trustee, American Beacon Institutional Funds Trust (2017-Present); Trustee, American Beacon Sound Point Enhanced Income Fund (2018-Present); Trustee, American Beacon Apollo Total Return Fund (2018-Present). | ||
| Eugene J. Duffy (63) | Trustee since 2008 | Managing Director, Global Investment Management Distribution, Mesirow Financial (2016-Present); Managing Director, Institutional Services, Intercontinental Real Estate Corporation (2014-Present); Principal and Executive Vice President, Paradigm Asset Management (1994-2014); Director, Sunrise Bank of Atlanta (2008-2013); Trustee, American Beacon Mileage Funds (2008-2012); Trustee, American Beacon Select Funds (2008-Present); Trustee, American Beacon Master Trust (2008-2012); Trustee, American Beacon Institutional Funds Trust (2017-Present); Trustee, American Beacon Sound Point Enhanced Income Fund (2018-Present); Trustee, American Beacon Apollo Total Return Fund (2018-Present). | ||
| Claudia A. Holz*** (60) | Trustee since 2018 | Partner, KPMG LLP (1990 - 2017); Trustee, American Beacon Select Funds (2018-Present); Trustee, American Beacon Institutional Funds Trust (2018-Present); Trustee, American Beacon Sound Point Enhanced Income Fund (2018-Present); Trustee, American Beacon Apollo Total Return Fund (2018-Present). | ||
| Douglas A. Lindgren**** (56) | Trustee since 2018 | CEO North America, Carne Global Financial Services (2016-2017); Managing Director, IPS Investment Management and Global Head, Content Management, UBS Wealth Management (2010-2016); Managing Director, P&S Hedge Funds, UBS Wealth Management (2008-2010); Managing Director, Head of Alternative Investments, UBS Financial Services, Inc. (2005-2008); Trustee, American Beacon Select Funds (2018-Present); Trustee, American Beacon Institutional Funds Trust (2018-Present); Trustee, American Beacon Sound Point Enhanced Income Fund (2018-Present); Trustee, American Beacon Apollo Total Return Fund (2018-Present). | ||
| Richard A. Massman (74) | Trustee since 2004 Chairman since 2008 | Consultant and General Counsel Emeritus, Hunt Consolidated, Inc. (holding company engaged in oil and gas exploration and production, refining, real estate, farming, ranching and venture capital activities) (2009-Present); Trustee, American Beacon Mileage Funds (2004-2012); Trustee, American Beacon Select Funds (2004-Present); Trustee, American Beacon Master Trust (2004-2012); Trustee, American Beacon Institutional Funds Trust (2017-Present); Trustee, American Beacon Sound Point Enhanced Income Fund (2018-Present); Trustee, American Beacon Apollo Total Return Fund (2018-Present). | ||
| Barbara J. McKenna, CFA (55) | Trustee since 2012 | Managing Principal, Longfellow Investment Management Company (2005-Present); Trustee, American Beacon Select Funds (2012-Present); Trustee, American Beacon Institutional Funds Trust (2017-Present); Trustee, American Beacon Sound Point Enhanced Income Fund (2018-Present); Trustee, American Beacon Apollo Total Return Fund (2018-Present). | ||
41
Trustees and Officers of the American Beacon FundsSM (Unaudited)
Name, Age and Address | Position, Term of Office and Length of Time Served with the Trust | Principal Occupation(s) During Past 5 Years and Current Directorships | ||
| TRUSTEES (CONT.) | Term | |||
Lifetime of Trust until removal, resignation or retirement* | ||||
| R. Gerald Turner (72) | Trustee since 2001 | President, Southern Methodist University (1995-Present); Director, J.C. Penney Company, Inc. (1996-Present); Director, Kronus Worldwide Inc. (chemical manufacturing) (2003-Present); Trustee, American Beacon Mileage Funds (2001-2012); Trustee, American Beacon Select Funds (2001-Present); Trustee, American Beacon Master Trust (2001-2012); Trustee, American Beacon Institutional Funds Trust (2017-Present); Trustee, American Beacon Sound Point Enhanced Income Fund (2018-Present); Trustee, American Beacon Apollo Total Return Fund (2018-Present). | ||
| OFFICERS | Term | |||
| One Year | ||||
| Gene L. Needles, Jr. (63) | President since 2009 | CEO and Director (2009 - Present), and Chairman (2018-Present), American Beacon Advisors, Inc.; President, American Beacon Advisors (2009-2018); Chairman and CEO, Resolute Investment Managers, Inc. (2015-Present); Director, Resolute Acquisition, Inc. (2015-Present); President (2015-2018), Director, Resolute Topco, Inc. (2015-Present), President (2015-2018), CEO (2015-Present), and Chairman (2018-Present), Resolute Investment Holdings, LLC; President, CEO and Director, Lighthouse Holdings, Inc. (2009-2015); President and CEO, Lighthouse Holdings Parent, Inc. (2009-2015); Manager, President and CEO, American Private Equity Management, LLC (2012-Present); President, American Beacon Cayman Managed Futures Strategy Fund, Ltd. (2014-Present); Director, Chairman, President and CEO, Alpha Quant Advisors, LLC (2016-Present); Director, ARK Investment Management LLC (2016-Present); Director, Shapiro Capital Management LLC (2017-Present); Director and Vice President, American Beacon Cayman Transformational Innovation Company, LTD., (2017-Present); Vice President, American Beacon Delaware Transformational Innovation Corporation (2017-Present); Executive Vice President and Chief Operating Officer, Continuous Capital, LLC (2018-Present); Member, Investment Advisory Committee, Employees Retirement System of Texas (2017-Present); Trustee, American Beacon NextShares Trust (2015-Present); President, American Beacon Select Funds (2009-Present); President, American Beacon Mileage Funds (2009-2012); President, American Beacon Master Trust (2009-2012); President, American Beacon Institutional Funds Trust (2017-Present); President, American Beacon Sound Point Enhanced Income Fund (2018-Present); President, American Beacon Apollo Total Return Fund (2018-Present). | ||
42
Trustees and Officers of the American Beacon FundsSM (Unaudited)
Name, Age and Address | Position, Term of Office and Length of Time Served with the Trust | Principal Occupation(s) During Past 5 Years and Current Directorships | ||
| OFFICERS (CONT.) | Term | |||
| One Year | ||||
| Rosemary K. Behan (59) | VP, Secretary and Chief Legal Officer since 2006 | Vice President and Secretary, American Beacon Advisors, Inc. (2006-Present); Secretary, Resolute Investment Holdings, LLC (2015-Present) Secretary, Resolute Investment Managers, Inc. (2015-Present); Secretary, Resolute Topco, Inc. (2015-Present); Secretary, Resolute Acquisition, Inc. (2015-Present); Secretary, Lighthouse Holdings, Inc. (2008-2015); Secretary, Lighthouse Holdings Parent, Inc. (2008-2015); Secretary, American Private Equity Management, LLC (2008-Present); Secretary, American Beacon Cayman Managed Futures Strategy Fund, Ltd. (2014-Present); Secretary, Alpha Quant Advisors, LLC (2016-Present); Secretary, American Beacon Cayman Transformational Innovation Company, Ltd. (2017-Present); Secretary, American Beacon Delaware Transformational Innovation Corporation (2017-Present); Secretary, Resolute Investment Distributors, Inc. (2017-Present); Vice President and Secretary, Continuous Capital, LLC (2018-Present); Chief Legal Officer, Vice President and Secretary, American Beacon Select Funds (2006-Present); Chief Legal Officer, Vice President and Secretary, American Beacon Mileage Funds (2006-2012); Chief Legal Officer, Vice President and Secretary, American Beacon Master Trust (2006-2012); Chief Legal Officer, Vice President and Secretary, American Beacon Institutional Funds Trust (2017-Present); Vice Chief Legal Officer, Vice President and Secretary, American Beacon Sound Point Enhanced Income Fund (2018-Present); Chief Legal Officer, Vice President and Secretary American Beacon Apollo Total Return Fund (2018-Present). | ||
| Brian E. Brett (58) | VP since 2004 | Senior Vice President (2012-Present) and Vice President (2004-2012), American Beacon Advisors, Inc.; Vice President, Resolute Investment Distributors, Inc. (2017-Present); Vice President, American Beacon Select Funds (2004-Present); Vice President, American Beacon Mileage Funds (2004-2012); Vice President, American Beacon Master Trust (2004-2012); Vice President, American Beacon Institutional Funds Trust (2017-Present); Vice President American Beacon Sound Point Enhanced Income Fund (2018-Present); Vice President American Beacon Apollo Total Return Fund (2018-Present). | ||
| Paul B. Cavazos(49) | VP since 2016 | Chief Investment Officer and Senior Vice President, American Beacon Advisors, Inc. (2016-Present); Chief Investment Officer and Assistant Treasurer, DTE Energy (2007-2016); Vice President, American Beacon Select Funds (2016-Present); Vice President, American Beacon Institutional Funds Trust (2017-Present); Vice President American Beacon Sound Point Enhanced Income Fund (2018-Present); Vice President American Beacon Apollo Total Return Fund (2018-Present). | ||
| Erica Duncan (47) | VP Since 2011 | Vice President, American Beacon Advisors, Inc. (2011-Present); Vice President, American Beacon Select Funds (2011-Present); Vice President, American Beacon Mileage Funds (2011-2012); Vice President, American Beacon Master Trust (2011-2012); Vice President, American Beacon Institutional Funds Trust (2017-Present); Vice President American Beacon Sound Point Enhanced Income Fund (2018-Present); Vice President American Beacon Apollo Total Return Fund (2018-Present).. | ||
43
Trustees and Officers of the American Beacon FundsSM (Unaudited)
Name, Age and Address | Position, Term of Office and Length of Time Served with the Trust | Principal Occupation(s) During Past 5 Years and Current Directorships | ||
| OFFICERS (CONT.) | Term | |||
| One Year | ||||
| Melinda G. Heika (57) | Treasurer since 2010 | Treasurer, American Beacon Advisors, Inc. (2010-Present); Resolute Investment Managers, Inc. (2015-Present); Treasurer, Resolute Acquisition, Inc. (2015-Present); Treasurer, Resolute Topco, Inc. (2015-Present); Treasurer, Resolute Investment Holdings, LLC. (2015-Present); Treasurer, Lighthouse Holdings, Inc. (2010-2015); Treasurer, Lighthouse Holdings Parent Inc., (2010-2015); Treasurer, American Private Equity Management, LLC (2012-Present); Director and Treasurer, American Beacon Cayman Managed Futures Strategy Fund, Ltd. (2014-Present); Treasurer, Alpha Quant Advisors, LLC (2016-Present); Treasurer, American Beacon Cayman Transformational Innovation, Ltd. (2017-Present); Treasurer, American Beacon Delaware Transformational Innovation Corporation (2017-Present); Treasurer, Resolute Investment Distributors, Inc. (2017-2017); Treasurer and Chief Financial Officer, Continuous Capital, LLC (2018-Present); Treasurer, American Beacon Select Funds (2010-Present); Treasurer, American Beacon Mileage Funds (2010-2012); Treasurer, American Beacon Master Trust (2010-2012); Treasurer, American Beacon Institutional Funds Trust (2017-Present); Treasurer, American Beacon Sound Point Enhanced Income Fund (2018-Present); Treasurer, American Beacon Apollo Total Return Fund (2018-Present). | ||
| Terri L. McKinney (54) | VP since 2010 | Vice President (2009-Present) and Managing Director (2003-2009), American Beacon Advisors, Inc.; Vice President, Resolute Investment Managers, Inc. (2017-Present); Vice President, Alpha Quant Advisors, LLC (2016-Present); Vice President, Resolute Investment Managers, Inc. (2017-Present); Vice President, Continuous Capital, LLC (2018-Present); Vice President, American Beacon Select Funds (2010-Present); Vice President, American Beacon Mileage Funds (2010-2012); Vice President, American Beacon Master Trust (2010-2012); Vice President, American Beacon Institutional Funds Trust (2017-Present); Vice President, American Beacon Sound Point Enhanced Income Fund (2018-Present); Vice President, American Beacon Apollo Total Return Fund (2018-Present). | ||
44
Trustees and Officers of the American Beacon FundsSM (Unaudited)
Name, Age and Address | Position, Term of Office and Length of Time Served with the Trust | Principal Occupation(s) During Past 5 Years and Current Directorships | ||
| OFFICERS (CONT.) | Term | |||
| One Year | ||||
| Jeffrey K. Ringdahl (43) | VP since 2010 | Chief Operating Officer (2010-Present), Vice President (2010-2013), Senior Vice President (2013-Present), Director (2015-Present), and President (2018-Present), American Beacon Advisors, Inc.; Vice President (2012-Present) and Manager (2015-Present), American Private Equity Management, LLC; Senior Vice President, Lighthouse Holdings, Inc. (2013-2015); Senior Vice President, Lighthouse Holdings Parent, Inc. (2013-2015); Director and Vice President, American Beacon Cayman Managed Futures Strategy Fund, Ltd. (2014-Present); Trustee, American Beacon NextShares Trust (2015-Present); Director (2015-Present), Senior Vice Present(2015-2018), and President (2018-Present), Resolute Investment Holdings, LLC; Director (2015-Present), Senior Vice President (2015-2018) and President (2018-Present), Resolute Topco, Inc.; Director (2015-Present), Senior Vice President (2015-Present), and President (2018-Present), Resolute Acquisition, Inc.; Director (2015-Present), Senior Vice President (2015-2018), and President (2018-Present), Resolute Investment Managers, Inc.; Director, Executive Vice President and Chief Operating Officer, Alpha Quant Advisors, LLC (2016-Present); Director (2017-Present), Executive Vice President (2017-2018), and President (2018-Present), Resolute Investment Services, Inc.; Director and Executive Vice President, Resolute Investment Distributors, Inc. (2017-Present); Director, Shapiro Capital Management, LLC (2017-Present); Director and Vice President, American Beacon Cayman Transformational Innovation Company, LTD., (2017-Present); Vice President, American Beacon Delaware Transformational Innovation Corporation (2017-Present); Executive Vice President and Chief Operating Officer, Continuous Capital, LLC (2018-Present); Vice President, American Beacon Select Funds (2010-Present); Vice President, American Beacon Institutional Funds Trust (2017-Present); Vice President, American Beacon Sound Point Enhanced Income Fund (2018-Present); Vice President, American Beacon Apollo Total Return Fund (2018-Present) | ||
| Samuel J. Silver (55) | VP Since 2011 | Vice President, American Beacon Advisors, Inc. (2011-Present); Vice President, American Beacon Select Funds (2011-Present); Vice President, American Beacon Mileage Funds (2011-2012); Vice President, American Beacon Master Trust (2011-2012); American Beacon Institutional Funds Trust (2011-Present); Vice President, American Beacon Sound Point Enhanced Income Fund (2018-Present); Vice President, American Beacon Apollo Total Return Fund (2018-Present). | ||
| Christina E. Sears (46) | Chief Compliance Officer since 2004 and Asst. Secretary since 1999 | Chief Compliance Officer, American Beacon Advisors, Inc. (2004-Present); Chief Compliance Officer, American Private Equity Management, LLC (2012-Present); Chief Compliance Officer and Vice President, Alpha Quant Advisors, LLC (2016-Present); Vice President, Resolute Investment Managers, Inc. (2017-Present); Vice President, Continuous Capital, LLC (2018-Present); Chief Compliance Officer (2004-Present) and Assistant Secretary (1999-Present), American Beacon Select Funds; Chief Compliance Officer (2004-2012) and Assistant Secretary (1999-2012), American Beacon Mileage Funds; Chief Compliance Officer (2004-2012) and Assistant Secretary (1999-2012), American Beacon Master Trust; Chief Compliance Officer and Assistant Secretary, American Beacon Institutional Funds Trust (2017-Present); Chief Compliance Officer and Assistant Secretary, American Beacon Sound Point Enhanced Income Fund (2018-Present); Chief Compliance Officer and Assistant Secretary, American Beacon Apollo Total Return Fund (2018-Present). | ||
45
Trustees and Officers of the American Beacon FundsSM (Unaudited)
Name, Age and Address | Position, Term of Office and Length of Time Served with the Trust | Principal Occupation(s) During Past 5 Years and Current Directorships | ||
| OFFICERS (CONT.) | Term | |||
| One Year | ||||
| Sonia L. Bates (61) | Asst. Treasurer since 2011 | Assistant Treasurer, American Beacon Advisors, Inc. (2011-Present); Assistant Treasurer, Resolute Investment Managers, Inc. (2015-Present); Assistant Treasurer, Resolute Acquisition, Inc. (2015-Present); Assistant. Treasurer, Resolute Topco, Inc. (2015-Present); Assistant Treasurer, Resolute Investment Holdings, LLC.; Assistant Treasurer, Lighthouse Holdings, Inc. (2011-2015); Assistant Treasurer, Lighthouse Holdings Parent Inc. (2011-2015); Assistant Treasurer, American Private Equity Management, LLC (2012-Present); Assistant Treasurer, American Beacon Cayman Transformational Innovation Company, Ltd. (2017-Present); Assistant Treasurer, American Beacon Select Funds (2011-Present); Assistant Treasurer American Beacon Mileage Funds (2011-2012); Assistant Treasurer, American Beacon Master Trust (2011-2012); Assistant Treasurer, American Beacon Institutional Funds Trust (2017-Present); Assistant Treasurer, American Beacon Sound Point Enhanced Income Fund (2018-Present); Assistant Treasurer, American Beacon Apollo Total Return Fund (2018-Present). | ||
| Shelley D. Abrahams (43) | Assistant Secretary since 2008 | Assistant Secretary, American Beacon Advisors, Inc. (2008-Present); Assistant Secretary, American Beacon Select Funds (2008-Present); Assistant Secretary, American Beacon Mileage Funds (2008-2012); Assistant Secretary, American Beacon Master Trust (2008-2012); Assistant Secretary, American Beacon Institutional Funds Trust (2017-Present); Assistant Secretary, American Beacon Sound Point Enhanced Income Fund (2018-Present); Assistant Secretary, American Beacon Apollo Total Return Fund (2018-Present). | ||
| Rebecca L. Harris (51) | Assistant Secretary since 2010 | Vice President, American Beacon Advisors, Inc. (2016-Present); Vice President, Resolute Investment Managers, Inc. (2017-Present); Vice President, Alpha Quant Advisors, LLC (2016-Present); Vice President, Continuous Capital, LLC (2018-Present); Assistant Secretary, American Beacon Select Funds (2010-Present); Assistant Secretary, American Beacon Mileage Funds (2010-2012); Assistant Secretary, American Beacon Master Trust (2010-2012); Assistant Secretary, American Beacon Institutional Funds Trust (2017-Present); Assistant Secretary, American Beacon Sound Point Enhanced Income Fund (2018-Present); Assistant Secretary, American Beacon Apollo Total Return Fund (2018-Present). | ||
| Diana N. Lai (42) | Assistant Secretary since 2012 | Assistant Secretary, American Beacon Advisors, Inc. (2012-Present); Assistant Secretary, American Beacon Cayman Transformational Innovation Company, Ltd. (2017-Present); Assistant Secretary, American Beacon Select Funds (2012-Present); Assistant Secretary, American Beacon Institutional Funds Trust (2017-Present); Assistant Secretary, American Beacon Sound Point Enhanced Income Fund (2018-Present); Assistant Secretary, American Beacon Apollo Total Return Fund (2018-Present). | ||
| Teresa A. Oxford (59) | Assistant Secretary since 2015 | Assistant Secretary, American Beacon Advisors, Inc. (2015-Present); Assistant Secretary, Alpha Quant Advisors, LLC (2016-Present); Assistant Secretary, American Beacon Select Funds (2015-Present); Assistant Secretary, American Beacon Institutional Funds Trust (2017-Present); Assistant Secretary, American Beacon Sound Point Enhanced Income Fund (2018-Present); Assistant Secretary, American Beacon Apollo Total Return Fund (2018-Present). | ||
* As of 11/12/2014, the Board adopted a retirement plan that requires Trustees to retire no later than the last day of the calendar year in which they reach the age of 75.
** Mr. Feld is deemed to be an “interested person” of the Trusts, as defined by the 1940 Act. Mr. Feld’s law firm of Akin, Gump, Strauss, Hauer & Feld LLP has provided legal services within the past two fiscal years to one or more of the Trust’s sub-advisors.
*** Claudia A. Holz became a new Trustee to each of the Trusts on 4/1/2018.
**** Douglas A. Lindren became a new Trustee to each of the Trusts on 1/1/2018.
46
Privacy Policy
June 30, 2018 (Unaudited)
The American Beacon Funds recognize and respect the privacy of our shareholders. We are providing this notice to you so you will understand how shareholder information may be collected and used.
We may collect nonpublic personal information about you from one or more of the following sources:
| • | information we receive from you on applications or other forms; |
| • | information about your transactions with us or our service providers; and |
| • | information we receive from third parties. |
We do not disclose any nonpublic personal information about our customers or former customers to anyone, except as permitted by law.
We restrict access to your nonpublic personal information to those employees or service providers who need to know that information to provide products or services to you. To ensure the confidentiality of your nonpublic personal information, we maintain safeguards that comply with federal standards.
47
This page intentionally left blank.
48

Delivery of Documents
eDelivery is NOW AVAILABLE - Stop traditional mail delivery and receive your
shareholder reports and summary prospectus on-line. Sign up at
www.americanbeaconfunds.com
If you invest in the Fund through a financial institution, you may be able to receive the Fund’s regulatory mailings, such as the Prospectus, Annual Report and Semi-Annual Report, by e-mail. If you are interested in this option, please go to www.icsdelivery.com and search for your financial institution’s name or contact your financial institution directly.
To obtain more information about the Fund:
 |  | |
| By E-mail: | On the Internet: | |
| american_beacon.funds@ambeacon.com | Visit our website at www.americanbeaconfunds.com | |
By Telephone: Call (800) 658-5811 |
By Mail: American Beacon Funds P.O. Box 219643 Kansas City, MO 64121-9643 | |
| Availability of Quarterly Portfolio Schedules | Availability of Proxy Voting Policy and Records | |
| In addition to the Schedule of Investments provided in each semi-annual and annual report, the Fund files a complete schedule of its portfolio holdings with the Securities and Exchange Commission (“SEC”) on Form N-Q as of the first and third fiscal quarters. The Fund’s Forms N-Q are available on the SEC’s website at www.sec.gov. The Forms N-Q may also be reviewed and copied at the SEC’s Public Reference Section, 100 F Street, NE, Washington, D.C. 20549-2736. Information regarding the operation of the SEC’s Public Reference Room may be obtained by calling (800)-SEC-0330. A complete schedule of the Fund’s portfolio holdings is also available at www.americanbeaconfunds.com approximately twenty days after the end of each month. | A description of the policies and procedures the Fund uses to determine how to vote proxies relating to portfolio securities is available in the Fund’s Statement of Additional Information, is available free of charge on the Fund’s website www.americanbeaconfunds.com and by calling 1-800-967-9009 or by accessing the SEC’s website at www.sec.gov. The Fund’s proxy voting record for the most recent year ended June 30 is filed annually with the SEC on Form N-PX. The Fund’s Forms N-PX are available on the SEC’s website at www.sec.gov. The Fund’s proxy voting record may also be obtained by calling 1-800-967-9009. | |


Fund Service Providers:
CUSTODIAN State Street Bank and Trust Boston, Massachusetts | TRANSFER AGENT DST Asset Manager Solutions, Inc. Quincy, Massachusetts | INDEPENDENT REGISTERED PUBLIC ACCOUNTING FIRM PricewaterhouseCoopers LLP Boston, Massachusetts | DISTRIBUTOR Resolute Investment Distributors, Inc. Irving, Texas |
This report is prepared for shareholders of the American Beacon Funds and may be distributed to others only if preceded or accompanied by a current Prospectus or Summary Prospectus.
American Beacon Funds and American Beacon ARK Transformational Innovation Fund are service marks of American Beacon Advisors, Inc.
AR 6/18

About American Beacon Advisors
Since 1986, American Beacon Advisors has offered a variety of products and investment advisory services to numerous institutional and retail clients, including a variety of mutual funds, corporate cash management, and separate account management.
Our clients include defined benefit plans, defined contribution plans, foundations, endowments, corporations, financial planners, and other institutional investors. With American Beacon Advisors, you can put the experience of a multi-billion dollar asset management firm to work for your company.
TWENTYFOUR STRATEGIC INCOME FUND
Investing in derivative instruments involves liquidity, credit, interest rate and market risks. Investments in high yield securities are subject to greater levels of credit, interest rate, market and liquidity risks than investment-grade securities. Because the Fund may invest in fewer issuers than a more diversified portfolio, the fluctuating value of a single holding may have a greater effect on the value of the Fund. Investing in foreign and emerging market securities may involve heightened risk due to currency fluctuations and economic and political risks. Please see the prospectus for a complete discussion of the Fund’s risks. There can be no assurances that the investment objectives of this Fund will be met.
Any opinions herein, including forecasts, reflect our judgment as of the end of the reporting period and are subject to change. Each advisor’s strategies and each Fund’s portfolio composition will change depending on economic and market conditions. This report is not a complete analysis of market conditions, and, therefore, should not be relied upon as investment advice. Although economic and market information has been compiled from reliable sources, American Beacon Advisors, Inc. makes no representation as to the completeness or accuracy of the statements contained herein.
American Beacon Funds | June 30, 2018 |
| 1 | ||||
| 2 | ||||
| 5 | ||||
| 7 | ||||
| 8 | ||||
| 12 | ||||
| 15 | ||||
| 35 | ||||
| 39 | ||||
Disclosure Regarding Approvals of the Management and Investment Advisory Agreements | 40 | |||
| 44 | ||||
| 50 | ||||
| Back Cover | ||||
 | Dear Shareholders,
Since 1986, American Beacon has endeavored to provide investors with a disciplined approach to realizing long-term investment goals: Institutional wisdom + earned alpha = enduring value.
u We believe institutional wisdom comes from having more than 30 years of experience as manager of one of the country’s largest pension plans. As a fiduciary, we have built an investment due-diligence and oversight infrastructure, which we leverage across all our investment products. When selecting our investment managers, we focus on their people, processes and performance. We perform due-diligence reviews with each investment manager on a quarterly basis.
u We believe earned alpha – that is, the returns of an actively managed fund beyond a benchmark – comes from employing and engaging |
investment managers we believe are best-in-class and who have defined, repeatable and proven processes. Our experience has shown us that, while it’s important to be mindful of short-term considerations, having a long-term focus helps manage expectations, mitigate risks and realize goals. Thus, we seek relationships with leading investment managers who display a willingness to undertake time-intensive research strategies. The resulting investment portfolios are differentiated from their peers and allow incremental changes to help address periods of market volatility and economic uncertainty.
| u | We believe enduring value comes from “putting a portfolio in place and sticking with the plan.” Our mutual funds provide you with access to institutional-quality, research-intensive investment managers with diverse processes and styles. In the long run, having such access and spending time in the market – rather than trying to time the market – may better position you to reach your long-term investment goals. |
The markets and U.S. economy were robust during calendar year 2017. However, during periods of market volatility and economic uncertainty – such as what we’ve seen thus far in 2018 – investing for the long term requires conviction. It isn’t about identifying and anticipating the next big market move. It’s about identifying the right investment products for riding out those moves. It’s about developing an approach based on long-term participation, while seeking some measure of protection against ongoing volatility.
As a manager of managers, we strive to provide investment products that may enable investors to participate during market upswings while potentially insulating against market downswings. Many of the sub-advisors to our mutual funds pursue upside capture and/or downside protection using proprietary strategies. The investment teams behind our mutual funds seek to produce consistent, long-term results rather than focus only on short-term movements in the markets. In managing our investment products, we emphasize identifying opportunities that offer the potential for high quality and lower risk.
At American Beacon, our approach is more than a concept. It’s the cornerstone of our culture. And we strive to apply it at every turn as we seek to provide a well-diversified line of investment products for your portfolio.
Thank you for your continued interest in American Beacon. For additional information about our investment products or to access your account information, please visit our website at www.americanbeaconfunds.com.
Best Regards,

Gene L. Needles, Jr.
President
American Beacon Funds
1
June 30, 2018 (Unaudited)
During the 12-month period ended June 30, 2018, the global bond market, as measured by the investment-grade Bloomberg Barclays Global Aggregate Index, returned 1.36%. The U.S. Aggregate component of the Index returned -0.40%, the European component returned 3.48% and the Asia-Pacific component returned 2.34%.
The U.S. bond market was affected by rising interest rates and an improving economy, whereas the euro area and Japan were still actively engaged in quantitative easing, which kept interest rates low.
The yield of the U.S. Treasury’s 10-year note rose 0.55% during the period and ended at 2.9%. Germany’s 10-year bond was essentially unchanged at 0.3% and Japan’s 10-year bond was flat at 0.0%.
The period was characterized by two very different themes. It began in 2017 with a continuation of the bull-market rally in equity and credit markets as U.S. interest rates were only modestly higher. Volatility in several markets had reached historic lows and investor complacency was at a peak. However, by the turn of the year, economic growth in Europe, China and Japan showed signs of moderation and President Donald Trump had started touting the probability of global trade wars over perceived unfair trade practices. The serenity induced by extraordinarily accommodative global central banks was coming to an end.
Importantly, while the media was occupied with daily headlines about trade negotiations, the broader macroeconomic reality included: (1) the termination of the U.S. quantitative-easing program; (2) the Federal Reserve (the “Fed”) actively raising interest rates; and (3) the Fed beginning to reduce its balance sheet. The European Union had also commenced discussions related to the tapering of its quantitative-easing program, and Japan started questioning the efficacy of its monetary policy. Following a decade of easy money around the globe, central banks began changing direction. With the safety net of easy money gradually fading, investor uncertainty and market volatility began to increase.
Throughout the period under review, the U.S. dollar was mixed compared to other major global currencies. However, near the end of the period, the dollar began to appreciate due to improving U.S. economic growth and rising interest rates. The appreciation placed additional pressure on dollar-sensitive, emerging-market countries and hastened the increase in overall volatility.
The credit markets performed well during the period as the Bloomberg Barclays Global Credit Index (investment-grade only) returned 0.69%, and the Bloomberg Barclays Global High Yield Index returned 1.11%. Rising U.S. interest rates put pressure on investment-grade credit sectors, but high-yield markets held strong momentum into 2018, allowing them to outperform. However, at period end, the High Yield sector began to soften given broader uncertainty about the outlook.
According to the Bloomberg Barclays Global Capital Securities Index, Capital Securities (including Contingent Convertible bonds and Additional Tier capital bonds) returned 0.84% for the period. This was consistent with the outperformance of high yield and the European credit markets. The securitized sectors, including asset- and mortgage-backed issues, also performed well on a duration-adjusted basis, which reflected the strong credit markets.
At period end, all eyes were on the Fed as it contemplated additional rate hikes. The flattening U.S. Treasury yield curve and increasing volatility in global markets reflected investor skepticism about the outlook. However, the global bond markets could remain strong if policymakers heed their signals.
2
American Beacon TwentyFour Strategic Income FundSM
Performance Overview
June 30, 2018 (Unaudited)
The Investor Class of the American Beacon TwentyFour Strategic Income Fund (the “Fund”) returned 3.09% for the twelve-month period ended June 30, 2018, outperforming the Bloomberg Barclays Global Aggregate Index (the “Index”) return of 1.36% and the secondary index, the BofA Merrill Lynch 3 Month LIBOR Constant Maturity Index, return of 1.53% for the same period.
Comparison of Change in Value of a $10,000 Investment for the period from 4/3/2017 through 6/30/2018
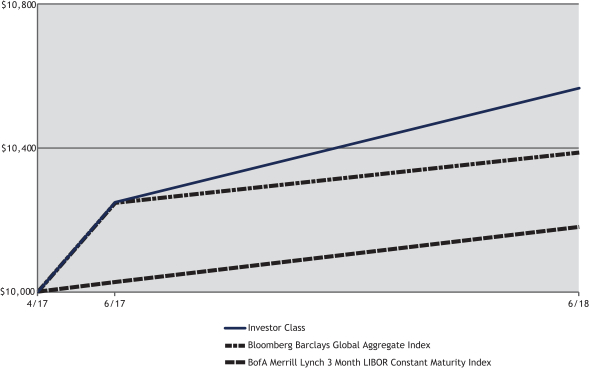
| Total Returns for the Period ended June 30, 2018 | ||||||||||||||||||||||
Ticker | 1 Year | Since Inception | Value of $10,000 04/03/2017- 06/30/2018 | |||||||||||||||||||
Institutional Class (1,3) | TFGIX | 3.49 | % | 4.93 | % | $ | 10,615.78 | |||||||||||||||
Y Class (1,3) | TFGYX | 3.39 | % | 4.85 | % | $ | 10,605.81 | |||||||||||||||
Investor Class (1,3) | TFGPX | 3.09 | % | 4.52 | % | $ | 10,564.39 | |||||||||||||||
Ultra Class (1,3) | TFGUX | 3.59 | % | 5.02 | % | $ | 10,626.29 | |||||||||||||||
Bloomberg Barclays Global Aggregate Index (2) | 1.36 | % | 3.08 | % | $ | 10,385.04 | ||||||||||||||||
BofA Merrill Lynch 3 Month LIBOR Constant Maturity Index (2) | 1.53 | % | 1.44 | % | $ | 10,179.62 | ||||||||||||||||
| 1. | Performance shown is historical and is not indicative of future returns. Investment returns and principal value will vary, and shares may be worth more or less at redemption than at original purchase. Performance shown is calculated based on the published end of day net asset values as of date indicated, and current performance may be lower or higher than the performance data quoted. To obtain performance as of the most recent month end, please visit www.americanbeaconfunds.com or call 1-800-967-9009. Fund performance in the table above does not reflect the deduction of taxes a shareholder would pay on distributions or the redemption of shares. Generally accepted accounting principles require adjustments to be made to the net assets of the Fund at period end for financial reporting purposes only; and as such, the total return based on the unadjusted net asset value per share may differ from the total return reported in the financial highlights. A portion of the fees charged to each Class of the Fund has been waived since Fund inception. Performance prior to waiving fees was lower than the actual returns shown since inception. |
| 2. | The BofA Merrill Lynch 3 Month LIBOR Constant Maturity Index tracks the performance of a synthetic asset paying LIBOR to a stated maturity. The index is based on the assumed purchase at par of a synthetic instrument having exactly its stated maturity and with a coupon equal to that day’s fixing rate. That issue is assumed to be sold the following business day (at a yield equal to the current day fixing rate) and rolled into a new instrument. The Bloomberg Barclays Global Aggregate Index tracks the performance of global investment-grade debt, including treasury, government-related, corporate and securitized fixed-rate bonds, denominated in local currencies from developed and emerging markets issuers. Securities must have at least one year until final maturity, or average life as applicable, and must meet minimum issue size criteria. One cannot directly invest in an index. |
3
American Beacon TwentyFour Strategic Income FundSM
Performance Overview
June 30, 2018 (Unaudited)
| 3. | The Total Annual Fund Operating Expense ratios set forth in the most recent Fund prospectus for the Institutional, Y, Investor, and Ultra Class shares were 0.87%, 0.97%, 1.24% and 0.84%, respectively. The expense ratios above may vary from the expense ratios presented in other sections of this report that are based on expenses incurred during the period covered by this report. |
The Fund’s outperformance was primarily a result of its lower duration and exposure to higher yielding securities. While the Fund held positions in local currencies in the UK, Europe and Australia, all foreign currency exposures were hedged back to the U.S. dollar.
The Fund’s shorter duration, at approximately 3.3 years during the period, was less than half of the Index duration of approximately 7.0 years and accounted for a large portion of the outperformance. U.S. interest rates rose as economic growth improved and the Federal Reserve Bank continued to raise the Federal Funds rate. The Fund maintained a low duration by holding a combination of short-maturity and floating-rate securities.
The 2-year U.S. Treasury note yield rose by 1.2% during the period and ended at 2.6%. The 30-year U.S. Treasury bond rose only 0.2% and ended with a yield of around 3.0%. The flattening of the yield curve indicated that, while economic growth was improving, investors had not yet begun to worry about inflation. One of the Fund’s larger sector exposures was in the financial sector, but many of those holdings were in European and UK issuers in countries where rising interest rates and flattening yield curves were not as prominent as in the U.S.
The Fund also outperformed due to its higher yield than that of the Index. The Fund’s yield of approximately 5.5% during the period was much higher than the Index yield of under 2%. Although the higher yielding credit segments of the market became volatile during the latter half of this period, most still outperformed. The period ended with unease in certain industries and emerging market economies given rising U.S. interest rates, an appreciating U.S. dollar and the potential for trade tariff disputes. The latent weakness, however, was not enough to disrupt investor enthusiasm as the fundamental backdrop in most developed economies remained positive.
The sub-advisor’s investment process incorporates top-down asset allocation and rigorous bottom-up credit analysis in a highly flexible approach that seeks to take advantage of prevailing market conditions. This team-based process has remained consistent since the Fund’s inception.
| Top Ten Holdings (% Net Assets) | ||||||||
| Australia Government Bond, Series 151, 2.000%, Due 12/21/2021 | 6.3 | |||||||
| U.S. Treasury Notes/Bonds, 1.000%, Due 11/30/2019 | 5.4 | |||||||
| Australia Government Bond, Series 153, 2.250%, Due 11/21/2022 | 4.9 | |||||||
| Italy Buoni Poliennali Del Tesoro, 0.950%, Due 3/1/2023 | 4.1 | |||||||
| U.S. Treasury Notes/Bonds, 2.500%, Due 3/31/2023 | 3.9 | |||||||
| Dryden 39 Euro CLO B.V., 2015-39X ER, 4.970%, Due 10/15/2031 | 3.0 | |||||||
| Coventry Building Society, 6.375%, Due 11/1/2019 | 2.9 | |||||||
| St Paul’s CLO VIII DAC, 8X E, 4.600%, Due 1/17/2030 | 2.9 | |||||||
| Nationwide Building Society, Series CCDS, 10.250%, Due 12/31/2049 | 2.3 | |||||||
| Carlyle Global Market Strategies Euro CLO DAC, 2016-1A DR, 4.770%, Due 5/17/2031 | 1.4 | |||||||
| Total Fund Holdings | 91 | |||||||
| Sector Allocation (% Fixed Income) | ||||||||
| Financial | 38.5 | |||||||
| Foreign Sovereign Obligations | 17.9 | |||||||
| Asset-Backed Obligations | 13.0 | |||||||
| U.S. Treasury Obligations | 11.0 | |||||||
| Communications | 6.9 | |||||||
| Energy | 6.1 | |||||||
| Consumer, Non-Cyclical | 3.6 | |||||||
| Industrial | 1.4 | |||||||
| Basic Materials | 1.1 | |||||||
| Consumer, Cyclical | 0.5 | |||||||
4
American Beacon TwentyFour Strategic Income FundSM
Expense Examples
June 30, 2018 (Unaudited)
Fund Expense Example
As a shareholder of a Fund, you incur two types of costs: (1) transaction costs, including sales charges (loads) on purchase payments and redemption fees, if applicable, and (2) ongoing costs, including management fees, distribution (12b-1) fees, sub-transfer agent fees, and other Fund expenses. The Examples are intended to help you understand the ongoing cost (in dollars) of investing in the Fund and to compare these costs with the ongoing costs of investing in other mutual funds. The Examples are based on an investment of $1,000 invested at the beginning of the period in each Class and held for the entire period from January 1, 2018 through June 30, 2018.
Actual Expenses
The “Actual” lines of the tables provide information about actual account values and actual expenses. You may use the information on this page, together with the amount you invested, to estimate the expenses that you paid over the period. Simply divide your account value by $1,000 (for example, an $8,600 account value divided by $1,000 = $8.60), then multiply the result by the “Expenses Paid During Period” to estimate the expenses you paid on your account during this period. Shareholders of the Investor and Institutional Classes that invest in the Fund through an IRA or Roth IRA may be subject to a custodial IRA fee of $15 that is typically deducted each December. If your account was subject to a custodial IRA fee during the period, your costs would have been $15 higher.
Hypothetical Example for Comparison Purposes
The “Hypothetical” lines of the tables provide information about hypothetical account values and hypothetical expenses based on the Fund’s actual expense ratio and an assumed 5% per year rate of return before expenses (not the Fund’s actual return). You may compare the ongoing costs of investing in the Fund with other funds by contrasting this 5% hypothetical example and the 5% hypothetical examples that appear in the shareholder reports of the other funds. The hypothetical account values and expenses may not be used to estimate the actual ending account balance or expenses you paid for the period. Shareholders of the Investor and Institutional Classes that invest in the Funds through an IRA or Roth IRA may be subject to a custodial IRA fee of $15 that is typically deducted each December. If your account was subject to a custodial IRA fee during the period, your costs would have been $15 higher.
You should also be aware that the expenses shown in the table highlight only your ongoing costs and do not reflect any transaction costs charged by the Fund, such as sales charges (loads) or redemption fees, as applicable. Similarly, the expense examples for other funds do not reflect any transaction costs charged by those funds, such as sales charges (loads), redemption fees or exchange fees. Therefore, the “Hypothetical” lines of the tables are useful in comparing ongoing costs only and will not help you determine the relative total costs of owning different funds. If you were subject to any transaction costs during the period, your costs would have been higher.
5
American Beacon TwentyFour Strategic Income FundSM
Expense Examples
June 30, 2018 (Unaudited)
| American Beacon TwentyFour Strategic Income Fund |
| Beginning Account Value 1/1/2018 | Ending Account Value 6/30/2018 | Expenses Paid During Period 1/1/2018-6/30/2018* | ||||||||||
| Institutional Class | ||||||||||||
| Actual | $ | 1,000.00 | $ | 995.00 | $ | 3.56 | ||||||
| Hypothetical** | $ | 1,000.00 | $ | 1,021.20 | $ | 3.61 | ||||||
| Y Class | ||||||||||||
| Actual | $ | 1,000.00 | $ | 995.00 | $ | 4.06 | ||||||
| Hypothetical** | $ | 1,000.00 | $ | 1,020.70 | $ | 4.11 | ||||||
| Investor Class | ||||||||||||
| Actual | $ | 1,000.00 | $ | 993.00 | $ | 5.39 | ||||||
| Hypothetical** | $ | 1,000.00 | $ | 1,019.40 | $ | 5.46 | ||||||
| Ultra Class | ||||||||||||
| Actual | $ | 1,000.00 | $ | 996.00 | $ | 3.32 | ||||||
| Hypothetical** | $ | 1,000.00 | $ | 1,021.50 | $ | 3.36 | ||||||
| * | Expenses are equal to the Fund’s annualized expense ratios for the six-month period of 0.72%, 0.82%, 1.09%, and 0.67% for the Institutional, Y, Investor, and Ultra Classes, respectively, multiplied by the average account value over the period, multiplied by the number derived by dividing the number of days in the most recent fiscal half-year (181) by days in the year (365) to reflect the half-year period. |
| ** | 5% return before expenses. |
6
American Beacon TwentyFour Strategic Income FundSM
Report of Independent Registered Public Accounting Firm
To the Board of Trustees of American Beacon Funds and Shareholders of American Beacon TwentyFour Strategic Income Fund
Opinion on the Financial Statements
We have audited the accompanying statement of assets and liabilities, including the schedule of investments, of American Beacon TwentyFour Strategic Income Fund (one of the series constituting American Beacon Funds, referred to hereafter as the “Fund”) as of June 30, 2018, the related statement of operations for the year ended June 30, 2018, and the statement of changes in net assets and the financial highlights for the year ended June 30, 2018 and for the period April 3, 2017 (commencement of operations) through June 30, 2017, including the related notes (collectively referred to as the “financial statements”). In our opinion, the financial statements present fairly, in all material respects, the financial position of the Fund as of June 30, 2018, the results of its operations for the year ended June 30, 2018, and the changes in its net assets and the financial highlights for the year ended June 30, 2018 and for the period April 3, 2017 (commencement of operations) through June 30, 2017 in conformity with accounting principles generally accepted in the United States of America.
Basis for Opinion
These financial statements are the responsibility of the Fund’s management. Our responsibility is to express an opinion on the Fund’s financial statements based on our audits. We are a public accounting firm registered with the Public Company Accounting Oversight Board (United States) (“PCAOB”) and are required to be independent with respect to the Fund in accordance with the U.S. federal securities laws and the applicable rules and regulations of the Securities and Exchange Commission and the PCAOB.
We conducted our audits of these financial statements in accordance with the standards of the PCAOB. Those standards require that we plan and perform the audit to obtain reasonable assurance about whether the financial statements are free of material misstatement, whether due to error or fraud.
Our audits included performing procedures to assess the risks of material misstatement of the financial statements, whether due to error or fraud, and performing procedures that respond to those risks. Such procedures included examining, on a test basis, evidence regarding the amounts and disclosures in the financial statements. Our audits also included evaluating the accounting principles used and significant estimates made by management, as well as evaluating the overall presentation of the financial statements. Our procedures included confirmation of securities owned as of June 30, 2018 by correspondence with the custodian, transfer agent and broker; when replies were not received from brokers, we performed other auditing procedures. We believe that our audits provide a reasonable basis for our opinion.
Boston, MA
August 24, 2018
We have served as the auditor of one or more American Beacon investment companies since 2016.
7
American Beacon TwentyFour Strategic Income FundSM
June 30, 2018
| Principal Amount* | Fair Value | ||||||||||||||
| CORPORATE OBLIGATIONS - 6.12% | |||||||||||||||
| Communications - 2.17% | |||||||||||||||
| CSC Holdings LLC, 10.875%, Due 10/15/2025A | $ | 400,000 | $ | 461,120 | |||||||||||
| Sprint Corp., 7.875%, Due 9/15/2023 | 375,000 | 388,828 | |||||||||||||
|
| ||||||||||||||
| 849,948 | |||||||||||||||
|
| ||||||||||||||
| Consumer, Non-Cyclical - 0.93% | |||||||||||||||
| CHS/Community Health Systems, Inc., | |||||||||||||||
5.125%, Due 8/1/2021 | 110,000 | 101,750 | |||||||||||||
6.250%, Due 3/31/2023 | 75,000 | 68,719 | |||||||||||||
| Pilgrim’s Pride Corp., 5.750%, Due 3/15/2025A | 200,000 | 192,000 | |||||||||||||
|
| ||||||||||||||
| 362,469 | |||||||||||||||
|
| ||||||||||||||
| Energy - 3.02% | |||||||||||||||
| Cheniere Corpus Christi Holdings LLC, 7.000%, Due 6/30/2024 | 500,000 | 545,000 | |||||||||||||
| CNX Midstream Partners LP / CNX Midstream Finance Corp., 6.500%, Due 3/15/2026A | 275,000 | 267,437 | |||||||||||||
| EP Energy LLC / Everest Acquisition Finance, Inc., 8.000%, Due 11/29/2024A | 365,000 | 368,650 | |||||||||||||
|
| ||||||||||||||
| 1,181,087 | |||||||||||||||
|
| ||||||||||||||
Total Corporate Obligations (Cost $2,437,410) | 2,393,504 | ||||||||||||||
|
| ||||||||||||||
| FOREIGN CORPORATE OBLIGATIONS - 49.68% | |||||||||||||||
| Basic Materials - 1.03% | |||||||||||||||
| Lecta S.A., 6.500%, Due 8/1/2023B | EUR | 170,000 | 195,548 | ||||||||||||
| Suzano Austria GmbH, 7.000%, Due 3/16/2047A | 200,000 | 205,750 | |||||||||||||
|
| ||||||||||||||
| 401,298 | |||||||||||||||
|
| ||||||||||||||
| Communications - 4.44% | |||||||||||||||
| Altice France SA, 6.000%, Due 5/15/2022A | 400,000 | 401,420 | |||||||||||||
| Altice Luxembourg S.A., 7.250%, Due 5/15/2022B | EUR | 300,000 | 352,092 | ||||||||||||
| Turkcell Iletisim Hizmetleri A/S, 5.750%, Due 10/15/2025B | 200,000 | 192,910 | |||||||||||||
| TV Azteca S.A.B. de C.V., 8.250%, Due 8/9/2024B | 400,000 | 390,200 | |||||||||||||
| VTR Finance B.V., 6.875%, Due 1/15/2024B | 400,000 | 401,880 | |||||||||||||
|
| ||||||||||||||
| 1,738,502 | |||||||||||||||
|
| ||||||||||||||
| Consumer, Cyclical - 0.49% | |||||||||||||||
| Intralot Capital Luxembourg S.A., 5.250%, Due 9/15/2024A | EUR | 200,000 | 193,177 | ||||||||||||
|
| ||||||||||||||
| Consumer, Non-Cyclical - 2.49% | |||||||||||||||
| Coca-Cola Icecek A/S, 4.215%, Due 9/19/2024B | 200,000 | 186,346 | |||||||||||||
| Kernel Holding S.A., 8.750%, Due 1/31/2022B | 200,000 | 196,040 | |||||||||||||
| MARB BondCo PLC, 6.875%, Due 1/19/2025B | 200,000 | 190,000 | |||||||||||||
| Marfrig Holdings Europe B.V., 6.875%, Due 6/24/2019B | 200,000 | 203,250 | |||||||||||||
| MHP SE, 7.750%, Due 5/10/2024B | 200,000 | 200,152 | |||||||||||||
|
| ||||||||||||||
| 975,788 | |||||||||||||||
|
| ||||||||||||||
| Energy - 2.82% | |||||||||||||||
| Gazprom OAO Via Gaz Capital S.A., 4.250%, Due 4/6/2024B | GBP | 120,000 | 161,210 | ||||||||||||
| Petrobras Global Finance B.V., 6.250%, Due 12/14/2026 | GBP | 150,000 | 199,200 | ||||||||||||
| Petroleos Mexicanos, 3.750%, Due 11/16/2025B | GBP | 150,000 | 185,514 | ||||||||||||
| Transocean Phoenix Ltd., 7.750%, Due 10/15/2024A | 518,500 | 555,443 | |||||||||||||
|
| ||||||||||||||
| 1,101,367 | |||||||||||||||
|
| ||||||||||||||
| Financial - 37.04% | |||||||||||||||
| Aareal Bank AG, 7.625%, Due 4/30/2020, (1-Yr. Annual EUR Swap + 7.180%)B C | EUR | 200,000 | 243,772 | ||||||||||||
| Aldermore Group PLC, 8.500%, Due 10/28/2026, (5-Yr. GBP Swap + 7.784%)B C | GBP | 100,000 | 149,792 | ||||||||||||
| ASR Nederland N.V., 4.625%, Due 10/19/2027B D | EUR | 400,000 | 444,965 | ||||||||||||
| Assicurazioni Generali SpA, 6.416%, Due 2/8/2022, (3-mo. GBP LIBOR + 2.200%)B C | GBP | 300,000 | 406,788 | ||||||||||||
| ATF Netherlands B.V., 3.750%, Due 1/20/2023, (5-Yr. Annual EUR Swap + 4.375%)B C | EUR | 300,000 | 352,876 | ||||||||||||
| Aviva PLC, 6.875%, Due 11/21/2019, (5-Yr. UK Government Bond + 2.970%)C | GBP | 135,000 | 186,095 | ||||||||||||
| AXA S.A., 6.463%, Due 12/14/2018, (3-mo. USD LIBOR + 1.449%)B C | $ | 385,000 | 376,337 | ||||||||||||
See accompanying notes
8
American Beacon TwentyFour Strategic Income FundSM
Schedule of Investments
June 30, 2018
| Principal Amount* | Fair Value | ||||||||||||||
| FOREIGN CORPORATE OBLIGATIONS - 49.68% (continued) | |||||||||||||||
| Financial - 37.04% (continued) | |||||||||||||||
| Banco Bilbao Vizcaya Argentaria S.A., 8.875%, Due 4/14/2021, (5-Yr. Annual EUR Swap + 9.177%)B C | EUR | 200,000 | $ | 261,598 | |||||||||||
| Banco de Sabadell S.A., 6.500%, Due 5/18/2022, (5-Yr. Annual EUR Swap + 6.414%)B C | EUR | 400,000 | 466,559 | ||||||||||||
| Banco Mercantil del Norte S.A., 5.750%, Due 10/4/2031, (5-Yr. CMT + 4.447%)B C | 400,000 | 366,000 | |||||||||||||
| Banco Santander S.A., 6.750%, Due 4/25/2022, (5-Yr. Annual EUR Swap + 6.803%)B C | EUR | 200,000 | 250,785 | ||||||||||||
| Bank of Ireland, 7.375%, Due 6/18/2020, (5-Yr. Annual EUR Swap + 6.956%)B C | EUR | 200,000 | 250,493 | ||||||||||||
| Barclays PLC, 7.875%, Due 9/15/2022, (5-Yr. GBP Swap + 6.099%)B C | GBP | 200,000 | 279,787 | ||||||||||||
| Bracken MidCo1 PLC, 10.500%, Due 11/15/2021, Cash (10.500%) or PIK (in-kind rate 11.250%)B | GBP | 300,000 | 413,743 | ||||||||||||
| Cabot Financial Luxembourg S.A., | |||||||||||||||
8.375%, Due 8/1/2020B | GBP | 100,000 | 133,466 | ||||||||||||
7.500%, Due 10/1/2023B | GBP | 300,000 | 402,854 | ||||||||||||
| CaixaBank S.A., 6.750%, Due 6/13/2024, (5-Yr. Annual EUR Swap + 6.498%)B C | EUR | 400,000 | 496,315 | ||||||||||||
| CNP Assurances, 7.375%, Due 9/30/2041, (12-mo. GBP LIBOR + 4.482%)B C | GBP | 100,000 | 147,749 | ||||||||||||
| Coventry Building Society, 6.375%, Due 11/1/2019, (5-Yr. GBP Swap + 4.113%)B C | GBP | 850,000 | 1,144,224 | ||||||||||||
| Credit Suisse Group AG, 7.500%, Due 12/11/2023, (5-Yr. Semi-Annual USD Swap + 4.598%)B C | 500,000 | 516,250 | |||||||||||||
| Deutsche Pfandbriefbank AG, 5.750%, Due 4/28/2023, Series 3529B D | EUR | 200,000 | 218,379 | ||||||||||||
| Ethias S.A., 5.000%, Due 1/14/2026B | EUR | 200,000 | 258,402 | ||||||||||||
| Garfunkelux Holdco S.A., 8.500%, Due 11/1/2022B | GBP | 400,000 | 512,222 | ||||||||||||
| Haya Finance S.A., 5.250%, Due 11/15/2022A | EUR | 100,000 | 103,766 | ||||||||||||
| Hiscox Ltd., 6.125%, Due 11/24/2045, (3-mo. GBP LIBOR + 5.076%)B C | GBP | 120,000 | 173,653 | ||||||||||||
| Intesa Sanpaolo SpA, 6.250%, Due 5/16/2024, (5-Yr. Annual EUR Swap + 5.856%)B C | EUR | 450,000 | 517,478 | ||||||||||||
| Jerrold Finco PLC, 6.125%, Due 1/15/2024B | GBP | 150,000 | 198,965 | ||||||||||||
| Legal & General Group PLC, 5.875%, Due 4/1/2019, (5-Yr. UK Government Bond + 2.330%)C | GBP | 120,000 | 161,141 | ||||||||||||
| Liverpool Victoria Friendly Society Ltd., 6.500%, Due 5/22/2043, (5-Yr. UK Government Bond + 5.630%)B C | GBP | 250,000 | 360,121 | ||||||||||||
| Lloyds Bank PLC, 13.000%, Due 1/21/2029, (5-Yr. UK Government Bond + 13.400%)C | GBP | 100,000 | 232,856 | ||||||||||||
| Nationwide Building Society, | |||||||||||||||
6.875%, Due 6/20/2019, (5-Yr. GBP Swap + 4.880%)B C | GBP | 300,000 | 404,209 | ||||||||||||
10.250%, Due 12/31/2049, Series CCDSB D | GBP | 466,700 | 911,573 | ||||||||||||
| Old Mutual PLC, 8.000%, Due 6/3/2021B | GBP | 200,000 | 291,005 | ||||||||||||
| OneSavings Bank PLC, 9.125%, Due 5/25/2022, (5-Yr. GBP Swap + 8.359%)B C | GBP | 200,000 | 270,219 | ||||||||||||
| Paragon Banking Group PLC, 7.250%, Due 9/9/2026, (5-Yr. GBP Swap + 6.731%)B C | GBP | 100,000 | 140,095 | ||||||||||||
| Pension Insurance Corp. PLC, 6.500%, Due 7/3/2024B | GBP | 100,000 | 147,159 | ||||||||||||
| Phoenix Group Holdings, 6.625%, Due 12/18/2025B | GBP | 250,000 | 363,791 | ||||||||||||
| Principality Building Society, 7.000%, Due 6/1/2020, (5-Yr. UK Government Bond + 3.000%)C | GBP | 182,000 | 249,500 | ||||||||||||
| Royal Bank of Scotland Group PLC, | |||||||||||||||
2.006%, Due 9/30/2018, (3-mo. EUR EURIBOR + 2.330%)B C | EUR | 200,000 | 228,889 | ||||||||||||
5.500%, Due 9/30/2018 | EUR | 150,000 | 176,405 | ||||||||||||
| Shawbrook Group PLC, 7.875%, Due 12/8/2022B D | GBP | 200,000 | 245,474 | ||||||||||||
| Standard Chartered PLC, 7.750%, Due 4/2/2023, (5-Yr. Semi-Annual USD Swap + 5.723%)B C | 200,000 | 205,000 | |||||||||||||
| UBS Group Funding AG, 5.750%, Due 2/19/2022, (5-Yr. Annual EUR Swap + 5.287%)B C | EUR | 200,000 | 251,920 | ||||||||||||
| UnipolSai Assicurazioni SpA, 5.750%, Due 6/18/2024, (3-mo. EUR EURIBOR + 5.180%)B C | EUR | 150,000 | 166,808 | ||||||||||||
| Virgin Money Holdings UK PLC, 8.750%, Due 11/10/2021, (5-Yr. GBP Swap + 7.930%)B C | GBP | 300,000 | 411,267 | ||||||||||||
|
| ||||||||||||||
| 14,490,745 | |||||||||||||||
|
| ||||||||||||||
| Industrial - 1.37% | |||||||||||||||
| ARD Finance S.A., 6.625%, Due 9/15/2023, PIK (in-kind rate 7.375%) | EUR | 150,000 | 178,192 | ||||||||||||
| Hidrovias International Finance SARL, 5.950%, Due 1/24/2025B | $ | 400,000 | 359,004 | ||||||||||||
|
| ||||||||||||||
| 537,196 | |||||||||||||||
|
| ||||||||||||||
Total Foreign Corporate Obligations (Cost $19,959,284) | 19,438,073 | ||||||||||||||
|
| ||||||||||||||
| FOREIGN SOVEREIGN OBLIGATIONS - 17.16% | |||||||||||||||
| African Export-Import Bank, 4.125%, Due 6/20/2024B | 400,000 | 380,080 | |||||||||||||
| Australia Government Bond, | |||||||||||||||
2.000%, Due 12/21/2021, Series 151B | AUD | 3,321,000 | 2,447,057 | ||||||||||||
2.250%, Due 11/21/2022, Series 153 | AUD | 2,570,000 | 1,902,910 | ||||||||||||
| Italy Buoni Poliennali Del Tesoro, | |||||||||||||||
0.350%, Due 6/15/2020 | EUR | 345,000 | 400,017 | ||||||||||||
0.950%, Due 3/1/2023 | EUR | 1,406,000 | 1,584,899 | ||||||||||||
|
| ||||||||||||||
Total Foreign Sovereign Obligations (Cost $6,822,539) | 6,714,963 | ||||||||||||||
|
| ||||||||||||||
See accompanying notes
9
American Beacon TwentyFour Strategic Income FundSM
Schedule of Investments
June 30, 2018
| Principal Amount* | Fair Value | ||||||||||||||
| ASSET-BACKED OBLIGATIONS - 12.51% | |||||||||||||||
| Aurium CLO III DAC, 4.900%, Due 4/15/2030, 3X E, (3-mo. EUR EURIBOR + 4.900%)B C | EUR | 190,000 | $ | 221,698 | |||||||||||
| Carlyle Global Market Strategies Euro CLO DAC, 4.770%, Due 5/17/2031, 2016-1A DRA D | EUR | 500,000 | 557,779 | ||||||||||||
| Dryden 39 Euro CLO B.V., 4.970%, Due 10/15/2031, 2015-39X ERB D | EUR | 1,000,000 | 1,157,506 | ||||||||||||
| Dryden 44 Euro CLO B.V., 6.500%, Due 7/15/2030, 2015-44X E, (6-mo. EUR EURIBOR + 6.500%)B C | EUR | 150,000 | 175,475 | ||||||||||||
| GLG Euro CLO II DAC, 8.750%, Due 1/15/2030, 2X F, (3-mo. EUR EURIBOR + 8.750%)B C | EUR | 200,000 | 237,380 | ||||||||||||
| Griffith Park CLO DAC, 6.400%, Due 10/15/2029, 1X D, (3-mo. EUR EURIBOR + 6.400%)B C | EUR | 150,000 | 178,419 | ||||||||||||
| Jubilee CLO B.V., | |||||||||||||||
4.671%, Due 1/15/2028, 2014-14X E, (3-mo. EUR EURIBOR + 5.000%)B C | EUR | 400,000 | 463,626 | ||||||||||||
8.400%, Due 10/15/2029, 2016-17A F, (3-mo. EUR EURIBOR + 8.400%)A C | EUR | 250,000 | 295,095 | ||||||||||||
| SC Germany Consumer UG haftungsbeschraenkt, 10.331%, Due 12/13/2028, 2015 1 E, (1-mo. EUR EURIBOR + 10.700%)B C | EUR | 200,000 | 239,661 | ||||||||||||
| St Paul’ CLO VIII DAC, 4.600%, Due 1/17/2030, 8X EB D | EUR | 1,000,000 | 1,135,697 | ||||||||||||
| St Pauls CLO II Ltd., 5.500%, Due 2/15/2030, 2X ERNE, (3-mo. EUR EURIBOR + 5.500%)B C | EUR | 200,000 | 233,794 | ||||||||||||
|
| ||||||||||||||
Total Asset-Backed Obligations (Cost $4,878,004) | 4,896,130 | ||||||||||||||
|
| ||||||||||||||
| U.S. TREASURY OBLIGATIONS - 10.59% | |||||||||||||||
| U.S. Treasury Notes/Bonds, | |||||||||||||||
1.000%, Due 11/30/2019 | $ | 2,140,000 | 2,096,615 | ||||||||||||
1.875%, Due 12/31/2019 | 510,000 | 505,438 | |||||||||||||
2.500%, Due 3/31/2023 | 1,555,000 | 1,539,450 | |||||||||||||
|
| ||||||||||||||
Total U.S. Treasury Obligations (Cost $4,138,075) | 4,141,503 | ||||||||||||||
|
| ||||||||||||||
| Shares | |||||||||||||||
| SHORT-TERM INVESTMENTS - 1.00% (Cost $392,064) | |||||||||||||||
| Investment Companies - 1.00% | |||||||||||||||
American Beacon U.S. Government Money Market Select Fund, Select Class, 1.82%E F | 392,064 | 392,064 | |||||||||||||
|
| ||||||||||||||
TOTAL INVESTMENTS - 97.06% (Cost $38,627,376) | 37,976,237 | ||||||||||||||
OTHER ASSETS, NET OF LIABILITIES - 2.94% | 1,148,321 | ||||||||||||||
|
| ||||||||||||||
TOTAL NET ASSETS - 100.00% | $ | 39,124,558 | |||||||||||||
|
| ||||||||||||||
Percentages are stated as a percent of net assets. *In U.S. Dollars unless otherwise noted. | |||||||||||||||
A Security exempt from registration under the Securities Act of 1933. These securities may be resold to qualified institutional buyers pursuant to Rule 144A. At the period end, the value of these securities amounted to $3,601,637 or 9.21% of net assets. The Fund has no right to demand registration of these securities.
B Reg S - Security purchased under the Securities Act of 1933, which exempts from registration securities offered and sold outside of the United States. Such a security cannot be sold in the United States without either an effective registration statement filed pursuant to the Securities Act of 1933, or pursuant to an exemption from registration.
C Variable, floating, or adjustable rate securities with an interest rate that changes periodically. Rates are periodically reset with rates that are based on a predetermined benchmark such as a widely followed interest rate such as T-bills, LIBOR or PRIME plus a fixed spread. The interest rate disclosed reflects the rate in effect on June 30, 2018.
D Coupon rate may change based on changes of the underlying collateral or prepayments of principal. The coupon rate shown represents the rate at period end.
E The Fund is affiliated by having the same investment advisor.
F 7-day yield.
CMT - Constant Maturity Treasury.
CLO - Collateralized Loan Obligation.
EURIBOR - Euro Interbank Offered Rate.
LIBOR - London Interbank Offered Rate.
LLC - Limited Liability Company.
LP - Limited Partnership.
PIK - Payment in Kind.
PLC - Public Limited Company.
See accompanying notes
10
American Beacon TwentyFour Strategic Income FundSM
Schedule of Investments
June 30, 2018
| Forward Foreign Currency Contracts Open on June 30, 2018: |
| |||||||||||||||||||||||||||||
| Currency Purchased* | Currency Sold* | Settlement Date | Counterparty | Unrealized Appreciation | Unrealized (Depreciation) | Net Unrealized Appreciation (Depreciation) | ||||||||||||||||||||||||
| GBP | 133,655 | USD | 133,206 | 7/18/2018 | SSB | $ | 449 | $ | - | $ | 449 | |||||||||||||||||||
| USD | 10,668,257 | EUR | 10,579,832 | 7/18/2018 | SSB | 88,425 | - | 88,425 | ||||||||||||||||||||||
| USD | 9,479,363 | GBP | 9,368,969 | 7/18/2018 | SSB | 110,394 | - | 110,394 | ||||||||||||||||||||||
| USD | 3,947,923 | AUD | 3,852,008 | 7/18/2018 | SSB | 95,915 | - | 95,915 | ||||||||||||||||||||||
| USD | 1,132,462 | EUR | 1,137,570 | 7/18/2018 | SSB | - | (5,108 | ) | (5,108 | ) | ||||||||||||||||||||
| USD | 400,170 | AUD | 402,122 | 7/18/2018 | SSB | - | (1,952 | ) | (1,952 | ) | ||||||||||||||||||||
| USD | 388,030 | EUR | 391,159 | 7/18/2018 | SSB | - | (3,129 | ) | (3,129 | ) | ||||||||||||||||||||
| USD | 285,936 | EUR | 288,625 | 7/18/2018 | SSB | - | (2,689 | ) | (2,689 | ) | ||||||||||||||||||||
| USD | 226,188 | EUR | 226,962 | 7/18/2018 | SSB | - | (774 | ) | (774 | ) | ||||||||||||||||||||
| USD | 185,896 | GBP | 186,744 | 7/18/2018 | SSB | - | (848 | ) | (848 | ) | ||||||||||||||||||||
| USD | 90,210 | AUD | 90,437 | 7/18/2018 | SSB | - | (227 | ) | (227 | ) | ||||||||||||||||||||
| USD | 87,316 | EUR | 88,305 | 7/18/2018 | SSB | - | (989 | ) | (989 | ) | ||||||||||||||||||||
| USD | 46,844 | AUD | 46,780 | 7/18/2018 | SSB | 64 | - | 64 | ||||||||||||||||||||||
| USD | 15,725 | EUR | 15,759 | 7/18/2018 | SSB | - | (34 | ) | (34 | ) | ||||||||||||||||||||
| USD | 13,604 | EUR | 13,602 | 7/18/2018 | SSB | 2 | - | 2 | ||||||||||||||||||||||
|
|
|
|
|
| |||||||||||||||||||||||||
| $ | 295,249 | $ | (15,750 | ) | $ | 279,499 | ||||||||||||||||||||||||
|
|
|
|
|
| |||||||||||||||||||||||||
| * | All values denominated in USD. |
| Glossary: | ||
| Counterparty Abbreviations: | ||
| SSB | State Street Bank & Trust Co. | |
| Currency Abbreviations: | ||
| AUD | Australian Dollar | |
| EUR | Euro | |
| GBP | Pound Sterling | |
| USD | United States Dollar | |
The Fund’s investments are summarized by level based on the inputs used to determine their values. As of June 30, 2018, the investments were classified as described below:
TwentyFour Strategic Income Fund | Level 1 | Level 2 | Level 3 | Total | ||||||||||||||||||||||||
Assets | ||||||||||||||||||||||||||||
Corporate Obligations | $ | - | $ | 2,393,504 | $ | - | $ | 2,393,504 | ||||||||||||||||||||
Foreign Corporate Obligations | - | 19,438,073 | - | 19,438,073 | ||||||||||||||||||||||||
Foreign Sovereign Obligations | - | 6,714,963 | - | 6,714,963 | ||||||||||||||||||||||||
Asset-Backed Obligations | - | 4,896,130 | - | 4,896,130 | ||||||||||||||||||||||||
U.S. Treasury Obligations | - | 4,141,503 | - | 4,141,503 | ||||||||||||||||||||||||
Short-Term Investments | 392,064 | - | - | 392,064 | ||||||||||||||||||||||||
|
|
|
|
|
|
|
| |||||||||||||||||||||
Total Investments in Securities - Assets | $ | 392,064 | $ | 37,584,173 | $ | - | $ | 37,976,237 | ||||||||||||||||||||
|
|
|
|
|
|
|
| |||||||||||||||||||||
Financial Derivative Instruments - Assets | ||||||||||||||||||||||||||||
Forward Foreign Currency Contracts | $ | - | $ | 295,249 | $ | - | $ | 295,249 | ||||||||||||||||||||
|
|
|
|
|
|
|
| |||||||||||||||||||||
Total Financial Derivative Instruments - Assets | $ | - | $ | 295,249 | $ | - | $ | 295,249 | ||||||||||||||||||||
|
|
|
|
|
|
|
| |||||||||||||||||||||
Financial Derivative Instruments - Liabilities | ||||||||||||||||||||||||||||
Forward Foreign Currency Contracts | $ | - | $ | (15,750 | ) | $ | - | $ | (15,750 | ) | ||||||||||||||||||
|
|
|
|
|
|
|
| |||||||||||||||||||||
Total Financial Derivative Instruments - Liabilities | $ | - | $ | (15,750 | ) | $ | - | $ | (15,750 | ) | ||||||||||||||||||
|
|
|
|
|
|
|
| |||||||||||||||||||||
U.S. GAAP requires all transfers between any levels to be disclosed. The end of period timing recognition has been adopted for the transfers between levels of the Fund’s assets and liabilities. During the year ended June 30, 2018, there were no transfers between levels.
See accompanying notes
11
American Beacon TwentyFour Strategic Income FundSM
Statement of Assets and Liabilities
June 30, 2018
Assets: |
| |||
Investments in unaffiliated securities, at fair value† | $ | 37,584,173 | ||
Investments in affiliated securities, at fair value‡ | 392,064 | |||
Foreign currency, at fair value^ | 221,352 | |||
Cash | 186,060 | |||
Dividends and interest receivable | 456,420 | |||
Receivable for investments sold | 562,361 | |||
Receivable for fund shares sold | 10,000 | |||
Receivable for tax reclaims | 488 | |||
Unrealized appreciation from forward foreign currency contracts | 295,249 | |||
Prepaid expenses | 46,505 | |||
|
| |||
Total assets | 39,754,672 | |||
|
| |||
Liabilities: |
| |||
Payable for investments purchased | 485,900 | |||
Payable for expense reimbursement (Note 2) | 7,172 | |||
Management and sub-advisory fees payable (Note 2) | 20,857 | |||
Service fees payable (Note 2) | 150 | |||
Transfer agent fees payable (Note 2) | 2,171 | |||
Custody and fund accounting fees payable | 23,575 | |||
Professional fees payable | 69,293 | |||
Trustee fees payable (Note 2) | 14 | |||
Payable for prospectus and shareholder reports | 4,004 | |||
Unrealized depreciation from forward foreign currency contracts | 15,750 | |||
Other liabilities | 1,228 | |||
|
| |||
Total liabilities | 630,114 | |||
|
| |||
Net assets | $ | 39,124,558 | ||
|
| |||
Analysis of net assets: |
| |||
Paid-in-capital | $ | 38,977,029 | ||
Undistributed net investment income | 439,311 | |||
Accumulated net realized gain | 83,673 | |||
Unrealized (depreciation) of investments in unaffiliated securitiesA | (651,139 | ) | ||
Unrealized (depreciation) of foreign currency transactions | (3,815 | ) | ||
Unrealized appreciation of forward foreign currency contracts | 279,499 | |||
|
| |||
Net assets | $ | 39,124,558 | ||
|
| |||
Shares outstanding at no par value (unlimited shares authorized): |
| |||
Institutional Class | 641,412 | |||
|
| |||
Y Class | 2,214,964 | |||
|
| |||
Investor Class | 126,868 | |||
|
| |||
Ultra Class | 904,526 | |||
|
| |||
Net assets: |
| |||
Institutional Class | $ | 6,460,768 | ||
|
| |||
Y Class | $ | 22,277,957 | ||
|
| |||
Investor Class | $ | 1,271,611 | ||
|
| |||
Ultra Class | $ | 9,114,222 | ||
|
| |||
Net asset value, offering and redemption price per share: |
| |||
Institutional Class | $ | 10.07 | ||
|
| |||
Y Class | $ | 10.06 | ||
|
| |||
Investor Class | $ | 10.02 | ||
|
| |||
Ultra Class | $ | 10.08 | ||
|
| |||
† Cost of investments in unaffiliated securities | $ | 38,235,312 | ||
‡ Cost of investments in affiliated securities | $ | 392,064 | ||
^ Cost of foreign currency | $ | 222,201 | ||
A The Fund’s investments in affiliated securities did not have unrealized appreciation (depreciation) at year end.
See accompanying notes
12
American Beacon TwentyFour Strategic Income FundSM
Statement of Operations
For the year ended June 30, 2018
Investment income: |
| |||
Dividend income from affiliated securities (Note 8) | $ | 11,842 | ||
Interest income (net of foreign taxes)† | 1,058,578 | |||
|
| |||
Total investment income | 1,070,420 | |||
|
| |||
Expenses: |
| |||
Management and sub-advisory fees (Note 2) | 141,166 | |||
Transfer agent fees: | ||||
Institutional Class (Note 2) | 514 | |||
Y Class (Note 2) | 5,032 | |||
Investor Class | 1,626 | |||
Ultra Class | 765 | |||
Custody and fund accounting fees | 10,425 | |||
Professional fees | 99,699 | |||
Registration fees and expenses | 81,027 | |||
Service fees (Note 2): | ||||
Investor Class | 1,648 | |||
Prospectus and shareholder report expenses | 23,358 | |||
Trustee fees (Note 2) | 1,356 | |||
Other expenses | 4,264 | |||
|
| |||
Total expenses | 370,880 | |||
|
| |||
Net fees waived and expenses (reimbursed) (Note 2) | (215,369 | ) | ||
|
| |||
Net expenses | 155,511 | |||
|
| |||
Net investment income | 914,909 | |||
|
| |||
Realized and unrealized gain (loss) from investments: |
| |||
Net realized gain (loss) from: | ||||
Investments in unaffiliated securitiesA | 407,648 | |||
Foreign currency transactions | 308,062 | |||
Forward foreign currency contracts | (326,745 | ) | ||
Change in net unrealized appreciation (depreciation) of: | ||||
Investments in unaffiliated securitiesB | (1,274,348 | ) | ||
Foreign currency transactions | (13,462 | ) | ||
Forward foreign currency contracts | 393,746 | |||
|
| |||
Net (loss) from investments | (505,099 | ) | ||
|
| |||
Net increase in net assets resulting from operations | $ | 409,810 | ||
|
| |||
† Foreign taxes | $ | 1,848 | ||
A The Fund did not recognize net realized gains (losses) from the sale of investments in affiliated securities. | ||||
B The Fund’s investments in affiliated securities did not have a change in unrealized appreciation (depreciation) at year end. | ||||
See accompanying notes
13
American Beacon TwentyFour Strategic Income FundSM
Statement of Changes in Net Assets
| Year Ended June 30, 2018 | April 3, 2017A to June 30, 2017 | |||||||||||
Increase (decrease) in net assets: |
| |||||||||||
Operations: |
| |||||||||||
Net investment income | $ | 914,909 | $ | 178,914 | ||||||||
Net realized gain (loss) from investments in unaffiliated securities, foreign currency transactions, and forward foreign currency contracts | 388,965 | (312,211 | ) | |||||||||
Change in net unrealized appreciation (depreciation) of investments in unaffiliated securities, foreign currency transactions, and forward foreign currency contracts | (894,064 | ) | 518,609 | |||||||||
|
|
|
| |||||||||
Net increase in net assets resulting from operations | 409,810 | 385,312 | ||||||||||
|
|
|
| |||||||||
Distributions to shareholders: |
| |||||||||||
Net investment income: | ||||||||||||
Institutional Class | (48,595 | ) | - | |||||||||
Y Class | (272,222 | ) | - | |||||||||
Investor Class | (30,565 | ) | - | |||||||||
Ultra Class | (529,543 | ) | - | |||||||||
Return of capital: | ||||||||||||
Institutional Class | - | (877 | ) | |||||||||
Y Class | - | (877 | ) | |||||||||
Investor Class | - | (877 | ) | |||||||||
Ultra Class | - | (128,902 | ) | |||||||||
|
|
|
| |||||||||
Net distributions to shareholders | (880,925 | ) | (131,533 | ) | ||||||||
|
|
|
| |||||||||
Capital share transactions (Note 10): |
| |||||||||||
Proceeds from sales of shares | 35,268,804 | 692,500 | ||||||||||
Reinvestment of dividends and distributions | 880,925 | 131,533 | ||||||||||
Cost of shares redeemed | (12,631,868 | ) | - | |||||||||
|
|
|
| |||||||||
Net increase in net assets from capital share transactions | 23,517,861 | 824,033 | ||||||||||
|
|
|
| |||||||||
Net increase in net assets | 23,046,746 | 1,077,812 | ||||||||||
|
|
|
| |||||||||
Net assets: |
| |||||||||||
Beginning of period | 16,077,812 | 15,000,000 | B | |||||||||
|
|
|
| |||||||||
End of period * | $ | 39,124,558 | $ | 16,077,812 | ||||||||
|
|
|
| |||||||||
*Includes undistributed net investment income | $ | 439,311 | $ | 100,153 | ||||||||
|
|
|
| |||||||||
A Commencement of operations.
B Seed capital.
See accompanying notes
14
American Beacon TwentyFour Strategic Income FundSM
June 30, 2018
1. Organization and Significant Accounting Policies
American Beacon Funds (the “Trust”), is organized as a Massachusetts business trust. The Fund, a series within the Trust, is registered under the Investment Company Act of 1940 (the “Act”), as amended, as a non-diversified, open-end management investment company. As of June 30, 2018, the Trust consists of thirty-three active series, one of which is presented in this filing: American Beacon TwentyFour Strategic Income Fund (the “Fund”). The remaining thirty-two active series are reported in separate filings.
American Beacon Advisors, Inc. (the “Manager”) is a Delaware corporation and a wholly-owned subsidiary of Resolute Investment Managers, Inc. (“RIM”) organized in 1986 to provide business management, advisory, administrative, and asset management consulting services to the Trust and other investors. RIM is, in turn, a wholly-owned subsidiary of Resolute Acquisition, Inc., which is a wholly-owned subsidiary of Resolute Topco, Inc., a wholly-owned subsidiary of Resolute Investment Holdings, LLC (“RIH”). RIH is owned primarily by Kelso Investment Associates VIII, L.P., KEP VI, LLC and Estancia Capital Partners L.P., investment funds affiliated with Kelso & Company, L.P. (“Kelso”) or Estancia Capital Management, LLC (“Estancia”), which are private equity firms.
Class Disclosure
The Fund has multiple classes of shares designed to meet the needs of different groups of investors. The following table sets forth the differences amongst the classes:
Class | Eligible Investors | Minimum Initial Investments | ||||
| Institutional | Large institutional investors - sold directly through intermediary channels. | $ | 250,000 | |||
| Y Class | Large institutional retirement plan investors - sold directly or through intermediary channels. | $ | 100,000 | |||
| Investor | All investors using intermediary organizations such as broker-dealers or retirement plan sponsors - sold directly through intermediary channels. | $ | 2,500 | |||
| Ultra | Large institutional investors - sold directly or through intermediary channels. | $ | 350,000,000 | |||
Each class offered by the Trust has equal rights as to assets and voting privileges. Income and non-class specific expenses are allocated daily to each class on the basis of the relative net assets. Realized and unrealized capital gains and losses of each class are allocated daily based on the relative net assets of each class of the respective Fund. Class specific expenses, where applicable, currently include service, distribution, transfer agent fees, and sub-transfer agent fees that vary amongst the classes as described more fully in Note 2.
Significant Accounting Policies
The following is a summary of significant accounting policies, consistently followed by the Fund in preparation of the financial statements. The Fund is considered an investment company and accordingly, follows the investment company accounting and reporting guidance of the Financial Accounting Standards Board Accounting Standard Codification Topic 946, Financial Services – Investment Companies, a part of Generally Accepted Accounting Principles (“U.S. GAAP”).
Security Transactions and Investment Income
Security transactions are recorded as of the trade date for financial reporting purposes. Securities purchased or sold on a when-issued or delayed-delivery basis may be settled beyond a standard settlement period for the security after the trade date.
Dividend income, net of foreign taxes, is recorded on the ex-dividend date, except certain dividends from foreign securities which are recorded as soon as the information is available to the Fund. Interest income, net of foreign taxes, is earned from settlement date, recorded on the accrual basis, and adjusted, if necessary, for accretion of discounts and amortization of premiums. Realized gains (losses) from securities sold are determined on the basis of specific lot identification.
15
American Beacon TwentyFour Strategic Income FundSM
Notes to Financial Statements
June 30, 2018
Currency Translation
All assets and liabilities initially expressed in foreign currency values are converted into U.S. dollar values at the mean of the bid and ask prices of such currencies against U.S. dollars as last quoted by a recognized dealer. Income, expenses, and purchases and sales of investments are translated into U.S. dollars at the rate of the exchange prevailing on the respective dates of such transactions. The effect of changes in foreign currency exchange rates on investments is separately identified from the fluctuations arising from changes in market values of securities held and is reported with all other foreign currency gains and losses on the Fund’s Statement of Operations.
Distributions to Shareholders
Distributions, if any, of net investment income will generally be paid at least annually and recorded on the ex-dividend date. Distributions, if any, of net realized capital gains will generally be paid at least annually and recorded on the ex-dividend date. Dividends to shareholders are determined in accordance with federal income tax regulations, which may differ in amount and character from net investment income and realized gains recognized for purposes of U.S. GAAP. To the extent necessary to fully distribute capital gains, the Fund may designate earnings and profits distributed to shareholders on the redemption of shares.
Commission Recapture
The Fund has established brokerage commission recapture arrangements with certain brokers or dealers. If a Fund’s investment advisor chooses to execute a transaction through a participating broker, the broker rebates a portion of the commission back to the Fund. Any collateral benefit received through participation in the commission recapture program is directed exclusively to the Fund. This amount is reported with the net realized gain in the Fund’s Statement of Operations, if applicable. For the year ended June 30, 2018, the Fund did not have commission recapture income.
Allocation of Income, Trust Expenses, Gains, and Losses
Investment income, realized and unrealized gains and losses from investments of the Fund is allocated daily to each class of shares based upon the relative proportion of net assets of each class to the total net assets of the Fund. Expenses directly charged or attributable to any Fund will be paid from the assets of the Fund. Generally, expenses of the Trust will be allocated among and charged to the assets of the Fund on a basis that the Trust’s Board of Trustees (the “Board”) deems fair and equitable, which may be based on the relative net assets of the Fund or nature of the services performed and relative applicability to the Fund.
Organization and Offering Costs
Organizational costs consist of the costs of forming the Fund, drafting the bylaws, administration, custody and transfer agency agreements, and legal services in connection with the initial meeting of trustees, and were expensed immediately as incurred. Offering costs consist of the costs of preparation, review and filing with the SEC the Fund’s registration statement (including the Prospectus and the Statement of Additional Information), the costs of preparation, the costs associated with the printing, mailing or other distribution of the Prospectus, SAI and the amounts of associated filing fees and legal fees associated with the offering. Organizational costs and offering costs are subject to the Fund’s expense limitation agreement discussed in Note 2 and offering costs require amortization over twelve months on a straight-line basis from the commencement of operations.
Use of Estimates
The preparation of financial statements in conformity with U.S. GAAP requires management to make estimates and assumptions that affect the amounts reported in the financial statements and accompanying notes. Actual results may differ from those estimated.
16
American Beacon TwentyFour Strategic Income FundSM
Notes to Financial Statements
June 30, 2018
Other
Under the Trust’s organizational documents, its officers and trustees are indemnified against certain liabilities arising out of the performance of their duties to the Trust. In the normal course of business, the Trust enters into contracts that provide indemnification to the other party or parties against potential costs or liabilities. The Trust’s maximum exposure under these arrangements is dependent on claims that may be made in the future and, therefore, cannot be estimated. The Trust has had no prior claims or losses pursuant to any such agreement.
2. Transactions with Affiliates
Management and Investment Sub-Advisory Agreements
The Fund and the Manager are parties to a Management Agreement that obligates the Manager to provide the Fund with investment advisory and administrative services. As compensation for performing the duties under the Management Agreement, the Manager will receive an annualized management fee based on a percentage of the Fund’s average daily net assets that is calculated and accrued daily according to the following schedule:
First $5 billion | 0.35 | % | ||
Next $5 billion | 0.325 | % | ||
Next $10 billion | 0.30 | % | ||
Over $20 billion | 0.275 | % |
The Trust, on behalf of the Fund, and the Manager have entered into an Investment Advisory Agreement with TwentyFour Asset Management (US), LP (the “Sub-Advisor”) pursuant to which the Fund has agreed to pay an annualized sub-advisory fee that is calculated and accrued daily based on the Fund’s average daily net assets according to the following schedule:
First $1 billion | 0.32 | % | ||
Over $1 billion | 0.27 | % |
The Management and Sub-Advisory Fees paid by the Fund for the year ended June 30, 2018 were as follows:
| Effective Fee Rate | Amount of Fees Paid | |||||||||||
Management Fees | 0.35 | % | $ | 73,595 | ||||||||
Sub-Advisor Fees | 0.32 | % | 67,571 | |||||||||
|
|
|
| |||||||||
Total | 0.67 | % | $ | 141,166 | ||||||||
|
|
|
| |||||||||
Distribution Plans
The Fund has adopted a “defensive” Distribution Plan (the “Plan”) in accordance with Rule 12b-1 under the Act, pursuant to which no separate fees may be charged to the Fund for distribution purposes. However, the Plan authorizes the management fee received by the Manager and the investment advisors hired by the Manager to be used for distribution purposes. Under this Plan, the Fund does not intend to compensate the Manager or any other party, either directly or indirectly, for the distribution of Fund shares.
Service Plans
The Manager and the Trust entered into a Service Plan that obligates the Manager to oversee additional shareholder servicing of the Investor Class of the Fund. As compensation for performing the duties required under the Service Plan, the Manager receives an annualized fee up to 0.375% of the average daily net assets of the Investor Class of the Fund.
17
American Beacon TwentyFour Strategic Income FundSM
Notes to Financial Statements
June 30, 2018
Sub-Transfer Agent Fees
The Manager has entered into agreements, which include servicing agreements, with financial intermediaries that provide recordkeeping, processing, shareholder communications and other services to customers of the intermediaries that hold positions in the Institutional and Y Classes of the Fund and has agreed to compensate the intermediaries for providing these services. Intermediaries transact with the Fund primarily through the use of omnibus accounts on behalf of its customers who hold positions in the Fund. Certain services would have been provided by the Fund’s transfer agent and other service providers if the shareholders’ accounts were maintained directly by the Fund’s transfer agent. Accordingly, the Fund, pursuant to Board approval, has agreed to reimburse the Manager for certain non-distribution shareholder services provided by financial intermediaries for the Institutional and Y Classes. The reimbursement amounts (sub-transfer agent fees) paid to the Manager are subject to a fee limit of up to 0.10% of an intermediary’s average net assets in the Institutional and Y Classes on an annual basis. During the year ended June 30, 2018, the sub-transfer agent fees, as reflected in “Transfer agent fees” on the Statement of Operations, were as follows:
Fund | Sub-Transfer Agent Fees | |||
TwentyFour Strategic Income | $ | 4,549 | ||
As of June 30, 2018, the Fund owed the Manager the following reimbursement of sub-transfer agent fees, as reflected in “Transfer agent fees payable” on the Statement of Assets and Liabilities:
Fund | Reimbursement Sub-Transfer Agent Fees | |||
TwentyFour Strategic Income | $ | 1,868 | ||
Investments in Affiliated Funds
The Fund may invest in the American Beacon U.S. Government Money Market Select Fund (the “USG Select Fund”). Cash collateral received by the Fund in connection with securities lending may also be invested in the USG Select Fund. The Fund and the USG Select Fund have the same investment advisor and therefore, are considered to be affiliated. The Manager serves as investment advisor to the USG Select Fund and receives management fees and administrative fees totaling 0.10% of the average daily net assets of the USG Select Fund. During the year ended June 30, 2018, the Manager earned fees on the Fund’s direct investments and securities lending collateral investments in the USG Select Fund as shown below:
Fund | Direct Investments in USG Select Fund | |||
TwentyFour Strategic Income | $ | 895 | ||
Interfund Credit Facility
Pursuant to an exemptive order issued by the Securities and Exchange Commission (“SEC”), the Fund, along with other registered investment companies having management contracts with the Manager, may participate in a credit facility whereby each Fund, under certain conditions, is permitted to lend money directly to and borrow directly from other participating Funds for temporary purposes. The interfund credit facility is advantageous to the Funds because it provides added liquidity, and eliminates the need to maintain higher cash balances to meet redemptions. This situation could arise when shareholder redemptions exceed anticipated volumes and certain funds have insufficient cash on hand to satisfy such redemptions or when sales of securities do not settle as expected, resulting in a cash shortfall for a fund. When a Fund liquidates portfolio securities to meet redemption requests, they often do not receive payment in settlement for up to two days (or longer for certain foreign transactions). Redemption requests normally are satisfied on the next business day. The credit facility provides a source of immediate, short-term liquidity pending settlement of the sale of portfolio securities. The credit facility is administered by a credit facility team consisting of professionals from the Manager’s asset management,
18
American Beacon TwentyFour Strategic Income FundSM
Notes to Financial Statements
June 30, 2018
compliance, and accounting areas who report the activities of the credit facility to the Board. During the year ended June 30, 2018, the Fund borrowed $209,564 for 1 day at an interest rate of 1.73% with interest charges of $10. These amounts are recorded as “Other expenses” in the Statement of Operations.
Expense Reimbursement Plan
The Manager contractually agreed to reduce fees and/or reimburse expenses for the classes of the Fund to the extent that total operating expenses exceed the Fund’s expense cap. During the year ended June 30, 2018, the Manager waived and/or reimbursed expenses as follows:
Fund | Class | Expense Cap | Reimbursed Expenses | (Recouped) Expenses | Expiration of Reimbursed Expenses | |||||||||||||
| 7/1/2017 - 6/30/2018 | ||||||||||||||||||
TwentyFour Strategic Income | Institutional | 0.72 | % | $ | 14,126 | $ | - | 2021 | ||||||||||
TwentyFour Strategic Income | Y | 0.82 | % | 69,225 | - | 2021 | ||||||||||||
TwentyFour Strategic Income | Investor | 1.09 | % | 7,938 | - | 2021 | ||||||||||||
TwentyFour Strategic Income | Ultra | 0.67 | % | 124,080 | - | 2021 | ||||||||||||
Of these amounts, $7,172 was disclosed as a payable to the Manager on the Statement of Assets and Liabilities at June 30, 2018.
The Fund has adopted an Expense Reimbursement Plan whereby the Manager may seek repayment of such fee reductions and expense reimbursements. Under the policy, the Manager can be reimbursed by the Fund for any contractual or voluntary fee reductions or expense reimbursements if reimbursement to the Manager (a) occurs within three years after the Manager’s own waiver or reimbursement and (b) does not cause the Fund’s annual operating expenses to exceed the lesser of the contractual percentage limit in effect at the time of the waiver/reimbursement or time of recoupment. The reimbursed expenses listed above will expire in 2021. The carryover of excess expenses potentially reimbursable to the Manager are as follows:
Fund | Recouped Expenses | Excess Expense Carryover | Expired Expense Carryover | Expiration of Reimbursed Expenses | ||||||||||||
TwentyFour Strategic Income | $ | - | $ | 149,855 | $ | - | 2020 | |||||||||
Concentration of Ownership
From time to time, the Fund may have a concentration of one or more accounts constituting a significant percentage of shares outstanding. Investment activities by holders of accounts that represent a significant ownership of more than 5% of the Fund’s outstanding shares could have a material impact on the Fund. As of June 30, 2018, based on management’s evaluation of the shareholder account base, one account in the Fund has been identified as representing an affiliated significant ownership of approximately 23% of the Fund’s outstanding shares.
Trustee Fees and Expenses
As compensation for their service to the Trust, American Beacon Select Funds, American Beacon Institutional Funds Trust, American Beacon Sound Point Enhanced Income Fund, and American Beacon Apollo Total Return Fund each Trustee receives an annual retainer of $120,000, plus $10,000 for each Board meeting attended in person or via teleconference, $2,500 for attendance by Committee members at meetings of the Audit Committee and the Investment Committee, and $1,500 for attendance by Committee members at meetings of the Nominating and Governance Committee, plus reimbursement of reasonable expenses incurred in attending Board meetings, Committee meetings, and relevant educational seminars. The Trustees also may be compensated for attendance at special Board and/or Committee meetings from time to time. The Board Chairman receives an additional annual
19
American Beacon TwentyFour Strategic Income FundSM
Notes to Financial Statements
June 30, 2018
retainer of $50,000 as well as a $2,500 fee each quarter for his attendance at the committee meetings. Effective January 1, 2018, the Board Vice Chair receives an additional annual retainer of $10,000. The Chairpersons of the Audit Committee and the Investment Committee each receive an additional annual retainer of $25,000 and the Chairman of the Nominating and Governance Committee receives an additional annual retainer of $10,000. These expenses are allocated on a prorated basis to each Fund of the Trusts according to its respective net assets.
3. Security Valuation and Fair Value Measurements
The price of the Fund’s shares is based on its net asset value (“NAV”) per share. The Fund’s NAV is computed by adding total assets, subtracting all the Fund’s liabilities, and dividing the result by the total number of shares outstanding.
The NAV of each class of the Fund’s shares is determined based on a pro rata allocation of the Fund’s investment income, expenses and total capital gains and losses. The Fund’s NAV per share is determined each business day as of the regular close of trading on the New York Stock Exchange (“NYSE” or “Exchange”), which is typically 4:00 p.m. Eastern Time (“ET”). However, if trading on the NYSE closes at a time other than 4:00 p.m. ET, the Fund’s NAV per share typically would still be determined as of the regular close of trading on the NYSE. The Fund does not price its shares on days that the NYSE is closed. Foreign exchanges may permit trading in foreign securities on days when the Fund is not open for business, which may result in the value of the Fund’s portfolio investments being affected at a time when you are unable to buy or sell shares.
Equity securities and certain derivative instruments that are traded on an exchange are valued based on market value. Certain derivative instruments (other than short-term securities) usually are valued on the basis of prices provided by a pricing service. The price of debt securities generally is determined using pricing services or quotes obtained from broker/dealers who may consider a number of inputs and factors, such as comparable characteristics, yield curve, credit spreads, estimated default rates, coupon rates, underlying collateral and estimated cash flow. Investments in other mutual funds are valued at the closing NAV per share of the mutual funds on the day of valuation. Equity securities, including shares of closed-end funds and exchanged-traded funds (“ETFs”), are valued at the last sale price or official closing price.
The valuation of securities traded on foreign markets and certain fixed income securities will generally be based on prices determined as of the earlier closing time of the markets on which they primarily trade unless a significant event has occurred. When the Fund holds securities or other assets that are denominated in a foreign currency, the Fund will normally use the currency exchange rates as of 4:00 p.m. ET.
Securities may be valued at fair value, as determined in good faith and pursuant to procedures approved by the Board of Trustees, under certain limited circumstances. For example, fair value pricing will be used when market quotations are not readily available or reliable, as determined by the Manager, such as when (i) trading for a security is restricted or stopped; (ii) a security’s trading market is closed (other than customary closings); or (iii) a security has been de-listed from a national exchange. A security with limited market liquidity may require fair value pricing if the Manager determines that the available price does not reflect the security’s true market value. In addition, if a significant event that the Manager determines to affect the value of one or more securities held by the Fund occurs after the close of a related exchange but before the determination of the Fund’s NAV, fair value pricing may be used on the affected security or securities. Securities of small-capitalization companies are also more likely to require a fair value determination using these procedures because they are more thinly traded and less liquid than the securities of larger-capitalization companies. The Fund may fair value securities as a result of significant events occurring after the close of the foreign markets in which the Fund invests as described below. In addition, the Fund may invest in illiquid securities requiring these procedures.
The Fund may use fair value pricing for securities primarily traded in non-U.S. markets because most foreign markets close well before the Fund’s pricing time of 4:00 p.m. ET. The earlier close of these foreign markets gives rise to the possibility that significant events, including broad market moves, may have occurred in the interim and
20
American Beacon TwentyFour Strategic Income FundSM
Notes to Financial Statements
June 30, 2018
may materially affect the value of those securities. If the Manager determines that the last quoted prices of non-U.S. securities will, in its judgment, materially affect the value of some or all its portfolio securities, the Manager can adjust the previous closing prices to reflect what it believes to be the fair value of the securities as of the close of the Exchange. In deciding whether it is necessary to adjust closing prices to reflect fair value, the Manager reviews a variety of factors, including developments in foreign markets, the performance of U.S. securities markets, and the performance of instruments trading in U.S. markets that represent foreign securities and baskets of foreign securities. These securities are fair valued using a pricing service, using methods approved by the Board, that considers the correlation of the trading patterns of the foreign security to intraday trading in the U.S. markets, based on indices of domestic securities and other appropriate indicators such as prices of relevant American Depositary Receipts (“ADRs”) and futures contracts. The Valuation Committee, established by the Board, may also fair value securities in other situations, such as when a particular foreign market is closed but the Fund is open. The Fund uses outside pricing services to provide closing prices and information to evaluate and/or adjust those prices. As a means of evaluating its security valuation process, the Valuation Committee routinely compares closing prices, the next day’s opening prices in the same markets and adjusted prices.
Attempts to determine the fair value of securities introduce an element of subjectivity to the pricing of securities. As a result, the price of a security determined through fair valuation techniques may differ from the price quoted or published by other sources and may not accurately reflect the market value of the security when trading resumes. If a reliable market quotation becomes available for a security formerly valued through fair valuation techniques, the Manager compares the new market quotation to the fair value price to evaluate the effectiveness of the Fund’s fair valuation procedures. If any significant discrepancies are found, the Manager may adjust the Fund’s fair valuation procedures.
Valuation Inputs
Various inputs may be used to determine the fair value of the Fund’s investments. These inputs are summarized in three broad levels for financial statement purposes. The inputs or methodologies used to value securities are not necessarily an indication of the risk associated with investing in those securities.
| Level 1 | - | Quoted prices in active markets for identical securities. | ||
| Level 2 | - | Prices determined using other significant observable inputs. These may include quoted prices for similar securities, interest rates, prepayment speeds, credit risk, and others. Fixed-income securities are considered Level 2 as they are valued using observable inputs. | ||
| Level 3 | - | Prices determined using other significant unobservable inputs. Unobservable inputs reflect the Fund’s own assumptions about the factors market participants would use in pricing an investment. | ||
Level 1 and Level 2 trading assets and trading liabilities, at fair value
Fixed-income securities including corporate, convertible and municipal bonds and notes, U.S. government agencies, U.S. Treasury obligations, sovereign issues, bank loans, convertible preferred securities, and non-U.S. bonds are normally valued by pricing service providers that use broker dealer quotations, reported trades or valuation estimates from their internal pricing models. The service providers’ internal models use inputs that are observable such as issuer details, interest rates, yield curves, prepayment speeds, credit risks/spreads, default rates, and quoted prices for similar assets. Securities that use similar valuation techniques and inputs as described above are categorized as Level 2 of the fair value hierarchy. Fixed-income securities purchased on a delayed-delivery basis are marked-to-market daily until settlement at the forward settlement date and are categorized as Level 2 of the fair value hierarchy.
Mortgage-related and asset-backed securities are usually issued as separate tranches, or classes, of securities within each deal. These securities are also normally valued by pricing service providers that use broker-dealer quotations or valuation estimates from their internal pricing models. The pricing models for these securities usually consider tranche-level attributes, current market data, estimated cash flows, and market-based yield spreads for
21
American Beacon TwentyFour Strategic Income FundSM
Notes to Financial Statements
June 30, 2018
each tranche, and incorporates deal collateral performance, as available. Mortgage-related and asset-backed securities that use similar valuation techniques and inputs as described above are categorized as Level 2 of the fair value hierarchy.
Common stocks, ETFs, and financial derivative instruments, such as futures contracts or options that are traded on a national securities exchange, are stated at the last reported sale or settlement price on the day of valuation. To the extent these securities are actively traded and valuation adjustments are not applied, they are categorized as Level 1 of the fair value hierarchy. Valuation adjustments may be applied to certain securities that are solely traded on a foreign exchange to account for the market movement between the close of the foreign market and the close of the Exchange. These securities are valued using pricing service providers that consider the correlation of the trading patterns of the foreign security to the intraday trading in the U.S. markets for investments. Securities using these valuation adjustments are categorized as Level 2 of the fair value hierarchy. Preferred securities and other equities traded on inactive markets or valued by reference to similar instruments are generally categorized as Level 2 of the fair value hierarchy.
Investments in registered open-end investment management companies will be valued based upon the NAVs of such investments and are categorized as Level 1 of the fair value hierarchy.
Over-the-counter (“OTC”) financial derivative instruments, such as forward foreign currency contracts derive their value from underlying asset prices, indices, reference rates, and other inputs or a combination of these factors. These contracts are normally valued on the basis of broker dealer quotations or pricing service providers. Depending on the product and the terms of the transaction, the fair value of the financial derivative contracts can be estimated by a pricing service provider using a series of techniques, including simulation pricing models. The pricing models use inputs that are observed from actively quoted markets such as issuer details, indices, spreads, interest rates, curves, dividends, and exchange rates. Financial derivatives that use similar valuation techniques and inputs as described above are categorized as Level 2 of the fair value hierarchy.
4. Securities and Other Investments
Asset-Backed Securities
Asset-Backed Securities (“ABS”) are securities issued by trusts and special purpose entities that are backed by pools of assets, such as automobile and credit-card receivables and home equity loans, which pass through the payments on the underlying obligations to the security holders (less servicing fees paid to the originator or fees for any credit enhancement). Typically, loans or accounts receivable paper are transferred from the originator to a specially created trust, which repackages the trust’s interests as securities with a minimum denomination and a specific term. The securities are then privately placed or publicly offered. Examples include certificates for automobile receivables and so-called plastic bonds, backed by credit card receivables. The Fund is permitted to invest in asset-backed securities, subject to the Fund’s rating and quality requirements.
The value of an asset-backed security is affected by, among other things, changes in the market’s perception of the asset backing the security, the creditworthiness of the servicing agent for the loan pool, the originator of the loans and the financial institution providing any credit enhancement. Payments of principal and interest passed through to holders of asset-backed securities are frequently supported by some form of credit enhancement, such as a letter of credit, surety bond, limited guarantee by another entity or by having a priority to certain of the borrower’s other assets. The degree of credit enhancement varies, and generally applies to only a portion of the asset-backed security’s par value. Value is also affected if any credit enhancement has been exhausted.
Collateralized Loan Obligations
The Fund may invest in collateralized loan obligations (“CLOs”) and other similarly structured securities. CLOs are types of asset-backed securities. A CLO is a trust typically collateralized by a pool of loans, which may
22
American Beacon TwentyFour Strategic Income FundSM
Notes to Financial Statements
June 30, 2018
include, among others, domestic and foreign senior secured loans, senior unsecured loans, and subordinate corporate loans, including loans that may be rated below investment grade or equivalent unrated loans. CLOs may charge management fees and administrative expenses.
For CLOs, the cash flows from the trust are split into two or more portions, called tranches, varying in risk and yield. The riskiest portion is the “equity” tranche which bears the bulk of defaults from the bonds or loans in the trust and serves to protect the other, more senior tranches from default in all but the most severe circumstances. Since they are partially protected from defaults, senior tranches from a CLO trust typically have higher ratings and lower yields than their underlying securities, and can be rated investment grade. Despite the protection from the equity tranche, CLO tranches can experience substantial losses due to actual defaults, increased sensitivity to defaults due to collateral default and disappearance of protecting tranches, market anticipation of defaults, as well as aversion to CLO securities as a class.
Foreign Debt Securities
The Fund may invest in foreign fixed and floating rate income securities (including emerging market securities) all or a portion of which may be non-U.S. dollar denominated and which include: (a) debt obligations issued or guaranteed by foreign national, provincial, state, municipal or other governments with taxing authority or by their agencies or instrumentalities, including Brady Bonds; (b) debt obligations of supranational entities; (c) debt obligations of the U.S. Government issued in non-dollar securities; (d) debt obligations and other fixed income securities of foreign corporate issuers (both dollar and non-dollar denominated); and (e) U.S. corporate issuers (both Eurodollar and non-dollar denominated). There is no minimum rating criteria for the Fund’s investments in such securities. Investing in the securities of foreign issuers involves special considerations that are not typically associated with investing in the securities of U.S. issuers. In addition, emerging markets are markets that have risks that are different and higher than those in more developed markets.
High-Yield Securities
Non-investment-grade securities are rated below the four highest credit grades by at least one of the public rating agencies (or are unrated if not publicly rated). Participation in high-yielding securities transactions generally involves greater returns in the form of higher average yields. However, participation in such transactions involves greater risks, including sensitivity to economic changes, solvency, and relative liquidity in the secondary trading market. Lower ratings may reflect a greater possibility that the financial condition of the issuer, or adverse changes in general economic conditions, or both, may impair the ability of the issuer to make payments of interest and principal. The prices and yields of lower-rated securities generally fluctuate more than higher-quality securities, and such prices may decline significantly in periods of general economic difficulty or rising interest rates.
Illiquid and Restricted Securities
The Fund may invest in securities that are subject to legal or contractual restrictions on resale. These securities may be sold privately, but are required to be registered or exempted from such registration before being sold to the public. Private placement securities are generally considered to be restricted except for those securities traded between qualified institutional investors under the provisions of Rule 144A of the Securities Act of 1933 (the “Securities Act”). Illiquid securities have included securities that have not been registered under the Securities Act, securities that are otherwise not readily marketable, and repurchase agreements having a remaining maturity of longer than seven calendar days. Disposal of both illiquid and restricted securities may involve time-consuming negotiations and expenses, and prompt sale at an acceptable price may be difficult to achieve. Restricted securities outstanding during the year ended June 30, 2018 are disclosed in the Notes to the Schedule of Investments.
Regulation S under the Securities Act permits the sale abroad of securities that are not registered for sale in the United States and includes a provision for U.S. investors, such as the Fund, to purchase such unregistered securities if certain conditions are met.
23
American Beacon TwentyFour Strategic Income FundSM
Notes to Financial Statements
June 30, 2018
Mortgage-Related and Other Asset-Backed Securities
The Fund may invest in mortgage or other ABS. These securities may include mortgage instruments issued by U.S. government agencies (“agency mortgages”) or those issued by private entities (“non-agency mortgages”). Specific types of instruments may include mortgage pass-through securities, collateralized mortgage obligations (“CMOs”), commercial mortgage-backed securities, mortgage dollar rolls, CMO residuals, stripped mortgage-backed
securities and other securities that directly or indirectly represent a participation in, or are secured by a payable from, mortgage loans on real property. The value of the Fund’s MBS may be affected by, among other things, changes or perceived changes in interest rates, factors concerning the interests in and structure of the issuer or the originator of the mortgage, or the quality of the underlying assets. The mortgages underlying the securities may default or decline in quality or value. Through its investments in MBS, a Fund has exposure to subprime loans, Alt-A loans and non-conforming loans as well as to the mortgage and credit markets generally. Underlying collateral related to subprime, Alt-A and non-conforming mortgage loans has become increasingly susceptible to defaults and declines in quality or value, especially in a declining residential real estate market. In addition, regulatory or tax changes may adversely affect the mortgage securities markets as a whole.
Other Investment Company Securities and Other Exchange-Traded Products
The Fund may invest in shares of other investment companies, including open-end funds, closed-end funds, business development companies, ETFs, unit investment trusts, and other investment companies of the Trust. The Fund may invest in investment company securities advised by the Manager or a sub-advisor. Investments in the securities of other investment companies may involve duplication of advisory fees and certain other expenses. By investing in another investment company, the Fund becomes a shareholder of that investment company. As a result, the Fund’s shareholders indirectly will bear the Fund’s proportionate share of the fees and expenses paid by shareholders of the other investment company, in addition to the fees and expenses the Fund’s shareholders directly bear in connection with the Fund’s own operations. These other fees and expenses are reflected as Acquired Fund Fees and Expenses and are included in the Fees and Expenses Table for the Fund in its Prospectus, if applicable. Investments in other investment companies may involve the payment of substantial premiums above the value of such issuer’s portfolio securities.
Payment-In-Kind Securities
The Fund may invest in payment-in-kind securities (“PIKs”). PIKs give the issuer the option at each interest payment date of making interest payments in either cash or additional debt securities. Those additional debt securities usually have the same terms, including maturity dates and interest rates, and associated risks as the original bonds. The daily market quotations of the original bonds may include the accrued interest (referred to as a dirty price) and require a pro-rata adjustment from the “Unrealized appreciation (depreciation) of investments” to “Dividend and interest receivable” in the Statement of Assets and Liabilities.
5. Financial Derivative Instruments
The Fund may utilize derivative instruments to enhance return, hedge risk, gain efficient exposure to an asset class or to manage liquidity. When considering the Fund’s use of derivatives, it is important to note that the Fund does not use derivatives for the purpose of creating financial leverage.
Options Contracts
The Fund may write (1) call and put options on futures, swaps (“swaptions”), securities, commodities or currencies it owns or in which it may invest and (2) inflation-capped options. Writing put options tends to increase the Fund’s exposure to unfavorable movements of the underlying instrument in exchange for an upfront premium. Writing call options tends to decrease the Fund’s exposure to favorable movements of the underlying instrument in exchange for an upfront premium. When the Fund writes a call, put, or inflation-capped option, an amount equal
24
American Beacon TwentyFour Strategic Income FundSM
Notes to Financial Statements
June 30, 2018
to the premium received is recorded as a liability and subsequently marked to market to reflect the current value of the option written. The purpose of inflation-capped options is to protect the buyer from inflation erosion above a certain rate on a given notional exposure. A floor can be used to give downside protection to investments in inflation-linked products. These liabilities are reflected as written options outstanding on the Statement of Assets and Liabilities. Certain options may be written with premiums to be determined on a future date. Premiums received from writing options which expire are treated as realized gains. Premiums received from writing options which are exercised or closed are added to the proceeds or offset against amounts paid on the underlying futures, swap, security or currency transaction to determine the realized gain or loss when the underlying transaction is sold. The Fund, as a writer of an option has no control over whether the underlying instrument may be sold (call) or purchased (put) and as a result bears the market risk of an unfavorable change in the price of the instrument underlying the written option. There is the risk the Fund may not be able to enter into a closing transaction because of an illiquid market.
The Fund may also purchase put and call options. Purchasing call options tends to increase the Fund’s exposure to favorable movements of the underlying instrument in exchange for paying an upfront premium. Purchasing put options tends to decrease the Fund’s exposure to unfavorable movements of the underlying instrument. The Fund pays a premium which is included on the Fund’s Statement of Assets and Liabilities as an investment and subsequently marked to market to reflect the current value of the option. Premiums paid for purchasing options which expire are treated as realized losses. Certain options may be purchased with premiums to be determined on a future date. The premiums for these options are based upon implied volatility parameters at specified terms. The risk associated with purchasing put and call options is limited to the premium paid. Premiums paid for purchasing options which are exercised or closed are added to the amounts paid or offset against the proceeds on the underlying investment transaction to determine the realized gain or loss when the underlying transaction is sold.
The Fund did not hold any option positions at period end.
Straddle Options
The Fund may enter into differing forms of straddle options. A straddle is an investment strategy that uses combinations of options that allow a Fund to profit based on the future price movements of the underlying security, regardless of the direction of those movements. A written straddle involves simultaneously writing a call option and a put option on the same security with the same strike price and expiration date. The written straddle increases in value when the underlying security price has little volatility before the expiration date. A purchased straddle involves simultaneously purchasing a call option and a put option on the same security with the same strike price and expiration date. The purchased straddle increases in value when the underlying security price has high volatility, regardless of direction, before the expiration date.
Forward Foreign Currency Contracts
The Fund may enter into forward foreign currency contracts to hedge the exchange rate risk on investment transactions or to hedge the value of the Fund’s securities denominated in foreign currencies. Forward foreign currency contracts are valued at the forward exchange rate prevailing on the day of valuation. The Fund may also use currency contracts to increase exposure to a foreign currency or to shift exposure to foreign currency fluctuations from one country to another. The Fund bears the market risk that arises from changes in foreign exchange rates, and accordingly, the unrealized gain (loss) on these contracts is reflected in the accompanying financial statements. The Fund also bears the credit risk if the counterparty fails to perform under the contract.
During the year ended June 30, 2018, the TwentyFour Strategic Income Fund entered into forward foreign currency contracts primarily for return enhancement and hedging.
The Fund’s forward foreign currency contract notional dollar values outstanding fluctuate throughout the operating year as required to meet strategic requirements. The following table illustrates the average quarterly volume of forward foreign currency contracts. For the purpose of this disclosure, volume is measured by the amounts bought and sold in USD at each quarter end.
25
American Beacon TwentyFour Strategic Income FundSM
Notes to Financial Statements
June 30, 2018
Average Forward Foreign Currency Notional Amounts Outstanding | ||||||||
Fund | Purchased Contracts | Sold Contracts | ||||||
TwentyFour Strategic Income | $ | 216,513 | $ | 16,791,178 | ||||
The following is a summary of the fair valuations of the Fund’s derivative instruments categorized by risk
exposure(1):
| Fair values of financial instruments on the Statement of Assets and Liabilities as of June 30, 2018: |
| ||||||||||||||||||||||||||||||||||||||||||||||||||||||
| Derivatives not accounted for as hedging instruments | |||||||||||||||||||||||||||||||||||||||||||||||||||||||
Assets: | Credit contracts | Foreign exchange contracts | Commodity contracts | Interest rate contracts | Equity contracts | Total | |||||||||||||||||||||||||||||||||||||||||||||||||
| Unrealized appreciation of forward foreign currency contracts | $ | - | $ | 295,249 | $ | - | $ | - | $ | - | $ | 295,249 | |||||||||||||||||||||||||||||||||||||||||||
Liabilities: | Credit contracts | Foreign exchange contracts | Commodity contracts | Interest rate contracts | Equity contracts | Total | |||||||||||||||||||||||||||||||||||||||||||||||||
| Unrealized depreciation of forward foreign currency contracts | $ | - | $ | (15,750 | ) | $ | - | $ | - | $ | - | $ | (15,750 | ) | |||||||||||||||||||||||||||||||||||||||||
| The effect of financial derivative instruments on the Statement of Operations as of June 30, 2018: |
| ||||||||||||||||||||||||||||||||||||||||||||||||||||||
| Derivatives not accounted for as hedging instruments | |||||||||||||||||||||||||||||||||||||||||||||||||||||||
Realized gain (loss) from derivatives | Credit contracts | Foreign exchange contracts | Commodity contracts | Interest rate contracts | Equity contracts | Total | |||||||||||||||||||||||||||||||||||||||||||||||||
| Forward foreign currency contracts | $ | - | $ | (326,745 | ) | $ | - | $ | - | $ | - | $ | (326,745 | ) | |||||||||||||||||||||||||||||||||||||||||
Net change in unrealized appreciation | Credit contracts | Foreign exchange contracts | Commodity contracts | Interest rate contracts | Equity contracts | Total | |||||||||||||||||||||||||||||||||||||||||||||||||
| Forward foreign currency contracts | $ | – | $ | 393,746 | $ | – | $ | – | $ | – | $ | 393,746 | |||||||||||||||||||||||||||||||||||||||||||
(1) See Note 3 in the Notes to Financial Statements for additional information.
Master Agreements
Master Securities Forward Transaction Agreements (“Master Forward Agreements”) govern the considerations and factors surrounding the settlement of certain forward settling transactions, such as delayed delivery or sale-buyback financing transactions by and between a Fund and select counterparties. The Master Forward Agreements maintain provisions for, among other things, initiation and confirmation, payment and transfer, events of default, termination, and maintenance of collateral.
Offsetting Assets and Liabilities
The Funds is a party to enforceable master netting agreements between brokers and counterparties which provide for the right to offset under certain circumstances. The Fund employs multiple money managers and counterparties and has elected not to offset qualifying financial and derivative instruments on the Statement of Assets and Liabilities, as such all financial and derivative instruments are presented on a gross basis. The impacts of netting arrangements that provide the right to offset are detailed below. The net amount represents the net receivable or payable that would be due from or to the counterparty in the event of default. Exposure from borrowings and other financing agreements such as repurchase agreements can only be netted across transactions governed by the same Master Agreement with the same legal entity. All amounts reported below represent the balance as of the report date, June 30, 2018.
26
American Beacon TwentyFour Strategic Income FundSM
Notes to Financial Statements
June 30, 2018
| Offsetting of Financial and Derivative Assets as of June 30, 2018: | ||||||||||||
| Assets | Liabilities | |||||||||||
| Forward Foreign Currency Contracts | $ | 295,249 | $ | 15,750 | ||||||||
|
|
|
| |||||||||
| Total derivative assets and liabilities in the Statement of Assets and Liabilities | $ | 295,249 | $ | 15,750 | ||||||||
|
|
|
| |||||||||
| Total derivative assets and liabilities subject to an MNA | $ | 295,249 | $ | 15,750 | ||||||||
|
|
|
| |||||||||
| Financial Assets, Derivatives, and Collateral Received/(Pledged) by Counterparty as of June 30, 2018: |
| |||||||||||||||||||||||||||||||||||
| Gross Amounts Not Offset in the Statement of Assets and Liabilities | ||||||||||||||||||||||||||||||||||||
Counterparty | Gross Amounts of Assets Presented in the Statement of Assets and Liabilities | Derivatives Available for Offset | Non-Cash Collateral Pledged | Cash Collateral Pledged | Net Amount | |||||||||||||||||||||||||||||||
| State Street Bank & Trust Co. | $ | 295,249 | $ | (15,750 | ) | $ | - | $ | - | $ | 279,499 | |||||||||||||||||||||||||
| Gross Amounts Not Offset in the Statement of Assets and Liabilities | ||||||||||||||||||||||||||||||||||||
Counterparty | Gross Amounts of Liabilities Presented in the Statement of Assets and Liabilities | Derivatives Available for Offset | Non-Cash Collateral Received | Cash Collateral Received | Net Amount | |||||||||||||||||||||||||||||||
| State Street Bank & Trust Co. | $ | 15,750 | $ | (15,750 | ) | $ | - | $ | - | $ | - | |||||||||||||||||||||||||
6. Principal Risks
Investing in the Fund may involve certain risks including, but not limited to, those described below.
Asset-Backed and Mortgage Related Securities Risk
Investments in asset-backed and mortgage related securities, are subject to market risks for fixed-income securities which include, but are not limited to, credit risk, extension risk, interest rate risk and prepayment risk. A decline in the credit quality of the issuers of asset-backed and mortgage related securities or instability in the markets for such securities may affect the value and liquidity of such securities, which could result in losses to the Fund.
CLO Risk
The risks of an investment in a CLO depend largely on the type of the collateral securities and the class of the instrument in which the Fund invests. Normally, CLOs are privately offered and sold, and thus, are not registered under the securities laws. As a result, investments in CLOs may be characterized by the Fund as illiquid securities, however an active dealer market may exist for CLOs allowing them to qualify for Rule 144A transactions. In addition to the normal risks associated with fixed income securities discussed in the Fund’s SAI and Prospectus (e.g., interest rate risk and default risk), CLOs carry additional risks including, but are not limited to: (i) the possibility that distributions from collateral securities will not be adequate to make interest or other payments; (ii) the quality of the collateral may decline in value or default; (iii) the risk that the Fund may invest in CLOs that are subordinate to other classes; and (iv) the complex structure of the security may not be fully understood at the time of investment and may produce disputes with the issuer or unexpected investment results.
Counterparty Risk
The Fund is subject to the risk that a party or participant to a transaction, such as a broker or derivative counterparty, will be unwilling or unable to satisfy its obligation to make timely principal, interest or settlement payments or to otherwise honor its obligations to the Fund.
27
American Beacon TwentyFour Strategic Income FundSM
Notes to Financial Statements
June 30, 2018
Credit Risk
The Fund is subject to the risk that the issuer or guarantor of a debt security, or the counterparty to a derivatives contract or a loan, will fail to make timely payment of interest or principal or otherwise honor its obligations or default completely. Credit risk is typically greater for securities with ratings that are below investment grade (commonly referred to as “junk bonds”). Since the Fund can invest significantly in lower-quality debt securities considered speculative in nature, this risk will be substantial. A downgrade or default affecting any of the Fund’s securities could affect the Fund’s performance.
Currency Risk
The Fund may have exposure to foreign currencies by making direct investments in non-U.S. currencies or in securities denominated in non-U.S. currencies, purchasing or selling forward foreign currency exchange contracts in non- U.S. currencies, non-U.S. currency futures contracts, and swaps for cross-currency investments. Foreign currencies will fluctuate, and may decline, in value relative to the U.S. dollar and other currencies and thereby affect the Fund’s investments in foreign (non-U.S.) currencies or in securities that trade in, and receive revenues in, or in derivatives that provide exposure to, foreign (non-U.S.) currencies.
Derivatives Risk
Derivatives may involve significant risk. The use of derivative instruments may expose the Fund to additional risks that it would not be subject to if it invested directly in the securities or other instruments underlying those derivatives, including the high degree of leverage often embedded in such instruments, and potential material and prolonged deviations between the theoretical value and realizable value of a derivative. Some derivatives have the potential for unlimited loss, regardless of the size of the Fund’s initial investment. Derivatives may be illiquid and may be more volatile than other types of investments. The Fund may buy or sell derivatives not traded on an exchange and which may be subject to heightened liquidity and valuation risk. Derivative investments can increase portfolio turnover and transaction costs. Derivatives also are subject to counterparty risk. As a result, the Fund may obtain no recovery of its investment or may only obtain a limited recovery, and any recovery may be delayed. Not all derivative transactions require a counterparty to post collateral, which may expose the Fund to greater losses in the event of a default by a counterparty.
Foreign Investing Risk
Non-U.S. investments carry potential risks not associated with U.S. investments. Such risks include, but are not limited to: (1) currency exchange rate fluctuations, (2) political and financial instability, (3) less liquidity and greater volatility, (4) lack of uniform accounting, auditing and financial reporting standards, (5) increased price volatility, (6) less government regulation and supervision of foreign stock exchanges, brokers and listed companies, and (7) delays in transaction settlement in some foreign markets.
Forward Foreign Currency Contracts Risk
Forward foreign currency contracts, including non-deliverable forwards, are derivative instruments pursuant to a contract with a counterparty to pay a fixed price for an agreed amount of securities or other underlying assets at an agreed date or to buy or sell a specific currency at a future date at a price set at the time of the contract. The use of forward foreign currency contracts may expose the Fund to additional risks that it would not be subject to if it invested directly in the securities or currencies underlying the forward foreign currency contract.
Interest Rate Risk
The Fund is subject to the risk that the market value of fixed-income securities or derivatives it holds, particularly mortgage backed and other asset backed securities, will decline due to rising interest rates. Generally, the value of investments with interest rate risk, such as fixed-income securities, will move in the opposite direction
28
American Beacon TwentyFour Strategic Income FundSM
Notes to Financial Statements
June 30, 2018
to movements in interest rates. The Federal Reserve raised the federal funds rate several times since December 2015 and has signaled additional increases in the near future. Interest rates may rise, perhaps significantly and/or rapidly, potentially resulting in substantial losses to the Fund. The prices of fixed-income securities or derivatives are also affected by their duration. Fixed-income securities or derivatives with longer duration generally have greater sensitivity to changes in interest rates. An increase in interest rates can impact markets broadly as well.
Liquidity Risk
Liquidity risk is the risk that the Fund may not be able to dispose of securities or close out derivatives transactions readily at a favorable time or prices (or at all) or at prices approximating those at which the Fund currently value them. For example, certain investments are subject to restrictions on resale, may trade in the over-the-counter market or in limited volume, or may not have an active trading market. Illiquid securities may trade at a discount from comparable, more liquid investments and may be subject to wide fluctuations in market value. It may be difficult for the Fund to value illiquid securities accurately. The market for certain investments may become illiquid under adverse market or economic conditions independent of any specific adverse changes in the conditions of a particular issuer. Disposal of illiquid securities may entail registration expenses and other transaction costs that are higher than those for liquid securities. The Fund may seek to borrow money to meet its obligations (including among other things redemption obligations) if it is unable to dispose of illiquid investments, resulting in borrowing expenses and possible leveraging of the Fund. In some cases, due to unanticipated levels of illiquidity the Fund may choose to meet its redemption obligations wholly or in part by distributions of assets in-kind.
Market Risk
Since the financial crisis that started in 2008, the U.S. and many foreign economies continue to experience its after-effects. Conditions in the U.S. and many foreign economies have resulted, and may continue to result, in certain instruments experiencing unusual liquidity issues, increased price volatility and, in some cases, credit downgrades and increased likelihood of default. These events have reduced the willingness and ability of some lenders to extend credit, and have made it more difficult for some borrowers to obtain financing on attractive terms, if at all. In some cases, traditional market participants have been less willing to make a market in some types of debt instruments, which has affected the liquidity of those instruments. During times of market turmoil, investors tend to look to the safety of securities issued or backed by the U.S. Treasury, causing the prices of these securities to rise and the yields to decline. The reduced liquidity in fixed income and credit markets may negatively affect many issuers worldwide. In addition, global economies and financial markets are becoming increasingly interconnected, which increases the possibilities that conditions in one country or region might adversely impact issuers in a different country or region.
In response to the financial crisis, the U.S. and other governments and the Federal Reserve and certain foreign central banks have taken steps to support financial markets. In some countries where economic conditions are recovering, they are nevertheless perceived as still fragile. Withdrawal of government support, failure of efforts in response to the crisis, or investor perception that such efforts are not succeeding, could adversely impact the value and liquidity of certain securities. The severity or duration of adverse economic conditions may also be affected by policy changes made by governments or quasi-governmental organizations, including changes in tax laws. The impact of new financial regulation legislation on the markets and the practical implications for market participants may not be fully known for some time. Regulatory changes are causing some financial services companies to exit long-standing lines of business, resulting in dislocations for other market participants. In addition, political and diplomatic events within the U.S. and abroad, such as the U.S. government’s inability at times to agree on a long-term budget and deficit reduction plan, the threat of a federal government shutdown and threats not to increase the federal government’s debt limit, may affect investor and consumer confidence and may adversely impact financial markets and the broader economy, perhaps suddenly and to a significant degree. The results of the 2016 U.S. presidential election may result in significant changes in certain policies. These changes may result in lower corporate taxes, higher levels of public debt, higher interest rates, more restrictions on international trade, and less stringent prudential regulation of certain players in the financial markets.
29
American Beacon TwentyFour Strategic Income FundSM
Notes to Financial Statements
June 30, 2018
Changes in market conditions will not have the same impact on all types of securities. Interest rates have been unusually low in recent years in the U.S. and abroad. Because there is little precedent for this situation, it is difficult to predict the impact of a significant rate increase on various markets. For example, because investors may buy securities or other investments with borrowed money, a significant increase in interest rates may cause a decline in the markets for those investments. Because of the sharp decline in the worldwide price of oil, there is a concern that oil producing nations may withdraw significant assets now held in U.S. Treasuries, which could force a substantial increase in interest rates. Regulators have expressed concern that rate increases may cause investors to sell fixed income securities faster than the market can absorb them, contributing to price volatility. In addition, there is a risk that the prices of goods and services in the U.S. and many foreign economies may decline over time, known as deflation (the opposite of inflation). Deflation may have an adverse effect on stock prices and creditworthiness and may make defaults on debt more likely. If a country’s economy slips into a deflationary pattern, it could last for a prolonged period and may be difficult to reverse. The abandonment of the euro or withdrawal from the European Union (“EU”) on the part of the United Kingdom or any other member could significantly adversely affect the value of the Fund’s investments in Europe. Particularly, the United Kingdom’s vote to leave the EU could lead to a prolonged period of uncertainty as to the exact terms of exit and the impact on different industry sectors and increased market volatility.
Market Timing Risk
Because the Fund invests in foreign securities, it is particularly subject to the risk of market timing activities. Frequent trading by Fund shareholders poses risks to other shareholders in the Fund, including (i) the dilution of the Fund’s NAV, (ii) an increase in the Fund’s expenses, and (iii) interference with the portfolio manager’s ability to execute efficient investment strategies. Because of specific securities in which the Fund may invest, it could be subject to the risk of market timing activities by shareholders.
Non-Diversification Risk
The Fund is non-diversified, which means the Fund may focus its investments in the securities of a comparatively small number of issuers. Investments in securities of a limited number of issuers exposes the Fund to greater market risk and potential losses than if assets were diversified among the securities of a greater number of issuers.
Other Investment Companies Risk
The Fund may invest in shares of other registered investment companies, including ETFs and money market funds that are advised by the Manager. To the extent that the Fund invests in shares of other registered investment companies, the Fund will indirectly bear the fees and expenses charged by those investment companies in addition to the Fund’s direct fees and expenses and will be subject to the risks associated with investments in those companies.
Restricted Securities Risk
Securities not registered in the U.S. under the Securities Act of 1933, as amended (the “Securities Act”), including Rule 144A securities, are restricted as to their resale. Such securities may not be listed on an exchange and may have no active trading market. They may be more difficult to purchase or sell at an advantageous time or price because such securities may not be readily marketable in broad public markets. The Fund may not be able to sell a restricted security when the sub-advisor considers it desirable to do so and/or may have to sell the security at a lower price than the Fund believes is its fair market value. In addition, transaction costs may be higher for restricted securities and the Fund may receive only limited information regarding the issuer of a restricted security. The Fund may have to bear the expense of registering restricted securities for resale and the risk of substantial delays in effecting the registration.
30
American Beacon TwentyFour Strategic Income FundSM
Notes to Financial Statements
June 30, 2018
Sovereign and Quasi Sovereign Debt Risk
The Fund normally will have significant investments in sovereign and quasi-sovereign debt securities. These investments are subject to risk of payment delays or defaults due to (1) country cash flow problems, (2) insufficient foreign currency reserves, (3) political considerations, (4) large debt positions relative to the country’s economy, (5) policies toward foreign lenders or investors, (6) the failure to implement economic reforms required by the International Monetary Fund or other multilateral agencies, or (7) an inability or unwillingness to repay debts. It may be particularly difficult to enforce the rights of debt holders in frontier and emerging markets. A governmental entity that defaults on an obligation may request additional time in which to pay or further loans or may seek to restructure its obligations to reduce interest rates or outstanding principal. There is no legal process for collecting sovereign and quasi-sovereign debt that a government does not pay nor are there bankruptcy proceedings through which all or part of the sovereign debt that a governmental entity has not repaid may be collected. Sovereign and quasi-sovereign debt risk is increased for emerging and frontier markets issuers, which are among the largest debtors to commercial banks and foreign governments. At times, certain emerging market countries have declared moratoria on the payment of principal and interest on external debt. Certain emerging market countries have experienced difficulty in servicing their sovereign debt on a timely basis, which has led to defaults and the restructuring of certain indebtedness.
U.S. Government Securities and Government-Sponsored Enterprises Risk
A security backed by the U.S. Treasury or the full faith and credit of the United States is guaranteed by the applicable entity only as to the timely payment of interest and principal when held to maturity. The market prices for such securities are not guaranteed and will fluctuate. Securities held by the Fund that are issued by government-sponsored enterprises, such as the Fannie Mae, Freddie Mac, FHLB, FFCB, and the Tennessee Valley Authority are not guaranteed by the U.S. Treasury and are not backed by the full faith and credit of the U.S. Government and no assurance can be given that the U.S. Government will provide financial support if these organizations do not have the funds to meet future payment obligations. U.S. Government securities and securities of government sponsored entities are also subject to credit risk, interest rate risk and market risk.
Valuation Risk
The Fund may value certain assets at a price different from the price at which they can be sold. This risk may be especially pronounced for investments, such as certain derivatives, which may be illiquid or which may become illiquid.
Variable and Floating Rate Securities Risk
The interest rates payable on variable and floating-rate securities are not fixed and may fluctuate based upon changes in market rates. The interest rate on a floating rate security is a variable rate which is tied to another interest rate, such as a money-market index or Treasury bill rate. Variable and floating rate securities are subject to interest rate risk and credit risk.
As short-term interest rates decline, interest payable on floating-rate securities typically decreases. Alternatively, during periods of rising interest rates, interest payable on floating-rate securities typically increases. Changes in the interest rates of floating-rate securities may lag behind changes in market rates or may have limits on the maximum rate change for a given period of time. The value of floating-rate securities may decline if their interest rates do not rise as much, or as quickly, as interest rates in general. Conversely, floating rate securities will not generally increase in value if interest rates decline.
7. Federal Income and Excise Taxes
It is the policy of the Fund to qualify as a regulated investment company (“RIC”), by complying with all applicable provisions of Subchapter M of the Internal Revenue Code, as amended, and to make distributions of taxable income sufficient to relieve it from substantially all federal income and excise taxes. For federal income tax purposes, the Fund is treated as a single entity for the purpose of determining such qualification.
31
American Beacon TwentyFour Strategic Income FundSM
Notes to Financial Statements
June 30, 2018
The Fund does not have any unrecognized tax benefits in the accompanying financial statements. Each of the tax years in the two year period ended June 30, 2018 remain subject to examination by the Internal Revenue Service. If applicable, the Fund recognizes interest accrued related to unrecognized tax benefits in interest expense and penalties in “Other expenses” on the Statement of Operations.
The Fund may be subject to taxes imposed by countries in which it invests. Such taxes are generally based on returns of income earned or gains realized or repatriated. Taxes are accrued and applied to net investment income, net realized capital gains and net unrealized appreciation (depreciation), as applicable, as the income is earned or capital gains are recorded.
Dividends are categorized in accordance with income tax regulations which may treat certain transactions differently than U.S. GAAP. Accordingly, the character of distributions and composition of net assets for tax purposes may differ from those reflected in the accompanying financial statements.
The tax character of distributions paid were as follows:
| Year Ended June 30, 2018 | From April 3, 2017A to June 30, 2017 | |||||||||||
Distributions paid from: | ||||||||||||
Ordinary income* | ||||||||||||
Institutional Class | $ | 48,595 | $ | |||||||||
Y Class | 272,222 | - | ||||||||||
Investors Class | 30,565 | - | ||||||||||
Ultra Class | 529,543 | - | ||||||||||
Return of capital | ||||||||||||
Institutional Class | - | 877 | ||||||||||
Y Class | - | 877 | ||||||||||
Investor Class | - | 877 | ||||||||||
Ultra Class | - | 128,902 | ||||||||||
|
|
|
| |||||||||
Total distributions paid | $ | 880,925 | $ | 131,533 | ||||||||
|
|
|
| |||||||||
*For tax purposes, short-term capital gains are considered ordinary income distributions.
ACommencement of operations.
As of June 30, 2018, the components of distributable earnings (deficits) on a tax basis were as follows:
Fund | Tax Cost | Unrealized Appreciation | Unrealized (Depreciation) | Net Unrealized Appreciation (Depreciation) | ||||||||||||
| TwentyFour Strategic Income | $ | 38,683,808 | $ | 595,106 | $ | (1,306,492 | ) | $ | (711,386 | ) | ||||||
Fund | Net Unrealized Appreciation (Depreciation) | Undistributed Ordinary Income | Undistributed Long-Term Capital Gains | Accumulated Capital and Other (Losses) | Other Temporary Differences | Distributable Earnings | ||||||||||||||||||
TwentyFour Strategic Income | $ | (711,386 | ) | $ | 842,584 | $ | 16,331 | $ | - | $ | - | $ | 147,529 | |||||||||||
Financial reporting records are adjusted for permanent book/tax differences to reflect tax character. Financial records are not adjusted for temporary differences. The temporary differences between financial reporting and tax-basis reporting of unrealized appreciation (depreciation) are attributable primarily to the tax deferral of losses from wash sales, the realization for tax purposes of unrealized gains (losses) on certain derivative instruments, and the tax deferral of losses due to straddles.
Due to inherent differences in the recognition of income, expenses, and realized gains (losses) under U.S. GAAP and federal income tax regulations, permanent differences between book and tax reporting have been identified and appropriately reclassified on the Statement of Assets and Liabilities.
32
American Beacon TwentyFour Strategic Income FundSM
Notes to Financial Statements
June 30, 2018
Accordingly, the following amounts represent current year permanent differences derived from foreign currency reclasses as of June 30, 2018:
Fund | Paid-In-Capital | Undistributed (Overdistribution of) Net Investment Income | Accumulated Net Realized Gain (Loss) | Net Unrealized Appreciation (Depreciation) | ||||||||||||
TwentyFour Strategic Income | $ | - | $ | 305,174 | $ | (305,174 | ) | $ | - | |||||||
Under the Regulated Investment Company Modernization Act of 2010 (“RIC MOD”), net capital losses recognized by the Fund in taxable years beginning after December 22, 2010 are carried forward indefinitely and retain their character as short-term and/or long-term losses.
During the year June 30, 2018, the Fund did not have any capital loss carryforwards.
8. Investment Transactions
The aggregate cost of purchases and proceeds from sales and maturities of investments, other than short-term obligations, for the year ended June 30, 2018 were as follows:
Fund | Purchases (non-U.S. Government Securities) | Purchases of U.S. Government Securities | Sales (non-U.S. Government Securities) | Sales of U.S. Government Securities | ||||||||||||
TwentyFour Strategic Income | $ | 39,870,938 | $ | 11,164,027 | $ | 19,956,212 | $ | 8,065,531 | ||||||||
A summary of the Fund’s transactions in the USG Select Fund for the year ended June 30, 2018 were as follows:
Fund | Type of Transaction | June 30, 2017 Shares/Fair Value | Purchases | Sales | June 30, 2018 Shares/Fair Value | Dividend Income | ||||||||||||||||||||||||||||||||||||
| TwentyFour Strategic Income | Direct | $ | 858,955 | $ | 36,577,874 | $ | 37,044,765 | $ | 392,064 | $ | 11,842 | |||||||||||||||||||||||||||||||
9. Borrowing Arrangements
Effective November 16, 2017, the Fund, along with certain other funds managed by the Manager (“Participating Funds”), entered into a committed revolving line of credit (the “Committed Line”) agreement with State Street Bank and Trust Company (the “Bank”) to be used to facilitate portfolio liquidity. The maximum borrowing amount under the Committed Line is $50 million with interest at a rate equal to the higher of (a) one-month London Inter-Bank Offered Rate (“LIBOR”) plus 1.25% per annum or (b) the Federal Funds rate plus 1.25% per annum on amounts borrowed. Each of the Participating Funds will pay a commitment fee at a rate of 0.25% per annum on the unused portion of the Committed Line amount. The Committed Line expires November 15, 2018, unless extended by the Bank or terminated by the Participating Funds in accordance with the agreement.
Effective November 16, 2017, the Fund, along with certain other Participating Funds managed by the Manager, entered into an uncommitted discretionary demand revolving line of credit (the “Uncommitted Line”) agreement with the Bank to be used to facilitate portfolio liquidity. The maximum borrowing amount under the Uncommitted Line is $50 million with interest at a rate equal to the higher of (a) one-month LIBOR plus 1.25% per annum or (b) the Federal Funds rate. The Uncommitted Line expires November 15, 2018 unless extended by the Bank or terminated by the Participating Funds in accordance with the agreement.
The Participating Funds paid administration, legal and arrangement fees, which are recognized as a component of “Other expenses” on the Statement of Operations, along with commitment fees, that have been allocated among the Participating Funds based on average daily net assets. During the year ended June 30, 2018, the Fund did not utilize this facility.
33
American Beacon TwentyFour Strategic Income FundSM
Notes to Financial Statements
June 30, 2018
10. Capital Share Transactions
The tables below summarize the activity in capital shares for each Class of the Fund:
| Institutional Class | ||||||||||||||||||||||||||||
| Year ended June 30, 2018 | April 3,2017A to June 30, 2017 | |||||||||||||||||||||||||||
TwentyFour Strategic Income Fund | Shares | Amount | Shares | Amount | ||||||||||||||||||||||||
| Shares sold | 649,311 | $ | 6,639,277 | - | B | $ | - | B | ||||||||||||||||||||
| Reinvestment of dividends | 4,769 | 48,595 | 87 | 877 | ||||||||||||||||||||||||
| Shares redeemed | (22,755 | ) | (232,211 | ) | - | - | ||||||||||||||||||||||
|
|
|
|
|
|
|
| |||||||||||||||||||||
| Net increase in shares outstanding | 631,325 | $ | 6,455,661 | 87 | $ | 877 | ||||||||||||||||||||||
|
|
|
|
|
| �� |
| |||||||||||||||||||||
| Y Class | ||||||||||||||||||||||||||||
| Year ended June 30, 2018 | April 3,2017A to June 30, 2017 | |||||||||||||||||||||||||||
TwentyFour Strategic Income Fund | Shares | Amount | Shares | Amount | ||||||||||||||||||||||||
| Shares sold | 2,531,698 | $ | 25,874,346 | 54,594 | B | $ | 554,700 | B | ||||||||||||||||||||
| Reinvestment of dividends | 26,631 | 272,222 | 87 | 877 | ||||||||||||||||||||||||
| Shares redeemed | (408,046 | ) | (4,171,937 | ) | - | - | ||||||||||||||||||||||
|
|
|
|
|
|
|
| |||||||||||||||||||||
| Net increase in shares outstanding | 2,150,283 | $ | 21,974,631 | 54,681 | $ | 555,577 | ||||||||||||||||||||||
|
|
|
|
|
|
|
| |||||||||||||||||||||
| Investor Class | ||||||||||||||||||||||||||||
| Year ended June 30, 2018 | April 3,2017A to June 30, 2017 | |||||||||||||||||||||||||||
TwentyFour Strategic Income Fund | Shares | Amount | Shares | Amount | ||||||||||||||||||||||||
| Shares sold | 122,804 | $ | 1,255,181 | 13,559 | B | $ | 137,800 | B | ||||||||||||||||||||
| Reinvestment of dividends | 2,994 | 30,565 | 87 | 877 | ||||||||||||||||||||||||
| Shares redeemed | (22,576 | ) | (227,720 | ) | - | - | ||||||||||||||||||||||
|
|
|
|
|
|
|
| |||||||||||||||||||||
| Net increase in shares outstanding | 103,222 | $ | 1,058,026 | 13,646 | $ | 138,677 | ||||||||||||||||||||||
|
|
|
|
|
|
|
| |||||||||||||||||||||
| Ultra Class | ||||||||||||||||||||||||||||
| Year ended June 30, 2018 | April 3,2017A to June 30, 2017 | |||||||||||||||||||||||||||
TwentyFour Strategic Income Fund | Shares | Amount | Shares | Amount | ||||||||||||||||||||||||
| Shares sold | 145,914 | $ | 1,500,000 | - | B | $ | - | B | ||||||||||||||||||||
| Reinvestment of dividends | 51,654 | 529,543 | 12,733 | 128,902 | ||||||||||||||||||||||||
| Shares redeemed | (775,775 | ) | (8,000,000 | ) | - | - | ||||||||||||||||||||||
|
|
|
|
|
|
|
| |||||||||||||||||||||
| Net increase (decrease) in shares outstanding | (578,207 | ) | $ | (5,970,457 | ) | 12,733 | $ | 128,902 | ||||||||||||||||||||
|
|
|
|
|
|
|
| |||||||||||||||||||||
A Commencement of operations.
B Seed capital was received on April 3, 2017 in the amount of $100,000, $100,000, $100,000, and $14,700,000 for the Institutional, Y, Investor, and Ultra Classes, respectively. As a result, shares were issued in the amounts of 10,000, 10,000, 10,000, and 1,470,000 for the Institutional, Y, Investor, and Ultra Classes, respectively.
11. Subsequent Events
On August 22, 2018, the Board of the Trust approved a Plan of Reorganization and Termination (the “Plan”) to reorganize the American Beacon Flexible Bond Fund (the “Target Fund”), another series of the Trust, into the Fund (the “Acquiring Fund”) (the “Reorganization”). The Reorganization is expected to occur on or about November 16, 2018. Also, effective August 23, 2018, the Fund’s classification was changed from “non-diversified” to “diversified” within the meaning of the Investment Company Act of 1940, as amended.
34
American Beacon TwentyFour Strategic Income FundSM
(For a share outstanding throughout the period)
| Institutional Class | ||||||||||||
| Year Ended June 30, 2018 | April 3, 2017A to June 30, 2017 | |||||||||||
|
| |||||||||||
Net asset value, beginning of period | $ | 10.17 | $ | 10.00 | ||||||||
|
|
|
| |||||||||
Income (loss) from investment operations: | ||||||||||||
Net investment income | 0.44 | 0.20 | ||||||||||
Net gains (losses) on investments (both realized and unrealized) | (0.09 | ) | 0.06 | |||||||||
|
|
|
| |||||||||
Total income from investment operations | 0.35 | 0.26 | ||||||||||
|
|
|
| |||||||||
Less distributions: | ||||||||||||
Dividends from net investment income | (0.45 | ) | - | |||||||||
Tax return of capitalB | - | (0.09 | ) | |||||||||
|
|
|
| |||||||||
Total distributions | (0.45 | ) | (0.09 | ) | ||||||||
|
|
|
| |||||||||
Net asset value, end of period | $ | 10.07 | $ | 10.17 | ||||||||
|
|
|
| |||||||||
Total returnC | 3.49 | % | 2.58 | %D | ||||||||
|
|
|
| |||||||||
Ratios and supplemental data: | ||||||||||||
Net assets, end of period | $ | 6,460,768 | $ | 102,562 | ||||||||
Ratios to average net assets: | ||||||||||||
Expenses, before reimbursements | 1.74 | % | 9.14 | %E | ||||||||
Expenses, net of reimbursements | 0.72 | % | 0.72 | %E | ||||||||
Net investment income (loss), before expense reimbursements | 3.22 | % | (3.68 | )%E | ||||||||
Net investment income, net of reimbursements | 4.24 | % | 4.74 | %E | ||||||||
Portfolio turnover rate | 135 | % | 27 | %F | ||||||||
| A | Commencement of operations. |
| B | Return of capital is calculated based on outstanding shares at the time of distribution. |
| C | Based on net asset value, which does not reflect the sales charge, redemption fee, or contingent deferred sales charge, if applicable. May include adjustments in accordance with U.S. GAAP and as such, the net asset value for reporting purposes and the returns based upon those net asset values may differ from the net asset value and returns for shareholder transactions. |
| D | Not annualized. |
| E | Annualized. |
| F | Portfolio turnover rate is for the period from April 3, 2017 through June 30, 2017 and is not annualized. |
See accompanying notes
35
American Beacon TwentyFour Strategic Income FundSM
Financial Highlights
(For a share outstanding throughout the period)
| Y Class | ||||||||||||
| Year Ended June 30, 2018 | April 3, 2017A to June 30, 2017 | |||||||||||
|
| |||||||||||
Net asset value, beginning of period | $ | 10.16 | $ | 10.00 | ||||||||
|
|
|
| |||||||||
Income (loss) from investment operations: | ||||||||||||
Net investment income | 0.46 | 0.11 | ||||||||||
Net gains (losses) on investments (both realized and unrealized) | (0.11 | ) | 0.14 | |||||||||
|
|
|
| |||||||||
Total income from investment operations | 0.35 | 0.25 | ||||||||||
|
|
|
| |||||||||
Less distributions: | ||||||||||||
Dividends from net investment income | (0.45 | ) | - | |||||||||
Tax return of capitalB | - | (0.09 | ) | |||||||||
|
|
|
| |||||||||
Total distributions | (0.45 | ) | (0.09 | ) | ||||||||
|
|
|
| |||||||||
Net asset value, end of period | $ | 10.06 | $ | 10.16 | ||||||||
|
|
|
| |||||||||
Total returnC | 3.49 | % | 2.48 | %D | ||||||||
|
|
|
| |||||||||
Ratios and supplemental data: |
| |||||||||||
Net assets, end of period | $ | 22,277,957 | $ | 657,411 | ||||||||
Ratios to average net assets: | ||||||||||||
Expenses, before reimbursements | 1.78 | % | 7.64 | %E | ||||||||
Expenses, net of reimbursements | 0.82 | % | 0.82 | %E | ||||||||
Net investment income (loss), before expense reimbursements | 3.25 | % | (2.94 | )%E | ||||||||
Net investment income, net of reimbursements | 4.21 | % | 3.88 | %E | ||||||||
Portfolio turnover rate | 135 | % | 27 | %F | ||||||||
| A | Commencement of operations. |
| B | Return of capital is calculated based on outstanding shares at the time of distribution. |
| C | Based on net asset value, which does not reflect the sales charge, redemption fee, or contingent deferred sales charge, if applicable. May include adjustments in accordance with U.S. GAAP and as such, the net asset value for reporting purposes and the returns based upon those net asset values may differ from the net asset value and returns for shareholder transactions. |
| D | Not annualized. |
| E | Annualized. |
| F | Portfolio turnover rate is for the period from April 3, 2017 through June 30, 2017 and is not annualized. |
See accompanying notes
36
American Beacon TwentyFour Strategic Income FundSM
Financial Highlights
(For a share outstanding throughout the period)
| Investor Class | ||||||||||||
| Year Ended June 30, 2018 | April 3, 2017A to June 30, 2017 | |||||||||||
|
| |||||||||||
Net asset value, beginning of period | $ | 10.16 | $ | 10.00 | ||||||||
|
|
|
| |||||||||
Income (loss) from investment operations: | ||||||||||||
Net investment income | 0.43 | 0.14 | ||||||||||
Net gains (losses) on investments (both realized and unrealized) | (0.12 | ) | 0.11 | |||||||||
|
|
|
| |||||||||
Total income from investment operations | 0.31 | 0.25 | ||||||||||
|
|
|
| |||||||||
Less distributions: | ||||||||||||
Dividends from net investment income | (0.45 | ) | - | |||||||||
Tax return of capitalB | - | (0.09 | ) | |||||||||
|
|
|
| |||||||||
Total distributions | (0.45 | ) | (0.09 | ) | ||||||||
|
|
|
| |||||||||
Net asset value, end of period | $ | 10.02 | $ | 10.16 | ||||||||
|
|
|
| |||||||||
Total returnC | 3.09 | % | 2.48 | %D | ||||||||
|
|
|
| |||||||||
Ratios and supplemental data: |
| |||||||||||
Net assets, end of period | $ | 1,271,611 | $ | 240,201 | ||||||||
Ratios to average net assets: | ||||||||||||
Expenses, before reimbursements | 2.16 | % | 10.00 | %E | ||||||||
Expenses, net of reimbursements | 1.09 | % | 1.09 | %E | ||||||||
Net investment income (loss), before expense reimbursements | 2.89 | % | (4.86 | )%E | ||||||||
Net investment income, net of reimbursements | 3.96 | % | 4.06 | %E | ||||||||
Portfolio turnover rate | 135 | % | 27 | %F | ||||||||
| A | Commencement of operations. |
| B | Return of capital is calculated based on outstanding shares at the time of distribution. |
| C | Based on net asset value, which does not reflect the sales charge, redemption fee, or contingent deferred sales charge, if applicable. May include adjustments in accordance with U.S. GAAP and as such, the net asset value for reporting purposes and the returns based upon those net asset values may differ from the net asset value and returns for shareholder transactions. |
| D | Not annualized. |
| E | Annualized. |
| F | Portfolio turnover rate is for the period from April 3, 2017 through June 30, 2017 and is not annualized. |
See accompanying notes
37
American Beacon TwentyFour Strategic Income FundSM
Financial Highlights
(For a share outstanding throughout the period)
| Ultra | ||||||||||||
| Year Ended June 30, 2018 | April 3, 2017A to June 30, 2017 | |||||||||||
|
| |||||||||||
Net asset value, beginning of period | $ | 10.17 | $ | 10.00 | ||||||||
|
|
|
| |||||||||
Income (loss) from investment operations: | ||||||||||||
Net investment income | 0.47 | 0.21 | ||||||||||
Net gains (losses) on investments (both realized and unrealized) | (0.11 | ) | 0.05 | |||||||||
|
|
|
| |||||||||
Total income from investment operations | 0.36 | 0.26 | ||||||||||
|
|
|
| |||||||||
Less distributions: | ||||||||||||
Dividends from net investment income | (0.45 | ) | - | |||||||||
Tax return of capitalB | - | (0.09 | ) | |||||||||
|
|
|
| |||||||||
Total distributions | (0.45 | ) | (0.09 | ) | ||||||||
|
|
|
| |||||||||
Net asset value, end of period | $ | 10.08 | $ | 10.17 | ||||||||
|
|
|
| |||||||||
Total returnC | 3.59 | % | 2.58 | %D | ||||||||
|
|
|
| |||||||||
Ratios and supplemental data: | ||||||||||||
Net assets, end of period | $ | 9,114,222 | $ | 15,077,638 | ||||||||
Ratios to average net assets: | ||||||||||||
Expenses, before reimbursements | 1.73 | % | 4.61 | %E | ||||||||
Expenses, net of reimbursements | 0.67 | % | 0.69 | %E | ||||||||
Net investment income, before expense reimbursements | 3.41 | % | 0.84 | %E | ||||||||
Net investment income, net of reimbursements | 4.48 | % | 4.77 | %E | ||||||||
Portfolio turnover rate | 135 | % | 27 | %F | ||||||||
| A | Commencement of operations. |
| B | Return of capital is calculated based on outstanding shares at the time of distribution. |
| C | Based on net asset value, which does not reflect the sales charge, redemption fee, or contingent deferred sales charge, if applicable. May include adjustments in accordance with U.S. GAAP and as such, the net asset value for reporting purposes and the returns based upon those net asset values may differ from the net asset value and returns for shareholder transactions. |
| D | Not annualized. |
| E | Annualized. |
| F | Portfolio turnover rate is for the period from April 3, 2017 through June 30, 2017 and is not annualized. |
See accompanying notes
38
American Beacon TwentyFour Strategic Income FundSM
Federal Tax Information
June 30, 2018 (Unaudited)
Certain tax information regarding the Fund is required to be provided to shareholders based upon the Fund’s income and distributions for the taxable year ended June 30, 2018. The information and distributions reported herein may differ from information and distributions taxable to the shareholders for the calendar year ended December 31, 2017.
The Fund designated the following items with regard to distributions paid during the fiscal year ended June 30, 2018. All designations are based on financial information available as of this annual report and, accordingly, are subject to change. For each item, it is the intention of the Fund to designate the maximum amount permitted under the Internal Revenue Code of 1986, as amended, and the regulations there under.
Corporate Dividends-Received Deduction:
TwentyFour Strategic Income | N/A |
Qualified Dividend Income:
TwentyFour Strategic Income | N/A |
Long-Term Capital Gain Distributions:
TwentyFour Strategic Income | $ | - |
Short-Term Capital Gain Distributions:
TwentyFour Strategic Income | $ | - |
Shareholders will receive notification in January 2019 of the applicable tax information necessary to prepare their 2018 income tax returns.
39
Disclosure Regarding Approval of the Management and Investment Advisory Agreements (Unaudited)
At in-person meetings held on May 18, 2018 and June 5-6, 2018 (collectively, the “Meetings”), the Board of Trustees (“Board” or “Trustees”) considered and then, at its June 6, 2018 meeting, approved the renewal of:
(1) the Management Agreement between American Beacon Advisors, Inc. (“Manager”) and the American Beacon Funds (“Trust”), on behalf of the American Beacon TwentyFour Strategic Income Fund (“Fund”); and
(2) the Investment Advisory Agreement among the Manager, TwentyFour Asset Management (US), LP (the “subadvisor”), and the Trust, on behalf of the Fund.
The Management Agreement and the Investment Advisory Agreement are collectively referred to herein as the “Agreements.” In preparation for its consideration of the renewal of the Agreements, the Board undertook steps to gather and consider information furnished by the Manager, the subadvisor, Broadridge, Inc. (“Broadridge”) and Morningstar, Inc. (“Morningstar”). The Board, with the assistance of independent legal counsel, requested and received certain relevant information from the Manager and the subadvisor.
In advance of the Meetings, the Board’s Investment Committee and/or the Manager coordinated the production of information from Broadridge and Morningstar regarding the performance, fees and expenses of the Fund as well as information from the Manager and the subadvisor. At the Meetings, the Board considered the information provided. Further, the Board took into consideration information furnished to the Board throughout the year at regular meetings of the Board and its committees, as well as information specifically prepared in connection with the renewal process.
In connection with the Board’s consideration of the Agreements, the Trustees received and evaluated such information as they deemed necessary. The information requested on behalf of the Board included, among other information, the following materials. References herein to the “firm” refer to the Manager and/or the subadvisor.
| • | comparisons of the performance of an appropriate share class of the Fund to comparable investment companies and appropriate benchmark indices, including peer group averages and performance analyses from Broadridge, and to the performance of any similar accounts or a composite of similar accounts, as applicable, managed by the firm; |
| • | comparisons of the Fund’s management and subadvisory fee rates and expense ratio with the management fee rates paid by comparable mutual funds and their expense ratios, including peer group averages and fee and expense analyses from Broadridge, and the advisory fee rates charged to other clients for which similar services are provided by a firm; |
| • | a description of any applicable fee waivers and/or expense reimbursements in place for the Fund during the past year, and any proposed changes to the expense limitation arrangements; |
| • | the Manager’s profitability with respect to the services that it provided to the Fund; |
| • | any actual or anticipated economies of scale in relation to the services the firm provides or will provide to the Fund and whether the current fee rates charged or to be charged to the Fund reflect these economies of scale for the benefit of the Fund’s investors; |
| • | an evaluation of other benefits to the firm or Fund as a result of their relationship, if any; |
| • | information regarding administrative, accounting-related and cash management services that the Manager provides to the Fund and the fees that the Manager receives for such services; and |
| • | information regarding a firm’s financial condition, the personnel of the Manager who are assigned primary responsibility for managing the Fund, staffing levels, portfolio managers’ compensation, insurance coverage, material pending litigation, code of ethics, compliance matters, actual or potential conflicts of interest that the firm experiences, or anticipates that it will experience, in providing services to the Fund, and the Manager’s disaster recovery plans. |
40
Disclosure Regarding Approval of the Management and Investment Advisory Agreements (Unaudited)
The Board noted that the Manager provides management and administrative services to the Fund pursuant to the Management Agreement. The Board considered that many mutual funds have separate contracts governing each type of service and observed that, with respect to such mutual funds, the actual management fee rates provided by Broadridge for peer group funds reflect the combined advisory and administrative expenses, reduced by any fee waivers and/or reimbursements.
A firm may not have been able to, or opted not to, provide information in response to certain information requests, in which case the Board conducted its evaluation of the firm based on information that was provided. In such cases, the Board determined that the omission of any such information was not material to its considerations. The class of shares used for comparative performance purposes was the share class with the lowest expenses available for purchase by the general public, which was the Institutional Class. The Board also considered that the use of Institutional Class performance generally facilitates a meaningful comparison for expense and performance purposes.
Provided below is an overview of certain factors the Board considered in connection with its renewal and approval of the Agreements. The Board did not identify any particular information that was most relevant to its consideration to renew or approve each Agreement, and each Trustee may have afforded different weight to the various factors. Legal counsel to the independent Trustees provided the Board with a memorandum regarding its responsibilities pertaining to the renewal and approval of investment advisory contracts, such as the Agreements. The memorandum explained the regulatory requirements surrounding the Trustees’ process for evaluating investment advisors and the terms of investment advisory contracts. Based on its evaluation, the Board unanimously concluded that the terms of each Agreement were reasonable and fair and that the renewal and approval of each Agreement was in the best interests of the Fund and its shareholders.
Considerations With Respect to the Renewal of the Management Agreement and the Investment Advisory Agreement
In determining whether to renew the Agreements, the Trustees considered the best interests of the Fund. While the Management Agreement and the Investment Advisory Agreement for the Fund were considered at the Meetings, the Board considered the Fund’s investment management and subadvisory relationships separately.
In each instance, the Board considered, among other things, the following factors: (1) the nature, extent and quality of the services provided; (2) the investment performance of the Fund; (3) the costs incurred by the Manager in rendering services to the Fund and its resulting profits or losses; (4) comparisons of services and fee rates with contracts entered into by the Manager or the subadvisor or their affiliates with other clients (such as pension funds and other institutional clients); (5) the extent to which economies of scale, if any, have been taken into account in setting each fee rate schedule; (6) whether fee rate levels reflect economies of scale, if any, for the benefit of Fund investors; and (7) any other benefits derived or anticipated to be derived by the Manager or the subadvisor from their relationships with the Fund.
Nature, Extent and Quality of Services. With respect to the renewal of the Management Agreement, the Board considered, among other factors: the Fund’s performance since its inception on April 3, 2017; the length of service of key investment personnel at the Manager; the cost structure of the Fund; the Manager’s culture of compliance and support that reduce risks to the Fund; the Manager’s quality of services; the Manager’s active role in monitoring and, as appropriate, recommending additional or replacement subadvisors; and the Manager’s efforts to retain key employees and maintain staffing levels.
With respect to the renewal of the Investment Advisory Agreement, the Board considered the level of staffing and the size of the subadvisor. The Board also considered the adequacy of the resources committed to the Fund by the subadvisor, and whether those resources were commensurate with the needs of the Fund and are sufficient to sustain appropriate levels of performance and compliance needs. In this regard, the Board considered the financial stability of the subadvisor. The Board also considered the subadvisor’s representations regarding its compliance program and code of ethics. Based on the foregoing information, the Board concluded that the nature, extent and quality of the management and advisory services provided by the Manager and the subadvisor were appropriate for the Fund.
41
Disclosure Regarding Approval of the Management and Investment Advisory Agreements (Unaudited)
Investment Performance. The Board evaluated the comparative information provided by Broadridge and the Manager regarding the performance of the Fund relative to its Broadridge performance universe, Morningstar Category, and benchmark indices, as well as the Fund’s Morningstar rating. The Board considered the information provided by Broadridge regarding Broadridge’s independent methodology for selecting the Fund’s Broadridge performance universe. The Board also considered that the performance universes selected by Broadridge may not provide appropriate comparisons for the Fund. In addition, the Board considered the performance reports and discussions with management at Board and Committee meetings throughout the year. The Board also evaluated the comparative information provided by the subadvisor regarding the performance of the Fund relative to the performance of a comparable investment account managed by the subadvisor and an appropriate peer group for the Fund. In addition, the Board considered the Manager’s recommendation to continue to retain the subadvisor. A discussion regarding the Board’s considerations with respect to the Fund’s performance appears below under “Additional Considerations and Conclusions with Respect to the Fund.”
Costs of the Services Provided to the Fund and the Profits Realized by the Manager from its Relationship with the Fund. In analyzing the cost of services and profitability of the Manager, the Board considered the revenues earned and the expenses incurred by the Manager, before and after the payment of distribution-related expenses by the Manager. The profits or losses were noted at both an aggregate level for all funds within the group of mutual funds sponsored by the Manager (the “Fund Complex”) and at an individual Fund level, with the Manager sustaining a loss before and after the payment of distribution-related expenses by the Manager. The Board also considered comparative information provided by the Manager regarding the Manager’s overall profitability with respect to the Fund Complex relative to the overall profitability of other firms in the mutual fund industry, as disclosed in publicly available sources. Although the Board noted that, in certain cases, the fee rates paid by other clients of the Manager are lower than the fee rates paid by the Fund, the Manager represented that, among other matters, the difference is attributable to the fact that the Manager does not perform administrative services for non-investment company clients and reflects the greater level of responsibility and regulatory requirements associated with managing the Fund.
The Board also noted that the Manager proposed to continue the expense waivers and reimbursements for the Fund that were in place during the last fiscal year. The Board further considered that, with respect to the Fund, the applicable Management Agreement provides for the Manager to receive a management fee comprised of an annualized fee that is retained by the Manager. The Board also noted that certain share classes of the Fund maintain higher expense ratios in order to compensate third-party financial intermediaries.
In analyzing the fee rates charged by the subadvisor in connection with its investment advisory services to the Fund, the Board considered representations made by the subadvisor that, although the subadvisor does not have a standard fee schedule, the fee rate for the Fund is below the range of advisory fee rates for other similar mandates as of December 31, 2017. The Board did not request profitability data from the subadvisor because the Board did not view this data as imperative to its deliberations given the arm’s-length nature of the relationship between the Manager and the subadvisor with respect to the negotiation of subadvisory fee rates. In addition, the Board noted that the subadvisor may not account for its profits on an account-by-account basis and that different firms likely employ different methodologies in connection with these calculations.
Based on the foregoing information, the Board concluded that the profitability levels of the Manager were reasonable in light of the services performed by the Manager. A discussion regarding the Board’s considerations with respect to the Fund’s fee rates is set forth below under “Additional Considerations and Conclusions with Respect to the Fund.”
Economies of Scale. In considering the reasonableness of the management and investment advisory fees rates, the Board considered whether economies of scale will be realized as the Fund grows and whether fee rate levels reflect these economies of scale for the benefit of Fund shareholders. In this regard, the Board considered that the Manager has negotiated breakpoints in the subadvisory fee rate for the Fund.
In addition, the Board noted the Manager’s representation that the Management Agreement contains fee schedule breakpoints at higher asset levels with respect to the Fund. Based on the foregoing information, the Board concluded that the Manager and subadvisor fee rate schedules for the Fund provide for a reasonable sharing of benefits from any economies of scale with the Fund.
42
Disclosure Regarding Approval of the Management and Investment Advisory Agreements (Unaudited)
Benefits Derived from the Relationship with the Fund. The Board considered the “fall-out” or ancillary benefits that accrue to the Manager and/or the subadvisor as a result of the advisory relationships with the Fund, including greater exposure in the marketplace with respect to the Manager’s or subadvisor’s investment process and expanding the level of assets under management by the Manager and the subadvisor. Based on the foregoing information, the Board concluded that the potential benefits accruing to the Manager and the subadvisor by virtue of their relationships with the Fund appear to be fair and reasonable.
Additional Considerations and Conclusions with Respect to the Fund
The performance comparisons below were made in comparison to the Fund’s Broadridge performance universe and Morningstar Category. With respect to the Broadridge performance universe, the 1st Quintile represents the top twenty percent of the universe based on performance and the 5th Quintile representing the bottom twenty percent of the universe based on performance. References below to the Fund’s Broadridge performance universe are to the universe of mutual funds with a comparable investment classification/objective included in the analysis provided by Broadridge.
The expense comparisons below were made in comparison to the Fund’s Broadridge expense universe and Broadridge expense group, with the 1st Quintile representing the top twenty percent of the universe or group based on lowest total expense and the 5th Quintile representing the bottom twenty percent of the universe or group based on highest total expense. References below to the Fund’s expense group and expense universe are to the respective group or universe of comparable mutual funds included in the analysis by Broadridge. A Broadridge expense group consists of the Fund and a representative sample of funds with similar operating structures and asset sizes, as selected by Broadridge. A Broadridge expense universe includes all funds in the investment classification/objective with a similar operating structure as the share class of the Fund included in the Broadridge comparative information and provides a broader view of expenses across the Fund’s investment classification/objective. The Trustees also considered the Fund’s Morningstar fee level category. In reviewing expenses, the Trustees considered the positive impact of fee waivers where applicable and the Manager’s agreement to continue the fee waivers. In addition, information regarding the subadvisor’s use of soft dollars was requested from the Manager and was considered by the Trustees.
In considering the renewal of the Management Agreement and the Investment Advisory Agreement with the subadvisor for the Fund, the Trustees considered the following additional factors:
Broadridge Total Expense Analysis Excluding 12b-1 Fees and Morningstar Fee Level Ranking
| Compared to Broadridge Expense Group | 4th Quintile | |
| Compared to Broadridge Expense Universe | 4th Quintile | |
| Morningstar Fee Level Ranking – Institutional Class | Average Expense Ratio |
Broadridge and Morningstar Performance Analysis (for the period indicated ended December 31, 2017)
| Compared to Broadridge Performance Universe | Since Inception April 3, 2017 | 1st Quintile | ||
| Compared to Morningstar Category | 6 Months | 1st Quintile |
The Trustees also considered: (1) information provided by the subadvisor regarding fee rates charged for managing accounts in the same strategy as the subadvisor manages the Fund; and (2) the Manager’s recommendation to continue to retain the subadvisor based upon, among other factors, the relatively brief period that this Fund has been in operation.
Based on these and other considerations, the Trustees: (1) concluded that the fees paid to the Manager and the subadvisor under the Management and Investment Advisory Agreements are fair and reasonable; and (2) determined that the Fund and its shareholders would benefit from the Manager’s and subadvisor’s continued management of the Fund.
43
Trustees and Officers of the American Beacon FundsSM (Unaudited)
The Trustees and officers of the American Beacon Funds (the “Trust”) are listed below, together with their principal occupations during the past five years. The address of each person listed below is 220 Las Colinas Boulevard East, Suite 1200, Irving, Texas 75039. Each Trustee oversees thirty-six funds in the fund complex that includes the Trust, the American Beacon Select Funds, the American Beacon Institutional Funds Trust, the American Beacon Sound Point Enhanced Income Fund, and the American Beacon Apollo Total Return Fund. The Trust’s Statement of Additional Information contains additional information about the Trustees and is available without charge by calling 1-800-658-5811.
Name, Age and Address | Position, Term of Office and Length of Time Served with the Trust | Principal Occupation(s) During Past 5 Years and Current Directorships | ||
| INTERESTED TRUSTEES | Term | |||
| Lifetime of Trust until removal, resignation or retirement* | ||||
| Alan D. Feld** (81) | Trustee since 1996 | Partner in the law firm of Akin, Gump, Strauss, Hauer & Feld, LLP (law firm) (1960-Present); Trustee, American Beacon Mileage Funds (1996-2012); Trustee, American Beacon Select Funds (1999-Present); Trustee, American Beacon Master Trust (1996-2012); Trustee, American Beacon Institutional Funds Trust (2017-Present); Trustee, American Beacon Sound Point Enhanced Income Fund (2018-Present); Trustee, American Beacon Apollo Total Return Fund (2018-Present). | ||
| NON-INTERESTED TRUSTEES | Term | |||
| Lifetime of Trust until removal, resignation or retirement* | ||||
| Gilbert G. Alvarado (48) | Trustee since 2015 | Director, Kura MD, Inc. (local telehealth organization) (2015-present); Vice President & CFO, Sierra Health Foundation (health conversion private foundation) (2006-Present); Vice President & CFO, Sierra Health Foundation: Center for Health Program Management (California public benefit corporation) (2012-Present); Director, Innovative North State (2012-2015); Director, Sacramento Regional Technology Alliance (2011-2016); Director, Women’s Empowerment (2009-2014); Director, Valley Healthcare Staffing (2017–present); Trustee, American Beacon Select Funds (2015-Present); Trustee, American Beacon Institutional Funds Trust (2017-Present); Trustee, American Beacon Sound Point Enhanced Income Fund (2018-Present); Trustee, American Beacon Apollo Total Return Fund (2018-Present). | ||
| Joseph B. Armes (56) | Trustee since 2015 | Chairman & CEO, CSW Industrials f/k/a Capital Southwest Corporation (investment company) (2015-Present); Chairman of the Board of Capital Southwest Corporation, predecessor to CSW Industrials, Inc. (2014-present) (investment company); CEO, Capital Southwest Corporation (2013-2015); President & CEO, JBA Investment Partners (family investment vehicle) (2010-Present); Director and Chair of Audit Committee, RSP Permian (oil and gas producer) (2013-Present); Trustee, American Beacon Select Funds (2015-Present); Trustee, American Beacon Institutional Funds Trust (2017-Present); Trustee, American Beacon Sound Point Enhanced Income Fund (2018-Present); Trustee, American Beacon Apollo Total Return Fund (2018-Present). | ||
| Gerard J. Arpey (60) | Trustee since 2012 | Director, The Home Depot, Inc. (2015-Present); Partner, Emerald Creek Group (private equity firm) (2011-Present); Director, S.C. Johnson & Son, Inc. (privately held company) (2008-present); Trustee, American Beacon Select Funds (2012-Present); Trustee, American Beacon Institutional Funds Trust (2017-Present); Trustee, American Beacon Sound Point Enhanced Income Fund (2018-Present); Trustee, American Beacon Apollo Total Return Fund (2018-Present). | ||
44
Trustees and Officers of the American Beacon FundsSM (Unaudited)
Name, Age and Address | Position, Term of Office and Length of Time Served with the Trust | Principal Occupation(s) During Past 5 Years and Current Directorships | ||
| NON-INTERESTED TRUSTEES (CONT.) | Term | |||
| Lifetime of Trust until removal, resignation or retirement* | ||||
| Brenda A. Cline (57) | Trustee since 2004 | Chief Financial Officer, Treasurer and Secretary, Kimbell Art Foundation (1993-Present); Director, Tyler Technologies, Inc. (public sector software solutions company) (2014-Present); Director, Range Resources Corporation (oil and natural gas company) (2015-Present); Trustee, Cushing Closed-End Funds (2017-Present); Trustee, American Beacon Mileage Funds (2004-2012); Trustee, American Beacon Select Funds (2004-Present); Trustee, American Beacon Master Trust (2004-2012); Trustee, American Beacon Institutional Funds Trust (2017-Present); Trustee, American Beacon Sound Point Enhanced Income Fund (2018-Present); Trustee, American Beacon Apollo Total Return Fund (2018-Present). | ||
| Eugene J. Duffy (63) | Trustee since 2008 | Managing Director, Global Investment Management Distribution, Mesirow Financial (2016-Present); Managing Director, Institutional Services, Intercontinental Real Estate Corporation (2014-Present); Principal and Executive Vice President, Paradigm Asset Management (1994-2014); Director, Sunrise Bank of Atlanta (2008-2013); Trustee, American Beacon Mileage Funds (2008-2012); Trustee, American Beacon Select Funds (2008-Present); Trustee, American Beacon Master Trust (2008-2012); Trustee, American Beacon Institutional Funds Trust (2017-Present); Trustee, American Beacon Sound Point Enhanced Income Fund (2018-Present); Trustee, American Beacon Apollo Total Return Fund (2018-Present). | ||
| Claudia A. Holz*** (60) | Trustee since 2018 | Partner, KPMG LLP (1990-2017); Trustee, American Beacon Select Funds (2018-Present); Trustee, American Beacon Institutional Funds Trust (2018-Present); Trustee, American Beacon Sound Point Enhanced Income Fund (2018-Present); Trustee, American Beacon Apollo Total Return Fund (2018-Present). | ||
| Douglas A. Lindgren**** (56) | Trustee since 2018 | CEO North America, Carne Global Financial Services (2016-2017); Managing Director, IPS Investment Management and Global Head, Content Management, UBS Wealth Management (2010-2016); Managing Director, P&S Hedge Funds, UBS Wealth Management (2008-2010); Managing Director, Head of Alternative Investments, UBS Financial Services, Inc. (2005-2008); Trustee, American Beacon Select Funds (2018-Present); Trustee, American Beacon Institutional Funds Trust (2018-Present); Trustee, American Beacon Sound Point Enhanced Income Fund (2018-Present); Trustee, American Beacon Apollo Total Return Fund (2018-Present). | ||
| Richard A. Massman (74) | Trustee since 2004 Chairman since 2008 | Consultant and General Counsel Emeritus, Hunt Consolidated, Inc. (holding company engaged in oil and gas exploration and production, refining, real estate, farming, ranching and venture capital activities) (2009-Present); Trustee, American Beacon Mileage Funds (2004-2012); Trustee, American Beacon Select Funds (2004-Present); Trustee, American Beacon Master Trust (2004-2012); Trustee, American Beacon Institutional Funds Trust (2017-Present); Trustee, American Beacon Sound Point Enhanced Income Fund (2018-Present); Trustee, American Beacon Apollo Total Return Fund (2018-Present). | ||
| Barbara J. McKenna, CFA (55) | Trustee since 2012 | Managing Principal, Longfellow Investment Management Company (2005-Present); Trustee, American Beacon Select Funds (2012-Present); Trustee, American Beacon Institutional Funds Trust (2017-Present); Trustee, American Beacon Sound Point Enhanced Income Fund (2018-Present); Trustee, American Beacon Apollo Total Return Fund (2018-Present). | ||
45
Trustees and Officers of the American Beacon FundsSM (Unaudited)
Name, Age and Address | Position, Term of Office and Length of Time Served with the Trust | Principal Occupation(s) During Past 5 Years and Current Directorships | ||
| NON-INTERESTED TRUSTEES (CONT.) | Term | |||
Lifetime of Trust until removal, resignation or retirement* | ||||
| R. Gerald Turner (72) | Trustee since 2001 | President, Southern Methodist University (1995-Present); Director, J.C. Penney Company, Inc. (1996-Present); Director, Kronus Worldwide Inc. (chemical manufacturing) (2003-Present); Trustee, American Beacon Mileage Funds (2001-2012); Trustee, American Beacon Select Funds (2001-Present); Trustee, American Beacon Master Trust (2001-2012); Trustee, American Beacon Institutional Funds Trust (2017-Present); Trustee, American Beacon Sound Point Enhanced Income Fund (2018-Present); Trustee, American Beacon Apollo Total Return Fund (2018-Present). | ||
| OFFICERS | Term | |||
| One Year | ||||
| Gene L. Needles, Jr. (63) | President since 2009 | CEO and Director (2009-Present), and Chairman (2018-Present), American Beacon Advisors, Inc.; President, American Beacon Advisors (2009-2018); Chairman and CEO, Resolute Investment Managers, Inc. (2015-Present); Director, Resolute Acquisition, Inc. (2015-Present); President (2015-2018), Director, Resolute Topco, Inc. (2015-Present), President (2015-2018), CEO (2015-Present), and Chairman (2018-Present), Resolute Investment Holdings, LLC; President, CEO and Director, Lighthouse Holdings, Inc. (2009-2015); President and CEO, Lighthouse Holdings Parent, Inc. (2009-2015); Manager, President and CEO, American Private Equity Management, LLC (2012-Present); President, American Beacon Cayman Managed Futures Strategy Fund, Ltd. (2014-Present); Director, Chairman, President and CEO, Alpha Quant Advisors, LLC (2016-Present); Director, ARK Investment Management LLC (2016-Present); Director, Shapiro Capital Management LLC (2017-Present); Director and Vice President, American Beacon Cayman Transformational Innovation Company, LTD., (2017-Present); Vice President, American Beacon Delaware Transformational Innovation Corporation (2017-Present); Executive Vice President and Chief Operating Officer, Continuous Capital, LLC (2018-Present); Member, Investment Advisory Committee, Employees Retirement System of Texas (2017-Present); Trustee, American Beacon NextShares Trust (2015-Present); President, American Beacon Select Funds (2009-Present); President, American Beacon Mileage Funds (2009-2012); President, American Beacon Master Trust (2009–2012); President, American Beacon Institutional Funds Trust (2017-Present); President, American Beacon Sound Point Enhanced Income Fund (2018- Present); President, American Beacon Apollo Total Return Fund (2018-Present). | ||
| Rosemary K. Behan (59) | VP, Secretary and Chief Legal Officer since 2006 | Vice President and Secretary, American Beacon Advisors, Inc. (2006-Present); Secretary, Resolute Investment Holdings, LLC (2015-Present) Secretary, Resolute Investment Managers, Inc. (2015-Present); Secretary, Resolute Topco, Inc. (2015-Present); Secretary, Resolute Acquisition, Inc. (2015-Present); Secretary, Lighthouse Holdings, Inc. (2008-2015); Secretary, Lighthouse Holdings Parent, Inc. (2008-2015); Secretary, American Private Equity Management, LLC (2008-Present); Secretary, American Beacon Cayman Managed Futures Strategy Fund, Ltd. (2014-Present); Secretary, Alpha Quant Advisors, LLC (2016-Present); Secretary, American Beacon Cayman Transformational Innovation Company, Ltd. (2017-Present); Secretary, American Beacon Delaware Transformational Innovation Corporation (2017-Present); Secretary, Resolute Investment Distributors, Inc. (2017-Present); Vice President and Secretary, Continuous Capital, LLC (2018-Present); Chief Legal Officer, Vice President and Secretary, American Beacon Select Funds (2006-Present); Chief Legal Officer, Vice President and Secretary, American Beacon Mileage Funds (2006-2012); Chief Legal Officer, Vice President and Secretary, American Beacon Master Trust (2006-2012); Chief Legal Officer, Vice President and Secretary, American Beacon Institutional Funds Trust (2017-Present); Vice Chief Legal Officer, Vice President and Secretary, American Beacon Sound Point Enhanced Income Fund (2018-Present); Chief Legal Officer, Vice President and Secretary American Beacon Apollo Total Return Fund (2018-Present). | ||
46
Trustees and Officers of the American Beacon FundsSM (Unaudited)
Name, Age and Address | Position, Term of Office and Length of Time Served with the Trust | Principal Occupation(s) During Past 5 Years and Current Directorships | ||
| OFFICERS (CONT.) | Term | |||
| One Year | ||||
| Brian E. Brett (58) | VP since 2004 | Senior Vice President (2012-Present) and Vice President (2004-2012), American Beacon Advisors, Inc.; Vice President, Resolute Investment Distributors, Inc. (2017-Present); Vice President, American Beacon Select Funds (2004-Present); Vice President, American Beacon Mileage Funds (2004-2012); Vice President, American Beacon Master Trust (2004-2012); Vice President, American Beacon Institutional Funds Trust (2017-Present); Vice President American Beacon Sound Point Enhanced Income Fund (2018-Present); Vice President American Beacon Apollo Total Return Fund (2018-Present). | ||
| Paul B. Cavazos (49) | VP since 2016 | Chief Investment Officer and Senior Vice President, American Beacon Advisors, Inc. (2016-Present); Chief Investment Officer and Assistant Treasurer, DTE Energy (2007-2016); Vice President, American Beacon Select Funds (2016-Present); Vice President, American Beacon Institutional Funds Trust (2017-Present); Vice President American Beacon Sound Point Enhanced Income Fund (2018-Present); Vice President American Beacon Apollo Total Return Fund (2018-Present). | ||
| Erica Duncan (47) | VP Since 2011 | Vice President, American Beacon Advisors, Inc. (2011-Present); Vice President, American Beacon Select Funds (2011-Present); Vice President, American Beacon Mileage Funds (2011-2012); Vice President, American Beacon Master Trust (2011-2012); Vice President, American Beacon Institutional Funds Trust (2017-Present); Vice President American Beacon Sound Point Enhanced Income Fund (2018-Present); Vice President American Beacon Apollo Total Return Fund (2018-Present). | ||
| Melinda G. Heika (57) | Treasurer since 2010 | Treasurer, American Beacon Advisors, Inc. (2010-Present); Resolute Investment Managers, Inc. (2015-Present); Treasurer, Resolute Acquisition, Inc. (2015-Present); Treasurer, Resolute Topco, Inc. (2015-Present); Treasurer, Resolute Investment Holdings, LLC. (2015-Present); Treasurer, Lighthouse Holdings, Inc. (2010-2015); Treasurer, Lighthouse Holdings Parent Inc., (2010-2015); Treasurer, American Private Equity Management, LLC (2012-Present); Director and Treasurer, American Beacon Cayman Managed Futures Strategy Fund, Ltd. (2014-Present); Treasurer, Alpha Quant Advisors, LLC (2016-Present); Treasurer, American Beacon Cayman Transformational Innovation, Ltd. (2017-Present); Treasurer, American Beacon Delaware Transformational Innovation Corporation (2017-Present); Treasurer, Resolute Investment Distributors, Inc. (2017-2017); Treasurer and Chief Financial Officer, Continuous Capital, LLC (2018-Present); Treasurer, American Beacon Select Funds (2010-Present); Treasurer, American Beacon Mileage Funds (2010-2012); Treasurer, American Beacon Master Trust (2010-2012); Treasurer, American Beacon Institutional Funds Trust (2017-Present); Treasurer, American Beacon Sound Point Enhanced Income Fund (2018-Present); Treasurer, American Beacon Apollo Total Return Fund (2018-Present). | ||
| Terri L. McKinney (54) | VP since 2010 | Vice President (2009-Present) and Managing Director (2003-2009), American Beacon Advisors, Inc.; Vice President, Resolute Investment Managers, Inc. (2017-Present); Vice President, Alpha Quant Advisors, LLC (2016-Present); Vice President, Resolute Investment Managers, Inc. (2017-Present); Vice President, Continuous Capital, LLC (2018-Present); Vice President, American Beacon Select Funds (2010-Present); Vice President, American Beacon Mileage Funds (2010-2012); Vice President, American Beacon Master Trust (2010-2012); Vice President, American Beacon Institutional Funds Trust (2017-Present); Vice President, American Beacon Sound Point Enhanced Income Fund (2018-Present); Vice President, American Beacon Apollo Total Return Fund (2018-Present). | ||
47
Trustees and Officers of the American Beacon FundsSM (Unaudited)
Name, Age and Address | Position, Term of Office and Length of Time Served with the Trust | Principal Occupation(s) During Past 5 Years and Current Directorships | ||
| OFFICERS (CONT.) | Term | |||
| One Year | ||||
| Jeffrey K. Ringdahl (43) | VP since 2010 | Chief Operating Officer (2010-Present), Vice President (2010-2013), Senior Vice President (2013-Present), Director (2015-Present), and President (2018-Present), American Beacon Advisors, Inc.; Vice President (2012-Present) and Manager (2015-Present), American Private Equity Management, LLC; Senior Vice President, Lighthouse Holdings, Inc. (2013-2015); Senior Vice President, Lighthouse Holdings Parent, Inc. (2013-2015); Director and Vice President, American Beacon Cayman Managed Futures Strategy Fund, Ltd. (2014-Present); Trustee, American Beacon NextShares Trust (2015-Present); Director (2015-Present), Senior Vice Present (2015-2018), and President (2018-Present), Resolute Investment Holdings, LLC; Director (2015-Present), Senior Vice President (2015-2018) and President (2018-Present), Resolute Topco, Inc.; Director (2015-Present), Senior Vice President (2015-Present), and President (2018-Present), Resolute Acquisition, Inc.; Director (2015-Present), Senior Vice President (2015-2018), and President (2018-Present), Resolute Investment Managers, Inc.; Director, Executive Vice President and Chief Operating Officer, Alpha Quant Advisors, LLC (2016-Present); Director (2017-Present), Executive Vice President (2017-2018), and President (2018-Present), Resolute Investment Services, Inc.; Director and Executive Vice President, Resolute Investment Distributors, Inc. (2017-Present); Director, Shapiro Capital Management, LLC (2017-Present); Director and Vice President, American Beacon Cayman Transformational Innovation Company, LTD., (2017-Present); Vice President, American Beacon Delaware Transformational Innovation Corporation (2017-Present); Executive Vice President and Chief Operating Officer, Continuous Capital, LLC (2018-Present); Vice President, American Beacon Select Funds (2010-Present); Vice President, American Beacon Institutional Funds Trust (2017-Present); Vice President, American Beacon Sound Point Enhanced Income Fund (2018-Present); Vice President, American Beacon Apollo Total Return Fund (2018-Present) | ||
| Samuel J. Silver (55) | VP Since 2011 | Vice President, American Beacon Advisors, Inc. (2011-Present); Vice President, American Beacon Select Funds (2011-Present); Vice President, American Beacon Mileage Funds (2011-2012); Vice President, American Beacon Master Trust (2011-2012); American Beacon Institutional Funds Trust (2011-Present); Vice President, American Beacon Sound Point Enhanced Income Fund (2018-Present); Vice President, American Beacon Apollo Total Return Fund (2018-Present). | ||
| Christina E. Sears (46) | Chief Compliance Officer since 2004 and Asst. Secretary since 1999 | Chief Compliance Officer, American Beacon Advisors, Inc. (2004-Present); Chief Compliance Officer, American Private Equity Management, LLC (2012-Present); Chief Compliance Officer and Vice President, Alpha Quant Advisors, LLC (2016-Present); Vice President, Resolute Investment Managers, Inc. (2017-Present); Vice President, Continuous Capital, LLC (2018-Present); Chief Compliance Officer (2004-Present) and Assistant Secretary (1999-Present), American Beacon Select Funds; Chief Compliance Officer (2004-2012) and Assistant Secretary (1999-2012), American Beacon Mileage Funds; Chief Compliance Officer (2004-2012) and Assistant Secretary (1999-2012), American Beacon Master Trust; Chief Compliance Officer and Assistant Secretary, American Beacon Institutional Funds Trust (2017-Present); Chief Compliance Officer and Assistant Secretary, American Beacon Sound Point Enhanced Income Fund (2018-Present); Chief Compliance Officer and Assistant Secretary, American Beacon Apollo Total Return Fund (2018-Present). | ||
48
Trustees and Officers of the American Beacon FundsSM (Unaudited)
Name, Age and Address | Position, Term of Office and Length of Time Served with the Trust | Principal Occupation(s) During Past 5 Years and Current Directorships | ||
| OFFICERS (CONT.) | Term | |||
| Sonia L. Bates (61) | Asst. Treasurer since 2011 | Assistant Treasurer, American Beacon Advisors, Inc. (2011-Present); Assistant Treasurer, Resolute Investment Managers, Inc. (2015-Present); Assistant Treasurer, Resolute Acquisition, Inc. (2015-Present); Assistant. Treasurer, Resolute Topco, Inc. (2015-Present); Assistant Treasurer, Resolute Investment Holdings, LLC.; Assistant Treasurer, Lighthouse Holdings, Inc. (2011-2015); Assistant Treasurer, Lighthouse Holdings Parent Inc. (2011-2015); Assistant Treasurer, American Private Equity Management, LLC (2012-Present); Assistant Treasurer, American Beacon Cayman Transformational Innovation Company, Ltd. (2017-Present); Assistant Treasurer, American Beacon Select Funds (2011-Present); Assistant Treasurer American Beacon Mileage Funds (2011-2012); Assistant Treasurer, American Beacon Master Trust (2011-2012); Assistant Treasurer, American Beacon Institutional Funds Trust (2017-Present); Assistant Treasurer, American Beacon Sound Point Enhanced Income Fund (2018-Present); Assistant Treasurer, American Beacon Apollo Total Return Fund (2018-Present). | ||
| One Year | ||||
| Shelley D. Abrahams (43) | Assistant Secretary since 2008 | Assistant Secretary, American Beacon Advisors, Inc. (2008-Present); Assistant Secretary, American Beacon Select Funds (2008-Present); Assistant Secretary, American Beacon Mileage Funds (2008-2012); Assistant Secretary, American Beacon Master Trust (2008-2012); Assistant Secretary, American Beacon Institutional Funds Trust (2017-Present); Assistant Secretary, American Beacon Sound Point Enhanced Income Fund (2018-Present); Assistant Secretary, American Beacon Apollo Total Return Fund (2018-Present). | ||
| Rebecca L. Harris (51) | Assistant Secretary since 2010 | Vice President, American Beacon Advisors, Inc. (2016-Present); Vice President, Resolute Investment Managers, Inc. (2017-Present); Vice President, Alpha Quant Advisors, LLC (2016-Present); Vice President, Continuous Capital, LLC (2018-Present); Assistant Secretary, American Beacon Select Funds (2010-Present); Assistant Secretary, American Beacon Mileage Funds (2010-2012); Assistant Secretary, American Beacon Master Trust (2010-2012); Assistant Secretary, American Beacon Institutional Funds Trust (2017-Present); Assistant Secretary, American Beacon Sound Point Enhanced Income Fund (2018-Present); Assistant Secretary, American Beacon Apollo Total Return Fund (2018-Present). | ||
| Diana N. Lai (42) | Assistant Secretary since 2012 | Assistant Secretary, American Beacon Advisors, Inc. (2012-Present); Assistant Secretary, American Beacon Cayman Transformational Innovation Company, Ltd. (2017-Present); Assistant Secretary, American Beacon Select Funds (2012-Present); Assistant Secretary, American Beacon Institutional Funds Trust (2017-Present); Assistant Secretary, American Beacon Sound Point Enhanced Income Fund (2018-Present); Assistant Secretary, American Beacon Apollo Total Return Fund (2018-Present). | ||
| Teresa A. Oxford (59) | Assistant Secretary since 2015 | Assistant Secretary, American Beacon Advisors, Inc. (2015-Present); Assistant Secretary, Alpha Quant Advisors, LLC (2016-Present); Assistant Secretary, American Beacon Select Funds (2015-Present); Assistant Secretary, American Beacon Institutional Funds Trust (2017-Present); Assistant Secretary, American Beacon Sound Point Enhanced Income Fund (2018-Present); Assistant Secretary, American Beacon Apollo Total Return Fund (2018-Present). | ||
* As of 11/12/2014, the Board adopted a retirement plan that requires Trustees to retire no later than the last day of the calendar year in which they reach the age of 75.
** Mr. Feld is deemed to be an “interested person” of the Trusts, as defined by the 1940 Act. Mr. Feld’s law firm of Akin, Gump, Strauss, Hauer & Feld LLP has provided legal services within the past two fiscal years to one or more of the Trust’s sub-advisors.
*** Claudia A. Holz became a new Trustee to each of the Trusts on 4/1/2018.
**** Douglas A. Lindren became a new Trustee to each of the Trusts on 1/1/2018.
49
Privacy Policy
June 30, 2018 (Unaudited)
The American Beacon Funds recognize and respect the privacy of our shareholders. We are providing this notice to you so you will understand how shareholder information may be collected and used.
We may collect nonpublic personal information about you from one or more of the following sources:
| • | information we receive from you on applications or other forms; |
| • | information about your transactions with us or our service providers; and |
| • | information we receive from third parties. |
We do not disclose any nonpublic personal information about our customers or former customers to anyone, except as permitted by law.
We restrict access to your nonpublic personal information to those employees or service providers who need to know that information to provide products or services to you. To ensure the confidentiality of your nonpublic personal information, we maintain safeguards that comply with federal standards.
50
This page intentionally left blank.
51
This page intentionally left blank.
52

Delivery of Documents
eDelivery is NOW AVAILABLE - Stop traditional mail delivery and receive your
shareholder reports and summary prospectus on-line. Sign up at
www.americanbeaconfunds.com
If you invest in the Fund through a financial institution, you may be able to receive the Fund’s regulatory mailings, such as the Prospectus, Annual Report and Semi-Annual Report, by e-mail. If you are interested in this option, please go to www.icsdelivery.com and search for your financial institution’s name or contact your financial institution directly.
To obtain more information about the Fund:
 |  | |
| By E-mail: | On the Internet: | |
| american_beacon.funds@ambeacon.com | Visit our website at www.americanbeaconfunds.com | |
By Telephone: Call (800) 658-5811 |
By Mail: American Beacon Funds P.O. Box 219643 Kansas City, MO 64121-9643 | |
| Availability of Quarterly Portfolio Schedules | Availability of Proxy Voting Policy and Records | |
| In addition to the Schedule of Investments provided in each semi-annual and annual report, the Fund files a complete schedule of its portfolio holdings with the Securities and Exchange Commission (“SEC”) on Form N-Q as of the first and third fiscal quarters. The Fund’s Forms N-Q are available on the SEC’s website at www.sec.gov. The Forms N-Q may also be reviewed and copied at the SEC’s Public Reference Section, 100 F Street, NE, Washington, D.C. 20549-2736. Information regarding the operation of the SEC’s Public Reference Room may be obtained by calling (800)-SEC-0330. A complete schedule of the Fund’s portfolio holdings is also available at www.americanbeaconfunds.com approximately sixty days after the end of each calendar quarter. | A description of the policies and procedures the Fund uses to determine how to vote proxies relating to portfolio securities is available in the Fund’s Statement of Additional Information, is available free of charge on the Fund’s website www.americanbeaconfunds.com and by calling 1-800-967-9009 or by accessing the SEC’s website at www.sec.gov. The Fund’s proxy voting record for the most recent year ended June 30 is filed annually with the SEC on Form N-PX. The Fund’s Forms N-PX are available on the SEC’s website at www.sec.gov. The Fund’s proxy voting record may also be obtained by calling 1-800-967-9009. | |


Fund Service Providers:
CUSTODIAN State Street Bank and Trust Boston, Massachusetts | TRANSFER AGENT DST Asset Manager Solutions, Inc. Quincy, Massachusetts | INDEPENDENT REGISTERED PUBLIC ACCOUNTING FIRM PricewaterhouseCoopers Boston, Massachusetts | DISTRIBUTOR Resolute Investment Distributors, Inc. Irving, Texas |
This report is prepared for shareholders of the American Beacon Funds and may be distributed to others only if preceded or accompanied by a current Prospectus or Summary Prospectus.
American Beacon Funds and American Beacon TwentyFour Strategic Income Fund are service marks of American Beacon Advisors, Inc.
AR 6/18

About American Beacon Advisors
Since 1986, American Beacon Advisors has offered a variety of products and investment advisory services to numerous institutional and retail clients, including a variety of mutual funds, corporate cash management, and separate account management.
Our clients include defined benefit plans, defined contribution plans, foundations, endowments, corporations, financial planners, and other institutional investors. With American Beacon Advisors, you can put the experience of a multi-billion dollar asset management firm to work for your company.
SHAPIRO EQUITY OPPORTUNITIES FUND
Investing in value stocks may limit downside risk over time; however, the Fund may produce more modest gains than riskier stock funds as a trade-off for this potentially lower risk. Because the Fund may invest in fewer issuers than a more diversified portfolio, the fluctuating value of a single holding may have a greater effect on the value of the Fund. The Fund participates in a securities lending program. The use of futures contracts for cash management may subject the Fund to losing more money than invested. Please see the prospectus for a complete discussion of the Fund’s risks. There can be no assurances that the investment objectives of this Fund will be met.
SHAPIRO SMID CAP EQUITY FUND
Investing in value stocks may limit downside risk over time; however, the Fund may produce more modest gains than riskier stock funds as a trade-off for this potentially lower risk. Investing in small- or mid-capitalization stocks may involve greater volatility and lower liquidity than larger company stocks. Because the Fund may invest in fewer issuers than a more diversified portfolio, the fluctuating value of a single holding may have a greater effect on the value of the Fund. The Fund participates in a securities lending program. The use of futures contracts for cash management may subject the Fund to losing more money than invested. Please see the prospectus for a complete discussion of the Fund’s risks. There can be no assurances that the investment objectives of this Fund will be met.
Any opinions herein, including forecasts, reflect our judgment as of the end of the reporting period and are subject to change. Each advisor’s strategies and each Fund’s portfolio composition will change depending on economic and market conditions. This report is not a complete analysis of market conditions, and, therefore, should not be relied upon as investment advice. Although economic and market information has been compiled from reliable sources, American Beacon Advisors, Inc. makes no representation as to the completeness or accuracy of the statements contained herein.
American Beacon Funds | June 30, 2018 |
| 1 | ||||
| 2 | ||||
| 7 | ||||
| 9 | ||||
Schedules of Investments: | ||||
| 10 | ||||
| 12 | ||||
| 14 | ||||
| 17 | ||||
Financial Highlights: | ||||
| 32 | ||||
| 35 | ||||
| 38 | ||||
| 39 | ||||
| 45 | ||||
| Back Cover | ||||
 | Dear Shareholders,
Since 1986, American Beacon has endeavored to provide investors with a disciplined approach to realizing long-term investment goals: Institutional wisdom + earned alpha = enduring value.
u We believe institutional wisdom comes from having more than 30 years of experience as manager of one of the country’s largest pension plans. As a fiduciary, we have built an investment due-diligence and oversight infrastructure, which we leverage across all our investment products. When selecting our investment managers, we focus on their people, processes and performance. We perform due-diligence reviews with each investment manager on a quarterly basis.
u We believe earned alpha – that is, the returns of an actively managed fund beyond a benchmark – comes from employing and engaging |
| investment managers we believe are best-in-class and who have defined, repeatable and proven processes. Our experience has shown us that, while it’s important to be mindful of short-term considerations, having a long-term focus helps manage expectations, mitigate risks and realize goals. Thus, we seek relationships with leading investment managers who display a willingness to undertake time-intensive research strategies. The resulting investment portfolios are differentiated from their peers and allow incremental changes to help address periods of market volatility and economic uncertainty. |
| u | We believe enduring value comes from “putting a portfolio in place and sticking with the plan.” Our mutual funds provide you with access to institutional-quality, research-intensive investment managers with diverse processes and styles. In the long run, having such access and spending time in the market – rather than trying to time the market – may better position you to reach your long-term investment goals. |
The markets and U.S. economy were robust during calendar year 2017. However, during periods of market volatility and economic uncertainty – such as what we’ve seen thus far in 2018 – investing for the long term requires conviction. It isn’t about identifying and anticipating the next big market move. It’s about identifying the right investment products for riding out those moves. It’s about developing an approach based on long-term participation, while seeking some measure of protection against ongoing volatility.
As a manager of managers, we strive to provide investment products that may enable investors to participate during market upswings while potentially insulating against market downswings. Many of the sub-advisors to our mutual funds pursue upside capture and/or downside protection using proprietary strategies. The investment teams behind our mutual funds seek to produce consistent, long-term results rather than focus only on short-term movements in the markets. In managing our investment products, we emphasize identifying opportunities that offer the potential for high quality and lower risk.
At American Beacon, our approach is more than a concept. It’s the cornerstone of our culture. And we strive to apply it at every turn as we seek to provide a well-diversified line of investment products for your portfolio.
Thank you for your continued interest in American Beacon. For additional information about our investment products or to access your account information, please visit our website at www.americanbeaconfunds.com.
Best Regards,

Gene L. Needles, Jr.
President
American Beacon Funds
1
Global Equity Market Overview
June 30, 2018 (Unaudited)
Equity markets produced solid returns for the 12-month period ended June 30, 2018, as the MSCI ACWI Index returned 10.73%. Benign market conditions persisted in the first half of the period as low inflation and moderate global growth drove equities higher. Early February 2018 marked the return of volatility as investors grappled with the prospect of a new regime led by the Federal Reserve’s potential acceleration of its rate-hiking cycle. Fears of a global trade war continued to swirl as the Trump administration announced tariffs on steel and aluminum imports.
In the U.S., 10 of 11 sectors within the S&P 500 Index produced positive returns for the period. The top performers were Information Technology (up 31.30%), Consumer Discretionary (up 23.55%) and Energy (up 20.99%). Lagging were the defensive sectors, including Consumer Staples (down 3.93%), Telecommunications Services (up 1.39%) and Utilities (up 3.41%). From a style standpoint, the performance differential between growth and value stocks was stark, demonstrated by the Russell 3000 Growth Index return of 22.47% versus the Russell 3000 Value Index return of 7.25%. From a capitalization perspective, small-cap stocks – represented by the Russell 2000 Index, returned 17.57% – outperformed large-cap stocks, represented by the S&P 500 Index, which returned 14.37%.
International developed markets lagged the U.S. over the period, but still produced positive returns as the MSCI EAFE Index was up 6.84%. In Europe, the top-performing countries were Norway and Portugal, represented by the MSCI Norway Index (up 27.11%) and the MSCI Portugal Index (up 15.75%), respectively. The laggards in Europe were Sweden and Spain, represented by the MSCI Sweden Index (down 4.64%) and the MSCI Spain Index (down 3.55%), respectively. In Japan, equities were up as the MSCI Japan Index returned 10.51%.
Finally, in the developing world, emerging markets began the period with strong returns, but the last few months were less kind as the strengthening dollar and trade-war rhetoric caused a pullback. For the full period, returns were still positive as the MSCI Emerging Market Index returned 8.20%. China, the largest country in the Index, returned 21.23% as represented by the MSCI China Index. Other notable strong markets include the MSCI Peru Index (up 30.70%) and MSCI Russia Index (up 25.97%). As Mexico’s presidential election approached and NAFTA negotiations continued, the equity market suffered due to uncertainty as the MSCI Mexico Index was down 9.28%. Turkey also had a difficult period as the currency was down significantly and the MSCI Turkey Index declined -26.34%.
2
American Beacon Shapiro Equity Opportunities FundSM
Performance Overview
June 30, 2018 (Unaudited)
The Investor Class of the American Beacon Shapiro Equity Opportunities Fund (the “Fund”) returned 12.77% for the period since inception September 12, 2017 through June 30, 2018. The Fund outperformed the Russell 3000 Index (the “Index”) return of 11.26% for the same period.
Comparison of Changes in Value of a $10,000 Investment for the period 9/12/2017 through 6/30/2018
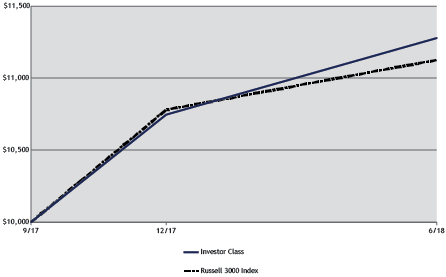
| Total Returns for the Period ended June 30, 2018 |
| |||||||||||||||||||||
Ticker | 6 Months | Since Inception | Value of $10,000 06/30/2018 | |||||||||||||||||||
Institutional Class (1,3) | SHXIX | 5.12 | % | 13.07 | % | 11,307.47 | ||||||||||||||||
Y Class (1,3) | SHXYX | 5.21 | % | 13.17 | % | 11,317.49 | ||||||||||||||||
Investor Class (1,3) | SHXPX | 4.94 | % | 12.77 | % | 11,277.44 | ||||||||||||||||
Russell 3000 Index (2) | 3.22 | % | 11.26 | % | 11,126.12 | |||||||||||||||||
| 1. | Performance shown is historical and is not indicative of future returns. Investment returns and principal value will vary, and shares may be worth more or less at redemption than at original purchase. Performance shown is calculated based on the published end of day net asset values as of the date indicated and current performance may be lower or higher than the performance data quoted. To obtain performance as of the most recent month end, please visit www.americanbeaconfunds.com or call 1-800-967-9009. Fund performance in the table above does not reflect the deduction of taxes a shareholder would pay on distributions or the redemption of shares. Generally accepted accounting principles require adjustments to be made to the net assets of the Fund at period end for financial reporting purposes only; and as such, the total return based on the unadjusted net asset value per share may differ from the total return reported in the financial highlights. A portion of the fees charged to each Class of the Fund has been waived since Fund inception. Performance prior to waiving fees was lower than the actual returns shown since inception. |
| 2. | The Russell 3000® Index measures the performance of the 3,000 largest U.S. companies based on total market capitalization, which represents approximately 98% of the U.S. equity market. The Russell 3000 Index is a registered trademark of Frank Russell Company. Frank Russell Company (“Russell”) is the source and owner of the trademarks, service marks and copyrights related to the Russell Indexes. Russell® is a trademark of Frank Russell Company. Neither Russell nor its licensors accept any liability for any errors or omissions in the Russell Indexes and/or Russell ratings or underlying data, and no party may rely on any Russell Indexes and/or Russell ratings and/or underlying data contained in this communication. No further distribution of Russell Data is permitted without Russell’s express written consent. Russell does not promote, sponsor or endorse the content of this communication. One cannot directly invest in an index. |
| 3. | The Total Annual Fund Operating Expense ratios set forth in the most recent Fund prospectus for the Institutional, Y and Investor Class shares were 1.26%, 1.36%, and 1.64%, respectively. The expense ratios above may vary from the expense ratios presented in other sections of this report that are based on expenses incurred during the period covered by this report. |
3
American Beacon Shapiro Equity Opportunities FundSM
Performance Overview
June 30, 2018 (Unaudited)
The Fund underperformed the Index through security selection, although this was partially offset by sector allocation for the nine months ending June 30, 2018. Most of the Fund’s underperformance related to security selection was attributed to holdings in the Information Technology and Consumer Discretionary sectors. In the Information Technology sector, Corning, Inc. (down 9.07%), Knowles Corp. (down 10.86%) and FireEye, Inc. (down 3.78%) were the largest detractors. In the Consumer Discretionary sector, Caesars Entertainment Corp. (down 14.39%), Hanesbrands, Inc. (down 11.97%) and CBS Corp., Class B (down 6.08%) detracted from performance. The underperformance was somewhat offset by security selection in the Energy sector. WPX Energy (up 59.50%) and Devon Energy Corp. (up 18.47%) were the largest contributors to performance.
From a sector allocation perspective, a significant overweight allocation in the Consumer Discretionary sector (up 17.38%), the second best performing sector, added value relative to the Index. Having no allocation to the Consumer Staples sector (down 4.06%), the second worst performing sector, also contributed to the Fund’s performance. The Fund’s overweight allocation to Materials sector (up 1.80%) detracted from performance.
Looking forward, the Fund’s sub-advisor will continue to employ a team-based investment process that is driven by deep fundamental research in a concentrated, value-oriented approach.
| Top Ten Holdings (% Net Assets) | ||||||||
| Corning, Inc. | 4.0 | |||||||
| CBS Corp., Class B, NVDR | 4.0 | |||||||
| Walt Disney Co. | 4.0 | |||||||
| Axalta Coating Systems Ltd. | 3.9 | |||||||
| United Parcel Service, Inc., Class B | 3.9 | |||||||
| Hanesbrands, Inc. | 3.9 | |||||||
| Merck & Co., Inc. | 3.9 | |||||||
| Pfizer, Inc. | 3.9 | |||||||
| FireEye, Inc. | 3.9 | |||||||
| Mosaic Co. | 3.9 | |||||||
| Total Fund Holdings | 23 | |||||||
| Sector Allocation (% Equities) | ||||||||
| Consumer Discretionary | 32.0 | |||||||
| Information Technology | 19.6 | |||||||
| Materials | 10.5 | |||||||
| Health Care | 10.5 | |||||||
| Financials | 10.4 | |||||||
| Energy | 6.6 | |||||||
| Industrials | 5.2 | |||||||
| Exchange-Traded Instruments | 5.2 | |||||||
4
American Beacon Shapiro SMID Cap Equity FundSM
Performance Overview
June 30, 2018 (Unaudited)
The Investor Class of the American Beacon Shapiro SMID Cap Equity Fund (the “Fund”) returned 13.60% for the period since inception September 12, 2017 through June 30, 2018. The Fund underperformed the Russell 2500 Index (the “Index”) return of 14.58% for the same period.
Comparison of Changes in Value of a $10,000 Investment for the period 9/12/2017 through 6/30/2018
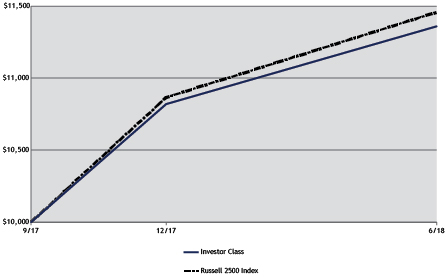
| Total Returns for the Period ended June 30, 2018 |
| |||||||||||||||||||||
Ticker | 6 Months | Since Inception | Value of $10,000 09/12/2017- 06/30/2018 | |||||||||||||||||||
Institutional Class (1,3) | SHDIX | 5.07 | % | 13.90 | % | 11,390.00 | ||||||||||||||||
Y Class (1,3) | SHDYX | 5.17 | % | 13.90 | % | 11,390.00 | ||||||||||||||||
Investor Class (1,3) | SHDPX | 4.99 | % | 13.60 | % | 11,360.00 | ||||||||||||||||
Russell 2500 Index (2) | 5.46 | % | 14.58 | % | 11,458.12 | |||||||||||||||||
| 1. | Performance shown is historical and is not indicative of future returns. Investment returns and principal value will vary, and shares may be worth more or less at redemption than at original purchase. Performance shown is calculated based on the published end of day net asset values as of the date indicated and current performance may be lower or higher than the performance data quoted. To obtain performance as of the most recent month end, please visit www.americanbeaconfunds.com or call 1-800-967-9009. Fund performance in the table above does not reflect the deduction of taxes a shareholder would pay on distributions or the redemption of shares. Generally accepted accounting principles require adjustments to be made to the net assets of the Fund at period end for financial reporting purposes only; and as such, the total return based on the unadjusted net asset value per share may differ from the total return reported in the financial highlights. A portion of the fees charged to each Class of the Fund has been waived since Fund inception. Performance prior to waiving fees was lower than the actual returns shown since inception. |
| 2. | The Russell 2500® Index is an unmanaged index that measures the performance of the small to mid-cap segment of the U.S. equity universe. It is a subset of the Russell 3000® Index and includes approximately 2,500 of the smallest securities based on a combination of their market capitalization and current index membership. The Russell 2500 Index and the Russell 3000 Index are registered trademarks of Frank Russell Company. Frank Russell Company (“Russell”) is the source and owner of the trademarks, service marks and copyrights related to the Russell Indexes. Russell® is a trademark of Frank Russell Company. Neither Russell nor its licensors accept any liability for any errors or omissions in the Russell Indexes and/or Russell ratings or underlying data, and no party may rely on any Russell Indexes and/or Russell ratings and/or underlying data contained in this communication. No further distribution of Russell Data is permitted without Russell’s express written consent. Russell does not promote, sponsor or endorse the content of this communication. One cannot directly invest in an index. |
| 3. | The Total Annual Fund Operating Expense ratios set forth in the most recent Fund prospectus for the Institutional, Y and Investor Class shares were 1.31%, 1.41%, and 1.69%, respectively. The expense ratios above may vary from the expense ratios presented in other sections of this report that are based on expenses incurred during the period covered by this report. |
5
American Beacon Shapiro SMID Cap Equity FundSM
Performance Overview
June 30, 2018 (Unaudited)
For the nine months ended June 30, 2018, security selection detracted, while sector allocation contributed to relative performance.
From a sector allocation perspective, null weighting the Real Estate sector (up 3.6%), and a significant overweight allocation to the Consumer Discretionary sector (up 13.4%) added value relative to the Index. Offsetting some of the gains was an overweight allocation to the Materials sector (up 3.8%), which detracted from relative performance.
Most of the Fund’s underperformance related to security selection was attributed to holdings in the Information Technology and Health Care sectors. In the Information Technology sector, positions in FireEye, Inc. (down 4.7%), Knowles Corp. (down 4.5%) and Versum Materials, Inc. (down 7.6%) were the largest detractors. In the Health Care sector, Patterson Companies, Inc. (down 32.4%) detracted from performance. The aforementioned underperformance was somewhat offset by security selection in the Energy sector. WPX Energy, Inc. (up 58.9%) and Semgroup Corp Class A. (up 15.4%) were the largest contributors to performance.
Looking forward, the Fund’s sub-advisor will continue to employ a team-oriented investment process that is driven by deep fundamental research in a concentrated, value-oriented approach.
| Top Ten Holdings (% Net Assets) | ||||||||
| Hanesbrands, Inc. | 6.2 | |||||||
| Maxar Technologies Ltd. | 5.3 | |||||||
| Valvoline, Inc. | 5.1 | |||||||
| Discovery, Inc., Class C | 5.1 | |||||||
| AMC Networks, Inc., Class A | 4.9 | |||||||
| Axalta Coating Systems Ltd. | 4.9 | |||||||
| FireEye, Inc. | 4.9 | |||||||
| Ciena Corp. | 4.9 | |||||||
| Regions Financial Corp. | 4.8 | |||||||
| First Data Corp | 4.8 | |||||||
| Total Fund Holdings | 27 | |||||||
| Sector Allocation (% Equities) | ||||||||
| Consumer Discretionary | 34.8 | |||||||
| Information Technology | 24.9 | |||||||
| Materials | 18.4 | |||||||
| Industrials | 9.9 | |||||||
| Energy | 6.0 | |||||||
| Financials | 4.9 | |||||||
| Health Care | 1.1 | |||||||
6
American Beacon FundsSM
June 30, 2018 (Unaudited)
Fund Expense Example
As a shareholder of a Fund, you incur two types of costs: (1) transaction costs, including sales charges (loads) on purchase payments and redemption fees, if applicable, and (2) ongoing costs, including management fees, distribution (12b-1) fees, sub-transfer agent fees, and other Fund expenses. The Examples are intended to help you understand the ongoing cost (in dollars) of investing in the Funds and to compare these costs with the ongoing costs of investing in other mutual funds. The Examples are based on an investment of $1,000 invested at the beginning of the period in each Class and held for the entire period from January 1, 2018 through June 30, 2018.
Actual Expenses
The “Actual” lines of the tables provide information about actual account values and actual expenses. You may use the information on this page, together with the amount you invested, to estimate the expenses that you paid over the period. Simply divide your account value by $1,000 (for example, an $8,600 account value divided by $1,000 = $8.60), then multiply the result by the “Expenses Paid During Period” to estimate the expenses you paid on your account during this period. Shareholders of the Investor and Institutional Classes that invest in the Funds through an IRA or Roth IRA may be subject to a custodial IRA fee of $15 that is typically deducted each December. If your account was subject to a custodial IRA fee during the period, your costs would have been $15 higher.
Hypothetical Example for Comparison Purposes
The “Hypothetical” lines of the tables provide information about hypothetical account values and hypothetical expenses based on the Funds’ actual expense ratio and an assumed 5% per year rate of return before expenses (not the Funds’ actual return). You may compare the ongoing costs of investing in the Funds with other funds by contrasting this 5% hypothetical example and the 5% hypothetical examples that appear in the shareholder reports of the other funds. The hypothetical account values and expenses may not be used to estimate the actual ending account balance or expenses you paid for the period. Shareholders of the Investor and Institutional Classes that invest in the Funds through an IRA or Roth IRA may be subject to a custodial IRA fee of $15 that is typically deducted each December. If your account was subject to a custodial IRA fee during the period, your costs would have been $15 higher.
You should also be aware that the expenses shown in the table highlight only your ongoing costs and do not reflect any transaction costs charged by the Funds, such as sales charges (loads) or redemption fees, as applicable. Similarly, the expense examples for other funds do not reflect any transaction costs charged by those funds, such as sales charges (loads), redemption fees or exchange fees. Therefore, the “Hypothetical” lines of the tables are useful in comparing ongoing costs only and will not help you determine the relative total costs of owning different funds. If you were subject to any transaction costs during the period, your costs would have been higher.
7
American Beacon FundsSM
Expense Examples
June 30, 2018 (Unaudited)
| American Beacon Shapiro Equity Opportunities Fund | |||||||||||||||
| Beginning Account Value 1/1/2018 | Ending Account Value 6/30/2018 | Expenses Paid During Period 1/1/2018-6/30/2018* | |||||||||||||
| Institutional Class | |||||||||||||||
| Actual | $1,000.00 | $1,051.20 | $4.02 | ||||||||||||
| Hypothetical** | $1,000.00 | $1,020.90 | $3.96 | ||||||||||||
| Y Class | |||||||||||||||
| Actual | $1,000.00 | $1,052.10 | $4.53 | ||||||||||||
| Hypothetical** | $1,000.00 | $1,020.40 | $4.46 | ||||||||||||
| Investor Class | |||||||||||||||
| Actual | $1,000.00 | $1,049.40 | $5.95 | ||||||||||||
| Hypothetical** | $1,000.00 | $1,019.00 | $5.86 | ||||||||||||
| * | Expenses are equal to the Fund’s annualized expense ratios for the six-month period of 0.79%, 0.89%, and 1.17% for the Institutional, Y, and Investor Classes, respectively, multiplied by the average account value over the period, multiplied by the number derived by dividing the number of days in the most recent fiscal half-year (181) by days in the year (365) to reflect the half-year period. |
| ** | 5% return before expenses. |
| American Beacon Shapiro SMID Cap Equity Fund | |||||||||||||||
| Beginning Account Value 1/1/2018 | Ending Account Value 6/30/2018 | Expenses Paid During Period 1/1/2018-6/30/2018* | |||||||||||||
| Institutional Class | |||||||||||||||
| Actual | $1,000.00 | $1,050.70 | $4.53 | ||||||||||||
| Hypothetical** | $1,000.00 | $1,020.40 | $4.46 | ||||||||||||
| Y Class | |||||||||||||||
| Actual | $1,000.00 | $1,051.70 | $5.04 | ||||||||||||
| Hypothetical** | $1,000.00 | $1,019.90 | $4.96 | ||||||||||||
| Investor Class | |||||||||||||||
| Actual | $1,000.00 | $1,049.90 | $6.45 | ||||||||||||
| Hypothetical** | $1,000.00 | $1,018.50 | $6.36 | ||||||||||||
| * | Expenses are equal to the Fund’s annualized expense ratios for the six-month period of 0.89%, 0.99%, and 1.27% for the Institutional, Y, and Investor Classes, respectively, multiplied by the average account value over the period, multiplied by the number derived by dividing the number of days in the most recent fiscal half-year (181) by days in the year (365) to reflect the half-year period. |
| ** | 5% return before expenses. |
8
American Beacon FundsSM
Report of Independent Registered Public Accounting Firm
To the Board of Trustees of American Beacon Funds and Shareholders of American Beacon Shapiro Equity Opportunities Fund and American Beacon Shapiro SMID Cap Equity Fund
Opinions on the Financial Statements
We have audited the accompanying statements of assets and liabilities, including the schedules of investments, of American Beacon Shapiro Equity Opportunities Fund and American Beacon Shapiro SMID Cap Equity Fund (two of the series constituting American Beacon Funds, referred to hereafter as the “Funds”) as of June 30, 2018, the related statements of operations and changes in net assets, including the related notes, and the financial highlights for the period September 12, 2017 (commencement of operations) through June 30, 2018 (collectively referred to as the “financial statements”). In our opinion, the financial statements present fairly, in all material respects, the financial position of each of the Funds as of June 30, 2018, and the results of each of their operations, changes in each of their net assets and the financial highlights for the period September 12, 2017 (commencement of operations) through June 30, 2018 in conformity with accounting principles generally accepted in the United States of America.
Basis for Opinions
These financial statements are the responsibility of the Funds’ management. Our responsibility is to express an opinion on the Funds’ financial statements based on our audits. We are a public accounting firm registered with the Public Company Accounting Oversight Board (United States) (“PCAOB”) and are required to be independent with respect to the Funds in accordance with the U.S. federal securities laws and the applicable rules and regulations of the Securities and Exchange Commission and the PCAOB.
We conducted our audits of these financial statements in accordance with the standards of the PCAOB. Those standards require that we plan and perform the audit to obtain reasonable assurance about whether the financial statements are free of material misstatement, whether due to error or fraud.
Our audits included performing procedures to assess the risks of material misstatement of the financial statements, whether due to error or fraud, and performing procedures that respond to those risks. Such procedures included examining, on a test basis, evidence regarding the amounts and disclosures in the financial statements. Our audits also included evaluating the accounting principles used and significant estimates made by management, as well as evaluating the overall presentation of the financial statements. Our procedures included confirmation of securities owned as of June 30, 2018 by correspondence with the custodian, transfer agent and broker; when replies were not received from brokers, we performed other auditing procedures. We believe that our audits provide a reasonable basis for our opinions.
Boston, MA
August 24, 2018
We have served as the auditor of one or more American Beacon investment companies since 2016.
9
American Beacon Shapiro Equity Opportunities FundSM
Schedule of Investments
June 30, 2018
| Shares | Fair Value | ||||||||||||||
| COMMON STOCKS - 71.09% | |||||||||||||||
| Consumer Discretionary - 24.02% | |||||||||||||||
| Automobiles - 2.97% | |||||||||||||||
| General Motors Co. | 53,000 | $ | 2,088,200 | ||||||||||||
|
| ||||||||||||||
| Hotels, Restaurants & Leisure - 3.92% | |||||||||||||||
| Caesars Entertainment Corp.A | 258,000 | 2,760,600 | |||||||||||||
|
| ||||||||||||||
| Media - 13.19% | |||||||||||||||
| CBS Corp., Class B, NVDR | 50,000 | 2,811,000 | |||||||||||||
| Discovery, Inc., Class CA | 105,800 | 2,697,900 | |||||||||||||
| Live Nation Entertainment, Inc.A | 20,400 | 990,828 | |||||||||||||
| Walt Disney Co. | 26,600 | 2,787,946 | |||||||||||||
|
| ||||||||||||||
| 9,287,674 | |||||||||||||||
|
| ||||||||||||||
| Textiles, Apparel & Luxury Goods - 3.94% | |||||||||||||||
| Hanesbrands, Inc. | 125,900 | 2,772,318 | |||||||||||||
|
| ||||||||||||||
Total Consumer Discretionary | 16,908,792 | ||||||||||||||
|
| ||||||||||||||
| Energy - 4.94% | |||||||||||||||
| Oil, Gas & Consumable Fuels - 4.94% | |||||||||||||||
| Devon Energy Corp. | 54,200 | 2,382,632 | |||||||||||||
| WPX Energy, Inc.A | 60,700 | 1,094,421 | |||||||||||||
|
| ||||||||||||||
| 3,477,053 | |||||||||||||||
|
| ||||||||||||||
Total Energy | 3,477,053 | ||||||||||||||
|
| ||||||||||||||
| Financials - 7.76% | |||||||||||||||
| Banks - 7.76% | |||||||||||||||
| Bank of America Corp. | 96,400 | 2,717,516 | |||||||||||||
| Regions Financial Corp. | 154,600 | 2,748,788 | |||||||||||||
|
| ||||||||||||||
| 5,466,304 | |||||||||||||||
|
| ||||||||||||||
Total Financials | 5,466,304 | ||||||||||||||
|
| ||||||||||||||
| Health Care - 7.86% | |||||||||||||||
| Pharmaceuticals - 7.86% | |||||||||||||||
| Merck & Co., Inc. | 45,600 | 2,767,920 | |||||||||||||
| Pfizer, Inc. | 76,200 | 2,764,536 | |||||||||||||
|
| ||||||||||||||
| 5,532,456 | |||||||||||||||
|
| ||||||||||||||
Total Health Care | 5,532,456 | ||||||||||||||
|
| ||||||||||||||
| Industrials - 3.94% | |||||||||||||||
| Air Freight & Logistics - 3.94% | |||||||||||||||
| United Parcel Service, Inc., Class B | 26,100 | 2,772,603 | |||||||||||||
|
| ||||||||||||||
| Information Technology - 14.70% | |||||||||||||||
| Electronic Equipment, Instruments & Components - 4.31% | |||||||||||||||
| Corning, Inc. | 103,000 | 2,833,530 | |||||||||||||
| Knowles Corp.A | 13,000 | 198,900 | |||||||||||||
|
| ||||||||||||||
| 3,032,430 | |||||||||||||||
|
| ||||||||||||||
| IT Services - 2.72% | |||||||||||||||
| First Data Corp., Class AA | 91,400 | 1,913,002 | |||||||||||||
|
| ||||||||||||||
| Semiconductors & Semiconductor Equipment - 1.38% | |||||||||||||||
| Entegris, Inc. | 28,725 | 973,778 | |||||||||||||
|
| ||||||||||||||
See accompanying notes
10
American Beacon Shapiro Equity Opportunities FundSM
Schedule of Investments
June 30, 2018
| Shares | Fair Value | ||||||||||||||
| COMMON STOCKS - 71.09% (continued) | |||||||||||||||
| Information Technology - 14.70% (continued) | |||||||||||||||
| Software - 3.92% | |||||||||||||||
| FireEye, Inc.A | 179,600 | $ | 2,764,044 | ||||||||||||
|
| ||||||||||||||
| Technology Hardware, Storage & Peripherals - 2.37% | |||||||||||||||
| Apple, Inc. | 9,000 | 1,665,990 | |||||||||||||
|
| ||||||||||||||
Total Information Technology | 10,349,244 | ||||||||||||||
|
| ||||||||||||||
| Materials - 7.87% | |||||||||||||||
| Chemicals - 7.87% | |||||||||||||||
| Axalta Coating Systems Ltd.A | 91,700 | 2,779,427 | |||||||||||||
| Mosaic Co. | 98,500 | 2,762,925 | |||||||||||||
|
| ||||||||||||||
| 5,542,352 | |||||||||||||||
|
| ||||||||||||||
Total Materials | 5,542,352 | ||||||||||||||
|
| ||||||||||||||
Total Common Stocks (Cost $49,494,643) | 50,048,804 | ||||||||||||||
|
| ||||||||||||||
| EXCHANGE-TRADED INSTRUMENTS - 3.89% (Cost $2,756,221) | |||||||||||||||
| Exchange-Traded Funds - 3.89% | |||||||||||||||
| SPDR S&P 500 ETF Trust | 10,100 | 2,739,928 | |||||||||||||
|
| ||||||||||||||
| SHORT-TERM INVESTMENTS - 6.71% (Cost $4,720,491) | |||||||||||||||
| Investment Companies - 6.71% | |||||||||||||||
| American Beacon U.S. Government Money Market Select Fund, Select Class, 1.82%B C | 4,720,491 | 4,720,491 | |||||||||||||
|
| ||||||||||||||
TOTAL INVESTMENTS - 81.69% (Cost $56,971,355) | 57,509,223 | ||||||||||||||
OTHER ASSETS, NET OF LIABILITIES - 18.31% | 12,887,587 | ||||||||||||||
|
| ||||||||||||||
TOTAL NET ASSETS - 100.00% | $ | 70,396,810 | |||||||||||||
|
| ||||||||||||||
| Percentages are stated as a percent of net assets. | |||||||||||||||
A Non-income producing security.
B The Fund is affiliated by having the same investment advisor.
C 7-day yield.
ETF - Exchange-Traded Fund.
NVDR - Non Voting Depositary Receipt.
S&P 500 - Standard & Poor’s U.S. Equity Large-Cap Index.
SPDR - Standard & Poor’s Depositary Receipt.
The Fund’s investments are summarized by level based on the inputs used to determine their values. As of June 30, 2018, the investments were classified as described below:
Shapiro Equity Opportunities Fund | Level 1 | Level 2 | Level 3 | Total | ||||||||||||||||||||||||
Assets | ||||||||||||||||||||||||||||
Common Stocks | $ | 50,048,804 | $ | - | $ | - | $ | 50,048,804 | ||||||||||||||||||||
Exchange-Traded Instruments | 2,739,928 | - | - | 2,739,928 | ||||||||||||||||||||||||
Short-Term Investments | 4,720,491 | - | - | 4,720,491 | ||||||||||||||||||||||||
|
|
|
|
|
|
|
| |||||||||||||||||||||
Total Investments in Securities - Assets | $ | 57,509,223 | $ | - | $ | - | $ | 57,509,223 | ||||||||||||||||||||
|
|
|
|
|
|
|
| |||||||||||||||||||||
U.S. GAAP requires all transfers between any levels to be disclosed. The end of period timing recognition has been adopted for the transfers between levels of the Fund’s assets and liabilities. During the period ended June 30, 2018, there were no transfers between levels.
See accompanying notes
11
American Beacon Shapiro SMID Cap Equity FundSM
Schedule of Investments
June 30, 2018
| Shares | Fair Value | ||||||||||||||
| COMMON STOCKS - 98.82% | |||||||||||||||
| Consumer Discretionary - 34.42% | |||||||||||||||
| Hotels, Restaurants & Leisure - 4.40% | |||||||||||||||
| Caesars Entertainment Corp.A | 23,400 | $ | 250,380 | ||||||||||||
|
| ||||||||||||||
| Leisure Products - 4.68% | |||||||||||||||
| Acushnet Holdings Corp. | 10,900 | 266,614 | |||||||||||||
|
| ||||||||||||||
| Media - 19.15% | |||||||||||||||
| AMC Networks, Inc., Class AA | 4,500 | 279,900 | |||||||||||||
| Discovery, Inc., Class CA | 11,300 | 288,150 | |||||||||||||
| IMAX Corp.A | 10,200 | 225,930 | |||||||||||||
| Lions Gate Entertainment Corp., Class B | 8,900 | 208,794 | |||||||||||||
| Live Nation Entertainment, Inc.A | 1,800 | 87,426 | |||||||||||||
|
| ||||||||||||||
| 1,090,200 | |||||||||||||||
|
| ||||||||||||||
| Textiles, Apparel & Luxury Goods - 6.19% | |||||||||||||||
| Hanesbrands, Inc. | 16,000 | 352,320 | |||||||||||||
|
| ||||||||||||||
Total Consumer Discretionary | 1,959,514 | ||||||||||||||
|
| ||||||||||||||
| Energy - 5.92% | |||||||||||||||
| Oil, Gas & Consumable Fuels - 5.92% | |||||||||||||||
| SemGroup Corp., Class A | 4,400 | 111,760 | |||||||||||||
| WPX Energy, Inc.A | 12,500 | 225,375 | |||||||||||||
|
| ||||||||||||||
| 337,135 | |||||||||||||||
|
| ||||||||||||||
Total Energy | 337,135 | ||||||||||||||
|
| ||||||||||||||
| Financials - 4.81% | |||||||||||||||
| Banks - 4.81% | |||||||||||||||
| Regions Financial Corp. | 15,400 | 273,812 | |||||||||||||
|
| ||||||||||||||
| Health Care - 1.03% | |||||||||||||||
| Health Care Providers & Services - 1.03% | |||||||||||||||
| Patterson Cos., Inc. | 2,600 | 58,942 | |||||||||||||
|
| ||||||||||||||
| Industrials - 9.77% | |||||||||||||||
| Aerospace & Defense - 6.54% | |||||||||||||||
| BWX Technologies, Inc. | 1,100 | 68,552 | |||||||||||||
| Maxar Technologies Ltd.B | 6,015 | 303,878 | |||||||||||||
|
| ||||||||||||||
| 372,430 | |||||||||||||||
|
| ||||||||||||||
| Professional Services - 3.23% | |||||||||||||||
| Dun & Bradstreet Corp. | 1,500 | 183,975 | |||||||||||||
|
| ||||||||||||||
Total Industrials | 556,405 | ||||||||||||||
|
| ||||||||||||||
| Information Technology - 24.64% | |||||||||||||||
| Communications Equipment - 4.89% | |||||||||||||||
| Ciena Corp.A | 10,500 | 278,355 | |||||||||||||
|
| ||||||||||||||
| Electronic Equipment, Instruments & Components - 3.70% | |||||||||||||||
| FLIR Systems, Inc. | 700 | 36,379 | |||||||||||||
| Knowles Corp.A | 11,400 | 174,420 | |||||||||||||
|
| ||||||||||||||
| 210,799 | |||||||||||||||
|
| ||||||||||||||
| Internet Software & Services - 2.25% | |||||||||||||||
| ChannelAdvisor Corp.A | 9,100 | 127,855 | |||||||||||||
|
| ||||||||||||||
See accompanying notes
12
American Beacon Shapiro SMID Cap Equity FundSM
Schedule of Investments
June 30, 2018
| Shares | Fair Value | ||||||||||||||
| COMMON STOCKS - 98.82% (continued) | |||||||||||||||
| Information Technology - 24.64% (continued) | |||||||||||||||
| IT Services - 4.78% | |||||||||||||||
| First Data Corp., Class AA | 13,000 | $ | 272,090 | ||||||||||||
|
| ||||||||||||||
| Semiconductors & Semiconductor Equipment - 4.13% | |||||||||||||||
| Entegris, Inc. | 4,200 | 142,380 | |||||||||||||
| Versum Materials, Inc. | 2,500 | 92,875 | |||||||||||||
|
| ||||||||||||||
| 235,255 | |||||||||||||||
|
| ||||||||||||||
| Software - 4.89% | |||||||||||||||
| FireEye, Inc.A | 18,100 | 278,559 | |||||||||||||
|
| ||||||||||||||
Total Information Technology | 1,402,913 | ||||||||||||||
|
| ||||||||||||||
| Materials - 18.23% | |||||||||||||||
| Chemicals - 13.96% | |||||||||||||||
| Axalta Coating Systems Ltd.A | 9,200 | 278,852 | |||||||||||||
| Mosaic Co. | 8,000 | 224,400 | |||||||||||||
| Valvoline, Inc. | 13,500 | 291,195 | |||||||||||||
|
| ||||||||||||||
| 794,447 | |||||||||||||||
|
| ||||||||||||||
| Metals & Mining - 4.27% | |||||||||||||||
| Compass Minerals International, Inc. | 3,700 | 243,275 | |||||||||||||
|
| ||||||||||||||
Total Materials | 1,037,722 | ||||||||||||||
|
| ||||||||||||||
Total Common Stocks (Cost $5,247,790) | 5,626,443 | ||||||||||||||
|
| ||||||||||||||
| SHORT-TERM INVESTMENTS - 1.90% (Cost $108,004) | |||||||||||||||
| Investment Companies - 1.90% | |||||||||||||||
| American Beacon U.S. Government Money Market Select Fund, Select Class, 1.82%C D | 108,004 | 108,004 | |||||||||||||
|
| ||||||||||||||
| SECURITIES LENDING COLLATERAL - 4.37% (Cost $248,939) | |||||||||||||||
| Investment Companies - 4.37% | |||||||||||||||
| American Beacon U.S. Government Money Market Select Fund, Select Class, 1.82%C D | 248,939 | 248,939 | |||||||||||||
|
| ||||||||||||||
TOTAL INVESTMENTS - 105.09% (Cost $5,604,733) | 5,983,386 | ||||||||||||||
LIABILITIES, NET OF OTHER ASSETS - (5.09%) | (289,761 | ) | |||||||||||||
|
| ||||||||||||||
TOTAL NET ASSETS - 100.00% | $ | 5,693,625 | |||||||||||||
|
| ||||||||||||||
| Percentages are stated as a percent of net assets. | |||||||||||||||
A Non-income producing security.
B All or a portion of this security is on loan at June 30, 2018.
C The Fund is affiliated by having the same investment advisor.
D 7-day yield.
The Fund’s investments are summarized by level based on the inputs used to determine their values. As of June 30, 2018, the investments were classified as described below:
Shapiro SMID Cap Equity Fund | Level 1 | Level 2 | Level 3 | Total | ||||||||||||||||||||||||
Assets | ||||||||||||||||||||||||||||
Common Stocks | $ | 5,626,443 | $ | - | $ | - | $ | 5,626,443 | ||||||||||||||||||||
Short-Term Investments | 108,004 | - | - | 108,004 | ||||||||||||||||||||||||
Securities Lending Collateral | 248,939 | - | - | 248,939 | ||||||||||||||||||||||||
|
|
|
|
|
|
|
| |||||||||||||||||||||
Total Investments in Securities - Assets | $ | 5,983,386 | $ | - | $ | - | $ | 5,983,386 | ||||||||||||||||||||
|
|
|
|
|
|
|
| |||||||||||||||||||||
U.S. GAAP requires all transfers between any levels to be disclosed. The end of period timing recognition has been adopted for the transfers between levels of the Fund’s assets and liabilities. During the period ended June 30, 2018, there were no transfers between levels.
See accompanying notes
13
American Beacon FundsSM
Statements of Assets and Liabilities
June 30, 2018
| Shapiro Equity Opportunities Fund | Shapiro SMID Cap Equity Fund | |||||||||||
Assets: | ||||||||||||
Investments in unaffiliated securities, at fair value†§ | $ | 52,788,732 | $ | 5,626,443 | ||||||||
Investments in affiliated securities, at fair value‡ | 4,720,491 | 356,943 | ||||||||||
Cash | - | 1,622 | ||||||||||
Dividends and interest receivable | 42,000 | 2,078 | ||||||||||
Receivable for fund shares sold | 15,000,860 | - | ||||||||||
Receivable for expense reimbursement (Note 2) | 4,173 | 4,696 | ||||||||||
Prepaid expenses | 38,835 | 19,412 | ||||||||||
|
|
|
| |||||||||
Total assets | 72,595,091 | 6,011,194 | ||||||||||
|
|
|
| |||||||||
Liabilities: | ||||||||||||
Payable for investments purchased | 2,150,838 | 43,560 | ||||||||||
Payable for fund shares redeemed | 2,051 | - | ||||||||||
Cash due to custodian | 23 | - | ||||||||||
Payable upon return of securities loaned (Note 8)§ | - | 248,939 | ||||||||||
Management and sub-advisory fees payable (Note 2) | 21,038 | 3,526 | ||||||||||
Service fees payable (Note 2) | 36 | 71 | ||||||||||
Transfer agent fees payable (Note 2) | 175 | 235 | ||||||||||
Custody and fund accounting fees payable | 1,040 | 1,019 | ||||||||||
Professional fees payable | 17,923 | 17,934 | ||||||||||
Trustee fees payable (Note 2) | - | 1 | ||||||||||
Payable for prospectus and shareholder reports | 1,023 | 1,114 | ||||||||||
Other liabilities | 4,134 | 1,170 | ||||||||||
|
|
|
| |||||||||
Total liabilities | 2,198,281 | 317,569 | ||||||||||
|
|
|
| |||||||||
Net assets | $ | 70,396,810 | $ | 5,693,625 | ||||||||
|
|
|
| |||||||||
Analysis of net assets: | ||||||||||||
Paid-in-capital | $ | 69,671,389 | $ | 5,127,360 | ||||||||
Undistributed net investment income | 38,151 | 2,860 | ||||||||||
Accumulated net realized gain | 149,402 | 184,752 | ||||||||||
Unrealized appreciation of investments in unaffiliated securitiesA | 537,868 | 378,653 | ||||||||||
|
|
|
| |||||||||
Net assets | $ | 70,396,810 | $ | 5,693,625 | ||||||||
|
|
|
| |||||||||
Shares outstanding at no par value (unlimited shares authorized): | ||||||||||||
Institutional Class | 3,878,850 | 449,932 | ||||||||||
|
|
|
| |||||||||
Y Class | 2,338,499 | 18,953 | ||||||||||
|
|
|
| |||||||||
Investor Class | 16,064 | 31,073 | ||||||||||
|
|
|
| |||||||||
Net assets: | ||||||||||||
Institutional Class | $ | 43,796,676 | $ | 5,124,948 | ||||||||
|
|
|
| |||||||||
Y Class | $ | 26,419,367 | $ | 215,795 | ||||||||
|
|
|
| |||||||||
Investor Class | $ | 180,767 | $ | 352,882 | ||||||||
|
|
|
| |||||||||
Net asset value, offering and redemption price per share: | ||||||||||||
Institutional Class | $ | 11.29 | $ | 11.39 | ||||||||
|
|
|
| |||||||||
Y Class | $ | 11.30 | $ | 11.39 | ||||||||
|
|
|
| |||||||||
Investor Class | $ | 11.25 | $ | 11.36 | ||||||||
|
|
|
| |||||||||
† Cost of investments in unaffiliated securities | $ | 52,250,864 | $ | 5,247,790 | ||||||||
‡ Cost of investments in affiliated securities | $ | 4,720,491 | $ | 356,943 | ||||||||
§ Fair value of securities on loan | $ | - | $ | 250,276 | ||||||||
A The Fund’s investments in affiliated securities did not have unrealized appreciation (depreciation) at year end. |
| |||||||||||
See accompanying notes
14
American Beacon FundsSM
Statements of Operations
For the period ended June 30, 2018A
| Shapiro Equity Opportunities Fund | Shapiro SMID Cap Equity Fund | |||||||||||
Investment income: | ||||||||||||
Dividend income from unaffiliated securities† | $ | 82,842 | $ | 31,936 | ||||||||
Dividend income from affiliated securities (Note 7) | 12,963 | 1,865 | ||||||||||
Income derived from securities lending (Note 8) | 150 | 645 | ||||||||||
|
|
|
| |||||||||
Total investment income | 95,955 | 34,446 | ||||||||||
|
|
|
| |||||||||
Expenses: | ||||||||||||
Management and sub-advisory fees (Note 2) | 43,989 | 26,324 | ||||||||||
Transfer agent fees: | ||||||||||||
Institutional Class (Note 2) | 1,707 | 1,661 | ||||||||||
Y Class (Note 2) | 1,564 | 1,555 | ||||||||||
Investor Class | 2,239 | 2,227 | ||||||||||
Custody and fund accounting fees | 5,768 | 5,729 | ||||||||||
Professional fees | 63,062 | 63,116 | ||||||||||
Registration fees and expenses | 45,116 | 41,799 | ||||||||||
Service fees (Note 2): | ||||||||||||
Investor Class | 302 | 348 | ||||||||||
Prospectus and shareholder report expenses | 7,673 | 7,641 | ||||||||||
Trustee fees (Note 2) | 243 | 227 | ||||||||||
Other expenses | 4,125 | 4,144 | ||||||||||
|
|
|
| |||||||||
Total expenses | 175,788 | 154,771 | ||||||||||
|
|
|
| |||||||||
Net fees waived and expenses (reimbursed) (Note 2) | (123,976 | ) | (122,970 | ) | ||||||||
|
|
|
| |||||||||
Net expenses | 51,812 | 31,801 | ||||||||||
|
|
|
| |||||||||
Net investment income | 44,143 | 2,645 | ||||||||||
|
|
|
| |||||||||
Realized and unrealized gain (loss) from investments: | ||||||||||||
Net realized gain from: | ||||||||||||
Investments in unaffiliated securitiesB | 146,481 | 181,546 | ||||||||||
Commission recapture (Note 1) | 3,222 | 3,206 | ||||||||||
Foreign currency transactions | - | 215 | ||||||||||
Change in net unrealized appreciation of: | ||||||||||||
Investments in unaffiliated securitiesC | 537,868 | 378,653 | ||||||||||
|
|
|
| |||||||||
Net gain from investments | 687,571 | 563,620 | ||||||||||
|
|
|
| |||||||||
Net increase in net assets resulting from operations | $ | 731,714 | $ | 566,265 | ||||||||
|
|
|
| |||||||||
† Foreign taxes | $ | - | $ | 745 | ||||||||
A Commencement of operations, September 12, 2017 through June 30, 2018. |
| |||||||||||
B The Fund did not recognize net realized gains (losses) from the sale of investments in affiliated securities. |
| |||||||||||
C The Fund’s investments in affiliated securities did not have a change in unrealized appreciation (depreciation) at period end. |
| |||||||||||
See accompanying notes
15
American Beacon FundsSM
Statements of Changes in Net Assets
| Shapiro Equity Opportunities Fund | Shapiro SMID Cap Equity Fund | |||||||||||
| September 12, 2017A to June 30, 2018 | September 12, 2017A to June 30, 2018 | |||||||||||
Increase in net assets: | ||||||||||||
Operations: | ||||||||||||
Net investment income | $ | 44,143 | $ | 2,645 | ||||||||
Net realized gain from investments in unaffiliated securities, commission recapture, and foreign currency transactions | 149,703 | 184,967 | ||||||||||
Change in net unrealized appreciation of investments in unaffiliated securities | 537,868 | 378,653 | ||||||||||
|
|
|
| |||||||||
Net increase in net assets resulting from operations | 731,714 | 566,265 | ||||||||||
|
|
|
| |||||||||
Distributions to shareholders: | ||||||||||||
Net investment income: | ||||||||||||
Institutional Class | (5,619 | ) | - | |||||||||
Y Class | (159 | ) | - | |||||||||
Investor Class | (214 | ) | - | |||||||||
Net realized gain from investments: | ||||||||||||
Institutional Class | (282 | ) | - | |||||||||
Y Class | (8 | ) | - | |||||||||
Investor Class | (11 | ) | - | |||||||||
|
|
|
| |||||||||
Net distributions to shareholders | (6,293 | ) | - | |||||||||
|
|
|
| |||||||||
Capital share transactions (Note 10): | ||||||||||||
Proceeds from sales of shares | 70,166,173 | 2,486,584 | ||||||||||
Reinvestment of dividends and distributions | 6,293 | - | ||||||||||
Cost of shares redeemed | (3,501,077 | ) | (359,224 | ) | ||||||||
|
|
|
| |||||||||
Net increase in net assets from capital share transactions | 66,671,389 | 2,127,360 | ||||||||||
|
|
|
| |||||||||
Net increase in net assets | 67,396,810 | 2,693,625 | ||||||||||
|
|
|
| |||||||||
Net assets: | ||||||||||||
Beginning of period | 3,000,000 | B | 3,000,000 | B | ||||||||
|
|
|
| |||||||||
End of period * | $ | 70,396,810 | $ | 5,693,625 | ||||||||
|
|
|
| |||||||||
*Includes undistributed net investment income | $ | 38,151 | $ | 2,860 | ||||||||
|
|
|
| |||||||||
A Commencement of operations. | ||||||||||||
B Seed capital. | ||||||||||||
See accompanying notes
16
American Beacon FundsSM
June 30, 2018
1. Organization and Significant Accounting Policies
American Beacon Funds (the “Trust”), is organized as a Massachusetts business trust. The Funds, each a series within the Trust, are registered under the Investment Company Act of 1940 (the “Act”), as amended, as non-diversified, open-end management investment companies. As of June 30, 2018, the Trust consists of thirty-three active series, two of which are presented in this filing: American Beacon Shapiro Equity Opportunities Fund and American Beacon Shapiro SMID Cap Equity Fund (collectively, the “Funds” and each individually a “Fund”). The remaining thirty-one active series are reported in separate filings.
American Beacon Advisors, Inc. (the “Manager”) is a Delaware corporation and a wholly-owned subsidiary of Resolute Investment Managers, Inc. (“RIM”) organized in 1986 to provide business management, advisory, administrative, and asset management consulting services to the Trust and other investors. RIM is, in turn, a wholly-owned subsidiary of Resolute Acquisition, Inc., which is a wholly-owned subsidiary of Resolute Topco, Inc., a wholly-owned subsidiary of Resolute Investment Holdings, LLC (“RIH”). RIH is owned primarily by Kelso Investment Associates VIII, L.P., KEP VI, LLC and Estancia Capital Partners L.P., investment funds affiliated with Kelso & Company, L.P. (“Kelso”) or Estancia Capital Management, LLC (“Estancia”), which are private equity firms.
Class Disclosure
September 12, 2017 is the inception date of the Institutional, Y, and Investor classes of the Funds.
Each Fund has multiple classes of shares designed to meet the needs of different groups of investors. The following table sets forth the differences amongst the classes:
Class | Eligible Investors | Minimum Initial Investments | ||||
| Institutional | Large institutional investors - sold directly through intermediary channels. | $ | 250,000 | |||
| Y Class | Large institutional retirement plan investors - sold directly or through intermediary channels. | $ | 100,000 | |||
| Investor | All investors using intermediary organizations, such as broker-dealers or retirement plan sponsors. | $ | 2,500 | |||
Each class offered by the Trust has equal rights as to assets and voting privileges. Income and non-class specific expenses are allocated daily to each class on the basis of the relative net assets. Realized and unrealized capital gains and losses of each class are allocated daily based on the relative net assets of each class of the respective Fund. Class specific expenses, where applicable, currently include service, distribution, transfer agent fees, and sub-transfer agent fees that vary amongst the classes as described more fully in Note 2.
Significant Accounting Policies
The following is a summary of significant accounting policies, consistently followed by the Funds in preparation of the financial statements. The Funds are considered investment companies and accordingly, follow the investment company accounting and reporting guidance of the Financial Accounting Standards Board Accounting Standard Codification Topic 946, Financial Services – Investment Companies, a part of Generally Accepted Accounting Principles (“U.S. GAAP”).
Security Transactions and Investment Income
Security transactions are recorded as of the trade date for financial reporting purposes. Securities purchased or sold on a when-issued or delayed-delivery basis may be settled beyond a standard settlement period for the security after the trade date.
17
American Beacon FundsSM
Notes to Financial Statements
June 30, 2018
Dividend income, net of foreign taxes, is recorded on the ex-dividend date, except certain dividends from foreign securities which are recorded as soon as the information is available to the Funds. Interest income, net of foreign taxes, is earned from settlement date, recorded on the accrual basis, and adjusted, if necessary, for accretion of discounts and amortization of premiums. Realized gains (losses) from securities sold are determined on the basis of specific lot identification.
Currency Translation
All assets and liabilities initially expressed in foreign currency values are converted into U.S. dollar values at the mean of the bid and ask prices of such currencies against U.S. dollars as last quoted by a recognized dealer. Income, expenses, and purchases and sales of investments are translated into U.S. dollars at the rate of the exchange prevailing on the respective dates of such transactions. The effect of changes in foreign currency exchange rates on investments is separately identified from the fluctuations arising from changes in market values of securities held and is reported with all other foreign currency gains and losses on the Funds’ Statement of Operations.
Distributions to Shareholders
Distributions, if any, of net investment income will generally be paid at least annually and recorded on the ex-dividend date. Distributions, if any, of net realized capital gains will generally be paid at least annually and recorded on the ex-dividend date. Dividends to shareholders are determined in accordance with federal income tax regulations, which may differ in amount and character from net investment income and realized gains recognized for purposes of U.S. GAAP. To the extent necessary to fully distribute capital gains, the Funds may designate earnings and profits distributed to shareholders on the redemption of shares.
Commission Recapture
The Funds have established brokerage commission recapture arrangements with certain brokers or dealers. If a Funds’ investment advisor chooses to execute a transaction through a participating broker, the broker rebates a portion of the commission back to the Funds. Any collateral benefit received through participation in the commission recapture program is directed exclusively to the Funds. This amount is reported with the net realized gain in the Funds’ Statements of Operations, if applicable. For the period ended June 30, 2018, there was recapture in both Funds.
Allocation of Income, Trust Expenses, Gains, and Losses
Investment income, realized and unrealized gains and losses from investments of the Funds are allocated daily to each class of shares based upon the relative proportion of net assets of each class to the total net assets of the Funds. Expenses directly charged or attributable to any Fund will be paid from the assets of the Fund. Generally, expenses of the Trust will be allocated among and charged to the assets of the Funds on a basis that the Trust’s Board of Trustees (the “Board”) deems fair and equitable, which may be based on the relative net assets of the Funds or nature of the services performed and relative applicability to the Funds.
Organization and Offering Costs
Organizational costs consist of the costs of forming the Funds, drafting the bylaws, administration, custody and transfer agency agreements, and legal services in connection with the initial meeting of trustees, and were expensed immediately as incurred. Offering costs consist of the costs of preparation, review and filing with the SEC the Funds’ registration statement (including the Prospectus and the Statement of Additional Information), the costs of preparation, the costs associated with the printing, mailing or other distribution of the Prospectus, SAI and the amounts of associated filing fees and legal fees associated with the offering. Organizational costs and offering costs are subject to the Funds’ expense limitation agreement discussed in Note 2 and offering costs require amortization over twelve months on a straight-line basis from the commencement of operations.
18
American Beacon FundsSM
Notes to Financial Statements
June 30, 2018
Use of Estimates
The preparation of financial statements in conformity with U.S. GAAP requires management to make estimates and assumptions that affect the amounts reported in the financial statements and accompanying notes. Actual results may differ from those estimated.
Other
Under the Trust’s organizational documents, its officers and trustees are indemnified against certain liabilities arising out of the performance of their duties to the Trust. In the normal course of business, the Trust enters into contracts that provide indemnification to the other party or parties against potential costs or liabilities. The Trust’s maximum exposure under these arrangements is dependent on claims that may be made in the future and, therefore, cannot be estimated. The Trust has had no prior claims or losses pursuant to any such agreement.
2. Transactions with Affiliates
Management and Investment Sub-Advisory Agreements
The Funds and the Manager are parties to a Management Agreement that obligates the Manager to provide the Funds with investment advisory and administrative services. As compensation for performing the duties under the Management Agreement, the Manager will receive an annualized management fee based on a percentage of each Fund’s average daily net assets that is calculated and accrued daily according to the following schedule:
First $5 billion | 0.35 | % | ||
Next $5 billion | 0.325 | % | ||
Next $10 billion | 0.30 | % | ||
Over $20 billion | 0.275 | % |
The Trust, on behalf of the Funds, and the Manager have entered into an Investment Advisory Agreement with Shapiro Capital Management LLC (“Shapiro”), an affiliate of the Manager pursuant to which each Fund has agreed to pay Shapiro an annualized sub-advisory fee that is calculated and accrued daily based on the Funds’ average daily net assets according to the following schedule:
Shapiro Equity Opportunities Fund
First $250 million | 0.35 | % | ||
Next $250 million | 0.30 | % | ||
Over $500 million | 0.25 | % |
Shapiro SMID Cap Equity Fund
First $250 million | 0.40 | % | ||
Next $250 million | 0.35 | % | ||
Over $500 million | 0.30 | % |
The Management and Sub-Advisory Fees paid by the Fund for the period ended June 30, 2018 were as follows:
Shapiro Equity Opportunities Fund
| Effective Fee Rate | Amount of Fees Paid | |||||||||||
Management Fees | 0.35 | % | $ | 21,724 | ||||||||
Sub-Advisor Fees | 0.35 | % | 22,265 | |||||||||
|
|
|
| |||||||||
Total | 0.70 | % | $ | 43,989 | ||||||||
|
|
|
| |||||||||
19
American Beacon FundsSM
Notes to Financial Statements
June 30, 2018
Shapiro SMID Cap Equity Fund
| Effective Fee Rate | Amount of Fees Paid | |||||||||||
Management Fees | 0.35 | % | $ | 12,298 | ||||||||
Sub-Advisor Fees | 0.40 | % | 14,026 | |||||||||
|
|
|
| |||||||||
Total | 0.75 | % | $ | 26,324 | ||||||||
|
|
|
| |||||||||
As compensation for services provided by the Manager in connection with securities lending activities conducted by the Funds, the lending Fund pays to the Manager, with respect to cash collateral posted by borrowers, a fee up to 10% of the net monthly interest income (the gross interest income earned by the investment of cash collateral, less the amount paid to borrowers and related expenses) from such activities and, with respect to loan fees paid by borrowers, a fee up to 10% of such loan fees. These fees are included in “Income derived from securities lending” and “Management and investment advisory fees” on the Statements of Operations. During the period ended June 30, 2018, the Manager received securities lending fees of $17 and $76 for the securities lending activities of the Shapiro Equity Opportunities and Shapiro SMID Cap Equity Funds, respectively.
Distribution Plans
The Funds have adopted a “defensive” Distribution Plan (the “Plan”) in accordance with Rule 12b-1 under the Act, pursuant to which no separate fees may be charged to the Funds for distribution purposes. However, the Plan authorizes the management fee received by the Manager and the investment advisors hired by the Manager to be used for distribution purposes. Under this Plan, the Funds do not intend to compensate the Manager or any other party, either directly or indirectly, for the distribution of Fund shares.
Service Plans
The Manager and the Trust entered into a Service Plan that obligates the Manager to oversee additional shareholder servicing of the Investor Class of the Funds. As compensation for performing the duties required under the Service Plan, the Manager receives an annualized fee up to 0.375% of the average daily net assets attributable to the Investor Class of the Funds.
Sub-Transfer Agent Fees
The Manager has entered into agreements, which include servicing agreements, with financial intermediaries that provide recordkeeping, processing, shareholder communications and other services to customers of the intermediaries that hold positions in the Institutional Class and Y Class of the Funds and has agreed to compensate the intermediaries for providing these services. Intermediaries transact with the Funds primarily through the use of omnibus accounts on behalf of their customers who hold positions in the Funds. Certain services would have been provided by the Funds’ transfer agent and other service providers if the shareholders’ accounts were maintained directly by the Funds’ transfer agent. Accordingly, the Funds, pursuant to Board approval, have agreed to reimburse the Manager for certain non-distribution shareholder services provided by financial intermediaries for the Institutional and Y Classes. The reimbursement amounts (sub-transfer agent fees) paid to the Manager are subject to a fee limit of up to 0.10% of an intermediary’s average net assets in the Institutional and Y Classes on an annual basis. During the period ended June 30, 2018, the sub-transfer agent fees, as reflected in “Transfer agent fees” on the Statements of Operations, were as follows:
Fund | Sub-Transfer Agent Fees | |||
Shaprio Equity Opportunities | $ | 57 | ||
Shapiro SMID Cap Equity | 61 | |||
20
American Beacon FundsSM
Notes to Financial Statements
June 30, 2018
As of June 30, 2018, the Manager owed the Funds the following reimbursement of sub-transfer agent fees, as reflected in “Transfer agent fees payable” on the Statements of Assets and Liabilities:
Fund | Reimbursement Sub-Transfer Agent Fees* | |||
Shaprio Equity Opportunities | $ | 71 | ||
Shapiro SMID Cap Equity | 8 | |||
* These balances are presented as a contra liability as of June 30, 2018 for each Fund respectively.
Investments in Affiliated Funds
The Funds may invest in the American Beacon U.S. Government Money Market Select Fund (the “USG Select Fund”). Cash collateral received by the Funds in connection with securities lending may also be invested in the USG Select Fund. The Funds and the USG Select Fund have the same investment advisor and therefore, are considered to be affiliated. The Manager serves as investment advisor to the USG Select Fund and receives management fees and administrative fees totaling 0.10% of the average daily net assets of the USG Select Fund. During the period ended June 30, 2018, the Manager earned fees on the Funds’ direct investments and securities lending collateral investments in the USG Select Fund as shown below:
Fund | Direct Investments in USG Select Fund | Securities Lending Collateral in USG Select Fund | Total | |||||||||
Shaprio Equity Opportunities | $ | 805 | $ | 52 | $ | 857 | ||||||
Shapiro SMID Cap Equity | 146 | 195 | 341 | |||||||||
Interfund Credit Facility
Pursuant to an exemptive order issued by the Securities and Exchange Commission (“SEC”), the Funds, along with other registered investment companies having management contracts with the Manager, may participate in a credit facility whereby each Fund, under certain conditions, is permitted to lend money directly to and borrow directly from other participating Funds for temporary purposes. The interfund credit facility is advantageous to the Funds because it provides added liquidity, and eliminates the need to maintain higher cash balances to meet redemptions. This situation could arise when shareholder redemptions exceed anticipated volumes and certain funds have insufficient cash on hand to satisfy such redemptions or when sales of securities do not settle as expected, resulting in a cash shortfall for a fund. When a Fund liquidates portfolio securities to meet redemption requests, they often do not receive payment in settlement for up to two days (or longer for certain foreign transactions). Redemption requests normally are satisfied on the next business day. The credit facility provides a source of immediate, short-term liquidity pending settlement of the sale of portfolio securities. The credit facility is administered by a credit facility team consisting of professionals from the Manager’s asset management, compliance, and accounting areas who report the activities of the credit facility to the Board. During the period ended June 30, 2018, the Shapiro SMID Cap Equity Fund borrowed on average $55,644 for 3 days at an average interest rate of 2.24% with interest charges of $11. These amounts are recorded as “Other expenses” in the Statements of Operations. For the period ended June 30, 2018, the Shapiro Equity Opportunities Fund did not utilize the credit facility.
Expense Reimbursement Plan
The Manager contractually agreed to reduce fees and/or reimburse expenses for the classes of the Funds to the extent that total operating expenses exceed the Funds’ expense cap. During the period ended June 30, 2018, the Manager waived and/or reimbursed expenses as follows:
| Expense Cap | Expiration of Reimbursed Expenses | |||||||||||||||||
Fund | Class | 9/12/2017 - 6/30/2018 | Reimbursed Expenses | (Recouped) Expenses | ||||||||||||||
Shaprio Equity Opportunities | Institutional | 0.79 | % | $ | 75,537 | $ | – | 2021 | ||||||||||
Shaprio Equity Opportunities | Y | 0.89 | % | 43,946 | – | 2021 | ||||||||||||
Shaprio Equity Opportunities | Investor | 1.17 | % | 4,493 | – | 2021 | ||||||||||||
Shapiro SMID Cap Equity | Institutional | 0.89 | % | 111,021 | – | 2021 | ||||||||||||
Shapiro SMID Cap Equity | Y | 0.99 | % | 5,189 | – | 2021 | ||||||||||||
Shapiro SMID Cap Equity | Investor | 1.27 | % | 6,760 | – | 2021 | ||||||||||||
21
American Beacon FundsSM
Notes to Financial Statements
June 30, 2018
Of these amounts, $4,173 and $4,696 were disclosed as a receivable from the Manager on the Statements of Assets and Liabilities at June 30, 2018 for the Shapiro Equity Opportunities Fund and Shapiro SMID Cap Equity Fund, respectively.
The Funds have adopted an Expense Reimbursement Plan whereby the Manager may seek repayment of such fee reductions and expense reimbursements. Under the policy, the Manager can be reimbursed by the Funds for any contractual or voluntary fee reductions or expense reimbursements if reimbursement to the Manager (a) occurs within three years after the Manager’s own waiver or reimbursement and (b) does not cause the Funds’ annual operating expenses to exceed the lesser of the contractual percentage limit in effect at the time of the waiver/reimbursement or time of recoupment. The reimbursed expenses listed above will expire in 2021. The Funds did not record a liability for potential reimbursements due to the current assessment that reimbursement is unlikely.
Concentration of Ownership
From time to time, the Funds may have a concentration of one or more accounts constituting a significant percentage of shares outstanding. Investment activities by holders of accounts that represent a significant ownership of more than 5% of the Funds’ outstanding shares could have a material impact on the Funds. As of June 30, 2018, based on management’s evaluation of the shareholder account base, two accounts have been identified as representing an unaffiliated significant ownership of approximately 56% for the Shapiro Equity Opportunities Fund and one account has been identified as representing an affiliated significant ownership of approximately 56% for the Shapiro SMID Cap Equity Fund.
Trustee Fees and Expenses
As compensation for their service to the Trust, American Beacon Select Funds, American Beacon Institutional Funds Trust, American Beacon Sound Point Enhanced Income Fund, and American Beacon Apollo Total Return Fund each Trustee receives an annual retainer of $120,000, plus $10,000 for each Board meeting attended in person or via teleconference, $2,500 for attendance by Committee members at meetings of the Audit Committee and the Investment Committee, and $1,500 for attendance by Committee members at meetings of the Nominating and Governance Committee, plus reimbursement of reasonable expenses incurred in attending Board meetings, Committee meetings, and relevant educational seminars. The Trustees also may be compensated for attendance at special Board and/or Committee meetings from time to time. The Board Chairman receives an additional annual retainer of $50,000 as well as a $2,500 fee each quarter for his attendance at the committee meetings. Effective January 1, 2018, the Board Vice Chair receives an additional annual retainer of $10,000. The Chairpersons of the Audit Committee and the Investment Committee each receive an additional annual retainer of $25,000 and the Chairman of the Nominating and Governance Committee receives an additional annual retainer of $10,000. These expenses are allocated on a prorated basis to each Fund of the Trusts according to its respective net assets.
3. Security Valuation and Fair Value Measurements
The price of the Fund’s shares is based on its net asset value (“NAV”) per share. The Fund’s NAV is computed by adding total assets, subtracting all the Fund’s liabilities, and dividing the result by the total number of shares outstanding.
The NAV of each class of the Fund’s shares is determined based on a pro rata allocation of the Fund’s investment income, expenses and total capital gains and losses. The Fund’s NAV per share is determined each business day as of the regular close of trading on the New York Stock Exchange (“NYSE” or “Exchange”), which is typically 4:00 p.m. Eastern Time (“ET”). However, if trading on the NYSE closes at a time other than 4:00 p.m. ET, the Fund’s NAV per share typically would still be determined as of the regular close of trading on the NYSE. The Fund does not price its shares on days that the NYSE is closed. Foreign exchanges may permit trading in foreign securities on days when the Fund is not open for business, which may result in the value of the Fund’s portfolio investments being affected at a time when you are unable to buy or sell shares.
22
American Beacon FundsSM
Notes to Financial Statements
June 30, 2018
Equity securities and certain derivative instruments that are traded on an exchange are valued based on market value. Certain derivative instruments (other than short-term securities) usually are valued on the basis of prices provided by a pricing service. The price of debt securities generally is determined using pricing services or quotes obtained from broker/dealers who may consider a number of inputs and factors, such as comparable characteristics, yield curve, credit spreads, estimated default rates, coupon rates, underlying collateral and estimated cash flow. Investments in other mutual funds are valued at the closing NAV per share of the mutual funds on the day of valuation. Equity securities, including shares of closed-end funds and exchanged-traded funds (“ETFs”), are valued at the last sale price or official closing price.
The valuation of securities traded on foreign markets and certain fixed income securities will generally be based on prices determined as of the earlier closing time of the markets on which they primarily trade unless a significant event has occurred. When the Fund holds securities or other assets that are denominated in a foreign currency, the Fund will normally use the currency exchange rates as of 4:00 p.m. ET.
Securities may be valued at fair value, as determined in good faith and pursuant to procedures approved by the Board of Trustees, under certain limited circumstances. For example, fair value pricing will be used when market quotations are not readily available or reliable, as determined by the Manager, such as when (i) trading for a security is restricted or stopped; (ii) a security’s trading market is closed (other than customary closings); or (iii) a security has been de-listed from a national exchange. A security with limited market liquidity may require fair value pricing if the Manager determines that the available price does not reflect the security’s true market value. In addition, if a significant event that the Manager determines to affect the value of one or more securities held by the Fund occurs after the close of a related exchange but before the determination of the Fund’s NAV, fair value pricing may be used on the affected security or securities. Securities of small-capitalization companies are also more likely to require a fair value determination using these procedures because they are more thinly traded and less liquid than the securities of larger-capitalization companies. The Fund may fair value securities as a result of significant events occurring after the close of the foreign markets in which the Fund invests as described below. In addition, the Fund may invest in illiquid securities requiring these procedures.
The Fund may use fair value pricing for securities primarily traded in non-U.S. markets because most foreign markets close well before the Fund’s pricing time of 4:00 p.m. ET. The earlier close of these foreign markets gives rise to the possibility that significant events, including broad market moves, may have occurred in the interim and may materially affect the value of those securities. If the Manager determines that the last quoted prices of non-U.S. securities will, in its judgment, materially affect the value of some or all its portfolio securities, the Manager can adjust the previous closing prices to reflect what it believes to be the fair value of the securities as of the close of the Exchange. In deciding whether it is necessary to adjust closing prices to reflect fair value, the Manager reviews a variety of factors, including developments in foreign markets, the performance of U.S. securities markets, and the performance of instruments trading in U.S. markets that represent foreign securities and baskets of foreign securities. These securities are fair valued using a pricing service, using methods approved by the Board, that considers the correlation of the trading patterns of the foreign security to intraday trading in the U.S. markets, based on indices of domestic securities and other appropriate indicators such as prices of relevant American Depositary Receipts (“ADRs”) and futures contracts. The Valuation Committee, established by the Board, may also fair value securities in other situations, such as when a particular foreign market is closed but the Fund is open. The Fund uses outside pricing services to provide closing prices and information to evaluate and/or adjust those prices. As a means of evaluating its security valuation process, the Valuation Committee routinely compares closing prices, the next day’s opening prices in the same markets and adjusted prices.
Attempts to determine the fair value of securities introduce an element of subjectivity to the pricing of securities. As a result, the price of a security determined through fair valuation techniques may differ from the price quoted or published by other sources and may not accurately reflect the market value of the security when trading resumes. If a reliable market quotation becomes available for a security formerly valued through fair valuation techniques, the Manager compares the new market quotation to the fair value price to evaluate the effectiveness of the Fund’s fair valuation procedures. If any significant discrepancies are found, the Manager may adjust the Fund’s fair valuation procedures.
23
American Beacon FundsSM
Notes to Financial Statements
June 30, 2018
Valuation Inputs
Various inputs may be used to determine the fair value of the Funds’ investments. These inputs are summarized in three broad levels for financial statement purposes. The inputs or methodologies used to value securities are not necessarily an indication of the risk associated with investing in those securities.
| Level 1 | - | Quoted prices in active markets for identical securities. | ||
| Level 2 | - | Prices determined using other significant observable inputs. These may include quoted prices for similar securities, interest rates, prepayment speeds, credit risk, and others. | ||
| Level 3 | - | Prices determined using other significant unobservable inputs. Unobservable inputs reflect the Fund’s own assumptions about the factors market participants would use in pricing an investment. | ||
Level 1 and Level 2 trading assets and trading liabilities, at fair value
Common stocks, ETFs and financial derivative instruments, such as futures contracts or options that are traded on a national securities exchange, are stated at the last reported sale or settlement price on the day of valuation. To the extent these securities are actively traded and valuation adjustments are not applied, they are categorized as Level 1 of the fair value hierarchy. Preferred securities and other equities traded on inactive markets or valued by reference to similar instruments are generally categorized as Level 2 of the fair value hierarchy.
Investments in registered open-end investment management companies will be valued based upon the NAVs of such investments and are categorized as Level 1 of the fair value hierarchy.
The Funds did not hold any Level 2 securities at the period ended June 30, 2018.
4. Securities and Other Investments
Common Stock
Common stock generally takes the form of shares in a corporation which represent an ownership interest. It ranks below preferred stock and debt securities in claims for dividends and for assets of the company in a liquidation or bankruptcy. The value of a company’s common stock may fall as a result of factors directly relating to that company, such as decisions made by its management or decreased demand for the company’s products or services. A stock’s value may also decline because of factors affecting not just the company, but also companies in the same industry or sector. The price of a company’s stock may also be affected by changes in financial markets that are relatively unrelated to the company, such as changes in interest rates, currency exchange rates or industry regulation. Companies that elect to pay dividends on their common stock generally only do so after they invest in their own business and make required payments to bondholders and on other debt and preferred stock. Therefore, the value of a company’s common stock will usually be more volatile than its bonds, other debt and preferred stock. Common stock may be exchange-traded or over-the-counter (“OTC”). OTC stock may be less liquid than exchange-traded stock.
Non-Voting Depositary Receipts
Non-Voting Depositary Receipts (“NVDRs”) represent financial interests in an issuer but the holder is not entitled to any voting rights. Depositary receipts may not be denominated in the same currency as the securities into which they may be converted. Investing in depositary receipts entails substantially the same risks as direct investment in foreign securities. There is generally less publicly available information about foreign companies and there may be less governmental regulation and supervision of foreign stock exchanges, brokers, and listed companies. In addition, such companies may use different accounting and financial standards (and certain currencies may become unavailable for transfer from a foreign currency), resulting in the Fund’s possible inability to convert
24
American Beacon FundsSM
Notes to Financial Statements
June 30, 2018
immediately into U.S. currency proceeds realized upon the sale of portfolio securities of the affected foreign companies. In addition, the Funds may invest in unsponsored depositary receipts, the issuers of which are not obligated to disclose material information about the underlying securities to investors in the United States. Ownership of unsponsored depositary receipts may not entitle the Funds to the same benefits and rights as ownership of a sponsored depositary receipt or the underlying security.
Other Investment Company Securities and Other Exchange-Traded Products
The Funds may invest in shares of other investment companies, including open-end funds, closed-end funds, business development companies, ETFs, unit investment trusts, and other investment companies of the Trust. The Funds may invest in investment company securities advised by the Manager or a sub-advisor. Investments in the securities of other investment companies may involve duplication of advisory fees and certain other expenses. By investing in another investment company, the Funds become a shareholder of that investment company. As a result, the Funds’ shareholders indirectly will bear the Funds’ proportionate share of the fees and expenses paid by shareholders of the other investment company, in addition to the fees and expenses the Funds’ shareholders directly bear in connection with the Funds’ own operations. These other fees and expenses are reflected as Acquired Fund Fees and Expenses and are included in the Fees and Expenses Table for the Funds in their Prospectus, if applicable. Investments in other investment companies may involve the payment of substantial premiums above the value of such issuer’s portfolio securities.
5. Principal Risks
Investing in the Funds may involve certain risks including, but not limited to, those described below.
Equity Investments Risk
Equity securities are subject to market risk. The Funds’ investments in equity securities may include common stocks, preferred stocks, securities convertible into or exchangeable for common stocks, real estate investment trusts (“REITs”), depositary receipts, and U.S. dollar-denominated foreign stocks traded on U.S. exchanges. Such investments may expose the Funds to additional risk. The value of a company’s common stock may fall as a result of factors affecting the company, companies in the same industry or sector, or the financial markets overall. Common stock generally is subordinate to preferred stock upon the liquidation or bankruptcy of the issuing company. Preferred stocks and convertible securities are sensitive to movements in interest rates. Preferred stocks may be less liquid than common stocks and, unlike common stocks, participation in the growth of an issuer may be limited. Distributions on preferred stocks generally are payable at the discretion of an issuer and after required payments to bond holders. Convertible securities are subject to the risk that the credit standing of the issuer may have an effect on the convertible securities’ investment value. Investments in REITs are subject to the risks associated with investing in the real estate industry such as adverse developments affecting the real estate industry and real property values. Depositary receipts and U.S. dollar-denominated foreign stocks traded on U.S. exchanges are subject to certain of the risks associated with investing directly in foreign securities, including, but not limited to, currency fluctuations and political and financial instability in the home country of a particular depositary receipt or foreign stock.
Focused Holdings Risk
Because the Funds may have a focused portfolio of fewer companies, the increase or decrease of the value of a single investment may have a greater impact on the Funds’ NAV and total return when compared to other diversified funds.
Market Risk
Since the financial crisis that started in 2008, the U.S. and many foreign economies continue to experience its after-effects. Conditions in the U.S. and many foreign economies have resulted, and may continue to result, in certain instruments experiencing unusual liquidity issues, increased price volatility and, in some cases, credit downgrades and
25
American Beacon FundsSM
Notes to Financial Statements
June 30, 2018
increased likelihood of default. These events have reduced the willingness and ability of some lenders to extend credit, and have made it more difficult for some borrowers to obtain financing on attractive terms, if at all. In some cases, traditional market participants have been less willing to make a market in some types of debt instruments, which has affected the liquidity of those instruments. During times of market turmoil, investors tend to look to the safety of securities issued or backed by the U.S. Treasury, causing the prices of these securities to rise and the yields to decline. The reduced liquidity in fixed income and credit markets may negatively affect many issuers worldwide. In addition, global economies and financial markets are becoming increasingly interconnected, which increases the possibilities that conditions in one country or region might adversely impact issuers in a different country or region.
In response to the financial crisis, the U.S. and other governments and the Federal Reserve and certain foreign central banks have taken steps to support financial markets. In some countries where economic conditions are recovering, they are nevertheless perceived as still fragile. Withdrawal of government support, failure of efforts in response to the crisis, or investor perception that such efforts are not succeeding, could adversely impact the value and liquidity of certain securities. The severity or duration of adverse economic conditions may also be affected by policy changes made by governments or quasi-governmental organizations, including changes in tax laws. The impact of new financial regulation legislation on the markets and the practical implications for market participants may not be fully known for some time. Regulatory changes are causing some financial services companies to exit long-standing lines of business, resulting in dislocations for other market participants. In addition, political and diplomatic events within the U.S. and abroad, such as the U.S. government’s inability at times to agree on a long-term budget and deficit reduction plan, the threat of a federal government shutdown and threats not to increase the federal government’s debt limit, may affect investor and consumer confidence and may adversely impact financial markets and the broader economy, perhaps suddenly and to a significant degree. The results of the 2016 U.S. presidential election may result in significant changes in certain policies. These changes may result in lower corporate taxes, higher levels of public debt, higher interest rates, more restrictions on international trade, and less stringent prudential regulation of certain players in the financial markets.
Changes in market conditions will not have the same impact on all types of securities. Interest rates have been unusually low in recent years in the U.S. and abroad. Because there is little precedent for this situation, it is difficult to predict the impact of a significant rate increase on various markets. For example, because investors may buy securities or other investments with borrowed money, a significant increase in interest rates may cause a decline in the markets for those investments. Because of the sharp decline in the worldwide price of oil, there is a concern that oil producing nations may withdraw significant assets now held in U.S. Treasuries, which could force a substantial increase in interest rates. Regulators have expressed concern that rate increases may cause investors to sell fixed income securities faster than the market can absorb them, contributing to price volatility. In addition, there is a risk that the prices of goods and services in the U.S. and many foreign economies may decline over time, known as deflation (the opposite of inflation). Deflation may have an adverse effect on stock prices and creditworthiness and may make defaults on debt more likely. If a country’s economy slips into a deflationary pattern, it could last for a prolonged period and may be difficult to reverse. The abandonment of the euro or withdrawal from the European Union (“EU”) on the part of the United Kingdom or any other member could significantly adversely affect the value of the Fund’s investments in Europe. Particularly, the United Kingdom’s vote to leave the EU could lead to a prolonged period of uncertainty as to the exact terms of exit and the impact on different industry sectors and increased market volatility.
Non-Diversification Risk
The Funds are non-diversified, which means the Funds may focus their investments in the securities of a comparatively small number of issuers. Investments in securities of a limited number of issuers exposes the Funds to greater market risk and potential losses than if assets were diversified among the securities of a greater number of issuers.
26
American Beacon FundsSM
Notes to Financial Statements
June 30, 2018
Other Investment Companies Risk
The Funds may invest in shares of other registered investment companies, including ETFs and money market funds that are advised by the Manager. To the extent that the Funds invest in shares of other registered investment companies, the Funds will indirectly bear the fees and expenses charged by those investment companies in addition to the Funds’ direct fees and expenses and will be subject to the risks associated with investments in those companies.
Securities Lending Risk
A Fund may lend its portfolio securities to brokers, dealers and financial institutions to seek income. There is a risk that a borrower may default on its obligations to return loaned securities; however, a Fund’s securities lending agent may indemnify the Fund against that risk. There is a risk that the assets of a Fund’s securities lending agent may be insufficient to satisfy any contractual indemnification requirements to the Fund. Borrowers of a Fund’s securities typically provide collateral in the form of cash that is reinvested in securities. A Fund will be responsible for the risks associated with the investment of cash collateral, including any collateral invested in an affiliated money market fund. A Fund may lose money on its investment of cash collateral or may fail to earn sufficient income on its investment to meet obligations to the borrower. In addition, delays may occur in the recovery of securities from borrowers, which could interfere with a Fund’s ability to vote proxies or to settle transactions and there is the risk of possible loss of rights in the collateral should the borrower fail financially.
Offsetting Assets and Liabilities
The Funds may be party to enforceable master netting agreements between brokers and counterparties which provide for the right to offset under certain circumstances. The Funds employ multiple money managers and counterparties and have elected not to offset qualifying financial and derivative instruments on the Statements of Assets and Liabilities, as such all financial and derivative instruments are presented on a gross basis. The impacts of netting arrangements that provide the right to offset are detailed below. The net amount represents the net receivable or payable that would be due from or to the counterparty in the event of default. Exposure from borrowings and other financing agreements such as repurchase agreements can only be netted across transactions governed by the same Master Agreement with the same legal entity. All amounts reported below represent the balance as of the report date, June 30, 2018.
Shapiro SMID Cap Equity Fund
| Remaining Contractual Maturity of the Agreements As of June 30, 2018 | ||||||||||||||||||||||||||||||||||||
| Overnight and Continuous | <30 days | Between 30 & 90 days | >90 days | Total | ||||||||||||||||||||||||||||||||
Securities Lending Transactions | ||||||||||||||||||||||||||||||||||||
Common Stocks | $ | 248,939 | $ | - | $ | - | $ | - | $ | 248,939 | ||||||||||||||||||||||||||
|
|
|
|
|
|
|
|
|
| |||||||||||||||||||||||||||
Total Borrowings | $ | 248,939 | $ | - | $ | - | $ | - | $ | 248,939 | ||||||||||||||||||||||||||
|
|
|
|
|
|
|
|
|
| |||||||||||||||||||||||||||
Gross amount of recognized liabilities for securities lending transactions |
| $ | 248,939 | |||||||||||||||||||||||||||||||||
|
| |||||||||||||||||||||||||||||||||||
6. Federal Income and Excise Taxes
It is the policy of each Fund to qualify as a regulated investment company (“RIC”), by complying with all applicable provisions of Subchapter M of the Internal Revenue Code, as amended, and to make distributions of taxable income sufficient to relieve it from substantially all federal income and excise taxes. For federal income tax purposes, each Fund is treated as a single entity for the purpose of determining such qualification.
The Funds do not have any unrecorded tax liabilities in the accompanying financial statements. The tax year ending June 30, 2018 remains subject to examination by the Internal Revenue Service. If applicable, the Funds recognize interest accrued related to unrecognized tax benefits in interest expense and penalties in “Other expenses” on the Statements of Operations.
27
American Beacon FundsSM
Notes to Financial Statements
June 30, 2018
The Funds may be subject to taxes imposed by countries in which it invests. Such taxes are generally based on returns of income earned or gains realized or repatriated. Taxes are accrued and applied to net investment income, net realized capital gains and net unrealized appreciation (depreciation), as applicable, as the income is earned or capital gains are recorded.
Dividends are categorized in accordance with income tax regulations which may treat certain transactions differently than U.S. GAAP. Accordingly, the character of distributions and composition of net assets for tax purposes may differ from those reflected in the accompanying financial statements.
The tax character of distributions paid were as follows:
| Shapiro Equity Opportunities Fund | Shapiro SMID Cap Equity Fund | |||||||||||
| From September 12, 2017A to June 30, 2018 | From September 12, 2017A to June 30, 2018 | |||||||||||
Distributions paid from: | ||||||||||||
Ordinary income* | ||||||||||||
Institutional Class | $ | 5,901 | $ | - | ||||||||
Y Class | 167 | - | ||||||||||
Investors Class | 225 | - | ||||||||||
|
|
|
| |||||||||
Total distributions paid | $ | 6,293 | $ | - | ||||||||
|
|
|
| |||||||||
*For tax purposes, short-term capital gains are considered ordinary income distributions.
ACommencement of operations.
As of June 30, 2018 the components of distributable earnings (deficits) on a tax basis were as follows:
Fund | Tax Cost | Unrealized Appreciation | Unrealized (Depreciation) | Net Unrealized Appreciation (Depreciation) | ||||||||||||
Shaprio Equity Opportunities | $ | 56,978,911 | $ | 1,407,741 | $ | (877,429 | ) | $ | 530,312 | |||||||
Shapiro SMID Cap Equity | 5,611,601 | 503,888 | (132,103 | ) | 371,785 | |||||||||||
Fund | Net Unrealized Appreciation (Depreciation) | Undistributed Ordinary Income | Undistributed Long-Term Capital Gains | Accumulated Capital and Other (Losses) | Other Temporary Differences | Distributable Earnings | ||||||||||||||||||
Shaprio Equity Opportunities | $ | 530,312 | $ | 195,109 | $ | – | $ | – | $ | – | $ | 725,421 | ||||||||||||
Shapiro SMID Cap Equity | 371,785 | 194,480 | – | – | – | 566,265 | ||||||||||||||||||
Financial reporting records are adjusted for permanent book/tax differences to reflect tax character. Financial records are not adjusted for temporary differences. The temporary differences between financial reporting and tax-basis reporting of unrealized appreciation (depreciation) are attributable primarily to the tax deferral of losses from wash sales and organizational expenses.
Due to inherent differences in the recognition of income, expenses, and realized gains (losses) under U.S. GAAP and federal income tax regulations, permanent differences between book and tax reporting have been identified and appropriately reclassified on the Statements of Assets and Liabilities.
Accordingly, the following amounts represent current year permanent differences derived from foreign currency reclasses as of June 30, 2018:
Fund | Paid-In-Capital | Undistributed (Overdistribution of) Net Investment Income | Accumulated Net Realized Gain (Loss) | Net Unrealized Appreciation (Depreciation) | ||||||||||||
Shaprio Equity Opportunities | $ | – | $ | – | $ | – | $ | – | ||||||||
Shapiro SMID Cap Equity | – | 215 | (215 | ) | – | |||||||||||
28
American Beacon FundsSM
Notes to Financial Statements
June 30, 2018
Under the Regulated Investment Company Modernization Act of 2010 (“RIC MOD”), net capital losses recognized by the Funds in taxable years beginning after December 22, 2010 are carried forward indefinitely and retain their character as short-term and/or long-term losses.
During the period June 30, 2018, the Funds did not have any capital loss carryforwards.
7. Investment Transactions
The aggregate cost of purchases and proceeds from sales and maturities of investments, other than short-term obligations, for the period ended June 30, 2018 were as follows:
Fund | Purchases (non-U.S. Government Securities) | Sales (non-U.S. Government Securities) | ||||||||||
| Shaprio Equity Opportunities | $ | 52,960,360 | $ | 855,978 | ||||||||
| Shapiro SMID Cap Equity | 6,010,648 | 944,404 | ||||||||||
A summary of the Funds’ transactions in the USG Select Fund for the period ended June 30, 2018 were as follows:
Fund | Type of Transaction | June 30, 2017 Shares/Fair Value | Purchases | Sales | June 30, 2018 Shares/Fair Value | Dividend Income | ||||||||||||||||||||||||||||||||||||
| Shapiro Equity Opportunities | Direct | $ | - | $ | 51,547,119 | $ | 46,826,628 | $ | 4,720,491 | $ | 12,963 | |||||||||||||||||||||||||||||||
| Shapiro Equity Opportunities | Securities Lending | - | 662,673 | 662,673 | - | 188 | ||||||||||||||||||||||||||||||||||||
| Shapiro SMID Cap Equity | Direct | - | 3,998,754 | 3,890,750 | 108,004 | 1,865 | ||||||||||||||||||||||||||||||||||||
| Shapiro SMID Cap Equity | Securities Lending | - | 2,330,020 | 2,081,081 | 248,939 | N/A | ||||||||||||||||||||||||||||||||||||
8. Securities Lending
The Funds may lend their securities to qualified financial institutions, such as certain broker-dealers, to earn additional income. The borrowers are required to secure their loans continuously with collateral in an amount at least equal to the fair value of the securities loaned, initially in an amount at least equal to 102% of the fair value of domestic securities loaned and 105% of the fair value of international securities loaned. Collateral is monitored and marked-to-market daily. Daily mark-to-market amounts are required to be paid to the borrower or received from the borrower by the end of the following business day. This one day settlement for mark-to-market amounts may result in the collateral being temporarily less than the value of the securities on loan or temporarily more than the required minimum collateral.
To the extent that a loan is collateralized by cash, such cash collateral shall be invested by the securities lending agent (the “Agent”) in money market mutual funds and other short-term investments, provided the investments meet certain quality and diversification requirements. Securities purchased with cash collateral proceeds are listed in the Funds’ Schedule of Investments and the collateral is shown on the Statement of Assets and Liabilities as a payable.
Securities lending income is generated from the demand premium (if any) paid by the borrower to borrow a specific security and from the return on investment of cash collateral, reduced by negotiated rebate fees paid to the borrower and transaction costs. To the extent that a loan is secured by non-cash collateral, securities lending income is generated as a demand premium reduced by transaction costs. The Funds, the Agent, and the Manager retained 80%, 10%, and 10%, respectively, of the income generated from securities lending.
While securities are on loan, the Funds continue to receive certain income associated with that security and any gain or loss in the market price that may occur during the term of the loan. In the case of domestic equities, the value of any dividend is received in the form of a substitute payment approximately equal to the dividend. In the case of foreign securities, a negotiated amount is received that is less than the actual dividend, but higher than the dividend amount minus the foreign tax that the Funds would be subject to on the dividend.
29
American Beacon FundsSM
Notes to Financial Statements
June 30, 2018
Securities lending transactions pose certain risks to the Funds, including that the borrower may not provide additional collateral when required or return the securities when due, that the value of the short-term investments will be less than the amount of cash collateral required to be returned to the borrower, that non-cash collateral may be subject to legal constraints in the event of a borrower bankruptcy, and that the cash collateral investments could become illiquid and unable to be used to return collateral to the borrower. The Funds could also experience delays and costs in gaining access to the collateral. The Funds bear the risk of any deficiency in the amount of the cash collateral available for return to the borrower and any action which impairs its ability to liquidate non-cash collateral to satisfy a borrower default.
As of June 30, 2018, the value of outstanding securities on loan and the value of collateral were as follows:
Fund | Market Value of Securities on Loan | Cash Collateral Received | Non-Cash Collateral Received | Total Collateral Received | ||||||||||||
Shapiro SMID Cap Equity | $ | 250,276 | $ | 248,939 | $ | – | $ | 248,939 | ||||||||
Cash collateral is listed on the Funds’ Schedules of Investments and is shown on the Statements of Assets and Liabilities. Income earned on these investments is included in “Income derived from securities lending” on the Statements of Operations.
Non-cash collateral received by the Funds may not be sold or re-pledged except to satisfy a borrower default. Therefore, non-cash collateral is not included on the Funds’ Schedules of Investments or Statements of Assets and Liabilities.
9. Borrowing Arrangements
Effective November 16, 2017, the Funds, along with certain other funds managed by the Manager (“Participating Funds”), entered into a committed revolving line of credit (the “Committed Line”) agreement with State Street Bank and Trust Company (the “Bank”) to be used to facilitate portfolio liquidity. The maximum borrowing amount under the Committed Line is $50 million with interest at a rate equal to the higher of (a) one-month London Inter-Bank Offered Rate (“LIBOR”) plus 1.25% per annum or (b) the Federal Funds rate plus 1.25% per annum on amounts borrowed. Each of the Participating Funds will pay a commitment fee at a rate of 0.25% per annum on the unused portion of the Committed Line amount. The Committed Line expires November 15, 2018, unless extended by the Bank or terminated by the Participating Funds in accordance with the agreement.
Effective November 16, 2017, the Funds, along with certain other Participating Funds managed by the Manager, entered into an uncommitted discretionary demand revolving line of credit (the “Uncommitted Line”) agreement with the Bank to be used to facilitate portfolio liquidity. The maximum borrowing amount under the Uncommitted Line is $50 million with interest at a rate equal to the higher of (a) one-month LIBOR plus 1.25% per annum or (b) the Federal Funds rate. The Uncommitted Line expires November 15, 2018 unless extended by the Bank or terminated by the Participating Funds in accordance with the agreement.
The Participating Funds paid administration, legal and arrangement fees, which are recognized as a component of “Other expenses” on the Statements of Operations, along with commitment fees, that have been allocated among the Participating Funds based on average daily net assets. During the period ended June 30, 2018, the Funds did not utilize this facility.
30
American Beacon FundsSM
Notes to Financial Statements
June 30, 2018
10. Capital Share Transactions
The tables below summarize the activity in capital shares for each Class of the Funds:
| Institutional Class | ||||||||||||
| September 12, 2017A to June 30, 2018 | ||||||||||||
Shapiro Equity Opportunities Fund | Shares | Amount | ||||||||||
| Shares sold | 4,171,644 | B | $ | 44,283,809 | B | |||||||
| Reinvestment of dividends | 547 | 5,901 | ||||||||||
| Shares redeemed | (293,341 | ) | (3,324,098 | ) | ||||||||
|
|
|
| |||||||||
| Net increase in shares outstanding | 3,878,850 | $ | 40,965,612 | |||||||||
|
|
|
| |||||||||
| Y Class | ||||||||||||
| September 12, 2017A to June 30, 2018 | ||||||||||||
Shapiro Equity Opportunities Fund | Shares | Amount | ||||||||||
| Shares sold | 2,348,499 | B | $ | 25,754,034 | B | |||||||
| Reinvestment of dividends | 15 | 167 | ||||||||||
| Shares redeemed | (10,015 | ) | (113,876 | ) | ||||||||
|
|
|
| |||||||||
| Net increase in shares outstanding | 2,338,499 | $ | 25,640,325 | |||||||||
|
|
|
| |||||||||
| Investor Class | ||||||||||||
| September 12, 2017A to June 30, 2018 | ||||||||||||
Shapiro Equity Opportunities Fund | Shares | Amount | ||||||||||
| Shares sold | 22,070 | B | $ | 128,330 | B | |||||||
| Reinvestment of dividends | 21 | 225 | ||||||||||
| Shares redeemed | (6,027 | ) | (63,103 | ) | ||||||||
|
|
|
| |||||||||
| Net increase in shares outstanding | 16,064 | $ | 65,452 | |||||||||
|
|
|
| |||||||||
| Institutional Class | ||||||||||||
| September 12, 2017A to June 30, 2018 | ||||||||||||
Shapiro SMID Cap Equity Fund | Shares | Amount | ||||||||||
| Shares sold | 449,932 | B | $ | 1,783,380 | B | |||||||
|
|
|
| |||||||||
| Net increase in shares outstanding | 449,932 | $ | 1,783,380 | |||||||||
|
|
|
| |||||||||
| Y Class | ||||||||||||
| September 12, 2017A to June 30, 2018 | ||||||||||||
Shapiro SMID Cap Equity Fund | Shares | Amount | ||||||||||
| Shares sold | 49,895 | B | $ | 449,955 | B | |||||||
| Shares redeemed | (30,942 | ) | (339,128 | ) | ||||||||
|
|
|
| |||||||||
| Net increase in shares outstanding | 18,953 | $ | 110,827 | |||||||||
|
|
|
| |||||||||
| Investor Class | ||||||||||||
| September 12, 2017A to June 30, 2018 | ||||||||||||
Shapiro SMID Cap Equity Fund | Shares | Amount | ||||||||||
| Shares sold | 33,037 | B | $ | 253,249 | B | |||||||
| Shares redeemed | (1,964 | ) | (20,096 | ) | ||||||||
|
|
|
| |||||||||
| Net increase in shares outstanding | 31,073 | $ | 233,153 | |||||||||
|
|
|
| |||||||||
A Commencement of operations.
B Seed Capital was received on September 12, 2017 in the amount of $2,800,000, $100,000, and $100,000 for the Institutional, Y, and Investor Classes, respectively. As a result, shares were issued in the amounts of 280,000, 10,000, and 10,000 for the Institutional, Y, and Investor Classes, respectively, for both Funds.
11. Subsequent Events
Management has evaluated subsequent events for possible recognition or disclosure in the financial statements through the date the financial statements are issued. Management has determined that there are no material events that would require disclosure in the Funds’ financial statements through this date.
31
American Beacon Shapiro Equity Opportunities FundSM
Financial Highlights
(For a share outstanding throughout the period)
| Institutional Class | ||||
| September 12, 2017A to June 30, 2018 | ||||
Net asset value, beginning of period | $ | 10.00 | ||
|
| |||
Income from investment operations: | ||||
Net investment income | 0.02 | |||
Net gains on investments (both realized and unrealized) | 1.29 | |||
|
| |||
Total income from investment operations | 1.31 | |||
|
| |||
Less distributions: | ||||
Dividends from net investment income | (0.02 | ) | ||
Distributions from net realized gains | (0.00 | )B | ||
|
| |||
Total distributions | (0.02 | ) | ||
|
| |||
Net asset value, end of period | $ | 11.29 | ||
|
| |||
Total returnC | 13.07 | %D | ||
|
| |||
Ratios and supplemental data: | ||||
Net assets, end of period | $ | 43,796,676 | ||
Ratios to average net assets: | ||||
Expenses, before reimbursements | 2.81 | %E | ||
Expenses, net of reimbursements | 0.79 | %E | ||
Net investment (loss), before expense reimbursements | (1.53 | )%E | ||
Net investment income, net of reimbursements | 0.49 | %E | ||
Portfolio turnover rate | 9 | %F | ||
| A | Commencement of operations. |
| B | Amount represents less than $0.01 per share. |
| C | Based on net asset value, which does not reflect the sales charge, redemption fee, or contingent deferred sales charge, if applicable. May include adjustments in accordance with U.S. GAAP and as such, the net asset value for reporting purposes and the returns based upon those net asset values may differ from the net asset value and returns for shareholder transactions. |
| D | Not annualized. |
| E | Annualized. |
| F | Portfolio turnover rate is for the period from September 12, 2017 through June 30, 2018 and is not annualized. |
See accompanying notes
32
American Beacon Shapiro Equity Opportunities FundSM
Financial Highlights
(For a share outstanding throughout the period)
| Y Class | ||||
| September 12, 2017A to June 30, 2018 | ||||
Net asset value, beginning of period | $ | 10.00 | ||
|
| |||
Income from investment operations: | ||||
Net investment income | 0.03 | |||
Net gains on investments (both realized and unrealized) | 1.29 | |||
|
| |||
Total income from investment operations | 1.32 | |||
|
| |||
Less distributions: | ||||
Dividends from net investment income | (0.02 | ) | ||
Distributions from net realized gains | (0.00 | )B | ||
|
| |||
Total distributions | (0.02 | ) | ||
|
| |||
Net asset value, end of period | $ | 11.30 | ||
|
| |||
Total returnC | 13.17 | %D | ||
|
| |||
Ratios and supplemental data: | ||||
Net assets, end of period | $ | 26,419,367 | ||
Ratios to average net assets: | ||||
Expenses, before reimbursements | 2.77 | %E | ||
Expenses, net of reimbursements | 0.89 | %E | ||
Net investment (loss), before expense reimbursements | (0.79 | )%E | ||
Net investment income, net of reimbursements | 1.09 | %E | ||
Portfolio turnover rate | 9 | %F | ||
| A | Commencement of operations. |
| B | Amount represents less than $0.01 per share. |
| C | Based on net asset value, which does not reflect the sales charge, redemption fee, or contingent deferred sales charge, if applicable. May include adjustments in accordance with U.S. GAAP and as such, the net asset value for reporting purposes and the returns based upon those net asset values may differ from the net asset value and returns for shareholder transactions. |
| D | Not annualized. |
| E | Annualized. |
| F | Portfolio turnover rate is for the period from September 12, 2017 through June 30, 2018 and is not annualized. |
See accompanying notes
33
American Beacon Shapiro Equity Opportunities FundSM
Financial Highlights
(For a share outstanding throughout the period)
| Investor Class | ||||
| September 12, 2017A to June 30, 2018 | ||||
Net asset value, beginning of period | $ | 10.00 | ||
|
| |||
Income from investment operations: | ||||
Net investment income | 0.02 | |||
Net gains on investments (both realized and unrealized) | 1.25 | |||
|
| |||
Total income from investment operations | 1.27 | |||
|
| |||
Less distributions: | ||||
Dividends from net investment income | (0.02 | ) | ||
Distributions from net realized gains | (0.00 | )B | ||
|
| |||
Total distributions | (0.02 | ) | ||
|
| |||
Net asset value, end of period | $ | 11.25 | ||
|
| |||
Total returnC | 12.67 | %D | ||
|
| |||
Ratios and supplemental data: | ||||
Net assets, end of period | $ | 180,767 | ||
Ratios to average net assets: | ||||
Expenses, before reimbursements | 4.88 | %E | ||
Expenses, net of reimbursements | 1.17 | %E | ||
Net investment (loss), before expense reimbursements | (3.54 | )%E | ||
Net investment income, net of reimbursements | 0.17 | %E | ||
Portfolio turnover rate | 9 | %F | ||
| A | Commencement of operations. |
| B | Amount represents less than $0.01 per share. |
| C | Based on net asset value, which does not reflect the sales charge, redemption fee, or contingent deferred sales charge, if applicable. May include adjustments in accordance with U.S. GAAP and as such, the net asset value for reporting purposes and the returns based upon those net asset values may differ from the net asset value and returns for shareholder transactions. |
| D | Not annualized. |
| E | Annualized. |
| F | Portfolio turnover rate is for the period from September 12, 2017 through June 30, 2018 and is not annualized. |
See accompanying notes
34
American Beacon Shapiro SMID Cap Equity FundSM
Financial Highlights
(For a share outstanding throughout the period)
| Institutional Class | ||||
| September 12, 2017A to June 30, 2018 | ||||
Net asset value, beginning of period | $ | 10.00 | ||
|
| |||
Income from investment operations: | ||||
Net investment income | 0.01 | |||
Net gains on investments (both realized and unrealized) | 1.38 | |||
|
| |||
Total income from investment operations | 1.39 | |||
|
| |||
Net asset value, end of period | $ | 11.39 | ||
|
| |||
Total returnB | 13.90 | %C | ||
|
| |||
Ratios and supplemental data: | ||||
Net assets, end of period | $ | 5,124,948 | ||
Ratios to average net assets: | ||||
Expenses, before reimbursements | 4.32 | %D | ||
Expenses, net of reimbursements | 0.89 | %D | ||
Net investment (loss), before expense reimbursements | (3.34 | )%D | ||
Net investment income, net of reimbursements | 0.08 | %D | ||
Portfolio turnover rate | 22 | %E | ||
| A | Commencement of operations. |
| B | Based on net asset value, which does not reflect the sales charge, redemption fee, or contingent deferred sales charge, if applicable. May include adjustments in accordance with U.S. GAAP and as such, the net asset value for reporting purposes and the returns based upon those net asset values may differ from the net asset value and returns for shareholder transactions. |
| C | Not annualized. |
| D | Annualized. |
| E | Portfolio turnover rate is for the period from September 12, 2017 through June 30, 2018 and is not annualized. |
See accompanying notes
35
American Beacon Shapiro SMID Cap Equity FundSM
Financial Highlights
(For a share outstanding throughout the period)
| Y Class | ||||
| September 12, 2017A to June 30, 2018 | ||||
Net asset value, beginning of period | $ | 10.00 | ||
|
| |||
Income from investment operations: | ||||
Net investment income | 0.01 | |||
Net gains on investments (both realized and unrealized) | 1.38 | |||
|
| |||
Total income from investment operations | 1.39 | |||
|
| |||
Net asset value, end of period | $ | 11.39 | ||
|
| |||
Total returnB | 13.90 | %C | ||
|
| |||
Ratios and supplemental data: | ||||
Net assets, end of period | $ | 215,795 | ||
Ratios to average net assets: | ||||
Expenses, before reimbursements | 5.69 | %D | ||
Expenses, net of reimbursements | 0.99 | %D | ||
Net investment (loss), before expense reimbursements | (4.47 | )%D | ||
Net investment income, net of reimbursements | 0.22 | %D | ||
Portfolio turnover rate | 22 | %E | ||
| A | Commencement of operations. |
| B | Based on net asset value, which does not reflect the sales charge, redemption fee, or contingent deferred sales charge, if applicable. May include adjustments in accordance with U.S. GAAP and as such, the net asset value for reporting purposes and the returns based upon those net asset values may differ from the net asset value and returns for shareholder transactions. |
| C | Not annualized. |
| D | Annualized. |
| E | Portfolio turnover rate is for the period from September 12, 2017 through June 30, 2018 and is not annualized. |
See accompanying notes
36
American Beacon Shapiro SMID Cap Equity FundSM
Financial Highlights
(For a share outstanding throughout the period)
| Investor Class | ||||
| September 12, 2017A to June 30, 2018 | ||||
Net asset value, beginning of period | $ | 10.00 | ||
|
| |||
Income (loss) from investment operations: | ||||
Net investment (loss) | (0.01 | ) | ||
Net gains on investments (both realized and unrealized) | 1.37 | |||
|
| |||
Total income from investment operations | 1.36 | |||
|
| |||
Net asset value, end of period | $ | 11.36 | ||
|
| |||
Total returnB | 13.60 | %C | ||
|
| |||
Ratios and supplemental data: | ||||
Net assets, end of period | $ | 352,882 | ||
Ratios to average net assets: | ||||
Expenses, before reimbursements | 6.12 | %D | ||
Expenses, net of reimbursements | 1.27 | %D | ||
Net investment (loss), before expense reimbursements | (5.09 | )%D | ||
Net investment (loss), net of reimbursements | (0.24 | )%D | ||
Portfolio turnover rate | 22 | %E | ||
| A | Commencement of operations. |
| B | Based on net asset value, which does not reflect the sales charge, redemption fee, or contingent deferred sales charge, if applicable. May include adjustments in accordance with U.S. GAAP and as such, the net asset value for reporting purposes and the returns based upon those net asset values may differ from the net asset value and returns for shareholder transactions. |
| C | Not annualized. |
| D | Annualized. |
| E | Portfolio turnover rate is for the period from September 12, 2017 through June 30, 2018 and is not annualized. |
See accompanying notes
37
American Beacon FundsSM
June 30, 2018 (Unaudited)
Certain tax information regarding the Funds are required to be provided to shareholders based upon the Funds’ income and distributions for the taxable year ended June 30, 2018. The information and distributions reported herein may differ from information and distributions taxable to the shareholders for the calendar year ended December 31, 2017.
The Funds designated the following items with regard to distributions paid during the fiscal year ended June 30, 2018. All designations are based on financial information available as of this annual report and, accordingly, are subject to change. For each item, it is the intention of the Funds to designate the maximum amount permitted under the Internal Revenue Code of 1986, as amended, and the regulations there under.
Corporate Dividends-Received Deduction:
Shapiro Equity Opportunities | 100.00 | % | ||
Shapiro SMID Cap Equity | N/A |
Qualified Dividend Income:
Shapiro Equity Opportunities | 100.00 | % | ||
Shapiro SMID Cap Equity | N/A |
Long-Term Capital Gain Distributions:
Shapiro Equity Opportunities | $ | - | ||
Shapiro SMID Cap Equity | - |
Short-Term Capital Gain Distributions:
Shapiro Equity Opportunities | $ | 301 | ||
Shapiro SMID Cap Equity | - |
Shareholders will receive notification in January 2019 of the applicable tax information necessary to prepare their 2018 income tax returns.
38
Trustees and Officers of the American Beacon FundsSM (Unaudited)
The Trustees and officers of the American Beacon Funds (the “Trust”) are listed below, together with their principal occupations during the past five years. The address of each person listed below is 220 Las Colinas Boulevard East, Suite 1200, Irving, Texas 75039. Each Trustee oversees thirty-six funds in the fund complex that includes the Trust, the American Beacon Select Funds, the American Beacon Institutional Funds Trust, the American Beacon Sound Point Enhanced Income Fund, and the American Beacon Apollo Total Return Fund. The Trust’s Statement of Additional Information contains additional information about the Trustees and is available without charge by calling 1-800-658-5811.
Name, Age and Address | Position, Term of Office and Length of Time Served with the Trust | Principal Occupation(s) During Past 5 Years and Current Directorships | ||
| INTERESTED TRUSTEES | Term | |||
| Lifetime of Trust until removal, resignation or retirement* | ||||
| Alan D. Feld** (81) | Trustee since 1996 | Partner in the law firm of Akin, Gump, Strauss, Hauer & Feld, LLP (law firm) (1960-Present); Trustee, American Beacon Mileage Funds (1996-2012); Trustee, American Beacon Select Funds (1999-Present); Trustee, American Beacon Master Trust (1996-2012); Trustee, American Beacon Institutional Funds Trust (2017-Present); Trustee, American Beacon Sound Point Enhanced Income Fund (2018-Present); Trustee, American Beacon Apollo Total Return Fund (2018-Present). | ||
| NON-INTERESTED TRUSTEES | Term | |||
| Lifetime of Trust until removal, resignation or retirement* | ||||
| Gilbert G. Alvarado (48) | Trustee since 2015 | Director, Kura MD, Inc. (local telehealth organization) (2015-present); Vice President & CFO, Sierra Health Foundation (health conversion private foundation) (2006-Present); Vice President & CFO, Sierra Health Foundation: Center for Health Program Management (California public benefit corporation) (2012-Present); Director, Innovative North State (2012-2015); Director, Sacramento Regional Technology Alliance (2011-2016); Director, Women’s Empowerment (2009-2014); Director, Valley Healthcare Staffing (2017-present); Trustee, American Beacon Select Funds (2015-Present); Trustee, American Beacon Institutional Funds Trust (2017-Present); Trustee, American Beacon Sound Point Enhanced Income Fund (2018-Present); Trustee, American Beacon Apollo Total Return Fund (2018-Present). | ||
| Joseph B. Armes (56) | Trustee since 2015 | Chairman & CEO, CSW Industrials f/k/a Capital Southwest Corporation (investment company) (2015-Present); Chairman of the Board of Capital Southwest Corporation, predecessor to CSW Industrials, Inc. (2014-present) (investment company); CEO, Capital Southwest Corporation (2013-2015); President & CEO, JBA Investment Partners (family investment vehicle) (2010-Present); Director and Chair of Audit Committee, RSP Permian (oil and gas producer) (2013-Present); Trustee, American Beacon Select Funds (2015-Present); Trustee, American Beacon Institutional Funds Trust (2017-Present); Trustee, American Beacon Sound Point Enhanced Income Fund (2018-Present); Trustee, American Beacon Apollo Total Return Fund (2018-Present). | ||
| Gerard J. Arpey (60) | Trustee since 2012 | Director, The Home Depot, Inc. (2015-Present); Partner, Emerald Creek Group (private equity firm) (2011-Present); Director, S.C. Johnson & Son, Inc. (privately held company) (2008-present); Trustee, American Beacon Select Funds (2012-Present); Trustee, American Beacon Institutional Funds Trust (2017-Present); Trustee, American Beacon Sound Point Enhanced Income Fund (2018-Present); Trustee, American Beacon Apollo Total Return Fund (2018-Present). | ||
39
Trustees and Officers of the American Beacon FundsSM (Unaudited)
Name, Age and Address | Position, Term of Office and Length of Time Served with the Trust | Principal Occupation(s) During Past 5 Years and Current Directorships | ||
| NON-INTERESTED TRUSTEES (CONT.) | Term | |||
| Lifetime of Trust until removal, resignation or retirement* | ||||
| Brenda A. Cline (57) | Trustee since 2004 | Chief Financial Officer, Treasurer and Secretary, Kimbell Art Foundation (1993-Present); Director, Tyler Technologies, Inc. (public sector software solutions company) (2014-Present); Director, Range Resources Corporation (oil and natural gas company) (2015-Present); Trustee, Cushing Closed-End Funds (2017-Present); Trustee, American Beacon Mileage Funds (2004-2012); Trustee, American Beacon Select Funds (2004-Present); Trustee, American Beacon Master Trust (2004-2012); Trustee, American Beacon Institutional Funds Trust (2017-Present); Trustee, American Beacon Sound Point Enhanced Income Fund (2018-Present); Trustee, American Beacon Apollo Total Return Fund (2018-Present). | ||
| Eugene J. Duffy (63) | Trustee since 2008 | Managing Director, Global Investment Management Distribution, Mesirow Financial (2016-Present); Managing Director, Institutional Services, Intercontinental Real Estate Corporation (2014-Present); Principal and Executive Vice President, Paradigm Asset Management (1994-2014); Director, Sunrise Bank of Atlanta (2008-2013); Trustee, American Beacon Mileage Funds (2008-2012); Trustee, American Beacon Select Funds (2008-Present); Trustee, American Beacon Master Trust (2008-2012); Trustee, American Beacon Institutional Funds Trust (2017-Present); Trustee, American Beacon Sound Point Enhanced Income Fund (2018-Present); Trustee, American Beacon Apollo Total Return Fund (2018-Present). | ||
| Claudia A. Holz*** (60) | Trustee since 2018 | Partner, KPMG LLP (1990-2017); Trustee, American Beacon Select Funds (2018-Present); Trustee, American Beacon Institutional Funds Trust (2018-Present); Trustee, American Beacon Sound Point Enhanced Income Fund (2018-Present); Trustee, American Beacon Apollo Total Return Fund (2018-Present). | ||
| Douglas A. Lindgren**** (56) | Trustee since 2018 | CEO North America, Carne Global Financial Services (2016-2017); Managing Director, IPS Investment Management and Global Head, Content Management, UBS Wealth Management (2010-2016); Managing Director, P&S Hedge Funds, UBS Wealth Management (2008-2010); Managing Director, Head of Alternative Investments, UBS Financial Services, Inc. (2005-2008); Trustee, American Beacon Select Funds (2018-Present); Trustee, American Beacon Institutional Funds Trust (2018-Present); Trustee, American Beacon Sound Point Enhanced Income Fund (2018-Present); Trustee, American Beacon Apollo Total Return Fund (2018-Present). | ||
| Richard A. Massman (74) | Trustee since 2004 Chairman since 2008 | Consultant and General Counsel Emeritus, Hunt Consolidated, Inc. (holding company engaged in oil and gas exploration and production, refining, real estate, farming, ranching and venture capital activities) (2009-Present); Trustee, American Beacon Mileage Funds (2004-2012); Trustee, American Beacon Select Funds (2004-Present); Trustee, American Beacon Master Trust (2004-2012); Trustee, American Beacon Institutional Funds Trust (2017-Present); Trustee, American Beacon Sound Point Enhanced Income Fund (2018-Present); Trustee, American Beacon Apollo Total Return Fund (2018-Present). | ||
| Barbara J. McKenna, CFA (55) | Trustee since 2012 | Managing Principal, Longfellow Investment Management Company (2005-Present); Trustee, American Beacon Select Funds (2012-Present); Trustee, American Beacon Institutional Funds Trust (2017-Present); Trustee, American Beacon Sound Point Enhanced Income Fund (2018-Present); Trustee, American Beacon Apollo Total Return Fund (2018-Present). | ||
40
Trustees and Officers of the American Beacon FundsSM (Unaudited)
Name, Age and Address | Position, Term of Office and Length of Time Served with the Trust | Principal Occupation(s) During Past 5 Years and Current Directorships | ||
| NON-INTERESTED TRUSTEES (CONT.) | Term | |||
| Lifetime of Trust until removal, resignation or retirement* | ||||
| R. Gerald Turner (72) | Trustee since 2001 | President, Southern Methodist University (1995-Present); Director, J.C. Penney Company, Inc. (1996-Present); Director, Kronus Worldwide Inc. (chemical manufacturing) (2003-Present); Trustee, American Beacon Mileage Funds (2001-2012); Trustee, American Beacon Select Funds (2001-Present); Trustee, American Beacon Master Trust (2001-2012); Trustee, American Beacon Institutional Funds Trust (2017-Present); Trustee, American Beacon Sound Point Enhanced Income Fund (2018-Present); Trustee, American Beacon Apollo Total Return Fund (2018-Present). | ||
| OFFICERS | Term | |||
| One Year | ||||
| Gene L. Needles, Jr. (63) | President since 2009 | CEO and Director (2009-Present), and Chairman (2018-Present), American Beacon Advisors, Inc.; President, American Beacon Advisors (2009-2018); Chairman and CEO, Resolute Investment Managers, Inc. (2015-Present); Director, Resolute Acquisition, Inc. (2015-Present); President (2015-2018), Director, Resolute Topco, Inc. (2015-Present), President (2015-2018), CEO (2015-Present), and Chairman (2018-Present), Resolute Investment Holdings, LLC; President, CEO and Director, Lighthouse Holdings, Inc. (2009-2015); President and CEO, Lighthouse Holdings Parent, Inc. (2009-2015); Manager, President and CEO, American Private Equity Management, LLC (2012-Present); President, American Beacon Cayman Managed Futures Strategy Fund, Ltd. (2014-Present); Director, Chairman, President and CEO, Alpha Quant Advisors, LLC (2016-Present); Director, ARK Investment Management LLC (2016-Present); Director, Shapiro Capital Management LLC (2017-Present); Director and Vice President, American Beacon Cayman Transformational Innovation Company, LTD., (2017-Present); Vice President, American Beacon Delaware Transformational Innovation Corporation (2017-Present); Executive Vice President and Chief Operating Officer, Continuous Capital, LLC (2018-Present); Member, Investment Advisory Committee, Employees Retirement System of Texas (2017-Present); Trustee, American Beacon NextShares Trust (2015-Present); President, American Beacon Select Funds (2009-Present); President, American Beacon Mileage Funds (2009-2012); President, American Beacon Master Trust (2009-2012); President, American Beacon Institutional Funds Trust (2017-Present); President, American Beacon Sound Point Enhanced Income Fund (2018-Present); President, American Beacon Apollo Total Return Fund (2018-Present). | ||
| Rosemary K. Behan (59) | VP, Secretary and Chief Legal Officer since 2006 | Vice President and Secretary, American Beacon Advisors, Inc. (2006-Present); Secretary, Resolute Investment Holdings, LLC (2015-Present) Secretary, Resolute Investment Managers, Inc. (2015-Present); Secretary, Resolute Topco, Inc. (2015-Present); Secretary, Resolute Acquisition, Inc. (2015-Present); Secretary, Lighthouse Holdings, Inc. (2008-2015); Secretary, Lighthouse Holdings Parent, Inc. (2008-2015); Secretary, American Private Equity Management, LLC (2008-Present); Secretary, American Beacon Cayman Managed Futures Strategy Fund, Ltd. (2014-Present); Secretary, Alpha Quant Advisors, LLC (2016-Present); Secretary, American Beacon Cayman Transformational Innovation Company, Ltd. (2017-Present); Secretary, American Beacon Delaware Transformational Innovation Corporation (2017-Present); Secretary, Resolute Investment Distributors, Inc. (2017-Present); Vice President and Secretary, Continuous Capital, LLC (2018-Present); Chief Legal Officer, Vice President and Secretary, American Beacon Select Funds (2006-Present); Chief Legal Officer, Vice President and Secretary, American Beacon Mileage Funds (2006-2012); Chief Legal Officer, Vice President and Secretary, American Beacon Master Trust (2006-2012); Chief Legal Officer, Vice President and Secretary, American Beacon Institutional Funds Trust (2017-Present); Vice Chief Legal Officer, Vice President and Secretary, American Beacon Sound Point Enhanced Income Fund (2018-Present); Chief Legal Officer, Vice President and Secretary American Beacon Apollo Total Return Fund (2018-Present). | ||
41
Trustees and Officers of the American Beacon FundsSM (Unaudited)
Name, Age and Address | Position, Term of Office and Length of Time Served with the Trust | Principal Occupation(s) During Past 5 Years and Current Directorships | ||
| OFFICERS (CONT.) | Term | |||
| One Year | ||||
| Brian E. Brett (58) | VP since 2004 | Senior Vice President (2012-Present) and Vice President (2004-2012), American Beacon Advisors, Inc.; Vice President, Resolute Investment Distributors, Inc. (2017-Present); Vice President, American Beacon Select Funds (2004-Present); Vice President, American Beacon Mileage Funds (2004-2012); Vice President, American Beacon Master Trust (2004-2012); Vice President, American Beacon Institutional Funds Trust (2017-Present); Vice President American Beacon Sound Point Enhanced Income Fund (2018-Present); Vice President American Beacon Apollo Total Return Fund (2018-Present). | ||
| Paul B. Cavazos (49) | VP since 2016 | Chief Investment Officer and Senior Vice President, American Beacon Advisors, Inc. (2016-Present); Chief Investment Officer and Assistant Treasurer, DTE Energy (2007-2016); Vice President, American Beacon Select Funds (2016-Present); Vice President, American Beacon Institutional Funds Trust (2017-Present); Vice President American Beacon Sound Point Enhanced Income Fund (2018-Present); Vice President American Beacon Apollo Total Return Fund (2018-Present). | ||
| Erica Duncan (47) | VP Since 2011 | Vice President, American Beacon Advisors, Inc. (2011-Present); Vice President, American Beacon Select Funds (2011-Present); Vice President, American Beacon Mileage Funds (2011-2012); Vice President, American Beacon Master Trust (2011-2012); Vice President, American Beacon Institutional Funds Trust (2017-Present); Vice President American Beacon Sound Point Enhanced Income Fund (2018-Present); Vice President American Beacon Apollo Total Return Fund (2018-Present).. | ||
| Melinda G. Heika (57) | Treasurer since 2010 | Treasurer, American Beacon Advisors, Inc. (2010-Present); Resolute Investment Managers, Inc. (2015-Present); Treasurer, Resolute Acquisition, Inc. (2015-Present); Treasurer, Resolute Topco, Inc. (2015-Present); Treasurer, Resolute Investment Holdings, LLC. (2015-Present); Treasurer, Lighthouse Holdings, Inc. (2010-2015); Treasurer, Lighthouse Holdings Parent Inc., (2010-2015); Treasurer, American Private Equity Management, LLC (2012-Present); Director and Treasurer, American Beacon Cayman Managed Futures Strategy Fund, Ltd. (2014-Present); Treasurer, Alpha Quant Advisors, LLC (2016-Present); Treasurer, American Beacon Cayman Transformational Innovation, Ltd. (2017-Present); Treasurer, American Beacon Delaware Transformational Innovation Corporation (2017-Present); Treasurer, Resolute Investment Distributors, Inc. (2017-2017); Treasurer and Chief Financial Officer, Continuous Capital, LLC (2018-Present); Treasurer, American Beacon Select Funds (2010-Present); Treasurer, American Beacon Mileage Funds (2010-2012); Treasurer, American Beacon Master Trust (2010-2012); Treasurer, American Beacon Institutional Funds Trust (2017-Present); Treasurer, American Beacon Sound Point Enhanced Income Fund (2018-Present); Treasurer, American Beacon Apollo Total Return Fund (2018-Present). | ||
| Terri L. McKinney (54) | VP since 2010 | Vice President (2009-Present) and Managing Director (2003-2009), American Beacon Advisors, Inc.; Vice President, Resolute Investment Managers, Inc. (2017-Present); Vice President, Alpha Quant Advisors, LLC (2016-Present); Vice President, Resolute Investment Managers, Inc. (2017-Present); Vice President, Continuous Capital, LLC (2018-Present); Vice President, American Beacon Select Funds (2010-Present); Vice President, American Beacon Mileage Funds (2010-2012); Vice President, American Beacon Master Trust (2010-2012); Vice President, American Beacon Institutional Funds Trust (2017-Present); Vice President, American Beacon Sound Point Enhanced Income Fund (2018-Present); Vice President, American Beacon Apollo Total Return Fund (2018-Present). | ||
42
Trustees and Officers of the American Beacon FundsSM (Unaudited)
Name, Age and Address | Position, Term of Office and Length of Time Served with the Trust | Principal Occupation(s) During Past 5 Years and Current Directorships | ||
| OFFICERS (CONT.) | Term | |||
| One Year | ||||
| Jeffrey K. Ringdahl (43) | VP since 2010 | Chief Operating Officer (2010-Present), Vice President (2010-2013), Senior Vice President (2013-Present), Director (2015-Present), and President (2018-Present), American Beacon Advisors, Inc.; Vice President (2012-Present) and Manager (2015-Present), American Private Equity Management, LLC; Senior Vice President, Lighthouse Holdings, Inc. (2013-2015); Senior Vice President, Lighthouse Holdings Parent, Inc. (2013-2015); Director and Vice President, American Beacon Cayman Managed Futures Strategy Fund, Ltd. (2014-Present); Trustee, American Beacon NextShares Trust (2015-Present); Director (2015-Present), Senior Vice Present(2015-2018), and President (2018-Present), Resolute Investment Holdings, LLC; Director (2015-Present), Senior Vice President (2015-2018) and President (2018-Present), Resolute Topco, Inc.; Director (2015-Present), Senior Vice President (2015-Present), and President (2018-Present), Resolute Acquisition, Inc.; Director (2015-Present), Senior Vice President (2015-2018), and President (2018-Present), Resolute Investment Managers, Inc.; Director, Executive Vice President and Chief Operating Officer, Alpha Quant Advisors, LLC (2016-Present); Director (2017-Present), Executive Vice President (2017-2018), and President (2018-Present), Resolute Investment Services, Inc.; Director and Executive Vice President, Resolute Investment Distributors, Inc. (2017-Present); Director, Shapiro Capital Management, LLC (2017-Present); Director and Vice President, American Beacon Cayman Transformational Innovation Company, LTD., (2017-Present); Vice President, American Beacon Delaware Transformational Innovation Corporation (2017-Present); Executive Vice President and Chief Operating Officer, Continuous Capital, LLC (2018-Present); Vice President, American Beacon Select Funds (2010-Present); Vice President, American Beacon Institutional Funds Trust (2017-Present); Vice President, American Beacon Sound Point Enhanced Income Fund (2018-Present); Vice President, American Beacon Apollo Total Return Fund (2018-Present) | ||
| Samuel J. Silver (55) | VP Since 2011 | Vice President, American Beacon Advisors, Inc. (2011-Present); Vice President, American Beacon Select Funds (2011-Present); Vice President, American Beacon Mileage Funds (2011-2012); Vice President, American Beacon Master Trust (2011-2012); American Beacon Institutional Funds Trust (2011-Present); Vice President, American Beacon Sound Point Enhanced Income Fund (2018-Present); Vice President, American Beacon Apollo Total Return Fund (2018-Present). | ||
| Christina E. Sears (46) | Chief Compliance Officer since 2004 and Asst. Secretary since 1999 | Chief Compliance Officer, American Beacon Advisors, Inc. (2004-Present); Chief Compliance Officer, American Private Equity Management, LLC (2012-Present); Chief Compliance Officer and Vice President, Alpha Quant Advisors, LLC (2016-Present); Vice President, Resolute Investment Managers, Inc. (2017-Present); Vice President, Continuous Capital, LLC (2018-Present); Chief Compliance Officer (2004-Present) and Assistant Secretary (1999-Present), American Beacon Select Funds; Chief Compliance Officer (2004-2012) and Assistant Secretary (1999-2012), American Beacon Mileage Funds; Chief Compliance Officer (2004-2012) and Assistant Secretary (1999-2012), American Beacon Master Trust; Chief Compliance Officer and Assistant Secretary, American Beacon Institutional Funds Trust (2017-Present); Chief Compliance Officer and Assistant Secretary, American Beacon Sound Point Enhanced Income Fund (2018-Present); Chief Compliance Officer and Assistant Secretary, American Beacon Apollo Total Return Fund (2018-Present). | ||
43
Trustees and Officers of the American Beacon FundsSM (Unaudited)
Name, Age and Address | Position, Term of Office and Length of Time Served with the Trust | Principal Occupation(s) During Past 5 Years and Current Directorships | ||
| OFFICERS (CONT.) | Term | |||
| One Year | ||||
| Sonia L. Bates (61) | Asst. Treasurer since 2011 | Assistant Treasurer, American Beacon Advisors, Inc. (2011-Present); Assistant Treasurer, Resolute Investment Managers, Inc. (2015-Present); Assistant Treasurer, Resolute Acquisition, Inc. (2015-Present); Assistant. Treasurer, Resolute Topco, Inc. (2015-Present); Assistant Treasurer, Resolute Investment Holdings, LLC.; Assistant Treasurer, Lighthouse Holdings, Inc. (2011-2015); Assistant Treasurer, Lighthouse Holdings Parent Inc. (2011-2015); Assistant Treasurer, American Private Equity Management, LLC (2012-Present); Assistant Treasurer, American Beacon Cayman Transformational Innovation Company, Ltd. (2017-Present); Assistant Treasurer, American Beacon Select Funds (2011-Present); Assistant Treasurer American Beacon Mileage Funds (2011-2012); Assistant Treasurer, American Beacon Master Trust (2011-2012); Assistant Treasurer, American Beacon Institutional Funds Trust (2017-Present); Assistant Treasurer, American Beacon Sound Point Enhanced Income Fund (2018-Present); Assistant Treasurer, American Beacon Apollo Total Return Fund (2018-Present). | ||
| Shelley D. Abrahams (43) | Assistant Secretary since 2008 | Assistant Secretary, American Beacon Advisors, Inc. (2008-Present); Assistant Secretary, American Beacon Select Funds (2008-Present); Assistant Secretary, American Beacon Mileage Funds (2008-2012); Assistant Secretary, American Beacon Master Trust (2008-2012); Assistant Secretary, American Beacon Institutional Funds Trust (2017-Present); Assistant Secretary, American Beacon Sound Point Enhanced Income Fund (2018-Present); Assistant Secretary, American Beacon Apollo Total Return Fund (2018-Present). | ||
| Rebecca L. Harris (51) | Assistant Secretary since 2010 | Vice President, American Beacon Advisors, Inc. (2016-Present); Vice President, Resolute Investment Managers, Inc. (2017-Present); Vice President, Alpha Quant Advisors, LLC (2016-Present); Vice President, Continuous Capital, LLC (2018-Present); Assistant Secretary, American Beacon Select Funds (2010-Present); Assistant Secretary, American Beacon Mileage Funds (2010-2012); Assistant Secretary, American Beacon Master Trust (2010-2012); Assistant Secretary, American Beacon Institutional Funds Trust (2017-Present); Assistant Secretary, American Beacon Sound Point Enhanced Income Fund (2018-Present); Assistant Secretary, American Beacon Apollo Total Return Fund (2018-Present). | ||
| Diana N. Lai (42) | Assistant Secretary since 2012 | Assistant Secretary, American Beacon Advisors, Inc. (2012-Present); Assistant Secretary, American Beacon Cayman Transformational Innovation Company, Ltd. (2017-Present); Assistant Secretary, American Beacon Select Funds (2012-Present); Assistant Secretary, American Beacon Institutional Funds Trust (2017-Present); Assistant Secretary, American Beacon Sound Point Enhanced Income Fund (2018-Present); Assistant Secretary, American Beacon Apollo Total Return Fund (2018-Present). | ||
| Teresa A. Oxford (59) | Assistant Secretary since 2015 | Assistant Secretary, American Beacon Advisors, Inc. (2015-Present); Assistant Secretary, Alpha Quant Advisors, LLC (2016-Present); Assistant Secretary, American Beacon Select Funds (2015-Present); Assistant Secretary, American Beacon Institutional Funds Trust (2017-Present); Assistant Secretary, American Beacon Sound Point Enhanced Income Fund (2018-Present); Assistant Secretary, American Beacon Apollo Total Return Fund (2018-Present). | ||
* As of 11/12/2014, the Board adopted a retirement plan that requires Trustees to retire no later than the last day of the calendar year in which they reach the age of 75.
** Mr. Feld is deemed to be an “interested person” of the Trusts, as defined by the 1940 Act. Mr. Feld’s law firm of Akin, Gump, Strauss, Hauer & Feld LLP has provided legal services within the past two fiscal years to one or more of the Trust’s sub-advisors.
*** Claudia A. Holz became a new Trustee to each of the Trusts on 4/1/2018.
**** Douglas A. Lindren became a new Trustee to each of the Trusts on 1/1/2018.
44
American Beacon FundsSM
June 30, 2018 (Unaudited)
The American Beacon Funds recognize and respect the privacy of our shareholders. We are providing this notice to you so you will understand how shareholder information may be collected and used.
We may collect nonpublic personal information about you from one or more of the following sources:
| • | information we receive from you on applications or other forms; |
| • | information about your transactions with us or our service providers; and |
| • | information we receive from third parties. |
We do not disclose any nonpublic personal information about our customers or former customers to anyone, except as permitted by law.
We restrict access to your nonpublic personal information to those employees or service providers who need to know that information to provide products or services to you. To ensure the confidentiality of your nonpublic personal information, we maintain safeguards that comply with federal standards.
45
This page intentionally left blank.
46
This page intentionally left blank.
47
This page intentionally left blank.
48

Delivery of Documents
eDelivery is NOW AVAILABLE - Stop traditional mail delivery and receive your
shareholder reports and summary prospectus on-line. Sign up at
www.americanbeaconfunds.com
If you invest in the Fund through a financial institution, you may be able to receive the Fund’s regulatory mailings, such as the Prospectus, Annual Report and Semi-Annual Report, by e-mail. If you are interested in this option, please go to www.icsdelivery.com and search for your financial institution’s name or contact your financial institution directly.
To obtain more information about the Fund:
 |  | |
| By E-mail: | On the Internet: | |
american_beacon.funds@ambeacon.com | Visit our website at www.americanbeaconfunds.com | |
By Telephone: Call (800) 658-5811 |
By Mail: American Beacon Funds P.O. Box 219643 Kansas City, MO 64121-9643 | |
| Availability of Quarterly Portfolio Schedules | Availability of Proxy Voting Policy and Records | |
| In addition to the Schedule of Investments provided in each semi-annual and annual report, the Fund files a complete schedule of its portfolio holdings with the Securities and Exchange Commission (“SEC”) on Form N-Q as of the first and third fiscal quarters. The Fund’s Forms N-Q are available on the SEC’s website at www.sec.gov. The Forms N-Q may also be reviewed and copied at the SEC’s Public Reference Section, 100 F Street, NE, Washington, D.C. 20549-2736. Information regarding the operation of the SEC’s Public Reference Room may be obtained by calling (800)-SEC-0330. A complete schedule of the Fund’s portfolio holdings is also available at www.americanbeaconfunds.com approximately sixty days after the end of each quarter. | A description of the policies and procedures the Fund uses to determine how to vote proxies relating to portfolio securities is available in the Fund’s Statement of Additional Information, is available free of charge on the Fund’s website www.americanbeaconfunds.com and by calling 1-800-967-9009 or by accessing the SEC’s website at www.sec.gov. The Fund’s proxy voting record for the most recent year ended June 30 is filed annually with the SEC on Form N-PX. The Fund’s Forms N-PX are available on the SEC’s website at www.sec.gov. The Fund’s proxy voting record may also be obtained by calling 1-800-967-9009. | |


Fund Service Providers:
CUSTODIAN State Street Bank and Trust Boston, Massachusetts | TRANSFER AGENT DST Asset Manager Solutions, Inc. Quincy, Massachusetts | INDEPENDENT REGISTERED PUBLIC ACCOUNTING FIRM PricewaterhouseCoopers LLP Boston, Massachusetts | DISTRIBUTOR Resolute Investment Distributors, Inc. Irving, Texas |
This report is prepared for shareholders of the American Beacon Funds and may be distributed to others only if preceded or accompanied by a current Prospectus or Summary Prospectus.
American Beacon Funds, American Beacon Shapiro Equity Opportunities Fund and Shapiro SMID Cap Equity Fund are service marks of American Beacon Advisors, Inc.
AR 6/18
| ITEM 2. | CODE OF ETHICS. |
The Trust adopted a code of ethics that applies to its principal executive and financial officers (the “Code”). The Trust amended its code March 24, 2017 to disclose the addition of the Institutional Funds Trust, disclose a change in the Principal Financial Officer and disclosure of conflicts due to Principal Officers serving in positions with affiliates, which also serve as sub-advisors. The Trust did not grant any waivers to the provisions of the Code during the period covered by the shareholder reports presented in Item 1. The Code is filed herewith as Exhibit 99.CODE ETH.
| ITEM 3. | AUDIT COMMITTEE FINANCIAL EXPERT. |
The Trust’s Board of Trustees has determined that Ms. Brenda A. Cline and Gilbert G. Alvarado, members of the Trust’s Audit and Compliance Committee, qualify as “audit committee financial experts” as defined in Form N-CSR. Ms. Cline and Mr. Alvarado are “independent” as defined in Form N-CSR.
| ITEM 4. | PRINCIPAL ACCOUNTANT FEES AND SERVICES. |
| (a) | ||||
Audit Fees | Fiscal Year Ended | |||
$170,850 | 6/30/2017 | |||
$332,188 | 6/30/2018 | |||
| (b) | ||||
Audit-Related Fees | Fiscal Year Ended | |||
$0 | 6/30/2017 | |||
$0 | 6/30/2018 | |||
| (c) | ||||
Tax Fees | Fiscal Year Ended | |||
$41,175 | 6/30/2017 | |||
$69,725 | 6/30/2018 | |||
| (d) | ||||
All Other Fees | Fiscal Year Ended | |||
$0 | 6/30/2017 | |||
$0 | 6/30/2018 | |||
e)(1) Pursuant to its charter, the Trust’s Audit and Compliance Committee shall have the following duties and powers pertaining to pre-approval of audit and non-audit services provided by the Trust’s principal accountant:
- to approve, prior to appointment, the engagement of auditors to annually audit and provide their opinion on the Trusts’ financial statements, and, in connection therewith, reviewing and evaluating matters potentially affecting the independence and capabilities of the auditors;
- to approve, prior to appointment, the engagement of the auditors to provide non-audit services to the Trusts, an investment adviser to any series of the Trusts or any entity controlling, controlled by, or under common control with an investment adviser (“adviser affiliate”) that provides ongoing services to the Trusts, if the engagement relates directly to the operations and financial reporting of the Trusts;
- to consider whether the non-audit services provided by a Trust’s auditor to an investment adviser or any adviser affiliate that provides ongoing services to a series of the Trusts, which services were not pre-approved by the Committee, are compatible with maintaining the auditor’s independence;
- to review the arrangements for and scope of the annual audit and any special audits; and
- to review and approving the fees proposed to be charged to the Trusts by the auditors for each audit and non-audit service.
The Audit and Compliance Committee may delegate any portion of its authority, including the authority to grant pre-approvals of audit and permitted non-audit services, to a subcommittee of one or more members. Any decisions of the subcommittee to grant pre-approvals shall be presented to the full audit committee at its next regularly scheduled meeting.
(e)(2) None of the fees disclosed in paragraphs (b) through (d) above were approved by the audit committee pursuant to paragraph (c)(7)(i)(C) of Rule 2-01 of Regulation S-X.
(f) Not applicable.
(g)
Aggregate Non-Audit Fees for Services Rendered to the:
Registrant | Adviser | Adviser’s Affiliates Providing Ongoing Services to Registrant | Fiscal Year Ended | |||||||
| $ | 41,175 | N/A | N/A | 6/30/2017 | ||||||
| $ | 69,725 | N/A | N/A | 6/30/2018 | ||||||
(h) Not applicable.
| ITEM 5. | AUDIT COMMITTEE OF LISTED REGISTRANTS. |
Not applicable.
| ITEM 6. | SCHEDULE OF INVESTMENTS. |
The schedules of investments for each series of the Trust are included in the shareholder reports presented in Item 1.
| ITEM 7. | DISCLOSURE OF PROXY VOTING POLICIES AND PROCEDURES FOR CLOSED-END MANAGEMENT INVESTMENT COMPANIES. |
Not applicable.
| ITEM 8. | PORTFOLIO MANAGERS OF CLOSED-END MANAGEMENT INVESTMENT COMPANIES. |
Not applicable.
| ITEM 9. | PURCHASES OF EQUITY SECURITIES BY CLOSED-END MANAGEMENT INVESTMENT COMPANY AND AFFILIATED PURCHASERS. |
Not applicable.
| ITEM 10. | SUBMISSION OF MATTERS TO A VOTE OF SECURITY HOLDERS. |
The Trust has made no material changes to the procedures by which shareholders may recommend nominees to the Trust’s Board of Trustees since the Trust last disclosed such procedures in Schedule 14A.
| ITEM 11. | CONTROLS AND PROCEDURES. |
(a) Based upon an evaluation within 90 days of the filing date of this report, the principal executive and financial officers concluded that the disclosure controls and procedures of the Trust are effective.
(b) There were no changes in the Trust’s internal control over financial reporting during the second fiscal quarter of the period covered by this report that has materially affected, or is reasonably likely to materially affect, the Trust’s internal control over financial reporting.
| ITEM 12. | EXHIBITS. |
(a)(1) Filed herewith as EX-99.CODE ETH.
(a)(2) A separate certification for each principal executive officer and principal financial officer of the Trust as required by Rule 30a-2(a) under the Investment Company Act of 1940 is attached hereto as EX-99.CERT.
(a)(3) Not applicable.
(b) The certifications required by Rule 30a-2(b) under the Investment Company Act of 1940 are attached hereto as EX-99.906CERT.
SIGNATURES
Pursuant to the requirements of the Securities Exchange Act of 1934 and the Investment Company Act of 1940, the registrant has duly caused this report to be signed on its behalf by the undersigned, thereunto duly authorized.
(Registrant): American Beacon Funds
By /s/ Gene L. Needles, Jr. |
| Gene L. Needles, Jr. |
| President |
| American Beacon Funds |
Date: August 29, 2018
Pursuant to the requirements of the Securities Exchange Act of 1934 and the Investment Company Act of 1940, this report has been signed below by the following persons on behalf of the registrant and in the capacities and on the dates indicated.
By /s/ Gene L. Needles, Jr. |
| Gene L. Needles, Jr. |
| President |
| American Beacon Funds |
Date: August 29, 2018
By /s/ Melinda G. Heika |
| Melinda G. Heika |
| Treasurer |
| American Beacon Funds |
Date: August 29, 2018