UNITED STATES
SECURITIES AND EXCHANGE COMMISSION
Washington, D.C. 20549
FORMN-CSR
CERTIFIED SHAREHOLDER REPORT OF REGISTERED
MANAGEMENT INVESTMENT COMPANIES
Investment Company Act file number:811-4984
AMERICAN BEACON FUNDS
(Exact name of registrant as specified in charter)
220 East Las Colinas Boulevard, Suite 1200
Irving, Texas 75039
(Address of principal executive offices)-(Zip code)
GENE L. NEEDLES, JR., PRESIDENT
220 East Las Colinas Boulevard, Suite 1200
Irving, Texas 75039
(Name and address of agent for service)
Registrant’s telephone number, including area code: (817)391-6100
Date of fiscal year end: January 31, 2019
Date of reporting period: January 31, 2019
FormN-CSR is to be used by management investment companies to file reports with the Commission not later than 10 days after the transmission to stockholders of any report that is required to be transmitted to stockholders under Rule30e-1 under the Investment Company Act of 1940 (17 CFR270.30e-1). The Commission may use the information provided on FormN-CSR in its regulatory, disclosure review, inspection, and policymaking roles.
A registrant is required to disclose the information specified by FormN-CSR, and the Commission will make this information public. A registrant is not required to respond to the collection of information contained in FormN-CSR unless the Form displays a currently valid Office of Management and Budget (“OMB”) control number. Please direct comments concerning the accuracy of the information collection burden estimate and any suggestions for reducing the burden to Secretary, Securities and Exchange Commission, 450 Fifth Street, NW, Washington, DC 20549-0609. The OMB has reviewed this collection of information under the clearance requirements of 44 U.S.C. § 3507.
| ITEM 1. | REPORTS TO STOCKHOLDERS. |

About American Beacon Advisors
Since 1986, American Beacon Advisors has offered a variety of products and investment advisory services to numerous institutional and retail clients, including a variety of mutual funds, corporate cash management, and separate account management.
Our clients include defined benefit plans, defined contribution plans, foundations, endowments, corporations, financial planners, and other institutional investors. With American Beacon Advisors, you can put the experience of a multi-billion dollar asset management firm to work for your company.
Beginning on January 1, 2021, as permitted by regulations adopted by the Securities and Exchange Commission, paper copies of the Fund’s shareholder reports will no longer be sent by mail, unless you specifically request paper copies of the reports from the Fund or from your financial intermediary, such as a broker-dealer or bank. Instead, the reports will be made available on a website, and you will be notified by mail each time a report is posted and provided with a website link to access the report.
If you already elected to receive shareholder reports electronically, you will not be affected by this change and you need not take any action. You may elect to receive shareholder reports and other communications from the Fund or your financial intermediary electronically by going towww.americanbeaconfunds.com and clicking on “Quick Links” and then “Register for E-Delivery.”
You may elect to receive all future reports in paper free of charge. You can inform the Fund that you wish to continue receiving paper copies of your shareholder reports by calling 1-800-658-5811, option 1, or you may directly inform your financial intermediary of your wish. A notice that will be mailed to you each time a report is posted will also include instructions for informing the Fund that you wish to continue receiving paper copies of your shareholder reports. Your election to receive reports in paper will apply to all funds held with the American Beacon Funds Complex or your financial intermediary, as applicable.
ACADIAN EMERGING MARKETS MANAGED VOLATILITY FUND
Investing inforeign and emerging market securitiesmay involve heightened risk due to currency fluctuations and economic and political risks. Investing inlower volatility securitiesmay produce more modest gains than other stock funds as atrade-off for the potentially lower downside risk. The use offutures contractsfor cash management may subject the Fund to losing more money than invested. The Fund participates in asecurities lendingprogram. Please see the prospectus for a complete discussion of the Fund’s risks. There can be no assurances that the investment objectives of this Fund will be met.
SGA GLOBAL GROWTH FUND
Investing inforeign and emerging market securitiesmay involve heightened risk due to currency fluctuations and economic and political risks.Growth stockstypically are more volatile than value stocks; however, value stocks have a lower expected growth rate in earnings and sales. The use offutures contractsfor cash management may subject the Fund to losing more money than invested. The Fund participates in asecurities lendingprogram. Please see the prospectus for a complete discussion of the Fund’s risks. There can be no assurances that the investment objectives of this Fund will be met.
Any opinions herein, including forecasts, reflect our judgment as of the end of the reporting period and are subject to change. Each advisor’s strategies and each Fund’s portfolio composition will change depending on economic and market conditions. This report is not a complete analysis of market conditions, and, therefore, should not be relied upon as investment advice. Although economic and market information has been compiled from reliable sources, American Beacon Advisors, Inc. makes no representation as to the completeness or accuracy of the statements contained herein.
American Beacon Funds | January 31, 2019 |
| 1 | ||||
| 2 | ||||
| 9 | ||||
| 11 | ||||
Schedules of Investments: | ||||
American Beacon Acadian Emerging Markets Managed Volatility Fund | 12 | |||
| 20 | ||||
| 23 | ||||
| 26 | ||||
Financial Highlights: | ||||
American Beacon Acadian Emerging Markets Managed Volatility Fund | 49 | |||
| 54 | ||||
| 59 | ||||
| 60 | ||||
Disclosure Regarding the Approval of the Management and Investment Advisory Agreements | ||||
| 66 | ||||
| Back Cover | ||||
 | Dear Shareholders,
The market volatility of December 2018 – a month in which all major U.S. equity indexes declined and the year ended in negative territory – serves as a prime example of the importance of having a long-term investment perspective.
While long-term investing isn’t about identifying and anticipating the next big market move, it is about identifying the right investment products for riding out those moves. As a long-term investor, you should strive to accomplish the three Ds: direction, discipline and diversification.
u Direction: Achieving your long-term financial goals requires an |
| individualized plan of action. You may want your plan to provide some measure of protection against periods of geopolitical turmoil, economic uncertainty, market volatility and job insecurity. Your plan should be reviewed annually and be adjusted in the event your long-range needs change. |
| u | Discipline:Long-term, systematic participation in an investment portfolio requires your resolution to stay the course. Spending time in the market – rather than trying to time the market – may place you in a better position to reach your long-term financial goals. |
| u | Diversification: By investing in different types of investment categories and asset classes, you may be able to help mitigate financial risks across your investment portfolio. By allocating your investment portfolio according to your risk-tolerance level, you may be better positioned to weather storms and achieve your long-term financial goals. |
Since 1986, American Beacon has endeavored to provide investors with a disciplined approach to realizing long-term financial goals.As a manager of managers, we strive to provide investment products that may enable investors to participate during market upswings while potentially insulating against market downswings. Our approach is more than a concept. It’s the cornerstone of our culture. And we strive to apply it at every turn as we seek to provide a well-diversified line of investment products for your investment portfolio.
Many of thesub-advisors to our mutual funds pursue upside capture and/or downside protection using proprietary strategies. The investment teams behind our mutual funds seek to produce consistent, long-term results rather than focus only on short-term movements in the markets. In managing our investment products, we emphasize identifying opportunities that offer the potential for long-term rewards.
Thank you for your continued interest in American Beacon. For additional information about our funds or to access your account information, please visit our website atwww.americanbeaconfunds.com.
Best Regards,

Gene L. Needles, Jr.
President
American Beacon Funds
1
Global Equity and Emerging Markets Overview
January 31, 2019 (Unaudited)
Global equity markets struggled during the12-month period ended January 31, 2019, as evidenced by the MSCI ACWI Index (down 7.5%).
In the U.S., the unemployment rate hit a49-year low of 3.7%, gross domestic product growth hit 3% for the first time since 2015 and corporate earnings growth surged. The Trump administration’s corporate tax cuts provided a temporary, but powerful, boost to the economy, convincing the data-dependent Federal Reserve (“the Fed”) to raise interest rates. However, by the end of the third quarter of 2018, the market was overcome by uncertainties, including how much higher the Fed was going to push interest rates, increasing trade tensions with China and whether the economic expansion was coming to an end. Despite these concerns, the Fed decided to hike interest rates in December 2018, which caused the market tosell-off rapidly. However, by the end of January, the Fed signaled a pause in rate hikes. In addition, the trade rhetoric from both President Donald Trump and China’s President Xi Jinping was starting to change with both sides seemingly more willing to compromise.
Within the S&P 500 Index, the top performing sectors were Utilities (up 11.1%) and Real Estate (up 10.4%). Lagging sectors included Materials (down 13.6%), Energy (down 12.3%) and Financials (down 11.1%). From a style standpoint, investors favored Growth stocks as they outperformed Value, as demonstrated by the Russell 3000 Growth Index (up 0.3%) versus the Russell 3000 Value Index (down 4.8%).
International developed markets also struggled during the period as the MSCI EAFE Index was down 12.5%. As concerns about economic growth mounted, the negative returns were broad-based: The MSCI Japan Index declined 11.6%, the MSCI Germany Index fell 21.7%, the MSCI Italy Index was down 20.0% and the MSCI United Kingdom Index was down 10.8%. In addition, the Brexit deadline of March 29, 2019, has been increasingly unsettling to markets as the U.K. has yet to come to an agreement with the European Union.
Finally, in the developing world, emerging markets had a difficult year as the combination of slowing growth and rising debt exacerbated concerns around the impact of President Trump’s tough trade policy on China. The MSCI Emerging Market Index ended the period down 14.2%. Notable market performance included the MSCI China Index (down 19.9%), the MSCI India Index (down 12.1%) and the MSCI Taiwan Index (down 13.9%).
2
American Beacon Acadian Emerging Markets Managed Volatility FundSM
Performance Overview
January 31, 2019 (Unaudited)
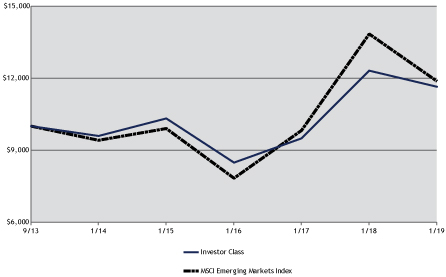
The Investor Class of the American Beacon Acadian Emerging Markets Managed Volatility Fund (the “Fund”) returned-5.45% for the twelve months ended January 31, 2019. The Fund outperformed the MSCI Emerging Markets Index (the “Index”) return of-14.24% for the period.
Comparison of Changes in Value of a $10,000 Investment for the period 9/27/2013 through 1/31/2019
| Total Returns for the Period ended January 31, 2019 |
| |||||||||||||||||||||||||||||||
Ticker | 1 Year | 3 Years | 5 Years | Since Inception | Value of $10,000 9/27/2013- 1/31/2019 | |||||||||||||||||||||||||||
Institutional Class (1,3) | ACDIX | (5.13 | )% | 11.56 | % | 4.34 | % | 3.25 | % | $ | 11,864 | |||||||||||||||||||||
Y Class (1,3) | ACDYX | (5.15 | )% | 11.49 | % | 4.24 | % | 3.16 | % | $ | 11,808 | |||||||||||||||||||||
Investor Class (1,3) | ACDPX | (5.45 | )% | 11.15 | % | 3.95 | % | 2.87 | % | $ | 11,636 | |||||||||||||||||||||
A without Sales Charge (1,3) | ACDAX | (5.52 | )% | 11.11 | % | 3.90 | % | 2.83 | % | $ | 11,608 | |||||||||||||||||||||
A with Sales Charge (1,3) | ACDAX | (10.93 | )% | 8.94 | % | 2.69 | % | 1.70 | % | $ | 10,941 | |||||||||||||||||||||
C without Sales Charge (1,3) | ACDCX | (6.19 | )% | 10.29 | % | 3.12 | % | 2.05 | % | $ | 11,143 | |||||||||||||||||||||
C with Sales Charge (1,3) | ACDCX | (7.19 | )% | 10.29 | % | 3.12 | % | 2.05 | % | $ | 11,143 | |||||||||||||||||||||
MSCI Emerging Markets Index (2) | (14.24 | )% | 14.89 | % | 4.77 | % | 3.26 | % | $ | 11,871 | ||||||||||||||||||||||
| 1. | Performance shown is historical and is not indicative of future returns. Investment returns and principal value will vary, and shares may be worth more or less at redemption than at original purchase. Performance shown is calculated based on the published end of day net asset values as of the date indicated and current performance may be lower or higher than the performance data quoted. To obtain performance as of the most recent month end, please visitwww.americanbeaconfunds.com or call1-800-967-9009. Fund performance in the table above does not reflect the deduction of taxes a shareholder would pay on distributions or the redemption of shares. Generally accepted accounting principles require adjustments to be made to the net assets of the Fund at period end for financial reporting purposes only, and as such, the total return based on the unadjusted net asset value per share may differ from the total return reported in the financial highlights. A portion of the fees charged to each Class of the Fund has been waived since inception. Performance prior to waiving fees was lower than the actual returns shown since inception. A Class shares have a maximum sales charge of 5.75%. The maximum contingent deferred sales charge for the C Class is 1.00% for shares redeemed within one year of the date of purchase. |
| 2. | The MSCI Emerging Markets Index is a market capitalization weighted index composed of companies that are representative of the market structure of developing countries in Latin America, Asia, Eastern Europe, the Middle East and Africa. One cannot directly invest in an index. |
3
American Beacon Acadian Emerging Markets Managed Volatility FundSM
Performance Overview
January 31, 2019 (Unaudited)
| 3. | The Total Annual Fund Operating Expense ratios set forth in the most recent Fund prospectus for the Institutional, Y, Investor, A, and C Class shares were 1.85%, 1.93%, 2.12%, 2.24% and 3.00%, respectively. The expense ratios above may vary from the expense ratios presented in other sections of this report that are based on expenses incurred during the period covered by this report. |
The Fund outperformed the Index over theone-year period primarily due to stock selection. Country allocation was also moderately positive.
Stock selections in China, Taiwan, and India contributed positively to relative performance during the period. The primary contributors in China included China Telecom Corp. Ltd., Class H (up 13.0%), Bank of Communications Co., Ltd., Class H (up 3.1%), and China Railway Group Ltd., Class H (up 63.5%). Holdings in Taiwan included The Shanghai Commercial & Savings Bank Ltd. (up 29.9%), Far Eastern International Bank (up 8.8%) and Taichung Commercial Bank Co., Ltd. (up 4.3%). In India, contributors included Nestle India Ltd. (up 39.3%), Hindustan Unilever Ltd. (up 16.7%), Tata Consultancy Services Ltd. (up 18.8%), and Infosys Ltd., Sponsored ADR (up 24.2%).
Relative contribution from country allocation was positive for the twelve-month period. Overweighting Egypt (down 1.9%), and underweighting Hong Kong (down 19.0%) contributed positively to relative performance. On the other hand, overweighting Greece (down 40.2%) detracted from relative performance during the period.
The Fund’s basic philosophy remains focused on investing in a well-diversified portfolio of low volatility stocks that aims to maximize risk-adjusted returns.
| Top Ten Holdings (% Net Assets) |
| |||||||
| Bank of Communications Co., Ltd., Class H | 1.5 | |||||||
| China Construction Bank Corp., Class H | 1.5 | |||||||
| China Telecom Corp. Ltd., Class H | 1.5 | |||||||
| IRB Brasil Resseguros S/A | 1.5 | |||||||
| CEZ A/S | 1.4 | |||||||
| Hindustan Unilever Ltd. | 1.4 | |||||||
| Nestle India Ltd. | 1.4 | |||||||
| Shanghai Commercial & Savings Bank Ltd. | 1.4 | |||||||
| Siam Cement PCL, NVDR | 1.4 | |||||||
| Tata Consultancy Services Ltd. | 1.4 | |||||||
| Total Fund Holdings | 243 | |||||||
| Sector Allocation (% Equities) |
| |||||||
| Financials | 22.8 | |||||||
| Consumer Staples | 20.5 | |||||||
| Communication Services | 14.1 | |||||||
| Utilities | 11.4 | |||||||
| Industrials | 8.1 | |||||||
| Information Technology | 7.6 | |||||||
| Energy | 5.0 | |||||||
| Consumer Discretionary | 4.4 | |||||||
| Materials | 3.2 | |||||||
| Health Care | 2.7 | |||||||
| Industrial | 0.2 | |||||||
4
American Beacon Acadian Emerging Markets Managed Volatility FundSM
Performance Overview
January 31, 2019 (Unaudited)
| Country Allocation (% Equities) |
| |||||||
| China | 27.3 | |||||||
| India | 12.1 | |||||||
| Republic of Korea | 9.9 | |||||||
| Taiwan | 8.8 | |||||||
| Brazil | 5.2 | |||||||
| Thailand | 5.0 | |||||||
| Malaysia | 4.5 | |||||||
| Philippines | 3.5 | |||||||
| Chile | 3.4 | |||||||
| Indonesia | 2.8 | |||||||
| South Africa | 2.5 | |||||||
| Greece | 2.3 | |||||||
| Egypt | 2.3 | |||||||
| Czech Republic | 2.2 | |||||||
| Hungary | 1.8 | |||||||
| Mexico | 1.4 | |||||||
| Russia | 1.4 | |||||||
| Peru | 1.3 | |||||||
| United Kingdom | 1.0 | |||||||
| Turkey | 0.8 | |||||||
| Poland | 0.3 | |||||||
| Hong Kong | 0.2 | |||||||
5
American Beacon SGA Global Growth FundSM
Performance Overview
January 31, 2019 (Unaudited)
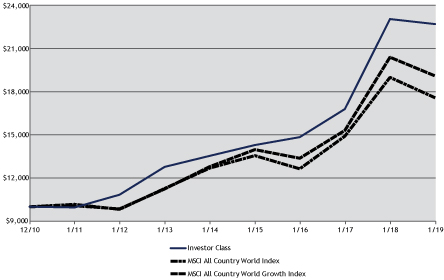
The Investor Class of the American Beacon SGA Global Growth Fund (the “Fund”) returned-1.51% for the twelve months ended January 31, 2019. The Fund outperformed the MSCI All Country World Index (the “Index”) return of-7.48% for the period.
Comparison of Change in Value of a $10,000 Investment for the period from 12/31/2010 through 1/31/2019
| Total Returns for the Period ended January 31, 2019 |
| |||||||||||||||||||||||||||||||
Ticker | 1 Year | 3 Years | 5 Years | Since Inception | Value of $10,000 | |||||||||||||||||||||||||||
Institutional Class (1,7) | SGAGX | (1.08 | )% | 15.67 | % | 11.33 | % | 10.94 | % | $ | 23,153 | |||||||||||||||||||||
Y Class (1,2,7) | SGAYX | (1.19 | )% | 15.56 | % | 11.20 | % | 10.86 | % | $ | 23,022 | |||||||||||||||||||||
Investor Class (1,3,7) | SGAPX | (1.51 | )% | 15.21 | % | 10.89 | % | 10.65 | % | $ | 22,672 | |||||||||||||||||||||
A without Sales Charge (1,4,7) | SGAAX | (1.46 | )% | 15.20 | % | 10.87 | % | 10.64 | % | $ | 22,651 | |||||||||||||||||||||
A with Sales Charge (1,4,7) | SGAAX | (7.11 | )% | 12.96 | % | 9.57 | % | 9.83 | % | $ | 21,348 | |||||||||||||||||||||
C without Sales Charge (1,5,7) | SGACX | (2.20 | )% | 14.36 | % | 10.04 | % | 10.10 | % | $ | 21,765 | |||||||||||||||||||||
C with Sales Charge (1,5,7) | SGACX | (3.20 | )% | 14.36 | % | 10.04 | % | 10.10 | % | $ | 21,765 | |||||||||||||||||||||
MSCI All Country World Index (6) | (7.48 | )% | 11.62 | % | 6.72 | % | 7.21 | % | $ | 17,562 | ||||||||||||||||||||||
MSCI All Country World Growth Index (6) | (6.38 | )% | 12.60 | % | 8.34 | % | 8.32 | % | $ | 19,076 | ||||||||||||||||||||||
| 1. | Performance shown is historical and is not indicative of future returns. Investment returns and principal value will vary, and shares may be worth more or less at redemption than at original purchase. Performance shown is calculated based on the published end of day net asset values as of the date indicated and current performance may be lower or higher than the performance data quoted. To obtain performance as of the most recent month end, please visitwww.americanbeaconfunds.com or call1-800-967-9009. Fund performance in the table above does not reflect the deduction of taxes a shareholder would pay on distributions or the redemption of shares. Generally accepted accounting principles require adjustments to be made to the net assets of the Fund at period end for financial reporting purposes only, and as such, the total return based on the unadjusted net asset value per share may differ from the total return reported in the financial highlights. A portion of the fees charged to each Class of the Fund has been waived since Fund inception. Performance prior to waiving fees was lower than the actual returns shown since inception. |
6
American Beacon SGA Global Growth FundSM
Performance Overview
January 31, 2019 (Unaudited)
| 2. | Fund performance for the since inception period represents the total returns achieved by the Institutional Class from 12/31/10 up to 10/4/13, the inception date of the Y Class, and the returns of the Y Class since its inception. Expenses of the Y Class are higher than those of the Institutional Class. As a result, total returns shown may be higher than they would have been had the Y Class been in existence since 12/31/10. |
| 3. | Fund performance for the since inception period represents the total returns achieved by the Institutional Class from 12/31/10 up to 10/4/13, the inception date of the Investor Class, and the returns of the Investor Class since its inception. Expenses of the Investor Class are higher than those of the Institutional Class. As a result, total returns shown may be higher than they would have been had the Investor Class been in existence since 12/31/10. |
| 4. | Fund performance for the since inception period represents the total returns achieved by the Institutional Class from 12/31/10 up to 10/4/13, the inception date of the A Class, and the returns of the A Class since its inception. Expenses of the A Class are higher than those of the Institutional Class. As a result, total returns shown may be higher than they would have been had the A Class been in existence since 12/31/10. The maximum sales charge for A Class is 5.75%. |
| 5. | Fund performance for the since inception period represents the total returns achieved by the Institutional Class from 12/31/10 up to 10/4/13, the inception date of the C Class, and the returns of the C Class since its inception. Expenses of the C Class are higher than those of the Institutional Class. As a result, total returns shown may be higher than they would have been had the C Class been in existence since 12/31/10. The maximum contingent deferred sales charge for C Class is 1.00% for shares redeemed within one year of the date of purchase. |
| 6. | The MSCI All Country World Index (“ACWI”) is a free float-adjusted, market capitalization weighted index that is designed to measure the equity market performance of developed and emerging markets. The MSCI All Country World Growth Index is designed to measure equity market performance of companies with higher growth values in developed and emerging markets. One cannot directly invest in an index. |
| 7. | The Total Annual Fund Operating Expense ratios set forth in the most recent Fund prospectus for the Institutional, Y, Investor, A and C Class shares were 1.35%, 1.41%, 1.58%, 1.73% and 2.48%, respectively. The expense ratios above may vary from the expense ratios presented in other sections of this report that are based on expenses incurred during the period covered by this report. |
From a Fund perspective, stock selection contributed positively, while country allocation detracted slightly from performance relative to the Index over theone-year period.
Stock selections in the United States were the top contributors to the Fund’s relative performance during the period, including Red Hat, Inc. (up 30.4%), Salesforce.com, Inc. (up 36.3%), Autodesk, Inc. (up 28.0%) and TJX Companies, Inc. (up 25.2%). Also adding to relative performance were stock selections in India, led by Infosys Ltd., Sponsored ADR (up 25.3%). Stock selections in the South Korea, including Amorepacific Corp. (down 42.9%), detracted from Fund performance.
From a country allocation perspective, overweighting China (down 19.9%) and South Africa (down 17.5%) detracted from relative performance. On the contrary, overweighting United States contributed positively to relative performance.
The Fund’s basic philosophy remains focused on investing in global companies that offer a more sustainable earnings and cash-flow growth over the long term.
| Top Ten Holdings (% Net Assets) |
| |||||||
| Abbott Laboratories | 3.9 | |||||||
| AIA Group Ltd. | 3.9 | |||||||
| Yum! Brands, Inc. | 3.9 | |||||||
| Nestle S.A. | 3.8 | |||||||
| Visa, Inc., Class B | 3.7 | |||||||
| Amazon.com, Inc. | 3.6 | |||||||
| Equinix, Inc. | 3.6 | |||||||
| Alphabet, Inc., Class C | 3.5 | |||||||
| Autodesk, Inc. | 3.5 | |||||||
| HDFC Bank Ltd., ADR | 3.3 | |||||||
| Total Fund Holdings | 33 | |||||||
7
American Beacon SGA Global Growth FundSM
Performance Overview
January 31, 2019 (Unaudited)
| Sector Allocation (% Equities) |
| |||||||
| Consumer Discretionary | 28.5 | |||||||
| Information Technology | 20.9 | |||||||
| Consumer Staples | 14.0 | |||||||
| Health Care | 10.4 | |||||||
| Financials | 9.6 | |||||||
| Communication Services | 6.6 | |||||||
| Real Estate | 3.8 | |||||||
| Industrials | 3.1 | |||||||
| Materials | 3.1 | |||||||
| Country Allocation (% Equities) |
| |||||||
| United States | 52.9 | |||||||
| China | 10.4 | |||||||
| India | 5.4 | |||||||
| Hong Kong | 4.1 | |||||||
| Switzerland | 4.0 | |||||||
| South Africa | 3.8 | |||||||
| Denmark | 3.1 | |||||||
| France | 3.1 | |||||||
| Germany | 3.1 | |||||||
| Ireland | 3.1 | |||||||
| Argentina | 2.6 | |||||||
| Japan | 2.5 | |||||||
| Mexico | 1.9 | |||||||
8
American Beacon FundsSM
January 31, 2019 (Unaudited)
Fund Expense Example
As a shareholder of a Fund, you incur two types of costs: (1) transaction costs, including sales charges (loads) on purchase payments and redemption fees, if applicable, and (2) ongoing costs, including management fees, distribution(12b-1) fees,sub-transfer agent fees, and other Fund expenses. The Examples are intended to help you understand the ongoing cost (in dollars) of investing in the Fund and to compare these costs with the ongoing costs of investing in other mutual funds. The Examples are based on an investment of $1,000 invested at the beginning of the period in each Class and held for the entire period from August 1, 2018 through January 31, 2019.
Actual Expenses
The “Actual” lines of the tables provide information about actual account values and actual expenses. You may use the information on this page, together with the amount you invested, to estimate the expenses that you paid over the period. Simply divide your account value by $1,000 (for example, an $8,600 account value divided by $1,000 = $8.60), then multiply the result by the “Expenses Paid During Period” to estimate the expenses you paid on your account during this period. Shareholders of the Investor and Institutional Classes that invest in the Fund through an IRA or Roth IRA may be subject to a custodial IRA fee of $15 that is typically deducted each December. If your account was subject to a custodial IRA fee during the period, your costs would have been $15 higher.
Hypothetical Example for Comparison Purposes
The “Hypothetical” lines of the tables provide information about hypothetical account values and hypothetical expenses based on the Fund’s actual expense ratio and an assumed 5% per year rate of return before expenses (not the Fund’s actual return). You may compare the ongoing costs of investing in the Fund with other funds by contrasting this 5% hypothetical example and the 5% hypothetical examples that appear in the shareholder reports of the other funds. The hypothetical account values and expenses may not be used to estimate the actual ending account balance or expenses you paid for the period. Shareholders of the Investor and Institutional Classes that invest in the Funds through an IRA or Roth IRA may be subject to a custodial IRA fee of $15 that is typically deducted each December. If your account was subject to a custodial IRA fee during the period, your costs would have been $15 higher.
You should also be aware that the expenses shown in the table highlight only your ongoing costs and do not reflect any transaction costs charged by the Fund, such as sales charges (loads) or redemption fees, as applicable. Similarly, the expense examples for other funds do not reflect any transaction costs charged by those funds, such as sales charges (loads), redemption fees or exchange fees. Therefore, the “Hypothetical” lines of the tables are useful in comparing ongoing costs only and will not help you determine the relative total costs of owning different funds. If you were subject to any transaction costs during the period, your costs would have been higher.
9
American Beacon FundsSM
Expense Examples
January 31, 2019 (Unaudited)
| American Beacon Acadian Emerging Markets Managed Volatility Fund |
| ||||||||||||||
| Beginning Account Value 8/1/2018 | Ending Account Value 1/31/2019 | Expenses Paid During Period 8/1/2018-1/31/2019* | |||||||||||||
| Institutional Class | |||||||||||||||
| Actual | $1,000.00 | $1,026.20 | $6.89 | ||||||||||||
| Hypothetical** | $1,000.00 | $1,018.40 | $6.87 | ||||||||||||
| Y Class | |||||||||||||||
| Actual | $1,000.00 | $1,026.40 | $7.41 | ||||||||||||
| Hypothetical** | $1,000.00 | $1,017.90 | $7.38 | ||||||||||||
| Investor Class | |||||||||||||||
| Actual | $1,000.00 | $1,024.60 | $8.83 | ||||||||||||
| Hypothetical** | $1,000.00 | $1,016.48 | $8.79 | ||||||||||||
| A Class | |||||||||||||||
| Actual | $1,000.00 | $1,024.60 | $8.93 | ||||||||||||
| Hypothetical** | $1,000.00 | $1,016.38 | $8.89 | ||||||||||||
| C Class | |||||||||||||||
| Actual | $1,000.00 | $1,020.30 | $12.73 | ||||||||||||
| Hypothetical** | $1,000.00 | $1,012.60 | $12.68 | ||||||||||||
| * | Expenses are equal to the Fund’s annualized expense ratios for thesix-month period of 1.35%, 1.45%, 1.73%, 1.75%, and 2.50% for the Institutional, Y, Investor, A, and C Classes, respectively, multiplied by the average account value over the period, multiplied by the number derived by dividing the number of days in the most recent fiscal half-year (184) by days in the year (365) to reflect the half-year period. |
| ** | 5% return before expenses. |
| American Beacon SGA Global Growth Fund |
| ||||||||||||||
| Beginning Account Value 8/1/2018 | Ending Account Value 1/31/2019 | Expenses Paid During Period 8/1/2018-1/31/2019* | |||||||||||||
| Institutional Class | |||||||||||||||
| Actual | $1,000.00 | $981.90 | $4.90 | ||||||||||||
| Hypothetical** | $1,000.00 | $1,020.27 | $4.99 | ||||||||||||
| Y Class | |||||||||||||||
| Actual | $1,000.00 | $981.30 | $5.39 | ||||||||||||
| Hypothetical** | $1,000.00 | $1,019.76 | $5.50 | ||||||||||||
| Investor Class | |||||||||||||||
| Actual | $1,000.00 | $979.50 | $6.79 | ||||||||||||
| Hypothetical** | $1,000.00 | $1,018.35 | $6.92 | ||||||||||||
| A Class | |||||||||||||||
| Actual | $1,000.00 | $979.90 | $6.89 | ||||||||||||
| Hypothetical** | $1,000.00 | $1,018.25 | $7.02 | ||||||||||||
| C Class | |||||||||||||||
| Actual | $1,000.00 | $976.50 | $10.61 | ||||||||||||
| Hypothetical** | $1,000.00 | $1,014.47 | $10.82 | ||||||||||||
| * | Expenses are equal to the Fund’s annualized expense ratios for thesix-month period of 0.98%, 1.08%, 1.36%, 1.38%, and 2.13% for the Institutional, Y, Investor, A, and C Classes, respectively, multiplied by the average account value over the period, multiplied by the number derived by dividing the number of days in the most recent fiscal half-year (184) by days in the year (365) to reflect the half-year period. |
| ** | 5% return before expenses. |
10
Report of Independent Registered Public Accounting Firm
Tothe Board of Trustees of American Beacon Funds and Shareholders of American Beacon Acadian Emerging Markets Managed Volatility Fund and American Beacon SGA Global Growth Fund
Opinion on the Financial Statements
We have audited the accompanying statements of assets and liabilities, including the schedules of investments, of American Beacon Acadian Emerging Markets Managed Volatility Fund and American Beacon SGA Global Growth Fund (two of the series constituting American Beacon Funds, referred to hereafter as the “Funds”) as of January 31, 2019, the related statements of operations for the year ended January 31, 2019, the statements of changes in net assets for each of the two years in the period ended January 31, 2019, including the related notes,and the financial highlights for each of the three years in the period ended January 31, 2019 (collectively referred to as the “financial statements”). In our opinion, the financial statements present fairly, in all material respects, the financial position of the Funds as of January 31, 2019, the results of their operations for the year then ended, the changes in their net assets for each of the two years in the period ended January 31, 2019 and the financial highlights for each of the three years in the period ended January 31, 2019 in conformity with accounting principles generally accepted in the United States of America.
Basis for Opinions
These financial statements are the responsibility of the Funds’ management. Our responsibility is to express an opinion on the Funds’ financial statements based on our audits. We are a public accounting firm registered with the Public Company Accounting Oversight Board (United States) (PCAOB) and are required to be independent with respect to the Funds in accordance with the U.S. federal securities laws and the applicable rules and regulations of the Securities and Exchange Commission and the PCAOB.
We conducted our audits of these financial statements in accordance with the standards of the PCAOB. Those standards require that we plan and perform the audit to obtain reasonable assurance about whether the financial statements are free of material misstatement, whether due to error or fraud.
Our audits included performing procedures to assess the risks of material misstatement of the financial statements, whether due to error or fraud, and performing procedures that respond to those risks. Such procedures included examining, on a test basis, evidence regarding the amounts and disclosures in the financial statements. Our audits also included evaluating the accounting principles used and significant estimates made by management, as well as evaluating the overall presentation of the financial statements. Our procedures included confirmation of securities owned as of January 31, 2019 by correspondence with the custodian, transfer agent and brokers; when replies were not received from brokers, we performed other auditing procedures. We believe that our audits provide a reasonable basis for our opinion.
The financial statements of each of the Funds as of and for the year ended January 31, 2016 and the financial highlights for each of the periods ended on or prior to January 31, 2016 (not presented herein, other than the financial highlights) were audited by other auditors whose report dated March 31, 2016 expressed an unqualified opinion on those financial statements and financial highlights.
PricewaterhouseCoopers LLP
Dallas, TX
March 27, 2019
We have served as the auditor of one or more investment companies in the American Beacon Funds since 2016.
11
American Beacon Acadian Emerging Markets Managed Volatility FundSM
Schedule of Investments
January 31, 2019
| Shares | Fair Value | ||||||||||||||
| Brazil - 5.06% | |||||||||||||||
| Common Stocks - 4.54% | |||||||||||||||
| Alupar Investimento S.A.A | 3,700 | $ | 21,862 | ||||||||||||
| Atacadao Distribuicao Comercio e Industria LtdaB | 34,300 | 187,995 | |||||||||||||
| BrasilAgro - Co. Brasileira de Propriedades Agricolas | 1,274 | 5,617 | |||||||||||||
| Camil Alimentos S.A.B | 63,100 | 129,930 | |||||||||||||
| Construtora Tenda S.A. | 4,900 | 49,696 | |||||||||||||
| CPFL Energia S.A. | 20,300 | 181,449 | |||||||||||||
| Grendene S.A. | 28,200 | 70,670 | |||||||||||||
| Hypera S.A.B | 17,200 | 150,203 | |||||||||||||
| IRB Brasil Resseguros S/A | 22,400 | 523,641 | |||||||||||||
| Notre Dame Intermedica Participacoes S.A.B | 2,300 | 21,176 | |||||||||||||
| Telefonica Brasil S.A., ADR | 17,728 | 237,555 | |||||||||||||
| Transmissora Alianca de Energia Eletrica S.A.A | 2,400 | 16,925 | |||||||||||||
|
| ||||||||||||||
Total Common Stocks | 1,596,719 | ||||||||||||||
|
| ||||||||||||||
| Preferred Stocks - 0.52% | |||||||||||||||
| Centrais Eletricas Santa CatarinaC | 900 | 13,572 | |||||||||||||
| Telefonica Brasil S.A.C | 12,800 | 170,880 | |||||||||||||
|
| ||||||||||||||
Total Preferred Stocks | 184,452 | ||||||||||||||
|
| ||||||||||||||
Total Brazil (Cost $1,268,911) | 1,781,171 | ||||||||||||||
|
| ||||||||||||||
| Chile - 3.29% | |||||||||||||||
| Common Stocks - 3.29% | |||||||||||||||
| Aguas Andinas SA, Class A | 152,031 | 89,856 | |||||||||||||
| AntarChile S.A. | 2,356 | 35,926 | |||||||||||||
| Banco de Chile | 4,737 | 752 | |||||||||||||
| Blumar S.A. | 68,358 | 30,437 | |||||||||||||
| Cia Cervecerias Unidas S.A. | 2,222 | 30,206 | |||||||||||||
| Cia Cervecerias Unidas S.A., Sponsored ADR | 10,140 | 283,007 | |||||||||||||
| Embotelladora Andina S.A., Class B, ADR | 3,952 | 94,058 | |||||||||||||
| Empresas COPEC S.A. | 442 | 6,066 | |||||||||||||
| Enel Chile S.A. | 2,043,335 | 215,301 | |||||||||||||
| Enel Chile S.A., ADR | 3,961 | 21,508 | |||||||||||||
| Inversiones Aguas Metropolitanas S.A. | 6,607 | 10,276 | |||||||||||||
| Sigdo Koppers S.A. | 16,183 | 28,255 | |||||||||||||
| SMU S.A.B | 281,595 | 79,201 | |||||||||||||
| Vina Concha y Toro S.A. | 111,423 | 230,899 | |||||||||||||
|
| ||||||||||||||
Total Common Stocks | 1,155,748 | ||||||||||||||
|
| ||||||||||||||
Total Chile (Cost $1,003,099) | 1,155,748 | ||||||||||||||
|
| ||||||||||||||
| China - 26.82% | |||||||||||||||
| Common Stocks - 26.82% | |||||||||||||||
| Agricultural Bank of China Ltd., Class HD | 860,000 | 408,325 | |||||||||||||
| Bank of Beijing Co., Ltd., Class AD | 37,000 | 33,153 | |||||||||||||
| Bank of China Ltd., Class HD | 919,000 | 427,446 | |||||||||||||
| Bank of Communications Co., Ltd., Class HD | 613,000 | 519,220 | |||||||||||||
| Bank of Gansu Co., Ltd., Class HB D | 51,000 | 14,420 | |||||||||||||
| Beijing Chunlizhengda Medical Instruments Co., Ltd., Class HD | 36,600 | 115,963 | |||||||||||||
| Beijing Jingkelong Co., Ltd., Class HD | 69,000 | 13,881 | |||||||||||||
| Changshouhua Food Co., Ltd.D | 19,000 | 7,956 | |||||||||||||
| China CITIC Bank Corp. Ltd., Class HD | 109,000 | 71,011 | |||||||||||||
| China Construction Bank Corp., Class HD | 594,000 | 536,476 | |||||||||||||
| China Everbright Bank Co., Ltd., Class HD | 134,000 | 64,406 | |||||||||||||
| China Greenfresh Group Co., Ltd.B D | 339,000 | 43,338 | |||||||||||||
| China Merchants Bank Co., Ltd., Class HD | 78,000 | 344,646 | |||||||||||||
| China Minsheng Banking Corp. Ltd., Class HD | 229,000 | 174,728 | |||||||||||||
| China Mobile Ltd.D | 42,500 | 446,798 | |||||||||||||
See accompanying notes
12
American Beacon Acadian Emerging Markets Managed Volatility FundSM
Schedule of Investments
January 31, 2019
| Shares | Fair Value | ||||||||||||||
| China - 26.82% (continued) | |||||||||||||||
| Common Stocks - 26.82% (continued) | |||||||||||||||
| China Petroleum & Chemical Corp., Class HD | 482,000 | $ | 402,065 | ||||||||||||
| China Railway Group Ltd., Class HD | 431,000 | 402,029 | |||||||||||||
| China Shenhua Energy Co., Ltd., Class HD | 108,000 | 275,339 | |||||||||||||
| China Telecom Corp. Ltd., Class HD | 956,000 | 520,052 | |||||||||||||
| China Unicom Hong Kong Ltd.D | 310,000 | 357,308 | |||||||||||||
| China Yangtze Power Co., Ltd., Class AD | 158,800 | 391,336 | |||||||||||||
| CITIC Ltd.D | 300,000 | 453,771 | |||||||||||||
| CNOOC Ltd.D | 235,000 | 392,534 | |||||||||||||
| COSCO SHIPPING International Hong Kong Co., Ltd.D | 240,000 | 84,509 | |||||||||||||
| Daqin Railway Co., Ltd., Class AD | 109,894 | 140,181 | |||||||||||||
| Fuguiniao Co., Ltd., Class HB D E | 28,000 | - | |||||||||||||
| GD Power Development Co., Ltd., Class AD | 389,600 | 139,494 | |||||||||||||
| Huadian Power International Corp. Ltd., Class HD | 424,000 | 197,154 | |||||||||||||
| Huishang Bank Corp. Ltd., Class HD | 397,100 | 182,225 | |||||||||||||
| Industrial & Commercial Bank of China Ltd., Class HD | 579,000 | 452,037 | |||||||||||||
| Jiangsu Expressway Co., Ltd., Class HD | 232,000 | 336,018 | |||||||||||||
| NVC Lighting Holding Ltd.D | 1,780,000 | 114,470 | |||||||||||||
| PetroChina Co., Ltd., Class HD | 614,000 | 394,865 | |||||||||||||
| Ping An Insurance Group Co. of China Ltd., Class HD | 40,000 | 390,911 | |||||||||||||
| Shanghai Pharmaceuticals Holding Co., Ltd., Class HD | 3,200 | 6,822 | |||||||||||||
| Shenergy Co., Ltd., Class AD | 127,700 | 96,645 | |||||||||||||
| Sinopec Shanghai Petrochemical Co., Ltd., Class HD | 48,000 | 22,946 | |||||||||||||
| Sinopharm Group Co., Ltd., Class HD | 22,000 | 99,048 | |||||||||||||
| Xiandai Investment Co., Ltd., Class AD | 92,500 | 56,734 | |||||||||||||
| Yuexiu Transport Infrastructure Ltd.D | 214,000 | 165,101 | |||||||||||||
| Zhejiang Zheneng Electric Power Co., Ltd., Class AD | 197,700 | 132,132 | |||||||||||||
|
| ||||||||||||||
Total Common Stocks | 9,427,493 | ||||||||||||||
|
| ||||||||||||||
Total China (Cost $8,579,591) | 9,427,493 | ||||||||||||||
|
| ||||||||||||||
| Czech Republic - 2.19% | |||||||||||||||
| Common Stocks - 2.19% | |||||||||||||||
| CEZ A/SD | 19,149 | 482,658 | |||||||||||||
| Komercni banka A/SD | 3,272 | 131,713 | |||||||||||||
| O2 Czech Republic A/SD | 2,513 | 27,196 | |||||||||||||
| Philip Morris CR A/SD | 202 | 129,972 | |||||||||||||
|
| ||||||||||||||
Total Common Stocks | 771,539 | ||||||||||||||
|
| ||||||||||||||
Total Czech Republic (Cost $591,200) | 771,539 | ||||||||||||||
|
| ||||||||||||||
| Egypt - 2.22% | |||||||||||||||
| Common Stocks - 2.22% | |||||||||||||||
| Commercial International Bank Egypt SAED | 48,501 | 227,719 | |||||||||||||
| Credit Agricole Egypt SAED | 13,945 | 33,719 | |||||||||||||
| Eastern TobaccoD | 323,955 | 307,829 | |||||||||||||
| ElSewedy Electric Co.D | 22,384 | 22,202 | |||||||||||||
| Faisal Islamic Bank of EgyptD | 40,070 | 37,260 | |||||||||||||
| Global Telecom Holding SAEB D | 19,187 | 4,790 | |||||||||||||
| MM Group for Industry & International Trade SAEB D | 72 | 43 | |||||||||||||
| Telecom Egypt Co.D | 184,372 | 148,081 | |||||||||||||
|
| ||||||||||||||
Total Common Stocks | 781,643 | ||||||||||||||
|
| ||||||||||||||
Total Egypt (Cost $564,387) | 781,643 | ||||||||||||||
|
| ||||||||||||||
| Greece - 2.22% | |||||||||||||||
| Common Stocks - 2.22% | |||||||||||||||
| Aegean Airlines S.A.D | 14,980 | 130,520 | |||||||||||||
| Hellenic Telecommunications Organization S.A.D | 29,732 | 372,702 | |||||||||||||
See accompanying notes
13
American Beacon Acadian Emerging Markets Managed Volatility FundSM
Schedule of Investments
January 31, 2019
| Shares | Fair Value | ||||||||||||||
| Greece - 2.22% (continued) | |||||||||||||||
| Common Stocks - 2.22% (continued) | |||||||||||||||
| Terna Energy S.A.D | 39,595 | $ | 270,616 | ||||||||||||
| Thessaloniki Water Supply & Sewage Co. S.A.D | 1,610 | 8,224 | |||||||||||||
|
| ||||||||||||||
Total Common Stocks | 782,062 | ||||||||||||||
|
| ||||||||||||||
Total Greece (Cost $680,184) | 782,062 | ||||||||||||||
|
| ||||||||||||||
| Hong Kong - 0.15% | |||||||||||||||
| Common Stocks - 0.15% | |||||||||||||||
| Citychamp Watch & Jewellery Group Ltd.D | 122,000 | 25,712 | |||||||||||||
| Goldlion Holdings Ltd.D | 46,000 | 18,957 | |||||||||||||
| Organic Tea Cosmetics Holdings Co., Ltd.D | 3,859 | 9,170 | |||||||||||||
|
| ||||||||||||||
Total Common Stocks | 53,839 | ||||||||||||||
|
| ||||||||||||||
Total Hong Kong (Cost $57,227) | 53,839 | ||||||||||||||
|
| ||||||||||||||
| Hungary - 1.81% | |||||||||||||||
| Common Stocks - 1.81% | |||||||||||||||
| Magyar Telekom Telecommunications PLCD | 198,581 | 335,336 | |||||||||||||
| MOL Hungarian Oil & Gas PLCD | 2,320 | 27,781 | |||||||||||||
| OTP Bank NyrtD | 282 | 11,628 | |||||||||||||
| Richter Gedeon NyrtD | 12,160 | 259,213 | |||||||||||||
| Waberer’s International NyrtB D | 290 | 2,343 | |||||||||||||
| Zwack Unicum RtD | 7 | 436 | |||||||||||||
|
| ||||||||||||||
Total Common Stocks | 636,737 | ||||||||||||||
|
| ||||||||||||||
Total Hungary (Cost $538,489) | 636,737 | ||||||||||||||
|
| ||||||||||||||
| India - 11.87% | |||||||||||||||
| Common Stocks - 11.87% | |||||||||||||||
| Colgate-Palmolive India Ltd.D | 1,861 | 33,624 | |||||||||||||
| Gillette India Ltd.D | 1,887 | 172,740 | |||||||||||||
| GlaxoSmithKline Consumer Healthcare Ltd.D | 2,410 | 248,279 | |||||||||||||
| Hawkins Cookers Ltd.D | 313 | 12,766 | |||||||||||||
| HCL Technologies Ltd.D | 25,858 | 366,005 | |||||||||||||
| Hinduja Global Solutions Ltd.D | 4,065 | 35,764 | |||||||||||||
| Hindustan Unilever Ltd.D | 19,515 | 482,454 | |||||||||||||
| Infosys Ltd.D | 19,406 | 205,452 | |||||||||||||
| Infosys Ltd., Sponsored ADR | 26,634 | 287,647 | |||||||||||||
| Nestle India Ltd.D | 2,968 | 480,952 | |||||||||||||
| Oil & Natural Gas Corp. Ltd.D | 5,268 | 10,430 | |||||||||||||
| Oracle Financial Services Software Ltd.D | 5,183 | 277,014 | |||||||||||||
| Pfizer Ltd.D | 5,690 | 242,752 | |||||||||||||
| Procter & Gamble Hygiene & Health Care Ltd.D | 1,854 | 258,390 | |||||||||||||
| Sanofi India Ltd.D | 217 | 19,713 | |||||||||||||
| Tata Consultancy Services Ltd.D | 17,092 | 484,805 | |||||||||||||
| Wipro Ltd.D | 87,362 | 452,414 | |||||||||||||
| Wipro Ltd., ADR | 17,962 | 102,204 | |||||||||||||
|
| ||||||||||||||
Total Common Stocks | 4,173,405 | ||||||||||||||
|
| ||||||||||||||
Total India (Cost $3,268,827) | 4,173,405 | ||||||||||||||
|
| ||||||||||||||
| Indonesia - 2.78% | |||||||||||||||
| Common Stocks - 2.78% | |||||||||||||||
| Astra Graphia Tbk PTD | 167,100 | 16,966 | |||||||||||||
| Bank Central Asia Tbk PTD | 216,600 | 436,887 | |||||||||||||
| Gudang Garam Tbk PTD | 3,300 | 19,763 | |||||||||||||
| Indofood CBP Sukses Makmur Tbk PTD | 11,200 | 8,647 | |||||||||||||
| Indofood Sukses Makmur Tbk PTD | 359,100 | 200,409 | |||||||||||||
See accompanying notes
14
American Beacon Acadian Emerging Markets Managed Volatility FundSM
Schedule of Investments
January 31, 2019
| Shares | Fair Value | ||||||||||||||
| Indonesia - 2.78% (continued) | |||||||||||||||
| Common Stocks - 2.78% (continued) | |||||||||||||||
| Multipolar Technology Tbk PT | 558,900 | $ | 36,200 | ||||||||||||
| Telekomunikasi Indonesia Persero Tbk PTD | 75,300 | 20,979 | |||||||||||||
| Unilever Indonesia Tbk PTD | 65,800 | 235,857 | |||||||||||||
|
| ||||||||||||||
Total Common Stocks | 975,708 | ||||||||||||||
|
| ||||||||||||||
Total Indonesia (Cost $851,996) | 975,708 | ||||||||||||||
|
| ||||||||||||||
| Malaysia - 4.43% | |||||||||||||||
| Common Stocks - 4.43% | |||||||||||||||
| Batu Kawan BhdD | 2,800 | 11,662 | |||||||||||||
| Fraser & Neave Holdings BhdD | 34,900 | 291,272 | |||||||||||||
| Kim Loong Resources BhdD | 10,253 | 3,133 | |||||||||||||
| Kuala Lumpur Kepong BhdD | 43,800 | 265,151 | |||||||||||||
| Nestle Malaysia BhdD | 4,200 | 152,957 | |||||||||||||
| Petronas Chemicals Group BhdD | 41,700 | 86,452 | |||||||||||||
| Public Bank BhdD | 67,800 | 410,529 | |||||||||||||
| Sime Darby Plantation BhdD | 54,100 | 68,508 | |||||||||||||
| Tenaga Nasional BhdD | 84,650 | 266,716 | |||||||||||||
|
| ||||||||||||||
Total Common Stocks | 1,556,380 | ||||||||||||||
|
| ||||||||||||||
Total Malaysia (Cost $1,317,234) | 1,556,380 | ||||||||||||||
|
| ||||||||||||||
| Mexico - 1.42% | |||||||||||||||
| Common Stocks - 1.42% | |||||||||||||||
| Fomento Economico Mexicano S.A.B. de C.V., Series B, Sponsored ADR | 3,311 | 301,367 | |||||||||||||
| Industrias Bachoco S.A.B. de C.V., Series B | 17,308 | 66,309 | |||||||||||||
| Megacable Holdings S.A.B. de C.V.A | 29,282 | 131,708 | |||||||||||||
|
| ||||||||||||||
Total Common Stocks | 499,384 | ||||||||||||||
|
| ||||||||||||||
Total Mexico (Cost $498,842) | 499,384 | ||||||||||||||
|
| ||||||||||||||
| Peru - 1.27% | |||||||||||||||
| Common Stocks - 1.27% | |||||||||||||||
| Alicorp S.A.A. | 133,443 | 423,489 | |||||||||||||
| Union de Cervecerias Peruanas Backus y Johnston S.A.A., Class I | 3,546 | 21,633 | |||||||||||||
|
| ||||||||||||||
Total Common Stocks | 445,122 | ||||||||||||||
|
| ||||||||||||||
Total Peru (Cost $351,043) | 445,122 | ||||||||||||||
|
| ||||||||||||||
| Philippines - 3.42% | |||||||||||||||
| Common Stocks - 3.42% | |||||||||||||||
| Aboitiz Power Corp.D | 228,600 | 168,484 | |||||||||||||
| Asia United Bank Corp.D | 19,880 | 22,734 | |||||||||||||
| Cebu Air, Inc.D | 44,203 | 74,674 | |||||||||||||
| China Banking Corp.D | 51,412 | 27,824 | |||||||||||||
| Cosco Capital, Inc.D | 261,300 | 37,058 | |||||||||||||
| Globe Telecom, Inc.D | 345 | 13,406 | |||||||||||||
| Manila Electric Co.D | 67,910 | 476,816 | |||||||||||||
| Pepsi-Cola Products Philippines, Inc.D | 40,900 | 1,052 | |||||||||||||
| Philippine National BankB D | 46,920 | 40,518 | |||||||||||||
| Pilipinas Shell Petroleum Corp.D | 5,480 | 5,048 | |||||||||||||
| Puregold Price Club, Inc.D | 121,800 | 106,370 | |||||||||||||
| RFM Corp.D | 132,000 | 12,161 | |||||||||||||
| San Miguel Corp.D | 50,960 | 161,386 | |||||||||||||
| San Miguel Food and Beverage, Inc.D | 4,200 | 7,657 | |||||||||||||
| Top Frontier Investment Holdings, Inc.B D | 3,950 | 21,139 | |||||||||||||
| Union Bank of the PhilippinesD | 20,490 | 25,381 | |||||||||||||
|
| ||||||||||||||
Total Common Stocks | 1,201,708 | ||||||||||||||
|
| ||||||||||||||
Total Philippines (Cost $1,133,160) | 1,201,708 | ||||||||||||||
|
| ||||||||||||||
See accompanying notes
15
American Beacon Acadian Emerging Markets Managed Volatility FundSM
Schedule of Investments
January 31, 2019
| Shares | Fair Value | ||||||||||||||
| Poland - 0.27% | |||||||||||||||
| Common Stocks - 0.27% | |||||||||||||||
| Boryszew S.A.B D | 2,086 | $ | 2,636 | ||||||||||||
| Dom Development S.A.D | 1,350 | 27,225 | |||||||||||||
| Netia S.A.B D | 10,180 | 14,115 | |||||||||||||
| Neuca S.A.D | 175 | 11,945 | |||||||||||||
| Stalexport Autostrady S.A.D | 32,382 | 34,386 | |||||||||||||
| Zespol Elektrocieplowni Wroclawskich Kogeneracja S.A.D | 433 | 3,713 | |||||||||||||
|
| ||||||||||||||
Total Common Stocks | 94,020 | ||||||||||||||
|
| ||||||||||||||
Total Poland (Cost $106,659) | 94,020 | ||||||||||||||
|
| ||||||||||||||
| Republic of Korea - 9.67% | |||||||||||||||
| Common Stocks - 9.67% | |||||||||||||||
| Binggrae Co., Ltd.D | 1,466 | 90,253 | |||||||||||||
| Busan City Gas Co., Ltd.D | 989 | 35,103 | |||||||||||||
| Daeduck Electronics Co.D | 101 | 936 | |||||||||||||
| Daehan Synthetic Fiber Co., Ltd.D | 89 | 8,725 | |||||||||||||
| Daekyo Co., Ltd.D | 11,206 | 66,362 | |||||||||||||
| Daesung Energy Co., Ltd.D | 8,294 | 39,591 | |||||||||||||
| Dong-Il Corp.D | 4,418 | 253,549 | |||||||||||||
| ESTec Corp.D | 5,543 | 57,375 | |||||||||||||
| Fursys, Inc.D | 639 | 17,466 | |||||||||||||
| Incheon City Gas Co., Ltd.D | 1,386 | 36,280 | |||||||||||||
| Industrial Bank of KoreaD | 3,180 | 40,748 | |||||||||||||
| Jinro Distillers Co., Ltd.D | 1,536 | 40,198 | |||||||||||||
| JLS Co., Ltd.D | 17,215 | 108,094 | |||||||||||||
| KEC Holdings Co., Ltd.D | 10,238 | 7,617 | |||||||||||||
| Kia Motors Corp.D | 11,831 | 386,709 | |||||||||||||
| KT Corp.D | 16,598 | 426,090 | |||||||||||||
| KT&G Corp.D | 2,201 | 196,066 | |||||||||||||
| LF Corp.D | 4,821 | 106,867 | |||||||||||||
| LG Uplus Corp.D | 19,119 | 259,589 | |||||||||||||
| Namyang Dairy Products Co., Ltd.D | 191 | 108,477 | |||||||||||||
| Pureun Mutual Savings BankD | 510 | 3,548 | |||||||||||||
| RedcapTour Co., Ltd.D | 1,544 | 22,430 | |||||||||||||
| S-1 Corp.D | 499 | 46,181 | |||||||||||||
| Saeron Automotive Corp.D | 2,901 | 13,866 | |||||||||||||
| Samsung C&T Corp.D | 58 | 6,272 | |||||||||||||
| Samsung Electronics Co., Ltd.D | 8,000 | 334,264 | |||||||||||||
| Samwonsteel Co., Ltd.D | 5,383 | 14,556 | |||||||||||||
| Samyang Tongsang Co., Ltd.D | 868 | 34,798 | |||||||||||||
| SAVEZONE I&C Corp.D | 6,608 | 22,897 | |||||||||||||
| SK Telecom Co., Ltd.D | 1,981 | 458,154 | |||||||||||||
| TS Corp.D | 1,139 | 20,642 | |||||||||||||
| YESCO Co., Ltd.D | 2,705 | 100,279 | |||||||||||||
| Youngone Holdings Co., Ltd.D | 671 | 37,276 | |||||||||||||
|
| ||||||||||||||
Total Common Stocks | 3,401,258 | ||||||||||||||
|
| ||||||||||||||
Total Republic of Korea (Cost $3,153,282) | 3,401,258 | ||||||||||||||
|
| ||||||||||||||
| Russia - 1.42% | |||||||||||||||
| Common Stocks - 1.42% | |||||||||||||||
| Gazprom Neft PJSC, Sponsored ADRD | 8,178 | 212,712 | |||||||||||||
| MMC Norilsk Nickel PJSC, ADRD | 3,784 | 78,739 | |||||||||||||
| Rostelecom PJSC, Sponsored ADRD | 30,391 | 203,372 | |||||||||||||
| Severstal PJSC, GDRD | 244 | 3,725 | |||||||||||||
|
| ||||||||||||||
Total Common Stocks | 498,548 | ||||||||||||||
|
| ||||||||||||||
Total Russia (Cost $435,408) | 498,548 | ||||||||||||||
|
| ||||||||||||||
See accompanying notes
16
American Beacon Acadian Emerging Markets Managed Volatility FundSM
Schedule of Investments
January 31, 2019
| Shares | Fair Value | ||||||||||||||
| South Africa - 2.49% | |||||||||||||||
| Common Stocks - 2.32% | |||||||||||||||
| AECI Ltd.D | 11,530 | $ | 77,533 | ||||||||||||
| Bid Corp. Ltd.D | 518 | 11,084 | |||||||||||||
| Clover Industries Ltd.D | 54,461 | 81,296 | |||||||||||||
| Combined Motor Holdings Ltd.D | 9,782 | 15,249 | |||||||||||||
| Distell Group Holdings Ltd.D | 39,921 | 348,534 | |||||||||||||
| Motus Holdings Ltd.B D | 21,109 | 142,450 | |||||||||||||
| Pick n Pay Stores Ltd.D | 1,735 | 9,092 | |||||||||||||
| SPAR Group Ltd.D | 2,425 | 36,697 | |||||||||||||
| Vodacom Group Ltd.D | 10,089 | 92,089 | |||||||||||||
|
| ||||||||||||||
Total Common Stocks | 814,024 | ||||||||||||||
|
| ||||||||||||||
| Preferred Stocks - 0.17% | |||||||||||||||
| Absa Bank Ltd.C D | 1,084 | 58,396 | |||||||||||||
|
| ||||||||||||||
Total South Africa (Cost $902,395) | 872,420 | ||||||||||||||
|
| ||||||||||||||
| Taiwan - 8.64% | |||||||||||||||
| Common Stocks - 8.64% | |||||||||||||||
| 104 Corp.D | 4,000 | 20,329 | |||||||||||||
| Chang Hwa Commercial Bank Ltd.D | 86,320 | 50,967 | |||||||||||||
| Chunghwa Telecom Co., Ltd.D | 132,000 | 461,681 | |||||||||||||
| E-LIFE MALL Corp.D | 12,000 | 24,947 | |||||||||||||
| ECOVE Environment Corp.D | 4,000 | 23,223 | |||||||||||||
| Far Eastern International BankD | 747,057 | 255,884 | |||||||||||||
| Far EasTone Telecommunications Co., Ltd.D | 51,000 | 119,761 | |||||||||||||
| First Financial Holding Co., Ltd.D | 52,520 | 35,149 | |||||||||||||
| Great Taipei Gas Co., Ltd.D | 91,000 | 86,793 | |||||||||||||
| Hey Song Corp.D | 23,000 | 22,528 | |||||||||||||
| Lian HWA Food Corp.D | 3,203 | 4,022 | |||||||||||||
| Shanghai Commercial & Savings Bank Ltd.D | 341,809 | 491,641 | |||||||||||||
| Taichung Commercial Bank Co., Ltd.D | 1,262,847 | 435,414 | |||||||||||||
| Taiwan Business BankD | 379,349 | 138,485 | |||||||||||||
| Taiwan Mobile Co., Ltd.D | 6,000 | 21,441 | |||||||||||||
| Taiwan Secom Co., Ltd.D | 71,105 | 200,838 | |||||||||||||
| Taiwan Shin Kong Security Co., Ltd.D | 242,170 | 302,070 | |||||||||||||
| Ttet Union Corp.D | 34,000 | 110,866 | |||||||||||||
| Uni-President Enterprises Corp.D | 39,000 | 91,694 | |||||||||||||
| Union Bank Of TaiwanD | 317,240 | 103,395 | |||||||||||||
| Ve Wong Corp.D | 44,000 | 37,325 | |||||||||||||
|
| ||||||||||||||
Total Common Stocks | 3,038,453 | ||||||||||||||
|
| ||||||||||||||
Total Taiwan (Cost $2,598,510) | 3,038,453 | ||||||||||||||
|
| ||||||||||||||
| Thailand - 4.87% | |||||||||||||||
| Common Stocks - 4.87% | |||||||||||||||
| Advanced Information Technology PCL, Class F | 60,500 | 39,117 | |||||||||||||
| Amata B.Grimm Power Plant Infrasture FundA D | 179,900 | 37,482 | |||||||||||||
| Bangkok Bank PCLD | 15,400 | 106,187 | |||||||||||||
| Bangkok Bank PCL, NVDRD | 21,200 | 146,180 | |||||||||||||
| Bangkok Insurance PCL, NVDRD | 1,900 | 20,141 | |||||||||||||
| Electricity Generating PCL, NVDRD | 1,100 | 9,234 | |||||||||||||
| Jasmine Broadband Internet Infrastructure FundA D | 159,600 | 51,609 | |||||||||||||
| Kang Yong Electric PCL | 100 | 1,258 | |||||||||||||
| Krung Thai Bank PCL, NVDRD | 571,200 | 362,208 | |||||||||||||
| PTT PCL, NVDRD | 7,000 | 10,863 | |||||||||||||
| Ratchaburi Electricity Generating Holding PCL | 103,400 | 183,683 | |||||||||||||
See accompanying notes
17
American Beacon Acadian Emerging Markets Managed Volatility FundSM
Schedule of Investments
January 31, 2019
| Shares | Fair Value | ||||||||||||||
| Thailand - 4.87% (continued) | |||||||||||||||
| Common Stocks - 4.87% (continued) | |||||||||||||||
| Ratchaburi Electricity Generating Holding PCL, NVDRD | 103,000 | $ | 183,182 | ||||||||||||
| Siam Cement PCL, NVDRD | 32,000 | 479,429 | |||||||||||||
| Siam Commercial Bank PCL, NVDRD | 13,900 | 59,252 | |||||||||||||
| Thai Stanley Electric PCL, NVDRD | 1,800 | 12,908 | |||||||||||||
| Thai Vegetable Oil PCL, NVDRD | 1,000 | 929 | |||||||||||||
| TTW PCL, NVDRD | 17,500 | 7,098 | |||||||||||||
|
| ||||||||||||||
Total Common Stocks | 1,710,760 | ||||||||||||||
|
| ||||||||||||||
Total Thailand (Cost $1,527,398) | 1,710,760 | ||||||||||||||
|
| ||||||||||||||
| Turkey - 0.83% | |||||||||||||||
| Common Stocks - 0.83% | |||||||||||||||
| Anadolu Anonim Turk Sigorta SirketiD | 18,386 | 15,271 | |||||||||||||
| BIM Birlesik Magazalar A/SD | 15,761 | 275,471 | |||||||||||||
|
| ||||||||||||||
Total Common Stocks | 290,742 | ||||||||||||||
|
| ||||||||||||||
Total Turkey (Cost $246,100) | 290,742 | ||||||||||||||
|
| ||||||||||||||
| United Kingdom - 0.95% (Cost $323,015) | |||||||||||||||
| Common Stocks - 0.95% | |||||||||||||||
| Mondi Ltd.D | 13,511 | 334,975 | |||||||||||||
|
| ||||||||||||||
| SHORT-TERM INVESTMENTS - 1.11% (Cost $392,084) | |||||||||||||||
| Investment Companies - 1.11% | |||||||||||||||
American Beacon U.S. Government Money Market Select Fund, Select Class, 2.32%F G | 392,084 | 392,084 | |||||||||||||
|
| ||||||||||||||
TOTAL INVESTMENTS - 99.20% (Cost $30,389,041) | 34,875,199 | ||||||||||||||
OTHER ASSETS, NET OF LIABILITIES - 0.80% | 281,837 | ||||||||||||||
|
| ||||||||||||||
TOTAL NET ASSETS - 100.00% | $ | 35,157,036 | |||||||||||||
|
| ||||||||||||||
| Percentages are stated as a percent of net assets. | |||||||||||||||
A Unit - Usually consists of one common stock and/or rights and warrants.
BNon-income producing security.
C A type of Preferred Stock that has no maturity date.
D Fair valued pursuant to procedures approved by the Board of Trustees. At period end, the value of these securities amounted to $29,951,583 or 85.19% of net assets.
E Value was determined using significant unobservable inputs.
F The Fund is affiliated by having the same investment advisor.
G7-day yield.
ADR - American Depositary Receipt.
GDR - Global Depositary Receipt.
NVDR - Non Voting Depositary Receipt.
PCL - Public Company Limited (Thailand).
PJSC - Private Joint Stock Company.
PLC - Public Limited Company.
| Long Futures Contracts Open on January 31, 2019: |
| |||||||||||||||
| Equity Futures Contracts | ||||||||||||||||
| Description | Number of Contracts | Expiration Date | Notional Amount | Contract Value | Unrealized Appreciation (Depreciation) | |||||||||||
| Mini MSCI Emerging Markets Index Futures | 12 | March 2019 | $ | 602,081 | $ | 638,760 | $ | 36,679 | ||||||||
|
|
|
|
|
| |||||||||||
| $ | 602,081 | $ | 638,760 | $ | 36,679 | |||||||||||
|
|
|
|
|
| |||||||||||
| Index Abbreviations: |
| |||||||||||||||
MSCI Morgan Stanley Capital International. |
| |||||||||||||||
See accompanying notes
18
American Beacon Acadian Emerging Markets Managed Volatility FundSM
Schedule of Investments
January 31, 2019
The Fund’s investments are summarized by level based on the inputs used to determine their values. As of January 31, 2019, the investments were classified as described below:
Acadian Emerging Markets Managed Volatility Fund | Level 1 | Level 2 | Level 3 | Total | ||||||||||||||||||||||||
Assets | ||||||||||||||||||||||||||||
Foreign Common Stocks | ||||||||||||||||||||||||||||
Brazil | $ | 1,596,719 | $ | - | $ | - | $ | 1,596,719 | ||||||||||||||||||||
Chile | 1,155,748 | - | - | 1,155,748 | ||||||||||||||||||||||||
China | - | 9,427,493 | 0 | (1) | 9,427,493 | |||||||||||||||||||||||
Czech Republic | - | 771,539 | - | 771,539 | ||||||||||||||||||||||||
Egypt | - | 781,643 | - | 781,643 | ||||||||||||||||||||||||
Greece | - | 782,062 | - | 782,062 | ||||||||||||||||||||||||
Hong Kong | - | 53,839 | - | 53,839 | ||||||||||||||||||||||||
Hungary | - | 636,737 | - | 636,737 | ||||||||||||||||||||||||
India | 389,851 | 3,783,554 | - | 4,173,405 | ||||||||||||||||||||||||
Indonesia | 36,200 | 939,508 | - | 975,708 | ||||||||||||||||||||||||
Malaysia | - | 1,556,380 | - | 1,556,380 | ||||||||||||||||||||||||
Mexico | 499,384 | - | - | 499,384 | ||||||||||||||||||||||||
Peru | 445,122 | - | - | 445,122 | ||||||||||||||||||||||||
Philippines | - | 1,201,708 | - | 1,201,708 | ||||||||||||||||||||||||
Poland | - | 94,020 | - | 94,020 | ||||||||||||||||||||||||
Republic of Korea | - | 3,401,258 | - | 3,401,258 | ||||||||||||||||||||||||
Russia | - | 498,548 | - | 498,548 | ||||||||||||||||||||||||
South Africa | - | 814,024 | - | 814,024 | ||||||||||||||||||||||||
Taiwan | - | 3,038,453 | - | 3,038,453 | ||||||||||||||||||||||||
Thailand | - | 1,710,760 | - | 1,710,760 | ||||||||||||||||||||||||
Turkey | - | 290,742 | - | 290,742 | ||||||||||||||||||||||||
United Kingdom | - | 334,975 | - | 334,975 | ||||||||||||||||||||||||
Foreign Preferred Stocks | ||||||||||||||||||||||||||||
Brazil | 184,452 | - | - | 184,452 | ||||||||||||||||||||||||
South Africa | - | 58,396 | - | 58,396 | ||||||||||||||||||||||||
Short-Term Investments | 392,084 | - | - | 392,084 | ||||||||||||||||||||||||
|
|
|
|
|
|
|
| |||||||||||||||||||||
Total Investments in Securities - Assets | $ | 4,699,560 | $ | 30,175,639 | $ | - | $ | 34,875,199 | ||||||||||||||||||||
|
|
|
|
|
|
|
| |||||||||||||||||||||
Financial Derivative Instruments - Assets | ||||||||||||||||||||||||||||
Futures Contracts | $ | 36,679 | $ | - | $ | - | $ | 36,679 | ||||||||||||||||||||
|
|
|
|
|
|
|
| |||||||||||||||||||||
Total Financial Derivative Instruments - Assets | $ | 36,679 | $ | - | $ | - | $ | 36,679 | ||||||||||||||||||||
|
|
|
|
|
|
|
| |||||||||||||||||||||
(1) Includes investments held in the Fund’s portfolio with $0 fair value.
U.S. GAAP requires transfers between all levels to/from level 3 be disclosed. During the year ended January 31, 2019, there were no transfers into or out of Level 3.
The following table is a reconciliation of Level 3 assets within the Fund for which significant unobservable inputs were used to determine fair value. Transfers in or out of Level 3 represent the ending value of any security or instrument where a change in the level has occurred from the beginning to the end of the period:
| Security Type | Balance as of 1/31/2018 | Purchases | Sales | Accrued Discounts (Premiums) | Realized Gain (Loss) | Change in Unrealized Appreciation (Depreciation) | Transfer into Level 3 | Transfer out of Level 3 | Balance as of 1/31/2019 | Unrealized Appreciation (Depreciation) at Period end** | ||||||||||||||||||||||||||||||
| Foreign Common Stocks | $ | 358 | $ | - | $ | - | $ | - | $ | - | $ | (358 | ) | $ | - | $ | - | $ | 0 | (1) | $ | (13,361 | ) | |||||||||||||||||
| ** | Change in unrealized appreciation (depreciation) attributable to Level 3 securities held at period end. This balance is included in the change in unrealized appreciation (depreciation) on the Statements of Operations. |
| (1) | Includes investments held in the Fund’s portfolio with $0 fair value. |
The foreign common stock classified as Level 3 was fair valued at a nominal value of 0.00 Hong Kong Dollar (HKD) due to lack of unobservable inputs. The company is in bankruptcy proceedings, therefore the valuation of the common stock was written down from 0.10 HKD to 0.00 HKD. There was no impact to the Fund’s NAV.
See accompanying notes
19
American Beacon SGA Global Growth FundSM
Schedule of Investments
January 31, 2019
| Shares | Fair Value | ||||||||||||||
| Argentina - 2.45% (Cost $940,272) | |||||||||||||||
| Common Stocks - 2.45% | |||||||||||||||
| MercadoLibre, Inc. | 3,328 | $ | 1,211,392 | ||||||||||||
|
| ||||||||||||||
| China - 9.90% | |||||||||||||||
| Common Stocks - 9.90% | |||||||||||||||
| Alibaba Group Holding Ltd., Sponsored ADRA | 9,094 | 1,532,248 | |||||||||||||
| Ctrip.com International Ltd., ADRA | 14,483 | 482,284 | |||||||||||||
| New Oriental Education & Technology Group, Inc., Sponsored ADRA | 18,818 | 1,449,739 | |||||||||||||
| Tencent Holdings Ltd.B | 31,695 | 1,426,047 | |||||||||||||
|
| ||||||||||||||
Total Common Stocks | 4,890,318 | ||||||||||||||
|
| ||||||||||||||
Total China (Cost $4,545,224) | 4,890,318 | ||||||||||||||
|
| ||||||||||||||
| Denmark - 2.94% (Cost $1,271,934) | |||||||||||||||
| Common Stocks - 2.94% | |||||||||||||||
| Novo Nordisk A/S, Class BB | 30,998 | 1,453,741 | |||||||||||||
|
| ||||||||||||||
| France - 2.97% (Cost $1,464,476) | |||||||||||||||
| Common Stocks - 2.97% | |||||||||||||||
| Danone S.A.B | 20,149 | 1,465,446 | |||||||||||||
|
| ||||||||||||||
| Germany - 2.93% (Cost $1,225,211) | |||||||||||||||
| Common Stocks - 2.93% | |||||||||||||||
| SAP SE, Sponsored ADR | 13,967 | 1,444,467 | |||||||||||||
|
| ||||||||||||||
| Hong Kong - 3.90% (Cost $1,479,068) | |||||||||||||||
| Common Stocks - 3.90% | |||||||||||||||
| AIA Group Ltd.B | 214,098 | 1,924,022 | |||||||||||||
|
| ||||||||||||||
| India - 5.21% | |||||||||||||||
| Common Stocks - 5.21% | |||||||||||||||
| HDFC Bank Ltd., ADR | 16,422 | 1,612,969 | |||||||||||||
| Infosys Ltd., Sponsored ADR | 88,921 | 960,347 | |||||||||||||
|
| ||||||||||||||
Total Common Stocks | 2,573,316 | ||||||||||||||
|
| ||||||||||||||
Total India (Cost $2,112,485) | 2,573,316 | ||||||||||||||
|
| ||||||||||||||
| Ireland - 2.96% (Cost $1,416,076) | |||||||||||||||
| Common Stocks - 2.96% | |||||||||||||||
| Linde PLC | 8,953 | 1,459,428 | |||||||||||||
|
| ||||||||||||||
| Japan - 2.42% (Cost $1,060,602) | |||||||||||||||
| Common Stocks - 2.42% | |||||||||||||||
| Fast Retailing Co., Ltd.B | 2,607 | 1,194,125 | |||||||||||||
|
| ||||||||||||||
| Mexico - 1.81% (Cost $843,107) | |||||||||||||||
| Common Stocks - 1.81% | |||||||||||||||
| Fomento Economico Mexicano S.A.B. de C.V., Series B, Sponsored ADR | 9,830 | 894,727 | |||||||||||||
|
| ||||||||||||||
| South Africa - 3.64% | |||||||||||||||
| Common Stocks - 3.64% | |||||||||||||||
| Sanlam Ltd.B | 157,499 | 1,001,032 | |||||||||||||
| Shoprite Holdings Ltd.B | 64,215 | 795,175 | |||||||||||||
|
| ||||||||||||||
Total Common Stocks | 1,796,207 | ||||||||||||||
|
| ||||||||||||||
Total South Africa (Cost $1,802,356) | 1,796,207 | ||||||||||||||
|
| ||||||||||||||
See accompanying notes
20
American Beacon SGA Global Growth FundSM
Schedule of Investments
January 31, 2019
| Shares | Fair Value | ||||||||||||||
| Switzerland - 3.81% (Cost $1,741,477) | |||||||||||||||
| Common Stocks - 3.81% | |||||||||||||||
| Nestle S.A.B | 21,615 | $ | 1,882,676 | ||||||||||||
|
| ||||||||||||||
| United States - 50.52% | |||||||||||||||
| Common Stocks - 50.52% | |||||||||||||||
| Abbott Laboratories | 26,417 | 1,927,913 | |||||||||||||
| Alphabet, Inc., Class CA | 1,528 | 1,705,813 | |||||||||||||
| Amazon.com, Inc.A | 1,032 | 1,773,730 | |||||||||||||
| Autodesk, Inc.A | 11,860 | 1,745,792 | |||||||||||||
| Booking Holdings, Inc.A | 527 | 965,891 | |||||||||||||
| Equinix, Inc. | 4,517 | 1,779,698 | |||||||||||||
| FleetCor Technologies, Inc.A | 7,114 | 1,435,676 | |||||||||||||
| IHS Markit Ltd.A | 27,661 | 1,436,159 | |||||||||||||
| Microsoft Corp. | 9,193 | 959,516 | |||||||||||||
| Mondelez International, Inc., Class A | 33,323 | 1,541,522 | |||||||||||||
| NIKE, Inc., Class B | 17,689 | 1,448,375 | |||||||||||||
| Regeneron Pharmaceuticals, Inc.A | 3,537 | 1,518,328 | |||||||||||||
| salesforce.com, Inc.A | 9,689 | 1,472,437 | |||||||||||||
| TJX Cos, Inc. | 29,292 | 1,456,691 | |||||||||||||
| Visa, Inc., Class A | 13,700 | 1,849,637 | |||||||||||||
| Yum! Brands, Inc. | 20,467 | 1,923,489 | |||||||||||||
|
| ||||||||||||||
Total Common Stocks | 24,940,667 | ||||||||||||||
|
| ||||||||||||||
Total United States (Cost $19,449,752) | 24,940,667 | ||||||||||||||
|
| ||||||||||||||
| SHORT-TERM INVESTMENTS - 4.89% (Cost $2,412,439) | |||||||||||||||
| Investment Companies - 4.89% | |||||||||||||||
American Beacon U.S. Government Money Market Select Fund, Select Class, 2.32%C D | 2,412,439 | 2,412,439 | |||||||||||||
|
| ||||||||||||||
TOTAL INVESTMENTS - 100.35% (Cost $41,764,479) | 49,542,971 | ||||||||||||||
LIABILITIES, NET OF OTHER ASSETS - (0.35%) | (171,322 | ) | |||||||||||||
|
| ||||||||||||||
TOTAL NET ASSETS - 100.00% | $ | 49,371,649 | |||||||||||||
|
| ||||||||||||||
| Percentages are stated as a percent of net assets. |
| ||||||||||||||
A Non-income producing security.
B Fair valued pursuant to procedures approved by the Board of Trustees. At period end, the value of these securities amounted to $11,142,264 or 22.57% of net assets.
C The Fund is affiliated by having the same investment advisor.
D 7-day yield.
ADR - American Depositary Receipt.
PLC - Public Limited Company.
| Long Futures Contracts Open on January 31, 2019: |
| |||||||||||||||
| Equity Futures Contracts | ||||||||||||||||
| Description | Number of Contracts | Expiration Date | Notional Amount | Contract Value | Unrealized Appreciation (Depreciation) | |||||||||||
| Mini MSCI EAFE Index Futures | 9 | March 2019 | $ | 786,955 | $ | 822,645 | $ | 35,690 | ||||||||
| Mini MSCI Emerging Markets Index Futures | 4 | March 2019 | 202,823 | 212,920 | 10,097 | |||||||||||
| S&P 500E-Mini Index Futures | 9 | March 2019 | 1,134,581 | 1,217,025 | 82,444 | |||||||||||
|
|
|
|
|
| |||||||||||
| $ | 2,124,359 | $ | 2,252,590 | $ | 128,231 | |||||||||||
|
|
|
|
|
| |||||||||||
| Index Abbreviations: | ||
| MSCI | Morgan Stanley Capital International. | |
| MSCI EAFE | Morgan Stanley Capital International - Europe, Australasia, and Far East. | |
| S&P 500 | Standard & Poor’s U.S. EquityLarge-Cap Index. | |
See accompanying notes
21
American Beacon SGA Global Growth FundSM
Schedule of Investments
January 31, 2019
The Fund’s investments are summarized by level based on the inputs used to determine their values. As of January 31, 2019, the investments were classified as described below:
SGA Global Growth Fund | Level 1 | Level 2 | Level 3 | Total | ||||||||||||||||||||||||
Assets | ||||||||||||||||||||||||||||
Foreign Common Stocks | ||||||||||||||||||||||||||||
Argentina | $ | 1,211,392 | $ | - | $ | - | $ | 1,211,392 | ||||||||||||||||||||
China | 3,464,271 | 1,426,047 | - | 4,890,318 | ||||||||||||||||||||||||
Denmark | - | 1,453,741 | - | 1,453,741 | ||||||||||||||||||||||||
France | - | 1,465,446 | - | 1,465,446 | ||||||||||||||||||||||||
Germany | 1,444,467 | - | - | 1,444,467 | ||||||||||||||||||||||||
Hong Kong | - | 1,924,022 | - | 1,924,022 | ||||||||||||||||||||||||
India | 2,573,316 | - | - | 2,573,316 | ||||||||||||||||||||||||
Ireland | 1,459,428 | - | - | 1,459,428 | ||||||||||||||||||||||||
Japan | - | 1,194,125 | - | 1,194,125 | ||||||||||||||||||||||||
Mexico | 894,727 | - | - | 894,727 | ||||||||||||||||||||||||
South Africa | - | 1,796,207 | - | 1,796,207 | ||||||||||||||||||||||||
Switzerland | - | 1,882,676 | - | 1,882,676 | ||||||||||||||||||||||||
Common Stocks | ||||||||||||||||||||||||||||
United States | 24,940,667 | - | - | 24,940,667 | ||||||||||||||||||||||||
Short-Term Investments | 2,412,439 | - | - | 2,412,439 | ||||||||||||||||||||||||
|
|
|
|
|
|
|
| |||||||||||||||||||||
Total Investments in Securities - Assets | $ | 38,400,707 | $ | 11,142,264 | $ | - | $ | 49,542,971 | ||||||||||||||||||||
|
|
|
|
|
|
|
| |||||||||||||||||||||
Financial Derivative Instruments - Assets | ||||||||||||||||||||||||||||
Futures Contracts | $ | 128,231 | $ | - | $ | - | $ | 128,231 | ||||||||||||||||||||
|
|
|
|
|
|
|
| |||||||||||||||||||||
Total Financial Derivative Instruments - Assets | $ | 128,231 | $ | - | $ | - | $ | 128,231 | ||||||||||||||||||||
|
|
|
|
|
|
|
| |||||||||||||||||||||
U.S. GAAP requires transfers between all levels to/from level 3 to be disclosed. During the year ended January 31, 2019, there were no transfers into or out of Level 3.
See accompanying notes
22
Statements of Assets and Liabilities
January 31, 2019
| Acadian Emerging Markets Managed Volatility Fund | SGA Global Growth Fund | |||||||||||
Assets: | ||||||||||||
Investments in unaffiliated securities, at fair value† | $ | 34,483,115 | $ | 47,130,532 | ||||||||
Investments in affiliated securities, at fair value‡ | 392,084 | 2,412,439 | ||||||||||
Foreign currency, at fair value^ | 283,202 | - | ||||||||||
Deposits with broker for futures contracts | 2,811 | - | ||||||||||
Dividends and interest receivable | 74,832 | 13,979 | ||||||||||
Receivable for investments sold | 7,013 | 677,992 | ||||||||||
Receivable for fund shares sold | 7,842 | 10,232 | ||||||||||
Receivable for tax reclaims | - | 17,563 | ||||||||||
Receivable for expense reimbursement (Note 2) | 20,447 | 45,469 | ||||||||||
Receivable for variation margin on open futures contracts (Note 5) | 36,746 | 128,308 | ||||||||||
Prepaid expenses | 33,975 | 57,527 | ||||||||||
|
|
|
| |||||||||
Total assets | 35,342,067 | 50,494,041 | ||||||||||
|
|
|
| |||||||||
Liabilities: | ||||||||||||
Payable for investments purchased | – | 959,516 | ||||||||||
Payable for fund shares redeemed | 14,646 | 30,515 | ||||||||||
Cash due to broker for futures contracts | - | 23,921 | ||||||||||
Management andsub-advisory fees payable (Note 2) | 39,574 | 34,888 | ||||||||||
Service fees payable (Note 2) | 904 | 4,913 | ||||||||||
Transfer agent fees payable (Note 2) | 2,904 | 1,743 | ||||||||||
Custody and fund accounting fees payable | 24,610 | 11,832 | ||||||||||
Professional fees payable | 96,440 | 49,704 | ||||||||||
Trustee fees payable (Note 2) | 472 | 705 | ||||||||||
Payable for prospectus and shareholder reports | 5,036 | 3,919 | ||||||||||
Other liabilities | 445 | 736 | ||||||||||
|
|
|
| |||||||||
Total liabilities | 185,031 | 1,122,392 | ||||||||||
|
|
|
| |||||||||
Net assets | $ | 35,157,036 | $ | 49,371,649 | ||||||||
|
|
|
| |||||||||
Analysis of net assets: | ||||||||||||
Paid-in-capital | $ | 30,589,069 | $ | 42,359,145 | ||||||||
Total distributable earnings (deficits)A | 4,567,967 | 7,012,504 | ||||||||||
|
|
|
| |||||||||
Net assets | $ | 35,157,036 | $ | 49,371,649 | ||||||||
|
|
|
| |||||||||
Shares outstanding at no par value (unlimited shares authorized): | ||||||||||||
Institutional Class | 479,580 | 1,513,731 | ||||||||||
|
|
|
| |||||||||
Y Class | 2,531,568 | 408,262 | ||||||||||
|
|
|
| |||||||||
Investor Class | 267,608 | 315,949 | ||||||||||
|
|
|
| |||||||||
A Class | 37,390 | 203,761 | ||||||||||
|
|
|
| |||||||||
C Class | 20,787 | 178,026 | ||||||||||
|
|
|
| |||||||||
Net assets: | ||||||||||||
Institutional Class | $ | 5,080,038 | $ | 28,819,370 | ||||||||
|
|
|
| |||||||||
Y Class | $ | 26,674,824 | $ | 7,724,294 | ||||||||
|
|
|
| |||||||||
Investor Class | $ | 2,793,978 | $ | 5,878,296 | ||||||||
|
|
|
| |||||||||
A Class | $ | 391,973 | $ | 3,786,025 | ||||||||
|
|
|
| |||||||||
C Class | $ | 216,223 | $ | 3,163,664 | ||||||||
|
|
|
| |||||||||
Net asset value, offering and redemption price per share: | ||||||||||||
Institutional Class | $ | 10.59 | $ | 19.04 | ||||||||
|
|
|
| |||||||||
Y Class | $ | 10.54 | $ | 18.92 | ||||||||
|
|
|
| |||||||||
Investor Class | $ | 10.44 | $ | 18.61 | ||||||||
|
|
|
| |||||||||
A Class | $ | 10.48 | $ | 18.58 | ||||||||
|
|
|
| |||||||||
A Class (offering price) | $ | 11.12 | $ | 19.71 | ||||||||
|
|
|
| |||||||||
C Class | $ | 10.40 | $ | 17.77 | ||||||||
|
|
|
| |||||||||
† Cost of investments in unaffiliated securities | $ | 29,996,957 | $ | 39,352,040 | ||||||||
‡ Cost of investments in affiliated securities | $ | 392,084 | $ | 2,412,439 | ||||||||
^ Cost of foreign currency | $ | 280,905 | $ | - | ||||||||
A The Fund’s investments in affiliated securities did not have unrealized appreciation (depreciation) at year end.
See accompanying notes
23
American Beacon FundsSM
Statements of Operations
For the year ended January 31, 2019
| Acadian Emerging Markets Managed Volatility Fund | SGA Global Growth Fund | |||||||||||
Investment income: |
| |||||||||||
Dividend income from unaffiliated securities (net of foreign taxes)† | $ | 1,029,397 | $ | 508,883 | ||||||||
Dividend income from affiliated securities (Note 8) | 12,018 | 48,196 | ||||||||||
Income derived from securities lending (Note 9) | 445 | 5,755 | ||||||||||
|
|
|
| |||||||||
Total investment income | 1,041,860 | 562,834 | ||||||||||
|
|
|
| |||||||||
Expenses: |
| |||||||||||
Management andsub-advisory fees (Note 2) | 336,938 | 408,173 | ||||||||||
Transfer agent fees: | ||||||||||||
Institutional Class (Note 2) | 2,977 | 6,224 | ||||||||||
Y Class (Note 2) | 27,614 | 11,427 | ||||||||||
Investor Class | 1,436 | 1,554 | ||||||||||
A Class | 67 | 306 | ||||||||||
C Class | 73 | 372 | ||||||||||
Custody and fund accounting fees | 39,220 | 41,117 | ||||||||||
Professional fees | 93,966 | 78,903 | ||||||||||
Registration fees and expenses | 67,283 | 76,253 | ||||||||||
Service fees (Note 2): | ||||||||||||
Investor Class | 12,342 | 40,697 | ||||||||||
A Class | 565 | 4,150 | ||||||||||
C Class | 420 | 2,107 | ||||||||||
Distribution fees (Note 2): | ||||||||||||
A Class | 1,315 | 9,878 | ||||||||||
C Class | 3,522 | 22,565 | ||||||||||
Prospectus and shareholder report expenses | 14,280 | 15,691 | ||||||||||
Trustee fees (Note 2) | 2,685 | 3,930 | ||||||||||
Other expenses | 11,472 | 16,286 | ||||||||||
|
|
|
| |||||||||
Total expenses | 616,175 | 739,633 | ||||||||||
|
|
|
| |||||||||
Net fees waived and expenses (reimbursed) (Note 2) | (112,124 | ) | (129,322 | ) | ||||||||
|
|
|
| |||||||||
Net expenses | 504,051 | 610,311 | ||||||||||
|
|
|
| |||||||||
Net investment income (loss) | 537,809 | (47,477 | ) | |||||||||
|
|
|
| |||||||||
Realized and unrealized gain (loss) from investments: |
| |||||||||||
Net realized gain (loss) from: | ||||||||||||
Investments in unaffiliated securitiesA | 826,997 | 572,773 | ||||||||||
Commission recapture (Note 1) | 280 | - | ||||||||||
Foreign currency transactions | (28,680 | ) | (18,812 | ) | ||||||||
Futures contracts | (209,857 | ) | (316,430 | ) | ||||||||
Change in net unrealized appreciation (depreciation) of: | ||||||||||||
Investments in unaffiliated securitiesB | (3,122,908 | ) | (1,662,174 | ) | ||||||||
Foreign currency transactions | 2,978 | (164 | ) | |||||||||
Futures contracts | 23,293 | 112,278 | ||||||||||
|
|
|
| |||||||||
Net (loss) from investments | (2,507,897 | ) | (1,312,529 | ) | ||||||||
|
|
|
| |||||||||
Net (decrease) in net assets resulting from operations | $ | (1,970,088 | ) | $ | (1,360,006 | ) | ||||||
|
|
|
| |||||||||
† Foreign taxes | $ | 141,937 | $ | 30,425 | ||||||||
A The Fund did not recognize net realized gains (losses) from the sale of investments in affiliated securities.
B The Fund’s investments in affiliated securities did not have a change in unrealized appreciation (depreciation) at year end.
See accompanying notes
24
American Beacon FundsSM
Statements of Changes in Net Assets
| Acadian Emerging Markets Managed Volatility Fund | SGA Global Growth Fund | |||||||||||||||||||||||||||
| Year Ended January 31, 2019 | Year Ended January 31, 2018 | Year Ended January 31, 2019 | Year Ended January 31, 2018 | |||||||||||||||||||||||||
Increase (decrease) in net assets: | ||||||||||||||||||||||||||||
Operations: | ||||||||||||||||||||||||||||
Net investment income (loss) | $ | 537,809 | $ | 603,982 | $ | (47,477 | ) | $ | (59,857 | ) | ||||||||||||||||||
Net realized gain from investments in unaffiliated securities, commission recapture, foreign currency transactions, and futures contracts | 588,740 | 5,754,585 | 237,531 | 2,578,017 | ||||||||||||||||||||||||
Change in net unrealized appreciation (depreciation) of investments in unaffiliated securities, foreign currency transactions, and futures contracts | (3,096,637 | ) | 5,835,412 | (1,550,060 | ) | 8,263,609 | ||||||||||||||||||||||
|
|
|
|
|
|
|
| |||||||||||||||||||||
Net increase (decrease) in net assets resulting from operations | (1,970,088 | ) | 12,193,979 | (1,360,006 | ) | 10,781,769 | ||||||||||||||||||||||
|
|
|
|
|
|
|
| |||||||||||||||||||||
Distributions to shareholders: | ||||||||||||||||||||||||||||
Net investment income: | ||||||||||||||||||||||||||||
Institutional Class | - | (100,822 | ) | - | - | |||||||||||||||||||||||
Y Class | - | (480,371 | ) | - | - | |||||||||||||||||||||||
Investor Class | - | (69,880 | ) | - | - | |||||||||||||||||||||||
A Class | - | (14,170 | ) | - | - | |||||||||||||||||||||||
C Class | - | (5,253 | ) | - | - | |||||||||||||||||||||||
Net realized gain from investments: | ||||||||||||||||||||||||||||
Institutional Class | - | - | - | (465,632 | ) | |||||||||||||||||||||||
Y Class | - | - | - | (142,594 | ) | |||||||||||||||||||||||
Investor Class | - | - | - | (592,350 | ) | |||||||||||||||||||||||
A Class | - | - | - | (116,358 | ) | |||||||||||||||||||||||
C Class | - | - | - | (54,664 | ) | |||||||||||||||||||||||
Total retained earnings:* | ||||||||||||||||||||||||||||
Institutional Class | (243,835 | ) | - | (1,005,813 | ) | - | ||||||||||||||||||||||
Y Class | (1,353,535 | ) | - | (672,150 | ) | - | ||||||||||||||||||||||
Investor Class | (143,418 | ) | - | (286,527 | ) | - | ||||||||||||||||||||||
A Class | (20,737 | ) | - | (146,965 | ) | - | ||||||||||||||||||||||
C Class | (9,707 | ) | - | (112,817 | ) | - | ||||||||||||||||||||||
|
|
|
|
|
|
|
| |||||||||||||||||||||
Net distributions to shareholders | (1,771,232 | ) | (670,496 | ) | (2,224,272 | ) | (1,371,598 | ) | ||||||||||||||||||||
|
|
|
|
|
|
|
| |||||||||||||||||||||
Capital share transactions (Note 11): | ||||||||||||||||||||||||||||
Proceeds from sales of shares | 9,804,850 | 9,494,062 | 35,882,656 | 18,350,384 | ||||||||||||||||||||||||
Reinvestment of dividends and distributions | 1,702,819 | 655,131 | 2,178,784 | 1,357,278 | ||||||||||||||||||||||||
Cost of shares redeemed | (10,520,132 | ) | (73,592,119 | ) | (32,121,198 | ) | (4,938,231 | ) | ||||||||||||||||||||
Redemption fees | 16,131 | 1,444 | - | - | ||||||||||||||||||||||||
|
|
|
|
|
|
|
| |||||||||||||||||||||
Net increase (decrease) in net assets from capital share transactions | 1,003,668 | (63,441,482 | ) | 5,940,242 | 14,769,431 | |||||||||||||||||||||||
|
|
|
|
|
|
|
| |||||||||||||||||||||
Net increase (decrease) in net assets | (2,737,652 | ) | (51,917,999 | ) | 2,355,964 | 24,179,602 | ||||||||||||||||||||||
|
|
|
|
|
|
|
| |||||||||||||||||||||
Net assets: | ||||||||||||||||||||||||||||
Beginning of period | 37,894,688 | 89,812,687 | 47,015,685 | 22,836,083 | ||||||||||||||||||||||||
|
|
|
|
|
|
|
| |||||||||||||||||||||
End of period | $ | 35,157,036 | $ | 37,894,688 | $ | 49,371,649 | $ | 47,015,685 | ||||||||||||||||||||
|
|
|
|
|
|
|
| |||||||||||||||||||||
* Distributions from net investment income and net realized capital gains are combined for the year ended January 31, 2019. See Note 1 in the Notes to Financial Statements for more information regarding new accounting pronouncements.
See accompanying notes
25
Notes to Financial Statements
January 31, 2019
1. Organization and Significant Accounting Policies
American Beacon Funds (the “Trust”), is organized as a Massachusetts business trust. The Funds, each a series within the Trust, are registered under the Investment Company Act of 1940, as amended (the “Act”), as diversified,open-end management investment companies. As of January 31, 2019, the Trust consists of thirty-three active series, two of which are presented in this filing: American Beacon Acadian Emerging Markets Managed Volatility Fund and American Beacon SGA Global Growth Fund (collectively, the “Funds” and each individually a “Fund”). The remainingthirty-one active series are reported in separate filings.
American Beacon Advisors, Inc. (the “Manager”) is a Delaware corporation and a wholly-owned subsidiary of Resolute Investment Managers, Inc. (“RIM”) organized in 1986 to provide business management, advisory, administrative, and asset management consulting services to the Trust and other investors. The Manager is registered as an investment advisor under the Investment Advisers Act of 1940, as amended (the “Advisers Act”). RIM is, in turn, a wholly-owned subsidiary of Resolute Acquisition, Inc., which is a wholly-owned subsidiary of Resolute Topco, Inc., a wholly-owned subsidiary of Resolute Investment Holdings, LLC (“RIH”). RIH is owned primarily by Kelso Investment Associates VIII, L.P., KEP VI, LLC and Estancia Capital Partners L.P., investment funds affiliated with Kelso & Company, L.P. (“Kelso”) or Estancia Capital Management, LLC (“Estancia”), which are private equity firms.
Recently Adopted Accounting Pronouncements
In March 2017, the Financial Accounting Standards Board (“FASB”) issued Accounting Standards Update (“ASU”)2017-08,Premium Amortization of Purchased Callable Debt Securities. The amendments in the ASU shorten the premium amortization period on a purchased callable debt security from the security’s contractual life to the earliest call date. It is anticipated that this change will enhance disclosures by reducing losses recognized when a security is called on an earlier date. This ASU is effective for fiscal years beginning after December 15, 2018. The Manager continues to evaluate the impact this ASU will have on the financial statements and other disclosures.
In August 2018, the FASB issued ASU2018-13,Fair Value Measurement (“Topic 820”). The amendments in the ASU impact disclosure requirements for fair value measurement. It is anticipated that this change will enhance the effectiveness of disclosures in the notes to the financial statements. This ASU is effective for fiscal years beginning after December 15, 2019. Early adoption is permitted and can include the entire standard or certain provisions that exclude or amend disclosures. For the year ended January 31, 2019, the Funds have chosen to adopt the standard. The adoption of this ASU guidance did not have a material impact on the financial statements and other disclosures.
In August 2018, the U.S. Securities and Exchange Commission (“SEC”) adopted amendments to certain disclosure requirements in Securities Act ReleaseNo. 33-10532, Disclosure Update and Simplification, which is intended to facilitate the disclosure of information to investors and simplify compliance without significantly altering the total mix of information provided to investors. Effective with the current reporting period, the Funds adopted the amendments with the impacts being that the Funds are no longer required to present components of distributable earnings on the Statements of Assets and Liabilities or the sources of distributable earnings and the amount of undistributed net investment income on the Statements of Changes in Net Assets.
26
American Beacon FundsSM
Notes to Financial Statements
January 31, 2019
Class Disclosure
Each Fund has multiple classes of shares designed to meet the needs of different groups of investors. The following table sets forth the differences amongst the classes:
Class | Eligible Investors | Minimum Initial Investments | ||||
| Institutional | Large institutional investors - sold directly or through intermediary channels. | $ | 250,000 | |||
| Y Class | Large institutional retirement plan investors - sold directly or through intermediary channels. | $ | 100,000 | |||
| Investor | All investors using intermediary organizations, such as broker-dealers or retirement plan sponsors. | $ | 2,500 | |||
| A Class | All investors who invest through intermediary organizations, such as broker-dealers or third party administrator. Retail investors who invest directly through a financial intermediary such as a broker, bank, or registered investment advisor which may include afront-end sales charge and a contingent deferred sales charge (“CDSC”). | $ | 2,500 | |||
| C Class | Retail investors who invest directly through a financial intermediary such as a broker or through employee directed benefit plans with applicable sales charges which may include CDSC. | $ | 1,000 | |||
Each class offered by the Trust has equal rights as to assets and voting privileges. Income andnon-class specific expenses are allocated daily to each class on the basis of the relative net assets. Realized and unrealized capital gains and losses of each class are allocated daily based on the relative net assets of each class of the respective Fund. Class specific expenses, where applicable, currently include service, distribution, transfer agent fees, andsub-transfer agent fees that vary amongst the classes as described more fully in Note 2.
Significant Accounting Policies
The following is a summary of significant accounting policies, consistently followed by the Funds in preparation of the financial statements. The Funds are considered investment companies and accordingly, follow the investment company accounting and reporting guidance of the FASB Accounting Standards Codification Topic 946,Financial Services – Investment Companies,a part of Generally Accepted Accounting Principles (“U.S. GAAP”).
Security Transactions and Investment Income
Security transactions are recorded as of the trade date for financial reporting purposes. Securities purchased or sold on a when-issued or delayed-delivery basis may be settled beyond a standard settlement period for the security after the trade date.
Dividend income, net of foreign taxes, is recorded on theex-dividend date, except certain dividends from foreign securities which are recorded as soon as the information is available to the Funds. Interest income, net of foreign taxes, is earned from settlement date, recorded on the accrual basis, and adjusted, if necessary, for accretion of discounts and amortization of premiums. Realized gains (losses) from securities sold are determined on the basis of specific lot identification.
Commission Recapture
The Funds have established brokerage commission recapture arrangements with certain brokers or dealers. If the Funds’ investment advisor chooses to execute a transaction through a participating broker, the broker rebates a portion of the commission back to the Funds. Any collateral benefit received through participation in the commission recapture program is directed exclusively to the Funds. This amount is reported with the net realized gain in the Funds’ Statements of Operations, if applicable.
27
American Beacon FundsSM
Notes to Financial Statements
January 31, 2019
Currency Translation
All assets and liabilities initially expressed in foreign currency values are converted into U.S. dollar values at the mean of the bid and ask prices of such currencies against U.S. dollars as last quoted by a recognized dealer. Income, expenses, and purchases and sales of investments are translated into U.S. dollars at the rate of the exchange prevailing on the respective dates of such transactions. The effect of changes in foreign currency exchange rates on investments is separately identified from the fluctuations arising from changes in market values of securities held and is reported with all other foreign currency gains and losses on the Funds’ Statements of Operations.
Distributions to Shareholders
Distributions, if any, of net investment income are generally paid at least annually and recorded on theex-dividend date. Distributions, if any, of net realized capital gains are generally paid at least annually and recorded on theex-dividend date. Dividends to shareholders are determined in accordance with federal income tax regulations, which may differ in amount and character from net investment income and realized gains recognized for purposes of U.S. GAAP. To the extent necessary to fully distribute capital gains, the Funds may designate earnings and profits distributed to shareholders on the redemption of shares.
Allocation of Income, Trust Expenses, Gains, and Losses
Investment income, realized and unrealized gains and losses from investments of the Funds are allocated daily to each class of shares based upon the relative proportion of net assets of each class to the total net assets of the Funds. Expenses directly charged or attributable to any Fund will be paid from the assets of the Fund. Generally, expenses of the Trust will be allocated among and charged to the assets of the Funds on a basis that the Trust’s Board of Trustees (the “Board”) deems fair and equitable, which may be based on the relative net assets of the Funds or nature of the services performed and relative applicability to the Funds.
Use of Estimates
The preparation of financial statements in conformity with U.S. GAAP requires management to make estimates and assumptions that affect the amounts reported in the financial statements and accompanying notes. Actual results may differ from those estimated.
Redemption Fees
All Classes of the Acadian Emerging Markets Managed Volatility Fund impose a 2% redemption fee on shares held for less than 90 days. The fee is deducted from the redemption proceeds and is intended to offset the trading costs, market impact, and other costs associated with short-term trading activity in the Fund. The“first-in,first-out” method is used to determine the holding period. The fee is allocated to all classes of this Fundpro-rata based on the net assets.
Other
Under the Trust’s organizational documents, its officers and trustees are indemnified against certain liabilities arising out of the performance of their duties to the Trust. In the normal course of business, the Trust enters into contracts that provide indemnification to the other party or parties against potential costs or liabilities. The Trust’s maximum exposure under these arrangements is dependent on claims that may be made in the future and, therefore, cannot be estimated. The Trust has had no prior claims or losses pursuant to any such agreement.
28
American Beacon FundsSM
Notes to Financial Statements
January 31, 2019
Concentration of Ownership
From time to time, the Funds may have a concentration of one or more accounts constituting a significant percentage of shares outstanding. Investment activities by holders of accounts that represent a significant ownership of more than 5% of the Funds’ outstanding shares could have a material impact on the Funds. As of January 31, 2019, based on management’s evaluation of the shareholder account base, one account in the SGA Global Growth Fund has been identified as representing an unaffiliated significant ownership of approximately 8% of the Fund’s outstanding shares.
2. Transactions with Affiliates
Management and InvestmentSub-Advisory Agreements
The Funds and the Manager are parties to a Management Agreement that obligates the Manager to provide the Funds with investment advisory and administrative services. As compensation for performing the duties under the Management Agreement, the Manager will receive an annualized management fee based on a percentage of the Funds’ average daily net assets that is calculated and accrued daily according to the following schedule:
First $5 billion | 0.35 | % | ||
Next $5 billion | 0.325 | % | ||
Next $10 billion | 0.30 | % | ||
Over $20 billion | 0.275 | % |
The Trust, on behalf of the Funds, and the Manager have entered into an Investment Advisory Agreement with Acadian Asset Management LLC and Sustainable Growth Advisers, LP (“SGA”) (the“Sub-Advisors”) pursuant to which each Fund has agreed to pay an annualizedsub-advisory fee that is calculated and accrued daily based on the Funds’ average daily net assets according to the following schedules:
Acadian Asset Management LLC
First $500 million | 0.65 | % | ||
Over $500 million | 0.60 | % |
Sustainable Growth Advisers, LP
First $100 million | 0.45 | % | ||
Next $900 million | 0.40 | % | ||
Over $1 billion | 0.35 | % |
The Management andSub-Advisory Fees paid by the Funds for the year ended January 31, 2019 were as follows:
Acadian Emerging Markets Managed Volatility Fund
| Effective Fee Rate | Amount of Fees Paid | |||||||||||
Management Fees | 0.35 | % | $ | 119,790 | ||||||||
Sub-Advisor Fees | 0.65 | % | 217,148 | |||||||||
|
|
|
| |||||||||
Total | 1.00 | % | $ | 336,938 | ||||||||
|
|
|
| |||||||||
SGA Global Growth Fund
| Effective Fee Rate | Amount of Fees Paid | |||||||||||
Management Fees | 0.35 | % | $ | 181,783 | ||||||||
Sub-Advisor Fees | 0.45 | % | 226,390 | |||||||||
|
|
|
| |||||||||
Total | 0.80 | % | $ | 408,173 | ||||||||
|
|
|
| |||||||||
29
American Beacon FundsSM
Notes to Financial Statements
January 31, 2019
As compensation for services provided by the Manager in connection with securities lending activities conducted by the Funds, the lending Fund pays to the Manager, with respect to cash collateral posted by borrowers, a fee up to 10% of the net monthly interest income (the gross interest income earned by the investment of cash collateral, less the amount paid to borrowers and related expenses) from such activities and, with respect to loan fees paid by borrowers, a fee up to 10% of such loan fees. These fees are included in “Income derived from securities lending” and “Management and investment advisory fees” on the Statements of Operations. During the year ended January 31, 2019, the Manager received securities lending fees of $49 and $623 for the securities lending activities of the Acadian Emerging Markets Managed Volatility Fund and SGA Global Growth Fund, respectively.
Distribution Plans
The Funds, except for the A and C Classes of the Funds, have adopted a “defensive” Distribution Plan (the “Plan”) in accordance with Rule12b-1 under the Act, pursuant to which no separate fees may be charged to the Funds for distribution purposes. However, the Plan authorizes the management fee received by the Manager and the investment advisors hired by the Manager to be used for distribution purposes. Under this Plan, the Funds do not intend to compensate the Manager or any other party, either directly or indirectly, for the distribution of Fund shares.
Separate Distribution Plans (the “Distribution Plans”) have been adopted pursuant to Rule12b-1 under the Act for the A and C Classes of the Funds. Under the Distribution Plans, as compensation for distribution and shareholder servicing assistance, the Manager receives an annual fee of 0.25% of the average daily net assets of the A Class and 1.00% of the average daily net assets of the C Class. The fee will be payable without regard to whether the amount of the fee is more or less than the actual expenses incurred in a particular month by the Manager for distribution assistance.
Service Plans
The Manager and the Trust entered into Service Plans that obligate the Manager to oversee additional shareholder servicing of the Investor, A, and C Classes of the Funds. As compensation for performing the duties required under the Service Plans, the Manager receives an annualized fee up to 0.25% of the average daily net assets of the A and C Classes, and up to 0.375% of the average daily net assets of the Investor Class of the Funds.
Sub-Transfer Agent Fees
The Manager has entered into agreements, which include servicing agreements, with financial intermediaries that provide recordkeeping, processing, shareholder communications and other services to customers of the intermediaries that hold positions in the Institutional and Y Classes of the Funds and has agreed to compensate the intermediaries for providing these services. Intermediaries transact with the Funds primarily through the use of omnibus accounts on behalf of their customers who hold positions in the Funds. Certain services would have been provided by the Funds’ transfer agent and other service providers if the shareholders’ accounts were maintained directly by the Funds’ transfer agent. Accordingly, the Funds, pursuant to Board approval, have agreed to reimburse the Manager for certainnon-distribution shareholder services provided by financial intermediaries for the Institutional and Y Classes. The reimbursement amounts(sub-transfer agent fees) paid to the Manager are subject to a fee limit of up to 0.10% of an intermediary’s average net assets in the Institutional and Y Classes on an annual basis. During the year ended January 31, 2019, thesub-transfer agent fees, as reflected in “Transfer agent fees” on the Statements of Operations, were as follows:
Fund | Sub-Transfer Agent Fees | |||
Acadian Emerging Markets Managed Volatility | $ | 28,960 | ||
SGA Global Growth | 15,664 | |||
30
American Beacon FundsSM
Notes to Financial Statements
January 31, 2019
As of January 31, 2019, the Funds owed the Manager the following reimbursement ofsub-transfer agent fees, as reflected in “Transfer agent fees payable” on the Statements of Assets and Liabilities:
Fund | Reimbursement Sub-Transfer Agent Fees | |||
Acadian Emerging Markets Managed Volatility | $ | 2,470 | ||
SGA Global Growth | 1,073 | |||
Investments in Affiliated Funds
The Funds may invest in the American Beacon U.S. Government Money Market Select Fund (the “USG Select Fund”). Cash collateral received by the Funds in connection with securities lending may also be invested in the USG Select Fund. The Funds and the USG Select Fund have the same investment advisor and therefore, are considered to be affiliated. The Manager serves as investment advisor to the USG Select Fund and receives management fees and administrative fees totaling 0.10% of the average daily net assets of the USG Select Fund. During the year ended January 31, 2019, the Manager earned fees on the Funds’ direct and indirect investments in the USG Select Fund as shown below:
Fund | Direct Investments in USG Select Fund | Securities Lending Collateral in USG Select Fund | Total | |||||||||
Acadian Emerging Markets Managed Volatility | $ | 684 | $ | 108 | $ | 792 | ||||||
SGA Global Growth | 2,619 | 265 | 2,884 | |||||||||
Interfund Credit Facility
Pursuant to an exemptive order issued by the SEC, the Funds, along with other registered investment companies having management contracts with the Manager, may participate in a credit facility whereby each fund, under certain conditions, is permitted to lend money directly to and borrow directly from other participating funds for temporary purposes. The interfund credit facility is advantageous to the funds because it provides added liquidity, and eliminates the need to maintain higher cash balances to meet redemptions. This situation could arise when shareholder redemptions exceed anticipated volumes and certain funds have insufficient cash on hand to satisfy such redemptions or when sales of securities do not settle as expected, resulting in a cash shortfall for a fund. When a fund liquidates portfolio securities to meet redemption requests, they often do not receive payment in settlement for up to two days (or longer for certain foreign transactions). Redemption requests normally are satisfied on the next business day. The credit facility provides a source of immediate, short-term liquidity pending settlement of the sale of portfolio securities. The credit facility is administered by a credit facility team consisting of professionals from the Manager’s asset management, compliance, and accounting areas who report the activities of the credit facility to the Board. During the year ended January 31, 2019, the Acadian Emerging Markets Managed Volatility Fund borrowed on average $30,034 for 2 days at an average interest rate of 2.02% with interest charges of $3 and the SGA Global Growth Fund borrowed on average $3,597,125 for 5 days at an average interest rate of 3.07% with interest charges of $1,509. These amounts are recorded as “Other expenses” in the Statements of Operations.
Expense Reimbursement Plan
The Manager contractually agreed to reduce fees and/or reimburse expenses for the classes of the Funds to the extent that total operating expenses exceed the Funds’ expense cap. During the year ended January 31, 2019, the Manager waived and/or reimbursed expenses as follows:
| Expense Cap | Expiration of Reimbursed Expenses | |||||||||||||||||
Fund | Class | 2/1/2018 - 1/31/2019 | Reimbursed Expenses | (Recouped) Expenses | ||||||||||||||
Acadian Emerging Markets Managed Volatility | Institutional | 1.35 | % | $ | 18,559 | $ | – | 2022 | ||||||||||
Acadian Emerging Markets Managed Volatility | Y | 1.45 | % | 79,593 | – | 2022 | ||||||||||||
Acadian Emerging Markets Managed Volatility | Investor | 1.73 | % | 11,618 | – | 2022 | ||||||||||||
31
American Beacon FundsSM
Notes to Financial Statements
January 31, 2019
| Expense Cap | Expiration of Reimbursed Expenses | |||||||||||||||||
Fund | Class | 2/1/2018 - 1/31/2019 | Reimbursed Expenses | (Recouped) Expenses | ||||||||||||||
Acadian Emerging Markets Managed Volatility | A | 1.75 | % | $ | 1,392 | $ | – | 2022 | ||||||||||
Acadian Emerging Markets Managed Volatility | C | 2.50 | % | 962 | – | 2022 | ||||||||||||
SGA Global Growth | Institutional | 0.98 | % | 68,928 | – | 2022 | ||||||||||||
SGA Global Growth | Y | 1.08 | % | 28,598 | – | 2022 | ||||||||||||
SGA Global Growth | Investor | 1.36 | % | 17,505 | – | 2022 | ||||||||||||
SGA Global Growth | A | 1.38 | % | 8,468 | – | 2022 | ||||||||||||
SGA Global Growth | C | 2.13 | % | 5,823 | – | 2022 | ||||||||||||
Of these amounts, $20,447 and $45,469 were disclosed as a receivable from the Manager on the Statements of Assets and Liabilities at January 31, 2019 for the Acadian Emerging Markets Managed Volatility Fund and SGA Global Growth Fund, respectively.
The Funds have adopted an Expense Reimbursement Plan whereby the Manager may seek repayment of such fee reductions and expense reimbursements. Under the policy, the Manager can be reimbursed by the Funds for any contractual or voluntary fee reductions or expense reimbursements if reimbursement to the Manager (a) occurs within three years after the Manager’s own waiver or reimbursement and (b) does not cause the Funds’ annual operating expenses to exceed the lesser of the contractual percentage limit in effect at the time of the waiver/reimbursement or time of recoupment. The reimbursed expenses listed above will expire in 2022. The Funds did not record a liability for potential reimbursements due to the current assessment that reimbursements are unlikely. The carryover of excess expenses potentially reimbursable to the Manager are as follows:
Fund | Recouped Expenses | Excess Expense Carryover | Expired Expense Carryover | Expiration of Reimbursed Expenses | ||||||||||||
Acadian Emerging Markets Managed Volatility | $ | – | $ | 93,050 | $ | – | $ | 2020 | ||||||||
Acadian Emerging Markets Managed Volatility | – | 207,848 | – | 2021 | ||||||||||||
SGA Global Growth | – | 123,518 | – | 2020 | ||||||||||||
SGA Global Growth | – | 96,126 | – | 2021 | ||||||||||||
The Distributor
Effective March 1, 2018, Resolute Investment Distributors, Inc. (“RID” or “Distributor”) replaced Foreside Fund Services, LLC (“Foreside”) as the Funds’ distributor and principal underwriter of the Funds’ shares.
RID is a registered broker-dealer and is a member of the Financial Industry Regulatory Authority, Inc. (“FINRA”). The Distributor is affiliated with the Manager through common ownership. Under a Distribution Agreement with the Trust, the Distributor acts as the distributor and principal underwriter of the Trust in connection with the continuous offering of shares of the Funds. The Distributor continually distributes shares of the Funds on a best efforts basis. The Distributor has no obligation to sell any specific quantity of the Funds’ shares. Pursuant to the Distribution Agreement, to the extent applicable, the Distributor receives, and mayre-allocate to broker-dealers, all or a portion of the sales charge paid by the purchasers of A Class and C Class shares. For A Class and C Class shares, the Distributor receives commission revenue consisting of the portion of A Class and C Class sales charge remaining after the allowances by the Distributor to the broker-dealers. The Distributor retains any portion of the commission fees that are not paid to the broker-dealers for use solely to pay distribution related expenses.
Prior to March 1, 2018, Foreside served as the distributor and principal underwriter of the Funds’ shares. Pursuant to aSub-Administration Agreement between Foreside and the Manager in effect through February 28, 2018, Foreside received a fee from the Manager for providing administrative services in connection with the marketing and distribution of shares of the Trust, including the registration of Manager employees as registered representatives of Foreside to facilitate distribution of Fund shares. Foreside also received a fee from the Manager under a Marketing Agreement pursuant to which Foreside provided services in connection with the marketing of a
32
American Beacon FundsSM
Notes to Financial Statements
January 31, 2019
Fund to institutional investors. Pursuant to the Distribution Agreement with the Trust in effect through February 28, 2018, Foreside received, and may havere-allocated to broker-dealers, all or a portion of the sales charge paid by the purchasers of A and C Class shares. For A and C Class shares, Foreside received commission revenues consisting of the portion of A and C Class sales charge remaining after the allowances by Foreside to the broker dealers. Foreside retained any portion of the commission fees that were not paid to the broker-dealers for use solely to pay distribution related expenses.
Sales Commissions
The Funds’ Distributor, formerly Foreside, may receive a portion of Class A sales charges from broker dealers and it may be used to offset distribution related expenses. During the period February 1, 2018 through February 28, 2018, Foreside collected $54 for SGA Global Growth Fund from the sale of Class A Shares. During the period March 1, 2018 through January 31, 2019, RID collected $8,316 for SGA Global Growth Fund from the sale of Class A Shares. Foreside and RID did not collect any Class A sales charges for Acadian Emerging Markets Managed Volatility Fund during the year ended January 31, 2019.
A CDSC of 0.50% will be deducted with respect to Class A Shares on certain purchases of $1,000,000 or more that are redeemed in whole or part within 18 months of purchase, unless waived as discussed in the Funds’ Prospectus. Any applicable CDSC will be 0.50% of the lesser of the original purchase price or the value of the redemption of the Class A Shares redeemed. During the year ended January 31, 2019, there were no CDSC fees collected for Class A Shares of the Funds.
A CDSC of 1.00% will be deducted with respect to Class C Shares redeemed within 12 months of purchase, unless waived as discussed in the Funds’ Prospectus. Any applicable CDSC will be 1.00% of the lesser of the original purchase price or the value of the redemption of the Class C Shares redeemed. During the period February 1, 2018 through February 28, 2018, CDSC fees of $41 were collected by Foreside for Class C Shares of the SGA Global Growth Fund. During the period March 1, 2018 through January 31, 2019, RID collected $1,309 in CDSC fees for SGA Global Growth Fund for Class C Shares. Foreside and RID did not collect any CDSC fees for Class C Shares for Acadian Emerging Markets Managed Volatility Fund during the year ended January 31, 2019.
Trustee Fees and Expenses
As compensation for their service to the Trust, American Beacon Select Funds, American Beacon Institutional Funds Trust, American Beacon Sound Point Enhanced Income Fund, and American Beacon Apollo Total Return Fund, each Trustee receives an annual retainer of $120,000, plus $10,000 for each Board meeting attended in person or via teleconference, $2,500 for attendance by Committee members at meetings of the Audit Committee and the Investment Committee, and $1,500 for attendance by Committee members at meetings of the Nominating and Governance Committee, plus reimbursement of reasonable expenses incurred in attending Board meetings, Committee meetings, and relevant educational seminars. The Trustees also may be compensated for attendance at special Board and/or Committee meetings from time to time. The Board Chair receives an additional annual retainer of $50,000 as well as a $2,500 fee each quarter for attendance at the committee meetings. The Chairpersons of the Audit Committee and the Investment Committee each receive an additional annual retainer of $25,000 and the Chairman of the Nominating and Governance Committee receives an additional annual retainer of $10,000. These expenses are allocated on a prorated basis to each Fund of the Trusts according to its respective net assets.
3. Security Valuation and Fair Value Measurements
The price of the Fund’s shares is based on its net asset value (“NAV”) per share. The Fund’s NAV is computed by adding total assets, subtracting all the Fund’s liabilities, and dividing the result by the total number of shares outstanding.
33
American Beacon FundsSM
Notes to Financial Statements
January 31, 2019
The NAV of each class of the Fund’s shares is determined based on a pro rata allocation of the Fund’s investment income, expenses and total capital gains and losses. The Fund’s NAV per share is determined each business day as of the regular close of trading on the New York Stock Exchange (“NYSE” or “Exchange”), which is typically 4:00 p.m. Eastern Time (“ET”). However, if trading on the NYSE closes at a time other than 4:00 p.m. ET, the Fund’s NAV per share typically would still be determined as of the regular close of trading on the NYSE. The Fund does not price its shares on days that the NYSE is closed. Foreign exchanges may permit trading in foreign securities on days when the Fund is not open for business, which may result in the value of the Fund’s portfolio investments being affected at a time when you are unable to buy or sell shares.
Equity securities, including shares ofclosed-end funds and exchange-traded funds (“ETFs”), are valued at the last sale price or official closing price taken from the primary exchange in which each security trades. Investments in other mutual funds are valued at the closing NAV per share on the day of valuation. Debt securities are valued at bid quotes from broker/dealers or evaluated bid prices from pricing services, who may consider a number of inputs and factors, such as prices of comparable securities, yield curves, spreads, credit ratings, coupon rates, maturity, default rates, and underlying collateral. Futures are valued based on their daily settlement prices. Exchange-traded andover-the-counter (“OTC”) options are valued at the last sale price. Options with no last sale for the day are priced at mid quote. Swaps are valued at evaluated mid prices from pricing services.
The valuation of securities traded on foreign markets and certain fixed income securities will generally be based on prices determined as of the earlier closing time of the markets on which they primarily trade unless a significant event has occurred. When the Fund holds securities or other assets that are denominated in a foreign currency, the Fund will normally use the currency exchange rates as of 4:00 p.m. ET.
Securities may be valued at fair value, as determined in good faith and pursuant to procedures approved by the Board, under certain limited circumstances. For example, fair value pricing will be used when market quotations are not readily available or reliable, as determined by the Manager, such as when (i) trading for a security is restricted or stopped; (ii) a security’s trading market is closed (other than customary closings); or (iii) a security has beende-listed from a national exchange. A security with limited market liquidity may require fair value pricing if the Manager determines that the available price does not reflect the security’s true market value. In addition, if a significant event that the Manager determines to affect the value of one or more securities held by the Fund occurs after the close of a related exchange but before the determination of the Fund’s NAV, fair value pricing may be used on the affected security or securities. Securities of small-capitalization companies are also more likely to require a fair value determination using these procedures because they are more thinly traded and less liquid than the securities of larger-capitalization companies. The Fund may fair value securities as a result of significant events occurring after the close of the foreign markets in which the Fund invests as described below. In addition, the Fund may invest in illiquid securities requiring these procedures.
The Fund may use fair value pricing for securities primarily traded innon-U.S. markets because most foreign markets close well before the Fund’s pricing time of 4:00 p.m. ET. The earlier close of these foreign markets gives rise to the possibility that significant events, including broad market moves, may have occurred in the interim and may materially affect the value of those securities. If the Manager determines that the last quoted prices ofnon-U.S. securities will, in its judgment, materially affect the value of some or all its portfolio securities, the Manager can adjust the previous closing prices to reflect what it believes to be the fair value of the securities as of the close of the Exchange. In deciding whether it is necessary to adjust closing prices to reflect fair value, the Manager reviews a variety of factors, including developments in foreign markets, the performance of U.S. securities markets, and the performance of instruments trading in U.S. markets that represent foreign securities and baskets of foreign securities. These securities are fair valued using a pricing service, using methods approved by the Board, that considers the correlation of the trading patterns of the foreign security to intraday trading in the U.S. markets, based on indices of domestic securities and other appropriate indicators such as prices of relevant American Depositary Receipts (“ADRs”) and futures contracts. The Valuation Committee, established by the Board, may also fair value securities in other situations, such as when a particular foreign market is closed but the Fund is open. The Fund uses outside pricing services to provide closing prices and information to evaluate
34
American Beacon FundsSM
Notes to Financial Statements
January 31, 2019
and/or adjust those prices. As a means of evaluating its security valuation process, the Valuation Committee routinely compares closing prices, the next day’s opening prices in the same markets and adjusted prices.
Attempts to determine the fair value of securities introduce an element of subjectivity to the pricing of securities. As a result, the price of a security determined through fair valuation techniques may differ from the price quoted or published by other sources and may not accurately reflect the market value of the security when trading resumes. If a reliable market quotation becomes available for a security formerly valued through fair valuation techniques, the Manager compares the new market quotation to the fair value price to evaluate the effectiveness of the Fund’s fair valuation procedures. If any significant discrepancies are found, the Manager may adjust the Fund’s fair valuation procedures.
Valuation Inputs
Various inputs may be used to determine the fair value of the Funds’ investments. These inputs are summarized in three broad levels for financial statement purposes. The inputs or methodologies used to value securities are not necessarily an indication of the risk associated with investing in those securities.
| Level 1 | - | Quoted prices in active markets for identical securities. | ||
| Level 2 | - | Prices determined using other significant observable inputs. These may include quoted prices for similar securities, interest rates, prepayment speeds, credit risk, and others. | ||
| Level 3 | - | Prices determined using other significant unobservable inputs. Unobservable inputs reflect the Fund’s own assumptions about the factors market participants would use in pricing an investment. | ||
Level 1 and Level 2 trading assets and trading liabilities, at fair value
Common stocks, preferred securities, and financial derivative instruments, such as futures contracts that are traded on a national securities exchange, are stated at the last reported sale or settlement price on the day of valuation. To the extent these securities are actively traded and valuation adjustments are not applied, they are categorized as Level 1 of the fair value hierarchy. Preferred securities and other equities traded on inactive markets or valued by reference to similar instruments are generally categorized as Level 2 of the fair value hierarchy. Valuation adjustments may be applied to certain securities that are solely traded on a foreign exchange to account for the market movement between the close of the foreign market and the close of the Exchange. These securities are valued using pricing service providers that consider the correlation of the trading patterns of the foreign security to the intraday trading in the U.S. markets for investments. Securities using these valuation adjustments are categorized as Level 2 of the fair value hierarchy.
Investments in registeredopen-end investment management companies will be valued based upon the NAVs of such investments and are categorized as Level 1 of the fair value hierarchy.
Level 3 trading assets and trading liabilities, at fair value
The valuation techniques and significant inputs used in determining the fair values of financial instruments classified as Level 3 of the fair value hierarchy are as follows.
Securities and other assets for which market quotes are not readily available are valued at fair value as determined in good faith by the Board or persons acting at their direction and may be categorized as Level 3 of the fair value hierarchy.
Market quotes are considered not readily available in circumstances where there is an absence of current or reliable market-based data (e.g., trade information or broker quotes), including where events occur after the close of the relevant market, but prior to the Exchange close, that materially affect the values of the Fund’s securities or assets. In addition, market quotes are considered not readily available when, due to extraordinary
35
American Beacon FundsSM
Notes to Financial Statements
January 31, 2019
circumstances, the exchanges or markets on which the securities trade, do not open for trading for the entire day and no other market prices are available. The Board has delegated to the Manager the responsibility for monitoring significant events that may materially affect the fair values of a Fund’s securities or assets and for determining whether the value of the applicable securities or assets should bere-evaluated in light of such significant events.
The Board has adopted methods for valuing securities and other assets in circumstances where market quotes are not readily available, and has delegated the responsibility for applying the valuation methods to the Manager. For instances in which daily market quotes are not readily available, investments may be valued pursuant to guidelines established by the Board. In the event that the security or asset cannot be valued, pursuant to one of the valuation methods established by the Board, the fair value of the security or asset will be determined in good faith by the Valuation Committee, generally based upon recommendations provided by the Manager.
When a Fund uses fair valuation methods applied by the Manager that use significant unobservable inputs to determine its NAV, the securities priced using this methodology are categorized as Level 3 of the fair value hierarchy. These methods may require subjective determinations about the value of a security. While the Trust’s policy is intended to result in a calculation of the Fund’s NAV that fairly reflects security values as of the time of pricing, the Trust cannot guarantee that values determined by the Board or persons acting at their direction would accurately reflect the price that a Fund could obtain for a security if it were to dispose of that security as of the time of pricing (for instance, in a forced or distressed sale). The prices used by a Fund may differ from the value that would be realized if the securities were sold.
4. Securities and Other Investments
American Depositary Receipts andNon-Voting Depositary Receipts
ADRs are depositary receipts for foreign issuers in registered form traded in U.S. securities markets.Non-Voting Depositary Receipts (“NVDRs”) represent financial interests in an issuer but the holder is not entitled to any voting rights. Depositary receipts may not be denominated in the same currency as the securities into which they may be converted. Investing in depositary receipts entails substantially the same risks as direct investment in foreign securities. There is generally less publicly available information about foreign companies and there may be less governmental regulation and supervision of foreign stock exchanges, brokers, and listed companies. In addition, such companies may use different accounting and financial standards (and certain currencies may become unavailable for transfer from a foreign currency), resulting in the Fund’s possible inability to convert immediately into U.S. currency proceeds realized upon the sale of portfolio securities of the affected foreign companies. In addition, the Funds may invest in unsponsored depositary receipts, the issuers of which are not obligated to disclose material information about the underlying securities to investors in the United States. Ownership of unsponsored depositary receipts may not entitle the Funds to the same benefits and rights as ownership of a sponsored depositary receipt or the underlying security.
Common Stock
Common stock generally takes the form of shares in a corporation which represent an ownership interest. It ranks below preferred stock and debt securities in claims for dividends and for assets of the company in a liquidation or bankruptcy. The value of a company’s common stock may fall as a result of factors directly relating to that company, such as decisions made by its management or decreased demand for the company’s products or services. A stock’s value may also decline because of factors affecting not just the company, but also companies in the same industry or sector. The price of a company’s stock may also be affected by changes in financial markets that are relatively unrelated to the company, such as changes in interest rates, currency exchange rates or industry regulation. Companies that elect to pay dividends on their common stock generally only do so after they invest in their own business and make required payments to bondholders and on other debt and preferred stock. Therefore, the value of a company’s common stock will usually be more volatile than its bonds, other debt and preferred stock. Common stock may be exchange-traded or OTC. OTC stock may be less liquid than exchange-traded stock.
36
American Beacon FundsSM
Notes to Financial Statements
January 31, 2019
Foreign Securities
The Funds may invest in U.S. dollar-denominated andnon-U.S. dollar denominated equity and debt securities of foreign issuers and foreign branches of U.S. banks, including negotiable certificates of deposit (“CDs”), bankers’ acceptances, and commercial paper. Foreign issuers are issuers organized and doing business principally outside the United States and include corporations, banks,non-U.S. governments, and quasi-governmental organizations. While investments in foreign securities may be intended to reduce risk by providing further diversification, such investments involve sovereign and other risks, in addition to the credit and market risks normally associated with domestic securities. These additional risks include the possibility of adverse political and economic developments (including political or social instability, nationalization, expropriation, or confiscatory taxation); the potentially adverse effects of unavailability of public information regarding issuers, different governmental supervision and regulation of financial markets, reduced liquidity of certain financial markets, and the lack of uniform accounting, auditing, and financial reporting standards or the application of standards that are different or less stringent than those applied in the United States; different laws and customs governing securities tracking; and possibly limited access to the courts to enforce the Funds’ rights as an investor.
Illiquid and Restricted Securities
The Funds may invest in securities that are subject to legal or contractual restrictions on resale. These securities may be sold privately, but are required to be registered or exempted from such registration before being sold to the public. Private placement securities are generally considered to be restricted except for those securities traded between qualified institutional investors under the provisions of Rule 144A of the Securities Act of 1933 (the “Securities Act”). Illiquid securities have included securities that have not been registered under the Securities Act, securities that are otherwise not readily marketable, and repurchase agreements having a remaining maturity of longer than seven calendar days. Disposal of both illiquid and restricted securities may involve time-consuming negotiations and expenses, and prompt sale at an acceptable price may be difficult to achieve. The Funds did not hold any illiquid securities as of the year ended January 31, 2019.
Regulation S under the Securities Act permits the sale abroad of securities that are not registered for sale in the United States and includes a provision for U.S. investors, such as the Funds, to purchase such unregistered securities if certain conditions are met.
Other Investment Company Securities and Other Exchange-Traded Products
The Funds may invest in shares of other investment companies, includingopen-end funds,closed-end funds, business development companies, ETFs, unit investment trusts, and other investment companies of the Trust. The Funds may invest in investment company securities advised by the Manager or asub-advisor. Investments in the securities of other investment companies may involve duplication of advisory fees and certain other expenses. By investing in another investment company, the Funds become a shareholder of that investment company. As a result, the Funds’ shareholders indirectly will bear the Funds’ proportionate share of the fees and expenses paid by shareholders of the other investment company, in addition to the fees and expenses the Funds’ shareholders directly bear in connection with the Funds’ own operations. These other fees and expenses are reflected as Acquired Fund Fees and Expenses and are included in the Fees and Expenses Table for the Funds in their Prospectus, if applicable. Investments in other investment companies may involve the payment of substantial premiums above the value of such issuer’s portfolio securities.
Preferred Stock
A preferred stock blends the characteristics of a bond and common stock. It can offer the higher yield of a bond and has priority over common stock in equity ownership, but does not have the seniority of a bond and its participation in the issuer’s growth may be limited. Preferred stock generally has preference over common stock in
37
American Beacon FundsSM
Notes to Financial Statements
January 31, 2019
the receipt of dividends and in any residual assets after payment to creditors should the issuer be dissolved. Although the dividend is set at a fixed or variable rate, in some circumstances it can be changed or omitted by the issuer.
Real Estate Investment Trusts
The Funds may own shares of real estate investment trusts (“REITs”) which report information on the source of their distributions annually. The Fundsre-characterize distributions received from REIT investments based on information provided by the REITs into the following categories: ordinary income, long-term capital gains, and return of capital. If information is not available on a timely basis from the REITs, there-characterization will be estimated based on available information, which may include the previous year allocation. If new or additional information becomes available from the REITs at a later date, are-characterization will be made the following year.
5. Financial Derivative Instruments
The Funds may utilize derivative instruments to gain market exposure on cash balances to hedge foreign currency exposure or reduce market exposure in anticipation of liquidity needs. When considering the Funds’ use of derivatives, it is important to note that the Funds do not use derivatives for the purpose of creating financial leverage.
Futures Contracts
Futures contracts are contracts to buy or sell a standard quantity of securities at a specified price on a future date. The Funds may enter into financial futures contracts as a method for keeping assets readily convertible to cash if needed to meet shareholder redemptions or for other needs while maintaining exposure to the stock or bond market, as applicable. The primary risks associated with the use of futures contracts are the possibility of illiquid markets or imperfect correlation between the values of the contracts and the underlying securities or that the counterparty will fail to perform its obligations.
Upon entering into a futures contract, the Funds are required to set aside or deposit with a broker an amount, termed the initial margin, which typically represents a portion of the face value of the futures contract. The Funds usually reflects this amount on the Schedules of Investments as a U.S. Treasury Bill held as collateral for futures contracts or as cash deposited with broker on the Statements of Assets and Liabilities. Payments to and from the broker, known as variation margin, are required to be made on a daily basis as the price of the futures contract fluctuates. Changes in initial settlement values are accounted for as unrealized appreciation (depreciation) until the contracts are terminated, at which time realized gains and losses are recognized. Futures contracts are valued at the most recent settlement price established each day by the exchange on which they are traded.
During the year ended January 31, 2019, the Funds entered into futures contracts primarily for return enhancement and exposing cash to markets.
The Funds’ average futures contracts outstanding fluctuate throughout the operating year as required to meet strategic requirements. The following table illustrates the average quarterly volume of futures contracts. For purpose of this disclosure, volume is measured by contracts outstanding at each quarter end.
Average Futures Contracts Outstanding | ||
Fund | Year Ended January 31, 2019 | |
Acadian Emerging Markets Managed Volatility | 16 | |
SGA Global Growth | 26 | |
38
American Beacon FundsSM
Notes to Financial Statements
January 31, 2019
The following is a summary of the fair valuations of the Funds’ derivative instruments categorized by risk exposure(1):
Acadian Emerging Markets Managed Volatility Fund
| Fair values of financial instruments on the Statements of Assets and Liabilities as of January 31, 2019: |
| ||||||||||||||||||||||||||||||||||||||||||||||||||||||
| Derivatives not accounted for as hedging instruments | |||||||||||||||||||||||||||||||||||||||||||||||||||||||
Assets: | Credit contracts | Foreign exchange contracts | Commodity contracts | Interest rate contracts | Equity contracts | Total | |||||||||||||||||||||||||||||||||||||||||||||||||
| Receivable for variation margin from open futures contracts(2) | $ | – | $ | – | $ | – | $ | – | $ | 36,679 | $ | 36,679 | |||||||||||||||||||||||||||||||||||||||||||
| The effect of financial derivative instruments on the Statements of Operations as of January 31, 2019: |
| ||||||||||||||||||||||||||||||||||||||||||||||||||||||
| Derivatives not accounted for as hedging instruments | |||||||||||||||||||||||||||||||||||||||||||||||||||||||
Realized gain (loss) from derivatives | Credit contracts | Foreign exchange contracts | Commodity contracts | Interest rate contracts | Equity contracts | Total | |||||||||||||||||||||||||||||||||||||||||||||||||
| Futures contracts | $ | – | $ | – | $ | – | $ | – | $ | (209,857 | ) | $ | (209,857 | ) | |||||||||||||||||||||||||||||||||||||||||
Net change in unrealized appreciation | Credit contracts | Foreign exchange contracts | Commodity contracts | Interest rate contracts | Equity contracts | Total | |||||||||||||||||||||||||||||||||||||||||||||||||
| Futures contracts | $ | – | $ | – | $ | – | $ | – | $ | 23,293 | $ | 23,293 | |||||||||||||||||||||||||||||||||||||||||||
SGA Global Growth Fund
| Fair values of financial instruments on the Statements of Assets and Liabilities as of January 31, 2019: |
| ||||||||||||||||||||||||||||||||||||||||||||||||||||||
| Derivatives not accounted for as hedging instruments | |||||||||||||||||||||||||||||||||||||||||||||||||||||||
Assets: | Credit contracts | Foreign exchange contracts | Commodity contracts | Interest rate contracts | Equity contracts | Total | |||||||||||||||||||||||||||||||||||||||||||||||||
| Receivable for variation margin from open futures contracts(2) | $ | – | $ | – | $ | – | $ | – | $ | 128,231 | $ | 128,231 | |||||||||||||||||||||||||||||||||||||||||||
| The effect of financial derivative instruments on the Statements of Operations as of January 31, 2019: |
| ||||||||||||||||||||||||||||||||||||||||||||||||||||||
| Derivatives not accounted for as hedging instruments | |||||||||||||||||||||||||||||||||||||||||||||||||||||||
Realized gain (loss) from derivatives | Credit contracts | Foreign exchange contracts | Commodity contracts | Interest rate contracts | Equity contracts | Total | |||||||||||||||||||||||||||||||||||||||||||||||||
| Futures contracts | $ | – | $ | – | $ | – | $ | – | $ | (316,430 | ) | $ | (316,430 | ) | |||||||||||||||||||||||||||||||||||||||||
Net change in unrealized appreciation as a result from operations: | Credit contracts | Foreign exchange contracts | Commodity contracts | Interest rate contracts | Equity contracts | Total | |||||||||||||||||||||||||||||||||||||||||||||||||
| Futures contracts | $ | – | $ | – | $ | – | $ | – | $ | 112,278 | $ | 112,278 | |||||||||||||||||||||||||||||||||||||||||||
(1)See Note 3 in the Notes to Financial Statements for additional information.
(2)Includes cumulative appreciation (depreciation) of futures contracts as reported in the Fund’s Schedule of Investments footnotes. Only current day’s variation margin is reported within the Statements of Assets and Liabilities.
Offsetting Assets and Liabilities
The Funds are parties to enforceable master netting agreements between brokers and counterparties which provide for the right to offset under certain circumstances. The Funds employ multiple money managers and counterparties and have elected not to offset qualifying financial and derivative instruments on the Statements of
39
American Beacon FundsSM
Notes to Financial Statements
January 31, 2019
Assets and Liabilities, as such all financial and derivative instruments are presented on a gross basis. The impacts of netting arrangements that provide the right to offset are detailed below. The net amount represents the net receivable or payable that would be due from or to the counterparty in the event of default. Exposure from borrowings and other financing agreements such as repurchase agreements can only be netted across transactions governed by the same Master Agreement with the same legal entity. All amounts reported below represent the balance as of the report date, January 31, 2019.
Acadian Emerging Markets Managed Volatility Fund
| Offsetting of Financial and Derivative Assets as of January 31, 2019: |
| |||||||||||
| Assets | Liabilities | ||||||||||
| Futures Contracts | $ | 36,679 | $ | - | ||||||||
|
|
|
| |||||||||
| Total derivative assets and liabilities in the Statement of Assets and Liabilities | $ | 36,679 | $ | - | ||||||||
|
|
|
| |||||||||
| Derivatives not subject to a Master Netting Agreement or similar agreement (“MNA”) | $ | (36,679 | ) | $ | - | |||||||
|
|
|
| |||||||||
SGA Global Growth Fund
| Offsetting of Financial and Derivative Assets as of January 31, 2019: |
| |||||||||||
| Assets | Liabilities | ||||||||||
| Futures Contracts | $ | 128,231 | $ | - | ||||||||
|
|
|
| |||||||||
| Total derivative assets and liabilities in the Statement of Assets and Liabilities | $ | 128,231 | $ | - | ||||||||
|
|
|
| |||||||||
| Derivatives not subject to a Master Netting Agreement or similar agreement (“MNA”) | $ | (128,231 | ) | $ | - | |||||||
|
|
|
| |||||||||
6. Principal Risks
Investing in the Funds may involve certain risks including, but not limited to, those described below.
Counterparty Risk
The Funds are subject to the risk that a party or participant to a transaction, such as a broker or derivative counterparty, will be unwilling or unable to satisfy its obligation to make timely principal, interest or settlement payments or to otherwise honor its obligations to the Funds. As a result the Fund may obtain no recovery of its investment or may only obtain a limited recovery, and any recovery may be delayed. Not all derivative transactions require a counterparty to post collateral, which may expose the Fund to greater losses in the event of a default by a counterparty.
Currency Risk
The Funds may have exposure to foreign currencies by making direct investments innon-U.S. currencies, in securities denominated innon-U.S. currencies or by purchasing or selling forward foreign currency exchange contracts innon-U.S. currencies. Foreign currencies will fluctuate, and may decline in value relative to the U.S. dollar and other currencies and thereby affect the Funds’ investments in foreign(non-U.S.) currencies or in securities that traded in, and receive revenues in, or in derivatives that provide exposure to, foreign(non-U.S.) currencies.
Derivatives Risk
Derivatives may involve significant risk. The use of derivative instruments may expose the Funds to additional risks that they would not be subject to if they invested directly in the securities or other instruments underlying those derivatives, including the high degree of leverage often embedded in such instruments, and potential material and prolonged deviations between the theoretical value and realizable value of a derivative. Some derivatives have the potential for unlimited loss, regardless of the size of the Funds’ initial investment.
40
American Beacon FundsSM
Notes to Financial Statements
January 31, 2019
Derivatives may be illiquid and may be more volatile than other types of investments. The Funds may buy or sell derivatives not traded on an exchange and which may be subject to heightened liquidity and valuation risk. Derivative investments can increase portfolio turnover and transaction costs. Derivatives also are subject to counterparty risk. As a result, the Funds may obtain no recovery of their investment or may only obtain a limited recovery, and any recovery may be delayed. Not all derivative transactions require a counterparty to post collateral, which may expose the Funds to greater losses in the event of a default by a counterparty.
Emerging Markets Risk
When investing in emerging markets, the risks of investing in foreign securities are heightened. Emerging markets are generally smaller, less developed, less liquid and more volatile than the securities markets of the U.S. and other developed markets. There are also risks of: greater political uncertainties; an economy’s dependence on revenues from particular commodities or on international aid or development assistance; currency transfer restrictions; a limited number of potential buyers for such securities; and delays and disruptions in securities settlement procedures.
Equity Investments Risk
Equity securities are subject to market risk. The Fund’s investments in equity securities may include common stocks, preferred stocks, securities convertible into or exchangeable for common stocks, REITs, depositary receipts, and U.S. dollar-denominated foreign stocks traded on U.S. exchanges. Such investments may expose the Fund to additional risk. The value of a company’s common stock may fall as a result of factors affecting the company, companies in the same industry or sector, or the financial markets overall. Common stock generally is subordinate to preferred stock upon the liquidation or bankruptcy of the issuing company. Preferred stocks are sensitive to movements in interest rates. Preferred stocks may be less liquid than common stocks and, unlike common stocks, participation in the growth of an issuer may be limited. Distributions on preferred stocks generally are payable at the discretion of an issuer and after required payments to bond holders. Convertible securities are subject to the risk that the credit standing of the issuer may have an effect on the convertible securities’ investment value. Investments in REITs are subject to the risks associated with investing in the real estate industry such as adverse developments affecting the real estate industry and real property values. Depositary receipts are subject to certain of the risks associated with investing directly in foreign securities, including, but not limited to, currency exchange rate fluctuations, political and financial instability in the home country of a particular depositary receipt, less liquidity and more volatility, less government regulation and supervision and delays in transaction settlement.
Foreign Investing Risk
Non-U.S. investments carry potential risks not associated with U.S. investments. Such risks include, but are not limited to: (1) currency exchange rate fluctuations, (2) political and financial instability, (3) less liquidity and greater volatility, (4) lack of uniform accounting, auditing and financial reporting standards, (5) increased price volatility, (6) less government regulation and supervision of foreign stock exchanges, brokers and listed companies, and (7) delays in transaction settlement in some foreign markets.
Futures Contracts Risk
Futures contracts are derivative instruments where one party pays a fixed price for an agreed amount of securities or other underlying assets at an agreed date. The use of such derivative instruments may expose the Funds to additional risks that they would not be subject to if they invested directly in the securities underlying those derivatives. Futures contracts may experience potentially dramatic price changes (losses) and imperfect correlation between the price of the contract and the underlying security or index, which will increase the volatility of the Funds and may involve a small investment of cash (the amount of initial and variation margin) relative to the magnitude of the risk assumed (the potential increase or decrease in the price of the futures contract).
41
American Beacon FundsSM
Notes to Financial Statements
January 31, 2019
Market Risk
Since the financial crisis that started in 2008, the U.S. and many foreign economies continue to experience its after-effects. Conditions in the U.S. and many foreign economies have resulted, and may continue to result, in certain instruments experiencing unusual liquidity issues, increased price volatility and, in some cases, credit downgrades and increased likelihood of default. These events have reduced the willingness and ability of some lenders to extend credit, and have made it more difficult for some borrowers to obtain financing on attractive terms, if at all. In some cases, traditional market participants have been less willing to make a market in some types of debt instruments, which has affected the liquidity of those instruments. During times of market turmoil, investors tend to look to the safety of securities issued or backed by the U.S. Treasury, causing the prices of these securities to rise and the yields to decline. Reduced liquidity in fixed income and credit markets may negatively affect many issuers worldwide. In addition, global economies and financial markets are becoming increasingly interconnected, which increases the possibilities that conditions in one country or region might adversely impact issuers in a different country or region. A rise in protectionist trade policies, and the possibility of changes to some international trade agreements, could affect the economies of many nations in ways that cannot necessarily be foreseen at the present time.
In response to the financial crisis, the U.S. and other governments and the Federal Reserve and certain foreign central banks have taken steps to support financial markets. In some countries where economic conditions are recovering, they are nevertheless perceived as still fragile. Withdrawal of government support, failure of efforts in response to the crisis, or investor perception that such efforts are not succeeding, could adversely impact the value and liquidity of certain securities. The severity or duration of adverse economic conditions may also be affected by policy changes made by governments or quasi-governmental organizations, including changes in tax laws. The impact of new financial regulation legislation on the markets and the practical implications for market participants may not be fully known for some time. Regulatory changes are causing some financial services companies to exit long-standing lines of business, resulting in dislocations for other market participants. In addition, political and diplomatic events within the U.S. and abroad, such as the U.S. government’s inability at times to agree on a long-term budget and deficit reduction plan, the threat of a federal government shutdown and threats not to increase the federal government’s debt limit, may affect investor and consumer confidence and may adversely impact financial markets and the broader economy, perhaps suddenly and to a significant degree. The U.S. government has recently reduced federal corporate income tax rates, and future legislative, regulatory and policy changes may result in more restrictions on international trade, less stringent prudential regulation of certain players in the financial markets, and significant new investments in infrastructure and national defense. Markets may react strongly to expectations about the changes in these policies, which could increase volatility, especially if the markets’ expectations for changes in government policies are not borne out.
Changes in market conditions will not have the same impact on all types of securities. Interest rates have been unusually low in recent years in the U.S. and abroad. Because there is little precedent for this situation, it is difficult to predict the impact of a significant rate increase on various markets. For example, because investors may buy securities or other investments with borrowed money, a significant increase in interest rates may cause a decline in the markets for those investments. Because of the sharp decline in the worldwide price of oil, there is a concern that oil producing nations may withdraw significant assets now held in U.S. Treasuries, which could force a substantial increase in interest rates. Regulators have expressed concern that rate increases may cause investors to sell fixed income securities faster than the market can absorb them, contributing to price volatility. In addition, there is a risk that the prices of goods and services in the U.S. and many foreign economies may decline over time, known as deflation (the opposite of inflation). Deflation may have an adverse effect on stock prices and creditworthiness and may make defaults on debt more likely. If a country’s economy slips into a deflationary pattern, it could last for a prolonged period and may be difficult to reverse. The precise details and the resulting impact of the United Kingdom’s vote to leave the European Union (the “EU”), commonly referred to as “Brexit,” are not yet known. The effect on the United Kingdom’s economy will likely depend on the nature of trade relations with the EU and other major economies following its exit, which are matters to be negotiated. The outcomes may cause increased volatility and have a significant adverse impact on world financial markets, other international
42
American Beacon FundsSM
Notes to Financial Statements
January 31, 2019
trade agreements, and the United Kingdom and European economies, as well as the broader global economy for some time, which could significantly adversely affect the value of the Fund’s investments in the United Kingdom and Europe.
Market Timing Risk
Because the Fund invests in foreign securities, it is particularly subject to the risk of market timing activities. Frequent trading by Fund shareholders poses risks to other shareholders in the Fund, including (i) the dilution of the Fund’s NAV, (ii) an increase in the Fund’s expenses, and (iii) interference with the portfolio manager’s ability to execute efficient investment strategies. Because of specific securities in which the Fund may invest, it could be subject to the risk of market timing activities by shareholders. Some examples of these types of securities are high-yield and foreign securities. The limited trading activity of some high-yield securities may result in market prices that do not reflect the true market value of these securities. The Funds generally prices foreign securities using their closing prices from the foreign markets in which they trade, typically prior to the Funds’ calculation of its NAV. These prices may be affected by events that occur after the close of a foreign market but before the Funds price its shares. In such instances, the Funds may fair value high yield and foreign securities. However, some investors may engage in frequent short-term trading in the Funds to take advantage of any price differentials that may be reflected in the NAV of the Funds’ shares. While the Manager monitors trading in the Funds, there is no guarantee that it can detect all market timing activities.
Other Investment Companies Risk
The Funds may invest in shares of other registered investment companies, including money market funds. To the extent that the Funds invest in shares of other registered investment companies, the Funds will indirectly bear the fees and expenses charged by the underlying funds in addition to the Fund’s direct fees and expenses and will be subject to the risks associated with investments in those companies.
Securities Lending Risk
A Fund may lend its portfolio securities to brokers, dealers and financial institutions to seek income. There is a risk that a borrower may default on its obligations to return loaned securities; however, a Fund’s securities lending agent may indemnify the Fund against that risk. There is a risk that the assets of a Fund’s securities lending agent may be insufficient to satisfy any contractual indemnification requirements to the Fund. Borrowers of a Fund’s securities typically provide collateral in the form of cash that is reinvested in securities. A Fund will be responsible for the risks associated with the investment of cash collateral, including any collateral invested in an affiliated money market fund. A Fund may lose money on its investment of cash collateral or may fail to earn sufficient income on its investment to meet obligations to the borrower. In addition, delays may occur in the recovery of securities from borrowers, which could interfere with a Fund’s ability to vote proxies or to settle transactions and there is the risk of possible loss of rights in the collateral should the borrower fail financially.
Valuation Risk
The Funds may value certain assets at a price different from the price at which they can be sold. This risk may be especially pronounced for investments, such as certain derivatives, which may be illiquid or which may become illiquid.
7. Federal Income and Excise Taxes
It is the policy of each Fund to qualify as a regulated investment company (“RIC”), by complying with all applicable provisions of Subchapter M of the Internal Revenue Code, as amended, and to make distributions of taxable income sufficient to relieve it from substantially all federal income and excise taxes. For federal income tax purposes, each Fund is treated as a single entity for the purpose of determining such qualification.
43
American Beacon FundsSM
Notes to Financial Statements
January 31, 2019
The Funds do not have any unrecorded tax liabilities in the accompanying financial statements. Each of the tax years in the four year period ended January 31, 2019 remain subject to examination by the Internal Revenue Service. If applicable, the Funds recognize interest accrued related to unrecognized tax benefits in interest expense and penalties in “Other expenses” on the Statements of Operations.
The Funds may be subject to taxes imposed by countries in which it invests. Such taxes are generally based on returns of income earned or gains realized or repatriated. Taxes are accrued and applied to net investment income, net realized capital gains and net unrealized appreciation (depreciation), as applicable, as the income is earned or capital gains are recorded.
Dividends are categorized in accordance with income tax regulations which may treat certain transactions differently than U.S. GAAP. Accordingly, the character of distributions and composition of net assets for tax purposes may differ from those reflected in the accompanying financial statements. The Funds also utilize earnings and profits distributed to shareholders on redemptions of shares as part of the dividends paid deduction.
The tax character of distributions paid were as follows:
| Acadian Emerging Markets Managed Volatility Fund | SGA Global Growth Fund | |||||||||||||||||||||||||||
| Year Ended January 31, 2019 | Year Ended January 31, 2018 | Year Ended January 31, 2019 | Year Ended January 31, 2018 | |||||||||||||||||||||||||
Distributions paid from: |
| |||||||||||||||||||||||||||
Ordinary income* |
| |||||||||||||||||||||||||||
Institutional Class | $ | 130,377 | $ | 100,822 | $ | 105,340 | $ | 280,924 | ||||||||||||||||||||
Y Class | 723,726 | 480,371 | 70,395 | 86,030 | ||||||||||||||||||||||||
Investor Class | 76,685 | 69,880 | 30,009 | 357,376 | ||||||||||||||||||||||||
A Class | 10,753 | 14,170 | 15,391 | 70,201 | ||||||||||||||||||||||||
C Class | 3,640 | 5,253 | 11,816 | 32,980 | ||||||||||||||||||||||||
Long-term capital gains | ||||||||||||||||||||||||||||
Institutional Class | 113,458 | – | 900,473 | 184,708 | ||||||||||||||||||||||||
Y Class | 629,809 | – | 601,755 | 56,564 | ||||||||||||||||||||||||
Investor Class | 66,733 | – | 256,518 | 234,974 | ||||||||||||||||||||||||
A Class | 9,984 | – | 131,574 | 46,157 | ||||||||||||||||||||||||
C Class | 6,067 | – | 101,001 | 21,684 | ||||||||||||||||||||||||
|
|
|
|
|
|
|
| |||||||||||||||||||||
Total distributions paid | $ | 1,771,232 | $ | 670,496 | $ | 2,224,272 | $ | 1,371,598 | ||||||||||||||||||||
|
|
|
|
|
|
|
| |||||||||||||||||||||
*For tax purposes, short-term capital gains are considered ordinary income distributions.
As of January 31, 2019, the components of distributable earnings (deficits) on a tax basis were as follows:
Fund | Tax Cost | Unrealized Appreciation | Unrealized (Depreciation) | Net Unrealized Appreciation (Depreciation) | ||||||||||||||||||||||||
| Acadian Emerging Markets Managed Volatility | $ | 30,553,591 | $ | 5,319,448 | $ | (974,435 | ) | $ | 4,345,013 | |||||||||||||||||||
| SGA Global Growth | 41,930,751 | 7,926,612 | (314,559 | ) | 7,612,053 | |||||||||||||||||||||||
Fund | Net Unrealized Appreciation (Depreciation) | Undistributed Ordinary Income | Undistributed Long-Term Capital Gains | Accumulated Capital and Other (Losses) | Other Temporary Differences | Distributable Earnings | ||||||||||||||||||||||||||||||||||||||
| Acadian Emerging Markets Managed Volatility | $ | 4,345,013 | $ | 134,587 | $ | 88,366 | $ | – | $ | 1 | $ | 4,567,967 | ||||||||||||||||||||||||||||||||
| SGA Global Growth | 7,612,053 | – | – | (599,549 | ) | – | 7,012,504 | |||||||||||||||||||||||||||||||||||||
Financial reporting records are adjusted for permanent book/tax differences to reflect tax character. Financial records are not adjusted for temporary differences. The temporary differences between financial reporting andtax-basis reporting of unrealized appreciation (depreciation) are attributable primarily to the tax deferral of losses from wash sales, the tax deferral of qualified late year capital losses, the realization for tax purposes of unrealized gains (losses) on investments in passive foreign investment companies and the realization for tax purposes of unrealized gains (losses) on certain derivative instruments.
44
American Beacon FundsSM
Notes to Financial Statements
January 31, 2019
Due to inherent differences in the recognition of income, expenses, and realized gains (losses) under U.S. GAAP and federal income tax regulations, permanent differences between book and tax reporting have been identified and appropriately reclassified on the Statements of Assets and Liabilities.
Accordingly, the following amounts represent current year permanent differences as of January 31, 2019:
Fund | Paid-In-Capital | Distributable Earnings/(Deficits) | ||||||||||
| Acadian Emerging Markets Managed Volatility | $ | – | $ | – | ||||||||
| SGA Global Growth | (34,379 | ) | 34,379 | |||||||||
Under the Regulated Investment Company Modernization Act of 2010 (“RIC MOD”), net capital losses recognized by the Funds in taxable years beginning after December 22, 2010 are carried forward indefinitely and retain their character as short-term and/or long-term losses.
As of January 31, 2019, the Funds did not have any capital loss carryforwards.
The Funds are permitted for tax purposes to defer into the next fiscal year qualified late year losses. Qualified late year capital losses are any capital losses incurred after October 31 through the Fund’s fiscal year end, January 31, 2019. Qualified late year ordinary losses are specified losses generally incurred after October 31 through the Fund’s fiscal year end, January 31, 2019. For the period ending January 31, 2019, SGA Global Growth deferred $360,331 short-term capital losses, $208,320 long-term capital losses, and $30,898 ordinary losses to February 1, 2019.
8. Investment Transactions
The aggregate cost of purchases and proceeds from sales and maturities of investments, other than short-term obligations, for the year ended January 31, 2019 were as follows:
Fund | Purchases (non-U.S. Government Securities) | Sales (non-U.S. Government Securities) | ||||||||||
| Acadian Emerging Markets Managed Volatility | $ | 9,570,713 | $ | 9,553,084 | ||||||||
| SGA Global Growth | 29,942,805 | 26,138,156 | ||||||||||
A summary of the Funds’ transactions in the USG Select Fund for the year ended January 31, 2019 were as follows:
Fund | Type of Transaction | January 31, 2018 Shares/Fair Value | Purchases | Sales | January 31, 2019 Shares/Fair Value | Dividend Income | ||||||||||||||||||||||||||||||||||||
| Acadian Emerging Markets Managed Volatility | Direct | $ | 594,472 | $ | 11,887,972 | $ | 12,090,360 | $ | 392,084 | $ | 12,018 | |||||||||||||||||||||||||||||||
| Acadian Emerging Markets Managed Volatility | Securities Lending | 98,112 | 2,105,290 | 2,203,402 | - | N/A | ||||||||||||||||||||||||||||||||||||
| SGA Global Growth | Direct | 2,508,026 | 42,668,425 | 42,764,012 | 2,412,439 | 48,196 | ||||||||||||||||||||||||||||||||||||
| SGA Global Growth | Securities Lending | 868,249 | 6,578,947 | 7,447,196 | - | N/A | ||||||||||||||||||||||||||||||||||||
9. Securities Lending
The Funds may lend their securities to qualified financial institutions, such as certain broker-dealers, to earn additional income. The borrowers are required to secure their loans continuously with collateral in an amount at least equal to the fair value of the securities loaned, initially in an amount at least equal to 102% of the fair value of domestic securities loaned and 105% of the fair value of international securities loaned. Collateral is monitored
45
American Beacon FundsSM
Notes to Financial Statements
January 31, 2019
andmarked-to-market daily. Dailymark-to-market amounts are required to be paid to the borrower or received from the borrower by the end of the following business day. This one day settlement formark-to-market amounts may result in the collateral being temporarily less than the value of the securities on loan or temporarily more than the required minimum collateral.
To the extent that a loan is collateralized by cash, such cash collateral shall be invested by the securities lending agent (the “Agent”) in money market mutual funds and other short-term investments as designated by the Manager.
Securities lending income is generated from the demand premium (if any) paid by the borrower to borrow a specific security and from the return on investment of cash collateral, reduced by negotiated rebate fees paid to the borrower and transaction costs. To the extent that a loan is secured bynon-cash collateral, securities lending income is generated as a demand premium reduced by transaction costs. The Funds, the Agent, and the Manager retained 80%, 10%, and 10%, respectively, of the income generated from securities lending.
While securities are on loan, the Funds continue to receive certain income associated with that security and any gain or loss in the market price that may occur during the term of the loan. In the case of domestic equities, the value of any dividend is received in the form of a substitute payment approximately equal to the dividend. In the case of foreign securities, a negotiated amount is received that is less than the actual dividend, but higher than the dividend amount minus the foreign tax that the Funds would be subject to on the dividend.
Securities lending transactions pose certain risks to the Funds, including that the borrower may not provide additional collateral when required or return the securities when due, that the value of the short-term investments will be less than the amount of cash collateral required to be returned to the borrower, thatnon-cash collateral may be subject to legal constraints in the event of a borrower bankruptcy, and that the cash collateral investments could become illiquid and unable to be used to return collateral to the borrower. The Funds could also experience delays and costs in gaining access to the collateral. The Funds bear the risk of any deficiency in the amount of the cash collateral available for return to the borrower and any action which impairs its ability to liquidatenon-cash collateral to satisfy a borrower default.
Cash collateral is listed on the Funds’ Schedules of Investments and is shown on the Statements of Assets and Liabilities. Income earned on these investments is included in “Income derived from securities lending” on the Statements of Operations.
Non-cash collateral received by the Funds may not be sold orre-pledged except to satisfy a borrower default. Therefore,non-cash collateral is not included on the Funds’ Schedules of Investments or Statements of Assets and Liabilities.
The Funds did not have any securities on loan or hold any securities lending collateral as of the year ended January 31, 2019.
10. Borrowing Arrangements
Effective November 15, 2018 (the “Effective Date”), the Funds, along with certain other funds managed by the Manager (“Participating Funds”), entered into a committed revolving line of credit (the “Committed Line”) agreement with State Street Bank and Trust Company (the “Bank”) to be used to facilitate portfolio liquidity. The maximum borrowing amount under the Committed Line is $250 million with interest at a rate equal to the higher of(a) one-month London Inter-Bank Offered Rate (“LIBOR”) plus 1.25% per annum or (b) the Federal Funds rate plus 1.25% per annum on amounts borrowed. Each of the Participating Funds will pay a closing fee of $100,000 on the Effective Date and a quarterly commitment fee at a rate of 0.25% per annum on the unused portion of the Committed Line amount. The Committed Line expires November 14, 2019, unless extended by the Bank or terminated by the Participating Funds in accordance with the agreement.
46
American Beacon FundsSM
Notes to Financial Statements
January 31, 2019
On the Effective Date, the Funds, along with certain other Participating Funds managed by the Manager, also entered into an uncommitted discretionary demand revolving line of credit (the “Uncommitted Line”) agreement with the Bank to be used to facilitate portfolio liquidity. The maximum borrowing amount under the Uncommitted Line is $50 million with interest at a rate equal to the higher of(a) one-month LIBOR plus 1.25% per annum or (b) the Federal Funds rate plus 1.25% per annum on each outstanding loan. Each of the Participating Funds will pay a closing fee of $35,000 on the Effective Date. The Uncommitted Line expires November 14, 2019 unless extended by the Bank or terminated by the Participating Funds in accordance with the agreement.
The Participating Funds paid administration, legal and arrangement fees, which are recognized as a component of “Other expenses” on the Statements of Operations, along with commitment fees, that have been allocated among the Participating Funds based on average daily net assets.
During the year ended January 31, 2019, the Funds did not utilize this facility.
11. Capital Share Transactions
The tables below summarize the activity in capital shares for each Class of the Funds:
| Institutional Class | ||||||||||||||||||||||||||||
| Year Ended January 31, | ||||||||||||||||||||||||||||
| 2019 | 2018 | |||||||||||||||||||||||||||
Acadian Emerging Markets Managed Volatility Fund | Shares | Amount | Shares | Amount | ||||||||||||||||||||||||
| Shares sold | 102,960 | $ | 1,125,554 | 118,476 | $ | 1,192,443 | ||||||||||||||||||||||
| Reinvestment of dividends | 24,555 | 243,835 | 9,318 | 100,822 | ||||||||||||||||||||||||
| Shares redeemed | (132,463 | ) | (1,430,096 | ) | (5,369,441 | ) | (52,389,780 | ) | ||||||||||||||||||||
| Redemption fees | – | 2,672 | – | 607 | ||||||||||||||||||||||||
|
|
|
|
|
|
|
| |||||||||||||||||||||
| Net (decrease) in shares outstanding | (4,948 | ) | $ | (58,035 | ) | (5,241,647 | ) | $ | (51,095,908 | ) | ||||||||||||||||||
|
|
|
|
|
|
|
| |||||||||||||||||||||
| Y Class | ||||||||||||||||||||||||||||
| Year Ended January 31, | ||||||||||||||||||||||||||||
| 2019 | 2018 | |||||||||||||||||||||||||||
Acadian Emerging Markets Managed Volatility Fund | Shares | Amount | Shares | Amount | ||||||||||||||||||||||||
| Shares sold | 740,434 | $ | 7,994,911 | 661,605 | $ | 6,777,368 | ||||||||||||||||||||||
| Reinvestment of dividends | 130,311 | 1,287,472 | 43,146 | 465,116 | ||||||||||||||||||||||||
| Shares redeemed | (710,915 | ) | (7,703,853 | ) | (1,880,829 | ) | (18,422,329 | ) | ||||||||||||||||||||
| Redemption fees | – | 11,668 | – | (310 | ) | |||||||||||||||||||||||
|
|
|
|
|
|
|
| |||||||||||||||||||||
| Net increase (decrease) in shares outstanding | 159,830 | $ | 1,590,198 | (1,176,078 | ) | $ | (11,180,155 | ) | ||||||||||||||||||||
|
|
|
|
|
|
|
| |||||||||||||||||||||
| Investor Class | ||||||||||||||||||||||||||||
| Year Ended January 31, | ||||||||||||||||||||||||||||
| 2019 | 2018 | |||||||||||||||||||||||||||
Acadian Emerging Markets Managed Volatility Fund | Shares | Amount | Shares | Amount | ||||||||||||||||||||||||
| Shares sold | 55,053 | $ | 582,905 | 104,015 | $ | 1,045,237 | ||||||||||||||||||||||
| Reinvestment of dividends | 14,395 | 141,069 | 6,508 | 69,770 | ||||||||||||||||||||||||
| Shares redeemed | (60,515 | ) | (635,338 | ) | (229,184 | ) | (2,397,931 | ) | ||||||||||||||||||||
| Redemption fees | – | 1,281 | – | 126 | ||||||||||||||||||||||||
|
|
|
|
|
|
|
| |||||||||||||||||||||
| Net increase (decrease) in shares outstanding | 8,933 | $ | 89,917 | (118,661 | ) | $ | (1,282,798 | ) | ||||||||||||||||||||
|
|
|
|
|
|
|
| |||||||||||||||||||||
| A Class | ||||||||||||||||||||||||||||
| Year Ended January 31, | ||||||||||||||||||||||||||||
| 2019 | 2018 | |||||||||||||||||||||||||||
Acadian Emerging Markets Managed Volatility Fund | Shares | Amount | Shares | Amount | ||||||||||||||||||||||||
| Shares sold | 6,847 | $ | 74,480 | 24,494 | $ | 259,607 | ||||||||||||||||||||||
| Reinvestment of dividends | 2,107 | 20,736 | 1,319 | 14,170 | ||||||||||||||||||||||||
| Shares redeemed | (44,210 | ) | (477,632 | ) | (8,724 | ) | (88,067 | ) | ||||||||||||||||||||
| Redemption fees | – | 302 | – | 1,001 | ||||||||||||||||||||||||
|
|
|
|
|
|
|
| |||||||||||||||||||||
| Net increase (decrease) in shares outstanding | (35,256 | ) | $ | (382,114 | ) | 17,089 | $ | 186,711 | ||||||||||||||||||||
|
|
|
|
|
|
|
| |||||||||||||||||||||
47
American Beacon FundsSM
Notes to Financial Statements
January 31, 2019
| C Class | ||||||||||||||||||||||||||||
| Year Ended January 31, | ||||||||||||||||||||||||||||
| 2019 | 2018 | |||||||||||||||||||||||||||
Acadian Emerging Markets Managed Volatility Fund | Shares | Amount | Shares | Amount | ||||||||||||||||||||||||
| Shares sold | 2,651 | $ | 27,000 | 22,464 | $ | 219,407 | ||||||||||||||||||||||
| Reinvestment of dividends | 994 | 9,707 | 495 | 5,253 | ||||||||||||||||||||||||
| Shares redeemed | (26,413 | ) | (273,213 | ) | (29,030 | ) | (294,012 | ) | ||||||||||||||||||||
| Redemption fees | – | 208 | – | 20 | ||||||||||||||||||||||||
|
|
|
|
|
|
|
| |||||||||||||||||||||
| Net (decrease) in shares outstanding | (22,768 | ) | $ | (236,298 | ) | (6,071 | ) | $ | (69,332 | ) | ||||||||||||||||||
|
|
|
|
|
|
|
| |||||||||||||||||||||
| Institutional Class | ||||||||||||||||||||||||||||
| Year Ended January 31, | ||||||||||||||||||||||||||||
| 2019 | 2018 | |||||||||||||||||||||||||||
SGA Global Growth Fund | Shares | Amount | Shares | Amount | ||||||||||||||||||||||||
| Shares sold | 747,781 | $ | 14,323,321 | 297,426 | $ | 5,174,249 | ||||||||||||||||||||||
| Reinvestment of dividends | 56,941 | 977,677 | 24,913 | 465,632 | ||||||||||||||||||||||||
| Shares redeemed | (82,296 | ) | (1,552,294 | ) | (40,518 | ) | (727,410 | ) | ||||||||||||||||||||
|
|
|
|
|
|
|
| |||||||||||||||||||||
| Net increase in shares outstanding | 722,426 | $ | 13,748,704 | 281,821 | $ | 4,912,471 | ||||||||||||||||||||||
|
|
|
|
|
|
|
| |||||||||||||||||||||
| Y Class | ||||||||||||||||||||||||||||
| Year Ended January 31, | ||||||||||||||||||||||||||||
| 2019 | 2018 | |||||||||||||||||||||||||||
SGA Global Growth Fund | Shares | Amount | Shares | Amount | ||||||||||||||||||||||||
| Shares sold | 743,521 | $ | 14,797,984 | 202,621 | $ | 3,631,956 | ||||||||||||||||||||||
| Reinvestment of dividends | 39,099 | 667,422 | 7,121 | 132,444 | ||||||||||||||||||||||||
| Shares redeemed | (660,805 | ) | (11,630,460 | ) | (36,662 | ) | (660,523 | ) | ||||||||||||||||||||
|
|
|
|
|
|
|
| |||||||||||||||||||||
| Net increase in shares outstanding | 121,815 | $ | 3,834,946 | 173,080 | $ | 3,103,877 | ||||||||||||||||||||||
|
|
|
|
|
|
|
| |||||||||||||||||||||
| Investor Class | ||||||||||||||||||||||||||||
| Year Ended January 31, | ||||||||||||||||||||||||||||
| 2019 | 2018 | |||||||||||||||||||||||||||
SGA Global Growth Fund | Shares | Amount | Shares | Amount | ||||||||||||||||||||||||
| Shares sold | 166,531 | $ | 3,135,589 | 338,281 | $ | 5,871,708 | ||||||||||||||||||||||
| Reinvestment of dividends | 17,024 | 285,834 | 32,263 | 592,350 | ||||||||||||||||||||||||
| Shares redeemed | (853,695 | ) | (16,485,577 | ) | (150,290 | ) | (2,633,764 | ) | ||||||||||||||||||||
|
|
|
|
|
|
|
| |||||||||||||||||||||
| Net increase (decrease) in shares outstanding | (670,140 | ) | $ | (13,064,154 | ) | 220,254 | $ | 3,830,294 | ||||||||||||||||||||
|
|
|
|
|
|
|
| |||||||||||||||||||||
| A Class | ||||||||||||||||||||||||||||
| Year Ended January 31, | ||||||||||||||||||||||||||||
| 2019 | 2018 | |||||||||||||||||||||||||||
SGA Global Growth Fund | Shares | Amount | Shares | Amount | ||||||||||||||||||||||||
| Shares sold | 90,750 | $ | 1,743,775 | 164,780 | $ | 2,822,687 | ||||||||||||||||||||||
| Reinvestment of dividends | 8,089 | 135,652 | 6,125 | 112,333 | ||||||||||||||||||||||||
| Shares redeemed | (89,505 | ) | (1,712,324 | ) | (45,538 | ) | (748,714 | ) | ||||||||||||||||||||
|
|
|
|
|
|
|
| |||||||||||||||||||||
| Net increase in shares outstanding | 9,334 | $ | 167,103 | 125,367 | $ | 2,186,306 | ||||||||||||||||||||||
|
|
|
|
|
|
|
| |||||||||||||||||||||
| C Class | ||||||||||||||||||||||||||||
| Year Ended January 31, | ||||||||||||||||||||||||||||
| 2019 | 2018 | |||||||||||||||||||||||||||
SGA Global Growth Fund | Shares | Amount | Shares | Amount | ||||||||||||||||||||||||
| Shares sold | 103,424 | $ | 1,881,987 | 47,361 | $ | 849,784 | ||||||||||||||||||||||
| Reinvestment of dividends | 6,991 | 112,199 | 3,077 | 54,519 | ||||||||||||||||||||||||
| Shares redeemed | (40,677 | ) | (740,543 | ) | (10,356 | ) | (167,820 | ) | ||||||||||||||||||||
|
|
|
|
|
|
|
| |||||||||||||||||||||
| Net increase in shares outstanding | 69,738 | $ | 1,253,643 | 40,082 | $ | 736,483 | ||||||||||||||||||||||
|
|
|
|
|
|
|
| |||||||||||||||||||||
12. Subsequent Events
The Fund’s management team at SGA will remain in place and there will be no impact to the Fund as a result of the change in control. The Trust’s Board of Trustees approved an Agreement and Plan of Reorganization (the “Plan”) that provides for the reorganization of the American Beacon SGA Global Growth Fund into the Virtus SGA Global Growth Fund, a newly organized series of the Virtus Equity Trust (the “Reorganization”). The Reorganization is subject to approval by shareholders at a meeting scheduled for April 23, 2019. If shareholders approve the Plan, the Reorganization is expected to take effect on May 3, 2019.
48
American Beacon Acadian Emerging Markets Managed Volatility FundSM
Financial Highlights
(For a share outstanding throughout the period)
| Institutional Class | ||||||||||||||||||||||||||||||||||||
| Year Ended January 31, | ||||||||||||||||||||||||||||||||||||
| 2019 | 2018 | 2017 | 2016 | 2015 | ||||||||||||||||||||||||||||||||
|
| |||||||||||||||||||||||||||||||||||
Net asset value, beginning of period | $ | 11.78 | $ | 9.22 | $ | 8.36 | $ | 10.24 | $ | 9.59 | ||||||||||||||||||||||||||
|
|
|
|
|
|
|
|
|
| |||||||||||||||||||||||||||
Income (loss) from investment operations: | ||||||||||||||||||||||||||||||||||||
Net investment income | 0.20 | 0.12 | A | 0.13 | 0.04 | 0.13 | ||||||||||||||||||||||||||||||
Net gains (losses) on investments (both realized and unrealized) | (0.84 | ) | 2.65 | 0.90 | (1.84 | ) | 0.64 | |||||||||||||||||||||||||||||
|
|
|
|
|
|
|
|
|
| |||||||||||||||||||||||||||
Total income (loss) from investment operations | (0.64 | ) | 2.77 | 1.03 | (1.80 | ) | 0.77 | |||||||||||||||||||||||||||||
|
|
|
|
|
|
|
|
|
| |||||||||||||||||||||||||||
Less distributions: | ||||||||||||||||||||||||||||||||||||
Dividends from net investment income | (0.18 | ) | (0.21 | ) | (0.17 | ) | (0.08 | ) | (0.12 | ) | ||||||||||||||||||||||||||
Distributions from net realized gains | (0.37 | ) | - | - | - | - | ||||||||||||||||||||||||||||||
Tax return of capitalB | - | - | - | (0.00 | )C | - | ||||||||||||||||||||||||||||||
|
|
|
|
|
|
|
|
|
| |||||||||||||||||||||||||||
Total distributions | (0.55 | ) | (0.21 | ) | (0.17 | ) | (0.08 | ) | (0.12 | ) | ||||||||||||||||||||||||||
|
|
|
|
|
|
|
|
|
| |||||||||||||||||||||||||||
Redemption fees added to beneficial interestsC | 0.00 | 0.00 | 0.00 | 0.00 | 0.00 | |||||||||||||||||||||||||||||||
|
|
|
|
|
|
|
|
|
| |||||||||||||||||||||||||||
Net asset value, end of period | $ | 10.59 | $ | 11.78 | $ | 9.22 | $ | 8.36 | $ | 10.24 | ||||||||||||||||||||||||||
|
|
|
|
|
|
|
|
|
| |||||||||||||||||||||||||||
Total returnD | (5.13 | )% | 30.24 | % | 12.37 | % | (17.58 | )% | 8.04 | % | ||||||||||||||||||||||||||
|
|
|
|
|
|
|
|
|
| |||||||||||||||||||||||||||
Ratios and supplemental data: | ||||||||||||||||||||||||||||||||||||
Net assets, end of period | $ | 5,080,038 | $ | 5,706,260 | $ | 52,787,468 | $ | 40,335,580 | $ | 13,079,558 | ||||||||||||||||||||||||||
Ratios to average net assets: | ||||||||||||||||||||||||||||||||||||
Expenses, before reimbursements | 1.71 | % | 1.85 | % | 1.47 | % | 1.68 | % | 2.26 | % | ||||||||||||||||||||||||||
Expenses, net of reimbursements | 1.35 | % | 1.35 | % | 1.35 | % | 1.35 | % | 1.35 | % | ||||||||||||||||||||||||||
Net investment income, before expense reimbursements | 1.44 | % | 0.74 | % | 1.18 | % | 1.16 | % | 0.44 | % | ||||||||||||||||||||||||||
Net investment income, net of reimbursements | 1.80 | % | 1.23 | % | 1.31 | % | 1.49 | % | 1.35 | % | ||||||||||||||||||||||||||
Portfolio turnover rate | 28 | % | 34 | % | 32 | % | 35 | % | 22 | % | ||||||||||||||||||||||||||
| A | Per share amounts have been calculated using the average shares method. |
| B | Tax return of capital is calculated based on shares outstanding at the time of distribution. |
| C | Amount represents less than $0.01 per share. |
| D | Based on net asset value, which does not reflect the sales charge, redemption fee, or contingent deferred sales charge, if applicable. May include adjustments in accordance with U.S. GAAP and as such, the net asset value for reporting purposes and the returns based upon those net asset values may differ from the net asset value and returns for shareholder transactions. |
See accompanying notes
49
American Beacon Acadian Emerging Markets Managed Volatility FundSM
Financial Highlights
(For a share outstanding throughout the period)
| Y Class | ||||||||||||||||||||||||||||||||||||
| Year Ended January 31, | ||||||||||||||||||||||||||||||||||||
| 2019 | 2018 | 2017 | 2016 | 2015 | ||||||||||||||||||||||||||||||||
|
| |||||||||||||||||||||||||||||||||||
Net asset value, beginning of period | $ | 11.73 | $ | 9.19 | $ | 8.34 | $ | 10.22 | $ | 9.59 | ||||||||||||||||||||||||||
|
|
|
|
|
|
|
|
|
| |||||||||||||||||||||||||||
Income (loss) from investment operations: | ||||||||||||||||||||||||||||||||||||
Net investment income | 0.17 | 0.13 | 0.11 | 0.14 | 0.04 | |||||||||||||||||||||||||||||||
Net gains (losses) on investments (both realized and unrealized) | (0.81 | ) | 2.62 | 0.91 | (1.94 | ) | 0.71 | |||||||||||||||||||||||||||||
|
|
|
|
|
|
|
|
|
| |||||||||||||||||||||||||||
Total income (loss) from investment operations | (0.64 | ) | 2.75 | 1.02 | (1.80 | ) | 0.75 | |||||||||||||||||||||||||||||
|
|
|
|
|
|
|
|
|
| |||||||||||||||||||||||||||
Less distributions: | ||||||||||||||||||||||||||||||||||||
Dividends from net investment income | (0.18 | ) | (0.21 | ) | (0.17 | ) | (0.08 | ) | (0.12 | ) | ||||||||||||||||||||||||||
Distributions from net realized gains | (0.37 | ) | - | - | - | - | ||||||||||||||||||||||||||||||
Tax return of capitalA | - | - | - | (0.00 | )B | - | ||||||||||||||||||||||||||||||
|
|
|
|
|
|
|
|
|
| |||||||||||||||||||||||||||
Total distributions | (0.55 | ) | (0.21 | ) | (0.17 | ) | (0.08 | ) | (0.12 | ) | ||||||||||||||||||||||||||
|
|
|
|
|
|
|
|
|
| |||||||||||||||||||||||||||
Redemption fees added to beneficial interestsB | 0.00 | 0.00 | 0.00 | 0.00 | 0.00 | |||||||||||||||||||||||||||||||
|
|
|
|
|
|
|
|
|
| |||||||||||||||||||||||||||
Net asset value, end of period | $ | 10.54 | $ | 11.73 | $ | 9.19 | $ | 8.34 | $ | 10.22 | ||||||||||||||||||||||||||
|
|
|
|
|
|
|
|
|
| |||||||||||||||||||||||||||
Total returnC | (5.15 | )% | 30.12 | % | 12.28 | % | (17.64 | )% | 7.83 | % | ||||||||||||||||||||||||||
|
|
|
|
|
|
|
|
|
| |||||||||||||||||||||||||||
Ratios and supplemental data: | ||||||||||||||||||||||||||||||||||||
Net assets, end of period | $ | 26,674,824 | $ | 27,820,209 | $ | 32,606,568 | $ | 25,098,823 | $ | 4,603,907 | ||||||||||||||||||||||||||
Ratios to average net assets: | ||||||||||||||||||||||||||||||||||||
Expenses, before reimbursements | 1.76 | % | 1.93 | % | 1.55 | % | 1.77 | % | 2.12 | % | ||||||||||||||||||||||||||
Expenses, net of reimbursements | 1.45 | % | 1.45 | % | 1.45 | % | 1.45 | % | 1.45 | % | ||||||||||||||||||||||||||
Net investment income, before expense reimbursements | 1.26 | % | 1.04 | % | 1.15 | % | 1.23 | % | 0.01 | % | ||||||||||||||||||||||||||
Net investment income, net of reimbursements | 1.57 | % | 1.52 | % | 1.25 | % | 1.55 | % | 0.68 | % | ||||||||||||||||||||||||||
Portfolio turnover rate | 28 | % | 34 | % | 32 | % | 35 | % | 22 | % | ||||||||||||||||||||||||||
| A | Tax return of capital is calculated based on shares outstanding at the time of distribution. |
| B | Amount represents less than $0.01 per share. |
| C | Based on net asset value, which does not reflect the sales charge, redemption fee, or contingent deferred sales charge, if applicable. May include adjustments in accordance with U.S. GAAP and as such, the net asset value for reporting purposes and the returns based upon those net asset values may differ from the net asset value and returns for shareholder transactions. |
See accompanying notes
50
American Beacon Acadian Emerging Markets Managed Volatility FundSM
Financial Highlights
(For a share outstanding throughout the period)
| Investor Class | ||||||||||||||||||||||||||||||||||||
| Year Ended January 31, | ||||||||||||||||||||||||||||||||||||
| 2019 | 2018 | 2017 | 2016 | 2015 | ||||||||||||||||||||||||||||||||
|
| |||||||||||||||||||||||||||||||||||
Net asset value, beginning of period | $ | 11.66 | $ | 9.16 | $ | 8.32 | $ | 10.19 | $ | 9.58 | ||||||||||||||||||||||||||
|
|
|
|
|
|
|
|
|
| |||||||||||||||||||||||||||
Income (loss) from investment operations: | ||||||||||||||||||||||||||||||||||||
Net investment income | 0.15 | 0.11 | 0.11 | 0.16 | 0.07 | |||||||||||||||||||||||||||||||
Net gains (losses) on investments (both realized and unrealized) | (0.82 | ) | 2.60 | 0.87 | (1.98 | ) | 0.66 | |||||||||||||||||||||||||||||
| �� |
|
|
|
|
|
|
|
|
|
| ||||||||||||||||||||||||||
Total income (loss) from investment operations | (0.67 | ) | 2.71 | 0.98 | (1.82 | ) | 0.73 | |||||||||||||||||||||||||||||
|
|
|
|
|
|
|
|
|
| |||||||||||||||||||||||||||
Less distributions: | ||||||||||||||||||||||||||||||||||||
Dividends from net investment income | (0.18 | ) | (0.21 | ) | (0.14 | ) | (0.05 | ) | (0.12 | ) | ||||||||||||||||||||||||||
Distributions from net realized gains | (0.37 | ) | - | - | - | - | ||||||||||||||||||||||||||||||
Tax return of capitalA | - | - | - | (0.00 | )B | - | ||||||||||||||||||||||||||||||
|
|
|
|
|
|
|
|
|
| |||||||||||||||||||||||||||
Total distributions | (0.55 | ) | (0.21 | ) | (0.14 | ) | (0.05 | ) | (0.12 | ) | ||||||||||||||||||||||||||
|
|
|
|
|
|
|
|
|
| |||||||||||||||||||||||||||
Redemption fees added to beneficial interestsB | 0.00 | 0.00 | 0.00 | 0.00 | 0.00 | |||||||||||||||||||||||||||||||
|
|
|
|
|
|
|
|
|
| |||||||||||||||||||||||||||
Net asset value, end of period | $ | 10.44 | $ | 11.66 | $ | 9.16 | $ | 8.32 | $ | 10.19 | ||||||||||||||||||||||||||
|
|
|
|
|
|
|
|
|
| |||||||||||||||||||||||||||
Total returnC | (5.45 | )% | 29.78 | % | 11.89 | % | (17.86 | )% | 7.63 | % | ||||||||||||||||||||||||||
|
|
|
|
|
|
|
|
|
| |||||||||||||||||||||||||||
Ratios and supplemental data: | ||||||||||||||||||||||||||||||||||||
Net assets, end of period | $ | 2,793,978 | $ | 3,016,153 | $ | 3,457,789 | $ | 3,933,437 | $ | 4,612,098 | ||||||||||||||||||||||||||
Ratios to average net assets: | ||||||||||||||||||||||||||||||||||||
Expenses, before reimbursements | 2.15 | % | 2.12 | % | 1.77 | % | 1.98 | % | 2.42 | % | ||||||||||||||||||||||||||
Expenses, net of reimbursements | 1.73 | % | 1.73 | % | 1.73 | % | 1.73 | % | 1.73 | % | ||||||||||||||||||||||||||
Net investment income, before expense reimbursements | 0.93 | % | 0.82 | % | 0.94 | % | 1.30 | % | 0.12 | % | ||||||||||||||||||||||||||
Net investment income, net of reimbursements | 1.35 | % | 1.21 | % | 0.98 | % | 1.55 | % | 0.81 | % | ||||||||||||||||||||||||||
Portfolio turnover rate | 28 | % | 34 | % | 32 | % | 35 | % | 22 | % | ||||||||||||||||||||||||||
| A | Tax return of capital is calculated based on shares outstanding at the time of distribution. |
| B | Amount represents less than $0.01 per share. |
| C | Based on net asset value, which does not reflect the sales charge, redemption fee, or contingent deferred sales charge, if applicable. May include adjustments in accordance with U.S. GAAP and as such, the net asset value for reporting purposes and the returns based upon those net asset values may differ from the net asset value and returns for shareholder transactions. |
See accompanying notes
51
American Beacon Acadian Emerging Markets Managed Volatility FundSM
Financial Highlights
(For a share outstanding throughout the period)
| A Class | ||||||||||||||||||||||||||||||||||||
| Year Ended January 31, | ||||||||||||||||||||||||||||||||||||
| 2019 | 2018 | 2017 | 2016 | 2015 | ||||||||||||||||||||||||||||||||
|
| |||||||||||||||||||||||||||||||||||
Net asset value, beginning of period | $ | 11.69 | $ | 9.18 | $ | 8.34 | $ | 10.18 | $ | 9.58 | ||||||||||||||||||||||||||
|
|
|
|
|
|
|
|
|
| |||||||||||||||||||||||||||
Income (loss) from investment operations: | ||||||||||||||||||||||||||||||||||||
Net investment income | 0.10 | 0.10 | 0.13 | 0.12 | 0.06 | |||||||||||||||||||||||||||||||
Net gains (losses) on investments (both realized and unrealized) | (0.78 | ) | 2.62 | 0.85 | (1.94 | ) | 0.66 | |||||||||||||||||||||||||||||
|
|
|
|
|
|
|
|
|
| |||||||||||||||||||||||||||
Total income (loss) from investment operations | (0.68 | ) | 2.72 | 0.98 | (1.82 | ) | 0.72 | |||||||||||||||||||||||||||||
|
|
|
|
|
|
|
|
|
| |||||||||||||||||||||||||||
Less distributions: | ||||||||||||||||||||||||||||||||||||
Dividends from net investment income | (0.16 | ) | (0.21 | ) | (0.14 | ) | (0.02 | ) | (0.12 | ) | ||||||||||||||||||||||||||
Distributions from net realized gains | (0.37 | ) | - | - | - | - | ||||||||||||||||||||||||||||||
Tax return of capitalA | - | - | - | (0.00 | )B | - | ||||||||||||||||||||||||||||||
|
|
|
|
|
|
|
|
|
| |||||||||||||||||||||||||||
Total distributions | (0.53 | ) | (0.21 | ) | (0.14 | ) | (0.02 | ) | (0.12 | ) | ||||||||||||||||||||||||||
|
|
|
|
|
|
|
|
|
| |||||||||||||||||||||||||||
Redemption fees added to beneficial interestsB | 0.00 | 0.00 | 0.00 | 0.00 | 0.00 | |||||||||||||||||||||||||||||||
|
|
|
|
|
|
|
|
|
| |||||||||||||||||||||||||||
Net asset value, end of period | $ | 10.48 | $ | 11.69 | $ | 9.18 | $ | 8.34 | $ | 10.18 | ||||||||||||||||||||||||||
|
|
|
|
|
|
|
|
|
| |||||||||||||||||||||||||||
Total returnC | (5.52 | )% | 29.83 | % | 11.84 | % | (17.90 | )% | 7.53 | % | ||||||||||||||||||||||||||
|
|
|
|
|
|
|
|
|
| |||||||||||||||||||||||||||
Ratios and supplemental data: | ||||||||||||||||||||||||||||||||||||
Net assets, end of period | $ | 391,973 | $ | 849,017 | $ | 510,236 | $ | 740,272 | $ | 3,214,591 | ||||||||||||||||||||||||||
Ratios to average net assets: | ||||||||||||||||||||||||||||||||||||
Expenses, before reimbursements | 2.02 | % | 2.24 | % | 1.90 | % | 2.10 | % | 2.49 | % | ||||||||||||||||||||||||||
Expenses, net of reimbursements | 1.75 | % | 1.75 | % | 1.75 | % | 1.75 | % | 1.77 | % | ||||||||||||||||||||||||||
Net investment income, before expense reimbursements | 1.06 | % | 0.61 | % | 0.86 | % | 1.08 | % | 0.09 | % | ||||||||||||||||||||||||||
Net investment income, net of reimbursements | 1.33 | % | 1.10 | % | 1.01 | % | 1.43 | % | 0.81 | % | ||||||||||||||||||||||||||
Portfolio turnover rate | 28 | % | 34 | % | 32 | % | 35 | % | 22 | % | ||||||||||||||||||||||||||
| A | Tax return of capital is calculated based on shares outstanding at the time of distribution. |
| B | Amount represents less than $0.01 per share. |
| C | Based on net asset value, which does not reflect the sales charge, redemption fee, or contingent deferred sales charge, if applicable. May include adjustments in accordance with U.S. GAAP and as such, the net asset value for reporting purposes and the returns based upon those net asset values may differ from the net asset value and returns for shareholder transactions. |
See accompanying notes
52
American Beacon Acadian Emerging Markets Managed Volatility FundSM
Financial Highlights
(For a share outstanding throughout the period)
| C Class | ||||||||||||||||||||||||||||||||||||
| Year Ended January 31, | ||||||||||||||||||||||||||||||||||||
| 2019 | 2018 | 2017 | 2016 | 2015 | ||||||||||||||||||||||||||||||||
|
| |||||||||||||||||||||||||||||||||||
Net asset value, beginning of period | $ | 11.55 | $ | 9.08 | $ | 8.23 | $ | 10.10 | $ | 9.55 | ||||||||||||||||||||||||||
|
|
|
|
|
|
|
|
|
| |||||||||||||||||||||||||||
Income (loss) from investment operations: | ||||||||||||||||||||||||||||||||||||
Net investment income | 0.02 | 0.06 | 0.02 | 0.10 | 0.02 | |||||||||||||||||||||||||||||||
Net gains (losses) on investments (both realized and unrealized) | (0.76 | ) | 2.54 | 0.89 | (1.97 | ) | 0.62 | |||||||||||||||||||||||||||||
|
|
|
|
|
|
|
|
|
| |||||||||||||||||||||||||||
Total income (loss) from investment operations | (0.74 | ) | 2.60 | 0.91 | (1.87 | ) | 0.64 | |||||||||||||||||||||||||||||
|
|
|
|
|
|
|
|
|
| |||||||||||||||||||||||||||
Less distributions: | ||||||||||||||||||||||||||||||||||||
Dividends from net investment income | (0.04 | ) | (0.13 | ) | (0.06 | ) | (0.00 | )A | (0.09 | ) | ||||||||||||||||||||||||||
Distributions from net realized gains | (0.37 | ) | - | - | - | - | ||||||||||||||||||||||||||||||
Tax return of capitalB | - | - | - | (0.00 | )A | - | ||||||||||||||||||||||||||||||
|
|
|
|
|
|
|
|
|
| |||||||||||||||||||||||||||
Total distributions | (0.41 | ) | (0.13 | ) | (0.06 | ) | (0.00 | )A | (0.09 | ) | ||||||||||||||||||||||||||
|
|
|
|
|
|
|
|
|
| |||||||||||||||||||||||||||
Redemption fees added to beneficial interestsA | 0.00 | 0.00 | 0.00 | 0.00 | 0.00 | |||||||||||||||||||||||||||||||
|
|
|
|
|
|
|
|
|
| |||||||||||||||||||||||||||
Net asset value, end of period | $ | 10.40 | $ | 11.55 | $ | 9.08 | $ | 8.23 | $ | 10.10 | ||||||||||||||||||||||||||
|
|
|
|
|
|
|
|
|
| |||||||||||||||||||||||||||
Total returnC | (6.19 | )% | 28.71 | % | 11.11 | % | (18.50 | )% | 6.66 | % | ||||||||||||||||||||||||||
|
|
|
|
|
|
|
|
|
| |||||||||||||||||||||||||||
Ratios and supplemental data: | ||||||||||||||||||||||||||||||||||||
Net assets, end of period | $ | 216,223 | $ | 503,049 | $ | 450,626 | $ | 644,705 | $ | 623,506 | ||||||||||||||||||||||||||
Ratios to average net assets: | ||||||||||||||||||||||||||||||||||||
Expenses, before reimbursements | 2.77 | % | 3.00 | % | 2.67 | % | 2.87 | % | 3.26 | % | ||||||||||||||||||||||||||
Expenses, net of reimbursements | 2.50 | % | 2.50 | % | 2.50 | % | 2.50 | % | 2.52 | % | ||||||||||||||||||||||||||
Net investment income (loss), before expense reimbursements | 0.54 | % | (0.01 | )% | 0.11 | % | 0.40 | % | (0.90 | )% | ||||||||||||||||||||||||||
Net investment income (loss), net of reimbursements | 0.81 | % | 0.49 | % | 0.28 | % | 0.77 | % | (0.16 | )% | ||||||||||||||||||||||||||
Portfolio turnover rate | 28 | % | 34 | % | 32 | % | 35 | % | 22 | % | ||||||||||||||||||||||||||
| A | Amount represents less than $0.01 per share. |
| B | Tax return of capital is calculated based on shares outstanding at the time of distribution. |
| C | Based on net asset value, which does not reflect the sales charge, redemption fee, or contingent deferred sales charge, if applicable. May include adjustments in accordance with U.S. GAAP and as such, the net asset value for reporting purposes and the returns based upon those net asset values may differ from the net asset value and returns for shareholder transactions. |
See accompanying notes
53
American Beacon SGA Global Growth FundSM
Financial Highlights
(For a share outstanding throughout the period)
| Institutional Class | ||||||||||||||||||||||||||||||||||||
| Year Ended January 31, | ||||||||||||||||||||||||||||||||||||
| 2019 | 2018 | 2017 | 2016 | 2015 | ||||||||||||||||||||||||||||||||
|
| |||||||||||||||||||||||||||||||||||
Net asset value, beginning of period | $ | 20.11 | $ | 15.11 | $ | 13.79 | $ | 13.43 | $ | 13.05 | ||||||||||||||||||||||||||
|
|
|
|
|
|
|
|
|
| |||||||||||||||||||||||||||
Income (loss) from investment operations: | ||||||||||||||||||||||||||||||||||||
Net investment income (loss) | 0.01 | A | (0.01 | ) | 0.03 | 0.03 | 0.06 | |||||||||||||||||||||||||||||
Net gains (losses) on investments (both realized and unrealized) | (0.31 | ) | 5.65 | 1.84 | 0.56 | 0.72 | ||||||||||||||||||||||||||||||
|
|
|
|
|
|
|
|
|
| |||||||||||||||||||||||||||
Total income (loss) from investment operations | (0.30 | ) | 5.64 | 1.87 | 0.59 | 0.78 | ||||||||||||||||||||||||||||||
|
|
|
|
|
|
|
|
|
| |||||||||||||||||||||||||||
Less distributions: | ||||||||||||||||||||||||||||||||||||
Dividends from net investment income | - | - | - | (0.02 | ) | (0.03 | ) | |||||||||||||||||||||||||||||
Distributions from net realized gains | (0.77 | ) | (0.64 | ) | (0.55 | ) | (0.21 | ) | (0.37 | ) | ||||||||||||||||||||||||||
|
|
|
|
|
|
|
|
|
| |||||||||||||||||||||||||||
Total distributions | (0.77 | ) | (0.64 | ) | (0.55 | ) | (0.23 | ) | (0.40 | ) | ||||||||||||||||||||||||||
|
|
|
|
|
|
|
|
|
| |||||||||||||||||||||||||||
Net asset value, end of period | $ | 19.04 | $ | 20.11 | $ | 15.11 | $ | 13.79 | $ | 13.43 | ||||||||||||||||||||||||||
|
|
|
|
|
|
|
|
|
| |||||||||||||||||||||||||||
Total returnB | (1.08 | )% | 37.64 | % | 13.66 | % | 4.26 | % | 5.98 | % | ||||||||||||||||||||||||||
|
|
|
|
|
|
|
|
|
| |||||||||||||||||||||||||||
Ratios and supplemental data: | ||||||||||||||||||||||||||||||||||||
Net assets, end of period | $ | 28,819,370 | $ | 15,912,971 | $ | 7,698,159 | $ | 6,219,477 | $ | 5,106,079 | ||||||||||||||||||||||||||
Ratios to average net assets: | ||||||||||||||||||||||||||||||||||||
Expenses, before reimbursements | 1.31 | % | 1.34 | % | 2.03 | % | 2.62 | % | 3.82 | % | ||||||||||||||||||||||||||
Expenses, net of reimbursements | 0.98 | % | 0.98 | % | 0.98 | % | 0.98 | % | 0.98 | % | ||||||||||||||||||||||||||
Net investment (loss), before expense reimbursements | (0.26 | )% | (0.28 | )% | (0.83 | )% | (1.37 | )% | (2.41 | )% | ||||||||||||||||||||||||||
Net investment income, net of reimbursements | 0.07 | % | 0.08 | % | 0.21 | % | 0.27 | % | 0.42 | % | ||||||||||||||||||||||||||
Portfolio turnover rate | 54 | % | 31 | % | 32 | % | 39 | % | 38 | % | ||||||||||||||||||||||||||
| A | Per share amounts have been calculated using the average shares method. |
| B | Based on net asset value, which does not reflect the sales charge, redemption fee, or contingent deferred sales charge, if applicable. May include adjustments in accordance with U.S. GAAP and as such, the net asset value for reporting purposes and the returns based upon those net asset values may differ from the net asset value and returns for shareholder transactions. |
See accompanying notes
54
American Beacon SGA Global Growth FundSM
Financial Highlights
(For a share outstanding throughout the period)
| Y Class | ||||||||||||||||||||||||||||||||||||
| Year Ended January 31, | ||||||||||||||||||||||||||||||||||||
| 2019 | 2018 | 2017 | 2016 | 2015 | ||||||||||||||||||||||||||||||||
|
| |||||||||||||||||||||||||||||||||||
Net asset value, beginning of period | $ | 20.01 | $ | 15.05 | $ | 13.75 | $ | 13.41 | $ | 13.05 | ||||||||||||||||||||||||||
|
|
|
|
|
|
|
|
|
| |||||||||||||||||||||||||||
Income (loss) from investment operations: | ||||||||||||||||||||||||||||||||||||
Net investment income (loss) | (0.01 | ) | 0.00 | A | (0.03 | ) | 0.02 | 0.04 | ||||||||||||||||||||||||||||
Net gains (losses) on investments (both realized and unrealized) | (0.31 | ) | 5.60 | 1.88 | 0.55 | 0.72 | ||||||||||||||||||||||||||||||
|
|
|
|
|
|
|
|
|
| |||||||||||||||||||||||||||
Total income (loss) from investment operations | (0.32 | ) | 5.60 | 1.85 | 0.57 | 0.76 | ||||||||||||||||||||||||||||||
|
|
|
|
|
|
|
|
|
| |||||||||||||||||||||||||||
Less distributions: | ||||||||||||||||||||||||||||||||||||
Dividends from net investment income | - | - | - | (0.02 | ) | (0.03 | ) | |||||||||||||||||||||||||||||
Distributions from net realized gains | (0.77 | ) | (0.64 | ) | (0.55 | ) | (0.21 | ) | (0.37 | ) | ||||||||||||||||||||||||||
|
|
|
|
|
|
|
|
|
| |||||||||||||||||||||||||||
Total distributions | (0.77 | ) | (0.64 | ) | (0.55 | ) | (0.23 | ) | (0.40 | ) | ||||||||||||||||||||||||||
|
|
|
|
|
|
|
|
|
| |||||||||||||||||||||||||||
Net asset value, end of period | $ | 18.92 | $ | 20.01 | $ | 15.05 | $ | 13.75 | $ | 13.41 | ||||||||||||||||||||||||||
|
|
|
|
|
|
|
|
|
| |||||||||||||||||||||||||||
Total returnB | (1.19 | )% | 37.52 | % | 13.55 | % | 4.12 | % | 5.83 | % | ||||||||||||||||||||||||||
|
|
|
|
|
|
|
|
|
| |||||||||||||||||||||||||||
Ratios and supplemental data: |
| |||||||||||||||||||||||||||||||||||
Net assets, end of period | $ | 7,724,294 | $ | 5,732,352 | $ | 1,706,678 | $ | 127,585 | $ | 119,680 | ||||||||||||||||||||||||||
Ratios to average net assets: | ||||||||||||||||||||||||||||||||||||
Expenses, before reimbursements | 1.33 | % | 1.40 | % | 1.88 | % | 2.72 | % | 3.84 | % | ||||||||||||||||||||||||||
Expenses, net of reimbursements | 1.08 | % | 1.08 | % | 1.07 | % | 1.08 | % | 1.08 | % | ||||||||||||||||||||||||||
Net investment (loss), before expense reimbursements | (0.30 | )% | (0.37 | )% | (0.96 | )% | (1.51 | )% | (2.44 | )% | ||||||||||||||||||||||||||
Net investment income (loss), net of reimbursements | (0.05 | )% | (0.04 | )% | (0.15 | )% | 0.13 | % | 0.32 | % | ||||||||||||||||||||||||||
Portfolio turnover rate | 54 | % | 31 | % | 32 | % | 39 | % | 38 | % | ||||||||||||||||||||||||||
| A | Amount represents less than $0.01 per share. |
| B | Based on net asset value, which does not reflect the sales charge, redemption fee, or contingent deferred sales charge, if applicable. May include adjustments in accordance with U.S. GAAP and as such, the net asset value for reporting purposes and the returns based upon those net asset values may differ from the net asset value and returns for shareholder transactions. |
See accompanying notes
55
American Beacon SGA Global Growth FundSM
Financial Highlights
(For a share outstanding throughout the period)
| Investor Class | ||||||||||||||||||||||||||||||||||||
| Year Ended January 31, | ||||||||||||||||||||||||||||||||||||
| 2019 | 2018 | 2017 | 2016 | 2015 | ||||||||||||||||||||||||||||||||
|
| |||||||||||||||||||||||||||||||||||
Net asset value, beginning of period | $ | 19.75 | $ | 14.90 | $ | 13.66 | $ | 13.36 | $ | 13.03 | ||||||||||||||||||||||||||
|
|
|
|
|
|
|
|
|
| |||||||||||||||||||||||||||
Income (loss) from investment operations: | ||||||||||||||||||||||||||||||||||||
Net investment income (loss) | (0.21 | ) | (0.04 | ) | 0.06 | (0.04 | ) | 0.01 | ||||||||||||||||||||||||||||
Net gains (losses) on investments (both realized and unrealized) | (0.16 | ) | 5.53 | 1.73 | 0.57 | 0.72 | ||||||||||||||||||||||||||||||
|
|
|
|
|
|
|
|
|
| |||||||||||||||||||||||||||
Total income (loss) from investment operations | (0.37 | ) | 5.49 | 1.79 | 0.53 | 0.73 | ||||||||||||||||||||||||||||||
|
|
|
|
|
|
|
|
|
| |||||||||||||||||||||||||||
Less distributions: | ||||||||||||||||||||||||||||||||||||
Dividends from net investment income | - | - | - | (0.02 | ) | (0.03 | ) | |||||||||||||||||||||||||||||
Distributions from net realized gains | (0.77 | ) | (0.64 | ) | (0.55 | ) | (0.21 | ) | (0.37 | ) | ||||||||||||||||||||||||||
|
|
|
|
|
|
|
|
|
| |||||||||||||||||||||||||||
Total distributions | (0.77 | ) | (0.64 | ) | (0.55 | ) | (0.23 | ) | (0.40 | ) | ||||||||||||||||||||||||||
|
|
|
|
|
|
|
|
|
| |||||||||||||||||||||||||||
Net asset value, end of period | $ | 18.61 | $ | 19.75 | $ | 14.90 | $ | 13.66 | $ | 13.36 | ||||||||||||||||||||||||||
|
|
|
|
|
|
|
|
|
| |||||||||||||||||||||||||||
Total returnA | (1.46 | )% | 37.16 | % | 13.20 | % | 3.84 | % | 5.60 | % | ||||||||||||||||||||||||||
|
|
|
|
|
|
|
|
|
| |||||||||||||||||||||||||||
Ratios and supplemental data: |
| |||||||||||||||||||||||||||||||||||
Net assets, end of period | $ | 5,878,296 | $ | 19,473,640 | $ | 11,414,261 | $ | 421,630 | $ | 108,458 | ||||||||||||||||||||||||||
Ratios to average net assets: | ||||||||||||||||||||||||||||||||||||
Expenses, before reimbursements | 1.50 | % | 1.57 | % | 2.05 | % | 3.08 | % | 5.28 | % | ||||||||||||||||||||||||||
Expenses, net of reimbursements | 1.36 | % | 1.36 | % | 1.34 | % | 1.36 | % | 1.36 | % | ||||||||||||||||||||||||||
Net investment (loss), before expense reimbursements | (0.29 | )% | (0.50 | )% | (1.14 | )% | (2.04 | )% | (3.88 | )% | ||||||||||||||||||||||||||
Net investment income (loss), net of reimbursements | (0.15 | )% | (0.29 | )% | (0.43 | )% | (0.32 | )% | 0.05 | % | ||||||||||||||||||||||||||
Portfolio turnover rate | 54 | % | 31 | % | 32 | % | 39 | % | 38 | % | ||||||||||||||||||||||||||
| A | Based on net asset value, which does not reflect the sales charge, redemption fee, or contingent deferred sales charge, if applicable. May include adjustments in accordance with U.S. GAAP and as such, the net asset value for reporting purposes and the returns based upon those net asset values may differ from the net asset value and returns for shareholder transactions. |
See accompanying notes
56
American Beacon SGA Global Growth FundSM
Financial Highlights
(For a share outstanding throughout the period)
| A Class | ||||||||||||||||||||||||||||||||||||
| Year Ended January 31, | ||||||||||||||||||||||||||||||||||||
| 2019 | 2018 | 2017 | 2016 | 2015 | ||||||||||||||||||||||||||||||||
|
| |||||||||||||||||||||||||||||||||||
Net asset value, beginning of period | $ | 19.72 | $ | 14.89 | $ | 13.65 | $ | 13.35 | $ | 13.03 | ||||||||||||||||||||||||||
|
|
|
|
|
|
|
|
|
| |||||||||||||||||||||||||||
Income (loss) from investment operations: | ||||||||||||||||||||||||||||||||||||
Net investment income (loss) | (0.05 | ) | (0.02 | ) | 0.03 | (0.03 | ) | 0.00 | A | |||||||||||||||||||||||||||
Net gains (losses) on investments (both realized and unrealized) | (0.32 | ) | 5.49 | 1.76 | 0.56 | 0.72 | ||||||||||||||||||||||||||||||
|
|
|
|
|
|
|
|
|
| |||||||||||||||||||||||||||
Total income (loss) from investment operations | (0.37 | ) | 5.47 | 1.79 | 0.53 | 0.72 | ||||||||||||||||||||||||||||||
|
|
|
|
|
|
|
|
|
| |||||||||||||||||||||||||||
Less distributions: | ||||||||||||||||||||||||||||||||||||
Dividends from net investment income | - | - | - | (0.02 | ) | (0.03 | ) | |||||||||||||||||||||||||||||
Distributions from net realized gains | (0.77 | ) | (0.64 | ) | (0.55 | ) | (0.21 | ) | (0.37 | ) | ||||||||||||||||||||||||||
|
|
|
|
|
|
|
|
|
| |||||||||||||||||||||||||||
Total distributions | (0.77 | ) | (0.64 | ) | (0.55 | ) | (0.23 | ) | (0.40 | ) | ||||||||||||||||||||||||||
|
|
|
|
|
|
|
|
|
| |||||||||||||||||||||||||||
Net asset value, end of period | $ | 18.58 | $ | 19.72 | $ | 14.89 | $ | 13.65 | $ | 13.35 | ||||||||||||||||||||||||||
|
|
|
|
|
|
|
|
|
| |||||||||||||||||||||||||||
Total returnB | (1.46 | )% | 37.05 | % | 13.21 | % | 3.84 | % | 5.53 | % | ||||||||||||||||||||||||||
|
|
|
|
|
|
|
|
|
| |||||||||||||||||||||||||||
Ratios and supplemental data: |
| |||||||||||||||||||||||||||||||||||
Net assets, end of period | $ | 3,786,025 | $ | 3,835,023 | $ | 1,028,223 | $ | 345,107 | $ | 434,636 | ||||||||||||||||||||||||||
Ratios to average net assets: | ||||||||||||||||||||||||||||||||||||
Expenses, before reimbursements | 1.60 | % | 1.72 | % | 2.33 | % | 3.05 | % | 4.19 | % | ||||||||||||||||||||||||||
Expenses, net of reimbursements | 1.38 | % | 1.38 | % | 1.38 | % | 1.38 | % | 1.42 | % | ||||||||||||||||||||||||||
Net investment (loss), before expense reimbursements | (0.50 | )% | (0.77 | )% | (1.22 | )% | (1.90 | )% | (2.78 | )% | ||||||||||||||||||||||||||
Net investment (loss), net of reimbursements | (0.28 | )% | (0.43 | )% | (0.27 | )% | (0.22 | )% | (0.01 | )% | ||||||||||||||||||||||||||
Portfolio turnover rate | 54 | % | 31 | % | 32 | % | 39 | % | 38 | % | ||||||||||||||||||||||||||
| A | Amount represents less than $0.01 per share. |
| B | Based on net asset value, which does not reflect the sales charge, redemption fee, or contingent deferred sales charge, if applicable. May include adjustments in accordance with U.S. GAAP and as such, the net asset value for reporting purposes and the returns based upon those net asset values may differ from the net asset value and returns for shareholder transactions. |
See accompanying notes
57
American Beacon SGA Global Growth FundSM
Financial Highlights
(For a share outstanding throughout the period)
| C Class | ||||||||||||||||||||||||||||||||||||
| Year Ended January 31, | ||||||||||||||||||||||||||||||||||||
| 2019 | 2018 | 2017 | 2016 | 2015 | ||||||||||||||||||||||||||||||||
|
| |||||||||||||||||||||||||||||||||||
Net asset value, beginning of period | $ | 19.04 | $ | 14.50 | $ | 13.40 | $ | 13.21 | $ | 13.00 | ||||||||||||||||||||||||||
|
|
|
|
|
|
|
|
|
| |||||||||||||||||||||||||||
Income (loss) from investment operations: | ||||||||||||||||||||||||||||||||||||
Net investment income (loss) | (0.04 | ) | (0.04 | ) | 0.05 | (0.12 | ) | (0.05 | ) | |||||||||||||||||||||||||||
Net gains (losses) on investments (both realized and unrealized) | (0.46 | ) | 5.22 | 1.60 | 0.54 | 0.66 | ||||||||||||||||||||||||||||||
|
|
|
|
|
|
|
|
|
| |||||||||||||||||||||||||||
Total income (loss) from investment operations | (0.50 | ) | 5.18 | 1.65 | 0.42 | 0.61 | ||||||||||||||||||||||||||||||
|
|
|
|
|
|
|
|
|
| |||||||||||||||||||||||||||
Less distributions: | ||||||||||||||||||||||||||||||||||||
Dividends from net investment income | - | - | - | (0.02 | ) | (0.03 | ) | |||||||||||||||||||||||||||||
Distributions from net realized gains | (0.77 | ) | (0.64 | ) | (0.55 | ) | (0.21 | ) | (0.37 | ) | ||||||||||||||||||||||||||
|
|
|
|
|
|
|
|
|
| |||||||||||||||||||||||||||
Total distributions | (0.77 | ) | (0.64 | ) | (0.55 | ) | (0.23 | ) | (0.40 | ) | ||||||||||||||||||||||||||
|
|
|
|
|
|
|
|
|
| |||||||||||||||||||||||||||
Net asset value, end of period | $ | 17.77 | $ | 19.04 | $ | 14.50 | $ | 13.40 | $ | 13.21 | ||||||||||||||||||||||||||
|
|
|
|
|
|
|
|
|
| |||||||||||||||||||||||||||
Total returnA | (2.20 | )% | 36.04 | % | 12.41 | % | 3.04 | % | 4.69 | % | ||||||||||||||||||||||||||
|
|
|
|
|
|
|
|
|
| |||||||||||||||||||||||||||
Ratios and supplemental data: |
| |||||||||||||||||||||||||||||||||||
Net assets, end of period | $ | 3,163,664 | $ | 2,061,699 | $ | 988,762 | $ | 410,331 | $ | 393,478 | ||||||||||||||||||||||||||
Ratios to average net assets: | ||||||||||||||||||||||||||||||||||||
Expenses, before reimbursements | 2.39 | % | 2.47 | % | 3.08 | % | 3.76 | % | 4.77 | % | ||||||||||||||||||||||||||
Expenses, net of reimbursements | 2.13 | % | 2.13 | % | 2.12 | % | 2.13 | % | 2.16 | % | ||||||||||||||||||||||||||
Net investment (loss), before expense reimbursements | (1.33 | )% | (1.42 | )% | (1.95 | )% | (2.51 | )% | (3.41 | )% | ||||||||||||||||||||||||||
Net investment (loss), net of reimbursements | (1.08 | )% | (1.08 | )% | (1.00 | )% | (0.89 | )% | (0.80 | )% | ||||||||||||||||||||||||||
Portfolio turnover rate | 54 | % | 31 | % | 32 | % | 39 | % | 38 | % | ||||||||||||||||||||||||||
| A | Based on net asset value, which does not reflect the sales charge, redemption fee, or contingent deferred sales charge, if applicable. May include adjustments in accordance with U.S. GAAP and as such, the net asset value for reporting purposes and the returns based upon those net asset values may differ from the net asset value and returns for shareholder transactions. |
See accompanying notes
58
American Beacon FundsSM
January 31, 2019 (Unaudited)
Certain tax information regarding the Funds is required to be provided to shareholders based upon the Funds’ income and distributions for the taxable year ended January 31, 2019. The information and distributions reported herein may differ from information and distributions taxable to the shareholders for the calendar year ended December 31, 2018.
The Funds designated the following items with regard to distributions paid during the fiscal year ended January 31, 2019. All designations are based on financial information available as of this annual report and, accordingly, are subject to change. For each item, it is the intention of the Funds to designate the maximum amount permitted under the Internal Revenue Code of 1986, as amended, and the regulations there under.
Corporate Dividends-Received Deduction:
Acadian Emerging Markets Managed Volatility | 0.31 | % | ||
SGA Global Growth | 51.68 | % |
Qualified Dividend Income:
Acadian Emerging Markets Managed Volatility | 83.00 | % | ||
SGA Global Growth | 100.00 | % |
Long-Term Capital Gain Distributions:
Acadian Emerging Markets Managed Volatility | $ | 826,051 | ||
SGA Global Growth | 1,991,321 |
Short-Term Capital Gain Distributions:
Acadian Emerging Markets Managed Volatility | $ | 357,106 | ||
SGA Global Growth | 232,951 |
Shareholders will receive notification in January 2019 of the applicable tax information necessary to prepare their 2018 income tax returns.
59
Trustees and Officers of the American Beacon FundsSM(Unaudited)
The Trustees and officers of the American Beacon Funds (the “Trust”) are listed below, together with their principal occupations during the past five years. The address of each person listed below is 220 Las Colinas Boulevard East, Suite 1200, Irving, Texas 75039. Each Trustee oversees thirty-seven funds in the fund complex that includes the Trust, the American Beacon Select Funds, the American Beacon Institutional Funds Trust, the American Beacon Sound Point Enhanced Income Fund and the American Beacon Apollo Total Return Fund. The Trust’s Statement of Additional Information contains additional information about the Trustees and is available without charge by calling1-800-658-5811.
Name, Age | Position, Term of Office and Length of Time Served with the Trust | Principal Occupation(s) During Past 5 Years and Current Directorships | ||
| INTERESTED TRUSTEES | Term | |||
Lifetime of Trust until removal, resignation or retirement* | ||||
| Alan D. Feld** (82) | Trustee since 1996 | Partner in the law firm of Akin, Gump, Strauss, Hauer & Feld, LLP (law firm) (1960-Present); Trustee, American Beacon Select Funds (1999-Present); Trustee, American Beacon Institutional Funds Trust (2017-Present); Trustee, American Beacon Sound Point Enhanced Income Fund (2018-Present); Trustee, American Beacon Apollo Total Return Fund (2018-Present). | ||
| NON-INTERESTED TRUSTEES | Term | |||
Lifetime of Trust until removal, resignation or retirement* | ||||
| Gilbert G. Alvarado (49) | Trustee since 2015 | Director, Kura MD, Inc. (local telehealth organization) (2015-present); Vice President & CFO, Sierra Health Foundation (health conversion private foundation) (2006-Present); Vice President & CFO, Sierra Health Foundation: Center for Health Program Management (California public benefit corporation) (2012-Present); Director, Innovative North State (2012-2015); Director, Sacramento Regional Technology Alliance (2011-2016); Director, Women’s Empowerment (2009-2014); Director, Valley Healthcare Staffing (2017-present); Trustee, American Beacon Select Funds (2015-Present); Trustee, American Beacon Institutional Funds Trust (2017-Present); Trustee, American Beacon Sound Point Enhanced Income Fund (2018-Present); Trustee, American Beacon Apollo Total Return Fund (2018-Present). | ||
| Joseph B. Armes (56) | Trustee since 2015 | Chairman & CEO, CSW Industrials f/k/a Capital Southwest Corporation (investment company) (2015-Present); Chairman of the Board of Capital Southwest Corporation, predecessor to CSW Industrials, Inc. (2014-2017) (investment company); CEO, Capital Southwest Corporation (2013-2015); President & CEO, JBA Investment Partners (family investment vehicle) (2010-Present); Director and Chair of Audit Committee, RSP Permian (oil and gas producer) (2013-Present); Trustee, American Beacon Select Funds (2015-Present); Trustee, American Beacon Institutional Funds Trust (2017-Present); Trustee, American Beacon Sound Point Enhanced Income Fund (2018-Present); Trustee, American Beacon Apollo Total Return Fund (2018-Present). | ||
| Gerard J. Arpey (60) | Trustee since 2012 | Director, The Home Depot, Inc. (2015-Present); Partner, Emerald Creek Group (private equity firm) (2011-Present); Director, S.C. Johnson & Son, Inc. (privately held company) (2008-present); Trustee, American Beacon Select Funds (2012-Present); Trustee, American Beacon Institutional Funds Trust (2017-Present); Trustee, American Beacon Sound Point Enhanced Income Fund (2018-Present); Trustee, American Beacon Apollo Total Return Fund (2018-Present). | ||
60
Trustees and Officers of the American Beacon FundsSM(Unaudited)
Name, Age | Position, Term of Office and Length of Time Served with the Trust | Principal Occupation(s) During Past 5 Years and Current Directorships | ||
| NON-INTERESTED (CONT.) | Term | |||
Lifetime of Trust until removal, resignation or retirement* | ||||
| Brenda A. Cline (58) | Trustee since 2004 Chair since 2019 Vice Chair 2018 | Chief Financial Officer, Treasurer and Secretary, Kimbell Art Foundation (1993-Present); Director, Tyler Technologies, Inc. (public sector software solutions company) (2014-Present); Director, Range Resources Corporation (oil and natural gas company) (2015-Present); Trustee, CushingClosed-End andOpen-End Funds and ETFs (2017-Present); Trustee, American Beacon Select Funds (2004-Present); Trustee, American Beacon Institutional Funds Trust (2017-Present); Trustee, American Beacon Sound Point Enhanced Income Fund (2018-Present); Trustee, American Beacon Apollo Total Return Fund (2018-Present). | ||
| Eugene J. Duffy (64) | Trustee since 2008 | Managing Director, Global Investment Management Distribution, Mesirow Financial (2016-Present); Managing Director, Institutional Services, Intercontinental Real Estate Corporation (2014-Present); Principal and Executive Vice President, Paradigm Asset Management (1994-2014); Trustee, American Beacon Select Funds (2008-Present); Trustee, American Beacon Institutional Funds Trust (2017-Present); Trustee, American Beacon Sound Point Enhanced Income Fund (2018-Present); Trustee, American Beacon Apollo Total Return Fund (2018-Present). | ||
| Claudia A. Holz*** (61) | Trustee since 2018 | Partner, KPMG LLP (1990-2017); Trustee, American Beacon Select Funds (2018-Present); Trustee, American Beacon Institutional Funds Trust (2018-Present); Trustee, American Beacon Sound Point Enhanced Income Fund (2018-Present); Trustee, American Beacon Apollo Total Return Fund (2018-Present). | ||
| Douglas A. Lindgren**** (57) | Trustee since 2018 | CEO North America, Carne Global Financial Services (2016-2017); Managing Director, IPS Investment Management and Global Head, Content Management, UBS Wealth Management (2010-2016); Trustee, American Beacon Select Funds (2018-Present); Trustee, American Beacon Institutional Funds Trust (2018-Present); Trustee, American Beacon Sound Point Enhanced Income Fund (2018-Present); Trustee, American Beacon Apollo Total Return Fund (2018-Present). | ||
| Richard A. Massman (75) | Trustee since 2004 Chair 2008-2018 Chair Emeritus since 2019 | Consultant and General Counsel Emeritus, Hunt Consolidated, Inc. (holding company engaged in oil and gas exploration and production, refining, real estate, farming, ranching and venture capital activities) (2009-Present); Trustee, American Beacon Select Funds (2004-Present); Trustee, American Beacon Institutional Funds Trust (2017-Present); Trustee, American Beacon Sound Point Enhanced Income Fund (2018-Present); Trustee, American Beacon Apollo Total Return Fund (2018-Present). | ||
| Barbara J. McKenna, CFA (55) | Trustee since 2012 | President/Managing Principal, Longfellow Investment Management Company (2005-Present); Trustee, American Beacon Select Funds (2012-Present); Trustee, American Beacon Institutional Funds Trust (2017-Present); Trustee, American Beacon Sound Point Enhanced Income Fund (2018-Present); Trustee, American Beacon Apollo Total Return Fund (2018-Present). | ||
| R. Gerald Turner (73) | Trustee since 2001 | President, Southern Methodist University (1995-Present); Director, J.C. Penney Company, Inc. (1996-Present); Director, Kronus Worldwide Inc. (chemical manufacturing) (2003-Present); Trustee, American Beacon Select Funds (2001-Present); Trustee, American Beacon Institutional Funds Trust (2017-Present); Trustee, American Beacon Sound Point Enhanced Income Fund (2018-Present); Trustee, American Beacon Apollo Total Return Fund (2018-Present). | ||
61
Trustees and Officers of the American Beacon FundsSM(Unaudited)
Name, Age | Position, Term of Office and Length of Time Served with the Trust | Principal Occupation(s) During Past 5 Years and Current Directorships | ||
| OFFICERS | Term | |||
| One Year | ||||
| Gene L. Needles, Jr. (64) | President since 2009 | CEO and Director (2009-Present), and Chairman (2018-Present), American Beacon Advisors, Inc.; President, American Beacon Advisors (2009-2018); President (2015-2018), Director and CEO (2015-Present), and Chairman (2018-Present), Resolute Investment Holdings, LLC; Director, Chairman and CEO, Resolute Topco, Inc. (2015-Present), President (2015-2018); Director, Chairman and CEO, Resolute Acquisition, Inc. (2015-Present); President (2015-2018), Chairman and CEO, Resolute Investment Managers, Inc. (2015-Present), President (2015-2018); Director, Chairman, President and CEO, Resolute Investment Distributors (2017-Present); Director, Chairman, President and CEO; Resolute Investment Services, Inc. (2015-Present); President and CEO, Lighthouse Holdings Parent, Inc. (2009-2015); President, CEO and Director, Lighthouse Holdings, Inc. (2009-2015); Manager, President and CEO, American Private Equity Management, LLC (2012-Present); Director, Chairman, President and CEO, Alpha Quant Advisors, LLC (2016-Present); Director, ARK Investment Management LLC (2016-Present); Director, Shapiro Capital Management LLC (2017-Present); Director, Chairman and CEO, Continuous Capital, LLC (2018-Present); Director and President, American Beacon Cayman Transformational Innovation Company, LTD., (2017-2018); President American Beacon Cayman TargetRisk Company, Ltd. (2018-Present); President, American Beacon Delaware Transformational Innovation Corporation (2017-2018); Member, Investment Advisory Committee, Employees Retirement System of Texas (2017-Present); Trustee, American Beacon NextShares Trust (2015-Present); President, American Beacon Select Funds (2009-Present); American Beacon Cayman Managed Futures Strategy Fund, Ltd. (2014-Present); President, American Beacon Institutional Funds Trust (2017-Present); President, American Beacon Sound Point Enhanced Income Fund (2018-Present); President, American Beacon Apollo Total Return Fund (2018-Present); President, | ||
| Rosemary K. Behan (59) | VP, Secretary and Chief Legal Officer since 2006 | Vice President, Secretary and General Counsel, American Beacon Advisors, Inc. (2006-Present); Secretary, Resolute Investment Holdings, LLC (2015-Present); Secretary, Resolute Topco, Inc. (2015-Present); Secretary, Resolute Acquisition, Inc. (2015-Present); Vice President, Secretary and General Counsel, Resolute Investment Managers, Inc. (2015-Present); Secretary, Resolute Investment Distributors, Inc. (2017-Present); Vice President, Secretary and General Counsel, Resolute Investment Services, Inc. (2015-Present); Vice President and Secretary, Lighthouse Holdings Parent, Inc. (2008-2015); Vice President and Secretary, Lighthouse Holdings, Inc. (2008-2015); Secretary, American Private Equity Management, LLC (2008-Present); Secretary, Alpha Quant Advisors, LLC (2016-Present); Vice President and Secretary, Continuous Capital, LLC (2018-Present); Secretary, American Beacon Delaware Transformational Innovation Corporation (2017-2018); Secretary, American Beacon Cayman Transformational Innovation Company, Ltd. (2017-2018; Secretary, American Beacon Cayman TargetRisk Company, Ltd (2018-Present); Chief Legal Officer, Vice President and Secretary, American Beacon Select Funds (2006-Present); Secretary, American Beacon Cayman Managed Futures Strategy Fund, Ltd. (2014-Present); Chief Legal Officer, Vice President and Secretary, American Beacon Institutional Funds Trust (2017-Present); Chief Legal Officer, Vice President and Secretary, American Beacon Sound Point Enhanced Income Fund (2018-Present); Chief Legal Officer, Vice President and Secretary American Beacon Apollo Total Return Fund (2018-Present). | ||
62
Trustees and Officers of the American Beacon FundsSM(Unaudited)
Name, Age | Position, Term of Office and Length of Time Served with the Trust | Principal Occupation(s) During Past 5 Years and Current Directorships | ||
| OFFICERS (CONT.) | Term | |||
| One Year | ||||
| Brian E. Brett (58) | VP since 2004 | Senior Vice President, Head of Distribution (2012-Present), Vice President, Director of Sales (2004-2012), American Beacon Advisors, Inc.; Senior Vice President, Resolute Investment Managers, Inc. (2017-Present); Senior Vice President, Resolute Investment Distributors, Inc. (2018-Present), Vice President (2017-2018); Senior Vice President, Resolute Investment Services, Inc. (2017-Present); Senior Vice President, Lighthouse Holdings Parent, Inc. (2008-2015); Senior Vice President, Lighthouse Holdings, Inc. (2008-2015); Vice President, American Beacon Select Funds (2004-Present); Vice President, American Beacon Institutional Funds Trust (2017-Present); Vice President American Beacon Sound Point Enhanced Income Fund (2018-Present); Vice President American Beacon Apollo Total Return Fund (2018-Present). | ||
| Paul B. Cavazos (49) | VP since 2016 | Chief Investment Officer and Senior Vice President, American Beacon Advisors, Inc. (2016-Present); Chief Investment Officer, DTE Energy (2007-2016); Vice President, American Private Equity Management, L.L.C. (2017-Present); Vice President, American Beacon Select Funds (2016-Present); Vice President, American Beacon Institutional Funds Trust (2017-Present); Vice President American Beacon Sound Point Enhanced Income Fund (2018-Present); Vice President American Beacon Apollo Total Return Fund (2018-Present). | ||
| Erica Duncan (48) | VP Since 2011 | Vice President, American Beacon Advisors, Inc. (2011-Present); Vice President, Resolute Investment Managers (2018-Present); Vice President, Resolute Investment Services, Inc. (2018-Present); Vice President, American Beacon Select Funds (2011-Present); Vice President, American Beacon Institutional Funds Trust (2017-Present); Vice President American Beacon Sound Point Enhanced Income Fund (2018-Present); Vice President American Beacon Apollo Total Return Fund (2018-Present). | ||
| Melinda G. Heika (57) | Treasurer since 2010 | Treasurer and CFO (2010-Present), American Beacon Advisors, Inc.; Treasurer, Resolute Topco, Inc. (2015-Present); Treasurer, Resolute Investment Holdings, LLC. (2015-Present); Treasurer, Resolute Acquisition, Inc. (2015-Present); Treasurer and CFO, Resolute Investment Managers, Inc. (2017-Present); Treasurer, Resolute Investment Distributors, Inc. (2017-2017); Treasurer and CFO, Resolute Investment Services, Inc. (2015-Present); Treasurer, Lighthouse Holdings Parent Inc., (2010-2015); Treasurer, Lighthouse Holdings, Inc. (2010-2015); Treasurer, American Private Equity Management, LLC (2012-Present); Treasurer and CFO, Alpha Quant Advisors, LLC (2016-Present); Treasurer and CFO, Continuous Capital, LLC (2018-Present); Treasurer, American Beacon Cayman Transformational Innovation, Ltd. (2017-2018); Treasurer, American Beacon Delaware Transformational Innovation Corporation (2017-2018); Treasurer, American Beacon Select Funds (2010-Present); Director and Treasurer, American Beacon Cayman Managed Futures Strategy Fund, Ltd. (2014-Present); Treasurer, American Beacon Institutional Funds Trust (2017-Present); Treasurer, American Beacon Sound Point Enhanced Income Fund (2018-Present); Treasurer, American Beacon Apollo Total Return Fund (2018-Present). | ||
| Terri L. McKinney (55) | VP since 2010 | Vice President (2009-Present), Managing Director (2003-2009), American Beacon Advisors, Inc.; Vice President, Resolute Investment Managers, Inc. (2017-Present); Vice President, Resolute Investment Services, Inc (2018-Present); Vice President, Alpha Quant Advisors, LLC (2016-Present); Vice President, Continuous Capital, LLC (2018-Present); Vice President, American Beacon Select Funds (2010-Present); Vice President, American Beacon Institutional Funds Trust (2017-Present); Vice President, American Beacon Sound Point Enhanced Income Fund (2018-Present); Vice President, American Beacon Apollo Total Return Fund (2018-Present). | ||
63
Trustees and Officers of the American Beacon FundsSM(Unaudited)
Name, Age | Position, Term of Office and Length of Time Served with the Trust | Principal Occupation(s) During Past 5 Years and Current Directorships | ||
| OFFICERS (CONT.) | Term | |||
| One Year | ||||
| Jeffrey K. Ringdahl (43) | VP since 2010 | Director (2015-Present), President (2018-Present), Chief Operating Officer (2010-Present), Senior Vice President (2013-2018), Vice President (2010-2013), American Beacon Advisors, Inc.; Director (2015-Present), President (2018-Present), Senior Vice Present (2015-2018, Resolute Investment Holdings, LLC; Director (2015-Present), President (2018-Present), Senior Vice President (2015-2018), Resolute Topco, Inc.; Director (2015-Present), President (2018-Present), Senior Vice President (2015-2018), Resolute Acquisition, Inc.; Director (2015-Present), President & COO (2018-Present), Senior Vice President (2015-2018), Resolute Investment Managers, Inc.; Director and Executive Vice President (2017-Present), Resolute Investment Distributors, Inc.; Director (2017-Present), President & COO (2018-Present), Executive Vice President (2017-2018), Resolute Investment Services, Inc.; Senior Vice President (2018-Present), Vice President (2012-2018), Manager (2015-2018), American Private Equity Management, LLC; Senior Vice President, Lighthouse Holdings Parent, Inc. (2013-2015); Senior Vice President, Lighthouse Holdings, Inc. (2013-2015); Trustee, American Beacon NextShares Trust (2015-Present); Director, Executive Vice President & COO, Alpha Quant Advisors, LLC (2016-Present); Director, Shapiro Capital Management, LLC (2017-Present); Director, Executive Vice President & COO, Continuous Capital, LLC (2018-Present); Director and Vice President, American Beacon Cayman Transformational Innovation Company, Ltd., (2017-Present); Vice President, American Beacon Delaware Transformational Innovation Corporation (2017-2018); Vice President, American Beacon Cayman TargetRisk Company, Ltd (2018-Present); Vice President, American Beacon Select Funds (2010-2018); Director and Vice President, American Beacon Cayman Managed Futures Strategy Fund, Ltd. (2014-Present); Vice President, American Beacon Institutional Funds Trust (2017-Present); Vice President, American Beacon Sound Point Enhanced Income Fund (2018-Present); Vice President, American Beacon Apollo Total Return Fund (2018-Present) | ||
| Samuel J. Silver (55) | VP Since 2011 | Vice President (2011-Present), Chief Fixed Income Officer (2016-Present), American Beacon Advisors, Inc. (2011-Present); Vice President, American Beacon Select Funds (2011-Present); Vice President, American Beacon Institutional Funds Trust (2017-Present); Vice President, American Beacon Sound Point Enhanced Income Fund (2018-Present); Vice President, American Beacon Apollo Total Return Fund (2018-Present). | ||
| Christina E. Sears (47) | Chief Compliance Officer since 2004 and Asst. Secretary since 1999 | Vice President, American Beacon Advisors, Inc. (2019-Present); Chief Compliance Officer, American Beacon Advisors, Inc. (2004-Present); Vice President, Resolute Investment Managers, Inc. (2017-Present); Vice President, Resolute Investment Distributors (2017-Present); Vice President, Resolute Investment Services, Inc. (2019-Present); Chief Compliance Officer, American Private Equity Management, LLC (2012-Present); Chief Compliance Officer and Vice President, Alpha Quant Advisors, LLC (2016-Present); Vice President, Continuous Capital, LLC (2018-Present); Chief Compliance Officer (2004-Present) and Assistant Secretary (1999-Present), American Beacon Select Funds; Chief Compliance Officer and Assistant Secretary, American Beacon Institutional Funds Trust (2017-Present); Chief Compliance Officer and Assistant Secretary, American Beacon Sound Point Enhanced Income Fund (2018-Present); Chief Compliance Officer and Assistant Secretary, American Beacon Apollo Total Return Fund (2018-Present). | ||
64
Trustees and Officers of the American Beacon FundsSM(Unaudited)
Name, Age | Position, Term of Office and Length of Time Served with the Trust | Principal Occupation(s) During Past 5 Years and Current Directorships | ||
| OFFICERS (CONT.) | Term | |||
| One Year | ||||
| Sonia L. Bates (62) | Asst. Treasurer since 2011 | Assistant Treasurer, American Beacon Advisors, Inc. (2011-2018); Assistant Treasurer, Lighthouse Holdings Parent Inc. (2011-2015); Assistant Treasurer, Lighthouse Holdings, Inc. (2011-2015); Assistant Treasurer, American Private Equity Management, LLC (2012-Present); Assistant Treasurer, American Beacon Cayman Transformational Innovation Company, Ltd. (2017-Present); Assistant Treasurer, American Beacon Cayman TargetRisk Company, Ltd. (2018-Present); Assistant Treasurer, American Beacon Select Funds (2011-Present); Assistant Treasurer, American Beacon Institutional Funds Trust (2017-Present); Assistant Treasurer, American Beacon Sound Point Enhanced Income Fund (2018-Present); Assistant Treasurer, American Beacon Apollo Total Return Fund (2018-Present). | ||
| Shelley D. Abrahams (44) | Assistant Secretary since 2008 | Assistant Secretary, American Beacon Select Funds (2008-Present); Assistant Secretary, American Beacon Institutional Funds Trust (2017-Present); Assistant Secretary, American Beacon Sound Point Enhanced Income Fund (2018-Present); Assistant Secretary, American Beacon Apollo Total Return Fund (2018-Present). | ||
| Rebecca L. Harris (52) | Assistant Secretary since 2010 | Vice President, American Beacon Advisors, Inc. (2011-Present); Vice President, Resolute Investment Managers, Inc. (2017-Present); Vice President, Resolute Investment Services (2015-Present); Vice President, Alpha Quant Advisors, LLC (2016-Present); Vice President, Continuous Capital, LLC (2018-Present); Assistant Secretary, American Beacon Select Funds (2010-Present); Assistant Secretary, American Beacon Institutional Funds Trust (2017-Present); Assistant Secretary, American Beacon Sound Point Enhanced Income Fund (2018-Present); Assistant Secretary, American Beacon Apollo Total Return Fund (2018-Present). | ||
| Teresa A. Oxford (60) | Assistant Secretary since 2015 | Assistant Secretary, American Beacon Advisors, Inc. (2015-Present); Assistant Secretary, Resolute Investment Distributors (2018-Present); Assistant Secretary, Resolute Investment Services (2018-Present); Assistant Secretary, Alpha Quant Advisors, LLC (2016-Present); Assistant Secretary, American Beacon Select Funds (2015-Present); Assistant Secretary, American Beacon Institutional Funds Trust (2017-Present); Assistant Secretary, American Beacon Sound Point Enhanced Income Fund (2018-Present); Assistant Secretary, American Beacon Apollo Total Return Fund (2018-Present). | ||
* As of 11/12/2014, the Board adopted a retirement plan that requires Trustees, other than Messrs. Feld and Massman to retire no later than the last day of the calendar year in which they reach the age of 75. As of 11/7/17, the Board approved a waiver of the mandatory retirement policy with respect to Mr. Massman, who turned 75 in November 2018, to permit him to continue to serve on the Board as Chair Emeritus through 12/31/19.
** Mr. Feld is deemed to be an “interested person” of the Trusts, as defined by the 1940 Act. Mr. Feld’s law firm of Akin, Gump, Strauss, Hauer & Feld LLP has provided legal services within the past two fiscal years to one or more of the Trust’ssub-advisors.
*** Claudia A. Holz became a new Trustee to each of the Trusts on 4/1/2018.
**** Douglas A. Lindgren became a new Trustee to each of the Trusts on 1/1/2018.
65
Privacy Policy
January 31, 2019 (Unaudited)
The American Beacon Funds recognize and respect the privacy of our shareholders. We are providing this notice to you so you will understand how shareholder information may be collected and used.
We may collect nonpublic personal information about you from one or more of the following sources:
| • | information we receive from you on applications or other forms; |
| • | information about your transactions with us or our service providers; and |
| • | information we receive from third parties. |
We do not disclose any nonpublic personal information about our customers or former customers to anyone, except as permitted by law.
We restrict access to your nonpublic personal information to those employees or service providers who need to know that information to provide products or services to you. To ensure the confidentiality of your nonpublic personal information, we maintain safeguards that comply with federal standards.
66
This page intentionally left blank.
67
This page intentionally left blank.
68

eDelivery isNOW AVAILABLE- Stop traditional mail delivery and receive your
shareholder reports and summary prospectuson-line. Sign up at
www.americanbeaconfunds.com
If you invest in the Fund through a financial institution, you may be able to receive the Fund’s regulatory mailings, such as the Prospectus, Annual Report and Semi-Annual Report, bye-mail. If you are interested in this option, please go towww.icsdelivery.com and search for your financial institution’s name or contact your financial institution directly.
To obtain more information about the Fund:
 |  | |
| ByE-mail: | On the Internet: | |
| american_beacon.funds@ambeacon.com | Visit our website atwww.americanbeaconfunds.com | |
By Telephone: Call (800)658-5811 |
By Mail: American Beacon Funds P.O. Box 219643 Kansas City, MO 64121-9643 | |
| Availability of Quarterly Portfolio Schedules | Availability of Proxy Voting Policy and Records | |
| In addition to the Schedule of Investments provided in each semi-annual and annual report, the Fund files a complete schedule of its portfolio holdings with the Securities and Exchange Commission (“SEC”) on FormN-Q as of the first and third fiscal quarters. The Fund’s FormsN-Q are available on the SEC’s website atwww.sec.gov. The FormsN-Q may also be reviewed and copied at the SEC’s Public Reference Section, 100 F Street, NE, Washington, D.C. 20549-2736. Information regarding the operation of the SEC’s Public Reference Room may be obtained by calling(800)-SEC-0330. A complete schedule of the American Beacon Acadian Emerging Markets Managed Volatility Fund’s portfolio holdings is also available atwww.americanbeaconfunds.com approximately sixty days after the end of each quarter. A complete schedule of the American Beacon SGA Global Growth Fund’s portfolio holdings is also available on the website approximately twenty days after the end of each month. | A description of the policies and procedures the Fund uses to determine how to vote proxies relating to portfolio securities is available in the Fund’s Statement of Additional Information, is available free of charge on the Fund’s websitewww.americanbeaconfunds.com and by calling1-800-967-9009 or by accessing the SEC’s website atwww.sec.gov. The Fund’s proxy voting record for the most recent year ended June 30 is filed annually with the SEC on FormN-PX. The Fund’s FormsN-PX are available on the SEC’s website atwww.sec.gov. The Fund’s proxy voting record may also be obtained by calling1-800-967-9009. | |


Fund Service Providers:
CUSTODIAN State Street Bank and Trust Company Boston, Massachusetts | TRANSFER AGENT DST Asset Manager Solutions, Inc. Kansas City, Missouri | INDEPENDENT REGISTERED PUBLIC ACCOUNTING FIRM PricewaterhouseCoopers LLP Boston, Massachusetts | DISTRIBUTOR Resolute Investment Distributors, Inc. Irving, Texas |
This report is prepared for shareholders of the American Beacon Funds and may be distributed to others only if preceded or accompanied by a current Prospectus or Summary Prospectus.
American Beacon Funds, American Beacon Acadian Emerging Markets Managed Volatility Fund and American Beacon SGA Global Growth Fund are service marks of American Beacon Advisors, Inc.
AR 1/19
About American Beacon Advisors
Since 1986, American Beacon Advisors has offered a variety of products and investment advisory services to numerous institutional and retail clients, including a variety of mutual funds, corporate cash management, and separate account management.
Our clients include defined benefit plans, defined contribution plans, foundations, endowments, corporations, financial planners, and other institutional investors. With American Beacon Advisors, you can put the experience of a multi-billion dollar asset management firm to work for your company.
Beginning on January 1, 2021, as permitted by regulations adopted by the Securities and Exchange Commission, paper copies of the Fund’s shareholder reports will no longer be sent by mail, unless you specifically request paper copies of the reports from the Fund or from your financial intermediary, such as a broker-dealer or bank. Instead, the reports will be made available on a website, and you will be notified by mail each time a report is posted and provided with a website link to access the report.
If you already elected to receive shareholder reports electronically, you will not be affected by this change and you need not take any action. You may elect to receive shareholder reports and other communications from the Fund or your financial intermediary electronically by going towww.americanbeaconfunds.com and clicking on “Quick Links” and then “Register for E-Delivery.”
You may elect to receive all future reports in paper free of charge. You can inform the Fund that you wish to continue receiving paper copies of your shareholder reports by calling 1-800-658-5811, option 1, or you may directly inform your financial intermediary of your wish. A notice that will be mailed to you each time a report is posted will also include instructions for informing the Fund that you wish to continue receiving paper copies of your shareholder reports. Your election to receive reports in paper will apply to all funds held with the American Beacon Funds Complex or your financial intermediary, as applicable.
CRESCENT SHORT DURATION HIGH INCOME FUND
The Fund’s investments inhigh-yield securities, includingloans, restricted securitiesandfloating rate securitiesare subject to greater levels of credit, interest rate, market and liquidity risks than investment-grade securities. Investing inforeign securitiesmay involve heightened risk due to currency fluctuations and economic and political risks. Please see the prospectus for a complete discussion of the Fund’s risks. There can be no assurances that the investment objectives of this Fund will be met.
Any opinions herein, including forecasts, reflect our judgment as of the end of the reporting period and are subject to change. Each advisor’s strategies and each Fund’s portfolio composition will change depending on economic and market conditions. This report is not a complete analysis of market conditions, and, therefore, should not be relied upon as investment advice. Although economic and market information has been compiled from reliable sources, American Beacon Advisors, Inc. makes no representation as to the completeness or accuracy of the statements contained herein.
American Beacon Funds | January 31, 2019 |
| 1 | ||||
| 2 | ||||
| 5 | ||||
| 7 | ||||
Schedule of Investments: | ||||
| 8 | ||||
| 21 | ||||
| 24 | ||||
Financial Highlights: | ||||
| 44 | ||||
| 49 | ||||
| 50 | ||||
Disclosure Regarding the Approval of the Management and Investment Advisory Agreements | ||||
| 56 | ||||
| Back Cover | ||||
 | Dear Shareholders,
The market volatility of December 2018 – a month in which all major U.S. equity indexes declined and the year ended in negative territory – serves as a prime example of the importance of having a long-term investment perspective.
While long-term investing isn’t about identifying and anticipating the next big market move, it is about identifying the right investment products for riding out those moves. As a long-term investor, you should strive to accomplish the three Ds: direction, discipline and diversification.
u Direction: Achieving your long-term financial goals requires an individualized plan of action. You may want your plan to provide some |
measure of protection against periods of geopolitical turmoil, economic uncertainty, market volatility and job insecurity. Your plan should be reviewed annually and be adjusted in the event your long-range needs change.
| u | Discipline:Long-term, systematic participation in an investment portfolio requires your resolution to stay the course. Spending time in the market – rather than trying to time the market – may place you in a better position to reach your long-term financial goals. |
| u | Diversification: By investing in different types of investment categories and asset classes, you may be able to help mitigate financial risks across your investment portfolio. By allocating your investment portfolio according to your risk-tolerance level, you may be better positioned to weather storms and achieve your long-term financial goals. |
Since 1986, American Beacon has endeavored to provide investors with a disciplined approach to realizing long-term financial goals. As a manager of managers, we strive to provide investment products that may enable investors to participate during market upswings while potentially insulating against market downswings. Our approach is more than a concept. It’s the cornerstone of our culture. And we strive to apply it at every turn as we seek to provide a well-diversified line of investment products for your investment portfolio.
Many of the sub-advisors to our mutual funds pursue upside capture and/or downside protection using proprietary strategies. The investment teams behind our mutual funds seek to produce consistent, long-term results rather than focus only on short-term movements in the markets. In managing our investment products, we emphasize identifying opportunities that offer the potential for long-term rewards.
Thank you for your continued interest in American Beacon. For additional information about our funds or to access your account information, please visit our website atwww.americanbeaconfunds.com.
Best Regards,

Gene L. Needles, Jr.
President
American Beacon Funds
1
High Yield Bond Market Overview
January 31, 2019 (Unaudited)
The High Yield and Bank Loan segments of the bond market managed to salvage reasonably attractive performance during the 12-month period despite a volatile end to 2018. For the period, high-yield bonds returned 1.6% and bank loans returned 2.4%, according to the ICE BofAML US High Yield Index and the Credit Suisse Leveraged Loan Index, respectively.
The period began with choppy equity markets in the early months of 2018, although they had only a limited effect on the High Yield and Bank Loan segments. The credit markets had generally been strong during recent years, and the economic outlook gave the Federal Reserve (the “Fed”) confidence to continue raising interest rates.
While the outlook was positive, the U.S. Treasury yield curve flattened as the Fed raised rates. Short-term yields moved up with the Fed, but long-term yields hardly budged. Longer-term bonds indicated that, despite strong corporate earnings and historically low unemployment, inflation was not a concern. The economic expansion may have been reaching into its 10th year; however, growth was not as robust as the Fed projected.
The status quo came to a halt in late 2018 when investors began to pull back from all risk assets. The Fed was pressing too hard on the brakes, Chinese growth was increasingly difficult to manufacture and Europe was barely treading water. Yet, at its December 2018 meeting, the Fed raised rates once again and indicated there may be additional hikes in 2019. The markets were not pleased. By month end, the S&P 500 Index was down 20% from its peak, High Yield credit spreads were wider by 200 basis points (2.00%) and the 10-year Treasury was up to almost 2.50%. With the markets sending strong warning signals, the Fed finally took note and began walking back from its outlook.
During its January 2019 meeting, the Fed announced a pause in raising interest rates and committed to reassessing its balance sheet reduction plans. The relief leading up to this meeting pushed many of the affected markets nearly back up to their peaks. Equities rallied, credit spreads narrowed and Treasury yields retreated. The High Yield and Bank Loan markets finished the period with attractive returns.
2
American Beacon Crescent Short Duration High Income FundSM
Performance Overview
January 31, 2019 (Unaudited)
The Investor Class of the American Beacon Crescent Short Duration High Income Fund (the “Fund”) returned 0.28% for the twelve-month period ended January 31, 2019, underperforming the ICE BofA Merrill Lynch U.S. High Yield Cash PayBB-B1-5 Year Index (the “Index”) return of 3.49%.
Comparison of Change in Value of a $10,000 Investment for the period from 10/1/2014 through 1/31/2019
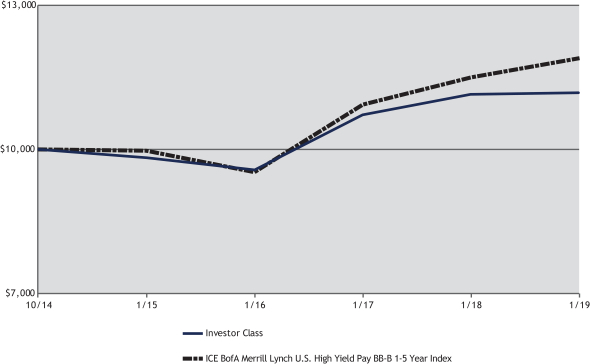
| Total Returns for the Period ended January 31, 2019 |
| ||||||||||||||||||||||||||
Ticker | 1 Year | 3 Years | Since Inception (10/01/2014) | Value of $10,000 10/01/2014- 1/31/2019 | |||||||||||||||||||||||
Institutional Class (1,3) | ACHIX | 0.60 | % | 5.69 | % | 2.97 | % | $ | 11,353 | ||||||||||||||||||
Y Class (1,3) | ACHYX | 0.78 | % | 5.69 | % | 2.92 | % | $ | 11,330 | ||||||||||||||||||
Investor Class (1,3) | ACHPX | 0.28 | % | 5.31 | % | 2.60 | % | $ | 11,178 | ||||||||||||||||||
A without Sales Charge (1,3) | ACHAX | 0.01 | % | 5.21 | % | 2.50 | % | $ | 11,128 | ||||||||||||||||||
A with Sales Charge (1,3) | ACHAX | (2.53 | )% | 4.33 | % | 1.89 | % | $ | 10,846 | ||||||||||||||||||
C without Sales Charge (1,3) | ACHCX | (0.49 | )% | 4.47 | % | 1.80 | % | $ | 10,802 | ||||||||||||||||||
C with Sales Charge (1,3) | ACHCX | (1.49 | )% | 4.47 | % | 1.80 | % | $ | 10,802 | ||||||||||||||||||
ICE BofA Merrill Lynch U.S High Yield Cash Pay BB-B1-5 Year Index (2) | 3.49 | % | 7.70 | % | 4.09 | % | $ | 11,897 | |||||||||||||||||||
| 1. | Performance shown is historical and is not indicative of future returns. Investment returns and principal value will vary, and shares may be worth more or less at redemption than at original purchase. Performance shown is calculated based on the published end of day net asset values as of the date indicated and current performance may be lower or higher than the performance data quoted. To obtain performance as of the most recent month end, please visitwww.americanbeaconfunds.com or call 1-800-967-9009. Fund performance in the table above does not reflect the deduction of taxes a shareholder would pay on distributions or the redemption of shares. Generally accepted accounting principles require adjustments to be made to the net assets of the Fund at period end for financial reporting purposes only, and as such, the total return based on the unadjusted net asset value per share may differ from the total return reported in the financial highlights. A portion of the fees charged to each Class of the Fund has been waived since Fund inception. Performance prior to waiving fees was lower than the actual returns shown since inception. A Class shares have a maximum sales charge of 2.50%. The maximum contingent deferred sales charge for the C Class is 1.00% for shares redeemed within one year of the date of purchase. |
| 2. | The ICE BofA Merrill Lynch U.S. High Yield Cash Pay BB-B 1-5 Year Index is an unmanaged index that generally tracks the performance of BB-B rated U.S. dollar-denominated corporate bonds publicly issued in the U.S. domestic market with maturities of 1 to 5 years. One cannot directly invest in an index. |
| 3. | The Total Annual Fund Operating Expense ratios set forth in the most recent Fund prospectus for the Institutional, Y, Investor, A, and C Class shares were 1.08%, 1.15%, 1.40%, 1.47%, and 2.22%, respectively. The expense ratios above may vary from the expense ratios presented in other sections of this report that are based on expenses incurred during the period covered by this report. |
3
American Beacon Crescent Short Duration High Income FundSM
Performance Overview
January 31, 2019 (Unaudited)
The Fund’ssub-advisor actively allocates among traditional high-yield, floating-rate bank loan and private-debt sectors of the bond market to seek attractive risk-adjusted returns over a full market cycle with lower volatility than that of the Index. This flexibility also allows for opportunity to create an actively managed, diversified portfolio of securities including those outside of the traditional indices.
On average during the period, the Fund held approximately 70% of assets in traditional high yield, 15% in floating-rate bank loans, 10% in private debt and the remainder in cash. The decision to overweight high-yield bonds and underweight bank loans added value as the high-yield Index outperformed bank loans during the period. Private-debt holdings in the Fund produced the highest returns overall.
The Fund’s exposure to the Energy sector, however, detracted from performance due to adverse security selection despite Energy producing some of the highest returns in the Index. Additionally, the Fund’s exposure to interest-rate and credit-spread duration also negatively affected performance as interest rates rose early in the period and credit spreads widened late in the period.
The Fund ended the period with a yield to maturity slightly above that of the Index, reflecting a lower interest-rate duration and a higher credit-spread duration.
| Top Ten Holdings (% Net Assets) |
| |||||||
| Sprint Corp., 7.250%, Due 9/15/2021 | 1.3 | |||||||
| Cablevision Systems Corp., 5.875%, Due 9/15/2022 | 1.1 | |||||||
| Navient Corp., 5.875%, Due 3/25/2021 | 1.1 | |||||||
| HCA, Inc., 5.875%, Due 5/1/2023 | 1.0 | |||||||
| Sirius XM Radio, Inc., 3.875%, Due 8/1/2022 | 1.0 | |||||||
| Dell International LLC / EMC Corp., 7.125%, Due 6/15/2024 | 0.9 | |||||||
| Freeport-McMoRan, Inc., 3.550%, Due 3/1/2022 | 0.9 | |||||||
| Hertz Corp., 5.875%, Due 10/15/2020 | 0.9 | |||||||
| MGM Resorts International, 6.625%, Due 12/15/2021 | 0.9 | |||||||
| Talen Energy Supply LLC, 9.500%, Due 7/15/2022 | 0.9 | |||||||
| Total Fund Holdings | 418 | |||||||
| Sector Allocation (% Investments) |
| |||||||
| Communications | 16.0 | |||||||
| Consumer,Non-Cyclical | 13.6 | |||||||
| Financial | 12.6 | |||||||
| Technology | 9.4 | |||||||
| Industrial | 9.0 | |||||||
| Energy | 8.2 | |||||||
| Consumer, Cyclical | 8.0 | |||||||
| Consumer | 5.4 | |||||||
| Service | 4.6 | |||||||
| Basic Materials | 4.3 | |||||||
| Manufacturing | 2.2 | |||||||
| Health Care | 2.2 | |||||||
| Utilities | 2.1 | |||||||
| Telecommunications | 1.5 | |||||||
| Media | 0.5 | |||||||
| Defense | 0.2 | |||||||
| Transportation | 0.2 | |||||||
4
American Beacon Crescent Short Duration High Income FundSM
January 31, 2019 (Unaudited)
Fund Expense Example
As a shareholder of a Fund, you incur two types of costs: (1) transaction costs, including sales charges (loads) on purchase payments and redemption fees, if applicable, and (2) ongoing costs, including management fees, distribution (12b-1) fees, sub-transfer agent fees, and other Fund expenses. The Examples are intended to help you understand the ongoing cost (in dollars) of investing in the Fund and to compare these costs with the ongoing costs of investing in other mutual funds. The Examples are based on an investment of $1,000 invested at the beginning of the period in each Class and held for the entire period from August 1, 2018 through January 31, 2019.
Actual Expenses
The “Actual” lines of the tables provide information about actual account values and actual expenses. You may use the information on this page, together with the amount you invested, to estimate the expenses that you paid over the period. Simply divide your account value by $1,000 (for example, an $8,600 account value divided by $1,000 = $8.60), then multiply the result by the “Expenses Paid During Period” to estimate the expenses you paid on your account during this period. Shareholders of the Investor and Institutional Classes that invest in the Fund through an IRA or Roth IRA may be subject to a custodial IRA fee of $15 that is typically deducted each December. If your account was subject to a custodial IRA fee during the period, your costs would have been $15 higher.
Hypothetical Example for Comparison Purposes
The “Hypothetical” lines of the tables provide information about hypothetical account values and hypothetical expenses based on the Fund’s actual expense ratio and an assumed 5% per year rate of return before expenses (not the Fund’s actual return). You may compare the ongoing costs of investing in the Fund with other funds by contrasting this 5% hypothetical example and the 5% hypothetical examples that appear in the shareholder reports of the other funds. The hypothetical account values and expenses may not be used to estimate the actual ending account balance or expenses you paid for the period. Shareholders of the Investor and Institutional Classes that invest in the Funds through an IRA or Roth IRA may be subject to a custodial IRA fee of $15 that is typically deducted each December. If your account was subject to a custodial IRA fee during the period, your costs would have been $15 higher.
You should also be aware that the expenses shown in the table highlight only your ongoing costs and do not reflect any transaction costs charged by the Fund, such as sales charges (loads) or redemption fees, as applicable. Similarly, the expense examples for other funds do not reflect any transaction costs charged by those funds, such as sales charges (loads), redemption fees or exchange fees. Therefore, the “Hypothetical” lines of the tables are useful in comparing ongoing costs only and will not help you determine the relative total costs of owning different funds. If you were subject to any transaction costs during the period, your costs would have been higher.
5
American Beacon Crescent Short Duration High Income FundSM
Expense Examples
January 31, 2019 (Unaudited)
| American Beacon Crescent Short Duration High Income Fund |
| ||||||||||||||
| Beginning Account Value 8/1/2018 | Ending Account Value 1/31/2019 | Expenses Paid During Period 8/1/2018-1/31/2019* | |||||||||||||
| Institutional Class | |||||||||||||||
| Actual | $1,000.00 | $1,001.00 | $4.29 | ||||||||||||
| Hypothetical** | $1,000.00 | $1,020.92 | $4.33 | ||||||||||||
| Y Class | |||||||||||||||
| Actual | $1,000.00 | $1,002.30 | $4.79 | ||||||||||||
| Hypothetical** | $1,000.00 | $1,020.42 | $4.84 | ||||||||||||
| Investor Class | |||||||||||||||
| Actual | $1,000.00 | $998.70 | $6.20 | ||||||||||||
| Hypothetical** | $1,000.00 | $1,019.01 | $6.26 | ||||||||||||
| A Class | |||||||||||||||
| Actual | $1,000.00 | $997.20 | $6.29 | ||||||||||||
| Hypothetical** | $1,000.00 | $1,018.90 | $6.36 | ||||||||||||
| C Class | |||||||||||||||
| Actual | $1,000.00 | $994.80 | $10.06 | ||||||||||||
| Hypothetical** | $1,000.00 | $1,015.12 | $10.16 | ||||||||||||
| * | Expenses are equal to the Fund’s annualized expense ratios for thesix-month period of 0.85%, 0.95%, 1.23%, 1.25%, and 2.00% for the Institutional, Y, Investor, A, and C Classes, respectively, multiplied by the average account value over the period, multiplied by the number derived by dividing the number of days in the most recent fiscal half-year (184) by days in the year (365) to reflect the half-year period. |
| ** | 5% return before expenses. |
6
American Beacon FundsSM
Report of Independent Registered Public Accounting Firm
Tothe Board of Trustees of American Beacon Funds and Shareholders of American Beacon Crescent Short Duration High Income Fund
Opinion on the Financial Statements
We have audited the accompanying statement of assets and liabilities, including the schedule of investments, of American Beacon Crescent Short Duration High Income Fund (one of the series constituting American Beacon Funds, referred to hereafter as the “Fund”) as of January 31, 2019, the related statement of operations for the year ended January 31, 2019, the statement of changes in net assets for each of the two years in the period ended January 31, 2019, including the related notes,and the financial highlights for each of the three years in the period ended January 31, 2019 (collectively referred to as the “financial statements”). In our opinion, the financial statements present fairly, in all material respects, the financial position of the Fund as of January 31, 2019, the results of its operations for the year then ended, the changes in its net assets for each of the two years in the period ended January 31, 2019 and the financial highlights for each of the three years in the period ended January 31, 2019 in conformity with accounting principles generally accepted in the United States of America.
Basis for Opinion
These financial statements are the responsibility of the Fund’s management. Our responsibility is to express an opinion on the Fund’s financial statements based on our audits. We are a public accounting firm registered with the Public Company Accounting Oversight Board (United States) (PCAOB) and are required to be independent with respect to the Fund in accordance with the U.S. federal securities laws and the applicable rules and regulations of the Securities and Exchange Commission and the PCAOB.
We conducted our audits of these financial statements in accordance with the standards of the PCAOB. Those standards require that we plan and perform the audit to obtain reasonable assurance about whether the financial statements are free of material misstatement, whether due to error or fraud.
Our audits included performing procedures to assess the risks of material misstatement of the financial statements, whether due to error or fraud, and performing procedures that respond to those risks. Such procedures included examining, on a test basis, evidence regarding the amounts and disclosures in the financial statements. Our audits also included evaluating the accounting principles used and significant estimates made by management, as well as evaluating the overall presentation of the financial statements. Our procedures included confirmation of securities owned as of January 31, 2019 by correspondence with the custodian, transfer agent, agent banks, and brokers; when replies were not received from brokers, we performed other auditing procedures. We believe that our audits provide a reasonable basis for our opinion.
The financial statements as of and for the year ended January 31, 2016 and the financial highlights for each of the periods ended on or prior to January 31, 2016 (not presented herein, other than the financial highlights) were audited by other auditors whose report dated March 31, 2016 expressed an unqualified opinion on those financial statements and financial highlights.
PricewaterhouseCoopers LLP
Dallas, TX
March 27, 2019
We have served as the auditor of one or more investment companies in the American Beacon Funds since 2016.
7
American Beacon Crescent Short Duration High Income FundSM
Schedule of Investments
January 31, 2019
| Principal Amount | Fair Value | ||||||||||||||
| BANK LOAN OBLIGATIONSA - 23.18% | |||||||||||||||
| Basic Materials - 1.05% | |||||||||||||||
Golden Nugget, Inc., 5.253%, Due 10/4/2023, 2017 Incremental Term Loan B,(1-mo. LIBOR + 2.750%) | $ | 39,825 | $ | 39,150 | |||||||||||
H.B. Fuller Co., 4.503%, Due 10/20/2024, 2017 Term Loan B,(1-mo. LIBOR + 2.000%) | 104,124 | 102,042 | |||||||||||||
Las Vegas Sands LLC, 4.249%, Due 3/27/2025, 2018 Term Loan B,(1-mo. LIBOR + 1.750%) | 55,389 | 54,304 | |||||||||||||
Loparex Holding B.V., 7.053%, Due 4/11/2025, 2018 Term Loan,(3-mo. LIBOR + 4.250%) | 101,615 | 100,344 | |||||||||||||
Messer Industries LLC, Due 10/1/2025, 2018 USD Term LoanB | 100,000 | 97,750 | |||||||||||||
PMHC II, Inc., 6.151%, Due 3/31/2025, 2018 1st Lien Term Loan,(1-mo. LIBOR + 3.500%) | 124,063 | 118,066 | |||||||||||||
PQ Corp., 5.244%, Due 2/8/2025, 2018 Term Loan B,(3-mo. LIBOR + 2.500%) | 95,540 | 92,913 | |||||||||||||
Schenectady International Group, Inc., 7.537%, Due 10/15/2025, 2018 1st Lien Term Loan,(3-mo. LIBOR + 4.750%) | 37,000 | 36,630 | |||||||||||||
Solenis International LP, 6.707%, Due 12/26/2023, 2018 1st Lien Term Loan,(3-mo. LIBOR + 4.000%) | 99,500 | 97,593 | |||||||||||||
Starfruit Finco B.V., 5.753%, Due 10/1/2025, 2018 USD Term Loan B,(1-mo. LIBOR + 3.250%) | 125,358 | 122,460 | |||||||||||||
Univar, Inc., 4.749%, Due 7/1/2024, 2017 USD Term Loan B,(1-mo. LIBOR + 2.250%) | 88,630 | 86,652 | |||||||||||||
|
| ||||||||||||||
| 947,904 | |||||||||||||||
|
| ||||||||||||||
| Consumer - 5.02% | |||||||||||||||
8th Avenue Food & Provisions, Inc., 6.253%, Due 10/1/2025, 2018 1st Lien Term Loan,(1-mo. LIBOR + 3.750%) | 100,000 | 99,750 | |||||||||||||
Albertsons LLC, 5.499%, Due 11/17/2025, Term Loan B7,(1-mo. LIBOR + 3.000%) | 20,991 | 20,519 | |||||||||||||
Alphabet Holding Co., Inc., 5.999%, Due 9/26/2024, 2017 1st Lien Term Loan,(1-mo. LIBOR + 3.500%) | 123,438 | 111,789 | |||||||||||||
AMCP Clean Acquisition Co. LLC, | |||||||||||||||
6.686%, Due 6/16/2025, 2018 Delayed Draw Term LoanC | 5,226 | 5,147 | |||||||||||||
7.053%, Due 6/16/2025, 2018 Term Loan,(3-mo. LIBOR + 4.250%) | 21,665 | 21,340 | |||||||||||||
APX Group, Inc., 7.499%, Due 4/1/2024, 2018 Term Loan B, (PRIME + 4.000%) | 82,652 | 81,033 | |||||||||||||
Bass Pro Group LLC, 7.499%, Due 9/25/2024, Term Loan B,(1-mo. LIBOR + 5.000%) | 57,693 | 56,972 | |||||||||||||
Builders FirstSource, Inc., Due 2/29/2024, 2017 Term Loan BB | 36,774 | 35,027 | |||||||||||||
Bulldog Purchaser, Inc., 6.249%, Due 8/22/2025, 2018 Term Loan,(1-mo. LIBOR + 3.750%) | 82,099 | 79,567 | |||||||||||||
Comet Acquisition, Inc., 6.277%, Due 10/24/2025, Term Loan,(3-mo. LIBOR + 3.500%) | 47,000 | 45,708 | |||||||||||||
CRCI Longhorn Holdings, Inc., 6.016%, Due 8/8/2025, 2018 1st Lien Term Loan,(1-mo. LIBOR + 3.500%) | 99,750 | 97,256 | |||||||||||||
Crown Finance US, Inc., 4.999%, Due 2/28/2025, 2018 USD Term Loan,(1-mo. LIBOR + 2.500%) | 124,063 | 120,930 | |||||||||||||
CSC Holdings LLC, 5.009%, Due 1/25/2026, 2018 Term Loan B,(1-mo. LIBOR + 2.500%) | 124,063 | 121,064 | |||||||||||||
CVS Holdings LP, 5.250%, Due 2/6/2025, 2018 1st Lien Term Loan,(1-mo. LIBOR + 2.750%) | 124,063 | 119,565 | |||||||||||||
Dhanani Group, Inc., 6.249%, Due 7/20/2025, 2018 Term Loan B,(1-mo. LIBOR + 3.750%) | 83,197 | 81,013 | |||||||||||||
Endo Luxembourg Finance Co. S.a.r.l., 6.750%, Due 4/29/2024, 2017 Term Loan B,(1-mo. LIBOR + 4.250%) | 123,125 | 121,792 | |||||||||||||
Financial & Risk US Holdings, Inc., 6.249%, Due 10/1/2025, 2018 USD Term Loan,(1-mo. LIBOR + 3.750%) | 100,000 | 95,938 | |||||||||||||
Gray Television, Inc., 5.020%, Due 1/2/2026, 2018 Term Loan C,(3-mo. LIBOR + 2.500%) | 100,000 | 98,542 | |||||||||||||
GYP Holdings III Corp., 5.249%, Due 6/1/2025, 2018 Term Loan B,(1-mo. LIBOR + 2.750%) | 35,166 | 33,650 | |||||||||||||
Hilton Worldwide Finance LLC, 4.260%, Due 10/25/2023, Term Loan B2,(1-mo. LIBOR + 1.750%) | 30,097 | 29,747 | |||||||||||||
HLF Financing S.a r.l., 5.749%, Due 8/18/2025, 2018 Term Loan B,(1-mo. LIBOR + 3.250%) | 104,738 | 103,935 | |||||||||||||
IRB Holding Corp., 5.764%, Due 2/5/2025, 1st Lien Term Loan,(3-mo. LIBOR + 3.250%) | 124,063 | 120,616 | |||||||||||||
Kettle Cuisine LLC, 6.260%, Due 8/22/2025, 2018 Term Loan,(1-mo. LIBOR + 3.750%) | 147,630 | 146,523 | |||||||||||||
Mohegan Tribal Gaming Authority, 6.499%, Due 10/13/2023, 2016 Term Loan B,(1-mo. LIBOR + 4.000%) | 114,411 | 105,925 | |||||||||||||
Next Level Apparel, Inc., 8.403%, Due 7/17/2024, 2018 Term Loan, (1 Week LIBOR + 6.000%) | 124,219 | 122,355 | |||||||||||||
P.F. Chang’s China Bistro, Inc., 7.671%, Due 8/18/2022, 2017 Term Loan B,(3-mo. LIBOR + 5.000%) | 123,438 | 123,129 | |||||||||||||
Parexel International Corp., 5.249%, Due 9/27/2024, Term Loan B,(1-mo. LIBOR + 2.750%) | 75,427 | 71,279 | |||||||||||||
Pure Fishing, Inc., 7.322%, Due 11/30/2025, Term Loan,(3-mo. LIBOR + 4.500%) | 100,000 | 97,250 | |||||||||||||
R.R. Donnelley & Sons Co., 7.510%, Due 1/15/2024, 2018 Term Loan B,(1-mo. LIBOR + 5.000%) | 100,000 | 98,750 | |||||||||||||
Rodan & Fields LLC, 6.508%, Due 6/6/2025, 2018 Term Loan B,(1-mo. LIBOR + 4.000%) | 99,500 | 92,037 | |||||||||||||
See accompanying notes
8
American Beacon Crescent Short Duration High Income FundSM
Schedule of Investments
January 31, 2019
| Principal Amount | Fair Value | ||||||||||||||
| BANK LOAN OBLIGATIONS - 23.18% (continued) | |||||||||||||||
| Consumer - 5.02% (continued) | |||||||||||||||
RSC Acquisition, Inc., 7.053%, Due 11/30/2022, 2018 1st Lien Term Loan,(3-mo. LIBOR + 4.250%) | $ | 280,971 | $ | 279,214 | |||||||||||
Scientific Games International, Inc., 5.249%, Due 8/14/2024, 2018 Term Loan B5,(1-mo. LIBOR + 2.750%) | 82,958 | 80,331 | |||||||||||||
Shutterfly, Inc., 5.250%, Due 8/17/2024, Term Loan B2,(1-mo. LIBOR + 2.750%) | 94,073 | 91,681 | |||||||||||||
SMG Holdings, Inc., 5.499%, Due 1/23/2025, 2017 1st Lien Term Loan,(1-mo. LIBOR + 3.000%) | 124,063 | 121,116 | |||||||||||||
SRS Distribution, Inc., 5.749%, Due 5/23/2025, 2018 1st Lien Term Loan,(1-mo. LIBOR + 3.250%) | 125,370 | 118,788 | |||||||||||||
Staples, Inc., 6.541%, Due 9/12/2024, 2017 Term Loan B,(3-mo. LIBOR + 4.000%) | 78,847 | 77,389 | |||||||||||||
Strategic Partners Acquisition Corp., 6.249%, Due 6/30/2023, 2016 Term Loan,(1-mo. LIBOR + 3.750%) | 117,911 | 116,732 | |||||||||||||
TGP Holdings III LLC, | |||||||||||||||
7.053%, Due 9/25/2024, 2018 1st Lien Term Loan,(3-mo. LIBOR + 4.250%) | 193,222 | 184,769 | |||||||||||||
11.303%, Due 9/25/2025, 2nd Lien Term Loan,(3-mo. LIBOR + 8.500%) | 50,000 | 47,250 | |||||||||||||
TMK Hawk Parent Corp., 6.000%, Due 8/28/2024, 2017 1st Lien Term Loan,(1-mo. LIBOR + 3.500%) | 123,451 | 110,242 | |||||||||||||
United Natural Foods, Inc., 6.749%, Due 10/22/2025, Term Loan B,(1-mo. LIBOR + 4.250%) | 100,000 | 85,550 | |||||||||||||
United Rentals, Inc., 4.249%, Due 10/31/2025, Term Loan B,(1-mo. LIBOR + 1.750%) | 99,750 | 99,106 | |||||||||||||
Varsity Brands, Inc., 5.999%, Due 12/15/2024, 2017 Term Loan B,(1-mo. LIBOR + 3.500%) | 123,751 | 121,688 | |||||||||||||
VT Topco, Inc., | |||||||||||||||
6.553%, Due 8/1/2025, 2018 1st Lien Term Loan,(3-mo. LIBOR + 3.750%) | 79,800 | 78,337 | |||||||||||||
6.553%, Due 8/1/2025, 2018 Delayed Draw Term Loan,(3-mo. LIBOR + 3.750%)C | 19,976 | 19,610 | |||||||||||||
Wand Intermediate I LP, Due 1/23/2026, 2019 1st Lien Term LoanB | 100,000 | 99,750 | |||||||||||||
Wheel Pros LLC, 7.249%, Due 4/4/2025, 1st Lien Term Loan,(1-mo. LIBOR + 4.750%) | 167,160 | 159,638 | |||||||||||||
Wynn Resorts Ltd., 4.750%, Due 10/30/2024, Term Loan B,(1-mo. LIBOR + 2.250%) | 100,000 | 97,357 | |||||||||||||
|
| ||||||||||||||
| 4,546,696 | |||||||||||||||
|
| ||||||||||||||
| Defense - 0.22% | |||||||||||||||
Keyw Corp. (The), 7.016%, Due 5/2/2024, 1st Lien Term Loan,(1-mo. LIBOR + 4.500%) | 115,961 | 114,947 | |||||||||||||
TransDigm, Inc., 4.999%, Due 6/9/2023, 2018 Term Loan F,(1-mo. LIBOR + 2.500%) | 82,223 | 80,408 | |||||||||||||
|
| ||||||||||||||
| 195,355 | |||||||||||||||
|
| ||||||||||||||
| Energy - 0.62% | |||||||||||||||
California Resources Corp., 12.874%, Due 12/31/2021, Second Out Term Loan,(1-mo. LIBOR + 10.375%) | 12,000 | 12,525 | |||||||||||||
Energy & Exploration Partners, Inc., 5.000%, Due 5/13/2022, 2016 2nd Lien PIK Term Loan, PIK(in-kind rate 5.000%) | 6,830 | — | |||||||||||||
Grizzly Acquisitions, Inc., 6.047%, Due 10/1/2025, 2018 Term Loan B,(3-mo. LIBOR + 3.250%) | 99,750 | 99,148 | |||||||||||||
Keane Group Holdings LLC, 6.250%, Due 5/25/2025, 2018 1st Lien Term Loan,(1-mo. LIBOR + 3.750%) | 41,278 | 38,595 | |||||||||||||
Lucid Energy Group II LLC, 5.519%, Due 2/17/2025, 2018 1st Lien Term Loan,(1-mo. LIBOR + 3.000%) | 124,063 | 116,371 | |||||||||||||
McDermott Technology Americas, Inc., 7.499%, Due 5/10/2025, 2018 1st Lien Term Loan,(1-mo. LIBOR + 5.000%) | 124,063 | 118,720 | |||||||||||||
Medallion Midland Acquisition LLC, 5.749%, Due 10/30/2024, 1st Lien Term Loan,(1-mo. LIBOR + 3.250%) | 123,750 | 118,697 | |||||||||||||
PowerTeam Services LLC, 6.063%, Due 3/6/2025, 2018 1st Lien Term Loan,(3-mo. LIBOR + 3.250%) | 57,987 | 55,305 | |||||||||||||
|
| ||||||||||||||
| 559,361 | |||||||||||||||
|
| ||||||||||||||
| Financial - 3.10% | |||||||||||||||
1011778 B.C. Unlimited Liability Co., 4.749%, Due 2/16/2024, Term Loan B3,(1-mo. LIBOR + 2.250%) | 112,720 | 110,748 | |||||||||||||
Achilles Acquisition LLC, 6.500%, Due 10/3/2025, 2018 Term Loan,(1-mo. LIBOR + 4.000%) | 100,000 | 98,875 | |||||||||||||
Acrisure LLC, 6.749%, Due 11/22/2023, 2017 Term Loan B,(1-mo. LIBOR + 4.250%) | 124,522 | 121,876 | |||||||||||||
Alera Group Holdings, Inc., 6.999%, Due 7/25/2025, 2018 Term Loan B,(1-mo. LIBOR + 4.500%) | 99,750 | 99,376 | |||||||||||||
AssuredPartners, Inc., 5.749%, Due 10/22/2024, 2017 1st LienAdd-On Term Loan,(1-mo. LIBOR + 3.250%) | 132,944 | 128,491 | |||||||||||||
See accompanying notes
9
American Beacon Crescent Short Duration High Income FundSM
Schedule of Investments
January 31, 2019
| Principal Amount | Fair Value | ||||||||||||||
| BANK LOAN OBLIGATIONS - 23.18% (continued) | |||||||||||||||
| Financial - 3.10% (continued) | |||||||||||||||
Asurion LLC, | |||||||||||||||
5.499%, Due 11/3/2024, 2018 Term Loan B7,(1-mo. LIBOR + 3.000%) | $ | 99,771 | $ | 98,108 | |||||||||||
8.999%, Due 8/4/2025, 2017 2nd Lien Term Loan,(1-mo. LIBOR + 6.500%) | 101,436 | 101,944 | |||||||||||||
Avolon TLB Borrower (US) LLC, 4.503%, Due 1/15/2025, Term Loan B3,(1-mo. LIBOR + 2.000%) | 134,413 | 132,901 | |||||||||||||
Capital Automotive LP, 8.499%, Due 3/24/2025, 2017 2nd Lien Term Loan,(1-mo. LIBOR + 6.000%) | 116,900 | 116,024 | |||||||||||||
DTZ U.S. Borrower LLC, 5.749%, Due 8/21/2025, 2018 Add On Term Loan B,(1-mo. LIBOR + 3.250%) | 124,688 | 122,162 | |||||||||||||
Edelman Financial Center LLC, 6.037%, Due 7/21/2025, 2018 1st Lien Term Loan,(3-mo. LIBOR + 3.250%) | 70,000 | 69,270 | |||||||||||||
EIG Management Co. LLC, 6.269%, Due 2/22/2025, 2018 Term Loan B,(1-mo. LIBOR + 3.750%) | 103,220 | 102,317 | |||||||||||||
First Data Corp., | |||||||||||||||
4.519%, Due 7/8/2022, 2017 USD Term Loan,(1-mo. LIBOR + 2.000%) | 58,003 | 57,752 | |||||||||||||
4.519%, Due 4/26/2024, 2024 USD Term Loan,(1-mo. LIBOR + 2.000%) | 36,235 | 36,088 | |||||||||||||
Forest City Enterprises LP, 6.513%, Due 12/7/2025, Term Loan B,(1-mo. LIBOR + 4.000%) | 100,000 | 99,833 | |||||||||||||
Franklin Square Holdings LP, 5.063%, Due 8/1/2025, 2018 Term Loan B,(1-mo. LIBOR + 2.500%) | 99,750 | 98,628 | |||||||||||||
Genworth Holdings, Inc., 7.008%, Due 3/7/2023, Term Loan,(1-mo. LIBOR + 4.500%) | 124,063 | 123,752 | |||||||||||||
Iron Mountain, Inc., 4.249%, Due 1/2/2026, 2018 Term Loan B,(1-mo. LIBOR + 1.750%) | 15,238 | 14,743 | |||||||||||||
iStar, Inc., 5.258%, Due 6/28/2023, 2016 Term Loan B,(1-mo. LIBOR + 2.750%) | 96,515 | 95,429 | |||||||||||||
Jane Street Group LLC, 5.499%, Due 8/25/2022, 2018 Term Loan B,(1-mo. LIBOR + 3.000%) | 122,300 | 120,466 | |||||||||||||
Prime Security Services Borrower LLC, 5.249%, Due 5/2/2022, 2016 1st Lien Term Loan,(1-mo. LIBOR + 2.750%) | 72,448 | 71,361 | |||||||||||||
SBA Senior Finance II LLC, 4.500%, Due 4/11/2025, 2018 Term Loan B,(1-mo. LIBOR + 2.000%) | 111,440 | 109,304 | |||||||||||||
Sedgwick Claims Management Services, Inc., 5.749%, Due 12/31/2025, 2018 Term Loan B,(1-mo. LIBOR + 3.250%) | 100,000 | 97,333 | |||||||||||||
StepStone Group LP, 6.499%, Due 3/14/2025, Term Loan B,(1-mo. LIBOR + 4.000%) | 168,314 | 167,052 | |||||||||||||
Valet Waste Holdings, Inc., 6.499%, Due 9/28/2025, 2018 1st Lien Term Loan,(1-mo. LIBOR + 4.000%) | 126,683 | 125,416 | |||||||||||||
VFH Parent LLC, Due 1/30/2026, 2019 Term Loan BB | 100,000 | 99,813 | |||||||||||||
VICI Properties LLC, 4.503%, Due 12/20/2024, Replacement Term Loan B,(1-mo. LIBOR + 2.000%) | 115,000 | 112,808 | |||||||||||||
WEX, Inc., 4.749%, Due 6/30/2023, 2017 Term Loan B2,(1-mo. LIBOR + 2.250%) | 75,684 | 74,454 | |||||||||||||
|
| ||||||||||||||
| 2,806,324 | |||||||||||||||
|
| ||||||||||||||
| Health Care - 2.05% | |||||||||||||||
Affordable Care Holding Corp., 7.396%, Due 10/22/2022, 2015 1st Lien Term Loan,(2-mo. LIBOR + 4.750%) | 70,205 | 69,503 | |||||||||||||
Agiliti Health, Inc., Due 1/4/2026, Term LoanBC | 100,000 | 99,375 | |||||||||||||
Amneal Pharmaceuticals LLC, 6.000%, Due 5/4/2025, 2018 Term Loan B,(1-mo. LIBOR + 3.500%) | 124,346 | 123,050 | |||||||||||||
Avalign Technologies, Inc., 6.999%, Due 12/22/2025, 2018 Term Loan B,(1-mo. LIBOR + 4.500%) | 159,974 | 158,374 | |||||||||||||
Avantor, Inc., 6.572%, Due 11/21/2024, 2017 1st Lien Term Loan,(3-mo. LIBOR + 3.750%) | 74,024 | 73,709 | |||||||||||||
Beaver-Visitec International, Inc., 6.619%, Due 8/21/2023, 2018 Term Loan B,(2-mo. LIBOR + 4.000%) | 100,148 | 98,646 | |||||||||||||
Carestream Health, Inc., 8.249%, Due 2/28/2021, 1st Lien Term Loan,(1-mo. LIBOR + 5.750%) | 77,018 | 74,900 | |||||||||||||
DentalCorp Perfect Smile ULC, | |||||||||||||||
5.586%, Due 6/6/2025, 1st Lien Delayed Draw Term Loan,(1-mo. LIBOR + 3.750%)C | 22,155 | 21,643 | |||||||||||||
6.249%, Due 6/6/2025, 1st Lien Term Loan,(1-mo. LIBOR + 3.750%) | 88,356 | 86,313 | |||||||||||||
Envision Healthcare Corp., 6.249%, Due 10/10/2025, 2018 1st Lien Term Loan,(1-mo. LIBOR + 3.750%) | 73,333 | 68,970 | |||||||||||||
Gentiva Health Services, Inc., 6.250%, Due 7/2/2025, 2018 1st Lien Term Loan,(1-mo. LIBOR + 3.750%) | 97,493 | 96,762 | |||||||||||||
Grifols Worldwide Operations USA, Inc., 4.664%, Due 1/31/2025, 2017 Acquisition Term Loan, (1 Week LIBOR + 2.250%) | 11,154 | 10,998 | |||||||||||||
See accompanying notes
10
American Beacon Crescent Short Duration High Income FundSM
Schedule of Investments
January 31, 2019
| Principal Amount | Fair Value | ||||||||||||||
| BANK LOAN OBLIGATIONS - 23.18% (continued) | |||||||||||||||
| Health Care - 2.05% (continued) | |||||||||||||||
Ivory Merger Sub, Inc., 6.020%, Due 3/7/2025, 2018 1st Lien Term Loan,(1-mo. LIBOR + 3.500%) | $ | 151,235 | $ | 139,703 | |||||||||||
Mallinckrodt International Finance S.A., 5.618%, Due 2/24/2025, 2018 Term Loan B,(3-mo. LIBOR + 3.000%) | 63,927 | 59,905 | |||||||||||||
MedPlast Holdings, Inc., 6.553%, Due 7/2/2025, 2018 1st Lien Term Loan,(3-mo. LIBOR + 3.750%) | 57,913 | 57,733 | |||||||||||||
NVA Holdings, Inc., 5.249%, Due 2/2/2025, Term Loan B3,(1-mo. LIBOR + 2.750%) | 124,064 | 118,481 | |||||||||||||
Pearl Intermediate Parent LLC, | |||||||||||||||
5.269%, Due 2/14/2025, 2018 1st Lien Term Loan,(1-mo. LIBOR + 2.750%) | 61,355 | 58,517 | |||||||||||||
5.269%, Due 2/14/2025, 2018 Delayed Draw Term Loan,(1-mo. LIBOR + 2.750%)C | 18,134 | 17,296 | |||||||||||||
Premise Health Holding Corp., | |||||||||||||||
Due 7/10/2025, 2018 1st Lien Delayed Draw Term LoanBC | 7,353 | 7,243 | |||||||||||||
6.553%, Due 7/10/2025, 2018 1st Lien Term Loan,(3-mo. LIBOR + 3.750%) | 92,416 | 91,029 | |||||||||||||
Prospect Medical Holdings, Inc., 8.063%, Due 2/22/2024, 2018 Term Loan B,(1-mo. LIBOR + 5.500%) | 124,063 | 122,822 | |||||||||||||
RegionalCare Hospital Partners Holdings, Inc., 7.129%, Due 11/16/2025, 2018 Term Loan B,(3-mo. LIBOR + 4.500%) | 102,000 | 99,424 | |||||||||||||
Universal Health Services, Inc., 4.249%, Due 10/31/2025, Term Loan B,(1-mo. LIBOR + 1.750%) | 100,000 | 99,750 | |||||||||||||
|
| ||||||||||||||
| 1,854,146 | |||||||||||||||
|
| ||||||||||||||
| Manufacturing - 2.06% | |||||||||||||||
American Bath Group LLC, 7.053%, Due 9/30/2023, 2018 Term Loan B,(3-mo. LIBOR + 4.250%) | 245,016 | 241,953 | |||||||||||||
Berlin Packaging LLC, 5.547%, Due 11/7/2025, 2018 1st Lien Term Loan,(1-mo. LIBOR + 3.000%) | 121,390 | 116,534 | |||||||||||||
Brookfield WEC Holdings, Inc., 6.249%, Due 8/1/2025, 2018 1st Lien Term Loan,(1-mo. LIBOR + 3.750%) | 100,000 | 99,411 | |||||||||||||
BWAY Holding Co., 6.033%, Due 4/3/2024, 2017 Term Loan B,(3-mo. LIBOR + 3.250%) | 48,265 | 46,485 | |||||||||||||
Consolidated Container Co. LLC, 5.249%, Due 5/22/2024, 2017 1st Lien Term Loan,(1-mo. LIBOR + 2.750%) | 113,516 | 110,735 | |||||||||||||
DAE Aviation Holdings, Inc., | |||||||||||||||
Due 1/23/2026, 2019 Term Loan BB | 65,035 | 64,756 | |||||||||||||
Due 1/23/2026, CAD Term LoanB | 34,965 | 34,815 | |||||||||||||
DG Investment Intermediate Holdings, Inc., 5.499%, Due 2/3/2025, 2018 1st Lien Term Loan,(1-mo. LIBOR + 3.000%) | 124,114 | 119,150 | |||||||||||||
Edward Don & Co. LLC, 6.749%, Due 7/2/2025, 2018 Term Loan,(1-mo. LIBOR + 4.250%) | 98,254 | 97,517 | |||||||||||||
Emerald Performance Materials LLC, 5.999%, Due 8/1/2021, New 1st Lien Term Loan,(1-mo. LIBOR + 3.500%) | 82,680 | 81,888 | |||||||||||||
Flex Acquisition Co., Inc., 5.520%, Due 12/29/2023, 1st Lien Term Loan,(1-mo. LIBOR + 3.000%) | 122,813 | 118,923 | |||||||||||||
Forming Machining Industries Holdings LLC, 6.851%, Due 10/3/2025, Term Loan,(3-mo. LIBOR + 4.250%) | 119,000 | 116,620 | |||||||||||||
LTI Holdings, Inc., 5.999%, Due 9/6/2025, 2018 Add On 1st Lien Term Loan,(1-mo. LIBOR + 3.500%) | 53,750 | 51,846 | |||||||||||||
Netsmart Technologies, Inc., 6.249%, Due 4/19/2023, Term Loan D1,(1-mo. LIBOR + 3.750%) | 75,428 | 74,202 | |||||||||||||
Pisces Midco, Inc., 6.547%, Due 4/12/2025, 2018 Term Loan,(3-mo. LIBOR + 3.750%) | 124,375 | 118,312 | |||||||||||||
SHO Holding I Corp., 7.744%, Due 10/27/2022, Term Loan,(3-mo. LIBOR + 5.000%) | 192,629 | 177,218 | |||||||||||||
Tank Holding Corp., 5.763%, Due 3/17/2022, 2018 Term Loan B,(1-mo. LIBOR + 3.250%) | 83,043 | 81,383 | |||||||||||||
Titan Acquisition Ltd., 5.499%, Due 3/28/2025, 2018 Term Loan B,(1-mo. LIBOR + 3.000%) | 124,063 | 116,671 | |||||||||||||
|
| ||||||||||||||
| 1,868,419 | |||||||||||||||
|
| ||||||||||||||
| Media - 0.49% | |||||||||||||||
Information Resources, Inc., 6.999%, Due 12/1/2025, 2018 1st Lien Term Loan,(1-mo. LIBOR + 4.500%) | 100,000 | 98,150 | |||||||||||||
Meredith Corp., 5.249%, Due 1/31/2025, 2018 Term Loan B,(1-mo. LIBOR + 2.750%) | 85,243 | 84,658 | |||||||||||||
Univision Communications, Inc., 5.249%, Due 3/15/2024, Term Loan C5,(1-mo. LIBOR + 2.750%) | 17,452 | 16,219 | |||||||||||||
UPC Financing Partnership, 5.009%, Due 1/15/2026, USD Term Loan AR,(1-mo. LIBOR + 2.500%) | 62,468 | 61,453 | |||||||||||||
Virgin Media Bristol LLC, 5.009%, Due 1/15/2026, Term Loan K,(1-mo. LIBOR + 2.500%) | 81,000 | 79,442 | |||||||||||||
WeddingWire, Inc., 7.290%, Due 12/19/2025, 1st Lien Term Loan,(3-mo. LIBOR + 4.500%) | 100,000 | 99,625 | |||||||||||||
|
| ||||||||||||||
| 439,547 | |||||||||||||||
|
| ||||||||||||||
See accompanying notes
11
American Beacon Crescent Short Duration High Income FundSM
Schedule of Investments
January 31, 2019
| Principal Amount | Fair Value | ||||||||||||||
| BANK LOAN OBLIGATIONS - 23.18% (continued) | |||||||||||||||
| Service - 4.23% | |||||||||||||||
Academy, Ltd., 6.514%, Due 7/1/2022, 2015 Term Loan B,(1-mo. LIBOR + 4.000%) | $ | 26,776 | $ | 18,375 | |||||||||||
ADMI Corp., 5.499%, Due 4/30/2025, 2018 Term Loan B,(1-mo. LIBOR + 3.000%) | 128,446 | 126,279 | |||||||||||||
Albany Molecular Research, Inc., 5.749%, Due 8/30/2024, 2017 1st Lien Term Loan,(1-mo. LIBOR + 3.250%) | 123,438 | 119,618 | |||||||||||||
Allied Universal Holdco LLC, | |||||||||||||||
6.249%, Due 7/28/2022, 2015 Term Loan,(1-mo. LIBOR + 3.750%) | 60,624 | 57,805 | |||||||||||||
6.749%, Due 7/28/2022, Incremental Term Loan,(1-mo. LIBOR + 4.250%) | 66,000 | 63,525 | |||||||||||||
American Airlines, Inc., 4.252%, Due 6/27/2025, 2018 Term Loan B,(1-mo. LIBOR + 1.750%) | 55,525 | 53,116 | |||||||||||||
ATI Holdings Acquisition, Inc., 6.008%, Due 5/10/2023, 2016 Term Loan,(1-mo. LIBOR + 3.500%) | 98,376 | 95,671 | |||||||||||||
BioClinica, Inc., 7.000%, Due 10/20/2023, 1st Lien Term Loan,(3-mo. LIBOR + 4.250%) | 84,944 | 76,662 | |||||||||||||
BJ’s Wholesale Club, Inc., 5.514%, Due 2/3/2024, 2017 1st Lien Term Loan,(1-mo. LIBOR + 3.000%) | 79,029 | 78,283 | |||||||||||||
Blackhawk Network Holdings, Inc., 5.499%, Due 6/15/2025, 2018 1st Lien Term Loan,(1-mo. LIBOR + 3.000%) | 67,660 | 66,341 | |||||||||||||
Boing US Holdco, Inc., 5.839%, Due 10/3/2024, 2017 1st Lien Term Loan,(3-mo. LIBOR + 3.250%) | 123,752 | 122,308 | |||||||||||||
Brand Energy & Infrastructure Services, Inc., 6.957%, Due 6/21/2024, 2017 Term Loan,(2-mo. LIBOR + 4.250%) | 123,125 | 117,826 | |||||||||||||
California Pizza Kitchen, Inc., 8.500%, Due 8/23/2022, 2016 Term Loan,(1-mo. LIBOR + 6.000%) | 244,375 | 238,266 | |||||||||||||
Camelot UK Holdco Ltd., 5.749%, Due 10/3/2023, 2017 Repriced Term Loan,(1-mo. LIBOR + 3.250%) | 67,694 | 67,145 | |||||||||||||
CareerBuilder LLC, 9.553%, Due 7/31/2023, Term Loan,(3-mo. LIBOR + 6.750%) | 60,576 | 60,122 | |||||||||||||
EAB Global, Inc., 6.408%, Due 11/15/2024, 1st Lien Term Loan,(3-mo. LIBOR + 3.750%) | 124,063 | 120,030 | |||||||||||||
Heartland Dental LLC, | |||||||||||||||
Due 4/30/2025, 2018 Delayed Draw Term LoanBC | 1,654 | 1,601 | |||||||||||||
6.249%, Due 4/30/2025, 2018 1st Lien Term Loan,(3-mo. LIBOR + 3.750%) | 2,121 | 2,053 | |||||||||||||
Hoya Midco LLC, 5.999%, Due 6/30/2024, 2017 1st Lien Term Loan,(1-mo. LIBOR + 3.500%) | 123,125 | 119,021 | |||||||||||||
IG Investment Holdings LLC, 6.126%, Due 5/23/2025, 2018 1st Lien Term Loan,(1-mo. LIBOR + 3.500%) | 121,007 | 119,131 | |||||||||||||
Institutional Shareholder Services, Inc., | |||||||||||||||
6.517%, Due 10/16/2024, 2017 Delayed Draw Term Loan, (PRIME + 2.750%) | 10,149 | 9,845 | |||||||||||||
6.553%, Due 10/16/2024, 2017 1st Lien Term Loan,(3-mo. LIBOR + 3.750%) | 111,360 | 108,019 | |||||||||||||
Kingpin Intermediate Holdings LLC, 6.000%, Due 7/3/2024, 2018 Term Loan B,(1-mo. LIBOR + 3.500%) | 124,438 | 123,505 | |||||||||||||
Lakeland Tours LLC, 6.788%, Due 12/15/2024, 2017 1st Lien Term Loan B,(3-mo. LIBOR + 4.000%) | 124,063 | 122,590 | |||||||||||||
Marriott Ownership Resorts, Inc., 4.749%, Due 8/29/2025, 2018 Term Loan B,(1-mo. LIBOR + 2.250%) | 13,461 | 13,352 | |||||||||||||
Midas Intermediate Holdco II LLC, Due 8/18/2021, Incremental Term Loan BB | 48,910 | 47,402 | |||||||||||||
Neiman Marcus Group Ltd. LLC, 5.763%, Due 10/25/2020, 2020 Term Loan,(1-mo. LIBOR + 3.250%) | 45,640 | 40,368 | |||||||||||||
NMSC Holdings, Inc., 7.594%, Due 4/19/2023, 1st Lien Term Loan,(3-mo. LIBOR + 5.000%) | 250,000 | 248,125 | |||||||||||||
Playpower, Inc., 7.553%, Due 6/23/2021, 2015 1st Lien Term Loan,(3-mo. LIBOR + 4.750%) | 242,462 | 242,462 | |||||||||||||
Pre-Paid Legal Services, Inc., 5.499%, Due 5/1/2025, 2018 1st Lien Term Loan,(1-mo. LIBOR + 3.000%) | 67,280 | 66,271 | |||||||||||||
Quidditch Acquisition, Inc., 9.503%, Due 3/14/2025, 2018 Term Loan B,(1-mo. LIBOR + 7.000%) | 109,175 | 108,083 | |||||||||||||
Realogy Group LLC, 4.758%, Due 2/8/2025, 2018 Term Loan B,(1-mo. LIBOR + 2.250%) | 73,716 | 71,689 | |||||||||||||
Red Ventures LLC, 5.499%, Due 11/8/2024, 2018 Term Loan B,(1-mo. LIBOR + 3.000%) | 122,529 | 121,228 | |||||||||||||
Rentpath, Inc., 7.250%, Due 12/17/2021, 2017 Term Loan,(1-mo. LIBOR + 4.750%) | 82,173 | 61,321 | |||||||||||||
Sabre GLBL, Inc., 4.499%, Due 2/22/2024, 2018 Term Loan B,(1-mo. LIBOR + 2.000%) | 109,173 | 107,620 | |||||||||||||
Spin Holdco, Inc., 6.029%, Due 11/14/2022, 2017 Term Loan B,(3-mo. LIBOR + 3.250%) | 87,009 | 84,833 | |||||||||||||
Syneos Health, Inc., 4.499%, Due 8/1/2024, 2018 Term Loan B,(1-mo. LIBOR + 2.000%) | 31,110 | 30,553 | |||||||||||||
Tribune Media Co., 5.499%, Due 12/27/2020, Term Loan,(1-mo. LIBOR + 3.000%) | 4,219 | 4,215 | |||||||||||||
TruGreen LP, 6.514%, Due 4/13/2023, 2017 Term Loan,(1-mo. LIBOR + 4.000%) | 46,960 | 47,078 | |||||||||||||
USIC Holdings, Inc., 5.749%, Due 12/8/2023, 2017 Term Loan B,(1-mo. LIBOR + 3.250%) | 10,641 | 10,242 | |||||||||||||
Vestcom Parent Holdings, Inc., 6.499%, Due 12/19/2023, 2016 1st Lien Term Loan, (PRIME + 3.000%) | 122,816 | 119,439 | |||||||||||||
See accompanying notes
12
American Beacon Crescent Short Duration High Income FundSM
Schedule of Investments
January 31, 2019
| Principal Amount | Fair Value | ||||||||||||||
| BANK LOAN OBLIGATIONS - 23.18% (continued) | |||||||||||||||
| Service - 4.23% (continued) | |||||||||||||||
William Morris Endeavor Entertainment LLC, 5.250%, Due 5/18/2025, 2018 1st Lien Term Loan,(1-mo. LIBOR + 2.750%) | $ | 84,257 | $ | 79,123 | |||||||||||
World Triathlon Corp., 6.803%, Due 6/26/2021, Term Loan,(3-mo. LIBOR + 4.000%) | 245,501 | 244,274 | |||||||||||||
|
| ||||||||||||||
| 3,834,815 | |||||||||||||||
|
| ||||||||||||||
| Technology - 2.44% | |||||||||||||||
Almonde, Inc., | |||||||||||||||
6.303%, Due 6/13/2024, USD 1st Lien Term Loan,(3-mo. LIBOR + 3.500%) | 53,647 | 51,401 | |||||||||||||
10.053%, Due 6/13/2025, USD 2nd Lien Term Loan,(3-mo. LIBOR + 7.250%) | 84,825 | 79,796 | |||||||||||||
AqGen Ascensus, Inc., 6.119%, Due 12/3/2022, 2017 Repriced Term Loan,(2-mo. LIBOR + 3.500%) | 105,378 | 102,744 | |||||||||||||
Capri Finance LLC, 5.994%, Due 11/1/2024, USD 2017 1st Lien Term Loan,(3-mo. LIBOR + 3.250%) | 85,972 | 83,393 | |||||||||||||
Compuware Corp., 6.002%, Due 8/22/2025, 2018 Term Loan B,(1-mo. LIBOR + 3.500%) | 100,000 | 99,813 | |||||||||||||
Dell International LLC, 4.500%, Due 9/7/2023, 2017 Term Loan B,(1-mo. LIBOR + 2.000%) | 154,436 | 152,177 | |||||||||||||
DiscoverOrg LLC, Due 2/1/2026, 2019 1st Lien Term LoanB | 100,000 | 99,250 | |||||||||||||
Dynatrace LLC, 5.749%, Due 8/22/2025, 2018 1st Lien Term Loan,(1-mo. LIBOR + 3.250%) | 52,855 | 52,227 | |||||||||||||
GGC Aperio Holdings LP, 7.375%, Due 10/28/2024, Term Loan,(2-mo. LIBOR + 4.750%)D H | 175,000 | 170,888 | |||||||||||||
GrafTech Finance, Inc., 5.999%, Due 2/12/2025, 2018 Term Loan B,(1-mo. LIBOR + 3.500%) | 120,706 | 118,443 | |||||||||||||
MH Sub I LLC, 6.269%, Due 9/13/2024, 2017 1st Lien Term Loan,(1-mo. LIBOR + 3.750%) | 123,438 | 121,085 | |||||||||||||
Navicure, Inc., 6.249%, Due 11/1/2024, 1st Lien Term Loan B,(1-mo. LIBOR + 3.750%) | 123,750 | 120,966 | |||||||||||||
Omnitracs, Inc., 5.574%, Due 3/21/2025, 2018 Term Loan B,(3-mo. LIBOR + 2.750%) | 108,768 | 105,369 | |||||||||||||
P2 Upstream Acquisition Co., 6.600%, Due 10/30/2020, 1st Lien Term Loan,(3-mo. LIBOR + 4.000%) | 134,288 | 130,595 | |||||||||||||
Plantronics, Inc., 4.999%, Due 7/2/2025, 2018 Term Loan B,(1-mo. LIBOR + 2.500%) | 80,102 | 77,766 | |||||||||||||
Riverbed Technology, Inc., 5.750%, Due 4/24/2022, 2016 Term Loan,(1-mo. LIBOR + 3.250%) | 56,000 | 51,170 | |||||||||||||
Sound Inpatient Physicians, 5.249%, Due 6/27/2025, 2018 1st Lien Term Loan,(1-mo. LIBOR + 2.750%) | 99,500 | 97,821 | |||||||||||||
SS&C Technologies Holdings Europe S.a.r.l., 4.749%, Due 4/16/2025, 2018 Term Loan B4,(1-mo. LIBOR + 2.250%) | 29,903 | 29,275 | |||||||||||||
SS&C Technologies, Inc., | |||||||||||||||
4.749%, Due 4/16/2025, 2018 Term Loan B3,(1-mo. LIBOR + 2.250%) | 77,743 | 76,113 | |||||||||||||
4.749%, Due 4/16/2025, 2018 Term Loan B5,(1-mo. LIBOR + 2.250%) | 20,116 | 19,719 | |||||||||||||
Triple Point Technology, Inc., 6.884%, Due 7/10/2020, 1st Lien Term Loan,(2-mo. LIBOR + 4.250%) | 82,660 | 67,781 | |||||||||||||
Verifone Systems, Inc., 6.645%, Due 8/20/2025, 2018 1st Lien Term Loan,(3-mo. LIBOR + 4.000%) | 99,750 | 97,630 | |||||||||||||
Verscend Holding Corp., 6.999%, Due 8/27/2025, 2018 Term Loan B,(1-mo. LIBOR + 4.500%) | 121,695 | 120,529 | |||||||||||||
Western Digital Corp., 4.260%, Due 4/29/2023, 2018 Term Loan B4,(1-mo. LIBOR + 1.750%) | 87,779 | 85,584 | |||||||||||||
|
| ||||||||||||||
| 2,211,535 | |||||||||||||||
|
| ||||||||||||||
| Telecommunications - 1.41% | |||||||||||||||
Altice France S.A., 6.509%, Due 8/14/2026, 2018 Term Loan B13,(1-mo. LIBOR + 4.000%) | 99,750 | 93,944 | |||||||||||||
Anastasia Parent LLC, 6.249%, Due 8/11/2025, 2018 Term Loan B,(1-mo. LIBOR + 3.750%) | 55,860 | 52,927 | |||||||||||||
Avaya, Inc., 6.759%, Due 12/15/2024, 2018 Term Loan B,(1-mo. LIBOR + 4.250%) | 123,750 | 121,584 | |||||||||||||
Charter Communications Operating LLC, 4.500%, Due 4/30/2025, 2017 Term Loan B,(1-mo. LIBOR + 2.000%) | 123,750 | 121,949 | |||||||||||||
Flexential Intermediate Corp., 6.303%, Due 8/1/2024, 2017 1st Lien Term Loan,(3-mo. LIBOR + 3.500%) | 123,438 | 111,402 | |||||||||||||
GoodRx, Inc., 5.514%, Due 10/10/2025, 1st Lien Term Loan,(1-mo. LIBOR + 3.000%) | 100,000 | 98,292 | |||||||||||||
GTT Communications, Inc., 5.250%, Due 5/31/2025, 2018 USD Term Loan B,(1-mo. LIBOR + 2.750%) | 30,845 | 28,898 | |||||||||||||
Intelsat Jackson Holdings S.A., 6.252%, Due 11/27/2023, 2017 Term Loan B3,(1-mo. LIBOR + 3.750%) | 42,000 | 41,588 | |||||||||||||
Merrill Communications LLC, 7.994%, Due 6/1/2022, 2015 Term Loan,(3-mo. LIBOR + 5.250%) | 35,726 | 35,659 | |||||||||||||
Mission Broadcasting, Inc., 4.756%, Due 1/17/2024, 2018 Term Loan B3,(3-mo. LIBOR + 2.250%) | 13,756 | 13,292 | |||||||||||||
NeuStar, Inc., 5.999%, Due 8/8/2024, 2018 Term Loan B4,(1-mo. LIBOR + 3.500%) | 123,438 | 119,734 | |||||||||||||
Nexstar Broadcasting, Inc., 4.752%, Due 1/17/2024, 2018 Term Loan B3,(1-mo. LIBOR + 2.250%) | 79,571 | 76,886 | |||||||||||||
Speedcast International Ltd., 5.553%, Due 5/2/2025, Term Loan B,(3-mo. LIBOR + 2.750%) | 125,370 | 120,773 | |||||||||||||
See accompanying notes
13
American Beacon Crescent Short Duration High Income FundSM
Schedule of Investments
January 31, 2019
| Principal Amount | Fair Value | ||||||||||||||
| BANK LOAN OBLIGATIONS - 23.18% (continued) | |||||||||||||||
| Telecommunications - 1.41% (continued) | |||||||||||||||
Sprint Communications, Inc., 5.000%, Due 2/2/2024, 1st Lien Term Loan B,(1-mo. LIBOR + 2.500%) | $ | 31,678 | $ | 30,925 | |||||||||||
Syniverse Holdings, Inc., 7.509%, Due 3/9/2023, 2018 1st Lien Term Loan,(1-mo. LIBOR + 5.000%) | 124,063 | 112,380 | |||||||||||||
Web.com Group, Inc., 6.269%, Due 10/10/2025, 2018 Term Loan B,(1-mo. LIBOR + 3.750%) | 100,000 | 96,500 | |||||||||||||
|
| ||||||||||||||
| 1,276,733 | |||||||||||||||
|
| ||||||||||||||
| Transportation - 0.21% | |||||||||||||||
American Tire Distributors Holdings, Inc., 9.999%, Due 9/2/2024, 2015 Term Loan,(1-mo. LIBOR + 7.500%) | 80,066 | 70,999 | |||||||||||||
XPO Logistics, Inc., 4.500%, Due 2/24/2025, 2018 Term Loan B,(1-mo. LIBOR + 2.000%) | 125,000 | 122,951 | |||||||||||||
|
| ||||||||||||||
| 193,950 | |||||||||||||||
|
| ||||||||||||||
| Utilities - 0.28% | |||||||||||||||
Calpine Corp., 5.310%, Due 1/15/2024, Term Loan B5,(3-mo. LIBOR + 2.500%) | 111,136 | 109,040 | |||||||||||||
Eastern Power LLC, 6.249%, Due 10/2/2023, Term Loan B,(1-mo. LIBOR + 3.750%) | 80,774 | 78,679 | |||||||||||||
Vistra Energy Corp., 4.499%, Due 12/31/2025, 1st Lien Term Loan B3,(1-mo. LIBOR + 2.000%) | 56,167 | 55,060 | |||||||||||||
Vistra Operations Co. LLC, Due 12/14/2023, 2016 Term Loan B2B | 14,578 | 14,418 | |||||||||||||
|
| ||||||||||||||
| 257,197 | |||||||||||||||
|
| ||||||||||||||
Total Bank Loan Obligations (Cost $21,492,707) | 20,991,982 | ||||||||||||||
|
| ||||||||||||||
| CORPORATE OBLIGATIONS - 56.34% | |||||||||||||||
| Basic Materials - 2.10% | |||||||||||||||
CF Industries, Inc., 3.450%, Due 6/1/2023 | 200,000 | 193,000 | |||||||||||||
Freeport-McMoRan, Inc., 3.550%, Due 3/1/2022 | 850,000 | 822,375 | |||||||||||||
Huntsman International LLC, 5.125%, Due 11/15/2022 | 500,000 | 517,500 | |||||||||||||
PQ Corp., 6.750%, Due 11/15/2022E | 350,000 | 365,925 | |||||||||||||
|
| ||||||||||||||
| 1,898,800 | |||||||||||||||
|
| ||||||||||||||
| Communications - 12.29% | |||||||||||||||
Block Communications, Inc., 6.875%, Due 2/15/2025E | 300,000 | 307,500 | |||||||||||||
Cablevision Systems Corp., 5.875%, Due 9/15/2022 | 950,000 | 954,750 | |||||||||||||
CCO Holdings LLC / CCO Holdings Capital Corp., | |||||||||||||||
5.250%, Due 9/30/2022 | 425,000 | 429,643 | |||||||||||||
5.125%, Due 2/15/2023 | 475,000 | 479,750 | |||||||||||||
CenturyLink, Inc., | |||||||||||||||
6.450%, Due 6/15/2021, Series S | 250,000 | 254,450 | |||||||||||||
5.800%, Due 3/15/2022, Series T | 200,000 | 200,426 | |||||||||||||
7.500%, Due 4/1/2024, Series Y | 325,000 | 329,875 | |||||||||||||
Clear Channel Worldwide Holdings, Inc., 6.500%, Due 11/15/2022, Series B | 350,000 | 357,875 | |||||||||||||
CSC Holdings LLC, 5.125%, Due 12/15/2021, Series 144E | 250,000 | 250,387 | |||||||||||||
DISH DBS Corp., | |||||||||||||||
6.750%, Due 6/1/2021 | 600,000 | 611,106 | |||||||||||||
5.000%, Due 3/15/2023 | 400,000 | 348,000 | |||||||||||||
EIG Investors Corp., 10.875%, Due 2/1/2024 | 350,000 | 367,500 | |||||||||||||
Frontier Communications Corp., | |||||||||||||||
7.125%, Due 3/15/2019 | 250,000 | 246,250 | |||||||||||||
10.500%, Due 9/15/2022 | 250,000 | 179,063 | |||||||||||||
8.500%, Due 4/1/2026E | 225,000 | 204,131 | |||||||||||||
Lamar Media Corp., 5.000%, Due 5/1/2023 | 250,000 | 251,875 | |||||||||||||
Level 3 Financing, Inc., 5.375%, Due 1/15/2024 | 650,000 | 646,750 | |||||||||||||
Plantronics, Inc., 5.500%, Due 5/31/2023E | 500,000 | 477,500 | |||||||||||||
Qwest Corp., 6.750%, Due 12/1/2021 | 25,000 | 26,719 | |||||||||||||
Salem Media Group, Inc., 6.750%, Due 6/1/2024E | 175,000 | 157,500 | |||||||||||||
Sinclair Television Group, Inc., 6.125%, Due 10/1/2022 | 400,000 | 407,000 | |||||||||||||
Sirius XM Radio, Inc., 3.875%, Due 8/1/2022E | 900,000 | 886,500 | |||||||||||||
Sprint Communications, Inc., 6.000%, Due 11/15/2022 | 775,000 | 783,719 | |||||||||||||
See accompanying notes
14
American Beacon Crescent Short Duration High Income FundSM
Schedule of Investments
January 31, 2019
| Principal Amount | Fair Value | ||||||||||||||
| CORPORATE OBLIGATIONS - 56.34% (continued) | |||||||||||||||
| Communications - 12.29% (continued) | |||||||||||||||
Sprint Corp., 7.250%, Due 9/15/2021 | $ | 1,100,000 | $ | 1,155,000 | |||||||||||
T-Mobile USA, Inc., 6.500%, Due 1/15/2024 | 175,000 | 181,125 | |||||||||||||
TEGNA, Inc., 6.375%, Due 10/15/2023 | 250,000 | 253,750 | |||||||||||||
Townsquare Media, Inc., 6.500%, Due 4/1/2023E | 300,000 | 277,500 | |||||||||||||
Windstream Services LLC, 7.750%, Due 10/15/2020 | 150,000 | 108,000 | |||||||||||||
|
| ||||||||||||||
| 11,133,644 | |||||||||||||||
|
| ||||||||||||||
| Consumer, Cyclical - 5.86% | |||||||||||||||
CEC Entertainment, Inc., 8.000%, Due 2/15/2022 | 250,000 | 217,500 | |||||||||||||
EMI Music Publishing Group North America Holdings, Inc., 7.625%, Due 6/15/2024E | 225,000 | 238,653 | |||||||||||||
Hanesbrands, Inc., 4.625%, Due 5/15/2024E | 250,000 | 245,313 | |||||||||||||
Jack Ohio Finance LLC / Jack Ohio Finance Corp., 10.250%, Due 11/15/2022E | 200,000 | 215,500 | |||||||||||||
KGA Escrow LLC, 7.500%, Due 8/15/2023E | 300,000 | 302,715 | |||||||||||||
MGM Resorts International, | |||||||||||||||
6.625%, Due 12/15/2021 | 750,000 | 792,150 | |||||||||||||
5.750%, Due 6/15/2025 | 200,000 | 201,000 | |||||||||||||
Neiman Marcus Group Ltd. LLC, 8.000%, Due 10/15/2021E | 150,000 | 67,875 | |||||||||||||
Scientific Games International, Inc., 10.000%, Due 12/1/2022 | 400,000 | 420,500 | |||||||||||||
Taylor Morrison Communities, Inc., 6.625%, Due 5/15/2022 | 300,000 | 305,250 | |||||||||||||
Tempur Sealy International, Inc., 5.625%, Due 10/15/2023 | 725,000 | 719,562 | |||||||||||||
United Continental Holdings, Inc., 4.250%, Due 10/1/2022 | 500,000 | 493,750 | |||||||||||||
Williams Scotsman International, Inc., 7.875%, Due 12/15/2022E | 400,000 | 404,000 | |||||||||||||
Wyndham Destinations, Inc., 5.625%, Due 3/1/2021 | 450,000 | 459,000 | |||||||||||||
Wynn Las Vegas LLC / Wynn Las Vegas Capital Corp., 4.250%, Due 5/30/2023E | 225,000 | 222,750 | |||||||||||||
|
| ||||||||||||||
| 5,305,518 | |||||||||||||||
|
| ||||||||||||||
| Consumer,Non-Cyclical - 10.69% | |||||||||||||||
ADT Security Corp., 4.125%, Due 6/15/2023 | 425,000 | 409,062 | |||||||||||||
Centene Corp., | |||||||||||||||
5.625%, Due 2/15/2021 | 300,000 | 304,500 | |||||||||||||
4.750%, Due 1/15/2025 | 100,000 | 101,000 | |||||||||||||
CHS/Community Health Systems, Inc., | |||||||||||||||
8.000%, Due 11/15/2019 | 700,000 | 675,500 | |||||||||||||
5.125%, Due 8/1/2021 | 100,000 | 96,125 | |||||||||||||
6.250%, Due 3/31/2023 | 250,000 | 238,750 | |||||||||||||
DaVita, Inc., | |||||||||||||||
5.750%, Due 8/15/2022 | 100,000 | 101,625 | |||||||||||||
5.125%, Due 7/15/2024 | 500,000 | 493,900 | |||||||||||||
Dean Foods Co., 6.500%, Due 3/15/2023E | 200,000 | 155,656 | |||||||||||||
DJO Finance LLC / DJO Finance Corp., 10.750%, Due 4/15/2020 | 175,000 | 175,438 | |||||||||||||
Elanco Animal Health, Inc., 4.272%, Due 8/28/2023E | 225,000 | 226,590 | |||||||||||||
HCA, Inc., | |||||||||||||||
6.500%, Due 2/15/2020 | 675,000 | 693,562 | |||||||||||||
5.875%, Due 5/1/2023 | 850,000 | 898,875 | |||||||||||||
Herc Rentals, Inc., 7.500%, Due 6/1/2022E | 366,000 | 382,927 | |||||||||||||
Hertz Corp., 5.875%, Due 10/15/2020 | 850,000 | 841,500 | |||||||||||||
Horizon Pharma, Inc., 6.625%, Due 5/1/2023 | 90,000 | 89,550 | |||||||||||||
Horizon Pharma, Inc. / Horizon Pharma USA, Inc., 8.750%, Due 11/1/2024E | 75,000 | 79,275 | |||||||||||||
Kronos Acquisition Holdings, Inc., 9.000%, Due 8/15/2023E | 350,000 | 296,625 | |||||||||||||
MEDNAX, Inc., 5.250%, Due 12/1/2023E | 225,000 | 225,563 | |||||||||||||
Monitronics International, Inc., 9.125%, Due 4/1/2020 | 250,000 | 69,375 | |||||||||||||
Nielsen Finance LLC / Nielsen Finance Co., 5.000%, Due 4/15/2022E | 500,000 | 499,250 | |||||||||||||
Prestige Brands, Inc., 5.375%, Due 12/15/2021E | 200,000 | 200,000 | |||||||||||||
Prime Security Services Borrower LLC / Prime Finance, Inc., 9.250%, Due 5/15/2023E | 353,000 | 373,298 | |||||||||||||
RegionalCare Hospital Partners Holdings, Inc., 8.250%, Due 5/1/2023E | 225,000 | 237,375 | |||||||||||||
Select Medical Corp., 6.375%, Due 6/1/2021 | 250,000 | 251,250 | |||||||||||||
Tenet Healthcare Corp., | |||||||||||||||
4.750%, Due 6/1/2020 | 450,000 | 453,375 | |||||||||||||
4.375%, Due 10/1/2021 | 200,000 | 199,750 | |||||||||||||
See accompanying notes
15
American Beacon Crescent Short Duration High Income FundSM
Schedule of Investments
January 31, 2019
| Principal Amount | Fair Value | ||||||||||||||
| CORPORATE OBLIGATIONS - 56.34% (continued) | |||||||||||||||
| Consumer,Non-Cyclical - 10.69% (continued) | |||||||||||||||
Tenet Healthcare Corp., (continued) | |||||||||||||||
8.125%, Due 4/1/2022 | $ | 100,000 | $ | 104,625 | |||||||||||
6.750%, Due 6/15/2023 | 300,000 | 295,125 | |||||||||||||
United Rentals North America, Inc., 5.750%, Due 11/15/2024 | 150,000 | 153,750 | |||||||||||||
Universal Health Services, Inc., 4.750%, Due 8/1/2022E | 350,000 | 353,500 | |||||||||||||
|
| ||||||||||||||
| 9,676,696 | |||||||||||||||
|
| ||||||||||||||
| Energy - 6.36% | |||||||||||||||
Antero Resources Corp., 5.125%, Due 12/1/2022 | 300,000 | 299,625 | |||||||||||||
Archrock Partners LP / Archrock Partners Finance Corp., 6.000%, Due 4/1/2021 | 250,000 | 246,563 | |||||||||||||
Chesapeake Energy Corp., | |||||||||||||||
8.000%, Due 1/15/2025 | 100,000 | 100,624 | |||||||||||||
8.000%, Due 6/15/2027 | 275,000 | 263,313 | |||||||||||||
Citgo Holding, Inc., 10.750%, Due 2/15/2020E | 350,000 | 356,125 | |||||||||||||
Continental Resources, Inc., 5.000%, Due 9/15/2022 | 300,000 | 301,486 | |||||||||||||
Crestwood Midstream Partners LP / Crestwood Midstream Finance Corp., 6.250%, Due 4/1/2023 | 200,000 | 201,750 | |||||||||||||
DCP Midstream Operating LP, 5.350%, Due 3/15/2020E | 200,000 | 203,000 | |||||||||||||
Denbury Resources, Inc., 9.000%, Due 5/15/2021E | 200,000 | 198,000 | |||||||||||||
EP Energy LLC / Everest Acquisition Finance, Inc., 8.000%, Due 11/29/2024E | 175,000 | 140,000 | |||||||||||||
Gulfport Energy Corp., 6.625%, Due 5/1/2023 | 250,000 | 247,656 | |||||||||||||
Hess Infrastructure Partners LP / Hess Infrastructure Partners Finance Corp., 5.625%, Due 2/15/2026E | 500,000 | 495,000 | |||||||||||||
Hilcorp Energy I LP / Hilcorp Finance Co., 5.000%, Due 12/1/2024E | 225,000 | 213,750 | |||||||||||||
Jones Energy Holdings LLC / Jones Energy Finance Corp., 6.750%, Due 4/1/2022 | 350,000 | 38,500 | |||||||||||||
Nabors Industries, Inc., 5.500%, Due 1/15/2023 | 325,000 | 292,500 | |||||||||||||
Newfield Exploration Co., 5.750%, Due 1/30/2022 | 300,000 | 311,625 | |||||||||||||
Oceaneering International, Inc., 4.650%, Due 11/15/2024 | 250,000 | 212,500 | |||||||||||||
Range Resources Corp., 5.875%, Due 7/1/2022 | 150,000 | 150,375 | |||||||||||||
Sanchez Energy Corp., | |||||||||||||||
7.750%, Due 6/15/2021 | 175,000 | 32,375 | |||||||||||||
6.125%, Due 1/15/2023 | 125,000 | 21,875 | |||||||||||||
SemGroup Corp. / Rose Rock Finance Corp., 5.625%, Due 7/15/2022 | 250,000 | 237,500 | |||||||||||||
SESI LLC, 7.125%, Due 12/15/2021 | 250,000 | 221,875 | |||||||||||||
Summit Midstream Holdings LLC / Summit Midstream Finance Corp., 5.500%, Due 8/15/2022 | 500,000 | 482,500 | |||||||||||||
Sunoco LP / Sunoco Finance Corp., 4.875%, Due 1/15/2023, Series WI | 500,000 | 492,500 | |||||||||||||
|
| ||||||||||||||
| 5,761,017 | |||||||||||||||
|
| ||||||||||||||
| Financial - 7.12% | |||||||||||||||
Ally Financial, Inc., | |||||||||||||||
4.125%, Due 2/13/2022 | 150,000 | 150,563 | |||||||||||||
4.625%, Due 5/19/2022 | 200,000 | 203,900 | |||||||||||||
Blackstone CQP Holdco LP, 6.500%, Due 3/20/2021E | 300,000 | 299,250 | |||||||||||||
CIT Group, Inc., | |||||||||||||||
5.000%, Due 8/15/2022 | 300,000 | 307,500 | |||||||||||||
4.750%, Due 2/16/2024 | 150,000 | 151,688 | |||||||||||||
Credit Acceptance Corp., | |||||||||||||||
6.125%, Due 2/15/2021 | 200,000 | 200,500 | |||||||||||||
7.375%, Due 3/15/2023 | 350,000 | 359,187 | |||||||||||||
Equinix, Inc., 5.375%, Due 1/1/2022, REIT | 150,000 | 152,813 | |||||||||||||
Greystar Real Estate Partners LLC, 5.750%, Due 12/1/2025E | 50,000 | 49,625 | |||||||||||||
Icahn Enterprises LP / Icahn Enterprises Finance Corp., | |||||||||||||||
5.875%, Due 2/1/2022 | 550,000 | 554,185 | |||||||||||||
6.250%, Due 2/1/2022 | 400,000 | 410,876 | |||||||||||||
iStar, Inc., 4.625%, Due 9/15/2020 | 550,000 | 545,875 | |||||||||||||
Jefferies Finance LLC / JFINCo-Issuer Corp., 6.875%, Due 4/15/2022E | 225,000 | 222,187 | |||||||||||||
Ladder Capital Finance Holdings LLLP / Ladder Capital Finance Corp., 5.875%, Due 8/1/2021E | 90,000 | 91,013 | |||||||||||||
Navient Corp., 5.875%, Due 3/25/2021 | 1,000,000 | 1,019,680 | |||||||||||||
See accompanying notes
16
American Beacon Crescent Short Duration High Income FundSM
Schedule of Investments
January 31, 2019
| Principal Amount | Fair Value | ||||||||||||||
| CORPORATE OBLIGATIONS - 56.34% (continued) | |||||||||||||||
| Financial - 7.12% (continued) | |||||||||||||||
Newmark Group, Inc., 6.125%, Due 11/15/2023E | $ | 225,000 | $ | 224,515 | |||||||||||
Oxford Finance LLC / Oxford FinanceCo-Issuer II, Inc., 6.375%, Due 12/15/2022E | 175,000 | 177,187 | |||||||||||||
SBA Communications Corp., 4.875%, Due 7/15/2022 | 300,000 | 303,840 | |||||||||||||
Springleaf Finance Corp., | |||||||||||||||
7.750%, Due 10/1/2021 | 250,000 | 263,125 | |||||||||||||
6.125%, Due 5/15/2022 | 300,000 | 308,376 | |||||||||||||
5.625%, Due 3/15/2023 | 100,000 | 98,500 | |||||||||||||
Starwood Property Trust, Inc., 5.000%, Due 12/15/2021 | 350,000 | 353,500 | |||||||||||||
|
| ||||||||||||||
| 6,447,885 | |||||||||||||||
|
| ||||||||||||||
| Industrial - 5.12% | |||||||||||||||
Arconic, Inc., 5.125%, Due 10/1/2024 | 400,000 | 402,818 | |||||||||||||
Ball Corp., | |||||||||||||||
5.000%, Due 3/15/2022 | 300,000 | 310,038 | |||||||||||||
5.250%, Due 7/1/2025 | 150,000 | 157,313 | |||||||||||||
BBA US Holdings, Inc., 5.375%, Due 5/1/2026E | 50,000 | 50,000 | |||||||||||||
Berry Global, Inc., 5.500%, Due 5/15/2022 | 200,000 | 201,308 | |||||||||||||
CEMEX Finance LLC, 6.000%, Due 4/1/2024E | 250,000 | 254,752 | |||||||||||||
Fortress Transportation & Infrastructure Investors LLC, | |||||||||||||||
6.750%, Due 3/15/2022E | 250,000 | 250,778 | |||||||||||||
6.500%, Due 10/1/2025E | 325,000 | 312,000 | |||||||||||||
Grinding Media, Inc. /Moly-Cop AltaSteel Ltd., 7.375%, Due 12/15/2023E | 475,000 | 479,750 | |||||||||||||
Ingram Micro, Inc., | |||||||||||||||
5.000%, Due 8/10/2022 | 275,000 | 269,375 | |||||||||||||
5.450%, Due 12/15/2024 | 350,000 | 341,660 | |||||||||||||
Owens-Brockway Glass Container, Inc., 5.000%, Due 1/15/2022E | 200,000 | 202,000 | |||||||||||||
Reynolds Group Issuer, Inc. / Reynolds Group Issuer LLC / Reynolds Group Issuer Lu, 5.125%, Due 7/15/2023E | 700,000 | 701,295 | |||||||||||||
Sealed Air Corp., 5.500%, Due 9/15/2025E | 150,000 | 153,375 | |||||||||||||
TransDigm, Inc., 6.000%, Due 7/15/2022 | 550,000 | 554,125 | |||||||||||||
|
| ||||||||||||||
| 4,640,587 | |||||||||||||||
|
| ||||||||||||||
| Technology - 5.20% | |||||||||||||||
Advanced Micro Devices, Inc., 7.000%, Due 7/1/2024 | 500,000 | 522,500 | |||||||||||||
Dell International LLC / EMC Corp., 7.125%, Due 6/15/2024E | 750,000 | 791,290 | |||||||||||||
First Data Corp., | |||||||||||||||
5.000%, Due 1/15/2024E | 450,000 | 459,844 | |||||||||||||
5.750%, Due 1/15/2024E | 300,000 | 308,437 | |||||||||||||
Harland Clarke Holdings Corp., 8.375%, Due 8/15/2022E | 100,000 | 93,750 | |||||||||||||
Infor Software Parent LLC / Infor Software Parent, Inc., 7.125%, Due 5/1/2021, Cash (7.125%) or PIK(in-kind rate 7.875%)E | 750,000 | 755,625 | |||||||||||||
j2 Cloud Services LLC / j2 GlobalCo-Obligor, Inc., 6.000%, Due 7/15/2025E | 300,000 | 300,750 | |||||||||||||
NCR Corp., 5.000%, Due 7/15/2022 | 200,000 | 196,560 | |||||||||||||
Rackspace Hosting, Inc., 8.625%, Due 11/15/2024E | 350,000 | 294,000 | |||||||||||||
Riverbed Technology, Inc., 8.875%, Due 3/1/2023E | 200,000 | 146,000 | |||||||||||||
Solera LLC / Solera Finance, Inc., 10.500%, Due 3/1/2024E | 500,000 | 542,490 | |||||||||||||
Xerox Corp., 4.500%, Due 5/15/2021 | 300,000 | 300,375 | |||||||||||||
|
| ||||||||||||||
| 4,711,621 | |||||||||||||||
|
| ||||||||||||||
| Utilities - 1.60% | |||||||||||||||
AES Corp., 4.500%, Due 3/15/2023 | 150,000 | 150,750 | |||||||||||||
Calpine Corp., 5.875%, Due 1/15/2024E | 300,000 | 300,000 | |||||||||||||
Clearway Energy Operating LLC, 5.375%, Due 8/15/2024 | 200,000 | 185,500 | |||||||||||||
Talen Energy Supply LLC, 9.500%, Due 7/15/2022E | 800,000 | 816,000 | |||||||||||||
|
| ||||||||||||||
| 1,452,250 | |||||||||||||||
|
| ||||||||||||||
Total Corporate Obligations (Cost $52,287,521) | 51,028,018 | ||||||||||||||
|
| ||||||||||||||
See accompanying notes
17
American Beacon Crescent Short Duration High Income FundSM
Schedule of Investments
January 31, 2019
| Principal Amount | Fair Value | ||||||||||||||
| FOREIGN CORPORATE OBLIGATIONS - 12.98% | |||||||||||||||
| Basic Materials - 0.86% | |||||||||||||||
Cascades, Inc., 5.500%, Due 7/15/2022E | $ | 450,000 | $ | 447,750 | |||||||||||
NOVA Chemicals Corp., 4.875%, Due 6/1/2024E | 125,000 | 118,750 | |||||||||||||
Perstorp Holding AB, 8.500%, Due 6/30/2021E | 204,000 | 211,650 | |||||||||||||
|
| ||||||||||||||
| 778,150 | |||||||||||||||
|
| ||||||||||||||
| Communications - 2.47% | |||||||||||||||
Altice Financing S.A., 6.625%, Due 2/15/2023E | 300,000 | 301,590 | |||||||||||||
Altice Luxembourg S.A., 7.750%, Due 5/15/2022E | 350,000 | 339,500 | |||||||||||||
Sable International Finance Ltd., 6.875%, Due 8/1/2022E | 278,000 | 288,425 | |||||||||||||
Videotron Ltd., 5.000%, Due 7/15/2022 | 600,000 | 616,920 | |||||||||||||
Virgin Media Secured Finance PLC, 5.250%, Due 1/15/2021 | 500,000 | 502,655 | |||||||||||||
VTR Finance B.V., 6.875%, Due 1/15/2024E | 185,000 | 190,531 | |||||||||||||
|
| ||||||||||||||
| 2,239,621 | |||||||||||||||
|
| ||||||||||||||
| Consumer, Cyclical - 1.50% | |||||||||||||||
Aston Martin Capital Holdings Ltd., 6.500%, Due 4/15/2022E | 250,000 | 245,000 | |||||||||||||
Fiat Chrysler Automobiles N.V., 5.250%, Due 4/15/2023 | 200,000 | 202,248 | |||||||||||||
Mclaren Finance PLC, 5.750%, Due 8/1/2022E | 375,000 | 346,830 | |||||||||||||
Silversea Cruise Finance Ltd., 7.250%, Due 2/1/2025E | 250,000 | 267,813 | |||||||||||||
Viking Cruises Ltd., 6.250%, Due 5/15/2025E | 300,000 | 300,000 | |||||||||||||
|
| ||||||||||||||
| 1,361,891 | |||||||||||||||
|
| ||||||||||||||
| Consumer,Non-Cyclical - 1.91% | |||||||||||||||
Bausch Health Cos, Inc., | |||||||||||||||
5.500%, Due 3/1/2023E | 625,000 | 606,250 | |||||||||||||
7.000%, Due 3/15/2024E | 700,000 | 735,420 | |||||||||||||
Clearwater Seafoods, Inc., 6.875%, Due 5/1/2025E | 100,000 | 96,250 | |||||||||||||
Mallinckrodt International Finance S.A. / Mallinckrodt CB LLC, 5.625%, Due 10/15/2023E | 350,000 | 295,312 | |||||||||||||
|
| ||||||||||||||
| 1,733,232 | |||||||||||||||
|
| ||||||||||||||
| Energy - 0.61% | |||||||||||||||
Welltec A/S, 9.500%, Due 12/1/2022E | 575,000 | 553,438 | |||||||||||||
|
| ||||||||||||||
| Financial - 1.47% | |||||||||||||||
goeasy Ltd., 7.875%, Due 11/1/2022E | 750,000 | 785,625 | |||||||||||||
Intesa Sanpaolo SpA, 3.125%, Due 7/14/2022E | 300,000 | 281,910 | |||||||||||||
Travelport Corporate Finance PLC, 6.000%, Due 3/15/2026E | 250,000 | 258,593 | |||||||||||||
|
| ||||||||||||||
| 1,326,128 | |||||||||||||||
|
| ||||||||||||||
| Industrial - 3.15% | |||||||||||||||
Ardagh Packaging Finance PLC, | |||||||||||||||
4.625%, Due 5/15/2023E | 450,000 | 450,000 | |||||||||||||
7.250%, Due 5/15/2024E | 350,000 | 361,813 | |||||||||||||
Bombardier, Inc., | |||||||||||||||
8.750%, Due 12/1/2021E | 350,000 | 371,542 | |||||||||||||
6.000%, Due 10/15/2022E | 650,000 | 626,437 | |||||||||||||
Cemex S.A.B. de C.V., 7.750%, Due 4/16/2026E | 350,000 | 378,000 | |||||||||||||
Park Aerospace Holdings Ltd., 5.250%, Due 8/15/2022E | 650,000 | 659,945 | |||||||||||||
|
| ||||||||||||||
| 2,847,737 | |||||||||||||||
|
| ||||||||||||||
| Technology - 1.01% | |||||||||||||||
Open Text Corp., | |||||||||||||||
5.625%, Due 1/15/2023E | 250,000 | 255,625 | |||||||||||||
5.875%, Due 6/1/2026E | 400,000 | 413,000 | |||||||||||||
Seagate HDD Cayman, 4.750%, Due 6/1/2023 | 250,000 | 247,004 | |||||||||||||
|
| ||||||||||||||
| 915,629 | |||||||||||||||
|
| ||||||||||||||
Total Foreign Corporate Obligations (Cost $11,836,306) | 11,755,826 | ||||||||||||||
|
| ||||||||||||||
See accompanying notes
18
American Beacon Crescent Short Duration High Income FundSM
Schedule of Investments
January 31, 2019
| Shares | Fair Value | ||||||||||||||
| SHORT-TERM INVESTMENTS - 4.14% (Cost $3,744,678) | |||||||||||||||
| Investment Companies - 4.14% | |||||||||||||||
American Beacon U.S. Government Money Market Select Fund, Select Class, 2.32%F G | 3,744,678 | $ | 3,744,678 | ||||||||||||
|
| ||||||||||||||
TOTAL INVESTMENTS - 96.64% (Cost $89,361,212) | 87,520,504 | ||||||||||||||
OTHER ASSETS, NET OF LIABILITIES - 3.36% | 3,047,566 | ||||||||||||||
|
| ||||||||||||||
TOTAL NET ASSETS - 100.00% | $ | 90,568,070 | |||||||||||||
|
| ||||||||||||||
| Percentages are stated as a percent of net assets. | |||||||||||||||
A Bank loan obligations, unless otherwise stated, carry a floating rate of interest. The coupon rate shown on floating or adjustable rate securities represents the rate at period end.
B Coupon rates may not be available for bank loans that are unsettled and/or unfunded as of January 31, 2019.
C Unfunded Loan Commitment. At period end, the amount of unfunded loan commitments was $134,439 or 0.15% of net assets. Of this amount, $100,000, relates to Agiliti Health, Inc., $3,180, relates to AMCP Clean Acquisition Co. LLC, $5,879, relates to DentalCorp Perfect Smile ULC, $3,780, relates to Heartland Dental LLC, $4,314, relates to Pearl Intermediate Parent LLC, $7,353, relates to Premise Health Holding Corp., and $9,933, relates to VT Topco, Inc.
D Value was determined using significant unobservable inputs.
E Security exempt from registration under the Securities Act of 1933. These securities may be resold to qualified institutional buyers pursuant to Rule 144A. At the period end, the value of these securities amounted to $27,722,595 or 30.61% of net assets. The Fund has no right to demand registration of these securities.
F The Fund is affiliated by having the same investment advisor.
G7-day yield.
H Fair valued pursuant to procedures approved by the Board of Trustees. At period end, the value of these securities amounted to $170,888 or 0.19% of net assets.
LIBOR - London Interbank Offered Rate.
LLC - Limited Liability Company.
LLLP - Limited Liability Limited Partnership.
LP - Limited Partnership.
PIK - Payment in Kind.
PLC - Public Limited Company.
PRIME - A rate, charged by banks, based on the U.S. Federal Funds rate.
REIT - Real Estate Investment Trust.
The Fund’s investments are summarized by level based on the inputs used to determine their values. As of January 31, 2019, the investments were classified as described below:
Crescent Short Duration High Income Fund | Level 1 | Level 2 | Level 3 | Total | ||||||||||||||||||||||||
Assets | ||||||||||||||||||||||||||||
Bank Loan Obligations(1) | $ | - | $ | 20,821,094 | $ | 170,888 | $ | 20,991,982 | ||||||||||||||||||||
Corporate Obligations | - | 51,028,018 | - | 51,028,018 | ||||||||||||||||||||||||
Foreign Corporate Obligations | - | 11,755,826 | - | 11,755,826 | ||||||||||||||||||||||||
Short-Term Investments | 3,744,678 | - | - | 3,744,678 | ||||||||||||||||||||||||
|
|
|
|
|
|
|
| |||||||||||||||||||||
Total Investments in Securities - Assets | $ | 3,744,678 | $ | 83,604,938 | $ | 170,888 | $ | 87,520,504 | ||||||||||||||||||||
|
|
|
|
|
|
|
| |||||||||||||||||||||
| (1) | Unfunded loan commitments represent $134,439 at year end. |
U.S. GAAP requires transfers between all levels to/from level 3 to be disclosed. During the year ended January 31, 2019, there were no transfers into or out of Level 3.
See accompanying notes
19
American Beacon Crescent Short Duration High Income FundSM
Schedule of Investments
January 31, 2019
The following table is a reconciliation of Level 3 assets within the Fund for which significant unobservable inputs were used to determine fair value. Transfers in or out of Level 3 represent the ending value of any security or instrument where a change in the level has occurred from the beginning to the end of the period:
| Security Type | Balance as of 1/31/2018 | Purchases | Sales | Accrued Discounts (Premiums) | Realized Gain (Loss) | Change in Unrealized Appreciation (Depreciation) | Transfer into Level 3 | Transfer Level 3 | Balance as of 1/31/2019 | Unrealized Appreciation (Depreciation) at Period end** | ||||||||||||||||||||||||||||||
| Common Stocks | $ | 507 | $ | - | $2,521 | $ | - | $ | (23,734 | ) | $ | 25,748 | $ | - | $ | - | $ | - | $ | - | ||||||||||||||||||||
| Bank Loan Obligations | - | 174,125 | - | - | - | (3,237 | ) | $ | - | - | 170,888 | (3,237 | ) | |||||||||||||||||||||||||||
|
|
|
|
|
|
|
|
|
|
|
|
|
|
|
|
|
|
|
| |||||||||||||||||||||
| Total | $ | 507 | $ | 174,125 | $2,521 | $ | - | $ | (23,734 | ) | $ | 22,511 | $ | - | $ | - | $ | 170,888 | $ | (3,237 | ) | |||||||||||||||||||
|
|
|
|
|
|
|
|
|
|
|
|
|
|
|
|
|
|
|
| |||||||||||||||||||||
| ** | Change in unrealized appreciation (depreciation) attributable to Level 3 securities held at period end. This balance is included in the change in unrealized appreciation (depreciation) on the Statement of Operations. |
The bank loan obligation was fair valued using a private valuation report from a third party valuation service provider where the market value of the bank loan obligation was $170,888. It has been classified as a Level 3 security due to the use of unobservable inputs that were significant to the valuation.
See accompanying notes
20
American Beacon Crescent Short Duration High Income FundSM
Statement of Assets and Liabilities
January 31, 2019
Assets: |
| |||
Investments in unaffiliated securities, at fair value† | $ | 83,775,826 | ||
Investments in affiliated securities, at fair value‡ | 3,744,678 | |||
Cash | 38,365 | |||
Dividends and interest receivable | 1,156,837 | |||
Receivable for investments sold | 3,535,494 | |||
Receivable for fund shares sold | 296 | |||
Receivable for tax reclaims | 1,152 | |||
Receivable for expense reimbursement (Note 2) | 44,017 | |||
Prepaid expenses | 70,933 | |||
|
| |||
Total assets | 92,367,598 | |||
|
| |||
Liabilities: |
| |||
Payable for investments purchased | 1,474,177 | |||
Payable for fund shares redeemed | 24,526 | |||
Dividends payable | 2,156 | |||
Unfunded loan commitments | 134,439 | |||
Management andsub-advisory fees payable (Note 2) | 57,600 | |||
Service fees payable (Note 2) | 1,468 | |||
Transfer agent fees payable (Note 2) | 1,445 | |||
Custody and fund accounting fees payable | 18,270 | |||
Professional fees payable | 73,911 | |||
Trustee fees payable (Note 2) | 1,282 | |||
Payable for prospectus and shareholder reports | 9,149 | |||
Other liabilities | 1,105 | |||
|
| |||
Total liabilities | 1,799,528 | |||
|
| |||
Net assets | $ | 90,568,070 | ||
|
| |||
Analysis of net assets: |
| |||
Paid-in-capital | $ | 96,678,569 | ||
Total distributable earnings (deficits)A | (6,110,499 | ) | ||
|
| |||
Net assets | $ | 90,568,070 | ||
|
| |||
Shares outstanding at no par value (unlimited shares authorized): |
| |||
Institutional Class | 9,093,114 | |||
|
| |||
Y Class | 477,261 | |||
|
| |||
Investor Class | 63,556 | |||
|
| |||
A Class | 187,066 | |||
|
| |||
C Class | 65,744 | |||
|
| |||
Net assets: |
| |||
Institutional Class | $ | 83,303,910 | ||
|
| |||
Y Class | $ | 4,369,096 | ||
|
| |||
Investor Class | $ | 582,797 | ||
|
| |||
A Class | $ | 1,710,171 | ||
|
| |||
C Class | $ | 602,096 | ||
|
| |||
Net asset value, offering and redemption price per share: |
| |||
Institutional Class | $ | 9.16 | ||
|
| |||
Y Class | $ | 9.15 | ||
|
| |||
Investor Class | $ | 9.17 | ||
|
| |||
A Class | $ | 9.14 | ||
|
| |||
A Class (offering price) | $ | 9.37 | ||
|
| |||
C Class | $ | 9.16 | ||
|
| |||
† Cost of investments in unaffiliated securities | $ | 85,616,534 | ||
‡ Cost of investments in affiliated securities | $ | 3,744,678 | ||
A The Fund’s investments in affiliated securities did not have unrealized appreciation (depreciation) at year end. |
| |||
See accompanying notes
21
American Beacon Crescent Short Duration High Income FundSM
Statement of Operations
For the year ended January 31, 2019
Investment income: | ||||
Dividend income from affiliated securities (Note 7) | $ | 69,897 | ||
Interest income | 5,310,416 | |||
|
| |||
Total investment income | 5,380,313 | |||
|
| |||
Expenses: | ||||
Management andsub-advisory fees (Note 2) | 673,539 | |||
Transfer agent fees: | ||||
Institutional Class (Note 2) | 10,818 | |||
Y Class (Note 2) | 4,189 | |||
Investor Class | 1,174 | |||
A Class | 65 | |||
C Class | 4 | |||
Custody and fund accounting fees | 75,494 | |||
Professional fees | 104,477 | |||
Registration fees and expenses | 68,877 | |||
Service fees (Note 2): | ||||
Investor Class | 8,102 | |||
A Class | 1,124 | |||
C Class | 495 | |||
Distribution fees (Note 2): | ||||
A Class | 3,489 | |||
C Class | 5,349 | |||
Prospectus and shareholder report expenses | 15,123 | |||
Trustee fees (Note 2) | 6,890 | |||
Other expenses | 10,826 | |||
|
| |||
Total expenses | 990,035 | |||
|
| |||
Net fees waived and expenses (reimbursed) (Note 2) | (208,447 | ) | ||
|
| |||
Net expenses | 781,588 | |||
|
| |||
Net investment income | 4,598,725 | |||
|
| |||
Realized and unrealized gain (loss) from investments: | ||||
Net realized (loss) from: | ||||
Investments in unaffiliated securitiesA | (1,795,322 | ) | ||
Change in net unrealized (depreciation) of: | ||||
Investments in unaffiliated securitiesB | (2,269,671 | ) | ||
|
| |||
Net (loss) from investments | (4,064,993 | ) | ||
|
| |||
Net increase in net assets resulting from operations | $ | 533,732 | ||
|
| |||
A The Fund did not recognize net realized gains (losses) from the sale of investments in affiliated securities. |
| |||
B The Fund’s investments in affiliated securities did not have a change in unrealized appreciation (depreciation) at year end. |
| |||
See accompanying notes
22
American Beacon Crescent Short Duration High Income FundSM
Statement of Changes in Net Assets
| Year Ended January 31, 2019 | Year Ended January 31, 2018 | |||||||||||
Increase (decrease) in net assets: |
| |||||||||||
Operations: |
| |||||||||||
Net investment income | $ | 4,598,725 | $ | 3,897,464 | ||||||||
Net realized gain (loss) from investments in unaffiliated securities | (1,795,322 | ) | 323,728 | |||||||||
Change in net unrealized (depreciation) of investments in unaffiliated securities | (2,269,671 | ) | (801,438 | ) | ||||||||
|
|
|
| |||||||||
Net increase in net assets resulting from operations | 533,732 | 3,419,754 | ||||||||||
|
|
|
| |||||||||
Distributions to shareholders: |
| |||||||||||
Net investment income: | ||||||||||||
Institutional Class | - | (3,407,440 | ) | |||||||||
Y Class | - | (295,367 | ) | |||||||||
Investor Class | - | (86,903 | ) | |||||||||
A Class | - | (72,041 | ) | |||||||||
C Class | - | (21,430 | ) | |||||||||
Total retained earnings:* | ||||||||||||
Institutional Class | (4,264,570 | ) | - | |||||||||
Y Class | (248,726 | ) | - | |||||||||
Investor Class | (34,886 | ) | - | |||||||||
A Class | (65,085 | ) | - | |||||||||
C Class | (21,512 | ) | - | |||||||||
|
|
|
| |||||||||
Net distributions to shareholders | (4,634,779 | ) | (3,883,181 | ) | ||||||||
|
|
|
| |||||||||
Capital share transactions (Note 9): |
| |||||||||||
Proceeds from sales of shares | 16,393,954 | 32,726,092 | ||||||||||
Reinvestment of dividends and distributions | 4,610,610 | 3,843,806 | ||||||||||
Cost of shares redeemed | (14,291,239 | ) | (10,553,290 | ) | ||||||||
|
|
|
| |||||||||
Net increase in net assets from capital share transactions | 6,713,325 | 26,016,608 | ||||||||||
|
|
|
| |||||||||
Net increase in net assets | 2,612,278 | 25,553,181 | ||||||||||
|
|
|
| |||||||||
Net assets: |
| |||||||||||
Beginning of period | 87,955,792 | 62,402,611 | ||||||||||
|
|
|
| |||||||||
End of period | $ | 90,568,070 | $ | 87,955,792 | ||||||||
|
|
|
| |||||||||
* Distributions from net investment income and net realized capital gains are combined for the year ended January 31, 2019. See Note 1 in the Notes to Financial Statements for more information regarding new accounting pronouncements. |
| |||||||||||
See accompanying notes
23
American Beacon Crescent Short Duration High Income FundSM
January 31, 2019
1. Organization and Significant Accounting Policies
American Beacon Funds (the “Trust”), is organized as a Massachusetts business trust. The Fund, a series within the Trust, is registered under the Investment Company Act of 1940, as amended (the “Act”), as a diversified,open-end management investment company. As of January 31, 2019, the Trust consists of thirty-three active series, one of which is presented in this filing: American Beacon Crescent Short Duration High Income Fund (the “Fund”). The remainingthirty-two active series are reported in separate filings.
American Beacon Advisors, Inc. (the “Manager”) is a Delaware corporation and a wholly-owned subsidiary of Resolute Investment Managers, Inc. (“RIM”) organized in 1986 to provide business management, advisory, administrative, and asset management consulting services to the Trust and other investors. The Manager is registered as an investment advisor under the Investment Advisers Act of 1940, as amended (the “Advisers Act”). RIM is, in turn, a wholly-owned subsidiary of Resolute Acquisition, Inc., which is a wholly-owned subsidiary of Resolute Topco, Inc., a wholly-owned subsidiary of Resolute Investment Holdings, LLC (“RIH”). RIH is owned primarily by Kelso Investment Associates VIII, L.P., KEP VI, LLC and Estancia Capital Partners L.P., investment funds affiliated with Kelso & Company, L.P. (“Kelso”) or Estancia Capital Management, LLC (“Estancia”), which are private equity firms.
Recently Adopted Accounting Pronouncements
In March 2017, the Financial Accounting Standards Board (“FASB”) issued Accounting Standards Update (“ASU”)2017-08,Premium Amortization of Purchased Callable Debt Securities. The amendments in the ASU shorten the premium amortization period on a purchased callable debt security from the security’s contractual life to the earliest call date. It is anticipated that this change will enhance disclosures by reducing losses recognized when a security is called on an earlier date. This ASU is effective for fiscal years beginning after December 15, 2018. The Manager continues to evaluate the impact this ASU will have on the financial statements and other disclosures.
In August 2018, the FASB issued ASU2018-13,Fair Value Measurement (“Topic 820”). The amendments in the ASU impact disclosure requirements for fair value measurement. It is anticipated that this change will enhance the effectiveness of disclosures in the notes to the financial statements. This ASU is effective for fiscal years beginning after December 15, 2019. Early adoption is permitted and can include the entire standard or certain provisions that exclude or amend disclosures. For the year ended January 31, 2019, the Fund has chosen to adopt the standard. The adoption of this ASU guidance did not have a material impact on the financial statements and other disclosures.
In August 2018, the U.S. Securities and Exchange Commission (“SEC”) adopted amendments to certain disclosure requirements in Securities Act ReleaseNo. 33-10532, Disclosure Update and Simplification, which is intended to facilitate the disclosure of information to investors and simplify compliance without significantly altering the total mix of information provided to investors. Effective with the current reporting period, the Fund adopted the amendments with the impacts being that the Fund is no longer required to present components of distributable earnings on the Statement of Assets and Liabilities or the sources of distributable earnings and the amount of undistributed net investment income on the Statement of Changes in Net Assets.
Class Disclosure
The Fund has multiple classes of shares designed to meet the needs of different groups of investors. The following table sets forth the differences amongst the classes:
Class | Eligible Investors | Minimum Initial Investments | ||||
| Institutional | Large institutional investors - sold directly or through intermediary channels. | $ | 250,000 | |||
| Y Class | Large institutional retirement plan investors - sold directly or through intermediary channels. | $ | 100,000 | |||
| Investor | All investors using intermediary organizations, such as broker-dealers or retirement plan sponsors. | $ | 2,500 | |||
24
American Beacon Crescent Short Duration High Income FundSM
Notes to Financial Statements
January 31, 2019
Class | Eligible Investors | Minimum Initial Investments | ||||
| A Class | All investors who invest through intermediary organizations, such as broker-dealers or third party administrator. Retail investors who invest directly through a financial intermediary such as a broker, bank, or registered investment advisor which may include afront-end sales charge and a contingent deferred sales charge (“CDSC”). | $ | 2,500 | |||
| C Class | Retail investors who invest directly through a financial intermediary such as a broker or through employee directed benefit plans with applicable sales charges which may include CDSC. | $ | 1,000 | |||
Each class offered by the Trust has equal rights as to assets and voting privileges. Income andnon-class specific expenses are allocated daily to each class on the basis of the relative net assets. Realized and unrealized capital gains and losses of each class are allocated daily based on the relative net assets of each class of the respective Fund. Class specific expenses, where applicable, currently include service, distribution, transfer agent fees, andsub-transfer agent fees that vary amongst the classes as described more fully in Note 2.
Significant Accounting Policies
The following is a summary of significant accounting policies, consistently followed by the Fund in preparation of the financial statements. The Fund is considered an investment company and accordingly, follows the investment company accounting and reporting guidance of the FASB Accounting Standards Codification Topic 946,Financial Services – Investment Companies,a part of Generally Accepted Accounting Principles (“U.S. GAAP”).
Security Transactions and Investment Income
Security transactions are recorded as of the trade date for financial reporting purposes. Securities purchased or sold on a when-issued or delayed-delivery basis may be settled beyond a standard settlement period for the security after the trade date.
Dividend income, net of foreign taxes, is recorded on theex-dividend date, except certain dividends from foreign securities which are recorded as soon as the information is available to the Fund. Interest income, net of foreign taxes, is earned from settlement date, recorded on the accrual basis, and adjusted, if necessary, for accretion of discounts and amortization of premiums. Realized gains (losses) from securities sold are determined on the basis of specific lot identification.
Distributions to Shareholders
Distributions, if any, of net investment income are generally paid monthly and recorded on theex-dividend date. Distributions, if any, of net realized capital gains are generally paid at least annually and recorded on theex-dividend date. Dividends to shareholders are determined in accordance with federal income tax regulations, which may differ in amount and character from net investment income and realized gains recognized for purposes of U.S. GAAP. To the extent necessary to fully distribute capital gains, the Fund may designate earnings and profits distributed to shareholders on the redemption of shares.
Allocation of Income, Trust Expenses, Gains, and Losses
Investment income, realized and unrealized gains and losses from investments of the Fund is allocated daily to each class of shares based upon the relative proportion of net assets of each class to the total net assets of the Fund. Expenses directly charged or attributable to any Fund will be paid from the assets of the Fund. Generally, expenses of the Trust will be allocated among and charged to the assets of the Fund on a basis that the Trust’s Board of Trustees (the “Board”) deems fair and equitable, which may be based on the relative net assets of the Fund or nature of the services performed and relative applicability to the Fund.
25
American Beacon Crescent Short Duration High Income FundSM
Notes to Financial Statements
January 31, 2019
Use of Estimates
The preparation of financial statements in conformity with U.S. GAAP requires management to make estimates and assumptions that affect the amounts reported in the financial statements and accompanying notes. Actual results may differ from those estimated.
Other
Under the Trust’s organizational documents, its officers and trustees are indemnified against certain liabilities arising out of the performance of their duties to the Trust. In the normal course of business, the Trust enters into contracts that provide indemnification to the other party or parties against potential costs or liabilities. The Trust’s maximum exposure under these arrangements is dependent on claims that may be made in the future and, therefore, cannot be estimated. The Trust has had no prior claims or losses pursuant to any such agreement.
Concentration of Ownership
From time to time, the Fund may have a concentration of one or more accounts constituting a significant percentage of shares outstanding. Investment activities by holders of accounts that represent a significant ownership of more than 5% of the Fund’s outstanding shares could have a material impact on the Fund. As of January 31, 2019, based on management’s evaluation of the shareholder account base, two accounts have been identified as representing an unaffiliated significant ownership of approximately 41% of the Fund’s outstanding shares.
2. Transactions with Affiliates
Management and InvestmentSub-Advisory Agreements
The Fund and the Manager are parties to a Management Agreement that obligates the Manager to provide the Fund with investment advisory and administrative services. As compensation for performing the duties under the Management Agreement, the Manager will receive an annualized management fee based on a percentage of the Fund’s average daily net assets that is calculated and accrued daily according to the following schedule:
First $5 billion | 0.35 | % | ||
Next $5 billion | 0.325 | % | ||
Next $10 billion | 0.30 | % | ||
Over $20 billion | 0.275 | % |
The Trust, on behalf of the Fund, and the Manager have entered into an Investment Advisory Agreement with Crescent Capital Group LP (the“Sub-Advisor”)Sub-Advisor pursuant to which the Fund has agreed to pay an annualizedsub-advisory fee that is calculated and accrued daily based on the Fund’s average daily net assets according to the following schedules:
First $250 million | 0.40 | % | ||
Next $750 million | 0.35 | % | ||
Over $1 billion | 0.30 | % |
The Management andSub-Advisory Fees paid by the Fund during the year ended January 31, 2019 were as follows:
| Effective Fee Rate |
| Amount of Fees Paid | ||||||||||
Management Fees | 0.35 | % | $ | 313,826 | ||||||||
Sub-Advisor Fees | 0.40 | % | 359,713 | |||||||||
|
|
|
| |||||||||
Total | 0.75 | % | $ | 673,539 | ||||||||
|
|
|
| |||||||||
26
American Beacon Crescent Short Duration High Income FundSM
Notes to Financial Statements
January 31, 2019
Distribution Plans
The Fund, except for the A and C Classes of the Fund, has adopted a “defensive” Distribution Plan (the “Plan”) in accordance with Rule12b-1 under the Act, pursuant to which no separate fees may be charged to the Fund for distribution purposes. However, the Plan authorizes the management fee received by the Manager and the investment advisors hired by the Manager to be used for distribution purposes. Under this Plan, the Fund does not intend to compensate the Manager or any other party, either directly or indirectly, for the distribution of Fund shares.
Separate Distribution Plans (the “Distribution Plans”) have been adopted pursuant to Rule12b-1 under the Act for the A and C Classes of the Fund. Under the Distribution Plans, as compensation for distribution and shareholder servicing assistance, the Manager receives an annual fee of 0.25% of the average daily net assets of the A Class and 1.00% of the average daily net assets of the C Class. The fee will be payable without regard to whether the amount of the fee is more or less than the actual expenses incurred in a particular month by the Manager for distribution assistance.
Service Plans
The Manager and the Trust entered into Service Plans that obligates the Manager to oversee additional shareholder servicing of the Investor, A, and C Classes of the Fund. As compensation for performing the duties required under the Service Plan, the Manager receives an annualized fee up to 0.25% of the average daily net assets of the A and C Classes and up to 0.375% of the average daily net assets of the Investor Class of the Fund.
Sub-Transfer Agent Fees
The Manager has entered into agreements, which include servicing agreements, with financial intermediaries that provide recordkeeping, processing, shareholder communications and other services to customers of the intermediaries that hold positions in the Institutional and Y Classes of the Fund and has agreed to compensate the intermediaries for providing these services. Intermediaries transact with the Fund primarily through the use of omnibus accounts on behalf of its customers who hold positions in the Fund. Certain services would have been provided by the Fund’s transfer agent and other service providers if the shareholders’ accounts were maintained directly by the Fund’s transfer agent. Accordingly, the Fund, pursuant to Board approval, has agreed to reimburse the Manager for certainnon-distribution shareholder services provided by financial intermediaries for the Institutional and Y Classes. The reimbursement amounts(sub-transfer agent fees) paid to the Manager are subject to a fee limit of up to 0.10% of an intermediary’s average net assets in the Institutional and Y Classes on an annual basis. During the year ended January 31, 2019, thesub-transfer agent fees, as reflected in “Transfer agent fees” on the Statement of Operations, were as follows:
Fund | Sub-Transfer Agent Fees | |||
Crescent Short Duration High Income | $ | 11,925 | ||
As of January 31, 2019, the Fund owed the Manager the following reimbursement ofsub-transfer agent fees, as reflected in “Transfer agent fees payable” on the Statement of Assets and Liabilities:
Fund | Reimbursement Sub-Transfer Agent Fees | |||
Crescent Short Duration High Income | $ | 841 | ||
Investments in Affiliated Funds
The Fund may invest in the American Beacon U.S. Government Money Market Select Fund (the “USG Select Fund”). Cash collateral received by the Fund in connection with securities lending may also be invested in the USG
27
American Beacon Crescent Short Duration High Income FundSM
Notes to Financial Statements
January 31, 2019
Select Fund. The Fund and the USG Select Fund have the same investment advisor and therefore, are considered to be affiliated. The Manager serves as investment advisor to the USG Select Fund and receives management fees and administrative fees totaling 0.10% of the average daily net assets of the USG Select Fund. During the year ended January 31, 2019, the Manager earned fees on the Fund’s direct investments in the USG Select Fund as shown below:
Fund | Direct Investments in USG Select Fund | |||
Crescent Short Duration High Income | $ | 3,955 | ||
Interfund Credit Facility
Pursuant to an exemptive order issued by the SEC, the Fund, along with other registered investment companies having management contracts with the Manager, may participate in a credit facility whereby each fund, under certain conditions, is permitted to lend money directly to and borrow directly from other participating funds for temporary purposes. The interfund credit facility is advantageous to the funds because it provides added liquidity, and eliminates the need to maintain higher cash balances to meet redemptions. This situation could arise when shareholder redemptions exceed anticipated volumes and certain funds have insufficient cash on hand to satisfy such redemptions or when sales of securities do not settle as expected, resulting in a cash shortfall for a fund. When a fund liquidates portfolio securities to meet redemption requests, they often do not receive payment in settlement for up to two days (or longer for certain foreign transactions). Redemption requests normally are satisfied on the next business day. The credit facility provides a source of immediate, short-term liquidity pending settlement of the sale of portfolio securities. The credit facility is administered by a credit facility team consisting of professionals from the Manager’s asset management, compliance, and accounting areas who report the activities of the credit facility to the Board. During the year ended January 31, 2019, the Fund did not utilize the credit facility.
Expense Reimbursement Plan
The Manager contractually agreed to reduce fees and/or reimburse expenses for the classes of the Fund to the extent that total operating expenses exceed the Fund’s expense cap. During the year ended January 31, 2019, the Manager waived and/or reimbursed expenses as follows:
| Expense Cap | Expiration of Reimbursed Expenses | |||||||||||||||||
Fund | Class | 2/1/2018 - 1/31/2019 | Reimbursed Expenses | (Recouped) Expenses | ||||||||||||||
Crescent Short Duration High Income | Institutional | 0.85 | % | $ | 188,151 | $ | - | 2022 | ||||||||||
Crescent Short Duration High Income | Y | 0.95 | % | 9,537 | - | 2022 | ||||||||||||
Crescent Short Duration High Income | Investor | 1.23 | % | 7,977 | - | 2022 | ||||||||||||
Crescent Short Duration High Income | A | 1.25 | % | 1,882 | - | 2022 | ||||||||||||
Crescent Short Duration High Income | C | 2.00 | % | 900 | - | 2022 | ||||||||||||
Of these amounts, $44,017 was disclosed as a receivable from the Manager to the Fund on the Statement of Assets and Liabilities at January 31, 2019.
The Fund has adopted an Expense Reimbursement Plan whereby the Manager may seek repayment of such fee reductions and expense reimbursements. Under the policy, the Manager can be reimbursed by the Fund for any contractual or voluntary fee reductions or expense reimbursements if reimbursement to the Manager (a) occurs within three years after the Manager’s own waiver or reimbursement and (b) does not cause the Fund’s annual operating expenses to exceed the lesser of the contractual percentage limit in effect at the time of the waiver/reimbursement or time of recoupment. The reimbursed expenses listed above will expire in 2022. The Fund did not
28
American Beacon Crescent Short Duration High Income FundSM
Notes to Financial Statements
January 31, 2019
record a liability for potential reimbursements due to the current assessment that reimbursements are unlikely. The carryover of excess expenses potentially reimbursable to the Manager are as follows:
Fund | Recouped Expenses | Excess Expense Carryover | Expired Expense Carryover | Expiration of Reimbursed Expenses | ||||||||||||
Crescent Short Duration High Income | $ | - | $ | 201,928 | $ | - | 2020 | |||||||||
Crescent Short Duration High Income | - | 175,701 | - | 2021 | ||||||||||||
The Distributor
Effective March 1, 2018, Resolute Investment Distributors, Inc. (“RID” or “Distributor”) replaced Foreside Fund Services, LLC (“Foreside”) as the Fund’s distributor and principal underwriter of the Fund’s shares.
RID is a registered broker-dealer and is a member of the Financial Industry Regulatory Authority, Inc. (“FINRA”). The Distributor is affiliated with the Manager through common ownership. Under a Distribution Agreement with the Trust, the Distributor acts as the distributor and principal underwriter of the Trust in connection with the continuous offering of shares of the Fund. The Distributor continually distributes shares of the Fund on a best efforts basis. The Distributor has no obligation to sell any specific quantity of the Fund’s shares. Pursuant to the Distribution Agreement, to the extent applicable, the Distributor receives, and mayre-allocate to broker-dealers, all or a portion of the sales charge paid by the purchasers of A Class and C Class shares. For A Class and C Class shares, the Distributor receives commission revenue consisting of the portion of A Class and C Class sales charge remaining after the allowances by the Distributor to the broker-dealers. The Distributor retains any portion of the commission fees that are not paid to the broker-dealers for use solely to pay distribution related expenses.
Prior to March 1, 2018, Foreside served as the distributor and principal underwriter of the Fund’s shares. Pursuant to aSub-Administration Agreement between Foreside and the Manager in effect through February 28, 2018, Foreside received a fee from the Manager for providing administrative services in connection with the marketing and distribution of shares of the Trust, including the registration of Manager employees as registered representatives of Foreside to facilitate distribution of Fund shares. Foreside also received a fee from the Manager under a Marketing Agreement pursuant to which Foreside provided services in connection with the marketing of a Fund to institutional investors. Pursuant to the Distribution Agreement with the Trust in effect through February 28, 2018, Foreside received, and may havere-allocated to broker-dealers, all or a portion of the sales charge paid by the purchasers of A and C Class shares. For A and C Class shares, Foreside received commission revenues consisting of the portion of A and C Class sales charge remaining after the allowances by Foreside to the broker dealers. Foreside retained any portion of the commission fees that were not paid to the broker-dealers for use solely to pay distribution related expenses.
Sales Commissions
The Fund’s Distributor, formerly Foreside, may receive a portion of Class A sales charges from broker dealers and it may be used to offset distribution related expenses. During the year ended January 31, 2019, there were no sales commissions collected by Foreside and RID for Class A Shares of the Fund.
A CDSC of 0.50% will be deducted with respect to Class A Shares on certain purchases of $1,000,000 or more that are redeemed in whole or part within 18 months of purchase, unless waived as discussed in the Fund’s Prospectus. Any applicable CDSC will be 0.50% of the lesser of the original purchase price or the value of the redemption of the Class A Shares redeemed. During the year ended January 31, 2019, there were no CDSC fees collected for Class A Shares of the Fund.
A CDSC of 1.00% will be deducted with respect to Class C Shares redeemed within 12 months of purchase, unless waived as discussed in the Fund’s Prospectus. Any applicable CDSC will be 1.00% of the lesser of the original purchase price or the value of the redemption of the Class C Shares redeemed. During the year ended January 31, 2019, there were no CDSC fees collected by Foreside and RID for Class C Shares of the Fund.
29
American Beacon Crescent Short Duration High Income FundSM
Notes to Financial Statements
January 31, 2019
Trustee Fees and Expenses
As compensation for their service to the Trust, American Beacon Select Funds, American Beacon Institutional Funds Trust, American Beacon Sound Point Enhanced Income Fund, and American Beacon Apollo Total Return Fund, each Trustee receives an annual retainer of $120,000, plus $10,000 for each Board meeting attended in person or via teleconference, $2,500 for attendance by Committee members at meetings of the Audit Committee and the Investment Committee, and $1,500 for attendance by Committee members at meetings of the Nominating and Governance Committee, plus reimbursement of reasonable expenses incurred in attending Board meetings, Committee meetings, and relevant educational seminars. The Trustees also may be compensated for attendance at special Board and/or Committee meetings from time to time. The Board Chair receives an additional annual retainer of $50,000 as well as a $2,500 fee each quarter for attendance at the committee meetings. The Chairpersons of the Audit Committee and the Investment Committee each receive an additional annual retainer of $25,000 and the Chairman of the Nominating and Governance Committee receives an additional annual retainer of $10,000. These expenses are allocated on a prorated basis to each Fund of the Trusts according to its respective net assets.
3. Security Valuation and Fair Value Measurements
The price of the Fund’s shares is based on its net asset value (“NAV”) per share. The Fund’s NAV is computed by adding total assets, subtracting all the Fund’s liabilities, and dividing the result by the total number of shares outstanding.
The NAV of each class of the Fund’s shares is determined based on a pro rata allocation of the Fund’s investment income, expenses and total capital gains and losses. The Fund’s NAV per share is determined each business day as of the regular close of trading on the New York Stock Exchange (“NYSE” or “Exchange”), which is typically 4:00 p.m. Eastern Time (“ET”). However, if trading on the NYSE closes at a time other than 4:00 p.m. ET, the Fund’s NAV per share typically would still be determined as of the regular close of trading on the NYSE. The Fund does not price its shares on days that the NYSE is closed. Foreign exchanges may permit trading in foreign securities on days when the Fund is not open for business, which may result in the value of the Fund’s portfolio investments being affected at a time when you are unable to buy or sell shares.
Equity securities, including shares ofclosed-end funds and exchange-traded funds (“ETFs”), are valued at the last sale price or official closing price taken from the primary exchange in which each security trades. Investments in other mutual funds are valued at the closing NAV per share on the day of valuation. Debt securities are valued at bid quotes from broker/dealers or evaluated bid prices from pricing services, who may consider a number of inputs and factors, such as prices of comparable securities, yield curves, spreads, credit ratings, coupon rates, maturity, default rates, and underlying collateral. Futures are valued based on their daily settlement prices. Exchange-traded andover-the-counter (“OTC”) options are valued at the last sale price. Options with no last sale for the day are priced at mid quote. Swaps are valued at evaluated mid prices from pricing services.
The valuation of securities traded on foreign markets and certain fixed income securities will generally be based on prices determined as of the earlier closing time of the markets on which they primarily trade unless a significant event has occurred. When the Fund holds securities or other assets that are denominated in a foreign currency, the Fund will normally use the currency exchange rates as of 4:00 p.m. ET.
Securities may be valued at fair value, as determined in good faith and pursuant to procedures approved by the Board, under certain limited circumstances. For example, fair value pricing will be used when market quotations are not readily available or reliable, as determined by the Manager, such as when (i) trading for a security is restricted or stopped; (ii) a security’s trading market is closed (other than customary closings); or (iii) a security has beende-listed from a national exchange. A security with limited market liquidity may require fair value pricing if the Manager determines that the available price does not reflect the security’s true market value. In addition, if a significant event that the Manager determines to affect the value of one or more securities held by
30
American Beacon Crescent Short Duration High Income FundSM
Notes to Financial Statements
January 31, 2019
the Fund occurs after the close of a related exchange but before the determination of the Fund’s NAV, fair value pricing may be used on the affected security or securities. Securities of small-capitalization companies are also more likely to require a fair value determination using these procedures because they are more thinly traded and less liquid than the securities of larger-capitalization companies. The Fund may fair value securities as a result of significant events occurring after the close of the foreign markets in which the Fund invests as described below. In addition, the Fund may invest in illiquid securities requiring these procedures.
The Fund may use fair value pricing for securities primarily traded innon-U.S. markets because most foreign markets close well before the Fund’s pricing time of 4:00 p.m. ET. The earlier close of these foreign markets gives rise to the possibility that significant events, including broad market moves, may have occurred in the interim and may materially affect the value of those securities. If the Manager determines that the last quoted prices ofnon-U.S. securities will, in its judgment, materially affect the value of some or all its portfolio securities, the Manager can adjust the previous closing prices to reflect what it believes to be the fair value of the securities as of the close of the Exchange. In deciding whether it is necessary to adjust closing prices to reflect fair value, the Manager reviews a variety of factors, including developments in foreign markets, the performance of U.S. securities markets, and the performance of instruments trading in U.S. markets that represent foreign securities and baskets of foreign securities. These securities are fair valued using a pricing service, using methods approved by the Board, that considers the correlation of the trading patterns of the foreign security to intraday trading in the U.S. markets, based on indices of domestic securities and other appropriate indicators such as prices of relevant American Depositary Receipts (“ADRs”) and futures contracts. The Valuation Committee, established by the Board, may also fair value securities in other situations, such as when a particular foreign market is closed but the Fund is open. The Fund uses outside pricing services to provide closing prices and information to evaluate and/or adjust those prices. As a means of evaluating its security valuation process, the Valuation Committee routinely compares closing prices, the next day’s opening prices in the same markets and adjusted prices.
Attempts to determine the fair value of securities introduce an element of subjectivity to the pricing of securities. As a result, the price of a security determined through fair valuation techniques may differ from the price quoted or published by other sources and may not accurately reflect the market value of the security when trading resumes. If a reliable market quotation becomes available for a security formerly valued through fair valuation techniques, the Manager compares the new market quotation to the fair value price to evaluate the effectiveness of the Fund’s fair valuation procedures. If any significant discrepancies are found, the Manager may adjust the Fund’s fair valuation procedures.
Valuation Inputs
Various inputs may be used to determine the fair value of the Fund’s investments. These inputs are summarized in three broad levels for financial statement purposes. The inputs or methodologies used to value securities are not necessarily an indication of the risk associated with investing in those securities.
| Level 1 | - | Quoted prices in active markets for identical securities. | ||
| Level 2 | - | Prices determined using other significant observable inputs. These may include quoted prices for similar securities, interest rates, prepayment speeds, credit risk, and others. | ||
| Level 3 | - | Prices determined using other significant unobservable inputs. Unobservable inputs reflect the Fund’s own assumptions about the factors market participants would use in pricing an investment. | ||
Level 1 and Level 2 trading assets and trading liabilities, at fair value
Fixed-income securities including corporate, convertible and municipal bonds and notes, U.S. government agencies, U.S. Treasury obligations, sovereign issues, bank loans, convertible preferred securities, andnon-U.S. bonds are normally valued by pricing service providers that use broker dealer quotations, reported trades or valuation estimates from their internal pricing models. The service providers’ internal models use inputs that are observable
31
American Beacon Crescent Short Duration High Income FundSM
Notes to Financial Statements
January 31, 2019
such as issuer details, interest rates, yield curves, prepayment speeds, credit risks/spreads, default rates, and quoted prices for similar assets. Securities that use similar valuation techniques and inputs as described above are categorized as Level 2 of the fair value hierarchy. Fixed-income securities purchased on a delayed-delivery basis aremarked-to-market daily until settlement at the forward settlement date and are categorized as Level 2 of the fair value hierarchy.
Common stocks that are traded on a national securities exchange, are stated at the last reported sale or settlement price on the day of valuation. To the extent these securities are actively traded and valuation adjustments are not applied, they are categorized as Level 1 of the fair value hierarchy. Securities using these valuation adjustments are categorized as Level 2 of the fair value hierarchy. Preferred securities and other equities traded on inactive markets or valued by reference to similar instruments are generally categorized as Level 2 of the fair value hierarchy.
Investments in registeredopen-end investment management companies will be valued based upon the NAVs of such investments and are categorized as Level 1 of the fair value hierarchy.
Level 3 trading assets and trading liabilities, at fair value
The valuation techniques and significant inputs used in determining the fair values of financial instruments classified as Level 3 of the fair value hierarchy are as follows.
Securities and other assets for which market quotes are not readily available are valued at fair value as determined in good faith by the Board or persons acting at their direction and may be categorized as Level 3 of the fair value hierarchy.
Market quotes are considered not readily available in circumstances where there is an absence of current or reliable market-based data (e.g., trade information or broker quotes), including where events occur after the close of the relevant market, but prior to the Exchange close, that materially affect the values of the Fund’s securities or assets. In addition, market quotes are considered not readily available when, due to extraordinary circumstances, the exchanges or markets on which the securities trade, do not open for trading for the entire day and no other market prices are available. The Board has delegated to the Manager the responsibility for monitoring significant events that may materially affect the fair values of a Fund’s securities or assets and for determining whether the value of the applicable securities or assets should bere-evaluated in light of such significant events.
The Board has adopted methods for valuing securities and other assets in circumstances where market quotes are not readily available, and has delegated the responsibility for applying the valuation methods to the Manager. For instances in which daily market quotes are not readily available, investments may be valued pursuant to guidelines established by the Board. In the event that the security or asset cannot be valued, pursuant to one of the valuation methods established by the Board, the fair value of the security or asset will be determined in good faith by the Valuation Committee, generally based upon recommendations provided by the Manager.
When a Fund uses fair valuation methods applied by the Manager that use significant unobservable inputs to determine its NAV, the securities priced using this methodology are categorized as Level 3 of the fair value hierarchy. These methods may require subjective determinations about the value of a security. While the Trust’s policy is intended to result in a calculation of the Fund’s NAV that fairly reflects security values as of the time of pricing, the Trust cannot guarantee that values determined by the Board or persons acting at their direction would accurately reflect the price that a Fund could obtain for a security if it were to dispose of that security as of the time of pricing (for instance, in a forced or distressed sale). The prices used by a Fund may differ from the value that would be realized if the securities were sold.
32
American Beacon Crescent Short Duration High Income FundSM
Notes to Financial Statements
January 31, 2019
4. Securities and Other Investments
Bank Loans and Senior Loans
Loans are typically administered by a bank, insurance company, finance company or other financial institution (the “agent”) for a lending syndicate of financial institutions. In a typical loan, the agent administers the terms of the loan agreement and is responsible for the collection of principal and interest and fee payments from the borrower and the apportionment of these payments to all lenders that are parties to the loan agreement. In addition, an institution (which may be the agent) may hold collateral on behalf of the lenders. Typically, under loan agreements, the agent is given broad authority in monitoring the borrower’s performance and is obligated to use the same care it would use in the management of its own property. In asserting rights against a borrower, the Fund normally will be dependent on the willingness of the lead bank to assert these rights, or upon a vote of all the lenders to authorize the action. If an agent becomes insolvent, or has a receiver, conservator, or similar official appointed for it by the appropriate regulatory authority, or becomes a debtor in a bankruptcy proceeding, the agent’s appointment may be terminated and a successor agent would be appointed. If an appropriate regulator or court determines that assets held by the agent for the benefit of purchasers of loans are subject to the claims of the agent’s general or secured creditors, the Fund might incur certain costs and delays in realizing payment on a loan or suffer a loss of principal and/or interest. The Fund may be subject to similar risks when it buys a participation interest or an assignment from an intermediary.
Bank loans are fixed and floating rate loans arranged through private negotiations between a company or anon-U.S. government and one or more financial institutions (lenders). The Fund may invest in senior loans, which are floating rate loans that hold a senior position in the capital structure of U.S. and foreign corporations, partnerships or other business entities. Under normal circumstances, senior loans have priority of claim ahead of other obligations of a borrower in the event of liquidation. Senior loans may be collateralized or uncollateralized. They pay interest at rates that float above, or are adjusted periodically based on, a benchmark that reflects current interest rates.
The Fund may invest in such loans in the form of participations in loans and assignments of all or a portion of loans from third parties. In connection with purchasing participations in such instruments, the Fund generally will have no right to enforce compliance by the borrower with the terms of the loan agreement relating to the loan, nor any rights ofset-off against the borrower, and the Fund may not benefit directly from any collateral supporting the loan in which it has purchased the participation. When the Fund purchases assignments from lenders, the Fund will acquire direct rights against the borrower on the loan. A Fund may acquire bank and senior loan assignments or participations. The purchaser of an assignment typically succeeds to all the rights and obligations of the assigning institution and becomes a lender under the credit agreement with respect to the debt obligation; however, the purchaser’s rights can be more restricted than those of the assigning institution, and, in any event, the Fund may not be able to unilaterally enforce all rights and remedies under the loan and with regard to any associated collateral. A participation typically results in a contractual relationship only with the institution participating out the interest, not with the borrower. In purchasing participations, the Fund generally will have no right to enforce compliance by the borrower with the terms of the loan agreement against the borrower, and the Fund may not directly benefit from the collateral supporting the debt obligation in which it has purchased the participation. As a result, a Fund will be exposed to the credit risk of both the borrower and the institution selling the participation.
The Fund earns a commitment fee, typically set as a percentage of the commitment amount. Such fee income, which is included in “Interest income” on the Statement of Operations, is recognized ratably over the commitment period. Unfunded floating rate loan interests aremarked-to-market daily, and any unrealized appreciation (depreciation) is included on the Statement of Assets and Liabilities and Statement of Operations.
Common Stock
Common stock generally takes the form of shares in a corporation which represent an ownership interest. It ranks below preferred stock and debt securities in claims for dividends and for assets of the company in a
33
American Beacon Crescent Short Duration High Income FundSM
Notes to Financial Statements
January 31, 2019
liquidation or bankruptcy. The value of a company’s common stock may fall as a result of factors directly relating to that company, such as decisions made by its management or decreased demand for the company’s products or services. A stock’s value may also decline because of factors affecting not just the company, but also companies in the same industry or sector. The price of a company’s stock may also be affected by changes in financial markets that are relatively unrelated to the company, such as changes in interest rates, currency exchange rates or industry regulation. Companies that elect to pay dividends on their common stock generally only do so after they invest in their own business and make required payments to bondholders and on other debt and preferred stock. Therefore, the value of a company’s common stock will usually be more volatile than its bonds, other debt and preferred stock. Common stock may be exchange-traded or OTC. OTC stock may be less liquid than exchange-traded stock.
Corporate Debt and Other Fixed-Income Securities
Typically, the values of fixed-income securities change inversely with prevailing interest rates. Therefore, a fundamental risk of fixed-income securities is interest rate risk, which is the risk that their value will generally decline as prevailing interest rates rise, which may cause a Fund’s net asset value to likewise decrease, and vice versa. How specific fixed-income securities may react to changes in interest rates will depend on specific characteristics of each security. Fixed-income securities are also subject to credit risk, which is the risk that the credit strength of an issuer of a fixed-income security will weaken and/or that the issuer will be unable to make timely principal and interest payments and that the security may go into default.
Delayed Funding Loans and Revolving Credit Facilities
A Fund may enter into, or acquire participations in, delayed funding loans and revolving credit facilities. Delayed funding loans and revolving credit facilities are borrowing arrangements in which the lender agrees to make loans up to a maximum amount upon demand by the borrower during a specific term. A revolving credit facility differs from a delayed funding loan in that as the borrower repays the loan, an amount equal to the repayment may be borrowed again during the term of the revolving credit facility. Delayed funding loans and revolving credit facilities usually provide for floating or variable rates of interest. These commitments may have the effect of requiring a Fund to increase its investment in a company at a time when it might not otherwise decide to do so (including at a time when the company’s financial condition makes it unlikely that such amounts will be repaid). To the extent that a Fund is committed to advance additional funds, it will at all times segregate or “earmark” assets, determined to be liquid in accordance with procedures established by the Trust’s Board, in an amount sufficient to meet such commitments.
A Fund may invest in delayed funding loans and revolving credit facilities with credit quality comparable to that of issuers of its securities investments. Delayed funding loans and revolving credit facilities may be subject to restrictions on transfer, and only limited opportunities may exist to resell such instruments. As a result, a Fund may be unable to sell such investments at an opportune time or may have to resell them at less than fair market value.
Floating Rate Loan Interest
The Fund may invest in floating rate loan interests. The floating rate loan interests held by the Fund are typically issued to companies (the “borrower”) by banks, other financial institutions, and privately and publicly offered corporations (the “lender”). Floating rate loan interests are generallynon-investment grade, often involve borrowers whose financial condition is troubled or uncertain and companies that are highly leveraged. The Fund may invest in obligations of borrowers who are in bankruptcy proceedings. Floating rate loan interests may include fully funded term loans or revolving lines of credit. Floating rate loan interests are typically senior in the corporate capital structure of the borrower. Floating rate loan interests generally pay interest at rates that are periodically determined by reference to a base lending rate plus a premium. The base lending rates are generally the lending rate offered by one or more European banks, such as the London Interbank Offered Rate (“LIBOR”), the prime rate offered by one or more U.S. banks or the certificate of deposit rate. Floating rate loan interests may involve foreign borrowers, and investments may be denominated in foreign currencies. The Fund considers these investments to be investments in debt securities for purposes of its investment policies.
34
American Beacon Crescent Short Duration High Income FundSM
Notes to Financial Statements
January 31, 2019
When the Fund purchases a floating rate loan interest it may receive a facility fee and when it sells a floating rate loan interest, it may pay a facility fee. On an ongoing basis, the Fund may receive a commitment fee based on the undrawn portion of the underlying line of credit amount of a floating rate loan interest. Facility and commitment fees are typically amortized to income over the term of the loan or term of the commitment, respectively. Consent and amendment fees are recorded to income as earned. Prepayment penalty fees, which may be received by the Fund upon the prepayment of a floating rate loan interest by a borrower, are recorded as realized gains. The Fund may invest in multiple series or tranches of a loan. A different series or tranche may have varying terms and carry different associated risks.
Floating rate loan interests are usually freely callable at the borrower’s option. The Fund may invest in such loans in the form of participations in loans (“Participations”) or assignments (“Assignments”) of all or a portion of loans from third parties. Participations typically will result in the Fund having a contractual relationship only with the lender, not with the borrower. The Fund will have the right to receive payments of principal, interest and any fees to which it is entitled only from the lender selling the Participation and only upon receipt by the lender of the payments from the borrower. In connection with purchasing Participations, the Fund generally will have no right to enforce compliance by the borrower with the terms of the loan agreement, nor any rights of offset against the borrower, and the Fund may not benefit directly from any collateral supporting the loan in which it has purchased the Participation. As a result, the Fund will assume the credit risk of both the borrower and the lender that is selling the Participation. The Fund’s investment in Participations involves the risk of insolvency of the financial intermediaries who are parties to the transactions. In the event of the insolvency of the lender selling the Participation, the Fund may be treated as a general creditor of the lender and may not benefit from any offset between the lender and the borrower. Assignments typically result in the Fund having a direct contractual relationship with the borrower, and the Fund may enforce compliance by the borrower with the terms of the loan agreement.
In connection with floating rate loan interests, the Fund may also enter into unfunded floating rate loan interests (“commitments”). In connection with these commitments, the Fund earns a commitment fee, typically set as a percentage of the commitment amount. Such fee income, which is included in “Interest income” on the Statement of Operations, is recognized ratably over the commitment period. Unfunded floating rate loan interests aremarked-to-market daily, and any unrealized appreciation (depreciation) is included on the Statement of Assets and Liabilities and Statement of Operations.
Foreign Debt Securities
The Fund may invest in foreign fixed and floating rate income securities (including emerging market securities) all or a portion of which may benon-U.S. dollar denominated and which include: (a) debt obligations issued or guaranteed by foreign national, provincial, state, municipal or other governments with taxing authority or by their agencies or instrumentalities, including Brady Bonds; (b) debt obligations of supranational entities; (c) debt obligations of the U.S. Government issued innon-dollar securities; (d) debt obligations and other fixed income securities of foreign corporate issuers (both dollar andnon-dollar denominated); and (e) U.S. corporate issuers (both Eurodollar andnon-dollar denominated). There is no minimum rating criteria for the Fund’s investments in such securities. Investing in the securities of foreign issuers involves special considerations that are not typically associated with investing in the securities of U.S. issuers. In addition, emerging markets are markets that have risks that are different and higher than those in more developed markets.
High-Yield Securities
Non-investment-grade securities are rated below the four highest credit grades by at least one of the public rating agencies (or are unrated if not publicly rated). Participation in high-yielding securities transactions generally involves greater returns in the form of higher average yields. However, participation in such transactions involves greater risks, including sensitivity to economic changes, solvency, and relative liquidity in the secondary trading market. Lower ratings may reflect a greater possibility that the financial condition of the issuer, or adverse changes in general economic conditions, or both, may impair the ability of the issuer to make payments of interest and principal.
35
American Beacon Crescent Short Duration High Income FundSM
Notes to Financial Statements
January 31, 2019
The prices and yields of lower-rated securities generally fluctuate more than higher-quality securities, and such prices may decline significantly in periods of general economic difficulty or rising interest rates.
Illiquid and Restricted Securities
The Fund may invest in securities that are subject to legal or contractual restrictions on resale. These securities may be sold privately, but are required to be registered or exempted from such registration before being sold to the public. Private placement securities are generally considered to be restricted except for those securities traded between qualified institutional investors under the provisions of Rule 144A of the Securities Act of 1933 (the “Securities Act”). Illiquid securities have included securities that have not been registered under the Securities Act, securities that are otherwise not readily marketable, and repurchase agreements having a remaining maturity of longer than seven calendar days. Disposal of both illiquid and restricted securities may involve time-consuming negotiations and expenses, and prompt sale at an acceptable price may be difficult to achieve. Restricted securities outstanding during the year ended January 31, 2019 are disclosed in the Notes to the Schedule of Investments.
Regulation S under the Securities Act permits the sale abroad of securities that are not registered for sale in the United States and includes a provision for U.S. investors, such as the Fund, to purchase such unregistered securities if certain conditions are met.
Other Investment Company Securities and Other Exchange-Traded Products
The Fund may invest in shares of other investment companies, includingopen-end funds,closed-end funds, business development companies, ETFs, unit investment trusts, and other investment companies of the Trust. The Fund may invest in investment company securities advised by the Manager or asub-advisor. Investments in the securities of other investment companies may involve duplication of advisory fees and certain other expenses. By investing in another investment company, the Fund becomes a shareholder of that investment company. As a result, the Fund’s shareholders indirectly will bear the Fund’s proportionate share of the fees and expenses paid by shareholders of the other investment company, in addition to the fees and expenses the Fund’s shareholders directly bear in connection with the Fund’s own operations. These other fees and expenses are reflected as Acquired Fund Fees and Expenses and are included in the Fees and Expenses Table for the Fund in its Prospectus, if applicable. Investments in other investment companies may involve the payment of substantial premiums above the value of such issuer’s portfolio securities.
Payment-In-Kind Securities
The Fund may invest inpayment-in-kind securities (“PIKs”). PIKs give the issuer the option at each interest payment date of making interest payments in either cash or additional debt securities. Those additional debt securities usually have the same terms, including maturity dates and interest rates, and associated risks as the original bonds. The daily market quotations of the original bonds may include the accrued interest (referred to as a dirty price) and require apro-rata adjustment from the “Unrealized appreciation (depreciation) of investments” to “Dividend and interest receivable” in the Statement of Assets and Liabilities.
5. Principal Risks
Investing in the Fund may involve certain risks including, but not limited to, those described below.
Credit Risk
The Fund is subject to the risk that the issuer or guarantor of a debt security, or the counterparty to a derivatives contract or a loan, will fail to make timely payment of interest or principal or otherwise honor its obligations or default completely. A decline in the credit rating of an individual security held by a Fund may have
36
American Beacon Crescent Short Duration High Income FundSM
Notes to Financial Statements
January 31, 2019
an adverse impact on its price and make it difficult for a Fund to sell it. Ratings represent a rating agency’s opinion regarding the quality of the security and are not a guarantee of quality. Rating agencies might not always change their credit rating on an issuer or security in a timely manner to reflect events that could affect the issuer’s ability to make timely payments on its obligations. Credit risk is typically greater for securities with ratings that are below investment grade.
Floating Rate Securities Risk
The coupons on certain fixed income securities in which the Fund may invest are not fixed and may fluctuate based upon changes in market rates. The coupon on a floating rate security is generally based on an interest rate such as a money-market index, LIBOR or a Treasury bill rate. Such securities are subject to interest rate risk and may fluctuate in value in response to interest rate changes if there is a delay between changes in market interest rates and the interest reset date for the obligation, or for other reasons. As short-term interest rates decline, the coupons on floating rate securities typically decrease. Alternatively, during periods of rising interest rates, changes in the coupons of floating rate securities may lag behind changes in market rates or may have limits on the maximum increases in the coupon rates. The value of floating rate securities may decline if their coupons do not rise as much, or as quickly, as interest rates in general. Conversely, floating rate securities will not generally increase in value if interest rates decline. Floating rate obligations are less effective than fixed rate obligations at locking in a particular yield and are subject to credit risk.
High-Yield Securities Risk
Investing in high-yield, below investment-grade securities (commonly referred to as “junk bonds”) generally involves significantly greater risks of loss of your money than an investment in investment grade securities. High-yield debt securities may fluctuate more widely in price and yield and may fall in price when the economy is weak or expected to become weak. High-yield securities are considered to be speculative with respect to an issuer’s ability to pay interest and principal and carry a greater risk that the issuers of lower-rated securities will default on the timely payment of principal and interest. Below investment grade securities may experience greater price volatility and less liquidity than investment grade securities.
Illiquid and Restricted Securities Risk
Securities not registered in the U.S. under the Securities Act of 1933, as amended (the “Securities Act”), including Rule 144A securities, are restricted as to their resale. Such securities may not be listed on an exchange and may have no active trading market. They may be more difficult to purchase or sell at an advantageous time or price because such securities may not be readily marketable in broad public markets. The Fund may not be able to sell a restricted security when thesub-advisor considers it desirable to do so and/or may have to sell the security at a lower price than the Fund believes is its fair market value. In addition, transaction costs may be higher for restricted securities and the Fund may receive only limited information regarding the issuer of a restricted security. The Fund may have to bear the expense of registering restricted securities for resale and the risk of substantial delays in effecting the registration.
Interest Rate Risk
The Fund is subject to the risk that the market value of fixed-income securities or derivatives it holds, particularly mortgage backed and other asset backed securities, will decline due to rising interest rates. Generally, the value of investments with interest rate risk, such as fixed-income securities, will move in the opposite direction to movements in interest rates. The Federal Reserve raised the federal funds rate several times since December 2015 and has signaled additional increases in the near future. Interest rates may rise, perhaps significantly and/or rapidly, potentially resulting in substantial losses to the Fund. The prices of fixed-income securities or derivatives are also affected by their duration. Fixed-income securities or derivatives with longer duration generally have greater sensitivity to changes in interest rates. An increase in interest rates can impact markets broadly as well.
37
American Beacon Crescent Short Duration High Income FundSM
Notes to Financial Statements
January 31, 2019
Liquidity Risk
The Fund is susceptible to the risk that certain investments held by the Fund may have limited marketability or be subject to restrictions on sale, and may be difficult to sell at favorable times or prices. The Fund could lose money if it is unable to dispose of an investment at a time that is most beneficial to the Fund. For example, the Fund may be forced to sell certain investments at unfavorable prices to meet redemption requests or other cash needs. Judgment plays a greater role in pricing illiquid investments than in investments with more active markets.
Loan Interests Risk
Unlike publicly traded common stocks which trade on national exchanges, there is no central place or exchange for loans, including bank loans and senior loans, to trade. Loans trade in anover-the-counter market, and confirmation and settlement, which are effected through standardized procedures and documentation, may take significantly longer than seven days to complete. Extended trade settlement periods may, in unusual market conditions with a high volume of shareholder redemptions, present risk to shareholders regarding a Fund’s ability to pay redemption proceeds within the allowable time periods stated in its prospectus. The secondary market for floating rate loans also may be subject to irregular trading activity and wide bid/ask spreads. The lack of an active trading market for certain loans may impair the ability of a Fund to sell its loan interests at a time when it may otherwise be desirable to do so or may require a Fund to sell them at prices that are less than what a Fund regards as their fair market value and may make it difficult to value such loans. Interest in loans made to finance highly leveraged companies or transactions, such as corporate acquisitions, may be especially vulnerable to adverse changes in economic or market conditions. When a Fund’s loan interest is a participation, the Fund is subject to the risk that the party selling the participation interest will not remit a Fund’s pro rata share of loan payments to the Fund, and the Fund may have less control over the exercise of remedies than the party selling the participation interest.
Market Risk
Since the financial crisis that started in 2008, the U.S. and many foreign economies continue to experience its after-effects. Conditions in the U.S. and many foreign economies have resulted, and may continue to result, in certain instruments experiencing unusual liquidity issues, increased price volatility and, in some cases, credit downgrades and increased likelihood of default. These events have reduced the willingness and ability of some lenders to extend credit, and have made it more difficult for some borrowers to obtain financing on attractive terms, if at all. In some cases, traditional market participants have been less willing to make a market in some types of debt instruments, which has affected the liquidity of those instruments. During times of market turmoil, investors tend to look to the safety of securities issued or backed by the U.S. Treasury, causing the prices of these securities to rise and the yields to decline. Reduced liquidity in fixed income and credit markets may negatively affect many issuers worldwide. In addition, global economies and financial markets are becoming increasingly interconnected, which increases the possibilities that conditions in one country or region might adversely impact issuers in a different country or region. A rise in protectionist trade policies, and the possibility of changes to some international trade agreements, could affect the economies of many nations in ways that cannot necessarily be foreseen at the present time.
In response to the financial crisis, the U.S. and other governments and the Federal Reserve and certain foreign central banks have taken steps to support financial markets. In some countries where economic conditions are recovering, they are nevertheless perceived as still fragile. Withdrawal of government support, failure of efforts in response to the crisis, or investor perception that such efforts are not succeeding, could adversely impact the value and liquidity of certain securities. The severity or duration of adverse economic conditions may also be affected by policy changes made by governments or quasi-governmental organizations, including changes in tax laws. The impact of new financial regulation legislation on the markets and the practical implications for market participants may not be fully known for some time. Regulatory changes are causing some financial services companies to exit long-standing lines of business, resulting in dislocations for other market participants. In addition, political and diplomatic events within the U.S. and abroad, such as the U.S. government’s inability at times to agree on a long-term budget and
38
American Beacon Crescent Short Duration High Income FundSM
Notes to Financial Statements
January 31, 2019
deficit reduction plan, the threat of a federal government shutdown and threats not to increase the federal government’s debt limit, may affect investor and consumer confidence and may adversely impact financial markets and the broader economy, perhaps suddenly and to a significant degree. The U.S. government has recently reduced federal corporate income tax rates, and future legislative, regulatory and policy changes may result in more restrictions on international trade, less stringent prudential regulation of certain players in the financial markets, and significant new investments in infrastructure and national defense. Markets may react strongly to expectations about the changes in these policies, which could increase volatility, especially if the markets’ expectations for changes in government policies are not borne out.
Changes in market conditions will not have the same impact on all types of securities. Interest rates have been unusually low in recent years in the U.S. and abroad. Because there is little precedent for this situation, it is difficult to predict the impact of a significant rate increase on various markets. For example, because investors may buy securities or other investments with borrowed money, a significant increase in interest rates may cause a decline in the markets for those investments. Because of the sharp decline in the worldwide price of oil, there is a concern that oil producing nations may withdraw significant assets now held in U.S. Treasuries, which could force a substantial increase in interest rates. Regulators have expressed concern that rate increases may cause investors to sell fixed income securities faster than the market can absorb them, contributing to price volatility. In addition, there is a risk that the prices of goods and services in the U.S. and many foreign economies may decline over time, known as deflation (the opposite of inflation). Deflation may have an adverse effect on stock prices and creditworthiness and may make defaults on debt more likely. If a country’s economy slips into a deflationary pattern, it could last for a prolonged period and may be difficult to reverse. The precise details and the resulting impact of the United Kingdom’s vote to leave the European Union (the “EU”), commonly referred to as “Brexit,” are not yet known. The effect on the United Kingdom’s economy will likely depend on the nature of trade relations with the EU and other major economies following its exit, which are matters to be negotiated. The outcomes may cause increased volatility and have a significant adverse impact on world financial markets, other international trade agreements, and the United Kingdom and European economies, as well as the broader global economy for some time, which could significantly adversely affect the value of the Fund’s investments in the United Kingdom and Europe.
Other Investment Companies Risk
The Fund may invest in shares of other registered investment companies, including money market funds. To the extent that the Fund invests in shares of other registered investment companies, the Fund will indirectly bear the fees and expenses charged by the underlying funds in addition to the Fund’s direct fees and expenses and will be subject to the risks associated with investments in those companies.
Prepayment and Extension Risk
Prepayment risk is the risk that the principal amount of a bond may be repaid prior to the bond’s maturity date. Due to a decline in interest rates or excess cash flow, a debt security may be called or otherwise prepaid before maturity. If this occurs, no additional interest will be paid on the investment and the Fund may have to invest at a lower rate, may not benefit from an increase in value that may result from declining interest rates, and may lose any premium it paid to acquire the security. Variable and floating rate securities may be less sensitive to prepayment risk. Extension risk is the risk that a decrease in prepayments may, as a result of higher interest rates or other factors, result in the extension of a security’s effective maturity, heighten interest rate risk and increase the potential for a decline in its price.
Unrated Securities Risk
Because the Fund may purchase securities that are not rated by any rating organization, thesub-advisor, after assessing their credit quality, may internally assign ratings to certain of those securities in categories similar to those of rating organizations. Some unrated securities may not have an active trading market or may be difficult to value, which means a Fund might have difficulty selling them promptly at an acceptable price. Unrated securities may be subject to greater liquidity risk and price volatility.
39
American Beacon Crescent Short Duration High Income FundSM
Notes to Financial Statements
January 31, 2019
6. Federal Income and Excise Taxes
It is the policy of the Fund to qualify as a regulated investment company (“RIC”), by complying with all applicable provisions of Subchapter M of the Internal Revenue Code, as amended, and to make distributions of taxable income sufficient to relieve it from substantially all federal income and excise taxes. For federal income tax purposes, the Fund is treated as a single entity for the purpose of determining such qualification.
The Fund does not have any unrecorded tax liabilities in the accompanying financial statements. Each of the tax years in the four year period ended January 31, 2019 remain subject to examination by the Internal Revenue Service. If applicable, the Fund recognizes interest accrued related to unrecognized tax benefits in interest expense and penalties in “Other expenses” on the Statement of Operations.
The Fund may be subject to taxes imposed by countries in which it invests. Such taxes are generally based on returns of income earned or gains realized or repatriated. Taxes are accrued and applied to net investment income, net realized capital gains and net unrealized appreciation (depreciation), as applicable, as the income is earned or capital gains are recorded.
Dividends are categorized in accordance with income tax regulations which may treat certain transactions differently than U.S. GAAP. Accordingly, the character of distributions and composition of net assets for tax purposes may differ from those reflected in the accompanying financial statements.
The tax character of distributions paid were as follows:
| Year Ended January 31, 2019 | Year Ended January 31, 2018 | |||||||||||
Distributions paid from: |
| |||||||||||
Ordinary income* |
| |||||||||||
Institutional Class | $ | 4,264,570 | $ | 3,407,440 | ||||||||
Y Class | 248,726 | 295,367 | ||||||||||
Investor Class | 34,886 | 86,903 | ||||||||||
A Class | 65,085 | 72,041 | ||||||||||
C Class | 21,512 | 21,430 | ||||||||||
|
|
|
| |||||||||
Total distributions paid | $ | 4,634,779 | $ | 3,883,181 | ||||||||
|
|
|
| |||||||||
*For tax purposes, short-term capital gains are considered ordinary income distributions.
As of January 31, 2019, the components of distributable earnings (deficits) on a tax basis were as follows:
Fund | Tax Cost | Unrealized Appreciation | Unrealized (Depreciation) | Net Unrealized Appreciation (Depreciation) | ||||||||||||||||||||||||
| Crescent Short Duration High Income | $ | 89,372,515 | $ | 397,429 | $ | (2,249,440 | ) | $ | (1,852,011 | ) | ||||||||||||||||||
Fund | Net Unrealized Appreciation (Depreciation) | Undistributed Ordinary Income | Undistributed Long-Term Capital Gains | Accumulated Capital and Other (Losses) | Other Temporary Differences | Distributable Earnings | ||||||||||||||||||||||||||||||||||||||
| Crescent Short Duration High Income | $ | (1,852,011 | ) | $ | 5,879 | $ | - | $ | (4,262,211 | ) | $ | (2,156 | ) | $ | (6,110,499 | ) | ||||||||||||||||||||||||||||
Financial reporting records are adjusted for permanent book/tax differences to reflect tax character. Financial records are not adjusted for temporary differences. The temporary differences between financial reporting andtax-basis reporting of unrealized appreciation (depreciation) are attributable primarily to the tax deferral of losses from wash sales, unused capital losses and dividends payable.
40
American Beacon Crescent Short Duration High Income FundSM
Notes to Financial Statements
January 31, 2019
Due to inherent differences in the recognition of income, expenses, and realized gains (losses) under U.S. GAAP and federal income tax regulations, permanent differences between book and tax reporting have been identified and appropriately reclassified on the Statement of Assets and Liabilities.
Accordingly, the following amounts represent current year permanent differences as of January 31, 2019:
Fund | Paid-In-Capital | Distributable Earnings/(Deficits) | ||||||||||
| Crescent Short Duration High Income | $ | - | $ | - | ||||||||
Under the Regulated Investment Company Modernization Act of 2010 (“RIC MOD”), net capital losses recognized by the Fund in taxable years beginning after December 22, 2010 are carried forward indefinitely and retain their character as short-term and/or long-term losses.
As of January 31, 2019, the Fund had the following post RIC MOD capital loss carryforwards:
Fund | Short-Term Capital Loss Carryforwards | Long-Term Capital Loss Carryforwards | ||||||||||
| Crescent Short Duration High Income | $ | 2,052,155 | $ | 2,210,056 | ||||||||
7. Investment Transactions
The aggregate cost of purchases and proceeds from sales and maturities of investments, other than short-term obligations, for the year ended January 31, 2019 were as follows:
Fund | Purchases(non-U.S. Government Securities) | Sales(non-U.S. Government Securities) | ||||||||||
| Crescent Short Duration High Income | $ | 77,135,403 | $ | 72,024,867 | ||||||||
A summary of the Fund’s transactions in the USG Select Fund for the year ended January 31, 2019 were as follows:
Fund | Type of Transaction | January 31, 2018 Shares/Fair Value | Purchases | Sales | January 31, 2019 Shares/Fair Value | Dividend Income | ||||||||||||||||||||||||||||||||||||
| Crescent Short Duration High Income | Direct | $ | 2,182,064 | $ | 52,828,960 | $ | 51,266,346 | $ | 3,744,678 | $ | 69,897 | |||||||||||||||||||||||||||||||
8. Borrowing Arrangements
Effective November 15, 2018 (the “Effective Date”), the Fund, along with certain other funds managed by the Manager (“Participating Funds”), entered into a committed revolving line of credit (the “Committed Line”) agreement with State Street Bank and Trust Company (the “Bank”) to be used to facilitate portfolio liquidity. The maximum borrowing amount under the Committed Line is $250 million with interest at a rate equal to the higher of(a) one-month LIBOR plus 1.25% per annum or (b) the Federal Funds rate plus 1.25% per annum on amounts borrowed. Each of the Participating Funds will pay a closing fee of $100,000 on the Effective Date and a quarterly commitment fee at a rate of 0.25% per annum on the unused portion of the Committed Line amount. The Committed Line expires November 14, 2019, unless extended by the Bank or terminated by the Participating Funds in accordance with the agreement.
41
American Beacon Crescent Short Duration High Income FundSM
Notes to Financial Statements
January 31, 2019
On the Effective Date, the Fund, along with certain other Participating Funds managed by the Manager, also entered into an uncommitted discretionary demand revolving line of credit (the “Uncommitted Line”) agreement with the Bank to be used to facilitate portfolio liquidity. The maximum borrowing amount under the Uncommitted Line is $50 million with interest at a rate equal to the higher of(a) one-month LIBOR plus 1.25% per annum or (b) the Federal Funds rate plus 1.25% per annum on each outstanding loan. Each of the Participating Funds will pay a closing fee of $35,000 on the Effective Date. The Uncommitted Line expires November 14, 2019 unless extended by the Bank or terminated by the Participating Funds in accordance with the agreement.
The Participating Funds paid administration, legal and arrangement fees, which are recognized as a component of “Other expenses” on the Statement of Operations, along with commitment fees, that have been allocated among the Participating Funds based on average daily net assets.
During the year ended January 31, 2019, the Fund did not utilize this facility.
9. Capital Share Transactions
The tables below summarize the activity in capital shares for each Class of the Fund:
| Institutional Class | ||||||||||||||||||||||||||||
| Year Ended January 31, 2019 | Year Ended January 31, 2018 | |||||||||||||||||||||||||||
Crescent Short Duration High Income Fund | Shares | Amount | Shares | Amount | ||||||||||||||||||||||||
| Shares sold | 872,633 | $ | 8,204,743 | 3,035,175 | $ | 29,281,462 | ||||||||||||||||||||||
| Reinvestment of dividends | 458,266 | 4,263,813 | 353,215 | 3,406,053 | ||||||||||||||||||||||||
| Shares redeemed | (468,729 | ) | (4,349,929 | ) | (536,404 | ) | (5,189,606 | ) | ||||||||||||||||||||
|
|
|
|
|
|
|
| |||||||||||||||||||||
| Net increase in shares outstanding | 862,170 | $ | 8,118,627 | 2,851,986 | $ | 27,497,909 | ||||||||||||||||||||||
|
|
|
|
|
|
|
| |||||||||||||||||||||
| Y Class | ||||||||||||||||||||||||||||
| Year Ended January 31, 2019 | Year Ended January 31, 2018 | |||||||||||||||||||||||||||
Crescent Short Duration High Income Fund | Shares | Amount | Shares | Amount | ||||||||||||||||||||||||
| Shares sold | 106,191 | $ | 993,231 | 216,234 | $ | 2,083,182 | ||||||||||||||||||||||
| Reinvestment of dividends | 25,164 | 234,241 | 29,095 | 280,460 | ||||||||||||||||||||||||
| Shares redeemed | (268,217 | ) | (2,513,830 | ) | (283,003 | ) | (2,725,395 | ) | ||||||||||||||||||||
|
|
|
|
|
|
|
| |||||||||||||||||||||
| Net (decrease) in shares outstanding | (136,862 | ) | $ | (1,286,358 | ) | (37,674 | ) | $ | (361,753 | ) | ||||||||||||||||||
|
|
|
|
|
|
|
| |||||||||||||||||||||
| Investor Class | ||||||||||||||||||||||||||||
| Year Ended January 31, 2019 | Year Ended January 31, 2018 | |||||||||||||||||||||||||||
Crescent Short Duration High Income Fund | Shares | Amount | Shares | Amount | ||||||||||||||||||||||||
| Shares sold | 49 | $ | 451 | 28,126 | $ | 271,672 | ||||||||||||||||||||||
| Reinvestment of dividends | 3,738 | 34,885 | 7,617 | 73,541 | ||||||||||||||||||||||||
| Shares redeemed | (42,354 | ) | (397,712 | ) | (211,566 | ) | (2,043,360 | ) | ||||||||||||||||||||
|
|
|
|
|
|
|
| |||||||||||||||||||||
| Net (decrease) in shares outstanding | (38,567 | ) | $ | (362,376 | ) | (175,823 | ) | $ | (1,698,147 | ) | ||||||||||||||||||
|
|
|
|
|
|
|
| |||||||||||||||||||||
| A Class | ||||||||||||||||||||||||||||
| Year Ended January 31, 2019 | Year Ended January 31, 2018 | |||||||||||||||||||||||||||
Crescent Short Duration High Income Fund | Shares | Amount | Shares | Amount | ||||||||||||||||||||||||
| Shares sold | 706,492 | $ | 6,385,353 | 83,232 | $ | 802,939 | ||||||||||||||||||||||
| Reinvestment of dividends | 6,212 | 57,728 | 6,732 | 64,862 | ||||||||||||||||||||||||
| Shares redeemed | (697,093 | ) | (6,279,757 | ) | (41,404 | ) | (399,151 | ) | ||||||||||||||||||||
|
|
|
|
|
|
|
| |||||||||||||||||||||
| Net increase in shares outstanding | 15,611 | $ | 163,324 | 48,560 | $ | 468,650 | ||||||||||||||||||||||
|
|
|
|
|
|
|
| |||||||||||||||||||||
42
American Beacon Crescent Short Duration High Income FundSM
Notes to Financial Statements
January 31, 2019
| C Class | ||||||||||||||||||||||||||||
| Year Ended January 31, 2019 | Year Ended January 31, 2018 | |||||||||||||||||||||||||||
Crescent Short Duration High Income Fund | Shares | Amount | Shares | Amount | ||||||||||||||||||||||||
| Shares sold | 89,689 | $ | 810,176 | 29,843 | $ | 286,837 | ||||||||||||||||||||||
| Reinvestment of dividends | 2,148 | 19,943 | 1,959 | 18,890 | ||||||||||||||||||||||||
| Shares redeemed | (82,017 | ) | (750,011 | ) | (20,299 | ) | (195,778 | ) | ||||||||||||||||||||
|
|
|
|
|
|
|
| |||||||||||||||||||||
| Net increase in shares outstanding | 9,820 | $ | 80,108 | 11,503 | $ | 109,949 | ||||||||||||||||||||||
|
|
|
|
|
|
|
| |||||||||||||||||||||
10. Subsequent Events
Management has evaluated subsequent events for possible recognition or disclosure in the financial statements through the date the financial statements are issued. Management has determined that there are no material events that would require disclosure in the Fund’s financial statements through this date.
43
American Beacon Crescent Short Duration High Income FundSM
(For a share outstanding throughout the period)
| Institutional Class | ||||||||||||||||||||||||||||||||||||
| Year Ended January 31, | October 1, 2014A to January 31, | |||||||||||||||||||||||||||||||||||
| 2019 | 2018 | 2017 | 2016 | 2015 | ||||||||||||||||||||||||||||||||
|
| |||||||||||||||||||||||||||||||||||
Net asset value, beginning of period | $ | 9.59 | $ | 9.64 | $ | 9.01 | $ | 9.68 | $ | 10.00 | ||||||||||||||||||||||||||
|
|
|
|
|
|
|
|
|
| |||||||||||||||||||||||||||
Income (loss) from investment operations: | ||||||||||||||||||||||||||||||||||||
Net investment income | 0.48 | 0.47 | 0.46 | 0.47 | 0.16 | |||||||||||||||||||||||||||||||
Net gains (losses) on investments (both realized and unrealized) | (0.43 | ) | (0.05 | ) | 0.63 | (0.67 | ) | (0.32 | ) | |||||||||||||||||||||||||||
|
|
|
|
|
|
|
|
|
| |||||||||||||||||||||||||||
Total income (loss) from investment operations | 0.05 | 0.42 | 1.09 | (0.20 | ) | (0.16 | ) | |||||||||||||||||||||||||||||
|
|
|
|
|
|
|
|
|
| |||||||||||||||||||||||||||
Less distributions: | ||||||||||||||||||||||||||||||||||||
Dividends from net investment income | (0.48 | ) | (0.47 | ) | (0.46 | ) | (0.47 | ) | (0.16 | ) | ||||||||||||||||||||||||||
Distributions from net realized gains | - | - | - | - | - | |||||||||||||||||||||||||||||||
|
|
|
|
|
|
|
|
|
| |||||||||||||||||||||||||||
Total distributions | (0.48 | ) | (0.47 | ) | (0.46 | ) | (0.47 | ) | (0.16 | ) | ||||||||||||||||||||||||||
|
|
|
|
|
|
|
|
|
| |||||||||||||||||||||||||||
Net asset value, end of period | $ | 9.16 | $ | 9.59 | $ | 9.64 | $ | 9.01 | $ | 9.68 | ||||||||||||||||||||||||||
|
|
|
|
|
|
|
|
|
| |||||||||||||||||||||||||||
Total returnB | 0.60 | % | 4.45 | % | 12.38 | % | (2.23 | )% | (1.65 | )%C | ||||||||||||||||||||||||||
|
|
|
|
|
|
|
|
|
| |||||||||||||||||||||||||||
Ratios and supplemental data: |
| |||||||||||||||||||||||||||||||||||
Net assets, end of period | $ | 83,303,910 | $ | 78,914,147 | $ | 51,834,666 | $ | 36,971,459 | $ | 33,903,138 | ||||||||||||||||||||||||||
Ratios to average net assets: | ||||||||||||||||||||||||||||||||||||
Expenses, before reimbursements | 1.08 | % | 1.07 | % | 1.26 | % | 1.27 | % | 2.24 | %D | ||||||||||||||||||||||||||
Expenses, net of reimbursements | 0.85 | % | 0.85 | % | 0.85 | % | 0.85 | % | 0.85 | %D | ||||||||||||||||||||||||||
Net investment income, before expense reimbursements | 4.92 | % | 4.66 | % | 4.51 | % | 4.41 | % | 3.37 | %D | ||||||||||||||||||||||||||
Net investment income, net of reimbursements | 5.15 | % | 4.89 | % | 4.93 | % | 4.83 | % | 4.76 | %D | ||||||||||||||||||||||||||
Portfolio turnover rate | 84 | % | 75 | % | 95 | % | 72 | % | 31 | %C | ||||||||||||||||||||||||||
| A | Commencement of operations. |
| B | Based on net asset value, which does not reflect the sales charge, redemption fee, or contingent deferred sales charge, if applicable. May include adjustments in accordance with U.S. GAAP and as such, the net asset value for reporting purposes and the returns based upon those net asset values may differ from the net asset value and returns for shareholder transactions. |
| C | Not annualized. |
| D | Annualized. |
See accompanying notes
44
American Beacon Crescent Short Duration High Income FundSM
Financial Highlights
(For a share outstanding throughout the period)
| Y Class | ||||||||||||||||||||||||||||||||||||
| Year Ended January 31, | October 1, 2014A to January 31, | |||||||||||||||||||||||||||||||||||
| 2019 | 2018 | 2017 | 2016 | 2015 | ||||||||||||||||||||||||||||||||
|
| |||||||||||||||||||||||||||||||||||
Net asset value, beginning of period | $ | 9.58 | $ | 9.63 | $ | 9.00 | $ | 9.68 | $ | 10.00 | ||||||||||||||||||||||||||
|
|
|
|
|
|
|
|
|
| |||||||||||||||||||||||||||
Income (loss) from investment operations: | ||||||||||||||||||||||||||||||||||||
Net investment income | 0.49 | 0.46 | 0.45 | 0.46 | 0.15 | |||||||||||||||||||||||||||||||
Net gains (losses) on investments (both realized and unrealized) | (0.45 | ) | (0.05 | ) | 0.63 | (0.68 | ) | (0.32 | ) | |||||||||||||||||||||||||||
|
|
|
|
|
|
|
|
|
| |||||||||||||||||||||||||||
Total income (loss) from investment operations | 0.04 | 0.41 | 1.08 | (0.22 | ) | (0.17 | ) | |||||||||||||||||||||||||||||
|
|
|
|
|
|
|
|
|
| |||||||||||||||||||||||||||
Less distributions: | ||||||||||||||||||||||||||||||||||||
Dividends from net investment income | (0.47 | ) | (0.46 | ) | (0.45 | ) | (0.46 | ) | (0.15 | ) | ||||||||||||||||||||||||||
Distributions from net realized gains | - | - | - | - | - | |||||||||||||||||||||||||||||||
|
|
|
|
|
|
|
|
|
| |||||||||||||||||||||||||||
Total distributions | (0.47 | ) | (0.46 | ) | (0.45 | ) | (0.46 | ) | (0.15 | ) | ||||||||||||||||||||||||||
|
|
|
|
|
|
|
|
|
| |||||||||||||||||||||||||||
Net asset value, end of period | $ | 9.15 | $ | 9.58 | $ | 9.63 | $ | 9.00 | $ | 9.68 | ||||||||||||||||||||||||||
|
|
|
|
|
|
|
|
|
| |||||||||||||||||||||||||||
Total returnB | 0.49 | % | 4.33 | % | 12.27 | % | (2.39 | )% | (1.68 | )%C | ||||||||||||||||||||||||||
|
|
|
|
|
|
|
|
|
| |||||||||||||||||||||||||||
Ratios and supplemental data: |
| |||||||||||||||||||||||||||||||||||
Net assets, end of period | $ | 4,369,096 | $ | 5,883,759 | $ | 6,277,416 | $ | 8,481,991 | $ | 98,343 | ||||||||||||||||||||||||||
Ratios to average net assets: | ||||||||||||||||||||||||||||||||||||
Expenses, before reimbursements | 1.14 | % | 1.14 | % | 1.36 | % | 1.29 | % | 7.71 | %D | ||||||||||||||||||||||||||
Expenses, net of reimbursements | 0.95 | % | 0.95 | % | 0.95 | % | 0.95 | % | 0.95 | %D | ||||||||||||||||||||||||||
Net investment income (loss), before expense reimbursements | 4.84 | % | 4.59 | % | 4.42 | % | 4.80 | % | (2.11 | )%D | ||||||||||||||||||||||||||
Net investment income, net of reimbursements | 5.03 | % | 4.78 | % | 4.83 | % | 5.14 | % | 4.64 | %D | ||||||||||||||||||||||||||
Portfolio turnover rate | 84 | % | 75 | % | 95 | % | 72 | % | 31 | %C | ||||||||||||||||||||||||||
| A | Commencement of operations. |
| B | Based on net asset value, which does not reflect the sales charge, redemption fee, or contingent deferred sales charge, if applicable. May include adjustments in accordance with U.S. GAAP and as such, the net asset value for reporting purposes and the returns based upon those net asset values may differ from the net asset value and returns for shareholder transactions. |
| C | Not annualized. |
| D | Annualized. |
See accompanying notes
45
American Beacon Crescent Short Duration High Income FundSM
Financial Highlights
(For a share outstanding throughout the period)
| Investor Class | ||||||||||||||||||||||||||||||||||||
| Year Ended January 31, | October 1, January 31, | |||||||||||||||||||||||||||||||||||
| 2019 | 2018 | 2017 | 2016 | 2015 | ||||||||||||||||||||||||||||||||
|
| |||||||||||||||||||||||||||||||||||
Net asset value, beginning of period | $ | 9.59 | $ | 9.64 | $ | 9.01 | $ | 9.69 | $ | 10.00 | ||||||||||||||||||||||||||
|
|
|
|
|
|
|
|
|
| |||||||||||||||||||||||||||
Income (loss) from investment operations: | ||||||||||||||||||||||||||||||||||||
Net investment income | 0.45 | 0.44 | 0.43 | 0.44 | 0.14 | |||||||||||||||||||||||||||||||
Net gains (losses) on investments (both realized and unrealized) | (0.43 | ) | (0.06 | ) | 0.63 | (0.68 | ) | (0.31 | ) | |||||||||||||||||||||||||||
|
|
|
|
|
|
|
|
|
| |||||||||||||||||||||||||||
Total income (loss) from investment operations | 0.02 | 0.38 | 1.06 | (0.24 | ) | (0.17 | ) | |||||||||||||||||||||||||||||
|
|
|
|
|
|
|
|
|
| |||||||||||||||||||||||||||
Less distributions: | ||||||||||||||||||||||||||||||||||||
Dividends from net investment income | (0.44 | ) | (0.43 | ) | (0.43 | ) | (0.44 | ) | (0.14 | ) | ||||||||||||||||||||||||||
Distributions from net realized gains | - | - | - | - | - | |||||||||||||||||||||||||||||||
|
|
|
|
|
|
|
|
|
| |||||||||||||||||||||||||||
Total distributions | (0.44 | ) | (0.43 | ) | (0.43 | ) | (0.44 | ) | (0.14 | ) | ||||||||||||||||||||||||||
|
|
|
|
|
|
|
|
|
| |||||||||||||||||||||||||||
Net asset value, end of period | $ | 9.17 | $ | 9.59 | $ | 9.64 | $ | 9.01 | $ | 9.69 | ||||||||||||||||||||||||||
|
|
|
|
|
|
|
|
|
| |||||||||||||||||||||||||||
Total returnB | 0.28 | % | 4.04 | % | 11.96 | % | (2.67 | )% | (1.67 | )%C | ||||||||||||||||||||||||||
|
|
|
|
|
|
|
|
|
| |||||||||||||||||||||||||||
Ratios and supplemental data: |
| |||||||||||||||||||||||||||||||||||
Net assets, end of period | $ | 582,797 | $ | 979,646 | $ | 2,679,338 | $ | 3,560,159 | $ | 189,898 | ||||||||||||||||||||||||||
Ratios to average net assets: | ||||||||||||||||||||||||||||||||||||
Expenses, before reimbursements | 2.31 | % | 1.39 | % | 1.56 | % | 1.46 | % | 6.21 | %D | ||||||||||||||||||||||||||
Expenses, net of reimbursements | 1.23 | % | 1.23 | % | 1.23 | % | 1.23 | % | 1.23 | %D | ||||||||||||||||||||||||||
Net investment income (loss), before expense reimbursements | 3.66 | % | 4.33 | % | 4.22 | % | 4.44 | % | (0.41 | )%D | ||||||||||||||||||||||||||
Net investment income, net of reimbursements | 4.74 | % | 4.49 | % | 4.55 | % | 4.68 | % | 4.57 | %D | ||||||||||||||||||||||||||
Portfolio turnover rate | 84 | % | 75 | % | 95 | % | 72 | % | 31 | %C | ||||||||||||||||||||||||||
| A | Commencement of operations. |
| B | Based on net asset value, which does not reflect the sales charge, redemption fee, or contingent deferred sales charge, if applicable. May include adjustments in accordance with U.S. GAAP and as such, the net asset value for reporting purposes and the returns based upon those net asset values may differ from the net asset value and returns for shareholder transactions. |
| C | Not annualized. |
| D | Annualized. |
See accompanying notes
46
American Beacon Crescent Short Duration High Income FundSM
Financial Highlights
(For a share outstanding throughout the period)
| A Class | ||||||||||||||||||||||||||||||||||||
| Year Ended January 31, | October 1, 2014A to January 31, | |||||||||||||||||||||||||||||||||||
| 2019 | 2018 | 2017 | 2016 | 2015 | ||||||||||||||||||||||||||||||||
|
| |||||||||||||||||||||||||||||||||||
Net asset value, beginning of period | $ | 9.58 | $ | 9.63 | $ | 9.00 | $ | 9.68 | $ | 10.00 | ||||||||||||||||||||||||||
|
|
|
|
|
|
|
|
|
| |||||||||||||||||||||||||||
Income (loss) from investment operations: | ||||||||||||||||||||||||||||||||||||
Net investment income | 0.43 | 0.43 | 0.43 | 0.43 | 0.14 | |||||||||||||||||||||||||||||||
Net gains (losses) on investments (both realized and unrealized) | (0.43 | ) | (0.05 | ) | 0.63 | (0.68 | ) | (0.32 | ) | |||||||||||||||||||||||||||
|
|
|
|
|
|
|
|
|
| |||||||||||||||||||||||||||
Total income (loss) from investment operations | - | 0.38 | 1.06 | (0.25 | ) | (0.18 | ) | |||||||||||||||||||||||||||||
|
|
|
|
|
|
|
|
|
| |||||||||||||||||||||||||||
Less distributions: | ||||||||||||||||||||||||||||||||||||
Dividends from net investment income | (0.44 | ) | (0.43 | ) | (0.43 | ) | (0.43 | ) | (0.14 | ) | ||||||||||||||||||||||||||
Distributions from net realized gains | - | - | - | - | - | |||||||||||||||||||||||||||||||
|
|
|
|
|
|
|
|
|
| |||||||||||||||||||||||||||
Total distributions | (0.44 | ) | (0.43 | ) | (0.43 | ) | (0.43 | ) | (0.14 | ) | ||||||||||||||||||||||||||
|
|
|
|
|
|
|
|
|
| |||||||||||||||||||||||||||
Net asset value, end of period | $ | 9.14 | $ | 9.58 | $ | 9.63 | $ | 9.00 | $ | 9.68 | ||||||||||||||||||||||||||
|
|
|
|
|
|
|
|
|
| |||||||||||||||||||||||||||
Total returnB | 0.02 | % | 4.02 | % | 11.94 | % | (2.71 | )% | (1.78 | )%C | ||||||||||||||||||||||||||
|
|
|
|
|
|
|
|
|
| |||||||||||||||||||||||||||
Ratios and supplemental data: |
| |||||||||||||||||||||||||||||||||||
Net assets, end of period | $ | 1,710,171 | $ | 1,642,414 | $ | 1,183,362 | $ | 1,033,329 | $ | 98,255 | ||||||||||||||||||||||||||
Ratios to average net assets: | ||||||||||||||||||||||||||||||||||||
Expenses, before reimbursements | 1.39 | % | 1.46 | % | 1.66 | % | 1.55 | % | 7.97 | %D | ||||||||||||||||||||||||||
Expenses, net of reimbursements | 1.25 | % | 1.25 | % | 1.25 | % | 1.25 | % | 1.25 | %D | ||||||||||||||||||||||||||
Net investment income (loss), before expense reimbursements | 4.48 | % | 4.26 | % | 4.13 | % | 4.28 | % | (2.37 | )%D | ||||||||||||||||||||||||||
Net investment income, net of reimbursements | 4.62 | % | 4.47 | % | 4.54 | % | 4.59 | % | 4.36 | %D | ||||||||||||||||||||||||||
Portfolio turnover rate | 84 | % | 75 | % | 95 | % | 72 | % | 31 | %C | ||||||||||||||||||||||||||
| A | Commencement of operations. |
| B | Based on net asset value, which does not reflect the sales charge, redemption fee, or contingent deferred sales charge, if applicable. May include adjustments in accordance with U.S. GAAP and as such, the net asset value for reporting purposes and the returns based upon those net asset values may differ from the net asset value and returns for shareholder transactions. |
| C | Not annualized. |
| D | Annualized. |
See accompanying notes
47
American Beacon Crescent Short Duration High Income FundSM
Financial Highlights
(For a share outstanding throughout the period)
| C Class | ||||||||||||||||||||||||||||||||||||
| Year Ended January 31, | October 1, 2014A to January 31, | |||||||||||||||||||||||||||||||||||
| 2019 | 2018 | 2017 | 2016 | 2015 | ||||||||||||||||||||||||||||||||
|
| |||||||||||||||||||||||||||||||||||
Net asset value, beginning of period | $ | 9.58 | $ | 9.63 | $ | 9.00 | $ | 9.68 | $ | 10.00 | ||||||||||||||||||||||||||
|
|
|
|
|
|
|
|
|
| |||||||||||||||||||||||||||
Income (loss) from investment operations: | ||||||||||||||||||||||||||||||||||||
Net investment income | 0.37 | 0.36 | 0.35 | 0.36 | 0.12 | |||||||||||||||||||||||||||||||
Net gains (losses) on investments (both realized and unrealized) | (0.42 | ) | (0.05 | ) | 0.63 | (0.68 | ) | (0.32 | ) | |||||||||||||||||||||||||||
|
|
|
|
|
|
|
|
|
| |||||||||||||||||||||||||||
Total income (loss) from investment operations | (0.05 | ) | 0.31 | 0.98 | (0.32 | ) | (0.20 | ) | ||||||||||||||||||||||||||||
|
|
|
|
|
|
|
|
|
| |||||||||||||||||||||||||||
Less distributions: | ||||||||||||||||||||||||||||||||||||
Dividends from net investment income | (0.37 | ) | (0.36 | ) | (0.35 | ) | (0.36 | ) | (0.12 | ) | ||||||||||||||||||||||||||
Distributions from net realized gains | - | - | - | - | - | |||||||||||||||||||||||||||||||
|
|
|
|
|
|
|
|
|
| |||||||||||||||||||||||||||
Total distributions | (0.37 | ) | (0.36 | ) | (0.35 | ) | (0.36 | ) | (0.12 | ) | ||||||||||||||||||||||||||
|
|
|
|
|
|
|
|
|
| |||||||||||||||||||||||||||
Net asset value, end of period | $ | 9.16 | $ | 9.58 | $ | 9.63 | $ | 9.00 | $ | 9.68 | ||||||||||||||||||||||||||
|
|
|
|
|
|
|
|
|
| |||||||||||||||||||||||||||
Total returnB | (0.49 | )% | 3.24 | % | 11.10 | % | (3.40 | )% | (2.03 | )%C | ||||||||||||||||||||||||||
|
|
|
|
|
|
|
|
|
| |||||||||||||||||||||||||||
Ratios and supplemental data: |
| |||||||||||||||||||||||||||||||||||
Net assets, end of period | $ | 602,096 | $ | 535,826 | $ | 427,829 | $ | 456,828 | $ | 97,911 | ||||||||||||||||||||||||||
Ratios to average net assets: | ||||||||||||||||||||||||||||||||||||
Expenses, before reimbursements | 2.17 | % | 2.21 | % | 2.41 | % | 2.36 | % | 8.70 | %D | ||||||||||||||||||||||||||
Expenses, net of reimbursements | 2.00 | % | 2.00 | % | 2.00 | % | 2.00 | % | 2.00 | %D | ||||||||||||||||||||||||||
Net investment income (loss), before expense reimbursements | 3.86 | % | 3.51 | % | 3.37 | % | 3.76 | % | (3.12 | )%D | ||||||||||||||||||||||||||
Net investment income, net of reimbursements | 4.03 | % | 3.71 | % | 3.78 | % | 4.12 | % | 3.59 | %D | ||||||||||||||||||||||||||
Portfolio turnover rate | 84 | % | 75 | % | 95 | % | 72 | % | 31 | %C | ||||||||||||||||||||||||||
| A | Commencement of operations. |
| B | Based on net asset value, which does not reflect the sales charge, redemption fee, or contingent deferred sales charge, if applicable. May include adjustments in accordance with U.S. GAAP and as such, the net asset value for reporting purposes and the returns based upon those net asset values may differ from the net asset value and returns for shareholder transactions. |
| C | Not annualized. |
| D | Annualized. |
See accompanying notes
48
American Beacon Crescent Short Duration High Income FundSM
January 31, 2019 (Unaudited)
Certain tax information regarding the Funds are required to be provided to shareholders based upon the Fund’s income and distributions for the taxable year ended January 31, 2019. The information and distributions reported herein may differ from information and distributions taxable to the shareholders for the calendar year ended December 31, 2018.
The Fund designated the following items with regard to distributions paid during the fiscal year ended January 31, 2019. All designations are based on financial information available as of this annual report and, accordingly, are subject to change. For each item, it is the intention of the Funds to designate the maximum amount permitted under the Internal Revenue Code of 1986, as amended, and the regulations there under.
Corporate Dividends-Received Deduction:
Crescent Short Duration High Income | 0.00 | % |
Qualified Dividend Income:
Crescent Short Duration High Income | 0.00 | % |
Long-Term Capital Gain Distributions:
Crescent Short Duration High Income | $ | - |
Short-Term Capital Gain Distributions:
Crescent Short Duration High Income | $ | - |
Shareholders will receive notification in January 2019 of the applicable tax information necessary to prepare their 2018 income tax returns.
49
Trustees and Officers of the American Beacon FundsSM(Unaudited)
The Trustees and officers of the American Beacon Funds (the “Trust”) are listed below, together with their principal occupations during the past five years. The address of each person listed below is 220 Las Colinas Boulevard East, Suite 1200, Irving, Texas 75039. Each Trustee oversees thirty-seven funds in the fund complex that includes the Trust, the American Beacon Select Funds, the American Beacon Institutional Funds Trust, the American Beacon Sound Point Enhanced Income Fund and the American Beacon Apollo Total Return Fund. The Trust’s Statement of Additional Information contains additional information about the Trustees and is available without charge by calling1-800-658-5811.
Name, Age | Position, Term of Office and Length of Time Served with the Trust | Principal Occupation(s) During Past 5 Years and Current Directorships | ||
| INTERESTED TRUSTEES | Term | |||
| Lifetime of Trust until removal, resignation or retirement* | ||||
| Alan D. Feld** (82) | Trustee since 1996 | Partner in the law firm of Akin, Gump, Strauss, Hauer & Feld, LLP (law firm) (1960-Present); Trustee, American Beacon Select Funds(1999-Present); Trustee, American Beacon Institutional Funds Trust(2017-Present); Trustee, American Beacon Sound Point Enhanced Income Fund (2018-Present); Trustee, American Beacon Apollo Total Return Fund (2018-Present). | ||
| NON-INTERESTED TRUSTEES | Term | |||
Lifetime of Trust until removal, resignation or retirement* | ||||
| Gilbert G. Alvarado (49) | Trustee since 2015 | Director, Kura MD, Inc. (local telehealth organization) (2015-present); Vice President & CFO, Sierra Health Foundation (health conversion private foundation) (2006-Present); Vice President & CFO, Sierra Health Foundation: Center for Health Program Management (California public benefit corporation) (2012-Present); Director, Innovative North State (2012-2015); Director, Sacramento Regional Technology Alliance(2011-2016); Director, Women’s Empowerment (2009-2014); Director, Valley Healthcare Staffing (2017-present); Trustee, American Beacon Select Funds (2015-Present); Trustee, American Beacon Institutional Funds Trust (2017-Present); Trustee, American Beacon Sound Point Enhanced Income Fund (2018-Present); Trustee, American Beacon Apollo Total Return Fund (2018-Present). | ||
| Joseph B. Armes (56) | Trustee since 2015 | Chairman & CEO, CSW Industrials f/k/a Capital Southwest Corporation (investment company) (2015-Present); Chairman of the Board of Capital Southwest Corporation, predecessor to CSW Industrials, Inc. (2014-2017) (investment company); CEO, Capital Southwest Corporation (2013-2015); President & CEO, JBA Investment Partners (family investment vehicle) (2010-Present); Director and Chair of Audit Committee, RSP Permian (oil and gas producer) (2013-Present); Trustee, American Beacon Select Funds (2015-Present); Trustee, American Beacon Institutional Funds Trust (2017-Present); Trustee, American Beacon Sound Point Enhanced Income Fund (2018-Present); Trustee, American Beacon Apollo Total Return Fund (2018-Present). | ||
| Gerard J. Arpey (60) | Trustee since 2012 | Director, The Home Depot, Inc. (2015-Present); Partner, Emerald Creek Group (private equity firm) (2011-Present); Director, S.C. Johnson & Son, Inc. (privately held company) (2008-present); Trustee, American Beacon Select Funds (2012-Present); Trustee, American Beacon Institutional Funds Trust (2017-Present); Trustee, American Beacon Sound Point Enhanced Income Fund (2018-Present); Trustee, American Beacon Apollo Total Return Fund (2018-Present). | ||
50
Trustees and Officers of the American Beacon FundsSM(Unaudited)
Name, Age | Position, Term of Office and Length of Time Served with the Trust | Principal Occupation(s) During Past 5 Years and Current Directorships | ||
| NON-INTERESTED TRUSTEES (CONT.) | Term | |||
| Lifetime of Trust until removal, resignation or retirement* | ||||
| Brenda A. Cline (58) | Trustee since 2004 Chair since 2019 Vice Chair 2018 | Chief Financial Officer, Treasurer and Secretary, Kimbell Art Foundation (1993-Present); Director, Tyler Technologies, Inc. (public sector software solutions company) (2014-Present); Director, Range Resources Corporation (oil and natural gas company) (2015-Present); Trustee, CushingClosed-End andOpen-End Funds and ETFs (2017-Present); Trustee, American Beacon Select Funds (2004-Present); Trustee, American Beacon Institutional Funds Trust (2017-Present); Trustee, American Beacon Sound Point Enhanced Income Fund (2018-Present); Trustee, American Beacon Apollo Total Return Fund (2018-Present). | ||
| Eugene J. Duffy (64) | Trustee since 2008 | Managing Director, Global Investment Management Distribution, Mesirow Financial (2016-Present); Managing Director, Institutional Services, Intercontinental Real Estate Corporation (2014-Present); Principal and Executive Vice President, Paradigm Asset Management (1994-2014); Trustee, American Beacon Select Funds (2008-Present); Trustee, American Beacon Institutional Funds Trust (2017-Present); Trustee, American Beacon Sound Point Enhanced Income Fund (2018-Present); Trustee, American Beacon Apollo Total Return Fund (2018-Present). | ||
| Claudia A. Holz*** (61) | Trustee since 2018 | Partner, KPMG LLP (1990-2017); Trustee, American Beacon Select Funds (2018-Present); Trustee, American Beacon Institutional Funds Trust(2018-Present); Trustee, American Beacon Sound Point Enhanced Income Fund (2018-Present); Trustee, American Beacon Apollo Total Return Fund (2018-Present). | ||
| Douglas A. Lindgren**** (57) | Trustee since 2018 | CEO North America, Carne Global Financial Services (2016-2017); Managing Director, IPS Investment Management and Global Head, Content Management, UBS Wealth Management (2010-2016); Trustee, American Beacon Select Funds (2018-Present); Trustee, American Beacon Institutional Funds Trust (2018-Present); Trustee, American Beacon Sound Point Enhanced Income Fund (2018-Present); Trustee, American Beacon Apollo Total Return Fund (2018-Present). | ||
| Richard A. Massman (75) | Trustee since 2004 Chair 2008-2018 Chair Emeritus since 2019 | Consultant and General Counsel Emeritus, Hunt Consolidated, Inc. (holding company engaged in oil and gas exploration and production, refining, real estate, farming, ranching and venture capital activities) (2009-Present); Trustee, American Beacon Select Funds (2004-Present); Trustee, American Beacon Institutional Funds Trust (2017-Present); Trustee, American Beacon Sound Point Enhanced Income Fund (2018-Present); Trustee, American Beacon Apollo Total Return Fund (2018-Present). | ||
| Barbara J. McKenna, CFA (55) | Trustee since 2012 | President/Managing Principal, Longfellow Investment Management Company (2005-Present); Trustee, American Beacon Select Funds(2012-Present); Trustee, American Beacon Institutional Funds Trust(2017-Present); Trustee, American Beacon Sound Point Enhanced Income Fund (2018-Present); Trustee, American Beacon Apollo Total Return Fund (2018-Present). | ||
| R. Gerald Turner (73) | Trustee since 2001 | President, Southern Methodist University (1995-Present); Director, J.C. Penney Company, Inc. (1996-Present); Director, Kronus Worldwide Inc. (chemical manufacturing) (2003-Present); Trustee, American Beacon Select Funds (2001-Present); Trustee, American Beacon Institutional Funds Trust (2017-Present); Trustee, American Beacon Sound Point Enhanced Income Fund (2018-Present); Trustee, American Beacon Apollo Total Return Fund (2018-Present). | ||
51
Trustees and Officers of the American Beacon FundsSM(Unaudited)
Name, Age | Position, Term of Office and Length of Time Served with the Trust | Principal Occupation(s) During Past 5 Years and Current Directorships | ||
| OFFICERS | Term | |||
| One Year | ||||
| Gene L. Needles, Jr. (64) | President since 2009 | CEO and Director (2009-Present), and Chairman (2018-Present), American Beacon Advisors, Inc.; President, American Beacon Advisors (2009-2018); President (2015-2018), Director and CEO (2015-Present), and Chairman (2018-Present), Resolute Investment Holdings, LLC; Director, Chairman and CEO, Resolute Topco, Inc. (2015-Present), President (2015-2018); Director, Chairman and CEO, Resolute Acquisition, Inc. (2015-Present); President (2015-2018), Chairman and CEO, Resolute Investment Managers, Inc. (2015-Present), President (2015-2018); Director, Chairman, President and CEO, Resolute Investment Distributors (2017-Present); Director, Chairman, President and CEO; Resolute Investment Services, Inc.(2015-Present); President and CEO, Lighthouse Holdings Parent, Inc.(2009-2015); President, CEO and Director, Lighthouse Holdings, Inc.(2009-2015); Manager, President and CEO, American Private Equity Management, LLC (2012-Present); Director, Chairman, President and CEO, Alpha Quant Advisors, LLC (2016-Present); Director, ARK Investment Management LLC (2016-Present); Director, Shapiro Capital Management LLC (2017-Present); Director, Chairman and CEO, Continuous Capital, LLC (2018-Present); Director and President, American Beacon Cayman Transformational Innovation Company, LTD., (2017-2018); President American Beacon Cayman TargetRisk Company, Ltd. (2018-Present); President, American Beacon Delaware Transformational Innovation Corporation (2017-2018); Member, Investment Advisory Committee, Employees Retirement System of Texas (2017-Present); Trustee, American Beacon NextShares Trust (2015-Present); President, American Beacon Select Funds (2009-Present); American Beacon Cayman Managed Futures Strategy Fund, Ltd.(2014-Present); President, American Beacon Institutional Funds Trust (2017-Present); President, American Beacon Sound Point Enhanced Income Fund (2018-Present); President, American Beacon Apollo Total Return Fund (2018-Present); President, | ||
| Rosemary K. Behan (59) | VP, Secretary and Chief Legal Officer since 2006 | Vice President, Secretary and General Counsel, American Beacon Advisors, Inc. (2006-Present); Secretary, Resolute Investment Holdings, LLC(2015-Present); Secretary, Resolute Topco, Inc. (2015-Present); Secretary, Resolute Acquisition, Inc. (2015-Present); Vice President, Secretary and General Counsel, Resolute Investment Managers, Inc. (2015-Present); Secretary, Resolute Investment Distributors, Inc. (2017-Present); Vice President, Secretary and General Counsel, Resolute Investment Services, Inc. (2015-Present); Vice President and Secretary, Lighthouse Holdings Parent, Inc. (2008-2015); Vice President and Secretary, Lighthouse Holdings, Inc. (2008-2015); Secretary, American Private Equity Management, LLC (2008-Present); Secretary, Alpha Quant Advisors, LLC (2016-Present); Vice President and Secretary, Continuous Capital, LLC (2018-Present); Secretary, American Beacon Delaware Transformational Innovation Corporation (2017-2018); Secretary, American Beacon Cayman Transformational Innovation Company, Ltd. (2017-2018; Secretary, American Beacon Cayman TargetRisk Company, Ltd (2018-Present); Chief Legal Officer, Vice President and Secretary, American Beacon Select Funds (2006-Present); Secretary, American Beacon Cayman Managed Futures Strategy Fund, Ltd. (2014-Present); Chief Legal Officer, Vice President and Secretary, American Beacon Institutional Funds Trust (2017-Present); Chief Legal Officer, Vice President and Secretary, American Beacon Sound Point Enhanced Income Fund (2018-Present); Chief Legal Officer, Vice President and Secretary American Beacon Apollo Total Return Fund (2018-Present). | ||
52
Trustees and Officers of the American Beacon FundsSM(Unaudited)
Name, Age | Position, Term of Office and Length of Time Served with the Trust | Principal Occupation(s) During Past 5 Years and Current Directorships | ||
| OFFICERS (CONT.) | Term | |||
| One Year | ||||
| Brian E. Brett (58) | VP since 2004 | Senior Vice President, Head of Distribution (2012-Present), Vice President, Director of Sales (2004-2012), American Beacon Advisors, Inc.; Senior Vice President, Resolute Investment Managers, Inc. (2017-Present); Senior Vice President, Resolute Investment Distributors, Inc. (2018-Present), Vice President (2017-2018); Senior Vice President, Resolute Investment Services, Inc. (2017-Present); Senior Vice President, Lighthouse Holdings Parent, Inc. (2008-2015); Senior Vice President, Lighthouse Holdings, Inc. (2008-2015); Vice President, American Beacon Select Funds(2004-Present); Vice President, American Beacon Institutional Funds Trust (2017-Present); Vice President American Beacon Sound Point Enhanced Income Fund (2018-Present); Vice President American Beacon Apollo Total Return Fund (2018-Present). | ||
| Paul B. Cavazos (49) | VP since 2016 | Chief Investment Officer and Senior Vice President, American Beacon Advisors, Inc. (2016-Present); Chief Investment Officer, DTE Energy(2007-2016); Vice President, American Private Equity Management, L.L.C. (2017-Present); Vice President, American Beacon Select Funds(2016-Present); Vice President, American Beacon Institutional Funds Trust (2017-Present); Vice President American Beacon Sound Point Enhanced Income Fund (2018-Present); Vice President American Beacon Apollo Total Return Fund (2018-Present). | ||
| Erica Duncan (48) | VP Since 2011 | Vice President, American Beacon Advisors, Inc. (2011-Present); Vice President, Resolute Investment Managers (2018-Present); Vice President, Resolute Investment Services, Inc. (2018-Present); Vice President, American Beacon Select Funds (2011-Present); Vice President, American Beacon Institutional Funds Trust (2017-Present); Vice President American Beacon Sound Point Enhanced Income Fund (2018-Present); Vice President American Beacon Apollo Total Return Fund (2018-Present). | ||
| Melinda G. Heika (57) | Treasurer since 2010 | Treasurer and CFO (2010-Present), American Beacon Advisors, Inc.; Treasurer, Resolute Topco, Inc. (2015-Present); Treasurer, Resolute Investment Holdings, LLC. (2015-Present); Treasurer, Resolute Acquisition, Inc. (2015-Present); Treasurer and CFO, Resolute Investment Managers, Inc. (2017-Present); Treasurer, Resolute Investment Distributors, Inc. (2017-2017); Treasurer and CFO, Resolute Investment Services, Inc. (2015-Present); Treasurer, Lighthouse Holdings Parent Inc., (2010-2015); Treasurer, Lighthouse Holdings, Inc. (2010-2015); Treasurer, American Private Equity Management, LLC (2012-Present); Treasurer and CFO, Alpha Quant Advisors, LLC (2016-Present); Treasurer and CFO, Continuous Capital, LLC (2018-Present); Treasurer, American Beacon Cayman Transformational Innovation, Ltd. (2017-2018); Treasurer, American Beacon Delaware Transformational Innovation Corporation (2017-2018); Treasurer, American Beacon Select Funds (2010-Present); Director and Treasurer, American Beacon Cayman Managed Futures Strategy Fund, Ltd. (2014-Present); Treasurer, American Beacon Institutional Funds Trust (2017-Present); Treasurer, American Beacon Sound Point Enhanced Income Fund (2018-Present); Treasurer, American Beacon Apollo Total Return Fund (2018-Present). | ||
| Terri L. McKinney (55) | VP since 2010 | Vice President (2009-Present), Managing Director (2003-2009), American Beacon Advisors, Inc.; Vice President, Resolute Investment Managers, Inc. (2017-Present); Vice President, Resolute Investment Services, Inc(2018-Present); Vice President, Alpha Quant Advisors, LLC (2016-Present); Vice President, Continuous Capital, LLC (2018-Present); Vice President, American Beacon Select Funds (2010-Present); Vice President, American Beacon Institutional Funds Trust (2017-Present); Vice President, American Beacon Sound Point Enhanced Income Fund (2018-Present); Vice President, American Beacon Apollo Total Return Fund (2018-Present). | ||
53
Trustees and Officers of the American Beacon FundsSM(Unaudited)
Name, Age | Position, Term of Office and Length of Time Served with the Trust | Principal Occupation(s) During Past 5 Years and Current Directorships | ||
| OFFICERS (CONT.) | Term | |||
| One Year | ||||
| Jeffrey K. Ringdahl (43) | VP since 2010 | Director (2015-Present), President (2018-Present), Chief Operating Officer (2010-Present), Senior Vice President (2013-2018), Vice President(2010-2013), American Beacon Advisors, Inc.; Director (2015-Present), President (2018-Present), Senior Vice Present (2015-2018, Resolute Investment Holdings, LLC; Director (2015-Present), President(2018-Present), Senior Vice President (2015-2018), Resolute Topco, Inc.; Director (2015-Present), President (2018-Present), Senior Vice President (2015-2018), Resolute Acquisition, Inc.; Director (2015-Present), President & COO (2018-Present), Senior Vice President (2015-2018), Resolute Investment Managers, Inc.; Director and Executive Vice President (2017-Present), Resolute Investment Distributors, Inc.; Director(2017-Present), President & COO (2018-Present), Executive Vice President (2017-2018), Resolute Investment Services, Inc.; Senior Vice President (2018-Present), Vice President (2012-2018), Manager (2015-2018), American Private Equity Management, LLC; Senior Vice President, Lighthouse Holdings Parent, Inc. (2013-2015); Senior Vice President, Lighthouse Holdings, Inc. (2013-2015); Trustee, American Beacon NextShares Trust (2015-Present); Director, Executive Vice President & COO, Alpha Quant Advisors, LLC(2016-Present); Director, Shapiro Capital Management, LLC (2017-Present); Director, Executive Vice President & COO, Continuous Capital, LLC (2018-Present); Director and Vice President, American Beacon Cayman Transformational Innovation Company, Ltd., (2017-Present); Vice President, American Beacon Delaware Transformational Innovation Corporation (2017-2018); Vice President, American Beacon Cayman TargetRisk Company, Ltd (2018-Present); Vice President, American Beacon Select Funds (2010-2018); Director and Vice President, American Beacon Cayman Managed Futures Strategy Fund, Ltd. (2014-Present); Vice President, American Beacon Institutional Funds Trust (2017-Present); Vice President, American Beacon Sound Point Enhanced Income Fund (2018-Present); Vice President, American Beacon Apollo Total Return Fund (2018-Present) | ||
| Samuel J. Silver (55) | VP Since 2011 | Vice President (2011-Present), Chief Fixed Income Officer (2016-Present), American Beacon Advisors, Inc. (2011-Present); Vice President, American Beacon Select Funds (2011-Present); Vice President, American Beacon Institutional Funds Trust (2017-Present); Vice President, American Beacon Sound Point Enhanced Income Fund (2018-Present); Vice President, American Beacon Apollo Total Return Fund (2018-Present). | ||
| Christina E. Sears (47) | Chief Compliance Officer since 2004 and Asst. Secretary since 1999 | Vice President, American Beacon Advisors, Inc. (2019-Present); Chief Compliance Officer, American Beacon Advisors, Inc. (2004-Present); Vice President, Resolute Investment Managers, Inc. (2017-Present); Vice President, Resolute Investment Distributors (2017-Present); Vice President, Resolute Investment Services, Inc. (2019-Present); Chief Compliance Officer, American Private Equity Management, LLC(2012-Present); Chief Compliance Officer and Vice President, Alpha Quant Advisors, LLC (2016-Present); Vice President, Continuous Capital, LLC (2018-Present); Chief Compliance Officer (2004-Present) and Assistant Secretary (1999-Present), American Beacon Select Funds; Chief Compliance Officer and Assistant Secretary, American Beacon Institutional Funds Trust (2017-Present); Chief Compliance Officer and Assistant Secretary, American Beacon Sound Point Enhanced Income Fund (2018-Present); Chief Compliance Officer and Assistant Secretary, American Beacon Apollo Total Return Fund (2018-Present). | ||
54
Name, Age | Position, Term of Office and Length of Time Served with the Trust | Principal Occupation(s) During Past 5 Years and Current Directorships | ||
| OFFICERS (CONT.) | Term | |||
| One Year | ||||
| Sonia L. Bates (62) | Asst. Treasurer since 2011 | Assistant Treasurer, American Beacon Advisors, Inc. (2011-2018); Assistant Treasurer, Lighthouse Holdings Parent Inc. (2011-2015); Assistant Treasurer, Lighthouse Holdings, Inc. (2011-2015); Assistant Treasurer, American Private Equity Management, LLC (2012-Present); Assistant Treasurer, American Beacon Cayman Transformational Innovation Company, Ltd. (2017-Present); Assistant Treasurer, American Beacon Cayman TargetRisk Company, Ltd. (2018-Present); Assistant Treasurer, American Beacon Select Funds (2011-Present); Assistant Treasurer, American Beacon Institutional Funds Trust (2017-Present); Assistant Treasurer, American Beacon Sound Point Enhanced Income Fund(2018-Present); Assistant Treasurer, American Beacon Apollo Total Return Fund (2018-Present). | ||
| Shelley D. Abrahams (44) | Assistant Secretary since 2008 | Assistant Secretary, American Beacon Select Funds (2008-Present); Assistant Secretary, American Beacon Institutional Funds Trust(2017-Present); Assistant Secretary, American Beacon Sound Point Enhanced Income Fund (2018-Present); Assistant Secretary, American Beacon Apollo Total Return Fund (2018-Present). | ||
| Rebecca L. Harris (52) | Assistant Secretary since 2010 | Vice President, American Beacon Advisors, Inc. (2011-Present); Vice President, Resolute Investment Managers, Inc. (2017-Present); Vice President, Resolute Investment Services (2015-Present); Vice President, Alpha Quant Advisors, LLC (2016-Present); Vice President, Continuous Capital, LLC (2018-Present); Assistant Secretary, American Beacon Select Funds (2010-Present); Assistant Secretary, American Beacon Institutional Funds Trust (2017-Present); Assistant Secretary, American Beacon Sound Point Enhanced Income Fund (2018-Present); Assistant Secretary, American Beacon Apollo Total Return Fund (2018-Present). | ||
| Teresa A. Oxford (60) | Assistant Secretary since 2015 | Assistant Secretary, American Beacon Advisors, Inc. (2015-Present); Assistant Secretary, Resolute Investment Distributors (2018-Present); Assistant Secretary, Resolute Investment Services (2018-Present); Assistant Secretary, Alpha Quant Advisors, LLC (2016-Present); Assistant Secretary, American Beacon Select Funds (2015-Present); Assistant Secretary, American Beacon Institutional Funds Trust (2017-Present); Assistant Secretary, American Beacon Sound Point Enhanced Income Fund(2018-Present); Assistant Secretary, American Beacon Apollo Total Return Fund (2018-Present). | ||
* As of 11/12/2014, the Board adopted a retirement plan that requires Trustees, other than Messrs. Feld and Massman to retire no later than the last day of the calendar year in which they reach the age of 75. As of 11/7/17, the Board approved a waiver of the mandatory retirement policy with respect to Mr. Massman, who turned 75 in November 2018, to permit him to continue to serve on the Board as Chair Emeritus through 12/31/19.
** Mr. Feld is deemed to be an “interested person” of the Trusts, as defined by the 1940 Act. Mr. Feld’s law firm of Akin, Gump, Strauss, Hauer & Feld LLP has provided legal services within the past two fiscal years to one or more of the Trust’ssub-advisors.
*** Claudia A. Holz became a new Trustee to each of the Trusts on 4/1/2018.
**** Douglas A. Lindgren became a new Trustee to each of the Trusts on 1/1/2018.
55
American Beacon FundsSM
January 31, 2019 (Unaudited)
The American Beacon Funds recognize and respect the privacy of our shareholders. We are providing this notice to you so you will understand how shareholder information may be collected and used.
We may collect nonpublic personal information about you from one or more of the following sources:
| • | information we receive from you on applications or other forms; |
| • | information about your transactions with us or our service providers; and |
| • | information we receive from third parties. |
We do not disclose any nonpublic personal information about our customers or former customers to anyone, except as permitted by law.
We restrict access to your nonpublic personal information to those employees or service providers who need to know that information to provide products or services to you. To ensure the confidentiality of your nonpublic personal information, we maintain safeguards that comply with federal standards.
56

eDelivery isNOW AVAILABLE - Stop traditional mail delivery and receive your
shareholder reports and summary prospectuson-line. Sign up at
www.americanbeaconfunds.com
If you invest in the Fund through a financial institution, you may be able to receive the Fund’s regulatory mailings, such as the Prospectus, Annual Report and Semi-Annual Report, by e-mail. If you are interested in this option, please go towww.icsdelivery.com and search for your financial institution’s name or contact your financial institution directly.
To obtain more information about the Fund:
 |  | |
| ByE-mail: | On the Internet: | |
| american_beacon.funds@ambeacon.com | Visit our website atwww.americanbeaconfunds.com | |
By Telephone: Call (800)658-5811 |
By Mail: American Beacon Funds P.O. Box 219643 Kansas City, MO 64121-9643 | |
| Availability of Quarterly Portfolio Schedules | Availability of Proxy Voting Policy and Records | |
| In addition to the Schedule of Investments provided in each semi-annual and annual report, the Fund files a complete schedule of its portfolio holdings with the Securities and Exchange Commission (“SEC”) on Form N-Q as of the first and third fiscal quarters. The Fund’s Forms N-Q are available on the SEC’s website atwww.sec.gov. The Forms N-Q may also be reviewed and copied at the SEC’s Public Reference Section, 100 F Street, NE, Washington, D.C. 20549-2736. Information regarding the operation of the SEC’s Public Reference Room may be obtained bycalling (800)-SEC-0330. A complete schedule of the Fund’s portfolio holdings is also available atwww.americanbeaconfunds.com approximately sixty days after the end of each quarter. | A description of the policies and procedures the Fund uses to determine how to vote proxies relating to portfolio securities is available in the Fund’s Statement of Additional Information, is available free of charge on the Fund’s websitewww.americanbeaconfunds.com and by calling1-800-967-9009 or by accessing the SEC’s website atwww.sec.gov. The Fund’s proxy voting record for the most recent year ended June 30 is filed annually with the SEC on Form N-PX. The Fund’s Forms N-PX are available on the SEC’s website atwww.sec.gov. The Fund’s proxy voting record may also be obtained by calling1-800-967-9009. | |


Fund Service Providers:
CUSTODIAN State Street Bank and Trust Company Boston, Massachusetts | TRANSFER AGENT DST Asset Manager Solutions, Inc. Kansas City, Missouri | INDEPENDENT REGISTERED PUBLIC ACCOUNTING FIRM PricewaterhouseCoopers LLP Boston, Massachusetts | DISTRIBUTOR Resolute Investment Distributors, Inc. Irving, Texas |
This report is prepared for shareholders of the American Beacon Funds and may be distributed to others only if preceded or accompanied by a current Prospectus or Summary Prospectus.
American Beacon Funds and American Beacon Crescent Short Duration High Income Fund are service marks of American Beacon Advisors, Inc.
AR 1/19

About American Beacon Advisors
Since 1986, American Beacon Advisors has offered a variety of products and investment advisory services to numerous institutional and retail clients, including a variety of mutual funds, corporate cash management, and separate account management.
Our clients include defined benefit plans, defined contribution plans, foundations, endowments, corporations, financial planners, and other institutional investors. With American Beacon Advisors, you can put the experience of a multi-billion dollar asset management firm to work for your company.
Beginning on January 1, 2021, as permitted by regulations adopted by the Securities and Exchange Commission, paper copies of the Fund’s shareholder reports will no longer be sent by mail, unless you specifically request paper copies of the reports from the Fund or from your financial intermediary, such as a broker-dealer or bank. Instead, the reports will be made available on a website, and you will be notified by mail each time a report is posted and provided with a website link to access the report.
If you already elected to receive shareholder reports electronically, you will not be affected by this change and you need not take any action. You may elect to receive shareholder reports and other communications from the Fund or your financial intermediary electronically by going towww.americanbeaconfunds.com and clicking on “Quick Links” and then “Register for E-Delivery.”
You may elect to receive all future reports in paper free of charge. You can inform the Fund that you wish to continue receiving paper copies of your shareholder reports by calling 1-800-658-5811, option 1, or you may directly inform your financial intermediary of your wish. A notice that will be mailed to you each time a report is posted will also include instructions for informing the Fund that you wish to continue receiving paper copies of your shareholder reports. Your election to receive reports in paper will apply to all funds held with the American Beacon Funds Complex or your financial intermediary, as applicable.
FRONTIER MARKETS INCOME FUND
Investing inforeign, emerging and frontier market securitiesmay involve heightened risk due to currency fluctuations and economic and political risks. Investing inderivative instrumentsinvolves liquidity, credit, interest rate and market risks. The use offixed-income securitiesentails interest rate and credit risks. Please see the prospectus for a complete discussion of the Fund’s risks. There can be no assurances that the investment objectives of this Fund will be met.
GLG TOTAL RETURN FUND
Investing inforeign and emerging market securitiesmay involve heightened risk due to currency fluctuations and economic and political risks. Investing inderivative instrumentsinvolves liquidity, credit, interest rate and market risks. The use offixed-income securitiesentails interest rate and credit risks. Because the Fund may invest infewer issuersthan a more diversified portfolio, the fluctuating value of a single holding may have a greater effect on the value of the Fund. Please see the prospectus for a complete discussion of the Fund’s risks. There can be no assurances that the investment objectives of this Fund will be met.
Any opinions herein, including forecasts, reflect our judgment as of the end of the reporting period and are subject to change. Each advisor’s strategies and each Fund’s portfolio composition will change depending on economic and market conditions. This report is not a complete analysis of market conditions, and, therefore, should not be relied upon as investment advice. Although economic and market information has been compiled from reliable sources, American Beacon Advisors, Inc. makes no representation as to the completeness or accuracy of the statements contained herein.
American Beacon Funds | January 31, 2019 |
| 1 | ||||
| 2 | ||||
| 10 | ||||
| 12 | ||||
| 13 | ||||
| 25 | ||||
| 31 | ||||
| 35 | ||||
| 66 | ||||
| 71 | ||||
| 77 | ||||
Disclosures Regarding the Approval of the Management and Investment | 78 | |||
| 79 | ||||
| 85 | ||||
| Back Cover | ||||
 | Dear Shareholders,
The market volatility of December 2018 – a month in which all major U.S. equity indexes declined and the year ended in negative territory – serves as a prime example of the importance of having a long-term investment perspective.
While long-term investing isn’t about identifying and anticipating the next big market move, it is about identifying the right investment products for riding out those moves. As a long-term investor, you should strive to accomplish the three Ds: direction, discipline and diversification.
u Direction: Achieving your long-term financial goals requires an individualized plan of action. You may want your plan to provide some |
measure of protection against periods of geopolitical turmoil, economic uncertainty, market volatility and job insecurity. Your plan should be reviewed annually and be adjusted in the event your long-range needs change.
| u | Discipline:Long-term, systematic participation in an investment portfolio requires your resolution to stay the course. Spending time in the market – rather than trying to time the market – may place you in a better position to reach your long-term financial goals. |
| u | Diversification: By investing in different types of investment categories and asset classes, you may be able to help mitigate financial risks across your investment portfolio. By allocating your investment portfolio according to your risk-tolerance level, you may be better positioned to weather storms and achieve your long-term financial goals. |
Since 1986, American Beacon has endeavored to provide investors with a disciplined approach to realizing long-term financial goals.As a manager of managers, we strive to provide investment products that may enable investors to participate during market upswings while potentially insulating against market downswings. Our approach is more than a concept. It’s the cornerstone of our culture. And we strive to apply it at every turn as we seek to provide a well-diversified line of investment products for your investment portfolio.
Many of thesub-advisors to our mutual funds pursue upside capture and/or downside protection using proprietary strategies. The investment teams behind our mutual funds seek to produce consistent, long-term results rather than focus only on short-term movements in the markets. In managing our investment products, we emphasize identifying opportunities that offer the potential for long-term rewards.
Thank you for your continued interest in American Beacon. For additional information about our funds or to access your account information, please visit our website atwww.americanbeaconfunds.com.
Best Regards,

Gene L. Needles, Jr.
President
American Beacon Funds
1
Global Fixed-Income Market Overview
January 31, 2019 (Unaudited)
The major emerging- and frontier-market fixed-income indexes ended the period relatively unchanged; however, the path during the year was tumultuous as significant volatility overtook the markets. Hard-currency, emerging-market bonds generally performed better than local-currency and frontier-market securities as investors flocked to safe-haven regions and currencies such as the U.S. dollar. While the U.S. markets were relatively stable until the fourth quarter of 2018, emerging and frontier markets experienced weakness throughout the year.
The general themes that sparked concern were trade tariffs, slowing Chinese and European economic growth, and a Federal Reserve (“the Fed”) intent on raising interest rates. Sentiment leading into 2018 was generally quite positive and continued the trend of strong performance from the preceding two years; however, as concerns mounted, investors finally pulled back.
Emerging and frontier market currencies began to weaken in early 2018 and finished the period down more than 10%, according to the JP Morgan Emerging Market Currency Index. Peak to trough, the index was down more than 15%. Certain countries in Latin America andSub-Saharan Africa posted even larger losses as investors fled to higher-quality regions. Likewise, credit spreads widened 0.9% during the period, and 1.6% peak to trough.
Interestingly, while thesell-off took place over much of the year, markets bounced back sharply in late 2018 into 2019 leaving several markets nearly unchanged by period end. The JP Morgan Emerging Market Bond Global Diversified Index (hard currency) ended the period with a 0.0% total return, after being down more than 6%. The JP Morgan Government Bond Index – Emerging Markets (local currency) ended the period with a-5.8% total return, after being down more than 16%.
While lower valuations drew some investors back into the markets, the headwinds of early 2018 also began to abate. There were signs of thawing in the tariff disputes. The Fed indicated that it would pause its interest-rate hikes, and the European Central Bank noted its fragile economy as well. China also attempted to project determination in addressing its weakness. With fewer headwinds, investors moved back into emerging-market bonds and pushed many indexes nearly back up to their peaks.
2
American Beacon Frontier Markets Income FundSM
Performance Overview
January 31, 2019 (Unaudited)
The Investor Class of the American Beacon Frontier Markets Income Fund (the “Fund”) returned-1.84% for the twelve-month period ending January 31, 2019. The Fund underperformed the JPMorgan EMBI Global Diversified Index (the “Index”) (hard currency) return of 0.01% for the period. For additional comparison, the JPMorganGBI-EM Global Diversified Index (local currency) returned-5.33%.
Comparison of Change in Value of a $10,000 Investment for the period from 2/25/2014 through 1/31/2019

| Total Returns for the Period ended January 31, 2019 |
| ||||||||||||||||||||||||||
Ticker | 1 Year | 3 Years | Since Inception (2/25/2014) | Value of $10,000 2/25/2014- 1/31/2019 | |||||||||||||||||||||||
Institutional Class (1,3) | AGEIX | (1.58 | )% | 9.72 | % | 4.92 | % | $ | 12,672 | ||||||||||||||||||
Y Class (1,3) | AGEYX | (1.65 | )% | 9.60 | % | 4.82 | % | $ | 12,614 | ||||||||||||||||||
Investor Class (1,3) | AGEPX | (1.84 | )% | 9.33 | % | 4.55 | % | $ | 12,453 | ||||||||||||||||||
A without Sales Charge (1,3) | AGUAX | (2.09 | )% | 9.23 | % | 4.48 | % | $ | 12,411 | ||||||||||||||||||
A with Sales Charge (1,3) | AGUAX | (6.75 | )% | 7.47 | % | 3.45 | % | $ | 11,820 | ||||||||||||||||||
C without Sales Charge (1,3) | AGECX | (2.64 | )% | 8.49 | % | 3.71 | % | $ | 11,970 | ||||||||||||||||||
C with Sales Charge (1,3) | AGECX | (3.64 | )% | 8.49 | % | 3.71 | % | $ | 11,970 | ||||||||||||||||||
JPMorgan EMBI Global Diversified Index (2) | 0.01 | % | 6.74 | % | 5.46 | % | $ | 12,995 | |||||||||||||||||||
| 1. | Performance shown is historical and is not indicative of future returns. Investment returns and principal value will vary, and shares may be worth more or less at redemption than at original purchase. Performance shown is calculated based on the published end of day net asset values as of date indicated, and current performance may be lower or higher than the performance data quoted. To obtain performance as of the most recent month end, please call1-800-967-9009 or visitwww.americanbeaconfunds.com. Fund performance in the table above does not reflect the deduction of taxes a shareholder would pay on distributions or the redemption of shares. Generally accepted accounting principles require adjustments to be made to the net assets of the Fund at period end for financial reporting purposes only, and as such, the total return based on the unadjusted net asset value per share may differ from the total return reported in the financial highlights. A portion of fees charged to the Institutional Class of the Fund was waived from Fund inception through 2015, partially recovered in 2016, and waived in 2017 and 2018. Performance prior to waiving fees was lower than actual returns shown through 2015 and in 2017 and 2018. A portion of fees charged to the Investor Class of the Fund was waived from Fund inception through 2015, partially recovered in 2016, waived in 2017, and partially recovered in 2018. Performance prior to waiving fees was lower than actual returns shown through 2015 and for 2017. A portion of fees charged to the Y Class of the Fund was waived from Fund inception through 2015, partially recovered in 2016, and waived in 2017 and 2018. Performance prior to waiving fees was lower than |
3
American Beacon Frontier Markets Income FundSM
Performance Overview
January 31, 2019 (Unaudited)
| actual returns shown through 2015 and in 2017 and 2018. A portion of fees charged to the A Class of the Fund was waived from Fund inception through 2015, partially recovered in 2016, waived in 2017, and partially recovered in 2018 and 2019. Performance prior to waiving fees was lower than actual returns shown through 2015 and in 2017. A portion of fees charged to the C Class of the Fund was waived from Fund inception through 2017 and was partially recovered in 2018. Performance prior to waiving fees was lower than actual returns shown through 2017. A Class shares have a maximum sales charge of 4.75%. The maximum contingent deferred sales charge for the C Class is 1.00% for shares redeemed within one year of the date of purchase. |
| 2. | The JPMorgan EMBI Global Diversified Index is an emerging market debt benchmark that tracks dollar-denominated bonds issued by frontier and emerging market governments. One cannot directly invest in an index. |
| 3. | The Total Annual Fund Operating Expense ratios set forth in the most recent Fund prospectus for the Institutional, Y, Investor, A, and C Class shares were 1.19%, 1.27%, 1.43%, 1.50% and 2.31%, respectively. The expense ratios above may vary from the expense ratios presented in other sections of this report that are based on expenses incurred during the period covered by this report. |
Global markets witnessed a pickup in volatility over the year as trade tensions mounted and talks between the world’s two largest economies, the United States and China, took many twists and turns. Investors were concerned that the global economy was not on solid footing and that the previous period of synchronized growth had dissipated. Furthermore, the U.S. Federal Reserve (“Fed”) continued its path of tightening monetary policy. In this environment, Frontier markets were not immune as performance was down for the year. Commodity-exporting countries were impacted by price declines, and in the latter half of 2018, oil prices tanked as the market selloff was relentless for risk assets. At the turn of the new year, however, sentiment quickly improved, and markets rallied into period end coinciding with dovish comments from the Fed chairman.
The largest detractors in the Fund during the period were local currency bonds in Argentina and Zambia. In Argentina, the peso suffered significant depreciation as investors lost confidence in the country’s fiscal and monetary policies. The International Monetary Fund (“IMF”) stepped in to offer financial support, but the market’s pessimism continued as the crisis manifested into an increased credit line from the IMF. Near period end, the situation improved as monetary policy stabilized and the currency rebounded off its lows.
In Zambia, local-currency bonds declined when investors became concerned about the country’s increasing debt load, which was then compounded by credit rating downgrades from Moody’s and Standard & Poor’s. The securities bounced back toward the end of the period as investors sensed that authorities were getting the fiscal and debt management situations under control.
The Fund’s largest contributors to performance over the period were positions in the local currency bonds of Kenya and Egypt. In Kenya, the bonds were steady producers as the shilling remained stable allowing the Fund to capture interest income. In Egypt, the high yield and low duration of the bonds provided solid returns over the course of the year.
The Fund’ssub-advisors continue to utilize bothtop-down andbottom-up inputs to identify the best relative opportunities across the evolving frontier market spectrum to benefit performance over the long term.
| Top Ten Holdings (% Net Assets) |
| |||||||
| Kenya Infrastructure Bond, 12.500%, Due 1/10/2033 | 2.1 | |||||||
| Angolan Government International Bond, 9.500%, Due 11/12/2025 | 2.0 | |||||||
| Angolan Government International Bond, 8.250%, Due 5/9/2028 | 1.8 | |||||||
| Nigeria Government Bond, 16.288%, Due 3/17/2027 | 1.7 | |||||||
| Argentina Treasury Bill, 38.30% Due 6/28/2019 | 1.5 | |||||||
| Dominican Republic International Bond, 11.500%, Due 5/10/2024 | 1.5 | |||||||
| Ivory Coast Government International Bond, 5.750%, Due 12/31/2032 | 1.5 | |||||||
| Mongolia Government International Bond, 8.750%, Due 3/9/2024 | 1.5 | |||||||
| Republic of Cameroon International Bond, 9.500%, Due 11/19/2025 | 1.5 | |||||||
| Ghana Government Bond, 16.500%, Due 3/22/2021 | 1.4 | |||||||
| Total Fund Holdings | 185 | |||||||
4
American Beacon Frontier Markets Income FundSM
Performance Overview
January 31, 2019 (Unaudited)
| Top Ten Country Weightings (% Investments) |
| |||||||
| Nigeria | 5.3 | |||||||
| Ghana | 5.2 | |||||||
| Angola | 5.1 | |||||||
| Argentina | 5.1 | |||||||
| Egypt | 4.9 | |||||||
| Kenya | 4.8 | |||||||
| Ukraine | 4.8 | |||||||
| Zambia | 4.4 | |||||||
| Ivory Coast | 4.2 | |||||||
| Sri Lanka | 4.2 | |||||||
| Sector Allocation (% Investments) |
| |||||||
| Foreign Sovereign Obligations | 82.4 | |||||||
| Credit-Linked Notes | 15.4 | |||||||
| Communications | 0.7 | |||||||
| Diversified | 0.4 | |||||||
| Consumer,Non-Cyclical | 0.3 | |||||||
| Energy | 0.3 | |||||||
| Financial | 0.3 | |||||||
| Basic Materials | 0.2 | |||||||
5
American Beacon Frontier Markets Income FundSM
Performance Overview
January 31, 2019 (Unaudited)
| Country Allocation (% Investments) |
| |||||||
| Nigeria | 5.3 | |||||||
| Ghana | 5.2 | |||||||
| Angola | 5.1 | |||||||
| Argentina | 5.1 | |||||||
| Egypt | 4.9 | |||||||
| Kenya | 4.8 | |||||||
| Ukraine | 4.8 | |||||||
| Zambia | 4.4 | |||||||
| Ivory Coast | 4.2 | |||||||
| Sri Lanka | 4.2 | |||||||
| Dominican Republic | 3.5 | |||||||
| Uganda | 3.5 | |||||||
| Iraq | 3.3 | |||||||
| Uruguay | 3.2 | |||||||
| Ecuador | 3.0 | |||||||
| Supranational | 3.0 | |||||||
| Senegal | 2.9 | |||||||
| Costa Rica | 2.7 | |||||||
| Mongolia | 2.5 | |||||||
| Mozambique | 2.4 | |||||||
| Netherlands | 1.9 | |||||||
| Nicaragua | 1.8 | |||||||
| Cameroon | 1.7 | |||||||
| Kyrgyzstan | 1.7 | |||||||
| Tajikistan | 1.6 | |||||||
| Gabon | 1.3 | |||||||
| Georgia | 1.2 | |||||||
| Kazakhstan | 1.1 | |||||||
| Belarus | 1.0 | |||||||
| Ethiopia | 1.0 | |||||||
| Papua New Guinea | 1.0 | |||||||
| Tunisia | 1.0 | |||||||
| Azerbaijan | 0.8 | |||||||
| Paraguay | 0.7 | |||||||
| Suriname | 0.6 | |||||||
| El Salvador | 0.4 | |||||||
| Malawi | 0.4 | |||||||
| Gambia | 0.3 | |||||||
| Rwanda | 0.3 | |||||||
| Tanzania, Republic of | 0.3 | |||||||
| Belize | 0.2 | |||||||
| Mauritius | 0.2 | |||||||
| Pakistan | 0.2 | |||||||
| United Kingdom | 0.2 | |||||||
| Albania | 0.1 | |||||||
| Armenia | 0.1 | |||||||
| Bosnia & Herzegovina | 0.1 | |||||||
| Bahrain | 0.1 | |||||||
| Bangladesh | 0.1 | |||||||
| Canada | 0.1 | |||||||
| Honduras | 0.1 | |||||||
| Jamaica | 0.1 | |||||||
| Lebanon | 0.1 | |||||||
| Luxembourg | 0.1 | |||||||
| Venezuela | 0.1 | |||||||
6
American Beacon GLG Total Return FundSM
Performance Overview
January 31, 2019 (Unaudited)
The Investor Class of the American Beacon GLG Total Return Fund (the “Fund”) returned-0.04% for the twelve-month period ended January 31, 2019. The Fund underperformed the BofA Merrill Lynch3-Month LIBOR Constant Maturity Index (the “Index”) return of 2.21% for the same period. For additional comparison, the JP Morgan EMBI Global Index (hard currency) returned-0.20%, and the JP MorganGBI-EM Global Diversified Index (local currency) returned-5.33%.
Comparison of Change in Value of a $10,000 Investment for the period from 5/20/2016 through 1/31/2019
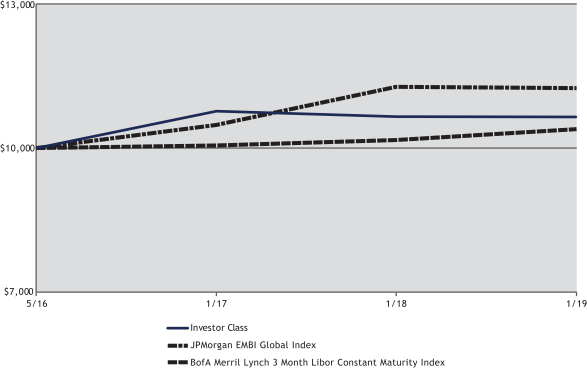
| Total Returns for the Period ended January 31, 2019 |
| |||||||||||||||||||||
Ticker | 1 Year | Since Inception (5/20/2016) | Value of $10,000 5/20/2016- 1/31/2019 | |||||||||||||||||||
Institutional Class (1,3) | GLGIX | 0.47 | % | 2.81 | % | $ | 10,777 | |||||||||||||||
Y Class (1,3) | GLGYX | 0.17 | % | 2.60 | % | $ | 10,719 | |||||||||||||||
Investor Class (1,3) | GLGPX | (0.04 | )% | 2.35 | % | $ | 10,647 | |||||||||||||||
A without Sales Charge (1,3) | GLGAX | (0.04 | )% | 2.31 | % | $ | 10,637 | |||||||||||||||
A Class with Sales Charge (1,3) | GLGAX | (4.79 | )% | 0.48 | % | $ | 10,131 | |||||||||||||||
C without Sales Charge (1,3) | GLGCX | (0.69 | )% | 1.58 | % | $ | 10,434 | |||||||||||||||
C Class with Sales Charge (1,3) | GLGCX | (1.69 | )% | 1.58 | % | $ | 10,434 | |||||||||||||||
Ultra Class (1,3) | GLGUX | 0.47 | % | 2.83 | % | $ | 10,784 | |||||||||||||||
BofA Merrill Lynch3-Month LIBOR Constant Maturity Index (2) | 2.21 | % | 1.43 | % | $ | 10,391 | ||||||||||||||||
JPMorgan EMBI Global Index (2) | (0.20 | )% | 4.44 | % | $ | 11,246 | ||||||||||||||||
| 1. | Performance shown is historical and is not indicative of future returns. Investment returns and principal value will vary, and shares may be worth more or less at redemption than at original purchase. Performance shown is calculated based on the published end of day net asset values as of the date indicated, and current performance may be lower or higher than the performance data quoted. To obtain performance as of the most recent month end, please visitwww.americanbeaconfunds.com or call1-800-967-9009. Fund performance in the table above does not reflect the deduction of taxes a shareholder would pay on distributions or the redemption of shares. Generally accepted accounting principles require adjustments to be made to the net assets of the Fund at period end for financial reporting purposes only, and as such, the total return based on the unadjusted net asset value per share may differ from the total return reported in the financial highlights. A portion of fees charged to the Investor and Ultra Classes of the Fund has been waived since Fund inception. |
7
American Beacon GLG Total Return FundSM
Performance Overview
January 31, 2019 (Unaudited)
| Performance prior to waiving fees was lower than actual returns shown since inception. A portion of fees charged to the Institutional, A and C Classes of the Fund were waived from Fund inception to 2017 and partially recovered in 2018. Performance prior to waiving fees was lower than actual returns shown through 2017. A portion of fees charged to the Y Class of the Fund was waived from Fund inception through 2017 and partially recovered in 2018. Performance prior to waiving fees was lower than actual returns shown through 2017. A Class shares have a maximum sales charge of 4.75%. The maximum contingent deferred sales charge for the C Class is 1.00% for shares redeemed within one year of the date of purchase. |
| 2. | The BofA Merrill Lynch3-Month LIBOR Constant Maturity Index represents the London Interbank Offered Rate (LIBOR) with a constant3-month average maturity. LIBOR is a composite of the rates of interest at which banks borrow from one another in the London market, and it is a widely used benchmark for short-term interest rates. The JPMorgan EMBI Global Index is an emerging market debt benchmark that tracks dollar-denominated bonds issued by emerging market governments. One cannot directly invest in an index. |
| 3. | The Total Annual Fund Operating Expense ratios set forth in the most recent Fund prospectus for the Institutional, Y, Investor, A, C, and Ultra Class shares were 1.04%, 1.19%, 2.10%, 1.43%, 2.18% and 1.08%, respectively. The expense ratios above may vary from the expense ratios presented in other sections of this report that are based on expenses incurred during the period covered by this report. |
Emerging-market debt had a difficult year as investors became concerned about global economic trends and reallocated into safe-haven countries and currencies. It was the environment the Fund had been anticipating since early-2017 when valuations first became stretched and investor exposures crowded. The Fund’s exposures to emerging markets were significantly reduced, although it did hold higher-quality, short-duration sovereign and quasi-sovereign bonds denominated in U.S. dollars to generate income as it awaited the correction.
During the period, the Fund was short a variety of local currencies including the Brazilian peso, Indonesian rupiah and South African rand. The Fund was also short credit exposure to countries including Brazil, Argentina, Colombia, Indonesia, South Africa, Lebanon and Russia, among others, as spreads became too narrow.
Investor positions in emerging market credit were overweight since 2017, yet fundamentals in many countries were weakening (including current account balances, inflation expectations, currency valuations, and fiscal deficits). Credit spreads also had become historically narrow as investors searched for yield in thelow-yielding environment. Finally, during the period, the Fund’s positions began to add value as investors withdrew assets from risk sectors and reconsidered their outlook towards global economic growth. Local currency bonds fared the worst during the period.
Given the magnitude of the correction, investors were lured back into the markets in January 2019 looking for discounts. Several of the worst-impacted sectors bounced back firmly salvaging their returns for the period, but many others were still down materially from their peaks. The subadvisor maintained a cautious outlook towards the market at period end.
The subadvisor has maintained a consistenttop-down andbottom-up approach towards the markets since the Fund’s inception and seeks to generate attractive long-term results with lower volatility than that of the emerging markets over a full market cycle.
| Top Ten Holdings (% Net Assets) |
| |||||||
| U.S. Treasury Bills, 2.472%, Due 7/18/2019 | 36.8 | |||||||
| U.S. Treasury Bills, 2.427%, Due 6/27/2019 | 13.8 | |||||||
| U.S. Treasury Bills, 2.304%, Due 2/14/2019 | 12.8 | |||||||
| U.S. Treasury Bills, 2.379%, Due 3/28/2019 | 12.7 | |||||||
| U.S. Treasury Bills, 2.454%, Due 4/25/2019 | 6.0 | |||||||
| Republic of South Africa Government International Bond, 6.875%, Due 5/27/2019 | 2.3 | |||||||
| Republic of South Africa Government International Bond, 5.500%, Due 3/9/2020 | 1.8 | |||||||
| Argentine Republic Government International Bond, 6.875%, Due 4/22/2021 | 1.4 | |||||||
| U.S. Treasury Bills, 2.466%, Due 5/16/2019 | 1.3 | |||||||
| Petroleos Mexicanos, 6.000%, Due 3/5/2020 | 1.3 | |||||||
| Total Fund Holdings | 12 | |||||||
8
American Beacon GLG Total Return FundSM
Performance Overview
January 31, 2019 (Unaudited)
| Fund | 1 | |||||||
| Sector Exposures (%) | Long/(Short) | |||||||
| Foreign Sovereign | 7.7 | |||||||
Argentina | 1.4 | |||||||
South Africa | 4.1 | |||||||
Indonesia | 1.1 | |||||||
Brazil | 0.2 | |||||||
Columbia | 0.9 | |||||||
| Foreign Corporate Obligations | 3.5 | |||||||
Energy | 2.4 | |||||||
Financial | 1.1 | |||||||
| Cash & Cash Equivalent | 85.4 | |||||||
| U.S. dollar denominated. | ||||||||
| 1 | Percentages represent the Fund’s risk-based, notional exposure as a percentage of the Fund’s total net assets. This table does not include derivative instruments in the sector analysis. |
| Country Allocation (% Investments) |
| |||
| United States | 88.4 | |||
| South Africa | 4.3 | |||
| Argentina | 1.4 | |||
| Mexico | 1.3 | |||
| British Virgin Islands | 1.2 | |||
| Indonesia | 1.2 | |||
| India | 1.1 | |||
| Colombia | 0.9 | |||
| Brazil | 0.2 | |||
9
Expense Examples
January 31, 2019 (Unaudited)
Fund Expense Example
As a shareholder of a Fund, you incur two types of costs: (1) transaction costs, including sales charges (loads) on purchase payments and redemption fees, if applicable, and (2) ongoing costs, including management fees, distribution(12b-1) fees,sub-transfer agent fees, and other Fund expenses. The Examples are intended to help you understand the ongoing cost (in dollars) of investing in the Fund and to compare these costs with the ongoing costs of investing in other mutual funds. The Examples are based on an investment of $1,000 invested at the beginning of the period in each Class and held for the entire period from August 1, 2018 through January 31, 2019.
Actual Expenses
The “Actual” lines of the tables provide information about actual account values and actual expenses. You may use the information on this page, together with the amount you invested, to estimate the expenses that you paid over the period. Simply divide your account value by $1,000 (for example, an $8,600 account value divided by $1,000 = $8.60), then multiply the result by the “Expenses Paid During Period” to estimate the expenses you paid on your account during this period. Shareholders of the Investor and Institutional Classes that invest in the Fund through an IRA or Roth IRA may be subject to a custodial IRA fee of $15 that is typically deducted each December. If your account was subject to a custodial IRA fee during the period, your costs would have been $15 higher.
Hypothetical Example for Comparison Purposes
The “Hypothetical” lines of the tables provide information about hypothetical account values and hypothetical expenses based on the Fund’s actual expense ratio and an assumed 5% per year rate of return before expenses (not the Fund’s actual return). You may compare the ongoing costs of investing in the Fund with other funds by contrasting this 5% hypothetical example and the 5% hypothetical examples that appear in the shareholder reports of the other funds. The hypothetical account values and expenses may not be used to estimate the actual ending account balance or expenses you paid for the period. Shareholders of the Investor and Institutional Classes that invest in the Funds through an IRA or Roth IRA may be subject to a custodial IRA fee of $15 that is typically deducted each December. If your account was subject to a custodial IRA fee during the period, your costs would have been $15 higher.
You should also be aware that the expenses shown in the table highlight only your ongoing costs and do not reflect any transaction costs charged by the Fund, such as sales charges (loads) or redemption fees, as applicable. Similarly, the expense examples for other funds do not reflect any transaction costs charged by those funds, such as sales charges (loads), redemption fees or exchange fees. Therefore, the “Hypothetical” lines of the tables are useful in comparing ongoing costs only and will not help you determine the relative total costs of owning different funds. If you were subject to any transaction costs during the period, your costs would have been higher.
10
American Beacon FundsSM
Expense Examples
January 31, 2019 (Unaudited)
| American Beacon Frontier Markets Income Fund |
| ||||||||||||||
| Beginning Account Value 8/1/2018 | Ending Account Value 1/31/2019 | Expenses Paid During Period 8/1/2018-1/31/2019* | |||||||||||||
| Institutional Class | |||||||||||||||
| Actual | $1,000.00 | $1,000.30 | $6.20 | ||||||||||||
| Hypothetical** | $1,000.00 | $1,019.01 | $6.26 | ||||||||||||
| Y Class | |||||||||||||||
| Actual | $1,000.00 | $998.70 | $6.85 | ||||||||||||
| Hypothetical** | $1,000.00 | $1,018.35 | $6.92 | ||||||||||||
| Investor Class | |||||||||||||||
| Actual | $1,000.00 | $997.60 | $8.71 | ||||||||||||
| Hypothetical** | $1,000.00 | $1,016.48 | $8.79 | ||||||||||||
| A Class | |||||||||||||||
| Actual | $1,000.00 | $997.10 | $9.56 | ||||||||||||
| Hypothetical** | $1,000.00 | $1,015.63 | $9.65 | ||||||||||||
| C Class | |||||||||||||||
| Actual | $1,000.00 | $993.80 | $12.21 | ||||||||||||
| Hypothetical** | $1,000.00 | $1,012.96 | $12.33 | ||||||||||||
| * | Expenses are equal to the Fund’s annualized expense ratios for thesix-month period of 1.23%, 1.36%, 1.73%, 1.90%, and 2.43% for the Institutional, Y, Investor, A, and C Classes, respectively, multiplied by the average account value over the period, multiplied by the number derived by dividing the number of days in the most recent fiscal half-year (184) by days in the year (365) to reflect the half-year period. |
| ** | 5% return before expenses. |
| American Beacon GLG Total Return Fund |
| ||||||||||||||
| Beginning Account Value 8/1/2018 | Ending Account Value 1/31/2019 | Expenses Paid During Period 8/1/2018-1/31/2019* | |||||||||||||
| Institutional Class | |||||||||||||||
| Actual | $1,000.00 | $973.20 | $5.27 | ||||||||||||
| Hypothetical** | $1,000.00 | $1,019.86 | $5.40 | ||||||||||||
| Y Class | |||||||||||||||
| Actual | $1,000.00 | $972.00 | $5.77 | ||||||||||||
| Hypothetical** | $1,000.00 | $1,019.36 | $5.90 | ||||||||||||
| Investor Class | |||||||||||||||
| Actual | $1,000.00 | $970.70 | $7.15 | ||||||||||||
| Hypothetical** | $1,000.00 | $1,017.95 | $7.32 | ||||||||||||
| A Class | |||||||||||||||
| Actual | $1,000.00 | $969.80 | $7.25 | ||||||||||||
| Hypothetical** | $1,000.00 | $1,017.85 | $7.43 | ||||||||||||
| C Class | |||||||||||||||
| Actual | $1,000.00 | $967.00 | $10.96 | ||||||||||||
| Hypothetical** | $1,000.00 | $1,014.07 | $11.22 | ||||||||||||
| Ultra Class | |||||||||||||||
| Actual | $1,000.00 | $973.20 | $4.77 | ||||||||||||
| Hypothetical** | $1,000.00 | $1,020.37 | $4.89 | ||||||||||||
| * | Expenses are equal to the Fund’s annualized expense ratios for thesix-month period of 1.06%, 1.16%, 1.44%, 1.46%, 2.21%, and 0.96% for the Institutional, Y, Investor, A, C, and Ultra Classes, respectively, multiplied by the average account value over the period, multiplied by the number derived by dividing the number of days in the most recent fiscal half-year (184) by days in the year (365) to reflect the half-year period. |
| ** | 5% return before expenses. |
11
Report of Independent Registered Public Accounting Firm
Tothe Board of Trustees of American Beacon Funds and Shareholders of American Beacon Frontier Markets Income Fund and American Beacon GLG Total Return Fund
Opinion on the Financial Statements
We have audited the accompanying statements of assets and liabilities, including the schedules of investments, of American Beacon Frontier Markets Income Fund and American Beacon GLG Total Return Fund (two of the series constituting American Beacon Funds, referred to hereafter as the “Funds”) as of January 31, 2019, the related statements of operations for the year ended January 31, 2019, the statements of changes in net assets for each of the two years in the period ended January 31, 2019, including the related notes,and the financial highlights for each of the periods listed in the table below (collectively referred to as the “financial statements”). In our opinion, the financial statements present fairly, in all material respects, the financial position of the Funds as of January 31, 2019, the results of their operations for the year then ended, the changes in their net assets for each of the two years in the period ended January 31, 2019 and each of the financial highlights for each of the periods listed in the table below in conformity with accounting principles generally accepted in the United States of America.
Fund Name | Financial Highlights | |
| American Beacon Frontier Markets Income Fund | Each of the three years in the period ended January 31, 2019 | |
| American Beacon GLG Total Return Fund | Period May 20, 2016 (commencement of operations) through January 31, 2017 and the two years in the period ended January 31, 2019 | |
Basis for Opinions
These financial statements are the responsibility of the Funds’ management. Our responsibility is to express an opinion on the Funds’ financial statements based on our audits. We are a public accounting firm registered with the Public Company Accounting Oversight Board (United States) (PCAOB) and are required to be independent with respect to the Funds in accordance with the U.S. federal securities laws and the applicable rules and regulations of the Securities and Exchange Commission and the PCAOB.
We conducted our audits of these financial statements in accordance with the standards of the PCAOB. Those standards require that we plan and perform the audit to obtain reasonable assurance about whether the financial statements are free of material misstatement, whether due to error or fraud.
Our audits included performing procedures to assess the risks of material misstatement of the financial statements, whether due to error or fraud, and performing procedures that respond to those risks. Such procedures included examining, on a test basis, evidence regarding the amounts and disclosures in the financial statements. Our audits also included evaluating the accounting principles used and significant estimates made by management, as well as evaluating the overall presentation of the financial statements. Our procedures included confirmation of securities owned as of January 31, 2019 by correspondence with the custodian, transfer agent, and brokers; when replies were not received from brokers, we performed other auditing procedures. We believe that our audits provide a reasonable basis for our opinion.
With respect to the American Beacon Frontier Markets Income Fund, the financial statements as of and for the year ended January 31, 2016 and the financial highlights for each of the periods ended on or prior to January 31, 2016 (not presented herein, other than the financial highlights) were audited by other auditors whose report dated March 31, 2016 expressed an unqualified opinion on those financial statements and financial highlights.
PricewaterhouseCoopers LLP
Dallas, TX
March 27, 2019
We have served as the auditor of one or more investment companies in the American Beacon Funds since 2016.
12
American Beacon Frontier Markets Income FundSM
January 31, 2019
| Principal Amount* | Fair Value | ||||||||||||||
| Albania - 0.08% (Cost $223,523) | |||||||||||||||
| Foreign Sovereign Obligations - 0.08% | |||||||||||||||
Republic of Albania, 3.500%, Due 10/9/2025A | EUR | 194,000 | $ | 223,718 | |||||||||||
|
| ||||||||||||||
| Angola - 4.48% | |||||||||||||||
| Credit-Linked Notes - 0.34% | |||||||||||||||
Republic of Angola (Issuer Aurora Australis B.V.), 8.032%, Due 12/19/2023,(6-mo. USD LIBOR + 6.250%)B C | $ | 937,500 | 943,617 | ||||||||||||
|
| ||||||||||||||
| Foreign Sovereign Obligations - 4.14% | |||||||||||||||
Angolan Government International Bond, | |||||||||||||||
9.500%, Due 11/12/2025C | 4,950,000 | 5,519,121 | |||||||||||||
8.250%, Due 5/9/2028C | 4,730,000 | 4,870,765 | |||||||||||||
9.375%, Due 5/8/2048C | 985,000 | 1,038,407 | |||||||||||||
|
| ||||||||||||||
Total Foreign Sovereign Obligations | 11,428,293 | ||||||||||||||
|
| ||||||||||||||
Total Angola (Cost $11,874,757) | 12,371,910 | ||||||||||||||
|
| ||||||||||||||
| Argentina - 4.50% | |||||||||||||||
| Foreign Sovereign Obligations - 4.50% | |||||||||||||||
Argentina Bonar Bonds, | |||||||||||||||
49.137%, Due 3/11/2019, (BADLARP Index + 2.500%)B | ARS | 50,441,687 | 1,366,564 | ||||||||||||
48.797%, Due 3/1/2020, (BADLARP Index + 3.250%)B | ARS | 4,500,000 | 123,742 | ||||||||||||
47.686%, Due 4/3/2022, (BADLARP Index + 2.000%)B | ARS | 42,100,000 | 1,146,398 | ||||||||||||
Argentina POM Politica Monetaria, 56.472%, Due 6/21/2020, Series POMD | ARS | 22,800,000 | 671,831 | ||||||||||||
Argentina Treasury Bill, 38.30%, Due 6/28/2019, Series 0000G | ARS | 150,000,000 | 4,126,254 | ||||||||||||
Argentine Bonos del Tesoro, | |||||||||||||||
18.200%, Due 10/3/2021 | ARS | 11,600,000 | 254,740 | ||||||||||||
16.000%, Due 10/17/2023 | ARS | 16,250,000 | 386,713 | ||||||||||||
Argentine Republic Government International Bond, 6.875%, Due 1/11/2048 | 3,400,000 | 2,601,000 | |||||||||||||
Provincia de Buenos Aires, | |||||||||||||||
51.031%, Due 5/31/2022, (BADLARP Index + 3.830%)B | ARS | 35,000,000 | 901,882 | ||||||||||||
49.156%, Due 4/12/2025, (BADLARP Index + 3.750%)A B C | ARS | 33,000,000 | 837,092 | ||||||||||||
|
| ||||||||||||||
Total Foreign Sovereign Obligations | 12,416,216 | ||||||||||||||
|
| ||||||||||||||
Total Argentina (Cost $16,359,607) | 12,416,216 | ||||||||||||||
|
| ||||||||||||||
| Armenia - 0.08% (Cost $211,675) | |||||||||||||||
| Credit-Linked Notes - 0.08% | |||||||||||||||
Republic of Armenia International Bond, 7.150%, Due 3/26/2025C | 200,000 | 216,283 | |||||||||||||
|
| ||||||||||||||
| Azerbaijan - 0.73% (Cost $2,000,000) | |||||||||||||||
| Credit-Linked Notes - 0.73% | |||||||||||||||
Republic of Azerbaijan (Issuer Frontera Capital B.V.), 14.000%, Due 3/30/2020, Series BA D | 2,000,000 | 2,012,591 | |||||||||||||
|
| ||||||||||||||
| Bahrain - 0.10% (Cost $253,753) | |||||||||||||||
| Foreign Corporate Obligations - 0.10% | |||||||||||||||
Oil and Gas Holding Co. BSCC, 7.625%, Due 11/7/2024A | 250,000 | 265,236 | |||||||||||||
|
| ||||||||||||||
| Bangladesh - 0.09% (Cost $251,971) | |||||||||||||||
| Foreign Corporate Obligations - 0.09% | |||||||||||||||
Banglalink Digital Communications Ltd., 8.625%, Due 5/6/2019C | 250,000 | 251,275 | |||||||||||||
|
| ||||||||||||||
| Belarus - 0.90% | |||||||||||||||
| Foreign Sovereign Obligations - 0.90% | |||||||||||||||
Republic of Belarus International Bond, | |||||||||||||||
6.875%, Due 2/28/2023C | 1,710,000 | 1,765,438 | |||||||||||||
7.625%, Due 6/29/2027C | 685,000 | 717,195 | |||||||||||||
|
| ||||||||||||||
Total Foreign Sovereign Obligations | 2,482,633 | ||||||||||||||
|
| ||||||||||||||
Total Belarus (Cost $2,460,950) | 2,482,633 | ||||||||||||||
|
| ||||||||||||||
See accompanying notes
13
American Beacon Frontier Markets Income FundSM
Schedule of Investments
January 31, 2019
| Principal Amount* | Fair Value | ||||||||||||||
| Belize - 0.17% (Cost $500,210) | |||||||||||||||
| Foreign Sovereign Obligations - 0.17% | |||||||||||||||
Belize Government International Bond, 4.938%, Due 2/20/2034C E | $ | 850,000 | $ | 471,750 | |||||||||||
|
| ||||||||||||||
| Bosnia & Herzegovina - 0.05% (Cost $160,992) | |||||||||||||||
| Foreign Sovereign Obligations - 0.05% | |||||||||||||||
Bosnia & Herzegovina Government International Bond, 0.500%, Due 12/20/2021, Series B,(6-mo. EUR LIBOR + 0.813%)B C F | EUR | 250,000 | 129,605 | ||||||||||||
|
| ||||||||||||||
| Cameroon, United Republic Of - 1.52% (Cost $4,205,431) | |||||||||||||||
| Foreign Sovereign Obligations - 1.52% | |||||||||||||||
Republic of Cameroon International Bond, 9.500%, Due 11/19/2025C | 3,930,000 | 4,203,528 | |||||||||||||
|
| ||||||||||||||
| Canada - 0.07% (Cost $195,266) | |||||||||||||||
| Foreign Corporate Obligations - 0.07% | |||||||||||||||
First Quantum Minerals Ltd., 7.250%, Due 5/15/2022C | 200,000 | 197,000 | |||||||||||||
|
| ||||||||||||||
| Costa Rica - 2.36% | |||||||||||||||
| Foreign Corporate Obligations - 0.09% | |||||||||||||||
Autopistas del Sol S.A., 7.375%, Due 12/30/2030C | 275,370 | 254,028 | |||||||||||||
|
| ||||||||||||||
| Foreign Sovereign Obligations - 2.27% | |||||||||||||||
Costa Rica Government International Bond, | |||||||||||||||
4.250%, Due 1/26/2023C | 280,000 | 258,300 | |||||||||||||
8.050%, Due 9/18/2024C | CRC | 950,000,000 | 1,368,256 | ||||||||||||
9.660%, Due 9/30/2026C | CRC | 2,250,000,000 | 3,525,140 | ||||||||||||
10.580%, Due 9/26/2029C | CRC | 800,000,000 | 1,126,297 | ||||||||||||
|
| ||||||||||||||
Total Foreign Sovereign Obligations | 6,277,993 | ||||||||||||||
|
| ||||||||||||||
Total Costa Rica (Cost $7,523,864) | 6,532,021 | ||||||||||||||
|
| ||||||||||||||
| Dominican Republic - 3.12% | |||||||||||||||
| Foreign Sovereign Obligations - 3.12% | |||||||||||||||
Dominican Republic Bond, 10.500%, Due 4/7/2023C | DOP | 57,000,000 | 1,132,338 | ||||||||||||
Dominican Republic International Bond, | |||||||||||||||
8.900%, Due 2/15/2023C | DOP | 173,000,000 | 3,310,852 | ||||||||||||
11.500%, Due 5/10/2024C | DOP | 200,000,000 | 4,173,418 | ||||||||||||
|
| ||||||||||||||
Total Foreign Sovereign Obligations | 8,616,608 | ||||||||||||||
|
| ||||||||||||||
Total Dominican Republic (Cost $9,377,791) | 8,616,608 | ||||||||||||||
|
| ||||||||||||||
| Ecuador - 2.64% | |||||||||||||||
| Foreign Sovereign Obligations - 2.64% | |||||||||||||||
Ecuador Government International Bond, | |||||||||||||||
10.500%, Due 3/24/2020C | 700,000 | 728,490 | |||||||||||||
10.500%, Due 3/24/2020C | 830,000 | 863,781 | |||||||||||||
10.750%, Due 3/28/2022C | 470,000 | 496,649 | |||||||||||||
8.750%, Due 6/2/2023C | 660,000 | 653,862 | |||||||||||||
7.950%, Due 6/20/2024C | 1,000,000 | 947,700 | |||||||||||||
9.650%, Due 12/13/2026C | 1,550,000 | 1,515,435 | |||||||||||||
9.625%, Due 6/2/2027C | 500,000 | 486,850 | |||||||||||||
8.875%, Due 10/23/2027C | 1,200,000 | 1,120,440 | |||||||||||||
10.750%, Due 1/31/2029, Series 144AA | 400,000 | 408,120 | |||||||||||||
EP PetroEcuador via Noble Sovereign Funding I Ltd., 8.443%, Due 9/24/2019,(3-mo. USD LIBOR + 5.630%)B C | 78,947 | 78,908 | |||||||||||||
|
| ||||||||||||||
Total Foreign Sovereign Obligations | 7,300,235 | ||||||||||||||
|
| ||||||||||||||
Total Ecuador (Cost $7,581,357) | 7,300,235 | ||||||||||||||
|
| ||||||||||||||
See accompanying notes
14
American Beacon Frontier Markets Income FundSM
Schedule of Investments
January 31, 2019
| Principal Amount* | Fair Value | ||||||||||||||
| Egypt - 4.37% | |||||||||||||||
| Foreign Sovereign Obligations - 4.37% | |||||||||||||||
Egypt Government Bond, | |||||||||||||||
17.180%, Due 5/9/2027, Series 10YR | EGP | 14,500,000 | $ | 791,128 | |||||||||||
15.700%, Due 11/7/2027, Series 10YR | EGP | 10,000,000 | 509,042 | ||||||||||||
Egypt Treasury Bills, | |||||||||||||||
16.480%, Due 3/5/2019, Series 364D | EGP | 20,000,000 | 1,116,331 | ||||||||||||
19.700%, Due 4/2/2019, Series 364D | EGP | 31,000,000 | 1,706,908 | ||||||||||||
19.501%, Due 4/30/2019, Series 364D | EGP | 23,000,000 | 1,248,844 | ||||||||||||
19.400%, Due 12/10/2019, Series 364D | EGP | 58,000,000 | 2,844,421 | ||||||||||||
17.951%, Due 1/21/2020, Series 364D | EGP | 80,000,000 | 3,854,367 | ||||||||||||
|
| ||||||||||||||
Total Foreign Sovereign Obligations | 12,071,041 | ||||||||||||||
|
| ||||||||||||||
Total Egypt (Cost $11,902,016) | 12,071,041 | ||||||||||||||
|
| ||||||||||||||
| El Salvador - 0.37% | |||||||||||||||
| Foreign Sovereign Obligations - 0.37% | |||||||||||||||
El Salvador Government International Bond, | |||||||||||||||
5.875%, Due 1/30/2025C | $ | 750,000 | 713,685 | ||||||||||||
6.375%, Due 1/18/2027C | 320,000 | 305,200 | |||||||||||||
|
| ||||||||||||||
Total Foreign Sovereign Obligations | 1,018,885 | ||||||||||||||
|
| ||||||||||||||
Total El Salvador (Cost $1,002,970) | 1,018,885 | ||||||||||||||
|
| ||||||||||||||
| Ethiopia - 0.91% (Cost $2,480,809) | |||||||||||||||
| Foreign Sovereign Obligations - 0.91% | |||||||||||||||
Ethiopia International Bond, 6.625%, Due 12/11/2024C | 2,500,000 | 2,514,600 | |||||||||||||
|
| ||||||||||||||
| Gabon - 1.14% | |||||||||||||||
| Foreign Sovereign Obligations - 1.14% | |||||||||||||||
Gabon Government International Bond, | |||||||||||||||
6.375%, Due 12/12/2024C | 2,380,000 | 2,274,328 | |||||||||||||
6.950%, Due 6/16/2025C | 900,000 | 864,000 | |||||||||||||
|
| ||||||||||||||
Total Foreign Sovereign Obligations | 3,138,328 | ||||||||||||||
|
| ||||||||||||||
Total Gabon (Cost $3,167,675) | 3,138,328 | ||||||||||||||
|
| ||||||||||||||
| Gambia - 0.25% (Cost $686,633) | |||||||||||||||
| Credit-Linked Notes - 0.25% | |||||||||||||||
Republic of Gambia (Zambezi B.V.), 11.180%, Due 9/11/2020A D | 686,701 | 678,324 | |||||||||||||
|
| ||||||||||||||
| Georgia - 1.07% | |||||||||||||||
| Credit-Linked Notes - 0.89% | |||||||||||||||
Georgia Government (Issuer Frontera Capital B.V.), 10.000%, Due 8/4/2021C D | 513,100 | 575,957 | |||||||||||||
Georgia Government (Issuer Zambezi B.V.), 9.500%, Due 8/9/2022A | 2,000,000 | 1,891,094 | |||||||||||||
|
| ||||||||||||||
Total Credit-Linked Notes | 2,467,051 | ||||||||||||||
|
| ||||||||||||||
| Foreign Corporate Obligations - 0.18% | |||||||||||||||
Bank of Georgia JSC, 11.000%, Due 6/1/2020C | GEL | 1,300,000 | 489,642 | ||||||||||||
|
| ||||||||||||||
Total Georgia (Cost $2,996,339) | 2,956,693 | ||||||||||||||
|
| ||||||||||||||
| Ghana - 4.58% | |||||||||||||||
| Credit-Linked Notes - 0.09% | |||||||||||||||
Ghana Promissory Notes (Issuer Saderea DAC), 12.500%, Due 11/30/2026C | 234,045 | 251,598 | |||||||||||||
|
| ||||||||||||||
| Foreign Sovereign Obligations - 4.49% | |||||||||||||||
Ghana Government Bond, | |||||||||||||||
16.500%, Due 3/22/2021, Series 3Y | GHS | 20,900,000 | 3,988,272 | ||||||||||||
24.750%, Due 7/19/2021, Series 5YR | GHS | 5,300,000 | 1,168,363 | ||||||||||||
18.750%, Due 1/24/2022, Series 5YR | GHS | 2,000,000 | 395,180 | ||||||||||||
18.250%, Due 7/25/2022, Series 5Y | GHS | 11,225,000 | 2,174,771 | ||||||||||||
16.500%, Due 2/6/2023, Series 5Y | GHS | 8,200,000 | 1,488,603 | ||||||||||||
19.000%, Due 11/2/2026, Series 10Y | GHS | 15,875,000 | 2,962,088 | ||||||||||||
Ghana Government International Bond, 10.750%, Due 10/14/2030C | 200,000 | 235,100 | |||||||||||||
|
| ||||||||||||||
Total Foreign Sovereign Obligations | 12,412,377 | ||||||||||||||
|
| ||||||||||||||
Total Ghana (Cost $14,630,267) | 12,663,975 | ||||||||||||||
|
| ||||||||||||||
See accompanying notes
15
American Beacon Frontier Markets Income FundSM
Schedule of Investments
January 31, 2019
| Principal Amount* | Fair Value | ||||||||||||||
| Honduras - 0.09% (Cost $247,128) | |||||||||||||||
| Foreign Corporate Obligations - 0.09% | |||||||||||||||
Inversiones Atlantida S.A., 8.250%, Due 7/28/2022C | $ | 240,000 | $ | 243,600 | |||||||||||
|
| ||||||||||||||
| Iraq - 2.94% | |||||||||||||||
| Foreign Sovereign Obligations - 2.94% | |||||||||||||||
Iraq International Bond, | |||||||||||||||
6.752%, Due 3/9/2023C | 3,080,000 | 3,070,637 | |||||||||||||
5.800%, Due 1/15/2028C | 1,750,000 | 1,654,607 | |||||||||||||
5.800%, Due 1/15/2028C | 3,600,000 | 3,403,764 | |||||||||||||
|
| ||||||||||||||
Total Foreign Sovereign Obligations | 8,129,008 | ||||||||||||||
|
| ||||||||||||||
Total Iraq (Cost $7,786,349) | 8,129,008 | ||||||||||||||
|
| ||||||||||||||
| Ivory Coast - 3.72% | |||||||||||||||
| Foreign Sovereign Obligations - 3.72% | |||||||||||||||
Ivory Coast Government International Bond, | |||||||||||||||
6.375%, Due 3/3/2028C | 390,000 | 372,949 | |||||||||||||
5.250%, Due 3/22/2030C | EUR | 2,140,000 | 2,268,723 | ||||||||||||
5.750%, Due 12/31/2032C E | 4,543,100 | 4,184,286 | |||||||||||||
5.750%, Due 12/31/2032C E | 3,755,750 | 3,459,121 | |||||||||||||
|
| ||||||||||||||
Total Foreign Sovereign Obligations | 10,285,079 | ||||||||||||||
|
| ||||||||||||||
Total Ivory Coast (Cost $10,981,414) | 10,285,079 | ||||||||||||||
|
| ||||||||||||||
| Jamaica - 0.04% | |||||||||||||||
| Foreign Corporate Obligations - 0.04% | |||||||||||||||
Digicel Group One Ltd., 8.250%, Due 12/30/2022A | 73,000 | 60,225 | |||||||||||||
Digicel Group Two Ltd., 8.250%, Due 9/30/2022A | 130,000 | 69,550 | |||||||||||||
|
| ||||||||||||||
Total Foreign Corporate Obligations | 129,775 | ||||||||||||||
|
| ||||||||||||||
Total Jamaica (Cost $130,227) | 129,775 | ||||||||||||||
|
| ||||||||||||||
| Kazakhstan - 1.01% | |||||||||||||||
| Credit-Linked Notes - 1.01% | |||||||||||||||
Development Bank of Kazakhstan JSC, 8.950%, Due 5/4/2023C | KZT | 206,250,000 | 466,371 | ||||||||||||
National Bank of Kazakhstan (Issuer Citigroup Global Markets Holdings, Inc.), | |||||||||||||||
0.000%, Due 2/8/2019C G | KZT | 124,000,000 | 325,022 | ||||||||||||
0.000%, Due 3/15/2019C G | KZT | 520,000,000 | 1,350,716 | ||||||||||||
National Bank of Kazakhstan (Issuer ICBC Standard Bank PLC), 0.000%, Due 2/8/2019C G | KZT | 250,000,000 | 649,467 | ||||||||||||
|
| ||||||||||||||
Total Credit-Linked Notes | 2,791,576 | ||||||||||||||
|
| ||||||||||||||
Total Kazakhstan (Cost $3,349,334) | 2,791,576 | ||||||||||||||
|
| ||||||||||||||
| Kenya - 4.28% | |||||||||||||||
| Foreign Sovereign Obligations - 4.28% | |||||||||||||||
Kenya Government International Bond, 6.875%, Due 6/24/2024C | 630,000 | 628,677 | |||||||||||||
Kenya Infrastructure Bond, | |||||||||||||||
12.000%, Due 9/18/2023, Series 12YR | KES | 57,400,000 | 585,830 | ||||||||||||
11.000%, Due 12/2/2024, Series 9YR | KES | 75,000,000 | 728,354 | ||||||||||||
12.500%, Due 5/12/2025, Series 9YR | KES | 36,000,000 | 368,958 | ||||||||||||
11.000%, Due 10/12/2026, Series 12YR | KES | 74,650,000 | 718,814 | ||||||||||||
12.000%, Due 10/6/2031, Series 15YR | KES | 288,000,000 | 2,925,229 | ||||||||||||
12.500%, Due 1/10/2033, Series 15YR | KES | 571,000,000 | 5,865,699 | ||||||||||||
|
| ||||||||||||||
Total Foreign Sovereign Obligations | 11,821,561 | ||||||||||||||
|
| ||||||||||||||
Total Kenya (Cost $11,445,236) | 11,821,561 | ||||||||||||||
|
| ||||||||||||||
See accompanying notes
16
American Beacon Frontier Markets Income FundSM
Schedule of Investments
January 31, 2019
| Principal Amount* | Fair Value | ||||||||||||||
| Kyrgyzstan - 1.51% | |||||||||||||||
| Credit-Linked Notes - 1.51% | |||||||||||||||
Kyrgyz Republic (Issuer Frontera Capital B.V.), 8.000%, Due 1/31/2020A | KGS | 132,958,171 | $ | 1,979,970 | |||||||||||
Kyrgyz Republic (Issuer Zambezi B.V.), 13.980%, Due 4/10/2028A | KGS | 180,000,000 | 2,200,634 | ||||||||||||
|
| ||||||||||||||
Total Credit-Linked Notes | 4,180,604 | ||||||||||||||
|
| ||||||||||||||
Total Kyrgyzstan (Cost $4,336,065) | 4,180,604 | ||||||||||||||
|
| ||||||||||||||
| Lebanon - 0.12% | |||||||||||||||
| Foreign Sovereign Obligations - 0.12% | |||||||||||||||
Lebanon Government International Bond, | |||||||||||||||
5.500%, Due 4/23/2019, Series GMTN | $ | 200,000 | 197,900 | ||||||||||||
6.100%, Due 10/4/2022, Series EMTNC | 140,000 | 121,708 | |||||||||||||
|
| ||||||||||||||
Total Foreign Sovereign Obligations | 319,608 | ||||||||||||||
|
| ||||||||||||||
Total Lebanon (Cost $321,012) | 319,608 | ||||||||||||||
|
| ||||||||||||||
| Luxembourg - 0.09% (Cost $254,714) | |||||||||||||||
| Foreign Corporate Obligations - 0.09% | |||||||||||||||
Kernel Holding S.A., 8.750%, Due 1/31/2022C | 250,000 | 247,550 | |||||||||||||
|
| ||||||||||||||
| Malawi - 0.39% (Cost $1,098,142) | |||||||||||||||
| Credit-Linked Notes - 0.39% | |||||||||||||||
Republic of Malawi (Issuer Zambezi B.V.), 12.000%, Due 10/8/2020A | 1,100,000 | 1,087,403 | |||||||||||||
|
| ||||||||||||||
| Mauritius - 0.19% (Cost $515,722) | |||||||||||||||
| Foreign Corporate Obligations - 0.19% | |||||||||||||||
HTA Group Ltd., 9.125%, Due 3/8/2022C | 500,000 | 515,100 | |||||||||||||
|
| ||||||||||||||
| Mongolia - 2.21% | |||||||||||||||
| Foreign Sovereign Obligations - 2.21% | |||||||||||||||
Development Bank of Mongolia LLC, | |||||||||||||||
7.250%, Due 10/23/2023A | 200,000 | 200,100 | |||||||||||||
7.250%, Due 10/23/2023C | 725,000 | 725,363 | |||||||||||||
Mongolia Government International Bond, | |||||||||||||||
8.750%, Due 3/9/2024C | 3,900,000 | 4,273,175 | |||||||||||||
8.750%, Due 3/9/2024C | 600,000 | 657,412 | |||||||||||||
Trade & Development Bank of Mongolia LLC, 9.375%, Due 5/19/2020C | 240,000 | 249,890 | |||||||||||||
|
| ||||||||||||||
Total Foreign Sovereign Obligations | 6,105,940 | ||||||||||||||
|
| ||||||||||||||
Total Mongolia (Cost $6,129,548) | 6,105,940 | ||||||||||||||
|
| ||||||||||||||
| Mozambique - 2.16% | |||||||||||||||
| Credit-Linked Notes - 1.53% | |||||||||||||||
Mozambique Government Bonds (Issuer ICBC Standard Bank PLC), | |||||||||||||||
1.000%, Due 4/23/2019D | MZN | 20,100,000 | 87,827 | ||||||||||||
27.000%, Due 2/26/2020 | MZN | 180,000,000 | 2,686,554 | ||||||||||||
Republic of Mozambique (Issuer ICBC Standard Bank PLC), 19.000%, Due 3/28/2021A C D | MZN | 90,500,000 | 1,441,146 | ||||||||||||
|
| ||||||||||||||
Total Credit-Linked Notes | 4,215,527 | ||||||||||||||
|
| ||||||||||||||
| Foreign Sovereign Obligations - 0.63% | |||||||||||||||
Mozambique International Bond, 10.500%, Due 1/18/2023C | 1,900,000 | 1,748,304 | |||||||||||||
|
| ||||||||||||||
Total Mozambique (Cost $6,270,170) | 5,963,831 | ||||||||||||||
|
| ||||||||||||||
| Netherlands - 1.69% | |||||||||||||||
| Foreign Corporate Obligations - 0.31% | |||||||||||||||
Frontera Capital B.V., 8.000%, Due 5/26/2025 | KGS | 70,000,000 | 867,629 | ||||||||||||
|
| ||||||||||||||
See accompanying notes
17
American Beacon Frontier Markets Income FundSM
Schedule of Investments
January 31, 2019
| Principal Amount* | Fair Value | ||||||||||||||
| Netherlands - 1.69% (continued) | |||||||||||||||
| Foreign Sovereign Obligations - 1.38% | |||||||||||||||
Nederlandse Financierings Maatschappij voor Ontwikkelingslanden N.V., | |||||||||||||||
7.350%, Due 9/11/2020, Series EMTNC | $ | 650,000 | $ | 609,175 | |||||||||||
0.000%, Due 4/6/2021, Series EMTND G | 3,500,000 | 3,194,081 | |||||||||||||
|
| ||||||||||||||
Total Foreign Sovereign Obligations | 3,803,256 | ||||||||||||||
|
| ||||||||||||||
Total Netherlands (Cost $5,034,950) | 4,670,885 | ||||||||||||||
|
| ||||||||||||||
| Nicaragua - 1.63% | |||||||||||||||
| Credit-Linked Notes - 1.58% | |||||||||||||||
Empresa Administadora de Aeropuertos Internacionales (Issuer Zambezi B.V.), 7.000%, Due 4/8/2024A D | 2,000,000 | 1,892,367 | |||||||||||||
Republic of Nicaragua (Issuer Zambezi B.V.), 6.750%, Due 8/5/2022A | 2,400,000 | 2,471,302 | |||||||||||||
|
| ||||||||||||||
Total Credit-Linked Notes | 4,363,669 | ||||||||||||||
|
| ||||||||||||||
| Foreign Sovereign Obligations - 0.05% | |||||||||||||||
Nicaragua Government International Bond, 5.000%, Due 2/1/2019E | 138,770 | 133,219 | |||||||||||||
|
| ||||||||||||||
Total Nicaragua (Cost $4,538,454) | 4,496,888 | ||||||||||||||
|
| ||||||||||||||
| Nigeria - 4.69% | |||||||||||||||
| Foreign Corporate Obligations - 0.18% | |||||||||||||||
IHS Netherlands Holdco B.V., 9.500%, Due 10/27/2021C | 250,000 | 257,416 | |||||||||||||
SEPLAT Petroleum Development Co. PLC, 9.250%, Due 4/1/2023C | 250,000 | 255,000 | |||||||||||||
|
| ||||||||||||||
Total Foreign Corporate Obligations | 512,416 | ||||||||||||||
|
| ||||||||||||||
| Foreign Sovereign Obligations - 4.51% | |||||||||||||||
Nigeria Government Bond, | |||||||||||||||
15.540%, Due 2/13/2020, Series 5YR | NGN | 310,000,000 | 857,210 | ||||||||||||
14.500%, Due 7/15/2021, Series 5YR | NGN | 839,000,000 | 2,273,644 | ||||||||||||
12.500%, Due 1/22/2026, Series 10YR | NGN | 103,000,000 | 251,752 | ||||||||||||
16.288%, Due 3/17/2027, Series 10YR | NGN | 1,610,700,000 | 4,673,700 | ||||||||||||
13.980%, Due 2/23/2028, Series 10YR | NGN | 560,000,000 | 1,441,613 | ||||||||||||
16.250%, Due 4/18/2037, Series 20YR | NGN | 888,958,000 | 2,629,548 | ||||||||||||
Nigeria Treasury Bills, 13.245%, Due 3/21/2019 | NGN | 120,000,000 | 327,258 | ||||||||||||
|
| ||||||||||||||
Total Foreign Sovereign Obligations | 12,454,725 | ||||||||||||||
|
| ||||||||||||||
Total Nigeria (Cost $13,540,791) | 12,967,141 | ||||||||||||||
|
| ||||||||||||||
| Pakistan - 0.18% (Cost $467,182) | |||||||||||||||
| Foreign Sovereign Obligations - 0.18% | |||||||||||||||
Pakistan Government International Bond, 6.875%, Due 12/5/2027C | 510,000 | 497,352 | |||||||||||||
|
| ||||||||||||||
| Papua New Guinea - 0.92% | |||||||||||||||
| Foreign Sovereign Obligations - 0.92% | |||||||||||||||
Papua New Guinea Government International Bond, | |||||||||||||||
8.375%, Due 10/4/2028C | 1,866,000 | 1,996,620 | |||||||||||||
8.375%, Due 10/4/2028A | 500,000 | 535,000 | |||||||||||||
|
| ||||||||||||||
Total Foreign Sovereign Obligations | 2,531,620 | ||||||||||||||
|
| ||||||||||||||
Total Papua New Guinea (Cost $2,378,287) | 2,531,620 | ||||||||||||||
|
| ||||||||||||||
| Paraguay - 0.66% (Cost $2,000,443) | |||||||||||||||
| Credit-Linked Notes - 0.66% | |||||||||||||||
Municipalidad De Asuncion (Issuer Zambezi B.V.), 11.000%, Due 3/23/2027A | 2,000,000 | 1,794,846 | |||||||||||||
|
| ||||||||||||||
| Rwanda - 0.27% (Cost $749,616) | |||||||||||||||
| Foreign Sovereign Obligations - 0.27% | |||||||||||||||
Rwanda International Government Bond, 6.625%, Due 5/2/2023C | 740,000 | 747,023 | |||||||||||||
|
| ||||||||||||||
See accompanying notes
18
American Beacon Frontier Markets Income FundSM
Schedule of Investments
January 31, 2019
| Principal Amount* | Fair Value | ||||||||||||||
| Senegal - 2.57% | |||||||||||||||
| Foreign Sovereign Obligations - 2.57% | |||||||||||||||
Senegal Government International Bond, | |||||||||||||||
6.250%, Due 7/30/2024C | $ | 1,730,000 | $ | 1,755,120 | |||||||||||
4.750%, Due 3/13/2028C | EUR | 2,230,000 | 2,441,680 | ||||||||||||
6.250%, Due 5/23/2033C | 400,000 | 370,795 | |||||||||||||
6.750%, Due 3/13/2048C | 2,860,000 | 2,543,272 | |||||||||||||
|
| ||||||||||||||
Total Foreign Sovereign Obligations | 7,110,867 | ||||||||||||||
|
| ||||||||||||||
Total Senegal (Cost $7,664,966) | 7,110,867 | ||||||||||||||
|
| ||||||||||||||
| Sri Lanka - 3.74% | |||||||||||||||
| Foreign Sovereign Obligations - 3.74% | |||||||||||||||
Sri Lanka Government Bonds, | |||||||||||||||
9.250%, Due 5/1/2020 | LKR | 30,000,000 | 165,297 | ||||||||||||
10.750%, Due 3/1/2021, Series A | LKR | 26,000,000 | 145,716 | ||||||||||||
9.000%, Due 5/1/2021, Series A | LKR | 465,000,000 | 2,510,646 | ||||||||||||
11.000%, Due 8/1/2021, Series A | LKR | 420,000,000 | 2,361,017 | ||||||||||||
11.500%, Due 5/15/2023, Series A | LKR | 180,000,000 | 1,016,083 | ||||||||||||
10.200%, Due 7/15/2023, Series A | LKR | 60,000,000 | 324,620 | ||||||||||||
11.400%, Due 1/1/2024, Series A | LKR | 200,000,000 | 1,120,664 | ||||||||||||
11.000%, Due 8/1/2024, Series A | LKR | 315,000,000 | 1,745,408 | ||||||||||||
11.500%, Due 9/1/2028 | LKR | 168,000,000 | 935,040 | ||||||||||||
|
| ||||||||||||||
Total Foreign Sovereign Obligations | 10,324,491 | ||||||||||||||
|
| ||||||||||||||
Total Sri Lanka (Cost $12,228,950) | 10,324,491 | ||||||||||||||
|
| ||||||||||||||
| Supranational - 2.64% | |||||||||||||||
| Foreign Sovereign Obligations - 2.64% | |||||||||||||||
European Bank for Reconstruction & Development, | |||||||||||||||
13.750%, Due 10/9/2019C | 571,429 | 432,760 | |||||||||||||
9.800%, Due 3/16/2020C | 700,000 | 630,409 | |||||||||||||
9.500%, Due 6/21/2021C | 500,000 | 458,255 | |||||||||||||
International Bank for Reconstruction & Development, 9.500%, Due 10/19/2020 | KZT | 750,000,000 | 1,950,626 | ||||||||||||
International Finance Corp., 9.500%, Due 5/31/2020 | UZS | 32,000,000,000 | 3,785,454 | ||||||||||||
|
| ||||||||||||||
Total Foreign Sovereign Obligations | 7,257,504 | ||||||||||||||
|
| ||||||||||||||
Total Supranational (Cost $7,748,004) | 7,257,504 | ||||||||||||||
|
| ||||||||||||||
| Suriname - 0.55% (Cost $1,616,016) | |||||||||||||||
| Foreign Sovereign Obligations - 0.55% | |||||||||||||||
Republic of Suriname, 9.250%, Due 10/26/2026C | 1,600,000 | 1,516,800 | |||||||||||||
|
| ||||||||||||||
| Tajikistan - 1.42% | |||||||||||||||
| Credit-Linked Notes - 0.36% | |||||||||||||||
Republic of Tajikistan (Issuer Frontera Capital BV), 10.780%, Due 2/5/2023A | 1,000,000 | 1,007,237 | |||||||||||||
|
| ||||||||||||||
Total Credit-Linked Notes | 1,007,237 | ||||||||||||||
|
| ||||||||||||||
| Foreign Sovereign Obligations - 1.06% | |||||||||||||||
Republic of Tajikistan International Bond, 7.125%, Due 9/14/2027C | 3,230,000 | 2,916,335 | |||||||||||||
|
| ||||||||||||||
Total Foreign Sovereign Obligations | 2,916,335 | ||||||||||||||
|
| ||||||||||||||
Total Tajikistan (Cost $4,201,446) | 3,923,572 | ||||||||||||||
|
| ||||||||||||||
| Tunisia - 0.90% | |||||||||||||||
| Foreign Sovereign Obligations - 0.90% | |||||||||||||||
Banque Centrale de Tunisie International Bond, | |||||||||||||||
6.750%, Due 10/31/2023, Series 144AA | EUR | 220,000 | 246,190 | ||||||||||||
5.750%, Due 1/30/2025C | 2,570,000 | 2,229,259 | |||||||||||||
|
| ||||||||||||||
Total Foreign Sovereign Obligations | 2,475,449 | ||||||||||||||
|
| ||||||||||||||
Total Tunisia (Cost $2,679,365) | 2,475,449 | ||||||||||||||
|
| ||||||||||||||
See accompanying notes
19
American Beacon Frontier Markets Income FundSM
Schedule of Investments
January 31, 2019
| Principal Amount* | Fair Value | ||||||||||||||
| Uganda - 3.05% | |||||||||||||||
| Foreign Sovereign Obligations - 3.05% | |||||||||||||||
Republic of Uganda Government Bonds, | |||||||||||||||
11.000%, Due 1/21/2021, Series 10YR | UGX | 2,800,000,000 | $ | 719,091 | |||||||||||
18.375%, Due 2/18/2021, Series 5YR | UGX | 1,000,000,000 | 289,922 | ||||||||||||
16.500%, Due 5/13/2021, Series 5YR | UGX | 4,355,000,000 | 1,222,832 | ||||||||||||
16.750%, Due 10/28/2021 | UGX | 6,940,000,000 | 1,951,742 | ||||||||||||
14.125%, Due 7/7/2022 | UGX | 8,300,000,000 | 2,158,677 | ||||||||||||
19.500%, Due 12/18/2025, Series 10YR | UGX | 4,000,000,000 | 1,234,316 | ||||||||||||
16.000%, Due 5/6/2027 | UGX | 2,500,000,000 | 669,431 | ||||||||||||
Republic of Uganda Government Bonds, 13.625%, Due 9/24/2019 | UGX | 723,000,000 | 198,269 | ||||||||||||
|
| ||||||||||||||
Total Foreign Sovereign Obligations | 8,444,280 | ||||||||||||||
|
| ||||||||||||||
Total Uganda (Cost $8,981,308) | 8,444,280 | ||||||||||||||
|
| ||||||||||||||
| Ukraine - 4.20% | |||||||||||||||
| Credit-Linked Notes - 3.98% | |||||||||||||||
Ukraine Government Bonds (Issuer Citigroup Global Markets Holdings, Inc.), | |||||||||||||||
15.090%, Due 3/6/2019 | UAH | 27,000,000 | 974,698 | ||||||||||||
13.300%, Due 8/2/2019C | UAH | 15,150,000 | 538,573 | ||||||||||||
13.460%, Due 6/12/2020C | UAH | 14,840,000 | 512,715 | ||||||||||||
13.500%, Due 8/21/2020C | UAH | 37,000,000 | 1,271,299 | ||||||||||||
14.160%, Due 10/14/2022C | UAH | 52,000,000 | 1,704,575 | ||||||||||||
14.160%, Due 10/17/2022C | UAH | 45,000,000 | 1,473,832 | ||||||||||||
15.970%, Due 4/19/2023C | UAH | 27,500,000 | 923,575 | ||||||||||||
Ukraine Government Bonds (Issuer ICBC Standard Bank PLC), | |||||||||||||||
15.740%, Due 1/15/2020C | UAH | 32,000,000 | 1,123,320 | ||||||||||||
14.910%, Due 10/14/2022 | UAH | 74,000,000 | 2,484,206 | ||||||||||||
|
| ||||||||||||||
Total Credit-Linked Notes | 11,006,793 | ||||||||||||||
|
| ||||||||||||||
| Foreign Corporate Obligations - 0.22% | |||||||||||||||
Metinvest B.V., 8.500%, Due 4/23/2026C | $ | 280,000 | 264,600 | ||||||||||||
MHP SE, 7.750%, Due 5/10/2024C | 350,000 | 336,189 | |||||||||||||
|
| ||||||||||||||
Total Foreign Corporate Obligations | 600,789 | ||||||||||||||
|
| ||||||||||||||
Total Ukraine (Cost $13,029,194) | 11,607,582 | ||||||||||||||
|
| ||||||||||||||
| United Kingdom - 0.18% (Cost $500,423) | |||||||||||||||
| Foreign Corporate Obligations - 0.18% | |||||||||||||||
Liquid Telecommunications Financing PLC, 8.500%, Due 7/13/2022C | 490,000 | 499,613 | |||||||||||||
|
| ||||||||||||||
| United Republic of Tanzania - 0.27% (Cost $764,045) | |||||||||||||||
| Credit-Linked Notes - 0.27% | |||||||||||||||
United Republic of Tanzania (Issuer Zambezi B.V.), 8.650%, Due 4/23/2021A | TZS | 1,700,000,000 | 739,797 | ||||||||||||
|
| ||||||||||||||
Total Credit-Linked Notes | 739,797 | ||||||||||||||
|
| ||||||||||||||
| Uruguay - 2.87% | |||||||||||||||
| Foreign Sovereign Obligations - 2.87% | |||||||||||||||
Uruguay Government International Bond, | |||||||||||||||
9.875%, Due 6/20/2022C | UYU | 48,203,000 | 1,485,887 | ||||||||||||
8.500%, Due 3/15/2028C | UYU | 65,802,000 | 1,773,545 | ||||||||||||
Uruguay Monetary Regulation Bill, | |||||||||||||||
9.324%, Due 4/5/2019, Series 0001 | UYU | 40,000,000 | 1,210,529 | ||||||||||||
9.460%, Due 7/5/2019, Series 0001 | UYU | 36,000,000 | 1,064,629 | ||||||||||||
9.983%, Due 1/3/2020, Series 0001 | UYU | 38,000,000 | 1,072,013 | ||||||||||||
Uruguay Notas del Tesoro, 13.900%, Due 7/29/2020, Series 8 | UYU | 40,750,000 | 1,320,370 | ||||||||||||
|
| ||||||||||||||
Total Foreign Sovereign Obligations | 7,926,973 | ||||||||||||||
|
| ||||||||||||||
Total Uruguay (Cost $8,962,040) | 7,926,973 | ||||||||||||||
|
| ||||||||||||||
| Venezuela - 0.11% (Cost $269,875) | |||||||||||||||
| Foreign Corporate Obligations - 0.11% | |||||||||||||||
Petroleos de Venezuela S.A., 6.000%, Due 5/16/2024C | 1,250,000 | 307,500 | |||||||||||||
|
| ||||||||||||||
See accompanying notes
20
American Beacon Frontier Markets Income FundSM
Schedule of Investments
January 31, 2019
| Principal Amount* | Fair Value | ||||||||||||||
| Zambia - 3.92% | |||||||||||||||
| Foreign Sovereign Obligations - 3.92% | |||||||||||||||
Zambia Government Bond, | |||||||||||||||
11.000%, Due 8/31/2019, Series 5YR | ZMW | 4,800,000 | $ | 365,286 | |||||||||||
11.000%, Due 2/16/2020, Series 5YR | ZMW | 500,000 | 35,656 | ||||||||||||
11.000%, Due 5/26/2020, Series 5YR | ZMW | 23,100,000 | 1,584,851 | ||||||||||||
11.000%, Due 8/29/2021, Series 5YR | ZMW | 21,000,000 | 1,240,851 | ||||||||||||
12.000%, Due 5/23/2023, Series 7YR | ZMW | 6,100,000 | 315,534 | ||||||||||||
12.000%, Due 11/21/2023, Series 7YR | ZMW | 14,900,000 | 742,177 | ||||||||||||
12.000%, Due 4/23/2025, Series 7YR | ZMW | 16,500,000 | 751,988 | ||||||||||||
13.000%, Due 8/29/2026, Series 10YR | ZMW | 42,500,000 | 1,927,398 | ||||||||||||
13.000%, Due 12/18/2027, Series 10YR | ZMW | 7,000,000 | 305,220 | ||||||||||||
Zambia Government International Bond, 8.970%, Due 7/30/2027C | $ | 4,350,000 | 3,580,050 | ||||||||||||
|
| ||||||||||||||
Total Foreign Sovereign Obligations | 10,849,011 | ||||||||||||||
|
| ||||||||||||||
Total Zambia (Cost $15,177,309) | 10,849,011 | ||||||||||||||
|
| ||||||||||||||
| Shares | |||||||||||||||
| SHORT-TERM INVESTMENTS - 7.62% (Cost $21,053,587) | |||||||||||||||
| Investment Companies - 7.62% | |||||||||||||||
American Beacon U.S. Government Money Market Select Fund, Select Class, 2.32%H I | 21,053,587 | 21,053,587 | |||||||||||||
|
| ||||||||||||||
TOTAL INVESTMENTS - 96.41% (Cost $286,499,168) | 266,295,871 | ||||||||||||||
OTHER ASSETS, NET OF LIABILITIES - 3.59% | 9,915,218 | ||||||||||||||
|
| ||||||||||||||
TOTAL NET ASSETS - 100.00% | $ | 276,211,089 | |||||||||||||
|
| ||||||||||||||
Percentages are stated as a percent of net assets. *In U.S. Dollars unless otherwise noted. | |||||||||||||||
A Security exempt from registration under the Securities Act of 1933. These securities may be resold to qualified institutional buyers pursuant to Rule 144A. At the period end, the value of these securities amounted to $22,827,730 or 8.26% of net assets. The Fund has no right to demand registration of these securities.
B Variable, floating, or adjustable rate securities with an interest rate that changes periodically. Rates are periodically reset with rates that are based on a predetermined benchmark such as a widely followed interest rate such asT-bills, LIBOR or PRIME plus a fixed spread. The interest rate disclosed reflects the rate in effect on January 31, 2019.
C Reg S - Security purchased under the Securities Act of 1933, which exempts from registration securities offered and sold outside of the United States. Such a security cannot be sold in the United States without either an effective registration statement filed pursuant to the Securities Act of 1933, or pursuant to an exemption from registration.
D Coupon rate may change based on changes of the underlying collateral or prepayments of principal. The coupon rate shown represents the rate at period end.
E Step Up/Down - A zero coupon bond that converts to a fixed rate or variable interest rate at a designated future date. The rate disclosed represents the coupon rate at January 31, 2019. The maturity date disclosed represents the final maturity date.
F Value was determined using significant unobservable inputs.
G Zero coupon bond.
H The Fund is affiliated by having the same investment advisor.
I7-day yield.
BADLARP - Benchmark rate provided by the Banco Central de la Republica Argentina.
LIBOR - London Interbank Offered Rate.
LLC - Limited Liability Company.
PLC - Public Limited Company.
See accompanying notes
21
American Beacon Frontier Markets Income FundSM
Schedule of Investments
January 31, 2019
| Forward Foreign Currency Contracts Open on January 31, 2019: |
| |||||||||||||||||||||||||||
| Currency Purchased* | Currency Sold* | Settlement Date | Counterparty | Unrealized Appreciation | Unrealized (Depreciation) | Net Unrealized Appreciation (Depreciation) | ||||||||||||||||||||||
| USD | 950,653 | EUR | 952,597 | 4/11/2019 | BRC | $ | - | $ | (1,944 | ) | $ | (1,944 | ) | |||||||||||||||
| KZT | 479,597 | USD | 481,579 | 2/21/2019 | CBK | - | (1,982 | ) | (1,982 | ) | ||||||||||||||||||
| KZT | 1,059,046 | USD | 1,200,000 | 2/4/2019 | ICBC | - | (140,954 | ) | (140,954 | ) | ||||||||||||||||||
| KZT | 1,774,667 | USD | 2,000,000 | 3/4/2019 | ICBC | - | (225,333 | ) | (225,333 | ) | ||||||||||||||||||
| GEL | 303,509 | USD | 300,000 | 3/11/2019 | ICBC | 3,509 | - | 3,509 | ||||||||||||||||||||
| MZN | 1,223,170 | USD | 1,200,000 | 4/2/2019 | ICBC | 23,170 | - | 23,170 | ||||||||||||||||||||
| KZT | 449,621 | USD | 500,000 | 4/12/2019 | ICBC | - | (50,379 | ) | (50,379 | ) | ||||||||||||||||||
| GEL | 507,110 | USD | 500,000 | 5/20/2019 | ICBC | 7,110 | - | 7,110 | ||||||||||||||||||||
| GEL | 306,583 | USD | 300,000 | 6/10/2019 | ICBC | 6,583 | - | 6,583 | ||||||||||||||||||||
| USD | 2,000,000 | KZT | 1,978,102 | 6/14/2019 | ICBC | 21,898 | - | 21,898 | ||||||||||||||||||||
| GEL | 511,818 | USD | 500,000 | 8/20/2019 | ICBC | 11,818 | - | 11,818 | ||||||||||||||||||||
| KZT | 1,195,028 | USD | 1,200,000 | 10/28/2019 | ICBC | - | (4,972 | ) | (4,972 | ) | ||||||||||||||||||
| USD | 4,578,320 | EUR | 4,593,718 | 3/15/2019 | SSB | - | (15,398 | ) | (15,398 | ) | ||||||||||||||||||
|
|
|
|
|
| |||||||||||||||||||||||
| $ | 74,088 | $ | (440,962 | ) | $ | (366,874 | ) | |||||||||||||||||||||
|
|
|
|
|
| |||||||||||||||||||||||
| * | All values denominated in USD. |
| Glossary: | ||
| Counterparty Abbreviations: | ||
| BRC | Barclays Bank PLC | |
| CBK | Citibank, N.A. | |
| ICBC | ICBC Standard Bank PLC | |
| SSB | State Street Bank & Trust Co. | |
| Currency Abbreviations: | ||
| ARS | Argentine Peso | |
| CRC | Costa Rican Colon | |
| DOP | Dominican Peso | |
| EGP | Egyptian Pound | |
| EUR | Euro | |
| GEL | Georgian Lari | |
| GHS | Ghanaian Cedi | |
| KES | Kenyan Shilling | |
| KGS | Kyrgyzstani Som | |
| KZT | Kazakhstani Tenge | |
| LKR | Sri Lankan Rupee | |
| MZN | Mozambique Metical | |
| NGN | Nigerian Naira | |
| TZS | Tanzanian Shilling | |
| UAH | Ukrainian Hryvnia | |
| UGX | Ugandan Shilling | |
| USD | United States Dollar | |
| UYU | Uruguayan Peso | |
| UZS | Uzbekistani Som | |
| ZMW | Zambian Kwacha | |
See accompanying notes
22
American Beacon Frontier Markets Income FundSM
Schedule of Investments
January 31, 2019
The Fund’s investments are summarized by level based on the inputs used to determine their values. As of January 31, 2019, the investments were classified as described below:
Frontier Markets Income Fund | Level 1 | Level 2 | Level 3 | Total | ||||||||||||||||||||||||
Assets | ||||||||||||||||||||||||||||
Foreign Sovereign Obligations | ||||||||||||||||||||||||||||
Albania | $ | - | $ | 223,718 | $ | - | $ | 223,718 | ||||||||||||||||||||
Angola | - | 11,428,293 | - | 11,428,293 | ||||||||||||||||||||||||
Argentina | - | 12,416,216 | - | 12,416,216 | ||||||||||||||||||||||||
Belarus | - | 2,482,633 | - | 2,482,633 | ||||||||||||||||||||||||
Belize | - | 471,750 | - | 471,750 | ||||||||||||||||||||||||
Bosnia & Herzegovina | - | - | 129,605 | 129,605 | ||||||||||||||||||||||||
Cameroon | - | 4,203,528 | - | 4,203,528 | ||||||||||||||||||||||||
Costa Rica | - | 6,277,993 | - | 6,277,993 | ||||||||||||||||||||||||
Dominican Republic | - | 8,616,608 | - | 8,616,608 | ||||||||||||||||||||||||
Ecuador | - | 7,300,235 | - | 7,300,235 | ||||||||||||||||||||||||
Egypt | - | 12,071,041 | - | 12,071,041 | ||||||||||||||||||||||||
El Salvador | - | 1,018,885 | - | 1,018,885 | ||||||||||||||||||||||||
Ethiopia | - | 2,514,600 | - | 2,514,600 | ||||||||||||||||||||||||
Gabon | - | 3,138,328 | - | 3,138,328 | ||||||||||||||||||||||||
Ghana | - | 12,412,377 | - | 12,412,377 | ||||||||||||||||||||||||
Iraq | - | 8,129,008 | - | 8,129,008 | ||||||||||||||||||||||||
Ivory Coast | - | 10,285,079 | - | 10,285,079 | ||||||||||||||||||||||||
Kenya | - | 11,821,561 | - | 11,821,561 | ||||||||||||||||||||||||
Lebanon | - | 319,608 | - | 319,608 | ||||||||||||||||||||||||
Mongolia | - | 6,105,940 | - | 6,105,940 | ||||||||||||||||||||||||
Mozambique | - | 1,748,304 | - | 1,748,304 | ||||||||||||||||||||||||
Netherlands | - | 3,803,256 | - | 3,803,256 | ||||||||||||||||||||||||
Nicaragua | - | 133,219 | - | 133,219 | ||||||||||||||||||||||||
Nigeria | - | 12,454,725 | - | 12,454,725 | ||||||||||||||||||||||||
Pakistan | - | 497,352 | - | 497,352 | ||||||||||||||||||||||||
Papua New Guinea | - | 2,531,620 | - | 2,531,620 | ||||||||||||||||||||||||
Rwanda | - | 747,023 | - | 747,023 | ||||||||||||||||||||||||
Senegal | - | 7,110,867 | - | 7,110,867 | ||||||||||||||||||||||||
Sri Lanka | - | 10,324,491 | - | 10,324,491 | ||||||||||||||||||||||||
Supranational | - | 7,257,504 | - | 7,257,504 | ||||||||||||||||||||||||
Suriname | - | 1,516,800 | - | 1,516,800 | ||||||||||||||||||||||||
Tajikistan | - | 2,916,335 | - | 2,916,335 | ||||||||||||||||||||||||
Tunisia | - | 2,475,449 | - | 2,475,449 | ||||||||||||||||||||||||
Uganda | - | 8,444,280 | - | 8,444,280 | ||||||||||||||||||||||||
Uruguay | - | 7,926,973 | - | 7,926,973 | ||||||||||||||||||||||||
Zambia | - | 10,849,011 | - | 10,849,011 | ||||||||||||||||||||||||
Credit-Linked Notes |
| |||||||||||||||||||||||||||
Angola | - | 943,617 | - | 943,617 | ||||||||||||||||||||||||
Armenia | - | 216,283 | - | 216,283 | ||||||||||||||||||||||||
Azerbaijan | - | 2,012,591 | - | 2,012,591 | ||||||||||||||||||||||||
Gambia | - | 678,324 | - | 678,324 | ||||||||||||||||||||||||
Georgia | - | 2,467,051 | - | 2,467,051 | ||||||||||||||||||||||||
Ghana | - | 251,598 | - | 251,598 | ||||||||||||||||||||||||
Kazakhstan | - | 2,791,576 | - | 2,791,576 | ||||||||||||||||||||||||
Kyrgyzstan | - | 4,180,604 | - | 4,180,604 | ||||||||||||||||||||||||
Malawi | - | 1,087,403 | - | 1,087,403 | ||||||||||||||||||||||||
Mozambique | - | 4,215,527 | - | 4,215,527 | ||||||||||||||||||||||||
Nicaragua | - | 4,363,669 | - | 4,363,669 | ||||||||||||||||||||||||
Paraguay | - | 1,794,846 | - | 1,794,846 | ||||||||||||||||||||||||
Tajikistan | - | 1,007,237 | - | 1,007,237 | ||||||||||||||||||||||||
Ukraine | - | 11,006,793 | - | 11,006,793 | ||||||||||||||||||||||||
United Republic of Tanzania | - | 739,797 | - | 739,797 | ||||||||||||||||||||||||
See accompanying notes
23
American Beacon Frontier Markets Income FundSM
Schedule of Investments
January 31, 2019
Frontier Markets Income Fund | Level 1 | Level 2 | Level 3 | Total | ||||||||||||||||||||||||
Assets (continued) | ||||||||||||||||||||||||||||
Foreign Corporate Obligations |
| |||||||||||||||||||||||||||
Bahrain | $ | - | $ | 265,236 | $ | - | $ | 265,236 | ||||||||||||||||||||
Bangladesh | - | 251,275 | - | 251,275 | ||||||||||||||||||||||||
Canada | - | 197,000 | - | 197,000 | ||||||||||||||||||||||||
Costa Rica | - | 254,028 | - | 254,028 | ||||||||||||||||||||||||
Georgia | - | 489,642 | - | 489,642 | ||||||||||||||||||||||||
Honduras | - | 243,600 | - | 243,600 | ||||||||||||||||||||||||
Jamaica | - | 129,775 | - | 129,775 | ||||||||||||||||||||||||
Luxembourg | - | 247,550 | - | 247,550 | ||||||||||||||||||||||||
Mauritius | - | 515,100 | - | 515,100 | ||||||||||||||||||||||||
Netherlands | - | 867,629 | - | 867,629 | ||||||||||||||||||||||||
Nigeria | - | 512,416 | - | 512,416 | ||||||||||||||||||||||||
Ukraine | - | 600,789 | - | 600,789 | ||||||||||||||||||||||||
United Kingdom | - | 499,613 | - | 499,613 | ||||||||||||||||||||||||
Venezuela | - | 307,500 | - | 307,500 | ||||||||||||||||||||||||
Short-Term Investments | 21,053,587 | - | - | 21,053,587 | ||||||||||||||||||||||||
|
|
|
|
|
|
|
| |||||||||||||||||||||
Total Investments in Securities - Assets | $ | 21,053,587 | $ | 245,112,679 | $ | 129,605 | $ | 266,295,871 | ||||||||||||||||||||
|
|
|
|
|
|
|
| |||||||||||||||||||||
Financial Derivative Instruments - Assets |
| |||||||||||||||||||||||||||
Forward Foreign Currency Contracts | $ | - | $ | 74,088 | $ | - | $ | 74,088 | ||||||||||||||||||||
|
|
|
|
|
|
|
| |||||||||||||||||||||
Total Financial Derivative Instruments - Assets | $ | - | $ | 74,088 | $ | - | $ | 74,088 | ||||||||||||||||||||
|
|
|
|
|
|
|
| |||||||||||||||||||||
Financial Derivative Instruments - Liabilities |
| |||||||||||||||||||||||||||
Forward Foreign Currency Contracts | $ | - | $ | (440,962 | ) | $ | - | $ | (440,962 | ) | ||||||||||||||||||
|
|
|
|
|
|
|
| |||||||||||||||||||||
Total Financial Derivative Instruments - Liabilities | $ | - | $ | (440,962 | ) | $ | - | $ | (440,962 | ) | ||||||||||||||||||
|
|
|
|
|
|
|
| |||||||||||||||||||||
U.S. GAAP requires transfers between all levels to/from level 3 be disclosed. During the year ended January 31, 2019, there were no transfers into or out of Level 3.
The following table is a reconciliation of Level 3 assets within the Fund for which significant unobservable inputs were used to determine fair value. Transfers in or out of Level 3 represent the ending value of any security or instrument where a change in the level has occurred from the beginning to the end of the period:
| Security Type | Balance as of 1/31/2018 | Purchases | Sales | Accrued Discounts (Premiums) | Realized Gain (Loss) | Change in Unrealized Appreciation (Depreciation) | Transfer into Level 3 | Transfer out of Level 3 | Balance as of 1/31/2019 | Unrealized Appreciation (Depreciation) at Period end** | ||||||||||||||||||||||||||||||
| Foreign Sovereign Obligations | $ | 176,155 | $ | - | $ | (48,950 | ) | $ | 4,034 | $ | (4,243 | ) | $ | 2,609 | $ | - | $ | - | $ | 129,605 | $ | (31,387 | ) | |||||||||||||||||
| ** | Change in unrealized appreciation (depreciation) attributable to Level 3 securities held at period end. This balance is included in the change in unrealized appreciation (depreciation) on the Statements of Operations. |
The foreign sovereign obligations, classified as Level 3, were valued using single broker quotes. The principal amount of these securities, valued at $129,605, have been deemed level 3 due to limited market transparency and/or lack of corroboration to support the quoted prices.
See accompanying notes
24
American Beacon GLG Total Return FundSM
Schedule of Investments
January 31, 2019
| Principal Amount | Fair Value | ||||||||||||||
| Argentina - 1.37% (Cost $6,142,486) | |||||||||||||||
| Foreign Sovereign Obligations - 1.37% | |||||||||||||||
Argentine Republic Government International Bond, 6.875%, Due 4/22/2021 | $ | 6,750,000 | $ | 6,446,250 | |||||||||||
|
| ||||||||||||||
| Brazil - 0.21% (Cost $1,002,303) | |||||||||||||||
| Foreign Sovereign Obligations - 0.21% | |||||||||||||||
Banco Nacional de Desenvolvimento Economico e Social, 4.000%, Due 4/14/2019A | 1,000,000 | 999,580 | |||||||||||||
|
| ||||||||||||||
| British Virgin Islands - 0.11% | |||||||||||||||
| Foreign Corporate Obligations - 0.11% | |||||||||||||||
Sinopec Group Overseas Development Ltd., | |||||||||||||||
2.750%, Due 4/10/2019A | 250,000 | 249,812 | |||||||||||||
2.125%, Due 5/3/2019A | 250,000 | 249,313 | |||||||||||||
|
| ||||||||||||||
Total Foreign Corporate Obligations | 499,125 | ||||||||||||||
|
| ||||||||||||||
Total British Virgin Islands (Cost $500,072) | 499,125 | ||||||||||||||
|
| ||||||||||||||
| China - 1.03% (Cost $4,856,655) | |||||||||||||||
| Foreign Corporate Obligations - 1.03% | |||||||||||||||
CNPC General Capital Ltd.A | 4,850,000 | 4,846,088 | |||||||||||||
|
| ||||||||||||||
| Colombia - 0.86% (Cost $4,025,924) | |||||||||||||||
| Foreign Sovereign Obligations - 0.86% | |||||||||||||||
Colombia Government International Bond, 7.375%, Due 3/18/2019 | 4,000,000 | 4,021,040 | |||||||||||||
|
| ||||||||||||||
| India - 1.03% | |||||||||||||||
| Foreign Corporate Obligations - 1.03% | |||||||||||||||
ICICI Bank Ltd., 4.800%, Due 5/22/2019A | 4,339,000 | 4,347,721 | |||||||||||||
State Bank of India, 3.622%, Due 4/17/2019A | 500,000 | 500,135 | |||||||||||||
|
| ||||||||||||||
Total Foreign Corporate Obligations | 4,847,856 | ||||||||||||||
|
| ||||||||||||||
Total India (Cost $4,870,012) | 4,847,856 | ||||||||||||||
|
| ||||||||||||||
| Indonesia - 1.14% (Cost $5,343,011) | |||||||||||||||
| Foreign Sovereign Obligations - 1.14% | |||||||||||||||
Indonesia Government International Bond, 11.625%, Due 3/4/2019A | 5,300,000 | 5,339,655 | |||||||||||||
|
| ||||||||||||||
| Mexico - 1.26% (Cost $6,009,342) | |||||||||||||||
| Foreign Corporate Obligations - 1.26% | |||||||||||||||
Petroleos Mexicanos, 6.000%, Due 3/5/2020 | 5,853,000 | 5,937,634 | |||||||||||||
|
| ||||||||||||||
| South Africa - 4.11% | |||||||||||||||
| Foreign Sovereign Obligations - 4.11% | |||||||||||||||
Republic of South Africa Government International Bond, | |||||||||||||||
6.875%, Due 5/27/2019 | 10,750,000 | 10,854,490 | |||||||||||||
5.500%, Due 3/9/2020 | 8,300,000 | 8,442,096 | |||||||||||||
|
| ||||||||||||||
Total Foreign Sovereign Obligations | 19,296,586 | ||||||||||||||
|
| ||||||||||||||
Total South Africa (Cost $19,427,776) | 19,296,586 | ||||||||||||||
|
| ||||||||||||||
| Shares | |||||||||||||||
| SHORT-TERM INVESTMENTS - 85.44% | |||||||||||||||
| Investment Companies - 0.94% | |||||||||||||||
American Beacon U.S. Government Money Market Select Fund, Select Class, 2.32%B C | 4,402,966 | 4,402,966 | |||||||||||||
|
| ||||||||||||||
| Par Amount | |||||||||||||||
| U.S. Treasury Obligations - 84.50% | |||||||||||||||
U.S. Treasury Bills, | |||||||||||||||
2.304%, Due 2/14/2019 | $ | 60,000,000 | 59,949,950 | ||||||||||||
2.358%, Due 3/7/2019 | 5,400,000 | 5,388,015 | |||||||||||||
See accompanying notes
25
American Beacon GLG Total Return FundSM
Schedule of Investments
January 31, 2019
| Par Amount | Fair Value | ||||||||||||||
| U.S. Treasury Obligations - 84.50% (continued) | |||||||||||||||
U.S. Treasury Bills (continued) | |||||||||||||||
2.379%, Due 3/28/2019 | $ | 60,000,000 | $ | 59,781,834 | |||||||||||
2.454%, Due 4/25/2019 | 28,395,000 | 28,241,809 | |||||||||||||
2.466%, Due 5/16/2019 | 6,000,000 | 5,958,699 | |||||||||||||
2.427%, Due 6/27/2019 | 65,305,000 | 64,672,675 | |||||||||||||
2.472%, Due 7/18/2019 | 174,640,000 | 172,683,522 | |||||||||||||
|
| ||||||||||||||
Total U.S. Treasury Obligations | 396,676,504 | ||||||||||||||
|
| ||||||||||||||
Total Short-Term Investments (Cost $401,091,819) | 401,079,470 | ||||||||||||||
|
| ||||||||||||||
TOTAL INVESTMENTS - 96.56% (Cost $453,269,400) | 453,313,284 | ||||||||||||||
OTHER ASSETS, NET OF LIABILITIES - 3.44% | 16,141,457 | ||||||||||||||
|
| ||||||||||||||
TOTAL NET ASSETS - 100.00% | $ | 469,454,741 | |||||||||||||
|
| ||||||||||||||
| Percentages are stated as a percent of net assets. | |||||||||||||||
A Reg S - Security purchased under the Securities Act of 1933, which exempts from registration securities offered and sold outside of the United States. Such a security cannot be sold in the United States without either an effective registration statement filed pursuant to the Securities Act of 1933, or pursuant to an exemption from registration.
B The Fund is affiliated by having the same investment advisor.
C7-day yield.
| Centrally Cleared Swap Agreements Outstanding on January 31, 2019: |
| |||||||||||||||||||||||
| Interest Rate Swaps | ||||||||||||||||||||||||
| Pay/Receive Floating Rate | Floating Rate Index | Fixed Rate (%) | Expiration Date | Curr | Notional Amount(4) (000s) | Premiums Paid (Received) | Fair Value | Unrealized Appreciation (Depreciation) | ||||||||||||||||
| Pay | 1-Day BRL-CDI | 10.36 | 1/4/2021 | BRL | 76,400 | $ | - | $ | (1,924,791 | ) | $ | (1,924,791 | ) | |||||||||||
| Pay | 1-DayBRL-CDI | 10.26 | 1/4/2021 | BRL | 80,900 | - | (1,983,789 | ) | (1,983,789 | ) | ||||||||||||||
| Pay | 1-DayBRL-CDI | 9.84 | 1/4/2021 | BRL | 41,000 | - | (883,543 | ) | (883,543 | ) | ||||||||||||||
| Pay | 1-DayBRL-CDI | 9.53 | 1/4/2021 | BRL | 187,700 | - | (3,633,460 | ) | (3,633,460 | ) | ||||||||||||||
| Pay | 1-DayBRL-CDI | 9.30 | 1/4/2021 | BRL | 24,800 | - | (439,816 | ) | (439,816 | ) | ||||||||||||||
| Pay | 1-DayBRL-CDI | 9.17 | 1/4/2021 | BRL | 191,800 | - | (3,225,608 | ) | (3,225,608 | ) | ||||||||||||||
| Pay | 1-DayBRL-CDI | 9.10 | 1/4/2021 | BRL | 70,000 | - | (1,121,014 | ) | (1,121,014 | ) | ||||||||||||||
| Pay | 1-DayBRL-CDI | 8.75 | 1/4/2021 | BRL | 24,500 | - | (337,152 | ) | (337,152 | ) | ||||||||||||||
| Receive | 1-DayBRL-CDI | 9.53 | 1/4/2021 | BRL | 140,000 | 1,651,032 | 2,710,093 | 1,059,061 | ||||||||||||||||
|
|
|
|
|
| |||||||||||||||||||
| $ | 1,651,032 | $ | (10,839,080 | ) | $ | (12,490,112 | ) | |||||||||||||||||
|
|
|
|
|
| |||||||||||||||||||
| OTC Swap Agreements Outstanding on January 31, 2019: |
| |||||||||||||||||||||||||||||
| Credit Default Swaps on Corporate and Sovereign Securities - Buy Protection(1) | ||||||||||||||||||||||||||||||
| Reference Entity | Counter- Party | Fixed Rate (%) | Expiration Date | Implied Credit Spread at 1/31/2019(3) (%) | Curr | Notional Amount(4) (000s) | Premiums Paid (Received) | Fair Value(5) | Unrealized Appreciation (Depreciation) | |||||||||||||||||||||
| Kingdom of Saudi Arabia | BRC | 1.00 | 12/20/2022 | 0.7700 | USD | 11,000 | $ | (20,097 | ) | $ | (111,728 | ) | $ | (91,631 | ) | |||||||||||||||
| Lebanese Republic | BRC | 1.00 | 12/20/2019 | 8.5000 | USD | 150 | 4,042 | 10,084 | 6,042 | |||||||||||||||||||||
| Lebanese Republic | BRC | 1.00 | 6/20/2021 | 8.2507 | USD | 275 | 22,873 | 41,785 | 18,912 | |||||||||||||||||||||
| Lebanese Republic | BCC | 1.00 | 6/20/2021 | 8.2507 | USD | 200 | 15,568 | 30,389 | 14,821 | |||||||||||||||||||||
| Lebanese Republic | BRC | 1.00 | 12/20/2021 | 8.0000 | USD | 3,000 | 314,149 | 520,178 | 206,029 | |||||||||||||||||||||
| Lebanese Republic | BRC | 1.00 | 12/20/2021 | 8.0000 | USD | 800 | 70,669 | 138,714 | 68,045 | |||||||||||||||||||||
| Lebanese Republic | BCC | 1.00 | 12/20/2021 | 8.0000 | USD | 15,000 | 1,296,933 | 2,600,887 | 1,303,954 | |||||||||||||||||||||
| Lebanese Republic | BRC | 1.00 | 6/20/2022 | 7.7507 | USD | 12,500 | 1,346,146 | 2,395,034 | 1,048,888 | |||||||||||||||||||||
| Lebanese Republic | BOA | 1.00 | 12/20/2022 | 7.5000 | USD | 3,000 | 360,094 | 626,800 | 266,706 | |||||||||||||||||||||
| Lebanese Republic | BOA | 1.00 | 12/20/2022 | 7.5000 | USD | 5,000 | 607,694 | 1,044,666 | 436,972 | |||||||||||||||||||||
| Lebanese Republic | DUB | 1.00 | 12/20/2022 | 7.5000 | USD | 1,100 | 151,852 | 229,827 | 77,975 | |||||||||||||||||||||
| Lebanese Republic | DUB | 1.00 | 12/20/2022 | 7.5000 | USD | 700 | 96,732 | 146,253 | 49,521 | |||||||||||||||||||||
| Lebanese Republic | DUB | 1.00 | 12/20/2022 | 7.5000 | USD | 1,600 | 216,935 | 334,293 | 117,358 | |||||||||||||||||||||
| Republic of Kazakhstan | BRC | 1.00 | 12/20/2021 | 0.4750 | USD | 15,000 | 267,761 | (255,879 | ) | (523,640 | ) | |||||||||||||||||||
| Republic of Kazakhstan | BRC | 1.00 | 12/20/2021 | 0.4750 | USD | 250 | 6,827 | (4,265 | ) | (11,092 | ) | |||||||||||||||||||
See accompanying notes
26
American Beacon GLG Total Return FundSM
Schedule of Investments
January 31, 2019
| Reference Entity | Counter- Party | Fixed Rate (%) | Expiration Date | Implied Credit Spread at 1/31/2019(3) (%) | Curr | Notional Amount(4) (000s) | Premiums Paid (Received) | Fair Value(5) | Unrealized Appreciation (Depreciation) | |||||||||||||||||||||
| Republic of Kazakhstan | BRC | 1.00 | 12/20/2021 | 0.4750 | USD | 3,000 | $ | 79,632 | $ | (51,176 | ) | $ | (130,808 | ) | ||||||||||||||||
| Republic of Kazakhstan | BRC | 1.00 | 12/20/2021 | 0.4750 | USD | 800 | 13,836 | (13,647 | ) | (27,483 | ) | |||||||||||||||||||
| Republic of Kazakhstan | CBK | 1.00 | 12/20/2021 | 0.4750 | USD | 300 | 7,566 | (5,117 | ) | (12,683 | ) | |||||||||||||||||||
| Republic of South Africa | HUS | 1.00 | 12/20/2023 | 1.7772 | USD | 1,400 | 78,134 | 47,664 | (30,470 | ) | ||||||||||||||||||||
| Republic of South Africa | HUS | 1.00 | 12/20/2023 | 1.7772 | USD | 6,600 | 368,346 | 224,702 | (143,644 | ) | ||||||||||||||||||||
| Republic of Turkey | BRC | 1.00 | 12/20/2023 | 3.0589 | USD | 14,500 | 2,329,848 | 1,250,845 | (1,079,003 | ) | ||||||||||||||||||||
| Russian Federation | GST | 1.00 | 12/20/2023 | 1.3205 | USD | 2,500 | 83,062 | 34,154 | (48,908 | ) | ||||||||||||||||||||
| Russian Federation | GST | 1.00 | 12/20/2023 | 1.3205 | USD | 19,400 | 644,560 | 265,031 | (379,529 | ) | ||||||||||||||||||||
|
|
|
|
|
| |||||||||||||||||||||||||
| $ | 8,363,162 | $ | 9,499,494 | $ | 1,136,332 | |||||||||||||||||||||||||
|
|
|
|
|
| |||||||||||||||||||||||||
| Credit Default Swaps on Corporate and Sovereign Securities - Sell Protection(2) | ||||||||||||||||||||||||||||||
| Reference Entity | Counter- Party | Fixed Rate (%) | Expiration Date | Implied Credit Spread at 1/31/2019(3) (%) | Curr | Notional Amount(4) (000s) | Premiums Paid (Received) | Fair Value(5) | Unrealized Appreciation (Depreciation) | |||||||||||||||||||||
| Republic of Colombia | HUS | 1.00 | 12/20/2021 | 0.3800 | USD | 7,000 | $ | 22,065 | $ | 33,134 | $ | 11,069 | ||||||||||||||||||
| Republic of Philippines | BRC | 1.00 | 12/20/2019 | 0.1013 | USD | 500 | 1,210 | 3,714 | 2,504 | |||||||||||||||||||||
| Republic of Philippines | BCC | 1.00 | 12/20/2019 | 0.1013 | USD | 3,000 | 9,626 | 22,283 | 12,657 | |||||||||||||||||||||
|
|
|
|
|
| |||||||||||||||||||||||||
| $ | 32,901 | $ | 59,131 | $ | 26,230 | |||||||||||||||||||||||||
|
|
|
|
|
| |||||||||||||||||||||||||
| Credit Default Swaps on Credit Indices - Buy Protection(1) | ||||||||||||||||||||||||||||||
| Reference Entity | Counter- Party | Fixed Rate (%) | Expiration Date | Implied Credit Spread at 1/31/2019(3) (%) | Curr | Notional Amount(4) (000s) | Premiums Paid (Received) | Fair Value | Unrealized Appreciation (Depreciation) | |||||||||||||||||||||
| Federal Republic of Brazil | FBF | 1.00 | 12/20/2023 | 1.6500 | USD | 58,400 | $ | 2,114,721 | $ | 1,674,779 | $ | (439,942 | ) | |||||||||||||||||
| Federation of Malaysia | FBF | 1.00 | 12/20/2023 | 0.8093 | USD | 27,000 | 170,645 | (227,584 | ) | (398,229 | ) | |||||||||||||||||||
| Republic of Colombia | FBF | 1.00 | 12/20/2023 | 1.2450 | USD | 61,250 | 667,403 | 631,716 | (35,687 | ) | ||||||||||||||||||||
| Republic of Indonesia | FBF | 1.00 | 12/20/2023 | 1.1150 | USD | 55,300 | 644,189 | 299,314 | (344,875 | ) | ||||||||||||||||||||
| Republic of Korea | FBF | 1.00 | 12/20/2023 | 0.3334 | USD | 5,400 | (138,828 | ) | (167,123 | ) | (28,295 | ) | ||||||||||||||||||
| Republic of South Africa | FBF | 1.00 | 12/20/2023 | 1.7772 | USD | 53,600 | 2,354,516 | 1,824,856 | (529,660 | ) | ||||||||||||||||||||
|
|
|
|
|
| |||||||||||||||||||||||||
| $ | 5,812,646 | $ | 4,035,958 | $ | (1,776,688 | ) | ||||||||||||||||||||||||
|
|
|
|
|
| |||||||||||||||||||||||||
| Credit Default Swaps on Credit Indices - Sell Protection(2) | ||||||||||||||||||||||||||||||
| Reference Entity | Counter- Party | Fixed Rate (%) | Expiration Date | Implied Credit Spread at 1/31/2019(3) (%) | Curr | Notional Amount(4) (000s) | Premiums Paid (Received) | Fair Value | Unrealized Appreciation (Depreciation) | |||||||||||||||||||||
| Federation of Malaysia | BRC | 1.00 | 12/20/2023 | 0.7854 | USD | 5,500 | $ | (19,493 | ) | $ | 46,360 | $ | 65,853 | |||||||||||||||||
| Russian Federation | BRC | 1.00 | 12/20/2023 | 1.2938 | USD | 4,000 | (86,099 | ) | (54,646 | ) | 31,453 | |||||||||||||||||||
|
|
|
|
|
| |||||||||||||||||||||||||
| $ | (105,592 | ) | $ | (8,286 | ) | $ | 97,306 | |||||||||||||||||||||||
|
|
|
|
|
| |||||||||||||||||||||||||
| Interest Rate Swaps | ||||||||||||||||||||||||||
| Reference Entity | Counter- Party | Fixed Rate (%) | Expiration Date | Curr | Notional Amount(4) (000s) | Premiums Paid (Received) | Fair Value | Unrealized Appreciation (Depreciation) | ||||||||||||||||||
| 1-DayBRL-CDI | HUS | 9.12 | 1/4/2021 | BRL | 30,100 | $ | - | $ | (477,629 | ) | $ | (477,629 | ) | |||||||||||||
| 1-DayBRL-CDI | UAG | 8.65 | 1/4/2021 | BRL | 32,500 | - | (389,691 | ) | (389,691 | ) | ||||||||||||||||
|
|
|
|
|
| |||||||||||||||||||||
| $ | - | $ | (867,320 | ) | $ | (867,320 | ) | |||||||||||||||||||
|
|
|
|
|
| |||||||||||||||||||||
| (1) | If the Fund is a buyer of protection and a credit event occurs, as defined under the terms of that particular swap agreement, the Fund will either (i) receive from the seller of protection an amount equal to the notional amount of the swap and deliver the referenced obligation or underlying securities comprising the referenced index or (ii) receive a net settlement amount in the form of cash or securities equal to the notional amount of the swap less the recovery value of the referenced obligation or underlying securities comprising the referenced index. |
See accompanying notes
27
American Beacon GLG Total Return FundSM
Schedule of Investments
January 31, 2019
| (2) | If the Fund is a seller of protection and a credit event occurs, as defined under the terms of that particular swap agreement, the Fund will either (i) pay to the buyer of protection an amount equal to the notional amount of the swap and take delivery of the referenced obligation or underlying securities comprising the referenced index or (ii) pay a net settlement amount in the form of cash or securities equal to the notional amount of the swap less the recovery value of the referenced obligation or underlying securities comprising the referenced index. |
| (3) | Implied credit spreads, represented in absolute terms, utilized in determining the fair value of credit default swaps agreements on corporate issues and sovereign issues of an emerging country as of period end serve as an indicator of the current status of the payment/performance risk and represent the likelihood or risk of default for the credit derivative. The implied credit spread of a particular referenced entity reflects the cost of buying/selling protection and may include upfront payments required to be made to enter into the agreement. Wider credit spreads represent a deterioration of the referenced entity’s credit soundness and a greater likelihood or risk of default or other credit event occurring as defined under the terms of the agreement. |
| (4) | The maximum potential amount the Fund could be required to pay as a seller of credit protection or receive as a buyer of credit protection if a credit event occurs as defined under the terms of that particular swap agreement. |
| (5) | The quoted market prices and resulting values for credit default swaps on asset-backed securities and credit indices serve as an indicator of the current status of the payment/performance risk and represent the likelihood of an expected liability (or profit) for the credit derivative should the notional amount of the swap agreement be closed/ sold as of the period end. Increasing fair values, in absolute terms when compared to the notional amount of the swap, represent a deterioration of the referenced entity’s credit soundness and greater likelihood or risk of default or other credit event occurring as defined under the terms of the agreement. |
| Forward Foreign Currency Contracts Open on January 31, 2019: |
| |||||||||||||||||||||||
| Currency Purchased* | Currency Sold* | Settlement Date | Counterparty | Unrealized Appreciation | Unrealized (Depreciation) | Net Unrealized Appreciation (Depreciation) | ||||||||||||||||||
| IDR | 1,259,130 | USD | 1,200,000 | 2/4/2019 | HUS | $ | 59,130 | $ | - | $ | 59,130 | |||||||||||||
| IDR | 1,791,190 | USD | 1,700,000 | 2/4/2019 | HUS | 91,190 | - | 91,190 | ||||||||||||||||
| IDR | 1,818,322 | USD | 1,700,000 | 2/4/2019 | HUS | 118,322 | - | 118,322 | ||||||||||||||||
| IDR | 1,900,419 | USD | 1,800,000 | 2/4/2019 | HUS | 100,419 | - | 100,419 | ||||||||||||||||
| IDR | 3,116,787 | USD | 2,900,000 | 2/4/2019 | HUS | 216,787 | - | 216,787 | ||||||||||||||||
| BRL | 3,202,251 | USD | 3,100,000 | 2/4/2019 | HUS | 102,251 | - | 102,251 | ||||||||||||||||
| BRL | 4,053,767 | USD | 3,900,000 | 2/4/2019 | HUS | 153,767 | - | 153,767 | ||||||||||||||||
| BRL | 4,163,194 | USD | 4,000,000 | 2/4/2019 | HUS | 163,194 | - | 163,194 | ||||||||||||||||
| IDR | 4,441,931 | USD | 4,355,430 | 2/4/2019 | HUS | 86,501 | - | 86,501 | ||||||||||||||||
| BRL | 4,674,819 | USD | 4,400,000 | 2/4/2019 | HUS | 274,819 | - | 274,819 | ||||||||||||||||
| IDR | 5,379,144 | USD | 5,267,000 | 2/4/2019 | HUS | 112,144 | - | 112,144 | ||||||||||||||||
| IDR | 5,429,855 | USD | 5,265,000 | 2/4/2019 | HUS | 164,855 | - | 164,855 | ||||||||||||||||
| IDR | 5,433,623 | USD | 5,265,000 | 2/4/2019 | HUS | 168,623 | - | 168,623 | ||||||||||||||||
| IDR | 5,433,623 | USD | 5,265,000 | 2/4/2019 | HUS | 168,623 | - | 168,623 | ||||||||||||||||
| BRL | 7,816,270 | USD | 7,500,000 | 2/4/2019 | HUS | 316,270 | - | 316,270 | ||||||||||||||||
| BRL | 8,728,900 | USD | 8,460,283 | 2/4/2019 | HUS | 268,617 | - | 268,617 | ||||||||||||||||
| BRL | 10,447,628 | USD | 10,110,000 | 2/4/2019 | HUS | 337,628 | - | 337,628 | ||||||||||||||||
| BRL | 10,450,400 | USD | 10,110,000 | 2/4/2019 | HUS | 340,400 | - | 340,400 | ||||||||||||||||
| BRL | 10,455,944 | USD | 10,110,000 | 2/4/2019 | HUS | 345,944 | - | 345,944 | ||||||||||||||||
| BRL | 10,469,804 | USD | 10,110,000 | 2/4/2019 | HUS | 359,804 | - | 359,804 | ||||||||||||||||
| USD | 30,816,000 | BRL | 34,341,015 | 2/4/2019 | HUS | - | (3,525,015 | ) | (3,525,015 | ) | ||||||||||||||
| USD | 18,779,000 | BRL | 20,631,567 | 2/4/2019 | HUS | - | (1,852,567 | ) | (1,852,567 | ) | ||||||||||||||
| USD | 17,039,229 | IDR | 18,002,011 | 2/4/2019 | HUS | - | (962,782 | ) | (962,782 | ) | ||||||||||||||
| USD | 12,519,000 | BRL | 13,744,573 | 2/4/2019 | HUS | - | (1,225,573 | ) | (1,225,573 | ) | ||||||||||||||
| USD | 8,510,392 | IDR | 9,001,007 | 2/4/2019 | HUS | - | (490,615 | ) | (490,615 | ) | ||||||||||||||
| USD | 8,516,154 | IDR | 9,001,006 | 2/4/2019 | HUS | - | (484,852 | ) | (484,852 | ) | ||||||||||||||
| USD | 2,568,000 | BRL | 2,881,184 | 2/4/2019 | HUS | - | (313,184 | ) | (313,184 | ) | ||||||||||||||
| USD | 2,568,000 | BRL | 2,864,638 | 2/4/2019 | HUS | - | (296,638 | ) | (296,638 | ) | ||||||||||||||
| COP | 1,727,151 | USD | 1,700,000 | 2/7/2019 | HUS | 27,151 | - | 27,151 | ||||||||||||||||
| COP | 1,730,436 | USD | 1,700,000 | 2/7/2019 | HUS | 30,436 | - | 30,436 | ||||||||||||||||
| COP | 1,755,070 | USD | 1,700,000 | 2/7/2019 | HUS | 55,070 | - | 55,070 | ||||||||||||||||
| COP | 2,645,792 | USD | 2,500,000 | 2/7/2019 | HUS | 145,792 | - | 145,792 | ||||||||||||||||
| COP | 2,988,574 | USD | 2,900,000 | 2/7/2019 | HUS | 88,574 | - | 88,574 | ||||||||||||||||
| COP | 7,501,518 | USD | 7,201,000 | 2/7/2019 | HUS | 300,518 | - | 300,518 | ||||||||||||||||
| COP | 7,510,793 | USD | 7,201,000 | 2/7/2019 | HUS | 309,793 | - | 309,793 | ||||||||||||||||
| COP | 8,688,840 | USD | 8,429,350 | 2/7/2019 | HUS | 259,490 | - | 259,490 | ||||||||||||||||
| USD | 8,913,078 | COP | 8,965,020 | 2/7/2019 | HUS | - | (51,942 | ) | (51,942 | ) | ||||||||||||||
| USD | 8,907,374 | COP | 8,965,020 | 2/7/2019 | HUS | - | (57,646 | ) | (57,646 | ) | ||||||||||||||
| USD | 8,901,536 | COP | 8,965,020 | 2/7/2019 | HUS | - | (63,484 | ) | (63,484 | ) | ||||||||||||||
See accompanying notes
28
American Beacon GLG Total Return FundSM
Schedule of Investments
January 31, 2019
| Currency Purchased* | Currency Sold* | Settlement Date | Counterparty | Unrealized Appreciation | Unrealized (Depreciation) | Net Unrealized Appreciation (Depreciation) | ||||||||||||||||||||
| USD | 4,320,729 | COP | 4,272,167 | 2/7/2019 | HUS | $ | 48,562 | $ | - | $ | 48,562 | |||||||||||||||
| USD | 3,457,893 | COP | 3,380,946 | 2/7/2019 | HUS | 76,947 | - | 76,947 | ||||||||||||||||||
| ARS | 1,424,602 | USD | 1,286,526 | 3/25/2019 | HUS | 138,076 | - | 138,076 | ||||||||||||||||||
| ARS | 12,494,020 | USD | 11,234,000 | 3/25/2019 | HUS | 1,260,020 | - | 1,260,020 | ||||||||||||||||||
| ARS | 16,002,834 | USD | 14,016,795 | 3/25/2019 | HUS | 1,986,039 | - | 1,986,039 | ||||||||||||||||||
| USD | 5,800,000 | ARS | 6,172,966 | 3/25/2019 | HUS | - | (372,966 | ) | (372,966 | ) | ||||||||||||||||
| USD | 3,100,000 | ARS | 3,349,059 | 3/25/2019 | HUS | - | (249,059 | ) | (249,059 | ) | ||||||||||||||||
| USD | 3,000,000 | ARS | 3,226,515 | 3/25/2019 | HUS | - | (226,515 | ) | (226,515 | ) | ||||||||||||||||
| USD | 2,400,000 | ARS | 2,559,829 | 3/25/2019 | HUS | - | (159,829 | ) | (159,829 | ) | ||||||||||||||||
| ARS | 3,363,534 | USD | 3,012,999 | 3/29/2019 | HUS | 350,535 | - | 350,535 | ||||||||||||||||||
| ARS | 3,372,699 | USD | 3,013,000 | 3/29/2019 | HUS | 359,699 | - | 359,699 | ||||||||||||||||||
| ARS | 4,560,604 | USD | 4,089,030 | 3/29/2019 | HUS | 471,574 | - | 471,574 | ||||||||||||||||||
| ARS | 13,919,259 | USD | 12,562,301 | 4/1/2019 | HUS | 1,356,958 | - | 1,356,958 | ||||||||||||||||||
| ARS | 6,080,810 | USD | 5,596,545 | 4/3/2019 | HUS | 484,265 | - | 484,265 | ||||||||||||||||||
| ARS | 6,425,239 | USD | 6,067,015 | 4/3/2019 | HUS | 358,224 | - | 358,224 | ||||||||||||||||||
| USD | 4,900,000 | ARS | 5,312,874 | 4/3/2019 | HUS | - | (412,874 | ) | (412,874 | ) | ||||||||||||||||
| BRL | 2,449,095 | USD | 2,400,000 | 5/3/2019 | HUS | 49,095 | - | 49,095 | ||||||||||||||||||
| USD | 10,110,000 | BRL | 10,486,293 | 5/3/2019 | HUS | - | (376,293 | ) | (376,293 | ) | ||||||||||||||||
| USD | 10,110,000 | BRL | 10,472,514 | 5/3/2019 | HUS | - | (362,514 | ) | (362,514 | ) | ||||||||||||||||
| USD | 10,110,000 | BRL | 10,466,451 | 5/3/2019 | HUS | - | (356,451 | ) | (356,451 | ) | ||||||||||||||||
| USD | 10,110,000 | BRL | 10,464,247 | 5/3/2019 | HUS | - | (354,247 | ) | (354,247 | ) | ||||||||||||||||
| USD | 8,398,903 | BRL | 8,677,856 | 5/3/2019 | HUS | - | (278,953 | ) | (278,953 | ) | ||||||||||||||||
| USD | 8,395,255 | COP | 8,657,426 | 5/8/2019 | HUS | - | (262,171 | ) | (262,171 | ) | ||||||||||||||||
| USD | 7,201,000 | COP | 7,512,288 | 5/8/2019 | HUS | - | (311,288 | ) | (311,288 | ) | ||||||||||||||||
| USD | 7,201,000 | COP | 7,502,815 | 5/8/2019 | HUS | - | (301,815 | ) | (301,815 | ) | ||||||||||||||||
| USD | 5,265,000 | IDR | 5,451,176 | 5/29/2019 | HUS | - | (186,176 | ) | (186,176 | ) | ||||||||||||||||
| USD | 5,265,000 | IDR | 5,449,690 | 5/29/2019 | HUS | - | (184,690 | ) | (184,690 | ) | ||||||||||||||||
| USD | 5,265,000 | IDR | 5,447,460 | 5/29/2019 | HUS | - | (182,460 | ) | (182,460 | ) | ||||||||||||||||
| USD | 5,267,000 | IDR | 5,393,387 | 5/29/2019 | HUS | - | (126,387 | ) | (126,387 | ) | ||||||||||||||||
| USD | 4,284,474 | IDR | 4,381,235 | 5/29/2019 | HUS | - | (96,761 | ) | (96,761 | ) | ||||||||||||||||
|
|
|
|
|
| |||||||||||||||||||||
| $ | 12,106,106 | $ | (14,125,747 | ) | $ | (2,019,641 | ) | |||||||||||||||||||
|
|
|
|
|
| |||||||||||||||||||||
| * | All values denominated in USD. |
| Glossary: | ||
| Counterparty Abbreviations: | ||
| BCC | Barclays Capital, Inc. | |
| BOA | Bank of America, N.A. | |
| BRC | Barclays Bank PLC | |
| CBK | Citibank, N.A. | |
| DUB | Deutsche Bank AG | |
| FBF | Credit Suisse Securities USA LLC | |
| GST | Goldman Sachs International | |
| HUS | HSBC Bank (USA) | |
| UAG | UBS AG | |
| Currency Abbreviations: | ||
| ARS | Argentine Peso | |
| BRL | Brazilian Real | |
| COP | Colombian Peso | |
| IDR | Indonesian Rupiah | |
| USD | United States Dollar | |
| Exchange Abbreviations: | ||
| OTC | Over-the-Counter | |
| Other Abbreviations: | ||
| CDI | Chess Depository Interest | |
See accompanying notes
29
American Beacon GLG Total Return FundSM
Schedule of Investments
January 31, 2019
The Fund’s investments are summarized by level based on the inputs used to determine their values. As of January 31, 2019, the investments were classified as described below:
GLG Total Return Fund | Level 1 | Level 2 | Level 3 | Total | ||||||||||||||||||||||||
Assets |
| |||||||||||||||||||||||||||
Foreign Sovereign Obligations |
| |||||||||||||||||||||||||||
Argentina | $ | - | $ | 6,446,250 | $ | - | $ | 6,446,250 | ||||||||||||||||||||
Brazil | - | 999,580 | - | 999,580 | ||||||||||||||||||||||||
Colombia | - | 4,021,040 | - | 4,021,040 | ||||||||||||||||||||||||
Indonesia | - | 5,339,655 | - | 5,339,655 | ||||||||||||||||||||||||
South Africa | - | 19,296,586 | - | 19,296,586 | ||||||||||||||||||||||||
Foreign Corporate Obligations |
| |||||||||||||||||||||||||||
British Virgin Islands | - | 499,125 | - | 499,125 | ||||||||||||||||||||||||
China | - | 4,846,088 | - | 4,846,088 | ||||||||||||||||||||||||
India | - | 4,847,856 | - | 4,847,856 | ||||||||||||||||||||||||
Mexico | - | 5,937,634 | - | 5,937,634 | ||||||||||||||||||||||||
Short-Term Investments | ||||||||||||||||||||||||||||
Investment Companies | 4,402,966 | - | - | 4,402,966 | ||||||||||||||||||||||||
U.S. Treasury Obligations | - | 396,676,504 | - | 396,676,504 | ||||||||||||||||||||||||
|
|
|
|
|
|
|
| |||||||||||||||||||||
Total Investments in Securities - Assets | $ | 4,402,966 | $ | 448,910,318 | $ | - | $ | 453,313,284 | ||||||||||||||||||||
|
|
|
|
|
|
|
| |||||||||||||||||||||
Financial Derivative Instruments - Assets |
| |||||||||||||||||||||||||||
Swap Contract Agreements | $ | - | $ | 4,797,820 | $ | - | $ | 4,797,820 | ||||||||||||||||||||
Forward Foreign Currency Contracts | - | 12,106,106 | - | 12,106,106 | ||||||||||||||||||||||||
|
|
|
|
|
|
|
| |||||||||||||||||||||
Total Financial Derivative Instruments - Assets | $ | - | $ | 16,903,926 | $ | - | $ | 16,903,926 | ||||||||||||||||||||
|
|
|
|
|
|
|
| |||||||||||||||||||||
Financial Derivative Instruments - Liabilities |
| |||||||||||||||||||||||||||
Swap Contract Agreements | $ | - | $ | (18,672,072 | ) | $ | - | $ | (18,672,072 | ) | ||||||||||||||||||
Forward Foreign Currency Contracts | - | (14,125,747 | ) | - | (14,125,747 | ) | ||||||||||||||||||||||
|
|
|
|
|
|
|
| |||||||||||||||||||||
Total Financial Derivative Instruments - Liabilities | $ | - | $ | (32,797,819 | ) | $ | - | $ | (32,797,819 | ) | ||||||||||||||||||
|
|
|
|
|
|
|
| |||||||||||||||||||||
U.S. GAAP requires transfers between all levels to/from level 3 be disclosed. During the year ended January 31, 2019, there were no transfers into or out of Level 3.
See accompanying notes
30
Statements of Assets and Liabilities
January 31, 2019
| Frontier Markets Income Fund | GLG Total Return Fund | |||||||||||
Assets: | ||||||||||||
Investments in unaffiliated securities, at fair value† | $ | 245,242,284 | $ | 448,910,318 | ||||||||
Investments in affiliated securities, at fair value‡ | 21,053,587 | 4,402,966 | ||||||||||
Foreign currency, at fair value^ | 1,376,645 | 265 | ||||||||||
Cash | 195,098 | - | ||||||||||
Swap premium paid | - | 16,018,666 | ||||||||||
Swap income receivable | - | 23,875 | ||||||||||
Cash with brokers | - | 17,281,909 | ||||||||||
Cash collateral held at custodian for the benefit of the broker | 590,000 | 1,110,000 | ||||||||||
Dividends and interest receivable | 6,620,967 | 1,061,094 | ||||||||||
Receivable for investments sold | 344,516 | - | ||||||||||
Receivable for fund shares sold | 1,728,685 | 1,915,030 | ||||||||||
Receivable for expense reimbursement (Note 2) | 61,771 | 50,243 | ||||||||||
Unrealized appreciation from forward foreign currency contracts | 74,088 | 12,106,106 | ||||||||||
Unrealized appreciation from swap agreements | - | 4,797,820 | ||||||||||
Prepaid expenses | 70,139 | 28,942 | ||||||||||
|
|
|
| |||||||||
Total assets | 277,357,780 | 507,707,234 | ||||||||||
|
|
|
| |||||||||
Liabilities: | ||||||||||||
Payable for investments purchased | 204,439 | - | ||||||||||
Payable for fund shares redeemed | 71,333 | 827,929 | ||||||||||
Cash collateral held at broker for the benefit of the custodian | - | 3,290,000 | ||||||||||
Cash due to custodian | - | 100,000 | ||||||||||
Swap premium received | - | 264,517 | ||||||||||
Swap income payable | - | 452,724 | ||||||||||
Management andsub-advisory fees payable (Note 2) | 193,965 | 384,983 | ||||||||||
Service fees payable (Note 2) | 24,560 | 118 | ||||||||||
Transfer agent fees payable (Note 2) | 13,579 | 2,125 | ||||||||||
Custody and fund accounting fees payable | 87,973 | 34,050 | ||||||||||
Professional fees payable | 108,398 | 63,366 | ||||||||||
Trustee fees payable (Note 2) | 1,365 | 10,618 | ||||||||||
Payable for prospectus and shareholder reports | - | 18,296 | ||||||||||
Unrealized depreciation from forward foreign currency contracts | 440,962 | 14,125,747 | ||||||||||
Unrealized depreciation from swap agreements | - | 18,672,072 | ||||||||||
Other liabilities | 117 | 5,948 | ||||||||||
|
|
|
| |||||||||
Total liabilities | 1,146,691 | 38,252,493 | ||||||||||
|
|
|
| |||||||||
Net assets | $ | 276,211,089 | $ | 469,454,741 | ||||||||
|
|
|
| |||||||||
Analysis of net assets: | ||||||||||||
Paid-in-capital | $ | 314,061,880 | $ | 497,506,228 | ||||||||
Total distributable earnings (deficits)A | (37,850,791 | ) | (28,051,487 | ) | ||||||||
|
|
|
| |||||||||
Net assets | $ | 276,211,089 | $ | 469,454,741 | ||||||||
|
|
|
| |||||||||
See accompanying notes
31
American Beacon FundsSM
Statements of Assets and Liabilities
January 31, 2019
| Frontier Markets Income Fund | GLG Total Return Fund | |||||||||||
Shares outstanding at no par value (unlimited shares authorized): | ||||||||||||
Institutional Class | 7,205,941 | 31,821 | ||||||||||
|
|
|
| |||||||||
Y Class | 17,483,247 | 67,689 | ||||||||||
|
|
|
| |||||||||
Investor Class | 5,592,884 | 13,831 | ||||||||||
|
|
|
| |||||||||
A Class | 369,756 | 10,605 | ||||||||||
|
|
|
| |||||||||
C Class | 1,190,595 | 10,550 | ||||||||||
|
|
|
| |||||||||
Ultra Class | N/A | 46,093,487 | ||||||||||
|
|
|
| |||||||||
Net assets: | ||||||||||||
Institutional Class | $ | 62,523,243 | $ | 323,306 | ||||||||
|
|
|
| |||||||||
Y Class | $ | 151,728,470 | $ | 683,994 | ||||||||
|
|
|
| |||||||||
Investor Class | $ | 48,475,727 | $ | 138,852 | ||||||||
|
|
|
| |||||||||
A Class | $ | 3,200,206 | $ | 106,404 | ||||||||
|
|
|
| |||||||||
C Class | $ | 10,283,443 | $ | 104,277 | ||||||||
|
|
|
| |||||||||
Ultra Class | N/A | $ | 468,097,908 | |||||||||
|
|
|
| |||||||||
Net asset value, offering and redemption price per share: | ||||||||||||
Institutional Class | $ | 8.68 | $ | 10.16 | ||||||||
|
|
|
| |||||||||
Y Class | $ | 8.68 | $ | 10.10 | ||||||||
|
|
|
| |||||||||
Investor Class | $ | 8.67 | $ | 10.04 | ||||||||
|
|
|
| |||||||||
A Class | $ | 8.65 | $ | 10.03 | ||||||||
|
|
|
| |||||||||
A Class (offering price) | $ | 9.09 | $ | 10.53 | ||||||||
|
|
|
| |||||||||
C Class | $ | 8.64 | $ | 9.88 | ||||||||
|
|
|
| |||||||||
Ultra Class | N/A | $ | 10.16 | |||||||||
|
|
|
| |||||||||
† Cost of investments in unaffiliated securities | $ | 265,445,581 | $ | 448,866,434 | ||||||||
‡ Cost of investments in affiliated securities | $ | 21,053,587 | $ | 4,402,966 | ||||||||
^ Cost of foreign currency | $ | 1,370,482 | $ | 256 | ||||||||
A The Fund’s investments in affiliated securities did not have unrealized appreciation (depreciation) at year end. |
| |||||||||||
See accompanying notes
32
American Beacon FundsSM
Statements of Operations
For the year ended January 31, 2019
| Frontier Markets Income Fund | GLG Total Return Fund | |||||||||||
Investment income: | ||||||||||||
Dividend income from affiliated securities (Note 8) | $ | 473,485 | $ | 168,954 | ||||||||
Interest income (net of foreign taxes)† | 25,603,888 | 13,326,136 | ||||||||||
|
|
|
| |||||||||
Total investment income | 26,077,373 | 13,495,090 | ||||||||||
|
|
|
| |||||||||
Expenses: | ||||||||||||
Management andsub-advisory fees (Note 2) | 2,201,706 | 6,432,225 | ||||||||||
Transfer agent fees: | ||||||||||||
Institutional Class (Note 2) | 15,772 | 50 | ||||||||||
Y Class (Note 2) | 119,301 | 77 | ||||||||||
Investor Class | 2,472 | 1,085 | ||||||||||
A Class | 537 | - | ||||||||||
C Class | 352 | - | ||||||||||
Ultra Class | - | 117,928 | ||||||||||
Custody and fund accounting fees | 403,561 | 190,221 | ||||||||||
Professional fees | 227,725 | 131,479 | ||||||||||
Registration fees and expenses | 122,184 | 112,427 | ||||||||||
Service fees (Note 2): | ||||||||||||
Investor Class | 146,809 | 116 | ||||||||||
A Class | 3,219 | 26 | ||||||||||
C Class | 8,776 | 25 | ||||||||||
Distribution fees (Note 2): | ||||||||||||
A Class | 8,841 | 270 | ||||||||||
C Class | 99,265 | 1,065 | ||||||||||
Prospectus and shareholder report expenses | 27,672 | 64,993 | ||||||||||
Trustee fees (Note 2) | 17,223 | 56,581 | ||||||||||
Dividends and interest on securities sold short | - | 26,850 | ||||||||||
Loan fees (Note 9) | 60,801 | - | ||||||||||
Other expenses | 21,682 | 46,161 | ||||||||||
|
|
|
| |||||||||
Total expenses | 3,487,898 | 7,181,579 | ||||||||||
|
|
|
| |||||||||
Net fees waived and expenses (reimbursed) (Note 2) | (29,227 | ) | (623,101 | ) | ||||||||
|
|
|
| |||||||||
Net expenses | 3,458,671 | 6,558,478 | ||||||||||
|
|
|
| |||||||||
Net investment income | 22,618,702 | 6,936,612 | ||||||||||
|
|
|
| |||||||||
Realized and unrealized gain (loss) from investments: | ||||||||||||
Net realized gain (loss) from: | ||||||||||||
Investments in unaffiliated securitiesA | (3,468,273 | ) | 2,643,290 | |||||||||
Foreign currency transactions | (155,993 | ) | (706,090 | ) | ||||||||
Forward foreign currency contracts | 153,072 | (1,291,678 | ) | |||||||||
Swap agreements | - | (1,964,962 | ) | |||||||||
Change in net unrealized appreciation (depreciation) of: | ||||||||||||
Investments in unaffiliated securitiesB | (23,335,878 | ) | 467,204 | |||||||||
Foreign currency transactions | (49,745 | ) | 6 | |||||||||
Forward foreign currency contracts | (506,291 | ) | 3,276,950 | |||||||||
Swap agreements | - | (1,668,215 | ) | |||||||||
|
|
|
| |||||||||
Net gain (loss) from investments | (27,363,108 | ) | 756,505 | |||||||||
|
|
|
| |||||||||
Net increase (decrease) in net assets resulting from operations | $ | (4,744,406 | ) | $ | 7,693,117 | |||||||
|
|
|
| |||||||||
† Foreign taxes | $ | 520,647 | $ | - | ||||||||
A The Fund did not recognize net realized gains (losses) from the sale of investments in affiliated securities. |
| |||||||||||
B The Fund’s investments in affiliated securities did not have a change in unrealized appreciation (depreciation) at year end. |
| |||||||||||
See accompanying notes
33
American Beacon FundsSM
Statements of Changes in Net Assets
| Frontier Markets Income Fund | GLG Total Return Fund | |||||||||||||||||||||||||||
| Year Ended January 31, 2019 | Year Ended January 31, 2018 | Year Ended January 31, 2019 | Year Ended January 31, 2018 | |||||||||||||||||||||||||
Increase (decrease) in net assets: |
| |||||||||||||||||||||||||||
Operations: |
| |||||||||||||||||||||||||||
Net investment income | $ | 22,618,702 | $ | 11,020,530 | $ | 6,936,612 | $ | 2,531,727 | ||||||||||||||||||||
Net realized gain (loss) from investments in unaffiliated securities, foreign currency transactions, forward foreign currency contracts, and swap agreements | (3,471,194 | ) | (2,024,117 | ) | (1,319,440 | ) | 3,133,509 | |||||||||||||||||||||
Change in net unrealized appreciation (depreciation) of investments in unaffiliated securities, foreign currency transactions, forward foreign currency contracts, and swap agreements | (23,891,914 | ) | 7,678,093 | 2,075,945 | (18,655,514 | ) | ||||||||||||||||||||||
|
|
|
|
|
|
|
| |||||||||||||||||||||
Net increase (decrease) in net assets resulting from operations | (4,744,406 | ) | 16,674,506 | 7,693,117 | (12,990,278 | ) | ||||||||||||||||||||||
|
|
|
|
|
|
|
| |||||||||||||||||||||
Distributions to shareholders: |
| |||||||||||||||||||||||||||
Net investment income: | ||||||||||||||||||||||||||||
Institutional Class | - | (2,845,735 | ) | - | (34,454 | ) | ||||||||||||||||||||||
Y Class | - | (3,511,778 | ) | - | (6,291 | ) | ||||||||||||||||||||||
Investor Class | - | (2,275,358 | ) | - | (1,298 | ) | ||||||||||||||||||||||
A Class | - | (293,772 | ) | - | (987 | ) | ||||||||||||||||||||||
C Class | - | (214,080 | ) | - | (422 | ) | ||||||||||||||||||||||
Ultra Class | - | - | - | (4,299,303 | ) | |||||||||||||||||||||||
Net realized gain from investments: | ||||||||||||||||||||||||||||
Institutional Class | - | - | - | (517 | ) | |||||||||||||||||||||||
Y Class | - | - | - | (1,675 | ) | |||||||||||||||||||||||
Investor Class | - | - | - | (244 | ) | |||||||||||||||||||||||
A Class | - | - | - | (173 | ) | |||||||||||||||||||||||
C Class | - | - | - | (172 | ) | |||||||||||||||||||||||
Ultra Class | - | - | - | (1,163,013 | ) | |||||||||||||||||||||||
Total retained earnings:* | ||||||||||||||||||||||||||||
Institutional Class | (6,063,094 | ) | - | (51,527 | ) | - | ||||||||||||||||||||||
Y Class | (11,141,405 | ) | - | (21,812 | ) | - | ||||||||||||||||||||||
Investor Class | (3,746,033 | ) | - | (5,902 | ) | - | ||||||||||||||||||||||
A Class | (291,836 | ) | - | (3,999 | ) | - | ||||||||||||||||||||||
C Class | (743,483 | ) | - | (3,911 | ) | - | ||||||||||||||||||||||
Ultra Class | - | - | (18,802,091 | ) | - | |||||||||||||||||||||||
Tax return of capital: | ||||||||||||||||||||||||||||
Institutional Class | - | - | - | (152 | ) | |||||||||||||||||||||||
Y Class | - | - | - | (491 | ) | |||||||||||||||||||||||
Investor Class | - | - | - | (72 | ) | |||||||||||||||||||||||
A Class | - | - | - | (51 | ) | |||||||||||||||||||||||
C Class | - | - | - | (50 | ) | |||||||||||||||||||||||
Ultra Class | - | - | - | (341,068 | ) | |||||||||||||||||||||||
|
|
|
|
|
|
|
| |||||||||||||||||||||
Net distributions to shareholders | (21,985,851 | ) | (9,140,723 | ) | (18,889,242 | ) | (5,850,433 | ) | ||||||||||||||||||||
|
|
|
|
|
|
|
| |||||||||||||||||||||
Capital share transactions (Note 10): |
| |||||||||||||||||||||||||||
Proceeds from sales of shares | 175,310,369 | 148,370,285 | 179,029,117 | 793,714,239 | ||||||||||||||||||||||||
Reinvestment of dividends and distributions | 18,991,501 | 8,065,854 | 18,844,081 | 184,104 | ||||||||||||||||||||||||
Cost of shares redeemed | (91,797,512 | ) | (26,890,130 | ) | (462,806,614 | ) | (104,815,311 | ) | ||||||||||||||||||||
Redemption fees | 88,999 | 11,114 | - | - | ||||||||||||||||||||||||
|
|
|
|
|
|
|
| |||||||||||||||||||||
Net increase (decrease) in net assets from capital share transactions | 102,593,357 | 129,557,123 | (264,933,416 | ) | 689,083,032 | |||||||||||||||||||||||
|
|
|
|
|
|
|
| |||||||||||||||||||||
Net increase (decrease) in net assets | 75,863,100 | 137,090,906 | (276,129,541 | ) | 670,242,321 | |||||||||||||||||||||||
|
|
|
|
|
|
|
| |||||||||||||||||||||
Net assets: |
| |||||||||||||||||||||||||||
Beginning of period | 200,347,989 | 63,257,083 | 745,584,282 | 75,341,961 | ||||||||||||||||||||||||
|
|
|
|
|
|
|
| |||||||||||||||||||||
End of period | $ | 276,211,089 | $ | 200,347,989 | $ | 469,454,741 | $ | 745,584,282 | ||||||||||||||||||||
|
|
|
|
|
|
|
| |||||||||||||||||||||
* Distributions from net investment income and net realized capital gains are combined for the year ended January 31, 2019. See Note 1 in the Notes to Financial Statements for more information regarding new accounting pronouncements. |
| |||||||||||||||||||||||||||
See accompanying notes
34
Notes to Financial Statements
January 31, 2019
1. Organization and Significant Accounting Policies
American Beacon Funds (the “Trust”), is organized as a Massachusetts business trust. The Funds, each a series within the Trust, are registered under the Investment Company Act of 1940, as amended (the “Act”), as diversified,open-end management investment companies. As of January 31, 2019, the Trust consists of thirty-three active series, two of which are presented in this filing: American Beacon Frontier Markets Income Fund and American Beacon GLG Total Return Fund (collectively, the “Funds” and each individually a “Fund”). The remainingthirty-one active series are reported in separate filings. The American Beacon Frontier Markets Income Fund is registered as a diversified fund and American Beacon GLG Total Return Fund is registered as non-diversified. From February 1, 2018 to June 14, 2018, the American Beacon Frontier Markets Income Fund was known as American Beacon Global Evolution Frontier Markets Income Fund.
American Beacon Advisors, Inc. (the “Manager”) is a Delaware corporation and a wholly-owned subsidiary of Resolute Investment Managers, Inc. (“RIM”) organized in 1986 to provide business management, advisory, administrative, and asset management consulting services to the Trust and other investors. The Manager is registered as an investment advisor under the Investment Advisers Act of 1940, as amended (the “Advisers Act”). RIM is, in turn, a wholly-owned subsidiary of Resolute Acquisition, Inc., which is a wholly-owned subsidiary of Resolute Topco, Inc., a wholly-owned subsidiary of Resolute Investment Holdings, LLC (“RIH”). RIH is owned primarily by Kelso Investment Associates VIII, L.P., KEP VI, LLC and Estancia Capital Partners L.P., investment funds affiliated with Kelso & Company, L.P. (“Kelso”) or Estancia Capital Management, LLC (“Estancia”), which are private equity firms.
Recently Adopted Accounting Pronouncements
In March 2017, the Financial Accounting Standards Board (“FASB”) issued Accounting Standards Update (“ASU”)2017-08,Premium Amortization of Purchased Callable Debt Securities. The amendments in the ASU shorten the premium amortization period on a purchased callable debt security from the security’s contractual life to the earliest call date. It is anticipated that this change will enhance disclosures by reducing losses recognized when a security is called on an earlier date. This ASU is effective for fiscal years beginning after December 15, 2018. The Manager continues to evaluate the impact this ASU will have on the financial statements and other disclosures.
In August 2018, the FASB issued ASU2018-13,Fair Value Measurement (“Topic 820”). The amendments in the ASU impact disclosure requirements for fair value measurement. It is anticipated that this change will enhance the effectiveness of disclosures in the notes to the financial statements. This ASU is effective for fiscal years beginning after December 15, 2019. Early adoption is permitted and can include the entire standard or certain provisions that exclude or amend disclosures. For the year ended January 31, 2019, the Funds have chosen to adopt the standard. The adoption of this ASU guidance did not have a material impact on the financial statements and other disclosures.
In August 2018, the U.S. Securities and Exchange Commission (“SEC”) adopted amendments to certain disclosure requirements in Securities Act ReleaseNo. 33-10532, Disclosure Update and Simplification, which is intended to facilitate the disclosure of information to investors and simplify compliance without significantly altering the total mix of information provided to investors. Effective with the current reporting period, the Funds adopted the amendments with the impacts being that the Funds are no longer required to present components of distributable earnings on the Statements of Assets and Liabilities or the sources of distributable earnings and the amount of undistributed net investment income on the Statements of Changes in Net Assets.
35
American Beacon FundsSM
Notes to Financial Statements
January 31, 2019
Class Disclosure
Each Fund has multiple classes of shares designed to meet the needs of different groups of investors; however, not all of the Funds offer all classes. The following table sets forth the differences amongst the classes:
Class | Eligible Investors | Minimum Initial Investments | ||||
| Institutional | Large institutional investors - sold directly or through intermediary channels. | $ | 250,000 | |||
| Y Class | Large institutional retirement plan investors - sold directly or through intermediary channels. | $ | 100,000 | |||
| Investor | All investors using intermediary organizations such as broker-dealers or retirement plan sponsors - sold directly through intermediary channels. | $ | 2,500 | |||
| A Class | All investors who invest through intermediary organizations, such as broker-dealers or third party administrator. Retail investors who invest directly through a financial intermediary such as a broker, bank, or registered investment advisor which may include afront-end sales charge and a contingent deferred sales charge (“CDSC”). | $ | 2,500 | |||
| C Class | Retail investors who invest directly through a financial intermediary such as a broker or through employee directed benefit plans with applicable sales charges which may include CDSC. | $ | 1,000 | |||
| Ultra | Large institutional investors - sold directly or through intermediary channels. The Manager may allow a reasonable period of time after opening an account for the Ultra Class for the investor to meet the initial investment requirement. In addition, for investors such as trust companies and financial advisors who make investments for a group of clients, the minimum initial investment can be met through aggregated purchase orders for more than one client. | $ | 500,000,000 | |||
Each class offered by the Trust has equal rights as to assets and voting privileges. Income andnon-class specific expenses are allocated daily to each class on the basis of the relative net assets. Realized and unrealized capital gains and losses of each class are allocated daily based on the relative net assets of each class of the respective Fund. Class specific expenses, where applicable, currently include service, distribution, transfer agent fees, andsub-transfer agent fees that vary amongst the classes as described more fully in Note 2.
Significant Accounting Policies
The following is a summary of significant accounting policies, consistently followed by the Funds in preparation of the financial statements. The Funds are considered investment companies and accordingly, follow the investment company accounting and reporting guidance of the FASB Accounting Standards Codification Topic 946,Financial Services - Investment Companies,a part of Generally Accepted Accounting Principles (“U.S. GAAP”).
Security Transactions and Investment Income
Security transactions are recorded as of the trade date for financial reporting purposes. Securities purchased or sold on a when-issued or delayed-delivery basis may be settled beyond a standard settlement period for the security after the trade date.
Dividend income, net of foreign taxes, is recorded on theex-dividend date, except certain dividends from foreign securities which are recorded as soon as the information is available to the Funds. Interest income, net of foreign taxes, is earned from settlement date, recorded on the accrual basis, and adjusted, if necessary, for accretion of discounts and amortization of premiums. Realized gains (losses) from securities sold are determined on the basis of specific lot identification.
Currency Translation
All assets and liabilities initially expressed in foreign currency values are converted into U.S. dollar values at the mean of the bid and ask prices of such currencies against U.S. dollars as last quoted by a recognized dealer.
36
American Beacon FundsSM
Notes to Financial Statements
January 31, 2019
Income, expenses, and purchases and sales of investments are translated into U.S. dollars at the rate of the exchange prevailing on the respective dates of such transactions. The effect of changes in foreign currency exchange rates on investments is separately identified from the fluctuations arising from changes in market values of securities held and is reported with all other foreign currency gains and losses on the Funds’ Statements of Operations.
Distributions to Shareholders
Distributions, if any, of net investment income are generally paid at least annually and recorded on theex-dividend date. Distributions, if any, of net realized capital gains are generally paid at least annually and recorded on theex-dividend date. Dividends to shareholders are determined in accordance with federal income tax regulations, which may differ in amount and character from net investment income and realized gains recognized for purposes of U.S. GAAP.
Allocation of Income, Trust Expenses, Gains, and Losses
Investment income, realized and unrealized gains and losses from investments of the Funds are allocated daily to each class of shares based upon the relative proportion of net assets of each class to the total net assets of the Funds. Expenses directly charged or attributable to any Fund will be paid from the assets of the Fund. Generally, expenses of the Trust will be allocated among and charged to the assets of the Funds on a basis that the Trust’s Board of Trustees (the “Board”) deems fair and equitable, which may be based on the relative net assets of the Funds or nature of the services performed and relative applicability to the Funds.
Use of Estimates
The preparation of financial statements in conformity with U.S. GAAP requires management to make estimates and assumptions that affect the amounts reported in the financial statements and accompanying notes. Actual results may differ from those estimated.
Redemption Fees
All Classes of the Frontier Markets Fund impose a 2% redemption fee on shares held for less than 90 days. The fee is deducted from the redemption proceeds and is intended to offset the trading costs, market impact, and other costs associated with short-term trading activity in the Fund. The“first-in,first-out” method is used to determine the holding period. The fee is allocated to all classes of this Fundpro-rata based on the net assets.
Other
Under the Trust’s organizational documents, its officers and trustees are indemnified against certain liabilities arising out of the performance of their duties to the Trust. In the normal course of business, the Trust enters into contracts that provide indemnification to the other party or parties against potential costs or liabilities. The Trust’s maximum exposure under these arrangements is dependent on claims that may be made in the future and, therefore, cannot be estimated. The Trust has had no prior claims or losses pursuant to any such agreement.
2. Transactions with Affiliates
Management and InvestmentSub-Advisory Agreements
The Funds and the Manager are parties to a Management Agreement that obligates the Manager to provide the Funds with investment advisory and administrative services. As compensation for performing the duties under
37
American Beacon FundsSM
Notes to Financial Statements
January 31, 2019
the Management Agreement, the Manager will receive an annualized management fee based on a percentage of the Funds’ average daily net assets that is calculated and accrued daily according to the following schedule:
First $5 billion | 0.35 | % | ||
Next $5 billion | 0.325 | % | ||
Next $10 billion | 0.30 | % | ||
Over $20 billion | 0.275 | % |
The Trust, on behalf of the Funds, and the Manager have entered into an Investment Advisory Agreements with Aberdeen Asset Managers Limited and Global Evolution USA, LLC for the Frontier Markets Fund and GLG LLC for the GLG Total Return Fund (the“Sub-Advisors”) pursuant to which each Fund has agreed to pay an annualizedsub-advisory fee that is calculated and accrued daily based on the Funds’ average daily net assets according to the following schedules:
Aberdeen Asset Managers Limited
All Assets | 0.50 | % |
Global Evolution USA, LLC
All Assets | 0.50 | % |
GLG LLC
First $500 million | 0.60 | % | ||
Next $500 million | 0.55 | % | ||
Over $1 billion | 0.50 | % |
The Management andSub-Advisory Fees paid by the Funds for the year ended January 31, 2019 were as follows:
Frontier Markets Income Fund
| Effective Fee Rate | Amount of Fees Paid | |||||||||||
Management Fees | 0.35 | % | $ | 905,830 | ||||||||
Sub-Advisor Fees | 0.50 | % | 1,295,876 | |||||||||
|
|
|
| |||||||||
Total | 0.85 | % | $ | 2,201,706 | ||||||||
|
|
|
| |||||||||
GLG Total Return Fund
| Effective Fee Rate | Amount of Fees Paid | |||||||||||
Management Fees | 0.35 | % | $ | 2,401,278 | ||||||||
Sub-Advisor Fees | 0.59 | % | 4,030,947 | |||||||||
|
|
|
| |||||||||
Total | 0.94 | % | $ | 6,432,225 | ||||||||
|
|
|
| |||||||||
Distribution Plans
The Funds, except for the A and C Classes of the Funds, have adopted a “defensive” Distribution Plan (the “Plan”) in accordance with Rule12b-1 under the Act, pursuant to which no separate fees may be charged to the Funds for distribution purposes. However, the Plan authorizes the management fee received by the Manager and the investment advisors hired by the Manager to be used for distribution purposes. Under this Plan, the Funds do not intend to compensate the Manager or any other party, either directly or indirectly, for the distribution of Fund shares.
Separate Distribution Plans (the “Distribution Plans”) have been adopted pursuant to Rule12b-1 under the Act for the A and C Classes of the Funds. Under the Distribution Plans, as compensation for distribution and shareholder servicing assistance, the Manager receives an annual fee of 0.25% of the average daily net assets of the
38
American Beacon FundsSM
Notes to Financial Statements
January 31, 2019
A Class and 1.00% of the average daily net assets of the C Class. The fee will be payable without regard to whether the amount of the fee is more or less than the actual expenses incurred in a particular month by the Manager for distribution assistance.
Service Plans
The Manager and the Trust entered into Service Plans that obligates the Manager to oversee additional shareholder servicing of the Investor, A, and C Classes of the Funds. As compensation for performing the duties required under the Service Plans, the Manager receives an annualized fee up to 0.25% of the average daily net assets of the A and C Classes, and up to 0.375% of the average daily net assets of the Investor Class of the Funds.
Sub-Transfer Agent Fees
The Manager has entered into agreements, which include servicing agreements, with financial intermediaries that provide recordkeeping, processing, shareholder communications and other services to customers of the intermediaries that hold positions in the Institutional and Y Classes of the Funds and has agreed to compensate the intermediaries for providing these services. Intermediaries transact with the Funds primarily through the use of omnibus accounts on behalf of their customers who hold positions in the Funds. Certain services would have been provided by the Funds’ transfer agent and other service providers if the shareholders’ accounts were maintained directly by the Funds’ transfer agent. Accordingly, the Funds, pursuant to Board approval, have agreed to reimburse the Manager for certainnon-distribution shareholder services provided by financial intermediaries for the Institutional and Y Classes. The reimbursement amounts(sub-transfer agent fees) paid to the Manager are subject to a fee limit of up to 0.10% of an intermediary’s average net assets in the Institutional and Y Classes on an annual basis. During the year ended January 31, 2019, thesub-transfer agent fees, as reflected in “Transfer agent fees” on the Statements of Operations, were as follows:
Fund | Sub-Transfer Agent Fees | |||
Frontier Markets Income | $ | 124,582 | ||
GLG Total Return | 758 | |||
As of January 31, 2019, the Funds owed the Manager the following reimbursement ofsub-transfer agent fees, as reflected in “Transfer agent fees payable” on the Statements of Assets and Liabilities:
Fund | Reimbursement Sub-Transfer Agent Fees | |||
Frontier Markets Income | $ | 11,515 | ||
GLG Total Return | 56 | |||
Investments in Affiliated Funds
The Funds may invest in the American Beacon U.S. Government Money Market Select Fund (the “USG Select Fund”). The Funds and the USG Select Fund have the same investment advisor and therefore, are considered to be affiliated. The Manager serves as investment advisor to the USG Select Fund and receives management fees and administrative fees totaling 0.10% of the average daily net assets of the USG Select Fund. During the year ended January 31, 2019, the Manager earned fees on the Funds’ direct investments in the USG Select Fund as shown below:
Fund | Direct Investments in USG Select Fund | |||
Frontier Markets Income | $ | 26,751 | ||
GLG Total Return | 9,820 | |||
Interfund Credit Facility
Pursuant to an exemptive order issued by the SEC, the Funds, along with other registered investment companies having management contracts with the Manager, may participate in a credit facility whereby each fund,
39
American Beacon FundsSM
Notes to Financial Statements
January 31, 2019
under certain conditions, is permitted to lend money directly to and borrow directly from other participating funds for temporary purposes. The interfund credit facility is advantageous to the funds because it provides added liquidity, and eliminates the need to maintain higher cash balances to meet redemptions. This situation could arise when shareholder redemptions exceed anticipated volumes and certain funds have insufficient cash on hand to satisfy such redemptions or when sales of securities do not settle as expected, resulting in a cash shortfall for a fund. When a fund liquidates portfolio securities to meet redemption requests, they often do not receive payment in settlement for up to two days (or longer for certain foreign transactions). Redemption requests normally are satisfied on the next business day. The credit facility provides a source of immediate, short-term liquidity pending settlement of the sale of portfolio securities. The credit facility is administered by a credit facility team consisting of professionals from the Manager’s asset management, compliance, and accounting areas who report the activities of the credit facility to the Board. During the year ended January 31, 2019, the Funds did not utilize the credit facility.
Expense Reimbursement Plan
The Manager contractually agreed to reduce fees and/or reimburse expenses for the classes of the Funds to the extent that total operating expenses exceed the Funds’ expense cap. During the year ended January 31, 2019, the Manager waived and/or reimbursed expenses as follows:
| Expense Cap | Expiration of Reimbursed Expenses | |||||||||||||||||||||
Fund | Class | 2/1/2018 - 5/31/2018 | 6/1/2018 - 1/31/2019 | Reimbursed Expenses | (Recouped) Expenses | |||||||||||||||||
Frontier Markets Income | Institutional | 1.15 | % | 1.15 | % | $ | 19,340 | $ | - | 2022 | ||||||||||||
Frontier Markets Income | Y | 1.25 | % | 1.25 | % | 21,972 | - | 2022 | ||||||||||||||
Frontier Markets Income | Investor | 1.53 | % | N/A | - | (918 | ) | 2022 | ||||||||||||||
Frontier Markets Income | A | 1.55 | % | N/A | - | (6,592 | ) | 2022 | ||||||||||||||
Frontier Markets Income | C | 2.30 | % | N/A | - | (4,575 | ) | 2022 | ||||||||||||||
GLG Total Return | Institutional | 1.05 | % | N/A | - | (232 | ) | 2022 | ||||||||||||||
GLG Total Return | Y | 1.15 | % | 1.15 | % | - | (655 | ) | 2022 | |||||||||||||
GLG Total Return | Investor | 1.43 | % | 1.43 | % | 578 | - | 2022 | ||||||||||||||
GLG Total Return | A | 1.45 | % | N/A | - | (155 | ) | 2022 | ||||||||||||||
GLG Total Return | C | 2.20 | % | N/A | - | (152 | ) | 2022 | ||||||||||||||
GLG Total Return | Ultra | 0.95 | % | 0.95 | % | 623,717 | - | 2022 | ||||||||||||||
Of these amounts, $61,771 and $50,243 were disclosed as a receivable from the Manager on the Statements of Assets and Liabilities at January 31, 2019 for the Frontier Markets Income Fund and GLG Total Return Fund, respectively.
The Funds have adopted an Expense Reimbursement Plan whereby the Manager may seek repayment of such fee reductions and expense reimbursements. Under the policy, the Manager can be reimbursed by the Funds for any contractual or voluntary fee reductions or expense reimbursements if reimbursement to the Manager (a) occurs within three years after the Manager’s own waiver or reimbursement and (b) does not cause the Funds’ annual operating expenses to exceed the lesser of the contractual percentage limit in effect at the time of the waiver/reimbursement or time of recoupment. The reimbursed expenses listed above will expire in 2022. The carryover of excess expenses potentially reimbursable to the Manager are as follows:
Fund | Recouped Expenses | Excess Expense Carryover | Expired Expense Carryover | Expiration of Reimbursed Expenses | ||||||||||||
Frontier Markets Income | $ | - | $ | 18,592 | $ | - | 2019 | |||||||||
Frontier Markets Income | - | 63,671 | (1) | - | 2020 | |||||||||||
Frontier Markets Income | - | 33,532 | - | 2021 | ||||||||||||
GLG Total Return | 226 | 262,037 | - | 2020 | ||||||||||||
GLG Total Return | 226 | 669,221 | - | 2021 | ||||||||||||
| (1) | Contractual expense caps were removed from the Institutional, Y, Investor, and A Classes on May 29, 2016. Voluntary expense caps were reinstated November 29, 2016 for the Institutional, Y, Investor, and A Classes. |
40
American Beacon FundsSM
Notes to Financial Statements
January 31, 2019
Sales Commissions
The Funds’ Distributor, formerly Foreside, may receive a portion of Class A sales charges from broker dealers and it may be used to offset distribution related expenses. During the period February 1, 2018 through February 28, 2018, Foreside collected $804 for the Frontier Markets Income Fund for the sale of Class A Shares. During the period March 1, 2018 through January 31, 2019, RID collected $6,451 the Frontier Markets Income Fund for the sale of Class A Shares. Foreside and RID did not collect any Class A sales charges for GLG Total Return Fund during the year ended January 31, 2019.
A CDSC of 0.50% will be deducted with respect to Class A Shares on certain purchases of $1,000,000 or more that are redeemed in whole or part within 18 months of purchase, unless waived as discussed in the Funds’ Prospectus. Any applicable CDSC will be 0.50% of the lesser of the original purchase price or the value of the redemption of the Class A Shares redeemed. During the year ended January 31, 2019, there were no CDSC fees collected for Class A Shares of the Funds.
A CDSC of 1.00% will be deducted with respect to Class C Shares redeemed within 12 months of purchase, unless waived as discussed in the Funds’ Prospectus. Any applicable CDSC will be 1.00% of the lesser of the original purchase price or the value of the redemption of the Class C Shares redeemed. During the period February 1, 2018 through February 28, 2018, CDSC fees of $100 were collected by Foreside for Class C Shares of the Frontier Markets Income Fund. During the period March 1, 2018 through January 31, 2019, RID collected $3,076 in CDSC fees for Frontier Markets Income Fund for Class C Shares. Foreside and RID did not collect any CDSC fees for Class C Shares for GLG Total Return Fund during the year ended January 31, 2019.
Trustee Fees and Expenses
As compensation for their service to the Trust, American Beacon Select Funds, American Beacon Institutional Funds Trust, American Beacon Sound Point Enhanced Income Fund, and American Beacon Apollo Total Return Fund, each Trustee receives an annual retainer of $120,000, plus $10,000 for each Board meeting attended in person or via teleconference, $2,500 for attendance by Committee members at meetings of the Audit Committee and the Investment Committee, and $1,500 for attendance by Committee members at meetings of the Nominating and Governance Committee, plus reimbursement of reasonable expenses incurred in attending Board meetings, Committee meetings, and relevant educational seminars. The Trustees also may be compensated for attendance at special Board and/or Committee meetings from time to time. The Board Chair receives an additional annual retainer of $50,000 as well as a $2,500 fee each quarter for attendance at the committee meetings. The Chairpersons of the Audit Committee and the Investment Committee each receive an additional annual retainer of $25,000 and the Chairman of the Nominating and Governance Committee receives an additional annual retainer of $10,000. These expenses are allocated on a prorated basis to each Fund of the Trusts according to its respective net assets.
3. Security Valuation and Fair Value Measurements
The price of the Fund’s shares is based on its net asset value (“NAV”) per share. The Fund’s NAV is computed by adding total assets, subtracting all the Fund’s liabilities, and dividing the result by the total number of shares outstanding.
The NAV of each class of the Fund’s shares is determined based on a pro rata allocation of the Fund’s investment income, expenses and total capital gains and losses. The Fund’s NAV per share is determined each business day as of the regular close of trading on the New York Stock Exchange (“NYSE” or “Exchange”), which is typically 4:00 p.m. Eastern Time (“ET”). However, if trading on the NYSE closes at a time other than 4:00 p.m. ET, the Fund’s NAV per share typically would still be determined as of the regular close of trading on the NYSE. The Fund does not price its shares on days that the NYSE is closed. Foreign exchanges may permit trading in foreign securities on days when the Fund is not open for business, which may result in the value of the Fund’s portfolio investments being affected at a time when you are unable to buy or sell shares.
41
American Beacon FundsSM
Notes to Financial Statements
January 31, 2019
Equity securities, including shares ofclosed-end funds and exchange-traded funds (“ETFs”), are valued at the last sale price or official closing price taken from the primary exchange in which each security trades. Investments in other mutual funds are valued at the closing NAV per share on the day of valuation. Debt securities are valued at bid quotes from broker/dealers or evaluated bid prices from pricing services, who may consider a number of inputs and factors, such as prices of comparable securities, yield curves, spreads, credit ratings, coupon rates, maturity, default rates, and underlying collateral. Futures are valued based on their daily settlement prices. Exchange-traded andover-the-counter (“OTC”) options are valued at the last sale price. Options with no last sale for the day are priced at mid quote. Swaps are valued at evaluated mid prices from pricing services.
The valuation of securities traded on foreign markets and certain fixed income securities will generally be based on prices determined as of the earlier closing time of the markets on which they primarily trade unless a significant event has occurred. When the Fund holds securities or other assets that are denominated in a foreign currency, the Fund will normally use the currency exchange rates as of 4:00 p.m. ET.
Securities may be valued at fair value, as determined in good faith and pursuant to procedures approved by the Board, under certain limited circumstances. For example, fair value pricing will be used when market quotations are not readily available or reliable, as determined by the Manager, such as when (i) trading for a security is restricted or stopped; (ii) a security’s trading market is closed (other than customary closings); or (iii) a security has beende-listed from a national exchange. A security with limited market liquidity may require fair value pricing if the Manager determines that the available price does not reflect the security’s true market value. In addition, if a significant event that the Manager determines to affect the value of one or more securities held by the Fund occurs after the close of a related exchange but before the determination of the Fund’s NAV, fair value pricing may be used on the affected security or securities. Securities of small-capitalization companies are also more likely to require a fair value determination using these procedures because they are more thinly traded and less liquid than the securities of larger-capitalization companies. The Fund may fair value securities as a result of significant events occurring after the close of the foreign markets in which the Fund invests as described below. In addition, the Fund may invest in illiquid securities requiring these procedures.
The Fund may use fair value pricing for securities primarily traded innon-U.S. markets because most foreign markets close well before the Fund’s pricing time of 4:00 p.m. ET. The earlier close of these foreign markets gives rise to the possibility that significant events, including broad market moves, may have occurred in the interim and may materially affect the value of those securities. If the Manager determines that the last quoted prices ofnon-U.S. securities will, in its judgment, materially affect the value of some or all its portfolio securities, the Manager can adjust the previous closing prices to reflect what it believes to be the fair value of the securities as of the close of the Exchange. In deciding whether it is necessary to adjust closing prices to reflect fair value, the Manager reviews a variety of factors, including developments in foreign markets, the performance of U.S. securities markets, and the performance of instruments trading in U.S. markets that represent foreign securities and baskets of foreign securities. These securities are fair valued using a pricing service, using methods approved by the Board, that considers the correlation of the trading patterns of the foreign security to intraday trading in the U.S. markets, based on indices of domestic securities and other appropriate indicators such as prices of relevant American Depositary Receipts (“ADRs”) and futures contracts. The Valuation Committee, established by the Board, may also fair value securities in other situations, such as when a particular foreign market is closed but the Fund is open. The Fund uses outside pricing services to provide closing prices and information to evaluate and/or adjust those prices. As a means of evaluating its security valuation process, the Valuation Committee routinely compares closing prices, the next day’s opening prices in the same markets and adjusted prices.
Attempts to determine the fair value of securities introduce an element of subjectivity to the pricing of securities. As a result, the price of a security determined through fair valuation techniques may differ from the price quoted or published by other sources and may not accurately reflect the market value of the security when trading resumes. If a reliable market quotation becomes available for a security formerly valued through fair valuation techniques, the Manager compares the new market quotation to the fair value price to evaluate the effectiveness of the Fund’s fair valuation procedures. If any significant discrepancies are found, the Manager may adjust the Fund’s fair valuation procedures.
42
American Beacon FundsSM
Notes to Financial Statements
January 31, 2019
Valuation Inputs
Various inputs may be used to determine the fair value of the Funds’ investments. These inputs are summarized in three broad levels for financial statement purposes. The inputs or methodologies used to value securities are not necessarily an indication of the risk associated with investing in those securities.
| Level 1 | - | Quoted prices in active markets for identical securities. | ||
| Level 2 | - | Prices determined using other significant observable inputs. These may include quoted prices for similar securities, interest rates, prepayment speeds, credit risk, and others. | ||
| Level 3 | - | Prices determined using other significant unobservable inputs. Unobservable inputs reflect the Fund’s own assumptions about the factors market participants would use in pricing an investment. | ||
Level 1 and Level 2 trading assets and trading liabilities, at fair value
Fixed-income securities including corporate, convertible and municipal bonds and notes, U.S. government agencies, U.S. Treasury obligations, sovereign issues, bank loans, convertible preferred securities, andnon-U.S. bonds are normally valued by pricing service providers that use broker dealer quotations, reported trades or valuation estimates from their internal pricing models. The service providers’ internal models use inputs that are observable such as issuer details, interest rates, yield curves, prepayment speeds, credit risks/spreads, default rates, and quoted prices for similar assets. Securities that use similar valuation techniques and inputs as described above are categorized as Level 2 of the fair value hierarchy. Fixed-income securities purchased on a delayed-delivery basis aremarked-to-market daily until settlement at the forward settlement date and are categorized as Level 2 of the fair value hierarchy.
Common stocks, ETFs, and financial derivative instruments, such as futures contracts or options that are that are traded on a national securities exchange, are stated at the last reported sale or settlement price on the day of valuation. To the extent these securities are actively traded and valuation adjustments are not applied, they are categorized as Level 1 of the fair value hierarchy. Preferred securities and other equities traded on inactive markets or valued by reference to similar instruments are generally categorized as Level 2 of the fair value hierarchy.
Investments in registeredopen-end investment management companies will be valued based upon the NAVs of such investments and are categorized as Level 1 of the fair value hierarchy.
Over-the-counter (“OTC”) financial derivative instruments, such as foreign currency contracts and structured notes, derive their value from underlying asset prices, indices, reference rates, and other inputs or a combination of these factors. These contracts are normally valued on the basis of broker dealer quotations or pricing service providers. Depending on the product and the terms of the transaction, the fair value of the financial derivative contracts can be estimated by a pricing service provider using a series of techniques, including simulation pricing models. The pricing models use inputs that are observed from actively quoted markets such as issuer details, indices, spreads, interest rates, curves, dividends, and exchange rates. Financial derivatives that use similar valuation techniques and inputs as described above are categorized as Level 2 of the fair value hierarchy.
Level 3 trading assets and trading liabilities, at fair value
The valuation techniques and significant inputs used in determining the fair values of financial instruments classified as Level 3 of the fair value hierarchy are as follows.
Securities and other assets for which market quotes are not readily available are valued at fair value as determined in good faith by the Board or persons acting at their direction and may be categorized as Level 3 of the fair value hierarchy.
43
American Beacon FundsSM
Notes to Financial Statements
January 31, 2019
Market quotes are considered not readily available in circumstances where there is an absence of current or reliable market-based data (e.g., trade information or broker quotes), including where events occur after the close of the relevant market, but prior to the Exchange close, that materially affect the values of the Fund’s securities or assets. In addition, market quotes are considered not readily available when, due to extraordinary circumstances, the exchanges or markets on which the securities trade, do not open for trading for the entire day and no other market prices are available. The Board has delegated to the Manager the responsibility for monitoring significant events that may materially affect the fair values of a Fund’s securities or assets and for determining whether the value of the applicable securities or assets should bere-evaluated in light of such significant events.
The Board has adopted methods for valuing securities and other assets in circumstances where market quotes are not readily available, and has delegated the responsibility for applying the valuation methods to the Manager. For instances in which daily market quotes are not readily available, investments may be valued pursuant to guidelines established by the Board. In the event that the security or asset cannot be valued, pursuant to one of the valuation methods established by the Board, the fair value of the security or asset will be determined in good faith by the Valuation Committee, generally based upon recommendations provided by the Manager.
When a Fund uses fair valuation methods applied by the Manager that use significant unobservable inputs to determine its NAV, the securities priced using this methodology are categorized as Level 3 of the fair value hierarchy. These methods may require subjective determinations about the value of a security. While the Trust’s policy is intended to result in a calculation of the Fund’s NAV that fairly reflects security values as of the time of pricing, the Trust cannot guarantee that values determined by the Board or persons acting at their direction would accurately reflect the price that a Fund could obtain for a security if it were to dispose of that security as of the time of pricing (for instance, in a forced or distressed sale). The prices used by a Fund may differ from the value that would be realized if the securities were sold.
4. Securities and Other Investments
Credit-Linked Notes
The Frontier Markets Income Fund may invest in credit-linked notes (“CLNs”). CLNs are derivative debt obligations that are issued by limited purpose entities, such as Special Purpose Vehicles (“SPVs”), or by financial firms, such as banks, securities firms or their affiliates. They are structured so that their performance is linked to that of an underlying bond or other debt obligation (a “reference asset”), normally by means of an embedded or underlying credit default swap. The reference assets for the CLNs in which the Fund may invest will be limited to sovereign or quasi-sovereign debt instruments or other investments in which the Fund’s investment policies permit it to invest directly. The Fund may invest in CLNs when the Fund’sSub-Advisor believes that doing so is more efficient than investing in the reference assets directly or when such direct investment by the Fund is not feasible due to legal or other restrictions.
The issuer or one of the affiliates of the issuer of the CLNs in which the Fund will invest, normally will purchase the reference asset underlying the CLN directly, but in some cases it may gain exposure to the reference asset through a credit default swap or other derivative. Under the terms of a CLN, the Fund will receive a fixed or variable rate of interest on the outstanding principal amount of the CLN, which in turn will be subject to reduction (potentially down to zero) if a “credit event” occurs with respect to the underlying reference asset or its issuer. Such credit events will include payment defaults on the reference asset, and normally will also include events that do not involve an actual default, such as actual or potential insolvencies, repudiations of indebtedness, moratoria on payments, reference asset restructurings, limits on the convertibility or repatriation of currencies, and the imposition of ownership restrictions. If a credit event occurs, payments on the CLN would terminate, and the Fund normally would receive delivery of the underlying reference asset (or, in some cases, a comparable “deliverable” asset) in lieu of the repayment of principal. In some cases, however, including but not limited to instances where there has been a market disruption or in which it is or has become illegal, impossible or impracticable for the Fund to purchase, hold or receive the reference assets, the Fund may receive a cash settlement based on the value of the reference asset or a comparable instrument, less fees charged and certain expenses incurred by the CLN issuer.
44
American Beacon FundsSM
Notes to Financial Statements
January 31, 2019
CLNs are debt obligations of the CLN issuers, and the Fund would have no ownership or other property interest in the reference assets (other than following a credit event that results in the reference assets being delivered to the Fund) or any direct recourse to the issuers of those reference assets. Thus, the Fund will be exposed to the credit risk of the issuers of the reference assets that underlie its CLNs, as well as to the credit risk of the issuers of the CLNs themselves. CLNs will also be subject to currency risk, liquidity risk, valuation risks, and the other risks of a credit default swap. Various determinations that may need to be made with respect to the CLNs, including the occurrence of a credit event, the selection of deliverable assets (where applicable) and the valuation of the reference asset for purposes of determining any cash settlement amount, normally will be made by the issuer or sponsor of the CLN. The interests of such issuer or sponsor may not be aligned with those of the Fund or other investors in the CLN. Accordingly, CLNs may also be subject to potential conflicts of interest. There may be no established trading market for the Fund’s CLNs, in which event they may constitute illiquid investments.
Fixed-Income Investments
The Funds may hold debt, including government and corporate debt, and other fixed-income securities. Typically, the values of fixed-income securities change inversely with prevailing interest rates. Therefore, a fundamental risk of fixed-income securities is interest rate risk, which is the risk that their value will generally decline as prevailing interest rates rise, which may cause the Funds’ net asset value to likewise decrease, and vice versa. How specific fixed-income securities may react to changes in interest rates will depend on the specific characteristics of each security. For example, while securities with longer maturities tend to produce higher yields, they also tend to be more sensitive to changes in prevailing interest rates and are, therefore, more volatile than shorter-term securities and are subject to greater market fluctuations as a result of changes in interest rates. Fixed-income securities are also subject to credit risk, which is the risk that the credit strength of an issuer of a fixed-income security will weaken and/or that the issuer will be unable to make timely principal and interest payments and that the security may go into default. In addition, there is prepayment risk, which is the risk that during periods of falling interest rates, certain fixed-income securities with higher interest rates, such as mortgage- and asset-backed securities, may be prepaid by their issuers thereby reducing the amount of interest payments. This may result in a Fund having to reinvest its proceeds in lower yielding securities. Securities underlying mortgage- and asset-backed securities, which may include subprime mortgages, also may be subject to a higher degree of credit risk, valuation risk, and liquidity risk.
Foreign Debt Securities
The Funds may invest in foreign fixed and floating rate income securities (including emerging market securities) all or a portion of which may benon-U.S. dollar denominated and which include: (a) debt obligations issued or guaranteed by foreign national, provincial, state, municipal or other governments with taxing authority or by their agencies or instrumentalities, including Brady Bonds; (b) debt obligations of supranational entities; (c) debt obligations of the U.S. Government issued innon-dollar securities; (d) debt obligations and other fixed income securities of foreign corporate issuers (both dollar andnon-dollar denominated); and (e) U.S. corporate issuers (both Eurodollar andnon-dollar denominated). There is no minimum rating criteria for the Funds’ investments in such securities. Investing in the securities of foreign issuers involves special considerations that are not typically associated with investing in the securities of U.S. issuers. In addition, emerging markets are markets that have risks that are different and higher than those in more developed markets.
Foreign Securities
The Funds may invest in U.S. dollar-denominated andnon-U.S. dollar denominated equity and debt securities of foreign issuers and foreign branches of U.S. banks, including negotiable certificates of deposit (“CDs”), bankers’ acceptances, and commercial paper. Foreign issuers are issuers organized and doing business principally outside the United States and include corporations, banks,non-U.S. governments, and quasi-governmental organizations. While investments in foreign securities may be intended to reduce risk by providing further diversification, such investments involve sovereign and other risks, in addition to the credit and market risks
45
American Beacon FundsSM
Notes to Financial Statements
January 31, 2019
normally associated with domestic securities. These additional risks include the possibility of adverse political and economic developments (including political or social instability, nationalization, expropriation, or confiscatory taxation); the potentially adverse effects of unavailability of public information regarding issuers, different governmental supervision and regulation of financial markets, reduced liquidity of certain financial markets, and the lack of uniform accounting, auditing, and financial reporting standards or the application of standards that are different or less stringent than those applied in the United States; different laws and customs governing securities tracking; and possibly limited access to the courts to enforce the Funds’ rights as an investor.
Frontier and Emerging Market Investments
The Funds may invest in the securities and derivatives with exposure to various countries with emerging capital markets. Investments in the securities and derivatives with exposure to countries with emerging capital markets involve significantly higher risks not involved in investments in securities in more developed capital markets, such as (i) low ornon-existent trading volume, resulting in a lack of liquidity and increased volatility in prices for such securities, as compared to securities from more developed capital markets, (ii) uncertain national policies and social, political and economic instability, increasing the potential for expropriation of assets, confiscatory taxation, high rates of inflation or unfavorable diplomatic developments, (iii) possible fluctuations in exchange rates, differing legal systems and the existence or possible imposition of exchange controls, custodial restrictions or othernon-U.S. or U.S. governmental laws or restrictions applicable to such investments, (iv) national policies that may limit the Fund’s investment opportunities such as restrictions on investment in issuers or industries deemed sensitive to national interests, (v) the lack or relatively early development of legal structures governing private and foreign investments and private property, and (vi) less diverse or immature economic structures. In addition to withholding taxes on investment income, some countries with emerging capital markets may impose differential capital gain taxes on foreign investors.
Illiquid and Restricted Securities
The Funds may invest in securities that are subject to legal or contractual restrictions on resale. These securities may be sold privately, but are required to be registered or exempted from such registration before being sold to the public. Private placement securities are generally considered to be restricted except for those securities traded between qualified institutional investors under the provisions of Rule 144A of the Securities Act of 1933 (the “Securities Act”). Illiquid securities have included securities that have not been registered under the Securities Act, securities that are otherwise not readily marketable, and repurchase agreements having a remaining maturity of longer than seven calendar days. Disposal of both illiquid and restricted securities may involve time-consuming negotiations and expenses, and prompt sale at an acceptable price may be difficult to achieve. Restricted securities outstanding during the year ended January 31, 2019 are disclosed in the Notes to the Schedule of Investments.
Regulation S under the Securities Act permits the sale abroad of securities that are not registered for sale in the United States and includes a provision for U.S. investors, such as the Funds, to purchase such unregistered securities if certain conditions are met.
Inflation-Indexed Bonds
The Funds may invest in inflation-indexed bonds. Inflation-indexed bonds are fixed-income securities whose principal value is periodically adjusted based on the rate of inflation. The interest rate on these bonds is generally fixed at issuance at a rate lower than typical bonds. Over the life of an inflation-indexed bond, however, interest will be paid based on principal value, which is adjusted for inflation. Any increase or decrease in the principal amount of an inflation-indexed bond will be included as interest income on the Statement of Operations, even though investors do not receive their principal until maturity.
46
American Beacon FundsSM
Notes to Financial Statements
January 31, 2019
Other Investment Company Securities and Other Exchange-Traded Products
The Funds may invest in shares of other investment companies, includingopen-end funds,closed-end funds, business development companies, ETFs, unit investment trusts, and other investment companies of the Trust. The Funds may invest in investment company securities advised by the Manager or asub-advisor. Investments in the securities of other investment companies may involve duplication of advisory fees and certain other expenses. By investing in another investment company, the Funds become a shareholder of that investment company. As a result, the Funds’ shareholders indirectly will bear the Funds’ proportionate share of the fees and expenses paid by shareholders of the other investment company, in addition to the fees and expenses the Funds’ shareholders directly bear in connection with the Funds’ own operations. These other fees and expenses are reflected as Acquired Fund Fees and Expenses and are included in the Fees and Expenses Table for the Funds in their Prospectus, if applicable. Investments in other investment companies may involve the payment of substantial premiums above the value of such issuer’s portfolio securities.
Sovereign and Quasi-Sovereign Government and Supranational Debt
The Funds can invest in debt securities issued or guaranteed by foreign governments and their political subdivisions or agencies which involve special risks. Sovereign debt differs from debt obligations issued by private entities in that, generally, remedies for defaults must be pursued in the courts of the defaulting party. Sovereign debt securities may include: debt securities issued or guaranteed by governments, governmental agencies or instrumentalities and political subdivisions located in emerging market countries; debt securities issued by government owned, controlled or sponsored entities located in emerging market countries; interests in entities organized and operated for the purpose of restructuring the investment characteristics of instruments issued by government owned, controlled or sponsored entities located in emerging market countries; interests in entities organized and operated for the purpose of restructuring the investment characteristics of instruments issued by any of the above issuers; participations in loans between emerging market governments and financial institutions; and Brady Bonds, which are debt securities issued under the framework of the Brady Plan as a means for debtor nations to restructure their outstanding external indebtedness.
Supranational entities may also issue debt securities. Supranational organizations are entities designated or supported by a government or governmental group to promote economic development. Included among these organizations are the Asian Development Bank, the European Investment Bank, the Inter-American Development Bank, the International Monetary Fund, the United Nations, the World Bank and the European Bank for Reconstruction and Development. Supranational organizations have no taxing authority and are dependent on their members for payments of interest and principal to the extent their assets are insufficient. Further, the lending activities of such entities are limited to a percentage of their total capital, reserves and net income.
Variable or Floating Rate Obligations
The interest rates payable on certainfixed-income securities in which the Funds may invest are not fixed and may fluctuate based upon changes in market rates. A variable rate obligation has an interest rate which is adjusted at predesignated periods in response to changes in the market rate of interest on which the interest rate is based. Variable and floating rate obligations are less effective than fixed rate instruments at locking in a particular yield. Nevertheless, such obligations may fluctuate in value in response to interest rate changes if there is a delay between changes in market interest rates and the interest reset date for the obligation, or for other reasons.
5. Financial Derivative Instruments
The Funds may utilize derivative instruments to enhance return, hedge risk, gain efficient exposure to an asset class or to manage liquidity. When considering the Funds’ use of derivatives, it is important to note that the Funds do not use derivatives for the purpose of creating financial leverage.
47
American Beacon FundsSM
Notes to Financial Statements
January 31, 2019
Forward Foreign Currency Contracts
The Funds may enter into forward foreign currency contracts to hedge the exchange rate risk on investment transactions or to hedge the value of the Funds’ securities denominated in foreign currencies. Forward foreign currency contracts are valued at the forward exchange rate prevailing on the day of valuation. The Funds may also use currency contracts to increase exposure to a foreign currency or to shift exposure to foreign currency fluctuations from one country to another. The Funds bear the market risk that arises from changes in foreign exchange rates, and accordingly, the unrealized gain (loss) on these contracts is reflected in the accompanying financial statements. The Funds also bear the credit risk if the counterparty fails to perform under the contract.
During the year ended January 31, 2019, the Funds entered into forward foreign currency contracts primarily for hedging foreign currency fluctuations.
The Funds’ forward foreign currency contract notional dollar values outstanding fluctuate throughout the operating year as required to meet strategic requirements. The following table illustrates the average quarterly volume of forward foreign currency contracts. For the purpose of this disclosure, volume is measured by the amounts bought and sold in USD at each quarter end.
Average Forward Foreign Currency Notional Amounts Outstanding | ||||||||||
Fund | Purchased Contracts | Sold Contracts | ||||||||
Frontier Markets Income | $ | 8,265,856 | $ | 5,691,569 | ||||||
GLG Total Return | 163,699,695 | 234,881,495 | ||||||||
Futures Contracts
Futures contracts are contracts to buy or sell a standard quantity of securities at a specified price on a future date. The Funds may enter into financial futures contracts as a method for keeping assets readily convertible to cash if needed to meet shareholder redemptions or for other needs while maintaining exposure to the stock or bond market, as applicable. The primary risks associated with the use of futures contracts are the possibility of illiquid markets or imperfect correlation between the values of the contracts and the underlying securities or that the counterparty will fail to perform its obligations.
Upon entering into a futures contract, the Funds are required to set aside or deposit with a broker an amount, termed the initial margin, which typically represents a portion of the face value of the futures contract. The Funds usually reflects this amount on the Schedules of Investments as a U.S. Treasury Bill held as collateral for futures contracts or as cash deposited with broker on the Statements of Assets and Liabilities. Payments to and from the broker, known as variation margin, are required to be made on a daily basis as the price of the futures contract fluctuates. Changes in initial settlement values are accounted for as unrealized appreciation (depreciation) until the contracts are terminated, at which time realized gains and losses are recognized. Futures contracts are valued at the most recent settlement price established each day by the exchange on which they are traded.
The Funds did not hold any futures as of January 31, 2019.
Swap Agreements
The Funds may invest in swap agreements. Swap agreements are negotiated between the Fund and a counterparty to exchange or swap investment cash flows, assets, foreign currencies, or market-linked returns at specified, future intervals. Swap agreements are either privately negotiated in theover-the-counter market (“OTC Swaps”) or cleared in a central clearing house (“Centrally Cleared Swaps”). The Fund may enter into credit default, cross-currency, interest rate and other forms of swap agreements to manage its exposure to credit, currency, interest rate, and inflation risk. In connection with these agreements, securities or cash may be
48
American Beacon FundsSM
Notes to Financial Statements
January 31, 2019
identified as collateral in accordance with the terms of the respective swap agreements to provide assets of value and recourse in the event of default or bankruptcy/insolvency.
Swaps are marked to market daily based upon values from third party vendors or quotations from market makers to the extent available and the change in value, if any, is recorded as an unrealized gain or loss on the Statement of Assets and Liabilities. Daily fluctuations in the value of centrally cleared swaps are recorded in variation margin on the Statement of Assets and Liabilities and recorded as unrealized gain or loss. In the event that market quotes are not readily available and the swap cannot be valued pursuant to one of the valuation methods, the value of the swap will be determined in good faith by the Valuation Committee pursuant to procedures approved by the Board.
For OTC payments received or made at the beginning of the measurement period are reflected as such on the Statement of Assets and Liabilities and represent payments made or received upon entering into the swap agreement to compensate for differences between the stated terms of the swap agreement and prevailing market conditions (credit spreads, currency exchange rates, interest rates, and other relevant factors). Centrally cleared swaps provide the same rights to the protection buyer and seller except the payments between parties, including upfront premiums, are settled through a central clearing agent through variation margin payments. Upfront and periodic payments for OTC and centrally cleared swaps are recorded as realized gains or losses on the Statement of Operations upon termination or maturity of the swap. A liquidation payment received or made at the termination of the swap is recorded as realized gain or loss on the Statement of Operations. Net periodic payments received or paid by the Fund are included as part of realized gains or losses on the Statement of Operations.
Entering into these agreements involves, to varying degrees, elements of credit, market and documentation risk in excess of the amounts recognized on the Statement of Assets and Liabilities. Such risks involve the possibility that there will be no liquid market for these agreements, that the counterparty to the agreements may default on its obligation to perform or disagree as to the meaning of contractual terms in the agreements and that there may be unfavorable changes in interest rates.
The Fund’s maximum risk of loss from counterparty credit risk is the discounted net value of the cash flows to be received from the counterparty over the contract’s remaining life, to the extent that amount is positive. The risk is mitigated by having a master netting arrangement between the Fund and the counterparty and by the posting of collateral to the Fund to cover the Fund’s exposure to the counterparty.
Credit Default Swap Agreements
Credit default swap agreements involve one party making a stream of payments (referred to as the buyer of protection) to another party (the seller of protection) in exchange for the right to receive a specified return in the event of a default or other credit event for the referenced entity, obligation or index. As a seller of protection on credit default swap agreements, the Fund will generally receive from the buyer of protection a fixed rate of periodic premiums throughout the term of the swap provided that there is no credit event. As the seller, the Fund would effectively add leverage to its portfolio because, in addition to its total net assets, the Fund would be subject to investment exposure up to the notional amount of the swap.
If the Fund is a seller of protection and a credit event occurs, as defined under the terms of that particular swap agreement, the Fund will either (i) pay to the buyer of protection an amount equal to the notional amount of the swap and take delivery of the referenced obligation, other deliverable obligations or underlying securities comprising the referenced index or (ii) pay a net settlement amount in the form of cash or securities equal to the notional amount of the swap less the recovery value of the referenced obligation or underlying securities comprising the referenced index. If the Fund is a buyer of protection and a credit event occurs, as defined under the terms of that particular swap agreement, the Fund will either (i) receive from the seller of protection an amount equal to the notional amount of the swap and deliver the referenced obligation, other deliverable obligations or underlying securities comprising the referenced index or (ii) receive a net settlement amount in the
49
American Beacon FundsSM
Notes to Financial Statements
January 31, 2019
form of cash or securities equal to the notional amount of the swap less the recovery value of the referenced obligation or underlying securities comprising the referenced index. Recovery values are estimated by market makers considering either industry standard recovery rates or entity specific factors and considerations until a credit event occurs. If a credit event has occurred, the recovery value is determined by a facilitated auction whereby a minimum number of allowable broker bids, together with a specified valuation method, are used to calculate the settlement value.
Credit default swap agreements on corporate issues, sovereign issues of an emerging country or U.S. municipal issues involve one party making a stream of payments to another party in exchange for the right to receive a specified return in the event of a default or other credit event. If a credit event occurs and cash settlement is not elected, a variety of other deliverable obligations may be delivered in lieu of the specific referenced obligation. The ability to deliver other obligations may result in acheapest-to-deliver option (the buyer of protection’s right to choose the deliverable obligation with the lowest value following a credit event). The Fund may use credit default swaps on corporate issues, sovereign issues of an emerging country or U.S. municipal issues to provide a measure of protection against defaults of the issuers (i.e., to reduce risk where the Fund owns or has exposure to the referenced obligation) or to take an active long or short position with respect to the likelihood of a particular issuer’s default.
Credit default swap agreements on asset-backed securities involve one party making a stream of payments to another party in exchange for the right to receive a specified return in the event of a default or other credit event. Unlike credit default swaps on corporate issues, sovereign issues of an emerging country or U.S. municipal issues, deliverable obligations in most instances would be limited to the specific referenced obligation as performance for asset-backed securities can vary across deals. Prepayments, principal paydowns, and other writedown or loss events on the underlying mortgage loans will reduce the outstanding principal balance of the referenced obligation. These reductions may be temporary or permanent as defined under the terms of the swap agreement and the notional amount for the swap agreement will be adjusted by corresponding amounts. The Fund may use credit default swaps on asset- backed securities to provide a measure of protection against defaults of the referenced obligation that the Fund owns or to take an active long or short position with respect to the likelihood of a particular referenced obligation’s default that the Fund does not own.
Credit default swap agreements on credit indices involve one party making a stream of payments to another party in exchange for the right to receive a specified return in the event of a write-down, principal shortfall, interest shortfall or default of all or part of the referenced entities comprising the credit index. A credit index is a basket of credit instruments or exposures designed to be representative of some part of the credit market as a whole. These indices are made up of reference credits that are judged by a poll of dealers to be the most liquid entities in the credit default swap market based on the sector of the index. Components of the indices may include, but are not limited to, investment grade securities, high yield securities, asset-backed securities, emerging markets, and/or various credit ratings within each sector. Credit indices are traded using credit default swaps with standardized terms including a fixed spread and standard maturity dates. An index credit default swap references all the names in the index, and if there is a default, the credit event is settled based on that name’s weight in the index. The composition of the indices changes periodically, usually every six months, and for most indices, each name has an equal weight in the index. The Fund may use credit default swaps on credit indices to hedge a portfolio of credit default swaps or bonds, which is less expensive than it would be to buy many credit default swaps to achieve a similar effect. Credit default swaps on indices are benchmarks for protecting investors owning bonds against default, and traders use them to speculate on changes in credit quality.
Implied credit spreads, represented in absolute terms, utilized in determining the market value of credit default swap agreements on corporate issues, sovereign issues of an emerging country or U.S. municipal issues as of period end are disclosed in the Notes to the Schedule of Investments and serve as an indicator of the current status of the payment/performance risk and represent a market participant view of the likelihood or risk of default for the underlying referenced security to credit derivative. The implied credit spread of a particular referenced entity reflects the cost of buying/selling protection and may include upfront payments required to be made to enter into
50
American Beacon FundsSM
Notes to Financial Statements
January 31, 2019
the agreement. For credit default swap agreements on asset-backed securities and credit indices, the quoted market prices and resulting values serve as the indicator of the current status of the payment/performance risk. Wider credit spreads represent a deterioration of the referenced entity’s credit soundness and a greater likelihood or risk of default or other credit event occurring as defined under the terms of the agreement.
The maximum potential amount of future payments (undiscounted) that the Fund as a seller of protection could be required to make under a credit default swap agreement would be an amount equal to the notional amount of the agreement. Notional amounts of each individual credit default swap agreement outstanding as of January 31, 2019, for which the Fund is the seller of protection is disclosed in the Notes to the Schedule of Investments. These potential amounts would be partially offset by any recovery values of the respective referenced obligations, upfront payments received upon entering into the agreement, or net amounts received from the settlement of buy protection credit default swap agreements entered into by the Fund for the same referenced entity or entities.
During the year ended January 31, 2019, the GLG Total Return Fund entered into credit default swaps primarily for return enhancement, hedging, and exposing cash to markets.
The Fund’s credit default swap contract notional amounts outstanding fluctuate throughout the operating year as required to meet the strategic requirements. The following table illustrates the average quarterly volume of credit default swap contracts. For the purpose of this disclosure, the volume is measure by the notional amounts outstanding at each quarter end.
Average Credit Default Swap Notional Amount Outstanding | ||||
Fund | Year Ended January 31, 2019 | |||
GLG Total Return | $ | 426,437,500 | ||
Interest Rate Swap Agreements
The GLG Total Return Fund is subject to interest rate risk exposure in the normal course of pursuing its investment objectives. Because the Fund holds fixed rate bonds, the value of these bonds may decrease if interest rates rise. To help hedge against this risk and to maintain its ability to generate income at prevailing market rates, the Fund may enter into interest rate swap agreements. Interest rate swap agreements involve the exchange by the Fund with another party of their respective commitments to pay or receive interest with respect to the notional amount of principal.
During the year ended January 31, 2019, the GLG Total Return Fund entered into interest rate swaps primarily for return enhancement, hedging and exposing cash to markets.
The Fund’s interest rate swap contract notional amounts outstanding fluctuate throughout the operating year as required to meet the strategic requirements. The following table illustrates the average quarterly volume of interest rate swap contracts. For the purpose of this disclosure, the volume is measured by the notional amounts outstanding at each quarter end.
Average Interest Rate Swaps Notional Amounts Outstanding | ||||
Fund | Year Ended January 31, 2019 | |||
GLG Total Return | $ | 794,700,000 | ||
51
American Beacon FundsSM
Notes to Financial Statements
January 31, 2019
The following is a summary of the fair valuations of the Funds’ derivative instruments categorized by risk
exposure(1):
Frontier Markets Income Fund
| Fair values of financial instruments on the Statements of Assets and Liabilities as of January 31, 2019: |
| ||||||||||||||||||||||||||||||||||||||||||||||||||||||
| Derivatives not accounted for as hedging instruments | |||||||||||||||||||||||||||||||||||||||||||||||||||||||
Assets: | Credit contracts | Foreign exchange contracts | Commodity contracts | Interest rate contracts | Equity contracts | Total | |||||||||||||||||||||||||||||||||||||||||||||||||
| Unrealized appreciation of forward foreign currency contracts | $ | - | $ | 74,088 | $ | - | $ | - | $ | - | $ | 74,088 | |||||||||||||||||||||||||||||||||||||||||||
Liabilities: | Credit contracts | Foreign exchange contracts | Commodity contracts | Interest rate contracts | Equity contracts | Total | |||||||||||||||||||||||||||||||||||||||||||||||||
| Unrealized depreciation of forward foreign currency contracts | $ | - | $ | (440,962 | ) | $ | - | $ | - | $ | - | $ | (440,962 | ) | |||||||||||||||||||||||||||||||||||||||||
| The effect of financial derivative instruments on the Statements of Operations as of January 31, 2019: |
| ||||||||||||||||||||||||||||||||||||||||||||||||||||||
| Derivatives not accounted for as hedging instruments | |||||||||||||||||||||||||||||||||||||||||||||||||||||||
Realized gain (loss) from derivatives | Credit contracts | Foreign exchange contracts | Commodity contracts | Interest rate contracts | Equity contracts | Total | |||||||||||||||||||||||||||||||||||||||||||||||||
| Forward foreign currency contracts | $ | - | $ | (153,072 | ) | $ | - | $ | - | $ | - | $ | (153,072 | ) | |||||||||||||||||||||||||||||||||||||||||
Net change in unrealized appreciation | Credit contracts | Foreign exchange contracts | Commodity contracts | Interest rate contracts | Equity contracts | Total | |||||||||||||||||||||||||||||||||||||||||||||||||
| Forward foreign currency contracts | $ | - | $ | (506,291 | ) | $ | - | $ | - | $ | - | $ | (506,291 | ) | |||||||||||||||||||||||||||||||||||||||||
GLG Total Return Fund
| Fair values of financial instruments on the Statements of Assets and Liabilities as of January 31, 2019: |
| ||||||||||||||||||||||||||||||||||||||||||||||||||||||
| Derivatives not accounted for as hedging instruments | |||||||||||||||||||||||||||||||||||||||||||||||||||||||
Assets: | Credit contracts | Foreign exchange contracts | Commodity contracts | Interest rate contracts | Equity contracts | Total | |||||||||||||||||||||||||||||||||||||||||||||||||
| Unrealized appreciation of forward foreign currency contracts | $ | - | $ | 12,106,106 | $ | - | $ | - | $ | - | $ | 12,106,106 | |||||||||||||||||||||||||||||||||||||||||||
| Unrealized appreciation from swap agreements | 3,738,759 | - | - | 1,059,061 | - | 4,797,820 | |||||||||||||||||||||||||||||||||||||||||||||||||
Liabilities: | Credit contracts | Foreign exchange contracts | Commodity contracts | Interest rate contracts | Equity contracts | Total | |||||||||||||||||||||||||||||||||||||||||||||||||
| Unrealized depreciation of forward foreign currency contracts | $ | - | $ | (14,125,747 | ) | $ | - | $ | - | $ | - | $ | (14,125,747 | ) | |||||||||||||||||||||||||||||||||||||||||
| Unrealized depreciation from swap agreements | (4,255,579 | ) | - | - | (14,416,493 | ) | - | (18,672,072 | ) | ||||||||||||||||||||||||||||||||||||||||||||||
52
American Beacon FundsSM
Notes to Financial Statements
January 31, 2019
| The effect of financial derivative instruments on the Statements of Operations as of January 31, 2019: |
| ||||||||||||||||||||||||||||||||||||||||||||||||||||||
| Derivatives not accounted for as hedging instruments | |||||||||||||||||||||||||||||||||||||||||||||||||||||||
Realized gain (loss) from derivatives | Credit contracts | Foreign exchange contracts | Commodity contracts | Interest rate contracts | Equity contracts | Total | |||||||||||||||||||||||||||||||||||||||||||||||||
| Forward foreign currency contracts | $ | - | $ | (1,291,678 | ) | $ | - | $ | - | $ | - | $ | (1,291,678 | ) | |||||||||||||||||||||||||||||||||||||||||
| Swap agreements | (1,811,531 | ) | - | - | (153,431 | ) | - | (1,964,962 | ) | ||||||||||||||||||||||||||||||||||||||||||||||
Net change in unrealized appreciation | Credit contracts | Foreign exchange contracts | Commodity contracts | Interest rate contracts | Equity contracts | Total | |||||||||||||||||||||||||||||||||||||||||||||||||
| Forward foreign currency contracts | $ | - | $ | 3,276,950 | $ | - | $ | - | $ | - | $ | 3,276,950 | |||||||||||||||||||||||||||||||||||||||||||
| Swap agreements | 6,093,833 | - | - | (7,762,049 | ) | - | (1,668,216 | ) | |||||||||||||||||||||||||||||||||||||||||||||||
Master Agreements
International Swaps and Derivatives Association, Inc. Master Agreements (“ISDA Master Agreements”) with counterparties govern transactions inover-the-counter (“OTC”) derivative and foreign exchange contracts entered into by the Fund and those counterparties. The ISDA Master Agreements contain provisions for general obligations, representations, agreements, collateral and events of default or termination. Events of termination include conditions that may entitle counterparties to elect to terminate early and cause settlement of all outstanding transactions under the applicable ISDA Master Agreement. Any election to terminate early could be material to the financial statements. Since different types of forward and OTC financial derivative transactions have different mechanics and are sometimes traded out of different legal entities of a particular counterparty organization, each type of transaction may be covered by a different Master Agreement, resulting in the need for multiple agreements with a single counterparty. As the Master Agreements are specific to unique operations of different asset types, they allow a Fund to net its total exposure to a counterparty in the event of a default with respect to all the transactions governed under a single agreement with a counterparty.
Master Securities Forward Transaction Agreements (“Master Forward Agreements”) govern the considerations and factors surrounding the settlement of certain forward settling transactions, such as delayed delivery or sale-buyback financing transactions by and between a Fund and select counterparties. The Master Forward Agreements maintain provisions for, among other things, initiation and confirmation, payment and transfer, events of default, termination, and maintenance of collateral.
Offsetting Assets and Liabilities
The Funds are parties to enforceable master netting agreements between brokers and counterparties which provide for the right to offset under certain circumstances. The Funds employ multiple money managers and counterparties and have elected not to offset qualifying financial and derivative instruments on the Statements of Assets and Liabilities, as such all financial and derivative instruments are presented on a gross basis. The impacts of netting arrangements that provide the right to offset are detailed below. The net amount represents the net receivable or payable that would be due from or to the counterparty in the event of default. Exposure from borrowings and other financing agreements such as repurchase agreements can only be netted across transactions governed by the same Master Agreement with the same legal entity. All amounts reported below represent the balance as of the report date, January 31, 2019.
Frontier Markets Income Fund
| Offsetting of Financial and Derivative Assets as of January 31, 2019: | ||||||||||||
| Assets | Liabilities | |||||||||||
| Forward Foreign Currency Contracts | $ | 74,088 | $ | 440,962 | ||||||||
|
|
|
| |||||||||
| Total derivative assets and liabilities in the Statement of Assets and Liabilities | $ | 74,088 | $ | 440,962 | ||||||||
|
|
|
| |||||||||
| Total derivative assets and liabilities subject to an MNA | $ | 74,088 | $ | 440,962 | ||||||||
|
|
|
| |||||||||
53
American Beacon FundsSM
Notes to Financial Statements
January 31, 2019
| Financial Assets, Derivatives, and Collateral Received/(Pledged) by Counterparty as of January 31, 2019: |
| |||||||||||||||||||||||||||||||||||
| Gross Amounts Not Offset in the Statement of Assets and Liabilities | ||||||||||||||||||||||||||||||||||||
Counterparty | Gross Amounts of Assets Presented in the Statement of Assets and Liabilities | Derivatives Available for Offset | Non-Cash Collateral Pledged | Cash Collateral Pledged | Net Amount | |||||||||||||||||||||||||||||||
| ICBC Standard Bank PLC | $ | 74,088 | $ | (74,088 | ) | $ | - | $ | - | $ | - | |||||||||||||||||||||||||
| Gross Amounts Not Offset in the Statement of Assets and Liabilities | ||||||||||||||||||||||||||||||||||||
Counterparty | Gross Amounts of Liabilities Presented in the Statement of Assets and Liabilities | Derivatives Available for Offset | Non-Cash Collateral Received | Cash Collateral Received | Net Amount | |||||||||||||||||||||||||||||||
| Barclays Bank PLC | $ | 1,944 | $ | - | $ | - | $ | - | $ | 1,944 | ||||||||||||||||||||||||||
| Citibank, N.A. | 1,982 | - | - | - | 1,982 | |||||||||||||||||||||||||||||||
| ICBC Standard Bank PLC | 421,638 | (74,088 | ) | - | - | 347,550 | ||||||||||||||||||||||||||||||
| State Street Bank & Trust Co. | 15,398 | - | - | - | 15,398 | |||||||||||||||||||||||||||||||
|
|
|
|
|
|
|
|
|
| |||||||||||||||||||||||||||
| Total | $ | 440,962 | $ | (74,088 | ) | $ | - | $ | - | $ | 366,874 | |||||||||||||||||||||||||
|
|
|
|
|
|
|
|
|
| |||||||||||||||||||||||||||
GLG Total Return Fund
| Offsetting of Financial and Derivative Assets as of January 31, 2019: | ||||||||||||
| Assets | Liabilities | |||||||||||
| Swap Agreement - Centrally cleared | $ | 1,059,061 | $ | 14,416,493 | ||||||||
| Swap Agreement - OTC | 3,738,759 | 4,255,579 | ||||||||||
| Forward Foreign Currency Contracts | 12,106,106 | 14,125,747 | ||||||||||
|
|
|
| |||||||||
| Total derivative assets and liabilities in the Statement of Assets and Liabilities | $ | 16,903,926 | $ | 32,797,819 | ||||||||
|
|
|
| |||||||||
| Derivatives not subject to a Master Netting Agreement or similar agreement (“MNA”) | $ | 1,059,061 | $ | 13,549,173 | ||||||||
|
|
|
| |||||||||
| Total derivative assets and liabilities subject to an MNA | $ | 15,844,865 | $ | 19,248,646 | ||||||||
|
|
|
| |||||||||
| Financial Assets, Derivatives, and Collateral Received/(Pledged) by Counterparty as of January 31, 2019: |
| |||||||||||||||||||||||||||||||||||
| Gross Amounts Not Offset in the Statement of Assets and Liabilities | ||||||||||||||||||||||||||||||||||||
Counterparty | Gross Amounts of Assets Presented in the Statement of Assets and Liabilities | Derivatives Available for Offset | Non-Cash Collateral Pledged | Cash Collateral Pledged | Net Amount | |||||||||||||||||||||||||||||||
| Bank of America, N.A. | $ | 703,678 | $ | - | $ | - | $ | - | $ | 703,678 | ||||||||||||||||||||||||||
| Barclays Bank PLC | 1,447,726 | (1,447,726 | ) | - | - | - | ||||||||||||||||||||||||||||||
| Barclays Capital, Inc. | 1,331,432 | - | - | - | 1,331,432 | |||||||||||||||||||||||||||||||
| Deutsche Bank AG | 244,854 | - | - | - | 244,854 | |||||||||||||||||||||||||||||||
| HSBC Bank (USA) | 12,117,175 | (12,117,175 | ) | - | - | - | ||||||||||||||||||||||||||||||
|
|
|
|
|
|
|
|
|
| |||||||||||||||||||||||||||
| Total | $ | 15,844,865 | $ | (13,564,901 | ) | $ | - | $ | - | $ | 2,279,964 | |||||||||||||||||||||||||
|
|
|
|
|
|
|
|
|
| |||||||||||||||||||||||||||
| Gross Amounts Not Offset in the Statement of Assets and Liabilities | ||||||||||||||||||||||||||||||||||||
Counterparty | Gross Amounts of Liabilities Presented in the Statement of Assets and Liabilities | Derivatives Available for Offset | Non-Cash Collateral Received | Cash Collateral Received | Net Amount | |||||||||||||||||||||||||||||||
| Barclays Bank PLC | $ | 1,863,657 | $ | (1,447,726 | ) | $ | - | $ | - | $ | 415,931 | |||||||||||||||||||||||||
| Citibank, N.A. | 12,683 | - | - | - | 12,683 | |||||||||||||||||||||||||||||||
| Credit Suisse Securities USA LLC | 1,776,688 | - | - | - | 1,776,688 | |||||||||||||||||||||||||||||||
| Goldman Sachs International | 428,437 | - | - | - | 428,437 | |||||||||||||||||||||||||||||||
| HSBC Bank (USA) | 14,777,490 | (12,117,175 | ) | - | - | 2,660,315 | ||||||||||||||||||||||||||||||
| UBS AG | 389,691 | - | - | - | 389,691 | |||||||||||||||||||||||||||||||
|
|
|
|
|
|
|
|
|
| |||||||||||||||||||||||||||
| Total | $ | 19,248,646 | $ | (13,564,901 | ) | $ | - | $ | - | $ | 5,683,745 | |||||||||||||||||||||||||
|
|
|
|
|
|
|
|
|
| |||||||||||||||||||||||||||
54
American Beacon FundsSM
Notes to Financial Statements
January 31, 2019
6. Principal Risks
Investing in the Funds may involve certain risks including, but not limited to, those described below.
Counterparty Risk
The Funds are subject to the risk that a party or participant to a transaction, such as a broker or derivative counterparty, will be unwilling or unable to satisfy its obligation to make timely principal, interest or settlement payments or to otherwise honor its obligations to the Funds. As a result the Fund may obtain no recovery of its investment or may only obtain a limited recovery, and any recovery may be delayed. Not all derivative transactions require a counterparty to post collateral, which may expose the Fund to greater losses in the event of a default by a counterparty.
Credit Risk
The Funds are subject to the risk that the issuer or guarantor of a debt security, or the counterparty to a derivatives contract or a loan, will fail to make timely payment of interest or principal or otherwise honor its obligations or default completely. A decline in the credit rating of an individual security held by a Fund may have an adverse impact on its price and make it difficult for a Fund to sell it. Ratings represent a rating agency’s opinion regarding the quality of the security and are not a guarantee of quality. Rating agencies might not always change their credit rating on an issuer or security in a timely manner to reflect events that could affect the issuer’s ability to make timely payments on its obligations. Credit risk is typically greater for securities with ratings that are below investment grade.
Currency Risk
The Funds may have exposure to foreign currencies by making direct investments innon-U.S. currencies or in securities denominated innon-U.S. currencies, purchasing or selling forward foreign currency exchange contracts innon- U.S. currencies,non-U.S. currency futures contracts, and swaps for cross-currency investments. Foreign currencies will fluctuate, and may decline, in value relative to the U.S. dollar and other currencies and thereby affect the Funds’ investments in foreign(non-U.S.) currencies or in securities that trade in, and receive revenues in, or in derivatives that provide exposure to, foreign(non-U.S.) currencies.
Custody Risk
The Funds may invest in markets that are less developed than those in the U.S., which may expose the Funds to risks in the process of clearing and settling trades and the holding of securities by foreign banks, agents and depositories. Investments in frontier and emerging markets may be subject to greater custody risks than investments in more developed markets.
Derivatives Risk
Derivatives may involve significant risk. The use of derivative instruments may expose the Funds to additional risks that they would not be subject to if they invested directly in the securities or other instruments underlying those derivatives, including the high degree of leverage often embedded in such instruments, and potential material and prolonged deviations between the theoretical value and realizable value of a derivative. Some derivatives have the potential for unlimited loss, regardless of the size of the Funds’ initial investment. Derivatives may be illiquid and may be more volatile than other types of investments. The Funds may buy or sell derivatives not traded on an exchange and which may be subject to heightened liquidity and valuation risk. Derivative investments can increase portfolio turnover and transaction costs. Derivatives also are subject to counterparty risk. As a result, the Funds may obtain no recovery of their investment or may only obtain a limited recovery, and any recovery may be delayed. Not all derivative transactions require a counterparty to post collateral, which may expose the Funds to greater losses in the event of a default by a counterparty.
55
American Beacon FundsSM
Notes to Financial Statements
January 31, 2019
Emerging Markets Risk
When investing in emerging markets, the risks of investing in foreign securities are heightened. Emerging markets are generally smaller, less developed, less liquid and more volatile than the securities markets of the U.S. and other developed markets. There are also risks of: greater political uncertainties; an economy’s dependence on revenues from particular commodities or on international aid or development assistance; currency transfer restrictions; a limited number of potential buyers for such securities; and delays and disruptions in securities settlement procedures.
Foreign Investing Risk
Non-U.S. investments carry potential risks not associated with U.S. investments. Such risks include, but are not limited to: (1) currency exchange rate fluctuations, (2) political and financial instability, (3) less liquidity and greater volatility, (4) lack of uniform accounting, auditing and financial reporting standards, (5) increased price volatility, (6) less government regulation and supervision of foreign stock exchanges, brokers and listed companies, and (7) delays in transaction settlement in some foreign markets.
Forward Foreign Currency Contracts Risk
Forward foreign currency contracts, includingnon-deliverable forwards, are derivative instruments pursuant to a contract with a counterparty to pay a fixed price for an agreed amount of securities or other underlying assets at an agreed date or to buy or sell a specific currency at a future date at a price set at the time of the contract. The use of forward foreign currency contracts may expose the Funds to additional risks that it would not be subject to if it invested directly in the securities or currencies underlying the forward foreign currency contract.
Frontier Markets Risk
Frontier market countries generally have smaller economies and less developed capital markets or legal, regulatory and political systems than traditional emerging market countries. As a result, the risks of investing in emerging market countries are magnified in frontier market countries. The magnification of risks are the result of (1) the potential for extreme price volatility and illiquidity in frontier markets; (2) government ownership or control of parts of the private sector or other protectionist measures; (3) large currency fluctuations; (4) fewer companies and investment opportunities; or (5) inadequate investor protections and regulatory enforcement. In certain frontier and emerging markets, fraud and corruption may be more prevalent than in developed market countries. Investments that the Fund holds may be exposed to these risks, which could have a negative impact on their value. Additional risks of frontier market securities may include: greater political instability (including the risk of war or natural disaster); increased risk of nationalization, expropriation, or other confiscation of assets of issuers to which the Fund is exposed; increased risk of embargoes or economic sanctions on a country, sector or issuer; greater risk of default (by both government and private issuers); more substantial governmental involvement in the economy; less governmental supervision and regulation; differences in, or lack of, auditing and financial reporting standards, which may result in unavailability of material information about issuers; less developed legal systems; inability to purchase and sell investments or otherwise settle security or derivative transactions (i.e., a market freeze); unavailability of currency hedging techniques; slower clearance and settlement; difficulties in obtaining and/or enforcing legal judgments; and significantly smaller market capitalizations of issuers.
High Portfolio Turnover Risk
Portfolio turnover is a measure of the Funds’ trading activity over aone-year period. A portfolio turnover rate of 100% would indicate that the Funds sold and replaced the entire value of its securities holdings during the period. High portfolio turnover could increase the Funds’ transaction costs, have a negative impact on performance, and generate higher capital gain distributions to shareholders than if the Funds have a lower portfolio turnover rate.
56
American Beacon FundsSM
Notes to Financial Statements
January 31, 2019
Illiquid and Restricted Securities Risk
Securities not registered in the U.S. under the Securities Act of 1933, as amended (the “Securities Act”), including Rule 144A securities, are restricted as to their resale. Such securities may not be listed on an exchange and may have no active trading market. They may be more difficult to purchase or sell at an advantageous time or price because such securities may not be readily marketable in broad public markets, or may have to be held for a certain time period before they can be resold. The Funds may not be able to sell a restricted security when the sub-advisor considers it desirable to do so and/or may have to sell the security at a lower price than the Funds believe is its fair market value. In addition, transaction costs may be higher for restricted securities and the Funds may receive only limited information regarding the issuer of a restricted security. The Funds may have to bear the expense of registering restricted securities for resale and the risk of substantial delays in effecting the registration.
Interest Rate Risk
The Funds are subject to the risk that the market value of fixed-income securities or derivatives it holds, particularly mortgage backed and other asset backed securities, will decline due to rising interest rates. Generally, the value of investments with interest rate risk, such as fixed-income securities, will move in the opposite direction to movements in interest rates. The Federal Reserve raised the federal funds rate several times since December 2015 and has signaled additional increases in the near future. Interest rates may rise, perhaps significantly and/or rapidly, potentially resulting in substantial losses to the Funds. The prices of fixed-income securities or derivatives are also affected by their duration. Fixed-income securities or derivatives with longer duration generally have greater sensitivity to changes in interest rates. An increase in interest rates can impact markets broadly as well. Some investors buy securities with borrowed money; an increase in interest rates can cause a decline in those markets.
Leverage Risk
The Funds’ use of futures, forward foreign currency contracts, swaps, other derivative instruments and selling securities short will have the economic effect of financial leverage. Financial leverage magnifies the exposure to the swings in prices of an asset or class of assets underlying a derivative instrument and results in increased volatility, which means that the Funds will have the potential for greater losses than if the Funds do not use the derivative instruments that have a leveraging effect. Leverage may result in losses that exceed the amount originally invested and may accelerate the rate of losses. Leverage tends to magnify, sometimes significantly, the effect of an increase or decrease in the Funds’ exposure to an asset or class of assets and may cause the Funds’ NAV to be volatile.
Liquidity Risk
When there is little or no active trading market for a specific security it can become more difficult to purchase or sell the securities at or near their perceived value. During such periods, certain investments held by the Fund may be difficult to sell or other investments may be difficult to purchase at favorable times or prices. As a result, the Fund may have to lower the price on certain securities that it is trying to sell, sell other securities instead or forgo an investment opportunity, any of which could have a negative effect on Fund management or performance. Redemptions by a few large investors in the Fund at such times may have a significant adverse effect on the Fund’s NAV and remaining Fund shareholders. In addition, the market-making capacity of dealers in certain types of securities has been reduced in recent years, in part as a result of structural and regulatory changes, such as fewer proprietary trading desks and increased regulatory capital requirements for broker-dealers. Further, many broker-dealers have reduced their inventory of certain debt securities. This could negatively affect the Fund’s ability to buy or sell debt securities and increase the related volatility and trading costs. The Fund may lose money if it is forced to sell certain investments at unfavorable prices to meet redemption requests or other cash needs.
57
American Beacon FundsSM
Notes to Financial Statements
January 31, 2019
Market Risk
Since the financial crisis that started in 2008, the U.S. and many foreign economies continue to experience its after-effects. Conditions in the U.S. and many foreign economies have resulted, and may continue to result, in certain instruments experiencing unusual liquidity issues, increased price volatility and, in some cases, credit downgrades and increased likelihood of default. These events have reduced the willingness and ability of some lenders to extend credit, and have made it more difficult for some borrowers to obtain financing on attractive terms, if at all. In some cases, traditional market participants have been less willing to make a market in some types of debt instruments, which has affected the liquidity of those instruments. During times of market turmoil, investors tend to look to the safety of securities issued or backed by the U.S. Treasury, causing the prices of these securities to rise and the yields to decline. Reduced liquidity in fixed income and credit markets may negatively affect many issuers worldwide. In addition, global economies and financial markets are becoming increasingly interconnected, which increases the possibilities that conditions in one country or region might adversely impact issuers in a different country or region. A rise in protectionist trade policies, and the possibility of changes to some international trade agreements, could affect the economies of many nations in ways that cannot necessarily be foreseen at the present time.
In response to the financial crisis, the U.S. and other governments and the Federal Reserve and certain foreign central banks have taken steps to support financial markets. In some countries where economic conditions are recovering, they are nevertheless perceived as still fragile. Withdrawal of government support, failure of efforts in response to the crisis, or investor perception that such efforts are not succeeding, could adversely impact the value and liquidity of certain securities. The severity or duration of adverse economic conditions may also be affected by policy changes made by governments or quasi-governmental organizations, including changes in tax laws. The impact of new financial regulation legislation on the markets and the practical implications for market participants may not be fully known for some time. Regulatory changes are causing some financial services companies to exit long-standing lines of business, resulting in dislocations for other market participants. In addition, political and diplomatic events within the U.S. and abroad, such as the U.S. government’s inability at times to agree on a long-term budget and deficit reduction plan, the threat of a federal government shutdown and threats not to increase the federal government’s debt limit, may affect investor and consumer confidence and may adversely impact financial markets and the broader economy, perhaps suddenly and to a significant degree. The U.S. government has recently reduced federal corporate income tax rates, and future legislative, regulatory and policy changes may result in more restrictions on international trade, less stringent prudential regulation of certain players in the financial markets, and significant new investments in infrastructure and national defense. Markets may react strongly to expectations about the changes in these policies, which could increase volatility, especially if the markets’ expectations for changes in government policies are not borne out.
Changes in market conditions will not have the same impact on all types of securities. Interest rates have been unusually low in recent years in the U.S. and abroad. Because there is little precedent for this situation, it is difficult to predict the impact of a significant rate increase on various markets. For example, because investors may buy securities or other investments with borrowed money, a significant increase in interest rates may cause a decline in the markets for those investments. Because of the sharp decline in the worldwide price of oil, there is a concern that oil producing nations may withdraw significant assets now held in U.S. Treasuries, which could force a substantial increase in interest rates. Regulators have expressed concern that rate increases may cause investors to sell fixed income securities faster than the market can absorb them, contributing to price volatility. In addition, there is a risk that the prices of goods and services in the U.S. and many foreign economies may decline over time, known as deflation (the opposite of inflation). Deflation may have an adverse effect on stock prices and creditworthiness and may make defaults on debt more likely. If a country’s economy slips into a deflationary pattern, it could last for a prolonged period and may be difficult to reverse. The precise details and the resulting impact of the United Kingdom’s vote to leave the European Union (the “EU”), commonly referred to as “Brexit,” are not yet known. The effect on the United Kingdom’s economy will likely depend on the nature of trade relations with the EU and other major economies following its exit, which are matters to be negotiated. The outcomes may cause increased volatility and have a significant adverse impact on world financial markets, other international
58
American Beacon FundsSM
Notes to Financial Statements
January 31, 2019
trade agreements, and the United Kingdom and European economies, as well as the broader global economy for some time, which could significantly adversely affect the value of the Fund’s investments in the United Kingdom and Europe.
Market Timing Risk
Because the Funds invest in foreign securities, it is particularly subject to the risk of market timing activities. Frequent trading by Fund shareholders poses risks to other shareholders in the Funds, including (i) the dilution of the Fund’s NAV, (ii) an increase in the Funds’ expenses, and (iii) interference with the portfolio manager’s ability to execute efficient investment strategies. Because of specific securities in which the Funds may invest, it could be subject to the risk of market timing activities by shareholders. Some examples of these types of securities are high-yield and foreign securities. The limited trading activity of some high-yield securities may result in market prices that do not reflect the true market value of these securities. The Funds generally prices foreign securities using their closing prices from the foreign markets in which they trade, typically prior to the Funds’ calculation of its NAV. These prices may be affected by events that occur after the close of a foreign market but before the Funds price its shares. In such instances, the Funds may fair value high yield and foreign securities. However, some investors may engage in frequent short-term trading in the Funds to take advantage of any price differentials that may be reflected in the NAV of the Funds’ shares. While the Manager monitors trading in the Funds, there is no guarantee that it can detect all market timing activities.
Non-Diversification Risk
The GLG Total Return Fund isnon-diversified, which means it may focus its investments in the securities of a comparatively small number of issuers. Investments in securities of a limited number of issuers exposes the Funds to greater market risk and potential losses than if assets were diversified among the securities of a greater number of issuers.
Other Investment Companies Risk
The Funds may invest in shares of other registered investment companies, including ETFs and money market funds that are advised by the Manager. To the extent that the Funds invest in shares of other registered investment companies, the Funds will indirectly bear the fees and expenses charged by those investment companies in addition to the Funds’ direct fees and expenses and will be subject to the risks associated with investments in those companies. For example, ETF shares may trade at a premium or discount to their net asset value. An ETF that tracks an index may not precisely replicate the returns of its benchmark index. For example, ETF shares may trade at a premium or discount to their net asset value. An ETF that tracks an index may not precisely replicate the returns of its benchmark index.
Redemption Risk
The Funds may experience periods of heavy redemptions that could cause the Funds to sell assets at inopportune times or at a loss or depressed value. Redemption risk is greater to the extent that one or more investors or intermediaries control a large percentage of investments in the Funds, have short investment horizons,or have unpredictable cash flow needs. A general rise in interest rates has the potential to cause investors to move out of fixed-income securities on a large scale, which may increase redemptions from mutual funds that hold large amounts of fixed-income securities. This, coupled with a reduction in the ability or willingness of dealers and other institutional investors to buy or hold fixed-income securities, may result in decreased liquidity and increased volatility in the fixed-income markets, and heightened redemption risk. Heavy redemptions, whether by a few large investors or many smaller investors, could hurt the Funds performance. The sale of assets to meet redemption requests may create net capital gains or losses, which could cause the Funds to have to distribute substantial capital gains.
59
American Beacon FundsSM
Notes to Financial Statements
January 31, 2019
Sovereign and Quasi Sovereign Debt Risk
The Funds normally will have significant investments in sovereign and quasi-sovereign debt securities. These investments are subject to risk of payment delays or defaults due to (1) country cash flow problems, (2) insufficient foreign currency reserves, (3) political considerations, (4) large debt positions relative to the country’s economy, (5) policies toward foreign lenders or investors, (6) the failure to implement economic reforms required by the International Monetary Fund or other multilateral agencies, or (7) an inability or unwillingness to repay debts. It may be particularly difficult to enforce the rights of debt holders in frontier and emerging markets. A governmental entity that defaults on an obligation may request additional time in which to pay or further loans or may seek to restructure its obligations to reduce interest rates or outstanding principal. There is no legal process for collecting sovereign and quasi-sovereign debt that a government does not pay nor are there bankruptcy proceedings through which all or part of the sovereign debt that a governmental entity has not repaid may be collected. Sovereign and quasi-sovereign debt risk is increased for emerging and frontier markets issuers, which are among the largest debtors to commercial banks and foreign governments. At times, certain emerging market countries have declared moratoria on the payment of principal and interest on external debt. Certain emerging market countries have experienced difficulty in servicing their sovereign debt on a timely basis, which has led to defaults and the restructuring of certain indebtedness.
Swap Agreement Risk
The GLG Total Return Fund may invest in swap agreements. Swaps can involve greater risks than a direct investment in an underlying asset, because swaps typically include a certain amount of embedded leverage and as such are subject to leveraging risk. If swaps are used as a hedging strategy, a Fund is subject to the risk that the hedging strategy may not eliminate the risk that it is intended to offset, due to, among other reasons, a lack of correlation between the swaps and the portfolio of assets that the swaps are designed to hedge or replace. Swaps also may be difficult to value. Total return swaps, interest rate swaps, currency swaps and credit default swaps are subject to counterparty risk, credit risk and liquidity risk. In addition to these risks, total return swaps are subject to market risk and interest rate risk, if the underlying securities are bonds or other debt obligations, interest rate swaps are subject to interest rate risk, and currency swaps are subject to currency risk. With respect to a credit default swap, if the Fund is selling credit protection, there is a risk that a credit event will occur and that the Fund will have to pay the counterparty. There is also the risk that the transaction may beclosed-out at a time when the credit quality of the underlying investment has deteriorated, in which case the Fund may need to make an early termination payment. If the Fund is buying credit protection, there is the risk that no credit event will occur and the Fund will receive no benefit (other than any hedging benefit) for the premium paid. There is also the risk that the transaction may beclosed-out at a time when the credit quality of the underlying investment has improved, in which case a Fund may need to make a nearly termination payment. Equity swaps are subject to equity investments risk, liquidity risk, and counterparty risk.
Variable and Floating Rate Securities Risk
The interest rates payable on variable and floating-rate securities are not fixed and may fluctuate based upon changes in market rates. The interest rate on a floating rate security is a variable rate which is tied to another interest rate, such as a money-market index or Treasury bill rate. Variable and floating rate securities are subject to interest rate risk and credit risk.
As short-term interest rates decline, interest payable on floating-rate securities typically decreases. Alternatively, during periods of rising interest rates, interest payable on floating-rate securities typically increases. Changes in the interest rates of floating-rate securities may lag behind changes in market rates or may have limits on the maximum rate change for a given period of time. The value of floating-rate securities may decline if their interest rates do not rise as much, or as quickly, as interest rates in general. Conversely, floating rate securities will not generally increase in value if interest rates decline.
60
American Beacon FundsSM
Notes to Financial Statements
January 31, 2019
7. Federal Income and Excise Taxes
It is the policy of each Fund to qualify as a regulated investment company (“RIC”), by complying with all applicable provisions of Subchapter M of the Internal Revenue Code, as amended, and to make distributions of taxable income sufficient to relieve it from substantially all federal income and excise taxes. For federal income tax purposes, each Fund is treated as a single entity for the purpose of determining such qualification.
The Funds do not have any unrecorded tax liabilities in the accompanying financial statements. The Frontier Markets Income Fund, for each of the tax years in the four year period ended January 31, 2019 and the GLG Total Return Fund, for each of the tax years in the three year period ended January 31, 2019 remain subject to examination by the Internal Revenue Service. If applicable, the Funds recognize interest accrued related to unrecognized tax benefits in interest expense and penalties in “Other expenses” on the Statements of Operations.
The Funds may be subject to taxes imposed by countries in which it invests. Such taxes are generally based on returns of income earned or gains realized or repatriated. Taxes are accrued and applied to net investment income, net realized capital gains and net unrealized appreciation (depreciation), as applicable, as the income is earned or capital gains are recorded.
Dividends are categorized in accordance with income tax regulations which may treat certain transactions differently than U.S. GAAP. Accordingly, the character of distributions and composition of net assets for tax purposes may differ from those reflected in the accompanying financial statements. The Funds also utilize earnings and profits distributed to shareholders on redemptions of shares as part of the dividends paid deduction.
The tax character of distributions paid were as follows:
| Frontier Markets Income Fund | GLG Total Return Fund | |||||||||||||||||||||||||||
| Year Ended January 31, 2019 | Year Ended January 31, 2018 | Year Ended January 31, 2019 | Year Ended January 31, 2018 | |||||||||||||||||||||||||
Distributions paid from: | ||||||||||||||||||||||||||||
Ordinary income* | ||||||||||||||||||||||||||||
Institutional Class | $ | 6,063,094 | $ | 2,845,735 | $ | 51,365 | $ | 34,961 | ||||||||||||||||||||
Y Class | 11,141,405 | 3,511,778 | 21,744 | 7,933 | ||||||||||||||||||||||||
Investors Class | 3,746,033 | 2,275,358 | 5,883 | 1,537 | ||||||||||||||||||||||||
A Class | 291,836 | 293,772 | 3,987 | 1,157 | ||||||||||||||||||||||||
C Class | 743,483 | 214,080 | 3,899 | 591 | ||||||||||||||||||||||||
Ultra Class | - | - | 18,743,203 | 5,439,268 | ||||||||||||||||||||||||
Long–term capital gains | ||||||||||||||||||||||||||||
Institutional Class | - | - | 162 | 10 | ||||||||||||||||||||||||
Y Class | - | - | 68 | 33 | ||||||||||||||||||||||||
Investors Class | - | - | 19 | 5 | ||||||||||||||||||||||||
A Class | - | - | 12 | 3 | ||||||||||||||||||||||||
C Class | - | - | 12 | 3 | ||||||||||||||||||||||||
Ultra Class | - | - | 58,888 | 23,048 | ||||||||||||||||||||||||
Return of capital | ||||||||||||||||||||||||||||
Institutional Class | - | - | - | 152 | ||||||||||||||||||||||||
Y Class | - | - | - | 491 | ||||||||||||||||||||||||
Investors Class | - | - | - | 72 | ||||||||||||||||||||||||
A Class | - | - | - | 51 | ||||||||||||||||||||||||
C Class | - | - | - | 50 | ||||||||||||||||||||||||
Ultra Class | - | - | - | 341,068 | ||||||||||||||||||||||||
|
|
|
|
|
|
|
| |||||||||||||||||||||
Total distributions paid | $ | 21,985,851 | $ | 9,140,723 | $ | 18,889,242 | $ | 5,850,433 | ||||||||||||||||||||
|
|
|
|
|
|
|
| |||||||||||||||||||||
* For tax purposes, short-term capital gains are considered ordinary income distributions.
61
American Beacon FundsSM
Notes to Financial Statements
January 31, 2019
As of January 31, 2019, the components of distributable earnings (deficits) on a tax basis were as follows:
Fund | Tax Cost | Unrealized Appreciation | Unrealized (Depreciation) | Net Unrealized Appreciation (Depreciation) | ||||||||||||||||||||||||
| Frontier Markets Income | $ | 287,034,154 | $ | 3,140,981 | $ | (24,251,820 | ) | $ | (21,110,839 | ) | ||||||||||||||||||
| GLG Total Return | 453,271,449 | 38,466,839 | (47,866,410 | ) | (9,399,571 | ) | ||||||||||||||||||||||
Fund | Net Unrealized Appreciation (Depreciation) | Undistributed Ordinary Income | Undistributed Long-Term Capital Gains | Accumulated Capital and Other (Losses) | Other Temporary Differences | Distributable Earnings | ||||||||||||||||||||||||||||||||||||||
| Frontier Markets Income | $ | (21,110,839 | ) | $ | – | $ | – | $ | (16,739,951 | ) | $ | (1 | ) | $ | (37,850,791 | ) | ||||||||||||||||||||||||||||
| GLG Total Return | (9,399,571 | ) | – | – | (18,650,842 | ) | (1,074 | ) | (28,051,487 | ) | ||||||||||||||||||||||||||||||||||
Financial reporting records are adjusted for permanent book/tax differences to reflect tax character. Financial records are not adjusted for temporary differences. The temporary differences between financial reporting andtax-basis reporting of unrealized appreciation (depreciation) are attributable primarily to the tax deferral of losses from wash sales, defaulted bond income accruals, the tax deferral of losses from straddles, unused capital losses, the tax deferral of post-October capital losses and the realization for tax purposes of unrealized gains (losses) on certain derivative instruments.
Due to inherent differences in the recognition of income, expenses, and realized gains (losses) under U.S. GAAP and federal income tax regulations, permanent differences between book and tax reporting have been identified and appropriately reclassified on the Statements of Assets and Liabilities.
Accordingly, the following amounts represent current year permanent differences derived from nondeductible excise tax paid as of January 31, 2019:
Fund | Paid-In-Capital | Distributable Earnings/(Deficits) | ||||||||||||||
| Frontier Markets Income | $ | (3,657 | ) | $ | 3,657 | |||||||||||
| GLG Total Return | - | - | ||||||||||||||
Under the Regulated Investment Company Modernization Act of 2010 (“RIC MOD”), net capital losses recognized by the Funds in taxable years beginning after December 22, 2010 are carried forward indefinitely and retain their character as short-term and/or long-term losses.
During the year January 31, 2019, the Funds had the following post RIC MOD capital loss carryforwards:
Fund | Short-Term Capital Loss Carryforwards | Long-Term Capital Loss Carryforwards | ||||||||||
| Frontier Markets Income | $ | 4,529,552 | $ | 11,401,146 | ||||||||
| GLG Total Return | - | - | ||||||||||
The Funds are permitted for tax purposes to defer into their next fiscal year qualified late year losses. Qualified late year capital losses are any capital losses incurred after October 31 through the Funds’ fiscal year end, January 31, 2019. Qualified late year ordinary losses are specified losses generally incurred after October 31 and ordinary losses incurred after December 31 through the end of the Funds’ fiscal year, January 31, 2019. For the period ended January 31, 2019, Frontier Markets deferred $809,253 in late year ordinary losses to February 1, 2019 and GLG deferred $2,956,579 in short-term capital losses and $15,694,263 in late year ordinary losses to February 1, 2019.
62
American Beacon FundsSM
Notes to Financial Statements
January 31, 2019
8. Investment Transactions
The aggregate cost of purchases and proceeds from sales and maturities of investments, other than short-term obligations, for the year ended January 31, 2019 were as follows:
Fund | Purchases (non-U.S. Government Securities) | Purchases of U.S. Government Securities | Sales (non-U.S. Government Securities) | Sales of U.S. Government Securities | ||||||||||||||||||||||||
| Frontier Markets Income | $ | 149,287,312 | $ | - | $ | 48,250,879 | $ | - | ||||||||||||||||||||
| GLG Total Return | 1,776,305,242 | 369,430,648 | 2,054,835,405 | 372,098,294 | ||||||||||||||||||||||||
A summary of the Funds’ transactions in the USG Select Fund for the year ended January 31, 2019 were as follows:
Fund | Type of Transaction | January 31, 2018 Shares/Fair Value | Purchases | Sales | January 31, 2019 Shares/Fair Value | Dividend Income | ||||||||||||||||||||||||||||||||||||
| Frontier Markets Income | Direct | $ | 27,848,722 | $ | 167,260,560 | $ | 174,055,695 | $ | 21,053,587 | $ | 473,485 | |||||||||||||||||||||||||||||||
| GLG Total Return | Direct | 13,961,256 | 405,491,625 | 415,049,915 | 4,402,966 | 168,954 | ||||||||||||||||||||||||||||||||||||
9. Borrowing Arrangements
Effective November 15, 2018 (the “Effective Date”), the Funds, along with certain other funds managed by the Manager (“Participating Funds”), entered into a committed revolving line of credit (the “Committed Line”) agreement with State Street Bank and Trust Company (the “Bank”) to be used to facilitate portfolio liquidity. The maximum borrowing amount under the Committed Line is $250 million with interest at a rate equal to the higher of(a) one-month London Inter-Bank Offered Rate (“LIBOR”) plus 1.25% per annum or (b) the Federal Funds rate plus 1.25% per annum on amounts borrowed. Each of the Participating Funds will pay a closing fee of $100,000 on the Effective Date and a quarterly commitment fee at a rate of 0.25% per annum on the unused portion of the Committed Line amount. The Committed Line expires November 14, 2019, unless extended by the Bank or terminated by the Participating Funds in accordance with the agreement.
On the Effective Date, the Funds, along with certain other Participating Funds managed by the Manager, also entered into an uncommitted discretionary demand revolving line of credit (the “Uncommitted Line”) agreement with the Bank to be used to facilitate portfolio liquidity. The maximum borrowing amount under the Uncommitted Line is $50 million with interest at a rate equal to the higher of(a) one-month LIBOR plus 1.25% per annum or (b) the Federal Funds rate plus 1.25% per annum on each outstanding loan. Each of the Participating Funds will pay a closing fee of $35,000 on the Effective Date. The Uncommitted Line expires November 14, 2019 unless extended by the Bank or terminated by the Participating Funds in accordance with the agreement.
The Participating Funds paid administration, legal and arrangement fees, which are recognized as a component of “Other expenses” on the Statements of Operations, along with commitment fees, that have been allocated among the Participating Funds based on average daily net assets.
During the year ended January 31, 2019, the Frontier Markets Income Fund borrowed $12,500,000 from the Committed Line for 52 days with interest charges of $60,801 in order to facilitate portfolio liquidity with the addition of Aberdeen Asset Managers Limited to the Fund. This amount is recorded as “Other expenses” in the Statements of Operations. At January 31, 2019, neither Fund had an outstanding balance with either facility.
63
American Beacon FundsSM
Notes to Financial Statements
January 31, 2019
10. Capital Share Transactions
The tables below summarize the activity in capital shares for each Class of the Funds:
| Institutional Class | ||||||||||||||||||||||||||||
| Year Ended January 31, 2019 | Year Ended January 31, 2018 | |||||||||||||||||||||||||||
Frontier Markets Income Fund | Shares | Amount | Shares | Amount | ||||||||||||||||||||||||
| Shares sold | 3,070,392 | $ | 28,213,463 | 6,139,305 | $ | 57,844,697 | ||||||||||||||||||||||
| Reinvestment of dividends | 355,822 | 3,176,717 | 194,497 | 1,822,176 | ||||||||||||||||||||||||
| Shares redeemed | (3,251,151 | ) | (28,839,715 | ) | (759,494 | ) | (7,164,036 | ) | ||||||||||||||||||||
| Redemption fees | - | 29,120 | - | (626 | ) | |||||||||||||||||||||||
|
|
|
|
|
|
|
| |||||||||||||||||||||
| Net increase in shares outstanding | 175,063 | $ | 2,579,585 | 5,574,308 | $ | 52,502,211 | ||||||||||||||||||||||
|
|
|
|
|
|
|
| |||||||||||||||||||||
| Y Class | ||||||||||||||||||||||||||||
| Year Ended January 31, 2019 | Year Ended January 31, 2018 | |||||||||||||||||||||||||||
Frontier Markets Income Fund | Shares | Amount | Shares | Amount | ||||||||||||||||||||||||
| Shares sold | 12,531,283 | $ | 114,296,669 | 5,977,636 | $ | 56,371,234 | ||||||||||||||||||||||
| Reinvestment of dividends | 1,247,796 | 11,082,499 | 371,040 | 3,480,135 | ||||||||||||||||||||||||
| Shares redeemed | (4,502,098 | ) | (39,757,884 | ) | (787,633 | ) | (7,423,091 | ) | ||||||||||||||||||||
| Redemption fees | - | 48,302 | - | 6,934 | ||||||||||||||||||||||||
|
|
|
|
|
|
|
| |||||||||||||||||||||
| Net increase in shares outstanding | 9,276,981 | $ | 85,669,586 | 5,561,043 | $ | 52,435,212 | ||||||||||||||||||||||
|
|
|
|
|
|
|
| |||||||||||||||||||||
| Investor Class | ||||||||||||||||||||||||||||
| Year Ended January 31, 2019 | Year Ended January 31, 2018 | |||||||||||||||||||||||||||
Frontier Markets Income Fund | Shares | Amount | Shares | Amount | ||||||||||||||||||||||||
| Shares sold | 2,973,069 | $ | 26,636,928 | 2,670,141 | $ | 24,877,596 | ||||||||||||||||||||||
| Reinvestment of dividends | 418,581 | 3,726,381 | 242,444 | 2,266,383 | ||||||||||||||||||||||||
| Shares redeemed | (2,122,257 | ) | (18,832,117 | ) | (836,260 | ) | (7,768,266 | ) | ||||||||||||||||||||
| Redemption fees | - | 7,815 | - | 3,588 | ||||||||||||||||||||||||
|
|
|
|
|
|
|
| |||||||||||||||||||||
| Net increase in shares outstanding | 1,269,393 | $ | 11,539,007 | 2,076,325 | $ | 19,379,301 | ||||||||||||||||||||||
|
|
|
|
|
|
|
| |||||||||||||||||||||
| A Class | ||||||||||||||||||||||||||||
| Year Ended January 31, 2019 | Year Ended January 31, 2018 | |||||||||||||||||||||||||||
Frontier Markets Income Fund | Shares | Amount | Shares | Amount | ||||||||||||||||||||||||
| Shares sold | 206,492 | $ | 1,906,208 | 246,600 | $ | 2,317,510 | ||||||||||||||||||||||
| Reinvestment of dividends | 29,710 | 266,124 | 30,605 | 284,937 | ||||||||||||||||||||||||
| Shares redeemed | (253,821 | ) | (2,289,629 | ) | (408,936 | ) | (3,828,759 | ) | ||||||||||||||||||||
| Redemption fees | - | 1,491 | - | 616 | ||||||||||||||||||||||||
|
|
|
|
|
|
|
| |||||||||||||||||||||
| Net (decrease) in shares outstanding | (17,619 | ) | $ | (115,806 | ) | (131,731 | ) | $ | (1,225,696 | ) | ||||||||||||||||||
|
|
|
|
|
|
|
| |||||||||||||||||||||
| C Class | ||||||||||||||||||||||||||||
| Year Ended January 31, 2019 | Year Ended January 31, 2018 | |||||||||||||||||||||||||||
Frontier Markets Income Fund | Shares | Amount | Shares | Amount | ||||||||||||||||||||||||
| Shares sold | 463,799 | $ | 4,257,101 | 736,515 | $ | 6,959,248 | ||||||||||||||||||||||
| Reinvestment of dividends | 83,406 | 739,780 | 22,677 | 212,223 | ||||||||||||||||||||||||
| Shares redeemed | (233,451 | ) | (2,078,167 | ) | (75,480 | ) | (705,978 | ) | ||||||||||||||||||||
| Redemption fees | - | 2,271 | - | 602 | ||||||||||||||||||||||||
|
|
|
|
|
|
|
| |||||||||||||||||||||
| Net increase in shares outstanding | 313,754 | $ | 2,920,985 | 683,712 | $ | 6,466,095 | ||||||||||||||||||||||
|
|
|
|
|
|
|
| |||||||||||||||||||||
| Institutional Class | ||||||||||||||||||||||||||||
| Year Ended January 31, 2019 | Year Ended January 31, 2018 | |||||||||||||||||||||||||||
GLG Total Return Fund | Shares | Amount | Shares | Amount | ||||||||||||||||||||||||
| Shares sold | 100,000 | $ | 1,090,000 | - | $ | - | ||||||||||||||||||||||
| Reinvestment of dividends | 1,175 | 12,087 | 3,291 | 35,124 | ||||||||||||||||||||||||
| Shares redeemed | (100,000 | ) | (1,029,000 | ) | (679,807 | ) | (7,300,030 | ) | ||||||||||||||||||||
|
|
|
|
|
|
|
| |||||||||||||||||||||
| Net increase (decrease) in shares outstanding | 1,175 | $ | 73,087 | (676,516 | ) | $ | (7,264,906 | ) | ||||||||||||||||||||
|
|
|
|
|
|
|
| |||||||||||||||||||||
64
American Beacon FundsSM
Notes to Financial Statements
January 31, 2019
| Y Class | ||||||||||||||||||||||||||||
| Year Ended January 31, 2019 | Year Ended January 31, 2018 | |||||||||||||||||||||||||||
GLG Total Return Fund | Shares | Amount | Shares | Amount | ||||||||||||||||||||||||
| Shares sold | 24,399 | $ | 255,017 | 99,879 | $ | 1,076,470 | ||||||||||||||||||||||
| Reinvestment of dividends | 2,128 | 21,812 | 794 | 8,458 | ||||||||||||||||||||||||
| Shares redeemed | (58,066 | ) | (610,285 | ) | (11,543 | ) | (124,763 | ) | ||||||||||||||||||||
|
|
|
|
|
|
|
| |||||||||||||||||||||
| Net increase (decrease) in shares outstanding | (31,539 | ) | $ | (333,456 | ) | 89,130 | $ | 960,165 | ||||||||||||||||||||
|
|
|
|
|
|
|
| |||||||||||||||||||||
| Investor Class | ||||||||||||||||||||||||||||
| Year Ended January 31, 2019 | Year Ended January 31, 2018 | |||||||||||||||||||||||||||
GLG Total Return Fund | Shares | Amount | Shares | Amount | ||||||||||||||||||||||||
| Shares sold | 858 | $ | 9,000 | 2,242 | $ | 24,098 | ||||||||||||||||||||||
| Reinvestment of dividends | 579 | 5,902 | 152 | 1,614 | ||||||||||||||||||||||||
| Shares redeemed | (2,078 | ) | (21,008 | ) | - | - | ||||||||||||||||||||||
|
|
|
|
|
|
|
| |||||||||||||||||||||
| Net increase (decrease) in shares outstanding | (641 | ) | $ | (6,106 | ) | 2,394 | $ | 25,712 | ||||||||||||||||||||
|
|
|
|
|
|
|
| |||||||||||||||||||||
| A Class | ||||||||||||||||||||||||||||
| Year Ended January 31, 2019 | Year Ended January 31, 2018 | |||||||||||||||||||||||||||
GLG Total Return Fund | Shares | Amount | Shares | Amount | ||||||||||||||||||||||||
| Reinvestment of dividends | 393 | $ | 3,999 | 114 | $ | 1,210 | ||||||||||||||||||||||
|
|
|
|
|
|
|
| |||||||||||||||||||||
| Net increase in shares outstanding | 393 | $ | 3,999 | 114 | $ | 1,210 | ||||||||||||||||||||||
|
|
|
|
|
|
|
| |||||||||||||||||||||
| C Class | ||||||||||||||||||||||||||||
| Year Ended January 31, 2019 | Year Ended January 31, 2018 | |||||||||||||||||||||||||||
GLG Total Return Fund | Shares | Amount | Shares | Amount | ||||||||||||||||||||||||
| Reinvestment of dividends | 390 | $ | 3,911 | 62 | $ | 644 | ||||||||||||||||||||||
|
|
|
|
|
|
|
| |||||||||||||||||||||
| Net increase in shares outstanding | 390 | $ | 3,911 | 62 | $ | 644 | ||||||||||||||||||||||
|
|
|
|
|
|
|
| |||||||||||||||||||||
| Ultra Class | ||||||||||||||||||||||||||||
| Year Ended January 31, 2019 | Year Ended January 31, 2018 | |||||||||||||||||||||||||||
GLG Total Return Fund | Shares | Amount | Shares | Amount | ||||||||||||||||||||||||
| Shares sold | 16,668,784 | $ | 177,675,100 | 73,646,676 | $ | 792,613,671 | ||||||||||||||||||||||
| Reinvestment of dividends | 1,824,890 | 18,796,370 | 12,855 | 137,054 | ||||||||||||||||||||||||
| Shares redeemed | (43,275,069 | ) | (461,146,321 | ) | (9,080,295 | ) | (97,390,518 | ) | ||||||||||||||||||||
|
|
|
|
|
|
|
| |||||||||||||||||||||
| Net increase in shares outstanding | (24,781,395 | ) | $ | (264,674,851 | ) | 64,579,236 | $ | 695,360,207 | ||||||||||||||||||||
|
|
|
|
|
|
|
| |||||||||||||||||||||
11. Subsequent Events
Management has evaluated subsequent events for possible recognition or disclosure in the financial statements through the date the financial statements are issued. Management has determined that there are no material events that would require disclosure in the Funds’ financial statements through this date.
65
American Beacon Frontier Markets Income FundSM
(For a share outstanding throughout the period)
| Institutional Class | ||||||||||||||||||||||||||||||||||||
| Year Ended January 31, | February 25, | |||||||||||||||||||||||||||||||||||
| 2014A to | ||||||||||||||||||||||||||||||||||||
| January 31, | ||||||||||||||||||||||||||||||||||||
| 2019J | 2018 | 2017 | 2016 | 2015 | ||||||||||||||||||||||||||||||||
|
| |||||||||||||||||||||||||||||||||||
Net asset value, beginning of period | $ | 9.62 | $ | 8.96 | $ | 8.35 | $ | 9.68 | $ | 10.00 | ||||||||||||||||||||||||||
|
|
|
|
|
|
|
|
|
| |||||||||||||||||||||||||||
Income (loss) from investment operations: | ||||||||||||||||||||||||||||||||||||
Net investment income | 0.80 | 0.77 | 0.88 | 0.67 | 0.59 | |||||||||||||||||||||||||||||||
Net gains (losses) on investments (both realized and unrealized) | (0.96 | ) | 0.61 | 0.44 | (1.30 | ) | (0.30 | ) | ||||||||||||||||||||||||||||
|
|
|
|
|
|
|
|
|
| |||||||||||||||||||||||||||
Total income (loss) from investment operations | (0.16 | ) | 1.38 | 1.32 | (0.63 | ) | 0.29 | |||||||||||||||||||||||||||||
|
|
|
|
|
|
|
|
|
| |||||||||||||||||||||||||||
Less distributions: | ||||||||||||||||||||||||||||||||||||
Dividends from net investment income | (0.78 | ) | (0.72 | ) | (0.08 | ) | (0.50 | ) | (0.59 | ) | ||||||||||||||||||||||||||
Distributions from net realized gains | - | - | - | - | (0.02 | ) | ||||||||||||||||||||||||||||||
Tax return of capital | - | - | (0.63 | )B | (0.20 | )B | - | |||||||||||||||||||||||||||||
|
|
|
|
|
|
|
|
|
| |||||||||||||||||||||||||||
Total distributions | (0.78 | ) | (0.72 | ) | (0.71 | ) | (0.70 | ) | (0.61 | ) | ||||||||||||||||||||||||||
|
|
|
|
|
|
|
|
|
| |||||||||||||||||||||||||||
Redemption fees added to beneficial interestsC | - | - | - | - | - | |||||||||||||||||||||||||||||||
|
|
|
|
|
|
|
|
|
| |||||||||||||||||||||||||||
Net asset value, end of period | $ | 8.68 | $ | 9.62 | $ | 8.96 | $ | 8.35 | $ | 9.68 | ||||||||||||||||||||||||||
|
|
|
|
|
|
|
|
|
| |||||||||||||||||||||||||||
Total returnD | (1.58 | )% | 15.92 | % | 16.20 | % | (6.98 | )% | 2.76 | %E | ||||||||||||||||||||||||||
|
|
|
|
|
|
|
|
|
| |||||||||||||||||||||||||||
Ratios and supplemental data: | ||||||||||||||||||||||||||||||||||||
Net assets, end of period | $ | 62,523,243 | $ | 67,653,731 | $ | 13,047,515 | $ | 10,531,288 | $ | 9,225,629 | ||||||||||||||||||||||||||
Ratios to average net assets: | ||||||||||||||||||||||||||||||||||||
Expenses, before reimbursements or recoupments | 1.20 | % | 1.17 | % | 1.40 | % | 1.14 | % | 1.95 | %F | ||||||||||||||||||||||||||
Expenses, net of reimbursements or recoupments | 1.17 | %I | 1.15 | % | 1.27 | %G | 1.15 | % | 1.15 | %F | ||||||||||||||||||||||||||
Net investment income, before expense reimbursements or recoupments | 8.87 | % | 9.04 | % | 9.98 | % | 7.14 | % | 5.43 | %F | ||||||||||||||||||||||||||
Net investment income, net of reimbursements or recoupments | 8.90 | % | 9.06 | % | 10.11 | % | 7.13 | % | 6.22 | %F | ||||||||||||||||||||||||||
Portfolio turnover rate | 21 | % | 22 | % | 69 | % | 68 | % | 23 | %H | ||||||||||||||||||||||||||
| A | Commencement of operations. |
| B | Tax return of capital is calculated based on outstanding shares at the time of distribution. |
| C | Amount represents less than $0.01 per share. |
| D | Based on net asset value, which does not reflect the sales charge, redemption fee, or contingent deferred sales charge, if applicable. May include adjustments in accordance with U.S. GAAP and as such, the net asset value for reporting purposes and the returns based upon those net asset values may differ from the net asset value and returns for shareholder transactions. |
| E | Not annualized. |
| F | Annualized. |
| G | Voluntary expense cap. See Note 2 of the Notes to the Financial Statements. |
| H | Portfolio turnover rate is for the period from February 25, 2014 through January 31, 2015 and is not annualized. |
| I | Includes non-operating expenses consisting of loan interest expenses. The expenses, net of reimbursements or recoupments ratio excluding non-operating expenses is 1.15%. |
| J | On October 1, 2018, Aberdeen Asset Managers Limited began managing a portion of the assets of the American Beacon Frontier Markets Income Fund. |
See accompanying notes
66
American Beacon Frontier Markets Income FundSM
Financial Highlights
(For a share outstanding throughout the period)
| Y Class | ||||||||||||||||||||||||||||||||||||
| Year Ended January 31, | February 25, 2014A to January 31, | |||||||||||||||||||||||||||||||||||
| 2019J | 2018 | 2017 | 2016 | 2015 | ||||||||||||||||||||||||||||||||
|
| |||||||||||||||||||||||||||||||||||
Net asset value, beginning of period | $ | 9.63 | $ | 8.97 | $ | 8.34 | $ | 9.69 | $ | 10.00 | ||||||||||||||||||||||||||
|
|
|
|
|
|
|
|
|
| |||||||||||||||||||||||||||
Income (loss) from investment operations: | ||||||||||||||||||||||||||||||||||||
Net investment income | 0.74 | 0.79 | 0.90 | 0.61 | 0.58 | |||||||||||||||||||||||||||||||
Net gains (losses) on investments (both realized and unrealized) | (0.92 | ) | 0.58 | 0.44 | (1.28 | ) | (0.28 | ) | ||||||||||||||||||||||||||||
|
|
|
|
|
|
|
|
|
| |||||||||||||||||||||||||||
Total income (loss) from investment operations | (0.18 | ) | 1.37 | 1.34 | (0.67 | ) | 0.30 | |||||||||||||||||||||||||||||
|
|
|
|
|
|
|
|
|
| |||||||||||||||||||||||||||
Less distributions: | ||||||||||||||||||||||||||||||||||||
Dividends from net investment income | (0.77 | ) | (0.71 | ) | (0.08 | ) | (0.50 | ) | (0.59 | ) | ||||||||||||||||||||||||||
Distributions from net realized gains | - | - | - | - | (0.02 | ) | ||||||||||||||||||||||||||||||
Tax return of capital | - | - | (0.63 | )B | (0.18 | )B | - | |||||||||||||||||||||||||||||
|
|
|
|
|
|
|
|
|
| |||||||||||||||||||||||||||
Total distributions | (0.77 | ) | (0.71 | ) | (0.71 | ) | (0.68 | ) | (0.61 | ) | ||||||||||||||||||||||||||
|
|
|
|
|
|
|
|
|
| |||||||||||||||||||||||||||
Redemption fees added to beneficial interestsC | - | - | - | - | - | |||||||||||||||||||||||||||||||
|
|
|
|
|
|
|
|
|
| |||||||||||||||||||||||||||
Net asset value, end of period | $ | 8.68 | $ | 9.63 | $ | 8.97 | $ | 8.34 | $ | 9.69 | ||||||||||||||||||||||||||
|
|
|
|
|
|
|
|
|
| |||||||||||||||||||||||||||
Total returnD | (1.76 | )% | 15.83 | % | 16.37 | % | (7.40 | )% | 2.87 | %E | ||||||||||||||||||||||||||
|
|
|
|
|
|
|
|
|
| |||||||||||||||||||||||||||
Ratios and supplemental data: | ||||||||||||||||||||||||||||||||||||
Net assets, end of period | $ | 151,728,470 | $ | 79,007,953 | $ | 23,715,300 | $ | 29,434,613 | $ | 138,082,358 | ||||||||||||||||||||||||||
Ratios to average net assets: | ||||||||||||||||||||||||||||||||||||
Expenses, before reimbursements or recoupments | 1.29 | % | 1.25 | % | 1.48 | % | 1.18 | % | 1.50 | %F | ||||||||||||||||||||||||||
Expenses, net of reimbursements or recoupments | 1.27 | %I | 1.25 | % | 1.37 | %G | 1.25 | % | 1.25 | %F | ||||||||||||||||||||||||||
Net investment income, before expense reimbursements or recoupments | 8.79 | % | 8.94 | % | 10.49 | % | 7.35 | % | 6.33 | %F | ||||||||||||||||||||||||||
Net investment income, net of reimbursements or recoupments | 8.80 | % | 8.94 | % | 10.61 | % | 7.28 | % | 6.59 | %F | ||||||||||||||||||||||||||
Portfolio turnover rate | 21 | % | 22 | % | 69 | % | 68 | % | 23 | %H | ||||||||||||||||||||||||||
| A | Commencement of operations. |
| B | The tax return of capital is calculated based on shares outstanding at the time of distribution. |
| C | Amount represents less than $0.01 per share. |
| D | Based on net asset value, which does not reflect the sales charge, redemption fee, or contingent deferred sales charge, if applicable. May include adjustments in accordance with U.S. GAAP and as such, the net asset value for reporting purposes and the returns based upon those net asset values may differ from the net asset value and returns for shareholder transactions. |
| E | Not annualized. |
| F | Annualized. |
| G | Voluntary expense cap. See Note 2 of the Notes to the Financial Statements. |
| H | Portfolio turnover rate is for the period from February 25, 2014 through January 31, 2015 and is not annualized. |
| I | Includes non-operating expenses consisting of loan interest expenses. The expenses, net of reimbursements or recoupments ratio excluding non-operating expenses is 1.25%. |
| J | On October 1, 2018, Aberdeen Asset Managers Limited began managing a portion of the assets of the American Beacon Frontier Markets Income Fund. |
See accompanying notes
67
American Beacon Frontier Markets Income FundSM
Financial Highlights
(For a share outstanding throughout the period)
| Investor Class | ||||||||||||||||||||||||||||||||||||
| Year Ended January 31, | February 25, 2014A to January 31, | |||||||||||||||||||||||||||||||||||
| 2019J | 2018 | 2017 | 2016 | 2015 | ||||||||||||||||||||||||||||||||
|
| |||||||||||||||||||||||||||||||||||
Net asset value, beginning of period | $ | 9.61 | $ | 8.95 | $ | 8.35 | $ | 9.68 | $ | 10.00 | ||||||||||||||||||||||||||
|
|
|
|
|
|
|
|
|
| |||||||||||||||||||||||||||
Income (loss) from investment operations: | ||||||||||||||||||||||||||||||||||||
Net investment income | 0.74 | 0.78 | 0.85 | 0.63 | 0.55 | |||||||||||||||||||||||||||||||
Net gains (losses) on investments (both realized and unrealized) | (0.93 | ) | 0.57 | 0.43 | (1.30 | ) | (0.29 | ) | ||||||||||||||||||||||||||||
|
|
|
|
|
|
|
|
|
| |||||||||||||||||||||||||||
Total income (loss) from investment operations | (0.19 | ) | 1.35 | 1.28 | (0.67 | ) | 0.26 | |||||||||||||||||||||||||||||
|
|
|
|
|
|
|
|
|
| |||||||||||||||||||||||||||
Less distributions: | ||||||||||||||||||||||||||||||||||||
Dividends from net investment income | (0.75 | ) | (0.69 | ) | (0.07 | ) | (0.47 | ) | (0.56 | ) | ||||||||||||||||||||||||||
Distributions from net realized gains | - | - | - | - | (0.02 | ) | ||||||||||||||||||||||||||||||
Tax return of capital | - | - | (0.61 | )B | (0.19 | )B | - | |||||||||||||||||||||||||||||
|
|
|
|
|
|
|
|
|
| |||||||||||||||||||||||||||
Total distributions | (0.75 | ) | (0.69 | ) | (0.68 | ) | (0.66 | ) | (0.58 | ) | ||||||||||||||||||||||||||
|
|
|
|
|
|
|
|
|
| |||||||||||||||||||||||||||
Redemption fees added to beneficial interestsC | - | - | - | - | - | |||||||||||||||||||||||||||||||
|
|
|
|
|
|
|
|
|
| |||||||||||||||||||||||||||
Net asset value, end of period | $ | 8.67 | $ | 9.61 | $ | 8.95 | $ | 8.35 | $ | 9.68 | ||||||||||||||||||||||||||
|
|
|
|
|
|
|
|
|
| |||||||||||||||||||||||||||
Total returnD | (1.94 | )% | 15.59 | % | 15.69 | % | (7.33 | )% | 2.47 | %E | ||||||||||||||||||||||||||
|
|
|
|
|
|
|
|
|
| |||||||||||||||||||||||||||
Ratios and supplemental data: | ||||||||||||||||||||||||||||||||||||
Net assets, end of period | $ | 48,475,727 | $ | 41,560,845 | $ | 20,120,332 | $ | 15,934,048 | $ | 13,987,805 | ||||||||||||||||||||||||||
Ratios to average net assets: | ||||||||||||||||||||||||||||||||||||
Expenses, before reimbursements or recoupments | 1.52 | % | 1.41 | % | 1.72 | % | 1.44 | % | 1.78 | %F | ||||||||||||||||||||||||||
Expenses, net of reimbursements or recoupments | 1.52 | %I | 1.51 | % | 1.63 | %G | 1.53 | % | 1.53 | %F | ||||||||||||||||||||||||||
Net investment income, before expense reimbursements or recoupments | 8.57 | % | 8.73 | % | 9.62 | % | 6.84 | % | 5.86 | %F | ||||||||||||||||||||||||||
Net investment income, net of reimbursements or recoupments | 8.57 | % | 8.64 | % | 9.71 | % | 6.76 | % | 6.12 | %F | ||||||||||||||||||||||||||
Portfolio turnover rate | 21 | % | 22 | % | 69 | % | 68 | % | 23 | %H | ||||||||||||||||||||||||||
| A | Commencement of operations. |
| B | Tax return of capital is calculated based on outstanding shares at the time of distribution. |
| C | Amount represents less than $0.01 per share. |
| D | Based on net asset value, which does not reflect the sales charge, redemption fee, or contingent deferred sales charge, if applicable. May include adjustments in accordance with U.S. GAAP and as such, the net asset value for reporting purposes and the returns based upon those net asset values may differ from the net asset value and returns for shareholder transactions. |
| E | Not annualized. |
| F | Annualized. |
| G | Voluntary expense cap. See Note 2 of the Notes to the Financial Statements. |
| H | Portfolio turnover rate is for the period from February 25, 2014 through January 31, 2015 and is not annualized. |
| I | Includes non-operating expenses consisting of loan interest expenses. The expenses, net of reimbursements or recoupments ratio excluding non-operating expenses is 1.50%. |
| J | On October 1, 2018, Aberdeen Asset Managers Limited began managing a portion of the assets of the American Beacon Frontier Markets Income Fund. |
See accompanying notes
68
American Beacon Frontier Markets Income FundSM
Financial Highlights
(For a share outstanding throughout the period)
| A Class | ||||||||||||||||||||||||||||||||||||
| Year Ended January 31, | February 25, 2014A to January 31, | |||||||||||||||||||||||||||||||||||
| 2019J | 2018 | 2017 | 2016 | 2015 | ||||||||||||||||||||||||||||||||
|
| |||||||||||||||||||||||||||||||||||
Net asset value, beginning of period | $ | 9.62 | $ | 8.96 | $ | 8.35 | $ | 9.68 | $ | 10.00 | ||||||||||||||||||||||||||
|
|
|
|
|
|
|
|
|
| |||||||||||||||||||||||||||
Income (loss) from investment operations: | ||||||||||||||||||||||||||||||||||||
Net investment income | 0.75 | 0.81 | 0.90 | 0.62 | 0.54 | |||||||||||||||||||||||||||||||
Net gains (losses) on investments (both realized and unrealized) | (0.98 | ) | 0.53 | 0.39 | (1.29 | ) | (0.29 | ) | ||||||||||||||||||||||||||||
|
|
|
|
|
|
|
|
|
| |||||||||||||||||||||||||||
Total income (loss) from investment operations | (0.23 | ) | 1.34 | 1.29 | (0.67 | ) | 0.25 | |||||||||||||||||||||||||||||
|
|
|
|
|
|
|
|
|
| |||||||||||||||||||||||||||
Less distributions: | ||||||||||||||||||||||||||||||||||||
Dividends from net investment income | (0.74 | ) | (0.68 | ) | (0.07 | ) | (0.47 | ) | (0.55 | ) | ||||||||||||||||||||||||||
Distributions from net realized gains | - | - | - | - | (0.02 | ) | ||||||||||||||||||||||||||||||
Tax return of capital | - | - | (0.61 | )B | (0.19 | )B | - | |||||||||||||||||||||||||||||
|
|
|
|
|
|
|
|
|
| |||||||||||||||||||||||||||
Total distributions | (0.74 | ) | (0.68 | ) | (0.68 | ) | (0.66 | ) | (0.57 | ) | ||||||||||||||||||||||||||
|
|
|
|
|
|
|
|
|
| |||||||||||||||||||||||||||
Redemption fees added to beneficial interestsC | - | - | - | - | - | |||||||||||||||||||||||||||||||
|
|
|
|
|
|
|
|
|
| |||||||||||||||||||||||||||
Net asset value, end of period | $ | 8.65 | $ | 9.62 | $ | 8.96 | $ | 8.35 | $ | 9.68 | ||||||||||||||||||||||||||
|
|
|
|
|
|
|
|
|
| |||||||||||||||||||||||||||
Total returnD | (2.31 | )% | 15.51 | % | 15.77 | % | (7.36 | )% | 2.42 | %E | ||||||||||||||||||||||||||
|
|
|
|
|
|
|
|
|
| |||||||||||||||||||||||||||
Ratios and supplemental data: | ||||||||||||||||||||||||||||||||||||
Net assets, end of period | $ | 3,200,206 | $ | 3,726,687 | $ | 4,648,954 | $ | 7,513,980 | $ | 15,782,502 | ||||||||||||||||||||||||||
Ratios to average net assets: | ||||||||||||||||||||||||||||||||||||
Expenses, before reimbursements or recoupments | 1.53 | % | 1.48 | % | 1.78 | % | 1.52 | % | 1.88 | %F | ||||||||||||||||||||||||||
Expenses, net of reimbursements or recoupments | 1.71 | %I | 1.55 | % | 1.67 | %G | 1.55 | % | 1.55 | %F | ||||||||||||||||||||||||||
Net investment income, before expense reimbursements or recoupments | 8.49 | % | 8.65 | % | 9.85 | % | 6.89 | % | 5.82 | %F | ||||||||||||||||||||||||||
Net investment income, net of reimbursements or recoupments | 8.30 | % | 8.58 | % | 9.96 | % | 6.86 | % | 6.15 | %F | ||||||||||||||||||||||||||
Portfolio turnover rate | 21 | % | 22 | % | 69 | % | 68 | % | 23 | %H | ||||||||||||||||||||||||||
| A | Commencement of operations. |
| B | Tax return of capital is calculated based on outstanding shares at the time of distribution. |
| C | Amount represents less than $0.01 per share. |
| D | Based on net asset value, which does not reflect the sales charge, redemption fee, or contingent deferred sales charge, if applicable. May include adjustments in accordance with U.S. GAAP and as such, the net asset value for reporting purposes and the returns based upon those net asset values may differ from the net asset value and returns for shareholder transactions. |
| E | Not annualized. |
| F | Annualized. |
| G | Voluntary expense cap. See Note 2 of the Notes to the Financial Statements. |
| H | Portfolio turnover rate is for the period from February 25, 2014 through January 31, 2015 and is not annualized. |
| I | Includes non-operating expenses consisting of loan interest expenses. The expenses, net of reimbursements or recoupments ratio excluding non-operating expenses is 1.69%. |
| J | On October 1, 2018, Aberdeen Asset Managers Limited began managing a portion of the assets of the American Beacon Frontier Markets Income Fund. |
See accompanying notes
69
American Beacon Frontier Markets Income FundSM
Financial Highlights
(For a share outstanding throughout the period)
| C Class | ||||||||||||||||||||||||||||||||||||
| Year Ended January 31, | February 25, 2014A to January 31, | |||||||||||||||||||||||||||||||||||
| 2019I | 2018 | 2017 | 2016 | 2015 | ||||||||||||||||||||||||||||||||
|
| |||||||||||||||||||||||||||||||||||
Net asset value, beginning of period | $ | 9.58 | $ | 8.93 | $ | 8.34 | $ | 9.67 | $ | 10.00 | ||||||||||||||||||||||||||
|
|
|
|
|
|
|
|
|
| |||||||||||||||||||||||||||
Income (loss) from investment operations: | ||||||||||||||||||||||||||||||||||||
Net investment income | 0.68 | 0.65 | 0.83 | 0.56 | 0.47 | |||||||||||||||||||||||||||||||
Net gains (losses) on investments (both realized and unrealized) | (0.95 | ) | 0.62 | 0.39 | (1.30 | ) | (0.30 | ) | ||||||||||||||||||||||||||||
|
|
|
|
|
|
|
|
|
| |||||||||||||||||||||||||||
Total income (loss) from investment operations | (0.27 | ) | 1.27 | 1.22 | (0.74 | ) | 0.17 | |||||||||||||||||||||||||||||
|
|
|
|
|
|
|
|
|
| |||||||||||||||||||||||||||
Less distributions: | ||||||||||||||||||||||||||||||||||||
Dividends from net investment income | (0.67 | ) | (0.62 | ) | (0.07 | ) | (0.42 | ) | (0.48 | ) | ||||||||||||||||||||||||||
Distributions from net realized gains | - | - | - | - | (0.02 | ) | ||||||||||||||||||||||||||||||
Tax return of capital | - | - | (0.56 | )B | (0.17 | )B | - | |||||||||||||||||||||||||||||
|
|
|
|
|
|
|
|
|
| |||||||||||||||||||||||||||
Total distributions | (0.67 | ) | (0.62 | ) | (0.63 | ) | (0.59 | ) | (0.50 | ) | ||||||||||||||||||||||||||
|
|
|
|
|
|
|
|
|
| |||||||||||||||||||||||||||
Redemption fees added to beneficial interestsC | - | - | - | - | - | |||||||||||||||||||||||||||||||
|
|
|
|
|
|
|
|
|
| |||||||||||||||||||||||||||
Net asset value, end of period | $ | 8.64 | $ | 9.58 | $ | 8.93 | $ | 8.34 | $ | 9.67 | ||||||||||||||||||||||||||
|
|
|
|
|
|
|
|
|
| |||||||||||||||||||||||||||
Total returnD | (2.74 | )% | 14.66 | % | 14.90 | % | (8.06 | )% | 1.60 | %E | ||||||||||||||||||||||||||
|
|
|
|
|
|
|
|
|
| |||||||||||||||||||||||||||
Ratios and supplemental data: | ||||||||||||||||||||||||||||||||||||
Net assets, end of period | $ | 10,283,443 | $ | 8,398,773 | $ | 1,724,982 | $ | 2,049,234 | $ | 1,244,636 | ||||||||||||||||||||||||||
Ratios to average net assets: | ||||||||||||||||||||||||||||||||||||
Expenses, before reimbursements or recoupments | 2.28 | % | 2.29 | % | 2.55 | % | 2.31 | % | 3.01 | %F | ||||||||||||||||||||||||||
Expenses, net of reimbursements or recoupments | 2.33 | %H | 2.30 | % | 2.30 | % | 2.30 | % | 2.31 | %F | ||||||||||||||||||||||||||
Net investment income, before expense reimbursements or recoupments | 7.79 | % | 7.81 | % | 8.90 | % | 5.89 | % | 4.62 | %F | ||||||||||||||||||||||||||
Net investment income, net of reimbursements or recoupments | 7.75 | % | 7.81 | % | 9.14 | % | 5.90 | % | 5.33 | %F | ||||||||||||||||||||||||||
Portfolio turnover rate | 21 | % | 22 | % | 69 | % | 68 | % | 23 | %G | ||||||||||||||||||||||||||
| A | Commencement of operations. |
| B | Tax return of capital is calculated based on outstanding shares at the time of distribution. |
| C | Amount represents less than $0.01 per share. |
| D | Based on net asset value, which does not reflect the sales charge, redemption fee, or contingent deferred sales charge, if applicable. May include adjustments in accordance with U.S. GAAP and as such, the net asset value for reporting purposes and the returns based upon those net asset values may differ from the net asset value and returns for shareholder transactions. |
| E | Not annualized. |
| F | Annualized. |
| G | Portfolio turnover rate is for the period from February 25, 2014 through January 31, 2015 and is not annualized. |
| H | Includes non-operating expenses consisting of loan interest expenses. The expenses, net of reimbursements or recoupments ratio excluding non-operating expenses is 2.30%. |
| I | On October 1, 2018, Aberdeen Asset Managers Limited began managing a portion of the assets of the American Beacon Frontier Markets Income Fund. |
See accompanying notes
70
American Beacon GLG Total Return FundSM
Financial Highlights
(For a share outstanding throughout the period)
| Institutional Class | ||||||||||||||||||||
| Year Ended January 31, | May 20, 2016A to January 31, | |||||||||||||||||||
| 2019 | 2018 | 2017 | ||||||||||||||||||
|
| |||||||||||||||||||
Net asset value, beginning of period | $ | 10.50 | $ | 10.69 | $ | 10.00 | ||||||||||||||
|
|
|
|
|
| |||||||||||||||
Income (loss) from investment operations: | ||||||||||||||||||||
Net investment income | 0.11 | B | 0.06 | B | 0.07 | |||||||||||||||
Net gains (losses) on investments (both realized and unrealized) | (0.06 | ) | (0.12 | ) | 0.73 | |||||||||||||||
|
|
|
|
|
| |||||||||||||||
Total income (loss) from investment operations | 0.05 | (0.06 | ) | 0.80 | ||||||||||||||||
|
|
|
|
|
| |||||||||||||||
Less distributions: | ||||||||||||||||||||
Dividends from net investment income | (0.15 | ) | (0.11 | ) | (0.10 | ) | ||||||||||||||
Distributions from net realized gains | (0.24 | ) | (0.02 | ) | (0.01 | ) | ||||||||||||||
Tax return of capital | - | (0.00 | )CD | - | ||||||||||||||||
|
|
|
|
|
| |||||||||||||||
Total distributions | (0.39 | ) | (0.13 | ) | (0.11 | ) | ||||||||||||||
|
|
|
|
|
| |||||||||||||||
Net asset value, end of period | $ | 10.16 | $ | 10.50 | $ | 10.69 | ||||||||||||||
|
|
|
|
|
| |||||||||||||||
Total returnE | 0.47 | % | (0.64 | )% | 7.95 | %F | ||||||||||||||
|
|
|
|
|
| |||||||||||||||
Ratios and supplemental data: | ||||||||||||||||||||
Net assets, end of period | $ | 323,306 | $ | 321,683 | $ | 7,560,278 | ||||||||||||||
Ratios to average net assets: | ||||||||||||||||||||
Expenses, before reimbursements or recoupments | 1.03 | % | 1.03 | % | 2.09 | %G | ||||||||||||||
Expenses, net of reimbursements or recoupments | 1.06 | % | 1.05 | % | 1.05 | %G | ||||||||||||||
Net investment income, before expense reimbursements or recoupments | 1.06 | % | 0.49 | % | 0.01 | %G | ||||||||||||||
Net investment income, net of reimbursements or recoupments | 1.04 | % | 0.46 | % | 1.05 | %G | ||||||||||||||
Portfolio turnover rate | 326 | % | 248 | % | 311 | %F | ||||||||||||||
| A | Commencement of operations. |
| B | Per share amounts have been calculated using the average shares method. |
| C | Tax return of capital is calculated based on outstanding shares at the time of distribution. |
| D | Amount represents less than $0.01 per share. |
| E | Based on net asset value, which does not reflect the sales charge, redemption fee, or contingent deferred sales charge, if applicable. May include adjustments in accordance with U.S. GAAP and as such, the net asset value for reporting purposes and the returns based upon those net asset values may differ from the net asset value and returns for shareholder transactions. |
| F | Not annualized. |
| G | Annualized. |
| H | Portfolio turnover rate is for the period from May 20, 2016 through January 31, 2017 and is not annualized |
See accompanying notes
71
American Beacon GLG Total Return FundSM
Financial Highlights
(For a share outstanding throughout the period)
| Y Class | ||||||||||||||||||||
| Year Ended January 31, | May 20, 2016A to January 31, | |||||||||||||||||||
| 2019 | 2018 | 2017 | ||||||||||||||||||
|
| |||||||||||||||||||
Net asset value, beginning of period | $ | 10.47 | $ | 10.68 | $ | 10.00 | ||||||||||||||
|
|
|
|
|
| |||||||||||||||
Income (loss) from investment operations: | ||||||||||||||||||||
Net investment income | 0.08 | 0.09 | 0.07 | |||||||||||||||||
Net gains (losses) on investments (both realized and unrealized) | (0.06 | ) | (0.17 | ) | 0.72 | |||||||||||||||
|
|
|
|
|
| |||||||||||||||
Total income (loss) from investment operations | 0.02 | (0.08 | ) | 0.79 | ||||||||||||||||
|
|
|
|
|
| |||||||||||||||
Less distributions: | ||||||||||||||||||||
Dividends from net investment income | (0.15 | ) | (0.10 | ) | (0.10 | ) | ||||||||||||||
Distributions from net realized gains | (0.24 | ) | (0.02 | ) | (0.01 | ) | ||||||||||||||
Tax return of capital | - | (0.01 | )B | - | ||||||||||||||||
|
|
|
|
|
| |||||||||||||||
Total distributions | (0.39 | ) | (0.13 | ) | (0.11 | ) | ||||||||||||||
|
|
|
|
|
| |||||||||||||||
Redemption fees added to beneficial interests | - | - | - | |||||||||||||||||
|
|
|
|
|
| |||||||||||||||
Net asset value, end of period | $ | 10.10 | $ | 10.47 | $ | 10.68 | ||||||||||||||
|
|
|
|
|
| |||||||||||||||
Total returnC | 0.17 | % | (0.78 | )% | 7.85 | %D | ||||||||||||||
|
|
|
|
|
| |||||||||||||||
Ratios and supplemental data: | ||||||||||||||||||||
Net assets, end of period | $ | 683,994 | $ | 1,038,736 | $ | 107,884 | ||||||||||||||
Ratios to average net assets: | ||||||||||||||||||||
Expenses, before reimbursements or recoupments | 1.05 | % | 1.18 | % | 5.31 | %E | ||||||||||||||
Expenses, net of reimbursements or recoupments | 1.15 | % | 1.15 | % | 1.15 | %E | ||||||||||||||
Net investment income (loss), before expense reimbursements or recoupments | 0.88 | % | 0.18 | % | (3.21 | )%E | ||||||||||||||
Net investment income, net of reimbursements or recoupments | 0.78 | % | 0.21 | % | 0.95 | %E | ||||||||||||||
Portfolio turnover rate | 326 | % | 248 | % | 311 | %F | ||||||||||||||
| A | Commencement of operations. |
| B | The tax return of capital is calculated based on shares outstanding at the time of distribution. |
| C | Based on net asset value, which does not reflect the sales charge, redemption fee, or contingent deferred sales charge, if applicable. May include adjustments in accordance with U.S. GAAP and as such, the net asset value for reporting purposes and the returns based upon those net asset values may differ from the net asset value and returns for shareholder transactions. |
| D | Not annualized. |
| E | Annualized. |
| F | Portfolio turnover rate is for the period from May 20, 2016 through January 31, 2017 and is not annualized. |
See accompanying notes
72
American Beacon GLG Total Return FundSM
Financial Highlights
(For a share outstanding throughout the period)
| Investor Class | ||||||||||||||||||||
| Year Ended January 31, | May 20, 2017 | |||||||||||||||||||
| 2019 | 2018 | |||||||||||||||||||
|
| |||||||||||||||||||
Net asset value, beginning of period | $ | 10.43 | $ | 10.66 | $ | 10.00 | ||||||||||||||
|
|
|
|
|
| |||||||||||||||
Income (loss) from investment operations: | ||||||||||||||||||||
Net investment income | 0.05 | 0.02 | 0.05 | |||||||||||||||||
Net gains (losses) on investments (both realized and unrealized) | (0.05 | ) | (0.13 | ) | 0.72 | |||||||||||||||
|
|
|
|
|
| |||||||||||||||
Total income (loss) from investment operations | - | (0.11 | ) | 0.77 | ||||||||||||||||
|
|
|
|
|
| |||||||||||||||
Less distributions: | ||||||||||||||||||||
Dividends from net investment income | (0.15 | ) | (0.09 | ) | (0.10 | ) | ||||||||||||||
Distributions from net realized gains | (0.24 | ) | (0.02 | ) | (0.01 | ) | ||||||||||||||
Tax return of capital | - | (0.01 | )B | - | ||||||||||||||||
|
|
|
|
|
| |||||||||||||||
Total distributions | (0.39 | ) | (0.12 | ) | (0.11 | ) | ||||||||||||||
|
|
|
|
|
| |||||||||||||||
Net asset value, end of period | $ | 10.04 | $ | 10.43 | $ | 10.66 | ||||||||||||||
|
|
|
|
|
| |||||||||||||||
Total returnC | (0.04 | )% | (1.05 | )% | 7.65 | %D | ||||||||||||||
|
|
|
|
|
| |||||||||||||||
Ratios and supplemental data: | ||||||||||||||||||||
Net assets, end of period | $ | 138,852 | $ | 150,889 | $ | 128,790 | ||||||||||||||
Ratios to average net assets: | ||||||||||||||||||||
Expenses, before reimbursements | 1.80 | % | 2.09 | % | 5.14 | %E | ||||||||||||||
Expenses, net of reimbursements | 1.43 | % | 1.43 | % | 1.43 | %E | ||||||||||||||
Net investment income (loss), before expense reimbursements | 0.21 | % | (0.62 | )% | (3.04 | )%E | ||||||||||||||
Net investment income, net of reimbursements | 0.57 | % | 0.03 | % | 0.67 | %E | ||||||||||||||
Portfolio turnover rate | 326 | % | 248 | % | 311 | %F | ||||||||||||||
| A | Commencement of operations. |
| B | Tax return of capital is calculated based on outstanding shares at the time of distribution. |
| c | Based on net asset value, which does not reflect the sales charge, redemption fee, or contingent deferred sales charge, if applicable. May include adjustments in accordance with U.S. GAAP and as such, the net asset value for reporting purposes and the returns based upon those net asset values may differ from the net asset value and returns for shareholder transactions. |
| D | Annualized. |
| E | Not annualized. |
| F | Portfolio turnover rate is for the period from May 20, 2016 through January 31, 2017 and is not annualized. |
See accompanying notes
73
American Beacon GLG Total Return FundSM
Financial Highlights
(For a share outstanding throughout the period)
| A Class | ||||||||||||||||||||
| Year Ended January 31, | May 20, 2017 | |||||||||||||||||||
| 2019 | 2018 | |||||||||||||||||||
|
| |||||||||||||||||||
Net asset value, beginning of period | $ | 10.42 | $ | 10.66 | $ | 10.00 | ||||||||||||||
|
|
|
|
|
| |||||||||||||||
Income (loss) from investment operations: | ||||||||||||||||||||
Net investment income | 0.07 | 0.00 | B | 0.05 | ||||||||||||||||
Net gains (losses) on investments (both realized and unrealized) | (0.07 | ) | (0.12 | ) | 0.72 | |||||||||||||||
|
|
|
|
|
| |||||||||||||||
Total income (loss) from investment operations | - | (0.12 | ) | 0.77 | ||||||||||||||||
|
|
|
|
|
| |||||||||||||||
Less distributions: | ||||||||||||||||||||
Dividends from net investment income | (0.15 | ) | (0.10 | ) | (0.10 | ) | ||||||||||||||
Distributions from net realized gains | (0.24 | ) | (0.02 | ) | (0.01 | ) | ||||||||||||||
Tax return of capital | - | (0.00 | )B C | - | ||||||||||||||||
|
|
|
|
|
| |||||||||||||||
Total distributions | (0.39 | ) | (0.12 | ) | (0.11 | ) | ||||||||||||||
|
|
|
|
|
| |||||||||||||||
Net asset value, end of period | $ | 10.03 | $ | 10.42 | $ | 10.66 | ||||||||||||||
|
|
|
|
|
| |||||||||||||||
Total returnD | (0.04 | )% | (1.15 | )% | 7.65 | %E | ||||||||||||||
|
|
|
|
|
| |||||||||||||||
Ratios and supplemental data: | ||||||||||||||||||||
Net assets, end of period | $ | 106,404 | $ | 106,439 | $ | 107,660 | ||||||||||||||
Ratios to average net assets: | ||||||||||||||||||||
Expenses, before reimbursements or recoupments | 1.31 | % | 1.42 | % | 5.62 | %F | ||||||||||||||
Expenses, net of reimbursements or recoupments | 1.46 | % | 1.45 | % | 1.45 | %F | ||||||||||||||
Net investment income (loss), before expense reimbursements or recoupments | 0.69 | % | 0.05 | % | (3.51 | )%F | ||||||||||||||
Net investment income, net of reimbursements or recoupments | 0.55 | % | 0.02 | % | 0.65 | %F | ||||||||||||||
Portfolio turnover rate | 326 | % | 248 | % | 311 | %G | ||||||||||||||
| A | Commencement of operations. |
| B | Amount represents less than $0.01 per share. |
| C | Tax return of capital is calculated based on outstanding shares at the time of distribution. |
| D | Based on net asset value, which does not reflect the sales charge, redemption fee, or contingent deferred sales charge, if applicable. May include adjustments in accordance with U.S. GAAP and as such, the net asset value for reporting purposes and the returns based upon those net asset values may differ from the net asset value and returns for shareholder transactions. |
| E | Not annualized. |
| F | Annualized. |
| G | Portfolio turnover rate is for the period from May 20, 2016 through January 31, 2017 and is not annualized. |
See accompanying notes
74
American Beacon GLG Total Return FundSM
Financial Highlights
(For a share outstanding throughout the period)
| C Class | ||||||||||||||||||||
| Year Ended January 31, | May 20, 2017 | |||||||||||||||||||
| 2019 | 2018 | |||||||||||||||||||
|
| |||||||||||||||||||
Net asset value, beginning of period | $ | 10.34 | $ | 10.61 | $ | 10.00 | ||||||||||||||
|
|
|
|
|
| |||||||||||||||
Income (loss) from investment operations: | ||||||||||||||||||||
Net investment (loss) | (0.01 | ) | (0.08 | ) | (0.01 | ) | ||||||||||||||
Net gains (losses) on investments (both realized and unrealized) | (0.07 | ) | (0.12 | ) | 0.73 | |||||||||||||||
|
|
|
|
|
| |||||||||||||||
Total income (loss) from investment operations | (0.08 | ) | (0.20 | ) | 0.72 | |||||||||||||||
|
|
|
|
|
| |||||||||||||||
Less distributions: | ||||||||||||||||||||
Dividends from net investment income | (0.14 | ) | (0.04 | ) | (0.10 | ) | ||||||||||||||
Distributions from net realized gains | (0.24 | ) | (0.02 | ) | (0.01 | ) | ||||||||||||||
Tax return of capital | - | (0.01 | )B | - | ||||||||||||||||
|
|
|
|
|
| |||||||||||||||
Total distributions | (0.38 | ) | (0.07 | ) | (0.11 | ) | ||||||||||||||
|
|
|
|
|
| |||||||||||||||
Net asset value, end of period | $ | 9.88 | $ | 10.34 | $ | 10.61 | ||||||||||||||
|
|
|
|
|
| |||||||||||||||
Total returnC | (0.79 | )% | (1.95 | )% | 7.15 | %D | ||||||||||||||
|
|
|
|
|
| |||||||||||||||
Ratios and supplemental data: | ||||||||||||||||||||
Net assets, end of period | $ | 104,277 | $ | 105,096 | $ | 107,101 | ||||||||||||||
Ratios to average net assets: | ||||||||||||||||||||
Expenses, before reimbursements or recoupments | 2.06 | % | 2.17 | % | 6.37 | %E | ||||||||||||||
Expenses, net of reimbursements or recoupments | 2.21 | % | 2.20 | % | 2.20 | %E | ||||||||||||||
Net investment (loss), before expense reimbursements or recoupments | (0.06 | )% | (0.70 | )% | (4.27 | )%E | ||||||||||||||
Net investment (loss), net of reimbursements or recoupments | (0.20 | )% | (0.73 | )% | (0.10 | )%E | ||||||||||||||
Portfolio turnover rate | 326 | % | 248 | % | 311 | %F | ||||||||||||||
| A | Commencement of operations. |
| B | Tax return of capital is calculated based on outstanding shares at the time of distribution. |
| C | Based on net asset value, which does not reflect the sales charge, redemption fee, or contingent deferred sales charge, if applicable. May include adjustments in accordance with U.S. GAAP and as such, the net asset value for reporting purposes and the returns based upon those net asset values may differ from the net asset value and returns for shareholder transactions. |
| D | Not annualized. |
| E | Annualized. |
| F | Portfolio turnover rate is for the period from May 20, 2016 through January 31, 2017 and is not annualized. |
See accompanying notes
75
American Beacon GLG Total Return FundSM
Financial Highlights
(For a share outstanding throughout the period)
| Ultra | ||||||||||||||||||||
| Year Ended January 31, | May 20, 2017 | |||||||||||||||||||
| 2019 | 2018 | |||||||||||||||||||
|
| |||||||||||||||||||
Net asset value, beginning of period | $ | 10.50 | $ | 10.69 | $ | 10.00 | ||||||||||||||
|
|
|
|
|
| |||||||||||||||
Income from investment operations: | ||||||||||||||||||||
Net investment income | 0.13 | 0.11 | 0.07 | |||||||||||||||||
Net gains (losses) on investments (both realized and unrealized) | (0.08 | ) | (0.17 | ) | 0.73 | |||||||||||||||
|
|
|
|
|
| |||||||||||||||
Total income (loss) from investment operations | 0.05 | (0.06 | ) | 0.80 | ||||||||||||||||
|
|
|
|
|
| |||||||||||||||
Less distributions: | ||||||||||||||||||||
Dividends from net investment income | (0.15 | ) | (0.10 | ) | (0.10 | ) | ||||||||||||||
Distributions from net realized gains | (0.24 | ) | (0.02 | ) | (0.01 | ) | ||||||||||||||
Tax return of capital | - | (0.01 | )B | - | ||||||||||||||||
|
|
|
|
|
| |||||||||||||||
Total distributions | (0.39 | ) | (0.13 | ) | (0.11 | ) | ||||||||||||||
|
|
|
|
|
| |||||||||||||||
Net asset value, end of period | $ | 10.16 | $ | 10.50 | $ | 10.69 | ||||||||||||||
|
|
|
|
|
| |||||||||||||||
Total returnC | 0.47 | % | (0.57 | )% | 7.95 | %D | ||||||||||||||
|
|
|
|
|
| |||||||||||||||
Ratios and supplemental data: | ||||||||||||||||||||
Net assets, end of period | $ | 468,097,908 | $ | 743,861,439 | $ | 67,330,248 | ||||||||||||||
Ratios to average net assets: | ||||||||||||||||||||
Expenses, before reimbursements | 1.05 | % | 1.07 | % | 2.09 | %E | ||||||||||||||
Expenses, net of reimbursements | 0.95 | % | 0.95 | % | 0.95 | %E | ||||||||||||||
Net investment income, before expense reimbursements | 0.92 | % | 0.34 | % | 0.76 | %E | ||||||||||||||
Net investment income, net of reimbursements | 1.02 | % | 0.46 | % | 1.91 | %E | ||||||||||||||
Portfolio turnover rate | 326 | % | 248 | % | 311 | %F | ||||||||||||||
| A | Commencement of operations. |
| B | Tax return of capital is calculated based on outstanding shares at the time of distribution. |
| C | Based on net asset value, which does not reflect the sales charge, redemption fee, or contingent deferred sales charge, if applicable. May include adjustments in accordance with U.S. GAAP and as such, the net asset value for reporting purposes and the returns based upon those net asset values may differ from the net asset value and returns for shareholder transactions. |
| D | Not annualized. |
| E | Annualized. |
| F | Portfolio turnover rate is for the period from May 20, 2016 through January 31, 2017 and is not annualized. |
See accompanying notes
76
Federal Tax Information
January 31, 2019 (Unaudited)
Certain tax information regarding the Funds is required to be provided to shareholders based upon the Funds’ income and distributions for the taxable year ended January 31, 2019. The information and distributions reported herein may differ from information and distributions taxable to the shareholders for the calendar year ended December 31, 2018.
The Funds designated the following items with regard to distributions paid during the fiscal year ended January 31, 2019. All designations are based on financial information available as of this annual report and, accordingly, are subject to change. For each item, it is the intention of the Funds to designate the maximum amount permitted under the Internal Revenue Code of 1986, as amended, and the regulations there under.
Long-Term Capital Gain Distributions:
Frontier Markets Income | $ | - | ||
GLG Total Return | 59,161 |
Short-Term Capital Gain Distributions:
Frontier Markets Income | $ | - | ||
GLG Total Return | 11,608,582 |
Shareholders received notification in January 2019 of the applicable tax information necessary to prepare their 2018 income tax returns.
77
Disclosure Regarding Approval of the Management and Investment Advisory Agreements(Unaudited)
Approval Related to American Beacon Frontier Markets Income Fund
At its February27-28, 2018 meetings, the Board of Trustees (“Board”) considered the approval of a new investment advisory agreement among American Beacon Advisors, Inc. (“Manager”), Global Evolution USA, LLC (the “Subadviser”), and the American Beacon Funds (“Trust”), on behalf of the American Beacon Frontier Markets Income Fund (the “Fund”) (“New Agreement”). The Board was advised that the Subadviser was expected to undergo a change of control in the second quarter of 2018, subject to certain regulatory approvals. The change of control would result in an assignment and the automatic termination of the existing Investment Advisory Agreement among the Manager, the Subadviser and the Trust, on behalf of the Fund (“Existing Agreement”).
Prior to the meetings, information was provided to the Board by the Subadviser and the Manager regarding the change of control and the New Agreement. The Board considered information from the Manager, the Subadviser and others at meetings held on May 16, 2017 and June6-7, 2017 in connection with the review of the Existing Agreement. The Board considered the Subadviser’s representation that, other than certain internal changes at the Subadviser associated with the change of control, there had been no material changes to the information regarding the Subadviser that the Board reviewed at its prior meetings. In connection with its consideration of the New Agreement, the Board considered that the New Agreement would contain the same terms and conditions as the Existing Agreement and that the services provided by the Subadviser to the Fund and the fee rate paid by the Fund to the Subadviser would remain unchanged. The Board also considered that the individuals who currently provide portfolio management services to the Fund would remain the same after the change of control.
Based on the foregoing considerations, the Board, including a majority of Trustees who are not “interested persons” of the Fund, the Manager or the Subadviser, as that term is defined in the 1940 Act, concluded that the approval of the New Agreement was in the best interests of the Fund and approved the New Agreement.
78
Trustees and Officers of the American Beacon FundsSM(Unaudited)
The Trustees and officers of the American Beacon Funds (the “Trust”) are listed below, together with their principal occupations during the past five years. The address of each person listed below is 220 Las Colinas Boulevard East, Suite 1200, Irving, Texas 75039. Each Trustee oversees thirty-seven funds in the fund complex that includes the Trust, the American Beacon Select Funds, the American Beacon Institutional Funds Trust, the American Beacon Sound Point Enhanced Income Fund and the American Beacon Apollo Total Return Fund. The Trust’s Statement of Additional Information contains additional information about the Trustees and is available without charge by calling1-800-658-5811.
Name, Age | Position, Term of | Principal Occupation(s) During Past 5 Years and Current Directorships | ||
| INTERESTED TRUSTEES | Term | |||
| Lifetime of Trust until removal, resignation or retirement* | ||||
| Alan D. Feld** (82) | Trustee since 1996 | Partner in the law firm of Akin, Gump, Strauss, Hauer & Feld, LLP (law firm) (1960-Present); Trustee, American Beacon Select Funds (1999-Present); Trustee, American Beacon Institutional Funds Trust (2017-Present); Trustee, American Beacon Sound Point Enhanced Income Fund (2018-Present); Trustee, American Beacon Apollo Total Return Fund (2018-Present). | ||
| NON-INTERESTED TRUSTEES | Term | |||
| Lifetime of Trust until removal, resignation or retirement* | ||||
| Gilbert G. Alvarado (49) | Trustee since 2015 | Director, Kura MD, Inc. (local telehealth organization) (2015-present); Vice President & CFO, Sierra Health Foundation (health conversion private foundation) (2006-Present); Vice President & CFO, Sierra Health Foundation: Center for Health Program Management (California public benefit corporation) (2012-Present); Director, Innovative North State (2012-2015); Director, Sacramento Regional Technology Alliance (2011-2016); Director, Women’s Empowerment (2009-2014); Director, Valley Healthcare Staffing (2017-present); Trustee, American Beacon Select Funds (2015-Present); Trustee, American Beacon Institutional Funds Trust (2017-Present); Trustee, American Beacon Sound Point Enhanced Income Fund (2018-Present); Trustee, American Beacon Apollo Total Return Fund (2018-Present). | ||
| Joseph B. Armes (56) | Trustee since 2015 | Chairman & CEO, CSW Industrials f/k/a Capital Southwest Corporation (investment company) (2015-Present); Chairman of the Board of Capital Southwest Corporation, predecessor to CSW Industrials, Inc. (2014-2017) (investment company); CEO, Capital Southwest Corporation (2013-2015); President & CEO, JBA Investment Partners (family investment vehicle) (2010-Present); Director and Chair of Audit Committee, RSP Permian (oil and gas producer) (2013-Present); Trustee, American Beacon Select Funds (2015-Present); Trustee, American Beacon Institutional Funds Trust (2017-Present); Trustee, American Beacon Sound Point Enhanced Income Fund (2018-Present); Trustee, American Beacon Apollo Total Return Fund (2018-Present). | ||
| Gerard J. Arpey (60) | Trustee since 2012 | Director, The Home Depot, Inc. (2015-Present); Partner, Emerald Creek Group (private equity firm) (2011-Present); Director, S.C. Johnson & Son, Inc. (privately held company) (2008-present); Trustee, American Beacon Select Funds (2012-Present); Trustee, American Beacon Institutional Funds Trust (2017-Present); Trustee, American Beacon Sound Point Enhanced Income Fund (2018-Present); Trustee, American Beacon Apollo Total Return Fund (2018-Present). | ||
79
Trustees and Officers of the American Beacon FundsSM(Unaudited)
Name, Age | Position, Term of | Principal Occupation(s) During Past 5 Years and Current Directorships | ||
| NON-INTERESTED TRUSTEES (CONT.) | Term | |||
| Lifetime of Trust until removal, resignation or retirement* | ||||
| Brenda A. Cline (58) | Trustee since 2004 Chair since 2019 Vice Chair 2018 | Chief Financial Officer, Treasurer and Secretary, Kimbell Art Foundation (1993-Present); Director, Tyler Technologies, Inc. (public sector software solutions company) (2014-Present); Director, Range Resources Corporation (oil and natural gas company) (2015-Present); Trustee, CushingClosed-End andOpen-End Funds and ETFs (2017-Present); Trustee, American Beacon Select Funds (2004-Present); Trustee, American Beacon Institutional Funds Trust (2017-Present); Trustee, American Beacon Sound Point Enhanced Income Fund (2018-Present); Trustee, American Beacon Apollo Total Return Fund (2018-Present). | ||
| Eugene J. Duffy (64) | Trustee since 2008 | Managing Director, Global Investment Management Distribution, Mesirow Financial (2016-Present); Managing Director, Institutional Services, Intercontinental Real Estate Corporation (2014-Present); Principal and Executive Vice President, Paradigm Asset Management (1994-2014); Trustee, American Beacon Select Funds (2008-Present); Trustee, American Beacon Institutional Funds Trust (2017-Present); Trustee, American Beacon Sound Point Enhanced Income Fund (2018-Present); Trustee, American Beacon Apollo Total Return Fund (2018-Present). | ||
| Claudia A. Holz*** (61) | Trustee since 2018 | Partner, KPMG LLP (1990-2017); Trustee, American Beacon Select Funds (2018-Present); Trustee, American Beacon Institutional Funds Trust (2018-Present); Trustee, American Beacon Sound Point Enhanced Income Fund (2018-Present); Trustee, American Beacon Apollo Total Return Fund (2018-Present). | ||
| Douglas A. Lindgren**** (57) | Trustee since 2018 | CEO North America, Carne Global Financial Services (2016-2017); Managing Director, IPS Investment Management and Global Head, Content Management, UBS Wealth Management (2010-2016); Trustee, American Beacon Select Funds (2018-Present); Trustee, American Beacon Institutional Funds Trust (2018-Present); Trustee, American Beacon Sound Point Enhanced Income Fund (2018-Present); Trustee, American Beacon Apollo Total Return Fund (2018-Present). | ||
| Richard A. Massman (75) | Trustee since 2004 Chair 2008-2018 Chair Emeritus since 2019 | Consultant and General Counsel Emeritus, Hunt Consolidated, Inc. (holding company engaged in oil and gas exploration and production, refining, real estate, farming, ranching and venture capital activities) (2009-Present); Trustee, American Beacon Select Funds (2004-Present); Trustee, American Beacon Institutional Funds Trust (2017-Present); Trustee, American Beacon Sound Point Enhanced Income Fund (2018-Present); Trustee, American Beacon Apollo Total Return Fund (2018-Present). | ||
| Barbara J. McKenna, CFA (55) | Trustee since 2012 | President/Managing Principal, Longfellow Investment Management Company (2005-Present); Trustee, American Beacon Select Funds (2012-Present); Trustee, American Beacon Institutional Funds Trust (2017-Present); Trustee, American Beacon Sound Point Enhanced Income Fund (2018-Present); Trustee, American Beacon Apollo Total Return Fund (2018-Present). | ||
| R. Gerald Turner (73) | Trustee since 2001 | President, Southern Methodist University (1995-Present); Director, J.C. Penney Company, Inc. (1996-Present); Director, Kronus Worldwide Inc. (chemical manufacturing) (2003-Present); Trustee, American Beacon Select Funds (2001-Present); Trustee, American Beacon Institutional Funds Trust (2017-Present); Trustee, American Beacon Sound Point Enhanced Income Fund (2018-Present); Trustee, American Beacon Apollo Total Return Fund (2018-Present). | ||
80
Trustees and Officers of the American Beacon FundsSM(Unaudited)
Name, Age | Position, Term of | Principal Occupation(s) During Past 5 Years and Current Directorships | ||
| OFFICERS | Term | |||
| One Year | ||||
| Gene L. Needles, Jr. (64) | President since 2009 | CEO and Director (2009-Present), and Chairman (2018-Present), American Beacon Advisors, Inc.; President, American Beacon Advisors (2009-2018); President (2015-2018), Director and CEO (2015-Present), and Chairman (2018-Present), Resolute Investment Holdings, LLC; Director, Chairman and CEO, Resolute Topco, Inc. (2015-Present), President (2015-2018); Director, Chairman and CEO, Resolute Acquisition, Inc. (2015-Present); President (2015-2018), Chairman and CEO, Resolute Investment Managers, Inc. (2015-Present), President (2015-2018); Director, Chairman, President and CEO, Resolute Investment Distributors (2017-Present); Director, Chairman, President and CEO; Resolute Investment Services, Inc. (2015-Present); President and CEO, Lighthouse Holdings Parent, Inc. (2009-2015); President, CEO and Director, Lighthouse Holdings, Inc. (2009-2015); Manager, President and CEO, American Private Equity Management, LLC (2012-Present); Director, Chairman, President and CEO, Alpha Quant Advisors, LLC (2016-Present); Director, ARK Investment Management LLC (2016-Present); Director, Shapiro Capital Management LLC (2017-Present); Director, Chairman and CEO, Continuous Capital, LLC (2018-Present); Director and President, American Beacon Cayman Transformational Innovation Company, LTD., (2017-2018); President American Beacon Cayman TargetRisk Company, Ltd. (2018-Present); President, American Beacon Delaware Transformational Innovation Corporation (2017-2018); Member, Investment Advisory Committee, Employees Retirement System of Texas (2017-Present); Trustee, American Beacon NextShares Trust (2015-Present); President, American Beacon Select Funds (2009-Present); American Beacon Cayman Managed Futures Strategy Fund, Ltd. (2014-Present); President, American Beacon Institutional Funds Trust (2017-Present); President, American Beacon Sound Point Enhanced Income Fund (2018-Present); President, American Beacon Apollo Total Return Fund (2018-Present); President, | ||
| Rosemary K. Behan (59) | VP, Secretary and Chief Legal Officer since 2006 | Vice President, Secretary and General Counsel, American Beacon Advisors, Inc. (2006-Present); Secretary, Resolute Investment Holdings, LLC (2015-Present); Secretary, Resolute Topco, Inc. (2015-Present); Secretary, Resolute Acquisition, Inc. (2015-Present); Vice President, Secretary and General Counsel, Resolute Investment Managers, Inc. (2015-Present); Secretary, Resolute Investment Distributors, Inc. (2017-Present); Vice President, Secretary and General Counsel, Resolute Investment Services, Inc. (2015-Present); Vice President and Secretary, Lighthouse Holdings Parent, Inc. (2008-2015); Vice President and Secretary, Lighthouse Holdings, Inc. (2008-2015); Secretary, American Private Equity Management, LLC (2008-Present); Secretary, Alpha Quant Advisors, LLC (2016-Present); Vice President and Secretary, Continuous Capital, LLC (2018-Present); Secretary, American Beacon Delaware Transformational Innovation Corporation (2017-2018); Secretary, American Beacon Cayman Transformational Innovation Company, Ltd. (2017-2018; Secretary, American Beacon Cayman TargetRisk Company, Ltd (2018-Present); Chief Legal Officer, Vice President and Secretary, American Beacon Select Funds (2006-Present); Secretary, American Beacon Cayman Managed Futures Strategy Fund, Ltd. (2014-Present); Chief Legal Officer, Vice President and Secretary, American Beacon Institutional Funds Trust (2017-Present); Chief Legal Officer, Vice President and Secretary, American Beacon Sound Point Enhanced Income Fund (2018-Present); Chief Legal Officer, Vice President and Secretary American Beacon Apollo Total Return Fund (2018-Present). | ||
81
Trustees and Officers of the American Beacon FundsSM(Unaudited)
Name, Age and Address | Position, Term of | Principal Occupation(s) During Past 5 Years and Current Directorships | ||
| OFFICERS (CONT.) | Term | |||
| One Year | ||||
| Brian E. Brett (58) | VP since 2004 | Senior Vice President, Head of Distribution (2012-Present), Vice President, Director of Sales (2004-2012), American Beacon Advisors, Inc.; Senior Vice President, Resolute Investment Managers, Inc. (2017-Present); Senior Vice President, Resolute Investment Distributors, Inc. (2018-Present), Vice President (2017-2018); Senior Vice President, Resolute Investment Services, Inc. (2017-Present); Senior Vice President, Lighthouse Holdings Parent, Inc. (2008-2015); Senior Vice President, Lighthouse Holdings, Inc. (2008-2015); Vice President, American Beacon Select Funds (2004-Present); Vice President, American Beacon Institutional Funds Trust (2017-Present); Vice President American Beacon Sound Point Enhanced Income Fund (2018-Present); Vice President American Beacon Apollo Total Return Fund (2018-Present). | ||
| Paul B. Cavazos (49) | VP since 2016 | Chief Investment Officer and Senior Vice President, American Beacon Advisors, Inc. (2016-Present); Chief Investment Officer, DTE Energy (2007-2016); Vice President, American Private Equity Management, L.L.C. (2017-Present); Vice President, American Beacon Select Funds (2016-Present); Vice President, American Beacon Institutional Funds Trust (2017-Present); Vice President American Beacon Sound Point Enhanced Income Fund (2018-Present); Vice President American Beacon Apollo Total Return Fund (2018-Present). | ||
| Erica Duncan (48) | VP Since 2011 | Vice President, American Beacon Advisors, Inc. (2011-Present); Vice President, Resolute Investment Managers (2018-Present); Vice President, Resolute Investment Services, Inc. (2018-Present); Vice President, American Beacon Select Funds (2011-Present); Vice President, American Beacon Institutional Funds Trust (2017-Present); Vice President American Beacon Sound Point Enhanced Income Fund (2018-Present); Vice President American Beacon Apollo Total Return Fund (2018-Present). | ||
| Melinda G. Heika (57) | Treasurer since 2010 | Treasurer and CFO (2010-Present), American Beacon Advisors, Inc.; Treasurer, Resolute Topco, Inc. (2015-Present); Treasurer, Resolute Investment Holdings, LLC. (2015-Present); Treasurer, Resolute Acquisition, Inc. (2015-Present); Treasurer and CFO, Resolute Investment Managers, Inc. (2017-Present); Treasurer, Resolute Investment Distributors, Inc. (2017-2017); Treasurer and CFO, Resolute Investment Services, Inc. (2015-Present); Treasurer, Lighthouse Holdings Parent Inc., (2010-2015); Treasurer, Lighthouse Holdings, Inc. (2010-2015); Treasurer, American Private Equity Management, LLC (2012-Present); Treasurer and CFO, Alpha Quant Advisors, LLC (2016-Present); Treasurer and CFO, Continuous Capital, LLC (2018-Present); Treasurer, American Beacon Cayman Transformational Innovation, Ltd. (2017-2018); Treasurer, American Beacon Delaware Transformational Innovation Corporation (2017-2018); Treasurer, American Beacon Select Funds (2010-Present); Director and Treasurer, American Beacon Cayman Managed Futures Strategy Fund, Ltd. (2014-Present); Treasurer, American Beacon Institutional Funds Trust (2017-Present); Treasurer, American Beacon Sound Point Enhanced Income Fund (2018-Present); Treasurer, American Beacon Apollo Total Return Fund (2018-Present). | ||
| Terri L. McKinney (55) | VP since 2010 | Vice President (2009-Present), Managing Director (2003-2009), American Beacon Advisors, Inc.; Vice President, Resolute Investment Managers, Inc. (2017-Present); Vice President, Resolute Investment Services, Inc (2018-Present); Vice President, Alpha Quant Advisors, LLC (2016-Present); Vice President, Continuous Capital, LLC (2018-Present); Vice President, American Beacon Select Funds (2010-Present); Vice President, American Beacon Institutional Funds Trust (2017-Present); Vice President, American Beacon Sound Point Enhanced Income Fund (2018-Present); Vice President, American Beacon Apollo Total Return Fund (2018-Present). | ||
82
Trustees and Officers of the American Beacon FundsSM(Unaudited)
Name, Age and Address | Position, Term of | Principal Occupation(s) During Past 5 Years and Current Directorships | ||
| OFFICERS (CONT.) | Term | |||
| One Year | ||||
| Jeffrey K. Ringdahl (43) | VP since 2010 | Director (2015-Present), President (2018-Present), Chief Operating Officer (2010-Present), Senior Vice President (2013-2018), Vice President (2010-2013), American Beacon Advisors, Inc.; Director (2015-Present), President (2018-Present), Senior Vice Present(2015-2018, Resolute Investment Holdings, LLC; Director (2015-Present), President (2018-Present), Senior Vice President (2015-2018), Resolute Topco, Inc.; Director (2015-Present), President (2018-Present), Senior Vice President (2015-2018), Resolute Acquisition, Inc.; Director (2015-Present), President & COO (2018-Present), Senior Vice President (2015-2018), Resolute Investment Managers, Inc.; Director and Executive Vice President (2017-Present), Resolute Investment Distributors, Inc.; Director (2017-Present), President & COO (2018-Present), Executive Vice President (2017-2018), Resolute Investment Services, Inc.; Senior Vice President (2018-Present), Vice President (2012-2018), Manager (2015-2018), American Private Equity Management, LLC; Senior Vice President, Lighthouse Holdings Parent, Inc. (2013-2015); Senior Vice President, Lighthouse Holdings, Inc. (2013-2015); Trustee, American Beacon NextShares Trust (2015-Present); Director, Executive Vice President & COO, Alpha Quant Advisors, LLC (2016-Present); Director, Shapiro Capital Management, LLC (2017-Present); Director, Executive Vice President & COO, Continuous Capital, LLC (2018-Present); Director and Vice President, American Beacon Cayman Transformational Innovation Company, Ltd., (2017-Present); Vice President, American Beacon Delaware Transformational Innovation Corporation (2017-2018); Vice President, American Beacon Cayman TargetRisk Company, Ltd (2018-Present); Vice President, American Beacon Select Funds (2010-2018); Director and Vice President, American Beacon Cayman Managed Futures Strategy Fund, Ltd. (2014-Present); Vice President, American Beacon Institutional Funds Trust (2017-Present); Vice President, American Beacon Sound Point Enhanced Income Fund (2018-Present); Vice President, American Beacon Apollo Total Return Fund (2018-Present) | ||
| Samuel J. Silver (55) | VP Since 2011 | Vice President (2011-Present), Chief Fixed Income Officer (2016-Present), American Beacon Advisors, Inc. (2011-Present); Vice President, American Beacon Select Funds (2011-Present); Vice President, American Beacon Institutional Funds Trust (2017-Present); Vice President, American Beacon Sound Point Enhanced Income Fund (2018-Present); Vice President, American Beacon Apollo Total Return Fund (2018-Present). | ||
| Christina E. Sears (47) | Chief Compliance Officer since 2004 and Asst. Secretary since 1999 | Vice President, American Beacon Advisors, Inc. (2019-Present); Chief Compliance Officer, American Beacon Advisors, Inc. (2004-Present); Vice President, Resolute Investment Managers, Inc. (2017-Present); Vice President, Resolute Investment Distributors (2017-Present); Vice President, Resolute Investment Services, Inc. (2019-Present); Chief Compliance Officer, American Private Equity Management, LLC (2012-Present); Chief Compliance Officer and Vice President, Alpha Quant Advisors, LLC (2016-Present); Vice President, Continuous Capital, LLC (2018-Present); Chief Compliance Officer (2004-Present) and Assistant Secretary (1999-Present), American Beacon Select Funds; Chief Compliance Officer and Assistant Secretary, American Beacon Institutional Funds Trust (2017-Present); Chief Compliance Officer and Assistant Secretary, American Beacon Sound Point Enhanced Income Fund (2018-Present); Chief Compliance Officer and Assistant Secretary, American Beacon Apollo Total Return Fund (2018-Present). | ||
83
Trustees and Officers of the American Beacon FundsSM(Unaudited)
Name, Age and Address | Position, Term of | Principal Occupation(s) During Past 5 Years and Current Directorships | ||
| OFFICERS (CONT.) | Term | |||
| One Year | ||||
| Sonia L. Bates (62) | Asst. Treasurer since 2011 | Assistant Treasurer, American Beacon Advisors, Inc. (2011-2018); Assistant Treasurer, Lighthouse Holdings Parent Inc. (2011-2015); Assistant Treasurer, Lighthouse Holdings, Inc. (2011-2015); Assistant Treasurer, American Private Equity Management, LLC (2012-Present); Assistant Treasurer, American Beacon Cayman Transformational Innovation Company, Ltd. (2017-Present); Assistant Treasurer, American Beacon Cayman TargetRisk Company, Ltd. (2018-Present); Assistant Treasurer, American Beacon Select Funds (2011-Present); Assistant Treasurer, American Beacon Institutional Funds Trust (2017-Present); Assistant Treasurer, American Beacon Sound Point Enhanced Income Fund (2018-Present); Assistant Treasurer, American Beacon Apollo Total Return Fund (2018-Present). | ||
| Shelley D. Abrahams (44) | Assistant Secretary since 2008 | Assistant Secretary, American Beacon Select Funds (2008-Present); Assistant Secretary, American Beacon Institutional Funds Trust (2017-Present); Assistant Secretary, American Beacon Sound Point Enhanced Income Fund (2018-Present); Assistant Secretary, American Beacon Apollo Total Return Fund (2018-Present). | ||
| Rebecca L. Harris (52) | Assistant Secretary since 2010 | Vice President, American Beacon Advisors, Inc. (2011-Present); Vice President, Resolute Investment Managers, Inc. (2017-Present); Vice President, Resolute Investment Services (2015-Present); Vice President, Alpha Quant Advisors, LLC (2016-Present); Vice President, Continuous Capital, LLC (2018-Present); Assistant Secretary, American Beacon Select Funds (2010-Present); Assistant Secretary, American Beacon Institutional Funds Trust (2017-Present); Assistant Secretary, American Beacon Sound Point Enhanced Income Fund (2018-Present); Assistant Secretary, American Beacon Apollo Total Return Fund (2018-Present). | ||
| Teresa A. Oxford (60) | Assistant Secretary since 2015 | Assistant Secretary, American Beacon Advisors, Inc. (2015-Present); Assistant Secretary, Resolute Investment Distributors (2018-Present); Assistant Secretary, Resolute Investment Services (2018-Present); Assistant Secretary, Alpha Quant Advisors, LLC (2016-Present); Assistant Secretary, American Beacon Select Funds (2015-Present); Assistant Secretary, American Beacon Institutional Funds Trust (2017-Present); Assistant Secretary, American Beacon Sound Point Enhanced Income Fund (2018-Present); Assistant Secretary, American Beacon Apollo Total Return Fund (2018-Present). | ||
* As of 11/12/2014, the Board adopted a retirement plan that requires Trustees, other than Messrs. Feld and Massman to retire no later than the last day of the calendar year in which they reach the age of 75. As of 11/7/17, the Board approved a waiver of the mandatory retirement policy with respect to Mr. Massman, who turned 75 in November 2018, to permit him to continue to serve on the Board as Chair Emeritus through 12/31/19.
** Mr. Feld is deemed to be an “interested person” of the Trusts, as defined by the 1940 Act. Mr. Feld’s law firm of Akin, Gump, Strauss, Hauer & Feld LLP has provided legal services within the past two fiscal years to one or more of the Trust’ssub-advisors.
*** Claudia A. Holz became a new Trustee to each of the Trusts on 4/1/2018.
**** Douglas A. Lindgren became a new Trustee to each of the Trusts on 1/1/2018.
84
Privacy Policy
January 31, 2019 (Unaudited)
The American Beacon Funds recognize and respect the privacy of our shareholders. We are providing this notice to you so you will understand how shareholder information may be collected and used.
We may collect nonpublic personal information about you from one or more of the following sources:
| • | information we receive from you on applications or other forms; |
| • | information about your transactions with us or our service providers; and |
| • | information we receive from third parties. |
We do not disclose any nonpublic personal information about our customers or former customers to anyone, except as permitted by law.
We restrict access to your nonpublic personal information to those employees or service providers who need to know that information to provide products or services to you. To ensure the confidentiality of your nonpublic personal information, we maintain safeguards that comply with federal standards.
85
This page intentionally left blank.
86
This page intentionally left blank.
87
This page intentionally left blank.
88

Delivery of Documents
eDelivery isNOW AVAILABLE - Stop traditional mail delivery and receive your
shareholder reports and summary prospectuson-line. Sign up at
www.americanbeaconfunds.com
If you invest in the Fund through a financial institution, you may be able to receive the Fund’s regulatory mailings, such as the Prospectus, Annual Report and Semi-Annual Report, bye-mail. If you are interested in this option, please go towww.icsdelivery.com and search for your financial institution’s name or contact your financial institution directly.
To obtain more information about the Fund:
 |  | |
| ByE-mail: | On the Internet: | |
| american_beacon.funds@ambeacon.com | Visit our website atwww.americanbeaconfunds.com | |
By Telephone: Call (800)658-5811 |
By Mail: American Beacon Funds P.O. Box 219643 Kansas City, MO 64121-9643 | |
| Availability of Quarterly Portfolio Schedules | Availability of Proxy Voting Policy and Records | |
| In addition to the Schedule of Investments provided in each semi-annual and annual report, the Fund files a complete schedule of its portfolio holdings with the Securities and Exchange Commission (“SEC”) on FormN-Q as of the first and third fiscal quarters. The Fund’s FormsN-Q are available on the SEC’s website atwww.sec.gov. The FormsN-Q may also be reviewed and copied at the SEC’s Public Reference Section, 100 F Street, NE, Washington, D.C. 20549-2736. Information regarding the operation of the SEC’s Public Reference Room may be obtained by calling(800)-SEC-0330. A complete schedule of each Fund’s portfolio holdings is also available atwww.americanbeaconfunds.com approximately twenty days after the end of each month. | A description of the policies and procedures the Fund uses to determine how to vote proxies relating to portfolio securities is available in the Fund’s Statement of Additional Information, is available free of charge on the Fund’s websitewww.americanbeaconfunds.com and by calling1-800-967-9009 or by accessing the SEC’s website atwww.sec.gov. The Fund’s proxy voting record for the most recent year ended June 30 is filed annually with the SEC on FormN-PX. The Fund’s FormsN-PX are available on the SEC’s website atwww.sec.gov. The Fund’s proxy voting record may also be obtained by calling1-800-967-9009. | |


Fund Service Providers:
CUSTODIAN State Street Bank and Trust Company Boston, Massachusetts | TRANSFER AGENT DST Asset Manager Solutions, Inc. Kansas City, Missouri | INDEPENDENT REGISTERED PUBLIC ACCOUNTING FIRM PricewaterhouseCoopers LLP Boston, Massachusetts | DISTRIBUTOR Resolute Investment Distributors, Inc. Irving, Texas |
This report is prepared for shareholders of the American Beacon Funds and may be distributed to others only if preceded or accompanied by a current Prospectus or Summary Prospectus.
American Beacon Funds, American Beacon Frontier Markets Income Fund and American Beacon GLG Total Return Fund are service marks of American Beacon Advisors, Inc.
AR 1/19

About American Beacon Advisors
Since 1986, American Beacon Advisors has offered a variety of products and investment advisory services to numerous institutional and retail clients, including a variety of mutual funds, corporate cash management, and separate account management.
Our clients include defined benefit plans, defined contribution plans, foundations, endowments, corporations, financial planners, and other institutional investors. With American Beacon Advisors, you can put the experience of a multi-billion dollar asset management firm to work for your company.
Beginning on January 1, 2021, as permitted by regulations adopted by the Securities and Exchange Commission, paper copies of the Fund’s shareholder reports will no longer be sent by mail, unless you specifically request paper copies of the reports from the Fund or from your financial intermediary, such as a broker-dealer or bank. Instead, the reports will be made available on a website, and you will be notified by mail each time a report is posted and provided with a website link to access the report.
If you already elected to receive shareholder reports electronically, you will not be affected by this change and you need not take any action. You may elect to receive shareholder reports and other communications from the Fund or your financial intermediary electronically by going towww.americanbeaconfunds.com and clicking on “Quick Links” and then “Register for E-Delivery.”
You may elect to receive all future reports in paper free of charge. You can inform the Fund that you wish to continue receiving paper copies of your shareholder reports by calling 1-800-658-5811, option 1, or you may directly inform your financial intermediary of your wish. A notice that will be mailed to you each time a report is posted will also include instructions for informing the Fund that you wish to continue receiving paper copies of your shareholder reports. Your election to receive reports in paper will apply to all funds held with the American Beacon Funds Complex or your financial intermediary, as applicable.
CONTINUOUS CAPITAL EMERGING MARKETS FUND
Investing inforeign and emerging market securitiesmay involve heightened risk due to currency fluctuations and economic and political risks. The Fund may havehigh portfolio turnover, which could increase the Fund’s transaction costs and possibly have a negative impact on performance. The Fund participates in asecurities lending program. Please see the prospectus for a complete discussion of the Fund’s risks. There can be no assurances that the investment objectives of this Fund will be met.
Any opinions herein, including forecasts, reflect our judgment as of the end of the reporting period and are subject to change. Each advisor’s strategies and each Fund’s portfolio composition will change depending on economic and market conditions. This report is not a complete analysis of market conditions, and, therefore, should not be relied upon as investment advice. Although economic and market information has been compiled from reliable sources, American Beacon Advisors, Inc. makes no representation as to the completeness or accuracy of the statements contained herein.
American Beacon Funds | January 31, 2019 |
| 1 | ||||
| 2 | ||||
| 6 | ||||
| 8 | ||||
Schedule of Investments: | ||||
| 9 | ||||
| 15 | ||||
| 18 | ||||
Financial Highlights: | ||||
| 32 | ||||
| 35 | ||||
Disclosures Regarding the Approval of the Management and Investment Advisory Agreements | 36 | |||
| 40 | ||||
| 47 | ||||
| Back Cover | ||||
 | Dear Shareholders,
The market volatility of December 2018 – a month in which all major U.S. equity indexes declined and the year ended in negative territory – serves as a prime example of the importance of having a long-term investment perspective.
While long-term investing isn’t about identifying and anticipating the next big market move, it is about identifying the right investment products for riding out those moves. As a long-term investor, you should strive to accomplish the three Ds: direction, discipline and diversification.
u Direction: Achieving your long-term financial goals requires an individualized plan of action. You may want your plan to provide some |
| measure of protection against periods of geopolitical turmoil, economic uncertainty, market volatility and job insecurity. Your plan should be reviewed annually and be adjusted in the event your long-range needs change. |
| u | Discipline:Long-term, systematic participation in an investment portfolio requires your resolution to stay the course. Spending time in the market – rather than trying to time the market – may place you in a better position to reach your long-term financial goals. |
| u | Diversification: By investing in different types of investment categories and asset classes, you may be able to help mitigate financial risks across your investment portfolio. By allocating your investment portfolio according to your risk-tolerance level, you may be better positioned to weather storms and achieve your long-term financial goals. |
Since 1986, American Beacon has endeavored to provide investors with a disciplined approach to realizing long-term financial goals.As a manager of managers, we strive to provide investment products that may enable investors to participate during market upswings while potentially insulating against market downswings. Our approach is more than a concept. It’s the cornerstone of our culture. And we strive to apply it at every turn as we seek to provide a well-diversified line of investment products for your investment portfolio.
Many of thesub-advisors to our mutual funds pursue upside capture and/or downside protection using proprietary strategies. The investment teams behind our mutual funds seek to produce consistent, long-term results rather than focus only on short-term movements in the markets. In managing our investment products, we emphasize identifying opportunities that offer the potential for long-term rewards.
Thank you for your continued interest in American Beacon. For additional information about our funds or to access your account information, please visit our website atwww.americanbeaconfunds.com.
Best Regards,

Gene L. Needles, Jr.
President
American Beacon Funds
1
Global Equity and Emerging Markets Overview
January 31, 2019 (Unaudited)
Global equity markets struggled during the12-month period ended January 31, 2019, as evidenced by the MSCI ACWI Index (down 7.5%).
In the U.S., the unemployment rate hit a49-year low of 3.7%, gross domestic product growth hit 3% for the first time since 2015 and corporate earnings growth surged. The Trump administration’s corporate tax cuts provided a temporary, but powerful, boost to the economy, convincing the data-dependent Federal Reserve (“the Fed”) to raise interest rates. However, by the end of the third quarter of 2018, the market was overcome by uncertainties, including how much higher the Fed was going to push interest rates, increasing trade tensions with China and whether the economic expansion was coming to an end. Despite these concerns, the Fed decided to hike interest rates in December 2018, which caused the market tosell-off rapidly. However, by the end of January, the Fed signaled a pause in rate hikes. In addition, the trade rhetoric from both President Donald Trump and China’s President Xi Jinping was starting to change with both sides seemingly more willing to compromise.
Within the S&P 500 Index, the top performing sectors were Utilities (up 11.1%) and Real Estate (up 10.4%). Lagging sectors included Materials (down 13.6%), Energy (down 12.3%) and Financials (down 11.1%). From a style standpoint, investors favored Growth stocks as they outperformed Value, as demonstrated by the Russell 3000 Growth Index (up 0.3%) versus the Russell 3000 Value Index (down 4.8%).
International developed markets also struggled during the period as the MSCI EAFE Index was down 12.5%. As concerns about economic growth mounted, the negative returns were broad-based: The MSCI Japan Index declined 11.6%, the MSCI Germany Index fell 21.7%, the MSCI Italy Index was down 20.0% and the MSCI United Kingdom Index was down 10.8%. In addition, the Brexit deadline of March 29, 2019, has been increasingly unsettling to markets as the U.K. has yet to come to an agreement with the European Union.
Finally, in the developing world, emerging markets had a difficult year as the combination of slowing growth and rising debt exacerbated concerns around the impact of President Trump��s tough trade policy on China. The MSCI Emerging Market Index ended the period down 14.2%. Notable market performance included the MSCI China Index (down 19.9%), the MSCI India Index (down 12.1%) and the MSCI Taiwan Index (down 13.9%).
2
American Beacon Continuous Capital Emerging Markets FundSMPerformance Overview
January 31, 2019 (Unaudited)
The Investor Class of the American Beacon Continuous Capital Emerging Markets Fund (the “Fund”) returned 8.40% for the period since inception December 17, 2018 through January 31, 2019. The Fund slightly outperformed the MSCI Emerging Markets Index (the “Index”) return of 8.33% for the same period. Due to the Fund having an inception of less than two full months, commentary below will focus on the one-month period ending January 31, 2019. During this period, the Fund returned 8.18%. The Fund slightly underperformed the Index return of 8.77%.
Comparison of Changes in Value of a $10,000 Investment for the period 12/17/2018 Through 1/31/2019
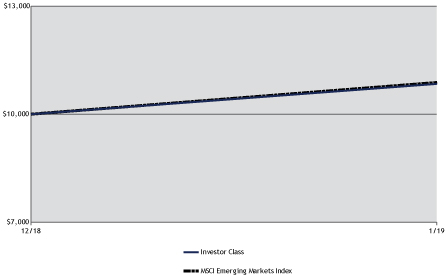
| Total Returns for the Period ended January 31, 2019 |
| ||||||||||||||||
Ticker | Since Inception (12/17/2018) | Value of $10,000 12/17/2018 - 1/31/2019 | |||||||||||||||
Institutional Class (1,3) | CCEIX | 8.50 | % | $ | 10,850 | ||||||||||||
Y Class (1,3) | CCEYX | 8.50 | % | $ | 10,850 | ||||||||||||
Investor Class (1,3) | CCEPX | 8.40 | % | $ | 10,840 | ||||||||||||
MSCI Emerging Markets Index (2) | 8.33 | % | $ | 10,878 | |||||||||||||
| 1. | Performance shown is historical and is not indicative of future returns. Investment returns and principal value will vary, and shares may be worth more or less at redemption than at original purchase. Performance shown is calculated based on the published end of day net asset values as of the date indicated and current performance may be lower or higher than the performance data quoted. To obtain performance as of the most recent month end, please visitwww.americanbeaconfunds.com or call1-800-967-9009. Fund performance in the table above does not reflect the deduction of taxes a shareholder would pay on distributions or the redemption of shares. Generally accepted accounting principles require adjustments to be made to the net assets of the Fund at period end for financial reporting purposes only, and as such, the total return based on the unadjusted net asset value per share may differ from the total return reported in the financial highlights. A portion of the fees charged to each Class of the Fund has been waived since Fund inception. Performance prior to waiving fees was lower than the actual returns shown since inception. |
| 2. | The MSCI Emerging Markets Index is a market capitalization weighted index composed of companies that are representative of the market structure of developing countries in Latin America, Asia, Eastern Europe, the Middle East and Africa. The MSCI® information contained herein: (1) is provided “as is,” (2) is proprietary to MSCI and/or its content providers, (3) may not be used to create any financial instruments or products or any indexes and (4) may not be copied or distributed without MSCI’s express written consent. MSCI disclaims all warranties with respect to the information. Neither MSCI nor its content providers are responsible for any damages or losses arising from any use of this information. One cannot directly invest in an index. |
3
American Beacon Continuous Capital Emerging Markets FundSMPerformance Overview
January 31, 2019 (Unaudited)
| 3. | The Total Annual Fund Operating Expense ratios set forth in the most recent Fund prospectus for the Institutional, Y and Investor Class shares were 2.42%, 2.52% and 2.80%, respectively. The expense ratios above may vary from the expense ratios presented in other sections of this report that are based on expenses incurred during the period covered by this report. |
For theone-month period ending January 31, 2019, the Fund modestly underperformed the Index primarily through stock selection. Sector allocation also detracted, but to a lesser degree. Most of the Fund’s underperformance related to security selection was attributed to holdings in the Energy and Consumer Discretionary sectors. In the Energy sector, United Tractors Tbk PT (down 3.1%) and Serba Dinamik Holdings Bhd (down 0.9%) detracted the most. In the Consumer Discretionary sector, Doubleugames Co., Ltd. (down 5.2%), and LF Corp. (down 5.5%), detracted the most. The aforementioned underperformance was somewhat offset by security selection in the Information Technology sector. Parade Technologies Ltd. (up 21.1%) and SFA Engineering Corp. (up 20.3%) were the largest contributors to performance.
Looking forward, the Fund’ssub-advisor will continue to focus on its iterative investment process of constructing a portfolio of high-quality companies with consistent value and income characteristics.
| Top Ten Holdings (% Net Assets) | ||||||||
| iShares MSCI India ETF | 5.9 | |||||||
| Alibaba Group Holding Ltd., Sponsored ADR | 0.9 | |||||||
| Baidu, Inc., Sponsored ADR | 0.8 | |||||||
| Naspers Ltd., Class N, Sponsored ADR | 0.8 | |||||||
| Tencent Holdings Ltd., ADR | 0.8 | |||||||
| China Merchants Bank Co., Ltd., Class H | 0.7 | |||||||
| Hapvida Participacoes e Investimentos S.A. | 0.7 | |||||||
| JBS S.A. | 0.7 | |||||||
| SFA Engineering Corp. | 0.7 | |||||||
| Yandex N.V., Class A | 0.7 | |||||||
| Total Fund Holdings | 142 | |||||||
| Sector Allocation (% Equities) | ||||||||
| Financials | 25.3 | |||||||
| Information Technology | 14.3 | |||||||
| Consumer Discretionary | 9.9 | |||||||
| Communication Services | 8.9 | |||||||
| Industrials | 8.4 | |||||||
| Consumer Staples | 7.1 | |||||||
| Health Care | 6.6 | |||||||
| Exchange-Traded Instruments | 6.4 | |||||||
| Energy | 4.5 | |||||||
| Materials | 4.5 | |||||||
| Utilities | 2.8 | |||||||
| Real Estate | 1.3 | |||||||
4
American Beacon Continuous Capital Emerging Markets FundSM
Performance Overview
January 31, 2019 (Unaudited)
| Country Allocation (% Equities) | ||||||||
| China | 26.7 | |||||||
| Republic of Korea | 13.6 | |||||||
| Taiwan | 11.5 | |||||||
| United States | 7.1 | |||||||
| Brazil | 6.7 | |||||||
| South Africa | 6.2 | |||||||
| Russia | 3.3 | |||||||
| Indonesia | 3.2 | |||||||
| India | 3.1 | |||||||
| Malaysia | 2.7 | |||||||
| Thailand | 2.7 | |||||||
| Hong Kong | 2.6 | |||||||
| Mexico | 2.6 | |||||||
| Philippines | 2.0 | |||||||
| Singapore | 1.9 | |||||||
| Chile | 1.3 | |||||||
| Cyprus | 0.7 | |||||||
| Peru | 0.7 | |||||||
| Turkey | 0.7 | |||||||
| United Kingdom | 0.7 |
5
Expense Examples
January 31, 2019 (Unaudited)
Fund Expense Example
As a shareholder of a Fund, you incur two types of costs: (1) transaction costs, including sales charges (loads) on purchase payments and redemption fees, if applicable, and (2) ongoing costs, including management fees, distribution(12b-1) fees,sub-transfer agent fees, and other Fund expenses. The Examples are intended to help you understand the ongoing cost (in dollars) of investing in the Fund and to compare these costs with the ongoing costs of investing in other mutual funds. The Examples are based on an investment of $1,000 invested at the beginning of the period in each Class and held for the entire period from December 17, 2018 through January 31, 2019.
Actual Expenses
The “Actual” lines of the tables provide information about actual account values and actual expenses. You may use the information on this page, together with the amount you invested, to estimate the expenses that you paid over the period. Simply divide your account value by $1,000 (for example, an $8,600 account value divided by $1,000 = $8.60), then multiply the result by the “Expenses Paid During Period” to estimate the expenses you paid on your account during this period. Shareholders of the Investor and Institutional Classes that invest in the Fund through an IRA or Roth IRA may be subject to a custodial IRA fee of $15 that is typically deducted each December. If your account was subject to a custodial IRA fee during the period, your costs would have been $15 higher.
Hypothetical Example for Comparison Purposes
The “Hypothetical” lines of the tables provide information about hypothetical account values and hypothetical expenses based on the Fund’s actual expense ratio and an assumed 5% per year rate of return before expenses (not the Fund’s actual return). You may compare the ongoing costs of investing in the Fund with other funds by contrasting this 5% hypothetical example and the 5% hypothetical examples that appear in the shareholder reports of the other funds. The hypothetical account values and expenses may not be used to estimate the actual ending account balance or expenses you paid for the period. Shareholders of the Investor and Institutional Classes that invest in the Funds through an IRA or Roth IRA may be subject to a custodial IRA fee of $15 that is typically deducted each December. If your account was subject to a custodial IRA fee during the period, your costs would have been $15 higher.
You should also be aware that the expenses shown in the table highlight only your ongoing costs and do not reflect any transaction costs charged by the Fund, such as sales charges (loads) or redemption fees, as applicable. Similarly, the expense examples for other funds do not reflect any transaction costs charged by those funds, such as sales charges (loads), redemption fees or exchange fees. Therefore, the “Hypothetical” lines of the tables are useful in comparing ongoing costs only and will not help you determine the relative total costs of owning different funds. If you were subject to any transaction costs during the period, your costs would have been higher.
6
American Beacon Continuous Capital Emerging Markets FundSM
Expense Examples
January 31, 2019 (Unaudited)
| American Beacon Continuous Capital Emerging Markets Fund |
| ||||||||||||||
| Beginning Account Value 12/17/2018 | Ending Account Value 1/31/2019 | Expenses Paid During Period 12/17/2018-1/31/2019* | |||||||||||||
| Institutional Class*** | |||||||||||||||
| Actual | $1,000.00 | $1,085.00 | $1.48 | ||||||||||||
| Hypothetical** | $1,000.00 | $1,004.75 | $1.42 | ||||||||||||
| Y Class*** | |||||||||||||||
| Actual | $1,000.00 | $1,085.00 | $1.61 | ||||||||||||
| Hypothetical** | $1,000.00 | $1,004.62 | $1.54 | ||||||||||||
| Investor Class*** | |||||||||||||||
| Actual | $1,000.00 | $1,084.00 | $1.97 | ||||||||||||
| Hypothetical** | $1,000.00 | $1,004.28 | $1.89 | ||||||||||||
| * | Expenses are equal to the Fund’s annualized expense ratios for thesix-month period of 1.15%, 1.25%, and 1.53% for the Institutional, Y and Investor Classes, respectively, multiplied by the average account value over the period, multiplied by the number derived by dividing the number of days in the most recent fiscal period (45) by days in the year (365) to reflect the period. |
| ** | 5% return before expenses. |
| *** | Commenced operations on December 17, 2018. |
7
Report of Independent Registered Public Accounting Firm
Tothe Board of Trustees of American Beacon Funds and Shareholders of American Beacon Continuous Capital Emerging Markets Fund
Opinion on the Financial Statements
We have audited the accompanying statement of assets and liabilities, including the schedule of investments, of American Beacon Continuous Capital Emerging Markets Fund (one of the series constituting the American Beacon Funds, hereafter referred to as the “Fund”) as of January 31, 2019, and the related statements of operations and changes in net assets, including the related notes, and the financial highlights for the period December 17, 2018 (commencement of operations) through January 31, 2019 (collectively referred to as the “financial statements”). In our opinion, the financial statements present fairly, in all material respects, the financial position of the Fund as of January 31, 2019, and the results of its operations, changes in its net assets, and the financial highlights for the period December 17, 2018 (commencement of operations) through January 31, 2019 in conformity with accounting principles generally accepted in the United States of America.
Basis for Opinion
These financial statements are the responsibility of the Fund’s management. Our responsibility is to express an opinion on the Fund’s financial statements based on our audit. We are a public accounting firm registered with the Public Company Accounting Oversight Board (United States) (“PCAOB”) and are required to be independent with respect to the Fund in accordance with the U.S. federal securities laws and the applicable rules and regulations of the Securities and Exchange Commission and the PCAOB.
We conducted our audit of these financial statements in accordance with the standards of the PCAOB. Those standards require that we plan and perform the audit to obtain reasonable assurance about whether the financial statements are free of material misstatement, whether due to error or fraud.
Our audit included performing procedures to assess the risks of material misstatement of the financial statements, whether due to error or fraud, and performing procedures that respond to those risks. Such procedures included examining, on a test basis, evidence regarding the amounts and disclosures in the financial statements. Our audit also included evaluating the accounting principles used and significant estimates made by management, as well as evaluating the overall presentation of the financial statements. Our procedures included confirmation of securities owned as of January 31, 2019 by correspondence with the custodian, and transfer agent. We believe that our audits provide a reasonable basis for our opinion.
PricewaterhouseCoopers LLP
Dallas, TX
March 27, 2019
We have served as the auditor of one or more investment companies in the American Beacon Funds since 2016.
8
American Beacon Continuous Capital Emerging Markets FundSM
Schedule of Investments
January 31, 2019
| Shares | Fair Value | ||||||||||||||
| Brazil - 6.54% | |||||||||||||||
| Common Stocks - 6.54% | |||||||||||||||
| Alupar Investimento S.A. | 3,878 | $ | 22,914 | ||||||||||||
| B3 S.A. – Brasil Bolsa Balcao | 2,649 | 22,857 | |||||||||||||
| Banco do Estado do Rio Grande do Sul S.A., Class B | 3,300 | 21,263 | |||||||||||||
| Hapvida Participacoes e Investimentos S.A.A | 2,464 | 23,132 | |||||||||||||
| IRB Brasil Resseguros S/A | 887 | 20,735 | |||||||||||||
| Petrobras Distribuidora S.A. | 2,968 | 21,687 | |||||||||||||
| Qualicorp Consultoria e Corretora de Seguros S.A. | 4,800 | 20,860 | |||||||||||||
| Sul America S.A. | 2,574 | 22,655 | |||||||||||||
| TIM Participacoes S.A. | 5,932 | 20,168 | |||||||||||||
| Vale S.A., Sponsored ADR | 1,310 | 16,296 | |||||||||||||
|
| ||||||||||||||
Total Common Stocks | 212,567 | ||||||||||||||
|
| ||||||||||||||
Total Brazil (Cost $184,712) | 212,567 | ||||||||||||||
|
| ||||||||||||||
| Chile - 1.32% | |||||||||||||||
| Common Stocks - 1.32% | |||||||||||||||
| Banco Santander Chile, ADR | 670 | 21,668 | |||||||||||||
| Enel Chile S.A. | 201,171 | 21,197 | |||||||||||||
|
| ||||||||||||||
Total Common Stocks | 42,865 | ||||||||||||||
|
| ||||||||||||||
Total Chile (Cost $41,761) | 42,865 | ||||||||||||||
|
| ||||||||||||||
| China - 26.18% | |||||||||||||||
| Common Stocks - 26.18% | |||||||||||||||
| Agricultural Bank of China Ltd., Class HB | 45,667 | 21,683 | |||||||||||||
| Alibaba Group Holding Ltd., Sponsored ADRC | 165 | 27,801 | |||||||||||||
| ANTA Sports Products Ltd.B | 4,258 | 22,293 | |||||||||||||
| Baidu, Inc., Sponsored ADRC | 159 | 27,448 | |||||||||||||
| Bank of China Ltd., Class HB | 45,101 | 20,977 | |||||||||||||
| Bank of Communications Co., Ltd., Class HB | 25,484 | 21,585 | |||||||||||||
| Beijing Enterprises Holdings Ltd.B | 3,792 | 21,620 | |||||||||||||
| By-health Co., Ltd., Class AB | 7,700 | 19,652 | |||||||||||||
| China Communications Services Corp. Ltd., Class HB | 23,283 | 21,890 | |||||||||||||
| China Construction Bank Corp., Class HB | 25,156 | 22,720 | |||||||||||||
| China Lilang Ltd.B | 25,000 | 22,133 | |||||||||||||
| China Medical System Holdings Ltd.B | 21,500 | 22,360 | |||||||||||||
| China Merchants Bank Co., Ltd., Class HB | 5,326 | 23,533 | |||||||||||||
| China Tower Corp. Ltd., Class HA B C | 100,324 | 21,490 | |||||||||||||
| China Traditional Chinese Medicine Holdings Co., Ltd.B | 31,453 | 20,461 | |||||||||||||
| Consun Pharmaceutical Group Ltd.B | 29,000 | 22,215 | |||||||||||||
| ENN Energy Holdings Ltd.B | 2,283 | 21,975 | |||||||||||||
| Gree Electric Appliances, Inc. of Zhuhai, Class AB C | 3,600 | 22,657 | |||||||||||||
| Guangdong Provincial Expressway Development Co., Ltd., Class AB | 16,700 | 21,721 | |||||||||||||
| Hangzhou Shunwang Technology Co., Ltd., Class AB | 9,900 | 18,025 | |||||||||||||
| Hubei Jumpcan Pharmaceutical Co., Ltd., Class AB | 4,100 | 20,464 | |||||||||||||
| Industrial & Commercial Bank of China Ltd., Class HB | 26,807 | 20,929 | |||||||||||||
| Inner Mongolia Yili Industrial Group Co., Ltd., Class AB | 5,500 | 19,852 | |||||||||||||
| Jiangsu Expressway Co., Ltd., Class HB | 13,872 | 20,092 | |||||||||||||
| Jiangsu Yanghe Brewery Joint-Stock Co., Ltd., Class AB | 1,400 | 19,751 | |||||||||||||
| Kweichow Moutai Co., Ltd., Class AB | 200 | 20,881 | |||||||||||||
| Longfor Group Holdings Ltd.B | 6,511 | 20,136 | |||||||||||||
| Luxshare Precision Industry Co., Ltd., Class AB | 9,300 | 22,979 | |||||||||||||
| Midea Group Co., Ltd., Class AB | 3,500 | 23,058 | |||||||||||||
| Qingdao Port International Co., Ltd., Class HA B C | 33,217 | 20,687 | |||||||||||||
| Shanghai Pharmaceuticals Holding Co., Ltd., Class HB | 9,849 | 20,998 | |||||||||||||
| Shenzhou International Group Holdings Ltd.B | 1,642 | 19,588 | |||||||||||||
| Sinopharm Group Co., Ltd., Class HB | 4,547 | 20,471 | |||||||||||||
See accompanying notes
9
American Beacon Continuous Capital Emerging Markets FundSM
Schedule of Investments
January 31, 2019
| Shares | Fair Value | ||||||||||||||
| China - 26.18% (continued) | |||||||||||||||
| Common Stocks - 26.18% (continued) | |||||||||||||||
| Sinosoft Technology Group Ltd.B | 79,212 | $ | 21,991 | ||||||||||||
| Tencent Holdings Ltd.B | 510 | 22,946 | |||||||||||||
| Tencent Holdings Ltd., ADR | 602 | 26,855 | |||||||||||||
| TravelSky Technology Ltd., Class HB | 8,193 | 22,194 | |||||||||||||
| Xtep International Holdings Ltd.B | 34,500 | 22,483 | |||||||||||||
| Zhejiang Expressway Co., Ltd., Class HB | 20,425 | 20,914 | |||||||||||||
|
| ||||||||||||||
Total Common Stocks | 851,508 | ||||||||||||||
|
| ||||||||||||||
Total China (Cost $786,606) | 851,508 | ||||||||||||||
|
| ||||||||||||||
| Hong Kong - 2.59% | |||||||||||||||
| Common Stocks - 2.59% | |||||||||||||||
| AIA Group Ltd., Sponsored ADR | 580 | 21,100 | |||||||||||||
| NWS Holdings Ltd.B | 9,000 | 20,651 | |||||||||||||
| Pacific Textiles Holdings Ltd.B | 24,000 | 20,969 | |||||||||||||
| Techtronic Industries Co., Ltd.B | 3,718 | 21,643 | |||||||||||||
|
| ||||||||||||||
Total Common Stocks | 84,363 | ||||||||||||||
|
| ||||||||||||||
Total Hong Kong (Cost $78,640) | 84,363 | ||||||||||||||
|
| ||||||||||||||
| India - 3.02% | |||||||||||||||
| Common Stocks - 3.02% | |||||||||||||||
| HDFC Bank Ltd., ADR | 174 | 17,090 | |||||||||||||
| ICICI Bank Ltd., Sponsored ADR | 1,784 | 18,214 | |||||||||||||
| Infosys Ltd., Sponsored ADR | 2,010 | 21,708 | |||||||||||||
| Larsen & Toubro Ltd., GDRB | 1,160 | 21,364 | |||||||||||||
| Reliance Industries Ltd., GDRA B | 575 | 19,826 | |||||||||||||
|
| ||||||||||||||
Total Common Stocks | 98,202 | ||||||||||||||
|
| ||||||||||||||
Total India (Cost $95,490) | 98,202 | ||||||||||||||
|
| ||||||||||||||
| Indonesia - 3.19% | |||||||||||||||
| Common Stocks - 3.19% | |||||||||||||||
| Bank Negara Indonesia Persero Tbk PTB | 33,005 | 21,447 | |||||||||||||
| Bank Rakyat Indonesia Persero Tbk PTB | 78,386 | 21,655 | |||||||||||||
| Gudang Garam Tbk PTB | 3,375 | 20,212 | |||||||||||||
| United Tractors Tbk PTB | 10,653 | 19,590 | |||||||||||||
| Waskita Beton Precast Tbk PTB | 757,269 | 20,859 | |||||||||||||
|
| ||||||||||||||
Total Common Stocks | 103,763 | ||||||||||||||
|
| ||||||||||||||
Total Indonesia (Cost $99,381) | 103,763 | ||||||||||||||
|
| ||||||||||||||
| Malaysia - 2.65% | |||||||||||||||
| Common Stocks - 2.65% | |||||||||||||||
| AEON Credit Service M BhdB | 5,500 | 21,435 | |||||||||||||
| Cahya Mata Sarawak BhdB | 29,100 | 21,835 | |||||||||||||
| My EG Services BhdB | 86,500 | 21,193 | |||||||||||||
| Serba Dinamik Holdings BhdB | 23,821 | 21,619 | |||||||||||||
|
| ||||||||||||||
Total Common Stocks | 86,082 | ||||||||||||||
|
| ||||||||||||||
Total Malaysia (Cost $79,017) | 86,082 | ||||||||||||||
|
| ||||||||||||||
See accompanying notes
10
American Beacon Continuous Capital Emerging Markets FundSM
Schedule of Investments
January 31, 2019
| Shares | Fair Value | ||||||||||||||
| Mexico - 2.53% | |||||||||||||||
| Common Stocks - 2.53% | |||||||||||||||
| Bolsa Mexicana de Valores S.A.B. de C.V. | 11,053 | $ | 22,109 | ||||||||||||
| Gruma S.A.B. de C.V., Class B | 1,755 | 21,438 | |||||||||||||
| Grupo Aeroportuario del Centro Norte S.A.B. de C.V., ADR | 447 | 20,035 | |||||||||||||
| Grupo Financiero Banorte S.A.B. de C.V. | 3,369 | 18,737 | |||||||||||||
|
| ||||||||||||||
Total Common Stocks | 82,319 | ||||||||||||||
|
| ||||||||||||||
Total Mexico (Cost $69,573) | 82,319 | ||||||||||||||
|
| ||||||||||||||
| Peru - 0.66% (Cost $19,614) | |||||||||||||||
| Common Stocks - 0.66% | |||||||||||||||
| Credicorp Ltd. | 89 | 21,607 | |||||||||||||
|
| ||||||||||||||
| Philippines - 1.92% | |||||||||||||||
| Common Stocks - 1.92% | |||||||||||||||
| Ayala Corp.B | 1,222 | 21,743 | |||||||||||||
| Ayala Land, Inc.B | 23,676 | 20,194 | |||||||||||||
| San Miguel Corp.B | 6,517 | 20,639 | |||||||||||||
|
| ||||||||||||||
Total Common Stocks | 62,576 | ||||||||||||||
|
| ||||||||||||||
Total Philippines (Cost $58,570) | 62,576 | ||||||||||||||
|
| ||||||||||||||
| Republic of Korea - 13.32% | |||||||||||||||
| Common Stocks - 13.32% | |||||||||||||||
| Doosan Bobcat, Inc.B | 652 | 19,471 | |||||||||||||
| DoubleUGames Co., Ltd.B | 440 | 22,165 | |||||||||||||
| Hana Financial Group, Inc.B | 595 | 21,451 | |||||||||||||
| Hansol Chemical Co., Ltd.B | 288 | 22,009 | |||||||||||||
| Industrial Bank of KoreaB | 1,641 | 21,027 | |||||||||||||
| Innocean Worldwide, Inc.B | 347 | 21,993 | |||||||||||||
| KT&G Corp.B | 221 | 19,687 | |||||||||||||
| LF Corp.B | 957 | 21,214 | |||||||||||||
| LG Household & Health Care Ltd.B | 29 | 19,819 | |||||||||||||
| LG Uplus Corp.B | 1,241 | 16,850 | |||||||||||||
| Meritz Securities Co., Ltd.B | 5,038 | 20,886 | |||||||||||||
| Samjin Pharmaceutical Co., Ltd.B | 562 | 19,442 | |||||||||||||
| Samsung Electronics Co., Ltd.B | 1,137 | 42,633 | |||||||||||||
| Samsung Fire & Marine Insurance Co., Ltd.B | 79 | 19,385 | |||||||||||||
| SFA Engineering Corp.B | 630 | 23,280 | |||||||||||||
| Shinhan Financial Group Co., Ltd.B | 545 | 21,099 | |||||||||||||
| Silicon Works Co., Ltd.B | 613 | 21,265 | |||||||||||||
| SK Holdings Co., Ltd.B | 85 | 20,144 | |||||||||||||
| SK Telecom Co., Ltd.B | 82 | 18,964 | |||||||||||||
| Soulbrain Co., Ltd.B | 446 | 20,392 | |||||||||||||
|
| ||||||||||||||
Total Common Stocks | 433,176 | ||||||||||||||
|
| ||||||||||||||
Total Republic of Korea (Cost $414,251) | 433,176 | ||||||||||||||
|
| ||||||||||||||
| Russia - 3.97% | |||||||||||||||
| Common Stocks - 3.97% | |||||||||||||||
| Gazprom Neft PJSC, ADR | 768 | 19,707 | |||||||||||||
| LUKOIL PJSC, ADR | 268 | 21,494 | |||||||||||||
| Novatek PJSC, GDRB | 112 | 20,575 | |||||||||||||
| Tatneft PJSC, ADRB | 285 | 20,931 | |||||||||||||
| TCS Group Holding PLC, GDRB | 1,164 | 22,705 | |||||||||||||
| Yandex N.V., Class AC | 705 | 23,674 | |||||||||||||
|
| ||||||||||||||
Total Common Stocks | 129,086 | ||||||||||||||
|
| ||||||||||||||
Total Russia (Cost $119,953) | 129,086 | ||||||||||||||
|
| ||||||||||||||
See accompanying notes
11
American Beacon Continuous Capital Emerging Markets FundSM
Schedule of Investments
January 31, 2019
| Shares | Fair Value | ||||||||||||||
| Singapore - 1.91% | |||||||||||||||
| Common Stocks - 1.91% | |||||||||||||||
| IGG, Inc.B | 13,719 | $ | 21,197 | ||||||||||||
| Oversea-Chinese Banking Corp. Ltd.B | 2,550 | 21,836 | |||||||||||||
| SATS Ltd.B | 5,344 | 19,205 | |||||||||||||
|
| ||||||||||||||
Total Common Stocks | 62,238 | ||||||||||||||
|
| ||||||||||||||
Total Singapore (Cost $57,469) | 62,238 | ||||||||||||||
|
| ||||||||||||||
| South Africa - 6.09% | |||||||||||||||
| Common Stocks - 6.09% | |||||||||||||||
| Adcock Ingram Holdings Ltd.B | 4,375 | 21,003 | |||||||||||||
| Distell Group Holdings Ltd.B | 2,484 | 21,687 | |||||||||||||
| FirstRand Ltd.B | 3,922 | 20,564 | |||||||||||||
| JSE Ltd.B | 1,700 | 21,055 | |||||||||||||
| KAP Industrial Holdings Ltd.B | 31,923 | 20,609 | |||||||||||||
| Naspers Ltd., Class NB | 99 | 22,909 | |||||||||||||
| Naspers Ltd., Class N, Sponsored ADR | 582 | 26,760 | |||||||||||||
| Santam Ltd.B | 942 | 21,617 | |||||||||||||
| Standard Bank Group Ltd., ADR | 1,468 | 21,888 | |||||||||||||
|
| ||||||||||||||
Total Common Stocks | 198,092 | ||||||||||||||
|
| ||||||||||||||
Total South Africa (Cost $175,004) | 198,092 | ||||||||||||||
|
| ||||||||||||||
| Taiwan - 11.33% | |||||||||||||||
| Common Stocks - 11.33% | |||||||||||||||
| Advantech Co., Ltd.B | 2,809 | 21,218 | |||||||||||||
| Ardentec Corp.B | 23,000 | 22,963 | |||||||||||||
| Chailease Holding Co., Ltd.B | 5,907 | 22,200 | |||||||||||||
| Chipbond Technology Corp.B | 10,000 | 21,931 | |||||||||||||
| E.Sun Financial Holding Co., Ltd.B | 29,297 | 20,593 | |||||||||||||
| Getac Technology Corp.B | 14,000 | 21,135 | |||||||||||||
| Greatek Electronics, Inc.B | 16,000 | 21,437 | |||||||||||||
| Novatek Microelectronics Corp.B | 4,300 | 22,836 | |||||||||||||
| Parade Technologies Ltd.B | 1,325 | 22,193 | |||||||||||||
| Realtek Semiconductor Corp.B | 4,118 | 22,559 | |||||||||||||
| Simplo Technology Co., Ltd.B | 3,000 | 22,059 | |||||||||||||
| Sinbon Electronics Co., Ltd.B | 7,798 | 21,867 | |||||||||||||
| Taiwan Semiconductor Manufacturing Co., Ltd., Sponsored ADR | 557 | 20,954 | |||||||||||||
| Topco Scientific Co., Ltd.B | 9,350 | 21,819 | |||||||||||||
| Tripod Technology Corp.B | 7,558 | 20,418 | |||||||||||||
| Uni-President Enterprises Corp.B | 8,824 | 20,746 | |||||||||||||
| Yuanta Financial Holding Co., Ltd.B | 38,893 | 21,625 | |||||||||||||
|
| ||||||||||||||
Total Common Stocks | 368,553 | ||||||||||||||
|
| ||||||||||||||
Total Taiwan (Cost $336,822) | 368,553 | ||||||||||||||
|
| ||||||||||||||
| Thailand - 2.63% | |||||||||||||||
| Common Stocks - 2.63% | |||||||||||||||
| AEON Thana Sinsap Thailand PCL, NVDRB | 3,868 | 21,927 | |||||||||||||
| Com7 PCL, NVDRB | 47,200 | 22,990 | |||||||||||||
| Krungthai Card PCL, NVDRB | 21,494 | 20,322 | |||||||||||||
| Tisco Financial Group PCL, NVDRB | 7,647 | 20,290 | |||||||||||||
|
| ||||||||||||||
Total Common Stocks | 85,529 | ||||||||||||||
|
| ||||||||||||||
Total Thailand (Cost $81,151) | 85,529 | ||||||||||||||
|
| ||||||||||||||
| Turkey - 0.65% (Cost $20,562) | |||||||||||||||
| Common Stocks - 0.65% | |||||||||||||||
| Soda Sanayii A/SB | 15,100 | 20,980 | |||||||||||||
|
| ||||||||||||||
See accompanying notes
12
American Beacon Continuous Capital Emerging Markets FundSM
Schedule of Investments
January 31, 2019
| Shares | Fair Value | ||||||||||||||
| United Kingdom - 0.64% (Cost $17,616) | |||||||||||||||
| Common Stocks - 0.64% | |||||||||||||||
| Mondi Ltd.B | 843 | $ | 20,900 | ||||||||||||
|
| ||||||||||||||
| United States - 6.97% | |||||||||||||||
| Common Stocks - 0.71% | |||||||||||||||
| JBS S.A. | 5,600 | 23,170 | |||||||||||||
|
| ||||||||||||||
| Exchange-Traded Instruments - 6.26% | |||||||||||||||
| iShares Core MSCI Emerging Markets ETF | 258 | 13,334 | |||||||||||||
| iShares MSCI India ETF | 5,804 | 190,371 | |||||||||||||
|
| ||||||||||||||
Total Exchange-Traded Instruments | 203,705 | ||||||||||||||
|
| ||||||||||||||
Total United States (Cost $220,684) | 226,875 | ||||||||||||||
|
| ||||||||||||||
| SHORT-TERM INVESTMENTS - 3.64% (Cost $118,300) | |||||||||||||||
| Investment Companies - 3.64% | |||||||||||||||
American Beacon U.S. Government Money Market Select Fund, Select Class, 2.32%D E | 118,300 | 118,300 | |||||||||||||
|
| ||||||||||||||
TOTAL INVESTMENTS - 101.75% (Cost $3,075,176) | 3,309,581 | ||||||||||||||
LIABILITIES, NET OF OTHER ASSETS - (1.75%) | (57,035 | ) | |||||||||||||
|
| ||||||||||||||
TOTAL NET ASSETS - 100.00% | $ | 3,252,546 | |||||||||||||
|
| ||||||||||||||
| Percentages are stated as a percent of net assets. |
| ||||||||||||||
A Security exempt from registration under the Securities Act of 1933. These securities may be resold to qualified institutional buyers pursuant to Rule 144A. At the period end, the value of these securities amounted to $85,135 or 2.62% of net assets. The Fund has no right to demand registration of these securities.
B Fair valued pursuant to procedures approved by the Board of Trustees. At period end, the value of these securities amounted to $2,310,355 or 71.03% of net assets.
CNon-income producing security.
D The Fund is affiliated by having the same investment advisor.
E7-day yield.
ADR - American Depositary Receipt.
GDR - Global Depositary Receipt.
ETF - Exchange-Traded Fund.
MSCI - Morgan Stanley Capital International.
NVDR - Non Voting Depositary Receipt.
PCL - Public Company Limited (Thailand).
PJSC - Private Joint Stock Company.
PLC - Public Limited Company.
The Fund’s investments are summarized by level based on the inputs used to determine their values. As of January 31, 2019, the investments were classified as described below:
Continuous Capital Emerging Markets Fund | Level 1 | Level 2 | Level 3 | Total | ||||||||||||||||||||||||
Assets | ||||||||||||||||||||||||||||
Foreign Common Stocks | ||||||||||||||||||||||||||||
Brazil | $ | 212,567 | $ | - | $ | - | $ | 212,567 | ||||||||||||||||||||
Chile | 42,865 | - | - | 42,865 | ||||||||||||||||||||||||
China | 82,104 | 769,404 | - | 851,508 | ||||||||||||||||||||||||
Cyprus | - | 22,705 | - | 22,705 | ||||||||||||||||||||||||
Hong Kong | 21,100 | 63,263 | - | 84,363 | ||||||||||||||||||||||||
India | 57,012 | 41,190 | - | 98,202 | ||||||||||||||||||||||||
Indonesia | - | 103,763 | - | 103,763 | ||||||||||||||||||||||||
Malaysia | - | 86,082 | - | 86,082 | ||||||||||||||||||||||||
Mexico | 82,319 | - | - | 82,319 | ||||||||||||||||||||||||
Peru | 21,607 | - | - | 21,607 | ||||||||||||||||||||||||
See accompanying notes
13
American Beacon Continuous Capital Emerging Markets FundSM
Schedule of Investments
January 31, 2019
Continuous Capital Emerging Markets Fund | Level 1 | Level 2 | Level 3 | Total | ||||||||||||||||||||||||
Philippines | $ | - | $ | 62,576 | $ | - | $ | 62,576 | ||||||||||||||||||||
Republic of Korea | - | 433,176 | - | 433,176 | ||||||||||||||||||||||||
Russia | 64,875 | 41,506 | - | 106,381 | ||||||||||||||||||||||||
Singapore | - | 62,238 | - | 62,238 | ||||||||||||||||||||||||
South Africa | 48,648 | 149,444 | - | 198,092 | ||||||||||||||||||||||||
Taiwan | 20,954 | 347,599 | - | 368,553 | ||||||||||||||||||||||||
Thailand | - | 85,529 | - | 85,529 | ||||||||||||||||||||||||
Turkey | - | 20,980 | - | 20,980 | ||||||||||||||||||||||||
United Kingdom | - | 20,900 | - | 20,900 | ||||||||||||||||||||||||
Common Stocks | ||||||||||||||||||||||||||||
United States | 23,170 | - | - | 23,170 | ||||||||||||||||||||||||
Exchange-Traded Instruments | ||||||||||||||||||||||||||||
United States | 203,705 | - | - | 203,705 | ||||||||||||||||||||||||
Short-Term Investments | 118,300 | - | - | 118,300 | ||||||||||||||||||||||||
|
|
|
|
|
|
|
| |||||||||||||||||||||
Total Investments in Securities - Assets | $ | 999,226 | $ | 2,310,355 | $ | - | $ | 3,309,581 | ||||||||||||||||||||
|
|
|
|
|
|
|
| |||||||||||||||||||||
U.S. GAAP requires transfers between all levels to/from Level 3 to be disclosed. During the period ended January 31, 2019, there were no transfers into or out of Level 3.
See accompanying notes
14
American Beacon Continuous Capital Emerging Markets FundSM
Statement of Assets and Liabilities
January 31, 2019
Assets: |
| |||
Investments in unaffiliated securities, at fair value† | $ | 3,191,281 | ||
Investments in affiliated securities, at fair value‡ | 118,300 | |||
Foreign currency, at fair value^ | 150 | |||
Dividends and interest receivable | 4,685 | |||
Receivable for fund shares sold | 100 | |||
Receivable for expense reimbursement (Note 2) | 74,144 | |||
Deferred offering costs | 46,743 | |||
|
| |||
Total assets | 3,435,403 | |||
|
| |||
Liabilities: |
| |||
Management andsub-advisory fees payable (Note 2) | 2,151 | |||
Service fees payable (Note 2) | 22 | |||
Transfer agent fees payable (Note 2) | 1,419 | |||
Custody and fund accounting fees payable | 39,013 | |||
Professional fees payable | 126,350 | |||
Registration fees payable | 5,955 | |||
Trustee fees payable (Note 2) | 185 | |||
Payable for prospectus and shareholder reports | 4,843 | |||
Other liabilities | 2,919 | |||
|
| |||
Total liabilities | 182,857 | |||
|
| |||
Net assets | $ | 3,252,546 | ||
|
| |||
Analysis of net assets: |
| |||
Paid-in-capital | $ | 3,008,462 | ||
Total distributable earnings (deficits)A | 244,084 | |||
|
| |||
Net assets | $ | 3,252,546 | ||
|
| |||
Shares outstanding at no par value (unlimited shares authorized): |
| |||
Institutional Class | 260,140 | |||
|
| |||
Y Class | 28,956 | |||
|
| |||
Investor Class | 10,798 | |||
|
| |||
Net assets: |
| |||
Institutional Class | $ | 2,821,409 | ||
|
| |||
Y Class | $ | 314,086 | ||
|
| |||
Investor Class | $ | 117,051 | ||
|
| |||
Net asset value, offering and redemption price per share: |
| |||
Institutional Class | $ | 10.85 | ||
|
| |||
Y Class | $ | 10.85 | ||
|
| |||
Investor Class | $ | 10.84 | ||
|
| |||
† Cost of investments in unaffiliated securities | $ | 2,956,876 | ||
‡ Cost of investments in affiliated securities | $ | 118,300 | ||
^ Cost of foreign currency | $ | 149 | ||
A The Fund’s investments in affiliated securities did not have unrealized appreciation (depreciation) at period end. |
| |||
See accompanying notes
15
American Beacon Continuous Capital Emerging Markets FundSM
Statement of Operations
For the period ended January 31, 2019A
Investment income: |
| |||
Dividend income from unaffiliated securities (net of foreign taxes)† | $ | 6,817 | D | |
Dividend income from affiliated securities (Note 7) | 784 | |||
|
| |||
Total investment income | 7,601 | |||
|
| |||
Expenses: |
| |||
Management andsub-advisory fees (Note 2) | 3,037 | |||
Transfer agent fees: | ||||
Institutional Class (Note 2) | 1,408 | |||
Y Class (Note 2) | 6 | |||
Investor Class | 6 | |||
Custody and fund accounting fees | 39,429 | |||
Professional fees | 86,126 | |||
Registration fees and expenses | 6,917 | |||
Service fees (Note 2): | ||||
Investor Class | 32 | |||
Prospectus and shareholder report expenses | 1,246 | |||
Trustee fees (Note 2) | 185 | |||
|
| |||
Total expenses | 138,392 | |||
|
| |||
Net fees waived and expenses (reimbursed) (Note 2) | (134,337 | ) | ||
|
| |||
Net expenses | 4,055 | |||
|
| |||
Net investment income | 3,546 | |||
|
| |||
Realized and unrealized gain (loss) from investments: |
| |||
Net realized gain (loss) from:‡ | ||||
Investments in unaffiliated securitiesB | 11,674 | |||
Foreign currency transactions | (5,572 | ) | ||
Change in net unrealized appreciation of: | ||||
Investments in unaffiliated securitiesC | 234,405 | |||
Foreign currency transactions | 31 | |||
|
| |||
Net gain from investments | 240,538 | |||
|
| |||
Net increase in net assets resulting from operations | $ | 244,084 | ||
|
| |||
† Foreign taxes | $ | 1,090 | ||
A Commencement of operations, December 17, 2018 through January 31, 2019. |
| |||
B The Fund did not recognize net realized gains (losses) from the sale of investments in affiliated securities. |
| |||
C The Fund’s investments in affiliated securities did not have a change in unrealized appreciation (depreciation) at period end. |
| |||
D Includes significant dividends of $1,973. |
| |||
See accompanying notes
16
American Beacon Continuous Capital Emerging Markets FundSM
Statement of Changes in Net Assets
| From December 17, 2018A to January 31, 2019 | ||||
Increase (decrease) in net assets: |
| |||
Operations: |
| |||
Net investment income | $ | 3,546 | ||
Net realized gain (loss) from investments in unaffiliated securities, and foreign currency transactions | 6,102 | |||
Change in net unrealized appreciation (depreciation) of investments in unaffiliated securities, and foreign currency transactions | 234,436 | |||
|
| |||
Net increase in net assets resulting from operations | 244,084 | |||
|
| |||
Capital share transactions (Note 9): |
| |||
Proceeds from sales of shares | 208,462 | |||
|
| |||
Net increase in net assets from capital share transactions | 208,462 | |||
|
| |||
Net increase in net assets | 452,546 | |||
|
| |||
Net assets: |
| |||
Beginning of periodB | 2,800,000 | |||
|
| |||
End of period | $ | 3,252,546 | ||
|
| |||
A Commencement of operations. B Seed capital. |
| |||
See accompanying notes
17
American Beacon Continuous Capital Emerging Markets FundSM
Notes to Financial Statements
January 31, 2019
1. Organization and Significant Accounting Policies
American Beacon Funds (the “Trust”), is organized as a Massachusetts business trust. The Fund, a series within the Trust, is registered under the Investment Company Act of 1940, as amended (the “Act”), as a diversified,open-end management investment company. As of January 31, 2019, the Trust consists of thirty-three active series, one of which is presented in this filing: American Beacon Continuous Capital Emerging Markets Fund (the “Fund”). The remainingthirty-two active series are reported in separate filings.
American Beacon Advisors, Inc. (the “Manager”) is a Delaware corporation and a wholly-owned subsidiary of Resolute Investment Managers, Inc. (“RIM”) organized in 1986 to provide business management, advisory, administrative, and asset management consulting services to the Trust and other investors. The Manager is registered as an investment advisor under the Investment Advisers Act of 1940, as amended (the “Advisers Act”). RIM is, in turn, a wholly-owned subsidiary of Resolute Acquisition, Inc., which is a wholly-owned subsidiary of Resolute Topco, Inc., a wholly-owned subsidiary of Resolute Investment Holdings, LLC (“RIH”). RIH is owned primarily by Kelso Investment Associates VIII, L.P., KEP VI, LLC and Estancia Capital Partners L.P., investment funds affiliated with Kelso & Company, L.P. (“Kelso”) or Estancia Capital Management, LLC (“Estancia”), which are private equity firms.
The Fund commenced operations for the Institutional, Y, and Investor Classes on December 17, 2018. The Fund constitutes a separate investment portfolio with a distinct investment objective and distinct purpose and strategy.
Recently Adopted Accounting Pronouncements
In August 2018, the FASB issued ASU2018-13,Fair Value Measurement (“Topic 820”). The amendments in the ASU impact disclosure requirements for fair value measurement. It is anticipated that this change will enhance the effectiveness of disclosures in the notes to the financial statements. This ASU is effective for fiscal years beginning after December 15, 2019. Early adoption is permitted and can include the entire standard or certain provisions that exclude or amend disclosures. For the period ended January 31, 2019, the Fund has chosen to adopt the standard. The adoption of this ASU guidance did not have a material impact on the financial statements and other disclosures.
In August 2018, the U.S. Securities and Exchange Commission (“SEC”) adopted amendments to certain disclosure requirements in Securities Act ReleaseNo. 33-10532, Disclosure Update and Simplification, which is intended to facilitate the disclosure of information to investors and simplify compliance without significantly altering the total mix of information provided to investors. Effective with the current reporting period, the Fund adopted the amendments with the impacts being that the Fund is no longer required to present components of distributable earnings on the Statement of Assets and Liabilities or the sources of distributable earnings and the amount of undistributed net investment income on the Statement of Changes in Net Assets.
Class Disclosure
The Fund has multiple classes of shares designed to meet the needs of different groups of investors. The following table sets forth the differences amongst the classes:
Class | Eligible Investors | Minimum Initial Investments | ||||
| Institutional | Large institutional investors - sold directly or through intermediary channels. | $ | 250,000 | |||
| Y Class | Large institutional retirement plan investors - sold directly or through intermediary channels. | $ | 100,000 | |||
| Investor | All investors using intermediary organizations, such as broker-dealers or retirement plan sponsors. | $ | 2,500 | |||
18
American Beacon Continuous Capital Emerging Markets FundSM
Notes to Financial Statements
January 31, 2019
Each class offered by the Trust has equal rights as to assets and voting privileges. Income andnon-class specific expenses are allocated daily to each class on the basis of the relative net assets. Realized and unrealized capital gains and losses of each class are allocated daily based on the relative net assets of each class of the respective Fund. Class specific expenses, where applicable, currently include service, distribution, transfer agent fees, andsub-transfer agent fees that vary amongst the classes as described more fully in Note 2.
Significant Accounting Policies
The following is a summary of significant accounting policies, consistently followed by the Funds in preparation of the financial statements. The Funds are considered investment companies and accordingly, follow the investment company accounting and reporting guidance of the FASB Accounting Standards Codification Topic 946,Financial Services – Investment Companies,a part of Generally Accepted Accounting Principles (“U.S. GAAP”).
Security Transactions and Investment Income
Security transactions are recorded as of the trade date for financial reporting purposes. Securities purchased or sold on a when-issued or delayed-delivery basis may be settled beyond a standard settlement period for the security after the trade date.
Dividend income, net of foreign taxes, is recorded on theex-dividend date, except certain dividends from foreign securities which are recorded as soon as the information is available to the Fund. Interest income, net of foreign taxes, is earned from settlement date, recorded on the accrual basis, and adjusted, if necessary, for accretion of discounts and amortization of premiums. Realized gains (losses) from securities sold are determined on the basis of specific lot identification.
Distributions to Shareholders
Distributions, if any, of net investment income are generally paid at least annually and recorded on theex-dividend date. Distributions, if any, of net realized capital gains are generally paid at least annually and recorded on theex-dividend date. Dividends to shareholders are determined in accordance with federal income tax regulations, which may differ in amount and character from net investment income and realized gains recognized for purposes of U.S. GAAP. To the extent necessary to fully distribute capital gains, the Fund may designate earnings and profits distributed to shareholders on the redemption of shares.
Currency Translation
All assets and liabilities initially expressed in foreign currency values are converted into U.S. dollar values at the mean of the bid and ask prices of such currencies against U.S. dollars as last quoted by a recognized dealer. Income, expenses, and purchases and sales of investments are translated into U.S. dollars at the rate of the exchange prevailing on the respective dates of such transactions. The effect of changes in foreign currency exchange rates on investments is separately identified from the fluctuations arising from changes in market values of securities held and is reported with all other foreign currency gains and losses on the Fund’s Statement of Operations.
Allocation of Income, Trust Expenses, Gains, and Losses
Investment income, realized and unrealized gains and losses from investments of the Fund is allocated daily to each class of shares based upon the relative proportion of net assets of each class to the total net assets of the Fund. Expenses directly charged or attributable to any Fund will be paid from the assets of the Fund. Generally, expenses of the Trust will be allocated among and charged to the assets of the Fund on a basis that the Trust’s Board of Trustees (the “Board”) deems fair and equitable, which may be based on the relative net assets of the Fund or nature of the services performed and relative applicability to the Fund.
19
American Beacon Continuous Capital Emerging Markets FundSM
Notes to Financial Statements
January 31, 2019
Use of Estimates
The preparation of financial statements in conformity with U.S. GAAP requires management to make estimates and assumptions that affect the amounts reported in the financial statements and accompanying notes. Actual results may differ from those estimated.
Other
Under the Trust’s organizational documents, its officers and trustees are indemnified against certain liabilities arising out of the performance of their duties to the Trust. In the normal course of business, the Trust enters into contracts that provide indemnification to the other party or parties against potential costs or liabilities. The Trust’s maximum exposure under these arrangements is dependent on claims that may be made in the future and, therefore, cannot be estimated. The Trust has had no prior claims or losses pursuant to any such agreement.
2. Transactions with Affiliates
Management and InvestmentSub-Advisory Agreements
The Fund and the Manager are parties to a Management Agreement that obligates the Manager to provide the Fund with investment advisory and administrative services. As compensation for performing the duties under the Management Agreement, the Manager will receive an annualized management fee based on a percentage of the Fund’s average daily net assets that is calculated and accrued daily according to the following schedule:
First $5 billion | 0.35 | % | ||
Next $5 billion | 0.325 | % | ||
Next $10 billion | 0.30 | % | ||
Over $20 billion | 0.275 | % |
The Trust, on behalf of the Fund, and the Manager have entered into an Investment Advisory Agreement with Continuous Capital LLC (the“Sub-Advisor”) pursuant to which the Fund has agreed to pay an annualizedsub-advisory fee that is calculated and accrued daily based on the Fund’s average daily net assets according to the following schedule:
First $500 million | 0.525 | % | ||
Next $500 million | 0.50 | % | ||
Over $1 billion | 0.475 | % |
The Management andSub-Advisory Fees paid by the Fund for the period ended January 31, 2019 were as follows:
| Effective Fee Rate | Amount of Fees Paid | |||||||||||
Management Fees | 0.350 | % | $ | 1,215 | ||||||||
Sub-Advisor Fees | 0.525 | % | 1,822 | |||||||||
|
|
|
| |||||||||
Total | 0.875 | % | $ | 3,037 | ||||||||
|
|
|
| |||||||||
Distribution Plans
The Fund has adopted a “defensive” Distribution Plan (the “Plan”) in accordance with Rule12b-1 under the Act, pursuant to which no separate fees may be charged to the Fund for distribution purposes. However, the Plan authorizes the management fee received by the Manager and the investment advisors hired by the Manager to be used for distribution purposes. Under this Plan, the Fund does not intend to compensate the Manager or any other party, either directly or indirectly, for the distribution of Fund shares.
20
American Beacon Continuous Capital Emerging Markets FundSM
Notes to Financial Statements
January 31, 2019
Service Plans
The Manager and the Trust entered into a Service Plan that obligates the Manager to oversee additional
shareholder servicing of the Investor Class of the Fund. As compensation for performing the duties required under the Service Plans, the Manager receives an annualized fee up to 0.375% of the average daily net assets of the Investor Class of the Fund.
Sub-Transfer Agent Fees
The Manager has entered into agreements, which include servicing agreements, with financial intermediaries that provide recordkeeping, processing, shareholder communications and other services to customers of the intermediaries that hold positions in the Institutional and Y Classes of the Fund and has agreed to compensate the intermediaries for providing these services. Intermediaries transact with the Fund primarily through the use of omnibus accounts on behalf of its customers who hold positions in the Fund. Certain services would have been provided by the Fund’s transfer agent and other service providers if the shareholders’ accounts were maintained directly by the Fund’s transfer agent. Accordingly, the Fund, pursuant to Board approval, has agreed to reimburse the Manager for certainnon-distribution shareholder services provided by financial intermediaries for the Institutional and Y Classes. The reimbursement amounts(sub-transfer agent fees) paid to the Manager are subject to a fee limit of up to 0.10% of an intermediary’s average net assets in the Institutional and Y Classes on an annual basis. During the period ended January 31, 2019, the Funds did not have any sub-transfer agent fees.
Investments in Affiliated Funds
The Fund may invest in the American Beacon U.S. Government Money Market Select Fund (the “USG Select Fund”). Cash collateral received by the Fund in connection with securities lending may also be invested in the USG Select Fund. The Funds and the USG Select Fund have the same investment advisor and therefore, are considered to be affiliated. The Manager serves as investment advisor to the USG Select Fund and receives management fees and administrative fees totaling 0.10% of the average daily net assets of the USG Select Fund. During the period ended January 31, 2019, the Manager earned fees on the Fund’s direct investments in the USG Select Fund as shown below:
Fund | Direct Investments in USG Select Fund | |||
Continuous Capital Emerging Markets | $ | 36 | ||
Interfund Credit Facility
Pursuant to an exemptive order issued by the SEC, the Fund, along with other registered investment companies having management contracts with the Manager, may participate in a credit facility whereby each fund, under certain conditions, is permitted to lend money directly to and borrow directly from other participating funds for temporary purposes. The interfund credit facility is advantageous to the funds because it provides added liquidity, and eliminates the need to maintain higher cash balances to meet redemptions. This situation could arise when shareholder redemptions exceed anticipated volumes and certain funds have insufficient cash on hand to satisfy such redemptions or when sales of securities do not settle as expected, resulting in a cash shortfall for a fund. When a fund liquidates portfolio securities to meet redemption requests, they often do not receive payment in settlement for up to two days (or longer for certain foreign transactions). Redemption requests normally are satisfied on the next business day. The credit facility provides a source of immediate, short-term liquidity pending settlement of the sale of portfolio securities. The credit facility is administered by a credit facility team consisting of professionals from the Manager’s asset management, compliance, and accounting areas who report the activities of the credit facility to the Board. During the period ended January 31, 2019, the Fund did not utilize the credit facility.
21
American Beacon Continuous Capital Emerging Markets FundSM
Notes to Financial Statements
January 31, 2019
Expense Reimbursement Plan
The Manager contractually agreed to reduce fees and/or reimburse expenses for the classes of the Fund to the extent that total operating expenses exceed the Fund’s expense cap. During the period ended January 31, 2019, the Manager waived and/or reimbursed expenses as follows:
| Expense Cap | ||||||||||||||||||
Fund | Class | 12/17/2018 - 1/31/2019 | Reimbursed Expenses | (Recouped) Expenses | Expiration of Reimbursed Expenses | |||||||||||||
Continuous Capital Emerging Markets | Institutional | 1.15 | % | $ | 123,173 | $ | – | 2022 | ||||||||||
Continuous Capital Emerging Markets | Y | 1.25 | % | 6,363 | – | 2022 | ||||||||||||
Continuous Capital Emerging Markets | Investor | 1.53 | % | 4,801 | – | 2022 | ||||||||||||
Of these amounts, $74,144 was disclosed as a receivable from the Manager on the Statement of Assets and Liabilities at January 31, 2019.
The Fund has adopted an Expense Reimbursement Plan whereby the Manager may seek repayment of such fee reductions and expense reimbursements. Under the policy, the Manager can be reimbursed by the Fund for any contractual or voluntary fee reductions or expense reimbursements if reimbursement to the Manager (a) occurs within three years after the Manager’s own waiver or reimbursement and (b) does not cause the Fund’s annual operating expenses to exceed the lesser of the contractual percentage limit in effect at the time of the waiver/reimbursement or time of recoupment. The reimbursed expenses listed above will expire in 2022. The Fund did not record a liability for potential reimbursement due to the current assessment that a reimbursement is unlikely.
Concentration of Ownership
From time to time, the Fund may have a concentration of one or more accounts constituting a significant percentage of shares outstanding. Investment activities by holders of accounts that represent significant ownership of more than 5% of the Fund’s outstanding shares could have a material impact on the Fund. As of January 31, 2019, based on management’s evaluation of the shareholder account base, one account has been identified as representing an affiliated significant ownership of approximately 93% of the American Beacon Continuous Capital Emerging Markets Fund’s outstanding shares.
Trustee Fees and Expenses
As compensation for their service to the Trust, American Beacon Select Funds, American Beacon Institutional Funds Trust, American Beacon Sound Point Enhanced Income Fund, and American Beacon Apollo Total Return Fund, each Trustee receives an annual retainer of $120,000, plus $10,000 for each Board meeting attended in person or via teleconference, $2,500 for attendance by Committee members at meetings of the Audit Committee and the Investment Committee, and $1,500 for attendance by Committee members at meetings of the Nominating and Governance Committee, plus reimbursement of reasonable expenses incurred in attending Board meetings, Committee meetings, and relevant educational seminars. The Trustees also may be compensated for attendance at special Board and/or Committee meetings from time to time. The Board Chair receives an additional annual retainer of $50,000 as well as a $2,500 fee each quarter for attendance at the committee meetings. The Chairpersons of the Audit Committee and the Investment Committee each receive an additional annual retainer of $25,000 and the Chairman of the Nominating and Governance Committee receives an additional annual retainer of $10,000. These expenses are allocated on a prorated basis to each Fund of the Trusts according to its respective net assets.
22
American Beacon Continuous Capital Emerging Markets FundSM
Notes to Financial Statements
January 31, 2019
3. Security Valuation and Fair Value Measurements
The price of the Fund’s shares is based on its net asset value (“NAV”) per share. The Fund’s NAV is computed by adding total assets, subtracting all the Fund’s liabilities, and dividing the result by the total number of shares outstanding.
The NAV of each class of the Fund’s shares is determined based on a pro rata allocation of the Fund’s investment income, expenses and total capital gains and losses. The Fund’s NAV per share is determined each business day as of the regular close of trading on the New York Stock Exchange (“NYSE” or “Exchange”), which is typically 4:00 p.m. Eastern Time (“ET”). However, if trading on the NYSE closes at a time other than 4:00 p.m. ET, the Fund’s NAV per share typically would still be determined as of the regular close of trading on the NYSE. The Fund does not price its shares on days that the NYSE is closed. Foreign exchanges may permit trading in foreign securities on days when the Fund is not open for business, which may result in the value of the Fund’s portfolio investments being affected at a time when you are unable to buy or sell shares.
Equity securities, including shares ofclosed-end funds and exchange-traded funds (“ETFs”), are valued at the last sale price or official closing price taken from the primary exchange in which each security trades. Investments in other mutual funds are valued at the closing NAV per share on the day of valuation. Debt securities are valued at bid quotes from broker/dealers or evaluated bid prices from pricing services, who may consider a number of inputs and factors, such as prices of comparable securities, yield curves, spreads, credit ratings, coupon rates, maturity, default rates, and underlying collateral. Futures are valued based on their daily settlement prices. Exchange-traded andover-the-counter (“OTC”) options are valued at the last sale price. Options with no last sale for the day are priced at mid quote. Swaps are valued at evaluated mid prices from pricing services.
The valuation of securities traded on foreign markets and certain fixed income securities will generally be based on prices determined as of the earlier closing time of the markets on which they primarily trade unless a significant event has occurred. When the Fund holds securities or other assets that are denominated in a foreign currency, the Fund will normally use the currency exchange rates as of 4:00 p.m. ET.
Securities may be valued at fair value, as determined in good faith and pursuant to procedures approved by the Board, under certain limited circumstances. For example, fair value pricing will be used when market quotations are not readily available or reliable, as determined by the Manager, such as when (i) trading for a security is restricted or stopped; (ii) a security’s trading market is closed (other than customary closings); or (iii) a security has beende-listed from a national exchange. A security with limited market liquidity may require fair value pricing if the Manager determines that the available price does not reflect the security’s true market value. In addition, if a significant event that the Manager determines to affect the value of one or more securities held by the Fund occurs after the close of a related exchange but before the determination of the Fund’s NAV, fair value pricing may be used on the affected security or securities. Securities of small-capitalization companies are also more likely to require a fair value determination using these procedures because they are more thinly traded and less liquid than the securities of larger-capitalization companies. The Fund may fair value securities as a result of significant events occurring after the close of the foreign markets in which the Fund invests as described below. In addition, the Fund may invest in illiquid securities requiring these procedures.
The Fund may use fair value pricing for securities primarily traded innon-U.S. markets because most foreign markets close well before the Fund’s pricing time of 4:00 p.m. ET. The earlier close of these foreign markets gives rise to the possibility that significant events, including broad market moves, may have occurred in the interim and may materially affect the value of those securities. If the Manager determines that the last quoted prices ofnon-U.S. securities will, in its judgment, materially affect the value of some or all its portfolio securities, the Manager can adjust the previous closing prices to reflect what it believes to be the fair value of the securities as of the close of the Exchange. In deciding whether it is necessary to adjust closing prices to reflect fair value, the Manager reviews a variety of factors, including developments in foreign markets, the performance of U.S. securities markets, and the performance of instruments trading in U.S. markets that represent foreign securities
23
American Beacon Continuous Capital Emerging Markets FundSM
Notes to Financial Statements
January 31, 2019
and baskets of foreign securities. These securities are fair valued using a pricing service, using methods approved by the Board, that considers the correlation of the trading patterns of the foreign security to intraday trading in the U.S. markets, based on indices of domestic securities and other appropriate indicators such as prices of relevant American Depositary Receipts (“ADRs”) and futures contracts. The Valuation Committee, established by the Board, may also fair value securities in other situations, such as when a particular foreign market is closed but the Fund is open. The Fund uses outside pricing services to provide closing prices and information to evaluate and/or adjust those prices. As a means of evaluating its security valuation process, the Valuation Committee routinely compares closing prices, the next day’s opening prices in the same markets and adjusted prices.
Attempts to determine the fair value of securities introduce an element of subjectivity to the pricing of securities. As a result, the price of a security determined through fair valuation techniques may differ from the price quoted or published by other sources and may not accurately reflect the market value of the security when trading resumes. If a reliable market quotation becomes available for a security formerly valued through fair valuation techniques, the Manager compares the new market quotation to the fair value price to evaluate the effectiveness of the Fund’s fair valuation procedures. If any significant discrepancies are found, the Manager may adjust the Fund’s fair valuation procedures.
Valuation Inputs
Various inputs may be used to determine the fair value of the Fund’s investments. These inputs are summarized in three broad levels for financial statement purposes. The inputs or methodologies used to value securities are not necessarily an indication of the risk associated with investing in those securities.
| Level 1 | - | Quoted prices in active markets for identical securities. | ||
| Level 2 | - | Prices determined using other significant observable inputs. These may include quoted prices for similar securities, interest rates, prepayment speeds, credit risk, and others. | ||
| Level 3 | - | Prices determined using other significant unobservable inputs. Unobservable inputs reflect the Fund’s own assumptions about the factors market participants would use in pricing an investment. | ||
Level 1 and Level 2 trading assets and trading liabilities, at fair value
Common stocks, ETFs, and financial derivative instruments, such as futures contracts or options that are that are traded on a national securities exchange, are stated at the last reported sale or settlement price on the day of valuation. To the extent these securities are actively traded and valuation adjustments are not applied, they are categorized as Level 1 of the fair value hierarchy. Preferred securities and other equities traded on inactive markets or valued by reference to similar instruments are generally categorized as Level 2 of the fair value hierarchy.
Investments in registeredopen-end investment management companies will be valued based upon the NAVs of such investments and are categorized as Level 1 of the fair value hierarchy.
4. Securities and Other Investments
American Depositary Receipts, Global Depositary Receipts, and Non-Voting Depositary Receipts
ADRs are depositary receipts for foreign issuers in registered form traded in U.S. securities markets. Global Depositary Receipts (“GDRs”) are in bearer form and traded in both the U.S. and European securities markets. Non-Voting Depositary Receipts (“NVDRs”) represent financial interests in an issuer but the holder is not entitled to any voting rights. Depositary receipts may not be denominated in the same currency as the securities into which they may be converted. Investing in depositary receipts entails substantially the same risks as direct investment in foreign securities. There is generally less publicly available information about foreign companies and there may be
24
American Beacon Continuous Capital Emerging Markets FundSM
Notes to Financial Statements
January 31, 2019
less governmental regulation and supervision of foreign stock exchanges, brokers and listed companies. In addition, such companies may use different accounting and financial standards (and certain currencies may become unavailable for transfer from a foreign currency), resulting in the Fund’s possible inability to convert immediately into U.S. currency proceeds realized upon the sale of portfolio securities of the affected foreign companies. In addition, the Fund may invest in unsponsored depositary receipts, the issuers of which are not obligated to disclose material information about the underlying securities to investors in the United States. Ownership of unsponsored depositary receipts may not entitle the Fund to the same benefits and rights as ownership of a sponsored depositary receipt or the underlying security.
Common Stock
Common stock generally takes the form of shares in a corporation which represent an ownership interest. It ranks below preferred stock and debt securities in claims for dividends and for assets of the company in a liquidation or bankruptcy. The value of a company’s common stock may fall as a result of factors directly relating to that company, such as decisions made by its management or decreased demand for the company’s products or services. A stock’s value may also decline because of factors affecting not just the company, but also companies in the same industry or sector. The price of a company’s stock may also be affected by changes in financial markets that are relatively unrelated to the company, such as changes in interest rates, currency exchange rates or industry regulation. Companies that elect to pay dividends on their common stock generally only do so after they invest in their own business and make required payments to bondholders and on other debt and preferred stock. Therefore, the value of a company’s common stock will usually be more volatile than its bonds, other debt and preferred stock. Common stock may be exchange-traded or OTC. OTC stock may be less liquid than exchange-traded stock.
Foreign Securities
The Fund may invest in U.S. dollar-denominated andnon-U.S. dollar denominated equity and debt securities of foreign issuers and foreign branches of U.S. banks, including negotiable certificates of deposit (“CDs”), bankers’ acceptances, and commercial paper. Foreign issuers are issuers organized and doing business principally outside the United States and include corporations, banks,non-U.S. governments, and quasi-governmental organizations. While investments in foreign securities may be intended to reduce risk by providing further diversification, such investments involve sovereign and other risks, in addition to the credit and market risks normally associated with domestic securities. These additional risks include the possibility of adverse political and economic developments (including political or social instability, nationalization, expropriation, or confiscatory taxation); the potentially adverse effects of unavailability of public information regarding issuers, different governmental supervision and regulation of financial markets, reduced liquidity of certain financial markets, and the lack of uniform accounting, auditing, and financial reporting standards or the application of standards that are different or less stringent than those applied in the United States; different laws and customs governing securities tracking; and possibly limited access to the courts to enforce the Funds’ rights as an investor.
Illiquid and Restricted Securities
The Fund may invest in securities that are subject to legal or contractual restrictions on resale. These securities may be sold privately, but are required to be registered or exempted from such registration before being sold to the public. Private placement securities are generally considered to be restricted except for those securities traded between qualified institutional investors under the provisions of Rule 144A of the Securities Act of 1933 (the “Securities Act”). Illiquid securities have included securities that have not been registered under the Securities Act, securities that are otherwise not readily marketable, and repurchase agreements having a remaining maturity of longer than seven calendar days. Disposal of both illiquid and restricted securities may involve time-consuming negotiations and expenses, and prompt sale at an acceptable price may be difficult to achieve. Restricted securities outstanding during the period ended January 31, 2019 are disclosed in the Notes to the Schedule of Investments.
25
American Beacon Continuous Capital Emerging Markets FundSM
Notes to Financial Statements
January 31, 2019
Regulation S under the Securities Act permits the sale abroad of securities that are not registered for sale in the United States and includes a provision for U.S. investors, such as the Fund, to purchase such unregistered securities if certain conditions are met.
Preferred Stock
A preferred stock blends the characteristics of a bond and common stock. It can offer the higher yield of a bond and has priority over common stock in equity ownership, but does not have the seniority of a bond and its participation in the issuer’s growth may be limited. Preferred stock generally has preference over common stock in the receipt of dividends and in any residual assets after payment to creditors should the issuer be dissolved. Although the dividend is set at a fixed or variable rate, in some circumstances it can be changed or omitted by the issuer. Preferred stocks are subject to the risks associated with other types of equity securities, as well as additional risks, such as credit risk, interest rate risk, potentially greater volatility and risks related to deferral,non-cumulative dividends, subordination, liquidity, limited voting rights, and special redemption rights.
Other Investment Company Securities and Other Exchange-Traded Products
The Fund may invest in shares of other investment companies, includingopen-end funds,closed-end funds, ETFs, unit investment trusts, and other investment companies of the Trust. The Fund may invest in investment company securities advised by the Manager or asub-advisor. Investments in the securities of other investment companies may involve duplication of advisory fees and certain other expenses. By investing in another investment company, the Fund becomes a shareholder of that investment company. As a result, the Fund’s shareholders indirectly will bear the Fund’s proportionate share of the fees and expenses paid by shareholders of the other investment company, in addition to the fees and expenses the Fund’s shareholders directly bear in connection with the Fund’s own operations. These other fees and expenses are reflected as Acquired Fund Fees and Expenses and are included in the Fees and Expenses Table for the Fund in the Prospectus, if applicable. Investments in other investment companies may involve the payment of substantial premiums above the value of such issuer’s portfolio securities.
5. Principal Risks
Investing in the Fund may involve certain risks including, but not limited to, those described below.
Currency Risk
The Fund may have exposure to foreign currencies by making direct investments innon-U.S. currencies, in securities denominated innon-U.S. currencies or by purchasing or selling forward foreign currency exchange contracts innon-U.S. currencies. Foreign currencies will fluctuate, and may decline in value relative to the U.S. dollar and other currencies and thereby affect the Fund’s investments in foreign(non-U.S.) currencies or in securities that traded in, and receive revenues in, or in derivatives that provide exposure to, foreign(non-U.S.) currencies.
Emerging Markets Risk
When investing in emerging markets, the risks of investing in foreign securities are heightened. Emerging markets are generally smaller, less developed, less liquid and more volatile than the securities markets of the U.S. and other developed markets. There are also risks of: greater political uncertainties; an economy’s dependence on revenues from particular commodities or on international aid or development assistance; currency transfer restrictions; a limited number of potential buyers for such securities; and delays and disruptions in securities settlement procedures.
26
American Beacon Continuous Capital Emerging Markets FundSM
Notes to Financial Statements
January 31, 2019
Equity Investments Risk
Equity securities are subject to market risk. The Fund’s investments in equity securities may include common stocks, preferred stocks, securities convertible into or exchangeable for common stocks, REITs, depositary receipts, and U.S. dollar-denominated foreign stocks traded on U.S. exchanges. Such investments may expose the Fund to additional risk. The value of a company’s common stock may fall as a result of factors affecting the company, companies in the same industry or sector, or the financial markets overall. Common stock generally is subordinate to preferred stock upon the liquidation or bankruptcy of the issuing company. Preferred stocks and convertible securities are sensitive to movements in interest rates. Preferred stocks may be less liquid than common stocks and, unlike common stocks, participation in the growth of an issuer may be limited. Distributions on preferred stocks generally are payable at the discretion of an issuer and after required payments to bond holders. Convertible securities are subject to the risk that the credit standing of the issuer may have an effect on the convertible securities’ investment value. Investments in REITs are subject to the risks associated with investing in the real estate industry such as adverse developments affecting the real estate industry and real property values. Depositary receipts and U.S. dollar-denominated foreign stocks traded on U.S. exchanges are subject to certain of the risks associated with investing directly in foreign securities, including, but not limited to, currency fluctuations and political and financial instability in the home country of a particular depositary receipt or foreign stock.
Foreign Investing Risk
Non-U.S. investments carry potential risks not associated with U.S. investments. Such risks include, but are not limited to: (1) currency exchange rate fluctuations, (2) political and financial instability, (3) less liquidity and greater volatility, (4) lack of uniform accounting, auditing and financial reporting standards, (5) increased price volatility, (6) less government regulation and supervision of foreign stock exchanges, brokers and listed companies, and (7) delays in transaction settlement in some foreign markets.
The risk of investing in Europe may be heightened due to the 2016 referendum in which the United Kingdom voted to exit the European Union (EU). There is a significant degree of uncertainty about how negotiations relating to the United Kingdom’s withdrawal will be conducted, as well as the potential consequences and precise time frame for “Brexit.” In March 2017, the United Kingdom formally notified the European Council that it intends to withdraw from the EU by invoking Article 50 of the Lisbon Treaty, which triggered a two-year period of negotiation on the terms of Brexit. While it is not possible to determine the precise impact these events may have on the Fund, during this period and beyond, the impact on the United Kingdom and European economies and the broader global economy could be significant, resulting in negative impacts, such as increased volatility and illiquidity, and potentially lower economic growth, on markets in the United Kingdom, Europe and globally, which may adversely affect the value of the Fund’s investments. In addition, if one or more other countries were to exit the EU or abandon the use of the euro as a currency, the value of investments tied to those countries or the euro could decline significantly and unpredictably.
Investment Risk
An investment in the Fund is not a deposit with a bank and is not insured or guaranteed by the Federal Deposit Insurance Corporation or any other government agency. When you sell your shares of the Fund, they could be worth less than what you paid for them. Therefore, you may lose money by investing in the Fund.
Market Risk
Since the financial crisis that started in 2008, the U.S. and many foreign economies continue to experience its after-effects. Conditions in the U.S. and many foreign economies have resulted, and may continue to result, in certain instruments experiencing unusual liquidity issues, increased price volatility and, in some cases, credit downgrades and increased likelihood of default. These events have reduced the willingness and ability of some lenders to extend credit, and have made it more difficult for some borrowers to obtain financing on attractive
27
American Beacon Continuous Capital Emerging Markets FundSM
Notes to Financial Statements
January 31, 2019
terms, if at all. In some cases, traditional market participants have been less willing to make a market in some types of debt instruments, which has affected the liquidity of those instruments. During times of market turmoil, investors tend to look to the safety of securities issued or backed by the U.S. Treasury, causing the prices of these securities to rise and the yields to decline. Reduced liquidity in fixed income and credit markets may negatively affect many issuers worldwide. In addition, global economies and financial markets are becoming increasingly interconnected, which increases the possibilities that conditions in one country or region might adversely impact issuers in a different country or region. A rise in protectionist trade policies, and the possibility of changes to some international trade agreements, could affect the economies of many nations in ways that cannot necessarily be foreseen at the present time.
In response to the financial crisis, the U.S. and other governments and the Federal Reserve and certain foreign central banks have taken steps to support financial markets. In some countries where economic conditions are recovering, they are nevertheless perceived as still fragile. Withdrawal of government support, failure of efforts in response to the crisis, or investor perception that such efforts are not succeeding, could adversely impact the value and liquidity of certain securities. The severity or duration of adverse economic conditions may also be affected by policy changes made by governments or quasi-governmental organizations, including changes in tax laws. The impact of new financial regulation legislation on the markets and the practical implications for market participants may not be fully known for some time. Regulatory changes are causing some financial services companies to exit long-standing lines of business, resulting in dislocations for other market participants. In addition, political and diplomatic events within the U.S. and abroad, such as the U.S. government’s inability at times to agree on a long-term budget and deficit reduction plan, the threat of a federal government shutdown and threats not to increase the federal government’s debt limit, may affect investor and consumer confidence and may adversely impact financial markets and the broader economy, perhaps suddenly and to a significant degree. The U.S. government has recently reduced federal corporate income tax rates, and future legislative, regulatory and policy changes may result in more restrictions on international trade, less stringent prudential regulation of certain players in the financial markets, and significant new investments in infrastructure and national defense. Markets may react strongly to expectations about the changes in these policies, which could increase volatility, especially if the markets’ expectations for changes in government policies are not borne out.
Changes in market conditions will not have the same impact on all types of securities. Interest rates have been unusually low in recent years in the U.S. and abroad. Because there is little precedent for this situation, it is difficult to predict the impact of a significant rate increase on various markets. For example, because investors may buy securities or other investments with borrowed money, a significant increase in interest rates may cause a decline in the markets for those investments. Because of the sharp decline in the worldwide price of oil, there is a concern that oil producing nations may withdraw significant assets now held in U.S. Treasuries, which could force a substantial increase in interest rates. Regulators have expressed concern that rate increases may cause investors to sell fixed income securities faster than the market can absorb them, contributing to price volatility. In addition, there is a risk that the prices of goods and services in the U.S. and many foreign economies may decline over time, known as deflation (the opposite of inflation). Deflation may have an adverse effect on stock prices and creditworthiness and may make defaults on debt more likely. If a country’s economy slips into a deflationary pattern, it could last for a prolonged period and may be difficult to reverse. The precise details and the resulting impact of the United Kingdom’s vote to leave the EU, commonly referred to as “Brexit,” are not yet known. The effect on the United Kingdom’s economy will likely depend on the nature of trade relations with the EU and other major economies following its exit, which are matters to be negotiated. The outcomes may cause increased volatility and have a significant adverse impact on world financial markets, other international trade agreements, and the United Kingdom and European economies, as well as the broader global economy for some time, which could significantly adversely affect the value of the Fund’s investments in the United Kingdom and Europe.
Market Timing Risk
Frequent trading by Fund shareholders poses risks to other shareholders in that Fund, including (i) the dilution of the Fund’s NAV, (ii) an increase in the Fund’s expenses, and (iii) interference with the portfolio
28
American Beacon Continuous Capital Emerging Markets FundSM
Notes to Financial Statements
January 31, 2019
manager’s ability to execute efficient investment strategies. Because of specific types of securities in which the Fund may invest, it could be subject to the risk of market timing activities by shareholders.
Other Investment Companies Risk
The Fund may invest in shares of other registered investment companies, including ETFs and money market funds that are advised by the Manager. To the extent that the Fund invests in shares of other registered investment companies, the Fund will indirectly bear the fees and expenses charged by those investment companies in addition to the Fund’s direct fees and expenses and will be subject to the risks associated with investments in those companies. For example, ETF shares may trade at a premium or discount to their net asset value. An ETF that tracks an index may not precisely replicate the returns of its benchmark index.
Valuation Risk
The Fund may value certain assets at a price different from the price at which they can be sold. This risk may be especially pronounced for investments, such as certain derivatives, which may be illiquid or which may become illiquid.
6. Federal Income and Excise Taxes
It is the policy of each Fund to qualify as a regulated investment company (“RIC”), by complying with all applicable provisions of Subchapter M of the Internal Revenue Code, as amended, and to make distributions of taxable income sufficient to relieve it from substantially all federal income and excise taxes. For federal income tax purposes, each Fund is treated as a single entity for the purpose of determining such qualification.
The Fund does not have any unrecorded tax liabilities in the accompanying financial statements. The period ended January 31, 2019 remains subject to examination by the Internal Revenue Service. If applicable, the Fund recognizes interest accrued related to unrecognized tax benefits in interest expense and penalties in “Other expenses” on the Statement of Operations.
The Fund may be subject to taxes imposed by countries in which it invests. Such taxes are generally based on returns of income earned or gains realized or repatriated. Taxes are accrued and applied to net investment income, net realized capital gains and net unrealized appreciation (depreciation), as applicable, as the income is earned or capital gains are recorded.
Dividends are categorized in accordance with income tax regulations which may treat certain transactions differently than U.S. GAAP. Accordingly, the character of distributions and composition of net assets for tax purposes may differ from those reflected in the accompanying financial statements. The Fund also utilize earnings and profits distributed to shareholders on redemptions of shares as part of the dividends paid deduction.
The Fund did not pay any distributions during the period ended January 31, 2019.
As of January 31, 2019, the components of distributable earnings (deficits) on a tax basis were as follows:
Fund | Tax Cost | Unrealized Appreciation | Unrealized (Depreciation) | Net Unrealized Appreciation (Depreciation) | ||||||||||||||||||||||||
| Continuous Capital Emerging Markets | $ | 3,092,241 | $ | 231,909 | $ | (14,538 | ) | $ | 217,371 | |||||||||||||||||||
Fund | Net Unrealized Appreciation (Depreciation) | Undistributed Ordinary Income | Undistributed Long-Term Capital Gains | Accumulated Capital and Other (Losses) | Other Temporary Differences | Distributable Earnings | ||||||||||||||||||||||||||||||||||||||
| Continuous Capital Emerging Markets | $ | 217,371 | $ | 26,713 | $ | – | $ | – | $ | – | $ | 244,084 | ||||||||||||||||||||||||||||||||
29
American Beacon Continuous Capital Emerging Markets FundSM
Notes to Financial Statements
January 31, 2019
Financial reporting records are adjusted for permanent book/tax differences to reflect tax character. Financial records are not adjusted for temporary differences. The temporary differences between financial reporting andtax-basis reporting of unrealized appreciation (depreciation) are attributable primarily to the tax deferral of losses from wash sales and the realization for tax purposes of unrealized gains (losses) on investments in passive foreign investment companies.
Due to inherent differences in the recognition of income, expenses, and realized gains (losses) under U.S. GAAP and federal income tax regulations, permanent differences between book and tax reporting have been identified and appropriately reclassified on the Statement of Assets and Liabilities.
Accordingly, the following amounts represent current year permanent differences as of January 31, 2019:
Fund | Paid-In-Capital | Distributable Earnings/(Deficits) | ||||||||||
| Continuous Capital Emerging Markets | $ | – | $ | – | ||||||||
Under the Regulated Investment Company Modernization Act of 2010 (“RIC MOD”), net capital losses recognized by the Funds in taxable years beginning after December 22, 2010 are carried forward indefinitely and retain their character as short-term and/or long-term losses.
As of January 31, 2019, the Fund did not have any capital loss carryforwards.
7. Investment Transactions
The aggregate cost of purchases and proceeds from sales and maturities of investments, other than short-term obligations, for the period ended January 31, 2019 were as follows:
Fund | Purchases (non-U.S. Government Securities) | Sales (non-U.S. Government Securities) | ||||||||||
| Continuous Capital Emerging Markets | $ | 3,425,350 | $ | 480,147 | ||||||||
A summary of the Fund’s transactions in the USG Select Fund for the period ended January 31, 2019 were as follows:
Fund | Type of Transaction | December 17, 2018 Shares/Fair Value | Purchases | Sales | January 31, 2019 Shares/Fair Value | Dividend Income | ||||||||||||||||||||||||||||||||||||||
| Continuous Capital Emerging Markets | Direct | $ | - | $ | 2,393,431 | $ | 2,275,131 | $ | 118,300 | $ | 784 | |||||||||||||||||||||||||||||||||
8. Borrowing Arrangements
Effective November 15, 2018 (the “Effective Date”), the Fund, along with certain other funds managed by the Manager (“Participating Funds”), entered into a committed revolving line of credit (the “Committed Line”) agreement with State Street Bank and Trust Company (the “Bank”) to be used to facilitate portfolio liquidity. The maximum borrowing amount under the Committed Line is $250 million with interest at a rate equal to the higher of(a) one-month London Inter-Bank Offered Rate (“LIBOR”) plus 1.25% per annum or (b) the Federal Funds rate plus 1.25% per annum on amounts borrowed. Each of the Participating Funds will pay a closing fee of $100,000 on the Effective Date and a quarterly commitment fee at a rate of 0.25% per annum on the unused portion of the Committed Line amount. The Committed Line expires November 14, 2019, unless extended by the Bank or terminated by the Participating Funds in accordance with the agreement.
30
American Beacon Continuous Capital Emerging Markets FundSM
Notes to Financial Statements
January 31, 2019
On the Effective Date, the Fund, along with certain other Participating Funds managed by the Manager, also entered into an uncommitted discretionary demand revolving line of credit (the “Uncommitted Line”) agreement with the Bank to be used to facilitate portfolio liquidity. The maximum borrowing amount under the Uncommitted Line is $50 million with interest at a rate equal to the higher of(a) one-month LIBOR plus 1.25% per annum or (b) the Federal Funds rate plus 1.25% per annum on each outstanding loan. Each of the Participating Funds will pay a closing fee of $35,000 on the Effective Date. The Uncommitted Line expires November 14, 2019 unless extended by the Bank or terminated by the Participating Funds in accordance with the agreement.
The Participating Fund paid administration, legal and arrangement fees, which are recognized as a component of “Other expenses” on the Statement of Operations, along with commitment fees, that have been allocated among the Participating Funds based on average daily net assets.
During the period ended January 31, 2019, the Fund did not utilize this facility.
9. Capital Share Transactions
The tables below summarize the activity in capital shares for each Class of the Fund:
| Institutional Class | ||||||||||||
| December 17, 2018A to January 31, 2019 | ||||||||||||
Continuous Capital Emerging Markets Fund | Shares | Amount | ||||||||||
| Shares sold | 140 | B | $ | - | B | |||||||
|
|
|
| |||||||||
| Net increase in shares outstanding | 140 | $ | - | |||||||||
|
|
|
| |||||||||
| Y Class | ||||||||||||
| December 17, 2018A to January 31, 2019 | ||||||||||||
Continuous Capital Emerging Markets Fund | Shares | Amount | ||||||||||
| Shares sold | 18,956 | B | $ | 199,985 | B | |||||||
|
|
|
| |||||||||
| Net increase in shares outstanding | 18,956 | $ | 199,985 | |||||||||
|
|
|
| |||||||||
| Investor Class | ||||||||||||
| December 17, 2018A to January 31, 2019 | ||||||||||||
Continuous Capital Emerging Markets Fund | Shares | Amount | ||||||||||
| Shares sold | 798 | B | $ | 8,477 | B | |||||||
|
|
|
| |||||||||
| Net increase in shares outstanding | 798 | $ | 8,477 | |||||||||
|
|
|
| |||||||||
A Commencement of operations.
B Total seed capital was received in the amounts of $2,600,000, $100,000, and $100,000 for the Institutional, Y, and Investor Classes, respectively. As a result, shares were issued in the total amounts of 260,000, 10,000, and 10,000 for Institutional, Y, and Investor Classes, respectively.
10. Subsequent Events
Management has evaluated subsequent events for possible recognition or disclosure in the financial statements through the date the financial statements are issued. Management has determined that there are no material events that would require disclosure in the Fund’s financial statements through this date.
31
American Beacon Continuous Capital Emerging Markets FundSM
Financial Highlights
(For a share outstanding throughout the period)
| Institutional Class | ||||
| December 17, 2018A to January 31, 2019 | ||||
Net asset value, beginning of period | $ | 10.00 | ||
|
| |||
Income (loss) from investment operations: | ||||
Net investment income | 0.01 | F | ||
Net gains on investments (both realized and unrealized) | 0.84 | |||
|
| |||
Total income (loss) from investment operations | 0.85 | |||
|
| |||
Dividends from net investment income | – | |||
Distributions from net realized gains | – | |||
|
| |||
Net asset value, end of period | $ | 10.85 | ||
|
| |||
Total returnB | 8.50 | %C | ||
|
| |||
Ratios and supplemental data: |
| |||
Net assets, end of period | $ | 2,821,409 | ||
Ratios to average net assets: | ||||
Expenses, before reimbursements | 39.68 | %D | ||
Expenses, net of reimbursements | 1.15 | %D | ||
Net investment (loss), before expense reimbursements | (37.54 | )%D | ||
Net investment income, net of reimbursements | 0.99 | %D | ||
Portfolio turnover rate | 24 | %E | ||
| A | Commencement of operations. |
| B | Based on net asset value, which does not reflect the sales charge, redemption fee, or contingent deferred sales charge, if applicable. May include adjustments in accordance with U.S. GAAP and as such, the net asset value for reporting purposes and the returns based upon those net asset values may differ from the net asset value and returns for shareholder transactions. |
| C | Not annualized. |
| D | Annualized. |
| E | Portfolio turnover rate is for the period from December 17, 2018 through January 31, 2019 and is not annualized. |
| F | Net investment income includes a significant dividend payment from Gazprom Neft PJSC, ADR and iShares Core MSCI Emerging Markets ETF amounting to $0.0057. |
See accompanying notes
32
American Beacon Continuous Capital Emerging Markets FundSM
Financial Highlights
(For a share outstanding throughout the period)
| Y Class | ||||
| December 17, 2018A to January 31, 2019 | ||||
Net asset value, beginning of period | $ | 10.00 | ||
|
| |||
Income (loss) from investment operations: | ||||
Net investment income | 0.01 | F | ||
Net gains on investments (both realized and unrealized) | 0.84 | |||
|
| |||
Total income (loss) from investment operations | 0.85 | |||
|
| |||
Dividends from net investment income | – | |||
Distributions from net realized gains | – | |||
|
| |||
Redemption fees added to beneficial interests | – | |||
|
| |||
Net asset value, end of period | $ | 10.85 | ||
|
| |||
Total returnB | 8.50 | %C | ||
|
| |||
Ratios and supplemental data: | ||||
Net assets, end of period | $ | 314,086 | ||
Ratios to average net assets: | ||||
Expenses, before reimbursements | 44.25 | %D | ||
Expenses, net of reimbursements | 1.25 | %D | ||
Net investment (loss), before expense reimbursements | (41.28 | )%D | ||
Net investment income, net of reimbursements | 1.72 | %D | ||
Portfolio turnover rate | 24 | %E | ||
| A | Commencement of operations. |
| B | Based on net asset value, which does not reflect the sales charge, redemption fee, or contingent deferred sales charge, if applicable. May include adjustments in accordance with U.S. GAAP and as such, the net asset value for reporting purposes and the returns based upon those net asset values may differ from the net asset value and returns for shareholder transactions. |
| C | Not annualized. |
| D | Annualized. |
| E | Portfolio turnover rate is for the period from December 17, 2018 through January 31, 2019 and is not annualized. |
| F | Net investment income includes a significant dividend payment from Gazprom Neft PJSC, ADR and iShares Core MSCI Emerging Markets ETF amounting to $0.0031. |
See accompanying notes
33
American Beacon Continuous Capital Emerging Markets FundSM
Financial Highlights
(For a share outstanding throughout the period)
| Investor Class | ||||
| December 17, 2018A to January 31, 2019 | ||||
Net asset value, beginning of period | $ | 10.00 | ||
|
| |||
Income (loss) from investment operations: | ||||
Net investment income | 0.01 | F | ||
Net gains on investments (both realized and unrealized) | 0.83 | |||
|
| |||
Total income (loss) from investment operations | 0.84 | |||
|
| |||
Dividends from net investment income | – | |||
Distributions from net realized gains | – | |||
|
| |||
Net asset value, end of period | $ | 10.84 | ||
|
| |||
Total returnB | 8.40 | %C | ||
|
| |||
Ratios and supplemental data: |
| |||
Net assets, end of period | $ | 117,051 | ||
Ratios to average net assets: | ||||
Expenses, before reimbursements | 39.63 | %D | ||
Expenses, net of reimbursements | 1.53 | %D | ||
Net investment (loss), before expense reimbursements | (37.17 | )%D | ||
Net investment income, net of reimbursements | 0.93 | %D | ||
Portfolio turnover rate | 24 | %E | ||
| A | Commencement of operations. |
| B | Based on net asset value, which does not reflect the sales charge, redemption fee, or contingent deferred sales charge, if applicable. May include adjustments in accordance with U.S. GAAP and as such, the net asset value for reporting purposes and the returns based upon those net asset values may differ from the net asset value and returns for shareholder transactions. |
| C | Not annualized. |
| D | Annualized. |
| E | Portfolio turnover rate is for the period from December 17, 2018 through January 31, 2019 and is not annualized. |
| F | Net investment income includes a significant dividend payment from Gazprom Neft PJSC, ADR and iShares Core MSCI Emerging Markets ETF amounting to $0.0010. |
See accompanying notes
34
American Beacon Continuous Capital Emerging Markets FundSM
Federal Tax Information
January 31, 2017 (Unaudited)
Certain tax information regarding the Fund is required to be provided to shareholders based upon the Fund’s income and distributions for the taxable year ended January 31, 2019. The information and distributions reported herein may differ from information and distributions taxable to the shareholders for the calendar year ended December 31, 2018.
For the year ended January 31, 2019, the Fund made no distributions.
Shareholders received notification in January 2019 of the applicable tax information necessary to prepare their 2018 income tax returns.
35
Disclosure Regarding Approval of the Management and Investment Advisory Agreements(Unaudited)
Approvals Related to American Beacon Continuous Capital Emerging Markets Fund
At its August21-22, 2018 meetings, the Board of Trustees (“Board”) considered: (1) the approval of the Management Agreement between American Beacon Advisors, Inc. (“Manager”) and the American Beacon Funds (“Trust”), on behalf of the American Beacon Continuous Capital Emerging Markets Fund (“Fund”), a newly created series of the Trust, and (2) the approval of a new investment advisory agreement (the “Advisory Agreement”) among the Manager, the Trust, on behalf of the Fund, and Continuous Capital, LLC (the “Subadviser”), the Fund’s proposed subadviser.
Approval of the Management Agreement
Prior to the meeting, information was provided to the Board by the Manager in response to requests from the Board in connection with the Board’s consideration of the Management Agreement for the Fund. The Investment Committee of the Board also met with representatives of the Manager. The Board also considered information that had been provided by the Manager to the Board at the May 18, 2018 and June5-6, 2018 Board meetings in connection with the review of the current Management Agreement between the Manager and the Trust as it related to the existing series of the Trust (“Existing Funds”).
Provided below is an overview of the primary factors the Board considered at its August21-22, 2018 meetings at which the Board considered the approval of the Management Agreement with respect to the Fund. In determining whether to approve the Management Agreement, the Board considered, among other things, the following factors with respect to the Fund: (1) the nature and quality of the services to be provided; (2) the estimated costs to be incurred by the Manager in rendering its services to the Fund and the resulting profits or losses; (3) the extent to which economies of scale, if any, have been taken into account in setting the fee schedule; (4) whether fee levels reflect economies of scale, if any, for the benefit of investors; (5) comparisons of services and fees with contracts entered into by the Manager with the Existing Funds; and (6) any other benefits derived or anticipated to be derived by the Manager from its relationship with the Fund.
The Board did not identify any particular information that was most relevant to its consideration of the Management Agreement, and each Trustee may have afforded different weight to the various factors. Legal counsel to the Independent Trustees provided the Board with a memorandum regarding its responsibilities pertaining to the approval of investment advisory contracts, such as the Management Agreement. The memorandum explained the regulatory requirements surrounding the Trustees’ process for evaluating investment advisors and the terms of investment advisory contracts. Based on its evaluation, the Board unanimously concluded that the terms of the Management Agreement were reasonable and fair and that the approval of the Management Agreement was in the best interests of the Fund.
Nature, Extent and Quality of Services. The Board considered that it had reviewed the Management Agreement between the Manager and the Trust as it relates to the Existing Funds at its May 18, 2018 and June5-6, 2018 meetings. At those meetings, the Board received detailed information regarding the Manager, including information with respect to the scope of services provided by the Manager to the Existing Funds and the background and experience of the Manager’s key investment personnel. The Board also considered representations made by the Manager at the Board’s May 18, 2018 and June5-6, 2018 meetings. At those meetings, the Manager described its disciplined investment approach and goal to provide above average long-term performance on behalf of the Existing Funds and detailed the culture of compliance and support that reduces risks to the Existing Funds. The Board considered the Manager’s representation that the advisory, administrative and related services proposed to be provided to the Fund will be consistent with the services provided to the Existing Funds that have a single investment subadviser. In addition, the Board considered the background and experience of key investment personnel who will have primary responsibility for theday-to-day oversight of the Fund. Based on the foregoing information, the Board concluded that the nature, extent and quality of the services to be provided by the Manager were appropriate for the Fund.
36
Disclosure Regarding Approval of the Management and Investment Advisory Agreements(Unaudited)
Investment Performance. The Board considered that the Fund is new and, therefore, had no historical performance for the Board to review with respect to the Manager. The Board also considered that it would review the historical investment performance record relevant to the Fund’s investment professionals in connection with its consideration of the Advisory Agreement.
Costs of the Services Provided to the Fund and the Profits or Losses to be Realized by the Manager from its Relationship with the Fund. In analyzing the cost of services and profitability of the Manager, the Board considered the estimated revenues to be earned and the expenses to be incurred by the Manager with respect to the Fund. The Board also considered that the Manager will receive certain fees related to securities lending, to the extent the Fund engages in securities lending activities. The Board then considered that, at assumed estimated initial asset levels, the Manager was projected to incur apre-tax loss before and after distribution revenues and expenses from its first year of rendering services to the Fund. The Board also considered the amounts of those projected losses. The Board considered the Manager’s explanation regarding its cost allocation methodology in calculating these projections.
Comparisons of the amounts to be paid to the Manager under the Management Agreement and other funds in the Select Peer Group. In evaluating the Management Agreement, the Board reviewed the Manager’s proposed management fee schedule. The Board considered a comparison of the management fee rate to be charged by the Manager under the Management Agreement versus the fee rates charged by the Manager to comparable funds. The Board considered the Manager’s representation that the management fee rate proposed by the Manager for the Fund is lower than the average advisory fee rate paid by peer group funds in the Fund’s potential Morningstar, Inc. (“Morningstar”) category (the “Select Peer Group”), both on a standalone basis and when combined with the proposed advisory fee rate to be paid to the Subadviser. The Board also considered that the Fund’s total expense ratio is expected to be higher than the median of the Select Peer Group with respect to each share class. The Board considered that the Manager had contractually agreed to limit the Fund’s total expenses through at least May 31, 2020, at competitive market levels, which are below industry averages with respect to the Institutional Class and higher than industry averages with respect to the Y Class and the Investor Class. This information assisted the Board in concluding that the management fee rate appeared to be within a reasonable range for the services to be provided to the Fund, in light of all the factors considered.
Economies of Scale. The Board considered the Manager’s representation that the proposed management fee rate for the Fund contains breakpoints, which the Manager believes properly reflect economies of scale for the benefit of the Fund’s shareholders.
Benefits Derived from the Relationship with the Fund. The Board considered the Manager’s representation that it has not identified any material indirect“fall-out” benefits that may accrue to it or its affiliates because of its proposed relationship with the Fund, except that the Manager will benefit from the Fund’s investment of its cash sweep accounts and securities lending collateral in the American Beacon U.S. Government Money Market Select Fund, a series of the American Beacon Select Funds. The Board also considered the Manager’s representation that its parent company has an ownership interest in the Fund’s proposed subadviser, and that the Manager may benefit to the extent that the subadviser’s growth contributes to the growth of the Manager’s parent company. Based on the foregoing information, the Board concluded that the potential benefits accruing to the Manager by virtue of its relationship with the Fund appear to be fair and reasonable.
Board’s Conclusion. Based on the various considerations described above, the Board, including a majority of Trustees who are not “interested persons” of the Fund or the Manager, as that term is defined in the Investment Company Act of 1940, as amended (“1940 Act”): (1) concluded that the proposed management fee is fair and reasonable with respect to the Fund; (2) determined that the Fund and its shareholders were expected to benefit from the Manager’s management of the Fund; and (3) approved the Management Agreement on behalf of the Fund.
37
Disclosure Regarding Approval of the Management and Investment Advisory Agreements(Unaudited)
Approval of the Advisory Agreement
Prior to the August21-22, 2018 meetings, information was provided to the Board by the Subadviser in response to requests from the Board and/or the Manager in connection with the Board’s consideration of the Advisory Agreement. The Investment Committee of the Board also met with a representative of the Subadviser.
Provided below is an overview of the primary factors the Board considered at its August21-22, 2018 meetings at which the Board considered the approval of the Advisory Agreement. In determining whether to approve the Advisory Agreement, the Board considered, among other things, the following factors: (1) the nature and quality of the services to be provided; (2) the prior investment performance of the Fund’s proposed portfolio manager; (3) the extent to which economies of scale, if any, have been taken into account in setting the fee schedule; (4) whether fee levels reflect these economies of scale, if any, for the benefit of investors; (5) comparisons of services and fees with contracts entered into by the Subadviser with other clients; and (6) any other benefits anticipated to be derived by the Subadviser from its relationship with the Fund.
The Board did not identify any particular information that was most relevant to its consideration of the Advisory Agreement, and each Trustee may have afforded different weight to the various factors. Legal counsel to the Independent Trustees provided the Board with a memorandum regarding its responsibilities pertaining to the approval of investment advisory contracts, such as the Advisory Agreement. The memorandum explained the regulatory requirements surrounding the Trustees’ process for evaluating investment advisors and the terms of investment advisory contracts. Based on its evaluation, the Board unanimously concluded that the terms of the Advisory Agreement were reasonable and fair and that the approval of the Advisory Agreement was in the best interests of the Fund.
Nature, extent and quality of the services to be provided by the Subadviser. The Board considered information regarding the Subadviser’s principal business activities, financial condition and overall capabilities to perform the services under the Advisory Agreement. In addition, the Board considered the background and experience of the portfolio manager who will be assigned responsibility for managing the Fund. The Board also considered the Subadviser’s investment resources, infrastructure and the adequacy of its compliance program. The Board also took into consideration the Manager’s recommendation of the Subadviser. The Board considered the Subadviser’s representation regarding the strength of its financial condition and that its current staffing levels were adequate to service the Fund. The Board considered that the Subadviser is newly formed and will receive operational support from Resolute Investment Managers, Inc., the Manager’s parent company. Based on this information, the Board concluded that the nature, extent and quality of the advisory services to be provided by the Subadviser were appropriate for the Fund in light of its investment objective, and, thus, supported a decision to approve the Advisory Agreement.
Performance of the Subadviser. The Board evaluated the information provided by the Subadviser and the Manager regarding the performance of a composite (the “Composite”), which consisted primarily of a registered investment company managed by the Fund’s proposed portfolio manager while he was employed at a prior firm, relative to the performance of appropriate benchmark indices and the funds included in the Select Peer Group. The Board considered representations made by the Subadviser and the Manager that, for various periods ended June 30, 2018, the Composite’s relative performance was favorable. Based on the foregoing information, the Board concluded that the historical investment performance record of the Subadviser supported approval of the Advisory Agreement.
Comparisons of the amounts to be paid under the Advisory Agreement with those under contracts between the Subadviser and its other clients. In evaluating the Advisory Agreement, the Board reviewed the proposed advisory fee rate for services to be performed by the Subadviser on behalf of the Fund. The Board considered that the Subadviser’s investment advisory fee rate under the Advisory Agreement would be paid to the Subadviser by the Fund. The Board considered the Subadviser’s representation that the advisory fee rate proposed for the Fund is below the standard fee schedule for the Fund’s strategy. After evaluating this information, the Board concluded
38
Disclosure Regarding Approval of the Management and Investment Advisory Agreements(Unaudited)
that the Subadviser’s advisory fee rate under the Advisory Agreement was reasonable in light of the services to be provided to the Fund.
Costs of the services to be provided and profits to be realized by the Subadviser and its affiliates from its relationship with the Fund. The Board considered the Subadviser’s representation that, at assumed estimated initial asset levels, the Subadviser believes that it will incur a loss with respect to the services that it provides to the Fund during the Fund’s first year of operations.
Economies of Scale. The Board considered the Subadviser’s representation that it believes that the proposed advisory fee schedule for the Fund, which includes breakpoints, reflects economies of scale for the benefit of the Fund’s investors.
Benefits to be derived by the Subadviser from its relationship with the Fund. The Board considered the Subadviser’s representation that it is not aware of any“fall-out” benefits that may accrue to it because of the Subadviser’s relationship with the Fund, except that the Subadviser expects to benefit from greater opportunities to market its strategy to other clients. Based on the foregoing information, the Board concluded that the potential benefits accruing to the Subadviser by virtue of its relationship with the Fund appear to be fair and reasonable.
Board’s Conclusion. Based on the various considerations described above, the Board, including a majority of Trustees who are not “interested persons” of the Fund, the Manager or the Subadviser, as that term is defined in the 1940 Act, concluded that the proposed investment advisory fee rate is fair and reasonable and the approval of the Advisory Agreement is in the best interests of the Fund and approved the Advisory Agreement.
39
Trustees and Officers of the American Beacon FundsSM(Unaudited)
The Trustees and officers of the American Beacon Funds (the “Trust”) are listed below, together with their principal occupations during the past five years. The address of each person listed below is 220 Las Colinas Boulevard East, Suite 1200, Irving, Texas 75039. Each Trustee oversees thirty-seven funds in the fund complex that includes the Trust, the American Beacon Select Funds, the American Beacon Institutional Funds Trust, the American Beacon Sound Point Enhanced Income Fund and the American Beacon Apollo Total Return Fund. The Trust’s Statement of Additional Information contains additional information about the Trustees and is available without charge by calling1-800-658-5811.
Name, Age | Position, Term of | Principal Occupation(s) During Past 5 Years and Current Directorships | ||
| INTERESTED TRUSTEES | Term | |||
| Lifetime of Trust until removal, resignation or retirement* | ||||
| Alan D. Feld** (82) | Trustee since 1996 | Partner in the law firm of Akin, Gump, Strauss, Hauer & Feld, LLP (law firm) (1960-Present); Trustee, American Beacon Select Funds (1999-Present); Trustee, American Beacon Institutional Funds Trust (2017-Present); Trustee, American Beacon Sound Point Enhanced Income Fund (2018-Present); Trustee, American Beacon Apollo Total Return Fund (2018-Present). | ||
| NON-INTERESTED TRUSTEES | Term | |||
Lifetime of Trust until removal, resignation or retirement* | ||||
| Gilbert G. Alvarado (49) | Trustee since 2015 | Director, Kura MD, Inc. (local telehealth organization) (2015-present); Vice President & CFO, Sierra Health Foundation (health conversion private foundation) (2006-Present); Vice President & CFO, Sierra Health Foundation: Center for Health Program Management (California public benefit corporation) (2012-Present); Director, Innovative North State (2012-2015); Director, Sacramento Regional Technology Alliance (2011-2016); Director, Women’s Empowerment (2009-2014); Director, Valley Healthcare Staffing (2017-present); Trustee, American Beacon Select Funds (2015-Present); Trustee, American Beacon Institutional Funds Trust (2017-Present); Trustee, American Beacon Sound Point Enhanced Income Fund (2018-Present); Trustee, American Beacon Apollo Total Return Fund (2018-Present). | ||
| Joseph B. Armes (56) | Trustee since 2015 | Chairman & CEO, CSW Industrials f/k/a Capital Southwest Corporation (investment company) (2015-Present); Chairman of the Board of Capital Southwest Corporation, predecessor to CSW Industrials, Inc. (2014-2017) (investment company); CEO, Capital Southwest Corporation (2013-2015); President & CEO, JBA Investment Partners (family investment vehicle) (2010-Present); Director and Chair of Audit Committee, RSP Permian (oil and gas producer) (2013-Present); Trustee, American Beacon Select Funds (2015-Present); Trustee, American Beacon Institutional Funds Trust (2017-Present); Trustee, American Beacon Sound Point Enhanced Income Fund (2018-Present); Trustee, American Beacon Apollo Total Return Fund (2018-Present). | ||
| Gerard J. Arpey (60) | Trustee since 2012 | Director, The Home Depot, Inc. (2015-Present); Partner, Emerald Creek Group (private equity firm) (2011-Present); Director, S.C. Johnson & Son, Inc. (privately held company) (2008-present); Trustee, American Beacon Select Funds (2012-Present); Trustee, American Beacon Institutional Funds Trust (2017-Present); Trustee, American Beacon Sound Point Enhanced Income Fund (2018-Present); Trustee, American Beacon Apollo Total Return Fund (2018-Present). | ||
40
Trustees and Officers of the American Beacon FundsSM(Unaudited)
Name, Age | Position, Term of | Principal Occupation(s) During Past 5 Years and Current Directorships | ||
| NON-INTERESTED TRUSTEES (CONT.) | Term | |||
Lifetime of Trust until removal, resignation or retirement* | ||||
| Brenda A. Cline (58) | Trustee since 2004 Chair since 2019 Vice Chair 2018 | Chief Financial Officer, Treasurer and Secretary, Kimbell Art Foundation (1993-Present); Director, Tyler Technologies, Inc. (public sector software solutions company) (2014-Present); Director, Range Resources Corporation (oil and natural gas company) (2015-Present); Trustee, CushingClosed-End andOpen-End Funds and ETFs (2017-Present); Trustee, American Beacon Select Funds (2004-Present); ; Trustee, American Beacon Institutional Funds Trust (2017-Present); Trustee, American Beacon Sound Point Enhanced Income Fund (2018-Present); Trustee, American Beacon Apollo Total Return Fund (2018-Present). | ||
| Eugene J. Duffy (64) | Trustee since 2008 | Managing Director, Global Investment Management Distribution, Mesirow Financial (2016-Present); Managing Director, Institutional Services, Intercontinental Real Estate Corporation (2014-Present); Principal and Executive Vice President, Paradigm Asset Management (1994-2014); Trustee, American Beacon Select Funds (2008-Present); Trustee, American Beacon Institutional Funds Trust (2017-Present); Trustee, American Beacon Sound Point Enhanced Income Fund (2018-Present); Trustee, American Beacon Apollo Total Return Fund (2018-Present). | ||
| Claudia A. Holz*** (61) | Trustee since 2018 | Partner, KPMG LLP (1990-2017); Trustee, American Beacon Select Funds (2018-Present); Trustee, American Beacon Institutional Funds Trust (2018-Present); Trustee, American Beacon Sound Point Enhanced Income Fund (2018-Present); Trustee, American Beacon Apollo Total Return Fund (2018-Present). | ||
| Douglas A. Lindgren**** (57) | Trustee since 2018 | CEO North America, Carne Global Financial Services (2016-2017); Managing Director, IPS Investment Management and Global Head, Content Management, UBS Wealth Management (2010-2016); Trustee, American Beacon Select Funds (2018-Present); Trustee, American Beacon Institutional Funds Trust (2018-Present); Trustee, American Beacon Sound Point Enhanced Income Fund (2018-Present); Trustee, American Beacon Apollo Total Return Fund (2018-Present). | ||
| Richard A. Massman (75) | Trustee since 2004 Chair 2008-2018 Chair Emeritus since 2019 | Consultant and General Counsel Emeritus, Hunt Consolidated, Inc. (holding company engaged in oil and gas exploration and production, refining, real estate, farming, ranching and venture capital activities) (2009-Present); Trustee, American Beacon Select Funds (2004-Present); Trustee, American Beacon Institutional Funds Trust (2017-Present); Trustee, American Beacon Sound Point Enhanced Income Fund (2018-Present); Trustee, American Beacon Apollo Total Return Fund (2018-Present). | ||
| Barbara J. McKenna, CFA (55) | Trustee since 2012 | President/Managing Principal, Longfellow Investment Management Company (2005-Present); Trustee, American Beacon Select Funds (2012-Present); Trustee, American Beacon Institutional Funds Trust (2017-Present); Trustee, American Beacon Sound Point Enhanced Income Fund (2018-Present); Trustee, American Beacon Apollo Total Return Fund (2018-Present). | ||
| R. Gerald Turner (73) | Trustee since 2001 | President, Southern Methodist University (1995-Present); Director, J.C. Penney Company, Inc. (1996-Present); Director, Kronus Worldwide Inc. (chemical manufacturing) (2003-Present); Trustee, American Beacon Select Funds (2001-Present); Trustee, American Beacon Institutional Funds Trust (2017-Present); Trustee, American Beacon Sound Point Enhanced Income Fund (2018-Present); Trustee, American Beacon Apollo Total Return Fund (2018-Present). | ||
41
Trustees and Officers of the American Beacon FundsSM(Unaudited)
Name, Age | Position, Term of | Principal Occupation(s) During Past 5 Years and Current Directorships | ||
| OFFICERS | Term | |||
| One Year | ||||
| Gene L. Needles, Jr. (64) | President since 2009 | CEO and Director (2009-Present), and Chairman (2018-Present), American Beacon Advisors, Inc.; President, American Beacon Advisors (2009-2018); President (2015-2018), Director and CEO (2015-Present), and Chairman (2018-Present), Resolute Investment Holdings, LLC; Director, Chairman and CEO, Resolute Topco, Inc. (2015-Present), President (2015-2018); Director, Chairman and CEO, Resolute Acquisition, Inc. (2015-Present); President (2015-2018), Chairman and CEO, Resolute Investment Managers, Inc. (2015-Present), President (2015-2018); Director, Chairman, President and CEO, Resolute Investment Distributors (2017-Present); Director, Chairman, President and CEO; Resolute Investment Services, Inc. (2015-Present); President and CEO, Lighthouse Holdings Parent, Inc. (2009-2015); President, CEO and Director, Lighthouse Holdings, Inc. (2009-2015); Manager, President and CEO, American Private Equity Management, LLC (2012-Present); Director, Chairman, President and CEO, Alpha Quant Advisors, LLC (2016-Present); Director, ARK Investment Management LLC (2016-Present); Director, Shapiro Capital Management LLC (2017-Present); Director, Chairman and CEO, Continuous Capital, LLC (2018-Present); Director and President, American Beacon Cayman Transformational Innovation Company, LTD., (2017-2018); President American Beacon Cayman TargetRisk Company, Ltd. (2018-Present); President, American Beacon Delaware Transformational Innovation Corporation (2017-2018); Member, Investment Advisory Committee, Employees Retirement System of Texas (2017-Present); Trustee, American Beacon NextShares Trust (2015-Present); President, American Beacon Select Funds (2009-Present); American Beacon Cayman Managed Futures Strategy Fund, Ltd. (2014-Present); President, American Beacon Institutional Funds Trust (2017-Present); President, American Beacon Sound Point Enhanced Income Fund (2018-Present); President, American Beacon Apollo Total Return Fund (2018-Present); President, | ||
| Rosemary K. Behan (59) | VP, Secretary and Chief Legal Officer since 2006 | Vice President, Secretary and General Counsel, American Beacon Advisors, Inc. (2006-Present); Secretary, Resolute Investment Holdings, LLC (2015-Present); Secretary, Resolute Topco, Inc. (2015-Present); Secretary, Resolute Acquisition, Inc. (2015-Present); Vice President, Secretary and General Counsel, Resolute Investment Managers, Inc. (2015-Present); Secretary, Resolute Investment Distributors, Inc. (2017-Present); Vice President, Secretary and General Counsel, Resolute Investment Services, Inc. (2015-Present); Vice President and Secretary, Lighthouse Holdings Parent, Inc. (2008-2015); Vice President and Secretary, Lighthouse Holdings, Inc. (2008-2015); Secretary, American Private Equity Management, LLC (2008-Present); Secretary, Alpha Quant Advisors, LLC (2016-Present); Vice President and Secretary, Continuous Capital, LLC (2018-Present); Secretary, American Beacon Delaware Transformational Innovation Corporation (2017-2018); Secretary, American Beacon Cayman Transformational Innovation Company, Ltd. (2017-2018; Secretary, American Beacon Cayman TargetRisk Company, Ltd (2018-Present); Chief Legal Officer, Vice President and Secretary, American Beacon Select Funds (2006-Present); Secretary, American Beacon Cayman Managed Futures Strategy Fund, Ltd. (2014-Present); Chief Legal Officer, Vice President and Secretary, American Beacon Institutional Funds Trust (2017-Present); Chief Legal Officer, Vice President and Secretary, American Beacon Sound Point Enhanced Income Fund (2018-Present); Chief Legal Officer, Vice President and Secretary American Beacon Apollo Total Return Fund (2018-Present). | ||
42
Trustees and Officers of the American Beacon FundsSM(Unaudited)
Name, Age | Position, Term of | Principal Occupation(s) During Past 5 Years and Current Directorships | ||
| OFFICERS (CONT.) | Term | |||
| One Year | ||||
| Brian E. Brett (58) | VP since 2004 | Senior Vice President, Head of Distribution (2012-Present), Vice President, Director of Sales (2004-2012), American Beacon Advisors, Inc.; Senior Vice President, Resolute Investment Managers, Inc. (2017-Present); Senior Vice President, Resolute Investment Distributors, Inc. (2018-Present), Vice President (2017-2018); Senior Vice President, Resolute Investment Services, Inc. (2017-Present); Senior Vice President, Lighthouse Holdings Parent, Inc. (2008-2015); Senior Vice President, Lighthouse Holdings, Inc. (2008-2015); Vice President, American Beacon Select Funds (2004-Present); Vice President, American Beacon Institutional Funds Trust (2017-Present); Vice President American Beacon Sound Point Enhanced Income Fund (2018-Present); Vice President American Beacon Apollo Total Return Fund (2018-Present). | ||
| Paul B. Cavazos (49) | VP since 2016 | Chief Investment Officer and Senior Vice President, American Beacon Advisors, Inc. (2016-Present); Chief Investment Officer, DTE Energy (2007-2016); Vice President, American Private Equity Management, L.L.C. (2017-Present); Vice President, American Beacon Select Funds (2016-Present); Vice President, American Beacon Institutional Funds Trust (2017-Present); Vice President American Beacon Sound Point Enhanced Income Fund (2018-Present); Vice President American Beacon Apollo Total Return Fund (2018-Present). | ||
| Erica Duncan (48) | VP Since 2011 | Vice President, American Beacon Advisors, Inc. (2011-Present); Vice President, Resolute Investment Managers (2018-Present); Vice President, Resolute Investment Services, Inc. (2018-Present); Vice President, American Beacon Select Funds (2011-Present); Vice President, American Beacon Institutional Funds Trust (2017-Present); Vice President American Beacon Sound Point Enhanced Income Fund (2018-Present); Vice President American Beacon Apollo Total Return Fund (2018-Present). | ||
| Melinda G. Heika (57) | Treasurer since 2010 | Treasurer and CFO (2010-Present), American Beacon Advisors, Inc.; Treasurer, Resolute Topco, Inc. (2015-Present); Treasurer, Resolute Investment Holdings, LLC. (2015-Present); Treasurer, Resolute Acquisition, Inc. (2015-Present); Treasurer and CFO, Resolute Investment Managers, Inc. (2017-Present); Treasurer, Resolute Investment Distributors, Inc. (2017-2017); Treasurer and CFO, Resolute Investment Services, Inc. (2015-Present); Treasurer, Lighthouse Holdings Parent Inc., (2010-2015); Treasurer, Lighthouse Holdings, Inc. (2010-2015); Treasurer, American Private Equity Management, LLC (2012-Present); Treasurer and CFO, Alpha Quant Advisors, LLC (2016-Present); Treasurer and CFO, Continuous Capital, LLC (2018-Present); Treasurer, American Beacon Cayman Transformational Innovation, Ltd. (2017-2018); Treasurer, American Beacon Delaware Transformational Innovation Corporation (2017-2018); Treasurer, American Beacon Select Funds (2010-Present); Director and Treasurer, American Beacon Cayman Managed Futures Strategy Fund, Ltd. (2014-Present); Treasurer, American Beacon Institutional Funds Trust (2017-Present); Treasurer, American Beacon Sound Point Enhanced Income Fund (2018-Present); Treasurer, American Beacon Apollo Total Return Fund (2018-Present). | ||
43
Trustees and Officers of the American Beacon FundsSM(Unaudited)
Name, Age | Position, Term of | Principal Occupation(s) During Past 5 Years and Current Directorships | ||
| OFFICERS (CONT.) | Term | |||
| One Year | ||||
| Terri L. McKinney (55) | VP since 2010 | Vice President (2009-Present), Managing Director (2003-2009), American Beacon Advisors, Inc.; Vice President, Resolute Investment Managers, Inc. (2017-Present); Vice President, Resolute Investment Services, Inc (2018-Present); Vice President, Alpha Quant Advisors, LLC (2016-Present); Vice President, Continuous Capital, LLC (2018-Present); Vice President, American Beacon Select Funds (2010-Present); Vice President, American Beacon Institutional Funds Trust (2017-Present); Vice President, American Beacon Sound Point Enhanced Income Fund (2018-Present); Vice President, American Beacon Apollo Total Return Fund (2018-Present). | ||
| Jeffrey K. Ringdahl (43) | VP since 2010 | Director (2015-Present), President (2018-Present), Chief Operating Officer (2010-Present), Senior Vice President (2013-2018), Vice President (2010-2013), American Beacon Advisors, Inc.; Director (2015-Present), President (2018-Present), Senior Vice Present(2015-2018, Resolute Investment Holdings, LLC; Director (2015-Present), President (2018-Present), Senior Vice President (2015-2018), Resolute Topco, Inc.; Director (2015-Present), President (2018-Present), Senior Vice President (2015-2018), Resolute Acquisition, Inc.; Director (2015-Present), President & COO (2018-Present), Senior Vice President (2015-2018), Resolute Investment Managers, Inc.; Director and Executive Vice President (2017-Present), Resolute Investment Distributors, Inc.; Director (2017-Present), President & COO (2018-Present), Executive Vice President (2017-2018), Resolute Investment Services, Inc.; Senior Vice President (2018-Present), Vice President (2012-2018), Manager (2015-2018), American Private Equity Management, LLC; Senior Vice President, Lighthouse Holdings Parent, Inc. (2013-2015); Senior Vice President, Lighthouse Holdings, Inc. (2013-2015); Trustee, American Beacon NextShares Trust (2015-Present); Director, Executive Vice President & COO, Alpha Quant Advisors, LLC (2016-Present); Director, Shapiro Capital Management, LLC (2017-Present); Director, Executive Vice President & COO, Continuous Capital, LLC (2018-Present); Director and Vice President, American Beacon Cayman Transformational Innovation Company, Ltd., (2017-Present); Vice President, American Beacon Delaware Transformational Innovation Corporation (2017-2018); Vice President, American Beacon Cayman TargetRisk Company, Ltd (2018-Present); Vice President, American Beacon Select Funds (2010-2018); Director and Vice President, American Beacon Cayman Managed Futures Strategy Fund, Ltd. (2014-Present); Vice President, American Beacon Institutional Funds Trust (2017-Present); Vice President, American Beacon Sound Point Enhanced Income Fund (2018-Present); Vice President, American Beacon Apollo Total Return Fund (2018-Present) | ||
| Samuel J. Silver (55) | VP Since 2011 | Vice President (2011-Present), Chief Fixed Income Officer (2016-Present), American Beacon Advisors, Inc. (2011-Present); Vice President, American Beacon Select Funds (2011-Present); Vice President, American Beacon Institutional Funds Trust (2017-Present); Vice President, American Beacon Sound Point Enhanced Income Fund (2018-Present); Vice President, American Beacon Apollo Total Return Fund (2018-Present). | ||
44
Trustees and Officers of the American Beacon FundsSM(Unaudited)
Name, Age | Position, Term of | Principal Occupation(s) During Past 5 Years and Current Directorships | ||
| OFFICERS (CONT.) | Term | |||
| One Year | ||||
| Christina E. Sears (47) | Chief Compliance Officer since 2004 and Asst. Secretary since 1999 | Vice President, American Beacon Advisors, Inc. (2019-Present); Chief Compliance Officer, American Beacon Advisors, Inc. (2004-Present); Vice President, Resolute Investment Managers, Inc. (2017-Present); Vice President, Resolute Investment Distributors (2017-Present); Vice President, Resolute Investment Services, Inc. (2019-Present); Chief Compliance Officer, American Private Equity Management, LLC (2012-Present); Chief Compliance Officer and Vice President, Alpha Quant Advisors, LLC (2016-Present); Vice President, Continuous Capital, LLC (2018-Present); Chief Compliance Officer (2004-Present) and Assistant Secretary (1999-Present), American Beacon Select Funds; Chief Compliance Officer and Assistant Secretary, American Beacon Institutional Funds Trust (2017-Present); Chief Compliance Officer and Assistant Secretary, American Beacon Sound Point Enhanced Income Fund (2018-Present); Chief Compliance Officer and Assistant Secretary, American Beacon Apollo Total Return Fund (2018-Present). | ||
| Sonia L. Bates (62) | Asst. Treasurer since 2011 | Assistant Treasurer, American Beacon Advisors, Inc. (2011-2018); Assistant Treasurer, Lighthouse Holdings Parent Inc. (2011-2015); Assistant Treasurer, Lighthouse Holdings, Inc. (2011-2015); Assistant Treasurer, American Private Equity Management, LLC (2012-Present); Assistant Treasurer, American Beacon Cayman Transformational Innovation Company, Ltd. (2017-Present); Assistant Treasurer, American Beacon Cayman TargetRisk Company, Ltd. (2018-Present); Assistant Treasurer, American Beacon Select Funds (2011-Present); Assistant Treasurer, American Beacon Institutional Funds Trust (2017-Present); Assistant Treasurer, American Beacon Sound Point Enhanced Income Fund (2018-Present); Assistant Treasurer, American Beacon Apollo Total Return Fund (2018-Present). | ||
| Shelley D. Abrahams (44) | Assistant Secretary since 2008 | Assistant Secretary, American Beacon Select Funds (2008-Present); Assistant Secretary, American Beacon Institutional Funds Trust (2017-Present); Assistant Secretary, American Beacon Sound Point Enhanced Income Fund (2018-Present); Assistant Secretary, American Beacon Apollo Total Return Fund (2018-Present). | ||
| Rebecca L. Harris (52) | Assistant Secretary since 2010 | Vice President, American Beacon Advisors, Inc. (2011-Present); Vice President, Resolute Investment Managers, Inc. (2017-Present); Vice President, Resolute Investment Services (2015-Present); Vice President, Alpha Quant Advisors, LLC (2016-Present); Vice President, Continuous Capital, LLC (2018-Present); Assistant Secretary, American Beacon Select Funds (2010-Present); Assistant Secretary, American Beacon Institutional Funds Trust (2017-Present); Assistant Secretary, American Beacon Sound Point Enhanced Income Fund (2018-Present); Assistant Secretary, American Beacon Apollo Total Return Fund (2018-Present). | ||
45
Trustees and Officers of the American Beacon FundsSM(Unaudited)
Name, Age | Position, Term of | Principal Occupation(s) During Past 5 Years and Current Directorships | ||
| OFFICERS (CONT.) | Term | |||
| One Year | ||||
| Teresa A. Oxford (60) | Assistant Secretary since 2015 | Assistant Secretary, American Beacon Advisors, Inc. (2015-Present); Assistant Secretary, Resolute Investment Distributors (2018-Present); Assistant Secretary, Resolute Investment Services (2018-Present); Assistant Secretary, Alpha Quant Advisors, LLC (2016-Present); Assistant Secretary, American Beacon Select Funds (2015-Present); Assistant Secretary, American Beacon Institutional Funds Trust (2017-Present); Assistant Secretary, American Beacon Sound Point Enhanced Income Fund (2018-Present); Assistant Secretary, American Beacon Apollo Total Return Fund (2018-Present). | ||
* As of 11/12/2014, the Board adopted a retirement plan that requires Trustees, other than Messrs. Feld and Massman to retire no later than the last day of the calendar year in which they reach the age of 75. As of 11/7/17, the Board approved a waiver of the mandatory retirement policy with respect to Mr. Massman, who turned 75 in November 2018, to permit him to continue to serve on the Board as Chair Emeritus through 12/31/19.
** Mr. Feld is deemed to be an “interested person” of the Trusts, as defined by the 1940 Act. Mr. Feld’s law firm of Akin, Gump, Strauss, Hauer & Feld LLP has provided legal services within the past two fiscal years to one or more of the Trust’ssub-advisors.
*** Claudia A. Holz became a new Trustee to each of the Trusts on 4/1/2018.
**** Douglas A. Lindgren became a new Trustee to each of the Trusts on 1/1/2018.
46
Privacy Policy
January 31, 2019 (Unaudited)
The American Beacon Funds recognize and respect the privacy of our shareholders. We are providing this notice to you so you will understand how shareholder information may be collected and used.
We may collect nonpublic personal information about you from one or more of the following sources:
| • | information we receive from you on applications or other forms; |
| • | information about your transactions with us or our service providers; and |
| • | information we receive from third parties. |
We do not disclose any nonpublic personal information about our customers or former customers to anyone, except as permitted by law.
We restrict access to your nonpublic personal information to those employees or service providers who need to know that information to provide products or services to you. To ensure the confidentiality of your nonpublic personal information, we maintain safeguards that comply with federal standards.
47
This page intentionally left blank.
48

eDelivery isNOW AVAILABLE - Stop traditional mail delivery and receive your
shareholder reports and summary prospectuson-line. Sign up at
www.americanbeaconfunds.com
If you invest in the Fund through a financial institution, you may be able to receive the Fund’s regulatory mailings, such as the Prospectus, Annual Report and Semi-Annual Report, bye-mail. If you are interested in this option, please go towww.icsdelivery.com and search for your financial institution’s name or contact your financial institution directly.
To obtain more information about the Fund:
 |  | |
| ByE-mail: | On the Internet: | |
| american_beacon.funds@ambeacon.com | Visit our website atwww.americanbeaconfunds.com | |
By Telephone: Call (800)658-5811 |
By Mail: American Beacon Funds P.O. Box 219643 Kansas City, MO 64121-9643 | |
| Availability of Quarterly Portfolio Schedules | Availability of Proxy Voting Policy and Records | |
| In addition to the Schedule of Investments provided in each semi-annual and annual report, the Fund files a complete schedule of its portfolio holdings with the Securities and Exchange Commission (“SEC”) onForm N-Q as of the first and third fiscal quarters. The Fund’sForms N-Q are available on the SEC’s website atwww.sec.gov. TheForms N-Q may also be reviewed and copied at the SEC’s Public Reference Section, 100 F Street, NE, Washington, D.C.20549-2736. Information regarding the operation of the SEC’s Public Reference Room may be obtained by calling(800)-SEC-0330. A complete schedule of the American Beacon Continuous Capital Emerging Markets Fund’s portfolio holdings is also available atwww.americanbeaconfunds.com approximately sixty days after the end of each quarter. | A description of the policies and procedures the Fund uses to determine how to vote proxies relating to portfolio securities is available in the Fund’s Statement of Additional Information, is available free of charge on the Fund’s websitewww.americanbeaconfunds.com and by calling1-800-967-9009 or by accessing the SEC’s website atwww.sec.gov. The Fund’s proxy voting record for the most recent year ended June 30 is filed annually with the SEC on FormN-PX. The Fund’s FormsN-PX are available on the SEC’s website atwww.sec.gov. The Fund’s proxy voting record may also be obtained by calling1-800-967-9009. | |


Fund Service Providers:
CUSTODIAN State Street Bank and Trust Company Boston, Massachusetts | TRANSFER AGENT DST Asset Manager Solutions, Inc. Kansas City, Missouri | INDEPENDENT REGISTERED PUBLIC ACCOUNTING FIRM PricewaterhouseCoopers LLP Boston, Massachusetts | DISTRIBUTOR Resolute Investment Distributors, Inc. Irving, Texas |
This report is prepared for shareholders of the American Beacon Funds and may be distributed to others only if preceded or accompanied by a current Prospectus or Summary Prospectus.
American Beacon Funds and American Beacon Continuous Capital Emerging Markets Fund are service marks of American Beacon Advisors, Inc.
AR 1/19
| ITEM 2. | CODE OF ETHICS. |
The Trust adopted a code of ethics that applies to its principal executive and financial officers (the “Code”). The Trust amended its code March 1, 2018 to disclose the addition of the American Beacon Sound Point Enhanced Income Fund and American Beacon Apollo Total Return Fund, disclose a change in the Principal Financial Officer and disclosure of conflicts due to Principal Officers serving in positions with affiliates, which also serve assub-advisors. The Trust did not grant any waivers to the provisions of the Code during the period covered by the shareholder reports presented in Item 1. The Code is filed herewith as Exhibit 99.CODE ETH.
| ITEM 3. | AUDIT COMMITTEE FINANCIAL EXPERT. |
The Trust’s Board of Trustees has determined that Gilbert G. Alvarado, a member of the Trust’s Audit and Compliance Committee, is an “audit committee financial expert” as defined in FormN-CSR. Mr. Gilbert Alvarado is “independent” as defined in FormN-CSR.
| ITEM 4. | PRINCIPAL ACCOUNTANT FEES AND SERVICES. |
(a) Audit Fees | Fiscal Year Ended | |||
$326,959 | 1/31/2018 | |||
$288,530 | 1/31/2019 | |||
(b) Audit-Related Fees | Fiscal Year Ended | |||
$ 0 | 1/31/2018 | |||
$ 0 | 1/31/2019 | |||
(c) Tax Fees | Fiscal Year Ended | |||
$127,409 | 1/31/2018 | |||
$ 71,090 | 1/31/2019 | |||
(d) All Other Fees | Fiscal Year Ended | |||
$ 0 | 1/31/2018 | |||
$ 0 | 1/31/2019 | |||
e)(1) Pursuant to its charter, the Trust’s Audit and Compliance Committee shall have the following duties and powers pertaining topre-approval of audit andnon-audit services provided by the Trust’s principal accountant:
- to approve, prior to appointment, the engagement of auditors to annually audit and provide their opinion on the Trusts’ financial statements, and, in connection therewith, reviewing and evaluating matters potentially affecting the independence and capabilities of the auditors;
- to approve, prior to appointment, the engagement of the auditors to providenon-audit services to the Trusts, an investment adviser to any series of the Trusts or any entity controlling, controlled by, or
under common control with an investment adviser (“adviser affiliate”) that provides ongoing services to the Trusts, if the engagement relates directly to the operations and financial reporting of the Trusts;
- to consider whether thenon-audit services provided by a Trust’s auditor to an investment adviser or any adviser affiliate that provides ongoing services to a series of the Trusts, which services were notpre-approved by the Committee, are compatible with maintaining the auditor’s independence;
- to review the arrangements for and scope of the annual audit and any special audits; and
- to review and approving the fees proposed to be charged to the Trusts by the auditors for each audit andnon-audit service.
The Audit and Compliance Committee may delegate any portion of its authority, including the authority to grantpre-approvals of audit and permittednon-audit services, to a subcommittee of one or more members. Any decisions of the subcommittee to grantpre-approvals shall be presented to the full audit committee at its next regularly scheduled meeting.
(e)(2) None of the fees disclosed in paragraphs (b) through (d) above were approved by the audit committee pursuant to paragraph (c)(7)(i)(C) of Rule2-01 of RegulationS-X.
(f) Not applicable.
(g) AggregateNon-Audit Fees for Services Rendered to the:
Registrant | Adviser | Adviser’s Affiliates Providing Ongoing Services to Registrant | Fiscal Year Ended | |||||||||
| $ | 127,409 | $ | 110,167 | N/A | 1/31/2018 | |||||||
| $ | 71,090 | $ | 0 | N/A | 1/31/2019 | |||||||
(h) Not applicable.
| ITEM 5. | AUDIT COMMITTEE OF LISTED REGISTRANTS. |
Not applicable.
| ITEM 6. | SCHEDULE OF INVESTMENTS. |
The schedules of investments for each series of the Trust are included in the shareholder reports presented in Item 1.
| ITEM 7. | DISCLOSURE OF PROXY VOTING POLICIES AND PROCEDURES FORCLOSED-END MANAGEMENT INVESTMENT COMPANIES. |
Not applicable.
| ITEM 8. | PORTFOLIO MANAGERS OFCLOSED-END MANAGEMENT INVESTMENT COMPANIES. |
Not applicable.
| ITEM 9. | PURCHASES OF EQUITY SECURITIES BYCLOSED-END MANAGEMENT INVESTMENT COMPANY AND AFFILIATED PURCHASERS. |
Not applicable.
| ITEM 10. | SUBMISSION OF MATTERS TO A VOTE OF SECURITY HOLDERS. |
The Trust has made no material changes to the procedures by which shareholders may recommend nominees to the Trust’s Board of Trustees since the Trust last disclosed such procedures in Schedule 14A.
| ITEM 11. | CONTROLS AND PROCEDURES. |
(a) Based upon an evaluation within 90 days of the filing date of this report, the principal executive and financial officers concluded that the disclosure controls and procedures of the Trust are effective.
(b) There were no changes in the Trust’s internal control over financial reporting during the second fiscal quarter of the period covered by this report that has materially affected, or is reasonably likely to materially affect, the Trust’s internal control over financial reporting.
| ITEM 12. | EXHIBITS. |
(a)(1) Filed herewith asEX-99.CODE ETH.
(a)(2) A separate certification for each principal executive officer and principal financial officer of the Trust as required byRule 30a-2(a) under the Investment Company Act of 1940 is attached hereto asEX-99.CERT.
(a)(3) Not applicable.
(b) The certifications required by Rule30a-2(b) under the Investment Company Act of 1940 are attached hereto asEX-99.906CERT.
SIGNATURES
Pursuant to the requirements of the Securities Exchange Act of 1934 and the Investment Company Act of 1940, the registrant has duly caused this report to be signed on its behalf by the undersigned, thereunto duly authorized.
(Registrant): American Beacon Funds
By /s/ Gene L. Needles, Jr. |
| Gene L. Needles, Jr. |
| President |
| American Beacon Funds |
Date: April 5, 2019
Pursuant to the requirements of the Securities Exchange Act of 1934 and the Investment Company Act of 1940, this report has been signed below by the following persons on behalf of the registrant and in the capacities and on the dates indicated.
By /s/ Gene L. Needles, Jr. |
| Gene L. Needles, Jr. |
| President |
| American Beacon Funds |
| Date: April 5, 2019 |
By /s/ Melinda G. Heika |
| Melinda G. Heika |
| Treasurer |
| American Beacon Funds |
| Date: April 5, 2019 |