UNITED STATES
SECURITIES AND EXCHANGE COMMISSION
Washington, D.C. 20549
FORMN-CSR
CERTIFIED SHAREHOLDER REPORT OF REGISTERED
MANAGEMENT INVESTMENT COMPANIES
Investment Company Act file number:811-4984
AMERICAN BEACON FUNDS
(Exact name of registrant as specified in charter)
220 East Las Colinas Boulevard, Suite 1200
Irving, Texas 75039
(Address of principal executive offices)-(Zip code)
GENE L. NEEDLES, JR., PRESIDENT
220 East Las Colinas Boulevard, Suite 1200
Irving, Texas 75039
(Name and address of agent for service)
Registrant’s telephone number, including area code: (817)391-6100
Date of fiscal year end: June 30, 2019
Date of reporting period: June 30, 2019
FormN-CSR is to be used by management investment companies to file reports with the Commission not later than 10 days after the transmission to stockholders of any report that is required to be transmitted to stockholders under Rule30e-1 under the Investment Company Act of 1940 (17 CFR270.30e-1). The Commission may use the information provided on FormN-CSR in its regulatory, disclosure review, inspection, and policymaking roles.
A registrant is required to disclose the information specified by FormN-CSR, and the Commission will make this information public. A registrant is not required to respond to the collection of information contained in FormN-CSR unless the Form displays a currently valid Office of Management and Budget (“OMB”) control number. Please direct comments concerning the accuracy of the information collection burden estimate and any suggestions for reducing the burden to Secretary, Securities and Exchange Commission, 450 Fifth Street, NW, Washington, DC 20549-0609. The OMB has reviewed this collection of information under the clearance requirements of 44 U.S.C. § 3507.
| ITEM 1. | REPORTS TO STOCKHOLDERS. |
About American Beacon Advisors
Since 1986, American Beacon Advisors has offered a variety of products and investment advisory services to numerous institutional and retail clients, including a variety of mutual funds, corporate cash management, and separate account management.
Our clients include defined benefit plans, defined contribution plans, foundations, endowments, corporations, financial planners, and other institutional investors. With American Beacon Advisors, you can put the experience of a multi-billion dollar asset management firm to work for your company.
ALPHA QUANT FUNDS
Investing invalue stocksmay limit downside risk over time; however, the Funds may produce more modest gains than riskier stock funds as atrade-off for this potentially lower risk. Investing inmedium-capitalization stocksmay involve greater volatility and lower liquidity than larger company stocks. The Funds are also subject to the following risks:American Beacon Alpha Quant Core Fund – growth stocks; American Beacon Alpha Quant Dividend Fund – dividend-paying stocks, growth stocks, fewer issuers; American Beacon Alpha Quant Quality Fund – growth stocks, fewer issuers; American Beacon Alpha Quant Value Fund – fewer issuers. Growth stockstypically are more volatile than value stocks; however, value stocks have a lower expected growth rate in earnings and sales. Investing individend-paying stocksmay result in less earnings growth or capital appreciation than investing innon-dividend paying stocks. Because the Funds may invest infewer issuersthan a more diversified portfolio, the fluctuating value of a single holding may have a greater effect on the value of the Funds. Please see the prospectus for a complete discussion of the Funds’ risks. There can be no assurances that the investment objectives of the Funds will be met.
Any opinions herein, including forecasts, reflect our judgment as of the end of the reporting period and are subject to change. Each advisor’s strategies and each Fund’s portfolio composition will change depending on economic and market conditions. This report is not a complete analysis of market conditions, and, therefore, should not be relied upon as investment advice. Although economic and market information has been compiled from reliable sources, American Beacon Advisors, Inc. makes no representation as to the completeness or accuracy of the statements contained herein.
American Beacon Funds | June 30, 2019 |
| 1 | ||||
| 2 | ||||
| 11 | ||||
| 14 | ||||
Schedules of Investments: | ||||
| 15 | ||||
| 18 | ||||
| 21 | ||||
| 24 | ||||
| 27 | ||||
| 31 | ||||
Financial Highlights: | ||||
| 48 | ||||
| 51 | ||||
| 54 | ||||
| 57 | ||||
| 60 | ||||
Disclosure Regarding Approvals of the Management and Investment Advisory Agreements | 61 | |||
| 67 | ||||
| 73 | ||||
| Back Cover |
 | Dear Shareholders,
At American Beacon, we take our heritage as a fiduciary very seriously — and we apply that mindset to all aspects of our business as a fund manager. As a result, for more than 30 years, we have endeavored to:
u Identify, engage and oversee the best money managers. As a manager of managers, our goal is to engage the most effective money managers for each asset class, investment style and market strategy we offer. We are committed to partnering with those we judge to be “the best of the best” when it comes to choosingsub-advisors for our mutual funds. Whether ourdue-diligence process results in the selection of onesub-advisor or multiplesub-advisors, we select those we believe show the greatest potential to help us meet the high standards you’ve come to expect. |
| u | Offer a variety of innovative investment solutions. Our mutual funds — which span the domestic, international, global, frontier and emerging markets — aresub-advised by experienced money managers who employ distinctive, proprietary investment processes to manage assets through a variety of economic and market conditions. From offering some of the first multi-manager funds, one of the first retirement income funds and the first open-ended mutual fund in the U.S. to focus primarily on frontier-market debt, our robust history includes applying a disciplined, solutions-based approach to our product development process in an effort to help you grow your assets while mitigating risk. |
| u | Provide a solutions-based approach to achieving long-term investment goals.We seek to provide investment solutions that might enable you to benefit from taking a more disciplined approach to investing. Our mutual funds provide access to institutional-quality, research-intensive investment managers with diverse processes and styles. Over the long run, having such access and spending time in the market — rather than trying to time the market — may better position you to reach your long-term investment goals during market upswings and potentially insulate against market downswings. |
Our management approach is more than a concept; it’s the cornerstone of American Beacon’s culture. And we strive to employ it at every turn as we seek to provide a well-diversified line of investment solutions to help our shareholders seek long-term rewards.
Thank you for your continued interest in American Beacon. For additional information about our mutual funds or to access your account information, please visit our website atwww.americanbeaconfunds.com.
Best Regards,

Gene L. Needles, Jr.
President
American Beacon Funds
1
June 30, 2019 (Unaudited)
For the12-month period ended June 30, 2019, equity markets were slightly higher overall; however, volatility picked up significantly as a myriad of uncertainties were on the minds of investors. Chief among those uncertainties were theup-and-down trade negotiations between the world’s two largest economies, the U.S. and China, as well as the Federal Reserve’s continued rate-hiking cycle in the first half of the period followed by its abrupt change of course in 2019 when it began holding the federal funds rate steady as the economy showed signs of cooling growth. Through all the noise, the MSCI All Country World Index rose 5.74%, driven higher by resilient U.S. equities as international developed and emerging market equities did not fare quite as well due to global trade worries.
In the U.S., the S&P 500 Index was up 10.42%, and 10 of its 11 sectors produced positive returns for the period. The top performers were yield-oriented sectors, including Utilities (up 19.03%) and Real Estate (up 16.80%), followed by Consumer Staples (up 16.39%) and Information Technology (up 14.34%). Commodity-sensitive sectors, including Energy (down 13.25%) and Materials (up 3.20%), were the worst performers. From a style standpoint, Growth continued the trend of outpacing Value as the Russell 3000 Growth Index returned 10.60% versus the Russell 3000 Value Index return of 7.34%. From a capitalization perspective,small-cap stocks struggled mightily compared to their larger capitalization peers, as evidenced by the Russell 2000 Index return of-3.31% compared to the Russell 1000 Index return of 10.02%.
International developed markets ended the period slightly higher as the MSCI EAFE Index was up 1.08%. In Europe, thetop-performing countries were Switzerland and Denmark, represented by the MSCI Switzerland Index (up 19.77%) and the MSCI Denmark Index (up 5.76%), respectively. The laggards in Europe were Austria and Ireland, represented by the MSCI Austria Index (down 13.12%) and the MSCI Ireland Index (down 9.22%), respectively. In Japan, equities struggled as the MSCI Japan Index returned-4.19%.
Finally, in the developing world, emerging markets were caught in the crossfire of the trade spat between the U.S. and China, but did manage to eke out a positive absolute return for the full period. The MSCI Emerging Market Index returned 1.21%. China, the largest-country constituent, was down 6.73%, represented by the MSCI China Index. Turkish equities also struggled as the economy dealt with rampant inflation and the MSCI Turkey Index returned-17.11%. The best-performing countries over the period were Brazil and Russia, represented by the MSCI Brazil Index (up 39.43%) and the MSCI Russia Index (up 27.06%), respectively.
2
American Beacon Alpha Quant Core FundSM
Performance Overview
June 30, 2019 (Unaudited)
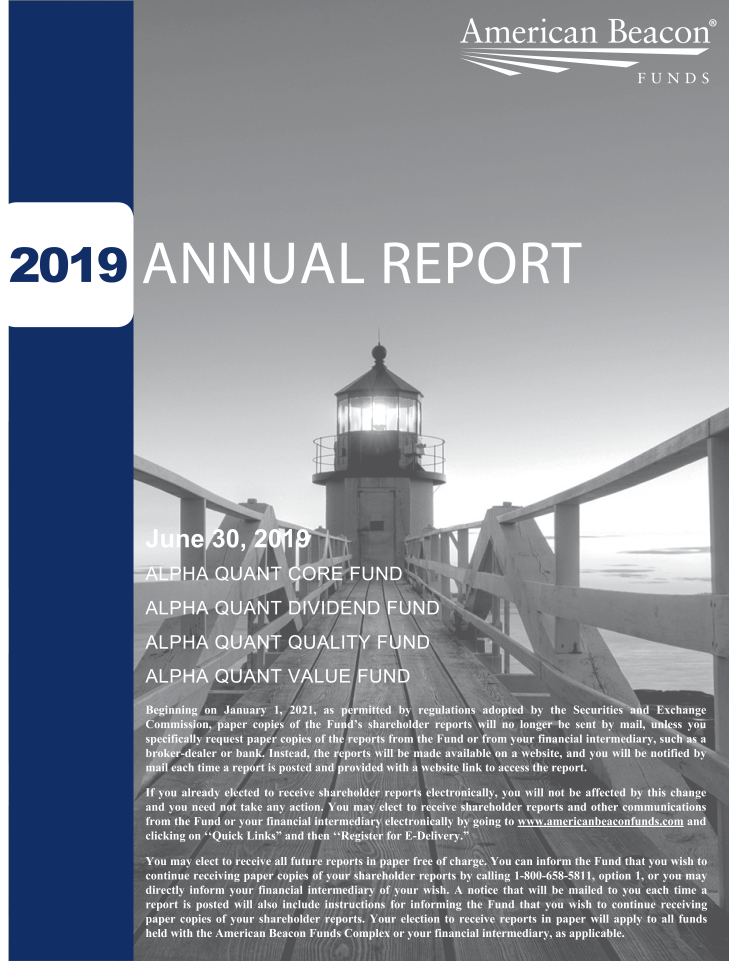
The Investor Class of the American Beacon Alpha Quant Core Fund (the “Fund”) returned-0.65% for the twelve months ended June 30, 2019, underperforming the S&P 500 Index (the “Index”) return of 10.42% for the same period.
Comparison of Changes in Value of a $10,000 Investment for the period 3/22/2017 through 6/30/2019
| Average Annual Total Returns for the Period ended June 30, 2019 |
| |||||||||||||||||||||
Ticker | 1 Year | Since Inception 03/22/2017 | Value of $10,000 06/30/2019 | |||||||||||||||||||
Institutional Class (1,3) | AQCIX | (0.20)% | 7.93% | $ | 11,895 | |||||||||||||||||
Y Class (1,3) | AQCYX | (0.28)% | 7.85% | $ | 11,875 | |||||||||||||||||
Investor Class (1,3) | AQCPX | (0.65)% | 7.52% | $ | 11,792 | |||||||||||||||||
S&P 500 Index (2) | 10.42% | 12.61% | $ | 13,101 | ||||||||||||||||||
| 1. | Performance shown is historical and is not indicative of future returns. Investment returns and principal value will vary, and shares may be worth more or less at redemption than at original purchase. Performance shown is calculated based on the publishedend-of-day net asset values as of the date indicated and current performance may be lower or higher than the performance data quoted. To obtain performance as of the most recent month end, please visitwww.americanbeaconfunds.com or call1-800-967-9009. Fund performance in the table above does not reflect the deduction of taxes a shareholder would pay on distributions or the redemption of shares. Generally accepted accounting principles require adjustments to be made to the net assets of the Fund at period end for financial reporting purposes only; and as such, the total return based on the unadjusted net asset value per share may differ from the total return reported in the financial highlights. A portion of the fees charged to each Class of the Fund has been waived since Fund inception. Performance prior to waiving fees was lower than the actual returns shown since inception. |
| 2. | The S&P 500 Index is an unmanaged index of common stocks publicly traded in the United States. The S&P 500 Index is a product of S&P Dow Jones Indices LLC, a division of S&P Global or its affiliates (“SPDJI”) and has been licensed for use by American Beacon Advisors. Standard & Poor’s® and S&P® are registered trademarks of Standard & Poor’s Financial Services LLC, a division of S&P Global (“S&P”). Dow Jones® is a registered trademark of Dow Jones Trademark Holdings LLC (“Dow Jones”). The American Beacon Alpha Quant Core Fund is not sponsored, endorsed, sold or promoted by SPDJI, Dow Jones, S&P or their respective affiliates, and none of such parties make any representation regarding the advisability of investing in such product(s) nor do they have any liability for any errors, omissions or interruptions of the S&P 500 Index. One cannot directly invest in an index. |
| 3. | The Total Annual Fund Operating Expense ratios set forth in the most recent Fund prospectus for the Institutional, Y and Investor Class shares were 5.55%, 5.63% and 6.73%, respectively. The expense ratios above may vary from the expense ratios presented in other sections of this report that are based on expenses incurred during the period covered by this report. |
3
American Beacon Alpha Quant Core FundSM
Performance Overview
June 30, 2019 (Unaudited)
The Fund underperformed the Index due mostly to security selection, while sector allocation was a modest positive contributor to relative performance.
During the period, stock selection in the Information Technology, Health Care, Materials and Consumer Discretionary sectors detracted the most from relative performance. In the Information Technology sector, the largest detractors included Western Digital Corp. (down 47.7%) and an absence from Microsoft (up 38.1%). In the Health Care sector, Biogen, Inc. (down 19.6%) and WellCare Health Plans, Inc. (down 28.7%) also detracted from relative returns. In the Materials sector, the largest detractors included Freeport McMoran, Inc. (down 34.9%) and LyondellBasell Industries N.V. (down 17.8%). And in the Consumer Discretionary sector, Kohls Corp. (down 40.2%) and Best Buy Co., Inc. (down 3.9%) detracted from relative performance.
From a sector allocation standpoint, overweighting the Information Technology sector (up 17.3%) and the Health Care sector (up 13.3%) contributed positively to relative performance. Slightly offsetting this performance was an overweight in the Materials sector (up 4.5%) and an underweight to the Utilities sector (up 20.5%).
The Fund’s sub-advisor remains focused on implementing a quantitative investment process rooted in fundamental factors that seeks to deliver shareholder value and above-market performance.
| Top Ten Holdings (% Net Assets) |
| |||||||
| Lam Research Corp. | 2.6 | |||||||
| Apple, Inc. | 2.4 | |||||||
| Facebook, Inc., Class A | 2.4 | |||||||
| Best Buy Co., Inc. | 2.2 | |||||||
| Boeing Co. | 2.2 | |||||||
| Monster Beverage Corp. | 2.2 | |||||||
| Starbucks Corp. | 2.2 | |||||||
| Cummins, Inc. | 2.1 | |||||||
| McKesson Corp. | 2.1 | |||||||
| Procter & Gamble Co. | 2.1 | |||||||
| Total Fund Holdings | 54 | |||||||
| Sector Allocation (% Equities) |
| |||||||
| Information Technology | 27.0 | |||||||
| Consumer Discretionary | 16.6 | |||||||
| Consumer Staples | 13.9 | |||||||
| Industrials | 12.8 | |||||||
| Health Care | 12.5 | |||||||
| Energy | 7.9 | |||||||
| Materials | 5.2 | |||||||
| Communication Services | 4.1 | |||||||
4
American Beacon Alpha Quant Dividend FundSM
Performance Overview
June 30, 2019 (Unaudited)
The Investor Class of the American Beacon Alpha Quant Dividend Fund (the “Fund”) returned 14.51% for the twelve months ended June 30, 2019, outperforming the S&P 500 Value Index (the “Index”) return of 8.67% for the same period.
Comparison of Changes in Value of a $10,000 Investment for the period 3/22/2017 through 6/30/2019

| Average Annual Total Returns for the Period ended June 30, 2019 |
| |||||||||||||||||||||
Ticker | 1 Year | Since Inception 03/22/2017 | Value of $10,000 03/22/2017- 06/30/2019 | |||||||||||||||||||
Institutional Class (1,3) | AQDIX | 14.94 | % | 9.53 | % | $ | 12,299 | |||||||||||||||
Y Class (1,3) | AQDYX | 14.76 | % | 9.40 | % | $ | 12,268 | |||||||||||||||
Investor Class (1,3) | AQDPX | 14.51 | % | 9.12 | % | $ | 12,195 | |||||||||||||||
S&P 500 Value Index (2) | 8.67 | % | 8.13 | % | $ | 11,946 | ||||||||||||||||
| 1. | Performance shown is historical and is not indicative of future returns. Investment returns and principal value will vary, and shares may be worth more or less at redemption than at original purchase. Performance shown is calculated based on the publishedend-of-day net asset values as of the date indicated and current performance may be lower or higher than the performance data quoted. To obtain performance as of the most recent month end, please visitwww.americanbeaconfunds.com or call1-800-967-9009. Fund performance in the table above does not reflect the deduction of taxes a shareholder would pay on distributions or the redemption of shares. Generally accepted accounting principles require adjustments to be made to the net assets of the Fund at period end for financial reporting purposes only; and as such, the total return based on the unadjusted net asset value per share may differ from the total return reported in the financial highlights. A portion of the fees charged to each Class of the Fund has been waived since Fund inception. Performance prior to waiving fees was lower than the actual returns shown since inception. |
| 2. | The S&P 500 Value Index is an unmanaged index of common stocks publicly traded in the United States, which represents the value companies, as determined by the Index sponsor, of the S&P 500 Index. The Index measures the performance of large-capitalization value stocks. The S&P 500 Value Index and the S&P 500 Index are products of S&P Dow Jones Indices LLC, a division of S&P Global or its affiliates (“SPDJI”) and have been licensed for use by American Beacon Advisors. Standard & Poor’s® and S&P® are registered trademarks of Standard & Poor’s Financial Services LLC, a division of S&P Global (“S&P”). Dow Jones® is a registered trademark of Dow Jones Trademark Holdings LLC (“Dow Jones”). The American Beacon Alpha Quant Dividend Fund is not sponsored, endorsed, sold or promoted by SPDJI, Dow Jones, S&P or their respective affiliates, and none of such parties make any representation regarding the advisability of investing in such product(s) nor do they have any liability for any errors, omissions or interruptions of the S&P 500 Value Index or the S&P 500 Index. One cannot directly invest in an index. |
| 3. | The Total Annual Fund Operating Expense ratios set forth in the most recent Fund prospectus for the Institutional, Y and Investor Class shares were 5.91%, 5.98% and 7.11%, respectively. The expense ratios above may vary from the expense ratios presented in other sections of this report that are based on expenses incurred during the period covered by this report. |
5
American Beacon Alpha Quant Dividend FundSM
Performance Overview
June 30, 2019 (Unaudited)
The Fund outperformed the Index primarily due to security selection while sector allocation also contributed.
As it relates to security selection, positions in the Materials and Industrials sectors contributed the most to performance. In the Materials sector, contributors included Air Products & Chemicals, Inc. (up 48.6%), Ecolab, Inc. (up 37.1%) and International Flavors & Fragrances (up 8.4%). Cummins, Inc. (up 32.8%) and Lockheed Martin Corp. (up 25.6%) in the Industrials sector also contributed to relative performance. Conversely, in the Health Care sector, an absence from Merck & Co., Inc. (up 27.7%) and a position in Johnson & Johnson (up 9.6%) slightly offset relative performance.
From a sector allocation standpoint, underweighting the Energy sector (down 11.8%), the worst performing sector within the Index, added to Fund performance. Additionally, significantly underweighting the Financials sector (up 6.5%) and overweighting the Utilities sector (up 19.5%) contributed positively to the Fund’s relative returns. An overweight to the Materials sector (down 4.1%) slightly offset the relative outperformance.
The Fund’s sub-advisor remains focused on implementing a quantitative investment process rooted in fundamental factors that seeks to deliver shareholder value and above-market performance.
| Top Ten Holdings (% Net Assets) |
| |||||||
| Air Products & Chemicals, Inc. | 4.0 | |||||||
| Lockheed Martin Corp. | 3.9 | |||||||
| Ecolab, Inc. | 3.8 | |||||||
| Principal Financial Group, Inc. | 3.7 | |||||||
| Target Corp. | 3.7 | |||||||
| Cummins, Inc. | 3.6 | |||||||
| Cisco Systems, Inc. | 3.5 | |||||||
| Southern Co. | 3.5 | |||||||
| International Business Machines Corp. | 3.4 | |||||||
| Procter & Gamble Co. | 3.4 | |||||||
| Total Fund Holdings | 30 | |||||||
| Sector Allocation (% Equities) |
| |||||||
| Industrials | 13.7 | |||||||
| Consumer Staples | 13.1 | |||||||
| Utilities | 13.1 | |||||||
| Health Care | 12.1 | |||||||
| Materials | 11.2 | |||||||
| Information Technology | 10.3 | |||||||
| Real Estate | 6.7 | |||||||
| Energy | 6.3 | |||||||
| Communication Services | 5.9 | |||||||
| Consumer Discretionary | 3.8 | |||||||
| Financials | 3.8 | |||||||
6
American Beacon Alpha Quant Quality FundSM
Performance Overview
June 30, 2019 (Unaudited)
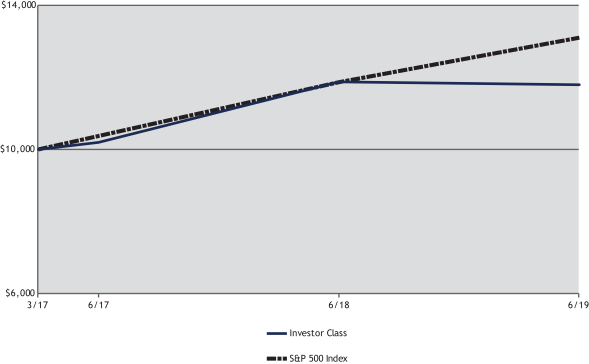
The Investor Class of the American Beacon Alpha Quant Quality Fund (the “Fund”) returned 2.64% for the twelve months ended June 30, 2019, underperforming the S&P 500 Growth Index (the “Index”) return of 12.02% for the same period.
Comparison of Changes in Value of a $10,000 Investment for the period 3/22/2017 through 6/30/2019
| Average Annual Total Returns for the Period ended June 30, 2019 |
| |||||||||||||||||||||
Ticker | 1 Year | Since Inception 03/22/2017 | Value of $10,000 03/22/2017- 06/30/2019 | |||||||||||||||||||
Institutional Class (1,3) | AQQIX | 2.99 | % | 10.91 | % | $ | 12,655 | |||||||||||||||
Y Class (1,3) | AQQYX | 2.91 | % | 10.83 | % | $ | 12,636 | |||||||||||||||
Investor Class (1,3) | AQQPX | 2.64 | % | 10.51 | % | $ | 12,551 | |||||||||||||||
S&P 500 Growth Index (2) | 12.02 | % | 16.66 | % | $ | 14,197 | ||||||||||||||||
| 1. | Performance shown is historical and is not indicative of future returns. Investment returns and principal value will vary, and shares may be worth more or less at redemption than at original purchase. Performance shown is calculated based on the publishedend-of-day net asset values as of the date indicated and current performance may be lower or higher than the performance data quoted. To obtain performance as of the most recent month end, please visitwww.americanbeaconfunds.com or call1-800-967-9009. Fund performance in the table above does not reflect the deduction of taxes a shareholder would pay on distributions or the redemption of shares. Generally accepted accounting principles require adjustments to be made to the net assets of the Fund at period end for financial reporting purposes only; and as such, the total return based on the unadjusted net asset value per share may differ from the total return reported in the financial highlights. A portion of the fees charged to each Class of the Fund has been waived since Fund inception. Performance prior to waiving fees was lower than the actual returns shown since inception. |
| 2. | The S&P 500 Growth Index is an unmanaged index of common stocks publicly traded in the United States, which represents the growth companies, as determined by the Index sponsor, of the S&P 500 Index. The Index measures the performance of large-capitalization growth stocks. The S&P 500 Growth Index and the S&P 500 Index are products of S&P Dow Jones Indices LLC, a division of S&P Global or its affiliates (“SPDJI”) and have been licensed for use by American Beacon Advisors. Standard & Poor’s® and S&P® are registered trademarks of Standard & Poor’s Financial Services LLC, a division of S&P Global (“S&P”). Dow Jones® is a registered trademark of Dow Jones Trademark Holdings LLC (“Dow Jones”). The American Beacon Alpha Quant Quality Fund is not sponsored, endorsed, sold or promoted by SPDJI, Dow Jones, S&P or their respective affiliates, and none of such parties make any representation regarding the advisability of investing in such product(s) nor do they have any liability for any errors, omissions or interruptions of the S&P 500 Growth Index or the S&P 500 Index. One cannot directly invest in an index. |
| 3. | The Total Annual Fund Operating Expense ratios set forth in the most recent Fund prospectus for the Institutional, Y and Investor Class shares were 5.69%, 5.78% and 6.83%, respectively. The expense ratios above may vary from the expense ratios presented in other sections of this report that are based on expenses incurred during the period covered by this report. |
7
American Beacon Alpha Quant Quality FundSM
Performance Overview
June 30, 2019 (Unaudited)
The Fund underperformed the Index due mostly to security selection, offset partially by sector allocation.
From a security selection standpoint, holdings in the Health Care and Industrials sectors detracted the most from relative performance. In the Health Care sector, detractors included Biogen, Inc. (down 18.9%), Abbvie, Inc. (down 19.2%) and Bristol Myers Squibb Co. (down 9.2%). In the Industrials sector, WW Grainger, Inc. (down 25.9%) and Raytheon Company (down 22.9%) detracted from performance. Slightly offsetting the underperformance were positions in The Procter & Gamble Co. (up 34.8%) and Church & Dwight Co., Inc. (up 39.2%) within the Consumer Staples sector.
As it relates to sector allocation, a substantial overweight to the Consumer Staples sector (up 16.3%) and an underweight to the Communication Services sector (up 0.1%) contributed positively to relative performance. Conversely, an overweight to the Energy sector (down 20.9%), the worst performing sector within the Index, detracted from relative performance.
The Fund’s sub-advisor remains focused on implementing a quantitative investment process rooted in fundamental factors that seeks to deliver shareholder value and above-market performance.
| Top Ten Holdings (% Net Assets) |
| |||||||
| Mastercard, Inc., Class A | 4.4 | |||||||
| Facebook, Inc., Class A | 4.1 | |||||||
| Lockheed Martin Corp. | 4.1 | |||||||
| VeriSign, Inc. | 4.1 | |||||||
| Intuit, Inc. | 4.0 | |||||||
| Yum! Brands, Inc. | 4.0 | |||||||
| Apple, Inc. | 3.8 | |||||||
| Booking Holdings, Inc. | 3.8 | |||||||
| Visa, Inc., Class A | 3.8 | |||||||
| Monster Beverage Corp. | 3.7 | |||||||
| Total Fund Holdings | 30 | |||||||
| Sector Allocation (% Equities) |
| |||||||
| Information Technology | 27.9 | |||||||
| Consumer Discretionary | 19.5 | |||||||
| Consumer Staples | 18.2 | |||||||
| Industrials | 16.7 | |||||||
| Health Care | 8.5 | |||||||
| Communication Services | 4.1 | |||||||
| Materials | 3.2 | |||||||
| Energy | 1.9 | |||||||
8
American Beacon Alpha Quant Value FundSM
Performance Overview
June 30, 2019 (Unaudited)
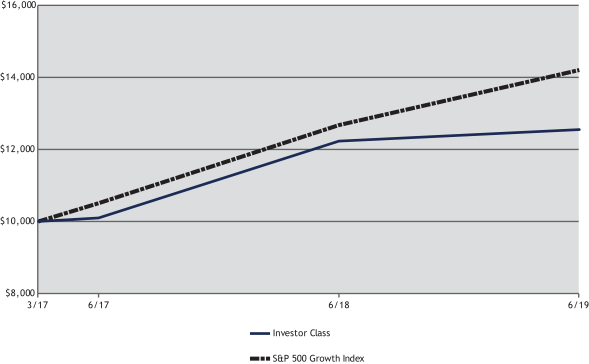
The Investor Class of the American Beacon Alpha Quant Value Fund (the “Fund”) returned-5.93% for the twelve months ended June 30, 2019, underperforming the S&P 500 Value Index (the “Index”) return of 8.67% for the same period.
Comparison of Changes in Value of a $10,000 Investment for the period 3/22/2017 through 6/30/2019
| Average Annual Total Returns for the Period ended June 30, 2019 |
| |||||||||||||||||||||
Ticker | 1 Year | Since Inception 03/22/2017 | Value of $10,000 03/22/2017- 06/30/2019 | |||||||||||||||||||
Institutional Class (1,3) | AQVVX | (5.65)% | 5.84% | $ | 11,379 | |||||||||||||||||
Y Class (1,3) | AQVYX | (5.74)% | 5.76% | $ | 11,358 | |||||||||||||||||
Investor Class (1,3) | AQVPX | (5.93)% | 5.47% | $ | 11,287 | |||||||||||||||||
S&P 500 Value Index (2) | 8.67% | 8.13% | $ | 11,946 | ||||||||||||||||||
| 1. | Performance shown is historical and is not indicative of future returns. Investment returns and principal value will vary, and shares may be worth more or less at redemption than at original purchase. Performance shown is calculated based on the publishedend-of-day net asset values as of the date indicated and current performance may be lower or higher than the performance data quoted. To obtain performance as of the most recent month end, please visitwww.americanbeaconfunds.com or call1-800-967-9009. Fund performance in the table above does not reflect the deduction of taxes a shareholder would pay on distributions or the redemption of shares. Generally accepted accounting principles require adjustments to be made to the net assets of the Fund at period end for financial reporting purposes only; and as such, the total return based on the unadjusted net asset value per share may differ from the total return reported in the financial highlights. A portion of the fees charged to each Class of the Fund has been waived since Fund inception. Performance prior to waiving fees was lower than the actual returns shown since inception. |
| 2. | The S&P 500 Value Index is an unmanaged index of common stocks publicly traded in the United States, which represents the value companies, as determined by the Index sponsor, of the S&P 500 Index. The Index measures the performance of large-capitalization value stocks. The S&P 500 Value Index and the S&P 500 Index are products of S&P Dow Jones Indices LLC, a division of S&P Global or its affiliates (“SPDJI”) and have been licensed for use by American Beacon Advisors. Standard & Poor’s® and S&P® are registered trademarks of Standard & Poor’s Financial Services LLC, a division of S&P Global (“S&P”). Dow Jones® is a registered trademark of Dow Jones Trademark Holdings LLC (“Dow Jones”). The American Beacon Alpha Quant Value Fund is not sponsored, endorsed, sold or promoted by SPDJI, Dow Jones, S&P or their respective affiliates, and none of such parties make any representation regarding the advisability of investing in such product(s) nor do they have any liability for any errors, omissions or interruptions of the S&P 500 Value Index or the S&P 500 Index. One cannot directly invest in an index. |
| 3. | The Total Annual Fund Operating Expense ratios set forth in the most recent Fund prospectus for the Institutional, Y and Investor Class shares were 5.18%, 5.30% and 6.21%, respectively. The expense ratios above may vary from the expense ratios presented in other sections of this report that are based on expenses incurred during the period covered by this report. |
9
American Beacon Alpha Quant Value FundSM
Performance Overview
June 30, 2019 (Unaudited)
The Fund’s underperformance was driven mainly by security selection, while sector allocation was a slight positive.
Security selection was the primary driver of underperformance, particularly in the Information Technology and Health Care sectors. Within Information Technology, Western Digital Corp. (down 46.8%), Micron Technology, Inc. (down 23.3%) and DXC Technology Co. (down 41.5%) were the leading detractors. In the Health Care sector, WellCare Health Plans, Inc. (down 28.1%) and Cigna Corp. (down 4.0%) detracted as well. Conversely, security selection in the Industrials sector slightly offset the aforementioned performance; contributors included Cummins, Inc. (up 32.2%).
From a sector allocation standpoint, sizeable overweights to the Information Technology sector (up 15.2%) and the Health Care Sector (up 11.9%) contributed positively to the Fund’s relative returns. Conversely, an underweight to the Communication Services sector (up 22.8%) detracted slightly from relative performance, as this was the best performing sector during the period.
The Fund’s sub-advisor remains focused on implementing a quantitative investment process rooted in fundamental factors that seeks to deliver shareholder value and above-market performance.
| Top Ten Holdings (% Net Assets) |
| |||||||
| Lam Research Corp. | 4.7 | |||||||
| Micron Technology, Inc. | 4.2 | |||||||
| Starbucks Corp. | 4.2 | |||||||
| Cardinal Health, Inc. | 3.9 | |||||||
| Cummins, Inc. | 3.9 | |||||||
| PulteGroup, Inc. | 3.9 | |||||||
| Boeing Co. | 3.8 | |||||||
| Cisco Systems, Inc. | 3.8 | |||||||
| McKesson Corp. | 3.8 | |||||||
| Seagate Technology PLC | 3.7 | |||||||
| Total Fund Holdings | 30 | |||||||
| Sector Allocation (% Equities) |
| |||||||
| Information Technology | 25.8 | |||||||
| Health Care | 18.9 | |||||||
| Consumer Discretionary | 13.9 | |||||||
| Energy | 11.6 | |||||||
| Industrials | 10.5 | |||||||
| Materials | 9.2 | |||||||
| Consumer Staples | 6.5 | |||||||
| Communication Services | 3.6 | |||||||
10
American Beacon FundsSM
June 30, 2019 (Unaudited)
Fund Expense Example
As a shareholder of a Fund, you incur two types of costs: (1) transaction costs, including sales charges (loads) on purchase payments and redemption fees, if applicable, and (2) ongoing costs, including management fees, distribution(12b-1) fees,sub-transfer agent fees, and other Fund expenses. The Examples are intended to help you understand the ongoing cost (in dollars) of investing in the Funds and to compare these costs with the ongoing costs of investing in other mutual funds. The Examples are based on an investment of $1,000 invested at the beginning of the period in each Class and held for the entire period from January 1, 2019 through June 30, 2019.
Actual Expenses
The “Actual” lines of the tables provide information about actual account values and actual expenses. You may use the information on this page, together with the amount you invested, to estimate the expenses that you paid over the period. Simply divide your account value by $1,000 (for example, an $8,600 account value divided by $1,000 = $8.60), then multiply the result by the “Expenses Paid During Period” to estimate the expenses you paid on your account during this period. Shareholders of the Investor and Institutional Classes that invest in the Funds through an IRA or Roth IRA may be subject to a custodial IRA fee of $15 that is typically deducted each December. If your account was subject to a custodial IRA fee during the period, your costs would have been $15 higher.
Hypothetical Example for Comparison Purposes
The “Hypothetical” lines of the tables provide information about hypothetical account values and hypothetical expenses based on the Funds’ actual expense ratio and an assumed 5% per year rate of return before expenses (not the Funds’ actual return). You may compare the ongoing costs of investing in the Funds with other funds by contrasting this 5% hypothetical example and the 5% hypothetical examples that appear in the shareholder reports of the other funds. The hypothetical account values and expenses may not be used to estimate the actual ending account balance or expenses you paid for the period. Shareholders of the Investor and Institutional Classes that invest in the Funds through an IRA or Roth IRA may be subject to a custodial IRA fee of $15 that is typically deducted each December. If your account was subject to a custodial IRA fee during the period, your costs would have been $15 higher.
You should also be aware that the expenses shown in the table highlight only your ongoing costs and do not reflect any transaction costs charged by the Funds, such as sales charges (loads) or redemption fees, as applicable. Similarly, the expense examples for other funds do not reflect any transaction costs charged by those funds, such as sales charges (loads), redemption fees or exchange fees. Therefore, the “Hypothetical” lines of the tables are useful in comparing ongoing costs only and will not help you determine the relative total costs of owning different funds. If you were subject to any transaction costs during the period, your costs would have been higher.
11
American Beacon FundsSM
Expense Examples
June 30, 2019 (Unaudited)
| American Beacon Alpha Quant Core Fund |
| ||||||||||||||
| Beginning Account Value 1/1/2019 | Ending Account Value 6/30/2019 | Expenses Paid During Period 1/1/2019-6/30/2019* | |||||||||||||
| Institutional Class | |||||||||||||||
| Actual | $1,000.00 | $1,097.10 | $3.33 | ||||||||||||
| Hypothetical** | $1,000.00 | $1,021.62 | $3.21 | ||||||||||||
| Y Class | |||||||||||||||
| Actual | $1,000.00 | $1,097.30 | $3.85 | ||||||||||||
| Hypothetical** | $1,000.00 | $1,021.13 | $3.71 | ||||||||||||
| Investor Class | |||||||||||||||
| Actual | $1,000.00 | $1,095.80 | $5.30 | ||||||||||||
| Hypothetical** | $1,000.00 | $1,019.74 | $5.11 | ||||||||||||
| * | Expenses are equal to the Fund’s annualized expense ratios for thesix-month period of 0.64%, 0.74%, and 1.02% for the Institutional, Y, and Investor Classes, respectively, multiplied by the average account value over the period, multiplied by the number derived by dividing the number of days in the most recent fiscal half-year (181) by days in the year (365) to reflect the half-year period. |
| ** | 5% return before expenses. |
| American Beacon Alpha Quant Dividend Fund |
| ||||||||||||||
| Beginning Account Value 1/1/2019 | Ending Account Value 6/30/2019 | Expenses Paid During Period 1/1/2019-6/30/2019* | |||||||||||||
| Institutional Class | |||||||||||||||
| Actual | $1,000.00 | $1,182.50 | $3.46 | ||||||||||||
| Hypothetical** | $1,000.00 | $1,021.62 | $3.21 | ||||||||||||
| Y Class | |||||||||||||||
| Actual | $1,000.00 | $1,181.80 | $3.95 | ||||||||||||
| Hypothetical** | $1,000.00 | $1,021.18 | $3.66 | ||||||||||||
| Investor Class | |||||||||||||||
| Actual | $1,000.00 | $1,180.70 | $5.68 | ||||||||||||
| Hypothetical** | $1,000.00 | $1,019.59 | $5.26 | ||||||||||||
| * | Expenses are equal to the Fund’s annualized expense ratios for thesix-month period of 0.64%, 0.73%, and 1.05% for the Institutional, Y, and Investor Classes, respectively, multiplied by the average account value over the period, multiplied by the number derived by dividing the number of days in the most recent fiscal half-year (181) by days in the year (365) to reflect the half-year period. |
| ** | 5% return before expenses. |
12
American Beacon FundsSM
Expense Examples
June 30, 2019 (Unaudited)
| American Beacon Alpha Quant Quality Fund |
| ||||||||||||||
| Beginning Account Value 1/1/2019 | Ending Account Value 6/30/2019 | Expenses Paid During Period 1/1/2019-6/30/2019* | |||||||||||||
| Institutional Class | |||||||||||||||
| Actual | $1,000.00 | $1,106.30 | $3.34 | ||||||||||||
| Hypothetical** | $1,000.00 | $1,021.62 | $3.21 | ||||||||||||
| Y Class | |||||||||||||||
| Actual | $1,000.00 | $1,106.50 | $3.86 | ||||||||||||
| Hypothetical** | $1,000.00 | $1,021.13 | $3.71 | ||||||||||||
| Investor Class | |||||||||||||||
| Actual | $1,000.00 | $1,103.90 | $5.32 | ||||||||||||
| Hypothetical** | $1,000.00 | $1,019.74 | $5.11 | ||||||||||||
| * | Expenses are equal to the Fund’s annualized expense ratios for thesix-month period of 0.64%, 0.74%, and 1.02% for the Institutional, Y, and Investor Classes, respectively, multiplied by the average account value over the period, multiplied by the number derived by dividing the number of days in the most recent fiscal half-year (181) by days in the year (365) to reflect the half-year period. |
| ** | 5% return before expenses. |
| American Beacon Alpha Quant Value Fund |
| ||||||||||||||
| Beginning Account Value 1/1/2019 | Ending Account Value 6/30/2019 | Expenses Paid During Period 1/1/2019-6/30/2019* | |||||||||||||
| Institutional Class | |||||||||||||||
| Actual | $1,000.00 | $1,077.70 | $3.30 | ||||||||||||
| Hypothetical** | $1,000.00 | $1,021.62 | $3.21 | ||||||||||||
| Y Class | |||||||||||||||
| Actual | $1,000.00 | $1,077.90 | $3.81 | ||||||||||||
| Hypothetical** | $1,000.00 | $1,021.13 | $3.71 | ||||||||||||
| Investor Class | |||||||||||||||
| Actual | $1,000.00 | $1,076.20 | $5.30 | ||||||||||||
| Hypothetical** | $1,000.00 | $1,019.69 | $5.16 | ||||||||||||
| * | Expenses are equal to the Fund’s annualized expense ratios for thesix-month period of 0.64%, 0.74%, and 1.03% for the Institutional, Y, and Investor Classes, respectively, multiplied by the average account value over the period, multiplied by the number derived by dividing the number of days in the most recent fiscal half-year (181) by days in the year (365) to reflect the half-year period. |
| ** | 5% return before expenses. |
13
American Beacon FundsSM
Report of Independent Registered Public Accounting Firm
Tothe Board of Trustees of American Beacon Funds and Shareholders of American Beacon Alpha Quant Core Fund, American Beacon Alpha Quant Dividend Fund, American Beacon Alpha Quant Quality Fund, and American Beacon Alpha Quant Value Fund
Opinions on the Financial Statements
We have audited the accompanying statements of assets and liabilities, including the schedules of investments, of American Beacon Alpha Quant Core Fund, American Beacon Alpha Quant Dividend Fund, American Beacon Alpha Quant Quality Fund, and American Beacon Alpha Quant Value Fund (four of the series constituting American Beacon Funds, referred to hereafter as the “Funds”) as of June 30, 2019, the related statements of operationsfor the year ended June 30, 2019, the statements of changes in net assets for each of the two years in the period ended June 30, 2019, including the related notes, and the financial highlights for the years ended June 30, 2019 and 2018, and for the period March 22, 2017 (commencement of operations) through June 30, 2017 (collectively referred to as the “financial statements”). In our opinion, the financial statements present fairly, in all material respects, the financial position of each of the Funds as of June 30, 2019, the results of each of their operations for the year ended June 30, 2019, the changes in each of their net assets for each of the two years in the period ended June 30, 2019 and the financial highlights of each of the Funds for the years ended June 30, 2019 and 2018, and for the period March 22, 2017 (commencement of operations) through June 30, 2017 in conformity with accounting principles generally accepted in the United States of America.
Basis for Opinions
These financial statements are the responsibility of the Funds’ management. Our responsibility is to express an opinion on the Funds’ financial statements based on our audits. We are a public accounting firm registered with the Public Company Accounting Oversight Board (United States) (PCAOB) and are required to be independent with respect to the Funds in accordance with the U.S. federal securities laws and the applicable rules and regulations of the Securities and Exchange Commission and the PCAOB.
We conducted our audits of these financial statements in accordance with the standards of the PCAOB. Those standards require that we plan and perform the audit to obtain reasonable assurance about whether the financial statements are free of material misstatement, whether due to error or fraud.
Our audits included performing procedures to assess the risks of material misstatement of the financial statements, whether due to error or fraud, and performing procedures that respond to those risks. Such procedures included examining, on a test basis, evidence regarding the amounts and disclosures in the financial statements. Our audits also included evaluating the accounting principles used and significant estimates made by management, as well as evaluating the overall presentation of the financial statements. Our procedures included confirmation of securities owned as of June 30, 2019 by correspondence with the custodian and transfer agent. We believe that our audits provide a reasonable basis for our opinions.
PricewaterhouseCoopers LLP
Dallas, TX
August 27, 2019
We have served as the auditor of one or more investment companies in the American Beacon family of funds since 2016.
14
American Beacon Alpha Quant Core FundSM
Schedule of Investments
June 30, 2019
| Shares | Fair Value | ||||||||||||||
| COMMON STOCKS - 99.19% | |||||||||||||||
| Communication Services - 4.02% | |||||||||||||||
| Interactive Media & Services - 2.39% | |||||||||||||||
| Facebook, Inc., Class AA | 397 | $ | 76,621 | ||||||||||||
|
| ||||||||||||||
| Media - 1.63% | |||||||||||||||
| Omnicom Group, Inc. | 636 | 52,120 | |||||||||||||
|
| ||||||||||||||
Total Communication Services | 128,741 | ||||||||||||||
|
| ||||||||||||||
| Consumer Discretionary - 16.44% | |||||||||||||||
| Hotels, Restaurants & Leisure - 3.89% | |||||||||||||||
| Starbucks Corp. | 825 | 69,160 | |||||||||||||
| Yum! Brands, Inc. | 501 | 55,446 | |||||||||||||
|
| ||||||||||||||
| 124,606 | |||||||||||||||
|
| ||||||||||||||
| Household Durables - 2.04% | |||||||||||||||
| PulteGroup, Inc. | 2,066 | 65,327 | |||||||||||||
|
| ||||||||||||||
| Internet & Direct Marketing Retail - 1.82% | |||||||||||||||
| Booking Holdings, Inc.A | 31 | 58,116 | |||||||||||||
|
| ||||||||||||||
| Multiline Retail - 1.23% | |||||||||||||||
| Kohl’s Corp. | 831 | 39,514 | |||||||||||||
|
| ||||||||||||||
| Specialty Retail - 5.36% | |||||||||||||||
| Best Buy Co., Inc. | 1,006 | 70,148 | |||||||||||||
| Foot Locker, Inc. | 1,101 | 46,154 | |||||||||||||
| Home Depot, Inc. | 265 | 55,112 | |||||||||||||
|
| ||||||||||||||
| 171,414 | |||||||||||||||
|
| ||||||||||||||
| Textiles, Apparel & Luxury Goods - 2.10% | |||||||||||||||
| NIKE, Inc., Class B | 800 | 67,160 | |||||||||||||
|
| ||||||||||||||
Total Consumer Discretionary | 526,137 | ||||||||||||||
|
| ||||||||||||||
| Consumer Staples - 13.82% | |||||||||||||||
| Beverages - 2.21% | |||||||||||||||
| Monster Beverage Corp.A | 1,107 | 70,660 | |||||||||||||
|
| ||||||||||||||
| Food & Staples Retailing - 5.49% | |||||||||||||||
| Sysco Corp. | 900 | 63,648 | |||||||||||||
| Walgreens Boots Alliance, Inc. | 911 | 49,804 | |||||||||||||
| Walmart, Inc. | 565 | 62,427 | |||||||||||||
|
| ||||||||||||||
| 175,879 | |||||||||||||||
|
| ||||||||||||||
| Household Products - 6.12% | |||||||||||||||
| Church & Dwight Co., Inc. | 877 | 64,074 | |||||||||||||
| Clorox Co. | 411 | 62,928 | |||||||||||||
| Procter & Gamble Co. | 627 | 68,750 | |||||||||||||
|
| ||||||||||||||
| 195,752 | |||||||||||||||
|
| ||||||||||||||
Total Consumer Staples | 442,291 | ||||||||||||||
|
| ||||||||||||||
| Energy - 7.88% | |||||||||||||||
| Oil, Gas & Consumable Fuels - 7.88% | |||||||||||||||
| Cabot Oil & Gas Corp. | 2,267 | 52,050 | |||||||||||||
| ConocoPhillips | 914 | 55,754 | |||||||||||||
| HollyFrontier Corp. | 910 | 42,115 | |||||||||||||
| Marathon Petroleum Corp. | 775 | 43,307 | |||||||||||||
See accompanying notes
15
American Beacon Alpha Quant Core FundSM
Schedule of Investments
June 30, 2019
| Shares | Fair Value | ||||||||||||||
| COMMON STOCKS - 99.19% (continued) | |||||||||||||||
| Energy - 7.88% (continued) | |||||||||||||||
| Oil, Gas & Consumable Fuels - 7.88% (continued) | |||||||||||||||
| Valero Energy Corp. | 691 | $ | 59,157 | ||||||||||||
|
| ||||||||||||||
| 252,383 | |||||||||||||||
|
| ||||||||||||||
Total Energy | 252,383 | ||||||||||||||
|
| ||||||||||||||
| Health Care - 12.36% | |||||||||||||||
| Biotechnology - 6.44% | |||||||||||||||
| AbbVie, Inc. | 733 | 53,304 | |||||||||||||
| Amgen, Inc. | 306 | 56,390 | |||||||||||||
| Biogen, Inc.A | 164 | 38,355 | |||||||||||||
| Gilead Sciences, Inc. | 860 | 58,101 | |||||||||||||
|
| ||||||||||||||
| 206,150 | |||||||||||||||
|
| ||||||||||||||
| Health Care Providers & Services - 5.92% | |||||||||||||||
| AmerisourceBergen Corp. | 753 | 64,201 | |||||||||||||
| Cardinal Health, Inc. | 1,231 | 57,980 | |||||||||||||
| McKesson Corp. | 500 | 67,195 | |||||||||||||
|
| ||||||||||||||
| 189,376 | |||||||||||||||
|
| ||||||||||||||
Total Health Care | 395,526 | ||||||||||||||
|
| ||||||||||||||
| Industrials - 12.70% | |||||||||||||||
| Aerospace & Defense - 3.91% | |||||||||||||||
| Boeing Co. | 190 | 69,162 | |||||||||||||
| Lockheed Martin Corp. | 154 | 55,985 | |||||||||||||
|
| ||||||||||||||
| 125,147 | |||||||||||||||
|
| ||||||||||||||
| Air Freight & Logistics - 3.40% | |||||||||||||||
| CH Robinson Worldwide, Inc. | 621 | 52,381 | |||||||||||||
| Expeditors International of Washington, Inc. | 745 | 56,516 | |||||||||||||
|
| ||||||||||||||
| 108,897 | |||||||||||||||
|
| ||||||||||||||
| Airlines - 1.79% | |||||||||||||||
| Southwest Airlines Co. | 1,128 | 57,280 | |||||||||||||
|
| ||||||||||||||
| Machinery - 2.13% | |||||||||||||||
| Cummins, Inc. | 398 | 68,193 | |||||||||||||
|
| ||||||||||||||
| Trading Companies & Distributors - 1.47% | |||||||||||||||
| WW Grainger, Inc. | 175 | 46,940 | |||||||||||||
|
| ||||||||||||||
Total Industrials | 406,457 | ||||||||||||||
|
| ||||||||||||||
| Information Technology - 26.79% | |||||||||||||||
| Communications Equipment - 3.47% | |||||||||||||||
| Cisco Systems, Inc. | 1,166 | 63,815 | |||||||||||||
| F5 Networks, Inc.A | 324 | 47,184 | |||||||||||||
|
| ||||||||||||||
| 110,999 | |||||||||||||||
|
| ||||||||||||||
| IT Services - 5.66% | |||||||||||||||
| Mastercard, Inc., Class A | 228 | 60,313 | |||||||||||||
| VeriSign, Inc.A | 267 | 55,846 | |||||||||||||
| Visa, Inc., Class A | 375 | 65,081 | |||||||||||||
|
| ||||||||||||||
| 181,240 | |||||||||||||||
|
| ||||||||||||||
See accompanying notes
16
American Beacon Alpha Quant Core FundSM
Schedule of Investments
June 30, 2019
| Shares | Fair Value | ||||||||||||||
| COMMON STOCKS - 99.19% (continued) | |||||||||||||||
| Information Technology - 26.79% (continued) | |||||||||||||||
| Semiconductors & Semiconductor Equipment - 8.30% | |||||||||||||||
| Applied Materials, Inc. | 1,480 | $ | 66,467 | ||||||||||||
| Lam Research Corp. | 449 | 84,340 | |||||||||||||
| Micron Technology, Inc.A | 1,515 | 58,464 | |||||||||||||
| Texas Instruments, Inc. | 491 | 56,347 | |||||||||||||
|
| ||||||||||||||
| 265,618 | |||||||||||||||
|
| ||||||||||||||
| Software - 1.71% | |||||||||||||||
| Intuit, Inc. | 210 | 54,879 | |||||||||||||
|
| ||||||||||||||
| Technology Hardware, Storage & Peripherals - 7.65% | |||||||||||||||
| Apple, Inc. | 384 | 76,001 | |||||||||||||
| HP, Inc. | 2,599 | 54,033 | |||||||||||||
| NetApp, Inc. | 869 | 53,618 | |||||||||||||
| Seagate Technology PLC | 1,300 | 61,256 | |||||||||||||
|
| ||||||||||||||
| 244,908 | |||||||||||||||
|
| ||||||||||||||
Total Information Technology | 857,644 | ||||||||||||||
|
| ||||||||||||||
| Materials - 5.18% | |||||||||||||||
| Chemicals - 3.39% | |||||||||||||||
| CF Industries Holdings, Inc. | 1,060 | 49,513 | |||||||||||||
| LyondellBasell Industries N.V., Class A | 687 | 59,171 | |||||||||||||
|
| ||||||||||||||
| 108,684 | |||||||||||||||
|
| ||||||||||||||
| Metals & Mining - 1.79% | |||||||||||||||
| Nucor Corp. | 1,038 | 57,194 | |||||||||||||
|
| ||||||||||||||
Total Materials | 165,878 | ||||||||||||||
|
| ||||||||||||||
Total Common Stocks (Cost $3,021,280) | 3,175,057 | ||||||||||||||
|
| ||||||||||||||
| SHORT-TERM INVESTMENTS - 0.94% (Cost $30,049) | |||||||||||||||
| Investment Companies - 0.94% | |||||||||||||||
| American Beacon U.S. Government Money Market Select Fund, Select Class, 2.32%B C | 30,049 | 30,049 | |||||||||||||
|
| ||||||||||||||
TOTAL INVESTMENTS - 100.13% (Cost $3,051,329) | 3,205,106 | ||||||||||||||
LIABILITIES, NET OF OTHER ASSETS - (0.13%) | (4,306 | ) | |||||||||||||
|
| ||||||||||||||
TOTAL NET ASSETS - 100.00% | $ | 3,200,800 | |||||||||||||
|
| ||||||||||||||
| Percentages are stated as a percent of net assets. | |||||||||||||||
ANon-income producing security.
B The Fund is affiliated by having the same investment advisor.
C7-day yield.
PLC - Public Limited Company.
The Fund’s investments are summarized by level based on the inputs used to determine their values. As of June 30, 2019, the investments were classified as described below:
Alpha Quant Core Fund | Level 1 | Level 2 | Level 3 | Total | ||||||||||||||||||||||||
Assets | ||||||||||||||||||||||||||||
Common Stocks | $ | 3,175,057 | $ | - | $ | - | $ | 3,175,057 | ||||||||||||||||||||
Short-Term Investments | 30,049 | - | - | 30,049 | ||||||||||||||||||||||||
|
|
|
|
|
|
|
| |||||||||||||||||||||
Total Investments in Securities - Assets | $ | 3,205,106 | $ | - | $ | - | $ | 3,205,106 | ||||||||||||||||||||
|
|
|
|
|
|
|
| |||||||||||||||||||||
U.S. GAAP requires transfers between all levels to/from level 3 be disclosed. During the year ended June 30, 2019, there were no transfers into or out of Level 3.
See accompanying notes
17
American Beacon Alpha Quant Dividend FundSM
Schedule of Investments
June 30, 2019
| Shares | Fair Value | ||||||||||||||
| COMMON STOCKS - 98.95% | |||||||||||||||
| Communication Services - 5.88% | |||||||||||||||
| Diversified Telecommunication Services - 2.95% | |||||||||||||||
| Verizon Communications, Inc. | 1,919 | $ | 109,632 | ||||||||||||
|
| ||||||||||||||
| Media - 2.93% | |||||||||||||||
| Omnicom Group, Inc. | 1,329 | 108,912 | |||||||||||||
|
| ||||||||||||||
Total Communication Services | 218,544 | ||||||||||||||
|
| ||||||||||||||
| Consumer Discretionary - 3.70% | |||||||||||||||
| Multiline Retail - 3.70% | |||||||||||||||
| Target Corp. | 1,590 | 137,710 | |||||||||||||
|
| ||||||||||||||
| Consumer Staples - 13.00% | |||||||||||||||
| Beverages - 6.26% | |||||||||||||||
| Coca-Cola Co. | 2,139 | 108,918 | |||||||||||||
| PepsiCo, Inc. | 943 | 123,656 | |||||||||||||
|
| ||||||||||||||
| 232,574 | |||||||||||||||
|
| ||||||||||||||
| Household Products - 6.74% | |||||||||||||||
| Kimberly-Clark Corp. | 931 | 124,083 | |||||||||||||
| Procter & Gamble Co. | 1,155 | 126,646 | |||||||||||||
|
| ||||||||||||||
| 250,729 | |||||||||||||||
|
| ||||||||||||||
Total Consumer Staples | 483,303 | ||||||||||||||
|
| ||||||||||||||
| Energy - 6.26% | |||||||||||||||
| Oil, Gas & Consumable Fuels - 6.26% | |||||||||||||||
| Chevron Corp. | 946 | 117,720 | |||||||||||||
| Exxon Mobil Corp. | 1,504 | 115,252 | |||||||||||||
|
| ||||||||||||||
| 232,972 | |||||||||||||||
|
| ||||||||||||||
Total Energy | 232,972 | ||||||||||||||
|
| ||||||||||||||
| Financials - 3.71% | |||||||||||||||
| Insurance - 3.71% | |||||||||||||||
| Principal Financial Group, Inc. | 2,381 | 137,907 | |||||||||||||
|
| ||||||||||||||
| Health Care - 12.01% | |||||||||||||||
| Biotechnology - 3.05% | |||||||||||||||
| Amgen, Inc. | 615 | 113,332 | |||||||||||||
|
| ||||||||||||||
| Health Care Providers & Services - 2.95% | |||||||||||||||
| Cardinal Health, Inc. | 2,327 | 109,602 | |||||||||||||
|
| ||||||||||||||
| Pharmaceuticals - 6.01% | |||||||||||||||
| Johnson & Johnson | 828 | 115,324 | |||||||||||||
| Pfizer, Inc. | 2,501 | 108,343 | |||||||||||||
|
| ||||||||||||||
| 223,667 | |||||||||||||||
|
| ||||||||||||||
Total Health Care | 446,601 | ||||||||||||||
|
| ||||||||||||||
| Industrials - 13.58% | |||||||||||||||
| Aerospace & Defense - 3.87% | |||||||||||||||
| Lockheed Martin Corp. | 396 | 143,962 | |||||||||||||
|
| ||||||||||||||
| Air Freight & Logistics - 3.16% | |||||||||||||||
| United Parcel Service, Inc., Class B | 1,138 | 117,521 | |||||||||||||
|
| ||||||||||||||
See accompanying notes
18
American Beacon Alpha Quant Dividend FundSM
Schedule of Investments
June 30, 2019
| Shares | Fair Value | ||||||||||||||
| COMMON STOCKS - 98.95% (continued) | |||||||||||||||
| Industrials - 13.58% (continued) | |||||||||||||||
| Electrical Equipment - 2.93% | |||||||||||||||
| Emerson Electric Co. | 1,632 | $ | 108,887 | ||||||||||||
|
| ||||||||||||||
| Machinery - 3.62% | |||||||||||||||
| Cummins, Inc. | 785 | 134,502 | |||||||||||||
|
| ||||||||||||||
Total Industrials | 504,872 | ||||||||||||||
|
| ||||||||||||||
| Information Technology - 10.21% | |||||||||||||||
| Communications Equipment - 3.52% | |||||||||||||||
| Cisco Systems, Inc. | 2,395 | 131,078 | |||||||||||||
|
| ||||||||||||||
| IT Services - 3.39% | |||||||||||||||
| International Business Machines Corp. | 913 | 125,903 | |||||||||||||
|
| ||||||||||||||
| Semiconductors & Semiconductor Equipment - 3.30% | |||||||||||||||
| Texas Instruments, Inc. | 1,071 | 122,908 | |||||||||||||
|
| ||||||||||||||
Total Information Technology | 379,889 | ||||||||||||||
|
| ||||||||||||||
| Materials - 11.03% | |||||||||||||||
| Chemicals - 11.03% | |||||||||||||||
| Air Products & Chemicals, Inc. | 649 | 146,914 | |||||||||||||
| Ecolab, Inc. | 725 | 143,144 | |||||||||||||
| PPG Industries, Inc. | 1,028 | 119,978 | |||||||||||||
|
| ||||||||||||||
| 410,036 | |||||||||||||||
|
| ||||||||||||||
Total Materials | 410,036 | ||||||||||||||
|
| ||||||||||||||
| Real Estate - 6.59% | |||||||||||||||
| Equity Real Estate Investment Trusts (REITs) - 6.59% | |||||||||||||||
| Ventas, Inc. | 1,768 | 120,843 | |||||||||||||
| Welltower, Inc. | 1,526 | 124,415 | |||||||||||||
|
| ||||||||||||||
| 245,258 | |||||||||||||||
|
| ||||||||||||||
Total Real Estate | 245,258 | ||||||||||||||
|
| ||||||||||||||
| Utilities - 12.98% | |||||||||||||||
| Electric Utilities - 9.74% | |||||||||||||||
| American Electric Power Co., Inc. | 1,401 | 123,302 | |||||||||||||
| Duke Energy Corp. | 1,220 | 107,653 | |||||||||||||
| Southern Co. | 2,378 | 131,456 | |||||||||||||
|
| ||||||||||||||
| 362,411 | |||||||||||||||
|
| ||||||||||||||
| Multi-Utilities - 3.24% | |||||||||||||||
| Consolidated Edison, Inc. | 1,373 | 120,384 | |||||||||||||
|
| ||||||||||||||
Total Utilities | 482,795 | ||||||||||||||
|
| ||||||||||||||
Total Common Stocks (Cost $3,319,191) | 3,679,887 | ||||||||||||||
|
| ||||||||||||||
| SHORT-TERM INVESTMENTS - 1.01% (Cost $37,675) | |||||||||||||||
| Investment Companies - 1.01% | |||||||||||||||
| American Beacon U.S. Government Money Market Select Fund, Select Class, 2.32%A B | 37,675 | 37,675 | |||||||||||||
|
| ||||||||||||||
TOTAL INVESTMENTS - 99.96% (Cost $3,356,866) | 3,717,562 | ||||||||||||||
OTHER ASSETS, NET OF LIABILITIES - 0.04% | 1,519 | ||||||||||||||
|
| ||||||||||||||
TOTAL NET ASSETS - 100.00% | $ | 3,719,081 | |||||||||||||
|
| ||||||||||||||
See accompanying notes
19
American Beacon Alpha Quant Dividend FundSM
Schedule of Investments
June 30, 2019
| Percentages are stated as a percent of net assets. |
A The Fund is affiliated by having the same investment advisor.
B7-day yield.
The Fund’s investments are summarized by level based on the inputs used to determine their values. As of June 30, 2019, the investments were classified as described below:
Alpha Quant Dividend Fund | Level 1 | Level 2 | Level 3 | Total | ||||||||||||||||||||||||
Assets |
| |||||||||||||||||||||||||||
Common Stocks | $ | 3,679,887 | $ | - | $ | - | $ | 3,679,887 | ||||||||||||||||||||
Short-Term Investments | 37,675 | - | - | 37,675 | ||||||||||||||||||||||||
|
|
|
|
|
|
|
| |||||||||||||||||||||
Total Investments in Securities - Assets | $ | 3,717,562 | $ | - | $ | - | $ | 3,717,562 | ||||||||||||||||||||
|
|
|
|
|
|
|
| |||||||||||||||||||||
U.S. GAAP requires transfers between all levels to/from level 3 be disclosed. During the year ended June 30, 2019, there were no transfers into or out of Level 3.
See accompanying notes
20
American Beacon Alpha Quant Quality FundSM
Schedule of Investments
June 30, 2019
| Shares | Fair Value | ||||||||||||||
| COMMON STOCKS - 99.60% | |||||||||||||||
| Communication Services - 4.12% | |||||||||||||||
| Interactive Media & Services - 4.12% | |||||||||||||||
| Facebook, Inc., Class AA | 579 | $ | 111,747 | ||||||||||||
|
| ||||||||||||||
| Consumer Discretionary - 19.44% | |||||||||||||||
| Hotels, Restaurants & Leisure - 6.28% | |||||||||||||||
| Starbucks Corp. | 727 | 60,945 | |||||||||||||
| Yum! Brands, Inc. | 988 | 109,342 | |||||||||||||
|
| ||||||||||||||
| 170,287 | |||||||||||||||
|
| ||||||||||||||
| Internet & Direct Marketing Retail - 3.81% | |||||||||||||||
| Booking Holdings, Inc.A | 55 | 103,109 | |||||||||||||
|
| ||||||||||||||
| Specialty Retail - 6.07% | |||||||||||||||
| Best Buy Co., Inc. | 1,400 | 97,622 | |||||||||||||
| Home Depot, Inc. | 321 | 66,758 | |||||||||||||
|
| ||||||||||||||
| 164,380 | |||||||||||||||
|
| ||||||||||||||
| Textiles, Apparel & Luxury Goods - 3.28% | |||||||||||||||
| NIKE, Inc., Class B | 1,058 | 88,819 | |||||||||||||
|
| ||||||||||||||
Total Consumer Discretionary | 526,595 | ||||||||||||||
|
| ||||||||||||||
| Consumer Staples - 18.13% | |||||||||||||||
| Beverages - 3.70% | |||||||||||||||
| Monster Beverage Corp.A | 1,571 | 100,277 | |||||||||||||
|
| ||||||||||||||
| Food & Staples Retailing - 3.67% | |||||||||||||||
| Sysco Corp. | 1,405 | 99,362 | |||||||||||||
|
| ||||||||||||||
| Household Products - 10.76% | |||||||||||||||
| Church & Dwight Co., Inc. | 1,295 | 94,613 | |||||||||||||
| Clorox Co. | 631 | 96,612 | |||||||||||||
| Procter & Gamble Co. | 914 | 100,220 | |||||||||||||
|
| ||||||||||||||
| 291,445 | |||||||||||||||
|
| ||||||||||||||
Total Consumer Staples | 491,084 | ||||||||||||||
|
| ||||||||||||||
| Energy - 1.90% | |||||||||||||||
| Oil, Gas & Consumable Fuels - 1.90% | |||||||||||||||
| Cabot Oil & Gas Corp. | 2,237 | 51,361 | |||||||||||||
|
| ||||||||||||||
| Health Care - 8.46% | |||||||||||||||
| Biotechnology - 5.22% | |||||||||||||||
| AbbVie, Inc. | 964 | 70,102 | |||||||||||||
| Biogen, Inc.A | 305 | 71,330 | |||||||||||||
|
| ||||||||||||||
| 141,432 | |||||||||||||||
|
| ||||||||||||||
| Health Care Providers & Services - 3.24% | |||||||||||||||
| AmerisourceBergen Corp. | 1,030 | 87,818 | |||||||||||||
|
| ||||||||||||||
Total Health Care | 229,250 | ||||||||||||||
|
| ||||||||||||||
| Industrials - 16.59% | |||||||||||||||
| Aerospace & Defense - 7.72% | |||||||||||||||
| Boeing Co. | 271 | 98,647 | |||||||||||||
| Lockheed Martin Corp. | 304 | 110,516 | |||||||||||||
|
| ||||||||||||||
| 209,163 | |||||||||||||||
|
| ||||||||||||||
See accompanying notes
21
American Beacon Alpha Quant Quality FundSM
Schedule of Investments
June 30, 2019
| Shares | Fair Value | ||||||||||||||
| COMMON STOCKS - 99.60% (continued) | |||||||||||||||
| Industrials - 16.59% (continued) | |||||||||||||||
| Air Freight & Logistics - 6.35% | |||||||||||||||
| CH Robinson Worldwide, Inc. | 972 | $ | 81,988 | ||||||||||||
| Expeditors International of Washington, Inc. | 1,188 | 90,122 | |||||||||||||
|
| ||||||||||||||
| 172,110 | |||||||||||||||
|
| ||||||||||||||
| Trading Companies & Distributors - 2.52% | |||||||||||||||
| WW Grainger, Inc. | 254 | 68,130 | |||||||||||||
|
| ||||||||||||||
Total Industrials | 449,403 | ||||||||||||||
|
| ||||||||||||||
| Information Technology - 27.81% | |||||||||||||||
| IT Services - 12.26% | |||||||||||||||
| Mastercard, Inc., Class A | 450 | 119,038 | |||||||||||||
| VeriSign, Inc.A | 526 | 110,018 | |||||||||||||
| Visa, Inc., Class A | 594 | 103,089 | |||||||||||||
|
| ||||||||||||||
| 332,145 | |||||||||||||||
|
| ||||||||||||||
| Semiconductors & Semiconductor Equipment - 7.79% | |||||||||||||||
| Applied Materials, Inc. | 2,225 | 99,925 | |||||||||||||
| Lam Research Corp. | 296 | 55,600 | |||||||||||||
| Texas Instruments, Inc. | 484 | 55,544 | |||||||||||||
|
| ||||||||||||||
| 211,069 | |||||||||||||||
|
| ||||||||||||||
| Software - 4.00% | |||||||||||||||
| Intuit, Inc. | 414 | 108,191 | |||||||||||||
|
| ||||||||||||||
| Technology Hardware, Storage & Peripherals - 3.76% | |||||||||||||||
| Apple, Inc. | 515 | 101,929 | |||||||||||||
|
| ||||||||||||||
Total Information Technology | 753,334 | ||||||||||||||
|
| ||||||||||||||
| Materials - 3.15% | |||||||||||||||
| Chemicals - 3.15% | |||||||||||||||
| LyondellBasell Industries N.V., Class A | 990 | 85,269 | |||||||||||||
|
| ||||||||||||||
Total Common Stocks (Cost $2,540,404) | 2,698,043 | ||||||||||||||
|
| ||||||||||||||
| SHORT-TERM INVESTMENTS - 0.66% (Cost $17,968) | |||||||||||||||
| Investment Companies - 0.66% | |||||||||||||||
| American Beacon U.S. Government Money Market Select Fund, Select Class, 2.32%B C | 17,968 | 17,968 | |||||||||||||
|
| ||||||||||||||
TOTAL INVESTMENTS - 100.26% (Cost $2,558,372) | 2,716,011 | ||||||||||||||
LIABILITIES, NET OF OTHER ASSETS - (0.26%) | (7,096 | ) | |||||||||||||
|
| ||||||||||||||
TOTAL NET ASSETS - 100.00% | $ | 2,708,915 | |||||||||||||
|
| ||||||||||||||
| Percentages are stated as a percent of net assets. | |||||||||||||||
ANon-income producing security.
B The Fund is affiliated by having the same investment advisor.
C7-day yield.
See accompanying notes
22
American Beacon Alpha Quant Quality FundSM
Schedule of Investments
June 30, 2019
The Fund’s investments are summarized by level based on the inputs used to determine their values. As of June 30, 2019, the investments were classified as described below:
Alpha Quant Quality Fund | Level 1 | Level 2 | Level 3 | Total | ||||||||||||||||||||||||
Assets | ||||||||||||||||||||||||||||
Common Stocks | $ | 2,698,043 | $ | - | $ | - | $ | 2,698,043 | ||||||||||||||||||||
Short-Term Investments | 17,968 | - | - | 17,968 | ||||||||||||||||||||||||
|
|
|
|
|
|
|
| |||||||||||||||||||||
Total Investments in Securities - Assets | $ | 2,716,011 | $ | - | $ | - | $ | 2,716,011 | ||||||||||||||||||||
|
|
|
|
|
|
|
| |||||||||||||||||||||
U.S. GAAP requires transfers between all levels to/from level 3 be disclosed. During the year ended June 30, 2019, there were no transfers into or out of Level 3.
See accompanying notes
23
American Beacon Alpha Quant Value FundSM
Schedule of Investments
June 30, 2019
| Shares | Fair Value | ||||||||||||||
| COMMON STOCKS - 99.03% | |||||||||||||||
| Communication Services - 3.57% | |||||||||||||||
| Media - 3.57% | |||||||||||||||
| Omnicom Group, Inc. | 1,758 | $ | 144,068 | ||||||||||||
|
| ||||||||||||||
| Consumer Discretionary - 13.73% | |||||||||||||||
| Hotels, Restaurants & Leisure - 4.22% | |||||||||||||||
| Starbucks Corp. | 2,030 | 170,175 | |||||||||||||
|
| ||||||||||||||
| Household Durables - 3.90% | |||||||||||||||
| PulteGroup, Inc. | 4,967 | 157,056 | |||||||||||||
|
| ||||||||||||||
| Multiline Retail - 2.67% | |||||||||||||||
| Kohl’s Corp. | 2,261 | 107,511 | |||||||||||||
|
| ||||||||||||||
| Specialty Retail - 2.94% | |||||||||||||||
| Foot Locker, Inc. | 2,827 | 118,508 | |||||||||||||
|
| ||||||||||||||
Total Consumer Discretionary | 553,250 | ||||||||||||||
|
| ||||||||||||||
| Consumer Staples - 6.45% | |||||||||||||||
| Food & Staples Retailing - 6.45% | |||||||||||||||
| Walgreens Boots Alliance, Inc. | 2,129 | 116,392 | |||||||||||||
| Walmart, Inc. | 1,298 | 143,416 | |||||||||||||
|
| ||||||||||||||
| 259,808 | |||||||||||||||
|
| ||||||||||||||
Total Consumer Staples | 259,808 | ||||||||||||||
|
| ||||||||||||||
| Energy - 11.48% | |||||||||||||||
| Oil, Gas & Consumable Fuels - 11.48% | |||||||||||||||
| ConocoPhillips | 1,537 | 93,757 | |||||||||||||
| HollyFrontier Corp. | 2,628 | 121,624 | |||||||||||||
| Marathon Petroleum Corp. | 1,973 | 110,251 | |||||||||||||
| Valero Energy Corp. | 1,600 | 136,976 | |||||||||||||
|
| ||||||||||||||
| 462,608 | |||||||||||||||
|
| ||||||||||||||
Total Energy | 462,608 | ||||||||||||||
|
| ||||||||||||||
| Health Care - 18.70% | |||||||||||||||
| Biotechnology - 8.76% | |||||||||||||||
| Amgen, Inc. | 666 | 122,731 | |||||||||||||
| Biogen, Inc.A | 395 | 92,379 | |||||||||||||
| Gilead Sciences, Inc. | 2,040 | 137,822 | |||||||||||||
|
| ||||||||||||||
| 352,932 | |||||||||||||||
|
| ||||||||||||||
| Health Care Providers & Services - 9.94% | |||||||||||||||
| AmerisourceBergen Corp. | 1,064 | 90,717 | |||||||||||||
| Cardinal Health, Inc. | 3,305 | 155,665 | |||||||||||||
| McKesson Corp. | 1,146 | 154,011 | |||||||||||||
|
| ||||||||||||||
| 400,393 | |||||||||||||||
|
| ||||||||||||||
Total Health Care | 753,325 | ||||||||||||||
|
| ||||||||||||||
| Industrials - 10.46% | |||||||||||||||
| Aerospace & Defense - 3.82% | |||||||||||||||
| Boeing Co. | 422 | 153,612 | |||||||||||||
|
| ||||||||||||||
| Airlines - 2.73% | |||||||||||||||
| Southwest Airlines Co. | 2,167 | 110,040 | |||||||||||||
|
| ||||||||||||||
See accompanying notes
24
American Beacon Alpha Quant Value FundSM
Schedule of Investments
June 30, 2019
| Shares | Fair Value | ||||||||||||||
| COMMON STOCKS - 99.03% (continued) | |||||||||||||||
| Industrials - 10.46% (continued) | |||||||||||||||
| Machinery - 3.91% | |||||||||||||||
| Cummins, Inc. | 920 | $ | 157,633 | ||||||||||||
|
| ||||||||||||||
Total Industrials | 421,285 | ||||||||||||||
|
| ||||||||||||||
| Information Technology - 25.53% | |||||||||||||||
| Communications Equipment - 6.56% | |||||||||||||||
| Cisco Systems, Inc. | 2,776 | 151,931 | |||||||||||||
| F5 Networks, Inc.A | 772 | 112,426 | |||||||||||||
|
| ||||||||||||||
| 264,357 | |||||||||||||||
|
| ||||||||||||||
| Semiconductors & Semiconductor Equipment - 8.85% | |||||||||||||||
| Lam Research Corp. | 1,000 | 187,840 | |||||||||||||
| Micron Technology, Inc.A | 4,377 | 168,909 | |||||||||||||
|
| ||||||||||||||
| 356,749 | |||||||||||||||
|
| ||||||||||||||
| Technology Hardware, Storage & Peripherals - 10.12% | |||||||||||||||
| HP, Inc. | 5,986 | 124,449 | |||||||||||||
| NetApp, Inc. | 2,154 | 132,902 | |||||||||||||
| Seagate Technology PLC | 3,187 | 150,171 | |||||||||||||
|
| ||||||||||||||
| 407,522 | |||||||||||||||
|
| ||||||||||||||
Total Information Technology | 1,028,628 | ||||||||||||||
|
| ||||||||||||||
| Materials - 9.11% | |||||||||||||||
| Chemicals - 6.72% | |||||||||||||||
| CF Industries Holdings, Inc. | 2,982 | 139,289 | |||||||||||||
| LyondellBasell Industries N.V., Class A | 1,527 | 131,521 | |||||||||||||
|
| ||||||||||||||
| 270,810 | |||||||||||||||
|
| ||||||||||||||
| Metals & Mining - 2.39% | |||||||||||||||
| Nucor Corp. | 1,746 | 96,204 | |||||||||||||
|
| ||||||||||||||
Total Materials | 367,014 | ||||||||||||||
|
| ||||||||||||||
Total Common Stocks (Cost $3,978,957) | 3,989,986 | ||||||||||||||
|
| ||||||||||||||
| SHORT-TERM INVESTMENTS - 0.86% (Cost $34,768) | |||||||||||||||
| Investment Companies - 0.86% | |||||||||||||||
| American Beacon U.S. Government Money Market Select Fund, Select Class, 2.32%B C | 34,768 | 34,768 | |||||||||||||
|
| ||||||||||||||
TOTAL INVESTMENTS - 99.89% (Cost $4,013,725) | 4,024,754 | ||||||||||||||
OTHER ASSETS, NET OF LIABILITIES - 0.11% | 4,340 | ||||||||||||||
|
| ||||||||||||||
TOTAL NET ASSETS - 100.00% | $ | 4,029,094 | |||||||||||||
|
| ||||||||||||||
| Percentages are stated as a percent of net assets. | |||||||||||||||
ANon-income producing security.
B The Fund is affiliated by having the same investment advisor.
C7-day yield.
PLC - Public Limited Company.
See accompanying notes
25
American Beacon Alpha Quant Value FundSM
Schedule of Investments
June 30, 2019
The Fund’s investments are summarized by level based on the inputs used to determine their values. As of June 30, 2019, the investments were classified as described below:
Alpha Quant Value Fund | Level 1 | Level 2 | Level 3 | Total | ||||||||||||||||||||||||
Assets |
| |||||||||||||||||||||||||||
Common Stocks | $ | 3,989,986 | $ | - | $ | - | $ | 3,989,986 | ||||||||||||||||||||
Short-Term Investments | 34,768 | - | - | 34,768 | ||||||||||||||||||||||||
|
|
|
|
|
|
|
| |||||||||||||||||||||
Total Investments in Securities - Assets | $ | 4,024,754 | $ | - | $ | - | $ | 4,024,754 | ||||||||||||||||||||
|
|
|
|
|
|
|
| |||||||||||||||||||||
U.S. GAAP requires transfers between all levels to/from level 3 be disclosed. During the year ended June 30, 2019, there were no transfers into or out of Level 3.
See accompanying notes
26
American Beacon FundsSM
Statements of Assets and Liabilities
June 30, 2019
| Alpha Quant Core Fund | Alpha Quant Dividend Fund | Alpha Quant Quality Fund | Alpha Quant Value Fund | |||||||||||||||||||||||||
Assets: | ||||||||||||||||||||||||||||
Investments in unaffiliated securities, at fair value† | $ | 3,175,057 | $ | 3,679,887 | $ | 2,698,043 | $ | 3,989,986 | ||||||||||||||||||||
Investments in affiliated securities, at fair value‡ | 30,049 | 37,675 | 17,968 | 34,768 | ||||||||||||||||||||||||
Dividends and interest receivable | 5,153 | 6,208 | 2,276 | 9,849 | ||||||||||||||||||||||||
Receivable for fund shares sold | - | 5,000 | - | - | ||||||||||||||||||||||||
Receivable for expense reimbursement (Note 2) | 6,821 | 6,427 | 6,586 | 10,529 | ||||||||||||||||||||||||
Prepaid expenses | 23,413 | 23,556 | 23,431 | 24,677 | ||||||||||||||||||||||||
|
|
|
|
|
|
|
| |||||||||||||||||||||
Total assets | 3,240,493 | 3,758,753 | 2,748,304 | 4,069,809 | ||||||||||||||||||||||||
|
|
|
|
|
|
|
| |||||||||||||||||||||
Liabilities: | ||||||||||||||||||||||||||||
Management andsub-advisory fees payable (Note 2) | 1,539 | 1,561 | 1,304 | 2,247 | ||||||||||||||||||||||||
Transfer agent fees payable (Note 2) | 130 | 163 | 150 | 193 | ||||||||||||||||||||||||
Custody and fund accounting fees payable | 3,456 | 3,452 | 3,448 | 3,497 | ||||||||||||||||||||||||
Professional fees payable | 34,459 | 34,410 | 34,423 | 34,738 | ||||||||||||||||||||||||
Other liabilities | 109 | 86 | 64 | 40 | ||||||||||||||||||||||||
|
|
|
|
|
|
|
| |||||||||||||||||||||
Total liabilities | 39,693 | 39,672 | 39,389 | 40,715 | ||||||||||||||||||||||||
|
|
|
|
|
|
|
| |||||||||||||||||||||
Net assets | $ | 3,200,800 | $ | 3,719,081 | $ | 2,708,915 | $ | 4,029,094 | ||||||||||||||||||||
|
|
|
|
|
|
|
| |||||||||||||||||||||
Analysis of net assets: | ||||||||||||||||||||||||||||
Paid-in-capital | $ | 3,130,984 | $ | 3,453,219 | $ | 2,568,251 | $ | 4,368,781 | ||||||||||||||||||||
Total distributable earnings (deficits)A | 69,816 | 265,862 | 140,664 | (339,687 | ) | |||||||||||||||||||||||
|
|
|
|
|
|
|
| |||||||||||||||||||||
Net assets | $ | 3,200,800 | $ | 3,719,081 | $ | 2,708,915 | $ | 4,029,094 | ||||||||||||||||||||
|
|
|
|
|
|
|
| |||||||||||||||||||||
Shares outstanding at no par value (unlimited shares authorized): | ||||||||||||||||||||||||||||
Institutional Class | 261,278 | 218,917 | 216,951 | 201,069 | ||||||||||||||||||||||||
|
|
|
|
|
|
|
| |||||||||||||||||||||
Y Class | 17,939 | 61,378 | 23,545 | 97,463 | ||||||||||||||||||||||||
|
|
|
|
|
|
|
| |||||||||||||||||||||
Investor Class | 22,325 | 55,949 | 14,698 | 79,560 | ||||||||||||||||||||||||
|
|
|
|
|
|
|
| |||||||||||||||||||||
Net assets: | ||||||||||||||||||||||||||||
Institutional Class | $ | 2,775,726 | $ | 2,426,418 | $ | 2,304,794 | $ | 2,147,774 | ||||||||||||||||||||
|
|
|
|
|
|
|
| |||||||||||||||||||||
Y Class | $ | 190,121 | $ | 678,401 | $ | 249,477 | $ | 1,038,803 | ||||||||||||||||||||
|
|
|
|
|
|
|
| |||||||||||||||||||||
Investor Class | $ | 234,953 | $ | 614,262 | $ | 154,644 | $ | 842,517 | ||||||||||||||||||||
|
|
|
|
|
|
|
| |||||||||||||||||||||
Net asset value, offering and redemption price per share: | ||||||||||||||||||||||||||||
Institutional Class | $ | 10.62 | $ | 11.08 | $ | 10.62 | $ | 10.68 | ||||||||||||||||||||
|
|
|
|
|
|
|
| |||||||||||||||||||||
Y Class | $ | 10.60 | $ | 11.05 | $ | 10.60 | $ | 10.66 | ||||||||||||||||||||
|
|
|
|
|
|
|
| |||||||||||||||||||||
Investor Class | $ | 10.52 | $ | 10.98 | $ | 10.52 | $ | 10.59 | ||||||||||||||||||||
|
|
|
|
|
|
|
| |||||||||||||||||||||
† Cost of investments in unaffiliated securities | $ | 3,021,280 | $ | 3,319,191 | $ | 2,540,404 | $ | 3,978,957 | ||||||||||||||||||||
‡ Cost of investments in affiliated securities | $ | 30,049 | $ | 37,675 | $ | 17,968 | $ | 34,768 | ||||||||||||||||||||
A The Fund’s investments in affiliated securities did not have unrealized appreciation (depreciation) at year end. |
| |||||||||||||||||||||||||||
See accompanying notes
27
American Beacon FundsSM
Statements of Operations
For the year ended June 30, 2019
| Alpha Quant Core Fund | Alpha Quant Dividend Fund | Alpha Quant Quality Fund | Alpha Quant Value Fund | |||||||||||||||||||||||||
Investment income: |
| |||||||||||||||||||||||||||
Dividend income from unaffiliated securities | $ | 67,389 | $ | 94,343 | $ | 54,043 | $ | 126,373 | ||||||||||||||||||||
Dividend income from affiliated securities (Note 7) | 716 | 683 | 426 | 1,461 | ||||||||||||||||||||||||
|
|
|
|
|
|
|
| |||||||||||||||||||||
Total investment income | 68,105 | 95,026 | 54,469 | 127,834 | ||||||||||||||||||||||||
|
|
|
|
|
|
| �� | |||||||||||||||||||||
Expenses: |
| |||||||||||||||||||||||||||
Management andsub-advisory fees (Note 2) | 18,357 | 16,282 | 16,049 | 30,852 | ||||||||||||||||||||||||
Transfer agent fees: | ||||||||||||||||||||||||||||
Institutional Class (Note 2) | 238 | 97 | 77 | 85 | ||||||||||||||||||||||||
Y Class (Note 2) | 105 | 121 | 125 | 1,950 | ||||||||||||||||||||||||
Investor Class | 1,093 | 1,102 | 1,100 | 1,179 | ||||||||||||||||||||||||
Custody and fund accounting fees | 23,814 | 23,779 | 23,778 | 24,037 | ||||||||||||||||||||||||
Professional fees | 35,548 | 35,238 | 35,291 | 37,616 | ||||||||||||||||||||||||
Registration fees and expenses | 42,212 | 42,183 | 42,162 | 45,724 | ||||||||||||||||||||||||
Service fees (Note 2): | ||||||||||||||||||||||||||||
Investor Class | 6,338 | 6,847 | 6,307 | 8,394 | ||||||||||||||||||||||||
Prospectus and shareholder report expenses | 5,594 | 5,303 | 5,506 | 8,028 | ||||||||||||||||||||||||
Trustee fees (Note 2) | 216 | 191 | 189 | 370 | ||||||||||||||||||||||||
Other expenses | 2,169 | 2,144 | 2,150 | 2,656 | ||||||||||||||||||||||||
|
|
|
|
|
|
|
| |||||||||||||||||||||
Total expenses | 135,684 | 133,287 | 132,734 | 160,891 | ||||||||||||||||||||||||
|
|
|
|
|
|
|
| |||||||||||||||||||||
Net fees waived and expenses (reimbursed) (Note 2) | (114,560 | ) | (113,549 | ) | (114,115 | ) | (120,405 | ) | ||||||||||||||||||||
|
|
|
|
|
|
|
| |||||||||||||||||||||
Net expenses | 21,124 | 19,738 | 18,619 | 40,486 | ||||||||||||||||||||||||
|
|
|
|
|
|
|
| |||||||||||||||||||||
Net investment income | 46,981 | 75,288 | 35,850 | 87,348 | ||||||||||||||||||||||||
|
|
|
|
|
|
|
| |||||||||||||||||||||
Realized and unrealized gain (loss) from investments: |
| |||||||||||||||||||||||||||
Net realized gain (loss) from: | ||||||||||||||||||||||||||||
Investments in unaffiliated securitiesA | 5,134 | (115,837 | ) | 142,394 | (350,442 | ) | ||||||||||||||||||||||
Change in net unrealized appreciation (depreciation) of: | ||||||||||||||||||||||||||||
Investments in unaffiliated securitiesB | (74,039 | ) | 420,596 | (108,934 | ) | (238,325 | ) | |||||||||||||||||||||
|
|
|
|
|
|
|
| |||||||||||||||||||||
Net gain (loss) from investments | (68,905 | ) | 304,759 | 33,460 | (588,767 | ) | ||||||||||||||||||||||
|
|
|
|
|
|
|
| |||||||||||||||||||||
Net increase (decrease) in net assets resulting from operations | $ | (21,924 | ) | $ | 380,047 | $ | 69,310 | $ | (501,419 | ) | ||||||||||||||||||
|
|
|
|
|
|
|
| |||||||||||||||||||||
A The Fund did not recognize net realized gains (losses) from the sale of investments in affiliated securities. |
| |||||||||||||||||||||||||||
B The Fund’s investments in affiliated securities did not have a change in unrealized appreciation (depreciation) at year end. |
| |||||||||||||||||||||||||||
See accompanying notes
28
American Beacon FundsSM
Statements of Changes in Net Assets
| Alpha Quant Core Fund | Alpha Quant Dividend Fund | |||||||||||||||||||||||||||
| Year Ended June 30, 2019 | Year Ended June 30, 2018 | Year Ended June 30, 2019 | Year Ended June 30, 2018 | |||||||||||||||||||||||||
Increase (decrease) in net assets: | ||||||||||||||||||||||||||||
Operations: | ||||||||||||||||||||||||||||
Net investment income | $ | 46,981 | $ | 31,910 | $ | 75,288 | $ | 58,380 | ||||||||||||||||||||
Net realized gain (loss) from investments in unaffiliated securities | 5,134 | 128,511 | (115,837 | ) | 124,002 | |||||||||||||||||||||||
Change in net unrealized appreciation (depreciation) of investments in unaffiliated securities | (74,039 | ) | 188,355 | 420,596 | (45,759 | ) | ||||||||||||||||||||||
|
|
|
|
|
|
|
| |||||||||||||||||||||
Net increase (decrease) in net assets resulting from operations | (21,924 | ) | 348,776 | 380,047 | 136,623 | |||||||||||||||||||||||
|
|
|
|
|
|
|
| |||||||||||||||||||||
Distributions to shareholders: | ||||||||||||||||||||||||||||
Net investment income: | ||||||||||||||||||||||||||||
Institutional Class | - | (24,547 | ) | - | (51,025 | ) | ||||||||||||||||||||||
Y Class | - | (1,582 | ) | - | (3,219 | ) | ||||||||||||||||||||||
Investor Class | - | (1,400 | ) | - | (2,929 | ) | ||||||||||||||||||||||
Net realized gain from investments: | ||||||||||||||||||||||||||||
Institutional Class | - | - | - | (689 | ) | |||||||||||||||||||||||
Y Class | - | - | - | (45 | ) | |||||||||||||||||||||||
Investor Class | - | - | - | (39 | ) | |||||||||||||||||||||||
Total retained earnings:* | ||||||||||||||||||||||||||||
Institutional Class | (238,433 | ) | - | (152,841 | ) | - | ||||||||||||||||||||||
Y Class | (18,171 | ) | - | (8,540 | ) | - | ||||||||||||||||||||||
Investor Class | (12,329 | ) | - | (30,553 | ) | - | ||||||||||||||||||||||
|
|
|
|
|
|
|
| |||||||||||||||||||||
Net distributions to shareholders | (268,933 | ) | (27,529 | ) | (191,934 | ) | (57,946 | ) | ||||||||||||||||||||
|
|
|
|
|
|
|
| |||||||||||||||||||||
Capital share transactions (Note 10): | ||||||||||||||||||||||||||||
Proceeds from sales of shares | 714,053 | 240,724 | 1,154,394 | 239,050 | ||||||||||||||||||||||||
Reinvestment of dividends and distributions | 268,933 | 27,529 | 191,934 | 57,946 | ||||||||||||||||||||||||
Cost of shares redeemed | (121,639 | ) | (1,616 | ) | (92,297 | ) | (100,808 | ) | ||||||||||||||||||||
|
|
|
|
|
|
|
| |||||||||||||||||||||
Net increase in net assets from capital share transactions | 861,347 | 266,637 | 1,254,031 | 196,188 | ||||||||||||||||||||||||
|
|
|
|
|
|
|
| |||||||||||||||||||||
Net increase in net assets | 570,490 | 587,884 | 1,442,144 | 274,865 | ||||||||||||||||||||||||
|
|
|
|
|
|
|
| |||||||||||||||||||||
Net assets: | ||||||||||||||||||||||||||||
Beginning of period | 2,630,310 | 2,042,426 | 2,276,937 | 2,002,072 | ||||||||||||||||||||||||
|
|
|
|
|
|
|
| |||||||||||||||||||||
End of period | $ | 3,200,800 | $ | 2,630,310 | $ | 3,719,081 | $ | 2,276,937 | ||||||||||||||||||||
|
|
|
|
|
|
|
| |||||||||||||||||||||
* Distributions from net investment income and net realized capital gains are combined for the year ended June 30, 2019. See Note 1 in the Notes to Financial Statements for more information regarding new accounting pronouncements. |
| |||||||||||||||||||||||||||
See accompanying notes
29
American Beacon FundsSM
Statements of Changes in Net Assets
| Alpha Quant Quality Fund | Alpha Quant Value Fund | |||||||||||||||||||||||||||
| Year Ended June 30, 2019 | Year Ended June 30, 2018 | Year Ended June 30, 2019 | Year Ended June 30, 2018 | |||||||||||||||||||||||||
Increase (decrease) in net assets: |
| |||||||||||||||||||||||||||
Operations: |
| |||||||||||||||||||||||||||
Net investment income | $ | 35,850 | $ | 17,620 | $ | 87,348 | $ | 46,327 | ||||||||||||||||||||
Net realized gain (loss) from investments in unaffiliated securities | 142,394 | 179,184 | (350,442 | ) | 125,143 | |||||||||||||||||||||||
Change in net unrealized appreciation (depreciation) of investments in unaffiliated securities | (108,934 | ) | 243,152 | (238,325 | ) | 201,721 | ||||||||||||||||||||||
|
|
|
|
|
|
|
| |||||||||||||||||||||
Net increase (decrease) in net assets resulting from operations | 69,310 | 439,956 | (501,419 | ) | 373,191 | |||||||||||||||||||||||
|
|
|
|
|
|
|
| |||||||||||||||||||||
Distributions to shareholders: |
| |||||||||||||||||||||||||||
Net investment income: | ||||||||||||||||||||||||||||
Institutional Class | - | (14,994 | ) | - | (31,446 | ) | ||||||||||||||||||||||
Y Class | - | (976 | ) | - | (2,250 | ) | ||||||||||||||||||||||
Investor Class | - | (857 | ) | - | (1,939 | ) | ||||||||||||||||||||||
Net realized gain from investments: | ||||||||||||||||||||||||||||
Institutional Class | - | - | - | - | ||||||||||||||||||||||||
Y Class | - | - | - | - | ||||||||||||||||||||||||
Investor Class | - | - | - | - | ||||||||||||||||||||||||
Total retained earnings:* | ||||||||||||||||||||||||||||
Institutional Class | (312,405 | ) | - | (92,857 | ) | - | ||||||||||||||||||||||
Y Class | (37,253 | ) | - | (70,474 | ) | - | ||||||||||||||||||||||
Investor Class | (21,418 | ) | - | (59,407 | ) | - | ||||||||||||||||||||||
|
|
|
|
|
|
|
| |||||||||||||||||||||
Net distributions to shareholders | (371,076 | ) | (16,827 | ) | (222,738 | ) | (35,635 | ) | ||||||||||||||||||||
|
|
|
|
|
|
|
| |||||||||||||||||||||
Capital share transactions (Note 10): |
| |||||||||||||||||||||||||||
Proceeds from sales of shares | 203,591 | 28,491 | 3,645,533 | 1,140,762 | ||||||||||||||||||||||||
Reinvestment of dividends and distributions | 371,076 | 16,827 | 217,885 | 35,635 | ||||||||||||||||||||||||
Cost of shares redeemed | (54,734 | ) | - | (2,676,153 | ) | (881 | ) | |||||||||||||||||||||
|
|
|
|
|
|
|
| |||||||||||||||||||||
Net increase in net assets from capital share transactions | 519,933 | 45,318 | 1,187,265 | 1,175,516 | ||||||||||||||||||||||||
|
|
|
|
|
|
|
| |||||||||||||||||||||
Net increase in net assets | 218,167 | 468,447 | 463,108 | 1,513,072 | ||||||||||||||||||||||||
|
|
|
|
|
|
|
| |||||||||||||||||||||
Net assets: |
| |||||||||||||||||||||||||||
Beginning of period | 2,490,748 | 2,022,301 | 3,565,986 | 2,052,914 | ||||||||||||||||||||||||
|
|
|
|
|
|
|
| |||||||||||||||||||||
End of period | $ | 2,708,915 | $ | 2,490,748 | $ | 4,029,094 | $ | 3,565,986 | ||||||||||||||||||||
|
|
|
|
|
|
|
| |||||||||||||||||||||
* Distributions from net investment income and net realized capital gains are combined for the year ended June 30, 2019. See Note 1 in the Notes to Financial Statements for more information regarding new accounting pronouncements. |
| |||||||||||||||||||||||||||
See accompanying notes
30
American Beacon FundsSM
June 30, 2019
1. Organization and Significant Accounting Policies
American Beacon Funds (the “Trust”), is organized as a Massachusetts business trust. The Funds, each a series within the Trust, are registered under the Investment Company Act of 1940, as amended (the “Act”), as diversified,open-end management investment companies. As of June 30, 2019, the Trust consists of thirty-three active series, four of which are presented in this filing: American Beacon Alpha Quant Core Fund, American Beacon Alpha Quant Dividend Fund, American Beacon Alpha Quant Quality Fund, and American Beacon Alpha Quant Value Fund (collectively, the “Funds” and each individually a “Fund”). The remaining twenty-nine active series are reported in separate filings.
American Beacon Advisors, Inc. (the “Manager”) is a Delaware corporation and a wholly-owned subsidiary of Resolute Investment Managers, Inc. (“RIM”) organized in 1986 to provide business management, advisory, administrative, and asset management consulting services to the Trust and other investors. The Manager is registered as an investment advisor under the Investment Advisers Act of 1940, as amended (the “Advisers Act”). RIM is, in turn, a wholly-owned subsidiary of Resolute Acquisition, Inc., which is a wholly-owned subsidiary of Resolute Topco, Inc., a wholly-owned subsidiary of Resolute Investment Holdings, LLC (“RIH”). RIH is owned primarily by Kelso Investment Associates VIII, L.P., KEP VI, LLC and Estancia Capital Partners L.P., investment funds affiliated with Kelso & Company, L.P. (“Kelso”) or Estancia Capital Management, LLC (“Estancia”), which are private equity firms.
Recent Accounting Pronouncements
In March 2017, the Financial Accounting Standards Board (“FASB”) issued Accounting Standards Update (“ASU”)2017-08,Premium Amortization of Purchased Callable Debt Securities. The amendments in the ASU shorten the premium amortization period on a purchased callable debt security from the security’s contractual life to the earliest call date. It is anticipated that this change will enhance disclosures by reducing losses recognized when a security is called on an earlier date. This ASU is effective for fiscal years beginning after December 15, 2018. The Manager continues to evaluate the impact this ASU will have on the financial statements and other disclosures.
In August 2018, the FASB issued ASU2018-13,Fair Value Measurement (“Topic 820”). The amendments in the ASU impact disclosure requirements for fair value measurement. It is anticipated that this change will enhance the effectiveness of disclosures in the notes to the financial statements. This ASU is effective for fiscal years beginning after December 15, 2019. Early adoption is permitted and can include the entire standard or certain provisions that exclude or amend disclosures. For the year ended June 30, 2019, the Funds have chosen to adopt the standard. The adoption of this ASU guidance did not have a material impact on the financial statements and other disclosures.
In August 2018, the U.S. Securities and Exchange Commission (“SEC”) adopted amendments to certain disclosure requirements in Securities Act ReleaseNo. 33-10532, Disclosure Update and Simplification, which is intended to facilitate the disclosure of information to investors and simplify compliance without significantly altering the total mix of information provided to investors. Effective with the current reporting period, the Funds adopted the amendments with the impacts being that the Funds are no longer required to present components of distributable earnings on the Statements of Assets and Liabilities or the sources of distributable earnings and the amount of undistributed net investment income on the Statements of Changes in Net Assets.
31
American Beacon FundsSM
Notes to Financial Statements
June 30, 2019
Class Disclosure
Each Fund has multiple classes of shares designed to meet the needs of different groups of investors. The following table sets forth the differences amongst the classes:
Class | Eligible Investors | Minimum Initial Investments | ||||
| Institutional | Large institutional investors - sold directly through intermediary channels. | $ | 250,000 | |||
| Y Class | Large institutional retirement plan investors - sold directly or through intermediary channels. | $ | 100,000 | |||
| Investor | All investors using intermediary organizations, such as broker-dealers or retirement plan sponsors. | $ | 2,500 | |||
Each class offered by the Trust has equal rights as to assets and voting privileges. Income andnon-class specific expenses are allocated daily to each class based on the relative net assets. Realized and unrealized capital gains and losses of each class are allocated daily based on the relative net assets of each class of the respective Fund. Class specific expenses, where applicable, currently include service, distribution, transfer agent fees, andsub-transfer agent fees that vary amongst the classes as described more fully in Note 2.
Significant Accounting Policies
The following is a summary of significant accounting policies, consistently followed by the Funds in preparation of the financial statements. The Funds are considered investment companies and accordingly, follow the investment company accounting and reporting guidance of the FASB Accounting Standards Codification Topic 946,Financial Services – Investment Companies,a part of Generally Accepted Accounting Principles (“U.S. GAAP”).
Security Transactions and Investment Income
Security transactions are recorded as of the trade date for financial reporting purposes. Securities purchased or sold on a when-issued or delayed-delivery basis may be settled beyond a standard settlement period for the security after the trade date.
Dividend income, net of foreign taxes, is recorded on theex-dividend date, except certain dividends from foreign securities which are recorded as soon as the information is available to the Funds. Interest income, net of foreign taxes, is earned from settlement date, recorded on the accrual basis, and adjusted, if necessary, for accretion of discounts and amortization of premiums. Realized gains (losses) from securities sold are determined based on specific lot identification.
Distributions to Shareholders
The Alpha Quant Dividend Fund distributes most or all of its net earning and realized gains, if any, each taxable year in the form of dividends from net investment income on a quarterly basis and distributions of realized net capital gains and net gains from foreign currency translations on an annual basis.
The Alpha Quant Core, Alpha Quant Quality and Alpha Quant Value Funds distributes most or all of their net earning and realized gains, if any, each taxable year in the form of dividends from net investment income and distributions of realized net capital gains and net gains from foreign currency translations on an annual basis. The Funds do not have a fixed dividend rate and do not guarantee that they will pay any distributions in any particular period. Dividends to shareholders are determined in accordance with federal income tax regulations, which may differ in amount and character from net investment income and realized gains recognized for purposes of U.S. GAAP. To the extent necessary to fully distribute capital gains, the Funds may designate earnings and profits distributed to shareholders on the redemption of shares.
32
American Beacon FundsSM
Notes to Financial Statements
June 30, 2019
Commission Recapture
The Funds have established brokerage commission recapture arrangements with certain brokers or dealers. If the Funds’ investment advisor chooses to execute a transaction through a participating broker, the broker rebates a portion of the commission back to the Funds. Any collateral benefit received through participation in the commission recapture program is directed exclusively to the Funds. This amount is reported with the net realized gain in the Funds’ Statements of Operations, if applicable.
Allocation of Income, Trust Expenses, Gains, and Losses
Investment income, realized and unrealized gains and losses from investments of the Funds are allocated daily to each class of shares based upon the relative proportion of net assets of each class to the total net assets of the Funds. Expenses directly charged or attributable to the Fund will be paid from the assets of the Fund. Generally, expenses of the Trust will be allocated among and charged to the assets of the Funds on a basis that the Trust’s Board of Trustees (the “Board”) deems fair and equitable, which may be based on the relative net assets of the Funds or nature of the services performed and relative applicability to the Funds.
Use of Estimates
The preparation of financial statements in conformity with U.S. GAAP requires management to make estimates and assumptions that affect the amounts reported in the financial statements and accompanying notes. Actual results may differ from those estimated.
Other
Under the Trust’s organizational documents, its officers and trustees are indemnified against certain liabilities arising out of the performance of their duties to the Trust. In the normal course of business, the Trust enters into contracts that provide indemnification to the other party or parties against potential costs or liabilities. The Trust’s maximum exposure under these arrangements is dependent on claims that may be made in the future and, therefore, cannot be estimated. The Trust has had no prior claims or losses pursuant to any such agreement.
2. Transactions with Affiliates
Management and InvestmentSub-Advisory Agreements
The Funds and the Manager are parties to a Management Agreement that obligates the Manager to provide the Funds with investment advisory and administrative services. As compensation for performing the duties under the Management Agreement, the Manager will receive an annualized management fee based on a percentage of each Funds’ average daily net assets that is calculated and accrued daily according to the following schedule:
First $5 billion | 0.35 | % | ||
Next $5 billion | 0.325 | % | ||
Next $10 billion | 0.30 | % | ||
Over $20 billion | 0.275 | % |
The Trust, on behalf of the Funds, and the Manager have entered into an Investment Advisory Agreement with Alpha Quant Advisors, LLC (the“Sub-Advisor”), an affiliate of the Manager, pursuant to which each Fund has agreed to pay an annualizedsub-advisory fee that is calculated and accrued daily based on the Funds’ average daily net assets according to the following schedule:
First $5 billion | 0.25 | % | ||
Over $5 billion | 0.20 | % |
33
American Beacon FundsSM
Notes to Financial Statements
June 30, 2019
The Management andSub-Advisory Fees paid by the Funds for the year ended June 30, 2019 were as follows:
Alpha Quant Core Fund
| Effective Fee Rate | Amount of Fees Paid | |||||||||||
Management Fees | 0.35 | % | $ | 10,706 | ||||||||
Sub-Advisor Fees | 0.25 | % | 7,651 | |||||||||
|
|
|
| |||||||||
Total | 0.60 | % | $ | 18,357 | ||||||||
|
|
|
| |||||||||
Alpha Quant Dividend Fund
| Effective Fee Rate | Amount of Fees Paid | |||||||||||
Management Fees | 0.35 | % | $ | 9,496 | ||||||||
Sub-Advisor Fees | 0.25 | % | 6,786 | |||||||||
|
|
|
| |||||||||
Total | 0.60 | % | $ | 16,282 | ||||||||
|
|
|
| |||||||||
Alpha Quant Quality Fund
| Effective Fee Rate | Amount of Fees Paid | |||||||||||
Management Fees | 0.35 | % | $ | 9,360 | ||||||||
Sub-Advisor Fees | 0.25 | % | 6,689 | |||||||||
|
|
|
| |||||||||
Total | 0.60 | % | $ | 16,049 | ||||||||
|
|
|
| |||||||||
Alpha Quant Value Fund
| Effective Fee Rate | Amount of Fees Paid | |||||||||||
Management Fees | 0.35 | % | $ | 17,984 | ||||||||
Sub-Advisor Fees | 0.25 | % | 12,868 | |||||||||
|
|
|
| |||||||||
Total | 0.60 | % | $ | 30,852 | ||||||||
|
|
|
| |||||||||
Distribution Plans
The Funds have adopted a “defensive” Distribution Plan (the “Plan”) in accordance with Rule12b-1 under the Act, pursuant to which no separate fees may be charged to the Funds for distribution purposes. However, the Plan authorizes the management fee received by the Manager and the investment advisors hired by the Manager to be used for distribution purposes. Under this Plan, the Funds do not intend to compensate the Manager or any other party, either directly or indirectly, for the distribution of Fund shares.
Service Plans
The Manager and the Trust entered into Service Plans that obligate the Manager to oversee additional shareholder servicing of the Investor Class of the Funds. As compensation for performing the duties required under the Service Plans, the Manager receives an annualized fee up to 0.375% of the average daily net assets of the Investor Class of the Funds.
Sub-Transfer Agent Fees
The Manager has entered into agreements, which include servicing agreements, with financial intermediaries that provide recordkeeping, processing, shareholder communications and other services to customers of the intermediaries that hold positions in the Institutional and Y Classes of the Funds and has agreed to compensate the intermediaries for providing these services. Intermediaries transact with the Funds primarily through the use of omnibus accounts on behalf of their customers who hold positions in the Funds. Certain services would have been provided by the Funds’ transfer agent and other service providers if the shareholders’ accounts were maintained directly by the Funds’ transfer agent. Accordingly, the Funds, pursuant to Board approval, have agreed to reimburse the Manager for certainnon-distribution shareholder services provided by financial
34
American Beacon FundsSM
Notes to Financial Statements
June 30, 2019
intermediaries for the Institutional and Y Classes. The reimbursement amounts(sub-transfer agent fees) paid to the Manager are subject to a fee limit of up to 0.10% of an intermediary’s average net assets in the Institutional and Y Classes on an annual basis. During the year ended June 30, 2019, thesub-transfer agent fees, as reflected in “Transfer agent fees” on the Statements of Operations, were as follows:
Fund | Sub-Transfer Agent Fees | |||
Alpha Quant Core | $ | 226 | ||
Alpha Quant Dividend | 119 | |||
Alpha Quant Quality | 98 | |||
Alpha Quant Value | 1,861 | |||
As of June 30, 2019, the Manager owed the Funds the following reimbursement ofsub-transfer agent fees, as reflected in “Transfer agent fees payable” on the Statements of Assets and Liabilities:
Fund | Reimbursement Sub-Transfer Agent Fees* | |||
Alpha Quant Core | $ | 45 | ||
Alpha Quant Dividend | 10 | |||
Alpha Quant Quality | 24 | |||
Alpha Quant Value | 202 | |||
| * | This balance is presented as a contra liability as of June 30, 2019 for each Fund respectively. |
Investments in Affiliated Funds
The Funds may invest in the American Beacon U.S. Government Money Market Select Fund (the “USG Select Fund”). Cash collateral received by the Funds in connection with securities lending may also be invested in the USG Select Fund. The Funds and the USG Select Fund have the same investment advisor and therefore, are considered to be affiliated. The Manager serves as investment advisor to the USG Select Fund and receives management fees and administrative fees totaling 0.10% of the average daily net assets of the USG Select Fund. During the year ended June 30, 2019, the Manager earned fees on the Funds’ direct investments in the USG Select Fund as shown below:
Fund | Direct Investments in USG Select Fund | |||
Alpha Quant Core | $ | 33 | ||
Alpha Quant Dividend | 31 | |||
Alpha Quant Quality | 20 | |||
Alpha Quant Value | 69 | |||
Interfund Credit Facility
Pursuant to an exemptive order issued by the SEC, the Funds, along with other registered investment companies having management contracts with the Manager, may participate in a credit facility whereby each fund, under certain conditions, is permitted to lend money directly to and borrow directly from other participating funds for temporary purposes. The interfund credit facility is advantageous to the funds because it provides added liquidity and eliminates the need to maintain higher cash balances to meet redemptions. This situation could arise when shareholder redemptions exceed anticipated volumes and certain funds have insufficient cash on hand to satisfy such redemptions or when sales of securities do not settle as expected, resulting in a cash shortfall for a fund. When a fund liquidates portfolio securities to meet redemption requests, they often do not receive payment in settlement for up to two days (or longer for certain foreign transactions). Redemption requests normally are satisfied on the next business day. The credit facility provides a source of immediate, short-term liquidity pending settlement of the sale of portfolio securities. The credit facility is administered by a credit facility team consisting of professionals from the Manager’s asset management, compliance, and accounting areas who report the activities of the credit facility to the Board. During the year ended June 30, 2019, the Alpha Quant Core Fund borrowed on average $13,941 for 2 days at an average interest rate of 3.01% with interest charges of $2, the Alpha Quant Dividend Fund borrowed on average $2,026 for 2 days at an average interest rate of 3.12% with interest charges of
35
American Beacon FundsSM
Notes to Financial Statements
June 30, 2019
less than $1 and the Alpha Quant Value Fund borrowed on average $226,049 for 15 days at an average interest rate of 2.89% with interest charges of $278. These amounts are recorded as “Other expenses” in the Statements of Operations. For the year ended June 30, 2019, the Alpha Quant Quality Fund did not utilize the credit facility.
Expense Reimbursement Plan
The Manager contractually agreed to reduce fees and/or reimburse expenses for the classes of the Funds to the extent that total operating expenses exceed the Funds’ expense cap. During the year ended June 30, 2019, the Manager waived and/or reimbursed expenses as follows:
| Expense Cap | Expiration of Reimbursed Expenses | |||||||||||||||||||||
Fund | Class | 7/1/2018 - 3/31/2019 | 4/1/2019 - 6/30/2019 | Reimbursed Expenses | (Recouped) Expenses | |||||||||||||||||
Alpha Quant Core | Institutional | 0.69 | % | 0.59 | % | $ | 95,145 | $ | – | 2021-2022 | ||||||||||||
Alpha Quant Core | Y | 0.79 | % | 0.69 | % | 6,880 | – | 2021-2022 | ||||||||||||||
Alpha Quant Core | Investor | 1.07 | % | 0.97 | % | 12,535 | – | 2021-2022 | ||||||||||||||
Alpha Quant Dividend | Institutional | 0.69 | % | 0.59 | % | 86,366 | – | 2021-2022 | ||||||||||||||
Alpha Quant Dividend | Y | 0.79 | % | 0.69 | % | 4,701 | – | 2021-2022 | ||||||||||||||
Alpha Quant Dividend | Investor | 1.07 | % | 0.97 | % | 22,482 | – | 2021-2022 | ||||||||||||||
Alpha Quant Quality | Institutional | 0.69 | % | 0.59 | % | 91,201 | – | 2021-2022 | ||||||||||||||
Alpha Quant Quality | Y | 0.79 | % | 0.69 | % | 9,859 | – | 2021-2022 | ||||||||||||||
Alpha Quant Quality | Investor | 1.07 | % | 0.97 | % | 13,055 | – | 2021-2022 | ||||||||||||||
Alpha Quant Value | Institutional | 0.69 | % | 0.59 | % | 49,720 | – | 2021-2022 | ||||||||||||||
Alpha Quant Value | Y | 0.79 | % | 0.69 | % | 38,341 | – | 2021-2022 | ||||||||||||||
Alpha Quant Value | Investor | 1.07 | % | 0.97 | % | 32,344 | – | 2021-2022 | ||||||||||||||
Of these amounts, $6,821, $6,427, $6,586, and $10,529 were disclosed as a receivable from the Manager on the Statements of Assets and Liabilities at June 30, 2019 for the Alpha Quant Core Fund, Alpha Quant Dividend Fund, Alpha Quant Quality Fund, and Alpha Quant Value Fund, respectively.
The Funds have adopted an Expense Reimbursement Plan whereby the Manager may seek repayment of such fee reductions and expense reimbursements. Under the policy, the Manager can be reimbursed by the Funds for any contractual or voluntary fee reductions or expense reimbursements if reimbursement to the Manager (a) occurs within three years from the date of the Manager’s waiver/reimbursement and (b) does not cause the Funds’ annual operating expenses to exceed the lesser of the contractual percentage limit in effect at the time of the waiver/reimbursement or time of recoupment. The reimbursed expenses listed above will expire in 2021-2022. The Funds did not record a liability for potential reimbursements due to the current assessment that reimbursements are uncertain. The carryover of excess expenses potentially reimbursable to the Manager are as follows:
Fund | Recouped Expenses | Excess Expense Carryover | Expired Expense Carryover | Expiration of Reimbursed Expenses | ||||||||||||
Alpha Quant Core | $ | - | $ | 67,123 | $ | - | 2019-2020 | |||||||||
Alpha Quant Core | - | 115,902 | - | 2020-2021 | ||||||||||||
Alpha Quant Dividend | - | 66,829 | - | 2019-2020 | ||||||||||||
Alpha Quant Dividend | - | 115,728 | - | 2020-2021 | ||||||||||||
Alpha Quant Quality | - | 66,815 | - | 2019-2020 | ||||||||||||
Alpha Quant Quality | - | 115,763 | - | 2020-2021 | ||||||||||||
Alpha Quant Value | - | 66,877 | - | 2019-2020 | ||||||||||||
Alpha Quant Value | - | 111,926 | - | 2020-2021 | ||||||||||||
Concentration of Ownership
From time to time, the Funds may have a concentration of one or more accounts constituting a significant percentage of shares outstanding. Investment activities by holders of accounts that represent a significant ownership of more than 5% of the Funds’ outstanding shares could have a material impact on the Funds. As of June 30, 2019, based on management’s evaluation of the shareholder account base, one account has been identified
36
American Beacon FundsSM
Notes to Financial Statements
June 30, 2019
as representing an affiliated significant ownership of approximately 67%, 60%, 84%, and 51% for the Alpha Quant Core Fund, Alpha Quant Dividend Fund, Alpha Quant Quality Fund, and Alpha Quant Value Fund, respectively.
Trustee Fees and Expenses
As compensation for their service to the Trusts, each Trustee receives an annual retainer of $120,000, plus $10,000 for each Board meeting attended in person or via teleconference, $2,500 for attendance by Committee members at meetings of the Audit Committee and the Investment Committee, and $1,500 for attendance by Committee members at meetings of the Nominating and Governance Committee, plus reimbursement of reasonable expenses incurred in attending Board meetings, Committee meetings, and relevant educational seminars. The Trustees also may be compensated for attendance at special Board and/or Committee meetings from time to time. The Board Chair receives an additional annual retainer of $50,000 as well as a $2,500 fee each quarter for attendance at the committee meetings. The Chairpersons of the Audit Committee and the Investment Committee each receive an additional annual retainer of $25,000 and the Chairman of the Nominating and Governance Committee receives an additional annual retainer of $10,000. These expenses are allocated on a prorated basis to each fund of the Trusts according to its respective net assets.
3. Security Valuation and Fair Value Measurements
The price of the Fund’s shares is based on its net asset value (“NAV”) per share. The Fund’s NAV is computed by adding total assets, subtracting all the Fund’s liabilities, and dividing the result by the total number of shares outstanding.
The NAV of each class of the Fund’s shares is determined based on a pro rata allocation of the Fund’s investment income, expenses and total capital gains and losses. The Fund’s NAV per share is determined each business day as of the regular close of trading on the New York Stock Exchange (“NYSE” or “Exchange”), which is typically 4:00 p.m. Eastern Time (“ET”). However, if trading on the NYSE closes at a time other than 4:00 p.m. ET, the Fund’s NAV per share typically would still be determined as of the regular close of trading on the NYSE. The Fund does not price its shares on days that the NYSE is closed. Foreign exchanges may permit trading in foreign securities on days when the Fund is not open for business, which may result in the value of the Fund’s portfolio investments being affected at a time when you are unable to buy or sell shares.
Equity securities, including shares ofclosed-end funds and exchange-traded funds (“ETFs”), are valued at the last sale price or official closing price taken from the primary exchange in which each security trades. Investments in other mutual funds are valued at the closing NAV per share on the day of valuation. Debt securities are valued at bid quotes from broker/dealers or evaluated bid prices from pricing services, who may consider a number of inputs and factors, such as prices of comparable securities, yield curves, spreads, credit ratings, coupon rates, maturity, default rates, and underlying collateral. Futures are valued based on their daily settlement prices. Exchange-traded andover-the-counter (“OTC”) options are valued at the last sale price. Options with no last sale for the day are priced at mid quote. Swaps are valued at evaluated mid prices from pricing services.
The valuation of securities traded on foreign markets and certain fixed income securities will generally be based on prices determined as of the earlier closing time of the markets on which they primarily trade unless a significant event has occurred. When the Fund holds securities or other assets that are denominated in a foreign currency, the Fund will normally use the currency exchange rates as of 4:00 p.m. ET.
Securities may be valued at fair value, as determined in good faith and pursuant to procedures approved by the Board, under certain limited circumstances. For example, fair value pricing will be used when market quotations are not readily available or reliable, as determined by the Manager, such as when (i) trading for a security is restricted or stopped; (ii) a security’s trading market is closed (other than customary closings); or (iii) a security has beende-listed from a national exchange. A security with limited market liquidity may require fair value pricing if the Manager determines that the available price does not reflect the security’s true market value. In addition, if a significant event that the Manager determines to affect the value of one or more securities held by
37
American Beacon FundsSM
Notes to Financial Statements
June 30, 2019
the Fund occurs after the close of a related exchange but before the determination of the Fund’s NAV, fair value pricing may be used on the affected security or securities. Securities of small-capitalization companies are also more likely to require a fair value determination using these procedures because they are more thinly traded and less liquid than the securities of larger-capitalization companies. The Fund may fair value securities as a result of significant events occurring after the close of the foreign markets in which the Fund invests as described below. In addition, the Fund may invest in illiquid securities requiring these procedures.
The Fund may use fair value pricing for securities primarily traded innon-U.S. markets because most foreign markets close well before the Fund’s pricing time of 4:00 p.m. ET. The earlier close of these foreign markets gives rise to the possibility that significant events, including broad market moves, may have occurred in the interim and may materially affect the value of those securities. If the Manager determines that the last quoted prices ofnon-U.S. securities will, in its judgment, materially affect the value of some or all its portfolio securities, the Manager can adjust the previous closing prices to reflect what it believes to be the fair value of the securities as of the close of the Exchange. In deciding whether it is necessary to adjust closing prices to reflect fair value, the Manager reviews a variety of factors, including developments in foreign markets, the performance of U.S. securities markets, and the performance of instruments trading in U.S. markets that represent foreign securities and baskets of foreign securities. These securities are fair valued using a pricing service, using methods approved by the Board, that considers the correlation of the trading patterns of the foreign security to intraday trading in the U.S. markets, based on indices of domestic securities and other appropriate indicators such as prices of relevant American Depositary Receipts (“ADRs”) and futures contracts. The Valuation Committee, established by the Board, may also fair value securities in other situations, such as when a particular foreign market is closed but the Fund is open. The Fund uses outside pricing services to provide closing prices and information to evaluate and/or adjust those prices. As a means of evaluating its security valuation process, the Valuation Committee routinely compares closing prices, the next day’s opening prices in the same markets and adjusted prices.
Attempts to determine the fair value of securities introduce an element of subjectivity to the pricing of securities. As a result, the price of a security determined through fair valuation techniques may differ from the price quoted or published by other sources and may not accurately reflect the market value of the security when trading resumes. If a reliable market quotation becomes available for a security formerly valued through fair valuation techniques, the Manager compares the new market quotation to the fair value price to evaluate the effectiveness of the Fund’s fair valuation procedures. If any significant discrepancies are found, the Manager may adjust the Fund’s fair valuation procedures.
Valuation Inputs
Various inputs may be used to determine the fair value of the Funds’ investments. These inputs are summarized in three broad levels for financial statement purposes. The inputs or methodologies used to value securities are not necessarily an indication of the risk associated with investing in those securities.
| Level 1 | - | Quoted prices in active markets for identical securities. | ||
| Level 2 | - | Prices determined using other significant observable inputs. These may include quoted prices for similar securities, interest rates, prepayment speeds, credit risk, and others. | ||
| Level 3 | - | Prices determined using other significant unobservable inputs. Unobservable inputs reflect the Fund’s own assumptions about the factors market participants would use in pricing an investment. | ||
Level 1 and Level 2 trading assets and trading liabilities, at fair value
Common stocks, ETFs and financial derivative instruments, such as futures contracts that are traded on a national securities exchange, are stated at the last reported sale or settlement price on the day of valuation. To the extent these securities are actively traded and valuation adjustments are not applied, they are categorized as Level 1 of the fair value hierarchy. Preferred securities and other equities traded on inactive markets or valued by reference to similar instruments are generally categorized as Level 2 of the fair value hierarchy.
38
American Beacon FundsSM
Notes to Financial Statements
June 30, 2019
Investments in registeredopen-end investment management companies will be valued based upon the NAVs of such investments and are categorized as Level 1 of the fair value hierarchy.
4. Securities and Other Investments
Common Stock
Common stock generally takes the form of shares in a corporation which represent an ownership interest. It ranks below preferred stock and debt securities in claims for dividends and for assets of the company in a liquidation or bankruptcy. The value of a company’s common stock may fall as a result of factors directly relating to that company, such as decisions made by its management or decreased demand for the company’s products or services. A stock’s value may also decline because of factors affecting not just the company, but also companies in the same industry or sector. The price of a company’s stock may also be affected by changes in financial markets that are relatively unrelated to the company, such as changes in interest rates, currency exchange rates or industry regulation. Companies that elect to pay dividends on their common stock generally only do so after they invest in their own business and make required payments to bondholders and on other debt and preferred stock. Therefore, the value of a company’s common stock will usually be more volatile than its bonds, other debt and preferred stock. Common stock may be exchange-traded or OTC. OTC stock may be less liquid than exchange-traded stock.
Other Investment Company Securities and Other Exchange-Traded Products
The Funds may invest in shares of other investment companies, includingopen-end funds,closed-end funds, business development companies, ETFs, unit investment trusts, and other investment companies of the Trust. The Funds may invest in investment company securities advised by the Manager or asub-advisor. Investments in the securities of other investment companies may involve duplication of advisory fees and certain other expenses. By investing in another investment company, the Funds become a shareholder of that investment company. As a result, the Funds’ shareholders indirectly will bear the Funds’ proportionate share of the fees and expenses paid by shareholders of the other investment company, in addition to the fees and expenses the Funds’ shareholders directly bear in connection with the Funds’ own operations. These other fees and expenses are reflected as Acquired Fund Fees and Expenses and are included in the Fees and Expenses Table for the Funds in their Prospectus, if applicable. Investments in other investment companies may involve the payment of substantial premiums above the value of such issuer’s portfolio securities.
Real Estate Investment Trusts
The Funds may own shares of real estate investment trusts (“REITs”) which report information on the source of their distributions annually. The Fundsre-characterize distributions received from REIT investments based on information provided by the REITs into the following categories: ordinary income, long-term capital gains, and return of capital. If information is not available on a timely basis from the REITs, there-characterization will be estimated based on available information, which may include the previous year allocation. If new or additional information becomes available from the REITs at a later date, are-characterization will be made the following year.
5. Principal Risks
Investing in the Funds may involve certain risks including, but not limited to, those described below.
Equity Investments Risk
Equity securities are subject to market risk. The Funds’ investments in equity securities may include common stocks, preferred stocks, securities convertible into or exchangeable for common stocks, REITs, depositary receipts, and U.S. dollar-denominated foreign stocks traded on U.S. exchanges. Such investments may expose the Funds to additional risk. The value of a company’s common stock may fall as a result of factors affecting the
39
American Beacon FundsSM
Notes to Financial Statements
June 30, 2019
company, companies in the same industry or sector, or the financial markets overall. Common stock generally is subordinate to preferred stock upon the liquidation or bankruptcy of the issuing company. Preferred stocks and convertible securities are sensitive to movements in interest rates. Preferred stocks may be less liquid than common stocks and, unlike common stocks, participation in the growth of an issuer may be limited. Distributions on preferred stocks generally are payable at the discretion of an issuer and after required payments to bond holders. Convertible securities are subject to the risk that the credit standing of the issuer may have an effect on the convertible securities’ investment value. Investments in REITs are subject to the risks associated with investing in the real estate industry such as adverse developments affecting the real estate industry and real property values. Depositary receipts and U.S. dollar-denominated foreign stocks traded on U.S. exchanges are subject to certain of the risks associated with investing directly in foreign securities, including, but not limited to, currency fluctuations and political and financial instability in the home country of a particular depositary receipt or foreign stock.
Focused Holdings Risk
Because the Funds may have a focused portfolio of fewer companies, the increase or decrease of the value of a single investment may have a greater impact on the Funds’ NAV and total return when compared to other diversified funds.
Market Risk
Conditions in the U.S. and many foreign economies have resulted, and may continue to result, in certain instruments experiencing unusual liquidity issues, increased price volatility and, in some cases, credit downgrades and increased likelihood of default. These events have reduced the willingness and ability of some lenders to extend credit, and have made it more difficult for some borrowers to obtain financing on attractive terms, if at all. In some cases, traditional market participants have been less willing to make a market in some types of debt instruments, which has affected the liquidity of those instruments. During times of market turmoil, investors tend to look to the safety of securities issued or backed by the U.S. Treasury, causing the prices of these securities to rise and the yields to decline. Reduced liquidity in fixed income and credit markets may negatively affect many issuers worldwide. In addition, global economies and financial markets are becoming increasingly interconnected, which increases the possibilities that conditions in one country or region might adversely impact issuers in a different country or region. A rise in protectionist trade policies, and the possibility of changes to some international trade agreements, could affect the economies of many nations in ways that cannot necessarily be foreseen at the present time.
In response to the financial crisis, the U.S. and other governments and the Federal Reserve and certain foreign central banks have taken steps to support financial markets. In some countries where economic conditions are recovering, they are nevertheless perceived as still fragile. Withdrawal of government support, failure of efforts in response to the crisis, or investor perception that such efforts are not succeeding, could adversely impact the value and liquidity of certain securities. The severity or duration of adverse economic conditions may also be affected by policy changes made by governments or quasi-governmental organizations, including changes in tax laws. The impact of new financial regulation legislation on the markets and the practical implications for market participants may not be fully known for some time. Regulatory changes are causing some financial services companies to exit long-standing lines of business, resulting in dislocations for other market participants. In addition, political and diplomatic events within the U.S. and abroad, such as the United States government’s inability at times to agree on a long-term budget and deficit reduction plan, the threat of a federal government shutdown and threats not to increase the federal government’s debt limit, may affect investor and consumer confidence and may adversely impact financial markets and the broader economy, perhaps suddenly and to a significant degree. The U.S. government has recently reduced the federal corporate income tax rates, and future legislative, regulatory and policy changes may result in more restrictions on international trade, less stringent prudential regulation of certain players in the financial markets, and significant new investments in infrastructure and national defense. Markets may react strongly to expectations about the changes in these policies, which could increase volatility, especially if the markets’ expectations for changes in government policies are not borne out.
40
American Beacon FundsSM
Notes to Financial Statements
June 30, 2019
Changes in market conditions will not have the same impact on all types of securities. Interest rates have been unusually low in recent years in the United States and abroad. Because there is little precedent for this situation, it is difficult to predict the impact of a significant rate increase on various markets. For example, because investors may buy securities or other investments with borrowed money, a significant increase in interest rates may cause a decline in the markets for those investments. Because of the sharp decline in the worldwide price of oil, there is a concern that oil producing nations may withdraw significant assets now held in U.S. Treasuries, which could force a substantial increase in interest rates. Regulators have expressed concern that rate increases may cause investors to sell fixed income securities faster than the market can absorb them, contributing to price volatility. In addition, there is a risk that the prices of goods and services in the U.S. and many foreign economies may decline over time, known as deflation (the opposite of inflation). Deflation may have an adverse effect on stock prices and creditworthiness and may make defaults on debt more likely. If a country’s economy slips into a deflationary pattern, it could last for a prolonged period and may be difficult to reverse.
The precise details and the resulting impact of the United Kingdom’s vote to leave the European Union (the “EU”), commonly referred to as “Brexit,” are not yet known. The effect on the United Kingdom’s economy will likely depend on the nature of trade relations with the EU and other major economies following its exit, which are matters to be negotiated. The outcomes may cause increased volatility and have a significant adverse impact on world financial markets, other international trade agreements, and the United Kingdom and European economies, as well as the broader global economy for some time, which could significantly adversely affect the value of the Fund’s investments in the United Kingdom and Europe.
Other Investment Companies Risk
The Funds may invest in shares of other registered investment companies, including money market funds that are advised by the Manager. To the extent that the Funds invest in shares of other registered investment companies, the Funds will indirectly bear the fees and expenses, including for example advisory and administrative fees, charged by those investment companies in addition to the Funds’ direct fees and expenses and will be subject to the risks associated with investments in those companies. For example, the Funds’ investments in money market funds are subject to interest rate risk, credit risk, and market risk. The Funds must rely on the investment company in which it invests to achieve its investment objective. If the investment company fails to achieve its investment objective, the value of the Funds’ investment will decline, adversely affecting the Funds’ performance. To the extent the Funds invest in other investment companies that invest in equity securities, fixed-income securities and/or foreign securities, or track an index, the Funds are subject to the risks associated with the underlying investments held by the investment company or the index fluctuations to which the investment company is subject.
6. Federal Income and Excise Taxes
It is the policy of each Fund to qualify as a regulated investment company (“RIC”), by complying with all applicable provisions of Subchapter M of the Internal Revenue Code, as amended, and to make distributions of taxable income sufficient to relieve it from substantially all federal income and excise taxes. For federal income tax purposes, each Fund is treated as a single entity for the purpose of determining such qualification.
The Funds do not have any unrecorded tax liabilities in the accompanying financial statements. Each of the tax years in the three year period ended June 30, 2019 remain subject to examination by the Internal Revenue Service. If applicable, the Funds recognize interest accrued related to unrecognized tax benefits in interest expense and penalties in “Other expenses” on the Statements of Operations.
The Funds may be subject to taxes imposed by countries in which it invests. Such taxes are generally based on returns of income earned or gains realized or repatriated. Taxes are accrued and applied to net investment income, net realized capital gains and net unrealized appreciation (depreciation), as applicable, as the income is earned or capital gains are recorded.
41
American Beacon FundsSM
Notes to Financial Statements
June 30, 2019
Dividends are categorized in accordance with income tax regulations which may treat certain transactions differently than U.S. GAAP. Accordingly, the character of distributions and composition of net assets for tax purposes may differ from those reflected in the accompanying financial statements.
The tax character of distributions paid were as follows:
| Alpha Quant Core Fund | Alpha Quant Dividend Fund | |||||||||||||||||||||||||||
| Year Ended June 30, 2019 | Year Ended June 30, 2018 | Year Ended June 30, 2019 | Year Ended June 30, 2018 | |||||||||||||||||||||||||
Distributions paid from: | ||||||||||||||||||||||||||||
Ordinary income* | ||||||||||||||||||||||||||||
Institutional Class | $ | 77,761 | $ | 24,547 | $ | 152,841 | $ | 51,214 | ||||||||||||||||||||
Y Class | 5,926 | 1,582 | 8,540 | 3,231 | ||||||||||||||||||||||||
Investor Class | 4,021 | 1,400 | 30,553 | 2,940 | ||||||||||||||||||||||||
Long-term capital gains | ||||||||||||||||||||||||||||
Institutional Class | 160,672 | - | - | 500 | ||||||||||||||||||||||||
Y Class | 12,245 | - | - | 33 | ||||||||||||||||||||||||
Investor Class | 8,308 | - | - | 28 | ||||||||||||||||||||||||
|
|
|
|
|
|
|
| |||||||||||||||||||||
Total distributions paid | $ | 268,933 | $ | 27,529 | $ | 191,934 | $ | 57,946 | ||||||||||||||||||||
|
|
|
|
|
|
|
| |||||||||||||||||||||
| Alpha Quant Quality Fund | Alpha Quant Value Fund | |||||||||||||||||||||||||||
| Year Ended June 30, 2019 | Year Ended June 30, 2018 | Year Ended June 30, 2019 | Year Ended June 30, 2018 | |||||||||||||||||||||||||
Distributions paid from: | ||||||||||||||||||||||||||||
Ordinary income* | ||||||||||||||||||||||||||||
Institutional Class | $ | 80,633 | $ | 14,994 | $ | 55,322 | $ | 31,446 | ||||||||||||||||||||
Y Class | 9,615 | 976 | 41,987 | 2,250 | ||||||||||||||||||||||||
Investor Class | 5,528 | 857 | 35,393 | 1,939 | ||||||||||||||||||||||||
Long-term capital gains | ||||||||||||||||||||||||||||
Institutional Class | 231,772 | - | 37,535 | - | ||||||||||||||||||||||||
Y Class | 27,638 | - | 28,487 | - | ||||||||||||||||||||||||
Investor Class | 15,890 | - | 24,014 | - | ||||||||||||||||||||||||
|
|
|
|
|
|
|
| |||||||||||||||||||||
Total distributions paid | $ | 371,076 | $ | 16,827 | $ | 222,738 | $ | 35,635 | ||||||||||||||||||||
|
|
|
|
|
|
|
| |||||||||||||||||||||
*For tax purposes, short-term capital gains are considered ordinary income distributions.
As of June 30, 2019, the components of distributable earnings (deficits) on a tax basis were as follows:
Fund | Tax Cost | Unrealized Appreciation | Unrealized (Depreciation) | Net Unrealized Appreciation (Depreciation) | ||||||||||||
Alpha Quant Core | $ | 3,051,329 | $ | 323,898 | $ | (170,121 | ) | $ | 153,777 | |||||||
Alpha Quant Dividend | 3,356,866 | 413,911 | (53,215 | ) | 360,696 | |||||||||||
Alpha Quant Quality | 2,558,372 | 250,012 | (92,373 | ) | 157,639 | |||||||||||
Alpha Quant Value | 4,013,725 | 319,023 | (307,994 | ) | 11,029 | |||||||||||
Fund | Net Unrealized Appreciation (Depreciation) | Undistributed Ordinary Income | Undistributed Long-Term Capital Gains | Accumulated Capital and Other (Losses) | Other Temporary Differences | Distributable Earnings | ||||||||||||||||||
Alpha Quant Core | $ | 153,777 | $ | 26,626 | $ | - | $ | (110,587 | ) | $ | – | $ | 69,816 | |||||||||||
Alpha Quant Dividend | 360,696 | 19,362 | - | (114,196 | ) | – | 265,862 | |||||||||||||||||
Alpha Quant Quality | 157,639 | 19,533 | - | (36,508 | ) | – | 140,664 | |||||||||||||||||
Alpha Quant Value | 11,029 | 52,331 | - | (403,047 | ) | – | (339,687 | ) | ||||||||||||||||
Financial reporting records are adjusted for permanent book/tax differences to reflect tax character. Financial records are not adjusted for temporary differences. The temporary differences between financial reporting andtax-basis reporting of unrealized appreciation (depreciation) are attributable primarily toPost-October capital loss deferrals.
42
American Beacon FundsSM
Notes to Financial Statements
June 30, 2019
Due to inherent differences in the recognition of income, expenses, and realized gains (losses) under U.S. GAAP and federal income tax regulations, permanent differences between book and tax reporting have been identified and appropriately reclassified on the Statements of Assets and Liabilities.
There were no permanent differences as of June 30, 2019.
Under the Regulated Investment Company Modernization Act of 2010 (“RIC MOD”), net capital losses recognized by the Funds in taxable years beginning after December 22, 2010 are carried forward indefinitely and retain their character as short-term and/or long-term losses.
During the year ended June 30, 2019, the Funds had the following post RIC Mod capital loss carryforwards:
Fund | Short-Term Capital Loss Carryforwards | Long-Term Capital Loss Carryforwards | ||||||||||
| Alpha Quant Core | $ | - | $ | - | ||||||||
| Alpha Quant Dividend | 27,575 | 86,621 | ||||||||||
| Alpha Quant Quality | - | - | ||||||||||
| Alpha Quant Value | - | - | ||||||||||
The Funds are permitted for tax purposes to defer into the next fiscal year qualified late year losses. Qualified late year losses are any capital losses incurred after October 31st through the Funds’ fiscal year end, June 30, 2019. Qualified late year ordinary losses are specified losses generally incurred after October 31st through the Funds’ fiscal year end, June 30, 2019. For the period ending June 30, 2019, the Funds’ deferred the following capital losses to July 1, 2019.
Fund | Short-Term | Long-Term | ||||||||||
| Alpha Quant Core | $ | 86,758 | $ | 23,829 | ||||||||
| Alpha Quant Dividend | - | - | ||||||||||
| Alpha Quant Quality | 68,825 | (32,317 | ) | |||||||||
| Alpha Quant Value | 339,801 | 63,246 | ||||||||||
7. Investment Transactions
The aggregate cost of purchases and proceeds from sales and maturities of investments, other than short-term obligations, for the year ended June 30, 2019 were as follows:
Fund | Purchases (non-U.S. Government Securities) | Sales (non-U.S. Government Securities) | ||||||||||
| Alpha Quant Core | $ | 2,620,549 | $ | 1,980,409 | ||||||||
| Alpha Quant Dividend | 2,056,330 | 939,791 | ||||||||||
| Alpha Quant Quality | 2,385,923 | 2,196,263 | ||||||||||
| Alpha Quant Value | 5,509,462 | 4,465,977 | ||||||||||
A summary of the Funds’ transactions in the USG Select Fund for the year ended June 30, 2019 are as follows:
Fund | Type of Transaction | June 30, 2018 Shares/Fair Value | Purchases | Sales | June 30, 2019 Shares/Fair Value | Dividend Income | ||||||||||||||||||||||||||||||||||||
| Alpha Quant Core | Direct | $ | 25,830 | $ | 867,115 | $ | 862,896 | $ | 30,049 | $ | 716 | |||||||||||||||||||||||||||||||
| Alpha Quant Dividend | Direct | 14,544 | 1,359,160 | 1,336,029 | 37,675 | 683 | ||||||||||||||||||||||||||||||||||||
| Alpha Quant Quality | Direct | 15,913 | 351,603 | 349,548 | 17,968 | 426 | ||||||||||||||||||||||||||||||||||||
| Alpha Quant Value | Direct | 34,476 | 3,326,395 | 3,326,103 | 34,768 | 1,461 | ||||||||||||||||||||||||||||||||||||
8. Securities Lending
The Funds may lend their securities to qualified financial institutions, such as certain broker-dealers, to earn additional income. The borrowers are required to secure their loans continuously with collateral in an amount at
43
American Beacon FundsSM
Notes to Financial Statements
June 30, 2019
least equal to the fair value of the securities loaned, initially in an amount at least equal to 102% of the fair value of domestic securities loaned and 105% of the fair value of international securities loaned. Collateral is monitored andmarked-to-market daily. Dailymark-to-market amounts are required to be paid to the borrower or received from the borrower by the end of the following business day. This one day settlement formark-to-market amounts may result in the collateral being temporarily less than the value of the securities on loan or temporarily more than the required minimum collateral.
To the extent that a loan is collateralized by cash, such cash collateral shall be invested by the securities lending agent (the “Agent”) in money market mutual funds and other short-term investments, provided the investments meet certain quality and diversification requirements. Securities purchased with cash collateral proceeds are listed in the Funds’ Schedule of Investments and the collateral is shown on the Statements of Assets and Liabilities as a payable.
Securities lending income is generated from the demand premium (if any) paid by the borrower to borrow a specific security and from the return on investment of cash collateral, reduced by negotiated rebate fees paid to the borrower and transaction costs. To the extent that a loan is secured bynon-cash collateral, securities lending income is generated as a demand premium reduced by transaction costs. The Funds, the Agent, and the Manager retained 80%, 10%, and 10%, respectively, of the income generated from securities lending.
While securities are on loan, the Funds continue to receive certain income associated with that security and any gain or loss in the market price that may occur during the term of the loan. In the case of domestic equities, the value of any dividend is received in the form of a substitute payment approximately equal to the dividend. In the case of foreign securities, a negotiated amount is received that is less than the actual dividend, but higher than the dividend amount minus the foreign tax that the Funds would be subject to on the dividend.
Securities lending transactions pose certain risks to the Funds, including that the borrower may not provide additional collateral when required or return the securities when due, that the value of the short-term investments will be less than the amount of cash collateral required to be returned to the borrower, thatnon-cash collateral may be subject to legal constraints in the event of a borrower bankruptcy, and that the cash collateral investments could become illiquid and unable to be used to return collateral to the borrower. The Funds could also experience delays and costs in gaining access to the collateral. The Funds bear the risk of any deficiency in the amount of the cash collateral available for return to the borrower and any action which impairs its ability to liquidatenon-cash collateral to satisfy a borrower default.
As of June 30, 2019, the Funds did not have any outstanding securities on loan.
Cash collateral is listed on the Funds’ Schedules of Investments and is shown on the Statements of Assets and Liabilities. Income earned on these investments is included in “Income derived from securities lending” on the Statements of Operations.
Non-cash collateral received by the Funds may not be sold orre-pledged except to satisfy a borrower default. Therefore,non-cash collateral is not included on the Funds’ Schedules of Investments or Statements of Assets and Liabilities.
9. Borrowing Arrangements
Effective November 15, 2018 (the “Effective Date”), the Funds, along with certain other funds managed by the Manager (“Participating Funds”), entered into a committed revolving line of credit (the “Committed Line”) agreement with State Street Bank and Trust Company (the “Bank”) to be used to facilitate portfolio liquidity. The maximum borrowing amount under the Committed Line is $250 million with interest at a rate equal to the higher of(a) one-month London Inter-Bank Offered Rate (“LIBOR”) plus 1.25% per annum or (b) the Federal Funds rate plus 1.25% per annum on amounts borrowed. Each of the Participating Funds will pay a closing fee of $100,000 on the Effective Date and a quarterly commitment fee at a rate of 0.25% per annum on the unused portion of the
44
American Beacon FundsSM
Notes to Financial Statements
June 30, 2019
Committed Line amount. The Committed Line expires November 14, 2019, unless extended by the Bank or terminated by the Participating Funds in accordance with the agreement.
On the Effective Date, the Funds, along with certain other Participating Funds managed by the Manager, also entered into an uncommitted discretionary demand revolving line of credit (the “Uncommitted Line”) agreement with the Bank to be used to facilitate portfolio liquidity. The maximum borrowing amount under the Uncommitted Line is $50 million with interest at a rate equal to the higher of(a) one-month LIBOR plus 1.25% per annum or (b) the Federal Funds rate plus 1.25% per annum on each outstanding loan. Each of the Participating Funds will pay a closing fee of $35,000 on the Effective Date. The Uncommitted Line expires November 14, 2019 unless extended by the Bank or terminated by the Participating Funds in accordance with the agreement.
During the year ended June 30, 2019, the Funds did not utilize this facility.
10. Capital Share Transactions
The tables below summarize the activity in capital shares for each Class of the Funds:
| Institutional Class | ||||||||||||||||||||||||||||
| Year Ended June 30, 2019 | Year Ended June 30, 2018 | |||||||||||||||||||||||||||
Alpha Quant Core Fund | Shares | Amount | Shares | Amount | ||||||||||||||||||||||||
| Shares sold | 44,013 | $ | 520,647 | 18,666 | $ | 216,444 | ||||||||||||||||||||||
| Reinvestment of dividends | 25,204 | 238,433 | 2,136 | 24,547 | ||||||||||||||||||||||||
| Shares redeemed | (8,602 | ) | (90,374 | ) | (139 | ) | (1,616 | ) | ||||||||||||||||||||
|
|
|
|
|
|
|
| |||||||||||||||||||||
| Net increase in shares outstanding | 60,615 | $ | 668,706 | 20,663 | $ | 239,375 | ||||||||||||||||||||||
|
|
|
|
|
|
|
| |||||||||||||||||||||
| Y Class | ||||||||||||||||||||||||||||
| Year Ended June 30, 2019 | Year Ended June 30, 2018 | |||||||||||||||||||||||||||
Alpha Quant Core Fund | Shares | Amount | Shares | Amount | ||||||||||||||||||||||||
| Shares sold | 6,084 | $ | 74,768 | 1,725 | $ | 19,960 | ||||||||||||||||||||||
| Reinvestment of dividends | 1,925 | 18,171 | 138 | 1,582 | ||||||||||||||||||||||||
| Shares redeemed | (1,933 | ) | (21,027 | ) | - | - | ||||||||||||||||||||||
|
|
|
|
|
|
|
| |||||||||||||||||||||
| Net increase in shares outstanding | 6,076 | $ | 71,912 | 1,863 | $ | 21,542 | ||||||||||||||||||||||
|
|
|
|
|
|
|
| |||||||||||||||||||||
| Investor Class | ||||||||||||||||||||||||||||
| Year Ended June 30, 2019 | Year Ended June 30, 2018 | |||||||||||||||||||||||||||
Alpha Quant Core Fund | Shares | Amount | Shares | Amount | ||||||||||||||||||||||||
| Shares sold | 11,171 | $ | 118,638 | 370 | $ | 4,320 | ||||||||||||||||||||||
| Reinvestment of dividends | 1,313 | 12,329 | 122 | 1,400 | ||||||||||||||||||||||||
| Shares redeemed | (944 | ) | (10,238 | ) | - | - | ||||||||||||||||||||||
|
|
|
|
|
|
|
| |||||||||||||||||||||
| Net increase in shares outstanding | 11,540 | $ | 120,729 | 492 | $ | 5,720 | ||||||||||||||||||||||
|
|
|
|
|
|
|
| |||||||||||||||||||||
| Institutional Class | ||||||||||||||||||||||||||||
| Year Ended June 30, 2019 | Year Ended June 30, 2018 | |||||||||||||||||||||||||||
Alpha Quant Dividend Fund | Shares | Amount | Shares | Amount | ||||||||||||||||||||||||
| Shares sold | 8,753 | $ | 90,997 | 9,439 | $ | 100,806 | ||||||||||||||||||||||
| Reinvestment of dividends | 15,819 | 152,841 | 4,906 | 51,713 | ||||||||||||||||||||||||
|
|
|
|
|
|
|
| |||||||||||||||||||||
| Net increase in shares outstanding | 24,572 | $ | 243,838 | 14,345 | $ | 152,519 | ||||||||||||||||||||||
|
|
|
|
|
|
|
| |||||||||||||||||||||
| Y Class | ||||||||||||||||||||||||||||
| Year Ended June 30, 2019 | Year Ended June 30, 2018 | |||||||||||||||||||||||||||
Alpha Quant Dividend Fund | Shares | Amount | Shares | Amount | ||||||||||||||||||||||||
| Shares sold | 52,037 | $ | 572,383 | 11,913 | $ | 128,860 | ||||||||||||||||||||||
| Reinvestment of dividends | 881 | 8,540 | 309 | 3,264 | ||||||||||||||||||||||||
| Shares redeemed | (4,314 | ) | (45,717 | ) | (9,448 | ) | (100,806 | ) | ||||||||||||||||||||
|
|
|
|
|
|
|
| |||||||||||||||||||||
| Net increase in shares outstanding | 48,604 | $ | 535,206 | 2,774 | $ | 31,318 | ||||||||||||||||||||||
|
|
|
|
|
|
|
| |||||||||||||||||||||
45
American Beacon FundsSM
Notes to Financial Statements
June 30, 2019
| Investor Class | ||||||||||||||||||||||||||||
| Year Ended June 30, 2019 | Year Ended June 30, 2018 | |||||||||||||||||||||||||||
Alpha Quant Dividend Fund | Shares | Amount | Shares | Amount | ||||||||||||||||||||||||
| Shares sold | 45,832 | $ | 491,014 | 865 | $ | 9,384 | ||||||||||||||||||||||
| Reinvestment of dividends | 3,212 | 30,553 | 282 | 2,969 | ||||||||||||||||||||||||
| Shares redeemed | (4,540 | ) | (46,580 | ) | - | (2 | ) | |||||||||||||||||||||
|
|
|
|
|
|
|
| |||||||||||||||||||||
| Net increase in shares outstanding | 44,504 | $ | 474,987 | 1,147 | $ | 12,351 | ||||||||||||||||||||||
|
|
|
|
|
|
|
| |||||||||||||||||||||
| Institutional Class | ||||||||||||||||||||||||||||
| Year Ended June 30, 2019 | Year Ended June 30, 2018 | |||||||||||||||||||||||||||
Alpha Quant Quality Fund | Shares | Amount | Shares | Amount | ||||||||||||||||||||||||
| Shares sold | 2,458 | $ | 25,000 | 1,294 | $ | 14,994 | ||||||||||||||||||||||
| Reinvestment of dividends | 33,199 | 312,405 | - | - | ||||||||||||||||||||||||
|
|
|
|
|
|
|
| |||||||||||||||||||||
| Net increase in shares outstanding | 35,657 | $ | 337,405 | 1,294 | $ | 14,994 | ||||||||||||||||||||||
|
|
|
|
|
|
|
| |||||||||||||||||||||
| Y Class | ||||||||||||||||||||||||||||
| Year Ended June 30, 2019 | Year Ended June 30, 2018 | |||||||||||||||||||||||||||
Alpha Quant Quality Fund | Shares | Amount | Shares | Amount | ||||||||||||||||||||||||
| Shares sold | 9,823 | $ | 127,916 | 1,712 | $ | 19,960 | ||||||||||||||||||||||
| Reinvestment of dividends | 3,967 | 37,253 | 84 | 976 | ||||||||||||||||||||||||
| Shares redeemed | (2,041 | ) | (22,058 | ) | - | - | ||||||||||||||||||||||
|
|
|
|
|
|
|
| |||||||||||||||||||||
| Net increase in shares outstanding | 11,749 | $ | 143,111 | 1,796 | $ | 20,936 | ||||||||||||||||||||||
|
|
|
|
|
|
|
| |||||||||||||||||||||
| Investor Class | ||||||||||||||||||||||||||||
| Year Ended June 30, 2019 | Year Ended June 30, 2018 | |||||||||||||||||||||||||||
Alpha Quant Quality Fund | Shares | Amount | Shares | Amount | ||||||||||||||||||||||||
| Shares sold | 4,144 | $ | 50,675 | 739 | $ | 8,531 | ||||||||||||||||||||||
| Reinvestment of dividends | 2,293 | 21,418 | 74 | 857 | ||||||||||||||||||||||||
| Shares redeemed | (2,846 | ) | (32,676 | ) | - | - | ||||||||||||||||||||||
|
|
|
|
|
|
|
| |||||||||||||||||||||
| Net increase in shares outstanding | 3,591 | $ | 39,417 | 813 | $ | 9,388 | ||||||||||||||||||||||
|
|
|
|
|
|
|
| |||||||||||||||||||||
| Institutional Class | ||||||||||||||||||||||||||||
| Year Ended June 30, 2019 | Year Ended June 30, 2018 | |||||||||||||||||||||||||||
Alpha Quant Value Fund | Shares | Amount | Shares | Amount | ||||||||||||||||||||||||
| Shares sold | 5,890 | $ | 72,000 | 9,808 | $ | 120,000 | ||||||||||||||||||||||
| Reinvestment of dividends | 9,170 | 88,493 | 2,720 | 31,446 | ||||||||||||||||||||||||
| Shares redeemed | (6,519 | ) | (74,578 | ) | - | - | ||||||||||||||||||||||
|
|
|
|
|
|
|
| |||||||||||||||||||||
| Net increase in shares outstanding | 8,541 | $ | 85,915 | 12,528 | $ | 151,446 | ||||||||||||||||||||||
|
|
|
|
|
|
|
| |||||||||||||||||||||
| Y Class | ||||||||||||||||||||||||||||
| Year Ended June 30, 2019 | Year Ended June 30, 2018 | |||||||||||||||||||||||||||
Alpha Quant Value Fund | Shares | Amount | Shares | Amount | ||||||||||||||||||||||||
| Shares sold | 132,582 | $ | 1,528,893 | 78,892 | $ | 925,846 | ||||||||||||||||||||||
| Reinvestment of dividends | 7,267 | 69,985 | 195 | 2,250 | ||||||||||||||||||||||||
| Shares redeemed | (131,420 | ) | (1,377,769 | ) | (53 | ) | (650 | ) | ||||||||||||||||||||
|
|
|
|
|
|
|
| |||||||||||||||||||||
| Net increase in shares outstanding | 8,429 | $ | 221,109 | 79,034 | $ | 927,446 | ||||||||||||||||||||||
|
|
|
|
|
|
|
| |||||||||||||||||||||
| Investor Class | ||||||||||||||||||||||||||||
| Year Ended June 30, 2019 | Year Ended June 30, 2018 | |||||||||||||||||||||||||||
Alpha Quant Value Fund | Shares | Amount | Shares | Amount | ||||||||||||||||||||||||
| Shares sold | 170,033 | $ | 2,044,640 | 8,017 | $ | 94,916 | ||||||||||||||||||||||
| Reinvestment of dividends | 6,201 | 59,407 | 168 | 1,939 | ||||||||||||||||||||||||
| Shares redeemed | (115,432 | ) | (1,223,806 | ) | (19 | ) | (231 | ) | ||||||||||||||||||||
|
|
|
|
|
|
|
| |||||||||||||||||||||
| Net increase in shares outstanding | 60,802 | $ | 880,241 | 8,166 | $ | 96,624 | ||||||||||||||||||||||
|
|
|
|
|
|
|
| |||||||||||||||||||||
46
American Beacon FundsSM
Notes to Financial Statements
June 30, 2019
11. Subsequent Events
Management has evaluated subsequent events for possible recognition or disclosure in the financial statements through the date the financial statements are issued. Management has determined that there are no material events that would require disclosure in the Funds’ financial statements through this date.
47
American Beacon Alpha Quant Core FundSM
Financial Highlights
(For a share outstanding throughout the period)
| Institutional Class | ||||||||||||||||||||
| Year Ended June 30, 2019 | Year Ended June 30, 2018 | March 22, 2017A to June 30, 2017 | ||||||||||||||||||
|
| |||||||||||||||||||
Net asset value, beginning of period | $ | 11.78 | $ | 10.20 | $ | 10.00 | ||||||||||||||
|
|
|
|
|
| |||||||||||||||
Income (loss) from investment operations: | ||||||||||||||||||||
Net investment income | 0.16 | 0.15 | B | 0.03 | ||||||||||||||||
Net gains (losses) on investments (both realized and unrealized) | (0.30 | ) | 1.56 | 0.17 | ||||||||||||||||
|
|
|
|
|
| |||||||||||||||
Total income (loss) from investment operations | (0.14 | ) | 1.71 | 0.20 | ||||||||||||||||
|
|
|
|
|
| |||||||||||||||
Less distributions: | ||||||||||||||||||||
Dividends from net investment income | (0.12 | ) | (0.13 | ) | - | |||||||||||||||
Distributions from net realized gains | (0.90 | ) | - | - | ||||||||||||||||
|
|
|
|
|
| |||||||||||||||
Total distributions | (1.02 | ) | (0.13 | ) | - | |||||||||||||||
|
|
|
|
|
| |||||||||||||||
Net asset value, end of period | $ | 10.62 | $ | 11.78 | $ | 10.20 | ||||||||||||||
|
|
|
|
|
| |||||||||||||||
Total returnC | (0.20 | )% | 16.85 | % | 2.00 | %D | ||||||||||||||
|
|
|
|
|
| |||||||||||||||
Ratios and supplemental data: | ||||||||||||||||||||
Net assets, end of period | $ | 2,775,726 | $ | 2,364,264 | $ | 1,835,621 | ||||||||||||||
Ratios to average net assets: | ||||||||||||||||||||
Expenses, before reimbursements | 4.20 | % | 5.55 | % | 12.23 | %E | ||||||||||||||
Expenses, net of reimbursements | 0.67 | % | 0.69 | % | 0.69 | %E | ||||||||||||||
Net investment (loss), before expense reimbursements | (1.97 | )% | (3.49 | )% | (10.44 | )%E | ||||||||||||||
Net investment income, net of reimbursements | 1.56 | % | 1.37 | % | 1.09 | %E | ||||||||||||||
Portfolio turnover rate | 65 | % | 56 | % | 14 | %F | ||||||||||||||
| A | Commencement of operations. |
| B | Includesnon-recurring dividends. Without these dividends, net investment income per share would have been $0.16. |
| C | Based on net asset value, which does not reflect the sales charge, redemption fee, or contingent deferred sales charge, if applicable. May include adjustments in accordance with U.S. GAAP and as such, the net asset value for reporting purposes and the returns based upon those net asset values may differ from the net asset value and returns for shareholder transactions. |
| D | Not annualized. |
| E | Annualized. |
| F | Portfolio turnover rate is for the period from March 22, 2017 through June 30, 2017 and is not annualized. |
See accompanying notes
48
American Beacon Alpha Quant Core FundSM
Financial Highlights
(For a share outstanding throughout the period)
| Y Class | ||||||||||||||||||||
| Year Ended June 30, 2019 | Year Ended June 30, 2018 | March 22, 2017A to June 30, 2017 | ||||||||||||||||||
|
| |||||||||||||||||||
Net asset value, beginning of period | $ | 11.77 | $ | 10.20 | $ | 10.00 | ||||||||||||||
|
|
|
|
|
| |||||||||||||||
Income (loss) from investment operations: | ||||||||||||||||||||
Net investment income | 0.16 | 0.13 | B | 0.03 | ||||||||||||||||
Net gains (losses) on investments (both realized and unrealized) | (0.31 | ) | 1.57 | 0.17 | ||||||||||||||||
|
|
|
|
|
| |||||||||||||||
Total income (loss) from investment operations | (0.15 | ) | 1.70 | 0.20 | ||||||||||||||||
|
|
|
|
|
| |||||||||||||||
Less distributions: | ||||||||||||||||||||
Dividends from net investment income | (0.12 | ) | (0.13 | ) | - | |||||||||||||||
Distributions from net realized gains | (0.90 | ) | - | - | ||||||||||||||||
|
|
|
|
|
| |||||||||||||||
Total distributions | (1.02 | ) | (0.13 | ) | - | |||||||||||||||
|
|
|
|
|
| |||||||||||||||
Net asset value, end of period | $ | 10.60 | $ | 11.77 | $ | 10.20 | ||||||||||||||
|
|
|
|
|
| |||||||||||||||
Total returnC | (0.28 | )% | 16.75 | % | 2.00 | %D | ||||||||||||||
|
|
|
|
|
| |||||||||||||||
Ratios and supplemental data: | ||||||||||||||||||||
Net assets, end of period | $ | 190,121 | $ | 139,588 | $ | 101,951 | ||||||||||||||
Ratios to average net assets: | ||||||||||||||||||||
Expenses, before reimbursements | 4.23 | % | 5.63 | % | 17.45 | %E | ||||||||||||||
Expenses, net of reimbursements | 0.77 | % | 0.79 | % | 0.79 | %E | ||||||||||||||
Net investment (loss), before expense reimbursements | (2.00 | )% | (3.59 | )% | (15.67 | )%E | ||||||||||||||
Net investment income, net of reimbursements | 1.47 | % | 1.25 | % | 0.99 | %E | ||||||||||||||
Portfolio turnover rate | 65 | % | 56 | % | 14 | %F | ||||||||||||||
| A | Commencement of operations. |
| B | Includesnon-recurring dividends. Without these dividends, net investment income per share would have been $0.14. |
| C | Based on net asset value, which does not reflect the sales charge, redemption fee, or contingent deferred sales charge, if applicable. May include adjustments in accordance with U.S. GAAP and as such, the net asset value for reporting purposes and the returns based upon those net asset values may differ from the net asset value and returns for shareholder transactions. |
| D | Not annualized. |
| E | Annualized. |
| F | Portfolio turnover rate is for the period from March 22, 2017 through June 30, 2017 and is not annualized. |
See accompanying notes
49
American Beacon Alpha Quant Core FundSM
Financial Highlights
(For a share outstanding throughout the period)
| Investor Class | ||||||||||||||||||||
| Year Ended June 30, 2019 | Year Ended June 30, 2018 | March 22, 2017A to June 30, 2017 | ||||||||||||||||||
|
| |||||||||||||||||||
Net asset value, beginning of period | $ | 11.73 | $ | 10.19 | $ | 10.00 | ||||||||||||||
|
|
|
|
|
| |||||||||||||||
Income (loss) from investment operations: | ||||||||||||||||||||
Net investment income | 0.14 | 0.11 | B | 0.02 | ||||||||||||||||
Net gains (losses) on investments (both realized and unrealized) | (0.33 | ) | 1.56 | 0.17 | ||||||||||||||||
|
|
|
|
|
| |||||||||||||||
Total income (loss) from investment operations | (0.19 | ) | 1.67 | 0.19 | ||||||||||||||||
|
|
|
|
|
| |||||||||||||||
Less distributions: | ||||||||||||||||||||
Dividends from net investment income | (0.12 | ) | (0.13 | ) | - | |||||||||||||||
Distributions from net realized gains | (0.90 | ) | - | - | ||||||||||||||||
|
|
|
|
|
| |||||||||||||||
Total distributions | (1.02 | ) | (0.13 | ) | - | |||||||||||||||
|
|
|
|
|
| |||||||||||||||
Net asset value, end of period | $ | 10.52 | $ | 11.73 | $ | 10.19 | ||||||||||||||
|
|
|
|
|
| |||||||||||||||
Total returnC | (0.65 | )% | 16.47 | % | 1.90 | %D | ||||||||||||||
|
|
|
|
|
| |||||||||||||||
Ratios and supplemental data: | ||||||||||||||||||||
Net assets, end of period | $ | 234,953 | $ | 126,458 | $ | 104,854 | ||||||||||||||
Ratios to average net assets: | ||||||||||||||||||||
Expenses, before reimbursements | 8.76 | % | 6.73 | % | 18.69 | %E | ||||||||||||||
Expenses, net of reimbursements | 1.05 | % | 1.07 | % | 1.07 | %E | ||||||||||||||
Net investment (loss), before expense reimbursements | (6.49 | )% | (4.66 | )% | (16.91 | )%E | ||||||||||||||
Net investment income, net of reimbursements | 1.22 | % | 1.01 | % | 0.71 | %E | ||||||||||||||
Portfolio turnover rate | 65 | % | 56 | % | 14 | %F | ||||||||||||||
| A | Commencement of operations. |
| B | Includesnon-recurring dividends. Without these dividends, net investment income per share would have been $0.12. |
| C | Based on net asset value, which does not reflect the sales charge, redemption fee, or contingent deferred sales charge, if applicable. May include adjustments in accordance with U.S. GAAP and as such, the net asset value for reporting purposes and the returns based upon those net asset values may differ from the net asset value and returns for shareholder transactions. |
| D | Not annualized. |
| E | Annualized. |
| F | Portfolio turnover rate is for the period from March 22, 2017 through June 30, 2017 and is not annualized. |
See accompanying notes
50
American Beacon Alpha Quant Dividend FundSM
Financial Highlights
(For a share outstanding throughout the period)
| Institutional Class | ||||||||||||||||||||
| Year Ended June 30, 2019 | Year Ended June 30, 2018 | March 22, 2017A to June 30, 2017 | ||||||||||||||||||
|
|
|
|
|
| |||||||||||||||
Net asset value, beginning of period | $ | 10.42 | $ | 10.00 | $ | 10.00 | ||||||||||||||
|
|
|
|
|
| |||||||||||||||
Income (loss) from investment operations: | ||||||||||||||||||||
Net investment income | 0.29 | 0.29 | 0.07 | |||||||||||||||||
Net gains (losses) on investments (both realized and unrealized) | 1.14 | 0.41 | (0.07 | ) | ||||||||||||||||
|
|
|
|
|
| |||||||||||||||
Total income (loss) from investment operations | 1.43 | 0.70 | - | |||||||||||||||||
|
|
|
|
|
| |||||||||||||||
Less distributions: | ||||||||||||||||||||
Dividends from net investment income | (0.28 | ) | (0.28 | ) | - | |||||||||||||||
Distributions from net realized gains | (0.49 | ) | (0.00 | )B | - | |||||||||||||||
|
|
|
|
|
| |||||||||||||||
Total distributions | (0.77 | ) | (0.28 | ) | - | |||||||||||||||
|
|
|
|
|
| |||||||||||||||
Net asset value, end of period | $ | 11.08 | $ | 10.42 | $ | 10.00 | ||||||||||||||
|
|
|
|
|
| |||||||||||||||
Total returnC | 14.94 | % | 7.00 | % | 0.00 | %D | ||||||||||||||
|
|
|
|
|
| |||||||||||||||
Ratios and supplemental data: | ||||||||||||||||||||
Net assets, end of period | $ | 2,426,418 | $ | 2,025,327 | $ | 1,799,305 | ||||||||||||||
Ratios to average net assets: | ||||||||||||||||||||
Expenses, before reimbursements | 4.65 | % | 5.91 | % | 12.37 | %E | ||||||||||||||
Expenses, net of reimbursements | 0.67 | % | 0.69 | % | 0.69 | %E | ||||||||||||||
Net investment (loss), before expense reimbursements | (1.17 | )% | (2.42 | )% | (9.23 | )%E | ||||||||||||||
Net investment income, net of reimbursements | 2.81 | % | 2.79 | % | 2.45 | %E | ||||||||||||||
Portfolio turnover rate | 34 | % | 49 | % | 0 | %F | ||||||||||||||
| A | Commencement of operations. |
| B | Amount is less than $0.01 per share. |
| C | Based on net asset value, which does not reflect the sales charge, redemption fee, or contingent deferred sales charge, if applicable. May include adjustments in accordance with U.S. GAAP and as such, the net asset value for reporting purposes and the returns based upon those net asset values may differ from the net asset value and returns for shareholder transactions. |
| D | Not annualized. |
| E | Annualized. |
| F | Portfolio turnover is based on the lesser of long-term purchases or sales divided by the average long-term fair value during the period. The Fund did not transact in any sales of long-term securities during the reporting period. |
See accompanying notes
51
American Beacon Alpha Quant Dividend FundSM
Financial Highlights
(For a share outstanding throughout the period)
| Y Class | ||||||||||||||||||||
| Year Ended June 30, 2019 | Year Ended June 30, 2018 | March 22, 2017A to June 30, 2017 | ||||||||||||||||||
|
| |||||||||||||||||||
Net asset value, beginning of period | $ | 10.41 | $ | 9.99 | $ | 10.00 | ||||||||||||||
|
|
|
|
|
| |||||||||||||||
Income (loss) from investment operations: | ||||||||||||||||||||
Net investment income | 0.22 | 0.29 | 0.06 | |||||||||||||||||
Net gains (losses) on investments (both realized and unrealized) | 1.19 | 0.41 | (0.07 | ) | ||||||||||||||||
|
|
|
|
|
| |||||||||||||||
Total income (loss) from investment operations | 1.41 | 0.70 | (0.01 | ) | ||||||||||||||||
|
|
|
|
|
| |||||||||||||||
Less distributions: | ||||||||||||||||||||
Dividends from net investment income | (0.28 | ) | (0.28 | ) | - | |||||||||||||||
Distributions from net realized gains | (0.49 | ) | (0.00 | )B | - | |||||||||||||||
|
|
|
|
|
| |||||||||||||||
Total distributions | (0.77 | ) | (0.28 | ) | - | |||||||||||||||
|
|
|
|
|
| |||||||||||||||
Net asset value, end of period | $ | 11.05 | $ | 10.41 | $ | 9.99 | ||||||||||||||
|
|
|
|
|
| |||||||||||||||
Total returnC | 14.76 | % | 7.01 | % | (0.10 | )%D | ||||||||||||||
|
|
|
|
|
| |||||||||||||||
Ratios and supplemental data: | ||||||||||||||||||||
Net assets, end of period | $ | 678,401 | $ | 132,924 | $ | 99,934 | ||||||||||||||
Ratios to average net assets: | ||||||||||||||||||||
Expenses, before reimbursements | 4.28 | % | 5.98 | % | 17.67 | %E | ||||||||||||||
Expenses, net of reimbursements | 0.77 | % | 0.79 | % | 0.79 | %E | ||||||||||||||
Net investment (loss), before expense reimbursements | (0.58 | )% | (2.41 | )% | (14.54 | )%E | ||||||||||||||
Net investment income, net of reimbursements | 2.93 | % | 2.79 | % | 2.34 | %E | ||||||||||||||
Portfolio turnover rate | 34 | % | 49 | % | 0 | %F | ||||||||||||||
| A | Commencement of operations. |
| B | Amount is less than $0.01 per share. |
| C | Based on net asset value, which does not reflect the sales charge, redemption fee, or contingent deferred sales charge, if applicable. May include adjustments in accordance with U.S. GAAP and as such, the net asset value for reporting purposes and the returns based upon those net asset values may differ from the net asset value and returns for shareholder transactions. |
| D | Not annualized. |
| E | Annualized. |
| F | Portfolio turnover is based on the lesser of long-term purchases or sales divided by the average long-term fair value during the period. The Fund did not transact in any sales of long-term securities during the reporting period. |
See accompanying notes
52
American Beacon Alpha Quant Dividend FundSM
Financial Highlights
(For a share outstanding throughout the period)
| Investor Class | ||||||||||||||||||||
| Year Ended June 30, 2019 | Year Ended June 30, 2018 | March 22, 2017A to June 30, 2017 | ||||||||||||||||||
|
| |||||||||||||||||||
Net asset value, beginning of period | $ | 10.37 | $ | 9.99 | $ | 10.00 | ||||||||||||||
|
|
|
|
|
| |||||||||||||||
Income (loss) from investment operations: | ||||||||||||||||||||
Net investment income | 0.27 | 0.26 | 0.05 | |||||||||||||||||
Net gains (losses) on investments (both realized and unrealized) | 1.11 | 0.40 | (0.06 | ) | ||||||||||||||||
|
|
|
|
|
| |||||||||||||||
Total income (loss) from investment operations | 1.38 | 0.66 | (0.01 | ) | ||||||||||||||||
|
|
|
|
|
| |||||||||||||||
Less distributions: | ||||||||||||||||||||
Dividends from net investment income | (0.28 | ) | (0.28 | ) | - | |||||||||||||||
Distributions from net realized gains | (0.49 | ) | (0.00 | )B | - | |||||||||||||||
|
|
|
|
|
| |||||||||||||||
Total distributions | (0.77 | ) | (0.28 | ) | - | |||||||||||||||
|
|
|
|
|
| |||||||||||||||
Net asset value, end of period | $ | 10.98 | $ | 10.37 | $ | 9.99 | ||||||||||||||
|
|
|
|
|
| |||||||||||||||
Total returnC | 14.51 | % | 6.60 | % | (0.10 | )%D | ||||||||||||||
|
|
|
|
|
| |||||||||||||||
Ratios and supplemental data: | ||||||||||||||||||||
Net assets, end of period | $ | 614,262 | $ | 118,686 | $ | 102,833 | ||||||||||||||
Ratios to average net assets: | ||||||||||||||||||||
Expenses, before reimbursements | 6.56 | % | 7.11 | % | 18.92 | %E | ||||||||||||||
Expenses, net of reimbursements | 1.05 | % | 1.07 | % | 1.07 | %E | ||||||||||||||
Net investment (loss), before expense reimbursements | (3.04 | )% | (3.63 | )% | (15.79 | )%E | ||||||||||||||
Net investment income, net of reimbursements | 2.47 | % | 2.41 | % | 2.06 | %E | ||||||||||||||
Portfolio turnover rate | 34 | % | 49 | % | 0 | %F | ||||||||||||||
| A | Commencement of operations. |
| B | Amount is less than $0.01 per share. |
| C | Based on net asset value, which does not reflect the sales charge, redemption fee, or contingent deferred sales charge, if applicable. May include adjustments in accordance with U.S. GAAP and as such, the net asset value for reporting purposes and the returns based upon those net asset values may differ from the net asset value and returns for shareholder transactions. |
| D | Not annualized. |
| E | Annualized. |
| F | Portfolio turnover is based on the lesser of long-term purchases or sales divided by the average long-term fair value during the period. The Fund did not transact in any sales of long-term securities during the reporting period. |
See accompanying notes
53
American Beacon Alpha Quant Quality FundSM
Financial Highlights
(For a share outstanding throughout the period)
| Institutional Class | ||||||||||||||||||||
| Year Ended June 30, 2019 | Year Ended June 30, 2018 | March 22, 2017A to June 30, 2017 | ||||||||||||||||||
|
| |||||||||||||||||||
Net asset value, beginning of period | $ | 12.20 | $ | 10.10 | $ | 10.00 | ||||||||||||||
|
|
|
|
|
| |||||||||||||||
Income (loss) from investment operations: | ||||||||||||||||||||
Net investment income | 0.15 | 0.09 | 0.03 | |||||||||||||||||
Net gains (losses) on investments (both realized and unrealized) | (0.01 | ) | 2.09 | 0.07 | ||||||||||||||||
|
|
|
|
|
| |||||||||||||||
Total income (loss) from investment operations | 0.14 | 2.18 | 0.10 | |||||||||||||||||
|
|
|
|
|
| |||||||||||||||
Less distributions: | ||||||||||||||||||||
Dividends from net investment income | (0.11 | ) | (0.08 | ) | - | |||||||||||||||
Distributions from net realized gains | (1.61 | ) | - | - | ||||||||||||||||
|
|
|
|
|
| |||||||||||||||
Total distributions | (1.72 | ) | (0.08 | ) | - | |||||||||||||||
|
|
|
|
|
| |||||||||||||||
Net asset value, end of period | $ | 10.62 | $ | 12.20 | $ | 10.10 | ||||||||||||||
|
|
|
|
|
| |||||||||||||||
Total returnB | 2.99 | % | 21.66 | % | 1.00 | %C | ||||||||||||||
|
|
|
|
|
| |||||||||||||||
Ratios and supplemental data: | ||||||||||||||||||||
Net assets, end of period | $ | 2,304,794 | $ | 2,212,134 | $ | 1,817,518 | ||||||||||||||
Ratios to average net assets: | ||||||||||||||||||||
Expenses, before reimbursements | 4.69 | % | 5.69 | % | 12.24 | %D | ||||||||||||||
Expenses, net of reimbursements | 0.67 | % | 0.69 | % | 0.69 | %D | ||||||||||||||
Net investment (loss), before expense reimbursements | (2.65 | )% | (4.21 | )% | (10.33 | )%D | ||||||||||||||
Net investment income, net of reimbursements | 1.37 | % | 0.79 | % | 1.22 | %D | ||||||||||||||
Portfolio turnover rate | 83 | % | 62 | % | 19 | %E | ||||||||||||||
| A | Commencement of operations. |
| B | Based on net asset value, which does not reflect the sales charge, redemption fee, or contingent deferred sales charge, if applicable. May include adjustments in accordance with U.S. GAAP and as such, the net asset value for reporting purposes and the returns based upon those net asset values may differ from the net asset value and returns for shareholder transactions. |
| C | Not annualized. |
| D | Annualized. |
| E | Portfolio turnover rate is for the period from March 22, 2017 through June 30, 2017 and is not annualized. |
See accompanying notes
54
American Beacon Alpha Quant Quality FundSM
Financial Highlights
(For a share outstanding throughout the period)
| Y Class | ||||||||||||||||||||
| Year Ended June 30, 2019 | Year Ended June 30, 2018 | March 22, 2017A to June 30, 2017 | ||||||||||||||||||
|
| |||||||||||||||||||
Net asset value, beginning of period | $ | 12.19 | $ | 10.09 | $ | 10.00 | ||||||||||||||
|
|
|
|
|
| |||||||||||||||
Income (loss) from investment operations: | ||||||||||||||||||||
Net investment income | 0.14 | 0.07 | 0.03 | |||||||||||||||||
Net gains (losses) on investments (both realized and unrealized) | (0.01 | ) | 2.11 | 0.06 | ||||||||||||||||
|
|
|
|
|
| |||||||||||||||
Total income (loss) from investment operations | 0.13 | 2.18 | 0.09 | |||||||||||||||||
|
|
|
|
|
| |||||||||||||||
Less distributions: | ||||||||||||||||||||
Dividends from net investment income | (0.11 | ) | (0.08 | ) | - | |||||||||||||||
Distributions from net realized gains | (1.61 | ) | - | - | ||||||||||||||||
|
|
|
|
|
| |||||||||||||||
Total distributions | (1.72 | ) | (0.08 | ) | - | |||||||||||||||
|
|
|
|
|
| |||||||||||||||
Net asset value, end of period | $ | 10.60 | $ | 12.19 | $ | 10.09 | ||||||||||||||
|
|
|
|
|
| |||||||||||||||
Total returnB | 2.91 | % | 21.68 | % | 0.90 | %C | ||||||||||||||
|
|
|
|
|
| |||||||||||||||
Ratios and supplemental data: | ||||||||||||||||||||
Net assets, end of period | $ | 249,477 | $ | 143,744 | $ | 100,946 | ||||||||||||||
Ratios to average net assets: | ||||||||||||||||||||
Expenses, before reimbursements | 4.75 | % | 5.78 | % | 17.48 | %D | ||||||||||||||
Expenses, net of reimbursements | 0.77 | % | 0.79 | % | 0.79 | %D | ||||||||||||||
Net investment (loss), before expense reimbursements | (2.68 | )% | (4.30 | )% | (15.57 | )%D | ||||||||||||||
Net investment income, net of reimbursements | 1.30 | % | 0.68 | % | 1.12 | %D | ||||||||||||||
Portfolio turnover rate | 83 | % | 62 | % | 19 | %E | ||||||||||||||
| A | Commencement of operations. |
| B | Based on net asset value, which does not reflect the sales charge, redemption fee, or contingent deferred sales charge, if applicable. May include adjustments in accordance with U.S. GAAP and as such, the net asset value for reporting purposes and the returns based upon those net asset values may differ from the net asset value and returns for shareholder transactions. |
| C | Not annualized. |
| D | Annualized. |
| E | Portfolio turnover rate is for the period from March 22, 2017 through June 30, 2017 and is not annualized. |
See accompanying notes
55
American Beacon Alpha Quant Quality FundSM
Financial Highlights
(For a share outstanding throughout the period)
| Investor Class | ||||||||||||||||||||
| Year Ended June 30, 2019 | Year Ended June 30, 2018 | March 22, 2017A to June 30, 2017 | ||||||||||||||||||
|
| |||||||||||||||||||
Net asset value, beginning of period | $ | 12.14 | $ | 10.09 | $ | 10.00 | ||||||||||||||
|
|
|
|
|
| |||||||||||||||
Income (loss) from investment operations: | ||||||||||||||||||||
Net investment income | 0.13 | 0.05 | 0.02 | |||||||||||||||||
Net gains (losses) on investments (both realized and unrealized) | (0.03 | ) | 2.08 | 0.07 | ||||||||||||||||
|
|
|
|
|
| |||||||||||||||
Total income (loss) from investment operations | 0.10 | 2.13 | 0.09 | |||||||||||||||||
|
|
|
|
|
| |||||||||||||||
Less distributions: | ||||||||||||||||||||
Dividends from net investment income | (0.11 | ) | (0.08 | ) | - | |||||||||||||||
Distributions from net realized gains | (1.61 | ) | - | - | ||||||||||||||||
|
|
|
|
|
| |||||||||||||||
Total distributions | (1.72 | ) | (0.08 | ) | - | |||||||||||||||
|
|
|
|
|
| |||||||||||||||
Net asset value, end of period | $ | 10.52 | $ | 12.14 | $ | 10.09 | ||||||||||||||
|
|
|
|
|
| |||||||||||||||
Total returnB | 2.64 | % | 21.18 | % | 0.90 | %C | ||||||||||||||
|
|
|
|
|
| |||||||||||||||
Ratios and supplemental data: | ||||||||||||||||||||
Net assets, end of period | $ | 154,644 | $ | 134,870 | $ | 103,837 | ||||||||||||||
Ratios to average net assets: | ||||||||||||||||||||
Expenses, before reimbursements | 9.45 | % | 6.83 | % | 18.73 | %D | ||||||||||||||
Expenses, net of reimbursements | 1.05 | % | 1.07 | % | 1.07 | %D | ||||||||||||||
Net investment (loss), before expense reimbursements | (7.39 | )% | (5.35 | )% | (16.82 | )%D | ||||||||||||||
Net investment income, net of reimbursements | 1.01 | % | 0.41 | % | 0.84 | %D | ||||||||||||||
Portfolio turnover rate | 83 | % | 62 | % | 19 | %E | ||||||||||||||
| A | Commencement of operations. |
| B | Based on net asset value, which does not reflect the sales charge, redemption fee, or contingent deferred sales charge, if applicable. May include adjustments in accordance with U.S. GAAP and as such, the net asset value for reporting purposes and the returns based upon those net asset values may differ from the net asset value and returns for shareholder transactions. |
| C | Not annualized. |
| D | Annualized. |
| E | Portfolio turnover rate is for the period from March 22, 2017 through June 30, 2017 and is not annualized. |
See accompanying notes
56
American Beacon Alpha Quant Value FundSM
Financial Highlights
(For a share outstanding throughout the period)
| Institutional Class | ||||||||||||||||||||
| Year Ended June 30, 2019 | Year Ended June 30, 2018 | March 22, 2017A to June 30, 2017 | ||||||||||||||||||
|
| |||||||||||||||||||
Net asset value, beginning of period | $ | 11.88 | $ | 10.23 | $ | 10.00 | ||||||||||||||
|
|
|
|
|
| |||||||||||||||
Income (loss) from investment operations: | ||||||||||||||||||||
Net investment income | 0.20 | 0.21 | B | 0.03 | ||||||||||||||||
Net gains (losses) on investments (both realized and unrealized) | (0.92 | ) | 1.61 | 0.20 | ||||||||||||||||
|
|
|
|
|
| |||||||||||||||
Total income (loss) from investment operations | (0.72 | ) | 1.82 | 0.23 | ||||||||||||||||
|
|
|
|
|
| |||||||||||||||
Less distributions: | ||||||||||||||||||||
Dividends from net investment income | (0.11 | ) | (0.17 | ) | - | |||||||||||||||
Distributions from net realized gains | (0.37 | ) | - | - | ||||||||||||||||
|
|
|
|
|
| |||||||||||||||
Total distributions | (0.48 | ) | (0.17 | ) | - | |||||||||||||||
|
|
|
|
|
| |||||||||||||||
Net asset value, end of period | $ | 10.68 | $ | 11.88 | $ | 10.23 | ||||||||||||||
|
|
|
|
|
| |||||||||||||||
Total returnC | (5.65 | )% | 17.88 | % | 2.30 | %D | ||||||||||||||
|
|
|
|
|
| |||||||||||||||
Ratios and supplemental data: | ||||||||||||||||||||
Net assets, end of period | $ | 2,147,774 | $ | 2,287,739 | $ | 1,842,294 | ||||||||||||||
Ratios to average net assets: | ||||||||||||||||||||
Expenses, before reimbursements | 2.90 | % | 5.18 | % | 12.16 | %E | ||||||||||||||
Expenses, net of reimbursements | 0.67 | % | 0.69 | % | 0.69 | %E | ||||||||||||||
Net investment (loss), before expense reimbursements | (0.44 | )% | (2.58 | )% | (10.48 | )%E | ||||||||||||||
Net investment income, net of reimbursements | 1.79 | % | 1.91 | % | 0.99 | %E | ||||||||||||||
Portfolio turnover rate | 90 | % | 53 | % | 11 | %F | ||||||||||||||
| A | Commencement of operations. |
| B | Includesnon-recurring dividends. Without these dividends, net investment income per share would have been $0.22. |
| C | Based on net asset value, which does not reflect the sales charge, redemption fee, or contingent deferred sales charge, if applicable. May include adjustments in accordance with U.S. GAAP and as such, the net asset value for reporting purposes and the returns based upon those net asset values may differ from the net asset value and returns for shareholder transactions. |
| D | Not annualized. |
| E | Annualized. |
| F | Portfolio turnover rate is for the period from March 22, 2017 through June 30, 2017 and is not annualized. |
See accompanying notes
57
American Beacon Alpha Quant Value FundSM
Financial Highlights
(For a share outstanding throughout the period)
| Y Class | ||||||||||||||||||||
| Year Ended June 30, 2019 | Year Ended June 30, 2018 | March 22, 2017A to June 30, 2017 | ||||||||||||||||||
|
| |||||||||||||||||||
Net asset value, beginning of period | $ | 11.87 | $ | 10.23 | $ | 10.00 | ||||||||||||||
|
|
|
|
|
| |||||||||||||||
Income (loss) from investment operations: | ||||||||||||||||||||
Net investment income | 0.25 | 0.18 | B | 0.02 | ||||||||||||||||
Net gains (losses) on investments (both realized and unrealized) | (0.98 | ) | 1.63 | 0.21 | ||||||||||||||||
|
|
|
|
|
| |||||||||||||||
Total income (loss) from investment operations | (0.73 | ) | 1.81 | 0.23 | ||||||||||||||||
|
|
|
|
|
| |||||||||||||||
Less distributions: | ||||||||||||||||||||
Dividends from net investment income | (0.11 | ) | (0.17 | ) | - | |||||||||||||||
Distributions from net realized gains | (0.37 | ) | - | - | ||||||||||||||||
|
|
|
|
|
| |||||||||||||||
Total distributions | (0.48 | ) | (0.17 | ) | - | |||||||||||||||
|
|
|
|
|
| |||||||||||||||
Net asset value, end of period | $ | 10.66 | $ | 11.87 | $ | 10.23 | ||||||||||||||
|
|
|
|
|
| |||||||||||||||
Total returnC | (5.74 | )% | 17.79 | % | 2.30 | %D | ||||||||||||||
|
|
|
|
|
| |||||||||||||||
Ratios and supplemental data: | ||||||||||||||||||||
Net assets, end of period | $ | 1,038,803 | $ | 1,056,453 | $ | 102,322 | ||||||||||||||
Ratios to average net assets: | ||||||||||||||||||||
Expenses, before reimbursements | 3.04 | % | 5.30 | % | 17.37 | %E | ||||||||||||||
Expenses, net of reimbursements | 0.77 | % | 0.79 | % | 0.79 | %E | ||||||||||||||
Net investment (loss), before expense reimbursements | (0.49 | )% | (2.69 | )% | (15.69 | )%E | ||||||||||||||
Net investment income, net of reimbursements | 1.78 | % | 1.82 | % | 0.89 | %E | ||||||||||||||
Portfolio turnover rate | 90 | % | 53 | % | 11 | %F | ||||||||||||||
| A | Commencement of operations. |
| B | Includesnon-recurring dividends. Without these dividends, net investment income per share would have been $0.19. |
| C | Based on net asset value, which does not reflect the sales charge, redemption fee, or contingent deferred sales charge, if applicable. May include adjustments in accordance with U.S. GAAP and as such, the net asset value for reporting purposes and the returns based upon those net asset values may differ from the net asset value and returns for shareholder transactions. |
| D | Not annualized. |
| E | Annualized. |
| F | Portfolio turnover rate is for the period from March 22, 2017 through June 30, 2017 and is not annualized. |
See accompanying notes
58
American Beacon Alpha Quant Value FundSM
Financial Highlights
(For a share outstanding throughout the period)
| Investor Class | ||||||||||||||||||||
| Year Ended June 30, 2019 | Year Ended June 30, 2018 | March 22, 2017A to June 30, 2017 | ||||||||||||||||||
|
| |||||||||||||||||||
Net asset value, beginning of period | $ | 11.82 | $ | 10.22 | $ | 10.00 | ||||||||||||||
|
|
|
|
|
| |||||||||||||||
Income (loss) from investment operations: | ||||||||||||||||||||
Net investment income | 0.15 | 0.17 | B | 0.02 | ||||||||||||||||
Net gains (losses) on investments (both realized and unrealized) | (0.90 | ) | 1.60 | 0.20 | ||||||||||||||||
|
|
|
|
|
| |||||||||||||||
Total income (loss) from investment operations | (0.75 | ) | 1.77 | 0.22 | ||||||||||||||||
|
|
|
|
|
| |||||||||||||||
Less distributions: | ||||||||||||||||||||
Dividends from net investment income | (0.11 | ) | (0.17 | ) | - | |||||||||||||||
Distributions from net realized gains | (0.37 | ) | - | - | ||||||||||||||||
|
|
|
|
|
| |||||||||||||||
Total distributions | (0.48 | ) | (0.17 | ) | - | |||||||||||||||
|
|
|
|
|
| |||||||||||||||
Net asset value, end of period | $ | 10.59 | $ | 11.82 | $ | 10.22 | ||||||||||||||
|
|
|
|
|
| |||||||||||||||
Total returnC | (5.93 | )% | 17.41 | % | 2.20 | %D | ||||||||||||||
|
|
|
|
|
| |||||||||||||||
Ratios and supplemental data: | ||||||||||||||||||||
Net assets, end of period | $ | 842,517 | $ | 221,794 | $ | 108,298 | ||||||||||||||
Ratios to average net assets: | ||||||||||||||||||||
Expenses, before reimbursements | 3.69 | % | 6.21 | % | 18.47 | %E | ||||||||||||||
Expenses, net of reimbursements | 1.05 | % | 1.07 | % | 1.07 | %E | ||||||||||||||
Net investment (loss), before expense reimbursements | (1.21 | )% | (3.68 | )% | (16.78 | )%E | ||||||||||||||
Net investment income, net of reimbursements | 1.43 | % | 1.46 | % | 0.61 | %E | ||||||||||||||
Portfolio turnover rate | 90 | % | 53 | % | 11 | %F | ||||||||||||||
| A | Commencement of operations. |
| B | Includesnon-recurring dividends. Without these dividends, net investment income per share would have been $0.18. |
| C | Based on net asset value, which does not reflect the sales charge, redemption fee, or contingent deferred sales charge, if applicable. May include adjustments in accordance with U.S. GAAP and as such, the net asset value for reporting purposes and the returns based upon those net asset values may differ from the net asset value and returns for shareholder transactions. |
| D | Not annualized. |
| E | Annualized. |
| F | Portfolio turnover rate is for the period from March 22, 2017 through June 30, 2017 and is not annualized. |
See accompanying notes
59
American Beacon FundsSM
June 30, 2019 (Unaudited)
Certain tax information regarding the Funds is required to be provided to shareholders based upon the Funds’ income and distributions for the taxable year ended June 30, 2019. The information and distributions reported herein may differ from information and distributions taxable to the shareholders for the calendar year ended December 31, 2018.
The Funds designated the following items with regard to distributions paid during the fiscal year ended June 30, 2019. All designations are based on financial information available as of this annual report and, accordingly, are subject to change. For each item, it is the intention of the Funds to designate the maximum amount permitted under the Internal Revenue Code of 1986, as amended, and the regulations there under.
Corporate Dividends-Received Deduction:
Alpha Quant Core | 54.70 | % | ||
Alpha Quant Dividend | 41.52 | % | ||
Alpha Quant Quality | 39.86 | % | ||
Alpha Quant Value | 54.52 | % |
Qualified Dividend Income:
Alpha Quant Core | 56.94 | % | ||
Alpha Quant Dividend | 41.76 | % | ||
Alpha Quant Quality | 43.35 | % | ||
Alpha Quant Value | 58.22 | % |
Long-Term Capital Gain Distributions:
Alpha Quant Core | $ | 181,225 | ||
Alpha Quant Dividend | - | |||
Alpha Quant Quality | 275,300 | |||
Alpha Quant Value | 90,036 |
Short-Term Capital Gain Distributions:
Alpha Quant Core | $ | 57,043 | ||
Alpha Quant Dividend | 123,793 | |||
Alpha Quant Quality | 72,053 | |||
Alpha Quant Value | 81,641 |
Shareholders will receive notification in January 2020 of the applicable tax information necessary to prepare their 2019 income tax returns.
60
Disclosure Regarding Approval of the Management and Investment Advisory Agreements(Unaudited)
Atin-person meetings held on May 9, 2019 and June4-5, 2019 (collectively, the “Meetings”), the Board of Trustees (“Board” or “Trustees”) considered and then, at its June 5, 2019 meeting, approved the renewal of:
(1) the Management Agreement between American Beacon Advisors, Inc. (“Manager”) and the American Beacon Funds (“Trust”), on behalf of the American Beacon Alpha Quant Core Fund (the “Core Fund”), the American Beacon Alpha Quant Dividend Fund (the “Dividend Fund”), the American Beacon Alpha Quant Quality Fund (the “Quality Fund”), and the American Beacon Alpha Quant Value Fund (the “Value Fund”) (each, a “Fund” and collectively, the “Funds”); and
(2) the Investment Advisory Agreement among the Manager, Alpha Quant Advisors, LLC (the “subadvisor”), and the Trust, on behalf of the Funds.
The Management Agreement and the Investment Advisory Agreement are referred to herein individually as an “Agreement” and collectively as the “Agreements.” In preparation for its consideration of the renewal of the Agreements, the Board undertook steps to gather and consider information furnished by the Manager, the subadvisor, Broadridge, Inc. (“Broadridge”) and Morningstar, Inc. (“Morningstar”). The Board, with the assistance of independent legal counsel, requested and received certain relevant information from the Manager and the subadvisor.
In advance of the Meetings, the Board’s Investment Committee and/or the Manager coordinated the production of information from Broadridge and Morningstar regarding the performance, fees and expenses of the Funds as well as information from the Manager and the subadvisor. At the Meetings, the Board considered the information provided in connection with the renewal process, as well as information furnished to the Board throughout the year at regular meetings of the Board and its committees. In connection with the Board’s consideration of the Agreements, the Board received and evaluated such information as they deemed necessary. This information is described below in the section summarizing the factors the Board considered in connection with its renewal and approval of the Agreements, as well as the section describing additional Board considerations with respect to each Fund.
The Board noted that the Manager provides management and administrative services to the Funds pursuant to the Management Agreement. The Board considered that many mutual funds have separate contracts governing each type of service and observed that, with respect to such mutual funds, the actual management fee rates provided by Broadridge for peer group funds reflect the combined advisory and administrative expenses, reduced by any fee waivers and/or reimbursements.
A firm may not have been able to, or opted not to, provide information in response to certain information requests, in which case the Board conducted its evaluation of the firm based on information that was provided. In such cases, the Board determined that the omission of any such information was not material to its considerations. For each Fund, the class of shares used for comparative performance purposes was the share class with the lowest expenses available for purchase by the general public, which was the Institutional Class. The Board also considered that the use of Institutional Class performance generally facilitates a meaningful comparison for expense and performance purposes.
Provided below is an overview of certain factors the Board considered in connection with its renewal and approval of the Agreements. The Board did not identify any particular information that was most relevant to its consideration to renew or approve each Agreement, and each Trustee may have afforded different weight to the various factors. Legal counsel to the independent Trustees provided the Board with a memorandum regarding its responsibilities pertaining to the renewal and approval of investment advisory contracts, such as the Agreements. The memorandum explained the regulatory requirements surrounding the Board’s process for evaluating investment advisors and the terms of investment advisory contracts. Based on its evaluation, the Board unanimously concluded that the terms of each Agreement were reasonable and fair and that the renewal and approval of each Agreement was in the best interests of the Funds and their shareholders.
61
Disclosure Regarding Approval of the Management and Investment Advisory Agreements(Unaudited)
Considerations With Respect to the Renewal of the Management Agreement and the Investment Advisory Agreement
In determining whether to renew the Agreements, the Board considered each Fund’s investment management and subadvisory relationships separately. In each instance, the Board considered, among other things, the following factors: (1) the nature, extent and quality of the services provided; (2) the investment performance of the Funds; (3) the costs incurred by the Manager and the subadvisor in rendering services to the Funds and their resulting profits or losses; (4) comparisons of services and fee rates with contracts entered into by the Manager or the subadvisor or their affiliates with other clients (such as pension funds and other institutional clients); (5) the extent to which economies of scale, if any, have been taken into account in setting each fee rate schedule; (6) whether fee rate levels reflect economies of scale, if any, for the benefit of Fund investors; and (7) any other benefits derived or anticipated to be derived by the Manager or the subadvisor from their relationships with the Funds.
Nature, Extent and Quality of Services. With respect to the renewal of the Management Agreement, the Board considered, among other factors: each Fund’s performance since its inception on March 22, 2017; the length of service of key investment personnel at the Manager; the cost structure of the Funds; the Manager’s culture of compliance and support that reduce risks to the Funds; the Manager’s quality of services; the Manager’s active role in monitoring and, as appropriate, recommending additional or replacement subadvisors; and the Manager’s efforts to retain key employees and maintain staffing levels.
With respect to the renewal of the Investment Advisory Agreement, the Board considered the level of staffing and the size of the subadvisor. The Board also considered the adequacy of the resources committed to the Funds by the subadvisor, and whether those resources were commensurate with the needs of the Funds and are sufficient to sustain appropriate levels of performance and compliance needs. In this regard, the Board considered the financial stability of the subadvisor. The Board also considered the subadvisor’s representations regarding its compliance program and code of ethics. Based on the foregoing information, the Board concluded that the nature, extent and quality of the management and advisory services provided by the Manager and the subadvisor were appropriate for each Fund.
Investment Performance. The Board evaluated the comparative information provided by Broadridge and the Manager regarding the performance of each Fund relative to its Broadridge performance universe, Morningstar Category, and/or benchmark index, as well as the Fund’s Morningstar rating. The Board considered the information provided by Broadridge regarding Broadridge’s independent methodology for selecting each Fund’s Broadridge performance universe. The Board also considered that the performance universes selected by Broadridge may not provide appropriate comparisons for a Fund. In addition, the Board considered the performance reports and discussions with management at Board and Committee meetings throughout the year. The Board also evaluated the comparative information provided by the subadvisor regarding the performance of each Fund relative to the performance of each Fund’s benchmark index and a composite of similar accounts. In addition, the Board considered the Manager’s recommendation to continue to retain the subadvisor. A discussion regarding the Board’s considerations with respect to each Fund’s performance appears below under “Additional Considerations and Conclusions with Respect to Each Fund.”
Costs of the Services Provided to the Funds and the Profits Realized by the Manager from its Relationship with the Funds. In analyzing the cost of services and profitability of the Manager, the Board considered the revenues earned and the expenses incurred by the Manager, before and after the payment of distribution-related expenses by the Manager. The profits or losses were noted at both an aggregate level for all funds within the group of mutual funds sponsored by the Manager (the “Fund Complex”) and at an individual Fund level, with the Manager sustaining a loss before and after the payment of distribution-related expenses by the Manager for each Fund. The Board also considered comparative information provided by the Manager regarding the Manager’s overall profitability with respect to the Fund Complex relative to the overall profitability of other firms in the mutual fund industry, as disclosed in publicly available sources. Although the Board noted that, in certain cases, the fee rates
62
Disclosure Regarding Approval of the Management and Investment Advisory Agreements(Unaudited)
paid by other clients of the Manager are lower than the fee rates paid by the Funds, the Manager represented that, among other matters, the difference is attributable to the fact that the Manager does not perform administrative services fornon-investment company clients and reflects the greater level of responsibility and regulatory requirements associated with managing the Funds.
The Board also noted that the Manager proposed to continue the expense waivers and reimbursements for the Funds that were in place during the last fiscal year. The Board further considered that, with respect to each Fund, the Management Agreement provides for the Manager to receive a management fee comprised of an annualized fee that is retained by the Manager. In addition, the Board considered that the Manager receives fees for overseeing the securities lending program on behalf of the Funds. The Board also noted that certain share classes of the Funds maintain higher expense ratios in order to compensate third-party financial intermediaries.
In analyzing the fee rates charged by the subadvisor in connection with its investment advisory services to the Funds, the Board considered representations made by subadvisor that the Manager has negotiated the lowest fee rate that the subadvisor charges for any comparable client accounts. The Board also considered the cost of services and profitability of the subadvisor, noting that the subadvisor had represented that it had not earned a profit with respect to the services that it provided to the Funds during the past year.
Based on the foregoing information, the Board concluded that the profitability levels of the Manager were reasonable in light of the services performed by the Manager and the profitability levels of the subadvisor were reasonable in light of the services performed by the subadvisor. A discussion regarding the Board’s considerations with respect to each Fund’s fee rates is set forth below under “Additional Considerations and Conclusions with Respect to Each Fund.”
Economies of Scale. In considering the reasonableness of the management and investment advisory fees rates, the Board considered whether economies of scale will be realized as each Fund grows and whether fee rate levels reflect these economies of scale for the benefit of Fund shareholders. In this regard, the Board considered that the Manager has negotiated breakpoints for the subadvisory fee rate for the Funds.
In addition, the Board noted the Manager’s representation that the Management Agreement contains fee schedule breakpoints at higher asset levels with respect to each Fund. Based on the foregoing information, the Board concluded that the Manager and subadvisor fee rate schedules for each Fund provide for a reasonable sharing of benefits from any economies of scale with each Fund.
Benefits Derived from the Relationship with the Funds. The Board considered the“fall-out” or ancillary benefits that accrue to the Manager and/or the subadvisor as a result of the advisory relationships with the Funds, including greater exposure in the marketplace with respect to the Manager’s or the subadvisor’s investment process and expanding the level of assets under management by the Manager and the subadvisor. The Board also considered that the Manager may invest the Funds’ cash balances and cash collateral provided by the borrowers of the Funds’ securities in the American Beacon U.S. Government Money Market Select Fund, which the Manager manages directly. Based on the foregoing information, the Board concluded that the potential benefits accruing to the Manager and the subadvisor by virtue of their relationships with the Funds appear to be fair and reasonable.
Additional Considerations and Conclusions with Respect to Each Fund
The performance comparisons below were made in comparison to each Fund’s Broadridge performance universe and Morningstar Category. With respect to the Broadridge performance universe, the 1st Quintile represents the top 20 percent of the universe based on performance and the 5th Quintile representing the bottom 20 percent of the universe based on performance. References below to each Fund’s Broadridge performance universe are to the universe of mutual funds with a comparable investment classification/objective included in the analysis provided by Broadridge.
63
Disclosure Regarding Approval of the Management and Investment Advisory Agreements(Unaudited)
The expense comparisons below were made in comparison to each Fund’s Broadridge expense universe and Broadridge expense group, with the 1st Quintile representing the lowest 20 percent of the universe or group based on lowest total expense and the 5th Quintile representing the highest 20 percent of the universe or group based on highest total expense. References below to each Fund’s expense group and expense universe are to the respective group or universe of comparable mutual funds included in the analysis by Broadridge. A Broadridge expense group consists of the Fund and a representative sample of funds with similar operating structures and asset sizes, as selected by Broadridge. A Broadridge expense universe includes all funds in the investment classification/objective with a similar operating structure as the share class of the Fund included in the Broadridge comparative information and provides a broader view of expenses across the Fund’s investment classification/objective. The Board also considered each Fund’s Morningstar fee level category. In reviewing expenses, the Board considered the positive impact of fee waivers where applicable and the Manager’s agreement to continue the fee waivers. In addition, information regarding the subadvisor’s use of soft dollars was requested from the Manager and was considered by the Board.
Additional Considerations and Conclusions with Respect to the American Beacon Alpha Quant Value Fund
In considering the renewal of the Management Agreement and the Investment Advisory Agreement with the subadvisor for the Value Fund, the Board considered the following additional factors:
Broadridge Total Expense Analysis Excluding12b-1 Fees and Morningstar Fee Level Ranking
| Compared to Broadridge Expense Group | 1st Quintile | |
| Compared to Broadridge Expense Universe | 3rd Quintile | |
| Morningstar Fee Level Ranking – Institutional Class | Average Expense Ratio |
Broadridge and Morningstar Performance Analysis(one-year period ended December 31, 2018)
| Compared to Broadridge Performance Universe | 2nd Quintile | |
| Compared to Morningstar Category | 3rd Quintile |
The Board also considered: (1) the subadvisor’s representation that it does not manage other accounts in the same strategy as the subadvisor manages the Value Fund; (2) that the subadvisor is an affiliate of the Manager; (3) that the Value Fund’s contractual expense limitation was reduced, effective April 1, 2019; and (4) the Manager’s recommendation to continue to retain the subadvisor based upon, among other factors, the relatively brief period that this Fund has been in operation.
Based on these and other considerations, the Board: (1) concluded that the fees paid to the Manager and the subadvisor under the Management and Investment Advisory Agreements are fair and reasonable; and (2) determined that the Value Fund and its shareholders would benefit from the Manager’s and subadvisor’s continued management of the Value Fund.
Additional Considerations and Conclusions with Respect to the American Beacon Alpha Quant Core Fund
In considering the renewal of the Management Agreement and the Investment Advisory Agreement with the subadvisor for the Core Fund, the Board considered the following additional factors:
Broadridge Total Expense Analysis Excluding12b-1 Fees and Morningstar Fee Level Ranking
| Compared to Broadridge Expense Group | 1st Quintile | |
| Compared to Broadridge Expense Universe | 2nd Quintile | |
| Morningstar Fee Level Ranking – Institutional Class | Average Expense Ratio |
64
Disclosure Regarding Approval of the Management and Investment Advisory Agreements(Unaudited)
Broadridge and Morningstar Performance Analysis(one-year period ended December 31, 2018)
| Compared to Broadridge Performance Universe | 2nd Quintile | |
| Compared to Morningstar Category | 3rd Quintile |
The Board also considered: (1) the subadvisor’s representation that it does not manage other accounts in the same strategy as the subadvisor manages the Core Fund; (2) that the subadvisor is an affiliate of the Manager; (3) that the Core Fund’s contractual expense limitation was reduced, effective April 1, 2019; and (4) the Manager’s recommendation to continue to retain the subadvisor based upon, among other factors, the relatively brief period that this Fund has been in operation.
Based on these and other considerations, the Board: (1) concluded that the fees paid to the Manager and the subadvisor under the Management and Investment Advisory Agreements are fair and reasonable; and (2) determined that the Core Fund and its shareholders would benefit from the Manager’s and subadvisor’s continued management of the Core Fund.
Additional Considerations and Conclusions with Respect to the American Beacon Alpha Quant Dividend Fund
In considering the renewal of the Management Agreement and the Investment Advisory Agreement with the subadvisor for the Dividend Fund, the Board considered the following additional factors:
Broadridge Total Expense Analysis Excluding12b-1 Fees and Morningstar Fee Level Ranking
| Compared to Broadridge Expense Group | 1st Quintile | |
| Compared to Broadridge Expense Universe | 2nd Quintile | |
| Morningstar Fee Level Ranking – Institutional Class | Average Expense Ratio |
Broadridge and Morningstar Performance Analysis(one-year period ended December 31, 2018)
| Compared to Broadridge Performance Universe | 3rd Quintile | |
| Compared to Morningstar Category | 2nd Quintile |
The Board also considered: (1) the subadvisor’s representation that it does not manage other accounts in the same strategy as the subadvisor manages the Dividend Fund; (2) that the subadvisor is an affiliate of the Manager; (3) that the Dividend Fund’s contractual expense limitation was reduced, effective April 1, 2019; and (4) the Manager’s recommendation to continue to retain the subadvisor based upon, among other factors, the relatively brief period that this Fund has been in operation.
Based on these and other considerations, the Board: (1) concluded that the fees paid to the Manager and the subadvisor under the Management and Investment Advisory Agreements are fair and reasonable; and (2) determined that the Dividend Fund and its shareholders would benefit from the Manager’s and subadvisor’s continued management of the Dividend Fund.
Additional Considerations and Conclusions with Respect to the American Beacon Alpha Quant Quality Fund
In considering the renewal of the Management Agreement and the Investment Advisory Agreement with the subadvisor for the Quality Fund, the Board considered the following additional factors:
Broadridge Total Expense Analysis Excluding12b-1 Fees and Morningstar Fee Level Ranking
| Compared to Broadridge Expense Group | 2nd Quintile | |
| Compared to Broadridge Expense Universe | 2nd Quintile | |
| Morningstar Fee Level Ranking – Institutional Class | Average Expense Ratio |
65
Disclosure Regarding Approval of the Management and Investment Advisory Agreements(Unaudited)
Broadridge and Morningstar Performance Analysis(one-year period ended December 31, 2018)
| Compared to Broadridge Performance Universe | 2nd Quintile | |
| Compared to Morningstar Category | 3rd Quintile |
The Board also considered: (1) the subadvisor’s representation that it does not manage other accounts in the same strategy as the subadvisor manages the Quality Fund; (2) that the subadvisor is an affiliate of the Manager; (3) that the Quality Fund’s contractual expense limitation was reduced, effective April 1, 2019; and (4) the Manager’s recommendation to continue to retain the subadvisor based upon, among other factors, the relatively brief period that this Fund has been in operation.
Based on these and other considerations, the Board: (1) concluded that the fees paid to the Manager and the subadvisor under the Management and Investment Advisory Agreements are fair and reasonable; and (2) determined that the Quality Fund and its shareholders would benefit from the Manager’s and subadvisor’s continued management of the Quality Fund.
66
Trustees and Officers of the American Beacon FundsSM(Unaudited)
The Trustees and officers of the American Beacon Funds (the “Trust”) are listed below, together with their principal occupations during the past five years. The address of each person listed below is 220 Las Colinas Boulevard East, Suite 1200, Irving, Texas 75039. Each Trustee oversees thirty-seven funds in the fund complex that includes the Trust, the American Beacon Select Funds, the American Beacon Institutional Funds Trust, the American Beacon Sound Point Enhanced Income Fund and the American Beacon Apollo Total Return Fund. The Trust’s Statement of Additional Information contains additional information about the Trustees and is available without charge by calling1-800-658-5811.
Name, Age and Address | Position, Term of Office and Length of Time Served with the Trust | Principal Occupation(s) During Past 5 Years and Current Directorships | ||
| INTERESTED TRUSTEES | Term | |||
| Lifetime of Trust until removal, resignation or retirement* | ||||
| Alan D. Feld** (82) | Trustee since 1996 | Partner in the law firm of Akin, Gump, Strauss, Hauer & Feld, LLP (law firm) (1960-Present); Trustee, American Beacon Select Funds(1999-Present); Trustee, American Beacon Institutional Funds Trust (2017-Present); Trustee, American Beacon Sound Point Enhanced Income Fund (2018–Present); Trustee, American Beacon Apollo Total Return Fund (2018–Present). | ||
| NON-INTERESTED TRUSTEES | Term | |||
| Lifetime of Trust until removal, resignation or retirement* | ||||
| Gilbert G. Alvarado (49) | Trustee since 2015 | Director, Kura MD, Inc. (local telehealth organization) (2015-present); Vice President & CFO, Sierra Health Foundation (health conversion private foundation) (2006-Present); Vice President & CFO, Sierra Health Foundation: Center for Health Program Management (California public benefit corporation) (2012-Present); Director, Innovative North State (2012-2015); Director, Sacramento Regional Technology Alliance(2011-2016); Director, Women’s Empowerment (2009-2014); Director, Valley Healthcare Staffing (2017–present); Trustee, American Beacon Select Funds (2015-Present); Trustee, American Beacon Institutional Funds Trust (2017-Present); Trustee, American Beacon Sound Point Enhanced Income Fund (2018–Present); Trustee, American Beacon Apollo Total Return Fund (2018–Present). | ||
| Joseph B. Armes (57) | Trustee since 2015 | Chairman & CEO, CSW Industrials f/k/a Capital Southwest Corporation (investment company) (2015-Present); Chairman of the Board of Capital Southwest Corporation, predecessor to CSW Industrials, Inc. (2014-2017) (investment company); CEO, Capital Southwest Corporation(2013-2015); President & CEO, JBA Investment Partners (family investment vehicle) (2010-Present); Director and Chair of Audit Committee, RSP Permian (oil and gas producer) (2013-Present); Trustee, American Beacon Select Funds (2015-Present); Trustee, American Beacon Institutional Funds Trust (2017-Present); Trustee, American Beacon Sound Point Enhanced Income Fund (2018–Present); Trustee, American Beacon Apollo Total Return Fund (2018–Present). | ||
| Gerard J. Arpey (60) | Trustee since 2012 | Director, The Home Depot, Inc. (2015-Present); Partner, Emerald Creek Group (private equity firm) (2011-Present); Director, S.C. Johnson & Son, Inc. (privately held company) (2008-present); Trustee, American Beacon Select Funds (2012-Present); Trustee, American Beacon Institutional Funds Trust (2017-Present); Trustee, American Beacon Sound Point Enhanced Income Fund (2018–Present); Trustee, American Beacon Apollo Total Return Fund (2018–Present). | ||
67
Trustees and Officers of the American Beacon FundsSM(Unaudited)
Name, Age and Address | Position, Term of Office and Length of Time Served with the Trust | Principal Occupation(s) During Past 5 Years and Current Directorships | ||
| NON-INTERESTED TRUSTEES (CONT.) | Term | |||
| Lifetime of Trust until removal, resignation or retirement* | ||||
| Brenda A. Cline (58) | Trustee since 2004 Chair since 2019 Vice Chair 2018 | Chief Financial Officer, Treasurer and Secretary, Kimbell Art Foundation (1993-Present); Director, Tyler Technologies, Inc. (public sector software solutions company) (2014-Present); Director, Range Resources Corporation (oil and natural gas company) (2015-Present); Trustee, CushingClosed-End andOpen-End Funds and ETFs(2017-Present); Trustee, American Beacon Select Funds(2004-Present); Trustee, American Beacon Institutional Funds Trust(2017-Present); Trustee, American Beacon Sound Point Enhanced Income Fund (2018–Present); Trustee, American Beacon Apollo Total Return Fund (2018–Present). | ||
| Eugene J. Duffy (64) | Trustee since 2008 | Managing Director, Global Investment Management Distribution, Mesirow Financial (2016-Present); Managing Director, Institutional Services, Intercontinental Real Estate Corporation (2014-Present); Principal and Executive Vice President, Paradigm Asset Management (1994-2014); Trustee, American Beacon Select Funds(2008-Present); Trustee, American Beacon Institutional Funds Trust (2017-Present); Trustee, American Beacon Sound Point Enhanced Income Fund (2018–Present); Trustee, American Beacon Apollo Total Return Fund (2018–Present). | ||
| Claudia A. Holz (61) | Trustee since 2018 | Partner, KPMG LLP (1990–2017); Trustee, American Beacon Select Funds(2018-Present); Trustee, American Beacon Institutional Funds Trust (2018-Present); Trustee, American Beacon Sound Point Enhanced Income Fund (2018–Present); Trustee, American Beacon Apollo Total Return Fund (2018–Present). | ||
| Douglas A. Lindgren (57) | Trustee since 2018 | CEO North America, Carne Global Financial Services (2016-2017); Managing Director, IPS Investment Management and Global Head, Content Management, UBS Wealth Management (2010-2016); Trustee, American Beacon Select Funds (2018-Present); Trustee, American Beacon Institutional Funds Trust (2018-Present); Trustee, American Beacon Sound Point Enhanced Income Fund (2018–Present); Trustee, American Beacon Apollo Total Return Fund (2018–Present). | ||
| Richard A. Massman (75) | Trustee since 2004Chair 2008-2018 Chair Emeritus since 2019 | Consultant and General Counsel Emeritus, Hunt Consolidated, Inc. (holding company engaged in oil and gas exploration and production, refining, real estate, farming, ranching and venture capital activities) (2009-Present); Trustee, American Beacon Select Funds(2004-Present); Trustee, American Beacon Institutional Funds Trust(2017-Present); Trustee, American Beacon Sound Point Enhanced Income Fund (2018–Present); Trustee, American Beacon Apollo Total Return Fund (2018–Present). | ||
| Barbara J. McKenna, CFA (56) | Trustee since 2012 | President/Managing Principal, Longfellow Investment Management Company(2005-Present); Trustee, American Beacon Select Funds(2012-Present); Trustee, American Beacon Institutional Funds Trust (2017-Present); Trustee, American Beacon Sound Point Enhanced Income Fund (2018–Present); Trustee, American Beacon Apollo Total Return Fund (2018–Present). | ||
| R. Gerald Turner (73) | Trustee since 2001 | President, Southern Methodist University (1995-Present); Director, J.C. Penney Company, Inc. (1996-Present); Director, Kronus Worldwide Inc. (chemical manufacturing) (2003-Present); Trustee, American Beacon Select Funds(2001-Present); Trustee, American Beacon Institutional Funds Trust (2017-Present); Trustee, American Beacon Sound Point Enhanced Income Fund (2018–Present); Trustee, American Beacon Apollo Total Return Fund (2018–Present). | ||
68
Trustees and Officers of the American Beacon FundsSM(Unaudited)
Name, Age and Address | Position, Term of Office and Length of Time Served with the Trust | Principal Occupation(s) During Past 5 Years and Current Directorships | ||
| OFFICERS | Term | |||
| One Year | ||||
| Gene L. Needles, Jr. (64) | President since 2009 | President (2009-2018), CEO and Director (2009–Present), and Chairman(2018-Present), American Beacon Advisors, Inc., President (2015-2018), Director and CEO (2015–Present), and Chairman (2018-Present), Resolute Investment Holdings, LLC; President (2015-2018), Director and CEO (2015-Present), and Chairman(2018-Present), Resolute Topco, Inc.; President (2015-2018); Director, and CEO(2015-Present), and Chairman (2018-Present), Resolute Acquisition, Inc.; President (2015-2018), Director and CEO (2015-Present), Chairman (2018-Present), Resolute Investment Managers, Inc.; Director, Chairman, President and CEO, Resolute Investment Distributors (2017-Present); Director, Chairman, President and CEO; Resolute Investment Services, Inc. (2017-Present); President and CEO, Lighthouse Holdings Parent, Inc. (2009-2015); President, CEO and Director, Lighthouse Holdings, Inc. (2009-2015); Manager, President and CEO, American Private Equity Management, LLC (2012-Present); Director, Chairman, President and CEO, Alpha Quant Advisors, LLC (2016-Present); Director, ARK Investment Management LLC (2016-Present); Director, Shapiro Capital Management LLC (2017-Present); Director, Chairman and CEO, Continuous Capital, LLC (2018-Present); President, American Beacon Cayman Managed Futures Strategy Fund, Ltd. (2014-Present); Director and President, American Beacon Cayman Transformational Innovation Company, LTD., (2017-2018); President, American Beacon Delaware Transformational Innovation Corporation (2017-2018); President American Beacon Cayman TargetRisk Company, Ltd. (2018-Present); Member, Investment Advisory Committee, Employees Retirement System of Texas (2017-Present); Trustee, American Beacon NextShares Trust(2015-Present); President, American Beacon Select Funds (2009-Present); President, American Beacon Institutional Funds Trust (2017-Present); President, American Beacon Sound Point Enhanced Income Fund(2018-Present); President, American Beacon Apollo Total Return Fund (2018-Present); Director, RSW Investments Holdings LLC, (2019-Present); Director, SSI Investment Management, LLC (2019-Present). | ||
| Rosemary K. Behan (60) | VP, Secretary and Chief Legal Officer since 2006 | Vice President, Secretary and General Counsel, American Beacon Advisors, Inc. (2006-Present); Secretary, Resolute Investment Holdings, LLC(2015-Present); Secretary, Resolute Topco, Inc. (2015-Present); Secretary, Resolute Acquisition, Inc. (2015–Present); Vice President, Secretary and General Counsel, Resolute Investment Managers, Inc. (2015-Present); Secretary, Resolute Investment Distributors, Inc. (2017-Present); Vice President, Secretary and General Counsel, Resolute Investment Services, Inc. (2017-Present); Vice President and Secretary, Lighthouse Holdings Parent, Inc. (2008-2015); Vice President and Secretary, Lighthouse Holdings, Inc. (2008-2015); Secretary, American Private Equity Management, LLC (2008-Present); Secretary and General Counsel, Alpha Quant Advisors, LLC (2016-Present); Vice President and Secretary, Continuous Capital, LLC (2018-Present); Secretary, American Beacon Delaware Transformational Innovation Corporation (2017-2018); Secretary, American Beacon Cayman Transformational Innovation Company, Ltd. (2017-2018); Secretary, American Beacon Cayman Managed Futures Strategy Fund, Ltd. (2014-Present); Secretary, American Beacon Cayman TargetRisk Company, Ltd (2018-Present); Chief Legal Officer, Vice President and Secretary, American Beacon Select Funds (2006-Present); Chief Legal Officer, Vice President and Secretary, American Beacon Institutional Funds Trust (2017-Present); Chief Legal Officer, Vice President and Secretary, American Beacon Sound Point Enhanced Income Fund (2018-Present); Chief Legal Officer, Vice President and Secretary American Beacon Apollo Total Return Fund (2018-Present). | ||
69
Trustees and Officers of the American Beacon FundsSM(Unaudited)
Name, Age and Address | Position, Term of Office and Length of Time Served with the Trust | Principal Occupation(s) During Past 5 Years and Current Directorships | ||
| OFFICERS (CONT.) | Term | |||
| One Year | ||||
| Brian E. Brett (59) | VP since 2004 | Senior Vice President, Head of Distribution (2012-Present), Vice President, Director of Sales (2004-2012), American Beacon Advisors, Inc.; Senior Vice President, Resolute Investment Managers, Inc. (2017-Present); Senior Vice President, Resolute Investment Distributors, Inc. (2018-Present), Senior Vice President, Resolute Investment Services, Inc. (2018-Present); Senior Vice President, Lighthouse Holdings Parent, Inc. (2008-2015); Senior Vice President, Lighthouse Holdings, Inc. (2008-2015); Vice President, American Beacon Select Funds (2004-Present); Vice President, American Beacon Institutional Funds Trust (2017-Present); Vice President American Beacon Sound Point Enhanced Income Fund (2018-Present); Vice President American Beacon Apollo Total Return Fund (2018-Present). | ||
| Paul B. Cavazos(50) | VP since 2016 | Chief Investment Officer and Senior Vice President, American Beacon Advisors, Inc. (2016-Present); Chief Investment Officer, DTE Energy(2007-2016); Vice President, American Private Equity Management, L.L.C. (2017–Present); Vice President, American Beacon Select Funds(2016-Present); Vice President, American Beacon Institutional Funds Trust(2017-Present); Vice President American Beacon Sound Point Enhanced Income Fund (2018-Present);Vice President American Beacon Apollo Total Return Fund (2018-Present). | ||
| Erica Duncan (48) | VP Since 2011 | Vice President, American Beacon Advisors, Inc. (2011-Present); Vice President, Resolute Investment Managers (2018-Present); Vice President, Resolute Investment Services, Inc. (2018-Present); Vice President, American Beacon Select Funds (2011-Present); Vice President, American Beacon Institutional Funds Trust (2017-Present); Vice President American Beacon Sound Point Enhanced Income Fund (2018-Present); Vice President American Beacon Apollo Total Return Fund (2018-Present). | ||
| Melinda G. Heika (58) | Treasurer since 2010 | Treasurer and CFO (2010-Present), American Beacon Advisors, Inc.; Treasurer, Resolute Topco, Inc. (2015-Present); Treasurer, Resolute Investment Holdings, LLC. (2015-Present); Treasurer, Resolute Acquisition, Inc. (2015-Present); Treasurer and CFO, Resolute Investment Managers, Inc. (2017-Present); Treasurer, Resolute Investment Distributors, Inc. (2017-2017); Treasurer and CFO, Resolute Investment Services, Inc. (2015-Present); Treasurer, Lighthouse Holdings Parent Inc., (2010-2015); Treasurer, Lighthouse Holdings, Inc. (2010-2015); Treasurer, American Private Equity Management, LLC (2012-Present); Treasurer and CFO, Alpha Quant Advisors, LLC (2016-Present); Treasurer and CFO, Continuous Capital, LLC (2018-Present); Treasurer, American Beacon Cayman Transformational Innovation, Ltd. (2017-2018); Treasurer, American Beacon Delaware Transformational Innovation Corporation (2017-2018); Director and Treasurer, American Beacon Cayman Managed Futures Strategy Fund, Ltd. (2014-Present); Treasurer, American Beacon Cayman TargetRisk Company, Ltd. (2018-Present); Treasurer, American Beacon Select Funds (2010-Present); Treasurer, American Beacon Institutional Funds Trust (2017-Present); Treasurer, American Beacon Sound Point Enhanced Income Fund (2018-Present); Treasurer, American Beacon Apollo Total Return Fund (2018-Present). | ||
| Terri L. McKinney (55) | VP since 2010 | Vice President (2009-Present), Managing Director (2003-2009), American Beacon Advisors, Inc.; Vice President, Resolute Investment Managers, Inc. (2017-Present); Vice President, Resolute Investment Services, Inc(2018-Present); Vice President, Alpha Quant Advisors, LLC (2016-Present); Vice President, Continuous Capital, LLC (2018-Present); Vice President, American Beacon Select Funds (2010-Present); Vice President, American Beacon Institutional Funds Trust (2017-Present); Vice President, American Beacon Sound Point Enhanced Income Fund (2018-Present); Vice President, American Beacon Apollo Total Return Fund (2018-Present). | ||
70
Trustees and Officers of the American Beacon FundsSM(Unaudited)
Name, Age and Address | Position, Term of Office and Length of Time Served with the Trust | Principal Occupation(s) During Past 5 Years and Current Directorships | ||
| OFFICERS (CONT.) | Term | |||
| One Year | ||||
| Jeffrey K. Ringdahl (44) | VP since 2010 | Director (2015-Present), President (2018-Present), Chief Operating Officer (2010-Present), Senior Vice President (2013-2018), Vice President(2010-2013), American Beacon Advisors, Inc.; Director (2015-Present), President (2018-Present), Senior Vice Present (2015-2018), Resolute Investment Holdings, LLC; Director (2015-Present), President(2018-Present), Senior Vice President (2015-2018), Resolute Topco, Inc.; Director (2015-Present), President (2018-Present), Senior Vice President (2015-2018), Resolute Acquisition, Inc.; Director (2015-Present), President & COO (2018-Present), Senior Vice President (2015-2018), Resolute Investment Managers, Inc.; Director and Executive Vice President (2017-Present), Resolute Investment Distributors, Inc.; Director(2017-Present), President & COO (2018-Present), Executive Vice President (2017-2018), Resolute Investment Services, Inc.; Senior Vice President (2017-Present), Vice President (2012-2017), Manager (2015-Present), American Private Equity Management, LLC; Senior Vice President, Lighthouse Holdings Parent, Inc. (2013-2015); Senior Vice President, Lighthouse Holdings, Inc. (2013-2015); Trustee, American Beacon NextShares Trust (2015-Present); Director, Executive Vice President & COO, Alpha Quant Advisors, LLC (2016-Present); Director, Shapiro Capital Management, LLC (2017-Present); Director, Executive Vice President & COO, Continuous Capital, LLC(2018-Present); Director and Vice President, American Beacon Cayman Transformational Innovation Company, Ltd., (2017-Present); Vice President, American Beacon Delaware Transformational Innovation Corporation (2017-2018); Director and Vice President, American Beacon Cayman Managed Futures Strategy Fund, Ltd. (2014-Present); Vice President, American Beacon Cayman TargetRisk Company, Ltd (2018-Present); Vice President, American Beacon Select Funds (2010-2018); Vice President, American Beacon Institutional Funds Trust (2017-Present); Vice President, American Beacon Sound Point Enhanced Income Fund (2018-Present); Vice President, American Beacon Apollo Total Return Fund (2018-Present); Director, RSW Investments Holdings LLC, (2019-Present); Director, SSI Investment Management, LLC (2019-Present). | ||
| Samuel J. Silver (56) | VP Since 2011 | Vice President (2011-Present), Chief Fixed Income Officer (2016-Present), American Beacon Advisors, Inc. (2011-Present); Vice President, American Beacon Select Funds (2011-Present); Vice President, American Beacon Institutional Funds Trust (2017-Present); Vice President, American Beacon Sound Point Enhanced Income Fund (2018-Present); Vice President, American Beacon Apollo Total Return Fund (2018-Present). | ||
| Christina E. Sears (47) | Chief Compliance Officer since 2004 and Asst. Secretary since 1999 | Vice President, American Beacon Advisors, Inc. (2019-Present); Chief Compliance Officer, American Beacon Advisors, Inc. (2004-Present); Vice President, Resolute Investment Managers, Inc. (2017-Present); Vice President, Resolute Investment Distributors (2017-Present); Vice President, Resolute Investment Services, Inc. (2019-Present); Chief Compliance Officer, American Private Equity Management, LLC(2012-Present); Chief Compliance Officer (2016-2019) and Vice President, Alpha Quant Advisors, LLC (2016-Present); Vice President, Continuous Capital, LLC (2018-Present); Chief Compliance Officer (2004-Present) and Assistant Secretary (1999-Present), American Beacon Select Funds; Chief Compliance Officer and Assistant Secretary, American Beacon Institutional Funds Trust (2017-Present); Chief Compliance Officer and Assistant Secretary, American Beacon Sound Point Enhanced Income Fund(2018-Present); Chief Compliance Officer and Assistant Secretary, American Beacon Apollo Total Return Fund (2018-Present). | ||
71
Trustees and Officers of the American Beacon FundsSM(Unaudited)
Name, Age and Address | Position, Term of Office and Length of Time Served with the Trust | Principal Occupation(s) During Past 5 Years and Current Directorships | ||
| OFFICERS (CONT.) | Term | |||
| One Year | ||||
| Sonia L. Bates (62) | Asst. Treasurer since 2011 | Assistant Treasurer, American Beacon Advisors, Inc. (2011-2018); Assistant Treasurer, Lighthouse Holdings Parent Inc. (2011-2015); Assistant Treasurer, Lighthouse Holdings, Inc. (2011-2015); Assistant Treasurer, American Private Equity Management, LLC (2012-Present); Assistant Treasurer, American Beacon Cayman Transformational Innovation Company, Ltd. (2017-Present); Assistant Treasurer, American Beacon Cayman TargetRisk Company, Ltd. (2018-Present); Assistant Treasurer, American Beacon Select Funds (2011-Present); Assistant Treasurer, American Beacon Institutional Funds Trust (2017-Present); Assistant Treasurer, American Beacon Sound Point Enhanced Income Fund (2018-Present); Assistant Treasurer, American Beacon Apollo Total Return Fund (2018-Present). | ||
| Shelley D. Abrahams (44) | Assistant Secretary since 2008 | Assistant Secretary, American Beacon Select Funds (2008-Present); Assistant Secretary, American Beacon Institutional Funds Trust(2017-Present); Assistant Secretary, American Beacon Sound Point Enhanced Income Fund (2018-Present); Assistant Secretary, American Beacon Apollo Total Return Fund (2018-Present). | ||
| Rebecca L. Harris (52) | Assistant Secretary since 2010 | Vice President, American Beacon Advisors, Inc. (2011-Present); Vice President, Resolute Investment Managers, Inc. (2017-Present); Vice President, Resolute Investment Services (2018-Present); Vice President, Alpha Quant Advisors, LLC (2016-Present); Vice President, Continuous Capital, LLC (2018-Present); Assistant Secretary, American Beacon Select Funds (2010-Present); Assistant Secretary, American Beacon Institutional Funds Trust (2017-Present); Assistant Secretary, American Beacon Sound Point Enhanced Income Fund (2018-Present); Assistant Secretary, American Beacon Apollo Total Return Fund (2018-Present). | ||
| Teresa A. Oxford (60) | Assistant Secretary since 2015 | Assistant Secretary, American Beacon Advisors, Inc. (2015-Present); Assistant Secretary, Resolute Investment Distributors (2018-Present); Assistant Secretary, Resolute Investment Services (2018-Present); Assistant Secretary, Alpha Quant Advisors, LLC (2016-Present); Assistant Secretary, American Beacon Select Funds (2015-Present); Assistant Secretary, American Beacon Institutional Funds Trust (2017-Present); Assistant Secretary, American Beacon Sound Point Enhanced Income Fund(2018-Present); Assistant Secretary, American Beacon Apollo Total Return Fund (2018-Present). | ||
* As of 11/12/2014, the Board adopted a retirement plan that requires Trustees, other than Messrs. Feld and Massman to retire no later than the last day of the calendar year in which they reach the age of 75. As of 11/7/17, the Board approved a waiver of the mandatory retirement policy with respect to Mr. Massman, who turned 75 in November 2018, to permit him to continue to serve on the Board as Chair Emeritus through 12/31/19.
** Mr. Feld is deemed to be an “interested person” of the Trusts, as defined by the 1940 Act. Mr. Feld’s law firm of Akin, Gump, Strauss, Hauer & Feld LLP has provided legal services within the past two fiscal years to one or more of the Trust’ssub-advisors.
72
American Beacon FundsSM
June 30, 2019 (Unaudited)
The American Beacon Funds recognize and respect the privacy of our shareholders. We are providing this notice to you so you will understand how shareholder information may be collected and used.
We may collect nonpublic personal information about you from one or more of the following sources:
| • | information we receive from you on applications or other forms; |
| • | information about your transactions with us or our service providers; and |
| • | information we receive from third parties. |
We do not disclose any nonpublic personal information about our customers or former customers to anyone, except as permitted by law.
We restrict access to your nonpublic personal information to those employees or service providers who need to know that information to provide products or services to you. To ensure the confidentiality of your nonpublic personal information, we maintain safeguards that comply with federal standards.
73
This page intentionally left blank.
74
This page intentionally left blank.
75
This page intentionally left blank.
76

eDelivery isNOW AVAILABLE - Stop traditional mail delivery and receive your
shareholder reports and summary prospectuson-line. Sign up at
www.americanbeaconfunds.com
If you invest in the Fund through a financial institution, you may be able to receive the Fund’s regulatory mailings, such as the Prospectus, Annual Report and Semi-Annual Report, bye-mail. If you are interested in this option, please go towww.icsdelivery.com and search for your financial institution’s name or contact your financial institution directly.
To obtain more information about the Fund:
 |  | |
| ByE-mail: | On the Internet: | |
| american_beacon.funds@ambeacon.com | Visit our website atwww.americanbeaconfunds.com | |
By Telephone: Call (800)658-5811 |
By Mail: American Beacon Funds P.O. Box 219643 Kansas City, MO 64121-9643 | |
| Availability of Quarterly Portfolio Schedules | Availability of Proxy Voting Policy and Records | |
| In addition to the Schedule of Investments provided in eachsemi-annual and annual report, the Fund files a complete schedule of its portfolio holdings with the Securities and Exchange Commission (“SEC”) onForm N-PORT as of the first and third fiscal quarters. The Fund’sForms N-PORT are available on the SEC’s website atwww.sec.gov. The FormsN-PORT may also be reviewed and copied at the SEC’s Public Reference Section, 100 F Street, NE, Washington, D.C. 20549-2736. Information regarding the operation of the SEC’s Public Reference Room may be obtained by calling(800)-SEC-0330. A complete schedule of the Fund’s portfolio holdings is also available atwww.americanbeaconfunds.com approximately twenty days after the end of each month. | A description of the policies and procedures the Fund uses to determine how to vote proxies relating to portfolio securities is available in the Fund’s Statement of Additional Information, is available free of charge on the Fund’s websitewww.americanbeaconfunds.com and by calling1-800-967-9009 or by accessing the SEC’s website atwww.sec.gov. The Fund’s proxy voting record for the most recent year ended June 30 is filed annually with the SEC onForm N-PX. The Fund’sForms N-PX are available on the SEC’s website atwww.sec.gov. The Fund’s proxy voting record may also be obtained by calling1-800-967-9009. | |


Fund Service Providers:
CUSTODIAN State Street Bank and Trust Company Boston, Massachusetts | TRANSFER AGENT DST Asset Manager Solutions, Inc. Quincy, Massachusetts | INDEPENDENT REGISTERED PUBLIC ACCOUNTING FIRM PricewaterhouseCoopers LLP Boston, Massachusetts | DISTRIBUTOR Resolute Investment Distributors, Inc. Irving, Texas |
This report is prepared for shareholders of the American Beacon Funds and may be distributed to others only if preceded or accompanied by a current Prospectus or Summary Prospectus.
American Beacon Funds, American Beacon Alpha Quant Core Fund, American Beacon Alpha Quant Dividend Fund, American Beacon Alpha Quant Quality Fund, and American Beacon Alpha Quant Value Fund are service marks of American Beacon Advisors, Inc.
AR 6/19
About American Beacon Advisors
Since 1986, American Beacon Advisors has offered a variety of products and investment advisory services to numerous institutional and retail clients, including a variety of mutual funds, corporate cash management, and separate account management.
Our clients include defined benefit plans, defined contribution plans, foundations, endowments, corporations, financial planners, and other institutional investors. With American Beacon Advisors, you can put the experience of a multi-billion dollar asset management firm to work for your company.
ARK TRANSFORMATIONAL INNOVATION FUND
Because the Fund may invest infewer issuersthan a more diversified portfolio, the fluctuating value of a single holding may have a greater effect on the value of the Fund. Companies that the sub-advisor believes are capitalizing ondisruptive innovationand developing technologies to displace older technologies or create new markets may not in fact do so. Investing inforeign securitiesmay involve heightened risk due to currency fluctuations and economic and political risks.Regulatory changesmay impair the Fund’s ability to qualify for federal income tax treatment as a regulated investment company, which could result in the Fund and shareholders incurring significant income tax expense. To the extent the Fund invests more heavily in particular sectors, its performance will be sensitive to factors affecting those sectors.Information Technology sectorcompanies may face intense competition and rapid product obsolescence, have limited product lines, markets, financial resources or personnel, and lose patent, copyright and trademark protections. Investing inHealth Care sectorcompanies involves risk due to government regulations, product litigation, competitive forces, and loss of patent protection. Please see the prospectus for a complete discussion of the Fund’s risks. There can be no assurances that the investment objectives of this Fund will be met.
Any opinions herein, including forecasts, reflect our judgment as of the end of the reporting period and are subject to change. Each advisor’s strategies and each Fund’s portfolio composition will change depending on economic and market conditions. This report is not a complete analysis of market conditions, and, therefore, should not be relied upon as investment advice. Although economic and market information has been compiled from reliable sources, American Beacon Advisors, Inc. makes no representation as to the completeness or accuracy of the statements contained herein.
American Beacon Funds | June 30, 2019 |
| 1 | ||||
| 2 | ||||
| 5 | ||||
| 7 | ||||
| 8 | ||||
| 11 | ||||
| 14 | ||||
| 31 | ||||
| 36 | ||||
Disclosure Regarding Approvals of the Management and Investment Advisory Agreements | 37 | |||
| 41 | ||||
| 47 | ||||
| Back Cover |
 | Dear Shareholders,
At American Beacon, we take our heritage as a fiduciary very seriously — and we apply that mindset to all aspects of our business as a fund manager. As a result, for more than 30 years, we have endeavored to:
u Identify, engage and oversee the best money managers. As a manager of managers, our goal is to engage the most effective money managers for each asset class, investment style and market strategy we offer. We are committed to partnering with those we judge to be “the best of the best” when it comes to choosing sub-advisors for our mutual funds. Whether our due-diligence process results in the selection of one sub-advisor or multiple sub-advisors, we select those we believe show the greatest potential to help us meet the high standards you’ve come to expect. |
| u | Offer a variety of innovative investment solutions. Our mutual funds — which span the domestic, international, global, frontier and emerging markets — are sub-advised by experienced money managers who employ distinctive, proprietary investment processes to manage assets through a variety of economic and market conditions. From offering some of the first multi-manager funds, one of the first retirement income funds and the first open-ended mutual fund in the U.S. to focus primarily on frontier-market debt, our robust history includes applying a disciplined, solutions-based approach to our product development process in an effort to help you grow your assets while mitigating risk. |
| u | Provide a solutions-based approach to achieving long-term investment goals.We seek to provide investment solutions that might enable you to benefit from taking a more disciplined approach to investing. Our mutual funds provide access to institutional-quality, research-intensive investment managers with diverse processes and styles. Over the long run, having such access and spending time in the market — rather than trying to time the market — may better position you to reach your long-term investment goals during market upswings and potentially insulate against market downswings. |
Our management approach is more than a concept; it’s the cornerstone of American Beacon’s culture. And we strive to employ it at every turn as we seek to provide a well-diversified line of investment solutions to help our shareholders seek long-term rewards.
Thank you for your continued interest in American Beacon. For additional information about our mutual funds or to access your account information, please visit our website atwww.americanbeaconfunds.com.
Best Regards,

Gene L. Needles, Jr.
President
American Beacon Funds
1
June 30, 2019 (Unaudited)
For the 12-month period ended June 30, 2019, equity markets were slightly higher overall; however, volatility picked up significantly as a myriad of uncertainties were on the minds of investors. Chief among those uncertainties were the up-and-down trade negotiations between the world’s two largest economies, the U.S. and China, as well as the Federal Reserve’s continued rate-hiking cycle in the first half of the period followed by its abrupt change of course in 2019 when it began holding the federal funds rate steady as the economy showed signs of cooling growth. Through all the noise, the MSCI All Country World Index rose 5.74%, driven higher by resilient U.S. equities as international developed and emerging market equities did not fare quite as well due to global trade worries.
In the U.S., the S&P 500 Index was up 10.42%, and 10 of its 11 sectors produced positive returns for the period. The top performers were yield-oriented sectors, including Utilities (up 19.03%) and Real Estate (up 16.80%), followed by Consumer Staples (up 16.39%) and Information Technology (up 14.34%). Commodity-sensitive sectors, including Energy (down 13.25%) and Materials (up 3.20%), were the worst performers. From a style standpoint, Growth continued the trend of outpacing Value as the Russell 3000 Growth Index returned 10.60% versus the Russell 3000 Value Index return of 7.34%. From a capitalization perspective, small-cap stocks struggled mightily compared to their larger capitalization peers, as evidenced by the Russell 2000 Index return of -3.31% compared to the Russell 1000 Index return of 10.02%.
International developed markets ended the period slightly higher as the MSCI EAFE Index was up 1.08%. In Europe, the top-performing countries were Switzerland and Denmark, represented by the MSCI Switzerland Index (up 19.77%) and the MSCI Denmark Index (up 5.76%), respectively. The laggards in Europe were Austria and Ireland, represented by the MSCI Austria Index (down 13.12%) and the MSCI Ireland Index (down 9.22%), respectively. In Japan, equities struggled as the MSCI Japan Index returned -4.19%.
Finally, in the developing world, emerging markets were caught in the crossfire of the trade spat between the U.S. and China, but did manage to eke out a positive absolute return for the full period. The MSCI Emerging Market Index returned 1.21%. China, the largest-country constituent, was down 6.73%, represented by the MSCI China Index. Turkish equities also struggled as the economy dealt with rampant inflation and the MSCI Turkey Index returned -17.11%. The best-performing countries over the period were Brazil and Russia, represented by the MSCI Brazil Index (up 39.43%) and the MSCI Russia Index (up 27.06%), respectively.
2
American Beacon ARK Transformational Innovation FundSM
Performance Overview
June 30, 2019 (Unaudited)
The Investor Class of the American Beacon ARK Transformational Innovation Fund (the “Fund”) returned 6.07% for the twelve months ended June 30, 2019. The Fund underperformed the S&P 500 Index (the “Index”) return of 10.42% for the same period.
Comparison of Changes in Value of a $10,000 Investment for the period 1/27/2017 through 6/30/2019
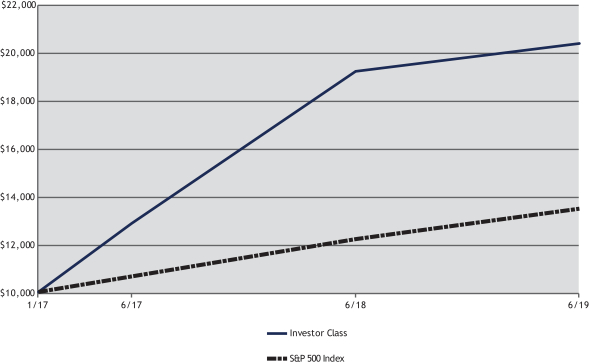
| Average Annual Total Returns for the Period ended June 30, 2019 |
| |||||||||||||||||||||
Ticker | 1 Year | Since Inception 01/27/2017 | Value of $10,000 01/27/2017- 06/30/2019 | |||||||||||||||||||
Institutional Class (1,5) | ADNIX | 6.55 | % | 34.60 | % | $ | 20,536 | |||||||||||||||
Y Class (1,5) | ADNYX | 6.39 | % | 34.43 | % | $ | 20,473 | |||||||||||||||
Investor Class (1,5) | ADNPX | 6.07 | % | 34.09 | % | $ | 20,348 | |||||||||||||||
A Class without Sales Charge (1,2,5) | ADNAX | 6.36 | % | 34.50 | % | $ | 20,500 | |||||||||||||||
A Class with Sales Charge (1,2,5) | ADNAX | 0.27 | % | 31.25 | % | $ | 19,321 | |||||||||||||||
C Class without Sales Charge (1,3,5) | ADNCX | 5.96 | % | 34.29 | % | $ | 20,422 | |||||||||||||||
C Class with Sales Charge (1,3,5) | ADNCX | 4.96 | % | 34.29 | % | $ | 20,422 | |||||||||||||||
S&P 500 Index (4) | 10.42 | % | 13.05 | % | $ | 13,460 | ||||||||||||||||
| 1. | Performance shown is historical and is not indicative of future returns. Investment returns and principal value will vary, and shares may be worth more or less at redemption than at original purchase. Performance shown is calculated based on the published end-of-day net asset values as of the date indicated and current performance may be lower or higher than the performance data quoted. To obtain performance as of the most recent month end, please visitwww.americanbeaconfunds.com or call 1-800-967-9009. Fund performance in the table above does not reflect the deduction of taxes a shareholder would pay on distributions or the redemption of shares. Generally accepted accounting principles require adjustments to be made to the net assets of the Fund at period end for financial reporting purposes only; and as such, the total return based on the unadjusted net asset value per share may differ from the total return reported in the financial highlights. A portion of the fees charged to each Class of the Fund has been waived since Fund inception. Performance prior to waiving fees was lower than the actual returns shown since inception. The strategy employed by the Fund’s sub-advisor has the potential for more volatility than broad market averages, which may result in significant fluctuations in the Fund’s short-term returns, both positive and negative. |
| 2. | Fund performance for the one-year and since-inception periods represent the returns achieved by the Institutional Class from 1/27/17 through 1/2/19, the inception date of the A Class, and the returns of the A Class since its inception. Expenses of the A Class are higher than those of the Institutional Class. As a result, total returns shown may be higher than they would have been had the A Class been in existence since 1/27/17. A Class shares have a maximum sales charge of 5.75%. |
3
American Beacon ARK Transformational Innovation FundSM
Performance Overview
June 30, 2019 (Unaudited)
| 3. | Fund performance for the one-year and since-inception periods represent the returns achieved by the Institutional Class from 1/27/17 through 1/2/19, the inception date of the C Class, and the returns of the C Class since its inception. Expenses of the C Class are higher than those of the Institutional Class. As a result, total returns shown may be higher than they would have been had the C Class been in existence since 1/27/17. The maximum contingent deferred sales charge for C Class is 1.00% for shares redeemed within one year of the date of purchase. |
| 4. | The S&P 500 Index is an unmanaged index of common stocks publicly traded in the United States. The S&P 500 Index is a product of S&P Dow Jones Indices LLC, a division of S&P Global or its affiliates (“SPDJI”) and has been licensed for use by American Beacon Advisors. Standard & Poor’s® and S&P® are registered trademarks of Standard & Poor’s Financial Services LLC, a division of S&P Global (“S&P”). Dow Jones® is a registered trademark of Dow Jones Trademark Holdings LLC (“Dow Jones”). The American Beacon ARK Transformational Innovation Fund is not sponsored, endorsed, sold or promoted by SPDJI, Dow Jones, S&P or their respective affiliates, and none of such parties make any representation regarding the advisability of investing in such product(s) nor do they have any liability for any errors, omissions or interruptions of the S&P 500 Index. One cannot directly invest in an index. |
| 5. | The Total Annual Fund Operating Expense ratios set forth in the most recent Fund prospectus for the Institutional, Y, Investor, A and C Class shares were 4.75%, 4.85%, 4.97%, 1.95% and 2.70%, respectively. The expense ratios above may vary from the expense ratios presented in other sections of this report that are based on expenses incurred during the period covered by this report. |
The Fund underperformed the Index primarily due to security selection as sector allocation contributed positively over the period. The Fund’s underperformance relative to the Index was attributable to holdings in the Consumer Discretionary and Communication Services sectors. Within the Consumer Discretionary sector, Tesla, Inc. (down 31.5%) was the largest detractor as the company undertook some cost cutting efforts to lay off 7% of its workforce and the CFO stepped down in the first quarter of 2019, replaced by a nine-year Tesla veteran. JD.com, Inc. ADR (down 42.7%) suffered as the United States alleged personal misconduct of its CEO as trade tensions between the U.S. and China intensified. In the Communication Services sector, the chief detractor was Baidu, Inc., Sponsored ADR (down 47.8%). The stock suffered as it posted its first loss since 2005, for the first quarter 2019 results and second quarter revenue guidance were below expectations. On the positive side, positions in the Health Care sector that added value relative to the Index were Invitae Corp. (up 213.8%), Nanostring Technologies, Inc. (up 115.8%), and Veracyte, Inc. (up 197.2%).
The Fund benefited from sector allocation over the period. Having a null weight to the Energy sector, which was the worst performing sector within the Index (down 12.9%) added to relative performance. Additionally, a significant overweight to the second-best performing sector in the Index, Information Technology (up 17.3%), contributed to relative performance. Slightly offsetting was a null weight to the Consumer Staples sector (up 16.3%) which detracted from relative returns.
The sub-advisor will continue to focus on identifying companies best positioned for long-term exponential growth and capital appreciation created by disruptive innovation.
| Top Ten Holdings (% Net Assets) |
| |||||||
| Tesla, Inc. | 9.1 | |||||||
| Stratasys Ltd. | 7.5 | |||||||
| Invitae Corp. | 7.0 | |||||||
| Square, Inc., Class A | 5.5 | |||||||
| Illumina, Inc. | 4.8 | |||||||
| NVIDIA Corp. | 4.7 | |||||||
| Intellia Therapeutics, Inc. | 4.0 | |||||||
| NanoString Technologies, Inc. | 3.9 | |||||||
| Twitter, Inc. | 3.8 | |||||||
| CRISPR Therapeutics AG | 3.5 | |||||||
| Total Fund Holdings | 44 | |||||||
| Sector Allocation (% Investments) |
| |||||||
| Health Care | 36.6 | |||||||
| Information Technology | 31.1 | |||||||
| Communication Services | 16.7 | |||||||
| Consumer Discretionary | 9.9 | |||||||
| Financials | 3.8 | |||||||
| Industrials | 1.9 | |||||||
4
American Beacon ARK Transformational Innovation FundSM
June 30, 2019 (Unaudited)
Fund Expense Example
As a shareholder of a Fund, you incur two types of costs: (1) transaction costs, including sales charges (loads) on purchase payments and redemption fees, if applicable, and (2) ongoing costs, including management fees, distribution (12b-1) fees, sub-transfer agent fees, and other Fund expenses. The Examples are intended to help you understand the ongoing cost (in dollars) of investing in the Fund and to compare these costs with the ongoing costs of investing in other mutual funds. The Examples are based on an investment of $1,000 invested at the beginning of the period in each Class and held for the entire period from January 1, 2019 through June 30, 2019.
Actual Expenses
The “Actual” lines of the tables provide information about actual account values and actual expenses. You may use the information on this page, together with the amount you invested, to estimate the expenses that you paid over the period. Simply divide your account value by $1,000 (for example, an $8,600 account value divided by $1,000 = $8.60), then multiply the result by the “Expenses Paid During Period” to estimate the expenses you paid on your account during this period. Shareholders of the Investor and Institutional Classes that invest in the Fund through an IRA or Roth IRA may be subject to a custodial IRA fee of $15 that is typically deducted each December. If your account was subject to a custodial IRA fee during the period, your costs would have been $15 higher.
Hypothetical Example for Comparison Purposes
The “Hypothetical” lines of the tables provide information about hypothetical account values and hypothetical expenses based on the Fund’s actual expense ratio and an assumed 5% per year rate of return before expenses (not the Fund’s actual return). You may compare the ongoing costs of investing in the Fund with other funds by contrasting this 5% hypothetical example and the 5% hypothetical examples that appear in the shareholder reports of the other funds. The hypothetical account values and expenses may not be used to estimate the actual ending account balance or expenses you paid for the period. Shareholders of the Investor and Institutional Classes that invest in the Funds through an IRA or Roth IRA may be subject to a custodial IRA fee of $15 that is typically deducted each December. If your account was subject to a custodial IRA fee during the period, your costs would have been $15 higher.
You should also be aware that the expenses shown in the table highlight only your ongoing costs and do not reflect any transaction costs charged by the Fund, such as sales charges (loads) or redemption fees, as applicable. Similarly, the expense examples for other funds do not reflect any transaction costs charged by those funds, such as sales charges (loads), redemption fees or exchange fees. Therefore, the “Hypothetical” lines of the tables are useful in comparing ongoing costs only and will not help you determine the relative total costs of owning different funds. If you were subject to any transaction costs during the period, your costs would have been higher.
5
American Beacon ARK Transformational Innovation FundSM
Expense Examples
June 30, 2019 (Unaudited)
| American Beacon ARK Transformational Innovation Fund |
| ||||||||||||||
| Beginning Account Value 1/1/2019 | Ending Account Value 6/30/2019 | Expenses Paid During Period 1/1/2019-6/30/2019* | |||||||||||||
| Institutional Class |
| ||||||||||||||
| Actual | $1,000.00 | $1,257.80 | $5.60 | ||||||||||||
| Hypothetical** | $1,000.00 | $1,019.84 | $5.01 | ||||||||||||
| Y Class |
| ||||||||||||||
| Actual | $1,000.00 | $1,256.90 | $6.16 | ||||||||||||
| Hypothetical** | $1,000.00 | $1,019.34 | $5.51 | ||||||||||||
| Investor Class |
| ||||||||||||||
| Actual | $1,000.00 | $1,255.60 | $7.72 | ||||||||||||
| Hypothetical** | $1,000.00 | $1,017.95 | $6.90 | ||||||||||||
| A Class*** |
| ||||||||||||||
| Actual | $1,000.00 | $1,251.40 | $7.73 | ||||||||||||
| Hypothetical** | $1,000.00 | $1,017.85 | $7.00 | ||||||||||||
| C Class*** |
| ||||||||||||||
| Actual | $1,000.00 | $1,246.60 | $11.84 | ||||||||||||
| Hypothetical** | $1,000.00 | $1,014.13 | $10.74 | ||||||||||||
| * | Expenses are equal to the Fund’s annualized expense ratios for thesix-month period of 1.00%, 1.10%, 1.38%, 1.40%, and 2.15% for the Institutional, Y, Investor, A, and C Classes, respectively, multiplied by the average account value over the period, multiplied by the number derived by dividing the number of days in the most recent fiscal half-year (181) by days in the year (365) to reflect the half-year period. |
| ** | 5% return before expenses. |
| *** | American Beacon ARK Transformational Innovation Fund’s A Class and C Class commenced operations on January 2, 2019. Expenses are equal to the fund’s annualized expense ratio for the period, multiplied by the average account value over the period, multiplied by the number of days since inception (179), then divided by the number of days in the year (365) to reflect the period. The Ending Account Value is derived from the fund’s share class actual return since inception. The Hypothetical 5% Annual Return information reflects the (181) day period for the six months ended June 30, 2019 to allow for comparability. |
6
American Beacon ARK Transformational Innovation FundSM
Report of Independent Registered Public Accounting Firm
Tothe Board of Trustees of American Beacon Funds and Shareholders of American Beacon ARK Transformational Innovation Fund
Opinion on the Financial Statements
We have audited the accompanying statement of assets and liabilities, including the schedule of investments, of American Beacon ARK Transformational Innovation Fund (one of the series constituting American Beacon Funds, referred to hereafter as the “Fund”) as of June 30, 2019, the related statement of operationsfor the year ended June 30, 2019, the statement of changes in net assets for each of the two years in the period ended June 30, 2019, including the related notes, and the financial highlights for each of the periods indicated therein (collectively referred to as the “financial statements”). In our opinion, the financial statements present fairly, in all material respects, the financial position of the Fund as of June 30, 2019, the results of its operations for the year ended June 30, 2019, the changes in its net assets for each of the two years in the period ended June 30, 2019 and the financial highlights for each of the periods indicated therein in conformity with accounting principles generally accepted in the United States of America.
Basis for Opinion
These financial statements are the responsibility of the Fund’s management. Our responsibility is to express an opinion on the Fund’s financial statements based on our audits. We are a public accounting firm registered with the Public Company Accounting Oversight Board (United States) (PCAOB) and are required to be independent with respect to the Fund in accordance with the U.S. federal securities laws and the applicable rules and regulations of the Securities and Exchange Commission and the PCAOB.
We conducted our audits of these financial statements in accordance with the standards of the PCAOB. Those standards require that we plan and perform the audit to obtain reasonable assurance about whether the financial statements are free of material misstatement, whether due to error or fraud.
Our audits included performing procedures to assess the risks of material misstatement of the financial statements, whether due to error or fraud, and performing procedures that respond to those risks. Such procedures included examining, on a test basis, evidence regarding the amounts and disclosures in the financial statements. Our audits also included evaluating the accounting principles used and significant estimates made by management, as well as evaluating the overall presentation of the financial statements. Our procedures included confirmation of securities owned as of June 30, 2019 by correspondence with the custodian, transfer agent and broker; when replies were not received from brokers, we performed other auditing procedures. We believe that our audits provide a reasonable basis for our opinion.
PricewaterhouseCoopers LLP
Dallas, TX
August 27, 2019
We have served as the auditor of one or more investment companies in the American Beacon family of funds since 2016.
7
American Beacon ARK Transformational Innovation FundSM
Schedule of Investments
June 30, 2019
| Shares | Fair Value | ||||||||||||||
| COMMON STOCKS - 96.53% | |||||||||||||||
| Communication Services - 16.08% | |||||||||||||||
| Entertainment - 3.54% | |||||||||||||||
| Netflix, Inc.A | 1,925 | $ | 707,091 | ||||||||||||
| Nintendo Co., Ltd.B | 171 | 62,865 | |||||||||||||
| Spotify Technology S.A.A | 6,880 | 1,005,993 | |||||||||||||
|
| ||||||||||||||
| 1,775,949 | |||||||||||||||
|
| ||||||||||||||
| Interactive Media & Services - 12.44% | |||||||||||||||
| Baidu, Inc., Sponsored ADRA | 9,251 | 1,085,697 | |||||||||||||
| Eventbrite, Inc., Class AA | 26,676 | 432,151 | |||||||||||||
| Facebook, Inc., Class AA | 2,473 | 477,289 | |||||||||||||
| Tencent Holdings Ltd., ADR | 25,766 | 1,166,169 | |||||||||||||
| Twitter, Inc.A | 55,070 | 1,921,943 | |||||||||||||
| Zillow Group, Inc.A C | 25,078 | 1,163,369 | |||||||||||||
|
| ||||||||||||||
| 6,246,618 | |||||||||||||||
|
| ||||||||||||||
| Wireless Telecommunication Services - 0.10% | |||||||||||||||
| SoftBank Group Corp.B | 1,110 | 53,490 | |||||||||||||
|
| ||||||||||||||
Total Communication Services | 8,076,057 | ||||||||||||||
|
| ||||||||||||||
| Consumer Discretionary - 9.53% | |||||||||||||||
| Auto Components - 0.44% | |||||||||||||||
| Aptiv PLC | 2,743 | 221,716 | |||||||||||||
|
| ||||||||||||||
| Automobiles - 9.09% | |||||||||||||||
| Tesla, Inc.A C | 20,415 | 4,561,936 | |||||||||||||
|
| ||||||||||||||
Total Consumer Discretionary | 4,783,652 | ||||||||||||||
|
| ||||||||||||||
| Financials - 3.73% | |||||||||||||||
| Consumer Finance - 1.77% | |||||||||||||||
| LendingClub Corp.A | 271,344 | 890,008 | |||||||||||||
|
| ||||||||||||||
| Thrifts & Mortgage Finance - 1.96% | |||||||||||||||
| LendingTree, Inc.A | 2,335 | 980,770 | |||||||||||||
|
| ||||||||||||||
Total Financials | 1,870,778 | ||||||||||||||
|
| ||||||||||||||
| Health Care - 35.31% | |||||||||||||||
| Biotechnology - 22.34% | |||||||||||||||
| Bluebird Bio, Inc.A | 3,478 | 442,402 | |||||||||||||
| Cellectis S.A., ADRA | 8,403 | 131,087 | |||||||||||||
| CRISPR Therapeutics AGA C | 37,231 | 1,753,580 | |||||||||||||
| Editas Medicine, Inc.A | 66,726 | 1,650,801 | |||||||||||||
| Intellia Therapeutics, Inc.A | 121,774 | 1,993,440 | |||||||||||||
| Invitae Corp.A | 148,540 | 3,490,690 | |||||||||||||
| Organovo Holdings, Inc.A C | 70,569 | 36,908 | |||||||||||||
| Seres Therapeutics, Inc.A C | 86,915 | 279,866 | |||||||||||||
| Syros Pharmaceuticals, Inc.A | 50,874 | 471,093 | |||||||||||||
| Veracyte, Inc.A | 33,910 | 966,774 | |||||||||||||
|
| ||||||||||||||
| 11,216,641 | |||||||||||||||
|
| ||||||||||||||
| Health Care Equipment & Supplies - 1.09% | |||||||||||||||
| Cerus Corp.A | 97,172 | 546,107 | |||||||||||||
|
| ||||||||||||||
| Health Care Technology - 2.58% | |||||||||||||||
| Medidata Solutions, Inc.A | 6,412 | 580,350 | |||||||||||||
| Teladoc Health, Inc.A | 10,799 | 717,162 | |||||||||||||
|
| ||||||||||||||
| 1,297,512 | |||||||||||||||
|
| ||||||||||||||
See accompanying notes
8
American Beacon ARK Transformational Innovation FundSM
Schedule of Investments
June 30, 2019
| Shares | Fair Value | ||||||||||||||
| COMMON STOCKS - 96.53% (continued) | |||||||||||||||
| Life Sciences Tools & Services - 9.25% | |||||||||||||||
| Compugen Ltd.A C | 70,360 | $ | 270,183 | ||||||||||||
| Illumina, Inc.A | 6,569 | 2,418,377 | |||||||||||||
| NanoString Technologies, Inc.A | 64,395 | 1,954,388 | |||||||||||||
|
| ||||||||||||||
| 4,642,948 | |||||||||||||||
|
| ||||||||||||||
| Pharmaceuticals - 0.05% | |||||||||||||||
| Bayer AGB | 390 | 27,089 | |||||||||||||
|
| ||||||||||||||
Total Health Care | 17,730,297 | ||||||||||||||
|
| ||||||||||||||
| Industrials - 1.87% | |||||||||||||||
| Machinery - 1.87% | |||||||||||||||
| FANUC Corp.B | 220 | 40,840 | |||||||||||||
| Proto Labs, Inc.A | 7,723 | 896,022 | |||||||||||||
|
| ||||||||||||||
| 936,862 | |||||||||||||||
|
| ||||||||||||||
Total Industrials | 936,862 | ||||||||||||||
|
| ||||||||||||||
| Information Technology - 30.01% | |||||||||||||||
| IT Services - 5.49% | |||||||||||||||
| Square, Inc., Class AA | 38,041 | 2,759,114 | |||||||||||||
|
| ||||||||||||||
| Semiconductors & Semiconductor Equipment - 8.83% | |||||||||||||||
| NVIDIA Corp. | 14,235 | 2,337,814 | |||||||||||||
| Teradyne, Inc. | 29,262 | 1,401,942 | |||||||||||||
| Xilinx, Inc. | 5,879 | 693,252 | |||||||||||||
|
| ||||||||||||||
| 4,433,008 | |||||||||||||||
|
| ||||||||||||||
| Software - 8.06% | |||||||||||||||
| 2U, Inc.A | 22,946 | 863,687 | |||||||||||||
| Materialise N.V., ADRA C | 40,865 | 797,685 | |||||||||||||
| Nutanix, Inc., Class AA | 20,150 | 522,691 | |||||||||||||
| salesforce.com, Inc.A | 6,115 | 927,829 | |||||||||||||
| Splunk, Inc.A | 7,424 | 933,568 | |||||||||||||
|
| ||||||||||||||
| 4,045,460 | |||||||||||||||
|
| ||||||||||||||
| Technology Hardware, Storage & Peripherals - 7.63% | |||||||||||||||
| Apple, Inc. | 333 | 65,907 | |||||||||||||
| Stratasys Ltd.A | 128,196 | 3,765,117 | |||||||||||||
|
| ||||||||||||||
| 3,831,024 | |||||||||||||||
|
| ||||||||||||||
Total Information Technology | 15,068,606 | ||||||||||||||
|
| ||||||||||||||
Total Common Stocks (Cost $43,380,848) | 48,466,252 | ||||||||||||||
|
| ||||||||||||||
| SHORT-TERM INVESTMENTS - 3.36% (Cost $1,684,972) | |||||||||||||||
| Investment Companies - 3.36% | |||||||||||||||
| American Beacon U.S. Government Money Market Select Fund, Select Class, 2.32%D E | 1,684,972 | 1,684,972 | |||||||||||||
|
| ||||||||||||||
| SECURITIES LENDING COLLATERAL - 9.68% (Cost $4,858,315) | |||||||||||||||
| Investment Companies - 9.68% | |||||||||||||||
| American Beacon U.S. Government Money Market Select Fund, Select Class, 2.32%D E | 4,858,315 | 4,858,315 | |||||||||||||
|
| ||||||||||||||
TOTAL INVESTMENTS - 109.57% (Cost $49,924,135) | 55,009,539 | ||||||||||||||
LIABILITIES, NET OF OTHER ASSETS - (9.57%) | (4,804,244 | ) | |||||||||||||
|
| ||||||||||||||
TOTAL NET ASSETS - 100.00% | $ | 50,205,295 | |||||||||||||
|
| ||||||||||||||
| Percentages are stated as a percent of net assets. | |||||||||||||||
See accompanying notes
9
American Beacon ARK Transformational Innovation FundSM
Schedule of Investments
June 30, 2019
ANon-income producing security.
B Fair valued pursuant to procedures approved by the Board of Trustees. At period end, the value of these securities amounted to $184,284 or 0.37% of net assets.
C All or a portion of this security is on loan at June 30, 2019.
D The Fund is affiliated by having the same investment advisor.
E7-day yield.
ADR - American Depositary Receipt.
PLC - Public Limited Company.
The Fund’s investments are summarized by level based on the inputs used to determine their values. As of June 30, 2019, the investments were classified as described below:
ARK Transformational Innovation Fund | Level 1 | Level 2 | Level 3 | Total | ||||||||||||||||||||||||
Assets |
| |||||||||||||||||||||||||||
Common Stocks | $ | 48,281,968 | $ | 184,284 | $ | - | $ | 48,466,252 | ||||||||||||||||||||
Short-Term Investments | 1,684,972 | - | - | 1,684,972 | ||||||||||||||||||||||||
Securities Lending Collateral | 4,858,315 | - | - | 4,858,315 | ||||||||||||||||||||||||
|
|
|
|
|
|
|
| |||||||||||||||||||||
Total Investments in Securities - Assets | $ | 54,825,255 | $ | 184,284 | $ | - | $ | 55,009,539 | ||||||||||||||||||||
|
|
|
|
|
|
|
| |||||||||||||||||||||
U.S. GAAP requires transfers between all levels to/from level 3 be disclosed. During the year ended June 30, 2019, there were no transfers into or out of Level 3.
See accompanying notes
10
American Beacon ARK Transformational Innovation FundSM
Statement of Assets and Liabilities
June 30, 2019
Assets: |
| |||
Investments in unaffiliated securities, at fair value†§ | $ | 48,466,252 | ||
Investments in affiliated securities, at fair value‡ | 6,543,287 | |||
Foreign currency, at fair value^ | 1,657 | |||
Dividends and interest receivable | 3,470 | |||
Receivable for investments sold | 92,307 | |||
Receivable for fund shares sold | 118,851 | |||
Receivable for tax reclaims | 419 | |||
Receivable for expense reimbursement (Note 2) | 32,083 | |||
Prepaid expenses | 24,557 | |||
|
| |||
Total assets | 55,282,883 | |||
|
| |||
Liabilities: |
| |||
Payable for investments purchased | 92,822 | |||
Payable for fund shares redeemed | 20,676 | |||
Management andsub-advisory fees payable (Note 2) | 33,112 | |||
Service fees payable (Note 2) | 2,050 | |||
Transfer agent fees payable (Note 2) | 1,689 | |||
Payable upon return of securities loaned (Note 8)§ | 4,858,315 | |||
Custody and fund accounting fees payable | 6,069 | |||
Professional fees payable | 60,116 | |||
Other liabilities | 2,739 | |||
|
| |||
Total liabilities | 5,077,588 | |||
|
| |||
Net assets | $ | 50,205,295 | ||
|
| |||
Analysis of net assets: |
| |||
Paid-in-capital | $ | 43,876,598 | ||
Total distributable earnings (deficits)A | 6,328,697 | |||
|
| |||
Net assets | $ | 50,205,295 | ||
|
| |||
Shares outstanding at no par value (unlimited shares authorized): |
| |||
Institutional Class | 143,899 | |||
|
| |||
Y Class | 1,770,759 | |||
|
| |||
Investor Class | 505,606 | |||
|
| |||
A ClassB | 195,789 | |||
|
| |||
C ClassB | 97,526 | |||
|
| |||
Net assets: |
| |||
Institutional Class | $ | 2,674,638 | ||
|
| |||
Y Class | $ | 32,822,832 | ||
|
| |||
Investor Class | $ | 9,310,932 | ||
|
| |||
A ClassB | $ | 3,606,814 | ||
|
| |||
C ClassB | $ | 1,790,079 | ||
|
| |||
Net asset value, offering and redemption price per share: |
| |||
Institutional Class | $ | 18.59 | ||
|
| |||
Y Class | $ | 18.54 | ||
|
| |||
Investor Class | $ | 18.42 | ||
|
| |||
A ClassB | $ | 18.42 | ||
|
| |||
A Class (offering price)B | $ | 18.53 | ||
|
| |||
C ClassB | $ | 18.35 | ||
|
| |||
† Cost of investments in unaffiliated securities | $ | 43,380,848 | ||
‡ Cost of investments in affiliated securities | $ | 6,543,287 | ||
§ Fair value of securities on loan | $ | 4,848,844 | ||
^ Cost of foreign currency | $ | 1,658 | ||
A The Fund’s investments in affiliated securities did not have unrealized appreciation (depreciation) at year end. |
| |||
B Class commenced operations January 2, 2019 (Note 1). |
| |||
See accompanying notes
11
American Beacon ARK Transformational Innovation FundSM
Statement of Operations
For the year ended June 30, 2019
Investment income: |
| |||
Dividend income from unaffiliated securities (net of foreign taxes)† | $ | 34,234 | ||
Dividend income from affiliated securities (Note 7) | 34,018 | |||
Income derived from securities lending (Note 8) | 34,671 | |||
|
| |||
Total investment income | 102,923 | |||
|
| |||
Expenses: |
| |||
Management andsub-advisory fees (Note 2) | 296,344 | |||
Transfer agent fees: | ||||
Institutional Class (Note 2) | 476 | |||
Y Class (Note 2) | 22,865 | |||
Investor Class | 1,543 | |||
A ClassA | 2,293 | |||
C ClassA | 2,290 | |||
Custody and fund accounting fees | 39,148 | |||
Professional fees | 122,486 | |||
Registration fees and expenses | 79,271 | |||
Service fees (Note 2): | ||||
Investor Class | 24,130 | |||
Distribution fees (Note 2): | ||||
A ClassA | 2,401 | |||
C ClassA | 5,078 | |||
Prospectus and shareholder report expenses | 18,959 | |||
Trustee fees (Note 2) | 2,316 | |||
Other expenses | 22,524 | |||
|
| |||
Total expenses | 642,124 | |||
|
| |||
Net fees waived and expenses (reimbursed) (Note 2) | (253,714 | ) | ||
|
| |||
Net expenses | 388,410 | |||
|
| |||
Net investment (loss) | (285,487 | ) | ||
|
| |||
Realized and unrealized gain (loss) from investments: |
| |||
Net realized gain from: | ||||
Investments in unaffiliated securitiesB | 1,603,340 | |||
Foreign currency transactions | 29 | |||
Change in net unrealized appreciation (depreciation) of: | ||||
Investments in unaffiliated securitiesC | 1,828,953 | |||
Foreign currency transactions | (6 | ) | ||
|
| |||
Net gain from investments | 3,432,316 | |||
|
| |||
Net increase in net assets resulting from operations | $ | 3,146,829 | ||
|
| |||
† Foreign taxes | $ | 578 | ||
| A Class commenced operations January 2, 2019 (Note 1). |
| |||
| B The Fund did not recognize net realized gains (losses) from the sale of investments in affiliated securities. |
| |||
| C The Fund’s investments in affiliated securities did not have a change in unrealized appreciation (depreciation) at year end. |
| |||
See accompanying notes
12
American Beacon ARK Transformational Innovation FundSM
Statement of Changes in Net Assets
| Year Ended June 30, 2019 | Year Ended June 30, 2018 | |||||||||||
Increase (decrease) in net assets: |
| |||||||||||
Operations: |
| |||||||||||
Net investment income (loss) | $ | (285,487 | ) | $ | (11,385 | ) | ||||||
Net realized gain from investments in unaffiliated securities and foreign currency transactions | 1,603,369 | 1,572,428 | ||||||||||
Change in net unrealized appreciation of investments in unaffiliated securities and foreign currency transactions | 1,828,947 | 2,516,596 | ||||||||||
|
|
|
| |||||||||
Net increase in net assets resulting from operations | 3,146,829 | 4,077,639 | ||||||||||
|
|
|
| |||||||||
Distributions to shareholders: |
| |||||||||||
Net investment income: | ||||||||||||
Institutional Class | - | (26,679 | ) | |||||||||
Y Class | - | (16,074 | ) | |||||||||
Investor Class | - | (18,772 | ) | |||||||||
Net realized gain from investments: | ||||||||||||
Institutional Class | - | (140,437 | ) | |||||||||
Y Class | - | (84,610 | ) | |||||||||
Investor Class | - | (98,701 | ) | |||||||||
Total retained earnings: * | ||||||||||||
Institutional Class | (142,278 | ) | - | |||||||||
Y Class | (764,186 | ) | - | |||||||||
Investor Class | (482,172 | ) | - | |||||||||
|
|
|
| |||||||||
Net distributions to shareholders | (1,388,636 | ) | (385,273 | ) | ||||||||
|
|
|
| |||||||||
Capital share transactions (Note 10): |
| |||||||||||
Proceeds from sales of shares | 44,421,838 | 20,034,082 | ||||||||||
Reinvestment of dividends and distributions | 1,386,473 | 381,774 | ||||||||||
Cost of shares redeemed | (21,809,490 | ) | (4,500,822 | ) | ||||||||
|
|
|
| |||||||||
Net increase in net assets from capital share transactions | 23,998,821 | 15,915,034 | ||||||||||
|
|
|
| |||||||||
Net increase in net assets | 25,757,014 | 19,607,400 | ||||||||||
|
|
|
| |||||||||
Net assets: |
| |||||||||||
Beginning of period | 24,448,281 | 4,840,881 | ||||||||||
|
|
|
| |||||||||
End of period | $ | 50,205,295 | $ | 24,448,281 | ||||||||
|
|
|
| |||||||||
* Distributions from net investment income and net realized capital gains are combined for the year ended June 30, 2019. See Note 1 in the Notes to Financial Statements for more information regarding new accounting pronouncements. |
| |||||||||||
See accompanying notes
13
American Beacon ARK Transformational Innovation FundSM
June 30, 2019
1. Organization and Significant Accounting Policies
American Beacon Funds (the “Trust”) is organized as a Massachusetts business trust. The Fund, a series within the Trust, is registered under the Investment Company Act of 1940, as amended (the “Act”), as anon-diversified,open-end management investment company. As of June 30, 2019, the Trust consists of thirty-three active series, one of which is presented in this filing: American Beacon ARK Transformational Innovation Fund (the “Fund”). The remainingthirty-two active series are reported in separate filings.
American Beacon Advisors, Inc. (the “Manager”) is a Delaware corporation and a wholly-owned subsidiary of Resolute Investment Managers, Inc. (“RIM”) organized in 1986 to provide business management, advisory, administrative, and asset management consulting services to the Trust and other investors. The Manager is registered as an investment advisor under the Investment Advisers Act of 1940, as amended (the “Advisers Act”). RIM is, in turn, a wholly-owned subsidiary of Resolute Acquisition, Inc., which is a wholly-owned subsidiary of Resolute Topco, Inc., a wholly-owned subsidiary of Resolute Investment Holdings, LLC (“RIH”). RIH is owned primarily by Kelso Investment Associates VIII, L.P., KEP VI, LLC and Estancia Capital Partners L.P., investment funds affiliated with Kelso & Company, L.P. (“Kelso”) or Estancia Capital Management, LLC (“Estancia”), which are private equity firms.
Recent Accounting Pronouncements
In March 2017, the Financial Accounting Standards Board (“FASB”) issued Accounting Standards Update (“ASU”)2017-08,Premium Amortization of Purchased Callable Debt Securities. The amendments in the ASU shorten the premium amortization period on a purchased callable debt security from the security’s contractual life to the earliest call date. It is anticipated that this change will enhance disclosures by reducing losses recognized when a security is called on an earlier date. This ASU is effective for fiscal years beginning after December 15, 2018. The Manager continues to evaluate the impact this ASU will have on the financial statements and other disclosures.
In August 2018, the FASB issued ASU2018-13,Fair Value Measurement (“Topic 820”). The amendments in the ASU impact disclosure requirements for fair value measurement. It is anticipated that this change will enhance the effectiveness of disclosures in the notes to the financial statements. This ASU is effective for fiscal years beginning after December 15, 2019. Early adoption is permitted and can include the entire standard or certain provisions that exclude or amend disclosures. For the year ended June 30, 2019, the Fund has chosen to adopt the standard. The adoption of this ASU guidance did not have a material impact on the financial statements and other disclosures.
In August 2018, the U.S. Securities and Exchange Commission (“SEC”) adopted amendments to certain disclosure requirements in Securities Act Release No. 33-10532, Disclosure Update and Simplification, which is intended to facilitate the disclosure of information to investors and simplify compliance without significantly altering the total mix of information provided to investors. Effective with the current reporting period, the Fund adopted the amendments with the impacts being that the Fund is no longer required to present components of distributable earnings on the Statement of Assets and Liabilities or the sources of distributable earnings and the amount of undistributed net investment income on the Statement of Changes in Net Assets.
Class Disclosure
On January 2, 2019, the Fund created the A and C Classes, new classes made available for sale pursuant to the Fund’s registration statement filed with the SEC. Refer to the Fund’s Prospectus for more details.
14
American Beacon ARK Transformational Innovation FundSM
Notes to Financial Statements
June 30, 2019
The Fund has multiple classes of shares designed to meet the needs of different groups of investors. The following table sets forth the differences amongst the classes:
Class | Eligible Investors | Minimum Initial Investments | ||||
| Institutional | Large institutional investors - sold directly through intermediary channels. | $ | 250,000 | |||
| Y Class | Large institutional retirement plan investors - sold directly or through intermediary channels. | $ | 100,000 | |||
| Investor | All investors using intermediary organizations, such as broker-dealers or retirement plan sponsors. | $ | 2,500 | |||
| A Class | All investors who invest through intermediary organizations, such as broker-dealers or third party administrator. Retail investors who invest directly through a financial intermediary such as a broker, bank, or registered investment advisor which may include afront-end sales charge and a contingent deferred sales charge (“CDSC”). | $ | 2,500 | |||
| C Class | Retail investors who invest directly through a financial intermediary such as a broker or through employee directed benefit plans with applicable sales charges which may include CDSC. | $ | 1,000 | |||
Each class offered by the Trust has equal rights as to assets and voting privileges. Income andnon-class specific expenses are allocated daily to each class based on the relative net assets. Realized and unrealized capital gains and losses of each class are allocated daily based on the relative net assets of each class of the respective Fund. Class specific expenses, where applicable, currently include service, distribution, transfer agent fees, andsub-transfer agent fees that vary amongst the classes as described more fully in Note 2.
Consolidation of Subsidiaries
The American Beacon Cayman Transformational Innovation Company, Ltd. (the “Cayman Subsidiary”) and American Beacon Delaware Transformational Innovation Corporation (the “Delaware Subsidiary”), wholly-owned and controlled subsidiaries (together, the “Subsidiaries”) closed on October 1, 2018 and October 25, 2018 respectively. Hence there was no consolidation of the Subsidiaries for the year ended June 30, 2019 since the respective closing dates aforementioned.
Significant Accounting Policies
The following is a summary of significant accounting policies, consistently followed by the Fund in preparation of the financial statements. The Fund is considered an investment company and accordingly, follows the investment company accounting and reporting guidance of the FASB Accounting Standards Codification Topic 946,Financial Services – Investment Companies,a part of Generally Accepted Accounting Principles (“U.S. GAAP”).
Security Transactions and Investment Income
Security transactions are recorded as of the trade date for financial reporting purposes. Securities purchased or sold on a when-issued or delayed-delivery basis may be settled beyond a standard settlement period for the security after the trade date.
Dividend income, net of foreign taxes, is recorded on theex-dividend date, except certain dividends from foreign securities which are recorded as soon as the information is available to the Fund. Interest income, net of foreign taxes, is earned from settlement date, recorded on the accrual basis, and adjusted, if necessary, for accretion of discounts and amortization of premiums. Realized gains (losses) from securities sold are determined based on specific lot identification.
Currency Translation
All assets and liabilities initially expressed in foreign currency values are converted into U.S. dollar values at the mean of the bid and ask prices of such currencies against U.S. dollars as last quoted by a recognized dealer.
15
American Beacon ARK Transformational Innovation FundSM
Notes to Financial Statements
June 30, 2019
Income, expenses, and purchases and sales of investments are translated into U.S. dollars at the rate of the exchange prevailing on the respective dates of such transactions. The effect of changes in foreign currency exchange rates on investments is separately identified from the fluctuations arising from changes in market values of securities held and is reported with all other foreign currency gains and losses on the Fund’s Statement of Operations.
Distributions to Shareholders
The Fund distributes most or all of its net earnings and realized gains, if any, each taxable year in the form of dividends from net investment income and distributions of realized net capital gains and net gains from foreign currency transactions on an annual basis. The Fund does not have a fixed dividend rate or does not guarantee that it will pay any distributions in any particular period.
Dividends to shareholders are determined in accordance with federal income tax regulations, which may differ in amount and character from net investment income and realized gains recognized for purposes of U.S. GAAP. To the extent necessary to fully distribute capital gains, the Fund may designate earnings and profits distributed to shareholders on the redemption of shares.
Commission Recapture
The Fund has established brokerage commission recapture arrangements with certain brokers or dealers. If the Fund’s investment advisor chooses to execute a transaction through a participating broker, the broker rebates a portion of the commission back to the Fund. Any collateral benefit received through participation in the commission recapture program is directed exclusively to the Fund. This amount is reported with the net realized gain in the Fund’s Statement of Operations, if applicable.
Allocation of Income, Trust Expenses, Gains, and Losses
Investment income, realized and unrealized gains and losses from investments of the Fund is allocated daily to each class of shares based upon the relative proportion of net assets of each class to the total net assets of the Fund. Expenses directly charged or attributable to the Fund will be paid from the assets of the Fund. Generally, expenses of the Trust will be allocated among and charged to the assets of the Fund on a basis that the Trust’s Board of Trustees (the “Board”) deems fair and equitable, which may be based on the relative net assets of the Fund or nature of the services performed and relative applicability to the Fund.
Use of Estimates
The preparation of financial statements in conformity with U.S. GAAP requires management to make estimates and assumptions that affect the amounts reported in the financial statements and accompanying notes. Actual results may differ from those estimated.
Other
Under the Trust’s organizational documents, its officers and trustees are indemnified against certain liabilities arising out of the performance of their duties to the Trust. In the normal course of business, the Trust enters into contracts that provide indemnification to the other party or parties against potential costs or liabilities. The Trust’s maximum exposure under these arrangements is dependent on claims that may be made in the future and, therefore, cannot be estimated. The Trust has had no prior claims or losses pursuant to any such agreement.
2. Transactions with Affiliates
Management and InvestmentSub-Advisory Agreements
The Fund and the Manager are parties to a Management Agreement that obligates the Manager to provide the Fund with investment advisory and administrative services. As compensation for performing the duties under
16
American Beacon ARK Transformational Innovation FundSM
Notes to Financial Statements
June 30, 2019
the Management Agreement, the Manager will receive an annualized management fee based on a percentage of the Fund’s average daily net assets that is calculated and accrued daily according to the following schedule:
First $5 billion | 0.35 | % | ||
Next $5 billion | 0.325 | % | ||
Next $10 billion | 0.30 | % | ||
Over $20 billion | 0.275 | % |
The Trust, on behalf of the Fund, and the Manager have entered into an Investment Advisory Agreement with ARK Investment Management LLC (the“Sub-Advisor”) pursuant to which the Fund has agreed to pay an annualizedsub-advisory fee that is calculated and accrued daily based on the Fund’s average daily net assets according to the following schedule:
First $5 billion | 0.55 | % | ||
Next $5 billion | 0.525 | % | ||
Next $10 billion | 0.50 | % | ||
Over $20 billion | 0.475 | % |
The Management andSub-Advisory Fees paid by the Fund for the year ended June 30, 2019 were as follows:
| Effective Fee Rate | Amount of Fees Paid | |||||||||||
Management Fees | 0.35 | % | $ | 117,646 | ||||||||
Sub-Advisor Fees | 0.55 | % | 178,698 | |||||||||
|
|
|
| |||||||||
Total | 0.90 | % | $ | 296,344 | ||||||||
|
|
|
| |||||||||
As compensation for services provided by the Manager in connection with securities lending activities conducted by the Fund, the lending Fund pays to the Manager, with respect to cash collateral posted by borrowers, a fee up to 10% of the net monthly interest income (the gross interest income earned by the investment of cash collateral, less the amount paid to borrowers and related expenses) from such activities and, with respect to loan fees paid by borrowers, a fee up to 10% of such loan fees. These fees are included in “Income derived from securities lending” and “Management and investment advisory fees” on the Statement of Operations. During the year ended June 30, 2019, the Manager received securities lending fees of $3,854 for the securities lending activities of the Fund.
Distribution Plans
The Fund, except for the A and C Classes of the Fund, has adopted a “defensive” Distribution Plan (the “Plan”) in accordance with Rule12b-1 under the Act, pursuant to which no separate fees may be charged to the Fund for distribution purposes. However, the Plan authorizes the management fee received by the Manager and the investment advisors hired by the Manager to be used for distribution purposes. Under this Plan, the Fund does not intend to compensate the Manager or any other party, either directly or indirectly, for the distribution of Fund shares.
Separate Distribution Plans (the “Distribution Plans”) have been adopted pursuant to Rule 12b-1 under the Act for the A and C Classes of the Fund. Under the Distribution Plans, as compensation for distribution and shareholder servicing assistance, the Manager receives an annual fee of 0.25% of the average daily net assets of the A Class and 1.00% of the average daily net assets of the C Class. The fee will be payable without regard to whether the amount of the fee is more or less than the actual expenses incurred in a particular month by the Manager for distribution assistance.
Service Plans
The Manager and the Trust entered into a Service Plan that obligates the Manager to oversee additional shareholder servicing of the Investor, A, and C Classes of the Fund. As compensation for performing the duties required under the Service Plan, the Manager receives an annualized fee up to 0.25% of the average daily net assets of the A and C Classes, and up to 0.375% of the average daily net assets of the Investor Class of the Fund.
17
American Beacon ARK Transformational Innovation FundSM
Notes to Financial Statements
June 30, 2019
Sub-Transfer Agent Fees
The Manager has entered into agreements, which include servicing agreements, with financial intermediaries that provide recordkeeping, processing, shareholder communications and other services to customers of the intermediaries that hold positions in the Institutional and Y Classes of the Fund and has agreed to compensate the intermediaries for providing these services. Intermediaries transact with the Fund primarily through the use of omnibus accounts on behalf of its customers who hold positions in the Fund. Certain services would have been provided by the Fund’s transfer agent and other service providers if the shareholders’ accounts were maintained directly by the Fund’s transfer agent. Accordingly, the Fund, pursuant to Board approval, has agreed to reimburse the Manager for certainnon-distribution shareholder services provided by financial intermediaries for the Institutional and Y Classes. The reimbursement amounts(sub-transfer agent fees) paid to the Manager are subject to a fee limit of up to 0.10% of an intermediary’s average net assets in the Institutional and Y Classes on an annual basis. During the year ended June 30, 2019, thesub-transfer agent fees, as reflected in “Transfer agent fees” on the Statement of Operations, were as follows:
Fund | Sub-Transfer Agent Fees | |||
ARK Transformational Innovation | $ | 21,001 | ||
As of June 30, 2019, the Manager owed the Fund the following reimbursement ofsub-transfer agent fees, as reflected in “Transfer agent fees payable” on the Statement of Assets and Liabilities:
Fund | Reimbursement Sub-Transfer Agent Fees* | |||
ARK Transformational Innovation | $ | 297 | ||
* This balance is presented as a contra liability as of June 30, 2019.
Investments in Affiliated Funds
The Fund may invest in the American Beacon U.S. Government Money Market Select Fund (the “USG Select Fund”). Cash collateral received by the Fund in connection with securities lending may also be invested in the USG Select Fund. The Fund and the USG Select Fund have the same investment advisor and therefore, are considered to be affiliated. The Manager serves as investment advisor to the USG Select Fund and receives management fees and administrative fees totaling 0.10% of the average daily net assets of the USG Select Fund. During the year ended June 30, 2019, the Manager earned fees on the Fund’s direct investments and securities lending collateral investments in the USG Select Fund as shown below:
Fund | Direct Investments in USG Select Fund | Securities Lending Collateral Investments in USG Select Fund | Total | |||||||||
ARK Transformational Innovation | $ | 1,528 | $ | 2,982 | $ | 4,510 | ||||||
Interfund Credit Facility
Pursuant to an exemptive order issued by the SEC, the Fund, along with other registered investment companies having management contracts with the Manager, may participate in a credit facility whereby each fund, under certain conditions, is permitted to lend money directly to and borrow directly from other participating funds for temporary purposes. The interfund credit facility is advantageous to the funds because it provides added liquidity and eliminates the need to maintain higher cash balances to meet redemptions. This situation could arise when shareholder redemptions exceed anticipated volumes and certain funds have insufficient cash on hand to satisfy such redemptions or when sales of securities do not settle as expected, resulting in a cash shortfall for a fund. When a fund liquidates portfolio securities to meet redemption requests, they often do not receive payment in settlement for up to two days (or longer for certain foreign transactions). Redemption requests normally are
18
American Beacon ARK Transformational Innovation FundSM
Notes to Financial Statements
June 30, 2019
satisfied on the next business day. The credit facility provides a source of immediate, short-term liquidity pending settlement of the sale of portfolio securities. The credit facility is administered by a credit facility team consisting of professionals from the Manager’s asset management, compliance, and accounting areas who report the activities of the credit facility to the Board. During the year ended June 30, 2019, the Fund borrowed on average $1,055,587 for 2 days at an average interest rate of 2.91% with interest charges of $168. These amounts are recorded as “Other expenses” in the Statement of Operations.
Expense Reimbursement Plan
The Manager contractually agreed to reduce fees and/or reimburse expenses for the classes of the Fund to the extent that total operating expenses exceed the Fund’s expense cap. During the year ended June 30, 2019, the Manager waived and/or reimbursed expenses as follows:
| Expense Cap | Expiration of Reimbursed Expenses | |||||||||||||||||
Fund | Class | 7/1/2018 - 6/30/2019 | Reimbursed Expenses | (Recouped) Expenses | ||||||||||||||
ARK Transformational Innovation | Institutional | 0.99 | % | $ | 24,559 | $ | – | 2021-2022 | ||||||||||
ARK Transformational Innovation | Y | 1.09 | % | 156,077 | – | 2021-2022 | ||||||||||||
ARK Transformational Innovation | Investor | 1.37 | % | 58,724 | – | 2021-2022 | ||||||||||||
ARK Transformational Innovation | A | 1.39 | % | 8,752 | – | 2021-2022 | ||||||||||||
ARK Transformational Innovation | C | 2.14 | % | 5,602 | – | 2021-2022 | ||||||||||||
Of these amounts, $32,083 was disclosed as a receivable from the Manager on the Statement of Assets and Liabilities at June 30, 2019.
The Fund has adopted an Expense Reimbursement Plan whereby the Manager may seek repayment of such fee reductions and expense reimbursements. Under the policy, the Manager can be reimbursed by the Fund for any contractual or voluntary fee reductions or expense reimbursements if reimbursement to the Manager (a) occurs within three years from the date of the Manager’s waiver/reimbursement and (b) does not cause the Fund’s annual operating expenses to exceed the lesser of the contractual percentage limit in effect at the time of the waiver/reimbursement or time of recoupment. The reimbursed expenses listed above will expire in 2021-2022. The Fund did not record a liability for potential reimbursement due to the current assessment that a reimbursement is uncertain. The carryover of excess expenses potentially reimbursable to the Manager are as follows:
Fund | Recouped Expenses | Excess Expense Carryover | Expired Expense Carryover | Expiration of Reimbursed Expenses | ||||||||||||
ARK Transformational Innovation | $ | – | $ | 141,632 | $ | – | 2019-2020 | |||||||||
ARK Transformational Innovation | – | 468,018 | – | 2020-2021 | ||||||||||||
Sales Commissions
The Fund’s Distributor, Resolute Investment Distributors, Inc. (“RID” or “Distributor”), may receive a portion of Class A sales charges from broker dealers and it may be used to offset distribution related expenses. During the year ended June 30, 2019, RID collected $21,086 from the sale of Class A Shares of the Fund.
A CDSC of 0.50% will be deducted with respect to Class A Shares on certain purchases of $1,000,000 or more that are redeemed in whole or part within 18 months of purchase, unless waived as discussed in the Fund’s Prospectus. Any applicable CDSC will be 0.50% of the lesser of the original purchase price or the value of the redemption of the Class A Shares redeemed. During the year ended June 30, 2019, there were no CDSC fees collected for Class A Shares of the Fund.
A CDSC of 1.00% will be deducted with respect to Class C Shares redeemed within 12 months of purchase, unless waived as discussed in the Fund’s Prospectus. Any applicable CDSC will be 1.00% of the lesser of the original
19
American Beacon ARK Transformational Innovation FundSM
Notes to Financial Statements
June 30, 2019
purchase price or the value of the redemption of the Class C Shares redeemed. During the year ended June 30, 2019, CDSC fees of $2,150 were collected for Class C Shares of the Fund.
Trustee Fees and Expenses
As compensation for their service to the Trusts, each Trustee receives an annual retainer of $120,000, plus $10,000 for each Board meeting attended in person or via teleconference, $2,500 for attendance by Committee members at meetings of the Audit Committee and the Investment Committee, and $1,500 for attendance by Committee members at meetings of the Nominating and Governance Committee, plus reimbursement of reasonable expenses incurred in attending Board meetings, Committee meetings, and relevant educational seminars. The Trustees also may be compensated for attendance at special Board and/or Committee meetings from time to time. The Board Chair receives an additional annual retainer of $50,000 as well as a $2,500 fee each quarter for attendance at the committee meetings. The Chairpersons of the Audit Committee and the Investment Committee each receive an additional annual retainer of $25,000 and the Chairman of the Nominating and Governance Committee receives an additional annual retainer of $10,000. These expenses are allocated on a prorated basis to each fund of the Trusts according to its respective net assets.
3. Security Valuation and Fair Value Measurements
The price of the Fund’s shares is based on its net asset value (“NAV”) per share. The Fund’s NAV is computed by adding total assets, subtracting all the Fund’s liabilities, and dividing the result by the total number of shares outstanding.
The NAV of each class of the Fund’s shares is determined based on a pro rata allocation of the Fund’s investment income, expenses and total capital gains and losses. The Fund’s NAV per share is determined each business day as of the regular close of trading on the New York Stock Exchange (“NYSE” or “Exchange”), which is typically 4:00 p.m. Eastern Time (“ET”). However, if trading on the NYSE closes at a time other than 4:00 p.m. ET, the Fund’s NAV per share typically would still be determined as of the regular close of trading on the NYSE. The Fund does not price its shares on days that the NYSE is closed. Foreign exchanges may permit trading in foreign securities on days when the Fund is not open for business, which may result in the value of the Fund’s portfolio investments being affected at a time when you are unable to buy or sell shares.
Equity securities, including shares ofclosed-end funds and exchange-traded funds (“ETFs”), are valued at the last sale price or official closing price taken from the primary exchange in which each security trades. Investments in other mutual funds are valued at the closing NAV per share on the day of valuation. Debt securities are valued at bid quotes from broker/dealers or evaluated bid prices from pricing services, who may consider a number of inputs and factors, such as prices of comparable securities, yield curves, spreads, credit ratings, coupon rates, maturity, default rates, and underlying collateral. Futures are valued based on their daily settlement prices. Exchange-traded andover-the-counter (“OTC”) options are valued at the last sale price. Options with no last sale for the day are priced at mid quote. Swaps are valued at evaluated mid prices from pricing services.
The valuation of securities traded on foreign markets and certain fixed income securities will generally be based on prices determined as of the earlier closing time of the markets on which they primarily trade unless a significant event has occurred. When the Fund holds securities or other assets that are denominated in a foreign currency, the Fund will normally use the currency exchange rates as of 4:00 p.m. ET.
Securities may be valued at fair value, as determined in good faith and pursuant to procedures approved by the Board, under certain limited circumstances. For example, fair value pricing will be used when market quotations are not readily available or reliable, as determined by the Manager, such as when (i) trading for a security is restricted or stopped; (ii) a security’s trading market is closed (other than customary closings); or (iii) a security has beende-listed from a national exchange. A security with limited market liquidity may require fair value pricing if the Manager determines that the available price does not reflect the security’s true market value.
20
American Beacon ARK Transformational Innovation FundSM
Notes to Financial Statements
June 30, 2019
In addition, if a significant event that the Manager determines to affect the value of one or more securities held by the Fund occurs after the close of a related exchange but before the determination of the Fund’s NAV, fair value pricing may be used on the affected security or securities. Securities of small-capitalization companies are also more likely to require a fair value determination using these procedures because they are more thinly traded and less liquid than the securities of larger-capitalization companies. The Fund may fair value securities as a result of significant events occurring after the close of the foreign markets in which the Fund invests as described below. In addition, the Fund may invest in illiquid securities requiring these procedures.
The Fund may use fair value pricing for securities primarily traded innon-U.S. markets because most foreign markets close well before the Fund’s pricing time of 4:00 p.m. ET. The earlier close of these foreign markets gives rise to the possibility that significant events, including broad market moves, may have occurred in the interim and may materially affect the value of those securities. If the Manager determines that the last quoted prices ofnon-U.S. securities will, in its judgment, materially affect the value of some or all its portfolio securities, the Manager can adjust the previous closing prices to reflect what it believes to be the fair value of the securities as of the close of the Exchange. In deciding whether it is necessary to adjust closing prices to reflect fair value, the Manager reviews a variety of factors, including developments in foreign markets, the performance of U.S. securities markets, and the performance of instruments trading in U.S. markets that represent foreign securities and baskets of foreign securities. These securities are fair valued using a pricing service, using methods approved by the Board, that considers the correlation of the trading patterns of the foreign security to intraday trading in the U.S. markets, based on indices of domestic securities and other appropriate indicators such as prices of relevant American Depositary Receipts (“ADRs”) and futures contracts. The Valuation Committee, established by the Board, may also fair value securities in other situations, such as when a particular foreign market is closed but the Fund is open. The Fund uses outside pricing services to provide closing prices and information to evaluate and/or adjust those prices. As a means of evaluating its security valuation process, the Valuation Committee routinely compares closing prices, the next day’s opening prices in the same markets and adjusted prices.
Attempts to determine the fair value of securities introduce an element of subjectivity to the pricing of securities. As a result, the price of a security determined through fair valuation techniques may differ from the price quoted or published by other sources and may not accurately reflect the market value of the security when trading resumes. If a reliable market quotation becomes available for a security formerly valued through fair valuation techniques, the Manager compares the new market quotation to the fair value price to evaluate the effectiveness of the Fund’s fair valuation procedures. If any significant discrepancies are found, the Manager may adjust the Fund’s fair valuation procedures.
Valuation Inputs
Various inputs may be used to determine the fair value of the Fund’s investments. These inputs are summarized in three broad levels for financial statement purposes. The inputs or methodologies used to value securities are not necessarily an indication of the risk associated with investing in those securities.
| Level 1 | - | Quoted prices in active markets for identical securities. | ||
| Level 2 | - | Prices determined using other significant observable inputs. These may include quoted prices for similar securities, interest rates, prepayment speeds, credit risk, and others. | ||
| Level 3 | - | Prices determined using other significant unobservable inputs. Unobservable inputs reflect the Fund’s own assumptions about the factors market participants would use in pricing an investment. | ||
Level 1 and Level 2 trading assets and trading liabilities, at fair value
Common stocks, ETFs, and financial derivative instruments, such as futures contracts or options that are traded on a national securities exchange, are stated at the last reported sale or settlement price on the day of valuation. To the extent these securities are actively traded and valuation adjustments are not applied, they are categorized as Level 1 of the fair value hierarchy. Valuation adjustments may be applied to certain securities that
21
American Beacon ARK Transformational Innovation FundSM
Notes to Financial Statements
June 30, 2019
are solely traded on a foreign exchange to account for the market movement between the close of the foreign market and the close of the Exchange. These securities are valued using pricing service providers that consider the correlation of the trading patterns of the foreign security to the intraday trading in the U.S. markets for investments. Securities using these valuation adjustments are categorized as Level 2 of the fair value hierarchy.
Investments in registeredopen-end investment management companies will be valued based upon the NAVs of such investments and are categorized as Level 1 of the fair value hierarchy.
4. Securities and Other Investments
American Depositary Receipts
ADRs are depositary receipts for foreign issuers in registered form traded in U.S. securities markets. Depositary receipts may not be denominated in the same currency as the securities into which they may be converted. Investing in depositary receipts entails substantially the same risks as direct investment in foreign securities. There is generally less publicly available information about foreign companies and there may be less governmental regulation and supervision of foreign stock exchanges, brokers, and listed companies. In addition, such companies may use different accounting and financial standards (and certain currencies may become unavailable for transfer from a foreign currency), resulting in the Fund’s possible inability to convert immediately into U.S. currency proceeds realized upon the sale of portfolio securities of the affected foreign companies. In addition, the Fund may invest in unsponsored depositary receipts, the issuers of which are not obligated to disclose material information about the underlying securities to investors in the United States. Ownership of unsponsored depositary receipts may not entitle the Fund to the same benefits and rights as ownership of a sponsored depositary receipt or the underlying security.
Common Stock
Common stock generally takes the form of shares in a corporation which represent an ownership interest. It ranks below preferred stock and debt securities in claims for dividends and for assets of the company in a liquidation or bankruptcy. The value of a company’s common stock may fall as a result of factors directly relating to that company, such as decisions made by its management or decreased demand for the company’s products or services. A stock’s value may also decline because of factors affecting not just the company, but also companies in the same industry or sector. The price of a company’s stock may also be affected by changes in financial markets that are relatively unrelated to the company, such as changes in interest rates, currency exchange rates or industry regulation. Companies that elect to pay dividends on their common stock generally only do so after they invest in their own business and make required payments to bondholders and on other debt and preferred stock. Therefore, the value of a company’s common stock will usually be more volatile than its bonds, other debt and preferred stock. Common stock may be exchange-traded or OTC. OTC stock may be less liquid than exchange-traded stock.
Foreign Securities
The Fund may invest in securities of foreign issuers. Foreign issuers are issuers organized and doing business principally outside the United States and include corporations, banks,non-U.S. governments, and quasi-governmental organizations. While investments in foreign securities are intended to reduce risk by providing further diversification, such investments involve sovereign and other risks, in addition to the credit and market risks normally associated with domestic securities. These additional risks include the possibility of adverse political and economic developments (including political or social instability, nationalization, expropriation, or confiscatory taxation); the potentially adverse effects of unavailability of public information regarding issuers, less governmental supervision and regulation of financial markets, reduced liquidity of certain financial markets, and the lack of uniform accounting, auditing, and financial reporting standards or the application of standards that are different or less stringent than those applied in the United States; different laws and customs governing securities tracking; and possibly limited access to the courts to enforce the Fund’s rights as an investor.
22
American Beacon ARK Transformational Innovation FundSM
Notes to Financial Statements
June 30, 2019
Other Investment Company Securities and Other Exchange-Traded Products
The Fund may invest in shares of other investment companies, includingopen-end funds,closed-end funds, business development companies, ETFs, unit investment trusts, and other investment companies of the Trust. The Fund may invest in investment company securities advised by the Manager or asub-advisor. Investments in the securities of other investment companies may involve duplication of advisory fees and certain other expenses. By investing in another investment company, the Fund becomes a shareholder of that investment company. As a result, the Fund’s shareholders indirectly will bear the Fund’s proportionate share of the fees and expenses paid by shareholders of the other investment company, in addition to the fees and expenses the Fund’s shareholders directly bear in connection with the Fund’s own operations. These other fees and expenses are reflected as Acquired Fund Fees and Expenses and are included in the Fees and Expenses Table for the Fund in its Prospectus, if applicable. Investments in other investment companies may involve the payment of substantial premiums above the value of such issuer’s portfolio securities.
5. Principal Risks
Investing in the Fund may involve certain risks including, but not limited to, those described below.
Asset Selection Risk
Assets selected by thesub-advisor or the Manager for the Fund may not perform to expectations. Thesub-advisor’s investment models may rely in part on data derived from third parties and may not perform as intended. This could result in the Fund’s underperformance compared to other funds with similar investment objectives.
Currency Risk
The Fund may have exposure to foreign currencies by investing in securities denominated innon-U.S. currencies or in securities denominated innon-U.S. currencies, purchasing or selling forward currency exchange contracts innon-U.S. currencies,non-U.S. currency futures contracts, options onnon-U.S. currencies andnon-U.S. currency futures and swaps for cross-currency investments. Foreign currencies may decline in value relative to the U.S. dollar, or, in the case of hedging positions, the U.S. dollar may decline in value relative to the currency being hedged, and thereby affect the Fund’s investments in foreign(non-U.S.) currencies or in securities that trade in, and receive revenues in, or in derivatives that provide exposure to, foreign(non-U.S.) currencies. Currency exchange rates may fluctuate significantly over short periods of time for a number of reasons, including changes in interest rates, intervention (or the failure to intervene) by U.S. or foreign governments, central banks or supranational entities such as the International Monetary Fund, or by the imposition of currency controls or other political developments in the United States or abroad. As a result, the Fund’s investments in foreign currency denominated securities may reduce the returns of the Fund. Currency futures, forwards, options or swaps may not always work as intended, and in specific cases the Fund may be worse off than if it had not used such instrument(s). There may not always be suitable hedging instruments available. Even where suitable hedging instruments are available, the Fund may choose to not hedge its currency risks.
Equity Investments Risk
Equity securities are subject to investment and market risk. The Fund’s investments in equity securities may include common stocks. Investing in such securities may expose the funds to additional risk. The value of a company’s common stock may fall as a result of factors affecting the company, companies in the same industry or sector, or the financial markets overall. Common stock generally is subordinate to preferred stock upon the liquidation or bankruptcy of the issuing company.
23
American Beacon ARK Transformational Innovation FundSM
Notes to Financial Statements
June 30, 2019
Foreign Investing Risk
Non-U.S. investments carry potential risks not associated with U.S. investments. Such risks include, but are not limited to: (1) currency exchange rate fluctuations, (2) political and financial instability, (3) less liquidity and greater volatility, (4) lack of uniform accounting, auditing and financial reporting standards, (5) increased price volatility, (6) less government regulation and supervision of foreign stock exchanges, brokers and listed companies, and (7) delays in transaction settlement in some foreign markets.
Market Risk
Conditions in the U.S. and many foreign economies have resulted, and may continue to result, in certain instruments experiencing unusual liquidity issues, increased price volatility and, in some cases, credit downgrades and increased likelihood of default. These events have reduced the willingness and ability of some lenders to extend credit, and have made it more difficult for some borrowers to obtain financing on attractive terms, if at all. In some cases, traditional market participants have been less willing to make a market in some types of debt instruments, which has affected the liquidity of those instruments. During times of market turmoil, investors tend to look to the safety of securities issued or backed by the U.S. Treasury, causing the prices of these securities to rise and the yields to decline. Reduced liquidity in fixed income and credit markets may negatively affect many issuers worldwide. In addition, global economies and financial markets are becoming increasingly interconnected, which increases the possibilities that conditions in one country or region might adversely impact issuers in a different country or region. A rise in protectionist trade policies, and the possibility of changes to some international trade agreements, could affect the economies of many nations in ways that cannot necessarily be foreseen at the present time.
In response to the financial crisis, the U.S. and other governments and the Federal Reserve and certain foreign central banks have taken steps to support financial markets. In some countries where economic conditions are recovering, they are nevertheless perceived as still fragile. Withdrawal of government support, failure of efforts in response to the crisis, or investor perception that such efforts are not succeeding, could adversely impact the value and liquidity of certain securities. The severity or duration of adverse economic conditions may also be affected by policy changes made by governments or quasi-governmental organizations, including changes in tax laws. The impact of new financial regulation legislation on the markets and the practical implications for market participants may not be fully known for some time. Regulatory changes are causing some financial services companies to exit long-standing lines of business, resulting in dislocations for other market participants. In addition, political and diplomatic events within the U.S. and abroad, such as the United States government’s inability at times to agree on a long-term budget and deficit reduction plan, the threat of a federal government shutdown and threats not to increase the federal government’s debt limit, may affect investor and consumer confidence and may adversely impact financial markets and the broader economy, perhaps suddenly and to a significant degree. The U.S. government has recently reduced the federal corporate income tax rates, and future legislative, regulatory and policy changes may result in more restrictions on international trade, less stringent prudential regulation of certain players in the financial markets, and significant new investments in infrastructure and national defense. Markets may react strongly to expectations about the changes in these policies, which could increase volatility, especially if the markets’ expectations for changes in government policies are not borne out.
Changes in market conditions will not have the same impact on all types of securities. Interest rates have been unusually low in recent years in the United States and abroad. Because there is little precedent for this situation, it is difficult to predict the impact of a significant rate increase on various markets. For example, because investors may buy securities or other investments with borrowed money, a significant increase in interest rates may cause a decline in the markets for those investments. Because of the sharp decline in the worldwide price of oil, there is a concern that oil producing nations may withdraw significant assets now held in U.S. Treasuries, which could force a substantial increase in interest rates. Regulators have expressed concern that rate increases may cause investors to sell fixed income securities faster than the market can absorb them, contributing to price volatility. In addition, there is a risk that the prices of goods and services in the U.S. and many foreign
24
American Beacon ARK Transformational Innovation FundSM
Notes to Financial Statements
June 30, 2019
economies may decline over time, known as deflation (the opposite of inflation). Deflation may have an adverse effect on stock prices and creditworthiness and may make defaults on debt more likely. If a country’s economy slips into a deflationary pattern, it could last for a prolonged period and may be difficult to reverse.
The precise details and the resulting impact of the United Kingdom’s vote to leave the European Union (the “EU”), commonly referred to as “Brexit,” are not yet known. The effect on the United Kingdom’s economy will likely depend on the nature of trade relations with the EU and other major economies following its exit, which are matters to be negotiated. The outcomes may cause increased volatility and have a significant adverse impact on world financial markets, other international trade agreements, and the United Kingdom and European economies, as well as the broader global economy for some time, which could significantly adversely affect the value of the Fund’s investments in the United Kingdom and Europe.
Non-Diversification Risk
The Fund isnon-diversified, which means the Fund may focus its investments in the securities of a comparatively small number of issuers. Investments in securities of a limited number of issuers exposes the Fund to greater market risk and potential losses than if assets were diversified among the securities of a greater number of issuers.
Other Investment Companies Risk
The Fund may invest in shares of other registered investment companies, including money market funds that are advised by the Manager. To the extent that the Fund invests in shares of other registered investment companies, the Fund will indirectly bear the fees and expenses, including for example advisory and administrative fees, charged by those investment companies in addition to the Fund’s direct fees and expenses and will be subject to the risks associated with investments in those companies. For example, the Fund’s investments in money market funds are subject to interest rate risk, credit risk, and market risk. The Fund must rely on the investment company in which it invests to achieve its investment objective. If the investment company fails to achieve its investment objective, the value of the Fund’s investment will decline, adversely affecting the Fund’s performance. To the extent the Fund invests in other investment companies that invest in equity securities, fixed income securities and/or foreign securities, or track an index, the Fund is subject to the risks associated with the underlying investments held by the investment company or the index fluctuations to which the investment company is subject.
Securities Lending Risk
A Fund may lend its portfolio securities to brokers, dealers and financial institutions to seek income. There is a risk that a borrower may default on its obligations to return loaned securities; however, a Fund’s securities lending agent indemnifies the Fund against that risk. There is a risk that the assets of a Fund’s securities lending agent may be insufficient to satisfy any contractual indemnification requirements to the Fund. Borrowers of a Fund’s securities typically provide collateral in the form of cash that is reinvested in securities. A Fund will be responsible for the risks associated with the investment of cash collateral, including any collateral invested in an affiliated money market fund. A Fund may lose money on its investment of cash collateral or may fail to earn sufficient income on its investment to meet obligations to the borrower. In addition, delays may occur in the recovery of securities from borrowers, which could interfere with a Fund’s ability to vote proxies or to settle transactions and there is the risk of possible loss of rights in the collateral should the borrower fail financially. In any case in which the loaned securities are not returned to the Fund before anex-dividend date, the payment in lieu of the dividend that the Fund receives from the securities’ borrower would not be treated as a dividend for federal income tax purposes and thus would not qualify for treatment as “qualified dividend income”.
25
American Beacon ARK Transformational Innovation FundSM
Notes to Financial Statements
June 30, 2019
Valuation Risk
This is the risk that the Fund has valued a security at a price different from the price at which it can be sold. This risk may be especially pronounced for investments, such as derivatives, which may be illiquid or which may become illiquid and for securities that trade in relatively thin markets and/or markets that experience extreme volatility. If market conditions make it difficult to value certain investments, the Fund may value these investments using more subjective methods, such as fair-value methodologies. Investors who purchase or redeem Fund shares on days when the Fund is holding fair-valued securities may receive fewer or more shares, or lower or higher redemption proceeds, than they would have received if the Fund had not fair-valued the securities or had used a different valuation methodology. The value of foreign securities, certain fixed-income securities and currencies, as applicable, may be materially affected by events after the close of the markets on which they are traded, but before the Fund determines its NAV. The Fund’s ability to value its investments in an accurate and timely manner may be impacted by technological issues and/or errors by third-party service providers, such as pricing services or accounting agents.
Offsetting Assets and Liabilities
The Fund is a party to enforceable master netting agreements between brokers and counterparties which provide for the right to offset under certain circumstances. The Fund employs multiple money managers and counterparties and has elected not to offset qualifying financial and derivative instruments on the Statement of Assets and Liabilities, as such all financial and derivative instruments are presented on a gross basis. The impacts of netting arrangements that provide the right to offset are detailed below, if applicable. The net amount represents the net receivable or payable that would be due from or to the counterparty in the event of default. Exposure from borrowings and other financing agreements such as repurchase agreements can only be netted across transactions governed by the same Master Agreement with the same legal entity. All amounts reported below represent the balance as of the report date, June 30, 2019.
| Remaining Contractual Maturity of the Agreements As of June 30, 2019 | ||||||||||||||||||||||||||||||||||||
| Overnight and Continuous | <30 days | Between 30 & 90 days |
| >90 days | Total | |||||||||||||||||||||||||||||||
Securities Lending Transactions |
| |||||||||||||||||||||||||||||||||||
Common Stocks | $ | 4,858,315 | $ | - | $ | - | $ | - | $ | 4,858,315 | ||||||||||||||||||||||||||
|
|
|
|
|
|
|
|
|
| |||||||||||||||||||||||||||
Total Borrowings | $ | 4,858,315 | $ | - | $ | - | $ | - | $ | 4,858,315 | ||||||||||||||||||||||||||
|
|
|
|
|
|
|
|
|
| |||||||||||||||||||||||||||
Gross amount of recognized liabilities for securities lending transactions |
| $ | 4,858,315 | |||||||||||||||||||||||||||||||||
|
| |||||||||||||||||||||||||||||||||||
6. Federal Income and Excise Taxes
It is the policy of the Fund to qualify as a RIC, by complying with all applicable provisions of Subchapter M of the Internal Revenue Code, as amended, and to make distributions of taxable income sufficient to relieve it from substantially all federal income and excise taxes. For federal income tax purposes, the Fund is treated as a single entity for the purpose of determining such qualification.
The Fund does not have any unrecorded tax liabilities in the accompanying financial statements. Each of the tax years in the three year period ended June 30, 2019 remain subject to examination by the Internal Revenue Service. If applicable, the Fund recognizes interest accrued related to unrecognized tax benefits in interest expense and penalties in “Other expenses” on the Statement of Operations.
The Fund may be subject to taxes imposed by countries in which it invests. Such taxes are generally based on returns of income earned or gains realized or repatriated. Taxes are accrued and applied to net investment income, net realized capital gains and net unrealized appreciation (depreciation), as applicable, as the income is earned or capital gains are recorded.
26
American Beacon ARK Transformational Innovation FundSM
Notes to Financial Statements
June 30, 2019
Dividends are categorized in accordance with income tax regulations which may treat certain transactions differently than U.S. GAAP. Accordingly, the character of distributions and composition of net assets for tax purposes may differ from those reflected in the accompanying financial statements.
The tax character of distributions paid were as follows:
| Year Ended June 30, 2019 | Year Ended June 30, 2018 | |||||||||||
Distributions paid from: | ||||||||||||
Ordinary income* | ||||||||||||
Institutional Class | $ | 50,634 | $ | 167,116 | ||||||||
Y Class | 271,960 | 100,684 | ||||||||||
Investor Class | 171,596 | 117,473 | ||||||||||
A Class** | - | - | ||||||||||
C Class** | - | - | ||||||||||
Long-term capital gains | ||||||||||||
Institutional Class | 91,644 | - | ||||||||||
Y Class | 492,226 | - | ||||||||||
Investor Class | 310,576 | - | ||||||||||
A Class** | - | - | ||||||||||
C Class** | - | - | ||||||||||
|
|
|
| |||||||||
Total distributions paid | $ | 1,388,636 | $ | 385,273 | ||||||||
|
|
|
| |||||||||
* For tax purposes, short-term capital gains are considered ordinary income distributions.
** Class commenced operations January 2, 2019.
As of June 30, 2019, the components of distributable earnings (deficits) on a tax basis were as follows:
Fund | Tax Cost | Unrealized Appreciation | Unrealized (Depreciation) | Net Unrealized Appreciation (Depreciation) | ||||||||||||||||||||||||
| ARK Transformational Innovation | $ | 50,825,219 | $ | 7,154,107 | $ | (2,969,786 | ) | $ | 4,184,321 | |||||||||||||||||||
Fund | Net Unrealized Appreciation (Depreciation) | Undistributed Ordinary Income | Undistributed Long-Term Capital Gains | Accumulated Capital and Other (Losses) | Other Temporary Differences | Distributable Earnings | ||||||||||||||||||||||||||||||||||||||
| ARK Transformational Innovation | $ | 4,184,321 | $ | 665,379 | $ | 1,478,997 | $ | - | $ | - | $ | 6,328,697 | ||||||||||||||||||||||||||||||||
Financial reporting records are adjusted for permanent book/tax differences to reflect tax character. Financial records are not adjusted for temporary differences. The temporary differences between financial reporting andtax-basis reporting of unrealized appreciation (depreciation) are attributable primarily to the tax deferral of losses from wash sales.
Due to inherent differences in the recognition of income, expenses, and realized gains (losses) under U.S. GAAP and federal income tax regulations, permanent differences between book and tax reporting have been identified and appropriately reclassified on the Statement of Assets and Liabilities.
Accordingly, the following amounts represent current year permanent differences derived from reclassification from investment subsidiary as of June 30, 2019:
Fund | Paid-In-Capital | Distributable Earnings/(Deficits) | ||||||||||
ARK Transformational Innovation | $ | (13,607 | ) | $ | 13,607 | |||||||
27
American Beacon ARK Transformational Innovation FundSM
Notes to Financial Statements
June 30, 2019
Under the Regulated Investment Company Modernization Act of 2010 (“RIC MOD”), net capital losses recognized by the Fund in taxable years beginning after December 22, 2010 are carried forward indefinitely and retain their character as short-term and/or long-term losses.
As of June 30, 2019, the Fund did not have any capital loss carryforwards.
7. Investment Transactions
The aggregate cost of purchases and proceeds from sales and maturities of investments, other than short-term obligations, for the year ended June 30, 2019 were as follows:
Fund | Purchases (non-U.S. Government Securities) | Sales (non-U.S. Government Securities) | ||||||||||
| ARK Transformational Innovation | $ | 41,564,673 | $ | 20,042,354 | ||||||||
A summary of the Fund’s transactions in the USG Select Fund for the year ended June 30, 2019 are as follows:
Fund | Type of Transaction | June 30, 2018 Shares/Fair Value | Purchases | Sales | June 30, 2019 Shares/Fair Value | Dividend Income | ||||||||||||||||||||||||||||||||||||
| ARK Transformational Innovation | Direct | $ | 741,158 | $ | 30,356,711 | $ | 29,412,897 | $ | 1,684,972 | $ | 34,018 | |||||||||||||||||||||||||||||||
| ARK Transformational Innovation | Securities Lending | 2,919,466 | 56,828,992 | 54,890,143 | 4,858,315 | N/A | ||||||||||||||||||||||||||||||||||||
8. Securities Lending
The Fund may lend its securities to qualified financial institutions, such as certain broker-dealers, to earn additional income. The borrowers are required to secure their loans continuously with collateral in an amount at least equal to the fair value of the securities loaned, initially in an amount at least equal to 102% of the fair value of domestic securities loaned and 105% of the fair value of international securities loaned. Collateral is monitored andmarked-to-market daily. Dailymark-to-market amounts are required to be paid to the borrower or received from the borrower by the end of the following business day. This one day settlement formark-to-market amounts may result in the collateral being temporarily less than the value of the securities on loan or temporarily more than the required minimum collateral.
To the extent that a loan is collateralized by cash, such cash collateral shall be invested by the securities lending agent (the “Agent”) in money market mutual funds and other short-term investments, provided the investments meet certain quality and diversification requirements. Securities purchased with cash collateral proceeds are listed in the Fund’s Schedule of Investments and the collateral is shown on the Statement of Assets and Liabilities as a payable.
Securities lending income is generated from the demand premium (if any) paid by the borrower to borrow a specific security and from the return on investment of cash collateral, reduced by negotiated rebate fees paid to the borrower and transaction costs. To the extent that a loan is secured bynon-cash collateral, securities lending income is generated as a demand premium reduced by transaction costs. The Fund, the Agent, and the Manager retained 80%, 10%, and 10%, respectively, of the income generated from securities lending.
While securities are on loan, the Fund continues to receive certain income associated with that security and any gain or loss in the market price that may occur during the term of the loan. In the case of domestic equities, the value of any dividend is received in the form of a substitute payment approximately equal to the dividend. In the case of foreign securities, a negotiated amount is received that is less than the actual dividend, but higher than the dividend amount minus the foreign tax that the Fund would be subject to on the dividend.
28
American Beacon ARK Transformational Innovation FundSM
Notes to Financial Statements
June 30, 2019
Securities lending transactions pose certain risks to the Fund, including that the borrower may not provide additional collateral when required or return the securities when due, that the value of the short-term investments will be less than the amount of cash collateral required to be returned to the borrower, thatnon-cash collateral may be subject to legal constraints in the event of a borrower bankruptcy, and that the cash collateral investments could become illiquid and unable to be used to return collateral to the borrower. The Fund could also experience delays and costs in gaining access to the collateral. The Fund bears the risk of any deficiency in the amount of the cash collateral available for return to the borrower and any action which impairs its ability to liquidatenon-cash collateral to satisfy a borrower default.
As of June 30, 2019, the value of outstanding securities on loan and the value of collateral were as follows:
Fund | Market Value of Securities on Loan | Cash Collateral Received | Non-Cash Collateral Received | Total Collateral Received | ||||||||||||
ARK Transformational Innovation | $ | 4,848,844 | $ | 4,858,315 | $ | – | $ | 4,858,315 | ||||||||
Cash collateral is listed on the Fund’s Schedule of Investments and is shown on the Statement of Assets and Liabilities. Income earned on these investments is included in “Income derived from securities lending” on the Statement of Operations.
Non-cash collateral received by the Fund may not be sold orre-pledged except to satisfy a borrower default. Therefore,non-cash collateral is not included on the Fund’s Schedule of Investments or Statement of Assets and Liabilities.
9. Borrowing Arrangements
Effective November 15, 2018 (the “Effective Date”), the Fund, along with certain other funds managed by the Manager (“Participating Funds”), entered into a committed revolving line of credit (the “Committed Line”) agreement with State Street Bank and Trust Company (the “Bank”) to be used to facilitate portfolio liquidity. The maximum borrowing amount under the Committed Line is $250 million with interest at a rate equal to the higher of(a) one-month London Inter-Bank Offered Rate (“LIBOR”) plus 1.25% per annum or (b) the Federal Funds rate plus 1.25% per annum on amounts borrowed. Each of the Participating Funds will pay a closing fee of $100,000 on the Effective Date and a quarterly commitment fee at a rate of 0.25% per annum on the unused portion of the Committed Line amount. The Committed Line expires November 14, 2019, unless extended by the Bank or terminated by the Participating Funds in accordance with the agreement.
On the Effective Date, the Fund, along with certain other Participating Funds managed by the Manager, also entered into an uncommitted discretionary demand revolving line of credit (the “Uncommitted Line”) agreement with the Bank to be used to facilitate portfolio liquidity. The maximum borrowing amount under the Uncommitted Line is $50 million with interest at a rate equal to the higher of(a) one-month LIBOR plus 1.25% per annum or (b) the Federal Funds rate plus 1.25% per annum on each outstanding loan. Each of the Participating Funds will pay a closing fee of $35,000 on the Effective Date. The Uncommitted Line expires November 14, 2019 unless extended by the Bank or terminated by the Participating Funds in accordance with the agreement.
The Participating Funds paid administration, legal and arrangement fees, which are recognized as a component of “Other expenses” on the Statement of Operations, along with commitment fees, that have been allocated among the Participating Funds based on average daily net assets.
During the year ended June 30, 2019, the Fund did not utilize this facility.
29
American Beacon ARK Transformational Innovation FundSM
Notes to Financial Statements
June 30, 2019
10. Capital Share Transactions
The tables below summarize the activity in capital shares for each Class of the Fund:
| Institutional Class | ||||||||||||||||||||||||||||
| Year Ended June 30, 2019 | Year Ended June 30, 2018 | |||||||||||||||||||||||||||
ARK Transformational Innovation Fund | Shares | Amount | Shares | Amount | ||||||||||||||||||||||||
| Shares sold | 40,549 | $ | 728,736 | 121,016 | $ | 2,224,632 | ||||||||||||||||||||||
| Reinvestment of dividends | 9,765 | 142,277 | 10,278 | 167,117 | ||||||||||||||||||||||||
| Shares redeemed | (317,709 | ) | (6,128,970 | ) | – | (3 | ) | |||||||||||||||||||||
|
|
|
|
|
|
|
| |||||||||||||||||||||
| Net increase (decrease) in shares outstanding | (267,395 | ) | $ | (5,257,957 | ) | 131,294 | $ | 2,391,746 | ||||||||||||||||||||
|
|
|
|
|
|
|
| |||||||||||||||||||||
| Y Class | ||||||||||||||||||||||||||||
| Year Ended June 30, 2019 | Year Ended June 30, 2018 | |||||||||||||||||||||||||||
ARK Transformational Innovation Fund | Shares | Amount | Shares | Amount | ||||||||||||||||||||||||
| Shares sold | 1,580,266 | $ | 27,393,997 | 542,353 | $ | 8,991,190 | ||||||||||||||||||||||
| Reinvestment of dividends | 52,436 | 762,415 | 6,000 | 97,436 | ||||||||||||||||||||||||
| Shares redeemed | (394,373 | ) | (6,778,738 | ) | (27,847 | ) | (457,807 | ) | ||||||||||||||||||||
|
|
|
|
|
|
|
| |||||||||||||||||||||
| Net increase in shares outstanding | 1,238,329 | $ | 21,377,674 | 520,506 | $ | 8,630,819 | ||||||||||||||||||||||
|
|
|
|
|
|
|
| |||||||||||||||||||||
| Investor Class | ||||||||||||||||||||||||||||
| Year Ended June 30, 2019 | Year Ended June 30, 2018 | |||||||||||||||||||||||||||
ARK Transformational Innovation Fund | Shares | Amount | Shares | Amount | ||||||||||||||||||||||||
| Shares sold | 600,909 | $ | 10,765,757 | 529,735 | $ | 8,818,260 | ||||||||||||||||||||||
| Reinvestment of dividends | 33,295 | 481,781 | 7,231 | 117,221 | ||||||||||||||||||||||||
| Shares redeemed | (501,964 | ) | (8,430,227 | ) | (247,935 | ) | (4,043,012 | ) | ||||||||||||||||||||
|
|
|
|
|
|
|
| |||||||||||||||||||||
| Net increase in shares outstanding | 132,240 | $ | 2,817,311 | 289,031 | $ | 4,892,469 | ||||||||||||||||||||||
|
|
|
|
|
|
|
| |||||||||||||||||||||
| A Class | ||||||||||||||||||||||||||||
| January 2, 2019A to June 30, 2019 | ||||||||||||||||||||||||||||
ARK Transformational Innovation Fund | Shares | Amount | ||||||||||||||||||||||||||
| Shares sold | 205,747 | $ | 3,588,662 | |||||||||||||||||||||||||
| Shares redeemed | (9,958 | ) | (178,778 | ) | ||||||||||||||||||||||||
|
|
|
| |||||||||||||||||||||||||
| Net increase in shares outstanding | 195,789 | $ | 3,409,884 | |||||||||||||||||||||||||
|
|
|
| |||||||||||||||||||||||||
| C Class | ||||||||||||||||||||||||||||
| January 2, 2019A to June 30, 2019 | ||||||||||||||||||||||||||||
ARK Transformational Innovation Fund | Shares | Amount | ||||||||||||||||||||||||||
| Shares sold | 114,562 | $ | 1,944,686 | |||||||||||||||||||||||||
| Shares redeemed | (17,036 | ) | (292,777 | ) | ||||||||||||||||||||||||
|
|
|
| |||||||||||||||||||||||||
| Net increase in shares outstanding | 97,526 | $ | 1,651,909 | |||||||||||||||||||||||||
|
|
|
| |||||||||||||||||||||||||
A Commencement of operations.
11. Subsequent Events
Management has evaluated subsequent events for possible recognition or disclosure in the financial statements through the date the financial statements are issued. Management has determined that there are no material events that would require disclosure in the Fund’s financial statements through this date.
30
American Beacon ARK Transformational Innovation FundSM
Financial Highlights
(For a share outstanding throughout the period)
| Institutional Class | ||||||||||||||||||||
| Year Ended June 30, | January 27, 2017A to June 30, 2017 | |||||||||||||||||||
| 2019 | 2018 | |||||||||||||||||||
|
| |||||||||||||||||||
Net asset value, beginning of period | $ | 18.60 | $ | 12.87 | $ | 10.00 | ||||||||||||||
|
|
|
|
|
| |||||||||||||||
Income (loss) from investment operations: | ||||||||||||||||||||
Net investment income (loss) | (0.29 | ) | 0.06 | (0.03 | ) | |||||||||||||||
Net gains on investments (both realized and unrealized) | 1.24 | 6.25 | 2.90 | |||||||||||||||||
|
|
|
|
|
| |||||||||||||||
Total income from investment operations | 0.95 | 6.31 | 2.87 | |||||||||||||||||
|
|
|
|
|
| |||||||||||||||
Less distributions: | ||||||||||||||||||||
Dividends from net investment income | - | (0.09 | ) | - | ||||||||||||||||
Distributions from net realized gains | (0.96 | ) | (0.49 | ) | - | |||||||||||||||
|
|
|
|
|
| |||||||||||||||
Total distributions | (0.96 | ) | (0.58 | ) | - | |||||||||||||||
|
|
|
|
|
| |||||||||||||||
Net asset value, end of period | $ | 18.59 | $ | 18.60 | $ | 12.87 | ||||||||||||||
|
|
|
|
|
| |||||||||||||||
Total returnB | 6.55 | % | 49.76 | % | 28.70 | %C | ||||||||||||||
|
|
|
|
|
| |||||||||||||||
Ratios and supplemental data: |
| |||||||||||||||||||
Net assets, end of period | $ | 2,674,638 | $ | 7,650,448 | $ | 3,603,636 | ||||||||||||||
Ratios to average net assets: | ||||||||||||||||||||
Expenses, before reimbursements | 1.74 | % | 4.74 | % | 10.29 | %D | ||||||||||||||
Expenses, net of reimbursementsE | 1.00 | % | 1.02 | % | 0.99 | %D | ||||||||||||||
Net investment (loss), before expense reimbursements | (1.42 | )% | (3.59 | )% | (10.01 | )%D | ||||||||||||||
Net investment income (loss), net of reimbursements | (0.68 | )% | 0.14 | % | (0.70 | )%D | ||||||||||||||
Portfolio turnover rate | 63 | % | 59 | % | 28 | %F | ||||||||||||||
| A | Commencement of operations. |
| B | Based on net asset value, which does not reflect the sales charge, redemption fee, or contingent deferred sales charge, if applicable. May include adjustments in accordance with U.S. GAAP and as such, the net asset value for reporting purposes and the returns based upon those net asset values may differ from the net asset value and returns for shareholder transactions. |
| C | Not annualized. |
| D | Annualized. |
| E | Expense ratios may exceed stated expense caps in Note 2 due to security lending expenses. |
| F | Portfolio turnover rate is for the period from January 27, 2017 through June 30, 2017 and is not annualized. |
See accompanying notes
31
American Beacon ARK Transformational Innovation FundSM
Financial Highlights
(For a share outstanding throughout the period)
| Y Class | ||||||||||||||||||||
| Year Ended June 30, | January 27, 2017A to June 30, 2017 | |||||||||||||||||||
| 2019 | 2018 | |||||||||||||||||||
|
| |||||||||||||||||||
Net asset value, beginning of period | $ | 18.57 | $ | 12.87 | $ | 10.00 | ||||||||||||||
|
|
|
|
|
| |||||||||||||||
Income (loss) from investment operations: | ||||||||||||||||||||
Net investment income (loss) | (0.06 | ) | (0.02 | )B | (0.03 | ) | ||||||||||||||
Net gains on investments (both realized and unrealized) | 0.99 | 6.30 | 2.90 | |||||||||||||||||
|
|
|
|
|
| |||||||||||||||
Total income from investment operations | 0.93 | 6.28 | 2.87 | |||||||||||||||||
|
|
|
|
|
| |||||||||||||||
Less distributions: | ||||||||||||||||||||
Dividends from net investment income | – | (0.09 | ) | – | ||||||||||||||||
Distributions from net realized gains | (0.96 | ) | (0.49 | ) | – | |||||||||||||||
|
|
|
|
|
| |||||||||||||||
Total distributions | (0.96 | ) | (0.58 | ) | – | |||||||||||||||
|
|
|
|
|
| |||||||||||||||
Net asset value, end of period | $ | 18.54 | $ | 18.57 | $ | 12.87 | ||||||||||||||
|
|
|
|
|
| |||||||||||||||
Total returnC | 6.45 | % | 49.52 | % | 28.70 | %D | ||||||||||||||
|
|
|
|
|
| |||||||||||||||
Ratios and supplemental data: |
| |||||||||||||||||||
Net assets, end of period | $ | 32,822,832 | $ | 9,887,450 | $ | 153,410 | ||||||||||||||
Ratios to average net assets: | ||||||||||||||||||||
Expenses, before reimbursements | 1.94 | % | 4.84 | % | 14.30 | %E | ||||||||||||||
Expenses, net of reimbursementsF | 1.10 | % | 1.12 | % | 1.09 | %E | ||||||||||||||
Net investment (loss), before expense reimbursements | (1.62 | )% | (3.85 | )% | (14.01 | )%E | ||||||||||||||
Net investment income (loss), net of reimbursements | (0.78 | )% | (0.13 | )% | (0.81 | )%E | ||||||||||||||
Portfolio turnover rate | 63 | % | 59 | % | 28 | %G | ||||||||||||||
| A | Commencement of operations. |
| B | Per share amounts have been calculated using the average shares method. |
| C | Based on net asset value, which does not reflect the sales charge, redemption fee, or contingent deferred sales charge, if applicable. May include adjustments in accordance with U.S. GAAP and as such, the net asset value for reporting purposes and the returns based upon those net asset values may differ from the net asset value and returns for shareholder transactions. |
| D | Not annualized. |
| E | Annualized. |
| F | Expense ratios may exceed stated expense caps in Note 2 due to security lending expenses. |
| G | Portfolio turnover rate is for the period from January 27, 2017 through June 30, 2017 and is not annualized. |
See accompanying notes
32
American Beacon ARK Transformational Innovation FundSM
Financial Highlights
(For a share outstanding throughout the period)
| Investor Class | ||||||||||||||||||||
| Year Ended June 30, | January 27, 2017A to June 30, 2017 | |||||||||||||||||||
| 2019 | 2018 | |||||||||||||||||||
|
| |||||||||||||||||||
Net asset value, beginning of period | $ | 18.51 | $ | 12.85 | $ | 10.00 | ||||||||||||||
|
|
|
|
|
| |||||||||||||||
Income (loss) from investment operations: | ||||||||||||||||||||
Net investment income (loss) | (0.17 | ) | (0.06 | )B | (0.02 | ) | ||||||||||||||
Net gains on investments (both realized and unrealized) | 1.04 | 6.30 | 2.87 | |||||||||||||||||
|
|
|
|
|
| |||||||||||||||
Total income from investment operations | 0.87 | 6.24 | 2.85 | |||||||||||||||||
|
|
|
|
|
| |||||||||||||||
Less distributions: | ||||||||||||||||||||
Dividends from net investment income | – | (0.09 | ) | – | ||||||||||||||||
Distributions from net realized gains | (0.96 | ) | (0.49 | ) | – | |||||||||||||||
|
|
|
|
|
| |||||||||||||||
Total distributions | (0.96 | ) | (0.58 | ) | – | |||||||||||||||
|
|
|
|
|
| |||||||||||||||
Net asset value, end of period | $ | 18.42 | $ | 18.51 | $ | 12.85 | ||||||||||||||
|
|
|
|
|
| |||||||||||||||
Total returnC | 6.13 | % | 49.28 | % | 28.50 | %D | ||||||||||||||
|
|
|
|
|
| |||||||||||||||
Ratios and supplemental data: |
| |||||||||||||||||||
Net assets, end of period | $ | 9,310,932 | $ | 6,910,383 | $ | 1,083,835 | ||||||||||||||
Ratios to average net assets: | ||||||||||||||||||||
Expenses, before reimbursements | 2.03 | % | 4.96 | % | 12.53 | %E | ||||||||||||||
Expenses, net of reimbursementsF | 1.38 | % | 1.40 | % | 1.37 | %E | ||||||||||||||
Net investment (loss), before expense reimbursements | (1.71 | )% | (3.92 | )% | (12.37 | )%E | ||||||||||||||
Net investment income (loss), net of reimbursements | (1.06 | )% | (0.36 | )% | (1.21 | )%E | ||||||||||||||
Portfolio turnover rate | 63 | % | 59 | % | 28 | %G | ||||||||||||||
| A | Commencement of operations. |
| B | Per share amounts have been calculated using the average shares method. |
| C | Based on net asset value, which does not reflect the sales charge, redemption fee, or contingent deferred sales charge, if applicable. May include adjustments in accordance with U.S. GAAP and as such, the net asset value for reporting purposes and the returns based upon those net asset values may differ from the net asset value and returns for shareholder transactions. |
| D | Not annualized. |
| E | Annualized. |
| F | Expense ratios may exceed stated expense caps in Note 2 due to security lending expenses. |
| G | Portfolio turnover rate is for the period from January 27, 2017 through June 30, 2017 and is not annualized. |
See accompanying notes
33
American Beacon ARK Transformational Innovation FundSM
Financial Highlights
(For a share outstanding throughout the period)
| A Class | ||||
| January 2, 2019A to June 30, 2019 | ||||
Net asset value, beginning of period | $ | 14.72 | ||
|
| |||
Income (loss) from investment operations: | ||||
Net investment (loss) | (0.05 | ) | ||
Net gains on investments (both realized and unrealized) | 3.75 | |||
|
| |||
Total income from investment operations | 3.70 | |||
|
| |||
Net asset value, end of period | $ | 18.42 | ||
|
| |||
Total returnB | 25.14 | %C | ||
|
| |||
Ratios and supplemental data: |
| |||
Net assets, end of period | $ | 3,606,814 | ||
Ratios to average net assets: | ||||
Expenses, before reimbursements | 2.31 | %D | ||
Expenses, net of reimbursementsE | 1.40 | %D | ||
Net investment (loss), before expense reimbursements | (2.00 | )%D | ||
Net investment (loss), net of reimbursements | (1.09 | )%D | ||
Portfolio turnover rate | 63 | % | ||
| A | Commencement of operations. |
| B | Based on net asset value, which does not reflect the sales charge, redemption fee, or contingent deferred sales charge, if applicable. May include adjustments in accordance with U.S. GAAP and as such, the net asset value for reporting purposes and the returns based upon those net asset values may differ from the net asset value and returns for shareholder transactions. |
| C | Not annualized. |
| D | Annualized. |
| E | Expense ratios may exceed stated expense caps in Note 2 due to security lending expenses. |
See accompanying notes
34
American Beacon ARK Transformational Innovation FundSM
Financial Highlights
(For a share outstanding throughout the period)
| C Class | ||||
| January 2, 2019A to June 30, 2019 | ||||
Net asset value, beginning of period | $ | 14.72 | ||
|
| |||
Income (loss) from investment operations: | ||||
Net investment (loss) | (0.10 | ) | ||
Net gains on investments (both realized and unrealized) | 3.73 | |||
|
| |||
Total income from investment operations | 3.63 | |||
|
| |||
Net asset value, end of period | $ | 18.35 | ||
|
| |||
Total returnB | 24.66 | %C | ||
|
| |||
Ratios and supplemental data: |
| |||
Net assets, end of period | $ | 1,790,079 | ||
Ratios to average net assets: | ||||
Expenses, before reimbursements | 3.25 | %D | ||
Expenses, net of reimbursementsE | 2.15 | %D | ||
Net investment (loss), before expense reimbursements | (2.94 | )%D | ||
Net investment (loss), net of reimbursements | (1.83 | )%D | ||
Portfolio turnover rate | 63 | % | ||
| A | Commencement of operations. |
| B | Based on net asset value, which does not reflect the sales charge, redemption fee, or contingent deferred sales charge, if applicable. May include adjustments in accordance with U.S. GAAP and as such, the net asset value for reporting purposes and the returns based upon those net asset values may differ from the net asset value and returns for shareholder transactions. |
| C | Not annualized. |
| D | Annualized. |
| E | Expense ratios may exceed stated expense caps in Note 2 due to security lending expenses. |
See accompanying notes
35
American Beacon ARK Transformational Innovation FundSM
June 30, 2019 (Unaudited)
Certain tax information regarding the Funds are required to be provided to shareholders based upon the Fund’s income and distributions for the taxable year ended June 30, 2019. The information and distributions reported herein may differ from information and distributions taxable to the shareholders for the calendar year ended December 31, 2018.
The Fund designated the following items with regard to distributions paid during the fiscal year ended June 30, 2019. All designations are based on financial information available as of this annual report and, accordingly, are subject to change. For each item, it is the intention of the Funds to designate the maximum amount permitted under the Internal Revenue Code of 1986, as amended, and the regulations there under.
Corporate Dividends-Received Deduction:
ARK Transformational Innovation | 3.58 | % |
Qualified Dividend Income:
ARK Transformational Innovation | 6.55 | % |
Long-Term Capital Gain Distributions:
ARK Transformational Innovation | $ | 894,446 |
Short-Term Capital Gain Distributions:
ARK Transformational Innovation | $ | 494,190 |
Shareholders will receive notification in January 2020 of the applicable tax information necessary to prepare their 2019 income tax returns.
36
Disclosure Regarding Approval of the Management and Investment Advisory Agreements(Unaudited)
At in-person meetings held on May 9, 2019 and June 4-5, 2019 (collectively, the “Meetings”), the Board of Trustees (“Board” or “Trustees”) considered and then, at its June 5, 2019 meeting, approved the renewal of:
(1) the Management Agreement between American Beacon Advisors, Inc. (“Manager”) and the American Beacon Funds (“Trust”), on behalf of the American Beacon ARK Transformational Innovation Fund (“Fund”); and
(2) the Investment Advisory Agreement among the Manager, ARK Investment Management LLC (the “subadvisor”), and the Trust, on behalf of the Fund.
The Management Agreement and the Investment Advisory Agreement are referred to herein individually as an “Agreement” and collectively as the “Agreements.” In preparation for its consideration of the renewal of the Agreements, the Board undertook steps to gather and consider information furnished by the Manager, the subadvisor, Broadridge, Inc. (“Broadridge”) and Morningstar, Inc. (“Morningstar”). The Board, with the assistance of independent legal counsel, requested and received certain relevant information from the Manager and the subadvisor.
In advance of the Meetings, the Board’s Investment Committee and/or the Manager coordinated the production of information from Broadridge and Morningstar regarding the performance, fees and expenses of the Fund as well as information from the Manager and the subadvisor. At the Meetings, the Board considered the information provided in connection with the renewal process, as well as information furnished to the Board throughout the year at regular meetings of the Board and its committees. In connection with the Board’s consideration of the Agreements, the Board received and evaluated such information as they deemed necessary. This information is described below in the section summarizing the factors the Board considered in connection with its renewal and approval of the Agreements, as well as the section describing additional Board considerations with respect to the Fund.
The Board noted that the Manager provides management and administrative services to the Fund pursuant to the Management Agreement. The Board considered that many mutual funds have separate contracts governing each type of service and observed that, with respect to such mutual funds, the actual management fee rates provided by Broadridge for peer group funds reflect the combined advisory and administrative expenses, reduced by any fee waivers and/or reimbursements.
A firm may not have been able to, or opted not to, provide information in response to certain information requests, in which case the Board conducted its evaluation of the firm based on information that was provided. In such cases, the Board determined that the omission of any such information was not material to its considerations. The class of shares used for comparative performance purposes was the share class with the lowest expenses available for purchase by the general public, which was the Institutional Class. The Board also considered that the use of Institutional Class performance generally facilitates a meaningful comparison for expense and performance purposes.
Provided below is an overview of certain factors the Board considered in connection with its renewal and approval of the Agreements. The Board did not identify any particular information that was most relevant to its consideration to renew or approve each Agreement, and each Trustee may have afforded different weight to the various factors. Legal counsel to the independent Trustees provided the Board with a memorandum regarding its responsibilities pertaining to the renewal and approval of investment advisory contracts, such as the Agreements. The memorandum explained the regulatory requirements surrounding the Board’s process for evaluating investment advisors and the terms of investment advisory contracts. Based on its evaluation, the Board unanimously concluded that the terms of each Agreement were reasonable and fair and that the renewal and approval of each Agreement was in the best interests of the Fund and its shareholders.
37
Disclosure Regarding Approval of the Management and Investment Advisory Agreements(Unaudited)
Considerations With Respect to the Renewal of the Management Agreement and the Investment Advisory Agreement
In determining whether to renew the Agreements, the Board considered the Fund’s investment management and subadvisory relationships separately. In each instance, the Board considered, among other things, the following factors: (1) the nature, extent and quality of the services provided; (2) the investment performance of the Fund; (3) the costs incurred by the Manager and the subadvisor in rendering services to the Fund and their resulting profits or losses; (4) comparisons of services and fee rates with contracts entered into by the Manager or the subadvisor or their affiliates with other clients (such as pension funds and other institutional clients); (5) the extent to which economies of scale, if any, have been taken into account in setting each fee rate schedule; (6) whether fee rate levels reflect economies of scale, if any, for the benefit of Fund investors; and (7) any other benefits derived or anticipated to be derived by the Manager or the subadvisor from their relationships with the Fund.
Nature, Extent and Quality of Services.With respect to the renewal of the Management Agreement, the Board considered, among other factors: the Fund’s performance since its inception on January 27, 2017; the length of service of key investment personnel at the Manager; the cost structure of the Fund; the Manager’s culture of compliance and support that reduce risks to the Fund; the Manager’s quality of services; the Manager’s active role in monitoring and, as appropriate, recommending additional or replacement subadvisors; and the Manager’s efforts to retain key employees and maintain staffing levels.
With respect to the renewal of the Investment Advisory Agreement, the Board considered the level of staffing and the size of the subadvisor. The Board also considered the adequacy of the resources committed to the Fund by the subadvisor, and whether those resources were commensurate with the needs of the Fund and are sufficient to sustain appropriate levels of performance and compliance needs. In this regard, the Board considered the financial stability of the subadvisor. The Board also considered the subadvisor’s representations regarding its compliance program and code of ethics. Based on the foregoing information, the Board concluded that the nature, extent and quality of the management and advisory services provided by the Manager and the subadvisor were appropriate for the Fund.
Investment Performance.The Board evaluated the comparative information provided by Broadridge and the Manager regarding the performance of the Fund relative to its Broadridge performance universe, Morningstar Category, and/or benchmark index, as well as the Fund’s Morningstar rating. The Board considered the information provided by Broadridge regarding Broadridge’s independent methodology for selecting the Fund’s Broadridge performance universe. The Board also considered that the performance universes selected by Broadridge may not provide appropriate comparisons for the Fund. In addition, the Board considered the performance reports and discussions with management at Board and Committee meetings throughout the year. The Board also evaluated the comparative information provided by the subadvisor regarding the performance of the Fund relative to the Fund’s benchmark index and a composite of similar accounts. In addition, the Board considered the Manager’s recommendation to continue to retain the subadvisor. A discussion regarding the Board’s considerations with respect to the Fund’s performance appears below under “Additional Considerations and Conclusions with Respect to the Fund.”
Costs of the Services Provided to the Fund and the Profits Realized by the Manager from its Relationship with the Fund.In analyzing the cost of services and profitability of the Manager, the Board considered the revenues earned and the expenses incurred by the Manager, before and after the payment of distribution-related expenses by the Manager. The profits or losses were noted at both an aggregate level for all funds within the group of mutual funds sponsored by the Manager (the “Fund Complex”) and at an individual Fund level, with the Manager sustaining a loss before and after the payment of distribution-related expenses by the Manager for the Fund. The Board also considered comparative information provided by the Manager regarding the Manager’s overall profitability with respect to the Fund Complex relative to the overall profitability of other firms in the mutual fund industry, as disclosed in publicly available sources. Although the Board noted that, in certain cases, the fee rates paid by other clients of the Manager are lower than the fee rates paid by the Fund, the Manager represented that, among other matters, the difference is attributable to the fact that the Manager does not perform administrative services for non-investment company clients and reflects the greater level of responsibility and regulatory requirements associated with managing the Fund.
38
Disclosure Regarding Approval of the Management and Investment Advisory Agreements(Unaudited)
The Board also noted that the Manager proposed to continue the expense waivers and reimbursements for the Fund that were in place during the last fiscal year. The Board further considered that, with respect to the Fund, the Management Agreement provides for the Manager to receive a management fee comprised of an annualized fee that is retained by the Manager. In addition, the Board considered that the Manager receives fees for overseeing the securities lending program on behalf of the Fund. The Board also noted that certain share classes of the Fund maintain higher expense ratios in order to compensate third-party financial intermediaries.
In analyzing the fee rates charged by the subadvisor in connection with its investment advisory services to the Fund, the Board considered representations made by the subadvisor that the Manager has negotiated the lowest fee rate that the subadvisor charges for any comparable client accounts. The Board also considered the cost of services and profitability of the subadvisor, noting that the subadvisor had represented that it had earned a profit with respect to the services that it provided to the Fund during the past year.
Based on the foregoing information, the Board concluded that the profitability levels of the Manager were reasonable in light of the services performed by the Manager and the profitability levels of the subadvisor were reasonable in light of the services performed by the subadvisor. A discussion regarding the Board’s considerations with respect to the Fund’s fee rates is set forth below under “Additional Considerations and Conclusions with Respect to the Fund.”
Economies of Scale. In considering the reasonableness of the management and investment advisory fees rates, the Board considered whether economies of scale will be realized as the Fund grows and whether fee rate levels reflect these economies of scale for the benefit of Fund shareholders. In this regard, the Board considered that the Manager has negotiated breakpoints for the subadvisory fee rate for the Fund.
In addition, the Board noted the Manager’s representation that the Management Agreement contains fee schedule breakpoints at higher asset levels with respect to the Fund. Based on the foregoing information, the Board concluded that the Manager and subadvisor fee rate schedules for the Fund provide for a reasonable sharing of benefits from any economies of scale with the Fund.
Benefits Derived from the Relationship with the Fund. The Board considered the “fall-out” or ancillary benefits that accrue to the Manager and/or the subadvisor as a result of the advisory relationships with the Fund, including greater exposure in the marketplace with respect to the Manager’s or the subadvisor’s investment process and expanding the level of assets under management by the Manager and the subadvisor. The Board also considered that the Manager may invest the Fund’s cash balances and cash collateral provided by the borrowers of the Fund’s securities in the American Beacon U.S. Government Money Market Select Fund, which the Manager manages directly. In addition, the Board noted that the subadvisor benefits from soft dollar arrangements for proprietary and/or third-party research. Based on the foregoing information, the Board concluded that the potential benefits accruing to the Manager and the subadvisor by virtue of their relationships with the Fund appear to be fair and reasonable.
Additional Considerations and Conclusions with Respect to the Fund
The performance comparisons below were made in comparison to the Fund’s Broadridge performance universe and Morningstar Category. With respect to the Broadridge performance universe, the 1st Quintile represents the top 20 percent of the universe based on performance and the 5th Quintile representing the bottom 20 percent of the universe based on performance. References below to the Fund’s Broadridge performance universe are to the universe of mutual funds with a comparable investment classification/objective included in the analysis provided by Broadridge.
39
Disclosure Regarding Approval of the Management and Investment Advisory Agreements(Unaudited)
The expense comparisons below were made in comparison to the Fund’s Broadridge expense universe and Broadridge expense group, with the 1st Quintile representing the lowest 20 percent of the universe or group based on lowest total expense and the 5th Quintile representing the highest 20 percent of the universe or group based on highest total expense. References below to the Fund’s expense group and expense universe are to the respective group or universe of comparable mutual funds included in the analysis by Broadridge. A Broadridge expense group consists of the Fund and a representative sample of funds with similar operating structures and asset sizes, as selected by Broadridge. A Broadridge expense universe includes all funds in the investment classification/objective with a similar operating structure as the share class of the Fund included in the Broadridge comparative information and provides a broader view of expenses across the Fund’s investment classification/objective. The Board also considered the Fund’s Morningstar fee level category. In reviewing expenses, the Board considered the positive impact of fee waivers where applicable and the Manager’s agreement to continue the fee waivers. In addition, information regarding the subadvisor’s use of soft dollars was requested from the Manager and was considered by the Board.
In considering the renewal of the Management Agreement and the Investment Advisory Agreement with the subadvisor for the Fund, the Board considered the following additional factors:
Broadridge Total Expense Analysis Excluding 12b-1 Fees and Morningstar Fee Level Ranking
| Compared to Broadridge Expense Group | 5th Quintile | |
| Compared to Broadridge Expense Universe | 5thQuintile | |
| Morningstar Fee Level Ranking – Institutional Class | Average Expense Ratio | |
Broadridge and Morningstar Performance Analysis (one-year period ended December 31, 2018)
| Compared to Broadridge Performance Universe | 3rd Quintile | |
| Compared to Morningstar Category | 3rd Quintile | |
The Board also considered: (1) information provided by the subadvisor regarding the fee rate charged for managing an account in the same or a similar strategy as the subadvisor manages the Fund; (2) that the subadvisor is an affiliate of the Manager; (3) the narrow dispersion in the Fund’s Broadridge expense group, that the Fund’s total expense ratio was slightly higher than the median, and that fixed expenses are proportionately higher for smaller funds; and (4) the Manager’s recommendation to continue to retain the subadvisor based upon, among other factors, the relatively brief period that this Fund has been in operation.
Based on these and other considerations, the Board: (1) concluded that the fees paid to the Manager and the subadvisor under the Management and Investment Advisory Agreements are fair and reasonable; and (2) determined that the Fund and its shareholders would benefit from the Manager’s and subadvisor’s continued management of the Fund.
40
Trustees and Officers of the American Beacon FundsSM(Unaudited)
The Trustees and officers of the American Beacon Funds (the “Trust”) are listed below, together with their principal occupations during the past five years. The address of each person listed below is 220 Las Colinas Boulevard East, Suite 1200, Irving, Texas 75039. Each Trustee oversees thirty-seven funds in the fund complex that includes the Trust, the American Beacon Select Funds, the American Beacon Institutional Funds Trust, the American Beacon Sound Point Enhanced Income Fund and the American Beacon Apollo Total Return Fund. The Trust’s Statement of Additional Information contains additional information about the Trustees and is available without charge by calling 1-800-658-5811.
Name, Age and Address | Position, Term of | Principal Occupation(s) During Past 5 Years and Current Directorships | ||
| INTERESTED TRUSTEES | Term | |||
Lifetime of Trust until removal, resignation or retirement* | ||||
| Alan D. Feld** (82) | Trustee since 1996 | Partner in the law firm of Akin, Gump, Strauss, Hauer & Feld, LLP (law firm) (1960-Present); Trustee, American Beacon Select Funds (1999-Present); Trustee, American Beacon Institutional Funds Trust (2017-Present); Trustee, American Beacon Sound Point Enhanced Income Fund (2018–Present); Trustee, American Beacon Apollo Total Return Fund (2018–Present). | ||
| NON-INTERESTED TRUSTEES | Term | |||
Lifetime of Trust until removal, resignation or retirement* | ||||
| Gilbert G. Alvarado (49) | Trustee since 2015 | Director, Kura MD, Inc. (local telehealth organization) (2015-present); Vice President & CFO, Sierra Health Foundation (health conversion private foundation) (2006-Present); Vice President & CFO, Sierra Health Foundation: Center for Health Program Management (California public benefit corporation) (2012-Present); Director, Innovative North State (2012-2015); Director, Sacramento Regional Technology Alliance (2011-2016); Director, Women’s Empowerment (2009-2014); Director, Valley Healthcare Staffing (2017–present); Trustee, American Beacon Select Funds (2015-Present); Trustee, American Beacon Institutional Funds Trust (2017-Present); Trustee, American Beacon Sound Point Enhanced Income Fund (2018–Present); Trustee, American Beacon Apollo Total Return Fund (2018–Present). | ||
| Joseph B. Armes (57) | Trustee since 2015 | Chairman & CEO, CSW Industrials f/k/a Capital Southwest Corporation (investment company) (2015-Present); Chairman of the Board of Capital Southwest Corporation, predecessor to CSW Industrials, Inc. (2014-2017) (investment company); CEO, Capital Southwest Corporation (2013-2015); President & CEO, JBA Investment Partners (family investment vehicle) (2010-Present); Director and Chair of Audit Committee, RSP Permian (oil and gas producer) (2013-Present); Trustee, American Beacon Select Funds (2015-Present); Trustee, American Beacon Institutional Funds Trust (2017-Present); Trustee, American Beacon Sound Point Enhanced Income Fund (2018–Present); Trustee, American Beacon Apollo Total Return Fund (2018–Present). | ||
| Gerard J. Arpey (60) | Trustee since 2012 | Director, The Home Depot, Inc. (2015-Present); Partner, Emerald Creek Group (private equity firm) (2011-Present); Director, S.C. Johnson & Son, Inc. (privately held company) (2008-present); Trustee, American Beacon Select Funds (2012-Present); Trustee, American Beacon Institutional Funds Trust (2017-Present); Trustee, American Beacon Sound Point Enhanced Income Fund (2018–Present); Trustee, American Beacon Apollo Total Return Fund (2018–Present). | ||
41
Trustees and Officers of the American Beacon FundsSM(Unaudited)
Name, Age and Address | Position, Term of | Principal Occupation(s) During Past 5 Years and Current Directorships | ||
| NON-INTERESTED TRUSTEES (CONT.) | Term | |||
Lifetime of Trust until removal, resignation or retirement* | ||||
| Brenda A. Cline (58) | Trustee since 2004 Chair since 2019 Vice Chair 2018 | Chief Financial Officer, Treasurer and Secretary, Kimbell Art Foundation (1993-Present); Director, Tyler Technologies, Inc. (public sector software solutions company) (2014-Present); Director, Range Resources Corporation (oil and natural gas company) (2015-Present); Trustee, Cushing Closed-End and Open-End Funds and ETFs (2017-Present); Trustee, American Beacon Select Funds (2004-Present); Trustee, American Beacon Institutional Funds Trust (2017-Present); Trustee, American Beacon Sound Point Enhanced Income Fund (2018–Present); Trustee, American Beacon Apollo Total Return Fund (2018–Present). | ||
| Eugene J. Duffy (64) | Trustee since 2008 | Managing Director, Global Investment Management Distribution, Mesirow Financial (2016-Present); Managing Director, Institutional Services, Intercontinental Real Estate Corporation (2014-Present); Principal and Executive Vice President, Paradigm Asset Management (1994-2014); Trustee, American Beacon Select Funds (2008-Present); Trustee, American Beacon Institutional Funds Trust (2017-Present); Trustee, American Beacon Sound Point Enhanced Income Fund (2018–Present); Trustee, American Beacon Apollo Total Return Fund (2018–Present). | ||
| Claudia A. Holz (61) | Trustee since 2018 | Partner, KPMG LLP (1990–2017); Trustee, American Beacon Select Funds (2018-Present); Trustee, American Beacon Institutional Funds Trust (2018-Present); Trustee, American Beacon Sound Point Enhanced Income Fund (2018–Present); Trustee, American Beacon Apollo Total Return Fund (2018–Present). | ||
| Douglas A. Lindgren (57) | Trustee since 2018 | CEO North America, Carne Global Financial Services (2016-2017); Managing Director, IPS Investment Management and Global Head, Content Management, UBS Wealth Management (2010-2016); Trustee, American Beacon Select Funds (2018-Present); Trustee, American Beacon Institutional Funds Trust (2018-Present); Trustee, American Beacon Sound Point Enhanced Income Fund (2018–Present); Trustee, American Beacon Apollo Total Return Fund (2018–Present). | ||
| Richard A. Massman (75) | Trustee since 2004 Chair 2008-2018 Chair Emeritus since 2019 | Consultant and General Counsel Emeritus, Hunt Consolidated, Inc. (holding company engaged in oil and gas exploration and production, refining, real estate, farming, ranching and venture capital activities) (2009-Present); Trustee, American Beacon Select Funds (2004-Present); Trustee, American Beacon Institutional Funds Trust (2017-Present); Trustee, American Beacon Sound Point Enhanced Income Fund (2018–Present); Trustee, American Beacon Apollo Total Return Fund (2018–Present). | ||
| Barbara J. McKenna, CFA (56) | Trustee since 2012 | President/Managing Principal, Longfellow Investment Management Company (2005-Present); Trustee, American Beacon Select Funds (2012-Present); Trustee, American Beacon Institutional Funds Trust (2017-Present); Trustee, American Beacon Sound Point Enhanced Income Fund (2018–Present); Trustee, American Beacon Apollo Total Return Fund (2018–Present). | ||
| R. Gerald Turner (73) | Trustee since 2001 | President, Southern Methodist University (1995-Present); Director, J.C. Penney Company, Inc. (1996-Present); Director, Kronus Worldwide Inc. (chemical manufacturing) (2003-Present); Trustee, American Beacon Select Funds (2001-Present); Trustee, American Beacon Institutional Funds Trust (2017-Present); Trustee, American Beacon Sound Point Enhanced Income Fund (2018–Present); Trustee, American Beacon Apollo Total Return Fund (2018–Present). | ||
42
Trustees and Officers of the American Beacon FundsSM(Unaudited)
Name, Age and Address | Position, Term of | Principal Occupation(s) During Past 5 Years and Current Directorships | ||
| OFFICERS | Term | |||
| One Year | ||||
| Gene L. Needles, Jr. (64) | President since 2009 | President (2009-2018), CEO and Director (2009–Present), and Chairman (2018-Present), American Beacon Advisors, Inc., President (2015-2018), Director and CEO (2015–Present), and Chairman (2018-Present), Resolute Investment Holdings, LLC; President (2015-2018), Director and CEO (2015-Present), and Chairman (2018-Present), Resolute Topco, Inc.; President (2015-2018); Director, and CEO (2015-Present), and Chairman (2018-Present), Resolute Acquisition, Inc.; President (2015-2018), Director and CEO (2015-Present), Chairman (2018-Present), Resolute Investment Managers, Inc.; Director, Chairman, President and CEO, Resolute Investment Distributors (2017-Present); Director, Chairman, President and CEO; Resolute Investment Services, Inc. (2017-Present); President and CEO, Lighthouse Holdings Parent, Inc. (2009-2015); President, CEO and Director, Lighthouse Holdings, Inc. (2009-2015); Manager, President and CEO, American Private Equity Management, LLC (2012-Present); Director, Chairman, President and CEO, Alpha Quant Advisors, LLC (2016-Present); Director, ARK Investment Management LLC (2016-Present); Director, Shapiro Capital Management LLC (2017-Present); Director, Chairman and CEO, Continuous Capital, LLC (2018-Present); President, American Beacon Cayman Managed Futures Strategy Fund, Ltd. (2014-Present); Director and President, American Beacon Cayman Transformational Innovation Company, LTD., (2017-2018); President, American Beacon Delaware Transformational Innovation Corporation (2017-2018); President American Beacon Cayman TargetRisk Company, Ltd. (2018-Present); Member, Investment Advisory Committee, Employees Retirement System of Texas (2017-Present); Trustee, American Beacon NextShares Trust (2015-Present); President, American Beacon Select Funds (2009-Present); President, American Beacon Institutional Funds Trust (2017-Present); President, American Beacon Sound Point Enhanced Income Fund (2018-Present); President, American Beacon Apollo Total Return Fund (2018-Present); Director, RSW Investments Holdings LLC, (2019-Present); Director, SSI Investment Management, LLC (2019-Present). | ||
| Rosemary K. Behan (60) | VP, Secretary and Chief Legal Officer since 2006 | Vice President, Secretary and General Counsel, American Beacon Advisors, Inc. (2006-Present); Secretary, Resolute Investment Holdings, LLC (2015-Present); Secretary, Resolute Topco, Inc. (2015-Present); Secretary, Resolute Acquisition, Inc. (2015–Present); Vice President, Secretary and General Counsel, Resolute Investment Managers, Inc. (2015-Present); Secretary, Resolute Investment Distributors, Inc. (2017-Present); Vice President, Secretary and General Counsel, Resolute Investment Services, Inc. (2017-Present); Vice President and Secretary, Lighthouse Holdings Parent, Inc. (2008-2015); Vice President and Secretary, Lighthouse Holdings, Inc. (2008-2015); Secretary, American Private Equity Management, LLC (2008-Present); Secretary and General Counsel, Alpha Quant Advisors, LLC (2016-Present); Vice President and Secretary, Continuous Capital, LLC (2018-Present); Secretary, American Beacon Delaware Transformational Innovation Corporation (2017-2018); Secretary, American Beacon Cayman Transformational Innovation Company, Ltd. (2017-2018); Secretary, American Beacon Cayman Managed Futures Strategy Fund, Ltd. (2014-Present); Secretary, American Beacon Cayman TargetRisk Company, Ltd (2018-Present); Chief Legal Officer, Vice President and Secretary, American Beacon Select Funds (2006-Present); Chief Legal Officer, Vice President and Secretary, American Beacon Institutional Funds Trust (2017-Present); Chief Legal Officer, Vice President and Secretary, American Beacon Sound Point Enhanced Income Fund (2018-Present); Chief Legal Officer, Vice President and Secretary American Beacon Apollo Total Return Fund (2018-Present). | ||
43
Trustees and Officers of the American Beacon FundsSM(Unaudited)
Name, Age and Address | Position, Term of | Principal Occupation(s) During Past 5 Years and Current Directorships | ||
| OFFICERS (CONT.) | Term | |||
| One Year | ||||
| Brian E. Brett (59) | VP since 2004 | Senior Vice President, Head of Distribution (2012-Present), Vice President, Director of Sales (2004-2012), American Beacon Advisors, Inc.; Senior Vice President, Resolute Investment Managers, Inc. (2017-Present); Senior Vice President, Resolute Investment Distributors, Inc. (2018-Present), Senior Vice President, Resolute Investment Services, Inc. (2018-Present); Senior Vice President, Lighthouse Holdings Parent, Inc. (2008-2015); Senior Vice President, Lighthouse Holdings, Inc. (2008-2015); Vice President, American Beacon Select Funds (2004-Present); Vice President, American Beacon Institutional Funds Trust (2017-Present); Vice President American Beacon Sound Point Enhanced Income Fund (2018-Present); Vice President American Beacon Apollo Total Return Fund (2018-Present). | ||
| Paul B. Cavazos (50) | VP since 2016 | Chief Investment Officer and Senior Vice President, American Beacon Advisors, Inc. (2016-Present); Chief Investment Officer, DTE Energy (2007-2016); Vice President, American Private Equity Management, L.L.C. (2017–Present); Vice President, American Beacon Select Funds (2016-Present); Vice President, American Beacon Institutional Funds Trust (2017-Present); Vice President American Beacon Sound Point Enhanced Income Fund (2018-Present);Vice President American Beacon Apollo Total Return Fund (2018-Present). | ||
| Erica Duncan (48) | VP Since 2011 | Vice President, American Beacon Advisors, Inc. (2011-Present); Vice President, Resolute Investment Managers (2018-Present); Vice President, Resolute Investment Services, Inc. (2018-Present); Vice President, American Beacon Select Funds (2011-Present); Vice President, American Beacon Institutional Funds Trust (2017-Present); Vice President American Beacon Sound Point Enhanced Income Fund (2018-Present); Vice President American Beacon Apollo Total Return Fund (2018-Present). | ||
| Melinda G. Heika (58) | Treasurer since 2010 | Treasurer and CFO (2010-Present), American Beacon Advisors, Inc.; Treasurer, Resolute Topco, Inc. (2015-Present); Treasurer, Resolute Investment Holdings, LLC. (2015-Present); Treasurer, Resolute Acquisition, Inc. (2015-Present); Treasurer and CFO, Resolute Investment Managers, Inc. (2017-Present); Treasurer, Resolute Investment Distributors, Inc. (2017-2017); Treasurer and CFO, Resolute Investment Services, Inc. (2015-Present); Treasurer, Lighthouse Holdings Parent Inc., (2010-2015); Treasurer, Lighthouse Holdings, Inc. (2010-2015); Treasurer, American Private Equity Management, LLC (2012-Present); Treasurer and CFO, Alpha Quant Advisors, LLC (2016-Present); Treasurer and CFO, Continuous Capital, LLC (2018-Present); Treasurer, American Beacon Cayman Transformational Innovation, Ltd. (2017-2018); Treasurer, American Beacon Delaware Transformational Innovation Corporation (2017-2018); Director and Treasurer, American Beacon Cayman Managed Futures Strategy Fund, Ltd. (2014-Present); Treasurer, American Beacon Cayman TargetRisk Company, Ltd. (2018-Present); Treasurer, American Beacon Select Funds (2010-Present); Treasurer, American Beacon Institutional Funds Trust (2017-Present); Treasurer, American Beacon Sound Point Enhanced Income Fund (2018-Present); Treasurer, American Beacon Apollo Total Return Fund (2018-Present). | ||
| Terri L. McKinney (55) | VP since 2010 | Vice President (2009-Present), Managing Director (2003-2009), American Beacon Advisors, Inc.; Vice President, Resolute Investment Managers, Inc. (2017-Present); Vice President, Resolute Investment Services, Inc (2018-Present); Vice President, Alpha Quant Advisors, LLC (2016-Present); Vice President, Continuous Capital, LLC (2018-Present); Vice President, American Beacon Select Funds (2010-Present); Vice President, American Beacon Institutional Funds Trust (2017-Present); Vice President, American Beacon Sound Point Enhanced Income Fund (2018-Present); Vice President, American Beacon Apollo Total Return Fund (2018-Present). | ||
44
Trustees and Officers of the American Beacon FundsSM(Unaudited)
Name, Age and Address | Position, Term of | Principal Occupation(s) During Past 5 Years and Current Directorships | ||
| OFFICERS (CONT.) | Term | |||
| One Year | ||||
| Jeffrey K. Ringdahl (44) | VP since 2010 | Director (2015-Present), President (2018-Present), Chief Operating Officer (2010-Present), Senior Vice President (2013-2018), Vice President (2010-2013), American Beacon Advisors, Inc.; Director (2015-Present), President (2018-Present), Senior Vice Present (2015-2018), Resolute Investment Holdings, LLC; Director (2015-Present), President (2018-Present), Senior Vice President (2015-2018), Resolute Topco, Inc.; Director (2015-Present), President (2018-Present), Senior Vice President (2015-2018), Resolute Acquisition, Inc.; Director (2015-Present), President & COO (2018-Present), Senior Vice President (2015-2018), Resolute Investment Managers, Inc.; Director and Executive Vice President (2017-Present), Resolute Investment Distributors, Inc.; Director (2017-Present), President & COO (2018-Present), Executive Vice President (2017-2018), Resolute Investment Services, Inc.; Senior Vice President (2017-Present), Vice President (2012-2017), Manager (2015-Present), American Private Equity Management, LLC; Senior Vice President, Lighthouse Holdings Parent, Inc. (2013-2015); Senior Vice President, Lighthouse Holdings, Inc. (2013-2015); Trustee, American Beacon NextShares Trust (2015-Present); Director, Executive Vice President & COO, Alpha Quant Advisors, LLC (2016-Present); Director, Shapiro Capital Management, LLC (2017-Present); Director, Executive Vice President & COO, Continuous Capital, LLC (2018-Present); Director and Vice President, American Beacon Cayman Transformational Innovation Company, Ltd., (2017-Present); Vice President, American Beacon Delaware Transformational Innovation Corporation (2017-2018); Director and Vice President, American Beacon Cayman Managed Futures Strategy Fund, Ltd. (2014-Present); Vice President, American Beacon Cayman TargetRisk Company, Ltd (2018-Present); Vice President, American Beacon Select Funds (2010-2018); Vice President, American Beacon Institutional Funds Trust (2017-Present); Vice President, American Beacon Sound Point Enhanced Income Fund (2018-Present); Vice President, American Beacon Apollo Total Return Fund (2018-Present); Director, RSW Investments Holdings LLC, (2019-Present); Director, SSI Investment Management, LLC (2019-Present). | ||
| Samuel J. Silver (56) | VP Since 2011 | Vice President (2011-Present), Chief Fixed Income Officer (2016-Present), American Beacon Advisors, Inc. (2011-Present); Vice President, American Beacon Select Funds (2011-Present); Vice President, American Beacon Institutional Funds Trust (2017-Present); Vice President, American Beacon Sound Point Enhanced Income Fund (2018-Present); Vice President, American Beacon Apollo Total Return Fund (2018-Present). | ||
| Christina E. Sears (47) | Chief Compliance Officer since 2004 and Asst. Secretary since 1999 | Vice President, American Beacon Advisors, Inc. (2019-Present); Chief Compliance Officer, American Beacon Advisors, Inc. (2004-Present); Vice President, Resolute Investment Managers, Inc. (2017-Present); Vice President, Resolute Investment Distributors (2017-Present); Vice President, Resolute Investment Services, Inc. (2019-Present); Chief Compliance Officer, American Private Equity Management, LLC (2012-Present); Chief Compliance Officer (2016-2019) and Vice President, Alpha Quant Advisors, LLC (2016-Present); Vice President, Continuous Capital, LLC (2018-Present); Chief Compliance Officer (2004-Present) and Assistant Secretary (1999-Present), American Beacon Select Funds; Chief Compliance Officer and Assistant Secretary, American Beacon Institutional Funds Trust (2017-Present); Chief Compliance Officer and Assistant Secretary, American Beacon Sound Point Enhanced Income Fund (2018-Present); Chief Compliance Officer and Assistant Secretary, American Beacon Apollo Total Return Fund (2018-Present). | ||
45
Trustees and Officers of the American Beacon FundsSM(Unaudited)
Name, Age and Address | Position, Term of | Principal Occupation(s) During Past 5 Years and Current Directorships | ||
| OFFICERS (CONT.) | Term | |||
| One Year | ||||
| Sonia L. Bates (62) | Asst. Treasurer since 2011 | Assistant Treasurer, American Beacon Advisors, Inc. (2011-2018); Assistant Treasurer, Lighthouse Holdings Parent Inc. (2011-2015); Assistant Treasurer, Lighthouse Holdings, Inc. (2011-2015); Assistant Treasurer, American Private Equity Management, LLC (2012-Present); Assistant Treasurer, American Beacon Cayman Transformational Innovation Company, Ltd. (2017-Present); Assistant Treasurer, American Beacon Cayman TargetRisk Company, Ltd. (2018-Present); Assistant Treasurer, American Beacon Select Funds (2011-Present); Assistant Treasurer, American Beacon Institutional Funds Trust (2017-Present); Assistant Treasurer, American Beacon Sound Point Enhanced Income Fund (2018-Present); Assistant Treasurer, American Beacon Apollo Total Return Fund (2018-Present). | ||
| Shelley D. Abrahams (44) | Assistant Secretary since 2008 | Assistant Secretary, American Beacon Select Funds (2008-Present); Assistant Secretary, American Beacon Institutional Funds Trust (2017-Present); Assistant Secretary, American Beacon Sound Point Enhanced Income Fund (2018-Present); Assistant Secretary, American Beacon Apollo Total Return Fund (2018-Present). | ||
| Rebecca L. Harris (52) | Assistant Secretary since 2010 | Vice President, American Beacon Advisors, Inc. (2011-Present); Vice President, Resolute Investment Managers, Inc. (2017-Present); Vice President, Resolute Investment Services (2018-Present); Vice President, Alpha Quant Advisors, LLC (2016-Present); Vice President, Continuous Capital, LLC (2018-Present); Assistant Secretary, American Beacon Select Funds (2010-Present); Assistant Secretary, American Beacon Institutional Funds Trust (2017-Present); Assistant Secretary, American Beacon Sound Point Enhanced Income Fund (2018-Present); Assistant Secretary, American Beacon Apollo Total Return Fund (2018-Present). | ||
| Teresa A. Oxford (60) | Assistant Secretary since 2015 | Assistant Secretary, American Beacon Advisors, Inc. (2015-Present); Assistant Secretary, Resolute Investment Distributors (2018-Present); Assistant Secretary, Resolute Investment Services (2018-Present); Assistant Secretary, Alpha Quant Advisors, LLC (2016-Present); Assistant Secretary, American Beacon Select Funds (2015-Present); Assistant Secretary, American Beacon Institutional Funds Trust (2017-Present); Assistant Secretary, American Beacon Sound Point Enhanced Income Fund (2018-Present); Assistant Secretary, American Beacon Apollo Total Return Fund (2018-Present). | ||
* As of 11/12/2014, the Board adopted a retirement plan that requires Trustees, other than Messrs. Feld and Massman to retire no later than the last day of the calendar year in which they reach the age of 75. As of 11/7/17, the Board approved a waiver of the mandatory retirement policy with respect to Mr. Massman, who turned 75 in November 2018, to permit him to continue to serve on the Board as Chair Emeritus through 12/31/19.
** Mr. Feld is deemed to be an “interested person” of the Trusts, as defined by the 1940 Act. Mr. Feld’s law firm of Akin, Gump, Strauss, Hauer & Feld LLP has provided legal services within the past two fiscal years to one or more of the Trust’s sub-advisors.
46
American Beacon FundsSM
June 30, 2019 (Unaudited)
The American Beacon Funds recognize and respect the privacy of our shareholders. We are providing this notice to you so you will understand how shareholder information may be collected and used.
We may collect nonpublic personal information about you from one or more of the following sources:
| • | information we receive from you on applications or other forms; |
| • | information about your transactions with us or our service providers; and |
| • | information we receive from third parties. |
We do not disclose any nonpublic personal information about our customers or former customers to anyone, except as permitted by law.
We restrict access to your nonpublic personal information to those employees or service providers who need to know that information to provide products or services to you. To ensure the confidentiality of your nonpublic personal information, we maintain safeguards that comply with federal standards.
47
This page intentionally left blank.
48

eDelivery isNOW AVAILABLE - Stop traditional mail delivery and receive your
shareholder reports and summary prospectuson-line. Sign up at
www.americanbeaconfunds.com
If you invest in the Fund through a financial institution, you may be able to receive the Fund’s regulatory mailings, such as the Prospectus, Annual Report and Semi-Annual Report, bye-mail. If you are interested in this option, please go towww.icsdelivery.com and search for your financial institution’s name or contact your financial institution directly.
To obtain more information about the Fund:
 |  | |
| ByE-mail: | On the Internet: | |
| american_beacon.funds@ambeacon.com | Visit our website atwww.americanbeaconfunds.com | |
By Telephone: Call (800)658-5811 |
By Mail: American Beacon Funds P.O. Box 219643 Kansas City, MO 64121-9643 | |
| Availability of Quarterly Portfolio Schedules | Availability of Proxy Voting Policy and Records | |
| In addition to the Schedule of Investments provided in each semi-annual and annual report, the Fund files a complete schedule of its portfolio holdings with the Securities and Exchange Commission (“SEC”) on Form N-PORT as of the first and third fiscal quarters. The Fund’s Forms N-PORT are available on the SEC’s website atwww.sec.gov. The Forms N-PORT may also be reviewed and copied at the SEC’s Public Reference Section, 100 F Street, NE, Washington, D.C. 20549-2736. Information regarding the operation of the SEC’s Public Reference Room may be obtained by calling (800)-SEC-0330. A complete schedule of the Fund’s portfolio holdings is also available atwww.americanbeaconfunds.com approximately twenty days after the end of each month. | A description of the policies and procedures the Fund uses to determine how to vote proxies relating to portfolio securities is available in the Fund’s Statement of Additional Information, is available free of charge on the Fund’s websitewww.americanbeaconfunds.com and by calling1-800-967-9009 or by accessing the SEC’s website atwww.sec.gov. The Fund’s proxy voting record for the most recent year ended June 30 is filed annually with the SEC onForm N-PX. The Fund’sForms N-PX are available on the SEC’s website atwww.sec.gov. The Fund’s proxy voting record may also be obtained by calling1-800-967-9009. | |


Fund Service Providers:
CUSTODIAN State Street Bank and Trust Company Boston, Massachusetts | TRANSFER AGENT DST Asset Manager Solutions, Inc. Quincy, Massachusetts | INDEPENDENT REGISTERED PUBLIC ACCOUNTING FIRM PricewaterhouseCoopers LLP Boston, Massachusetts | DISTRIBUTOR Resolute Investment Distributors, Inc. Irving, Texas |
This report is prepared for shareholders of the American Beacon Funds and may be distributed to others only if preceded or accompanied by a current Prospectus or Summary Prospectus.
American Beacon Funds and American Beacon ARK Transformational Innovation Fund are service marks of American Beacon Advisors, Inc.
AR 6/19
About American Beacon Advisors
Since 1986, American Beacon Advisors has offered a variety of products and investment advisory services to numerous institutional and retail clients, including a variety of mutual funds, corporate cash management, and separate account management.
Our clients include defined benefit plans, defined contribution plans, foundations, endowments, corporations, financial planners, and other institutional investors. With American Beacon Advisors, you can put the experience of a multi-billion dollar asset management firm to work for your company.
SHAPIRO EQUITY OPPORTUNITIES FUND
Investing invalue stocksmay limit downside risk over time; however, the Fund may produce more modest gains than riskier stock funds as a trade-off for this potentially lower risk. Because the Fund may invest infewer issuersthan a more diversified portfolio, the fluctuating value of a single holding may have a greater effect on the value of the Fund. The Fund participates in asecurities lendingprogram. The use offutures contractsfor cash management may subject the Fund to losing more money than invested. Please see the prospectus for a complete discussion of the Fund’s risks. There can be no assurances that the investment objectives of this Fund will be met.
SHAPIRO SMID CAP EQUITY FUND
Investing invalue stocksmay limit downside risk over time; however, the Fund may produce more modest gains than riskier stock funds as a trade-off for this potentially lower risk. Investing insmall- or mid-capitalizationstocks may involve greater volatility and lower liquidity than larger company stocks. Because the Fund may invest infewer issuersthan a more diversified portfolio, the fluctuating value of a single holding may have a greater effect on the value of the Fund. The Fund participates in asecurities lendingprogram. The use offutures contractsfor cash management may subject the Fund to losing more money than invested. Please see the prospectus for a complete discussion of the Fund’s risks. There can be no assurances that the investment objectives of this Fund will be met.
Any opinions herein, including forecasts, reflect our judgment as of the end of the reporting period and are subject to change. Each advisor’s strategies and each Fund’s portfolio composition will change depending on economic and market conditions. This report is not a complete analysis of market conditions, and, therefore, should not be relied upon as investment advice. Although economic and market information has been compiled from reliable sources, American Beacon Advisors, Inc. makes no representation as to the completeness or accuracy of the statements contained herein.
American Beacon Funds | June 30, 2019 |
| 1 | ||||
| 2 | ||||
| 7 | ||||
| 9 | ||||
Schedules of Investments: | ||||
| 10 | ||||
| 13 | ||||
| 16 | ||||
| 19 | ||||
Financial Highlights: | ||||
| 36 | ||||
| 39 | ||||
| 42 | ||||
Disclosure Regarding Approval of the Management and Investment Advisory Agreements | 43 | |||
| 48 | ||||
| 54 | ||||
| Back Cover | ||||
 | Dear Shareholders,
At American Beacon, we take our heritage as a fiduciary very seriously — and we apply that mindset to all aspects of our business as a fund manager. As a result, for more than 30 years, we have endeavored to:
u Identify, engage and oversee the best money managers. As a manager of managers, our goal is to engage the most effective money managers for each asset class, investment style and market strategy we offer. We are committed to partnering with those we judge to be “the best of the best” when it comes to choosing sub-advisors for our mutual funds. Whether our due-diligence process results in the selection of one sub-advisor or multiple sub-advisors, we select those we believe show the greatest potential to help us meet the high standards you’ve come to expect. |
| u | Offer a variety of innovative investment solutions. Our mutual funds — which span the domestic, international, global, frontier and emerging markets — are sub-advised by experienced money managers who employ distinctive, proprietary investment processes to manage assets through a variety of economic and market conditions. From offering some of the first multi-manager funds, one of the first retirement income funds and the first open-ended mutual fund in the U.S. to focus primarily on frontier-market debt, our robust history includes applying a disciplined, solutions-based approach to our product development process in an effort to help you grow your assets while mitigating risk. |
| u | Provide a solutions-based approach to achieving long-term investment goals.We seek to provide investment solutions that might enable you to benefit from taking a more disciplined approach to investing. Our mutual funds provide access to institutional-quality, research-intensive investment managers with diverse processes and styles. Over the long run, having such access and spending time in the market — rather than trying to time the market — may better position you to reach your long-term investment goals during market upswings and potentially insulate against market downswings. |
Our management approach is more than a concept; it’s the cornerstone of American Beacon’s culture. And we strive to employ it at every turn as we seek to provide a well-diversified line of investment solutions to help our shareholders seek long-term rewards.
Thank you for your continued interest in American Beacon. For additional information about our mutual funds or to access your account information, please visit our website atwww.americanbeaconfunds.com.
Best Regards,

Gene L. Needles, Jr.
President
American Beacon Funds
1
June 30, 2019 (Unaudited)
For the 12-month period ended June 30, 2019, equity markets were slightly higher overall; however, volatility picked up significantly as a myriad of uncertainties were on the minds of investors. Chief among those uncertainties were the up-and-down trade negotiations between the world’s two largest economies, the U.S. and China, as well as the Federal Reserve’s continued rate-hiking cycle in the first half of the period followed by its abrupt change of course in 2019 when it began holding the federal funds rate steady as the economy showed signs of cooling growth. Through all the noise, the MSCI All Country World Index rose 5.74%, driven higher by resilient U.S. equities as international developed and emerging market equities did not fare quite as well due to global trade worries.
In the U.S., the S&P 500 Index was up 10.42%, and 10 of its 11 sectors produced positive returns for the period. The top performers were yield-oriented sectors, including Utilities (up 19.03%) and Real Estate (up 16.80%), followed by Consumer Staples (up 16.39%) and Information Technology (up 14.34%). Commodity-sensitive sectors, including Energy (down 13.25%) and Materials (up 3.20%), were the worst performers. From a style standpoint, Growth continued the trend of outpacing Value as the Russell 3000 Growth Index returned 10.60% versus the Russell 3000 Value Index return of 7.34%. From a capitalization perspective, small-cap stocks struggled mightily compared to their larger capitalization peers, as evidenced by the Russell 2000 Index return of -3.31% compared to the Russell 1000 Index return of 10.02%.
International developed markets ended the period slightly higher as the MSCI EAFE Index was up 1.08%. In Europe, the top-performing countries were Switzerland and Denmark, represented by the MSCI Switzerland Index (up 19.77%) and the MSCI Denmark Index (up 5.76%), respectively. The laggards in Europe were Austria and Ireland, represented by the MSCI Austria Index (down 13.12%) and the MSCI Ireland Index (down 9.22%), respectively. In Japan, equities struggled as the MSCI Japan Index returned -4.19%.
Finally, in the developing world, emerging markets were caught in the crossfire of the trade spat between the U.S. and China, but did manage to eke out a positive absolute return for the full period. The MSCI Emerging Market Index returned 1.21%. China, the largest-country constituent, was down 6.73%, represented by the MSCI China Index. Turkish equities also struggled as the economy dealt with rampant inflation and the MSCI Turkey Index returned -17.11%. The best-performing countries over the period were Brazil and Russia, represented by the MSCI Brazil Index (up 39.43%) and the MSCI Russia Index (up 27.06%), respectively.
2
American Beacon Shapiro Equity Opportunities FundSM
Performance Overview
June 30, 2019 (Unaudited)
The Investor Class of the American Beacon Shapiro Equity Opportunities Fund (the “Fund”) returned 2.53% for the twelve months ended June 30, 2019. The Fund underperformed the Russell 3000 Index (the “Index”) return of 8.98% for the period.
Comparison of Changes in Value of a $10,000 Investment for the period 9/12/2017 through 6/30/2019
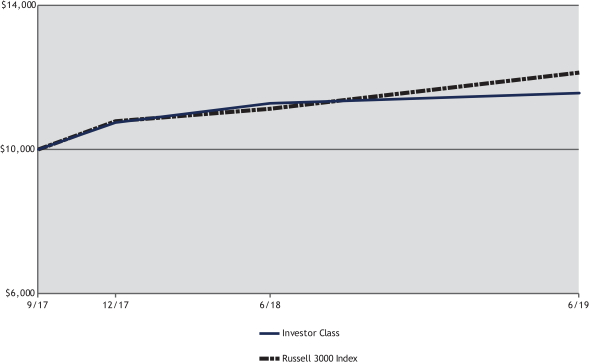
| Average Annual Total Returns for the Period ended June 30, 2019 |
| |||||||||||||||||||||
Ticker | 1 Year | �� | Since Inception | Value of $10,000 09/12/2017- 06/30/2019 | ||||||||||||||||||
Institutional Class (1,3) | SHXIX | 2.97 | % | 8.82 | % | $ | 11,643 | |||||||||||||||
Y Class (1,3) | SHXYX | 2.88 | % | 8.82 | % | $ | 11,643 | |||||||||||||||
Investor Class (1,3) | SHXPX | 2.53 | % | 8.40 | % | $ | 11,563 | |||||||||||||||
Russell 3000 Index (2) | 8.98 | % | 11.30 | % | $ | 12,126 | ||||||||||||||||
| 1. | Performance shown is historical and is not indicative of future returns. Investment returns and principal value will vary, and shares may be worth more or less at redemption than at original purchase. Performance shown is calculated based on the published end-of-day net asset values as of date indicated, and current performance may be lower or higher than the performance data quoted. To obtain performance as of the most recent month end, please call1-800-9687-9009 or visitwww.americanbeaconfunds.com. Fund performance in the table above does not reflect the deduction of taxes a shareholder would pay on distributions or the redemption of shares. Generally accepted accounting principles require adjustments to be made to the net assets of the Fund at period end for financial reporting purposes only; and as such, the total return based on the unadjusted net asset value per share may differ from the total return reported in the financial highlights. A portion of the fees charged to each Class of the Fund has been waived since Fund inception. Performance prior to waiving was lower than actual returns shown since inception. |
| 2. | The Russell 3000® Index measures the performance of the 3,000 largest U.S. companies based on total market capitalization, which represents approximately 98% of the U.S. equity market. The Russell 3000 Index is a registered trademark of Frank Russell Company. Frank Russell Company (“Russell”) is the source and owner of the trademarks, service marks and copyrights related to the Russell Indexes. Russell® is a trademark of Frank Russell Company. Neither Russell nor its licensors accept any liability for any errors or omissions in the Russell Indexes and/or Russell ratings or underlying data, and no party may rely on any Russell Indexes and/or Russell ratings and/or underlying data contained in this communication. No further distribution of Russell Data is permitted without Russell’s express written consent. Russell does not promote, sponsor or endorse the content of this communication. One cannot directly invest in an index. |
3
American Beacon Shapiro Equity Opportunities FundSM
Performance Overview
June 30, 2019 (Unaudited)
| 3. | The Total Annual Fund Operating Expense ratios set forth in the most recent Fund prospectus for the Institutional, Y and Investor Class shares were 2.83%, 2.79% and 4.90%, respectively. The expense ratios above may vary from the expense ratios presented in other sections of this report that are based on expenses incurred during the period covered by this report. |
The Fund underperformed the Index primarily due to stock selection, although sector allocation also detracted over the period. Most of the Fund’s underperformance related to security selection was attributed to holdings in the Industrials and Consumer Discretionary sectors. In the Industrials sector, Maxar Technologies Ltd. (down 84.0%), and FedEx Corp. (down 9.1%) were the largest detractors. In the Consumer Discretionary sector, Hanesbrands, Inc. (down 15.6%), CBS Corp., Class B (down 5.6%) and Discovery, Inc., Class C (up 0.7%) detracted from performance. The underperformance was partially offset by security selection in the Health Care sector. Merck & Co., Inc. (up 41.1%) and Pfizer, Inc. (up 22.0%) were the largest contributors to performance.
From a sector allocation perspective, an overweight allocation to the Materials sector (down 1.7%), the second worst performing sector in the Index, detracted from Fund performance. Null weighting the Consumer Staples sector (up 14.4%) hurt the Fund’s relative returns. The Fund’s underweight allocation to the Financials sector (up 5.1%) contributed positively to performance.
Looking forward, the Fund’s sub-advisor will continue to employ a team-based investment process that is driven by deep fundamental research in a concentrated, value-oriented approach.
| Top Ten Holdings (% Net Assets) |
| |||||||
| Caesars Entertainment Corp. | 6.6 | |||||||
| Walt Disney Co. | 5.7 | |||||||
| AT&T, Inc. | 5.4 | |||||||
| Axalta Coating Systems Ltd. | 5.3 | |||||||
| FedEx Corp. | 5.2 | |||||||
| Apple, Inc. | 5.1 | |||||||
| Hanesbrands, Inc. | 5.1 | |||||||
| Corning, Inc. | 5.0 | |||||||
| General Motors Co. | 4.9 | |||||||
| Regions Financial Corp. | 4.9 | |||||||
| Total Fund Holdings | 23 | |||||||
| Sector Allocation (% Equities) |
| |||||||
| Communication Services | 21.9 | |||||||
| Information Technology | 17.7 | |||||||
| Consumer Discretionary | 17.1 | |||||||
| Materials | 10.9 | |||||||
| Financials | 9.7 | |||||||
| Industrials | 6.5 | |||||||
| Energy | 6.5 | |||||||
| Health Care | 4.9 | |||||||
| Industrials | 4.8 | |||||||
4
American Beacon Shapiro SMID Cap Equity FundSM
Performance Overview
June 30, 2019 (Unaudited)
The Investor Class of the American Beacon Shapiro SMID Cap Equity Fund (the “Fund”) returned -7.06% for the twelve months ended June 30, 2019. The Fund underperformed the Russell 2500 Index (the “Index”) return of 1.77% for the same period.
Comparison of Changes in Value of a $10,000 Investment for the period 9/12/2017 through 6/30/2019
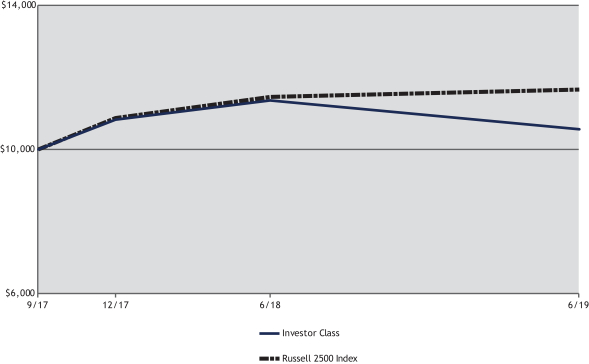
| Average Annual Total Returns for the Period ended June 30, 2019 |
| |||||||||||||||||||||
Ticker | 1 Year | Since Inception 09/12/2017 | Value of $10,000 09/12/2017- 06/30/2019 | |||||||||||||||||||
Institutional Class (1,3) | SHDIX | (6.67 | )% | 3.45 | % | $ | 10,630 | |||||||||||||||
Y Class (1,3) | SHDYX | (6.76 | )% | 3.40 | % | $ | 10,621 | |||||||||||||||
Investor Class (1,3) | SHDPX | (7.06 | )% | 3.06 | % | $ | 10,558 | |||||||||||||||
Russell 2500 Index (2) | 1.77 | % | 8.91 | % | $ | 11,661 | ||||||||||||||||
| 1. | Performance shown is historical and is not indicative of future returns. Investment returns and principal value will vary, and shares may be worth more or less at redemption than at original purchase. Performance shown is calculated based on the published end-of-day net asset values as of date indicated, and current performance may be lower or higher than the performance data quoted. To obtain performance as of the most recent month end, please visitwww.americanbeaconfunds.com or call 1-800-967-9009. Fund performance in the table above does not reflect the deduction of taxes a shareholder would pay on distributions or the redemption of shares. Generally accepted accounting principles require adjustments to be made to the net assets of the Fund at period end for financial reporting purposes only; and as such, the total return based on the unadjusted net asset value per share may differ from the total return reported in the financial highlights. A portion of the fees charged to each Class of the Fund has been waived since Fund inception. Performance prior to waiving fees was lower than actual returns shown since inception. |
| 2. | The Russell 2500® Index is an unmanaged index that measures the performance of the small to mid-cap segment of the U.S. equity universe. It is a subset of the Russell 3000® Index and includes approximately 2,500 of the smallest securities based on a combination of their market capitalization and current index membership. The Russell 2500 Index and the Russell 3000 Index are registered trademarks of Frank Russell Company. Frank Russell Company (“Russell”) is the source and owner of the trademarks, service marks and copyrights related to the Russell Indexes. Russell® is a trademark of Frank Russell Company. Neither Russell nor its licensors accept any liability for any errors or omissions in the Russell Indexes and/or Russell ratings or underlying data, and no party may rely on any Russell Indexes and/or Russell ratings and/or underlying data contained in this communication. No further distribution of Russell Data is permitted without Russell’s express written consent. Russell does not promote, sponsor or endorse the content of this communication. One cannot directly invest in an index. |
5
American Beacon Shapiro SMID Cap Equity FundSM
Performance Overview
June 30, 2019 (Unaudited)
| 3. | The Total Annual Fund Operating Expense ratios set forth in the most recent Fund prospectus for the Institutional, Y and Investor Class shares were 4.33%, 5.70%, and 6.13%, respectively. The expense ratios above may vary from the expense ratios presented in other sections of this report that are based on expenses incurred during the period covered by this report |
The Fund underperformed the Index primarily due to stock selection, but sector allocation also slightly detracted over the period. Most of the Fund’s underperformance related to security selection was attributed to holdings in the Industrials and Communication Services sectors. In the Industrials sector, Maxar Technologies Ltd. (down 84.0%) was the top detractor during the period. In the Communication Services sector, positions in Lions Gate Entertainment Corp., Class B (down 46.3%) and IMAX Corp. (down 14.3%) detracted from performance. The aforementioned underperformance was partially offset by security selection in the Materials sector. Positions in Graphic Packaging Holding Co. (up 22.0%) and Mosaic Co. (up 17.2%) were the largest contributors to performance.
From a sector allocation perspective, overweighting the Materials sector (down 7.2%), and the Consumer Discretionary sector (down 6.8%) hurt returns relative to the Index. Partially offsetting losses was a significant overweight allocation to the top performing sector within the Index, Information Technology (up 18.5%), which added value to relative performance.
Looking forward, the Fund’s sub-advisor will continue to employ a team-oriented investment process that is driven by deep fundamental research in a concentrated, value-oriented approach.
| Top Ten Holdings (% Net Assets) |
| |||||||
| Caesars Entertainment Corp. | 6.7 | |||||||
| Axalta Coating Systems Ltd. | 5.6 | |||||||
| Hanesbrands, Inc. | 5.5 | |||||||
| Graphic Packaging Holding Co. | 5.4 | |||||||
| Allscripts Healthcare Solutions, Inc. | 5.3 | |||||||
| GreenSky, Inc., Class A | 5.1 | |||||||
| FireEye, Inc. | 5.0 | |||||||
| AMC Networks, Inc., Class A | 4.7 | |||||||
| Regions Financial Corp. | 4.7 | |||||||
| Lions Gate Entertainment Corp., Class B | 4.6 | |||||||
| Total Fund Holdings | 27 | |||||||
| Sector Allocation (% Equities) |
| |||||||
| Materials | 23.4 | |||||||
| Information Technology | 19.0 | |||||||
| Communication Services | 17.5 | |||||||
| Consumer Discretionary | 14.6 | |||||||
| Financials | 7.8 | |||||||
| Energy | 6.2 | |||||||
| Industrials | 6.0 | |||||||
| Health Care | 5.5 | |||||||
6
Expense Examples
June 30, 2019 (Unaudited)
Fund Expense Example
As a shareholder of a Fund, you incur two types of costs: (1) transaction costs, including sales charges (loads) on purchase payments and redemption fees, if applicable, and (2) ongoing costs, including management fees, distribution (12b-1) fees, sub-transfer agent fees, and other Fund expenses. The Examples are intended to help you understand the ongoing cost (in dollars) of investing in the Funds and to compare these costs with the ongoing costs of investing in other mutual funds. The Examples are based on an investment of $1,000 invested at the beginning of the period in each Class and held for the entire period from January 1, 2019 through June 30, 2019.
Actual Expenses
The “Actual” lines of the tables provide information about actual account values and actual expenses. You may use the information on this page, together with the amount you invested, to estimate the expenses that you paid over the period. Simply divide your account value by $1,000 (for example, an $8,600 account value divided by $1,000 = $8.60), then multiply the result by the “Expenses Paid During Period” to estimate the expenses you paid on your account during this period. Shareholders of the Investor and Institutional Classes that invest in the Funds through an IRA or Roth IRA may be subject to a custodial IRA fee of $15 that is typically deducted each December. If your account was subject to a custodial IRA fee during the period, your costs would have been $15 higher.
Hypothetical Example for Comparison Purposes
The “Hypothetical” lines of the tables provide information about hypothetical account values and hypothetical expenses based on the Funds’ actual expense ratio and an assumed 5% per year rate of return before expenses (not the Funds’ actual return). You may compare the ongoing costs of investing in the Funds with other funds by contrasting this 5% hypothetical example and the 5% hypothetical examples that appear in the shareholder reports of the other funds. The hypothetical account values and expenses may not be used to estimate the actual ending account balance or expenses you paid for the period. Shareholders of the Investor and Institutional Classes that invest in the Funds through an IRA or Roth IRA may be subject to a custodial IRA fee of $15 that is typically deducted each December. If your account was subject to a custodial IRA fee during the period, your costs would have been $15 higher.
You should also be aware that the expenses shown in the table highlight only your ongoing costs and do not reflect any transaction costs charged by the Funds, such as sales charges (loads) or redemption fees, as applicable. Similarly, the expense examples for other funds do not reflect any transaction costs charged by those funds, such as sales charges (loads), redemption fees or exchange fees. Therefore, the “Hypothetical” lines of the tables are useful in comparing ongoing costs only and will not help you determine the relative total costs of owning different funds. If you were subject to any transaction costs during the period, your costs would have been higher.
7
American Beacon FundsSM
Expense Examples
June 30, 2019 (Unaudited)
| American Beacon Shapiro Equity Opportunities Fund |
| ||||||||||||||
| Beginning Account Value 1/1/2019 | Ending Account Value 6/30/2019 | Expenses Paid During Period 1/1/2019-6/30/2019* | |||||||||||||
| Institutional Class | |||||||||||||||
| Actual | $1,000.00 | $1,193.70 | $4.30 | ||||||||||||
| Hypothetical** | $1,000.00 | $1,020.88 | $3.96 | ||||||||||||
| Y Class | |||||||||||||||
| Actual | $1,000.00 | $1,193.70 | $4.84 | ||||||||||||
| Hypothetical** | $1,000.00 | $1,020.38 | $4.46 | ||||||||||||
| Investor Class | |||||||||||||||
| Actual | $1,000.00 | $1,191.50 | $6.36 | ||||||||||||
| Hypothetical** | $1,000.00 | $1,018.99 | $5.86 | ||||||||||||
| * | Expenses are equal to the Fund’s annualized expense ratios for thesix-month period of 0.79%, 0.89%, and 1.17% for the Institutional, Y, and Investor Classes, respectively, multiplied by the average account value over the period, multiplied by the number derived by dividing the number of days in the most recent fiscal half-year (181) by days in the year (365) to reflect the half-year period. |
| ** | 5% return before expenses. |
| American Beacon Shapiro SMID Cap Equity Fund |
| ||||||||||||||
| Beginning Account Value 1/1/2019 | Ending Account Value 6/30/2019 | Expenses Paid During Period 1/1/2019-6/30/2019* | |||||||||||||
| Institutional Class | |||||||||||||||
| Actual | $1,000.00 | $1,175.30 | $4.80 | ||||||||||||
| Hypothetical** | $1,000.00 | $1,020.38 | $4.46 | ||||||||||||
| Y Class | |||||||||||||||
| Actual | $1,000.00 | $1,175.50 | $5.34 | ||||||||||||
| Hypothetical** | $1,000.00 | $1,019.89 | $4.96 | ||||||||||||
| Investor Class | |||||||||||||||
| Actual | $1,000.00 | $1,172.50 | $6.84 | ||||||||||||
| Hypothetical** | $1,000.00 | $1,018.50 | $6.36 | ||||||||||||
| * | Expenses are equal to the Fund’s annualized expense ratios for thesix-month period of 0.89%, 0.99%, and 1.27% for the Institutional, Y, and Investor Classes, respectively, multiplied by the average account value over the period, multiplied by the number derived by dividing the number of days in the most recent fiscal half-year (181) by days in the year (365) to reflect the half-year period. |
| ** | 5% return before expenses. |
8
Report of Independent Registered Public Accounting Firm
To the Board of Trustees of American Beacon Funds and Shareholders of American Beacon Shapiro Equity Opportunities Fund and American Beacon Shapiro SMID Cap Equity Fund
Opinions on the Financial Statements
We have audited the accompanying statements of assets and liabilities, including the schedules of investments, of American Beacon Shapiro Equity Opportunities Fund and American Beacon Shapiro SMID Cap Equity Fund (two of the series constituting American Beacon Funds, referred to hereafter as the “Funds”) as of June 30, 2019, the related statements of operations for the year ended June 30, 2019, and the statements of changes in net assets and the financial highlights for the year ended June 30, 2019 and for the period September 12, 2017 (commencement of operations) through June 30, 2018, including the related notes (collectively referred to as the “financial statements”). In our opinion, the financial statements present fairly, in all material respects, the financial position of each of the Funds as of June 30, 2019, the results of each of their operations for the year ended June 30, 2019, and the changes in each of their net assets and the financial highlights of each Fund for the year ended June 30, 2019 and for the period September 12, 2017 (commencement of operations) through June 30, 2018 in conformity with accounting principles generally accepted in the United States of America.
Basis for Opinions
These financial statements are the responsibility of the Funds’ management. Our responsibility is to express an opinion on the Funds’ financial statements based on our audits. We are a public accounting firm registered with the Public Company Accounting Oversight Board (United States) (PCAOB) and are required to be independent with respect to the Funds in accordance with the U.S. federal securities laws and the applicable rules and regulations of the Securities and Exchange Commission and the PCAOB.
We conducted our audits of these financial statements in accordance with the standards of the PCAOB. Those standards require that we plan and perform the audit to obtain reasonable assurance about whether the financial statements are free of material misstatement, whether due to error or fraud.
Our audits included performing procedures to assess the risks of material misstatement of the financial statements, whether due to error or fraud, and performing procedures that respond to those risks. Such procedures included examining, on a test basis, evidence regarding the amounts and disclosures in the financial statements. Our audits also included evaluating the accounting principles used and significant estimates made by management, as well as evaluating the overall presentation of the financial statements. Our procedures included confirmation of securities owned as of June 30, 2019 by correspondence with the custodian and transfer agent. We believe that our audits provide a reasonable basis for our opinions.
PricewaterhouseCoopers LLP
Dallas, TX
August 27, 2019
We have served as the auditor of one or more investment companies in the American Beacon family of funds since 2016.
9
American Beacon Shapiro Equity Opportunities FundSM
Schedule of Investments
June 30, 2019
| Shares | Fair Value | ||||||||||||||
| COMMON STOCKS - 91.90% | |||||||||||||||
| Communication Services - 21.16% | |||||||||||||||
| Diversified Telecommunication Services - 5.37% | |||||||||||||||
| AT&T, Inc. | 142,800 | $ | 4,785,228 | ||||||||||||
|
| ||||||||||||||
| Entertainment - 11.09% | |||||||||||||||
| Lions Gate Entertainment Corp., Class B | 337,000 | 3,912,570 | |||||||||||||
| Live Nation Entertainment, Inc.A | 13,500 | 894,375 | |||||||||||||
| Walt Disney Co. | 36,400 | 5,082,896 | |||||||||||||
|
| ||||||||||||||
| 9,889,841 | |||||||||||||||
|
| ||||||||||||||
| Media - 4.70% | |||||||||||||||
| CBS Corp., Class B, NVDR | 84,000 | 4,191,600 | |||||||||||||
|
| ||||||||||||||
Total Communication Services | 18,866,669 | ||||||||||||||
|
| ||||||||||||||
| Consumer Discretionary - 16.49% | |||||||||||||||
| Automobiles - 4.86% | |||||||||||||||
| General Motors Co. | 112,600 | 4,338,478 | |||||||||||||
|
| ||||||||||||||
| Hotels, Restaurants & Leisure - 6.56% | |||||||||||||||
| Caesars Entertainment Corp.A | 494,600 | 5,846,172 | |||||||||||||
|
| ||||||||||||||
| Textiles, Apparel & Luxury Goods - 5.07% | |||||||||||||||
| Hanesbrands, Inc. | 262,400 | 4,518,528 | |||||||||||||
|
| ||||||||||||||
Total Consumer Discretionary | 14,703,178 | ||||||||||||||
|
| ||||||||||||||
| Energy - 6.24% | |||||||||||||||
| Oil, Gas & Consumable Fuels - 6.24% | |||||||||||||||
| Devon Energy Corp. | 124,300 | 3,545,036 | |||||||||||||
| WPX Energy, Inc.A | 175,200 | 2,016,552 | |||||||||||||
|
| ||||||||||||||
| 5,561,588 | |||||||||||||||
|
| ||||||||||||||
Total Energy | 5,561,588 | ||||||||||||||
|
| ||||||||||||||
| Financials - 9.37% | |||||||||||||||
| Banks - 9.37% | |||||||||||||||
| Bank of America Corp. | 138,200 | 4,007,800 | |||||||||||||
| Regions Financial Corp. | 290,900 | 4,346,046 | |||||||||||||
|
| ||||||||||||||
| 8,353,846 | |||||||||||||||
|
| ||||||||||||||
Total Financials | 8,353,846 | ||||||||||||||
|
| ||||||||||||||
| Health Care - 4.76% | |||||||||||||||
| Pharmaceuticals - 4.76% | |||||||||||||||
| Merck & Co., Inc. | 50,600 | 4,242,810 | |||||||||||||
|
| ||||||||||||||
| Industrials - 6.30% | |||||||||||||||
| Aerospace & Defense - 1.13% | |||||||||||||||
| Maxar Technologies, Inc.A B | 129,300 | 1,011,126 | |||||||||||||
|
| ||||||||||||||
| Air Freight & Logistics - 5.17% | |||||||||||||||
| FedEx Corp. | 28,070 | 4,608,813 | |||||||||||||
|
| ||||||||||||||
Total Industrials | 5,619,939 | ||||||||||||||
|
| ||||||||||||||
| Information Technology - 17.12% | |||||||||||||||
| Electronic Equipment, Instruments & Components - 4.96% | |||||||||||||||
| Corning, Inc. | 133,100 | 4,422,913 | |||||||||||||
|
| ||||||||||||||
See accompanying notes
10
American Beacon Shapiro Equity Opportunities FundSM
Schedule of Investments
June 30, 2019
| Shares | Fair Value | ||||||||||||||
| COMMON STOCKS - 91.90% (continued) | |||||||||||||||
| Information Technology - 17.12% (continued) | |||||||||||||||
| Semiconductors & Semiconductor Equipment - 2.30% | |||||||||||||||
| Entegris, Inc. | 54,925 | $ | 2,049,801 | ||||||||||||
|
| ||||||||||||||
| Software - 4.76% | |||||||||||||||
| FireEye, Inc.A | 286,600 | 4,244,546 | |||||||||||||
|
| ||||||||||||||
| Technology Hardware, Storage & Peripherals - 5.10% | |||||||||||||||
| Apple, Inc. | 22,965 | 4,545,233 | |||||||||||||
|
| ||||||||||||||
Total Information Technology | 15,262,493 | ||||||||||||||
|
| ||||||||||||||
| Materials - 10.46% | |||||||||||||||
| Chemicals - 6.52% | |||||||||||||||
| Axalta Coating Systems Ltd.A | 157,900 | 4,700,683 | |||||||||||||
| Mosaic Co. | 44,700 | 1,118,841 | |||||||||||||
|
| ||||||||||||||
| 5,819,524 | |||||||||||||||
|
| ||||||||||||||
| Containers & Packaging - 3.94% | |||||||||||||||
| Graphic Packaging Holding Co. | 251,200 | 3,511,776 | |||||||||||||
|
| ||||||||||||||
Total Materials | 9,331,300 | ||||||||||||||
|
| ||||||||||||||
Total Common Stocks (Cost $84,169,019) | 81,941,823 | ||||||||||||||
|
| ||||||||||||||
| EXCHANGE-TRADED INSTRUMENTS - 4.67% (Cost $3,724,670) | |||||||||||||||
| Exchange-Traded Funds - 4.67% | |||||||||||||||
| SPDR S&P 500 ETF Trust | 14,200 | 4,160,600 | |||||||||||||
|
| ||||||||||||||
| SHORT-TERM INVESTMENTS - 3.46% (Cost $3,080,491) | |||||||||||||||
| Investment Companies - 3.46% | |||||||||||||||
| American Beacon U.S. Government Money Market Select Fund, Select Class, 2.32%C D | 3,080,491 | 3,080,491 | |||||||||||||
|
| ||||||||||||||
| SECURITIES LENDING COLLATERAL - 0.61% (Cost $544,670) | |||||||||||||||
| Investment Companies - 0.61% | |||||||||||||||
| American Beacon U.S. Government Money Market Select Fund, Select Class, 2.32%C D | 544,670 | 544,670 | |||||||||||||
|
| ||||||||||||||
TOTAL INVESTMENTS - 100.64% (Cost $91,518,850) | 89,727,584 | ||||||||||||||
LIABILITIES, NET OF OTHER ASSETS - (0.64%) | (567,892 | ) | |||||||||||||
|
| ||||||||||||||
TOTAL NET ASSETS - 100.00% | $ | 89,159,692 | |||||||||||||
|
| ||||||||||||||
| Percentages are stated as a percent of net assets. | |||||||||||||||
ANon-income producing security.
B All or a portion of this security is on loan at June 30, 2019.
C The Fund is affiliated by having the same investment advisor.
D7-day yield.
ETF - Exchange-Traded Fund.
NVDR - Non Voting Depositary Receipt.
SPDR - Standard & Poor’s U.S. EquityLarge-Cap Index.
S&P 500 - Standard & Poor’s U.S. EquityLarge-Cap Index.
See accompanying notes
11
American Beacon Shapiro Equity Opportunities FundSM
Schedule of Investments
June 30, 2019
The Fund’s investments are summarized by level based on the inputs used to determine their values. As of June 30, 2019, the investments were classified as described below:
Shapiro Equity Opportunities Fund | Level 1 | Level 2 | Level 3 | Total | ||||||||||||||||||||||||
Assets |
| |||||||||||||||||||||||||||
Common Stocks | $ | 81,941,823 | $ | - | $ | - | $ | 81,941,823 | ||||||||||||||||||||
Exchange-Traded Instruments | 4,160,600 | - | - | 4,160,600 | ||||||||||||||||||||||||
Short-Term Investments | 3,080,491 | - | - | 3,080,491 | ||||||||||||||||||||||||
Securities Lending Collateral | 544,670 | - | - | 544,670 | ||||||||||||||||||||||||
|
|
|
|
|
|
|
| |||||||||||||||||||||
Total Investments in Securities - Assets | $ | 89,727,584 | $ | - | $ | - | $ | 89,727,584 | ||||||||||||||||||||
|
|
|
|
|
|
|
| |||||||||||||||||||||
U.S. GAAP requires transfers between all levels to/from level 3 be disclosed. During the year ended June 30, 2019, there were no transfers into or out of Level 3.
See accompanying notes
12
American Beacon Shapiro SMID Cap Equity FundSM
Schedule of Investments
June 30, 2019
| Shares | Fair Value | ||||||||||||||
| COMMON STOCKS - 96.32% | |||||||||||||||
| Communication Services - 16.88% | |||||||||||||||
| Entertainment - 12.16% | |||||||||||||||
| IMAX Corp.A | 13,400 | $ | 270,680 | ||||||||||||
| Liberty Media Corp-Liberty Braves, Class CA | 6,200 | 173,414 | |||||||||||||
| Lions Gate Entertainment Corp., Class B | 26,800 | 311,148 | |||||||||||||
| Live Nation Entertainment, Inc.A | 1,100 | 72,875 | |||||||||||||
|
| ||||||||||||||
| 828,117 | |||||||||||||||
|
| ||||||||||||||
| Media - 4.72% | |||||||||||||||
| AMC Networks, Inc., Class AA | 5,900 | 321,491 | |||||||||||||
|
| ||||||||||||||
Total Communication Services | 1,149,608 | ||||||||||||||
|
| ||||||||||||||
| Consumer Discretionary - 14.11% | |||||||||||||||
| Hotels, Restaurants & Leisure - 6.70% | |||||||||||||||
| Caesars Entertainment Corp.A | 38,600 | 456,252 | |||||||||||||
|
| ||||||||||||||
| Leisure Products - 1.93% | |||||||||||||||
| Acushnet Holdings Corp. | 5,000 | 131,300 | |||||||||||||
|
| ||||||||||||||
| Textiles, Apparel & Luxury Goods - 5.48% | |||||||||||||||
| Hanesbrands, Inc. | 21,700 | 373,674 | |||||||||||||
|
| ||||||||||||||
Total Consumer Discretionary | 961,226 | ||||||||||||||
|
| ||||||||||||||
| Energy - 5.96% | |||||||||||||||
| Oil, Gas & Consumable Fuels - 5.96% | |||||||||||||||
| SemGroup Corp., Class A | 8,200 | 98,400 | |||||||||||||
| WPX Energy, Inc.A | 26,700 | 307,317 | |||||||||||||
|
| ||||||||||||||
| 405,717 | |||||||||||||||
|
| ||||||||||||||
Total Energy | 405,717 | ||||||||||||||
|
| ||||||||||||||
| Financials - 7.47% | |||||||||||||||
| Banks - 7.47% | |||||||||||||||
| Cadence Bancorp | 9,100 | 189,280 | |||||||||||||
| Regions Financial Corp. | 21,400 | 319,716 | |||||||||||||
|
| ||||||||||||||
| 508,996 | |||||||||||||||
|
| ||||||||||||||
Total Financials | 508,996 | ||||||||||||||
|
| ||||||||||||||
| Health Care - 5.27% | |||||||||||||||
| Health Care Technology - 5.27% | |||||||||||||||
| Allscripts Healthcare Solutions, Inc.A | 30,900 | 359,367 | |||||||||||||
|
| ||||||||||||||
| Industrials - 5.77% | |||||||||||||||
| Aerospace & Defense - 5.77% | |||||||||||||||
| BWX Technologies, Inc. | 5,300 | 276,130 | |||||||||||||
| Maxar Technologies, Inc.A B | 14,915 | 116,635 | |||||||||||||
|
| ||||||||||||||
| 392,765 | |||||||||||||||
|
| ||||||||||||||
Total Industrials | 392,765 | ||||||||||||||
|
| ||||||||||||||
| Information Technology - 18.35% | |||||||||||||||
| Communications Equipment - 3.02% | |||||||||||||||
| Ciena Corp.A | 5,000 | 205,650 | |||||||||||||
|
| ||||||||||||||
| IT Services - 5.05% | |||||||||||||||
| GreenSky, Inc., Class AA B | 28,000 | 344,120 | |||||||||||||
|
| ||||||||||||||
See accompanying notes
13
American Beacon Shapiro SMID Cap Equity FundSM
Schedule of Investments
June 30, 2019
| Shares | Fair Value | ||||||||||||||
| COMMON STOCKS - 96.32% (continued) | |||||||||||||||
| Information Technology - 18.35% (continued) | |||||||||||||||
| Semiconductors & Semiconductor Equipment - 3.23% | |||||||||||||||
| Entegris, Inc. | 5,900 | $ | 220,188 | ||||||||||||
|
| ||||||||||||||
| Software - 7.05% | |||||||||||||||
| ChannelAdvisor Corp.A | 15,900 | 139,284 | |||||||||||||
| FireEye, Inc.A | 23,000 | 340,630 | |||||||||||||
|
| ||||||||||||||
| 479,914 | |||||||||||||||
|
| ||||||||||||||
Total Information Technology | 1,249,872 | ||||||||||||||
|
| ||||||||||||||
| Materials - 22.51% | |||||||||||||||
| Chemicals - 13.44% | |||||||||||||||
| Axalta Coating Systems Ltd.A | 12,900 | 384,033 | |||||||||||||
| Livent Corp.A | 3,600 | 24,912 | |||||||||||||
| Mosaic Co. | 3,800 | 95,114 | |||||||||||||
| PQ Group Holdings, Inc.A | 10,537 | 167,012 | |||||||||||||
| Valvoline, Inc. | 12,500 | 244,125 | |||||||||||||
|
| ||||||||||||||
| 915,196 | |||||||||||||||
|
| ||||||||||||||
| Containers & Packaging - 5.44% | |||||||||||||||
| Graphic Packaging Holding Co. | 26,500 | 370,470 | |||||||||||||
|
| ||||||||||||||
| Metals & Mining - 3.63% | |||||||||||||||
| Compass Minerals International, Inc. | 4,500 | 247,275 | |||||||||||||
|
| ||||||||||||||
Total Materials | 1,532,941 | ||||||||||||||
|
| ||||||||||||||
Total Common Stocks (Cost $7,118,207) | 6,560,492 | ||||||||||||||
|
| ||||||||||||||
| SHORT-TERM INVESTMENTS - 3.71% (Cost $252,400) | |||||||||||||||
| Investment Companies - 3.71% | |||||||||||||||
| American Beacon U.S. Government Money Market Select Fund, Select Class, 2.32%C D | 252,400 | 252,400 | |||||||||||||
|
| ||||||||||||||
| SECURITIES LENDING COLLATERAL - 5.34% (Cost $363,460) | |||||||||||||||
| Investment Companies - 5.34% | |||||||||||||||
| American Beacon U.S. Government Money Market Select Fund, Select Class, 2.32%C D | 363,460 | 363,460 | |||||||||||||
|
| ||||||||||||||
TOTAL INVESTMENTS - 105.37% (Cost $7,734,067) | 7,176,352 | ||||||||||||||
LIABILITIES, NET OF OTHER ASSETS - (5.37%) | (365,428 | ) | |||||||||||||
|
| ||||||||||||||
TOTAL NET ASSETS - 100.00% | $ | 6,810,924 | |||||||||||||
|
| ||||||||||||||
| Percentages are stated as a percent of net assets. | |||||||||||||||
ANon-income producing security.
B All or a portion of this security is on loan at June 30, 2019.
C The Fund is affiliated by having the same investment advisor.
D7-day yield.
See accompanying notes
14
American Beacon Shapiro SMID Cap Equity FundSM
Schedule of Investments
June 30, 2019
The Fund’s investments are summarized by level based on the inputs used to determine their values. As of June 30, 2019, the investments were classified as described below:
Shapiro SMID Cap Equity Fund | Level 1 | Level 2 | Level 3 | Total | ||||||||||||||||||||||||
Assets | ||||||||||||||||||||||||||||
Common Stocks | $ | 6,560,492 | $ | - | $ | - | $ | 6,560,492 | ||||||||||||||||||||
Short-Term Investments | 252,400 | - | - | 252,400 | ||||||||||||||||||||||||
Securities Lending Collateral | 363,460 | - | - | 363,460 | ||||||||||||||||||||||||
|
|
|
|
|
|
|
| |||||||||||||||||||||
Total Investments in Securities - Assets | $ | 7,176,352 | $ | - | $ | - | $ | 7,176,352 | ||||||||||||||||||||
|
|
|
|
|
|
|
| |||||||||||||||||||||
U.S. GAAP requires transfers between all levels to/from level 3 be disclosed. During the year ended June 30, 2019, there were no transfers into or out of Level 3.
See accompanying notes
15
Statements of Assets and Liabilities
June 30, 2019
| Shapiro Equity Opportunities Fund | Shapiro SMID Cap Equity Fund | |||||||||||
Assets: |
| |||||||||||
Investments in unaffiliated securities, at fair value†§ | $ | 86,102,423 | $ | 6,560,492 | ||||||||
Investments in affiliated securities, at fair value‡ | 3,625,161 | 615,860 | ||||||||||
Dividends and interest receivable | 145,249 | 5,321 | ||||||||||
Receivable for investments sold | - | 13,955 | ||||||||||
Receivable for fund shares sold | 12,428 | - | ||||||||||
Receivable for expense reimbursement (Note 2) | 26,931 | 11,300 | ||||||||||
Prepaid expenses | 12,223 | 11,580 | ||||||||||
|
|
|
| |||||||||
Total assets | 89,924,415 | 7,218,508 | ||||||||||
|
|
|
| |||||||||
Liabilities: |
| |||||||||||
Payable for fund shares redeemed | 126,118 | - | ||||||||||
Management andsub-advisory fees payable (Note 2) | 48,875 | 4,020 | ||||||||||
Transfer agent fees payable (Note 2) | 727 | 90 | ||||||||||
Payable upon return of securities loaned (Note 8)§ | 544,670 | 363,460 | ||||||||||
Custody and fund accounting fees payable | 4,719 | 3,509 | ||||||||||
Professional fees payable | 39,409 | 35,919 | ||||||||||
Other liabilities | 205 | 586 | ||||||||||
|
|
|
| |||||||||
Total liabilities | 764,723 | 407,584 | ||||||||||
|
|
|
| |||||||||
Net assets | $ | 89,159,692 | $ | 6,810,924 | ||||||||
|
|
|
| |||||||||
Analysis of net assets: |
| |||||||||||
Paid-in-capital | $ | 88,679,736 | $ | 7,052,349 | ||||||||
Total distributable earnings (deficits)A | 479,956 | (241,425 | ) | |||||||||
|
|
|
| |||||||||
Net assets | $ | 89,159,692 | $ | 6,810,924 | ||||||||
|
|
|
| |||||||||
Shares outstanding at no par value (unlimited shares authorized): |
| |||||||||||
Institutional Class | 4,689,503 | 544,427 | ||||||||||
|
|
|
| |||||||||
Y Class | 3,148,116 | 41,011 | ||||||||||
|
|
|
| |||||||||
Investor Class | 65,711 | 115,995 | ||||||||||
|
|
|
| |||||||||
Net assets: |
| |||||||||||
Institutional Class | $ | 52,917,588 | $ | 5,293,291 | ||||||||
|
|
|
| |||||||||
Y Class | $ | 35,505,884 | $ | 398,161 | ||||||||
|
|
|
| |||||||||
Investor Class | $ | 736,220 | $ | 1,119,472 | ||||||||
|
|
|
| |||||||||
Net asset value, offering and redemption price per share: |
| |||||||||||
Institutional Class | $ | 11.28 | $ | 9.72 | ||||||||
|
|
|
| |||||||||
Y Class | $ | 11.28 | $ | 9.71 | ||||||||
|
|
|
| |||||||||
Investor Class | $ | 11.20 | $ | 9.65 | ||||||||
|
|
|
| |||||||||
† Cost of investments in unaffiliated securities | $ | 87,893,689 | $ | 7,118,207 | ||||||||
‡ Cost of investments in affiliated securities | $ | 3,625,161 | $ | 615,860 | ||||||||
§ Fair value of securities on loan | $ | 549,590 | $ | 378,284 | ||||||||
A The Fund’s investments in affiliated securities did not have unrealized appreciation (depreciation) at year end. |
| |||||||||||
See accompanying notes
16
American Beacon FundsSM
Statements of Operations
For the year ended June 30, 2019
| Shapiro Equity Opportunities Fund | Shapiro SMID Cap Equity Fund | |||||||||||
Investment income: |
| |||||||||||
Dividend income from unaffiliated securities (net of foreign taxes)† | $ | 1,336,808 | $ | 81,119 | ||||||||
Dividend income from affiliated securities (Note 7) | 69,147 | 4,263 | ||||||||||
Income derived from securities lending (Note 8) | 6,804 | 891 | ||||||||||
|
|
|
| |||||||||
Total investment income | 1,412,759 | 86,273 | ||||||||||
|
|
|
| |||||||||
Expenses: |
| |||||||||||
Management andsub-advisory fees (Note 2) | 549,801 | 47,124 | ||||||||||
Transfer agent fees: | ||||||||||||
Institutional Class (Note 2) | 4,348 | 897 | ||||||||||
Y Class (Note 2) | 26,390 | 180 | ||||||||||
Investor Class | 1,143 | 1,131 | ||||||||||
Custody and fund accounting fees | 32,437 | 25,322 | ||||||||||
Professional fees | 67,360 | 40,501 | ||||||||||
Registration fees and expenses | 85,631 | 56,769 | ||||||||||
Service fees (Note 2): | ||||||||||||
Investor Class | 6,534 | 7,373 | ||||||||||
Prospectus and shareholder report expenses | 13,174 | 4,508 | ||||||||||
Trustee fees (Note 2) | 5,607 | 449 | ||||||||||
Other expenses | 5,876 | 2,379 | ||||||||||
|
|
|
| |||||||||
Total expenses | 798,301 | 186,633 | ||||||||||
|
|
|
| |||||||||
Net fees waived and expenses (reimbursed) (Note 2) | (146,881 | ) | (127,374 | ) | ||||||||
|
|
|
| |||||||||
Net expenses | 651,420 | 59,259 | ||||||||||
|
|
|
| |||||||||
Net investment income | 761,339 | 27,014 | ||||||||||
|
|
|
| |||||||||
Realized and unrealized gain (loss) from investments: |
| |||||||||||
Net realized gain from: | ||||||||||||
Investments in unaffiliated securitiesA | 3,165,985 | 549,012 | ||||||||||
Commission recapture (Note 1) | 88,475 | 5,853 | ||||||||||
Foreign currency transactions | (536 | ) | (263 | ) | ||||||||
Change in net unrealized depreciation of: | ||||||||||||
Investments in unaffiliated securitiesB | (2,329,134 | ) | (936,368 | ) | ||||||||
|
|
|
| |||||||||
Net gain (loss) from investments | 924,790 | (381,766 | ) | |||||||||
|
|
|
| |||||||||
Net increase (decrease) in net assets resulting from operations | $ | 1,686,129 | $ | (354,752 | ) | |||||||
|
|
|
| |||||||||
† Foreign taxes | $ | 9,767 | $ | 1,132 | ||||||||
A The Fund did not recognize net realized gains (losses) from the sale of investments in affiliated securities. |
| |||||||||||
B The Fund’s investments in affiliated securities did not have a change in unrealized appreciation (depreciation) at year end. |
| |||||||||||
See accompanying notes
17
American Beacon FundsSM
Statements of Changes in Net Assets
| Shapiro Equity Opportunities Fund | Shapiro SMID Cap Equity Fund | |||||||||||||||||||||||||||
| Year Ended June 30, 2019 | September 12, 2017A to June 30, 2018 | Year Ended June 30, 2019 | September 12, 2017A to June 30, 2018 | |||||||||||||||||||||||||
Increase (decrease) in net assets: | ||||||||||||||||||||||||||||
Operations: | ||||||||||||||||||||||||||||
Net investment income | $ | 761,339 | $ | 44,143 | $ | 27,014 | $ | 2,645 | ||||||||||||||||||||
Net realized gain from investments in unaffiliated securities, commission recapture, and foreign currency transactions | 3,253,924 | 149,703 | 554,602 | 184,967 | ||||||||||||||||||||||||
Change in net unrealized appreciation (depreciation) of investments in unaffiliated securities | (2,329,134 | ) | 537,868 | (936,368 | ) | 378,653 | ||||||||||||||||||||||
|
|
|
|
|
|
|
| |||||||||||||||||||||
Net increase (decrease) in net assets resulting from operations | 1,686,129 | 731,714 | (354,752 | ) | 566,265 | |||||||||||||||||||||||
|
|
|
|
|
|
|
| |||||||||||||||||||||
Distributions to shareholders: |
| |||||||||||||||||||||||||||
Net investment income: | ||||||||||||||||||||||||||||
Institutional Class | - | (5,619 | ) | - | - | |||||||||||||||||||||||
Y Class | - | (159 | ) | - | - | |||||||||||||||||||||||
Investor Class | - | (214 | ) | - | - | |||||||||||||||||||||||
Net realized gain from investments: | ||||||||||||||||||||||||||||
Institutional Class | - | (282 | ) | - | - | |||||||||||||||||||||||
Y Class | - | (8 | ) | - | - | |||||||||||||||||||||||
Investor Class | - | (11 | ) | - | - | |||||||||||||||||||||||
Total retained earnings:* | ||||||||||||||||||||||||||||
Institutional Class | (1,211,245 | ) | - | (391,569 | ) | - | ||||||||||||||||||||||
Y Class | (707,549 | ) | - | (14,218 | ) | - | ||||||||||||||||||||||
Investor Class | (12,800 | ) | - | (47,151 | ) | - | ||||||||||||||||||||||
|
|
|
|
|
|
|
| |||||||||||||||||||||
Net distributions to shareholders | (1,931,594 | ) | (6,293 | ) | (452,938 | ) | - | |||||||||||||||||||||
|
|
|
|
|
|
|
| |||||||||||||||||||||
Capital share transactions (Note 10): |
| |||||||||||||||||||||||||||
Proceeds from sales of shares | 25,831,453 | 70,166,173 | 1,989,470 | 2,486,584 | ||||||||||||||||||||||||
Reinvestment of dividends and distributions | 1,931,594 | 6,293 | 452,938 | - | ||||||||||||||||||||||||
Cost of shares redeemed | (8,754,700 | ) | (3,501,077 | ) | (517,419 | ) | (359,224 | ) | ||||||||||||||||||||
|
|
|
|
|
|
|
| |||||||||||||||||||||
Net increase in net assets from capital share transactions | 19,008,347 | 66,671,389 | 1,924,989 | 2,127,360 | ||||||||||||||||||||||||
|
|
|
|
|
|
|
| |||||||||||||||||||||
Net increase in net assets | 18,762,882 | 67,396,810 | 1,117,299 | 2,693,625 | ||||||||||||||||||||||||
|
|
|
|
|
|
|
| |||||||||||||||||||||
Net assets: |
| |||||||||||||||||||||||||||
Beginning of period | 70,396,810 | 3,000,000 | B | 5,693,625 | 3,000,000 | B | ||||||||||||||||||||||
|
|
|
|
|
|
|
| |||||||||||||||||||||
End of period | $ | 89,159,692 | $ | 70,396,810 | $ | 6,810,924 | $ | 5,693,625 | ||||||||||||||||||||
|
|
|
|
|
|
|
| |||||||||||||||||||||
* Distributions from net investment income and net realized capital gains are combined for the year ended June 30, 2019. See Note 1 in the Notes to Financial Statements for more information regarding new accounting pronouncements. |
| |||||||||||||||||||||||||||
A Commencement of operations. |
| |||||||||||||||||||||||||||
B Seed capital. |
| |||||||||||||||||||||||||||
See accompanying notes
18
Notes to Financial Statements
June 30, 2019
1. Organization and Significant Accounting Policies
American Beacon Funds (the “Trust”), is organized as a Massachusetts business trust. The Funds, each a series within the Trust, are registered under the Investment Company Act of 1940, as amended (the “Act”), asnon-diversified,open-end management investment companies. As of June 30, 2019, the Trust consists of thirty-three active series, two of which are presented in this filing: American Beacon Shapiro Equity Opportunities Fund and American Beacon Shapiro SMID Cap Equity Fund (collectively, the “Funds” and each individually a “Fund”). The remainingthirty-one active series are reported in separate filings.
American Beacon Advisors, Inc. (the “Manager”) is a Delaware corporation and a wholly-owned subsidiary of Resolute Investment Managers, Inc. (“RIM”) organized in 1986 to provide business management, advisory, administrative, and asset management consulting services to the Trust and other investors. The Manager is registered as an investment advisor under the Investment Advisers Act of 1940, as amended (the “Advisers Act”). RIM is, in turn, a wholly-owned subsidiary of Resolute Acquisition, Inc., which is a wholly-owned subsidiary of Resolute Topco, Inc., a wholly-owned subsidiary of Resolute Investment Holdings, LLC (“RIH”). RIH is owned primarily by Kelso Investment Associates VIII, L.P., KEP VI, LLC and Estancia Capital Partners L.P., investment funds affiliated with Kelso & Company, L.P. (“Kelso”) or Estancia Capital Management, LLC (“Estancia”), which are private equity firms.
Recent Accounting Pronouncements
In March 2017, the Financial Accounting Standards Board (“FASB”) issued Accounting Standards Update (“ASU”)2017-08,Premium Amortization of Purchased Callable Debt Securities. The amendments in the ASU shorten the premium amortization period on a purchased callable debt security from the security’s contractual life to the earliest call date. It is anticipated that this change will enhance disclosures by reducing losses recognized when a security is called on an earlier date. This ASU is effective for fiscal years beginning after December 15, 2018. The Manager continues to evaluate the impact this ASU will have on the financial statements and other disclosures.
In August 2018, the FASB issued ASU2018-13,Fair Value Measurement (“Topic 820”). The amendments in the ASU impact disclosure requirements for fair value measurement. It is anticipated that this change will enhance the effectiveness of disclosures in the notes to the financial statements. This ASU is effective for fiscal years beginning after December 15, 2019. Early adoption is permitted and can include the entire standard or certain provisions that exclude or amend disclosures. For the year ended June 30, 2019, the Funds have chosen to adopt the standard. The adoption of this ASU guidance did not have a material impact on the financial statements and other disclosures.
In August 2018, the U.S. Securities and Exchange Commission (“SEC”) adopted amendments to certain disclosure requirements in Securities Act ReleaseNo. 33-10532, Disclosure Update and Simplification, which is intended to facilitate the disclosure of information to investors and simplify compliance without significantly altering the total mix of information provided to investors. Effective with the current reporting period, the Funds adopted the amendments with the impacts being that the Funds are no longer required to present components of distributable earnings on the Statements of Assets and Liabilities or the sources of distributable earnings and the amount of undistributed net investment income on the Statements of Changes in Net Assets.
19
American Beacon FundsSM
Notes to Financial Statements
June 30, 2019
Class Disclosure
Each Fund has multiple classes of shares designed to meet the needs of different groups of investors. The following table sets forth the differences amongst the classes:
Class | Eligible Investors | Minimum Initial Investments | ||||
| Institutional | Large institutional investors - sold directly through intermediary channels. | $ | 250,000 | |||
| Y Class | Large institutional retirement plan investors - sold directly or through intermediary channels. | $ | 100,000 | |||
| Investor | All investors using intermediary organizations, such as broker-dealers or retirement plan sponsors. | $ | 2,500 | |||
Each class offered by the Trust has equal rights as to assets and voting privileges. Income andnon-class specific expenses are allocated daily to each class based on the relative net assets. Realized and unrealized capital gains and losses of each class are allocated daily based on the relative net assets of each class of the respective Fund. Class specific expenses, where applicable, currently include service, distribution, transfer agent fees, andsub-transfer agent fees that vary amongst the classes as described more fully in Note 2.
Significant Accounting Policies
The following is a summary of significant accounting policies, consistently followed by the Funds in preparation of the financial statements. The Funds are considered investment companies and accordingly, follow the investment company accounting and reporting guidance of the FASB Accounting Standards Codification Topic 946,Financial Services – Investment Companies,a part of Generally Accepted Accounting Principles (“U.S. GAAP”).
Security Transactions and Investment Income
Security transactions are recorded as of the trade date for financial reporting purposes. Securities purchased or sold on a when-issued or delayed-delivery basis may be settled beyond a standard settlement period for the security after the trade date.
Dividend income, net of foreign taxes, is recorded on theex-dividend date, except certain dividends from foreign securities which are recorded as soon as the information is available to the Funds. Interest income, net of foreign taxes, is earned from settlement date, recorded on the accrual basis, and adjusted, if necessary, for accretion of discounts and amortization of premiums. Realized gains (losses) from securities sold are determined based on specific lot identification.
Currency Translation
All assets and liabilities initially expressed in foreign currency values are converted into U.S. dollar values at the mean of the bid and ask prices of such currencies against U.S. dollars as last quoted by a recognized dealer. Income, expenses, and purchases and sales of investments are translated into U.S. dollars at the rate of the exchange prevailing on the respective dates of such transactions. The effect of changes in foreign currency exchange rates on investments is separately identified from the fluctuations arising from changes in market values of securities held and is reported with all other foreign currency gains and losses on the Funds’ Statements of Operations.
Distributions to Shareholders
Each Fund distributes most or all of its net earnings and realized gains, if any, each taxable year in the form of dividends from net investment income and distributions of realized net capital gains and net gains from foreign currency transactions on an annual basis. The Funds do not have a fixed dividend rate or do not guarantee that they will pay any distributions in any particular period.
20
American Beacon FundsSM
Notes to Financial Statements
June 30, 2019
Dividends to shareholders are determined in accordance with federal income tax regulations, which may differ in amount and character from net investment income and realized gains recognized for purposes of U.S. GAAP. To the extent necessary to fully distribute capital gains, the Funds may designate earnings and profits distributed to shareholders on the redemption of shares.
Commission Recapture
The Funds have established brokerage commission recapture arrangements with certain brokers or dealers. If the Funds’ investment advisor chooses to execute a transaction through a participating broker, the broker rebates a portion of the commission back to the Funds. Any collateral benefit received through participation in the commission recapture program is directed exclusively to the Funds. This amount is reported with the net realized gain in the Funds’ Statements of Operations, if applicable.
Allocation of Income, Trust Expenses, Gains, and Losses
Investment income, realized and unrealized gains and losses from investments of the Funds are allocated daily to each class of shares based upon the relative proportion of net assets of each class to the total net assets of the Funds. Expenses directly charged or attributable to the Fund will be paid from the assets of the Fund. Generally, expenses of the Trust will be allocated among and charged to the assets of the Funds on a basis that the Trust’s Board of Trustees (the “Board”) deems fair and equitable, which may be based on the relative net assets of the Funds or nature of the services performed and relative applicability to the Funds.
Use of Estimates
The preparation of financial statements in conformity with U.S. GAAP requires management to make estimates and assumptions that affect the amounts reported in the financial statements and accompanying notes. Actual results may differ from those estimated.
Other
Under the Trust’s organizational documents, its officers and trustees are indemnified against certain liabilities arising out of the performance of their duties to the Trust. In the normal course of business, the Trust enters into contracts that provide indemnification to the other party or parties against potential costs or liabilities. The Trust’s maximum exposure under these arrangements is dependent on claims that may be made in the future and, therefore, cannot be estimated. The Trust has had no prior claims or losses pursuant to any such agreement.
2. Transactions with Affiliates
Management and InvestmentSub-Advisory Agreements
The Funds and the Manager are parties to a Management Agreement that obligates the Manager to provide the Funds with investment advisory and administrative services. As compensation for performing the duties under the Management Agreement, the Manager will receive an annualized management fee based on a percentage of each Fund’s average daily net assets that is calculated and accrued daily according to the following schedule:
First $5 billion | 0.35 | % | ||
Next $5 billion | 0.325 | % | ||
Next $10 billion | 0.30 | % | ||
Over $20 billion | 0.275 | % |
The Trust, on behalf of the Funds, and the Manager have entered into an Investment Advisory Agreement with Shapiro Capital Management LLC (“Shapiro”), an affiliate of the Manager pursuant to which each Fund has agreed to pay Shapiro an annualizedsub-advisory fee that is calculated and accrued daily based on the Funds’ average daily net assets according to the following schedule:
21
American Beacon FundsSM
Notes to Financial Statements
June 30, 2019
Shapiro Equity Opportunities Fund
First $250 million | 0.35 | % | ||
Next $250 million | 0.30 | % | ||
Over $500 million | 0.25 | % |
Shapiro SMID Cap Equity Fund
First $250 million | 0.40 | % | ||
Next $250 million | 0.35 | % | ||
Over $500 million | 0.30 | % |
The Management andSub-Advisory Fees paid by the Funds for the year ended June 30, 2019 were as follows:
Shapiro Equity Opportunities Fund
| Effective Fee Rate | Amount of Fees Paid | |||||||||||
Management Fees | 0.35 | % | $ | 275,178 | ||||||||
Sub-Advisor Fees | 0.35 | % | 274,623 | |||||||||
|
|
|
| |||||||||
Total | 0.70 | % | $ | 549,801 | ||||||||
|
|
|
| |||||||||
Shapiro SMID Cap Equity Fund
| Effective Fee Rate | Amount of Fees Paid | |||||||||||
Management Fees | 0.35 | % | $ | 22,043 | ||||||||
Sub-Advisor Fees | 0.40 | % | 25,081 | |||||||||
|
|
|
| |||||||||
Total | 0.75 | % | $ | 47,124 | ||||||||
|
|
|
| |||||||||
As compensation for services provided by the Manager in connection with securities lending activities conducted by the Funds, the lending Fund pays to the Manager, with respect to cash collateral posted by borrowers, a fee up to 10% of the net monthly interest income (the gross interest income earned by the investment of cash collateral, less the amount paid to borrowers and related expenses) from such activities and, with respect to loan fees paid by borrowers, a fee up to 10% of such loan fees. These fees are included in “Income derived from securities lending” and “Management and investment advisory fees” on the Statements of Operations. During the year ended June 30, 2019, the Manager received securities lending fees of $838 and $160 for the securities lending activities of the Shapiro Equity Opportunities and Shapiro SMID Cap Equity Funds, respectively.
Distribution Plans
The Funds have adopted a “defensive” Distribution Plan (the “Plan”) in accordance with Rule12b-1 under the Act, pursuant to which no separate fees may be charged to the Funds for distribution purposes. However, the Plan authorizes the management fee received by the Manager and the investment advisors hired by the Manager to be used for distribution purposes. Under this Plan, the Funds do not intend to compensate the Manager or any other party, either directly or indirectly, for the distribution of Fund shares.
Service Plans
The Manager and the Trust entered into Service Plans that obligate the Manager to oversee additional shareholder servicing of the Investor Class of the Funds. As compensation for performing the duties required under the Service Plans, the Manager receives an annualized fee up to 0.375% of the average daily net assets attributable to the Investor Class of the Funds.
22
American Beacon FundsSM
Notes to Financial Statements
June 30, 2019
Sub-Transfer Agent Fees
The Manager has entered into agreements, which include servicing agreements, with financial intermediaries that provide recordkeeping, processing, shareholder communications and other services to customers of the intermediaries that hold positions in the Institutional and Y Classes of the Funds and has agreed to compensate the intermediaries for providing these services. Intermediaries transact with the Funds primarily through the use of omnibus accounts on behalf of their customers who hold positions in the Funds. Certain services would have been provided by the Funds’ transfer agent and other service providers if the shareholders’ accounts were maintained directly by the Funds’ transfer agent. Accordingly, the Funds, pursuant to Board approval, have agreed to reimburse the Manager for certainnon-distribution shareholder services provided by financial intermediaries for the Institutional and Y Classes. The reimbursement amounts(sub-transfer agent fees) paid to the Manager are subject to a fee limit of up to 0.10% of an intermediary’s average net assets in the Institutional and Y Classes on an annual basis. During the year ended June 30, 2019, thesub-transfer agent fees, as reflected in “Transfer agent fees” on the Statements of Operations, were as follows:
Fund | Sub-Transfer Agent Fees | |||
Shapiro Equity Opportunities | $ | 27,608 | ||
Shapiro SMID Cap Equity | 895 | |||
As of June 30, 2019, the Funds owed the Manager the following reimbursement ofsub-transfer agent fees, as reflected in “Transfer agent fees payable” on the Statements of Assets and Liabilities:
Fund | Reimbursement Sub-Transfer Agent Fees* | |||
Shapiro Equity Opportunities | $ | 2,045 | ||
Shapiro SMID Cap Equity | 98 | |||
*This balance is presented as a contra liability as of June 30, 2019.
Investments in Affiliated Funds
The Funds may invest in the American Beacon U.S. Government Money Market Select Fund (the “USG Select Fund”). Cash collateral received by the Funds in connection with securities lending may also be invested in the USG Select Fund. The Funds and the USG Select Fund have the same investment advisor and therefore, are considered to be affiliated. The Manager serves as investment advisor to the USG Select Fund and receives management fees and administrative fees totaling 0.10% of the average daily net assets of the USG Select Fund. During the year ended June 30, 2019, the Manager earned fees on the Funds’ direct investments and securities lending collateral investments in the USG Select Fund as shown below:
Fund | Direct Investments in USG Select Fund | Securities Lending Collateral Investments in USG Select Fund | Total | |||||||||
Shapiro Equity Opportunities | $ | 3,216 | $ | 1,541 | $ | 4,757 | ||||||
Shapiro SMID Cap Equity | 197 | 192 | 389 | |||||||||
Interfund Credit Facility
Pursuant to an exemptive order issued by the SEC, the Funds, along with other registered investment companies having management contracts with the Manager, may participate in a credit facility whereby each fund, under certain conditions, is permitted to lend money directly to and borrow directly from other participating funds for temporary purposes. The interfund credit facility is advantageous to the funds because it provides added liquidity, and eliminates the need to maintain higher cash balances to meet redemptions. This situation could arise when shareholder redemptions exceed anticipated volumes and certain funds have insufficient cash on hand to
23
American Beacon FundsSM
Notes to Financial Statements
June 30, 2019
satisfy such redemptions or when sales of securities do not settle as expected, resulting in a cash shortfall for a fund. When a fund liquidates portfolio securities to meet redemption requests, they often do not receive payment in settlement for up to two days (or longer for certain foreign transactions). Redemption requests normally are satisfied on the next business day. The credit facility provides a source of immediate, short-term liquidity pending settlement of the sale of portfolio securities. The credit facility is administered by a credit facility team consisting of professionals from the Manager’s asset management, compliance, and accounting areas who report the activities of the credit facility to the Board. During the year ended June 30, 2019, the Shapiro Equity Opportunities Fund borrowed on average $1,355,924 for 1 day at 3.06% with interest charges of $114 and the Shapiro SMID Cap Equity Fund borrowed on average $83,577 for 4 days at 3.04% with interest charges of $28. This amount is included in “Interest income” on the Statements of Operations.
Expense Reimbursement Plan
The Manager contractually agreed to reduce fees and/or reimburse expenses for the classes of the Funds to the extent that total operating expenses exceed the Funds’ expense cap. During the year ended June 30, 2019, the Manager waived and/or reimbursed expenses as follows:
| Expense Cap | Expiration of Reimbursed Expenses | |||||||||||||||||
Fund | Class | 7/1/2018 - 6/30/2019 | Reimbursed Expenses | (Recouped) Expenses | ||||||||||||||
Shapiro Equity Opportunities | Institutional | 0.79 | % | $ | 90,709 | $ | - | 2021-2022 | ||||||||||
Shapiro Equity Opportunities | Y | 0.89 | % | 49,457 | - | 2021-2022 | ||||||||||||
Shapiro Equity Opportunities | Investor | 1.17 | % | 6,715 | - | 2021-2022 | ||||||||||||
Shapiro SMID Cap Equity | Institutional | 0.89 | % | 100,760 | - | 2021-2022 | ||||||||||||
Shapiro SMID Cap Equity | Y | 0.99 | % | 5,768 | - | 2021-2022 | ||||||||||||
Shapiro SMID Cap Equity | Investor | 1.27 | % | 20,846 | - | 2021-2022 | ||||||||||||
Of these amounts, $26,931 and $11,300 were disclosed as a receivable from the Manager on the Statements of Assets and Liabilities at June 30, 2019 for the Shapiro Equity Opportunities Fund and Shapiro SMID Cap Equity Fund, respectively.
The Funds have adopted an Expense Reimbursement Plan whereby the Manager may seek repayment of such fee reductions and expense reimbursements. Under the policy, the Manager can be reimbursed by the Funds for any contractual or voluntary fee reductions or expense reimbursements if reimbursement to the Manager (a) occurs within three years from the date of the Manager’s waiver/reimbursement and (b) does not cause the Funds’ annual operating expenses to exceed the lesser of the contractual percentage limit in effect at the time of the waiver/reimbursement or time of recoupment. The reimbursed expenses listed above will expire in 2021 and 2022. The Funds did not record a liability for potential reimbursement due to the current assessment that reimbursement are uncertain. The carryover of excess expenses potentially reimbursable to the Manager are as follows:
Fund | Recouped Expenses | Excess Expense Carryover | Expired Expense Carryover | Expiration of Reimbursed Expenses | ||||||||||||
Shapiro Equity Opportunities | $ | – | $ | 123,976 | $ | – | 2020-2021 | |||||||||
Shapiro SMID Cap Equity | – | 122,970 | – | 2020-2021 | ||||||||||||
Concentration of Ownership
From time to time, the Funds may have a concentration of one or more accounts constituting a significant percentage of shares outstanding. Investment activities by holders of accounts that represent a significant ownership of more than 5% of the Funds’ outstanding shares could have a material impact on the Funds. As of June 30, 2019, based on management’s evaluation of the shareholder account base, two accounts have been identified as representing an unaffiliated significant ownership of approximately 46% for the Shapiro Equity
24
American Beacon FundsSM
Notes to Financial Statements
June 30, 2019
Opportunities Fund and one account has been identified as representing an affiliated significant ownership of approximately 44% for the Shapiro SMID Cap Equity Fund.
Trustee Fees and Expenses
As compensation for their service to the Trusts, each Trustee receives an annual retainer of $120,000, plus $10,000 for each Board meeting attended in person or via teleconference, $2,500 for attendance by Committee members at meetings of the Audit Committee and the Investment Committee, and $1,500 for attendance by Committee members at meetings of the Nominating and Governance Committee, plus reimbursement of reasonable expenses incurred in attending Board meetings, Committee meetings, and relevant educational seminars. The Trustees also may be compensated for attendance at special Board and/or Committee meetings from time to time. The Board Chair receives an additional annual retainer of $50,000 as well as a $2,500 fee each quarter for attendance at the committee meetings. The Chairpersons of the Audit Committee and the Investment Committee each receive an additional annual retainer of $25,000 and the Chairman of the Nominating and Governance Committee receives an additional annual retainer of $10,000. These expenses are allocated on a prorated basis to each fund of the Trusts according to its respective net assets.
3. Security Valuation and Fair Value Measurements
The price of the Fund’s shares is based on its net asset value (“NAV”) per share. The Fund’s NAV is computed by adding total assets, subtracting all the Fund’s liabilities, and dividing the result by the total number of shares outstanding.
The NAV of each class of the Fund’s shares is determined based on a pro rata allocation of the Fund’s investment income, expenses and total capital gains and losses. The Fund’s NAV per share is determined each business day as of the regular close of trading on the New York Stock Exchange (“NYSE” or “Exchange”), which is typically 4:00 p.m. Eastern Time (“ET”). However, if trading on the NYSE closes at a time other than 4:00 p.m. ET, the Fund’s NAV per share typically would still be determined as of the regular close of trading on the NYSE. The Fund does not price its shares on days that the NYSE is closed. Foreign exchanges may permit trading in foreign securities on days when the Fund is not open for business, which may result in the value of the Fund’s portfolio investments being affected at a time when you are unable to buy or sell shares.
Equity securities, including shares ofclosed-end funds and exchange-traded funds (“ETFs”), are valued at the last sale price or official closing price taken from the primary exchange in which each security trades. Investments in other mutual funds are valued at the closing NAV per share on the day of valuation. Debt securities are valued at bid quotes from broker/dealers or evaluated bid prices from pricing services, who may consider a number of inputs and factors, such as prices of comparable securities, yield curves, spreads, credit ratings, coupon rates, maturity, default rates, and underlying collateral. Futures are valued based on their daily settlement prices. Exchange-traded andover-the-counter (“OTC”) options are valued at the last sale price. Options with no last sale for the day are priced at mid quote. Swaps are valued at evaluated mid prices from pricing services.
The valuation of securities traded on foreign markets and certain fixed income securities will generally be based on prices determined as of the earlier closing time of the markets on which they primarily trade unless a significant event has occurred. When the Fund holds securities or other assets that are denominated in a foreign currency, the Fund will normally use the currency exchange rates as of 4:00 p.m. ET.
Securities may be valued at fair value, as determined in good faith and pursuant to procedures approved by the Board, under certain limited circumstances. For example, fair value pricing will be used when market quotations are not readily available or reliable, as determined by the Manager, such as when (i) trading for a security is restricted or stopped; (ii) a security’s trading market is closed (other than customary closings); or (iii) a security has beende-listed from a national exchange. A security with limited market liquidity may require fair value pricing if the Manager determines that the available price does not reflect the security’s true market value.
25
American Beacon FundsSM
Notes to Financial Statements
June 30, 2019
In addition, if a significant event that the Manager determines to affect the value of one or more securities held by the Fund occurs after the close of a related exchange but before the determination of the Fund’s NAV, fair value pricing may be used on the affected security or securities. Securities of small-capitalization companies are also more likely to require a fair value determination using these procedures because they are more thinly traded and less liquid than the securities of larger-capitalization companies. The Fund may fair value securities as a result of significant events occurring after the close of the foreign markets in which the Fund invests as described below. In addition, the Fund may invest in illiquid securities requiring these procedures.
The Fund may use fair value pricing for securities primarily traded innon-U.S. markets because most foreign markets close well before the Fund’s pricing time of 4:00 p.m. ET. The earlier close of these foreign markets gives rise to the possibility that significant events, including broad market moves, may have occurred in the interim and may materially affect the value of those securities. If the Manager determines that the last quoted prices ofnon-U.S. securities will, in its judgment, materially affect the value of some or all its portfolio securities, the Manager can adjust the previous closing prices to reflect what it believes to be the fair value of the securities as of the close of the Exchange. In deciding whether it is necessary to adjust closing prices to reflect fair value, the Manager reviews a variety of factors, including developments in foreign markets, the performance of U.S. securities markets, and the performance of instruments trading in U.S. markets that represent foreign securities and baskets of foreign securities. These securities are fair valued using a pricing service, using methods approved by the Board, that considers the correlation of the trading patterns of the foreign security to intraday trading in the U.S. markets, based on indices of domestic securities and other appropriate indicators such as prices of relevant American Depositary Receipts (“ADRs”) and futures contracts. The Valuation Committee, established by the Board, may also fair value securities in other situations, such as when a particular foreign market is closed but the Fund is open. The Fund uses outside pricing services to provide closing prices and information to evaluate and/or adjust those prices. As a means of evaluating its security valuation process, the Valuation Committee routinely compares closing prices, the next day’s opening prices in the same markets and adjusted prices.
Attempts to determine the fair value of securities introduce an element of subjectivity to the pricing of securities. As a result, the price of a security determined through fair valuation techniques may differ from the price quoted or published by other sources and may not accurately reflect the market value of the security when trading resumes. If a reliable market quotation becomes available for a security formerly valued through fair valuation techniques, the Manager compares the new market quotation to the fair value price to evaluate the effectiveness of the Fund’s fair valuation procedures. If any significant discrepancies are found, the Manager may adjust the Fund’s fair valuation procedures.
Valuation Inputs
Various inputs may be used to determine the fair value of the Funds’ investments. These inputs are summarized in three broad levels for financial statement purposes. The inputs or methodologies used to value securities are not necessarily an indication of the risk associated with investing in those securities.
| Level 1 | - | Quoted prices in active markets for identical securities. | ||
| Level 2 | - | Prices determined using other significant observable inputs. These may include quoted prices for similar securities, interest rates, prepayment speeds, credit risk, and others. | ||
| Level 3 | - | Prices determined using other significant unobservable inputs. Unobservable inputs reflect the Fund’s own assumptions about the factors market participants would use in pricing an investment. | ||
Level 1 and Level 2 trading assets and trading liabilities, at fair value
Common stocks, ETF and financial derivative instruments, such as futures contracts that are traded on a national securities exchange, are stated at the last reported sale or settlement price on the day of valuation. To the extent these securities are actively traded and valuation adjustments are not applied, they are categorized as
26
American Beacon FundsSM
Notes to Financial Statements
June 30, 2019
Level 1 of the fair value hierarchy. Preferred securities and other equities traded on inactive markets or valued by reference to similar instruments are generally categorized as Level 2 of the fair value hierarchy.
Investments in registeredopen-end investment management companies will be valued based upon the NAVs of such investments and are categorized as Level 1 of the fair value hierarchy.
4. Securities and Other Investments
Common Stock
Common stock generally takes the form of shares in a corporation which represent an ownership interest. It ranks below preferred stock and debt securities in claims for dividends and for assets of the company in a liquidation or bankruptcy. The value of a company’s common stock may fall as a result of factors directly relating to that company, such as decisions made by its management or decreased demand for the company’s products or services. A stock’s value may also decline because of factors affecting not just the company, but also companies in the same industry or sector. The price of a company’s stock may also be affected by changes in financial markets that are relatively unrelated to the company, such as changes in interest rates, currency exchange rates or industry regulation. Companies that elect to pay dividends on their common stock generally only do so after they invest in their own business and make required payments to bondholders and on other debt and preferred stock. Therefore, the value of a company’s common stock will usually be more volatile than its bonds, other debt and preferred stock. Common stock may be exchange-traded orover-the-counter (“OTC”). OTC stock may be less liquid than exchange-traded stock.
Non-Voting Depositary Receipts
Non-Voting Depositary Receipts (“NVDRs”) represent financial interests in an issuer but the holder is not entitled to any voting rights. Depositary receipts may not be denominated in the same currency as the securities into which they may be converted. Investing in depositary receipts entails substantially the same risks as direct investment in foreign securities. There is generally less publicly available information about foreign companies and there may be less governmental regulation and supervision of foreign stock exchanges, brokers, and listed companies. In addition, such companies may use different accounting and financial standards (and certain currencies may become unavailable for transfer from a foreign currency), resulting in the Fund’s possible inability to convert immediately into U.S. currency proceeds realized upon the sale of portfolio securities of the affected foreign companies. In addition, the Funds may invest in unsponsored depositary receipts, the issuers of which are not obligated to disclose material information about the underlying securities to investors in the United States. Ownership of unsponsored depositary receipts may not entitle the Funds to the same benefits and rights as ownership of a sponsored depositary receipt or the underlying security.
Other Investment Company Securities and Other Exchange-Traded Products
The Funds may invest in shares of other investment companies, includingopen-end funds,closed-end funds, business development companies, ETFs, unit investment trusts, and other investment companies of the Trust. The Funds may invest in investment company securities advised by the Manager or asub-advisor. Investments in the securities of other investment companies may involve duplication of advisory fees and certain other expenses. By investing in another investment company, the Funds become a shareholder of that investment company. As a result, the Funds’ shareholders indirectly will bear the Funds’ proportionate share of the fees and expenses paid by shareholders of the other investment company, in addition to the fees and expenses the Funds’ shareholders directly bear in connection with the Funds’ own operations. These other fees and expenses are reflected as Acquired Fund Fees and Expenses and are included in the Fees and Expenses Table for the Funds in their Prospectus, if applicable. Investments in other investment companies may involve the payment of substantial premiums above the value of such issuer’s portfolio securities.
27
American Beacon FundsSM
Notes to Financial Statements
June 30, 2019
5. Principal Risks
Investing in the Funds may involve certain risks including, but not limited to, those described below.
Equity Investments Risk
Equity securities are subject to market risk. The Funds’ investments in equity securities may include common stocks, preferred stocks, securities convertible into or exchangeable for common stocks, REITs, depositary receipts, and U.S. dollar-denominated foreign stocks traded on U.S. exchanges. Such investments may expose the Funds to additional risk. The value of a company’s common stock may fall as a result of factors affecting the company, companies in the same industry or sector, or the financial markets overall. Common stock generally is subordinate to preferred stock upon the liquidation or bankruptcy of the issuing company. Preferred stocks and convertible securities are sensitive to movements in interest rates. Preferred stocks may be less liquid than common stocks and, unlike common stocks, participation in the growth of an issuer may be limited. Distributions on preferred stocks generally are payable at the discretion of an issuer and after required payments to bond holders. Convertible securities are subject to the risk that the credit standing of the issuer may have an effect on the convertible securities’ investment value. Investments in REITs are subject to the risks associated with investing in the real estate industry such as adverse developments affecting the real estate industry and real property values. Depositary receipts and U.S. dollar-denominated foreign stocks traded on U.S. exchanges are subject to certain of the risks associated with investing directly in foreign securities, including, but not limited to, currency fluctuations and political and financial instability in the home country of a particular depositary receipt or foreign stock.
Focused Holdings Risk
Because the Funds may have a focused portfolio of fewer companies, the increase or decrease of the value of a single investment may have a greater impact on the Funds’ NAV and total return when compared to other diversified funds.
Market Risk
Conditions in the U.S. and many foreign economies have resulted, and may continue to result, in certain instruments experiencing unusual liquidity issues, increased price volatility and, in some cases, credit downgrades and increased likelihood of default. These events have reduced the willingness and ability of some lenders to extend credit, and have made it more difficult for some borrowers to obtain financing on attractive terms, if at all. In some cases, traditional market participants have been less willing to make a market in some types of debt instruments, which has affected the liquidity of those instruments. During times of market turmoil, investors tend to look to the safety of securities issued or backed by the U.S. Treasury, causing the prices of these securities to rise and the yields to decline. Reduced liquidity in fixed income and credit markets may negatively affect many issuers worldwide. In addition, global economies and financial markets are becoming increasingly interconnected, which increases the possibilities that conditions in one country or region might adversely impact issuers in a different country or region. A rise in protectionist trade policies, and the possibility of changes to some international trade agreements, could affect the economies of many nations in ways that cannot necessarily be foreseen at the present time.
In response to the financial crisis, the U.S. and other governments and the Federal Reserve and certain foreign central banks have taken steps to support financial markets. In some countries where economic conditions are recovering, they are nevertheless perceived as still fragile. Withdrawal of government support, failure of efforts in response to the crisis, or investor perception that such efforts are not succeeding, could adversely impact the value and liquidity of certain securities. The severity or duration of adverse economic conditions may also be affected by policy changes made by governments or quasi-governmental organizations, including changes in tax laws. The impact of new financial regulation legislation on the markets and the practical implications for market
28
American Beacon FundsSM
Notes to Financial Statements
June 30, 2019
participants may not be fully known for some time. Regulatory changes are causing some financial services companies to exit long-standing lines of business, resulting in dislocations for other market participants. In addition, political and diplomatic events within the U.S. and abroad, such as the United States government’s inability at times to agree on a long-term budget and deficit reduction plan, the threat of a federal government shutdown and threats not to increase the federal government’s debt limit, may affect investor and consumer confidence and may adversely impact financial markets and the broader economy, perhaps suddenly and to a significant degree. The U.S. government has recently reduced the federal corporate income tax rates, and future legislative, regulatory and policy changes may result in more restrictions on international trade, less stringent prudential regulation of certain players in the financial markets, and significant new investments in infrastructure and national defense. Markets may react strongly to expectations about the changes in these policies, which could increase volatility, especially if the markets’ expectations for changes in government policies are not borne out.
Changes in market conditions will not have the same impact on all types of securities. Interest rates have been unusually low in recent years in the United States and abroad. Because there is little precedent for this situation, it is difficult to predict the impact of a significant rate increase on various markets. For example, because investors may buy securities or other investments with borrowed money, a significant increase in interest rates may cause a decline in the markets for those investments. Because of the sharp decline in the worldwide price of oil, there is a concern that oil producing nations may withdraw significant assets now held in U.S. Treasuries, which could force a substantial increase in interest rates. Regulators have expressed concern that rate increases may cause investors to sell fixed income securities faster than the market can absorb them, contributing to price volatility. In addition, there is a risk that the prices of goods and services in the U.S. and many foreign economies may decline over time, known as deflation (the opposite of inflation). Deflation may have an adverse effect on stock prices and creditworthiness and may make defaults on debt more likely. If a country’s economy slips into a deflationary pattern, it could last for a prolonged period and may be difficult to reverse.
The precise details and the resulting impact of the United Kingdom’s vote to leave the European Union (the “EU”), commonly referred to as “Brexit,” are not yet known. The effect on the United Kingdom’s economy will likely depend on the nature of trade relations with the EU and other major economies following its exit, which are matters to be negotiated. The outcomes may cause increased volatility and have a significant adverse impact on world financial markets, other international trade agreements, and the United Kingdom and European economies, as well as the broader global economy for some time, which could significantly adversely affect the value of the Fund’s investments in the United Kingdom and Europe.
Non-Diversification Risk
The Funds arenon-diversified, which means the Funds may focus their investments in the securities of a comparatively small number of issuers. Investments in securities of a limited number of issuers exposes the Funds to greater market risk and potential losses than if assets were diversified among the securities of a greater number of issuers.
Other Investment Companies Risk
The Funds may invest in shares of other registered investment companies, including ETFs and money market funds. To the extent that the Funds invest in shares of other registered investment companies, the Funds will indirectly bear the fees and expenses charged by those investment companies in addition to the Funds’ direct fees and expenses and will be subject to the risks associated with investments in those companies. For example, ETF shares may trade at a premium or discount to their NAV. An ETF that tracks an index may not precisely replicate the returns of its benchmark index.
Securities Lending Risk
A Fund may lend its portfolio securities to brokers, dealers and financial institutions to seek income. There is a risk that a borrower may default on its obligations to return loaned securities; however, a Fund’s securities
29
American Beacon FundsSM
Notes to Financial Statements
June 30, 2019
lending agent indemnifies the Fund against that risk. There is a risk that the assets of a Fund’s securities lending agent may be insufficient to satisfy any contractual indemnification requirements to the Fund. Borrowers of a Fund’s securities typically provide collateral in the form of cash that is reinvested in securities. A Fund will be responsible for the risks associated with the investment of cash collateral, including any collateral invested in an affiliated money market fund. A Fund may lose money on its investment of cash collateral or may fail to earn sufficient income on its investment to meet obligations to the borrower. In addition, delays may occur in the recovery of securities from borrowers, which could interfere with a Fund’s ability to vote proxies or to settle transactions and there is the risk of possible loss of rights in the collateral should the borrower fail financially. In any case in which the loaned securities are not returned to the Fund before anex-dividend date, the payment in lieu of the dividend that the Fund receives from the securities’ borrower would not be treated as a dividend for federal income tax purposes and thus would not qualify for treatment as “qualified dividend income”.
Securities Selection Risk
Securities selected by thesub-advisor or the Manager for the Funds may not perform to expectations. This could result in the Funds’ underperformance compared to other funds with similar investment objectives.
Offsetting Assets and Liabilities
The Funds are parties to enforceable master netting agreements between brokers and counterparties which provide for the right to offset under certain circumstances. The Funds employ multiple money managers and counterparties and have elected not to offset qualifying financial and derivative instruments on the Statements of Assets and Liabilities, as such all financial and derivative instruments are presented on a gross basis. The impacts of netting arrangements that provide the right to offset are detailed below, if applicable. The net amount represents the net receivable or payable that would be due from or to the counterparty in the event of default. Exposure from borrowings and other financing agreements such as repurchase agreements can only be netted across transactions governed by the same Master Agreement with the same legal entity. All amounts reported below represent the balance as of the report date, June 30, 2019.
Shapiro Equity Opportunities Fund
| Remaining Contractual Maturity of the Agreements As of June 30, 2019 | ||||||||||||||||||||||||||||||||||||
| Overnight and Continuous | <30 days | Between 30 & 90 days | >90 days | Total | ||||||||||||||||||||||||||||||||
Securities Lending Transactions | ||||||||||||||||||||||||||||||||||||
Common Stocks | $ | 544,670 | $ | - | $ | - | $ | - | $ | 544,670 | ||||||||||||||||||||||||||
|
|
|
|
|
|
|
|
|
| |||||||||||||||||||||||||||
Total Borrowings | $ | 544,670 | $ | - | $ | - | $ | - | $ | 544,670 | ||||||||||||||||||||||||||
|
|
|
|
|
|
|
|
|
| |||||||||||||||||||||||||||
Gross amount of recognized liabilities for securities lending transactions |
| $ | 544,670 | |||||||||||||||||||||||||||||||||
|
| |||||||||||||||||||||||||||||||||||
Shapiro SMID Cap Equity Fund
| Remaining Contractual Maturity of the Agreements As of June 30, 2019 | ||||||||||||||||||||||||||||||||||||
| Overnight and Continuous | <30 days | Between 30 & 90 days | >90 days | Total | ||||||||||||||||||||||||||||||||
Securities Lending Transactions | ||||||||||||||||||||||||||||||||||||
Common Stocks | $ | 363,460 | $ | - | $ | - | $ | - | $ | 363,460 | ||||||||||||||||||||||||||
|
|
|
|
|
|
|
|
|
| |||||||||||||||||||||||||||
Total Borrowings | $ | 363,460 | $ | - | $ | - | $ | - | $ | 363,460 | ||||||||||||||||||||||||||
|
|
|
|
|
|
|
|
|
| |||||||||||||||||||||||||||
Gross amount of recognized liabilities for securities lending transactions |
| $ | 363,460 | |||||||||||||||||||||||||||||||||
|
| |||||||||||||||||||||||||||||||||||
30
American Beacon FundsSM
Notes to Financial Statements
June 30, 2019
6. Federal Income and Excise Taxes
It is the policy of each Fund to qualify as a regulated investment company (“RIC”), by complying with all applicable provisions of Subchapter M of the Internal Revenue Code, as amended, and to make distributions of taxable income sufficient to relieve it from substantially all federal income and excise taxes. For federal income tax purposes, each Fund is treated as a single entity for the purpose of determining such qualification.
The Funds do not have any unrecorded tax liabilities in the accompanying financial statements. Each of the tax years in the two years ending June 30, 2019 remain subject to examination by the Internal Revenue Service. If applicable, the Funds recognize interest accrued related to unrecognized tax benefits in interest expense and penalties in “Other expenses” on the Statements of Operations.
The Funds may be subject to taxes imposed by countries in which it invests. Such taxes are generally based on returns of income earned or gains realized or repatriated. Taxes are accrued and applied to net investment income, net realized capital gains and net unrealized appreciation (depreciation), as applicable, as the income is earned or capital gains are recorded.
Dividends are categorized in accordance with income tax regulations which may treat certain transactions differently than U.S. GAAP. Accordingly, the character of distributions and composition of net assets for tax purposes may differ from those reflected in the accompanying financial statements.
The tax character of distributions paid were as follows:
| Shapiro Equity Opportunities Fund | Shapiro SMID Cap Equity Fund | |||||||||||||||||||||||||||
| Year Ended June 30, 2019 | From September 12, 2017A to June 30, 2018 | Year Ended June 30, 2019 | From September 12, 2017A to June 30, 2018 | |||||||||||||||||||||||||
Distributions paid from: | ||||||||||||||||||||||||||||
Ordinary income* | ||||||||||||||||||||||||||||
Institutional Class | $ | 1,140,700 | $ | 5,901 | $ | 343,027 | $ | – | ||||||||||||||||||||
Y Class | 666,340 | 167 | 12,456 | – | ||||||||||||||||||||||||
Investor Class | 12,054 | 225 | 41,306 | – | ||||||||||||||||||||||||
Long-term capital gains | ||||||||||||||||||||||||||||
Institutional Class | 70,546 | – | 48,542 | – | ||||||||||||||||||||||||
Y Class | 41,209 | – | 1,762 | – | ||||||||||||||||||||||||
Investor Class | 745 | – | 5,845 | – | ||||||||||||||||||||||||
|
|
|
|
|
|
|
| |||||||||||||||||||||
Total distributions paid | $ | 1,931,594 | $ | 6,293 | $ | 452,938 | $ | – | ||||||||||||||||||||
|
|
|
|
|
|
|
| |||||||||||||||||||||
*For tax purposes, short-term capital gains are considered ordinary income distributions.
A Commencement of operations.
As of June 30, 2019, the components of distributable earnings (deficits) on a tax basis were as follows:
Fund | Tax Cost | Unrealized Appreciation | Unrealized (Depreciation) | Net Unrealized Appreciation (Depreciation) | ||||||||||||||||||||||||
Shapiro Equity Opportunities | $ | 92,364,071 | $ | 6,487,596 | $ | (9,124,083 | ) | $ | (2,636,487 | ) | ||||||||||||||||||
Shapiro SMID Cap Equity | 7,737,966 | 450,867 | (1,012,481 | ) | (561,614 | ) | ||||||||||||||||||||||
Fund | Net Unrealized Appreciation (Depreciation) | Undistributed Ordinary Income | Undistributed Long-Term Capital Gains | Accumulated Capital and Other (Losses) | Other Temporary Differences | Distributable Earnings | ||||||||||||||||||
Shapiro Equity Opportunities | $ | (2,636,487 | ) | $ | 3,000,097 | $ | 116,346 | $ | – | $ | – | $ | 479,956 | |||||||||||
Shapiro SMID Cap Equity | (561,614 | ) | 130,690 | 189,499 | – | – | (241,425 | ) | ||||||||||||||||
31
American Beacon FundsSM
Notes to Financial Statements
June 30, 2019
Financial reporting records are adjusted for permanent book/tax differences to reflect tax character. Financial records are not adjusted for temporary differences. The temporary differences between financial reporting andtax-basis reporting of unrealized appreciation (depreciation) are attributable primarily to the tax deferral of losses from wash sales and organizational expenses.
Due to inherent differences in the recognition of income, expenses, and realized gains (losses) under U.S. GAAP and federal income tax regulations, permanent differences between book and tax reporting have been identified and appropriately reclassified on the Statements of Assets and Liabilities.
For the year ending June 30, 2019, the Funds had no permanent differences.
Under the Regulated Investment Company Modernization Act of 2010 (“RIC MOD”), net capital losses recognized by the Funds in taxable years beginning after December 22, 2010 are carried forward indefinitely and retain their character as short-term and/or long-term losses.
As of June 30, 2019, the Funds did not have any capital loss carryforwards.
7. Investment Transactions
The aggregate cost of purchases and proceeds from sales and maturities of investments, other than short-term obligations, for the year ended June 30, 2019 were as follows:
Fund | Purchases (non-U.S. Government Securities) | Sales (non-U.S. Government Securities) | ||||||||||
Shapiro Equity Opportunities | $ | 73,076,020 | $ | 40,599,181 | ||||||||
Shapiro SMID Cap Equity | 4,749,857 | 3,428,452 | ||||||||||
A summary of the Funds’ transactions in the USG Select Fund for the year ended June 30, 2019 were as follows:
Fund | Type of Transaction | June 30, 2018 Shares/Fair Value | Purchases | Sales | June 30, 2019 Shares/Fair Value | Dividend Income | ||||||||||||||||||||||||||||||||||||
| Shapiro Equity Opportunities | Direct | $ | 4,720,491 | $ | 56,025,194 | $ | 57,665,194 | $ | 3,080,491 | $ | 69,147 | |||||||||||||||||||||||||||||||
| Shapiro Equity Opportunities | Securities Lending | - | 37,889,460 | 37,344,790 | 544,670 | 1,456 | ||||||||||||||||||||||||||||||||||||
| Shapiro SMID Cap Equity | Direct | 108,004 | 3,973,895 | 3,829,499 | 252,400 | 4,263 | ||||||||||||||||||||||||||||||||||||
| Shapiro SMID Cap Equity | Securities Lending | 248,939 | 4,141,275 | 4,026,754 | 363,460 | 269 | ||||||||||||||||||||||||||||||||||||
8. Securities Lending
The Funds may lend their securities to qualified financial institutions, such as certain broker-dealers, to earn additional income. The borrowers are required to secure their loans continuously with collateral in an amount at least equal to the fair value of the securities loaned, initially in an amount at least equal to 102% of the fair value of domestic securities loaned and 105% of the fair value of international securities loaned. Collateral is monitored andmarked-to-market daily. Dailymark-to-market amounts are required to be paid to the borrower or received from the borrower by the end of the following business day. This one day settlement formark-to-market amounts may result in the collateral being temporarily less than the value of the securities on loan or temporarily more than the required minimum collateral.
To the extent that a loan is collateralized by cash, such cash collateral shall be invested by the securities lending agent (the “Agent”) in money market mutual funds and other short-term investments, provided the investments meet certain quality and diversification requirements. Securities purchased with cash collateral proceeds are listed in the Funds’ Schedule of Investments and the collateral is shown on the Statements of Assets and Liabilities as a payable.
32
American Beacon FundsSM
Notes to Financial Statements
June 30, 2019
Securities lending income is generated from the demand premium (if any) paid by the borrower to borrow a specific security and from the return on investment of cash collateral, reduced by negotiated rebate fees paid to the borrower and transaction costs. To the extent that a loan is secured bynon-cash collateral, securities lending income is generated as a demand premium reduced by transaction costs. The Funds, the Agent, and the Manager retained 80%, 10%, and 10%, respectively, of the income generated from securities lending.
While securities are on loan, the Funds continue to receive certain income associated with that security and any gain or loss in the market price that may occur during the term of the loan. In the case of domestic equities, the value of any dividend is received in the form of a substitute payment approximately equal to the dividend. In the case of foreign securities, a negotiated amount is received that is less than the actual dividend, but higher than the dividend amount minus the foreign tax that the Funds would be subject to on the dividend.
Securities lending transactions pose certain risks to the Funds, including that the borrower may not provide additional collateral when required or return the securities when due, that the value of the short-term investments will be less than the amount of cash collateral required to be returned to the borrower, thatnon-cash collateral may be subject to legal constraints in the event of a borrower bankruptcy, and that the cash collateral investments could become illiquid and unable to be used to return collateral to the borrower. The Funds could also experience delays and costs in gaining access to the collateral. The Funds bear the risk of any deficiency in the amount of the cash collateral available for return to the borrower and any action which impairs its ability to liquidatenon-cash collateral to satisfy a borrower default.
As of June 30, 2019, the value of outstanding securities on loan and the value of collateral were as follows:
Fund | Market Value of Securities on Loan | Cash Collateral Received | Non-Cash Collateral Received | Total Collateral Received | ||||||||||||||||||||||||
| Shapiro Equity Opportunities | $ | 549,590 | $ | 544,670 | $ | - | $ | 544,670 | ||||||||||||||||||||
| Shapiro SMID Cap Equity | 378,284 | 363,460 | - | 363,460 | ||||||||||||||||||||||||
Cash collateral is listed on the Funds’ Schedules of Investments and is shown on the Statements of Assets and Liabilities. Income earned on these investments is included in “Income derived from securities lending” on the Statements of Operations.
Non-cash collateral received by the Funds may not be sold orre-pledged except to satisfy a borrower default. Therefore,non-cash collateral is not included on the Funds’ Schedules of Investments or Statements of Assets and Liabilities.
9. Borrowing Arrangements
Effective November 15, 2018 (the “Effective Date”), the Funds, along with certain other funds managed by the Manager (“Participating Funds”), entered into a committed revolving line of credit (the “Committed Line”) agreement with State Street Bank and Trust Company (the “Bank”) to be used to facilitate portfolio liquidity. The maximum borrowing amount under the Committed Line is $250 million with interest at a rate equal to the higher of(a) one-month London Inter-Bank Offered Rate (“LIBOR”) plus 1.25% per annum or (b) the Federal Funds rate plus 1.25% per annum on amounts borrowed. Each of the Participating Funds will pay a closing fee of $100,000 on the Effective Date and a quarterly commitment fee at a rate of 0.25% per annum on the unused portion of the Committed Line amount. The Committed Line expires November 14, 2019, unless extended by the Bank or terminated by the Participating Funds in accordance with the agreement.
On the Effective Date, the Funds, along with certain other Participating Funds managed by the Manager, also entered into an uncommitted discretionary demand revolving line of credit (the “Uncommitted Line”) agreement with the Bank to be used to facilitate portfolio liquidity. The maximum borrowing amount under the Uncommitted Line is $50 million with interest at a rate equal to the higher of(a) one-month LIBOR plus 1.25% per annum or (b) the Federal Funds rate plus 1.25% per annum on each outstanding loan. Each of the Participating
33
American Beacon FundsSM
Notes to Financial Statements
June 30, 2019
Funds will pay a closing fee of $35,000 on the Effective Date. The Uncommitted Line expires November 14, 2019 unless extended by the Bank or terminated by the Participating Funds in accordance with the agreement.
The Participating Funds paid administration, legal and arrangement fees, which are recognized as a component of “Other expenses” on the Statements of Operations, along with commitment fees, that have been allocated among the Participating Funds based on average daily net assets.
During the year ended June 30, 2019, the Funds did not utilize this facility.
10. Capital Share Transactions
The tables below summarize the activity in capital shares for each Class of the Funds:
| Institutional Class | ||||||||||||||||||||||||||||
| Year Ended June 30, 2019 | September 12, 2017A to June 30, 2018 | |||||||||||||||||||||||||||
Shapiro Equity Opportunities Fund | Shares | Amount | Shares | Amount | ||||||||||||||||||||||||
| Shares sold | 759,395 | $ | 8,443,778 | 4,171,644 | B | $ | 44,283,809 | B | ||||||||||||||||||||
| Reinvestment of dividends | 130,945 | 1,211,245 | 547 | 5,901 | ||||||||||||||||||||||||
| Shares redeemed | (79,687 | ) | (878,814 | ) | (293,341 | ) | (3,324,098 | ) | ||||||||||||||||||||
|
|
|
|
|
|
|
| |||||||||||||||||||||
| Net increase in shares outstanding | 810,653 | $ | 8,776,209 | 3,878,850 | $ | 40,965,612 | ||||||||||||||||||||||
|
|
|
|
|
|
|
| |||||||||||||||||||||
| Y Class | ||||||||||||||||||||||||||||
| Year Ended June 30, 2019 | September 12, 2017A to June 30, 2018 | |||||||||||||||||||||||||||
Shapiro Equity Opportunities Fund | Shares | Amount | Shares | Amount | ||||||||||||||||||||||||
| Shares sold | 1,553,828 | $ | 16,745,549 | 2,348,499 | B | $ | 25,754,034 | B | ||||||||||||||||||||
| Reinvestment of dividends | 76,492 | 707,549 | 15 | 167 | ||||||||||||||||||||||||
| Shares redeemed | (820,703 | ) | (7,762,611 | ) | (10,015 | ) | (113,876 | ) | ||||||||||||||||||||
|
|
|
|
|
|
|
| |||||||||||||||||||||
| Net increase in shares outstanding | 809,617 | $ | 9,690,487 | 2,338,499 | $ | 25,640,325 | ||||||||||||||||||||||
|
|
|
|
|
|
|
| |||||||||||||||||||||
| Investor Class | ||||||||||||||||||||||||||||
| Year Ended June 30, 2019 | September 12, 2017A to June 30, 2018 | |||||||||||||||||||||||||||
Shapiro Equity Opportunities Fund | Shares | Amount | Shares | Amount | ||||||||||||||||||||||||
| Shares sold | 59,227 | $ | 642,126 | 22,070 | B | $ | 128,330 | B | ||||||||||||||||||||
| Reinvestment of dividends | 1,391 | 12,800 | 21 | 225 | ||||||||||||||||||||||||
| Shares redeemed | (10,971 | ) | (113,275 | ) | (6,027 | ) | (63,103 | ) | ||||||||||||||||||||
|
|
|
|
|
|
|
| |||||||||||||||||||||
| Net increase in shares outstanding | 49,647 | $ | 541,651 | 16,064 | $ | 65,452 | ||||||||||||||||||||||
|
|
|
|
|
|
|
| |||||||||||||||||||||
| Institutional Class | ||||||||||||||||||||||||||||
| Year Ended June 30, 2019 | September 12, 2017A to June 30, 2018 | |||||||||||||||||||||||||||
Shapiro SMID Cap Equity Fund | Shares | Amount | Shares | Amount | ||||||||||||||||||||||||
| Shares sold | 72,855 | $ | 727,095 | 449,932 | B | $ | 1,783,380 | B | ||||||||||||||||||||
| Reinvestment of dividends | 48,885 | 391,569 | - | - | ||||||||||||||||||||||||
| Shares redeemed | (27,245 | ) | (251,564 | ) | - | - | ||||||||||||||||||||||
|
|
|
|
|
|
|
| |||||||||||||||||||||
| Net increase in shares outstanding | 94,495 | $ | 867,100 | 449,932 | $ | 1,783,380 | ||||||||||||||||||||||
|
|
|
|
|
|
|
| |||||||||||||||||||||
| Y Class | ||||||||||||||||||||||||||||
| Year Ended June 30, 2019 | September 12, 2017A to June 30, 2018 | |||||||||||||||||||||||||||
Shapiro SMID Cap Equity Fund | Shares | Amount | Shares | Amount | ||||||||||||||||||||||||
| Shares sold | 37,537 | $ | 345,903 | 49,895 | B | $ | 449,955 | B | ||||||||||||||||||||
| Reinvestment of dividends | 1,777 | 14,218 | - | - | ||||||||||||||||||||||||
| Shares redeemed | (17,256 | ) | (167,561 | ) | (30,942 | ) | (339,128 | ) | ||||||||||||||||||||
|
|
|
|
|
|
|
| |||||||||||||||||||||
| Net increase in shares outstanding | 22,058 | $ | 192,560 | 18,953 | $ | 110,827 | ||||||||||||||||||||||
|
|
|
|
|
|
|
| |||||||||||||||||||||
34
American Beacon FundsSM
Notes to Financial Statements
June 30, 2019
| Investor Class | ||||||||||||||||||||||||||||
| Year Ended June 30, 2019 | September 12, 2017A to June 30, 2018 | |||||||||||||||||||||||||||
Shapiro SMID Cap Equity Fund | Shares | Amount | Shares | Amount | ||||||||||||||||||||||||
| Shares sold | 88,862 | $ | 916,472 | 33,037 | B | $ | 253,249 | B | ||||||||||||||||||||
| Reinvestment of dividends | 5,916 | 47,151 | - | - | ||||||||||||||||||||||||
| Shares redeemed | (9,856 | ) | (98,294 | ) | (1,964 | ) | (20,096 | ) | ||||||||||||||||||||
|
|
|
|
|
|
|
| |||||||||||||||||||||
| Net increase in shares outstanding | 84,922 | $ | 865,329 | 31,073 | $ | 233,153 | ||||||||||||||||||||||
|
|
|
|
|
|
|
| |||||||||||||||||||||
| A | Commencement of operations. |
| B | Seed capital was received on September 12, 2017 in the amount of $2,800,000, $100,000, and $100,000 for the Institutional, Y, and Investor Classes, respectively. As a result, shares were issued in the amounts of 280,000, 10,000, and 10,000 for the Institutional, Y, and Investor Classes, respectively, for both Funds. |
11. Subsequent Events
Management has evaluated subsequent events for possible recognition or disclosure in the financial statements through the date the financial statements are issued. Management has determined that there are no material events that would require disclosure in the Funds’ financial statements through this date.
35
American Beacon Shapiro Equity Opportunities FundSM
Financial Highlights
(For a share outstanding throughout the period)
| Institutional Class | ||||||||||||
| Year Ended June 30, 2019 | September 12, 2017A to June 30, 2018 | |||||||||||
|
| |||||||||||
Net asset value, beginning of period | $ | 11.29 | $ | 10.00 | ||||||||
|
|
|
| |||||||||
Income (loss) from investment operations: | ||||||||||||
Net investment income | 0.11 | 0.02 | ||||||||||
Net gains on investments (both realized and unrealized) | 0.16 | 1.29 | ||||||||||
|
|
|
| |||||||||
Total income (loss) from investment operations | 0.27 | 1.31 | ||||||||||
|
|
|
| |||||||||
Less distributions: | ||||||||||||
Dividends from net investment income | (0.07 | ) | (0.02 | ) | ||||||||
Distributions from net realized gains | (0.21 | ) | (0.00 | )B | ||||||||
|
|
|
| |||||||||
Total distributions | (0.28 | ) | (0.02 | ) | ||||||||
|
|
|
| |||||||||
Net asset value, end of period | $ | 11.28 | $ | 11.29 | ||||||||
|
|
|
| |||||||||
Total returnC | 2.97 | % | 13.07 | %D | ||||||||
|
|
|
| |||||||||
Ratios and supplemental data: |
| |||||||||||
Net assets, end of period | $ | 52,917,588 | $ | 43,796,676 | ||||||||
Ratios to average net assets: | ||||||||||||
Expenses, before reimbursements | 0.98 | % | 2.81 | %E | ||||||||
Expenses, net of reimbursements | 0.79 | % | 0.79 | %E | ||||||||
Net investment income (loss), before expense reimbursements | 0.80 | % | (1.53 | )%E | ||||||||
Net investment income, net of reimbursements | 0.99 | % | 0.49 | %E | ||||||||
Portfolio turnover rate | 54 | % | 9 | %F | ||||||||
| A | Commencement of operations. |
| B | Amount represents less than $0.01 per share. |
| C | Based on net asset value, which does not reflect the sales charge, redemption fee, or contingent deferred sales charge, if applicable. May include adjustments in accordance with U.S. GAAP and as such, the net asset value for reporting purposes and the returns based upon those net asset values may differ from the net asset value and returns for shareholder transactions. |
| D | Not annualized. |
| E | Annualized. |
| F | Portfolio turnover rate is for the period from September 12, 2017 through June 30, 2018 and is not annualized. |
See accompanying notes
36
American Beacon Shapiro Equity Opportunities FundSM
Financial Highlights
(For a share outstanding throughout the period)
| Y Class | ||||||||||||
| Year Ended June 30, 2019 | September 12, 2017A to June 30, 2018 | |||||||||||
|
| |||||||||||
Net asset value, beginning of period | $ | 11.30 | $ | 10.00 | ||||||||
|
|
|
| |||||||||
Income (loss) from investment operations: | ||||||||||||
Net investment income | 0.10 | 0.03 | ||||||||||
Net gains on investments (both realized and unrealized) | 0.16 | 1.29 | ||||||||||
|
|
|
| |||||||||
Total income (loss) from investment operations | 0.26 | 1.32 | ||||||||||
|
|
|
| |||||||||
Less distributions: | ||||||||||||
Dividends from net investment income | (0.07 | ) | (0.02 | ) | ||||||||
Distributions from net realized gains | (0.21 | ) | (0.00 | )B | ||||||||
|
|
|
| |||||||||
Total distributions | (0.28 | ) | (0.02 | ) | ||||||||
|
|
|
| |||||||||
Net asset value, end of period | $ | 11.28 | $ | 11.30 | ||||||||
|
|
|
| |||||||||
Total returnD | 2.88 | % | 13.17 | %C | ||||||||
|
|
|
| |||||||||
Ratios and supplemental data: |
| |||||||||||
Net assets, end of period | $ | 35,505,884 | $ | 26,419,367 | ||||||||
Ratios to average net assets: | ||||||||||||
Expenses, before reimbursements | 1.06 | % | 2.77 | %E | ||||||||
Expenses, net of reimbursements | 0.89 | % | 0.89 | %E | ||||||||
Net investment income (loss), before expense reimbursements | 0.77 | % | (0.79 | )%E | ||||||||
Net investment income, net of reimbursements | 0.94 | % | 1.09 | %E | ||||||||
Portfolio turnover rate | 54 | % | 9 | %F | ||||||||
| A | Commencement of operations. |
| B | Amount represents less than $0.01 per share. |
| C | Not annualized. |
| D | Based on net asset value, which does not reflect the sales charge, redemption fee, or contingent deferred sales charge, if applicable. May include adjustments in accordance with U.S. GAAP and as such, the net asset value for reporting purposes and the returns based upon those net asset values may differ from the net asset value and returns for shareholder transactions. |
| E | Annualized. |
| F | Portfolio turnover rate is for the period from September 12, 2017 through June 30, 2018 and is not annualized. |
See accompanying notes
37
American Beacon Shapiro Equity Opportunities FundSM
Financial Highlights
(For a share outstanding throughout the period)
| Investor Class | ||||||||||||
| Year Ended June 30, 2019 | September 12, 2017A to June 30, 2018 | |||||||||||
|
| |||||||||||
Net asset value, beginning of period | $ | 11.25 | $ | 10.00 | ||||||||
|
|
|
| |||||||||
Income (loss) from investment operations: | ||||||||||||
Net investment income | 0.07 | 0.02 | ||||||||||
Net gains on investments (both realized and unrealized) | 0.16 | 1.25 | ||||||||||
|
|
|
| |||||||||
Total income (loss) from investment operations | 0.23 | 1.27 | ||||||||||
|
|
|
| |||||||||
Less distributions: | ||||||||||||
Dividends from net investment income | (0.07 | ) | (0.02 | ) | ||||||||
Distributions from net realized gains | (0.21 | ) | (0.00 | )B | ||||||||
|
|
|
| |||||||||
Total distributions | (0.28 | ) | (0.02 | ) | ||||||||
|
|
|
| |||||||||
Net asset value, end of period | $ | 11.20 | $ | 11.25 | ||||||||
|
|
|
| |||||||||
Total returnC | 2.62 | % | 12.67 | %D | ||||||||
|
|
|
| |||||||||
Ratios and supplemental data: |
| |||||||||||
Net assets, end of period | $ | 736,220 | $ | 180,767 | ||||||||
Ratios to average net assets: | ||||||||||||
Expenses, before reimbursements | 2.57 | % | 4.88 | %E | ||||||||
Expenses, net of reimbursements | 1.17 | % | 1.17 | %E | ||||||||
Net investment (loss), before expense reimbursements | (0.74 | )% | (3.54 | )%E | ||||||||
Net investment income, net of reimbursements | 0.66 | % | 0.17 | %E | ||||||||
Portfolio turnover rate | 54 | % | 9 | %F | ||||||||
| A | Commencement of operations. |
| B | Amount represents less than $0.01 per share. |
| C | Based on net asset value, which does not reflect the sales charge, redemption fee, or contingent deferred sales charge, if applicable. May include adjustments in accordance with U.S. GAAP and as such, the net asset value for reporting purposes and the returns based upon those net asset values may differ from the net asset value and returns for shareholder transactions. |
| D | Not annualized. |
| E | Annualized. |
| F | Portfolio turnover rate is for the period from September 12, 2017 through June 30, 2018 and is not annualized. |
See accompanying notes
38
American Beacon Shapiro SMID Cap Equity FundSM
Financial Highlights
(For a share outstanding throughout the period)
| Institutional Class | ||||||||||||
| Year Ended June 30, 2019 | September 12, 2017A to June 30, 2018 | |||||||||||
|
| |||||||||||
Net asset value, beginning of period | $ | 11.39 | $ | 10.00 | ||||||||
|
|
|
| |||||||||
Income (loss) from investment operations: | ||||||||||||
Net investment income | 0.05 | 0.01 | ||||||||||
Net gains (losses) on investments (both realized and unrealized) | (0.97 | ) | 1.38 | |||||||||
|
|
|
| |||||||||
Total income (loss) from investment operations | (0.92 | ) | 1.39 | |||||||||
|
|
|
| |||||||||
Less distributions: | ||||||||||||
Dividends from net investment income | (0.04 | ) | – | |||||||||
Distributions from net realized gains | (0.71 | ) | – | |||||||||
|
|
|
| |||||||||
Total distributions | (0.75 | ) | – | |||||||||
|
|
|
| |||||||||
Net asset value, end of period | $ | 9.72 | $ | 11.39 | ||||||||
|
|
|
| |||||||||
Total returnC | (6.67 | )% | 13.90 | %B | ||||||||
|
|
|
| |||||||||
Ratios and supplemental data: |
| |||||||||||
Net assets, end of period | $ | 5,293,291 | $ | 5,124,948 | ||||||||
Ratios to average net assets: | ||||||||||||
Expenses, before reimbursements | 2.84 | % | 4.32 | %D | ||||||||
Expenses, net of reimbursements | 0.89 | % | 0.89 | %D | ||||||||
Net investment (loss), before expense reimbursements | (1.47 | )% | (3.34 | )%D | ||||||||
Net investment income, net of reimbursements | 0.48 | % | 0.08 | %D | ||||||||
Portfolio turnover rate | 56 | % | 22 | %E | ||||||||
| A | Commencement of operations. |
| B | Not annualized. |
| C | Based on net asset value, which does not reflect the sales charge, redemption fee, or contingent deferred sales charge, if applicable. May include adjustments in accordance with U.S. GAAP and as such, the net asset value for reporting purposes and the returns based upon those net asset values may differ from the net asset value and returns for shareholder transactions. |
| D | Annualized. |
| E | Portfolio turnover rate is for the period from September 12, 2017 through June 30, 2018 and is not annualized. |
See accompanying notes
39
American Beacon Shapiro SMID Cap Equity FundSM
Financial Highlights
(For a share outstanding throughout the period)
| Y Class | ||||||||||||
| Year Ended June 30, 2019 | September 12, 2017A to June 30, 2018 | |||||||||||
|
| |||||||||||
Net asset value, beginning of period | $ | 11.39 | $ | 10.00 | ||||||||
|
|
|
| |||||||||
Income (loss) from investment operations: | ||||||||||||
Net investment income | 0.04 | 0.01 | ||||||||||
Net gains (losses) on investments (both realized and unrealized) | (0.97 | ) | 1.38 | |||||||||
|
|
|
| |||||||||
Total income (loss) from investment operations | (0.93 | ) | 1.39 | |||||||||
|
|
|
| |||||||||
Less distributions: | ||||||||||||
Dividends from net investment income | (0.04 | ) | – | |||||||||
Distributions from net realized gains | (0.71 | ) | – | |||||||||
|
|
|
| |||||||||
Total distributions | (0.75 | ) | – | |||||||||
|
|
|
| |||||||||
Net asset value, end of period | $ | 9.71 | $ | 11.39 | ||||||||
|
|
|
| |||||||||
Total returnC | (6.76 | )% | 13.90 | %B | ||||||||
|
|
|
| |||||||||
Ratios and supplemental data: |
| |||||||||||
Net assets, end of period | $ | 398,161 | $ | 215,795 | ||||||||
Ratios to average net assets: | ||||||||||||
Expenses, before reimbursements | 2.87 | % | 5.69 | %D | ||||||||
Expenses, net of reimbursements | 0.99 | % | 0.99 | %D | ||||||||
Net investment (loss), before expense reimbursements | (1.47 | )% | (4.47 | )%D | ||||||||
Net investment income, net of reimbursements | 0.41 | % | 0.22 | % | ||||||||
Portfolio turnover rate | 56 | % | 22 | %E | ||||||||
| A | Commencement of operations. |
| B | Not annualized. |
| C | Based on net asset value, which does not reflect the sales charge, redemption fee, or contingent deferred sales charge, if applicable. May include adjustments in accordance with U.S. GAAP and as such, the net asset value for reporting purposes and the returns based upon those net asset values may differ from the net asset value and returns for shareholder transactions. |
| D | Annualized. |
| E | Portfolio turnover rate is for the period from September 12, 2017 through June 30, 2018 and is not annualized. |
See accompanying notes
40
American Beacon Shapiro SMID Cap Equity FundSM
Financial Highlights
(For a share outstanding throughout the period)
| Investor Class | ||||||||||||
| Year Ended June 30, 2019 | September 12, 2017A to June 30, 2018 | |||||||||||
|
| |||||||||||
Net asset value, beginning of period | $ | 11.36 | $ | 10.00 | ||||||||
|
|
|
| |||||||||
Income (loss) from investment operations: | ||||||||||||
Net investment income (loss) | 0.04 | (0.01 | ) | |||||||||
Net gains (losses) on investments (both realized and unrealized) | (1.00 | ) | 1.37 | |||||||||
|
|
|
| |||||||||
Total income (loss) from investment operations | (0.96 | ) | 1.36 | |||||||||
|
|
|
| |||||||||
Less distributions: | ||||||||||||
Dividends from net investment income | (0.04 | ) | – | |||||||||
Distributions from net realized gains | (0.71 | ) | – | |||||||||
|
|
|
| |||||||||
Total distributions | (0.75 | ) | – | |||||||||
|
|
|
| |||||||||
Net asset value, end of period | $ | 9.65 | $ | 11.36 | ||||||||
|
|
|
| |||||||||
Total returnB | (7.06 | )% | 13.60 | %C | ||||||||
|
|
|
| |||||||||
Ratios and supplemental data: |
| |||||||||||
Net assets, end of period | $ | 1,119,472 | $ | 352,882 | ||||||||
Ratios to average net assets: | ||||||||||||
Expenses, before reimbursements | 3.87 | % | 6.12 | %D | ||||||||
Expenses, net of reimbursements | 1.27 | % | 1.27 | %D | ||||||||
Net investment (loss), before expense reimbursements | (2.44 | )% | (5.09 | )%D | ||||||||
Net investment income (loss), net of reimbursements | 0.16 | % | (0.24 | )%D | ||||||||
Portfolio turnover rate | 56 | % | 22 | %E | ||||||||
| A | Commencement of operations. |
| B | Based on net asset value, which does not reflect the sales charge, redemption fee, or contingent deferred sales charge, if applicable. May include adjustments in accordance with U.S. GAAP and as such, the net asset value for reporting purposes and the returns based upon those net asset values may differ from the net asset value and returns for shareholder transactions. |
| C | Not annualized. |
| D | Annualized. |
| E | Portfolio turnover rate is for the period from September 12, 2017 through June 30, 2018 and is not annualized. |
See accompanying notes
41
Federal Tax Information
June 30, 2019 (Unaudited)
Certain tax information regarding the Funds are required to be provided to shareholders based upon the Fund’s income and distributions for the taxable year ended June 30, 2019. The information and distributions reported herein may differ from information and distributions taxable to the shareholders for the calendar year ended December 31, 2018.
The Fund designated the following items with regard to distributions paid during the fiscal year ended June 30, 2019. All designations are based on financial information available as of this annual report and, accordingly, are subject to change. For each item, it is the intention of the Funds to designate the maximum amount permitted under the Internal Revenue Code of 1986, as amended, and the regulations there under.
Corporate Dividends-Received Deduction:
Shapiro Equity Opportunities | 36.75 | % | ||
Shapiro SMID Cap Equity | 11.15 | % |
Qualified Dividend Income:
Shapiro Equity Opportunities | 38.72 | % | ||
Shapiro SMID Cap Equity | 12.62 | % |
Long-Term Capital Gain Distributions:
Shapiro Equity Opportunities | $ | 112,500 | ||
Shapiro SMID Cap Equity | 56,149 |
Short-Term Capital Gain Distributions:
Shapiro Equity Opportunities | $ | 1,309,775 | ||
Shapiro SMID Cap Equity | 373,484 |
Shareholders will receive notification in January 2020 of the applicable tax information necessary to prepare their 2019 income tax returns.
42
Disclosure Regarding Approval of the Management and Investment
Advisory Agreements(Unaudited)
At in-person meetings held on May 9, 2019 and June 4-5, 2019 (collectively, the “Meetings”), the Board of Trustees (“Board” or “Trustees”) considered and then, at its June 5, 2019 meeting, approved the renewal of:
(1) the Management Agreement between American Beacon Advisors, Inc. (“Manager”) and the American Beacon Funds (“Trust”), on behalf of the American Beacon Shapiro Equity Opportunities Fund (“Equity Opportunities Fund”) and the American Beacon Shapiro SMID Cap Equity Fund (“SMID Cap Fund”) (each, a “Fund” and collectively, the “Funds”); and
(2) the Investment Advisory Agreement among the Manager, Shapiro Capital Management, LLC (the “subadvisor”), and the Trust, on behalf of the Funds.
The Management Agreement and the Investment Advisory Agreement are referred to herein individually as an “Agreement” and collectively as the “Agreements.” In preparation for its consideration of the renewal of the Agreements, the Board undertook steps to gather and consider information furnished by the Manager, the subadvisor, Broadridge, Inc. (“Broadridge”) and Morningstar, Inc. (“Morningstar”). The Board, with the assistance of independent legal counsel, requested and received certain relevant information from the Manager and the subadvisor.
In advance of the Meetings, the Board’s Investment Committee and/or the Manager coordinated the production of information from Broadridge and Morningstar regarding the performance, fees and expenses of the Funds as well as information from the Manager and the subadvisor. At the Meetings, the Board considered the information provided in connection with the renewal process, as well as information furnished to the Board throughout the year at regular meetings of the Board and its committees. In connection with the Board’s consideration of the Agreements, the Board received and evaluated such information as they deemed necessary. This information is described below in the section summarizing the factors the Board considered in connection with its renewal and approval of the Agreements, as well as the section describing additional Board considerations with respect to each Fund.
The Board noted that the Manager provides management and administrative services to the Funds pursuant to the Management Agreement. The Board considered that many mutual funds have separate contracts governing each type of service and observed that, with respect to such mutual funds, the actual management fee rates provided by Broadridge for peer group funds reflect the combined advisory and administrative expenses, reduced by any fee waivers and/or reimbursements.
A firm may not have been able to, or opted not to, provide information in response to certain information requests, in which case the Board conducted its evaluation of the firm based on information that was provided. In such cases, the Board determined that the omission of any such information was not material to its considerations. For each Fund, the class of shares used for comparative performance purposes was the share class with the lowest expenses available for purchase by the general public, which was the Institutional Class. The Board also considered that the use of Institutional Class performance generally facilitates a meaningful comparison for expense and performance purposes.
Provided below is an overview of certain factors the Board considered in connection with its renewal and approval of the Agreements. The Board did not identify any particular information that was most relevant to its consideration to renew or approve each Agreement, and each Trustee may have afforded different weight to the various factors. Legal counsel to the independent Trustees provided the Board with a memorandum regarding its responsibilities pertaining to the renewal and approval of investment advisory contracts, such as the Agreements. The memorandum explained the regulatory requirements surrounding the Board’s process for evaluating investment advisors and the terms of investment advisory contracts. Based on its evaluation, the Board unanimously concluded that the terms of each Agreement were reasonable and fair and that the renewal and approval of each Agreement was in the best interests of the Funds and their shareholders.
43
Disclosure Regarding Approval of the Management and Investment
Advisory Agreements(Unaudited)
Considerations With Respect to the Renewal of the Management Agreement and the Investment Advisory Agreement
In determining whether to renew the Agreements, the Board considered each Fund’s investment management and subadvisory relationships separately. In each instance, the Board considered, among other things, the following factors: (1) the nature, extent and quality of the services provided; (2) the investment performance of the Funds; (3) the costs incurred by the Manager and the subadvisor in rendering services to the Funds and their resulting profits or losses; (4) comparisons of services and fee rates with contracts entered into by the Manager or the subadvisor or their affiliates with other clients (such as pension funds and other institutional clients); (5) the extent to which economies of scale, if any, have been taken into account in setting each fee rate schedule; (6) whether fee rate levels reflect economies of scale, if any, for the benefit of Fund investors; and (7) any other benefits derived or anticipated to be derived by the Manager or the subadvisor from their relationships with the Funds.
Nature, Extent and Quality of Services. With respect to the renewal of the Management Agreement, the Board considered, among other factors: each Fund’s performance since its inception on September 12, 2017; the length of service of key investment personnel at the Manager; the cost structure of the Funds; the Manager’s culture of compliance and support that reduce risks to the Funds; the Manager’s quality of services; the Manager’s active role in monitoring and, as appropriate, recommending additional or replacement subadvisors; and the Manager’s efforts to retain key employees and maintain staffing levels.
With respect to the renewal of the Investment Advisory Agreement, the Board considered the level of staffing and the size of the subadvisor. The Board also considered the adequacy of the resources committed to the Funds by the subadvisor, and whether those resources were commensurate with the needs of the Funds and are sufficient to sustain appropriate levels of performance and compliance needs. In this regard, the Board considered the financial stability of the subadvisor. The Board also considered the subadvisor’s representations regarding its compliance program and code of ethics. Based on the foregoing information, the Board concluded that the nature, extent and quality of the management and advisory services provided by the Manager and the subadvisor were appropriate for each Fund.
Investment Performance. The Board evaluated the comparative information provided by Broadridge and the Manager regarding the performance of each Fund relative to its Broadridge performance universe, Morningstar Category, and/or benchmark index, as well as the Fund’s Morningstar rating. The Board considered the information provided by Broadridge regarding Broadridge’s independent methodology for selecting each Fund’s Broadridge performance universe. The Board also considered that the performance universes selected by Broadridge may not provide appropriate comparisons for a Fund. In addition, the Board considered the performance reports and discussions with management at Board and Committee meetings throughout the year. The Board also evaluated the comparative information provided by the subadvisor regarding the performance of each Fund relative to the performance of each Fund’s benchmark index and, with respect to the Equity Opportunities Fund, a composite of similar accounts. In addition, the Board considered the Manager’s recommendation to continue to retain the subadvisor. A discussion regarding the Board’s considerations with respect to each Fund’s performance appears below under “Additional Considerations and Conclusions with Respect to Each Fund.”
Costs of the Services Provided to the Funds and the Profits Realized by the Manager from its Relationship with the Funds. In analyzing the cost of services and profitability of the Manager, the Board considered the revenues earned and the expenses incurred by the Manager, before and after the payment of distribution-related expenses by the Manager. The profits or losses were noted at both an aggregate level for all funds within the group of mutual funds sponsored by the Manager (the “Fund Complex”) and at an individual Fund level, with the Manager sustaining a loss before and after the payment of distribution-related expenses by the Manager for each Fund. The Board also considered comparative information provided by the Manager regarding the Manager’s overall profitability with respect to the Fund Complex relative to the overall profitability of other firms in the mutual fund industry, as disclosed in publicly available sources. Although the Board noted that, in certain cases, the fee rates
44
Disclosure Regarding Approval of the Management and Investment
Advisory Agreements(Unaudited)
paid by other clients of the Manager are lower than the fee rates paid by the Funds, the Manager represented that, among other matters, the difference is attributable to the fact that the Manager does not perform administrative services for non-investment company clients and reflects the greater level of responsibility and regulatory requirements associated with managing the Funds.
The Board also noted that the Manager proposed to continue the expense waivers and reimbursements for the Funds that were in place during the last fiscal year. The Board further considered that, with respect to each Fund, the Management Agreement provides for the Manager to receive a management fee comprised of an annualized fee that is retained by the Manager. In addition, the Board considered that the Manager receives fees for overseeing the securities lending program on behalf of the Funds. The Board also noted that certain share classes of the Funds maintain higher expense ratios in order to compensate third-party financial intermediaries.
In analyzing the fee rates charged by the subadvisor in connection with its investment advisory services to the Funds, the Board considered representations made by subadvisor that the Manager has negotiated the lowest fee rate that the subadvisor charges for any comparable client accounts with respect to the Equity Opportunities Fund, and that the subadvisor does not manage any comparable client accounts with respect to the SMID Cap Fund. The Board also considered the cost of services and profitability of the subadvisor, noting that the subadvisor had represented that it had earned a profit with respect to the services that it provided to the Funds during the past year.
Based on the foregoing information, the Board concluded that the profitability levels of the Manager were reasonable in light of the services performed by the Manager and the profitability levels of the subadvisor were reasonable in light of the services performed by the subadvisor. A discussion regarding the Board’s considerations with respect to each Fund’s fee rates is set forth below under “Additional Considerations and Conclusions with Respect to Each Fund.”
Economies of Scale. In considering the reasonableness of the management and investment advisory fees rates, the Board considered whether economies of scale will be realized as each Fund grows and whether fee rate levels reflect these economies of scale for the benefit of Fund shareholders. In this regard, the Board considered that the Manager has negotiated breakpoints for the subadvisory fee rate for the Funds.
In addition, the Board noted the Manager’s representation that the Management Agreement contains fee schedule breakpoints at higher asset levels with respect to each Fund. Based on the foregoing information, the Board concluded that the Manager and subadvisor fee rate schedules for each Fund provide for a reasonable sharing of benefits from any economies of scale with each Fund.
Benefits Derived from the Relationship with the Funds.The Board considered the “fall-out” or ancillary benefits that accrue to the Manager and/or the subadvisor as a result of the advisory relationships with the Funds, including greater exposure in the marketplace with respect to the Manager’s or the subadvisor’s investment process and expanding the level of assets under management by the Manager and the subadvisor. The Board also considered that the Manager may invest the Funds’ cash balances and cash collateral provided by the borrowers of the Funds’ securities in the American Beacon U.S. Government Money Market Select Fund, which the Manager manages directly. Based on the foregoing information, the Board concluded that the potential benefits accruing to the Manager and the subadvisor by virtue of their relationships with the Funds appear to be fair and reasonable.
Additional Considerations and Conclusions with Respect to Each Fund
The performance comparisons below were made in comparison to each Fund’s Broadridge performance universe and Morningstar Category. With respect to the Broadridge performance universe, the 1st Quintile represents the top 20 percent of the universe based on performance and the 5th Quintile representing the bottom 20 percent of the universe based on performance. References below to each Fund’s Broadridge performance universe are to the universe of mutual funds with a comparable investment classification/objective included in the analysis provided by Broadridge.
45
Disclosure Regarding Approval of the Management and Investment
Advisory Agreements(Unaudited)
The expense comparisons below were made in comparison to each Fund’s Broadridge expense universe and Broadridge expense group, with the 1st Quintile representing the lowest 20 percent of the universe or group based on lowest total expense and the 5th Quintile representing the highest 20 percent of the universe or group based on highest total expense. References below to each Fund’s expense group and expense universe are to the respective group or universe of comparable mutual funds included in the analysis by Broadridge. A Broadridge expense group consists of the Fund and a representative sample of funds with similar operating structures and asset sizes, as selected by Broadridge. A Broadridge expense universe includes all funds in the investment classification/objective with a similar operating structure as the share class of the Fund included in the Broadridge comparative information and provides a broader view of expenses across the Fund’s investment classification/objective. The Board also considered each Fund’s Morningstar fee level category. In reviewing expenses, the Board considered the positive impact of fee waivers where applicable and the Manager’s agreement to continue the fee waivers. In addition, information regarding the subadvisor’s use of soft dollars was requested from the Manager and was considered by the Board.
Additional Considerations and Conclusions with Respect to the American Beacon Shapiro Equity Opportunities Fund
In considering the renewal of the Management Agreement and the Investment Advisory Agreement with the subadvisor for the Equity Opportunities Fund, the Board considered the following additional factors:
Broadridge Total Expense Analysis Excluding 12b-1 Fees and Morningstar Fee Level Ranking
Compared to Broadridge Expense Group | 3rd Quintile | |
Compared to Broadridge Expense Universe | 4th Quintile | |
Morningstar Fee Level Ranking – Institutional Class | Below Average Expense Ratio |
Broadridge and Morningstar Performance Analysis (one-year period ended December 31, 2018)
Compared to Broadridge Performance Universe | 2nd Quintile | |
Compared to Morningstar Category | 1st Quintile |
The Board also considered: (1) the subadvisor’s representation that the fee rate charged to the Equity Opportunities Fund is lower than the fee rate schedule for the subadvisor’s separate account clients in the same strategy as the Equity Opportunities Fund; (2) that the subadvisor is an affiliate of the Manager; and (3) the Manager’s recommendation to continue to retain the subadvisor based upon, among other factors, the relatively brief period that the Equity Opportunities Fund has been in operation.
Based on these and other considerations, the Board: (1) concluded that the fees paid to the Manager and the subadvisor under the Management and Investment Advisory Agreements are fair and reasonable; and (2) determined that the Equity Opportunities Fund and its shareholders would benefit from the Manager’s and subadvisor’s continued management of the Equity Opportunities Fund.
Additional Considerations and Conclusions with Respect to the American Beacon Shapiro SMID Cap Equity Fund
In considering the renewal of the Management Agreement and the Investment Advisory Agreement with the subadvisor for the SMID Cap Fund, the Board considered the following additional factors:
Broadridge Total Expense Analysis Excluding 12b-1 Fees and Morningstar Fee Level Ranking
Compared to Broadridge Expense Group | 1st Quintile | |
Compared to Broadridge Expense Universe | 3rd Quintile | |
Morningstar Fee Level Ranking – Institutional Class | Average Expense Ratio |
46
Disclosure Regarding Approval of the Management and Investment
Advisory Agreements(Unaudited)
Broadridge and Morningstar Performance Analysis (one-year period ended December 31, 2018)
Compared to Broadridge Performance Universe | 5th Quintile | |
Compared to Morningstar Category | 4th Quintile |
The Board also considered: (1) that the subadvisor is an affiliate of the Manager; (2) the subadvisor’s representation that it has no other comparable accounts in the same strategy as the subadvisor manages the SMID Cap Fund; and (3) the Manager’s recommendation to continue to retain the subadvisor based upon, among other factors, the relatively brief period that the SMID Cap Fund has been in operation.
Based on these and other considerations, the Board: (1) concluded that the fees paid to the Manager and the subadvisor under the Management and Investment Advisory Agreements are fair and reasonable; and (2) determined that the SMID Cap Fund and its shareholders would benefit from the Manager’s and subadvisor’s continued management of the SMID Cap Fund.
47
Trustees and Officers of the American Beacon FundsSM(Unaudited)
The Trustees and officers of the American Beacon Funds (the “Trust”) are listed below, together with their principal occupations during the past five years. The address of each person listed below is 220 Las Colinas Boulevard East, Suite 1200, Irving, Texas 75039. Each Trustee oversees thirty-seven funds in the fund complex that includes the Trust, the American Beacon Select Funds, the American Beacon Institutional Funds Trust, the American Beacon Sound Point Enhanced Income Fund and the American Beacon Apollo Total Return Fund. The Trust’s Statement of Additional Information contains additional information about the Trustees and is available without charge by calling 1-800-658-5811.
Name, Age and Address | Position, Term of | Principal Occupation(s) During Past 5 Years and Current Directorships | ||
| INTERESTED TRUSTEES | Term | |||
Lifetime of Trust until removal, resignation or retirement* | ||||
| Alan D. Feld** (82) | Trustee since 1996 | Partner in the law firm of Akin, Gump, Strauss, Hauer & Feld, LLP (law firm) (1960-Present); Trustee, American Beacon Select Funds (1999-Present); Trustee, American Beacon Institutional Funds Trust (2017-Present); Trustee, American Beacon Sound Point Enhanced Income Fund (2018–Present); Trustee, American Beacon Apollo Total Return Fund (2018–Present). | ||
| NON-INTERESTED TRUSTEES | Term | |||
Lifetime of Trust until removal, resignation or retirement* | ||||
| Gilbert G. Alvarado (49) | Trustee since 2015 | Director, Kura MD, Inc. (local telehealth organization) (2015-present); Vice President & CFO, Sierra Health Foundation (health conversion private foundation) (2006-Present); Vice President & CFO, Sierra Health Foundation: Center for Health Program Management (California public benefit corporation) (2012-Present); Director, Innovative North State (2012-2015); Director, Sacramento Regional Technology Alliance (2011-2016); Director, Women’s Empowerment (2009-2014); Director, Valley Healthcare Staffing (2017–present); Trustee, American Beacon Select Funds (2015-Present); Trustee, American Beacon Institutional Funds Trust (2017-Present); Trustee, American Beacon Sound Point Enhanced Income Fund (2018–Present); Trustee, American Beacon Apollo Total Return Fund (2018–Present). | ||
| Joseph B. Armes (57) | Trustee since 2015 | Chairman & CEO, CSW Industrials f/k/a Capital Southwest Corporation (investment company) (2015-Present); Chairman of the Board of Capital Southwest Corporation, predecessor to CSW Industrials, Inc. (2014-2017) (investment company); CEO, Capital Southwest Corporation (2013-2015); President & CEO, JBA Investment Partners (family investment vehicle) (2010-Present); Director and Chair of Audit Committee, RSP Permian (oil and gas producer) (2013-Present); Trustee, American Beacon Select Funds (2015-Present); Trustee, American Beacon Institutional Funds Trust (2017-Present); Trustee, American Beacon Sound Point Enhanced Income Fund (2018–Present); Trustee, American Beacon Apollo Total Return Fund (2018–Present). | ||
| Gerard J. Arpey (60) | Trustee since 2012 | Director, The Home Depot, Inc. (2015-Present); Partner, Emerald Creek Group (private equity firm) (2011-Present); Director, S.C. Johnson & Son, Inc. (privately held company) (2008-present); Trustee, American Beacon Select Funds (2012-Present); Trustee, American Beacon Institutional Funds Trust (2017-Present); Trustee, American Beacon Sound Point Enhanced Income Fund (2018–Present); Trustee, American Beacon Apollo Total Return Fund (2018–Present). | ||
48
Trustees and Officers of the American Beacon FundsSM(Unaudited)
Name, Age and Address | Position, Term of | Principal Occupation(s) During Past 5 Years and Current Directorships | ||
| NON-INTERESTED TRUSTEES (CONT.) | Term | |||
Lifetime of Trust until removal, resignation or retirement* | ||||
| Brenda A. Cline (58) | Trustee since 2004 Chair since 2019 Vice Chair 2018 | Chief Financial Officer, Treasurer and Secretary, Kimbell Art Foundation (1993-Present); Director, Tyler Technologies, Inc. (public sector software solutions company) (2014-Present); Director, Range Resources Corporation (oil and natural gas company) (2015-Present); Trustee, Cushing Closed-End and Open-End Funds and ETFs (2017-Present); Trustee, American Beacon Select Funds (2004-Present); Trustee, American Beacon Institutional Funds Trust (2017-Present); Trustee, American Beacon Sound Point Enhanced Income Fund (2018–Present); Trustee, American Beacon Apollo Total Return Fund (2018–Present). | ||
| Eugene J. Duffy (64) | Trustee since 2008 | Managing Director, Global Investment Management Distribution, Mesirow Financial (2016-Present); Managing Director, Institutional Services, Intercontinental Real Estate Corporation (2014-Present); Principal and Executive Vice President, Paradigm Asset Management (1994-2014); Trustee, American Beacon Select Funds (2008-Present); Trustee, American Beacon Institutional Funds Trust (2017-Present); Trustee, American Beacon Sound Point Enhanced Income Fund (2018–Present); Trustee, American Beacon Apollo Total Return Fund (2018–Present). | ||
| Claudia A. Holz (61) | Trustee since 2018 | Partner, KPMG LLP (1990–2017); Trustee, American Beacon Select Funds (2018-Present); Trustee, American Beacon Institutional Funds Trust (2018-Present); Trustee, American Beacon Sound Point Enhanced Income Fund (2018–Present); Trustee, American Beacon Apollo Total Return Fund (2018–Present). | ||
| Douglas A. Lindgren (57) | Trustee since 2018 | CEO North America, Carne Global Financial Services (2016-2017); Managing Director, IPS Investment Management and Global Head, Content Management, UBS Wealth Management (2010-2016); Trustee, American Beacon Select Funds (2018-Present); Trustee, American Beacon Institutional Funds Trust (2018-Present); Trustee, American Beacon Sound Point Enhanced Income Fund (2018–Present); Trustee, American Beacon Apollo Total Return Fund (2018–Present). | ||
| Richard A. Massman (75) | Trustee since 2004 Chair 2008-2018 Chair Emeritus since 2019 | Consultant and General Counsel Emeritus, Hunt Consolidated, Inc. (holding company engaged in oil and gas exploration and production, refining, real estate, farming, ranching and venture capital activities) (2009-Present); Trustee, American Beacon Select Funds (2004-Present); Trustee, American Beacon Institutional Funds Trust (2017-Present); Trustee, American Beacon Sound Point Enhanced Income Fund (2018–Present); Trustee, American Beacon Apollo Total Return Fund (2018–Present). | ||
| Barbara J. McKenna, CFA (56) | Trustee since 2012 | President/Managing Principal, Longfellow Investment Management Company (2005-Present); Trustee, American Beacon Select Funds (2012-Present); Trustee, American Beacon Institutional Funds Trust (2017-Present); Trustee, American Beacon Sound Point Enhanced Income Fund (2018–Present); Trustee, American Beacon Apollo Total Return Fund (2018–Present). | ||
| R. Gerald Turner (73) | Trustee since 2001 | President, Southern Methodist University (1995-Present); Director, J.C. Penney Company, Inc. (1996-Present); Director, Kronus Worldwide Inc. (chemical manufacturing) (2003-Present); Trustee, American Beacon Select Funds (2001-Present); Trustee, American Beacon Institutional Funds Trust (2017-Present); Trustee, American Beacon Sound Point Enhanced Income Fund (2018–Present); Trustee, American Beacon Apollo Total Return Fund (2018–Present). | ||
49
Trustees and Officers of the American Beacon FundsSM(Unaudited)
Name, Age and Address | Position, Term of | Principal Occupation(s) During Past 5 Years and Current Directorships | ||
| OFFICERS | Term | |||
| One Year | ||||
| Gene L. Needles, Jr. (64) | President since 2009 | President (2009-2018), CEO and Director (2009–Present), and Chairman (2018-Present), American Beacon Advisors, Inc., President (2015-2018), Director and CEO (2015–Present), and Chairman (2018-Present), Resolute Investment Holdings, LLC; President (2015-2018), Director and CEO (2015-Present), and Chairman (2018-Present), Resolute Topco, Inc.; President (2015-2018); Director, and CEO (2015-Present), and Chairman (2018-Present), Resolute Acquisition, Inc.; President (2015-2018), Director and CEO (2015-Present), Chairman (2018-Present), Resolute Investment Managers, Inc.; Director, Chairman, President and CEO, Resolute Investment Distributors (2017-Present); Director, Chairman, President and CEO; Resolute Investment Services, Inc. (2017-Present); President and CEO, Lighthouse Holdings Parent, Inc. (2009-2015); President, CEO and Director, Lighthouse Holdings, Inc. (2009-2015); Manager, President and CEO, American Private Equity Management, LLC (2012-Present); Director, Chairman, President and CEO, Alpha Quant Advisors, LLC (2016-Present); Director, ARK Investment Management LLC (2016-Present); Director, Shapiro Capital Management LLC (2017-Present); Director, Chairman and CEO, Continuous Capital, LLC (2018-Present); President, American Beacon Cayman Managed Futures Strategy Fund, Ltd. (2014-Present); Director and President, American Beacon Cayman Transformational Innovation Company, LTD., (2017-2018); President, American Beacon Delaware Transformational Innovation Corporation (2017-2018); President American Beacon Cayman TargetRisk Company, Ltd. (2018-Present); Member, Investment Advisory Committee, Employees Retirement System of Texas (2017-Present); Trustee, American Beacon NextShares Trust (2015-Present); President, American Beacon Select Funds (2009-Present); President, American Beacon Institutional Funds Trust (2017-Present); President, American Beacon Sound Point Enhanced Income Fund (2018-Present); President, American Beacon Apollo Total Return Fund (2018-Present); Director, RSW Investments Holdings LLC, (2019-Present); Director, SSI Investment Management, LLC (2019-Present). | ||
| Rosemary K. Behan (60) | VP, Secretary and Chief Legal Officer since 2006 | Vice President, Secretary and General Counsel, American Beacon Advisors, Inc. (2006-Present); Secretary, Resolute Investment Holdings, LLC(2015-Present); Secretary, Resolute Topco, Inc. (2015-Present); Secretary, Resolute Acquisition, Inc. (2015–Present); Vice President, Secretary and General Counsel, Resolute Investment Managers, Inc. (2015-Present); Secretary, Resolute Investment Distributors, Inc. (2017-Present); Vice President, Secretary and General Counsel, Resolute Investment Services, Inc. (2017-Present); Vice President and Secretary, Lighthouse Holdings Parent, Inc. (2008-2015); Vice President and Secretary, Lighthouse Holdings, Inc. (2008-2015); Secretary, American Private Equity Management, LLC (2008-Present); Secretary and General Counsel, Alpha Quant Advisors, LLC (2016-Present); Vice President and Secretary, Continuous Capital, LLC (2018-Present); Secretary, American Beacon Delaware Transformational Innovation Corporation (2017-2018); Secretary, American Beacon Cayman Transformational Innovation Company, Ltd. (2017-2018); Secretary, American Beacon Cayman Managed Futures Strategy Fund, Ltd. (2014-Present); Secretary, American Beacon Cayman TargetRisk Company, Ltd (2018-Present); Chief Legal Officer, Vice President and Secretary, American Beacon Select Funds (2006-Present); Chief Legal Officer, Vice President and Secretary, American Beacon Institutional Funds Trust (2017-Present); Chief Legal Officer, Vice President and Secretary, American Beacon Sound Point Enhanced Income Fund (2018-Present); Chief Legal Officer, Vice President and Secretary American Beacon Apollo Total Return Fund (2018-Present). | ||
50
Trustees and Officers of the American Beacon FundsSM(Unaudited)
Name, Age and Address | Position, Term of | Principal Occupation(s) During Past 5 Years and Current Directorships | ||
| OFFICERS (CONT.) | Term | |||
| One Year | ||||
| Brian E. Brett (59) | VP since 2004 | Senior Vice President, Head of Distribution (2012-Present), Vice President, Director of Sales (2004-2012), American Beacon Advisors, Inc.; Senior Vice President, Resolute Investment Managers, Inc. (2017-Present); Senior Vice President, Resolute Investment Distributors, Inc. (2018-Present), Senior Vice President, Resolute Investment Services, Inc. (2018-Present); Senior Vice President, Lighthouse Holdings Parent, Inc. (2008-2015); Senior Vice President, Lighthouse Holdings, Inc. (2008-2015); Vice President, American Beacon Select Funds (2004-Present); Vice President, American Beacon Institutional Funds Trust (2017-Present); Vice President American Beacon Sound Point Enhanced Income Fund (2018-Present); Vice President American Beacon Apollo Total Return Fund (2018-Present). | ||
| Paul B. Cavazos (50) | VP since 2016 | Chief Investment Officer and Senior Vice President, American Beacon Advisors, Inc. (2016-Present); Chief Investment Officer, DTE Energy (2007-2016); Vice President, American Private Equity Management, L.L.C. (2017–Present); Vice President, American Beacon Select Funds (2016-Present); Vice President, American Beacon Institutional Funds Trust (2017-Present); Vice President American Beacon Sound Point Enhanced Income Fund (2018-Present); Vice President American Beacon Apollo Total Return Fund (2018-Present). | ||
| Erica Duncan (48) | VP Since 2011 | Vice President, American Beacon Advisors, Inc. (2011-Present); Vice President, Resolute Investment Managers (2018-Present); Vice President, Resolute Investment Services, Inc. (2018-Present); Vice President, American Beacon Select Funds (2011-Present); Vice President, American Beacon Institutional Funds Trust (2017-Present); Vice President American Beacon Sound Point Enhanced Income Fund (2018-Present); Vice President American Beacon Apollo Total Return Fund (2018-Present). | ||
| Melinda G. Heika (58) | Treasurer since 2010 | Treasurer and CFO (2010-Present), American Beacon Advisors, Inc.; Treasurer, Resolute Topco, Inc. (2015-Present); Treasurer, Resolute Investment Holdings, LLC. (2015-Present); Treasurer, Resolute Acquisition, Inc. (2015-Present); Treasurer and CFO, Resolute Investment Managers, Inc. (2017-Present); Treasurer, Resolute Investment Distributors, Inc. (2017-2017); Treasurer and CFO, Resolute Investment Services, Inc. (2015-Present); Treasurer, Lighthouse Holdings Parent Inc., (2010-2015); Treasurer, Lighthouse Holdings, Inc. (2010-2015); Treasurer, American Private Equity Management, LLC (2012-Present); Treasurer and CFO, Alpha Quant Advisors, LLC (2016-Present); Treasurer and CFO, Continuous Capital, LLC (2018-Present); Treasurer, American Beacon Cayman Transformational Innovation, Ltd. (2017-2018); Treasurer, American Beacon Delaware Transformational Innovation Corporation (2017-2018); Director and Treasurer, American Beacon Cayman Managed Futures Strategy Fund, Ltd. (2014-Present); Treasurer, American Beacon Cayman TargetRisk Company, Ltd. (2018-Present); Treasurer, American Beacon Select Funds (2010-Present); Treasurer, American Beacon Institutional Funds Trust (2017-Present); Treasurer, American Beacon Sound Point Enhanced Income Fund (2018-Present); Treasurer, American Beacon Apollo Total Return Fund (2018-Present). | ||
| Terri L. McKinney (55) | VP since 2010 | Vice President (2009-Present), Managing Director (2003-2009), American Beacon Advisors, Inc.; Vice President, Resolute Investment Managers, Inc. (2017-Present); Vice President, Resolute Investment Services, Inc (2018-Present); Vice President, Alpha Quant Advisors, LLC (2016-Present); Vice President, Continuous Capital, LLC (2018-Present); Vice President, American Beacon Select Funds (2010-Present); Vice President, American Beacon Institutional Funds Trust (2017-Present); Vice President, American Beacon Sound Point Enhanced Income Fund (2018-Present); Vice President, American Beacon Apollo Total Return Fund (2018-Present). | ||
51
Trustees and Officers of the American Beacon FundsSM(Unaudited)
Name, Age and Address | Position, Term of | Principal Occupation(s) During Past 5 Years and Current Directorships | ||
| OFFICERS (CONT.) | Term | |||
| One Year | ||||
| Jeffrey K. Ringdahl (44) | VP since 2010 | Director (2015-Present), President (2018-Present), Chief Operating Officer (2010-Present), Senior Vice President (2013-2018), Vice President (2010-2013), American Beacon Advisors, Inc.; Director (2015-Present), President (2018-Present), Senior Vice Present (2015-2018), Resolute Investment Holdings, LLC; Director (2015-Present), President (2018-Present), Senior Vice President (2015-2018), Resolute Topco, Inc.; Director (2015-Present), President (2018-Present), Senior Vice President (2015-2018), Resolute Acquisition, Inc.; Director (2015-Present), President & COO (2018-Present), Senior Vice President (2015-2018), Resolute Investment Managers, Inc.; Director and Executive Vice President (2017-Present), Resolute Investment Distributors, Inc.; Director (2017-Present), President & COO (2018-Present), Executive Vice President (2017-2018), Resolute Investment Services, Inc.; Senior Vice President (2017-Present), Vice President (2012-2017), Manager (2015-Present), American Private Equity Management, LLC; Senior Vice President, Lighthouse Holdings Parent, Inc. (2013-2015); Senior Vice President, Lighthouse Holdings, Inc. (2013-2015); Trustee, American Beacon NextShares Trust (2015-Present); Director, Executive Vice President & COO, Alpha Quant Advisors, LLC (2016-Present); Director, Shapiro Capital Management, LLC (2017-Present); Director, Executive Vice President & COO, Continuous Capital, LLC (2018-Present); Director and Vice President, American Beacon Cayman Transformational Innovation Company, Ltd., (2017-Present); Vice President, American Beacon Delaware Transformational Innovation Corporation (2017-2018); Director and Vice President, American Beacon Cayman Managed Futures Strategy Fund, Ltd. (2014-Present); Vice President, American Beacon Cayman TargetRisk Company, Ltd (2018-Present); Vice President, American Beacon Select Funds (2010-2018); Vice President, American Beacon Institutional Funds Trust (2017-Present); Vice President, American Beacon Sound Point Enhanced Income Fund (2018-Present); Vice President, American Beacon Apollo Total Return Fund (2018-Present); Director, RSW Investments Holdings LLC, (2019-Present); Director, SSI Investment Management, LLC (2019-Present). | ||
| Samuel J. Silver (56) | VP Since 2011 | Vice President (2011-Present), Chief Fixed Income Officer (2016-Present), American Beacon Advisors, Inc. (2011-Present); Vice President, American Beacon Select Funds (2011-Present); Vice President, American Beacon Institutional Funds Trust (2017-Present); Vice President, American Beacon Sound Point Enhanced Income Fund (2018-Present); Vice President, American Beacon Apollo Total Return Fund (2018-Present). | ||
| Christina E. Sears (47) | Chief Compliance Officer since 2004 and Asst. Secretary since 1999 | Vice President, American Beacon Advisors, Inc. (2019-Present); Chief Compliance Officer, American Beacon Advisors, Inc. (2004-Present); Vice President, Resolute Investment Managers, Inc. (2017-Present); Vice President, Resolute Investment Distributors (2017-Present); Vice President, Resolute Investment Services, Inc. (2019-Present); Chief Compliance Officer, American Private Equity Management, LLC (2012-Present); Chief Compliance Officer (2016-2019) and Vice President, Alpha Quant Advisors, LLC (2016-Present); Vice President, Continuous Capital, LLC (2018-Present); Chief Compliance Officer (2004-Present) and Assistant Secretary (1999-Present), American Beacon Select Funds; Chief Compliance Officer and Assistant Secretary, American Beacon Institutional Funds Trust (2017-Present); Chief Compliance Officer and Assistant Secretary, American Beacon Sound Point Enhanced Income Fund (2018-Present); Chief Compliance Officer and Assistant Secretary, American Beacon Apollo Total Return Fund (2018-Present). | ||
52
Trustees and Officers of the American Beacon FundsSM(Unaudited)
Name, Age and Address | Position, Term of | Principal Occupation(s) During Past 5 Years and Current Directorships | ||
| OFFICERS (CONT.) | Term | |||
| One Year | ||||
| Sonia L. Bates (62) | Asst. Treasurer since 2011 | Assistant Treasurer, American Beacon Advisors, Inc. (2011-2018); Assistant Treasurer, Lighthouse Holdings Parent Inc. (2011-2015); Assistant Treasurer, Lighthouse Holdings, Inc. (2011-2015); Assistant Treasurer, American Private Equity Management, LLC (2012-Present); Assistant Treasurer, American Beacon Cayman Transformational Innovation Company, Ltd. (2017-Present); Assistant Treasurer, American Beacon Cayman TargetRisk Company, Ltd. (2018-Present); Assistant Treasurer, American Beacon Select Funds (2011-Present); Assistant Treasurer, American Beacon Institutional Funds Trust (2017-Present); Assistant Treasurer, American Beacon Sound Point Enhanced Income Fund (2018-Present); Assistant Treasurer, American Beacon Apollo Total Return Fund (2018-Present). | ||
| Shelley D. Abrahams (44) | Assistant Secretary since 2008 | Assistant Secretary, American Beacon Select Funds (2008-Present); Assistant Secretary, American Beacon Institutional Funds Trust (2017-Present); Assistant Secretary, American Beacon Sound Point Enhanced Income Fund (2018-Present); Assistant Secretary, American Beacon Apollo Total Return Fund (2018-Present). | ||
| Rebecca L. Harris (52) | Assistant Secretary since 2010 | Vice President, American Beacon Advisors, Inc. (2011-Present); Vice President, Resolute Investment Managers, Inc. (2017-Present); Vice President, Resolute Investment Services (2018-Present); Vice President, Alpha Quant Advisors, LLC (2016-Present); Vice President, Continuous Capital, LLC (2018-Present); Assistant Secretary, American Beacon Select Funds (2010-Present); Assistant Secretary, American Beacon Institutional Funds Trust (2017-Present); Assistant Secretary, American Beacon Sound Point Enhanced Income Fund (2018-Present); Assistant Secretary, American Beacon Apollo Total Return Fund (2018-Present). | ||
| Teresa A. Oxford (60) | Assistant Secretary since 2015 | Assistant Secretary, American Beacon Advisors, Inc. (2015-Present); Assistant Secretary, Resolute Investment Distributors (2018-Present); Assistant Secretary, Resolute Investment Services (2018-Present); Assistant Secretary, Alpha Quant Advisors, LLC (2016-Present); Assistant Secretary, American Beacon Select Funds (2015-Present); Assistant Secretary, American Beacon Institutional Funds Trust (2017-Present); Assistant Secretary, American Beacon Sound Point Enhanced Income Fund (2018-Present); Assistant Secretary, American Beacon Apollo Total Return Fund (2018-Present). | ||
* As of 11/12/2014, the Board adopted a retirement plan that requires Trustees, other than Messrs. Feld and Massman to retire no later than the last day of the calendar year in which they reach the age of 75. As of 11/7/17, the Board approved a waiver of the mandatory retirement policy with respect to Mr. Massman, who turned 75 in November 2018, to permit him to continue to serve on the Board as Chair Emeritus through 12/31/19.
** Mr. Feld is deemed to be an “interested person” of the Trusts, as defined by the 1940 Act. Mr. Feld’s law firm of Akin, Gump, Strauss, Hauer & Feld LLP has provided legal services within the past two fiscal years to one or more of the Trust’s sub-advisors
53
Privacy Policy
June 30, 2019 (Unaudited)
The American Beacon Funds recognize and respect the privacy of our shareholders. We are providing this notice to you so you will understand how shareholder information may be collected and used.
We may collect nonpublic personal information about you from one or more of the following sources:
| • | information we receive from you on applications or other forms; |
| • | information about your transactions with us or our service providers; and |
| • | information we receive from third parties. |
We do not disclose any nonpublic personal information about our customers or former customers to anyone, except as permitted by law.
We restrict access to your nonpublic personal information to those employees or service providers who need to know that information to provide products or services to you. To ensure the confidentiality of your nonpublic personal information, we maintain safeguards that comply with federal standards.
54
This page intentionally left blank.
55
This page intentionally left blank.
56

Delivery of Documents
eDelivery isNOW AVAILABLE- Stop traditional mail delivery and receive your
shareholder reports and summary prospectuson-line. Sign up at
www.americanbeaconfunds.com
If you invest in the Fund through a financial institution, you may be able to receive the Fund’s regulatory mailings, such as the Prospectus, Annual Report and Semi-Annual Report, bye-mail. If you are interested in this option, please go towww.icsdelivery.com and search for your financial institution’s name or contact your financial institution directly.
To obtain more information about the Fund:
 |  | |
| ByE-mail: | On the Internet: | |
american_beacon.funds@ambeacon.com | Visit our website atwww.americanbeaconfunds.com | |
By Telephone: Call (800)658-5811 |
By Mail: American Beacon Funds P.O. Box 219643 Kansas City, MO 64121-9643 | |
| Availability of Quarterly Portfolio Schedules | Availability of Proxy Voting Policy and Records | |
| In addition to the Schedule of Investments provided in each semi-annual and annual report, the Fund files a complete schedule of its portfolio holdings with the Securities and Exchange Commission (“SEC”) on Form N-PORT as of the first and third fiscal quarters. The Fund’s Forms N-PORT are available on the SEC’s website atwww.sec.gov. The FormsN-PORT may also be reviewed and copied at the SEC’s Public Reference Section, 100 F Street, NE, Washington, D.C. 20549-2736. Information regarding the operation of the SEC’s Public Reference Room may be obtained by calling(800)-SEC-0330. A complete schedule of the Fund’s portfolio holdings is also available atwww.americanbeaconfunds.com approximately sixty days after the end of each quarter. | A description of the policies and procedures the Fund uses to determine how to vote proxies relating to portfolio securities is available in the Fund’s Statement of Additional Information, is available free of charge on the Fund’s websitewww.americanbeaconfunds.com and by calling1-800-967-9009 or by accessing the SEC’s website atwww.sec.gov. The Fund’s proxy voting record for the most recent year ended June 30 is filed annually with the SEC on FormN-PX. The Fund’s FormsN-PX are available on the SEC’s website atwww.sec.gov. The Fund’s proxy voting record may also be obtained by calling1-800-967-9009. | |


Fund Service Providers:
CUSTODIAN State Street Bank and Trust Company Boston, Massachusetts | TRANSFER AGENT DST Asset Manager Solutions, Inc. Quincy, Massachusetts | INDEPENDENT REGISTERED PUBLIC ACCOUNTING FIRM PricewaterhouseCoopers LLP Boston, Massachusetts | DISTRIBUTOR Resolute Investment Distributors, Inc. Irving, Texas |
This report is prepared for shareholders of the American Beacon Funds and may be distributed to others only if preceded or accompanied by a current Prospectus or Summary Prospectus.
American Beacon Funds, American Beacon Shapiro Equity Opportunities Fund and Shapiro SMID Cap Equity Fund are service marks of American Beacon Advisors, Inc.
AR 6/19
About American Beacon Advisors
Since 1986, American Beacon Advisors has offered a variety of products and investment advisory services to numerous institutional and retail clients, including a variety of mutual funds, corporate cash management, and separate account management.
Our clients include defined benefit plans, defined contribution plans, foundations, endowments, corporations, financial planners, and other institutional investors. With American Beacon Advisors, you can put the experience of a multi-billion dollar asset management firm to work for your company.
SSI ALTERNATIVE INCOME FUND
The use offixed-income securities, including convertible securities, entails interest rate and credit risks. In addition, the value of aconvertible security could fluctuate based on the value of the underlying stock. Investing inderivative instruments involves liquidity, credit, interest rate and market risks. The Fund’s investments inhigh-yield securities, includingrestricted securities and floating rate securities,are subject to greater levels of credit, interest rate, market and liquidity risks than investment-grade securities.Short sales involve special risks, including greater reliance on thesub-advisor’s ability to accurately anticipate the future value of a security or instrument; the Fund’s losses are potentially unlimited in a short sale. Investing in foreign and emerging market securities may involve heightened risk due to currency fluctuations and economic and political risks. Investing insmall- ormid-capitalization stocksmay involve greater volatility and lower liquidity than larger company stocks. Please see the prospectus for a complete discussion of the Fund’s risks. There can be no assurances that the investment objectives of this Fund will be met.
TWENTYFOUR STRATEGIC INCOME FUND
Investing inderivative instrumentsinvolves liquidity, credit, interest rate and market risks. Investments inhigh-yield securitiesare subject to greater levels of credit, interest rate, market and liquidity risks than investment-grade securities. Because the Fund may invest infewer issuersthan a more diversified portfolio, the fluctuating value of a single holding may have a greater effect on the value of the Fund. Investing inforeign and emerging market securitiesmay involve heightened risk due to currency fluctuations and economic and political risks. Please see the prospectus for a complete discussion of the Fund’s risks. There can be no assurances that the investment objectives of this Fund will be met.
Any opinions herein, including forecasts, reflect our judgment as of the end of the reporting period and are subject to change. Each advisor’s strategies and each Fund’s portfolio composition will change depending on economic and market conditions. This report is not a complete analysis of market conditions, and, therefore, should not be relied upon as investment advice. Although economic and market information has been compiled from reliable sources, American Beacon Advisors, Inc. makes no representation as to the completeness or accuracy of the statements contained herein.
American Beacon Funds | June 30, 2019 |
| 1 | ||||
| 2 | ||||
| 7 | ||||
| 9 | ||||
Schedules of Investments: | ||||
| 10 | ||||
| 21 | ||||
| 26 | ||||
| 30 | ||||
Financial Highlights: | ||||
| 62 | ||||
| 65 | ||||
| 71 | ||||
Disclosure Regarding Approvals of the Management and Investment Advisory Agreements | 72 | |||
| 81 | ||||
| 87 | ||||
| Back Cover | ||||
 | Dear Shareholders,
At American Beacon, we take our heritage as a fiduciary very seriously — and we apply that mindset to all aspects of our business as a fund manager. As a result, for more than 30 years, we have endeavored to:
u Identify, engage and oversee the best money managers.As a manager of managers, our goal is to engage the most effective money managers for each asset class, investment style and market strategy we offer. We are committed to partnering with those we judge to be “the best of the best” when it comes to choosingsub-advisors for our mutual funds. Whether ourdue-diligence process results in the selection of onesub-advisor or multiplesub-advisors, we select those we believe show the greatest potential to help us meet the high standards you’ve come to expect. |
| u | Offer a variety of innovative investment solutions. Our mutual funds — which span the domestic, international, global, frontier and emerging markets — aresub-advised by experienced money managers who employ distinctive, proprietary investment processes to manage assets through a variety of economic and market conditions. From offering some of the first multi-manager funds, one of the first retirement income funds and the first open-ended mutual fund in the U.S. to focus primarily on frontier-market debt, our robust history includes applying a disciplined, solutions-based approach to our product development process in an effort to help you grow your assets while mitigating risk. |
| u | Provide a solutions-based approach to achieving long-term investment goals.We seek to provide investment solutions that might enable you to benefit from taking a more disciplined approach to investing. Our mutual funds provide access to institutional-quality, research-intensive investment managers with diverse processes and styles. Over the long run, having such access and spending time in the market — rather than trying to time the market — may better position you to reach your long-term investment goals during market upswings and potentially insulate against market downswings. |
Our management approach is more than a concept; it’s the cornerstone of American Beacon’s culture. And we strive to employ it at every turn as we seek to provide a well-diversified line of investment solutions to help our shareholders seek long-term rewards.
Thank you for your continued interest in American Beacon. For additional information about our mutual funds or to access your account information, please visit our website atwww.americanbeaconfunds.com.
Best Regards,

Gene L. Needles, Jr.
President
American Beacon Funds
1
June 30, 2019 (Unaudited)
The negative headlines that punctuated much of 2018 coalesced into a wave of pessimism in the fourth quarter of 2018. Investor concerns around a variety of issues, including higher interest rates, heightened trade tensions and slowing global growth, ultimately overwhelmed a market that had displayed remarkable resiliency during most of the year’s first nine months. The U.S. High Yield market’s-2.19% return during the last month of the year was the worst monthly performance for credit in almost three years. The S&P 500 Index’s-9.03% return in December was the worst monthly performance for U.S. stocks since February 2009 and the worst December performance since the Great Depression.
The turmoil that enveloped the market in the second half of the fourth quarter coincided with a collapse in interest rates.Ten-year U.S. Treasury yields fell approximately 40 basis points to 2.70% during the final seven weeks of the year while the market quickly abandoned its expectation for two Federal Reserve (the “Fed”) rate hikes in 2019. Given their floating-rate nature, U.S. leveraged loans were particularly hard hit by the move lower in interest rates and experienced more than $40 billion of outflows in the fourth quarter, including almost $30 billion in December alone.
The rebound in the first half of 2019 was spurred by a radical Fed pivot toward dovishness, signaling no more rate hikes and an earlier cessation of quantitative tightening. Markets applauded the Fed’s efforts to support market stability; the S&P 500 rallied 13.65% during the first quarter, its best start to a year since 1998. The U.S. High Yield market posted a 7.40% quarterly gain, its highest reading since the third quarter of 2009, and spreads collapsed more than 100 basis points. The positive inflection in the market was almost immediate as High Yield notched a 4.59% return for the month of January alone. Lower interest rates and supportive market technicals also helped drive the first quarter rally in credit. Robust, high-yield inflows drove stronger asset demand while a lack of new deal activity constrained supply. Offsetting some of this good news was a weakness in net leveraged loan new issuance, which declined 30% year-over-year during the first quarter, suggesting theyear-end bout of market volatility negatively affected new deal-pipeline growth, which contributed to the lack of new supply during the first three months of 2019.
In May 2019, escalating global trade tensions brought about a broad-basedsell-off in risk assets. U.S.-China trade negotiations broke down as the Trump administration announced it would move ahead with tariff increases on U.S. imports from China. In retaliation, China imposed tariff increases on U.S. exports. As hopes for a U.S.-China trade deal evaporated, the Trump administration’s unanticipated announcement about establishing a tariff on all Mexican imports unless Mexico agreed to help stem the flow of illegal immigrants served to further exacerbate trade concerns. Amid this heightened level of trade uncertainty, global equity markets fell as investment-grade and high-yield spreads widened throughout the month. The risingrisk-off sentiment also led developed-market bond yields to fall sharply across the yield curve. In the U.S., thefront-end of the yield curve inverted for the second time in 2019 as the spread between the three-month and10-year Treasury yields turned negative. The three-month Treasury bill yield ended May at 2.35%, as compared to the10-year rate at 2.14%. By June 2019,10-year Treasuries dipped to 2.00%.
While the escalating trade war was the main catalyst for market weakness, other geopolitical headwinds emanating from the United Kingdom and Europe added pressure to an already tenuous market. In the U.K., Prime Minister Theresa May announced she would step down after she was unable to gain British Parliament support for her Brexit deal. Anti-establishment and populist parties gained ground in European Parliament elections in May, increasing the outlook for policy uncertainty — particularly in Italy. After the brief setback, risk markets bounced back by the end of the quarter as U.S.-China trade tensions thawed and the Fed signaled easier monetary policy.
2
American Beacon SSI Alternative Income FundSM
Performance Overview
June 30, 2019 (Unaudited)
The Investor Class of the American Beacon SSI Alternative Income Fund (the “Fund”) returned 3.55% for the twelve-month period ending June 30, 2019. The Fund outperformed the ICE BofAML3-Month Treasury Bill Index (the “Index”) return of 2.31% for the period.
Comparison of Change in Value of a $10,000 Investment for the period from 5/25/2012 through 6/30/2019
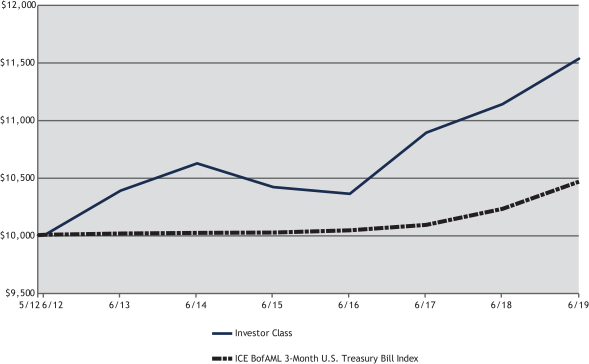
| Average Annual Total Returns for the Period ended June 30, 2019 |
| |||||||||||||||||||||||||||||||
Ticker | 1 Year | 3 Year | 5 Year | Since Inception 05/25/2012 | Value of $10,000 | |||||||||||||||||||||||||||
Institutional Class (1,2,4) | SHDIX | 3.77 | % | 3.91 | % | 1.91 | % | 2.27 | % | $ | 11,724 | |||||||||||||||||||||
Y Class (1,4) | SHDYX | 3.77 | % | 3.91 | % | 1.91 | % | 2.27 | % | $ | 11,724 | |||||||||||||||||||||
Investor Class (1,4) | SHDPX | 3.55 | % | 3.64 | % | 1.65 | % | 2.03 | % | $ | 11,529 | |||||||||||||||||||||
ICE BofAML 3-Month U.S. Treasury Bill Index (3) | 2.31 | % | 1.38 | % | 0.87 | % | 0.64 | % | $ | 10,461 | ||||||||||||||||||||||
| 1. | Performance shown is historical and is not indicative of future returns. Investment returns and principal value will vary, and shares may be worth more or less at redemption than at original purchase. Performance shown is calculated based on the publishedend-of-day net asset values as of date indicated, and current performance may be lower or higher than the performance data quoted. To obtain performance as of the most recent month end, please call1-800-9687-9009 or visitwww.americanbeaconfunds.com. Fund performance in the table above does not reflect the deduction of taxes a shareholder would pay on distributions or the redemption of shares. Generally accepted accounting principles require adjustments to be made to the net assets of the Fund at period end for financial reporting purposes only; and as such, the total return based on the unadjusted net asset value per share may differ from the total return reported in the financial highlights. A portion of fees charged to the Institutional Class of the Fund has been waived since the Institutional Class inception (May 17, 2019). Performance prior to waiving was lower than actual returns shown since Institutional Class inception. A portion of fees charged to the Investor Class of the Fund has been waived since the Investor Class inception (May 25, 2012). Performance prior to waiving was lower than actual returns shown since Investor Class inception. A portion of fees charged to the Y Class of the Fund has been waived since the Y Class inception (May 25, 2012). Performance prior to waiving was lower than actual returns shown since Y Class inception. |
| 2. | Fund performance for the periods represents the total returns achieved by the Y Class from 5/25/12 up to 5/17/19, the inception date of the Institutional Class. Expenses of the Institutional Class are lower than those of the Y Class. As a result, total returns shown may be lower than they would have been had the Institutional Class been in existence since 5/25/12. |
3
American Beacon SSI Alternative Income FundSM
Performance Overview
June 30, 2019 (Unaudited)
| 3. | ICE BofAML3-Month U.S. Treasury Bill Index is an index of U.S. Treasury securities maturing in less than 3 months that assumes reinvestment of all income and is intended to track the daily performance of3-month U.S. Treasury bills. One cannot directly invest in an index. |
| 4. | The Total Annual Fund Operating Expense ratios set forth in the most recent Fund prospectus for the Institutional, Y and Investor Class shares were 1.75%, 1.73% and 2.13%, respectively. The expense ratios above may vary from the expense ratios presented in other sections of this report that are based on expenses incurred during the period covered by this report. |
The convertible market is dominated by growth-oriented companies with relatively strong balance sheets. During the period, convertible liquidity was healthy with significant volume and reasonable trading spreads following the financial turmoil in late 2018. New issuance was strong, producing $43.3 billion, which represents superior issuance compared to the calendar years of 2015, 2016 and 2017. The issuance during the period was spearheaded primarily by new issues in growth-oriented sectors, such as Technology and Health Care.
Valuations for many positions in the Fund improved, amid solid demand from institutional investors for exposure to growth equities through convertible bonds. The CBOE Volatility Index spiked several times, helping to drive volatility in the underlying common stocks, which created opportunities to lock in gains through hedge ratio adjustments. The estimated gross yield was in the 3.7% - 4.0% range throughout the period, making the income component of the Fund an important driver of the positive returns. Through most of the period, solid credit markets were a tailwind for the strategy.
Conditions remain favorable for the Fund entering the second half of 2019, including attractive yields on current convertible positions, healthy credit markets and the potential for equity volatility that may be monetized.
| Top Ten Holdings (% Net Assets) |
| |||||||
| Liberty Interactive LLC, 3.500%, Due 1/15/2031 | 1.6 | |||||||
| Wayfair, Inc., 0.375%, Due 9/1/2022 | 1.6 | |||||||
| Aerojet Rocketdyne Holdings, Inc., 2.250%, Due 12/15/2023 | 1.4 | |||||||
| Microchip Technology, Inc., 1.625%, Due 2/15/2027 | 1.4 | |||||||
| Atlas Air Worldwide Holdings, Inc., 1.875%, Due 6/1/2024 | 1.3 | |||||||
| MGIC Investment Corp., 9.000%, Due 4/1/2063 | 1.3 | |||||||
| Cleveland-Cliffs, Inc., 1.500%, Due 1/15/2025 | 1.2 | |||||||
| Medicines Co., 2.750%, Due 7/15/2023 | 1.2 | |||||||
| MongoDB, Inc., 0.750%, Due 6/15/2024 | 1.2 | |||||||
| New York Community Capital Trust, 6.000%, Due 11/1/2051 | 1.2 | |||||||
| Total Fund Holdings | 216 | |||||||
| Sector Allocation (% Equities) |
| |||||||
| Financials | 52.2 | |||||||
| Utilities | 11.4 | |||||||
| Exchange-Traded Instruments | 8.0 | |||||||
| Industrials | 7.2 | |||||||
| Information Technology | 6.2 | |||||||
| Consumer Staples | 5.6 | |||||||
| Materials | 4.8 | |||||||
| Energy | 4.3 | |||||||
| Health Care | 0.3 | |||||||
| Communication Services | 0.0 | |||||||
4
American Beacon TwentyFour Strategic Income FundSM
Performance Overview
June 30, 2019 (Unaudited)
The Investor Class of the American Beacon TwentyFour Strategic Income Fund (the “Fund”) returned 6.84% for theone-year period ended June 30, 2019, outperforming the Bloomberg Barclays Global Aggregate Index (the “Index”) return of 5.85% and the secondary index, the BofA Merrill Lynch3-Month LIBOR Constant Maturity Index, return of 2.59%.
Comparison of Change in Value of a $10,000 Investment for the period from 4/3/2017 through 6/30/2019
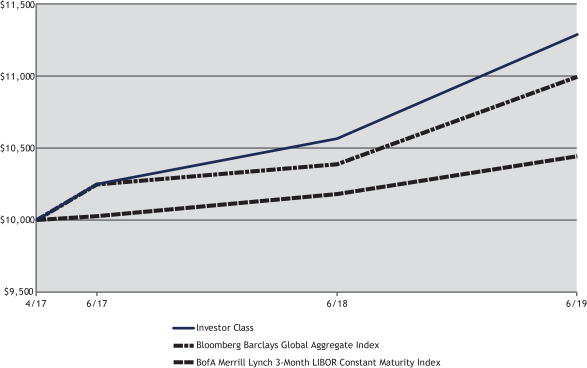
| Average Annual Total Returns for the Period ended June 30, 2019 | ||||||||||||||||||||||
Ticker | 1 Year | Since Inception 04/03/2017 | Value of $10,000 | |||||||||||||||||||
Institutional Class (1,5) | TFGIX | 7.27 | % | 5.97 | % | $ | 11,388 | |||||||||||||||
Y Class (1,5) | TFGYX | 7.18 | % | 5.89 | % | $ | 11,367 | |||||||||||||||
Investor Class (1,5) | TFGPX | 6.84 | % | 5.55 | % | $ | 11,286 | |||||||||||||||
A Class without Sales Charge (1,2,5) | TFSAX | 7.06 | % | 5.88 | % | $ | 11,364 | |||||||||||||||
A Class with Sales Charge (1,2,5) | TFSAX | 3.06 | % | 4.08 | % | $ | 10,938 | |||||||||||||||
C Class without Sales Charge (1,3,5) | TFGCX | 6.50 | % | 5.63 | % | $ | 11,306 | |||||||||||||||
C Class with Sales Charge (1,3,5) | TFGCX | 5.50 | % | 5.63 | % | $ | 11,306 | |||||||||||||||
Ultra Class (1,5) | TFGUX | 7.27 | % | 6.02 | % | $ | 11,398 | |||||||||||||||
Bloomberg Barclays Global Aggregate Index (2) | 5.85 | % | 4.31 | % | $ | 10,992 | ||||||||||||||||
BofA Merrill Lynch 3-Month LIBOR Constant Maturity Index (2) | 2.59 | % | 1.95 | % | $ | 10,442 | ||||||||||||||||
| 1. | Performance shown is historical and is not indicative of future returns. Investment returns and principal value will vary, and shares may be worth more or less at redemption than at original purchase. Performance shown is calculated based on the publishedend-of-day net asset values as of date indicated, and current performance may be lower or higher than the performance data quoted. To obtain performance as of the most recent month end, please visitwww.americanbeaconfunds.com or call1-800-967-9009. Fund performance in the table above does not reflect the deduction of taxes a shareholder would pay on distributions or the redemption of shares. Generally accepted accounting principles require adjustments to be made to the net assets of the Fund at period end for financial reporting purposes only; and as such, the total return based on the unadjusted net asset value per share may differ from the total return reported in the financial highlights. A portion of the fees charged to each Class of the Fund has been waived since Fund inception. Performance prior to waiving fees was lower than the actual returns shown since inception. A Class shares have a maximum sales charge of 3.75%. The maximum contingent deferred sales charge for the C Class is 1.00% for shares redeemed within one year of the date of purchase. |
| 2. | Fund performance for the periods represents the total returns achieved by the Institutional Class from 4/03/17 up to 10/29/18, the inception date of the A Class. Expenses of the A Class are higher than those of the Institutional Class. As a result, total returns shown may be higher than they would have been had the A Class been in existence since 4/03/17. |
5
American Beacon TwentyFour Strategic Income FundSM
Performance Overview
June 30, 2019 (Unaudited)
| 3. | Fund performance for the periods represents the total returns achieved by the Institutional Class from 4/03/17 up to 10/29/18, the inception date of the C Class. Expenses of the C Class are higher than those of the Institutional Class. As a result, total returns shown may be higher than they would have been had the C Class been in existence since 4/03/17. |
| 4. | The BofA Merrill Lynch3-Month LIBOR Constant Maturity Index tracks the performance of a synthetic asset paying LIBOR to a stated maturity. The index is based on the assumed purchase at par of a synthetic instrument having exactly its stated maturity and with a coupon equal to that day’s fixing rate. That issue is assumed to be sold the following business day (at a yield equal to the current day fixing rate) and rolled into a new instrument. The Bloomberg Barclays Global Aggregate Index tracks the performance of global investment-grade debt, including treasury, government-related, corporate and securitized fixed-rate bonds, denominated in local currencies from developed and emerging markets issuers. Securities must have at least one year until final maturity, or average life as applicable, and must meet minimum issue size criteria. One cannot directly invest in an index. |
| 5. | The Total Annual Fund Operating Expense ratios set forth in the most recent Fund prospectus for the Institutional, Y, Investor, A, C and Ultra Class shares were 1.74%, 1.78%, 2.16%, 1.36%, 2.06% and 1.73%, respectively. The expense ratios above may vary from the expense ratios presented in other sections of this report that are based on expenses incurred during the period covered by this report. |
The Fund outperformed during the year due primarily to the yield generated from its short-duration credit exposures. Credit markets ended the period on a solid note, following a difficult end to 2018, as interest rates declined and credit spreads tightened. Investors were encouraged by dovish signals from the Federal Reserve and the European Central Bank, and they sought alternatives to low-yielding government bonds.
While the credit markets performed well during the period, the sub-advisor remained watchful of volatility and added duration to the U.S. Treasury and other high-quality sovereign bonds to hedge against potential future volatility. The sub-advisor adopted a broader sentiment toward risk reduction and sought a balanced mix of short-dated credit and longer-dated interest rate exposure and to remain liquid and nimble for opportunities in the market. The Fund ended the period with a duration of 4.1 years, versus nearly 7.1 years for the Index, yet it maintained a higher yield due to its credit exposures.
The Fund’s primary exposures at period end were to contingent-capital securities issued by European finance companies, short-duration higher yielding instruments, and U.S. treasuries. The Fund ended with a weighted-average credit quality of investment grade with nearly half of its holdings in investment-grade issues and the other half in high-yield and unrated bonds. A majority of the Fund’s exposure was to European issuers, a third to U.S., and a small amount to emerging markets. All currency exposures were hedged back to the U.S. dollar, which helped as the dollar outperformed both the Euro and the British pound during the period.
The Fund’s higher yield, coupled with its lower duration, reflects the sub-advisor’s investment process that incorporates top-down asset allocation and duration management with rigorous bottom-up credit analysis in a highly flexible approach that seeks to take advantage of prevailing market conditions. This team-based process has remained consistent since the Fund’s inception
| Top Ten Holdings (% Net Assets) |
| |||||||
| U.S. Treasury Notes/Bonds, 1.000%, Due 11/30/2019 | 8.3 | |||||||
| U.S. Treasury Notes/Bonds, 2.125%, Due 3/31/2024 | 8.1 | |||||||
| U.S. Treasury Notes/Bonds, 2.625%, Due 2/15/2029 | 5.8 | |||||||
| Spain Government Bond, 1.850%, Due 7/30/2035 | 5.1 | |||||||
| Nationwide Building Society, 10.250%, Due 12/31/2999, Series CCDS | 2.6 | |||||||
| U.S. Treasury Notes/Bonds, 3.375%, Due 11/15/2048 | 2.2 | |||||||
| Halcyon Loan Advisors, 5.130%, Due 10/18/2031 | 1.9 | |||||||
| DrydenXXVII-R Euro CLO B.V., 3.150%, Due 5/15/2030,2017-27X D,(3-mo. EUR EURIBOR + 3.150%) | 1.7 | |||||||
| Dryden 39 Euro CLO B.V., 4.970%, Due 10/15/2031,2015-39X ER,(3-mo. EUR EURIBOR + 4.970%) | 1.6 | |||||||
| Lloyds Bank PLC, 13.000%, Due 1/22/2029,(5-Yr. UK Government Bond + 13.400%) | 1.5 | |||||||
| Total Fund Holdings | 119 | |||||||
| Sector Allocation (% Fixed Income) |
| |||||||
| Financial | 44.4 | |||||||
| U.S. Treasury Obligations | 25.4 | |||||||
| Asset-Backed Obligations | 8.3 | |||||||
| Communications | 6.6 | |||||||
| Foreign Sovereign Obligations | 5.7 | |||||||
| Energy | 2.6 | |||||||
| Consumer,Non-Cyclical | 2.2 | |||||||
| Industrial | 1.9 | |||||||
| Consumer, Cyclical | 1.0 | |||||||
| Collateralized Mortgage Obligations | 0.8 | |||||||
| Basic Materials | 0.4 | |||||||
| Utilities | 0.4 | |||||||
| Diversified | 0.2 | |||||||
| Technology | 0.1 | |||||||
6
Expense Examples
June 30, 2019 (Unaudited)
Fund Expense Example
As a shareholder of a Fund, you incur two types of costs: (1) transaction costs, including sales charges (loads) on purchase payments and redemption fees, if applicable, and (2) ongoing costs, including management fees, distribution(12b-1) fees,sub-transfer agent fees, and other Fund expenses. The Examples are intended to help you understand the ongoing cost (in dollars) of investing in the Fund and to compare these costs with the ongoing costs of investing in other mutual funds. The Examples are based on an investment of $1,000 invested at the beginning of the period in each Class and held for the entire period from April 1, 2019 through June 30, 2019 for the SSI Alternative Income Fund and January 1, 2019 through June 30, 2019 for the TwentyFour Strategic Income Fund.
Actual Expenses
The “Actual” lines of the tables provide information about actual account values and actual expenses. You may use the information on this page, together with the amount you invested, to estimate the expenses that you paid over the period. Simply divide your account value by $1,000 (for example, an $8,600 account value divided by $1,000 = $8.60), then multiply the result by the “Expenses Paid During Period” to estimate the expenses you paid on your account during this period. Shareholders of the Investor and Institutional Classes that invest in the Fund through an IRA or Roth IRA may be subject to a custodial IRA fee of $15 that is typically deducted each December. If your account was subject to a custodial IRA fee during the period, your costs would have been $15 higher.
Hypothetical Example for Comparison Purposes
The “Hypothetical” lines of the tables provide information about hypothetical account values and hypothetical expenses based on the Fund’s actual expense ratio and an assumed 5% per year rate of return before expenses (not the Fund’s actual return). You may compare the ongoing costs of investing in the Fund with other funds by contrasting this 5% hypothetical example and the 5% hypothetical examples that appear in the shareholder reports of the other funds. The hypothetical account values and expenses may not be used to estimate the actual ending account balance or expenses you paid for the period. Shareholders of the Investor and Institutional Classes that invest in the Funds through an IRA or Roth IRA may be subject to a custodial IRA fee of $15 that is typically deducted each December. If your account was subject to a custodial IRA fee during the period, your costs would have been $15 higher.
You should also be aware that the expenses shown in the table highlight only your ongoing costs and do not reflect any transaction costs charged by the Fund, such as sales charges (loads) or redemption fees, as applicable. Similarly, the expense examples for other funds do not reflect any transaction costs charged by those funds, such as sales charges (loads), redemption fees or exchange fees. Therefore, the “Hypothetical” lines of the tables are useful in comparing ongoing costs only and will not help you determine the relative total costs of owning different funds. If you were subject to any transaction costs during the period, your costs would have been higher.
7
American Beacon FundsSM
Expense Examples
June 30, 2019 (Unaudited)
| American Beacon SSI Alternative Income Fund |
| ||||||||||||||
| Beginning Account Value 4/1/2019 | Ending Account Value 6/30/2019 | Expenses Paid During Period 4/1/2019-6/30/2019* | |||||||||||||
| Institutional Class** | |||||||||||||||
| Actual | $1,000.00 | $1,009.80 | $2.22 | ||||||||||||
| Hypothetical*** | $1,000.00 | $1,015.72 | $9.15 | ||||||||||||
| Y Class# | |||||||||||||||
| Actual | $1,000.00 | $1,014.80 | $4.29 | ||||||||||||
| Hypothetical*** | $1,000.00 | $1,016.32 | $8.55 | ||||||||||||
| Investor Class# | |||||||||||||||
| Actual | $1,000.00 | $1,013.80 | $4.97 | ||||||||||||
| Hypothetical*** | $1,000.00 | $1,014.98 | $9.89 | ||||||||||||
| * | Expenses are equal to the Fund’s annualized expense ratios for thesix-month period of 1.83%, 1.71%, and 1.98% for the Institutional, Y, and Investor Classes, respectively, multiplied by the average account value over the period, multiplied by the number derived by dividing the number of days in the most recent fiscal half-year (181) by days in the year (365) to reflect the half-year period. |
| ** | American Beacon SSI Alternative Income Fund’s Institutional Class commenced operations on May 20, 2019 with an effective date of May 17, 2019. Expenses are equal to the fund’s annualized expense ratio for the period, multiplied by the average account value over the period, multiplied by the number of days since inception (44), then divided by the number of days in the year (365) to reflect the period. The Ending Account Value is derived from the fund’s share class actual return since inception. The Hypothetical 5% Annual Return information reflects the (181) day period for the six months ended June 30, 2019 to allow for comparability. |
| *** | 5% return before expenses. |
| # | American Beacon SSI Alternative Income Fund’s Investor and Y Classes had fiscal year end changed from March 31st to June 30th. Expenses are equal to the fund’s annualized expense ratio for the period, multiplied by the average account value over the period, multiplied by the number of days since inception (91), then divided by the number of days in the year (365) to reflect the period. The Ending Account Value is derived from the fund’s share class actual return since inception. The Hypothetical 5% Annual Return information reflects the (181) day period for the six months ended June 30, 2019 to allow for comparability. |
| American Beacon TwentyFour Strategic Income Fund |
| ||||||||||||||
| Beginning Account Value 1/1/2019 | Ending Account Value 6/30/2019 | Expenses Paid During Period 1/1/2019-6/30/2019* | |||||||||||||
| Institutional Class | |||||||||||||||
| Actual | $1,000.00 | $1,076.20 | $4.68 | ||||||||||||
| Hypothetical** | $1,000.00 | $1,020.28 | $4.56 | ||||||||||||
| Y Class | |||||||||||||||
| Actual | $1,000.00 | $1,076.40 | $4.89 | ||||||||||||
| Hypothetical** | $1,000.00 | $1,020.08 | $4.76 | ||||||||||||
| Investor Class | |||||||||||||||
| Actual | $1,000.00 | $1,074.40 | $5.50 | ||||||||||||
| Hypothetical** | $1,000.00 | $1,019.49 | $5.36 | ||||||||||||
| A Class | |||||||||||||||
| Actual | $1,000.00 | $1,075.50 | $6.74 | ||||||||||||
| Hypothetical** | $1,000.00 | $1,018.30 | $6.56 | ||||||||||||
| C Class | |||||||||||||||
| Actual | $1,000.00 | $1,071.60 | $10.38 | ||||||||||||
| Hypothetical** | $1,000.00 | $1,014.78 | $10.09 | ||||||||||||
| Ultra Class | |||||||||||||||
| Actual | $1,000.00 | $1,077.30 | $3.50 | ||||||||||||
| Hypothetical** | $1,000.00 | $1,021.42 | $3.41 | ||||||||||||
| * | Expenses are equal to the Fund’s annualized expense ratios for thesix-month period of 0.91%, 0.95%, 1.07%, 1.31%, 2.02%, and 0.68% for the Institutional, Y, Investor, A, C, and Ultra Classes, respectively, multiplied by the average account value over the period, multiplied by the number derived by dividing the number of days in the most recent fiscal half-year (181) by days in the year (365) to reflect the half-year period. |
| ** | 5% return before expenses. |
8
Report of Independent Registered Public Accounting Firm
Tothe Board of Trustees of American Beacon Funds and Shareholders of American Beacon SSI Alternative Income Fund and American Beacon TwentyFour Strategic Income Fund
Opinions on the Financial Statements
We have audited the accompanying statements of assets and liabilities, including the schedules of investments, of each of the funds indicated in the table below (two of the series constituting American Beacon Funds, hereafter collectively referred to as the “Funds”) as of June 30, 2019, the related statements of operations and of changes in net assets for each of the periods indicated in the table below, including the related notes, and the financial highlights for each of the periods indicated in the table below (collectively referred to as the “financial statements”). In our opinion, the financial statements present fairly, in all material respects, the financial position of each of the Funds as of June 30, 2019, the results of each of their operations, the changes in each of their net assets and each of the financial highlights for each of the periods indicated in the table below, in conformity with accounting principles generally accepted in the United States of America.
Fund Name | Statements of Operations | Statements of Changes | Financial Highlights | |||
| American Beacon SSI Alternative Income Fund | For the period from April 1, 2019 through June 30, 2019 | For the period from April 1, 2019 through June 30, 2019 | For the period from April 1, 2019 through June 30, 2019 for Y Class and Investor Class
For the period from May 20, 2019 (commencement of operations) through June 30, 2019 for Institutional Class | |||
| American Beacon TwentyFour Strategic Income Fund | For the year ended June 30, 2019 | For the years ended June 30, 2019 and 2018 | For each of the periods indicated therein | |||
The financial statements of American Beacon SSI Alternative Income Fund as of March 31, 2019 and for the years ended March 31, 2019 and 2018 and the financial highlights for each of the periods ended on or prior to March 31, 2019 (not presented herein, other thanthe statement of operations, statements of changes in net assets and the financial highlights) were audited by other auditors whose report dated May 24, 2019 expressed an unqualified opinion on those financial statements and financial highlights.
Basis for Opinions
These financial statements are the responsibility of the Funds’ management. Our responsibility is to express an opinion on the Funds’ financial statements based on our audits. We are a public accounting firm registered with the Public Company Accounting Oversight Board (United States) (PCAOB) and are required to be independent with respect to the Funds in accordance with the U.S. federal securities laws and the applicable rules and regulations of the Securities and Exchange Commission and the PCAOB.
We conducted our audits of these financial statements in accordance with the standards of the PCAOB. Those standards require that we plan and perform the audit to obtain reasonable assurance about whether the financial statements are free of material misstatement, whether due to error or fraud.
Our audits included performing procedures to assess the risks of material misstatement of the financial statements, whether due to error or fraud, and performing procedures that respond to those risks. Such procedures included examining, on a test basis, evidence regarding the amounts and disclosures in the financial statements. Our audits also included evaluating the accounting principles used and significant estimates made by management, as well as evaluating the overall presentation of the financial statements. Our procedures included confirmation of securities owned as of June 30, 2019 by correspondence with the custodian, transfer agent, agent banks and brokers; when replies were not received from brokers, we performed other auditing procedures. We believe that our audits provide a reasonable basis for our opinions.
PricewaterhouseCoopers LLP
Dallas, TX
August 27, 2019
We have served as the auditor of one or more investment companies in the American Beacon family of funds since 2016.
9
American Beacon SSI Alternative Income FundSM
Schedule of Investments
June 30, 2019
| Shares | Fair Value | ||||||||||||||
| SECURITIES HELD LONG - 101.20% | |||||||||||||||
| COMMON STOCKS - 0.03% | |||||||||||||||
| Health Care - 0.03% | |||||||||||||||
| Health Care Technology - 0.03% | |||||||||||||||
| Change Healthcare, Inc.A | 1,440 | $ | 81,072 | ||||||||||||
|
| ||||||||||||||
Total Common Stocks (Cost $72,000) | 81,072 | ||||||||||||||
|
| ||||||||||||||
| RIGHTS - 0.00% (Cost $—) | |||||||||||||||
| Materials - 0.00% (Cost $—) | |||||||||||||||
| A Schulman, Inc.A B | 10 | 5 | |||||||||||||
|
| ||||||||||||||
| CONVERTIBLE PREFERRED STOCKS - 12.21% | |||||||||||||||
| Consumer Staples - 0.75% | |||||||||||||||
| Household Products - 0.75% | |||||||||||||||
| Energizer Holdings, Inc., Series A, 7.500%, Due 1/15/2022 | 19,342 | 1,706,844 | |||||||||||||
|
| ||||||||||||||
| 1,706,844 | |||||||||||||||
|
| ||||||||||||||
| Energy - 0.57% | |||||||||||||||
| Energy Equipment & Services - 0.57% | |||||||||||||||
| Nabors Industries Ltd., 6.00%, Due 5/1/2021 | 56,493 | 1,310,638 | |||||||||||||
|
| ||||||||||||||
| 1,310,638 | |||||||||||||||
|
| ||||||||||||||
| Financials - 6.95% | |||||||||||||||
| Banks - 1.58% | |||||||||||||||
| Bank of America Corp., Series LC | 1,244 | 1,704,777 | |||||||||||||
| Wells Fargo & Co., Series LC | 1,390 | 1,898,045 | |||||||||||||
|
| ||||||||||||||
| 3,602,822 | |||||||||||||||
|
| ||||||||||||||
| Capital Markets - 1.25% | |||||||||||||||
| Cowen, Inc., Series AC | 1,910 | 1,730,434 | |||||||||||||
| Virtus Investment Partners, Inc., Series D, 7.250%, Due 2/1/2020 | 11,971 | 1,116,815 | |||||||||||||
|
| ||||||||||||||
| 2,847,249 | |||||||||||||||
|
| ||||||||||||||
| Diversified Financial Services - 1.03% | |||||||||||||||
| AMG Capital Trust II | 48,732 | 2,352,755 | |||||||||||||
|
| ||||||||||||||
| Equity Real Estate Investment Trusts (REITs) - 3.09% | |||||||||||||||
| iStar, Inc., Series JC H I | 46,061 | 2,378,422 | |||||||||||||
| New York Community Capital Trust, 6.00%, Due 11/1/2051 | 58,607 | 2,804,345 | |||||||||||||
| QTS Realty Trust, Inc., Series BC H | 16,943 | 1,884,945 | |||||||||||||
|
| ||||||||||||||
| 7,067,712 | |||||||||||||||
|
| ||||||||||||||
Total Financials | 15,870,538 | ||||||||||||||
|
| ||||||||||||||
| Industrials - 0.95% | |||||||||||||||
| Machinery - 0.95% | |||||||||||||||
| Colfax Corp., 5.750%, Due 1/15/2022H | 17,197 | 2,175,966 | |||||||||||||
|
| ||||||||||||||
| Information Technology - 0.83% | |||||||||||||||
| Technology Hardware, Storage & Peripherals - 0.83% | |||||||||||||||
| NCR Corp., Series A, 5.500%, PIKC | 1,609 | 1,884,376 | |||||||||||||
|
| ||||||||||||||
| Materials - 0.64% | |||||||||||||||
| Chemicals - 0.64% | |||||||||||||||
| A Schulman, Inc.C | 1,416 | 1,451,400 | |||||||||||||
|
| ||||||||||||||
See accompanying notes
10
American Beacon SSI Alternative Income FundSM
Schedule of Investments
June 30, 2019
| Shares | Fair Value | ||||||||||||||
| CONVERTIBLE PREFERRED STOCKS - 12.21% (continued) | |||||||||||||||
| Utilities - 1.52% | |||||||||||||||
| Gas Utilities - 0.59% | |||||||||||||||
| South Jersey Industries, Inc., 7.250%, Due 4/15/2021 | 25,506 | $ | 1,354,369 | ||||||||||||
|
| ||||||||||||||
| Multi-Utilities - 0.79% | |||||||||||||||
| CenterPoint Energy, Inc., Series B, 7.000%, Due 9/1/2021I | 25,643 | 1,289,221 | |||||||||||||
| Dominion Energy, Inc., Series A, 7.250%, Due 6/1/2022 | 4,912 | 508,687 | |||||||||||||
|
| ||||||||||||||
| 1,797,908 | |||||||||||||||
|
| ||||||||||||||
| Water Utilities - 0.14% | |||||||||||||||
| Aqua America, Inc., 6.000%, Due 4/30/2022 | 5,731 | 326,552 | |||||||||||||
|
| ||||||||||||||
Total Utilities | 3,478,829 | ||||||||||||||
|
| ||||||||||||||
Total Convertible Preferred Stocks (Cost $27,749,219) | 27,878,591 | ||||||||||||||
|
| ||||||||||||||
| Principal Amount | |||||||||||||||
| CORPORATE OBLIGATIONS - 19.43% | |||||||||||||||
| Communications - 1.92% | |||||||||||||||
| Harmonic, Inc., 4.000%, Due 12/1/2020 | $ | 1,043,000 | 1,215,095 | ||||||||||||
| Pandora Media LLC, 1.750%, Due 12/1/2023 | 1,503,000 | 1,673,098 | |||||||||||||
| Perficient, Inc., 2.375%, Due 9/15/2023D | 1,346,000 | 1,489,895 | |||||||||||||
|
| ||||||||||||||
| 4,378,088 | |||||||||||||||
|
| ||||||||||||||
| Consumer, Cyclical - 0.66% | |||||||||||||||
| EZCORP, Inc., 2.375%, Due 5/1/2025 | 1,669,000 | 1,505,684 | |||||||||||||
|
| ||||||||||||||
| Consumer,Non-Cyclical - 4.37% | |||||||||||||||
| Chegg, Inc., 0.250%, Due 5/15/2023 | 1,454,000 | 2,226,688 | |||||||||||||
| FTI Consulting, Inc., 2.000%, Due 8/15/2023D H | 1,669,000 | 1,785,818 | |||||||||||||
| Ligand Pharmaceuticals, Inc., 0.750%, Due 5/15/2023H | 2,825,000 | 2,438,997 | |||||||||||||
| Retrophin, Inc., 2.500%, Due 9/15/2025 | 1,399,000 | 1,253,350 | |||||||||||||
| Square, Inc., 0.500%, Due 5/15/2023H | 1,906,000 | 2,274,519 | |||||||||||||
|
| ||||||||||||||
| 9,979,372 | |||||||||||||||
|
| ||||||||||||||
| Financial - 4.01% | |||||||||||||||
| Apollo Commercial Real Estate Finance, Inc., | |||||||||||||||
4.750%, Due 8/23/2022 | 810,000 | 809,834 | |||||||||||||
5.375%, Due 10/15/2023H | 2,043,000 | 2,034,345 | |||||||||||||
| Granite Point Mortgage Trust, Inc., 6.375%, Due 10/1/2023 | 737,000 | 761,413 | |||||||||||||
| Hope Bancorp, Inc., 2.000%, Due 5/15/2038I | 2,799,000 | 2,556,159 | |||||||||||||
| New Mountain Finance Corp., 5.750%, Due 8/15/2023H I | 1,741,000 | 1,793,017 | |||||||||||||
| Redwood Trust, Inc., 5.625%, Due 7/15/2024H | 1,215,000 | 1,208,166 | |||||||||||||
|
| ||||||||||||||
| 9,162,934 | |||||||||||||||
|
| ||||||||||||||
| Industrial - 1.95% | |||||||||||||||
| OSI Systems, Inc., 1.250%, Due 9/1/2022 | 1,718,000 | 2,036,158 | |||||||||||||
| SEACOR Holdings, Inc., 3.250%, Due 5/15/2030I | 2,550,000 | 2,408,848 | |||||||||||||
|
| ||||||||||||||
| 4,445,006 | |||||||||||||||
|
| ||||||||||||||
| Technology - 6.52% | |||||||||||||||
| Atlassian, Inc., 0.625%, Due 5/1/2023 | 1,311,000 | 2,228,700 | |||||||||||||
| Envestnet, Inc., 1.750%, Due 6/1/2023 | 1,648,000 | 1,960,937 | |||||||||||||
| Evolent Health, Inc., 1.500%, Due 10/15/2025D | 2,459,000 | 1,588,365 | |||||||||||||
| MongoDB, Inc., 0.750%, Due 6/15/2024D H | 1,215,000 | 2,784,628 | |||||||||||||
| Pure Storage, Inc., 0.125%, Due 4/15/2023 | 1,281,000 | 1,226,557 | |||||||||||||
| Rapid7, Inc., 1.250%, Due 8/1/2023D H | 1,184,000 | 1,807,079 | |||||||||||||
| Splunk, Inc., 1.125%, Due 9/15/2025D | 1,697,000 | 1,899,215 | |||||||||||||
See accompanying notes
11
American Beacon SSI Alternative Income FundSM
Schedule of Investments
June 30, 2019
| Principal Amount | Fair Value | ||||||||||||||
| CORPORATE OBLIGATIONS - 19.43% (continued) | |||||||||||||||
| Technology - 6.52% (continued) | |||||||||||||||
| Twilio, Inc., 0.250%, Due 6/1/2023 | $ | 694,000 | $ | 1,391,993 | |||||||||||
|
| ||||||||||||||
| 14,887,474 | |||||||||||||||
|
| ||||||||||||||
Total Corporate Obligations (Cost $40,071,685) | 44,358,558 | ||||||||||||||
|
| ||||||||||||||
| CONVERTIBLE OBLIGATIONS - 56.13% | |||||||||||||||
| Basic Materials - 2.04% | |||||||||||||||
| Cleveland-Cliffs, Inc., 1.500%, Due 1/15/2025H | 1,892,000 | 2,730,322 | |||||||||||||
| First Majestic Silver Corp., 1.875%, Due 3/1/2023 | 1,809,000 | 1,926,585 | |||||||||||||
|
| ||||||||||||||
| 4,656,907 | |||||||||||||||
|
| ||||||||||||||
| Communications - 8.33% | |||||||||||||||
| FireEye, Inc., 1.625%, Due 6/1/2035, Series BI | 1,102,000 | 1,035,880 | |||||||||||||
| IAC Financeco 3, Inc., 2.000%, Due 1/15/2030D | 1,582,000 | 1,627,818 | |||||||||||||
| Liberty Interactive LLC, 3.500%, Due 1/15/2031I | 3,997,000 | 3,541,964 | |||||||||||||
| Liberty Media Corp., 2.250%, Due 12/1/2048D HI | 1,902,000 | 2,171,160 | |||||||||||||
| MercadoLibre, Inc., 2.000%, Due 8/15/2028D | 1,372,000 | 2,113,472 | |||||||||||||
| Vonage Holdings Corp., 1.750%, Due 6/1/2024D | 904,000 | 910,034 | |||||||||||||
| Wayfair, Inc., 0.375%, Due 9/1/2022H | 2,402,000 | 3,635,818 | |||||||||||||
| YY, Inc., 1.375%, Due 6/15/2026D | 1,789,000 | 1,815,850 | |||||||||||||
| Zillow Group, Inc., 2.000%, Due 12/1/2021H | 1,907,000 | 2,158,033 | |||||||||||||
|
| ||||||||||||||
| 19,010,029 | |||||||||||||||
|
| ||||||||||||||
| Consumer, Cyclical - 1.35% | |||||||||||||||
| Guess?, Inc., 2.000%, Due 4/15/2024D | 1,138,000 | 1,064,520 | |||||||||||||
| Meritor, Inc., 3.250%, Due 10/15/2037I | 1,939,000 | 2,020,968 | |||||||||||||
|
| ||||||||||||||
| 3,085,488 | |||||||||||||||
|
| ||||||||||||||
| Consumer,Non-Cyclical - 12.52% | |||||||||||||||
| Alder Biopharmaceuticals, Inc., 2.500%, Due 2/1/2025 | 1,383,000 | 1,285,326 | |||||||||||||
| Exact Sciences Corp., 1.000%, Due 1/15/2025 | 1,554,000 | 2,683,210 | |||||||||||||
| Flexion Therapeutics, Inc., 3.375%, Due 5/1/2024 | 1,329,000 | 1,153,738 | |||||||||||||
| Horizon Pharma Investment Ltd., 2.500%, Due 3/15/2022 | 1,179,000 | 1,306,300 | |||||||||||||
| Huron Consulting Group, Inc., 1.250%, Due 10/1/2019 | 1,704,000 | 1,687,563 | |||||||||||||
| Innoviva, Inc., 2.125%, Due 1/15/2023 | 2,580,000 | 2,705,770 | |||||||||||||
| Insmed, Inc., 1.750%, Due 1/15/2025 | 1,244,000 | 1,208,055 | |||||||||||||
| Ionis Pharmaceuticals, Inc., 1.000%, Due 11/15/2021H | 2,141,000 | 2,531,855 | |||||||||||||
| Ironwood Pharmaceuticals, Inc., 2.250%, Due 6/15/2022H | 2,559,000 | 2,728,178 | |||||||||||||
| Medicines Co., 2.750%, Due 7/15/2023 | 2,798,000 | 2,798,500 | |||||||||||||
| Neurocrine Biosciences, Inc., 2.250%, Due 5/15/2024 | 1,311,000 | 1,720,028 | |||||||||||||
| Radius Health, Inc., 3.000%, Due 9/1/2024 | 1,951,000 | 1,765,456 | |||||||||||||
| Team, Inc., 5.000%, Due 8/1/2023H | 1,166,000 | 1,185,356 | |||||||||||||
| Theravance Biopharma, Inc., 3.250%, Due 11/1/2023 | 1,397,000 | 1,197,576 | |||||||||||||
| Wright Medical Group N.V., 2.250%, Due 11/15/2021 | 1,779,000 | 2,635,144 | |||||||||||||
|
| ||||||||||||||
| 28,592,055 | |||||||||||||||
|
| ||||||||||||||
| Energy - 2.52% | |||||||||||||||
| Cheniere Energy, Inc., 4.250%, Due 3/15/2045HI | 2,945,000 | 2,306,230 | |||||||||||||
| Helix Energy Solutions Group, Inc., 4.125%, Due 9/15/2023 | 1,147,000 | 1,377,873 | |||||||||||||
| Newpark Resources, Inc., 4.000%, Due 12/1/2021 | 970,000 | 1,071,948 | |||||||||||||
| Tesla Energy Operations, Inc., 1.625%, Due 11/1/2019 | 1,028,000 | 991,221 | |||||||||||||
|
| ||||||||||||||
| 5,747,272 | |||||||||||||||
|
| ||||||||||||||
| Financial - 14.75% | |||||||||||||||
| AXA S.A., 7.250%, Due 5/15/2021D H | 2,616,000 | 2,686,893 | |||||||||||||
| BlackRock TCP Capital Corp., 5.250%, Due 12/15/2019 | 1,297,000 | 1,306,582 | |||||||||||||
| Blackstone Mortgage Trust, Inc., 4.750%, Due 3/15/2023 | 1,022,000 | 1,064,388 | |||||||||||||
| Encore Capital Europe Finance Ltd., 4.500%, Due 9/1/2023 | 963,000 | 980,095 | |||||||||||||
See accompanying notes
12
American Beacon SSI Alternative Income FundSM
Schedule of Investments
June 30, 2019
| Principal Amount | Fair Value | ||||||||||||||
| CONVERTIBLE OBLIGATIONS - 56.13% (continued) | |||||||||||||||
| Financial - 14.75% (continued) | |||||||||||||||
| Encore Capital Group, Inc., | |||||||||||||||
3.000%, Due 7/1/2020 | $ | 508,000 | $ | 507,915 | |||||||||||
2.875%, Due 3/15/2021 | 1,203,000 | 1,137,591 | |||||||||||||
| Forestar Group, Inc., 3.750%, Due 3/1/2020 | 1,091,000 | 1,084,329 | |||||||||||||
| Granite Point Mortgage Trust, Inc., 5.625%, Due 12/1/2022D H | 1,688,000 | 1,724,925 | |||||||||||||
| Hercules Capital, Inc., 4.375%, Due 2/1/2022 | 1,340,000 | 1,340,466 | |||||||||||||
| IH Merger Sub LLC, 3.500%, Due 1/15/2022, REIT | 1,929,000 | 2,352,015 | |||||||||||||
| iStar, Inc., 3.125%, Due 9/15/2022 | 1,337,000 | 1,371,900 | |||||||||||||
| KKR Real Estate Finance Trust, Inc., 6.125%, Due 5/15/2023H | 1,830,000 | 1,891,798 | |||||||||||||
| MFA Financial, Inc., 6.250%, Due 6/15/2024 | 1,196,000 | 1,201,157 | |||||||||||||
| MGIC Investment Corp., 9.000%, Due 4/1/2063D | 2,291,000 | 3,017,456 | |||||||||||||
| PennyMac Corp., 5.375%, Due 5/1/2020 | 2,335,000 | 2,356,570 | |||||||||||||
| PRA Group, Inc., | |||||||||||||||
3.000%, Due 8/1/2020 | 1,480,000 | 1,465,684 | |||||||||||||
3.500%, Due 6/1/2023H | 1,715,000 | 1,599,314 | |||||||||||||
| Prospect Capital Corp., 6.375%, Due 3/1/2025 | 2,372,000 | 2,422,524 | |||||||||||||
| Redwood Trust, Inc., 4.750%, Due 8/15/2023 | 1,965,000 | 1,915,875 | |||||||||||||
| Two Harbors Investment Corp., 6.250%, Due 1/15/2022 | 2,241,000 | 2,255,874 | |||||||||||||
|
| ||||||||||||||
| 33,683,351 | |||||||||||||||
|
| ||||||||||||||
| Industrial - 5.48% | |||||||||||||||
| Aerojet Rocketdyne Holdings, Inc., 2.250%, Due 12/15/2023H | 1,748,000 | 3,107,704 | |||||||||||||
| Atlas Air Worldwide Holdings, Inc., 1.875%, Due 6/1/2024 | 2,843,000 | 2,918,764 | |||||||||||||
| Cemex S.A.B. de C.V., 3.720%, Due 3/15/2020 | 1,182,000 | 1,178,387 | |||||||||||||
| II-VI, Inc., 0.250%, Due 9/1/2022 | 1,287,000 | 1,355,372 | |||||||||||||
| Knowles Corp., 3.250%, Due 11/1/2021H | 1,410,000 | 1,692,657 | |||||||||||||
| SunPower Corp., 4.000%, Due 1/15/2023 | 2,557,000 | 2,266,414 | |||||||||||||
|
| ||||||||||||||
| 12,519,298 | |||||||||||||||
|
| ||||||||||||||
| Technology - 8.20% | |||||||||||||||
| Bilibili, Inc., 1.375%, Due 4/1/2026D | 1,777,000 | 1,687,583 | |||||||||||||
| Cree, Inc., 0.875%, Due 9/1/2023D | 1,358,000 | 1,571,794 | |||||||||||||
| j2 Global, Inc., 3.250%, Due 6/15/2029HI | 1,495,000 | 2,083,616 | |||||||||||||
| Microchip Technology, Inc., 1.625%, Due 2/15/2027H | 2,656,000 | 3,129,034 | |||||||||||||
| New Relic, Inc., 0.500%, Due 5/1/2023 | 1,091,000 | 1,163,986 | |||||||||||||
| ON Semiconductor Corp., 1.625%, Due 10/15/2023 | 974,000 | 1,186,633 | |||||||||||||
| RealPage, Inc., 1.500%, Due 11/15/2022H | 904,000 | 1,354,242 | |||||||||||||
| Synaptics, Inc., 0.500%, Due 6/15/2022 | 1,861,000 | 1,662,106 | |||||||||||||
| Tabula Rasa HealthCare, Inc., 1.750%, Due 2/15/2026D | 1,260,000 | 1,261,424 | |||||||||||||
| Veeco Instruments, Inc., 2.700%, Due 1/15/2023H | 1,505,000 | 1,335,304 | |||||||||||||
| Workday, Inc., 0.250%, Due 10/1/2022 | 1,529,000 | 2,289,756 | |||||||||||||
|
| ||||||||||||||
| 18,725,478 | |||||||||||||||
|
| ||||||||||||||
| Utilities - 0.94% | |||||||||||||||
| CenterPoint Energy, Inc., 4.516%, Due 9/15/2029E | 18,839 | 926,690 | |||||||||||||
| NRG Energy, Inc., 2.750%, Due 6/1/2048I | 1,141,000 | 1,218,681 | |||||||||||||
|
| ||||||||||||||
| 2,145,371 | |||||||||||||||
|
| ||||||||||||||
Total Convertible Obligations (Cost $117,490,734) | 128,165,249 | ||||||||||||||
|
| ||||||||||||||
| FOREIGN CORPORATE OBLIGATIONS - 2.19% | |||||||||||||||
| Communications - 0.62% | |||||||||||||||
| Weibo Corp., 1.250%, Due 11/15/2022 | 1,495,000 | 1,411,321 | |||||||||||||
|
| ||||||||||||||
| Industrial - 0.58% | |||||||||||||||
| Ship Finance International Ltd., 4.875%, Due 5/1/2023H | 1,319,000 | 1,333,195 | |||||||||||||
|
| ||||||||||||||
See accompanying notes
13
American Beacon SSI Alternative Income FundSM
Schedule of Investments
June 30, 2019
| Principal Amount | Fair Value | ||||||||||||||
| FOREIGN CORPORATE OBLIGATIONS - 2.19% (continued) | |||||||||||||||
| Technology - 0.99% | |||||||||||||||
| Momo, Inc., 1.250%, Due 7/1/2025D H | $ | 2,384,000 | $ | 2,252,880 | |||||||||||
|
| ||||||||||||||
Total Foreign Corporate Obligations (Cost $5,071,512) | 4,997,396 | ||||||||||||||
|
| ||||||||||||||
| Shares | |||||||||||||||
| EXCHANGE-TRADED INSTRUMENTS - 1.07% (Cost $2,798,154) | |||||||||||||||
| Exchange-Traded Funds - 1.07% | |||||||||||||||
| ProShares Short 20+ Year Treasury | 120,000 | 2,446,800 | |||||||||||||
|
| ||||||||||||||
| SHORT-TERM INVESTMENTS - 10.14% (Cost $23,145,110) | |||||||||||||||
| Investment Companies - 10.14% | |||||||||||||||
| American Beacon U.S. Government Money Market Select Fund, Select Class, 2.32%F G | 23,145,110 | 23,145,110 | |||||||||||||
|
| ||||||||||||||
TOTAL SECURITIES HELD LONG (Cost $216,398,414) | 231,072,781 | ||||||||||||||
|
| ||||||||||||||
| SECURITIES SOLD SHORT - (36.63%) | |||||||||||||||
| COMMON STOCKS - (36.63%) | |||||||||||||||
| Communication Services - (2.94%) | |||||||||||||||
| Diversified Telecommunication Services - (0.33%) | |||||||||||||||
| AT&T, Inc. | (13,533 | ) | (453,491 | ) | |||||||||||
| Vonage Holdings Corp.A | (25,776 | ) | (292,042 | ) | |||||||||||
|
| ||||||||||||||
| (745,533 | ) | ||||||||||||||
|
| ||||||||||||||
| Entertainment - (0.79%) | |||||||||||||||
| Bilibili, Inc., ADR | (43,852 | ) | (713,472 | ) | |||||||||||
| Live Nation Entertainment, Inc.A | (16,650 | ) | (1,103,062 | ) | |||||||||||
|
| ||||||||||||||
| (1,816,534 | ) | ||||||||||||||
|
| ||||||||||||||
| Interactive Media & Services - (1.33%) | |||||||||||||||
| IAC/InterActiveCorpA | (3,801 | ) | (826,832 | ) | |||||||||||
| Momo, Inc., ADR | (14,135 | ) | (506,033 | ) | |||||||||||
| Weibo Corp., Sponsored ADR | (2,468 | ) | (107,481 | ) | |||||||||||
| YY, Inc., ADR | (11,378 | ) | (792,933 | ) | |||||||||||
| Zillow Group, Inc., Class CA | (17,592 | ) | (816,093 | ) | |||||||||||
|
| ||||||||||||||
| (3,049,372 | ) | ||||||||||||||
|
| ||||||||||||||
| Media - (0.49%) | |||||||||||||||
| Charter Communications, Inc., Class AA | (1,156 | ) | (456,828 | ) | |||||||||||
| Sirius XM Holdings, Inc. | (117,590 | ) | (656,152 | ) | |||||||||||
|
| ||||||||||||||
| (1,112,980 | ) | ||||||||||||||
|
| ||||||||||||||
Total Communication Services | (6,724,419 | ) | |||||||||||||
|
| ||||||||||||||
| Consumer Discretionary - (2.67%) | |||||||||||||||
| Diversified Consumer Services - (0.73%) | |||||||||||||||
| Chegg, Inc.A | (42,962 | ) | (1,657,904 | ) | |||||||||||
|
| ||||||||||||||
| Internet & Direct Marketing Retail - (1.79%) | |||||||||||||||
| MercadoLibre, Inc.A | (2,511 | ) | (1,536,154 | ) | |||||||||||
| Wayfair, Inc., Class AA | (17,402 | ) | (2,540,692 | ) | |||||||||||
|
| ||||||||||||||
| (4,076,846 | ) | ||||||||||||||
|
| ||||||||||||||
| Specialty Retail - (0.15%) | |||||||||||||||
| Guess?, Inc. | (21,846 | ) | (352,813 | ) | |||||||||||
|
| ||||||||||||||
Total Consumer Discretionary | (6,087,563 | ) | |||||||||||||
|
| ||||||||||||||
See accompanying notes
14
American Beacon SSI Alternative Income FundSM
Schedule of Investments
June 30, 2019
| Shares | Fair Value | ||||||||||||||
| COMMON STOCKS - (36.63%) (continued) | |||||||||||||||
| Consumer Staples - (0.50%) | |||||||||||||||
| Household Products - (0.50%) | |||||||||||||||
| Energizer Holdings, Inc. | (29,704 | ) | $ | (1,147,763 | ) | ||||||||||
|
| ||||||||||||||
| Energy - (1.79%) | |||||||||||||||
| Energy Equipment & Services - (1.37%) | |||||||||||||||
| Helix Energy Solutions Group, Inc.A | (83,636 | ) | (721,779 | ) | |||||||||||
| Nabors Industries Ltd. | (379,270 | ) | (1,099,883 | ) | |||||||||||
| Newpark Resources, Inc.A | (58,202 | ) | (431,859 | ) | |||||||||||
| SEACOR Holdings, Inc.A | (18,509 | ) | (879,362 | ) | |||||||||||
|
| ||||||||||||||
| (3,132,883 | ) | ||||||||||||||
|
| ||||||||||||||
| Oil, Gas & Consumable Fuels - (0.42%) | |||||||||||||||
| Cheniere Energy, Inc.A | (5,957 | ) | (407,757 | ) | |||||||||||
| Ship Finance International Ltd. | (43,184 | ) | (540,232 | ) | |||||||||||
|
| ||||||||||||||
| (947,989 | ) | ||||||||||||||
|
| ||||||||||||||
Total Energy | (4,080,872 | ) | |||||||||||||
|
| ||||||||||||||
| Financials - (3.08%) | |||||||||||||||
| Banks - (0.19%) | |||||||||||||||
| Hope Bancorp, Inc. | (31,542 | ) | (434,649 | ) | |||||||||||
|
| ||||||||||||||
| Capital Markets - (0.89%) | |||||||||||||||
| Affiliated Managers Group, Inc. | (3,656 | ) | (336,864 | ) | |||||||||||
| Cowen, Inc., Class AA | (53,128 | ) | (913,270 | ) | |||||||||||
| New Mountain Finance Corp. | (1,188 | ) | (16,596 | ) | |||||||||||
| Virtus Investment Partners, Inc. | (7,166 | ) | (769,629 | ) | |||||||||||
|
| ||||||||||||||
| (2,036,359 | ) | ||||||||||||||
|
| ||||||||||||||
| Consumer Finance - (0.84%) | |||||||||||||||
| Encore Capital Group, Inc.A | (23,852 | ) | (807,867 | ) | |||||||||||
| EZCORP, Inc., Class AA | (62,982 | ) | (596,440 | ) | |||||||||||
| PRA Group, Inc.A | (18,182 | ) | (511,641 | ) | |||||||||||
|
| ||||||||||||||
| (1,915,948 | ) | ||||||||||||||
|
| ||||||||||||||
| Diversified Financial Services - (0.89%) | |||||||||||||||
| AXA Equitable Holdings, Inc. | (97,685 | ) | (2,041,616 | ) | |||||||||||
|
| ||||||||||||||
| Mortgage Real Estate Investment Trusts (REITs) - (0.24%) | |||||||||||||||
| Apollo Commercial Real Estate Finance, Inc. | (8,217 | ) | (151,111 | ) | |||||||||||
| Blackstone Mortgage Trust, Inc., Class A | (1,413 | ) | (50,275 | ) | |||||||||||
| Granite Point Mortgage Trust, Inc. | (4,639 | ) | (89,022 | ) | |||||||||||
| KKR Real Estate Finance Trust, Inc. | (3,212 | ) | (63,983 | ) | |||||||||||
| Redwood Trust, Inc. | (6,654 | ) | (109,991 | ) | |||||||||||
| Two Harbors Investment Corp. | (6,926 | ) | (87,752 | ) | |||||||||||
|
| ||||||||||||||
| (552,134 | ) | ||||||||||||||
|
| ||||||||||||||
| Thrifts & Mortgage Finance - (0.03%) | |||||||||||||||
| MGIC Investment Corp.A | (4,357 | ) | (57,251 | ) | |||||||||||
|
| ||||||||||||||
Total Financials | (7,037,957 | ) | |||||||||||||
|
| ||||||||||||||
| Health Care - (6.03%) | |||||||||||||||
| Biotechnology - (3.90%) | |||||||||||||||
| Alder Biopharmaceuticals, Inc.A | (40,298 | ) | (474,307 | ) | |||||||||||
| Exact Sciences Corp.A | (16,199 | ) | (1,912,130 | ) | |||||||||||
| Flexion Therapeutics, Inc.A | (22,827 | ) | (280,772 | ) | |||||||||||
See accompanying notes
15
American Beacon SSI Alternative Income FundSM
Schedule of Investments
June 30, 2019
| Shares | Fair Value | ||||||||||||||
| COMMON STOCKS - (36.63%) (continued) | |||||||||||||||
| Health Care - (6.03%) (continued) | |||||||||||||||
| Biotechnology - (3.90%) (continued) | |||||||||||||||
| Insmed, Inc.A | (20,006 | ) | $ | (512,154 | ) | ||||||||||
| Ionis Pharmaceuticals, Inc.A | (22,113 | ) | (1,421,202 | ) | |||||||||||
| Ironwood Pharmaceuticals, Inc.A | (105,806 | ) | (1,157,518 | ) | |||||||||||
| Ligand Pharmaceuticals, Inc.A | (4,183 | ) | (477,489 | ) | |||||||||||
| Medicines Co.A | (22,287 | ) | (812,807 | ) | |||||||||||
| Neurocrine Biosciences, Inc.A | (11,161 | ) | (942,323 | ) | |||||||||||
| Radius Health, Inc.A | (20,799 | ) | (506,664 | ) | |||||||||||
| Retrophin, Inc.A | (20,579 | ) | (413,432 | ) | |||||||||||
|
| ||||||||||||||
| (8,910,798 | ) | ||||||||||||||
|
| ||||||||||||||
| Health Care Equipment & Supplies - (0.96%) | |||||||||||||||
| Wright Medical Group N.V.A | (73,194 | ) | (2,182,645 | ) | |||||||||||
|
| ||||||||||||||
| Health Care Technology - (0.37%) | |||||||||||||||
| Evolent Health, Inc., Class AA | (28,681 | ) | (228,014 | ) | |||||||||||
| Tabula Rasa HealthCare, Inc.A | (12,605 | ) | (629,368 | ) | |||||||||||
|
| ||||||||||||||
| (857,382 | ) | ||||||||||||||
|
| ||||||||||||||
| Pharmaceuticals - (0.80%) | |||||||||||||||
| Horizon Therapeutics PLCA | (16,177 | ) | (389,218 | ) | |||||||||||
| Innoviva, Inc.A | (75,694 | ) | (1,102,105 | ) | |||||||||||
| Theravance Biopharma, Inc.A | (20,227 | ) | (330,307 | ) | |||||||||||
|
| ||||||||||||||
| (1,821,630 | ) | ||||||||||||||
|
| ||||||||||||||
Total Health Care | (13,772,455 | ) | |||||||||||||
|
| ||||||||||||||
| Industrials - (3.35%) | |||||||||||||||
| Aerospace & Defense - (1.16%) | |||||||||||||||
| Aerojet Rocketdyne Holdings, Inc.A | (59,282 | ) | (2,654,055 | ) | |||||||||||
|
| ||||||||||||||
| Air Freight & Logistics - (0.56%) | |||||||||||||||
| Atlas Air Worldwide Holdings, Inc.A | (28,412 | ) | (1,268,312 | ) | |||||||||||
|
| ||||||||||||||
| Commercial Services & Supplies - (0.21%) | |||||||||||||||
| Team, Inc.A | (31,619 | ) | (484,403 | ) | |||||||||||
|
| ||||||||||||||
| Machinery - (1.05%) | |||||||||||||||
| Colfax Corp.A | (62,930 | ) | (1,763,928 | ) | |||||||||||
| Meritor, Inc.A | (26,225 | ) | (635,956 | ) | |||||||||||
|
| ||||||||||||||
| (2,399,884 | ) | ||||||||||||||
|
| ||||||||||||||
| Professional Services - (0.37%) | |||||||||||||||
| FTI Consulting, Inc.A | (9,959 | ) | (834,963 | ) | |||||||||||
|
| ||||||||||||||
Total Industrials | (7,641,617 | ) | |||||||||||||
|
| ||||||||||||||
| Information Technology - (12.05%) | |||||||||||||||
| Communications Equipment - (1.70%) | |||||||||||||||
| Harmonic, Inc.A | (119,776 | ) | (664,757 | ) | |||||||||||
| Motorola Solutions, Inc. | (19,296 | ) | (3,217,222 | ) | |||||||||||
|
| ||||||||||||||
| (3,881,979 | ) | ||||||||||||||
|
| ||||||||||||||
| Electronic Equipment, Instruments & Components - (1.19%) | |||||||||||||||
| II-VI, Inc.A | (14,767 | ) | (539,882 | ) | |||||||||||
| Knowles Corp.A | (50,433 | ) | (923,428 | ) | |||||||||||
| OSI Systems, Inc.A | (11,019 | ) | (1,241,070 | ) | |||||||||||
|
| ||||||||||||||
| (2,704,380 | ) | ||||||||||||||
|
| ||||||||||||||
See accompanying notes
16
American Beacon SSI Alternative Income FundSM
Schedule of Investments
June 30, 2019
| Shares | Fair Value | ||||||||||||||
| COMMON STOCKS - (36.63%) (continued) | |||||||||||||||
| Information Technology - (12.05%) (continued) | |||||||||||||||
| IT Services - (2.34%) | |||||||||||||||
| MongoDB, Inc.A | (15,230 | ) | $ | (2,316,331 | ) | ||||||||||
| Perficient, Inc.A | (22,194 | ) | (761,698 | ) | |||||||||||
| Square, Inc., Class AA | (15,179 | ) | (1,100,933 | ) | |||||||||||
| Twilio, Inc., Class AA | (8,553 | ) | (1,166,201 | ) | |||||||||||
|
| ||||||||||||||
| (5,345,163 | ) | ||||||||||||||
|
| ||||||||||||||
| Semiconductors & Semiconductor Equipment - (1.89%) | |||||||||||||||
| Cree, Inc.A | (14,352 | ) | (806,295 | ) | |||||||||||
| Microchip Technology, Inc. | (29,483 | ) | (2,556,176 | ) | |||||||||||
| ON Semiconductor Corp.A | (32,904 | ) | (664,990 | ) | |||||||||||
| SunPower Corp.A | (2,958 | ) | (31,621 | ) | |||||||||||
| Synaptics, Inc.A | (5,082 | ) | (148,090 | ) | |||||||||||
| Veeco Instruments, Inc.A | (8,274 | ) | (101,108 | ) | |||||||||||
|
| ||||||||||||||
| (4,308,280 | ) | ||||||||||||||
|
| ||||||||||||||
| Software - (4.34%) | |||||||||||||||
| Atlassian Corp. PLC, Class AA | (13,859 | ) | (1,813,312 | ) | |||||||||||
| Envestnet, Inc.A | (15,224 | ) | (1,040,865 | ) | |||||||||||
| FireEye, Inc.A | (1,111 | ) | (16,454 | ) | |||||||||||
| j2 Global, Inc. | (18,311 | ) | (1,627,665 | ) | |||||||||||
| New Relic, Inc.A | (6,269 | ) | (542,331 | ) | |||||||||||
| Rapid7, Inc.A | (20,872 | ) | (1,207,236 | ) | |||||||||||
| RealPage, Inc.A | (18,523 | ) | (1,090,079 | ) | |||||||||||
| Splunk, Inc.A | (7,095 | ) | (892,196 | ) | |||||||||||
| Workday, Inc., Class AA | (8,212 | ) | (1,688,223 | ) | |||||||||||
|
| ||||||||||||||
| (9,918,361 | ) | ||||||||||||||
|
| ||||||||||||||
| Technology Hardware, Storage & Peripherals - (0.59%) | |||||||||||||||
| NCR Corp.A | (32,810 | ) | (1,020,391 | ) | |||||||||||
| Pure Storage, Inc., Class AA | (21,939 | ) | (335,008 | ) | |||||||||||
|
| ||||||||||||||
| (1,355,399 | ) | ||||||||||||||
|
| ||||||||||||||
Total Information Technology | (27,513,562 | ) | |||||||||||||
|
| ||||||||||||||
| Materials - (1.04%) | |||||||||||||||
| Metals & Mining - (1.04%) | |||||||||||||||
| Cleveland-Cliffs, Inc. | (163,545 | ) | (1,745,025 | ) | |||||||||||
| First Majestic Silver Corp.A | (78,678 | ) | (622,343 | ) | |||||||||||
|
| ||||||||||||||
| (2,367,368 | ) | ||||||||||||||
|
| ||||||||||||||
Total Materials | (2,367,368 | ) | |||||||||||||
|
| ||||||||||||||
| Real Estate - (1.92%) | |||||||||||||||
| Equity Real Estate Investment Trusts (REITs) - (1.92%) | |||||||||||||||
| Invitation Homes, Inc. | (63,406 | ) | (1,694,842 | ) | |||||||||||
| iStar, Inc. | (122,431 | ) | (1,520,593 | ) | |||||||||||
| QTS Realty Trust, Inc., Class A | (25,172 | ) | (1,162,443 | ) | |||||||||||
|
| ||||||||||||||
| (4,377,878 | ) | ||||||||||||||
|
| ||||||||||||||
Total Real Estate | (4,377,878 | ) | |||||||||||||
|
| ||||||||||||||
| Utilities - (1.26%) | |||||||||||||||
| Gas Utilities - (0.44%) | |||||||||||||||
| South Jersey Industries, Inc. | (29,579 | ) | (997,700 | ) | |||||||||||
|
| ||||||||||||||
| (997,700 | ) | ||||||||||||||
|
| ||||||||||||||
See accompanying notes
17
American Beacon SSI Alternative Income FundSM
Schedule of Investments
June 30, 2019
| Shares | Fair Value | ||||||||||||||
| COMMON STOCKS - (36.63%) (continued) | |||||||||||||||
| Independent Power & Renewable Electricity Producers - (0.21%) | |||||||||||||||
| NRG Energy, Inc. | (13,624 | ) | $ | (478,475 | ) | ||||||||||
|
| ||||||||||||||
| (478,475 | ) | ||||||||||||||
|
| ||||||||||||||
| Multi-Utilities - (0.51%) | |||||||||||||||
| CenterPoint Energy, Inc. | (29,866 | ) | (855,064 | ) | |||||||||||
| Dominion Energy, Inc. | (4,154 | ) | (321,187 | ) | |||||||||||
|
| ||||||||||||||
| (1,176,251 | ) | ||||||||||||||
|
| ||||||||||||||
| Water Utilities - (0.10%) | |||||||||||||||
| Aqua America, Inc. | (5,349 | ) | (221,288 | ) | |||||||||||
|
| ||||||||||||||
| (221,288 | ) | ||||||||||||||
|
| ||||||||||||||
Total Utilities | (2,873,714 | ) | |||||||||||||
|
| ||||||||||||||
TOTAL COMMON STOCKS (Proceeds $(71,400,326)) | (83,625,168 | ) | |||||||||||||
|
| ||||||||||||||
TOTAL SECURITIES SOLD SHORT (Proceeds $(71,400,326)) | (83,625,168 | ) | |||||||||||||
|
| ||||||||||||||
TOTAL INVESTMENTS IN SECURITIES (EXCLUDES SECURITIES SOLD SHORT) - 101.20% (Cost $216,398,414) | 231,072,781 | ||||||||||||||
TOTAL WRITTEN OPTIONS CONTRACTS - (0.17%) (Premiums Received $(250,645)) | (394,098 | ) | |||||||||||||
TOTAL SECURITIES SOLD SHORT - (36.63%) (Proceeds $(71,400,326)) | (83,625,168 | ) | |||||||||||||
OTHER ASSETS, NET OF LIABILITIES - 35.60% | 81,273,863 | ||||||||||||||
|
| ||||||||||||||
TOTAL NET ASSETS - 100.00% | $ | 228,327,378 | |||||||||||||
|
| ||||||||||||||
| Percentages are stated as a percent of net assets. | |||||||||||||||
ANon-income producing security.
B Fair valued pursuant to procedures approved by the Board of Trustees. At period end, the value of these securities amounted to $5 or 0.00% of net assets.
C A type of Preferred Stock that has no maturity date.
D Security exempt from registration under the Securities Act of 1933. These securities may be resold to qualified institutional buyers pursuant to Rule 144A. At the period end, the value of these securities amounted to $35,260,809 or 15.44% of net assets. The Fund has no right to demand registration of these securities.
E Step Up/Down - A zero coupon bond that converts to a fixed rate or variable interest rate at a designated future date. The rate disclosed represents the coupon rate at June 30, 2019. The maturity date disclosed represents the final maturity date.
F The Fund is affiliated by having the same investment advisor.
G7-day yield.
H This security or a piece thereof is held as segregated collateral. At period end, the value of these securities amounted to $66,204,416 or 29.00% of net assets.
I Callable security.
ADR - American Depositary Receipt.
LLC - Limited Liability Company.
PIK - Payment in Kind.
PLC - Public Limited Company.
| Written Options Contracts Open on June 30, 2019: |
| |||||||||||||||||||||||||||
| Equity Options | ||||||||||||||||||||||||||||
| Description | Counter- party | Exercise Price | Expiration Date | Currency | Number of Contracts | Notional Amount | Premiums Received | Fair Value | Unrealized Appreciation (Depreciation) | |||||||||||||||||||
| Call - Cleveland-Cliffs, Inc. | CCP | 9.00 | 7/19/2019 | USD | 407 | 40,700 | $ | (35,407 | ) | $ | (68,783 | ) | $ | (33,376 | ) | |||||||||||||
| Call - Exact Sciences Corp. | CCP | 110.00 | 7/19/2019 | USD | 31 | 3,100 | (18,537 | ) | (29,450 | ) | (10,913 | ) | ||||||||||||||||
| Call - First Majestic Silver Corp. | CCP | 6.00 | 7/19/2019 | USD | 334 | 33,400 | (12,692 | ) | (61,790 | ) | (49,098 | ) | ||||||||||||||||
| Call - Medicines Co. | CCP | 30.00 | 7/19/2019 | USD | 92 | 9,200 | (27,369 | ) | (63,480 | ) | (36,111 | ) | ||||||||||||||||
| Call - Momo, Inc. | CCP | 34.40 | 7/19/2019 | USD | 56 | 5,600 | (8,288 | ) | (12,040 | ) | (3,752 | ) | ||||||||||||||||
| Call - Envestnet, Inc. | CCP | 70.00 | 8/16/2019 | USD | 36 | 3,600 | (11,808 | ) | (10,260 | ) | 1,548 | |||||||||||||||||
See accompanying notes
18
American Beacon SSI Alternative Income FundSM
Schedule of Investments
June 30, 2019
| Equity Options | ||||||||||||||||||||||||||||
| Description | Counter- party | Exercise Price | Expiration Date | Currency | Number of Contracts | Notional Amount | Premiums Received | Fair Value | Unrealized Appreciation (Depreciation) | |||||||||||||||||||
| Call - Horizon Therapeutics PLC | CCP | 23.00 | 8/16/2019 | USD | 62 | 6,200 | $ | (11,966 | ) | $ | (14,632 | ) | $ | (2,666 | ) | |||||||||||||
| Call - MongoDB, Inc. | CCP | 140.00 | 8/16/2019 | USD | 27 | 2,700 | (43,145 | ) | (42,120 | ) | 1,025 | |||||||||||||||||
| Call - Neurocrine Biosciences, Inc. | CCP | 85.00 | 8/16/2019 | USD | 26 | 2,600 | (14,768 | ) | (14,248 | ) | 520 | |||||||||||||||||
| Call - Rapid7, Inc. | CCP | 55.00 | 8/16/2019 | USD | 47 | 4,700 | (13,536 | ) | (26,790 | ) | (13,254 | ) | ||||||||||||||||
| Call - Wayfair, Inc. | CCP | 145.00 | 8/16/2019 | USD | 35 | 3,500 | (53,129 | ) | (50,505 | ) | 2,624 | |||||||||||||||||
|
|
|
|
|
| |||||||||||||||||||||||
| $ | (250,645 | ) | $ | (394,098 | ) | $ | (143,453 | ) | ||||||||||||||||||||
|
|
|
|
|
| |||||||||||||||||||||||
| Glossary: | ||
| Currency Abbreviations: | ||
| USD | United States Dollar | |
| Other Abbreviations: | ||
| CCP | Central Counterparty Clearing House. | |
The Fund’s investments are summarized by level based on the inputs used to determine their values. As of June 30, 2019, the investments were classified as described below:
SSI Alternative Income Fund | Level 1 | Level 2 | Level 3 | Total | ||||||||||||||||||||||||
Assets |
| |||||||||||||||||||||||||||
Common Stocks | $ | 81,072 | $ | - | $ | - | $ | 81,072 | ||||||||||||||||||||
Rights | - | - | 5 | 5 | ||||||||||||||||||||||||
Convertible Preferred Stocks | 835,239 | | 27,043,352 | | - | 27,878,591 | ||||||||||||||||||||||
Corporate Obligations | - | 44,358,558 | - | 44,358,558 | ||||||||||||||||||||||||
Convertible Obligations | - | 128,165,249 | - | 128,165,249 | ||||||||||||||||||||||||
Foreign Corporate Obligations | - | 4,997,396 | - | 4,997,396 | ||||||||||||||||||||||||
Exchange-Traded Instruments | 2,446,800 | - | - | 2,446,800 | ||||||||||||||||||||||||
Short-Term Investments | 23,145,110 | - | - | 23,145,110 | ||||||||||||||||||||||||
|
|
|
|
|
|
|
| |||||||||||||||||||||
Total Investments in Securities - Assets | $ | 26,508,221 | $ | 204,564,555 | $ | 5 | $ | 231,072,781 | ||||||||||||||||||||
|
|
|
|
|
|
|
| |||||||||||||||||||||
Liabilities |
| |||||||||||||||||||||||||||
Common Stocks (Sold Short) | $ | (83,625,168 | ) | $ | - | $ | - | $ | (83,625,168 | ) | ||||||||||||||||||
|
|
|
|
|
|
|
| |||||||||||||||||||||
Total Investments in Securities - Liabilities | (83,625,168 | ) | - | - | (83,625,168 | ) | ||||||||||||||||||||||
|
|
|
|
|
|
|
| |||||||||||||||||||||
Total Investments in Securities | $ | (57,116,947 | ) | $ | 204,564,555 | $ | 5 | $ | 147,447,613 | |||||||||||||||||||
|
|
|
|
|
|
|
| |||||||||||||||||||||
Financial Derivative Instruments - Liabilities |
| |||||||||||||||||||||||||||
Written Options | $ | (394,098 | ) | $ | - | $ | - | $ | (394,098 | ) | ||||||||||||||||||
|
|
|
|
|
|
|
| |||||||||||||||||||||
Total Financial Derivative Instruments - Liabilities | $ | (394,098 | ) | $ | - | $ | - | $ | (394,098 | ) | ||||||||||||||||||
|
|
|
|
|
|
|
| |||||||||||||||||||||
U.S. GAAP requires transfers between all levels to/from level 3 be disclosed. During the year ended June 30, 2019, there were no transfers into or out of Level 3.
See accompanying notes
19
American Beacon SSI Alternative Income FundSM
Schedule of Investments
June 30, 2019
The following table is a reconciliation of Level 3 assets within the Fund for which significant unobservable inputs were used to determine fair value. Transfers in or out of Level 3 represent the ending value of any security or instrument where a change in the level has occurred from the beginning to the end of the period:
| Security Type | Balance as of 3/31/2019 | Purchases | Sales | Accrued Discounts (Premiums) | Realized Gain (Loss) | Change in Unrealized Appreciation (Depreciation) | Transfer into Level 3 | Transfer out of Level 3 | Balance as of 6/30/2019 | Change in Unrealized Appreciation (Depreciation) at Period end** | ||||||||||||||||||||||||||||||
| Rights | $ | 5 | $ | - | $ | - | $ | - | $ | - | $ | - | $ | - | $ | - | $ | 5 | $ | - | ||||||||||||||||||||
| ** | Change in unrealized appreciation (depreciation) attributable to Level 3 securities held at period end. This balance is included in the change in unrealized appreciation (depreciation) on the Statement of Operations. |
The rights, classified as Level 3, were valued using single broker quotes. These securities are deemed Level 3 due to limited market transparency and/or lack of corroboration to support the quoted prices.
See accompanying notes
20
American Beacon TwentyFour Strategic Income FundSM
Schedule of Investments
June 30, 2019
| Principal Amount* | Fair Value | ||||||||||||||
| CORPORATE OBLIGATIONS - 3.61% | |||||||||||||||
| Communications - 1.91% | |||||||||||||||
| CommScope, Inc., 5.500%, Due 3/1/2024A | $ | 291,000 | $ | 298,639 | |||||||||||
| CSC Holdings LLC, 5.375%, Due 7/15/2023A | 200,000 | 205,500 | |||||||||||||
| Nexstar Escrow, Inc., 5.625%, Due 7/15/2027A | 209,000 | 213,964 | |||||||||||||
| Sprint Corp., 7.875%, Due 9/15/2023 | 515,000 | 559,418 | |||||||||||||
|
| ||||||||||||||
| 1,277,521 | |||||||||||||||
|
| ||||||||||||||
| Consumer,Non-Cyclical - 0.16% | |||||||||||||||
| CHS/Community Health Systems, Inc., 5.125%, Due 8/1/2021 | 110,000 | 107,525 | |||||||||||||
|
| ||||||||||||||
| Financial - 0.98% | |||||||||||||||
Brookfield Property REIT, Inc. / BPR Cumulus LLC / BPR Nimbus LLC / GGSI Sellco LL, 5.750%, Due 5/15/2026A | 375,000 | 386,250 | |||||||||||||
| Dresdner Funding Trust I, 8.151%, Due 6/30/2031B | 100,000 | 134,475 | |||||||||||||
| MGM Growth Properties Operating Partnership LP / MGP FinanceCo-Issuer, Inc., | |||||||||||||||
4.500%, Due 9/1/2026 | 48,000 | 49,260 | |||||||||||||
5.750%, Due 2/1/2027A | 76,000 | 81,890 | |||||||||||||
|
| ||||||||||||||
| 651,875 | |||||||||||||||
|
| ||||||||||||||
| Industrial - 0.44% | |||||||||||||||
| Berry Global Escrow Corp., 5.625%, Due 7/15/2027A | 86,000 | 89,440 | |||||||||||||
| Stericycle, Inc., 5.375%, Due 7/15/2024A | 96,000 | 100,212 | |||||||||||||
| TransDigm, Inc., 6.250%, Due 3/15/2026A | 100,000 | 105,250 | |||||||||||||
|
| ||||||||||||||
| 294,902 | |||||||||||||||
|
| ||||||||||||||
| Technology - 0.12% | |||||||||||||||
| Dell International LLC / EMC Corp., 7.125%, Due 6/15/2024A | 77,000 | 81,291 | |||||||||||||
|
| ||||||||||||||
Total Corporate Obligations (Cost $2,359,948) | 2,413,114 | ||||||||||||||
|
| ||||||||||||||
| FOREIGN CORPORATE OBLIGATIONS - 54.25% | |||||||||||||||
| Basic Materials - 0.41% | |||||||||||||||
| Lecta S.A., 6.500%, Due 8/1/2023B | EUR | 320,000 | 275,560 | ||||||||||||
|
| ||||||||||||||
| Communications - 4.44% | |||||||||||||||
| Altice France S.A., | |||||||||||||||
6.250%, Due 5/15/2024A | 255,000 | 262,650 | |||||||||||||
7.375%, Due 5/1/2026A | 200,000 | 205,000 | |||||||||||||
| Altice Luxembourg S.A., | |||||||||||||||
7.250%, Due 5/15/2022B | EUR | 85,783 | 99,988 | ||||||||||||
8.000%, Due 5/15/2027B | EUR | 200,000 | 231,251 | ||||||||||||
10.500%, Due 5/15/2027A | 200,000 | 205,500 | |||||||||||||
| America Movil S.A.B. de C.V., 6.375%, Due 9/6/2073, Series C,(5-Yr. GBP Swap + 4.100%)B C | GBP | 300,000 | 400,908 | ||||||||||||
| Sable International Finance Ltd., 5.750%, Due 9/7/2027A | 291,000 | 293,001 | |||||||||||||
| Telecom Italia SpA, 4.000%, Due 4/11/2024B | EUR | 100,000 | 122,749 | ||||||||||||
| Telefonica Europe B.V., 2.625%, Due 3/7/2023,(5-Yr. Annual EUR Swap + 2.327%)B D | EUR | 100,000 | 114,989 | ||||||||||||
| Turkcell Iletisim Hizmetleri A/S, 5.750%, Due 10/15/2025B | 200,000 | 192,640 | |||||||||||||
| TV Azteca S.A.B. de C.V., 8.250%, Due 8/9/2024B | 400,000 | 393,904 | |||||||||||||
| Unitymedia Hessen GmbH & Co. KG / Unitymedia NRW GmbH, 6.250%, Due 1/15/2029B | EUR | 135,000 | 170,678 | ||||||||||||
| VTR Finance B.V., 6.875%, Due 1/15/2024B | 260,000 | 269,100 | |||||||||||||
|
| ||||||||||||||
| 2,962,358 | |||||||||||||||
|
| ||||||||||||||
| Consumer, Cyclical - 1.00% | |||||||||||||||
| Brookfield Residential Properties, Inc. / Brookfield Residential US Corp., 6.125%, Due 7/1/2022A | 169,000 | 171,957 | |||||||||||||
| IHO Verwaltungs GmbH, 3.625%, Due 5/15/2025, PIK(in-kind rate 4.375%)A | EUR | 150,000 | 174,403 | ||||||||||||
| Panther BF Aggregator 2 LP / Panther Finance Co., Inc., | |||||||||||||||
4.375%, Due 5/15/2026A | EUR | 110,000 | 129,146 | ||||||||||||
6.250%, Due 5/15/2026A | 184,000 | 191,130 | |||||||||||||
|
| ||||||||||||||
| 666,636 | |||||||||||||||
|
| ||||||||||||||
See accompanying notes
21
American Beacon TwentyFour Strategic Income FundSM
Schedule of Investments
June 30, 2019
| Principal Amount* | Fair Value | ||||||||||||||
| FOREIGN CORPORATE OBLIGATIONS - 54.25% (continued) | |||||||||||||||
| Consumer,Non-Cyclical - 1.98% | |||||||||||||||
| AA Bond Co., Ltd., 2.875%, Due 7/31/2043B | GBP | 100,000 | $ | 120,821 | |||||||||||
| Bausch Health Cos., Inc., 9.000%, Due 12/15/2025A | $ | 168,000 | 187,706 | ||||||||||||
| Kernel Holding S.A., 8.750%, Due 1/31/2022B | 200,000 | 210,936 | |||||||||||||
| MARB BondCo PLC, 6.875%, Due 1/19/2025B | 200,000 | 208,646 | |||||||||||||
| MHP SE, 7.750%, Due 5/10/2024B | 300,000 | 318,492 | |||||||||||||
| Synlab Bondco PLC, 3.500%, Due 7/1/2022,(3-mo. EUR EURIBOR + 3.500%)B C | EUR | 100,000 | 113,885 | ||||||||||||
| Verisure Midholding AB, 5.750%, Due 12/1/2023B | EUR | 140,000 | 164,570 | ||||||||||||
|
| ||||||||||||||
| 1,325,056 | |||||||||||||||
|
| ||||||||||||||
| Diversified - 0.22% | |||||||||||||||
| VistaJet Malta Finance PLC / XO Management Holding, Inc., 10.500%, Due 6/1/2024A | 150,000 | 149,625 | |||||||||||||
|
| ||||||||||||||
| Energy - 2.53% | |||||||||||||||
| Gazprom OAO Via Gaz Capital S.A., | |||||||||||||||
4.250%, Due 4/6/2024B | GBP | 200,000 | 269,114 | ||||||||||||
8.625%, Due 4/28/2034B | 100,000 | 136,209 | |||||||||||||
| Petrobras Global Finance B.V., 6.250%, Due 12/14/2026 | GBP | 250,000 | 357,935 | ||||||||||||
| Petroleos Mexicanos, | |||||||||||||||
2.500%, Due 8/21/2021B | EUR | 200,000 | 227,693 | ||||||||||||
5.125%, Due 3/15/2023B | EUR | 400,000 | 477,722 | ||||||||||||
| Transocean Phoenix Ltd., 7.750%, Due 10/15/2024A | 207,750 | 221,773 | |||||||||||||
|
| ||||||||||||||
| 1,690,446 | |||||||||||||||
|
| ||||||||||||||
| Financial - 41.95% | |||||||||||||||
| Aareal Bank AG, 7.625%, Due 4/30/2020,(1-Yr. Annual EUR Swap + 7.180%)B C | EUR | 800,000 | 946,067 | ||||||||||||
| ABN AMRO Bank N.V., 5.750%, Due 9/22/2020,(5-Yr. Annual EUR Swap + 5.452%)B C | EUR | 600,000 | 717,335 | ||||||||||||
| Achmea B.V., 6.000%, Due 4/4/2043,(3-mo. EUR EURIBOR + 5.330%)B C | EUR | 430,000 | 567,800 | ||||||||||||
| Aldermore Group PLC, 8.500%, Due 10/28/2026,(5-Yr. GBP Swap + 7.784%)B C | GBP | 100,000 | 141,676 | ||||||||||||
| Allied Irish Banks PLC, 7.375%, Due 12/3/2020,(5-Yr. Annual EUR Swap + 7.339%)B C | EUR | 231,000 | 283,355 | ||||||||||||
| ASR Nederland N.V., 4.625%, Due 10/19/2027,(5-Yr. Annual EUR Swap + 3.789%)B D | EUR | 400,000 | 459,708 | ||||||||||||
| Assicurazioni Generali SpA, 6.416%, Due 2/8/2022,(3-mo. GBP LIBOR + 2.200%)B C | GBP | 500,000 | 665,136 | ||||||||||||
| ATF Netherlands B.V., 3.750%, Due 1/20/2023,(5-Yr. Annual EUR Swap + 4.375%)B C | EUR | 400,000 | 474,203 | ||||||||||||
| Aviva PLC, 5.902%, Due 7/27/2020,(6-mo. GBP LIBOR + 1.880%)B C | GBP | 450,000 | 588,621 | ||||||||||||
| Banco Bilbao Vizcaya Argentaria S.A., | |||||||||||||||
6.750%, Due 2/18/2020,(5-Yr. Annual EUR Swap + 6.604%)B C | EUR | 400,000 | 467,306 | ||||||||||||
8.875%, Due 4/14/2021,(5-Yr. Annual EUR Swap + 9.177%)B C | EUR | 200,000 | 253,289 | ||||||||||||
| Banco de Sabadell S.A., 5.375%, Due 12/12/2028,(5-Yr. Annual EUR Swap + 5.100%)B C | EUR | 300,000 | 374,786 | ||||||||||||
| Banco Mercantil del Norte S.A., 5.750%, Due 10/4/2031,(5-Yr. CMT + 4.447%)B C | 300,000 | 292,128 | |||||||||||||
| Banco Santander S.A., 6.750%, Due 4/25/2022,(5-Yr. Annual EUR Swap + 6.803%)B D | EUR | 600,000 | 743,370 | ||||||||||||
| Bank of Ireland, 7.375%, Due 6/18/2020,(5-Yr. Annual EUR Swap + 6.956%)B C | EUR | 340,000 | 407,871 | ||||||||||||
| Barclays Bank PLC, 7.125%, Due 10/24/2020,(5-Yr. UK Government Bond + 3.150%)B C | GBP | 360,000 | 482,102 | ||||||||||||
| Barclays PLC, | |||||||||||||||
6.500%, Due 9/15/2019,(5-Yr. Annual EUR Swap + 5.875%)C | EUR | 400,000 | 459,388 | ||||||||||||
7.875%, Due 9/15/2022,(5-Yr. GBP Swap + 6.099%)B C | GBP | 200,000 | 268,912 | ||||||||||||
| BAWAG Group AG, 2.375%, Due 3/26/2029,(5-Yr. Annual EUR Swap + 2.300%)B D | EUR | 200,000 | 231,242 | ||||||||||||
| BNP Paribas S.A., | |||||||||||||||
6.500%, Due 9/6/2019 | 300,000 | 306,000 | |||||||||||||
4.875%, Due 10/17/2019 | EUR | 710,000 | 822,874 | ||||||||||||
| Bracken MidCo1 PLC, 8.875%, Due 10/15/2023, Cash (8.875%) or PIK(in-kind rate 9.648%)A | GBP | 580,000 | 710,546 | ||||||||||||
| Cabot Financial Luxembourg S.A., 7.500%, Due 10/1/2023B | GBP | 551,000 | 722,484 | ||||||||||||
| Cooperatieve Rabobank UA, 6.910%, Due 6/10/2038,(6-mo. GBP LIBOR + 2.825%)B C | GBP | 75,000 | 137,245 | ||||||||||||
| Coventry Building Society, 6.875%, Due 9/18/2024,(5-Yr. UK Government Bond + 6.111%)B C | GBP | 500,000 | 646,651 | ||||||||||||
| CYBG PLC, 5.000%, Due 2/9/2026,(5-Yr. GBP Swap + 3.516%)B C | GBP | 100,000 | 127,156 | ||||||||||||
| Deutsche Pfandbriefbank AG, 5.750%, Due 4/28/2023,(5-Yr. EUR Swap + 5.383%)B C | EUR | 600,000 | 696,806 | ||||||||||||
| Direct Line Insurance Group PLC, 4.750%, Due 12/7/2027,(5-Yr. GBP Swap + 3.394%)B C | GBP | 200,000 | 216,679 | ||||||||||||
| Garfunkelux Holdco S.A., 8.500%, Due 11/1/2022B | GBP | 200,000 | 227,829 | ||||||||||||
| ING Groep N.V., 6.000%, Due 4/16/2020,(5-Yr. Semi-Annual USD Swap + 4.445%)C | 350,000 | 353,395 | |||||||||||||
| Intesa Sanpaolo SpA, 7.000%, Due 1/19/2021,(5-Yr. Annual EUR Swap + 6.884%)B C | EUR | 550,000 | 658,265 | ||||||||||||
| Jerrold Finco PLC, 6.125%, Due 1/15/2024B | GBP | 500,000 | 644,753 | ||||||||||||
See accompanying notes
22
American Beacon TwentyFour Strategic Income FundSM
Schedule of Investments
June 30, 2019
| Principal Amount* | Fair Value | ||||||||||||||
| FOREIGN CORPORATE OBLIGATIONS - 54.25% (continued) | |||||||||||||||
| Financial - 41.95% (continued) | |||||||||||||||
Liverpool Victoria Friendly Society Ltd., 6.500%, Due 5/22/2043,(5-Yr. UK Government Bond + 5.630%)B C | GBP | 500,000 | $ | 707,194 | |||||||||||
| Lloyds Bank PLC, 13.000%, Due 1/22/2029,(5-Yr. UK Government Bond + 13.400%)C | GBP | 450,000 | 985,567 | ||||||||||||
| Nationwide Building Society, 10.250%, Due 12/31/2049, Series CCDSB D | GBP | 916,700 | 1,756,430 | ||||||||||||
| Oaknorth Bank PLC, 7.750%, Due 6/1/2028,(5-Yr. UK Government Bond + 6.851%)B C | GBP | 250,000 | 317,487 | ||||||||||||
| OneSavings Bank PLC, 9.125%, Due 5/25/2022,(5-Yr. GBP ICE Swap + 8.359%)B C | GBP | 400,000 | 511,790 | ||||||||||||
| Paragon Banking Group PLC, 7.250%, Due 9/9/2026,(5-Yr. GBP Swap + 6.731%)B C | GBP | 490,000 | 661,307 | ||||||||||||
| Pension Insurance Corp. PLC, 6.500%, Due 7/3/2024B | GBP | 400,000 | 565,582 | ||||||||||||
| Phoenix Group Holdings, | |||||||||||||||
6.625%, Due 12/18/2025 | GBP | 250,000 | 349,955 | ||||||||||||
5.750%, Due 12/31/2049 | GBP | 500,000 | 562,746 | ||||||||||||
| Principality Building Society, 7.000%, Due 6/1/2020,(5-Yr. UK Government Bond + 3.000%)C | GBP | 449,000 | 572,659 | ||||||||||||
| QBE Insurance Group Ltd., 6.115%, Due 5/24/2042,(5-Yr. GBP Swap + 5.000%)B C | GBP | 200,000 | 276,651 | ||||||||||||
| Rothesay Life PLC, 8.000%, Due 10/30/2025B | GBP | 100,000 | 143,695 | ||||||||||||
| Rothesay Life PLC, 6.875%, Due 9/12/2028,(5-Yr. GBP Swap + 5.419%)B C | GBP | 450,000 | 554,333 | ||||||||||||
| Shawbrook Group PLC, 7.875%, Due 12/8/2022,(5-Yr. GBP Swap + 6.752%)B C | GBP | 200,000 | 250,497 | ||||||||||||
Skandinaviska Enskilda Banken AB, 5.750%, Due 5/13/2020,(5-Yr. Semi-Annual USD Swap + 3.850%)B C | $ | 900,000 | 907,189 | ||||||||||||
| Societe Generale S.A., 6.750%, Due 4/7/2021,(5-Yr. Annual EUR Swap + 5.538%)B C | EUR | 150,000 | 182,078 | ||||||||||||
| Svenska Handelsbanken AB, 5.250%, Due 3/1/2021,(5-Yr. Semi-Annual USD Swap + 3.335%)B C | 700,000 | 705,250 | |||||||||||||
| Turkiye Garanti Bankasi A/S, 4.750%, Due 10/17/2019B | 200,000 | 199,710 | |||||||||||||
| UBS Group Funding Switzerland AG, | |||||||||||||||
6.875%, Due 3/22/2021, Series .,(5-Yr. USD ICE Swap + 5.497%)B D | 200,000 | 208,000 | |||||||||||||
7.000%, Due 1/31/2024,(5-Yr. Semi-Annual USD Swap + 4.344%)A D | 700,000 | 743,624 | |||||||||||||
| UnipolSai Assicurazioni SpA, 5.750%, Due 6/18/2024,(3-mo. EUR EURIBOR + 5.180%)B C | EUR | 350,000 | 398,982 | ||||||||||||
| UNIQA Insurance Group AG, 6.875%, Due 7/31/2043,(3-mo. EUR EURIBOR + 5.986%)B C | EUR | 300,000 | 402,991 | ||||||||||||
| Virgin Money Holdings UK PLC, 8.750%, Due 11/10/2021,(5-Yr. GBP Swap + 7.930%)B C | GBP | 700,000 | 954,359 | ||||||||||||
|
| ||||||||||||||
| 28,013,054 | |||||||||||||||
|
| ||||||||||||||
| Industrial - 1.37% | |||||||||||||||
| ARD Finance S.A., 6.625%, Due 9/15/2023, PIK(in-kind rate 7.375%) | EUR | 150,000 | 176,663 | ||||||||||||
| Hidrovias International Finance SARL, 5.950%, Due 1/24/2025B | 400,000 | 408,904 | |||||||||||||
| Promontoria Holding 264 B.V., | |||||||||||||||
6.750%, Due 8/15/2023B | EUR | 200,000 | 217,655 | ||||||||||||
6.750%, Due 8/15/2023A | EUR | 100,000 | 108,827 | ||||||||||||
|
| ||||||||||||||
| 912,049 | |||||||||||||||
|
| ||||||||||||||
| Utilities - 0.35% | |||||||||||||||
| Centrica PLC, 3.000%, Due 4/10/2076, Series .,(5-Yr. Annual EUR Swap + 2.687%)B C | EUR | 200,000 | 230,250 | ||||||||||||
|
| ||||||||||||||
Total Foreign Corporate Obligations (Cost $36,471,116) | 36,225,034 | ||||||||||||||
|
| ||||||||||||||
| FOREIGN SOVEREIGN OBLIGATIONS - 5.54% | |||||||||||||||
| African Export-Import Bank, 4.125%, Due 6/20/2024B | 300,000 | 306,600 | |||||||||||||
| Spain Government Bond, 1.850%, Due 7/30/2035A B | EUR | 2,610,000 | 3,394,991 | ||||||||||||
|
| ||||||||||||||
Total Foreign Sovereign Obligations (Cost $3,577,681) | 3,701,591 | ||||||||||||||
|
| ||||||||||||||
| ASSET-BACKED OBLIGATIONS - 8.02% | |||||||||||||||
| BNPP AM Euro CLO B.V., 4.700%, Due 10/15/2031,2017-1X E,(3-mo. EUR EURIBOR + 4.700%)B C | EUR | 500,000 | 539,172 | ||||||||||||
| Carlyle Euro CLO DAC, 5.230%, Due 8/28/2031,2018-2A D,(3-mo. EUR EURIBOR + 5.230%)A C | EUR | 500,000 | 550,297 | ||||||||||||
Carlyle Global Market Strategies Euro CLO DAC, 4.770%, Due 5/17/2031,2016-1A DR,(3-mo. EUR EURIBOR + 4.770%)A C | EUR | 500,000 | 528,769 | ||||||||||||
Dryden 39 Euro CLO B.V., 4.970%, Due 10/15/2031,2015-39X ER,(3-mo. EUR EURIBOR + 4.970%)B C | EUR | 1,000,000 | 1,082,709 | ||||||||||||
DrydenXXVII-R Euro CLO B.V., 3.150%, Due 5/15/2030,2017-27X D,(3-mo. EUR EURIBOR + 3.150%)B C | EUR | 1,000,000 | 1,136,293 | ||||||||||||
| Halcyon Loan Advisors, 5.130%, Due 10/18/2031 | EUR | 1,190,000 | 1,287,394 | ||||||||||||
| Man GLG Euro CLO II DAC, 8.750%, Due 1/15/2030, 2X F,(3-mo. EUR EURIBOR + 8.750%)B C | EUR | 200,000 | 227,426 | ||||||||||||
|
| ||||||||||||||
Total Asset-Backed Obligations (Cost $5,603,942) | 5,352,060 | ||||||||||||||
|
| ||||||||||||||
See accompanying notes
23
American Beacon TwentyFour Strategic Income FundSM
Schedule of Investments
June 30, 2019
| Principal Amount* | Fair Value | ||||||||||||||
| COLLATERALIZED MORTGAGE OBLIGATIONS - 0.76% (Cost $504,109) | |||||||||||||||
| Residential Mortgage Securities 26 PLC, Due 2/14/2041, 26 M1B E H | GBP | 400,000 | $ | 503,867 | |||||||||||
|
| ||||||||||||||
| U.S. TREASURY OBLIGATIONS - 24.51% | |||||||||||||||
| U.S. Treasury Notes/Bonds, | |||||||||||||||
1.000%, Due 11/30/2019 | $ | 5,580,000 | 5,554,062 | ||||||||||||
2.125%, Due 3/31/2024 | 5,350,000 | 5,439,445 | |||||||||||||
2.625%, Due 2/15/2029 | 3,700,000 | 3,901,765 | |||||||||||||
3.375%, Due 11/15/2048 | 1,249,600 | 1,470,965 | |||||||||||||
|
| ||||||||||||||
Total U.S. Treasury Obligations (Cost $16,040,026) | 16,366,237 | ||||||||||||||
|
| ||||||||||||||
| Shares | |||||||||||||||
| SHORT-TERM INVESTMENTS - 1.98% (Cost $1,319,812) | |||||||||||||||
| Investment Companies - 1.98% | |||||||||||||||
American Beacon U.S. Government Money Market Select Fund, Select Class, 2.32%F G | 1,319,812 | 1,319,812 | |||||||||||||
|
| ||||||||||||||
TOTAL INVESTMENTS - 98.67% (Cost $65,876,634) | 65,881,715 | ||||||||||||||
OTHER ASSETS, NET OF LIABILITIES - 1.33% | 889,237 | ||||||||||||||
|
| ||||||||||||||
TOTAL NET ASSETS - 100.00% | $ | 66,770,952 | |||||||||||||
|
| ||||||||||||||
Percentages are stated as a percent of net assets. *In U.S. Dollars unless otherwise noted. | |||||||||||||||
A Security exempt from registration under the Securities Act of 1933. These securities may be resold to qualified institutional buyers pursuant to Rule 144A. At the period end, the value of these securities amounted to $9,791,381 or 14.66% of net assets. The Fund has no right to demand registration of these securities.
B Reg S - Security purchased under the Securities Act of 1933, which exempts from registration securities offered and sold outside of the United States. Such a security cannot be sold in the United States without either an effective registration statement filed pursuant to the Securities Act of 1933, or pursuant to an exemption from registration.
C Variable, floating, or adjustable rate securities with an interest rate that changes periodically. Rates are periodically reset with rates that are based on a predetermined benchmark such as a widely followed interest rate such asT-bills, LIBOR or PRIME plus a fixed spread. The interest rate disclosed reflects the rate in effect on June 30, 2019.
D Coupon rate may change based on changes of the underlying collateral or prepayments of principal. The coupon rate shown represents the rate at period end.
E Zero coupon bond.
F The Fund is affiliated by having the same investment advisor.
G7-day yield.
H Principal only.
CLO - Collateralized Loan Obligation.
CMT – Constant Maturity Treasury.
EURIBOR – Euro Interbank Offered Rate.
ICE – Intercontinental Exchange.
LIBOR – London Interbank Offered Rate.
LLC - Limited Liability Company.
LP - Limited Partnership.
PIK - Payment in Kind.
PLC - Public Limited Company.
PRIME – A rate, charged by banks, based on the U.S. Federal Funds rate.
REIT - Real Estate Investment Trust.
| Forward Foreign Currency Contracts Open on June 30, 2019: | ||||||||||||||||||||||||||||
| Currency Purchased* | Currency Sold* | Settlement Date | Counterparty | Unrealized Appreciation | Unrealized (Depreciation) | Net Unrealized Appreciation (Depreciation) | ||||||||||||||||||||||
| GBP | 23,254 | USD | 23,280 | 7/3/2019 | SSB | $ | - | $ | (26 | ) | $ | (26 | ) | |||||||||||||||
| EUR | 176,991 | USD | 175,215 | 7/3/2019 | SSB | 1,776 | - | 1,776 | ||||||||||||||||||||
| GBP | 187,023 | USD | 187,487 | 7/3/2019 | SSB | - | (464 | ) | (464 | ) | ||||||||||||||||||
| GBP | 313,367 | USD | 313,513 | 7/3/2019 | SSB | - | (146 | ) | (146 | ) | ||||||||||||||||||
| EUR | 348,180 | USD | 346,886 | 7/3/2019 | SSB | 1,294 | - | 1,294 | ||||||||||||||||||||
See accompanying notes
24
American Beacon TwentyFour Strategic Income FundSM
Schedule of Investments
June 30, 2019
| Currency Purchased* | Currency Sold* | Settlement Date | Counterparty | Unrealized Appreciation | Unrealized (Depreciation) | Net Unrealized Appreciation (Depreciation) | ||||||||||||||||||||||||
| USD | 18,374,013 | EUR | 18,706,906 | 7/3/2019 | SSB | $ | - | $ | (332,893 | ) | $ | (332,893 | ) | |||||||||||||||||
| USD | 17,411,792 | GBP | 17,480,490 | 7/3/2019 | SSB | - | (68,698 | ) | (68,698 | ) | ||||||||||||||||||||
| USD | 1,194,927 | EUR | 1,205,402 | 7/3/2019 | SSB | - | (10,475 | ) | (10,475 | ) | ||||||||||||||||||||
| USD | 1,190,161 | EUR | 1,197,432 | 7/3/2019 | SSB | - | (7,271 | ) | (7,271 | ) | ||||||||||||||||||||
| USD | 848,183 | EUR | 852,898 | 7/3/2019 | SSB | - | (4,715 | ) | (4,715 | ) | ||||||||||||||||||||
| USD | 222,270 | EUR | 223,653 | 7/3/2019 | SSB | - | (1,383 | ) | (1,383 | ) | ||||||||||||||||||||
| USD | 90,800 | EUR | 91,332 | 7/3/2019 | SSB | - | (532 | ) | (532 | ) | ||||||||||||||||||||
| USD | 69,626 | GBP | 69,466 | 7/3/2019 | SSB | 160 | - | 160 | ||||||||||||||||||||||
| USD | 56,732 | EUR | 57,165 | 7/3/2019 | SSB | - | (433 | ) | (433 | ) | ||||||||||||||||||||
| USD | 53,837 | GBP | 53,696 | 7/3/2019 | SSB | 141 | - | 141 | ||||||||||||||||||||||
|
|
|
|
|
| |||||||||||||||||||||||||
| $ | 3,371 | $ | (427,036 | ) | $ | (423,665 | ) | |||||||||||||||||||||||
|
|
|
|
|
| |||||||||||||||||||||||||
| * | All values denominated in USD. |
| Glossary: | ||
| Counterparty Abbreviations: | ||
| SSB | State Street Bank & Trust Co. | |
| Currency Abbreviations: | ||
| EUR | Euro | |
| GBP | Pound Sterling | |
| USD | United States Dollar | |
The Fund’s investments are summarized by level based on the inputs used to determine their values. As of June 30, 2019, the investments were classified as described below:
TwentyFour Strategic Income Fund | Level 1 | Level 2 | Level 3 | Total | ||||||||||||||||||||||||
Assets | ||||||||||||||||||||||||||||
Corporate Obligations | $ | - | $ | 2,413,114 | $ | - | $ | 2,413,114 | ||||||||||||||||||||
Foreign Corporate Obligations | - | 36,225,034 | - | 36,225,034 | ||||||||||||||||||||||||
Foreign Sovereign Obligations | - | 3,701,591 | - | 3,701,591 | ||||||||||||||||||||||||
Asset-Backed Obligations | - | 5,352,060 | - | 5,352,060 | ||||||||||||||||||||||||
Collateralized Mortgage Obligations | - | 503,867 | - | 503,867 | ||||||||||||||||||||||||
U.S. Treasury Obligations | - | 16,366,237 | - | 16,366,237 | ||||||||||||||||||||||||
Short-Term Investments | 1,319,812 | - | - | 1,319,812 | ||||||||||||||||||||||||
|
|
|
|
|
|
|
| |||||||||||||||||||||
Total Investments in Securities - Assets | $ | 1,319,812 | $ | 64,561,903 | $ | - | $ | 65,881,715 | ||||||||||||||||||||
|
|
|
|
|
|
|
| |||||||||||||||||||||
Financial Derivative Instruments - Assets |
| |||||||||||||||||||||||||||
Forward Foreign Currency Contracts | $ | - | $ | 3,371 | $ | - | $ | 3,371 | ||||||||||||||||||||
|
|
|
|
|
|
|
| |||||||||||||||||||||
Total Financial Derivative Instruments - Assets | $ | - | $ | 3,371 | $ | - | $ | 3,371 | ||||||||||||||||||||
|
|
|
|
|
|
|
| |||||||||||||||||||||
Financial Derivative Instruments - Liabilities |
| |||||||||||||||||||||||||||
Forward Foreign Currency Contracts | $ | - | $ | (427,036 | ) | $ | - | $ | (427,036 | ) | ||||||||||||||||||
|
|
|
|
|
|
|
| |||||||||||||||||||||
Total Financial Derivative Instruments - Liabilities | $ | - | $ | (427,036 | ) | $ | - | $ | (427,036 | ) | ||||||||||||||||||
|
|
|
|
|
|
|
| |||||||||||||||||||||
U.S. GAAP requires transfers between all levels to/from level 3 be disclosed. During the year ended June 30, 2019, there were no transfers into or out of Level 3.
See accompanying notes
25
Statements of Assets and Liabilities
June 30, 2019
| SSI Alternative Income Fund@ | TwentyFour Strategic Income Fund | |||||||||||
Assets: |
| |||||||||||
Investments in unaffiliated securities, at fair value† | $ | 207,927,671 | $ | 64,561,903 | ||||||||
Investments in affiliated securities, at fair value‡ | 23,145,110 | 1,319,812 | ||||||||||
Foreign currency, at fair value^ | - | 668,819 | ||||||||||
Cash | 900 | - | ||||||||||
Cash with brokers | 81,654,923 | - | ||||||||||
Dividends and interest receivable | 1,364,511 | 835,410 | ||||||||||
Receivable for investments sold | 659,042 | 677,673 | ||||||||||
Receivable for fund shares sold | 89,747 | 73,186 | ||||||||||
Receivable for tax reclaims | - | 7,161 | ||||||||||
Receivable for expense reimbursement (Note 2) | 231,596 | 48,224 | ||||||||||
Unrealized appreciation from forward foreign currency contracts | - | 3,371 | ||||||||||
Prepaid expenses | 181,012 | 55,857 | ||||||||||
|
|
|
| |||||||||
Total assets | 315,254,512 | 68,251,416 | ||||||||||
|
|
|
| |||||||||
Liabilities: |
| |||||||||||
Payable for investments purchased | 1,340,132 | 882,807 | ||||||||||
Payable for fund shares redeemed | 872,615 | 11,084 | ||||||||||
Securities sold short, at fair value± | 83,625,168 | - | ||||||||||
Written options, at fair value (premiums received $250,645) | 394,098 | - | ||||||||||
Dividends and interest expense payable | 43,410 | - | ||||||||||
Management andsub-advisory fees payable (Note 2) | 253,092 | 38,223 | ||||||||||
Service fees payable (Note 2) | 25,573 | 2,466 | ||||||||||
Transfer agent fees payable (Note 2) | 70,192 | 5,700 | ||||||||||
Custody and fund accounting fees payable | 8,836 | 34,398 | ||||||||||
Professional fees payable | 261,426 | 75,729 | ||||||||||
Trustee fees payable (Note 2) | 150 | - | ||||||||||
Payable for prospectus and shareholder reports | 22,624 | - | ||||||||||
Unrealized depreciation from forward foreign currency contracts | - | 427,036 | ||||||||||
Other liabilities | 9,818 | 3,021 | ||||||||||
|
|
|
| |||||||||
Total liabilities | 86,927,134 | 1,480,464 | ||||||||||
|
|
|
| |||||||||
Net assets | $ | 228,327,378 | $ | 66,770,952 | ||||||||
|
|
|
| |||||||||
Analysis of net assets: |
| |||||||||||
Paid-in-capital | $ | 228,498,475 | $ | 83,359,199 | ||||||||
Total distributable earnings (deficits)A | (171,097 | ) | (16,588,247 | ) | ||||||||
|
|
|
| |||||||||
Net assets | $ | 228,327,378 | $ | 66,770,952 | ||||||||
|
|
|
| |||||||||
See accompanying notes
26
American Beacon FundsSM
Statements of Assets and Liabilities
June 30, 2019
| SSI Alternative Income Fund@ | TwentyFour Strategic Income Fund | |||||||||||
Shares outstanding at no par value (unlimited shares authorized): |
| |||||||||||
Institutional ClassB | 9,833 | 876,289 | ||||||||||
|
|
|
| |||||||||
Y Class | 22,134,831 | D | 3,783,054 | |||||||||
|
|
|
| |||||||||
Investor Class | 92,210 | E | 140,145 | |||||||||
|
|
|
| |||||||||
A ClassC | N/A | 617,352 | ||||||||||
|
|
|
| |||||||||
C ClassC | N/A | 163,624 | ||||||||||
|
|
|
| |||||||||
Ultra Class | N/A | 954,183 | ||||||||||
|
|
|
| |||||||||
Net assets: |
| |||||||||||
Institutional ClassB | $ | 100,976 | $ | 8,968,940 | ||||||||
|
|
|
| |||||||||
Y Class | $ | 227,279,618 | D | $ | 38,664,428 | |||||||
|
|
|
| |||||||||
Investor Class | $ | 946,784 | E | $ | 1,422,906 | |||||||
|
|
|
| |||||||||
A ClassC | N/A | $ | 6,270,835 | |||||||||
|
|
|
| |||||||||
C ClassC | N/A | $ | 1,659,229 | |||||||||
|
|
|
| |||||||||
Ultra Class | N/A | $ | 9,784,614 | |||||||||
|
|
|
| |||||||||
Net asset value, offering and redemption price per share: |
| |||||||||||
Institutional ClassB | $ | 10.27 | $ | 10.24 | ||||||||
|
|
|
| |||||||||
Y Class | $ | 10.27 | D | $ | 10.22 | |||||||
|
|
|
| |||||||||
Investor Class | $ | 10.27 | E | $ | 10.15 | |||||||
|
|
|
| |||||||||
A ClassC | N/A | $ | 10.16 | |||||||||
|
|
|
| |||||||||
A Class (offering price)C | N/A | $ | 10.55 | |||||||||
|
|
|
| |||||||||
C ClassC | N/A | $ | 10.14 | |||||||||
|
|
|
| |||||||||
Ultra Class | N/A | $ | 10.25 | |||||||||
|
|
|
| |||||||||
† Cost of investments in unaffiliated securities | $ | 193,253,304 | $ | 64,556,822 | ||||||||
‡ Cost of investments in affiliated securities | $ | 23,145,110 | $ | 1,319,812 | ||||||||
^ Cost of foreign currency | $ | - | $ | 669,655 | ||||||||
± Proceeds of securities sold short | $ | 71,400,326 | $ | - | ||||||||
| @ Formerly known as Palmer Square SSI Alternative Income Fund. |
| |||||||||||
| A The Fund’s investments in affiliated securities did not have unrealized appreciation (depreciation) at year end. |
| |||||||||||
| B Class commenced operations May 20, 2019 in the SSI Alternative Income Fund (Note 1). |
| |||||||||||
| C Class commenced operations October 29, 2018 in the TwentyFour Strategic Income Fund (Note 1). |
| |||||||||||
| D Formerly known as Class I. |
| |||||||||||
| E Formerly known as Class A. |
| |||||||||||
See accompanying notes
27
American Beacon FundsSM
Statements of Operations
| SSI Alternative Income Fund@ | TwentyFour Strategic Income Fund | |||||||||||||||||||
| Period from 4/1/2019 through 6/30/2019# | Year Ended 3/31/2019 | Year Ended 6/30/2019 | ||||||||||||||||||
Investment income: |
| |||||||||||||||||||
Dividend income from unaffiliated securities | $ | 407,413 | $ | 1,969,696 | $ | - | ||||||||||||||
Dividend income from affiliated securities (Note 7) | 54,312 | - | 52,176 | |||||||||||||||||
Interest income (net of foreign taxes)† | 2,048,430 | 8,871,920 | 3,261,237 | |||||||||||||||||
|
|
|
|
|
| |||||||||||||||
Total investment income | 2,510,155 | 10,841,616 | 3,313,413 | |||||||||||||||||
|
|
|
|
|
| |||||||||||||||
Expenses: |
| |||||||||||||||||||
Management andsub-advisory fees (Note 2) | 823,660 | 3,734,730 | 443,326 | |||||||||||||||||
Transfer agent fees: | ||||||||||||||||||||
Institutional Class (Note 2)A | 21 | - | 7,396 | |||||||||||||||||
Y Class (Note 2) | 83,728 | E | 46,476 | 28,116 | ||||||||||||||||
Investor Class | 183 | F | 320 | 1,308 | ||||||||||||||||
A ClassB | - | - | 1,854 | |||||||||||||||||
C ClassB | - | - | 1,766 | |||||||||||||||||
Ultra Class | - | - | 231 | |||||||||||||||||
Custody and fund accounting fees | 31,357 | 269,950 | 58,266 | |||||||||||||||||
Professional fees | 240,754 | 113,715 | 158,769 | |||||||||||||||||
Registration fees and expenses | 8,899 | 52,611 | 138,031 | |||||||||||||||||
Service fees (Note 2): | ||||||||||||||||||||
Y Class | 23,934 | E | 214,974 | - | ||||||||||||||||
Investor Class | 360 | F | 1,481 | 4,533 | ||||||||||||||||
A ClassB | - | - | 233 | |||||||||||||||||
C ClassB | - | - | 104 | |||||||||||||||||
Distribution fees (Note 2): | ||||||||||||||||||||
Investor Class | 276 | F | - | - | ||||||||||||||||
A ClassB | - | 4,896 | 6,607 | |||||||||||||||||
C ClassB | - | - | 8,614 | |||||||||||||||||
Chief Compliance Officer fees | - | 19,724 | - | |||||||||||||||||
Prospectus and shareholder report expenses | 18,900 | 20,499 | 30,506 | |||||||||||||||||
Trustee fees (Note 2) | 5,597 | 8,175 | 4,334 | |||||||||||||||||
Dividends and interest on securities sold short | 106,349 | 642,490 | - | |||||||||||||||||
Other expenses | 12,935 | 11,336 | 14,542 | |||||||||||||||||
|
|
|
|
|
| |||||||||||||||
Total expenses | 1,356,953 | 5,141,377 | 908,536 | |||||||||||||||||
|
|
|
|
|
| |||||||||||||||
Net fees waived and expenses (reimbursed) (Note 2) | (273,157 | ) | - | (381,614 | ) | |||||||||||||||
|
|
|
|
|
| |||||||||||||||
Net expenses | 1,083,796 | 5,141,377 | 526,922 | |||||||||||||||||
|
|
|
|
|
| |||||||||||||||
Net investment income | 1,426,359 | 5,700,239 | 2,786,491 | |||||||||||||||||
|
|
|
|
|
| |||||||||||||||
Realized and unrealized gain (loss) from investments: |
| |||||||||||||||||||
Net realized gain from: | ||||||||||||||||||||
Investments in unaffiliated securitiesC | 3,704,792 | 14,657,387 | (976,729 | ) | ||||||||||||||||
Foreign currency transactions | - | - | (374,994 | ) | ||||||||||||||||
Forward foreign currency contracts | - | - | 2,572,150 | |||||||||||||||||
Written options contracts | 432,415 | 1,114,292 | - | |||||||||||||||||
Short sales | (3,248,703 | ) | (10,350,164 | ) | - | |||||||||||||||
Change in net unrealized appreciation of: | ||||||||||||||||||||
Investments in unaffiliated securitiesD | 721,313 | (1,917,060 | ) | 1,818,888 | ||||||||||||||||
Foreign currency transactions | - | - | 957 | |||||||||||||||||
Forward foreign currency contracts | - | - | (703,164 | ) | ||||||||||||||||
Written options contracts | 409,724 | (685,198 | ) | - | ||||||||||||||||
Short sales | 141,717 | (417,973 | ) | - | ||||||||||||||||
|
|
|
|
|
| |||||||||||||||
Net gain from investments | 2,161,258 | 2,401,284 | 2,337,108 | |||||||||||||||||
|
|
|
|
|
| |||||||||||||||
Net increase in net assets resulting from operations | $ | 3,587,617 | $ | 8,101,523 | $ | 5,123,599 | ||||||||||||||
|
|
|
|
|
| |||||||||||||||
† Foreign taxes | $ | - | $ | - | $ | 2 | ||||||||||||||
@ Formerly known as Palmer Square SSI Alternative Income Fund. |
| |||||||||||||||||||
# Fiscal year end changed from March 31 to June 30. |
| |||||||||||||||||||
A Class commenced operations May 20, 2019 in the SSI Alternative Income Fund (Note 1). |
| |||||||||||||||||||
B Class commenced operations October 29, 2018 in the TwentyFour Strategic Income Fund (Note 1). |
| |||||||||||||||||||
C The Fund did not recognize net realized gains (losses) from the sale of investments in affiliated securities. |
| |||||||||||||||||||
D The Fund’s investments in affiliated securities did not have a change in unrealized appreciation (depreciation) at year end. |
| |||||||||||||||||||
E Formally known as Class I. |
| |||||||||||||||||||
F Formally known as Class A. |
| |||||||||||||||||||
See accompanying notes
28
American Beacon FundsSM
Statements of Changes in Net Assets
| SSI Alternative Income Fund@ | TwentyFour Strategic Income Fund | |||||||||||||||||||||||||||||||||||
| Period from 4/1/2019 through 6/30/2019# | Year Ended March 31, 2019 | Year Ended March 31, 2018 | Year Ended June 30, 2019 | Year Ended June 30, 2018 | ||||||||||||||||||||||||||||||||
Increase (decrease) in net assets: |
| |||||||||||||||||||||||||||||||||||
Operations: |
| |||||||||||||||||||||||||||||||||||
Net investment income | $ | 1,426,359 | $ | 5,700,239 | $ | 5,519,141 | $ | 2,786,491 | $ | 914,909 | ||||||||||||||||||||||||||
Net realized gain (loss) from investments in unaffiliated securities, foreign currency transactions, forward foreign currency contracts, written options contracts, and short sales | 888,504 | 5,421,515 | 3,798,117 | 1,220,427 | 388,965 | |||||||||||||||||||||||||||||||
Change in net unrealized appreciation (depreciation) of investments in unaffiliated securities, foreign currency transactions, forward foreign currency contracts, written options contracts, and short sales | 1,272,754 | (3,020,231 | ) | 195,923 | 1,116,681 | (894,064 | ) | |||||||||||||||||||||||||||||
|
|
|
|
|
|
|
|
|
| |||||||||||||||||||||||||||
Net increase in net assets resulting from operations | 3,587,617 | 8,101,523 | 9,513,181 | 5,123,599 | 409,810 | |||||||||||||||||||||||||||||||
|
|
|
|
|
|
|
|
|
| |||||||||||||||||||||||||||
Distributions to shareholders: |
| |||||||||||||||||||||||||||||||||||
Net investment income: | ||||||||||||||||||||||||||||||||||||
Institutional ClassB | - | - | - | - | (48,595 | ) | ||||||||||||||||||||||||||||||
Y Class | - | C | - | (5,309,363 | ) | - | (272,222 | ) | ||||||||||||||||||||||||||||
Investor Class | - | D | - | (58,932 | ) | - | (30,565 | ) | ||||||||||||||||||||||||||||
Ultra Class | - | - | - | - | (529,543 | ) | ||||||||||||||||||||||||||||||
Total retained earnings:*† | ||||||||||||||||||||||||||||||||||||
Institutional ClassB | - | - | - | (1,441,555 | ) | - | ||||||||||||||||||||||||||||||
Y Class | - | C | (5,245,637 | ) | - | (1,666,141 | ) | - | ||||||||||||||||||||||||||||
Investor Class | - | D | (33,530 | ) | - | (76,834 | ) | - | ||||||||||||||||||||||||||||
A ClassA | - | - | - | (136,279 | ) | - | ||||||||||||||||||||||||||||||
C ClassA | - | - | - | (45,547 | ) | - | ||||||||||||||||||||||||||||||
Ultra Class | - | - | - | (492,467 | ) | - | ||||||||||||||||||||||||||||||
|
|
|
|
|
|
|
|
|
| |||||||||||||||||||||||||||
Net distributions to shareholders | - | (5,279,167 | ) | (5,368,295 | ) | (3,858,823 | ) | (880,925 | ) | |||||||||||||||||||||||||||
|
|
|
|
|
|
|
|
|
| |||||||||||||||||||||||||||
Capital share transactions (Note 10): |
| |||||||||||||||||||||||||||||||||||
Proceeds from sales of shares | 7,412,899 | 79,669,135 | 49,216,546 | 23,533,149 | 35,268,804 | |||||||||||||||||||||||||||||||
Reinvestment of dividends and distributions | - | 4,621,235 | 4,868,490 | 3,843,791 | 880,925 | |||||||||||||||||||||||||||||||
Issued in reorganization | - | - | - | 55,815,668 | - | |||||||||||||||||||||||||||||||
Cost of shares redeemed | (62,959,198 | ) | (89,455,597 | ) | (76,190,811 | ) | (56,810,990 | ) | (12,631,868 | ) | ||||||||||||||||||||||||||
|
|
|
|
|
|
|
|
|
| |||||||||||||||||||||||||||
Net increase (decrease) in net assets from capital share transactions | (55,546,299 | ) | (5,165,227 | ) | (22,105,775 | ) | 26,381,618 | 23,517,861 | ||||||||||||||||||||||||||||
|
|
|
|
|
|
|
|
|
| |||||||||||||||||||||||||||
Net increase (decrease) in net assets | (51,958,682 | ) | (2,342,871 | ) | (17,960,889 | ) | 27,646,394 | 23,046,746 | ||||||||||||||||||||||||||||
|
|
|
|
|
|
|
|
|
| |||||||||||||||||||||||||||
Net assets: |
| |||||||||||||||||||||||||||||||||||
Beginning of period | 280,286,060 | 282,628,931 | 300,589,820 | 39,124,558 | 16,077,812 | |||||||||||||||||||||||||||||||
|
|
|
|
|
|
|
|
|
| |||||||||||||||||||||||||||
End of period | $ | 228,327,378 | $ | 280,286,060 | $ | 282,628,931 | $ | 66,770,952 | $ | 39,124,558 | ||||||||||||||||||||||||||
|
|
|
|
|
|
|
|
|
| |||||||||||||||||||||||||||
# Fiscal year end changed from March 31 to June 30. |
| |||||||||||||||||||||||||||||||||||
@ Formerly known as Palmer Square SSI Alternative Income Fund. |
| |||||||||||||||||||||||||||||||||||
* Distributions from net investment income and net realized capital gains are combined for the year ended March 31, 2019 for the SSI Alternative Income Fund. See Note 1 in the Notes to Financial Statements for more information regarding new accounting pronouncements. |
| |||||||||||||||||||||||||||||||||||
† Distributions from net investment income and net realized capital gains are combined for the year ended June 30, 2019. See Note 1 in the Notes to Financial Statements for more information regarding new accounting pronouncements. |
| |||||||||||||||||||||||||||||||||||
A Class commenced operations October 29, 2018 in the TwentyFour Strategic Income Fund (Note 1). |
| |||||||||||||||||||||||||||||||||||
B Class commenced operations May 20, 2019 in the SSI Alternative Income Fund (Note 1). |
| |||||||||||||||||||||||||||||||||||
C Formally known as Class I. |
| |||||||||||||||||||||||||||||||||||
D Formally known as Class A. |
| |||||||||||||||||||||||||||||||||||
See accompanying notes
29
Notes to Financial Statements
June 30, 2019
1. Organization and Significant Accounting Policies
American Beacon Funds (the “Trust”) is organized as a Massachusetts business trust. The Funds, each a series within the Trust, are registered under the Investment Company Act of 1940, as amended (the “Act”), as diversified,open-end management investment companies. As of June 30, 2019, the Trust consists of thirty-three active series, two of which are presented in this filing: American Beacon SSI Alternative Income Fund and American Beacon TwentyFour Strategic Income Fund (collectively, the “Funds” and each individually a “Fund”). The remainingthirty-one active series are reported in separate filings.
American Beacon Advisors, Inc. (the “Manager”) is a Delaware corporation and a wholly-owned subsidiary of Resolute Investment Managers, Inc. (“RIM”) organized in 1986 to provide business management, advisory, administrative, and asset management consulting services to the Trust and other investors. The Manager is registered as an investment advisor under the Investment Advisers Act of 1940, as amended (the “Advisers Act”). RIM is, in turn, a wholly-owned subsidiary of Resolute Acquisition, Inc., which is a wholly-owned subsidiary of Resolute Topco, Inc., a wholly-owned subsidiary of Resolute Investment Holdings, LLC (“RIH”). RIH is owned primarily by Kelso Investment Associates VIII, L.P., KEP VI, LLC and Estancia Capital Partners L.P., investment funds affiliated with Kelso & Company, L.P. (“Kelso”) or Estancia Capital Management, LLC (“Estancia”), which are private equity firms.
Fund Reorganizations
At a meeting held on August 22, 2018, the Board of Trustees (“Board”) of the American Beacon Funds (the “Trust”) approved a proposal to reorganize the American Beacon Flexible Bond Fund (the “Target Fund”) into the American Beacon TwentyFour Strategic Income Fund (the “TwentyFour Acquiring Fund”), each a series of the Trust (the “Reorganization”). The Manager proposed the Reorganization in order to consolidate funds of the Trust that are similar investment products under the same management.
On the same date, the Board approved the appointment of TwentyFour Asset Management (US) LP (“TwentyFour”) as an additionalsub-advisor to the Target Fund. On August 31, 2018, TwentyFour became asub- advisor to the Target Fund and the Target Fund’s investment strategies were changed to be consistent with those of the TwentyFour Acquiring Fund. Thereafter, the othersub-advisors to the Target Fund began an orderly disposition of the Target Fund’s portfolio securities and transferred sales proceeds to the management of TwentyFour in anticipation of TwentyFour assuming management responsibilities for the Target Fund’s entire portfolio. On October 1, 2018, TwentyFour became the solesub-advisor to the Target Fund. The Reorganization was set to occur on or about November 16, 2018. Shareholder approval was not required for the Reorganization.
On November 16, 2018, pursuant to the Plan, the Target Fund transferred all of its property and assets to the TwentyFour Acquiring Fund in exchange solely for voting shares of the TwentyFour Acquiring Fund and the assumption of all of the Target Fund’s liabilities. The Target Fund’s shareholders received a pro rata portion of the TwentyFour Acquiring Fund’s shares in exchange for their shares therein and in liquidation and termination of the Target Fund. Class shares outstanding, net assets applicable to each class and NAV per share outstanding immediately before the Reorganization were as follows:
| Target Fund Class Prior to Reorganization | Target Fund Shares Outstanding Prior to Reorganization | Target Fund Net Assets Prior to Reorganization | Target Fund NAV Per Share Prior to Reorganization | TwentyFour Acquiring Fund Class Prior to Reorganization | TwentyFour Acquiring Fund Shares Outstanding Prior to Reorganization | TwentyFour Acquiring Fund Net Assets Prior to Reorganization | TwentyFour Acquiring Fund NAV Per Share Prior to Reorganization | Exchange Ratio1 | ||||||||||||||||||||||
Institutional | 4,276,771 | $ | 40,388,347 | $ | 9.44 | Institutional | 723,312 | $ | 7,205,450 | $ | 9.96 | 0.948 | ||||||||||||||||||
Y | 962,649 | 9,076,049 | 9.43 | Y | 2,393,213 | 23,797,475 | 9.94 | 0.949 | ||||||||||||||||||||||
Investor | 326,974 | 3,071,987 | 9.40 | Investor | 76,415 | 756,395 | 9.90 | 0.949 | ||||||||||||||||||||||
A | 174,724 | 1,633,194 | 9.35 | A | 101 | 998 | 9.90 | 0.944 | ||||||||||||||||||||||
C | 161,713 | 1,509,474 | 9.33 | C | 101 | 998 | 9.90 | 0.942 | ||||||||||||||||||||||
Ultra | - | - | - | Ultra | 920,546 | 9,175,375 | 9.97 | - | ||||||||||||||||||||||
| 1 | Calculated by dividing the NAV of the Target Fund by the NAV of the TwentyFour Acquiring Fund on Reorganization date. |
30
American Beacon FundsSM
Notes to Financial Statements
June 30, 2019
Class shares outstanding, net assets applicable to each class and NAV per share immediately after the Reorganization were as follows:
TwentyFour Acquiring Fund Class – After Reorganization | Shares Outstanding | Net Assets | NAV Per Share | |||||||||
Institutional | 4,778,367 | $ | 47,593,797 | $ | 9.96 | |||||||
Y | 3,306,296 | 32,873,524 | 9.94 | |||||||||
Investor | 386,717 | 3,828,382 | 9.90 | |||||||||
A | 165,070 | 1,634,193 | 9.90 | |||||||||
C | 152,573 | 1,510,472 | 9.90 | |||||||||
Ultra | 920,546 | 9,175,375 | 9.97 | |||||||||
The Reorganization was structured to qualify as atax-free reorganization under the Internal Revenue Code for federal income tax purposes. As such, the Target Fund’s shareholders recognized no gain or loss for federal income tax purposes.
The cost, fair value and net unrealized appreciation (depreciation) of the investments of the Target Fund as of the date of Reorganization, were as follows:
Target Fund – Prior to Reorganization | ||||
Cost of investments | $ | 49,598,707 | ||
Fair value of investments | 48,436,039 | |||
Net unrealized appreciation of investments | (1,162,668 | ) | ||
For financial reporting purposes, assets received, and shares issued by the TwentyFour Acquiring Fund were recorded at fair value; however, the cost basis of the investments received from the Target Fund were carried forward to align ongoing reporting of the TwentyFour Acquiring Fund’s realized and unrealized gains and losses with the amount distributable to shareholders for tax purposes.
Assuming the Reorganization had been completed on July 1, 2018, the beginning of the TwentyFour Acquiring Fund’s current fiscal period, the pro forma results of operations for the current period would have been as follows:
TwentyFour Acquiring Fund – Pro Forma Results from Operations | ||||
Net investment income | $ | 3,123,732 | ||
Net realized and unrealized gains | (5,952,203 | ) | ||
Change in net assets resulting in operations | (2,828,471 | ) | ||
Because the combined investment portfolios for the Reorganization have been managed as a single integrated portfolio since the Reorganization was completed, it is not practicable to separate the amounts of revenue and earnings of the Target Fund that have been included in the Statements of Operations for the TwentyFour Acquiring Fund since the Reorganization was consummated.
In connection with the Reorganization, the TwentyFour Acquiring Fund incurred certain associated expenses. Such amounts were included as components of “Other liabilities” on the Statements of Assets and Liabilities.
At a meeting on November 5 and 6, 2018, the Board approved an Agreement and Plan of Reorganization and Termination (the “Plan”) to reorganize the Palmer Square SSI Alternative Income Fund (the “Acquired Fund”), into the American Beacon SSI Alternative Income Fund (the “SSI Acquiring Fund”), a newly organized series of American Beacon Funds (the “SSI Reorganization”). Shareholders of the Acquired Fund approved the Plan at a special meeting on April 29, 2019. Pursuant to the Plan, the Acquired Fund transferred all its property and assets to the SSI Acquiring Fund in exchange solely for voting shares of the SSI Acquiring Fund and the assumption all the Acquired Fund’s liabilities. Shareholders of the Acquired Fund became shareholders of the SSI Acquiring Fund, in which they received shares of the SSI Acquiring Fund equal in value to the shares of the Acquired Fund held by the shareholders immediately prior to the SSI Reorganization. The accounting and performance history of the Class A
31
American Beacon FundsSM
Notes to Financial Statements
June 30, 2019
shares and Class I shares of the Acquired Fund were redesignated as that of the Investor Class shares and Y Class shares, respectively, of the SSI Acquiring Fund with the same aggregate value. Institutional Class commenced operations on May 20, 2019.
The SSI Reorganization was structured to qualify as atax-free reorganization under the Internal Revenue Code for federal income tax purposes. As such, the Acquired Fund’s shareholders recognized no gain or loss for federal income tax purposes. The shares, net assets, net investment income, and net unrealized appreciation (depreciation) of the investments of the Acquired Fund as of the close of business on May 17, 2019 were as follows:
Investor Class Shares | 84,996 | |||
Y Class Shares | 24,703,378 | |||
Net Assets - Investor Class | $ | 864,577 | ||
Net Assets - Y Class | $ | 251,224,440 | ||
Net Investment Income | $ | 779,922 | ||
Unrealized Appreciation | $ | 543,874 |
The SSI Acquiring Fund is designed to be substantially similar from an investment perspective to the Acquired Fund. The SSI Reorganization shifted the management oversight responsibility from Palmer Square Capital Management LLC (“SSI Advisor”) to the Manager. The Manager engaged SSI Investment Management, Inc. (“SSISub-Advisor”) as thesub-advisor to the Fund, thus maintaining the continuity of the portfolio management.
For financial reporting purposes, assets received, and shares issued by the SSI Acquiring Fund were recorded at fair value; however, the cost basis of the investments received from the Target Fund was carried forward to align ongoing reporting of the SSI Acquiring Fund’s realized and unrealized gains and losses with the amount distributable to shareholders for tax purposes. The Acquired Fund had a March 31 fiscalyear-end, whereas the SSI Acquiring Fund will have a June 30 fiscalyear-end as approved by the Board at the November 6, 2018 meeting.
Recent Accounting Pronouncements
In March 2017, the Financial Accounting Standards Board (“FASB”) issued Accounting Standards Update (“ASU”)2017-08,Premium Amortization of Purchased Callable Debt Securities. The amendments in the ASU shorten the premium amortization period on a purchased callable debt security from the security’s contractual life to the earliest call date. It is anticipated that this change will enhance disclosures by reducing losses recognized when a security is called on an earlier date. This ASU is effective for fiscal years beginning after December 15, 2018. The Manager continues to evaluate the impact this ASU will have on the financial statements and other disclosures related to the American Beacon TwentyFour Strategic Income Fund. Effective for the current reporting period, the SSI Alternative Income Fund adopted the ASU2017-08 with no material impact on the financial statements and other disclosures.
In August 2018, the FASB issued ASU2018-13,Fair Value Measurement (“Topic 820”). The amendments in the ASU impact disclosure requirements for fair value measurement. It is anticipated that this change will enhance the effectiveness of disclosures in the notes to the financial statements. This ASU is effective for fiscal years beginning after December 15, 2019. Early adoption is permitted and can include the entire standard or certain provisions that exclude or amend disclosures. For the year ended June 30, 2019, the Funds have chosen to adopt the standard. The adoption of this ASU guidance did not have a material impact on the financial statements and other disclosures.
In August 2018, the U.S. Securities and Exchange Commission (“SEC”) adopted amendments to certain disclosure requirements in Securities Act ReleaseNo. 33-10532, Disclosure Update and Simplification, which is intended to facilitate the disclosure of information to investors and simplify compliance without significantly altering the total mix of information provided to investors. Effective with the current reporting period, the Funds adopted the amendments with the impacts being that the Funds are no longer required to present components of
32
American Beacon FundsSM
Notes to Financial Statements
June 30, 2019
distributable earnings on the Statements of Assets and Liabilities or the sources of distributable earnings and the amount of undistributed net investment income on the Statements of Changes in Net Assets.
Change in FiscalYear-End
On November 6, 2018, the Board approved a change in the fiscalyear-end of the American Beacon SSI Alternative Income Fund from a March 31 fiscalyear-end to June 30. The first full cycle of the fiscal year reporting will begin July 1, 2019. As a result of the change, the Fund will have a June 30 fiscal transition period, the results of which are reported in this Annual Report for the year ended June 30, 2019.
Class Disclosure
On October 29, 2018, the American Beacon TwentyFour Strategic Income Fund created the A and C Classes, new classes made available for sale through intermediary organizations pursuant to the Fund’s registration statement filed with the U.S. Securities and Exchange Commission. Refer to the Fund’s Prospectus for more details.
On May 20, 2019, the American Beacon SSI Alternative Income Fund created the Institutional Class, a new Class made available for sale pursuant to the Fund’s registration statement filed with the U.S. Securities and Exchange Commission (“SEC”). Refer to the Fund’s Prospectus for more details.
Each Fund has multiple classes of shares designed to meet the needs of different groups of investors. The following table sets forth the differences amongst the classes:
Class | Eligible Investors | Minimum Initial Investments | ||||
| Institutional | Large institutional investors - sold directly through intermediary channels. | $ | 250,000 | |||
| Y Class | Large institutional retirement plan investors - sold directly or through intermediary channels. | $ | 100,000 | |||
| Investor | All investors using intermediary organizations such as broker-dealers or retirement plan sponsors - sold directly through intermediary channels. | $ | 2,500 | |||
| A Class | All investors who invest through intermediary organizations, such as broker-dealers or third-party administrator. Retail investors who invest directly through a financial intermediary such as a broker, bank, or registered investment advisor which may include afront-end sales charge and a contingent deferred sales charge (“CDSC”). | $ | 2,500 | |||
| C Class | Retail investors who invest directly through a financial intermediary such as a broker or through employee directed benefit plans with applicable sales charges which may include CDSC. | $ | 1,000 | |||
| Ultra | Large institutional investors - sold directly or through intermediary channels. | $ | 350,000,000 | |||
Each class offered by the Trust has equal rights as to assets and voting privileges. Income andnon-class specific expenses are allocated daily to each class based on the relative net assets. Realized and unrealized capital gains and losses of each class are allocated daily based on the relative net assets of each class of the respective Fund. Class specific expenses, where applicable, currently include service, distribution, transfer agent fees, andsub-transfer agent fees that vary amongst the classes as described more fully in Note 2.
Significant Accounting Policies
The following is a summary of significant accounting policies, consistently followed by the Funds in preparation of the financial statements. The Funds are considered investment companies and accordingly, follow the investment company accounting and reporting guidance of the FASB Accounting Standards Codification Topic 946,Financial Services – Investment Companies,a part of Generally Accepted Accounting Principles (“U.S. GAAP”).
33
American Beacon FundsSM
Notes to Financial Statements
June 30, 2019
Security Transactions and Investment Income
Security transactions are recorded as of the trade date for financial reporting purposes. Securities purchased or sold on a when-issued or delayed-delivery basis may be settled beyond a standard settlement period for the security after the trade date.
Dividend income, net of foreign taxes, is recorded on theex-dividend date, except certain dividends from foreign securities which are recorded as soon as the information is available to the Funds. Interest income, net of foreign taxes, is earned from settlement date, recorded on the accrual basis, and adjusted, if necessary, for accretion of discounts and amortization of premiums. Realized gains (losses) from securities sold are determined based on specific lot identification.
Currency Translation
All assets and liabilities initially expressed in foreign currency values are converted into U.S. dollar values at the mean of the bid and ask prices of such currencies against U.S. dollars as last quoted by a recognized dealer. Income, expenses, and purchases and sales of investments are translated into U.S. dollars at the rate of the exchange prevailing on the respective dates of such transactions. The effect of changes in foreign currency exchange rates on investments is separately identified from the fluctuations arising from changes in market values of securities held and is reported with all other foreign currency gains and losses on the Funds’ Statements of Operations.
Distributions to Shareholders
The SSI Alternative Income Fund distributes most or all of its net earning and realized gains, if any, each taxable year in the form of dividends from net investment income on a semi-annual basis and distributions of realized net capital gains and net gains from foreign currency transactions on an annual basis. The TwentyFour Strategic Income Fund distributes most or all of its net earnings and realized gains, if any, each taxable year in the form of dividends from net investment income on a monthly basis and distributions of realized net capital gains and net gains from foreign currency transactions on an annual basis. The Fund does not have a fixed dividend rate and does not guarantee that it will pay any distributions in any particular period. Dividends to shareholders are determined in accordance with federal income tax regulations, which may differ in amount and character from net investment income and realized gains recognized for purposes of U.S. GAAP. To the extent necessary to fully distribute capital gains, the Funds may designate earnings and profits distributed to shareholders on the redemption of shares.
Allocation of Income, Trust Expenses, Gains, and Losses
Investment income, realized and unrealized gains and losses from investments of the Funds are allocated daily to each class of shares based upon the relative proportion of net assets of each class to the total net assets of the Funds. Expenses directly charged or attributable to the Fund will be paid from the assets of the Fund. Generally, expenses of the Trust will be allocated among and charged to the assets of the Funds on a basis that the Trust’s Board of Trustees (the “Board”) deems fair and equitable, which may be based on the relative net assets of the Funds or nature of the services performed and relative applicability to the Funds.
Use of Estimates
The preparation of financial statements in conformity with U.S. GAAP requires management to make estimates and assumptions that affect the amounts reported in the financial statements and accompanying notes. Actual results may differ from those estimated.
34
American Beacon FundsSM
Notes to Financial Statements
June 30, 2019
Other
Under the Trust’s organizational documents, its officers and trustees are indemnified against certain liabilities arising out of the performance of their duties to the Trust. In the normal course of business, the Trust enters into contracts that provide indemnification to the other party or parties against potential costs or liabilities. The Trust’s maximum exposure under these arrangements is dependent on claims that may be made in the future and, therefore, cannot be estimated. The Trust has had no prior claims or losses pursuant to any such agreement.
2. Transactions with Affiliates
Management and InvestmentSub-Advisory Agreements
Prior to the SSI Reorganization on May 17, 2019, the SSI Advisor of the Acquired Fund received from the Acquired Fund a monthly investment advisory fee at an annual rate of 0.35% of the Acquired Fund’s average daily assets. Since May 17, 2019 for the SSI Acquiring Fund and for the entire period ended June 30, 2019 for the TwentyFour Strategic Income Fund, the Funds and the Manager are parties to a Management Agreement that obligates the Manager to provide the Funds with investment advisory and administrative services. As compensation for performing the duties under the Management Agreement, the Manager will receive an annualized management fee based on a percentage of each Fund’s average daily net assets that is calculated and accrued daily according to the following schedule:
SSI Alternative Income Fund
First $5 billion | 0.35 | % | ||
Next $5 billion | 0.325 | % | ||
Next $10 billion | 0.30 | % | ||
Over $20 billion | 0.275 | % |
TwentyFour Strategic Income Fund
First $5 billion | 0.35 | % | ||
Next $5 billion | 0.325 | % | ||
Next $10 billion | 0.30 | % | ||
Over $20 billion | 0.275 | % |
Prior to the SSI Reorganization on May 17, 2019, the Acquired Fund paid a monthlysub-advisory fee to the SSISub-Advisor at a rate of 0.95% for the first $300 million of the Acquired Fund’s average daily net assets and 0.85% of the average daily net assets greater than $300 million. Since May 17, 2019 for the SSI Acquiring Fund and for the entire period ended June 30, 2019 for the TwentyFour Strategic Income Fund, the Trust, on behalf of the Funds, and the Manager have entered into an Investment Advisory Agreement with the followingSub-Advisors pursuant to which each Fund has agreed to pay an annualizedsub-advisory fee that is calculated and accrued daily based on the applicable Fund’s average daily net assets according to the following schedules:
SSI Alternative Income Fund
First $300 million | 0.95 | % | ||
Over $300 million | 0.85 | % |
TwentyFour Strategic Income Fund
First $1 billion | 0.32 | % | ||
Over $1 billion | 0.27 | % |
35
American Beacon FundsSM
Notes to Financial Statements
June 30, 2019
The Management andSub-Advisory Fees paid by the Funds for the period ended June 30, 2019 were as follows:
SSI Alternative Income Fund
| Effective Fee Rate | Amount of Fees Paid | |||||||||||
Management Fees | 0.35 | % | $ | 221,755 | ||||||||
Sub-Advisor Fees | 0.95 | % | 601,905 | |||||||||
|
|
|
| |||||||||
Total | 1.30 | % | $ | 823,660 | ||||||||
|
|
|
| |||||||||
TwentyFour Strategic Income Fund
| Effective Fee Rate | Amount of Fees Paid | |||||||||||
Management Fees | 0.35 | % | $ | 230,802 | ||||||||
Sub-Advisor Fees | 0.32 | % | 212,524 | |||||||||
|
|
|
| |||||||||
Total | 0.67 | % | $ | 443,326 | ||||||||
|
|
|
| |||||||||
Distribution Plans
The Funds have adopted a “defensive” Distribution Plan (the “Plan”) in accordance with Rule12b-1 under the Act, pursuant to which no separate fees may be charged to the Funds for distribution purposes. However, the Plan authorizes the management fee received by the Manager and the investment advisors hired by the Manager to be used for distribution purposes. Under this Plan, the Funds do not intend to compensate the Manager or any other party, either directly or indirectly, for the distribution of Fund shares.
Prior to the SSI Reorganization on May 17, 2019, the Acquired Fund had adopted a Distribution Plan (the “Plan”) pursuant to Rule12b-1 under the Act that allowed the Acquired Fund to pay distribution fees for the sale and distribution of its Class A shares (exchanged for Investor Class shares upon the Reorganization). The Plan provided for the payment of distribution fees at the annual rate of up to 0.25% of average daily net assets attributable to Class A Shares. Since May 17, 2019, the SSI Acquiring Fund has relied upon the “defensive” Plan described above. Effective October 29, 2018, separate Distribution Plans (the “Distribution Plans”) have been adopted pursuant to Rule 12b-1 under the Act for the A and C Classes of the TwentyFour Strategic Income Fund. Under the Distribution Plans, as compensation for distribution and shareholder servicing assistance, the Manager receives an annual fee of 0.25% of the average daily net assets of the A Class and 1.00% of the average daily net assets of the C Class. The fee will be payable without regard to whether the amount of the fee is more or less than the actual expenses incurred in a particular month by the Manager for distribution assistance.
Service Plans
Prior to the SSI Reorganization on May 17, 2019, the Acquired Fund had adopted a Shareholder Servicing Plan to pay a fee at an annual rate of up to 0.25% of average daily net assets of the Class A and Class I shares (exchanged for Investor Class and Y Class shares, respectively) serviced by shareholder servicing agents providing administrative and support services to their customers. Since May 17, 2019 for the SSI Acquiring Fund and for the entire period ended June 30, 2019 for the TwentyFour Strategic Income Fund, the Manager and the Trust entered into Service Plans that obligates the Manager to oversee additional shareholder servicing of the Investor Class of the Fund. As compensation for performing the duties required under the Service Plans, the Manager receives an annualized fee up to 0.375% of the average daily net assets of the Investor Class of the Funds.
Sub-Transfer Agent Fees
The Manager has entered into agreements, which include servicing agreements, with financial intermediaries that provide recordkeeping, processing, shareholder communications and other services to customers of the intermediaries that hold positions in the Institutional and Y Classes of the Funds and has agreed to compensate the intermediaries for providing these services. Intermediaries transact with the Funds primarily
36
American Beacon FundsSM
Notes to Financial Statements
June 30, 2019
through the use of omnibus accounts on behalf of their customers who hold positions in the Funds. Certain services would have been provided by the Funds’ transfer agent and other service providers if the shareholders’ accounts were maintained directly by the Funds’ transfer agent. Accordingly, the Funds, pursuant to Board approval, have agreed to reimburse the Manager for certainnon-distribution shareholder services provided by financial intermediaries for the Institutional and Y Classes. The reimbursement amounts(sub-transfer agent fees) paid to the Manager are subject to a fee limit of up to 0.10% of an intermediary’s average net assets in the Institutional and Y Classes on an annual basis. During the period ended June 30, 2019, thesub-transfer agent fees, as reflected in “Transfer agent fees” on the Statements of Operations, were as follows:
Fund | Sub-Transfer Agent Fees | |||
SSI Alternative Income | $ | 28,932 | ||
TwentyFour Strategic Income | 34,432 | |||
As of June 30, 2019, the Funds owed the Manager the following reimbursement ofsub-transfer agent fees, as reflected in “Transfer agent fees payable” on the Statements of Assets and Liabilities:
Fund | Reimbursement Sub-Transfer Agent Fees | |||
SSI Alternative Income | $ | 19,392 | ||
TwentyFour Strategic Income | 4,782 | |||
Investments in Affiliated Funds
The Funds may invest in the American Beacon U.S. Government Money Market Select Fund (the “USG Select Fund”). Cash collateral received by the Funds in connection with securities lending may also be invested in the USG Select Fund. The Funds and the USG Select Fund have the same investment advisor and therefore, are considered to be affiliated. The Manager serves as investment advisor to the USG Select Fund and receives management fees and administrative fees totaling 0.10% of the average daily net assets of the USG Select Fund. During the period ended June 30, 2019, the Manager earned fees on the Funds’ direct investments in the USG Select Fund as shown below:
Fund | Direct Investments in USG Select Fund | |||
SSI Alternative Income | $ | 2,353 | ||
TwentyFour Strategic Income | 2,149 | |||
Interfund Credit Facility
Pursuant to an exemptive order issued by the SEC, the Funds, along with other registered investment companies having management contracts with the Manager, may participate in a credit facility whereby each fund, under certain conditions, is permitted to lend money directly to and borrow directly from other participating funds for temporary purposes. The interfund credit facility is advantageous to the funds because it provides added liquidity and eliminates the need to maintain higher cash balances to meet redemptions. This situation could arise when shareholder redemptions exceed anticipated volumes and certain funds have insufficient cash on hand to satisfy such redemptions or when sales of securities do not settle as expected, resulting in a cash shortfall for a fund. When a fund liquidates portfolio securities to meet redemption requests, they often do not receive payment in settlement for up to two days (or longer for certain foreign transactions). Redemption requests normally are satisfied on the next business day. The credit facility provides a source of immediate, short-term liquidity pending settlement of the sale of portfolio securities. The credit facility is administered by a credit facility team consisting of professionals from the Manager’s asset management, compliance, and accounting areas who report the activities of the credit facility to the Board. During the period ended June 30, 2019, the SSI Alternative Income Fund did not utilize the credit facility and the TwentyFour Strategic Income Fund borrowed on average $4,774,269 for 9 days at 3.01% with interest charges of $3,602. These amounts are recorded as “Other expenses” in the Statements of Operations.
37
American Beacon FundsSM
Notes to Financial Statements
June 30, 2019
Expense Reimbursement Plan
Prior to the SSI Reorganization on May 17, 2019, the SSI Advisor contractually agreed to waive fees and/or pay expenses of the Acquired Fund to ensure that total annual fund operating expenses did not exceed 1.74% and 1.49% of the average daily net assets for the Acquired Fund’s Class A shares and Class I shares, respectively (exchanged for Investor Class and Y Class shares, respectively). At the Reorganization date, the SSI Advisor had waived and/or paid expenses of $702 and $216,814, for the Class A and Class I shares of the Acquired Fund, respectively. The Manager contractually agreed to reduce fees and/or reimburse expenses for the classes of the Funds to the extent that total operating expenses exceed the Funds’ expense caps as set forth below. During the period ended June 30, 2019, the Manager waived and/or reimbursed expenses as follows:
| Expense Cap | ||||||||||||||||||||||||||
Fund | Class | 5/17/2019 - 6/30/2019 | 7/01/2018 - 6/30/2019 | Reimbursed Expenses | Expenses Ineligible for Recoupment | (Recouped) Expenses | Expiration of Reimbursed Expenses | |||||||||||||||||||
SSI Alternative Income | Institutional* | 1.49 | % | – | $ | 113 | $ | – | $ | – | 2021-2022 | |||||||||||||||
SSI Alternative Income | Y | 1.56 | % | – | 272,110 | 216,814 | – | 2021-2022 | ||||||||||||||||||
SSI Alternative Income | Investor | 1.81 | % | – | 934 | 702 | – | 2021-2022 | ||||||||||||||||||
TwentyFour Strategic Income | Institutional | – | 0.72 | % | 106,277 | – | – | 2021-2022 | ||||||||||||||||||
TwentyFour Strategic Income | Y | – | 0.82 | % | 183,462 | – | – | 2021-2022 | ||||||||||||||||||
TwentyFour Strategic Income | Investor | – | 1.09 | % | 8,489 | – | – | 2021-2022 | ||||||||||||||||||
TwentyFour Strategic Income | A** | – | 1.12 | % | 17,356 | – | – | 2021-2022 | ||||||||||||||||||
TwentyFour Strategic Income | C** | – | 1.87 | % | 6,069 | – | – | 2021-2022 | ||||||||||||||||||
TwentyFour Strategic Income | Ultra | – | 0.67 | % | 59,961 | – | – | 2021-2022 | ||||||||||||||||||
* Commenced operations on May 20, 2019.
** Commenced operations on October 29, 2018.
Of these amounts, $231,596 and $48,224 were disclosed as a receivable from the Manager on the Statements of Assets and Liabilities at June 30, 2019 for the SSI Alternative Income Fund and TwentyFour Strategic Income Fund, respectively.
The Funds have adopted an Expense Reimbursement Plan whereby the Manager may seek repayment of such fee reductions and expense reimbursements. Under the policy, the Manager can be reimbursed by the Funds for any contractual or voluntary fee reductions or expense reimbursements if reimbursement to the Manager (a) occurs within three years from the date of the Manager’s own waiver/reimbursement and (b) does not cause the Funds’ annual operating expenses to exceed the lesser of the contractual percentage limit in effect at the time of the waiver/reimbursement or time of recoupment. The reimbursed expenses listed above will expire in 2021 and 2022. The Fund did not record a liability for potential reimbursement due to the current assessment that a reimbursement is uncertain. The carryover of excess expenses potentially reimbursable to the Manager are as follows:
Fund | Recouped Expenses | Excess Expense Carryover | Expired Expense Carryover | Expiration of Reimbursed Expenses | ||||||||||||
TwentyFour Strategic Income | $ | – | $ | 149,855 | $ | – | 2020 | |||||||||
TwentyFour Strategic Income | – | 215,369 | – | 2021 | ||||||||||||
Concentration of Ownership
From time to time, the Funds may have a concentration of one or more accounts constituting a significant percentage of shares outstanding. Investment activities by holders of accounts that represent a significant ownership of more than 5% of the Funds’ outstanding shares could have a material impact on the Funds. As of June 30, 2019, based on management’s evaluation of the shareholder account base, one account has been identified as representing an affiliated significant ownership of approximately 15% for the TwentyFour Strategic Income Fund and one account has been identified as representing an unaffiliated significant ownership of approximately 19% for the SSI Alternative Income Fund.
38
American Beacon FundsSM
Notes to Financial Statements
June 30, 2019
Sales Commissions
The Funds’ Distributor, Resolute Investment Distributors, Inc. (“RID” or “Distributor”), may receive a portion of Class A sales charges from broker dealers and it may be used to offset distribution related expenses. During the period ended June 30, 2019, RID collected $8,223 for TwentyFour Strategic Income Fund from the sale of Class A Shares.
A CDSC of 0.50% will be deducted with respect to Class A Shares on certain purchases of $1,000,000 or more that are redeemed in whole or part within 18 months of purchase, unless waived as discussed in the Funds’ Prospectus. Any applicable CDSC will be 0.50% of the lesser of the original purchase price or the value of the redemption of the Class A Shares redeemed. During the period ended June 30, 2019, there were no CDSC fees collected for the Class A Shares of TwentyFour Strategic Income Fund.
A CDSC of 1.00% will be deducted with respect to Class C Shares redeemed within 12 months of purchase, unless waived as discussed in the Funds’ Prospectus. Any applicable CDSC will be 1.00% of the lesser of the original purchase price or the value of the redemption of the Class C Shares redeemed. During the period ended June 30, 2019, there were no CDSC fees collected for the Class C Shares of TwentyFour Strategic Income Fund.
Trustee Fees and Expenses
As compensation for their service to the Trusts, each Trustee receives an annual retainer of $120,000, plus $10,000 for each Board meeting attended in person or via teleconference, $2,500 for attendance by Committee members at meetings of the Audit Committee and the Investment Committee, and $1,500 for attendance by Committee members at meetings of the Nominating and Governance Committee, plus reimbursement of reasonable expenses incurred in attending Board meetings, Committee meetings, and relevant educational seminars. The Trustees also may be compensated for attendance at special Board and/or Committee meetings from time to time. The Board Chair receives an additional annual retainer of $50,000 as well as a $2,500 fee each quarter for attendance at the committee meetings. The Chairpersons of the Audit Committee and the Investment Committee each receive an additional annual retainer of $25,000 and the Chairman of the Nominating and Governance Committee receives an additional annual retainer of $10,000. These expenses are allocated on a prorated basis to each fund of the Trusts according to its respective net assets.
3. Security Valuation and Fair Value Measurements
The price of the Fund’s shares is based on its net asset value (“NAV”) per share. The Fund’s NAV is computed by adding total assets, subtracting all the Fund’s liabilities, and dividing the result by the total number of shares outstanding.
The NAV of each class of the Fund’s shares is determined based on a pro rata allocation of the Fund’s investment income, expenses and total capital gains and losses. The Fund’s NAV per share is determined each business day as of the regular close of trading on the New York Stock Exchange (“NYSE” or “Exchange”), which is typically 4:00 p.m. Eastern Time (“ET”). However, if trading on the NYSE closes at a time other than 4:00 p.m. ET, the Fund’s NAV per share typically would still be determined as of the regular close of trading on the NYSE. The Fund does not price its shares on days that the NYSE is closed. Foreign exchanges may permit trading in foreign securities on days when the Funds are not open for business, which may result in the value of the Fund’s portfolio investments being affected at a time when you are unable to buy or sell shares.
Equity securities, including shares ofclosed-end funds and exchange-traded funds (“ETFs”), are valued at the last sale price or official closing price taken from the primary exchange in which each security trades. Investments in other mutual funds are valued at the closing NAV per share on the day of valuation. Debt securities are valued at bid quotes from broker/dealers or evaluated bid prices from pricing services, who may consider a number of inputs and factors, such as prices of comparable securities, yield curves, spreads, credit ratings, coupon
39
American Beacon FundsSM
Notes to Financial Statements
June 30, 2019
rates, maturity, default rates, and underlying collateral. Futures are valued based on their daily settlement prices. Exchange-traded andover-the-counter (“OTC”) options are valued at the last sale price. Options with no last sale for the day are priced at mid quote. Swaps are valued at evaluated mid prices from pricing services.
The valuation of securities traded on foreign markets and certain fixed income securities will generally be based on prices determined as of the earlier closing time of the markets on which they primarily trade unless a significant event has occurred. When the Funds holds securities or other assets that are denominated in a foreign currency, the Funds will normally use the currency exchange rates as of 4:00 p.m. ET.
Securities may be valued at fair value, as determined in good faith and pursuant to procedures approved by the Board, under certain limited circumstances. For example, fair value pricing will be used when market quotations are not readily available or reliable, as determined by the Manager, such as when (i) trading for a security is restricted or stopped; (ii) a security’s trading market is closed (other than customary closings); or (iii) a security has beende-listed from a national exchange. A security with limited market liquidity may require fair value pricing if the Manager determines that the available price does not reflect the security’s true market value. In addition, if a significant event that the Manager determines to affect the value of one or more securities held by the Funds occurs after the close of a related exchange but before the determination of the Fund’s NAV, fair value pricing may be used on the affected security or securities. Securities of small-capitalization companies are also more likely to require a fair value determination using these procedures because they are more thinly traded and less liquid than the securities of larger-capitalization companies. The Funds may fair value securities as a result of significant events occurring after the close of the foreign markets in which the Funds invests as described below. In addition, the Funds may invest in illiquid securities requiring these procedures.
The Funds may use fair value pricing for securities primarily traded innon-U.S. markets because most foreign markets close well before the Fund’s pricing time of 4:00 p.m. ET. The earlier close of these foreign markets gives rise to the possibility that significant events, including broad market moves, may have occurred in the interim and may materially affect the value of those securities. If the Manager determines that the last quoted prices ofnon-U.S. securities will, in its judgment, materially affect the value of some or all its portfolio securities, the Manager can adjust the previous closing prices to reflect what it believes to be the fair value of the securities as of the close of the Exchange. In deciding whether it is necessary to adjust closing prices to reflect fair value, the Manager reviews a variety of factors, including developments in foreign markets, the performance of U.S. securities markets, and the performance of instruments trading in U.S. markets that represent foreign securities and baskets of foreign securities. These securities are fair valued using a pricing service, using methods approved by the Board, that considers the correlation of the trading patterns of the foreign security to intraday trading in the U.S. markets, based on indices of domestic securities and other appropriate indicators such as prices of relevant American Depositary Receipts (“ADRs”) and futures contracts. The Valuation Committee, established by the Board, may also fair value securities in other situations, such as when a particular foreign market is closed but the Funds are open. The Funds uses outside pricing services to provide closing prices and information to evaluate and/or adjust those prices. As a means of evaluating its security valuation process, the Valuation Committee routinely compares closing prices, the next day’s opening prices in the same markets and adjusted prices.
Attempts to determine the fair value of securities introduce an element of subjectivity to the pricing of securities. As a result, the price of a security determined through fair valuation techniques may differ from the price quoted or published by other sources and may not accurately reflect the market value of the security when trading resumes. If a reliable market quotation becomes available for a security formerly valued through fair valuation techniques, the Manager compares the new market quotation to the fair value price to evaluate the effectiveness of the Fund’s fair valuation procedures. If any significant discrepancies are found, the Manager may adjust the Fund’s fair valuation procedures.
Investments inopen-end mutual funds are valued at the closing NAV per share of the mutual fund on the day of valuation.
40
American Beacon FundsSM
Notes to Financial Statements
June 30, 2019
Securities for which the market prices are not readily available or are not reflective of the fair value of the security, as determined by the Manager, will be priced at fair value following procedures approved by the Board.
Other investments for which the above valuation procedures are inappropriate or are deemed not to reflect fair value, are stated at fair value as determined in good faith by the Manager’s Valuation Committee, pursuant to procedures established by the Board.
Valuation Inputs
Various inputs may be used to determine the fair value of the Funds’ investments. These inputs are summarized in three broad levels for financial statement purposes. The inputs or methodologies used to value securities are not necessarily an indication of the risk associated with investing in those securities.
| Level 1 | - | Quoted prices in active markets for identical securities. | ||
| Level 2 | - | Prices determined using other significant observable inputs. These may include quoted prices for similar securities, interest rates, prepayment speeds, credit risk, and others. | ||
| Level 3 | - | Prices determined using other significant unobservable inputs. Unobservable inputs reflect the Fund’s own assumptions about the factors market participants would use in pricing an investment. | ||
Level 1 and Level 2 trading assets and trading liabilities, at fair value
Fixed-income securities including corporate, convertible and municipal bonds and notes, U.S. government agencies, U.S. Treasury obligations, sovereign issues, bank loans, convertible preferred securities, andnon-U.S. bonds are normally valued by pricing service providers that use broker dealer quotations, reported trades or valuation estimates from their internal pricing models. The service providers’ internal models use inputs that are observable such as issuer details, interest rates, yield curves, prepayment speeds, credit risks/spreads, default rates, and quoted prices for similar assets. Securities that use similar valuation techniques and inputs as described above are categorized as Level 2 of the fair value hierarchy. Fixed-income securities purchased on a delayed-delivery basis aremarked-to-market daily until settlement at the forward settlement date and are categorized as Level 2 of the fair value hierarchy.
Mortgage-related and asset-backed securities (“ABS”) are usually issued as separate tranches, or classes, of securities within each deal. These securities are also normally valued by pricing service providers that use broker-dealer quotations or valuation estimates from their internal pricing models. The pricing models for these securities usually consider tranche-level attributes, current market data, estimated cash flows, and market-based yield spreads for each tranche, and incorporates deal collateral performance, as available. Mortgage-related and ABS that use similar valuation techniques and inputs as described above are categorized as Level 2 of the fair value hierarchy.
Common stocks, ETFs, preferred securities, and financial derivative instruments, such as futures contracts or options that are traded on a national securities exchange, are stated at the last reported sale or settlement price on the day of valuation. To the extent these securities are actively traded and valuation adjustments are not applied, they are categorized as Level 1 of the fair value hierarchy. Valuation adjustments may be applied to certain securities that are solely traded on a foreign exchange to account for the market movement between the close of the foreign market and the close of the Exchange. These securities are valued using pricing service providers that consider the correlation of the trading patterns of the foreign security to the intraday trading in the U.S. markets for investments. Securities using these valuation adjustments are categorized as Level 2 of the fair value hierarchy. Preferred securities and other equities traded on inactive markets or valued by reference to similar instruments are generally categorized as Level 2 of the fair value hierarchy.
Investments in registeredopen-end investment management companies will be valued based upon the NAVs of such investments and are categorized as Level 1 of the fair value hierarchy.
41
American Beacon FundsSM
Notes to Financial Statements
June 30, 2019
OTC financial derivative instruments, such as forward foreign currency contracts derive their value from underlying asset prices, indices, reference rates, and other inputs or a combination of these factors. These contracts are normally valued on the basis of broker dealer quotations or pricing service providers. Depending on the product and the terms of the transaction, the fair value of the financial derivative contracts can be estimated by a pricing service provider using a series of techniques, including simulation pricing models. The pricing models use inputs that are observed from actively quoted markets such as issuer details, indices, spreads, interest rates, curves, dividends, and exchange rates. Financial derivatives that use similar valuation techniques and inputs as described above are categorized as Level 2 of the fair value hierarchy.
4. Securities and Other Investments
Asset-Backed Securities
ABS are securities issued by trusts and special purpose entities that are backed by pools of assets, such as automobile and credit-card receivables and home equity loans, which pass through the payments on the underlying obligations to the security holders (less servicing fees paid to the originator or fees for any credit enhancement). Typically, loans or accounts receivable paper are transferred from the originator to a specially created trust, which repackages the trust’s interests as securities with a minimum denomination and a specific term. The securities are then privately placed or publicly offered. Examples include certificates for automobile receivables andso-called plastic bonds, backed by credit card receivables. The Funds are permitted to invest in ABS, subject to the Funds’ rating and quality requirements.
The value of an ABS is affected by, among other things, changes in the market’s perception of the asset backing the security, the creditworthiness of the servicing agent for the loan pool, the originator of the loans and the financial institution providing any credit enhancement. Payments of principal and interest passed through to holders of ABS are frequently supported by some form of credit enhancement, such as a letter of credit, surety bond, limited guarantee by another entity or by having a priority to certain of the borrower’s other assets. The degree of credit enhancement varies, and generally applies to only a portion of the ABS’s par value. Value is also affected if any credit enhancement has been exhausted.
Collateralized Loan Obligations
The TwentyFour Strategic Income Fund may invest in collateralized loan obligations (“CLOs”) and other similarly structured securities. CLOs are types of ABS. A CLO is a trust typically collateralized by a pool of loans, which may include, among others, domestic and foreign senior secured loans, senior unsecured loans, and subordinate corporate loans, including loans that may be rated below investment grade or equivalent unrated loans. CLOs may charge management fees and administrative expenses.
For CLOs, the cash flows from the trust are split into two or more portions, called tranches, varying in risk and yield. The riskiest portion is the “equity” tranche which bears the bulk of defaults from the bonds or loans in the trust and serves to protect the other, more senior tranches from default in all but the most severe circumstances. Since they are partially protected from defaults, senior tranches from a CLO trust typically have higher ratings and lower yields than their underlying securities, and can be rated investment grade. Despite the protection from the equity tranche, CLO tranches can experience substantial losses due to actual defaults, increased sensitivity to defaults due to collateral default and disappearance of protecting tranches, market anticipation of defaults, as well as aversion to CLO securities as a class.
Foreign Debt Securities
The Funds may invest in foreign fixed and floating rate income securities (including emerging market securities) all or a portion of which may benon-U.S. dollar denominated and which include: (a) debt obligations issued or guaranteed by foreign national, provincial, state, municipal or other governments with taxing authority or
42
American Beacon FundsSM
Notes to Financial Statements
June 30, 2019
by their agencies or instrumentalities, including Brady Bonds; (b) debt obligations of supranational entities; (c) debt obligations of the U.S. Government issued innon-dollar securities; (d) debt obligations and other fixed income securities of foreign corporate issuers (both dollar andnon-dollar denominated); and (e) U.S. corporate issuers (both Eurodollar andnon-dollar denominated). There is no minimum rating criteria for the Funds’ investments in such securities. Investing in the securities of foreign issuers involves special considerations that are not typically associated with investing in the securities of U.S. issuers. In addition, emerging markets are markets that have risks that are different and higher than those in more developed markets.
High-Yield Bonds
High-yield,non-investment-grade bonds (also known as “junk bonds”) arelow-quality, high-risk corporate bonds that generally offer a high level of current income. These bonds are considered speculative by rating organizations. For example, Moody’s, S&P Global Ratings (“S&P Global”) and Fitch, Inc. rate them below Baa and BBB, respectively. High-yield bonds are often issued as a result of corporate restructurings, such as leveraged buyouts, mergers, acquisitions, or other similar events. They may also be issued by smaller, less creditworthy companies or by highly leveraged firms, which are generally less able to make scheduled payments of interest and principal than more financially stable firms. Because of their low credit quality, high-yield bonds must pay higher interest to compensate investors for the substantial credit risk they assume. In order to minimize credit risk, the Funds intend to diversify their holdings among multiple issuers.
Illiquid and Restricted Securities
Generally, an illiquid asset is an asset that the Funds reasonably expect cannot be sold or disposed of in current market conditions in seven calendar days or less without the sale or disposition significantly changing the market value of the investment, as determined pursuant to Rule22e-4 under the Investment Company Act or as otherwise permitted or required by SEC rules and interpretations. Historically, illiquid securities have included securities that have not been registered under the Securities Act, securities that are otherwise not readily marketable, and repurchase agreements having a remaining maturity of longer than seven calendar days. Securities that have not been registered under the Securities Act are referred to as private placements or restricted securities and are purchased directly from the issuer or in the secondary market. These securities may be sold only in a privately negotiated transaction or pursuant to an exemption from registration. A large institutional market exists for certain securities that are not registered under the Securities Act, including repurchase agreements, commercial paper, foreign securities, municipal securities and corporate bonds and notes. Institutional investors depend on an efficient institutional market in which the unregistered security can be readily resold or on an issuer’s ability to honor a demand for repayment. However, the fact that there are contractual or legal restrictions on resale of such investments to the general public or to certain institutions may not be indicative of their liquidity.
Limitations on resale may have an adverse effect on the marketability of portfolio securities, and the Funds might be unable to dispose of restricted or other illiquid securities promptly or at reasonable prices and might thereby experience difficulty satisfying redemptions within seven calendar days. In addition, the Funds may get only limited information about an issuer, so it may be less able to predict a loss. The Funds also might have to register such restricted securities in order to dispose of them resulting in additional expense and delay. Adverse market conditions could impede such a public offering of securities. In recognition of the increased size and liquidity of the institutional market for unregistered securities and the importance of institutional investors in the formation of capital, the SEC adopted Rule 144A under the Securities Act. Rule 144A is designed to facilitate efficient trading among institutional investors by permitting the sale of certain unregistered securities to qualified institutional buyers. To the extent privately placed securities held by the Funds qualify under Rule 144A and an institutional market develops for those securities, the Funds likely will be able to dispose of the securities without registering them under the Securities Act. To the extent that institutional buyers become, for a time, uninterested in purchasing these securities, investing in Rule 144A securities could increase the level of the Funds’ illiquidity. The Manager or thesub-advisor, as applicable, may determine that certain securities qualified for trading under
43
American Beacon FundsSM
Notes to Financial Statements
June 30, 2019
Rule 144A are liquid. Regulation S under the Securities Act permits the sale abroad of securities that are not registered for sale in the United States and includes a provision for U.S. investors, such as the Funds, to purchase such unregistered securities if certain conditions are met.
Securities sold in private placement offerings made in reliance on the “private placement” exemption from registration afforded by Section 4(a)(2) of the Securities Act and resold to qualified institutional buyers under Rule 144A under the Securities Act (“Section 4(a)(2) securities”) are restricted as to disposition under the federal securities laws, and generally are sold to institutional investors, such as the Funds, that agree they are purchasing the securities for investment and not with an intention to distribute to the public. Any resale by the purchaser must be pursuant to an exempt transaction and may be accomplished in accordance with Rule 144A. Section 4(a)(2) securities normally are resold to other institutional investors through or with the assistance of the issuer or dealers that make a market in the Section 4(a)(2) securities, thus providing liquidity.
Restricted securities outstanding during the period ended June 30, 2019 are disclosed in the Notes to the Schedules of Investments.
Mortgage-Related and Other Asset-Backed Securities
The TwentyFour Strategic Income Fund may invest in mortgage-backed securities consisting of collateralized mortgage obligations and mortgage pass-through certificates. These securities may include mortgage instruments issued by U.S. government agencies (“agency mortgages”) or those issued by private entities(“non-agency mortgages”). Specific types of instruments may include commercial mortgage-backed securities (“CMBS”) collateralized mortgage obligations (“CMOs”), mortgage pass-through securities, mortgage dollar rolls, CMO residuals or stripped mortgage-backed securities (“SMBS”).
Other Investment Company Securities and Other Exchange-Traded Products
The Funds may invest in shares of other investment companies, including money market funds and ETFs. The Funds may invest in securities of an investment company advised by the Manager or asub-advisor. Investments in the securities of other investment companies may involve duplication of advisory fees and certain other expenses. By investing in another investment company, the Funds become a shareholder of that investment company. As a result, the Funds’ shareholders indirectly will bear the Funds’ proportionate share of the fees and expenses paid by shareholders of the other investment company, in addition to the fees and expenses the Funds’ shareholders directly bear in connection with the Funds’ own operations. These other fees and expenses are reflected as Acquired Fund Fees and Expenses and are included in the Fees and Expenses Table for the Funds in their Prospectus, if applicable. Investments in other investment companies may involve the payment of substantial premiums above the value of such issuer’s portfolio securities.
The Funds can invest free cash balances in registeredopen-end investment companies regulated as money market funds under the Investment Company Act, to provide liquidity or for defensive purposes. The Funds could invest in money market funds rather than purchasing individual short-term investments. If the Funds invests in money market funds, shareholders will bear their proportionate share of the expenses, including for example, advisory and administrative fees, of the money market funds in which the Funds invest, including advisory fees charged by the Manager to any applicable money market funds advised by the Manager.
Payment-In-Kind Securities
The Funds may invest inpayment-in-kind securities (“PIKs”). PIKs give the issuer the option at each interest payment date of making interest payments in either cash or additional debt securities. Those additional debt securities usually have the same terms, including maturity dates and interest rates, and associated risks as the original bonds. The daily market quotations of the original bonds may include the accrued interest (referred to as a dirty price) and require apro-rata adjustment from the “Unrealized appreciation (depreciation) of investments” to “Dividend and interest receivable” in the Statements of Assets and Liabilities.
44
American Beacon FundsSM
Notes to Financial Statements
June 30, 2019
Short Sales
The SSI Alternative Income Fund may enter into short sale transactions. A short sale is a transaction in which a Fund sells a security it does not own in anticipation of a decline in the market price of the security. Securities sold in short sale transactions and the dividends and interest payable on such securities, if any, are reflected as a liability. The Fund is obligated to deliver the security at the market price at the time the short position is closed. The risk of loss on a short sale transaction is theoretically unlimited, because there is no limit to the cost of replacing the security sold short, whereas losses from purchase transactions cannot exceed the total amount invested. As of June 30, 2019, short positions were held by the Fund and are disclosed in the Schedule of Investments. For the same period herein, securities pledged as collateral for short sales are disclosed in the Fund’s Schedule of Investments, and cash collateral for short sales are reflected as “Cash with brokers” on the Statements of Assets and Liabilities.
5. Financial Derivative Instruments
The Funds may utilize derivative instruments to hedge against fluctuations in securities prices and currency exchange rates. When considering the Funds’ use of derivatives, it is important to note that the Funds do not use derivatives for the purpose of creating financial leverage.
Options Contracts
The Funds may write (1) call and put options on futures, swaps (“swaptions”), securities, commodities or currencies it owns or in which it may invest and (2) inflation-capped options. Writing put options tends to increase the Funds’ exposure to unfavorable movements of the underlying instrument in exchange for an upfront premium. Writing call options tends to decrease the Funds’ exposure to favorable movements of the underlying instrument in exchange for an upfront premium. When the Funds writes a call, put, or inflation-capped option, an amount equal to the premium received is recorded as a liability and subsequently marked to market to reflect the current value of the option written. The purpose of inflation-capped options is to protect the buyer from inflation erosion above a certain rate on a given notional exposure. A floor can be used to give downside protection to investments in inflation-linked products. These liabilities are reflected as written options outstanding on the Statement of Assets and Liabilities. Certain options may be written with premiums to be determined on a future date. Premiums received from writing options which expire are treated as realized gains. Premiums received from writing options which are exercised or closed are added to the proceeds or offset against amounts paid on the underlying futures, swap, security or currency transaction to determine the realized gain or loss when the underlying transaction is sold. The Funds, as a writer of an option has no control over whether the underlying instrument may be sold (call) or purchased (put) and as a result bears the market risk of an unfavorable change in the price of the instrument underlying the written option. There is the risk the Funds may not be able to enter into a closing transaction because of an illiquid market.
The Funds may also purchase put and call options. Purchasing call options tends to increase the Funds’ exposure to favorable movements of the underlying instrument in exchange for paying an upfront premium. Purchasing put options tends to decrease the Funds’ exposure to unfavorable movements of the underlying instrument. The Funds pay a premium which is included on the Funds’ Statements of Assets and Liabilities as an investment and subsequently marked to market to reflect the current value of the option. Premiums paid for purchasing options which expire are treated as realized losses. Certain options may be purchased with premiums to be determined on a future date. The premiums for these options are based upon implied volatility parameters at specified terms. The risk associated with purchasing put and call options is limited to the premium paid. Premiums paid for purchasing options which are exercised or closed are added to the amounts paid or offset against the proceeds on the underlying investment transaction to determine the realized gain or loss when the underlying transaction is sold.
During the period ended June 30, 2019, the SSI Alternative Income Fund purchased/sold options primarily for hedging.
45
American Beacon FundsSM
Notes to Financial Statements
June 30, 2019
The Fund’s option contracts outstanding fluctuate throughout the operating year as required to meet strategic requirements. The following table illustrates the average quarterly volume of options contracts. For the purpose of this disclosure, volume is measured by the notional value of contracts outstanding at each quarter end.
Average Option Notional Amounts Outstanding | ||||||||||||
Fund | Purchased Contracts | Written Contracts | ||||||||||
SSI Alternative Income | $ | - | $ | 159,000 | ||||||||
Straddle Options
The Funds may enter into differing forms of straddle options. A straddle is an investment strategy that uses combinations of options that allow a Fund to profit based on the future price movements of the underlying security, regardless of the direction of those movements. A written straddle involves simultaneously writing a call option and a put option on the same security with the same strike price and expiration date. The written straddle increases in value when the underlying security price has little volatility before the expiration date. A purchased straddle involves simultaneously purchasing a call option and a put option on the same security with the same strike price and expiration date. The purchased straddle increases in value when the underlying security price has high volatility, regardless of direction, before the expiration date.
Forward Foreign Currency Contracts
The TwentyFour Strategic Income Fund may enter into forward foreign currency contracts to hedge the exchange rate risk on investment transactions or to hedge the value of the Funds’ securities denominated in foreign currencies. Forward foreign currency contracts are valued at the forward exchange rate prevailing on the day of valuation. The Funds may also use currency contracts to increase exposure to a foreign currency or to shift exposure to foreign currency fluctuations from one country to another. The Fund bears the market risk that arises from changes in foreign exchange rates, and accordingly, the unrealized gain (loss) on these contracts is reflected in the accompanying financial statements. The Fund also bears the credit risk if the counterparty fails to perform under the contract.
During the year ended June 30, 2019, the TwentyFour Strategic Income Fund entered into forward foreign currency contracts primarily for return enhancement and hedging.
The Fund’s forward foreign currency contract notional dollar values outstanding fluctuate throughout the operating year as required to meet strategic requirements. The following table illustrates the average quarterly volume of forward foreign currency contracts. For the purpose of this disclosure, volume is measured by the amounts bought and sold in USD at each quarter end.
Average Forward Foreign Currency Notional Amounts Outstanding | ||||||||||||
Fund | Purchased Contracts | Sold Contracts | ||||||||||
TwentyFour Strategic Income | $ | 1,243,702 | $ | 45,632,989 | ||||||||
The following is a summary of the fair valuations of the Funds’ derivative instruments categorized by risk exposure(1):
SSI Alternative Income Fund
| Fair values of financial instruments on the Statements of Assets and Liabilities as of June 30, 2019: |
| ||||||||||||||||||||||||||||||||||||||||||||||||||||||
| Derivatives not accounted for as hedging instruments |
|
| |||||||||||||||||||||||||||||||||||||||||||||||||||||
Liabilities: | Credit contracts | Foreign exchange contracts | Commodity contracts | Interest rate contracts | Equity contracts | Total | |||||||||||||||||||||||||||||||||||||||||||||||||
| Written options contracts outstanding | $ | – | $ | – | $ | – | $ | – | $ | (394,098 | ) | $ | (394,098 | ) | |||||||||||||||||||||||||||||||||||||||||
46
American Beacon FundsSM
Notes to Financial Statements
June 30, 2019
| The effect of financial derivative instruments on the Statements of Operations as of June 30, 2019: |
| ||||||||||||||||||||||||||||||||||||||||||||||||||||||
| Derivatives not accounted for as hedging instruments |
|
| |||||||||||||||||||||||||||||||||||||||||||||||||||||
Realized gain (loss) from derivatives | Credit contracts | Foreign exchange contracts | Commodity contracts | Interest rate contracts | Equity contracts | Total | |||||||||||||||||||||||||||||||||||||||||||||||||
| Written options contracts | $ | – | $ | – | $ | – | $ | – | $ | 432,415 | $ | 432,415 | |||||||||||||||||||||||||||||||||||||||||||
Net change in unrealized appreciation | Credit contracts | Foreign exchange contracts | Commodity contracts | Interest rate contracts | Equity contracts | Total | |||||||||||||||||||||||||||||||||||||||||||||||||
| Written options contracts | $ | – | $ | – | $ | – | $ | – | $ | 409,724 | $ | 409,724 | |||||||||||||||||||||||||||||||||||||||||||
TwentyFour Strategic Income Fund
| Fair values of financial instruments on the Statements of Assets and Liabilities as of June 30, 2019: |
| ||||||||||||||||||||||||||||||||||||||||||||||||||||||
| Derivatives not accounted for as hedging instruments |
|
| |||||||||||||||||||||||||||||||||||||||||||||||||||||
Assets: | Credit contracts | Foreign exchange contracts | Commodity contracts | Interest rate contracts | Equity contracts | Total | |||||||||||||||||||||||||||||||||||||||||||||||||
| Unrealized appreciation of forward foreign currency contracts | $ | – | $ | 3,371 | $ | – | $ | – | $ | – | $ | 3,371 | |||||||||||||||||||||||||||||||||||||||||||
Liabilities: | Credit contracts | Foreign exchange contracts | Commodity contracts | Interest rate contracts | Equity contracts | Total | |||||||||||||||||||||||||||||||||||||||||||||||||
| Unrealized depreciation of forward foreign currency contracts | $ | – | $ | (427,036 | ) | $ | – | $ | – | $ | – | $ | (427,036 | ) | |||||||||||||||||||||||||||||||||||||||||
| The effect of financial derivative instruments on the Statements of Operations as of June 30, 2019: |
| ||||||||||||||||||||||||||||||||||||||||||||||||||||||
| Derivatives not accounted for as hedging instruments |
|
| |||||||||||||||||||||||||||||||||||||||||||||||||||||
Realized gain (loss) from derivatives | Credit contracts | Foreign exchange contracts | Commodity contracts | Interest rate contracts | Equity contracts | Total | |||||||||||||||||||||||||||||||||||||||||||||||||
| Forward foreign currency contracts | $ | – | $ | 2,572,150 | $ | – | $ | – | $ | – | $ | 2,572,150 | |||||||||||||||||||||||||||||||||||||||||||
Net change in unrealized appreciation | Credit contracts | Foreign exchange contracts | Commodity contracts | Interest rate contracts | Equity contracts | Total | |||||||||||||||||||||||||||||||||||||||||||||||||
| Forward foreign currency contracts | $ | – | $ | (703,164 | ) | $ | – | $ | – | $ | – | $ | (703,164 | ) | |||||||||||||||||||||||||||||||||||||||||
(1)See Note 3 in the Notes to Financial Statements for additional information.
Master Agreements
Master Securities Forward Transaction Agreements (“Master Forward Agreements”) govern the considerations and factors surrounding the settlement of certain forward settling transactions, such as delayed delivery or sale-buyback financing transactions by and between a Fund and select counterparties. The Master Forward Agreements maintain provisions for, among other things, initiation and confirmation, payment and transfer, events of default, termination, and maintenance of collateral.
Offsetting Assets and Liabilities
The Funds are parties to enforceable master netting agreements between brokers and counterparties which provide for the right to offset under certain circumstances. The Funds employ multiple money managers and counterparties and have elected not to offset qualifying financial and derivative instruments on the Statements of Assets and Liabilities, as such all financial and derivative instruments are presented on a gross basis. The impacts of netting arrangements that provide the right to offset are detailed below. The net amount represents the net
47
American Beacon FundsSM
Notes to Financial Statements
June 30, 2019
receivable or payable that would be due from or to the counterparty in the event of default. Exposure from borrowings and other financing agreements such as repurchase agreements can only be netted across transactions governed by the same Master Agreement with the same legal entity. All amounts reported below represent the balance as of the report date, June 30, 2019.
SSI Alternative Income Fund
| Offsetting of Financial and Derivative Assets as of June 30, 2019: |
| |||||||||||
| Assets | Liabilities | |||||||||||
| Written Options Contracts | $ | - | $ | 394,098 | ||||||||
|
|
|
| |||||||||
| Total derivative assets and liabilities in the Statement of Assets and Liabilities | $ | - | $ | 394,098 | ||||||||
|
|
|
| |||||||||
| Derivatives not subject to a Master Netting Agreement or similar agreement (“MNA”) | $ | - | $ | (394,098 | ) | |||||||
|
|
|
| |||||||||
TwentyFour Strategic Income Fund
| Offsetting of Financial and Derivative Assets as of June 30, 2019: |
| |||||||||||
| Assets | Liabilities | |||||||||||
| Forward Foreign Currency Contracts | $ | 3,371 | $ | 427,036 | ||||||||
|
|
|
| |||||||||
| Total derivative assets and liabilities in the Statement of Assets and Liabilities | $ | 3,371 | $ | 427,036 | ||||||||
|
|
|
| |||||||||
| Total derivative assets and liabilities subject to an MNA | $ | 3,371 | $ | 427,036 | ||||||||
|
|
|
| |||||||||
| Financial Assets, Derivatives, and Collateral Received/(Pledged) by Counterparty as of June 30, 2019: |
| |||||||||||||||||||||||||||||||||||
| Gross Amounts Not Offset in the Statement of Assets and Liabilities | ||||||||||||||||||||||||||||||||||||
Counterparty | Gross Amounts of Assets Presented in the Statement of Assets and Liabilities | Derivatives Available for Offset | Non-Cash Collateral Pledged | Cash Collateral Pledged | Net Amount | |||||||||||||||||||||||||||||||
| State Street Bank & Trust Co. | $ | 3,371 | $ | (3,371 | ) | $ | - | $ | - | $ | - | |||||||||||||||||||||||||
| Gross Amounts Not Offset in the Statement of Assets and Liabilities | ||||||||||||||||||||||||||||||||||||
Counterparty | Gross Amounts of Liabilities Presented in the Statement of Assets and Liabilities | Derivatives Available for Offset | Non-Cash Collateral Received | Cash Collateral Received | Net Amount | |||||||||||||||||||||||||||||||
| State Street Bank & Trust Co. | $ | 427,036 | $ | (3,371 | ) | $ | - | $ | - | $ | 423,665 | |||||||||||||||||||||||||
6. Principal Risks
Investing in the Funds may involve certain risks including, but not limited to, those described below.
Asset-Backed and Mortgage Related Securities Risk
Investments in asset-backed and mortgage related securities, including CMOs and commercial and residential loans, are subject to market risks for fixed-income securities which include, but are not limited to, interest rate risk, prepayment risk and extension risk. Small movements in interest rates (both increases and decreases) may quickly and significantly reduce the value of certain MBS and ABS securities. If interest rates fall, the rate of prepayments tends to increase as borrowers are motivated to pay off debt and refinance at new lower rates. When mortgages and other obligations are prepaid and when securities are called, a Fund may have to reinvest in securities with a lower yield or fail to recover additional amounts (i.e., premiums) paid for securities with higher interest rates, resulting in an unexpected capital loss and/or a decrease in the amount of dividends and yield. Because prepayments increase when interest rates fall, the prices of MBS and ABS do not increase as much as other fixed income securities when interest rates fall. When interest rates rise, borrowers are less likely to prepay their mortgage and other loans. A decreased rate of prepayments lengthens the expected maturity of MBS and ABS. Therefore, the prices of MBS and ABS may decrease more than prices of other fixed-income securities when
48
American Beacon FundsSM
Notes to Financial Statements
June 30, 2019
interest rates rise. Rising interest rates tend to extend the duration of these securities, making them more sensitive to changes in interest rates. Rising interest rates also may increase the risk of default by borrowers. As a result, in a period of rising interest rates, a Fund that holds these types of securities, may experience additional volatility and losses. A decline in the credit quality of and defaults by the issuers of asset-backed and mortgage related securities or instability in the markets for such securities may affect the value and liquidity of such securities, which could result in losses to a Fund. In addition, certain asset-backed and mortgage related securities may include securities backed by pools of loans made to “subprime” borrowers or borrowers with blemished credit histories; the risk of defaults is generally higher in the case of mortgage pools that include such subprime mortgages.
Callable Securities Risk
The SSI Alternative Income Fund may invest in fixed-income securities with call features. A call feature allows the issuer of the security to redeem or call the security prior to its stated maturity date. In periods of falling interest rates, issuers may be more likely to call in securities that are paying higher coupon rates than prevailing interest rates. In the event of a call, the Fund would lose the income that would have been earned to maturity on that security, and the proceeds received by the Fund may be invested in securities paying lower coupon rates. Thus, the Fund’s income could be reduced as a result of a call. In addition, the market value of a callable security may decrease if it is perceived by the market as likely to be called, which could have a negative impact on the Fund’s total return.
Convertible Securities Risk
The value of a convertible security typically increases or decreases with the price of the underlying common stock. In general, a convertible security is subject to the risks of stocks, and its price may be as volatile as that of the underlying stock, when the underlying stock’s price is high relative to the conversion price and a convertible security is subject to the risks of debt securities, and is particularly sensitive to changes in interest rates, when the underlying stock’s price is low relative to the conversion price. Convertible securities generally have less potential for gain or loss than common stocks. Securities that are convertible other than at the option of the holder generally do not limit the potential for loss to the same extent as securities that are convertible at the option of the holder. Many convertible securities have credit ratings that are below investment grade and are subject to the same risks as an investment in lower-rated debt securities. The credit rating of a company’s convertible securities is generally lower than that of itsnon-convertible debt securities. Convertible securities are normally considered “junior” securities – that is, the company usually must pay interest on itsnon-convertible debt securities before it can make payments on its convertible securities. If the issuer stops paying interest or principal, convertible securities may become worthless and the Fund could lose its entire investment. In addition, because companies that issue convertible securities may be small- ormid-cap companies, to the extent the Fund invests in convertible securities issued by small- ormid-cap companies, it will be subject to the risks of investing in such companies.
Counterparty Risk
The Funds are subject to the risk that a party or participant to a transaction, such as a broker or derivative counterparty, will be unwilling or unable to satisfy its obligation to make timely principal, interest or settlement payments or to otherwise honor its obligations to the Funds. As a result the Fund may obtain no recovery of its investment or may only obtain a limited recovery, and any recovery may be delayed. Not all derivative transactions require a counterparty to post collateral, which may expose the Fund to greater losses in the event of a default by a counterparty.
Some of the markets in which the Fund may effect derivative transactions are over-the-counter (“OTC”) or “interdealer” markets. The participants in such markets are typically not subject to credit evaluation and regulatory oversight to the same extent as are members of “exchange-based” markets. This exposes the Fund to the risk that a counterparty will not settle a transaction in accordance with its terms and conditions because of a
49
American Beacon FundsSM
Notes to Financial Statements
June 30, 2019
credit or liquidity problem with the counterparty and the recent turbulence in the financial markets highlights the importance of being aware of counterparty risk resulting from OTC derivative transactions. The Fund is subject to the risk that a party or participant to a transaction, such as a broker or derivative counterparty, will be unwilling or unable to satisfy its obligation to make timely principal, interest or settlement payments or to otherwise honor its obligations to the Fund. As a result, the Funds may obtain no recovery of its investment or may only obtain a limited recovery, and any recovery may be delayed. Not all derivative transactions require a counterparty to post collateral, which may expose the Funds to greater losses in the event of a default by a counterparty.
Credit Risk
The Funds are subject to the risk that the issuer or guarantor of an obligation, or the counterparty to a transaction, including a derivatives contract or a loan, will fail to make timely payment of interest or principal or otherwise honor its obligations or default completely. The strategies utilized by thesub-advisors require accurate and detailed credit analysis of issuers and there can be no assurance that its analysis will be accurate or complete. The Funds may be subject to substantial losses in the event of credit deterioration or bankruptcy of one or more issuers in its portfolio. Financial strength and solvency of an issuer are the primary factors influencing credit risk. In addition, inadequacy of collateral or credit enhancement for a debt instrument may affect its credit risk. Credit risk may change over the life of an instrument and debt obligations which are rated by rating agencies may be subject to downgrade. The credit ratings of debt instruments and investments represent the rating agencies’ opinions regarding their credit quality and are not a guarantee of future credit performance of such securities. Rating agencies attempt to evaluate the safety of the timely payment of principal and interest (or dividends) and do not evaluate the risks of fluctuations in market value. The ratings assigned to securities by rating agencies do not purport to fully reflect the true risks of an investment. Further, in recent years many highly-rated structured securities have been subject to substantial losses as the economic assumptions on which their ratings were based proved to be materially inaccurate. A decline in the credit rating of an individual security held by the Funds may have an adverse impact on its price and make it difficult for the Funds to sell it. Ratings represent a rating agency’s opinion regarding the quality of the security and are not a guarantee of quality. Rating agencies might not always change their credit rating on an issuer or security in a timely manner to reflect events that could affect the issuer’s ability to make timely payments on its obligations. Credit risk is typically greater for securities with ratings that are below investment grade (commonly referred to as “junk bonds”). Since the Funds can invest significantly in lower quality debt securities considered speculative in nature, this risk will be substantial. A downgrade or default affecting any of the Fund’s securities could affect the Fund’s performance.
Currency Risk
The Funds may have exposure to foreign currencies by investing in securities denominated innon-U.S. currencies or in securities denominated innon-U.S. currencies, purchasing or selling forward currency exchange contracts innon-U.S. currencies,non-U.S. currency futures contracts, options onnon-U.S. currencies andnon-U.S. currency futures and swaps for cross-currency investments. Foreign currencies may decline in value relative to the U.S. dollar, or, in the case of hedging positions, the U.S. dollar may decline in value relative to the currency being hedged, and thereby affect a Fund’s investments in foreign(non-U.S.) currencies or in securities that trade in, and receive revenues in, or in derivatives that provide exposure to, foreign(non-U.S.) currencies. Currency exchange rates may fluctuate significantly over short periods of time for a number of reasons, including changes in interest rates, intervention (or the failure to intervene) by U.S. or foreign governments, central banks or supranational entities such as the International Monetary Fund, or by the imposition of currency controls or other political developments in the United States or abroad. As a result, the Fund’s investments in foreign currency denominated securities may reduce the returns of the Funds. Currency futures, forwards, options or swaps may not always work as intended, and in specific cases, the Funds may be worse off than if it had not used such instrument(s). There may not always be suitable hedging instruments available. Even where suitable hedging instruments are available, the Funds may choose to not hedge its currency risks.
50
American Beacon FundsSM
Notes to Financial Statements
June 30, 2019
Derivatives Risk
Derivatives may involve significant risk. The use of derivative instruments may expose the Funds to additional risks that they would not be subject to if they invested directly in the securities or other instruments underlying those derivatives, including the high degree of leverage often embedded in such instruments, and potential material and prolonged deviations between the theoretical value and realizable value of a derivative. Some derivatives have the potential for unlimited loss, regardless of the size of the Funds’ initial investment. Derivatives may be illiquid and may be more volatile than other types of investments. The Funds may buy or sell derivatives not traded on an exchange and which may be subject to heightened liquidity and valuation risk. Derivative investments can increase portfolio turnover and transaction costs. Derivatives also are subject to counterparty risk and credit risk. As a result, the Funds may obtain no recovery of their investment or may only obtain a limited recovery, and any recovery may be delayed. Not all derivative transactions require a counterparty to post collateral, which may expose the Funds to greater losses in the event of a default by a counterparty.
Foreign Investing and Emerging Markets Risk
Non-U.S. investments carry potential risks not associated with U.S. investments. Such risks include, but are not limited to: (1) currency exchange rate fluctuations, (2) political and financial instability, (3) less liquidity, (4) lack of uniform accounting, auditing and financial reporting standards, (5) increased price volatility, (6) less government regulation and supervision of foreign stock exchanges, brokers and listed companies, and (7) delays in transaction settlement in some foreign markets. To the extent the Funds invests a significant portion of its assets in securities of a single country or region, it is more likely to be affected by events or conditions of that country or region. In addition, the economies and political environments of emerging market countries tend to be more unstable than those of developed countries, resulting in more volatile rates of return than the developed markets and substantially greater risk to investors. There may be very limited oversight of certain foreign banks or securities depositories that hold foreign securities and currency and the laws of certain countries may limit the ability to recover such assets if a foreign bank or depository or their agents goes bankrupt. When investing in emerging markets, the risks of investing in foreign securities are heightened. Emerging markets have unique risks that are greater than, or in addition to, investing in developed markets because emerging markets are generally smaller, less developed, less liquid and more volatile than the securities markets of the U.S. and other developed markets. There are also risks of: greater political uncertainties; an economy’s dependence on revenues from particular commodities or on international aid or development assistance; currency transfer restrictions; a limited number of potential buyers for such securities, resulting in increased volatility and limited liquidity for emerging market securities; trading suspensions; and delays and disruptions in securities settlement procedures. In addition, there may be less information available to make investment decisions and more volatile rates of return.
Forward Foreign Currency Contracts Risk
Forward foreign currency contracts, includingnon-deliverable forwards, are derivative instruments pursuant to a contract with a counterparty to pay a fixed price for an agreed amount of securities or other underlying assets at an agreed date or to buy or sell a specific currency at a future date at a price set at the time of the contract. The use of forward foreign currency contracts may expose the Funds to additional risks that it would not be subject to if it invested directly in the securities or currencies underlying the forward foreign currency contract.
High Portfolio Turnover Risk
Portfolio turnover is a measure of a Fund’s trading activity over aone-year period. A portfolio turnover rate of 100% would indicate that a Fund sold and replaced the entire value of its securities holdings during the period. High portfolio turnover could increase the Fund’s transaction costs because of increased broker commissions resulting from such transactions. These costs are not reflected in the Fund’s annual operating expenses or in the expense example, but they can have a negative impact on performance and generate higher capital gain distributions to shareholders than if the Fund had a low portfolio turnover rate. Frequent trading by a Fund could
51
American Beacon FundsSM
Notes to Financial Statements
June 30, 2019
also result in increased realized net capital gains, distributions of which are taxable to a Fund’s shareholders when Fund shares are held in a taxable account (including net short-term capital gain distributions, which are taxable to them as ordinary income).
High-Yield Bond Risk
Lower-rated securities are subject to certain risks that may not be present with investments in higher-grade securities. Investors should consider carefully their ability to assume the risks associated with lower-rated securities before investing in the Fund. The lower rating of certain high yielding corporate income securities reflects a greater possibility that the financial condition of the issuer or adverse changes in general economic conditions may impair the ability of the issuer to pay income and principal. Changes by rating agencies in their ratings of a fixed income security also may affect the value of these investments. However, allocating investments in the Fund among securities of different issuers should reduce the risks of owning any such securities separately. The prices of these high yielding securities tend to be less sensitive to interest rate changes than higher-rated investments, but more sensitive to adverse economic changes or individual corporate developments. During economic downturns or periods of rising interest rates, highly leveraged issuers may experience financial stress that adversely affects their ability to service principal and interest payment obligations, to meet projected business goals or to obtain additional financing, and the markets for their securities may be more volatile. If an issuer defaults, the Fund may incur additional expenses to seek recovery. Additionally, accruals of interest income for the Fund may have to be adjusted in the event of default. In the event of an issuer’s default, the Fund may write off prior income accruals for that issuer, resulting in a reduction in the Fund’s current dividend payment. Frequently, the higher yields of high-yielding securities may not reflect the value of the income stream that holders of such securities may expect, but rather the risk that such securities may lose a substantial portion of their value as a result of their issuer’s financial restructuring or default. Additionally, an economic downturn or an increase in interest rates could have a negative effect on the high-yield securities market and on the market value of the high-yield securities held by the Fund, as well as on the ability of the issuers of such securities to repay principal and interest on their borrowings.
Interest Rate Risk
Investments in fixed-income securities or derivatives that are influenced by interest rates are subject to interest rate risk. The Funds may be particularly sensitive to changes in interest rates if it invests in debt securities with intermediate and long terms to maturity. Debt securities with longer durations tend to be more sensitive to changes in interest rates, usually making them more volatile than debt securities with shorter durations. For example, if a bond has a duration of four years, a 1% increase in interest rates could be expected to result in a 4% decrease in the value of the bond. Yields of debt securities will fluctuate over time. Following the financial crisis that started in 2008, the Federal Reserve has attempted to stabilize the economy and support the economic recovery by keeping the federal funds rate (the interest rate at which depository institutions lend reserve balances to each other overnight) at or near zero percent. The Federal Reserve has raised the federal funds rate several times since December 2015 and may continue to increase rates in the future. Interest rates may rise significantly and/or rapidly, potentially resulting in substantial losses to the Funds. During periods of very low or negative interest rates, the Funds may be unable to maintain positive returns. Certain European countries and Japan have recently experienced negative interest rates on deposits and debt securities have traded at negative yields. Negative interest rates may become more prevalent amongnon-U.S. issuers, and potentially within the United States. Changing interest rates, including rates that fall below zero, may have unpredictable effects on markets, may result in heightened market volatility and may detract from Fund performance to the extent the Funds are exposed to such interest rates.
Liquidity Risk
When there is little or no active trading market for a specific type of security, it can become more difficult to purchase or sell the securities at or near their perceived value. During such periods, certain investments held by
52
American Beacon FundsSM
Notes to Financial Statements
June 30, 2019
the Funds may be difficult to sell or other investments may be difficult to purchase at favorable times or prices. As a result, the Funds may have to lower the price on certain securities that it is trying to sell, sell other securities instead or forgo an investment opportunity, any of which could have a negative effect on Fund management or performance. Redemptions by a few large investors in the Funds at such times may have a significant adverse effect on the Funds’ NAV per share and remaining Fund shareholders. In addition, the market-making capacity of dealers in certain types of securities has been reduced in recent years, in part as a result of structural and regulatory changes, such as fewer proprietary trading desks and increased regulatory capital requirements for broker-dealers. Further, many broker-dealers have reduced their inventory of certain debt securities. This could negatively affect the Funds’ ability to buy or sell debt securities and increase the related volatility and trading costs. The Funds may lose money if it is forced to sell certain investments at unfavorable prices to meet redemption requests or other cash needs.
Market Risk
Conditions in the U.S. and many foreign economies have resulted, and may continue to result, in certain instruments experiencing unusual liquidity issues, increased price volatility and, in some cases, credit downgrades and increased likelihood of default. These events have reduced the willingness and ability of some lenders to extend credit, and have made it more difficult for some borrowers to obtain financing on attractive terms, if at all. In some cases, traditional market participants have been less willing to make a market in some types of debt instruments, which has affected the liquidity of those instruments. During times of market turmoil, investors tend to look to the safety of securities issued or backed by the U.S. Treasury, causing the prices of these securities to rise and the yields to decline. Reduced liquidity in fixed income and credit markets may negatively affect many issuers worldwide. In addition, global economies and financial markets are becoming increasingly interconnected, which increases the possibilities that conditions in one country or region might adversely impact issuers in a different country or region. A rise in protectionist trade policies, and the possibility of changes to some international trade agreements, could affect the economies of many nations in ways that cannot necessarily be foreseen at the present time.
In response to the financial crisis, the U.S. and other governments, the Federal Reserve, and certain foreign central banks have taken steps to support financial markets. In some countries where economic conditions are recovering, they are nevertheless perceived as still fragile. Withdrawal of government support, failure of efforts in response to the crisis, or investor perception that such efforts are not succeeding, could adversely impact the value and liquidity of certain securities. The severity or duration of adverse economic conditions may also be affected by policy changes made by governments or quasi-governmental organizations, including changes in tax laws. The impact of new financial regulation legislation on the markets and the practical implications for market participants may not be fully known for some time. Regulatory changes are causing some financial services companies to exit long-standing lines of business, resulting in dislocations for other market participants. In addition, political and diplomatic events within the U.S. and abroad, such as the U.S. government’s inability at times to agree on a long-term budget and deficit reduction plan, the threat of a federal government shutdown and threats not to increase the federal government’s debt limit, may affect investor and consumer confidence and may adversely impact financial markets and the broader economy, perhaps suddenly and to a significant degree. The U.S. government has recently reduced the federal corporate income tax rate, and future legislative, regulatory and policy changes may result in more restrictions on international trade, less stringent prudential regulation of certain players in the financial markets, and significant new investments in infrastructure and national defense. Markets may react strongly to expectations about the changes in these policies, which could increase volatility, especially if the market’s expectations for changes in government policies are not borne out.
Changes in market conditions will not have the same impact on all types of securities. Interest rates have been unusually low in recent years in the U.S. and abroad. Because there is little precedent for this situation, it is difficult to predict the impact of a significant rate increase on various markets. For example, because investors may buy securities or other investments with borrowed money, a significant increase in interest rates may cause a decline in the markets for those investments. Regulators have expressed concern that rate increases may cause
53
American Beacon FundsSM
Notes to Financial Statements
June 30, 2019
investors to sell fixed income securities faster than the market can absorb them, contributing to price volatility. In addition, there is a risk that the prices of goods and services in the U.S. and many foreign economies may decline over time, known as deflation (the opposite of inflation). Deflation may have an adverse effect on stock prices and creditworthiness and may make defaults on debt more likely. If a country’s economy slips into a deflationary pattern, it could last for a prolonged period and may be difficult to reverse.
The precise details and the resulting impact of the United Kingdom’s vote to leave the European Union (the “EU”), commonly referred to as “Brexit,” are not yet known. The effect on the United Kingdom’s economy will likely depend on the nature of trade relations with the EU and other major economies following its exit, which are matters to be negotiated. The outcomes may cause increased volatility and have a significant adverse impact on world financial markets, other international trade agreements, and the United Kingdom and European economies, as well as the broader global economy for some time, which could significantly adversely affect the value of the Fund’s investments in the United Kingdom and Europe.
Market Timing Risk
Because the Funds invest in foreign securities, it is particularly subject to the risk of market timing activities. Frequent trading by Fund shareholders poses risks to other shareholders in the Funds, including (i) the dilution of the Funds’ NAV, (ii) an increase in the Funds’ expenses, and (iii) interference with the portfolio manager’s ability to execute efficient investment strategies. Because of specific securities in which the Funds may invest, it could be subject to the risk of market timing activities by shareholders. Some examples of these types of securities are high-yield and foreign securities. The limited trading activity of some high-yield securities may result in market prices that do not reflect the true market value of these securities. The Funds generally prices foreign securities using their closing prices from the foreign markets in which they trade, typically prior to the Funds’ calculation of its NAV. These prices may be affected by events that occur after the close of a foreign market but before the Funds price its shares. In such instances, the Funds may fair value high yield and foreign securities. However, some investors may engage in frequent short-term trading in the Funds to take advantage of any price differentials that may be reflected in the NAV of the Funds’ shares. While the Manager monitors trading in the Funds, there is no guarantee that it can detect all market timing activities.
Other Investment Companies Risk
The Funds may invest in shares of other registered investment companies, including money market funds, exchange-traded funds (“ETFs”) and business development companies (“BDCs”). To the extent that the Funds invest in shares of other registered investment companies, the Funds will indirectly bear the fees and expenses, including for example, advisory and administrative fees, charged by those investment companies in addition to the Funds’ direct fees and expenses and will be subject to the risks associated with investments in those companies. For example, the Funds’ investments in money market funds are subject to interest rate risk, credit risk, and market risk. The Funds must rely on the investment company in which it invests to achieve its investment objective. If the investment company fails to achieve its investment objective, the value of the Funds’ investment may decline, adversely affecting the Funds’ performance. ETFs are subject to the following risks that do not apply to conventional funds: (1) the market price of an ETF’s shares may trade at a discount or premium to its NAV; (2) an active trading market for an ETF’s shares may not develop or be maintained; or (3) trading of an ETF’s shares may be halted if the listing exchange’s officials deem such action appropriate, the shares are delisted from the exchange, or the activation of market-wide “circuit breakers” (which are tied to large decreases in stock prices) halts stock trading generally. An ETF that tracks an index may not precisely replicate the returns of its benchmark index. To the extent the Funds invest in other investment companies that invest in equity securities, fixed-income securities and/or foreign securities, or that track an index, the Funds are subject to the risks associated with the underlying investments held by the investment company or the index fluctuations to which the investment company is subject. ETFs have expenses associated with their operation, typically including advisory fees. BDCs generally invest in small developing companies, private companies, and thinly traded securities of public companies, and many debt instruments in which a BDC may invest may not be rated by a credit rating
54
American Beacon FundsSM
Notes to Financial Statements
June 30, 2019
agency and may be below investment grade quality. The Funds’ investments in BDCs may be subject to certain additional risks, including competition for limited investment opportunities, the liquidity of a BDC’s investments, uncertainty as to the value of a BDC’s investments, risks associated with access to capital and leverage, and reliance on the management of a BDC.
Restricted Securities Risk
Section 4(a) (2) and other restricted securities may not be listed on an exchange and may have no active trading market. They may be more difficult to purchase or sell at an advantageous time or price because such securities may not be readily marketable in broad public markets. The Funds may not be able to sell a Section 4(a)(2) security when thesub-advisor consider it desirable to do so and/or may have to sell the security at a lower price than the Funds believe is its fair market value. Although there is a substantial institutional market for Section 4(a)(2) securities, it is not possible to predict exactly how the market for such securities will develop. A Section 4(a)(2) security that was liquid at the time of purchase may subsequently become illiquid. In addition, transaction costs may be higher for restricted securities and the Fund may receive only limited information regarding the issuer of a restricted security. The Funds may have to bear the expense of registering Section 4(a)(2) securities for resale and the risk of substantial delays in effecting the registration. If, during such a delay, adverse market conditions were to develop, the Fund might obtain a less favorable price than prevailed at the time it decided to seek registration of the security.
Short Position Risk
The SSI Alternative Income Fund’s short positions are subject to special risks. A short sale is effected by selling a security that the Fund does not own, or selling a security that the Fund owns but that it does not deliver upon consummation of the sale. In order to make delivery to the buyer of a security sold short, the Fund must borrow the security. In so doing, it incurs the obligation to replace that security, whatever its price may be, at the time it is required to deliver it to the lender. The Fund must also pay to the lender of the security any dividends or interest payable on the security during the borrowing period and may have to pay a premium to borrow the security. This obligation must, unless the Fund then owns or has the right to obtain, without payment, securities identical to those sold short, be collateralized by a deposit of cash or marketable securities with the lender. Short selling is subject to a theoretically unlimited risk of loss because there is no limit on how much the price of a security may appreciate before the short position is closed out. There can be no assurance that the securities necessary to cover the short position will be available for purchase by the Fund. In addition, purchasing securities to close out the short position can itself cause the price of the relevant securities to rise further, thereby increasing any loss incurred by the Fund. Furthermore, the Fund may be forced to close out a short position prematurely if a counterparty from which the Fund borrowed securities demands their return, resulting in a loss on what might otherwise have been a profitable position. The Fund may also enter into a short position through a forward commitment or via an option, futures contract or swap agreement. If the price of the security or derivative has increased during the time the Fund holds the short position, then the Fund will incur a loss equal to the increase in price from the time that the short position was entered into plus any premiums and interest paid to the third party. Therefore, short positions involve the risk that losses may be exaggerated, potentially losing more money than the actual cost of the investment. The Fund’s losses are potentially unlimited in a short position because the price appreciation of the security that the Fund is required to purchase is unlimited. In addition, because the Fund may invest the proceeds of a short sale, the Fund may be subject to the effect of leverage, in that it amplifies changes in the Fund’s NAV since it increases the exposure of the Fund to the market. If such instruments are traded OTC, the Fund is subject to the risk that the counterparty may fail to honor its contract terms, causing a loss to the Fund.
Sovereign and Quasi Sovereign Debt Risk
An investment in sovereign and quasi-sovereign debt obligations involves special risks not present in corporate debt obligations. Sovereign and quasi-sovereign debt securities are issued or guaranteed by a sovereign government or entity affiliated with or backed by a sovereign government. The issuer of the sovereign or
55
American Beacon FundsSM
Notes to Financial Statements
June 30, 2019
quasi-sovereign debt that controls the repayment of the debt may be unable or unwilling to repay principal or interest when due, and the Fund may have limited recourse in the event of a default. In addition, these investments are subject to risk of payment delays or defaults due to (1) country cash flow problems, (2) insufficient foreign currency reserves, (3) political considerations, (4) large debt positions relative to the country’s economy, (5) policies toward foreign lenders or investors, (6) the failure to implement economic reforms required by the International Monetary Fund or other multilateral agencies, or (7) an inability or unwillingness to repay debts. It may be particularly difficult to enforce the rights of debt holders in frontier and emerging markets. A governmental entity that defaults on an obligation may request additional time in which to pay or receive further loans or may seek to restructure its obligations to reduce interest rates or outstanding principal. There is no legal process for collecting sovereign and quasi-sovereign debt that a government does not pay nor are there bankruptcy proceedings through which all or part of the sovereign debt that a governmental entity has not repaid may be collected. Sovereign and quasi-sovereign debt risk is increased for emerging and frontier markets issuers, which are among the largest debtors to commercial banks and foreign governments. At times, certain emerging market countries have declared moratoria on the payment of principal and interest on external debt. Certain emerging market countries have experienced difficulty in servicing their sovereign debt on a timely basis, which has led to defaults and the restructuring of certain indebtedness.
U.S. Government Securities and Government-Sponsored Enterprises Risk
A security backed by the U.S. Treasury or the full faith and credit of the United States is guaranteed by the applicable entity only as to the timely payment of interest and principal when held to maturity. The market prices for such securities are not guaranteed and will fluctuate. Additionally, circumstances could arise that would prevent the payment of interest or principal. This could result in losses to the Fund. Investments in securities issued by government-sponsored enterprises are debt obligations issued by agencies and instrumentalities of the U.S. Government. These obligations vary in the level of support they receive from the U.S. Government. They may be: (i) supported by the full faith and credit of the U.S. Treasury, such as those of the Government National Mortgage Association (“GNMA”); (ii) supported by the right of the issuer to borrow from the U.S. Treasury, such as those of the Federal Home Loan Bank and the Federal Farm Credit Banks; (iii) supported by the discretionary authority of the U.S. Government to purchase the agency obligations, such as those of Fannie Mae and Freddie Mac or (iv) supported only by the credit of the issuer, such as those of the Federal Farm Credit Bureau. The U.S. Government may choose not to provide financial support to U.S. Government-sponsored agencies or instrumentalities if it is not legally obligated to do so, in which case, if the issuer defaulted, to the extent the Fund holds securities of such issuer, it might not be able to recover its investment from the U.S. Government.
Valuation Risk
This is the risk that a Fund has valued a security at a price different from the price at which it can be sold. This risk may be especially pronounced for investments, such as derivatives, which may be illiquid or which may become illiquid and for securities that trade in relatively thin markets and/or markets that experience extreme volatility. If market conditions make it difficult to value certain investments, a Fund may value these investments using more subjective methods, such as fair-value methodologies. Investors who purchase or redeem Fund shares on days when a Fund is holding fair-valued securities may receive fewer or more shares, or lower or higher redemption proceeds, than they would have received if the Fund had not fair-valued the securities or had used a different valuation methodology. The value of foreign securities, certain fixed income securities and currencies, as applicable, may be materially affected by events after the close of the markets on which they are traded, but before a Fund determines its NAV. A Fund’s ability to value its investments in an accurate and timely manner may be impacted by technological issues and/or errors by third-party service providers, such as pricing services or accounting agents.
Variable and Floating Rate Securities Risk
The coupons on certain fixed income securities in which a Fund may invest are not fixed and may fluctuate based upon changes in market rates. The coupon on a floating rate security is generally based on an interest rate
56
American Beacon FundsSM
Notes to Financial Statements
June 30, 2019
such as a money-market index, LIBOR or a Treasury bill rate. Such securities are subject to interest rate risk and may fluctuate in value in response to interest rate changes if there is a delay between changes in market interest rates and the interest reset date for the obligation, or for other reasons. As short-term interest rates decline, the coupons on variable and floating rate securities typically decrease. Alternatively, during periods of rising interest rates, changes in the coupons of variable and floating rate securities may lag behind changes in market rates or may have limits on the maximum increases in the coupon rates. The value of variable and floating rate securities may decline if their coupons do not rise as much, or as quickly, as interest rates in general. Conversely, variable and floating rate securities will not generally increase in value if interest rates decline. Variable and floating rate securities are less effective at locking in a particular yield and are subject to credit risk.
7. Federal Income and Excise Taxes
It is the policy of each Fund to qualify as a regulated investment company (“RIC”), by complying with all applicable provisions of Subchapter M of the Internal Revenue Code, as amended, and to make distributions of taxable income sufficient to relieve it from substantially all federal income and excise taxes. For federal income tax purposes, each Fund is treated as a single entity for the purpose of determining such qualification.
The Funds do not have any unrecorded tax liabilities in the accompanying financial statements. Each of the tax years in the four year period ended June 30, 2019 remain subject to examination by the Internal Revenue Service. If applicable, the Funds recognize interest accrued related to unrecognized tax benefits in interest expense and penalties in “Other expenses” on the Statements of Operations.
The Funds may be subject to taxes imposed by countries in which it invests. Such taxes are generally based on returns of income earned or gains realized or repatriated. Taxes are accrued and applied to net investment income, net realized capital gains and net unrealized appreciation (depreciation), as applicable, as the income is earned or capital gains are recorded.
Dividends are categorized in accordance with income tax regulations which may treat certain transactions differently than U.S. GAAP. Accordingly, the character of distributions and composition of net assets for tax purposes may differ from those reflected in the accompanying financial statements.
The tax character of distributions paid were as follows:
| SSI Alternative Income Fund | TwentyFour Strategic Income Fund | |||||||||||||||||||||||||||
| Period Ended June 30, 2019 | Year Ended March 31, 2019 | Year Ended June 30, 2019 | Year Ended June 30, 2018 | |||||||||||||||||||||||||
Distributions paid from: |
| |||||||||||||||||||||||||||
Ordinary income |
| |||||||||||||||||||||||||||
Institutional Class | $ | $ | $ | 1,433,690 | $ | 48,595 | ||||||||||||||||||||||
Y Class | - | 5,245,637 | 1,660,225 | 272,222 | ||||||||||||||||||||||||
Investor Class | - | 33,530 | 76,563 | 30,565 | ||||||||||||||||||||||||
A Class | - | - | 135,761 | - | ||||||||||||||||||||||||
C Class | - | - | 45,304 | - | ||||||||||||||||||||||||
Ultra Class | - | - | 490,949 | 529,543 | ||||||||||||||||||||||||
Long-term capital gains |
| |||||||||||||||||||||||||||
Institutional Class | - | - | 7,865 | - | ||||||||||||||||||||||||
Y Class | - | - | 5,916 | - | ||||||||||||||||||||||||
Investor Class | - | - | 271 | - | ||||||||||||||||||||||||
A Class | - | - | 518 | - | ||||||||||||||||||||||||
C Class | - | - | 243 | - | ||||||||||||||||||||||||
Ultra Class | - | - | 1,518 | - | ||||||||||||||||||||||||
|
|
|
|
|
|
|
| |||||||||||||||||||||
Total distributions paid | $ | $ | 5,279,167 | $ | 3,858,823 | $ | 880,925 | |||||||||||||||||||||
|
|
|
|
|
|
|
| |||||||||||||||||||||
*For tax purposes, short-term capital gains are considered ordinary income distributions.
57
American Beacon FundsSM
Notes to Financial Statements
June 30, 2019
As of June 30, 2019, the components of distributable earnings (deficits) on a tax basis were as follows:
Fund | Tax Cost | Unrealized Appreciation | Unrealized (Depreciation) | Net Unrealized Appreciation (Depreciation) | ||||||||||||||||||||||||
| SSI Alternative Income | $ | 218,666,069 | $ | 20,496,436 | $ | (20,458,019 | ) | $ | 38,417 | |||||||||||||||||||
| TwentyFour Strategic Income | 65,972,823 | 1,325,599 | (1,419,564 | ) | (93,965 | ) | ||||||||||||||||||||||
Fund | Net Unrealized Appreciation (Depreciation) | Undistributed Ordinary Income | Undistributed Long-Term Capital Gains | Accumulated Capital and Other (Losses) | Other Temporary Differences | Distributable Earnings | ||||||||||||||||||||||||||||||||||||||
| SSI Alternative Income | $ | 38,417 | $ | 3,192,470 | $ | - | $ | (3,401,983 | ) | $ | (1 | ) | $ | (171,097 | ) | |||||||||||||||||||||||||||||
| TwentyFour Strategic Income | (93,965 | ) | 880,960 | - | (17,375,240 | ) | (2 | ) | (16,588,247 | ) | ||||||||||||||||||||||||||||||||||
Financial reporting records are adjusted for permanent book/tax differences to reflect tax character. Financial records are not adjusted for temporary differences. The temporary differences between financial reporting andtax-basis reporting of unrealized appreciation (depreciation) are attributable primarily to the tax deferral of losses from wash sales, the tax deferral of post-October capital losses, the tax deferral of losses from straddles, reclassifications of income from investments in real estate investment securities, deemed distributions from convertible obligations, unused capital losses, and the realization for tax purposes of unrealized gains (losses) on certain derivative instruments.
Due to inherent differences in the recognition of income, expenses, and realized gains (losses) under U.S. GAAP and federal income tax regulations, permanent differences between book and tax reporting have been identified and appropriately reclassified on the Statements of Assets and Liabilities.
Fund | Paid-In-Capital | Distributable Earnings/(Deficits) | ||||||
SSI Alternative Income | $ | 1,155 | $ | (1,155 | ) | |||
TwentyFour Strategic Income | 16,837,884 | (16,837,884 | ) | |||||
Under the Regulated Investment Company Modernization Act of 2010 (“RIC MOD”), net capital losses recognized by the Funds in taxable years beginning after December 22, 2010 are carried forward indefinitely and retain their character as short-term and/or long-term losses.
As of June 30, 2019, the Funds had the following post RIC MOD capital loss carryforwards:
Fund | Short-Term Capital Loss Carryforwards | Long-Term Capital Loss Carryforwards | ||||||
SSI Alternative Income | $ | 3,401,983 | $ | - | ||||
TwentyFour Strategic Income | 7,395,423 | 9,979,817 | ||||||
SSI Alternative Income utilized $2,442,060 in short-term capital loss carryforwards during the year ending June 30, 2019. The ability to utilize capital loss carryforwards in the future may be limited under the Internal Revenue Code and related regulations based on the results of future transactions.
8. Investment Transactions
The aggregate cost of purchases and proceeds from sales and maturities of investments, other than short-term obligations, for the period ended June 30, 2019 were as follows:
Fund | Purchases (non-U.S. Government Securities) | Purchases of U.S. Government Securities | Sales (non-U.S. Government Securities) | Sales of U.S. Government Securities | ||||||||||||
SSI Alternative Income | $ | 63,655,154 | $ | – | $ | 113,439,341 | $ | – | ||||||||
TwentyFour Strategic Income | 63,380,755 | 56,909,418 | 83,272,188 | 64,715,751 | ||||||||||||
58
American Beacon FundsSM
Notes to Financial Statements
June 30, 2019
A summary of the Funds’ transactions in the USG Select Fund for the period ended June 30, 2019 were as follows:
Fund | Type of Transaction | June 30, 2018 Shares/Fair Value | Purchases | Sales | June 30, 2019 Shares/Fair Value | Dividend Income | ||||||||||||||||||||||||||||||||||||
| SSI Alternative Income | Direct | $ | - | * | $ | 40,864,756 | $ | 17,719,646 | $ | 23,145,110 | $ | 54,312 | ||||||||||||||||||||||||||||||
| TwentyFour Strategic Income | Direct | 392,064 | 55,444,730 | 54,516,982 | 1,319,812 | 52,176 | ||||||||||||||||||||||||||||||||||||
| * | Beginning balance is May 20, 2019. |
9. Borrowing Arrangements
Effective November 15, 2018 (the “Effective Date”), the Funds, along with certain other funds managed by the Manager (“Participating Funds”), entered into a committed revolving line of credit (the “Committed Line”) agreement with State Street Bank and Trust Company (the “Bank”) to be used to facilitate portfolio liquidity. The maximum borrowing amount under the Committed Line is $250 million with interest at a rate equal to the higher of(a) one-month London Inter-Bank Offered Rate (“LIBOR”) plus 1.25% per annum or (b) the Federal Funds rate plus 1.25% per annum on amounts borrowed. Each of the Participating Funds will pay a closing fee of $100,000 on the Effective Date and a quarterly commitment fee at a rate of 0.25% per annum on the unused portion of the Committed Line amount. The Committed Line expires November 14, 2019, unless extended by the Bank or terminated by the Participating Funds in accordance with the agreement.
On the Effective Date, the Funds, along with certain other Participating Funds managed by the Manager, also entered into an uncommitted discretionary demand revolving line of credit (the “Uncommitted Line”) agreement with the Bank to be used to facilitate portfolio liquidity. The maximum borrowing amount under the Uncommitted Line is $50 million with interest at a rate equal to the higher of(a) one-month LIBOR plus 1.25% per annum or (b) the Federal Funds rate plus 1.25% per annum on each outstanding loan. Each of the Participating Funds will pay a closing fee of $35,000 on the Effective Date. The Uncommitted Line expires November 14, 2019 unless extended by the Bank or terminated by the Participating Funds in accordance with the agreement.
The Participating Funds paid administration, legal and arrangement fees, which are recognized as a component of “Other expenses” on the Statements of Operations, along with commitment fees, that have been allocated among the Participating Funds based on average daily net assets.
During the period ended June 30, 2019, the Funds did not utilize this facility.
10. Capital Share Transactions
The tables below summarize the activity in capital shares for each Class of the Funds:
| Institutional Class | ||||||||||||||||||||||||||||||||||||||||||||
| May 20, 2019A - June 30, 2019 | ||||||||||||||||||||||||||||||||||||||||||||
SSI Alternative Income Fund | Shares | Amount | ||||||||||||||||||||||||||||||||||||||||||
| Shares sold | 9,833 | $ | 100,000 | |||||||||||||||||||||||||||||||||||||||||
| Reinvestment of dividends | - | - | ||||||||||||||||||||||||||||||||||||||||||
| Shares redeemed | - | - | ||||||||||||||||||||||||||||||||||||||||||
|
|
|
| |||||||||||||||||||||||||||||||||||||||||
| Net increase in shares outstanding | 9,833 | $ | 100,000 | |||||||||||||||||||||||||||||||||||||||||
|
|
|
| |||||||||||||||||||||||||||||||||||||||||
59
American Beacon FundsSM
Notes to Financial Statements
June 30, 2019
| Y Class | ||||||||||||||||||||||||||||||||||||||||||||
| Period Ended June 30, 2019 | Year Ended March 31, 2019 | Year Ended March 31, 2018 | ||||||||||||||||||||||||||||||||||||||||||
SSI Alternative Income Fund | Shares | Amount | Shares | Amount | Shares | Amount | ||||||||||||||||||||||||||||||||||||||
| Shares sold | 701,747 | $ | 7,117,392 | 7,957,248 | $ | 79,355,790 | 4,835,178 | $ | 48,362,683 | |||||||||||||||||||||||||||||||||||
| Reinvestment of dividends | - | - | 462,665 | 4,588,864 | 482,824 | 4,810,765 | ||||||||||||||||||||||||||||||||||||||
| Shares redeemed | (6,172,159 | ) | (62,841,558 | ) | (8,630,606 | ) | (86,477,727 | ) | (7,392,795 | ) | (74,062,724 | ) | ||||||||||||||||||||||||||||||||
|
|
|
|
|
|
|
|
|
|
|
| |||||||||||||||||||||||||||||||||
| Net increase (decrease) in shares outstanding | (5,470,412 | ) | $ | (55,724,166 | ) | (210,693 | ) | $ | (2,533,073 | ) | (2,074,793 | ) | $ | (20,889,276 | ) | |||||||||||||||||||||||||||||
|
|
|
|
|
|
|
|
|
|
|
| |||||||||||||||||||||||||||||||||
| Investor Class | ||||||||||||||||||||||||||||||||||||||||||||
| Period Ended June 30, 2019 | Year Ended March 31, 2019 | Year Ended March 31, 2018 | ||||||||||||||||||||||||||||||||||||||||||
SSI Alternative Income Fund | Shares | Amount | Shares | Amount | Shares | Amount | ||||||||||||||||||||||||||||||||||||||
| Shares sold | 19,211 | $ | 195,507 | 31,207 | $ | 313,345 | 85,255 | $ | 853,863 | |||||||||||||||||||||||||||||||||||
| Reinvestment of dividends | - | - | 3,246 | 32,371 | 5,790 | 57,725 | ||||||||||||||||||||||||||||||||||||||
| Shares redeemed | (11,550 | ) | (117,640 | ) | (297,247 | ) | (2,977,870 | ) | (212,341 | ) | (2,128,087 | ) | ||||||||||||||||||||||||||||||||
|
|
|
|
|
|
|
|
|
|
|
| |||||||||||||||||||||||||||||||||
| Net increase (decrease) in shares outstanding | 7,661 | $ | 77,867 | (262,794 | ) | $ | (2,632,154 | ) | (121,296 | ) | $ | (1,216,499 | ) | |||||||||||||||||||||||||||||||
|
|
|
|
|
|
|
|
|
|
|
| |||||||||||||||||||||||||||||||||
| Institutional Class | ||||||||||||||||||||||||||||||||||||||||||||
| Year Ended June 30, 2019 | Year Ended June 30, 2018 | |||||||||||||||||||||||||||||||||||||||||||
TwentyFour Strategic Income Fund | Shares | Amount | Shares | Amount | ||||||||||||||||||||||||||||||||||||||||
| Shares sold | 127,229 | $ | 1,275,666 | 649,311 | $ | 6,639,277 | ||||||||||||||||||||||||||||||||||||||
| Reinvestment of dividends | 146,814 | 1,440,934 | 4,769 | 48,595 | ||||||||||||||||||||||||||||||||||||||||
| Issued in Reorganization | 4,054,363 | 40,388,350 | - | - | ||||||||||||||||||||||||||||||||||||||||
| Shares redeemed | (4,093,529 | ) | (40,753,632 | ) | (22,755 | ) | (232,211 | ) | ||||||||||||||||||||||||||||||||||||
|
|
|
|
|
|
|
| |||||||||||||||||||||||||||||||||||||
| Net increase in shares outstanding | 234,877 | $ | 2,351,318 | 631,325 | $ | 6,455,661 | ||||||||||||||||||||||||||||||||||||||
|
|
|
|
|
|
|
| |||||||||||||||||||||||||||||||||||||
| Y Class | ||||||||||||||||||||||||||||||||||||||||||||
| Year Ended June 30, 2019 | Year Ended June 30, 2018 | |||||||||||||||||||||||||||||||||||||||||||
TwentyFour Strategic Income Fund | Shares | Amount | Shares | Amount | ||||||||||||||||||||||||||||||||||||||||
| Shares sold | 1,691,016 | $ | 16,773,603 | 2,531,698 | $ | 25,874,346 | ||||||||||||||||||||||||||||||||||||||
| Reinvestment of dividends | 167,939 | 1,658,061 | 26,631 | 272,222 | ||||||||||||||||||||||||||||||||||||||||
| Issued in Reorganization | 925,963 | 9,207,495 | - | - | ||||||||||||||||||||||||||||||||||||||||
| Shares redeemed | (1,216,828 | ) | (11,983,051 | ) | (408,046 | ) | (4,171,937 | ) | ||||||||||||||||||||||||||||||||||||
|
|
|
|
|
|
|
| |||||||||||||||||||||||||||||||||||||
| Net increase in shares outstanding | 1,568,090 | $ | 15,656,108 | 2,150,283 | $ | 21,974,631 | ||||||||||||||||||||||||||||||||||||||
|
|
|
|
|
|
|
| |||||||||||||||||||||||||||||||||||||
| Investor Class | ||||||||||||||||||||||||||||||||||||||||||||
| Year Ended June 30, 2019 | Year Ended June 30, 2018 | |||||||||||||||||||||||||||||||||||||||||||
TwentyFour Strategic Income Fund | Shares | Amount | Shares | Amount | ||||||||||||||||||||||||||||||||||||||||
| Shares sold | 41,921 | $ | 417,210 | 122,804 | $ | 1,255,181 | ||||||||||||||||||||||||||||||||||||||
| Reinvestment of dividends | 7,825 | 76,834 | 2,994 | 30,565 | ||||||||||||||||||||||||||||||||||||||||
| Issued in Reorganization | 310,870 | 3,077,148 | - | - | ||||||||||||||||||||||||||||||||||||||||
| Shares redeemed | (347,339 | ) | (3,410,547 | ) | (22,576 | ) | (227,720 | ) | ||||||||||||||||||||||||||||||||||||
|
|
|
|
|
|
|
| |||||||||||||||||||||||||||||||||||||
| Net increase in shares outstanding | 13,277 | $ | 160,645 | 103,222 | $ | 1,058,026 | ||||||||||||||||||||||||||||||||||||||
|
|
|
|
|
|
|
| |||||||||||||||||||||||||||||||||||||
| A Class | ||||||||||||||||||||||||||||||||||||||||||||
| October 29, 2018A to June 30, 2019 | ||||||||||||||||||||||||||||||||||||||||||||
TwentyFour Strategic Income Fund | Shares | Amount |
|
| ||||||||||||||||||||||||||||||||||||||||
| Shares sold | 471,100 | $ | 4,648,441 | |||||||||||||||||||||||||||||||||||||||||
| Reinvestment of dividends | 13,532 | 132,650 | ||||||||||||||||||||||||||||||||||||||||||
| Issued in Reorganization | 165,011 | 1,633,201 | ||||||||||||||||||||||||||||||||||||||||||
| Shares redeemed | (32,291 | ) | (317,909 | ) | ||||||||||||||||||||||||||||||||||||||||
|
|
|
| |||||||||||||||||||||||||||||||||||||||||
| Net increase in shares outstanding | 617,352 | $ | 6,096,383 | |||||||||||||||||||||||||||||||||||||||||
|
|
|
| |||||||||||||||||||||||||||||||||||||||||
60
American Beacon FundsSM
Notes to Financial Statements
June 30, 2019
| C Class | ||||||||||||||||||||||||||||||||||||||||||||
| October 29, 2018A to June 30, 2019 | ||||||||||||||||||||||||||||||||||||||||||||
TwentyFour Strategic Income Fund | Shares | Amount | ||||||||||||||||||||||||||||||||||||||||||
| Shares sold | 41,748 | $ | 418,229 | |||||||||||||||||||||||||||||||||||||||||
| Reinvestment of dividends | 4,390 | 42,846 | ||||||||||||||||||||||||||||||||||||||||||
| Issued in Reorganization | 152,546 | 1,509,474 | ||||||||||||||||||||||||||||||||||||||||||
| Shares redeemed | (35,060 | ) | (345,851 | ) | ||||||||||||||||||||||||||||||||||||||||
|
|
|
| |||||||||||||||||||||||||||||||||||||||||
| Net increase in shares outstanding | 163,624 | $ | 1,624,698 | |||||||||||||||||||||||||||||||||||||||||
|
|
|
| |||||||||||||||||||||||||||||||||||||||||
| Ultra Class | ||||||||||||||||||||||||||||||||||||||||||||
| Year Ended June 30, 2019 | Year Ended June 30, 2018 | |||||||||||||||||||||||||||||||||||||||||||
TwentyFour Strategic Income Fund | Shares | Amount | Shares | Amount | ||||||||||||||||||||||||||||||||||||||||
| Shares sold | - | $ | - | 145,914 | $ | 1,500,000 | ||||||||||||||||||||||||||||||||||||||
| Reinvestment of dividends | 49,657 | 492,466 | 51,654 | 529,543 | ||||||||||||||||||||||||||||||||||||||||
| Shares redeemed | - | - | (775,775 | ) | (8,000,000 | ) | ||||||||||||||||||||||||||||||||||||||
|
|
|
|
|
|
|
| |||||||||||||||||||||||||||||||||||||
| Net increase in shares outstanding | 49,657 | $ | 492,466 | (578,207 | ) | $ | (5,970,457 | ) | ||||||||||||||||||||||||||||||||||||
|
|
|
|
|
|
|
| |||||||||||||||||||||||||||||||||||||
A Commencement of operations.
11. Subsequent Events
Management has evaluated subsequent events for possible recognition or disclosure in the financial statements through the date the financial statements are issued. Management has determined that there are no material events that would require disclosure in the Funds’ financial statements through this date.
61
American Beacon SSI Alternative Income FundSM
Financial Highlights
(For a share outstanding throughout the period)
| Institutional Class | ||||
| May 20, 2019A to June 30, 2019# | ||||
Net asset value, beginning of period | $ | 10.17 | ||
|
| |||
Income (loss) from investment operations: | ||||
Net investment income | 0.03 | |||
Net gains on investments (both realized and unrealized) | 0.07 | |||
|
| |||
Total income (loss) from investment operations | 0.10 | |||
|
| |||
Net asset value, end of period | $ | 10.27 | ||
|
| |||
Total returnB | 0.98 | %E | ||
|
| |||
Ratios and supplemental data: |
| |||
Net assets, end of period | $ | 100,976 | ||
Ratios to average net assets: | ||||
Expenses, before reimbursements | 2.76 | %C | ||
Expenses, net of reimbursements | 1.83 | %C D | ||
Net investment income, before expense reimbursements | 1.41 | %C | ||
Net investment income, net of reimbursements | 2.34 | %C | ||
Portfolio turnover rate | 20 | % | ||
| # | Fiscal year end changed from March 31st to June 30th. |
| A | Commencement of operations. |
| B | Based on net asset value, which does not reflect the sales charge, redemption fee, or contingent deferred sales charge, if applicable. May include adjustments in accordance with U.S. GAAP and as such, the net asset value for reporting purposes and the returns based upon those net asset values may differ from the net asset value and returns for shareholder transactions. |
| C | Annualized. |
| D | Includesnon-operating expenses consisting of prime broker fees, dividends and interest expense from securities sold short. The Expenses, net of reimbursements, excludingnon-operating expenses is 1.49% for the period ended June 30, 2019. |
| E | Not annualized. |
See accompanying notes
62
American Beacon SSI Alternative Income FundSM
Financial Highlights
(For a share outstanding throughout the period)
| Y ClassA | ||||||||||||||||||||||||||||||||||||||||||||
April 1, June 30, | Year Ended March 31, | |||||||||||||||||||||||||||||||||||||||||||
| 2019 | 2018 | 2017 | 2016 | 2015 | ||||||||||||||||||||||||||||||||||||||||
|
| |||||||||||||||||||||||||||||||||||||||||||
Net asset value, beginning of period | $ | 10.12 | $ | 10.04 | $ | 9.90 | $ | 9.33 | $ | 9.94 | $ | 10.30 | ||||||||||||||||||||||||||||||||
|
|
|
|
|
|
|
|
|
|
|
| |||||||||||||||||||||||||||||||||
Income (loss) from investment operations: | ||||||||||||||||||||||||||||||||||||||||||||
Net investment income | 0.08 | 0.20 | B | 0.19 | B | 0.21 | B | 0.20 | B | 0.07 | B | |||||||||||||||||||||||||||||||||
Net gains (losses) on investments (both realized and unrealized) | 0.07 | 0.07 | 0.13 | 0.49 | (0.51 | ) | (0.20 | ) | ||||||||||||||||||||||||||||||||||||
|
|
|
|
|
|
|
|
|
|
|
| |||||||||||||||||||||||||||||||||
Total income (loss) from investment operations | 0.15 | 0.27 | 0.32 | 0.70 | (0.31 | ) | (0.13 | ) | ||||||||||||||||||||||||||||||||||||
|
|
|
|
|
|
|
|
|
|
|
| |||||||||||||||||||||||||||||||||
Less distributions: | ||||||||||||||||||||||||||||||||||||||||||||
Dividends from net investment income | - | (0.19 | ) | (0.18 | ) | (0.13 | ) | (0.30 | ) | (0.06 | ) | |||||||||||||||||||||||||||||||||
Distributions from net realized gains | - | - | - | - | - | (0.17 | ) | |||||||||||||||||||||||||||||||||||||
|
|
|
|
|
|
|
|
|
|
|
| |||||||||||||||||||||||||||||||||
Total distributions | - | (0.19 | ) | (0.18 | ) | (0.13 | ) | (0.30 | ) | (0.23 | ) | |||||||||||||||||||||||||||||||||
|
|
|
|
|
|
|
|
|
|
|
| |||||||||||||||||||||||||||||||||
Net asset value, end of period | $ | 10.27 | $ | 10.12 | $ | 10.04 | $ | 9.90 | $ | 9.33 | $ | 9.94 | ||||||||||||||||||||||||||||||||
|
|
|
|
|
|
|
|
|
|
|
| |||||||||||||||||||||||||||||||||
Total return | 1.48 | %GH | 2.71 | %C | 3.28 | %C | 7.54 | %C | (3.19 | )%C | (1.25 | )%C | ||||||||||||||||||||||||||||||||
|
|
|
|
|
|
|
|
|
|
|
| |||||||||||||||||||||||||||||||||
Ratios and supplemental data: |
| |||||||||||||||||||||||||||||||||||||||||||
Net assets, end of period | $ | 227,279,618 | $ | 279,429,760 | $ | 281,239,955 | $ | 295,950,357 | $ | 263,248,666 | $ | 439,338,571 | ||||||||||||||||||||||||||||||||
Ratios to average net assets: | ||||||||||||||||||||||||||||||||||||||||||||
Expenses, before reimbursements | 2.14 | %D | 1.79 | %E | 1.76 | %E | 2.06 | %E | 2.10 | %E | 2.09 | %E | ||||||||||||||||||||||||||||||||
Expenses, net of reimbursements | 1.71 | %D F | 1.79 | %E | 1.76 | %E | 2.06 | %E | 2.09 | %E | 2.11 | %E | ||||||||||||||||||||||||||||||||
Net investment income, before expense reimbursements | 1.81 | %D | 1.99 | % | 1.85 | % | 2.12 | % | 2.04 | % | 0.70 | % | ||||||||||||||||||||||||||||||||
Net investment income, net of reimbursements | 2.24 | %D | 1.99 | % | 1.85 | % | 2.12 | % | 2.05 | % | 0.68 | % | ||||||||||||||||||||||||||||||||
Portfolio turnover rate | 20 | %G | 76 | % | 52 | % | 54 | % | 66 | % | 104 | % | ||||||||||||||||||||||||||||||||
| # | Fiscal year end changed from March 31st to June 30th. |
| A | On May 17, 2019, Class I was re-designated as Y Class. |
| B | Based on average shares outstanding for the period. |
| C | Total returns would have been lower/higher had expenses not been waived/recovered by the Advisor. Returns shown do not reflect the deduction of taxes that shareholder would pay on Fund distributions or the redemption of Fund shares. |
| D | Annualized. |
| E | If interest expense, dividends on securities sold short and shareholder servicing fees had been excluded, the expense ratios would have been lowered by 0.30%, 0.27%, 0.57%, 0.60%, and 0.62% for the periods ended March 31, respectively. |
| F | Includesnon-operating expenses consisting of prime broker fees, dividends and interest expense from securities sold short. The Expenses, net of reimbursements, excludingnon-operating expenses is 1.54% for the period ended June 30, 2019. |
| G | Not annualized. |
| H | Based on net asset value, which does not reflect the sales charge, redemption fee, or contingent deferred sales charge, if applicable. May include adjustments in accordance with U.S. GAAP and as such, the net asset value for reporting purposes and the returns based upon those net asset values may differ from the net asset value and returns for shareholder transactions. |
See accompanying notes
63
American Beacon SSI Alternative Income FundSM
Financial Highlights
(For a share outstanding throughout the period)
| Investor ClassA | ||||||||||||||||||||||||||||||||||||||||||||
April 1, June 30, | Year Ended March 31, | |||||||||||||||||||||||||||||||||||||||||||
| 2019 | 2018 | 2017 | 2016 | 2015 | ||||||||||||||||||||||||||||||||||||||||
|
| |||||||||||||||||||||||||||||||||||||||||||
Net asset value, beginning of period | $ | 10.13 | $ | 10.04 | $ | 9.90 | $ | 9.32 | $ | 9.93 | $ | 10.29 | ||||||||||||||||||||||||||||||||
|
|
|
|
|
|
|
|
|
|
|
| |||||||||||||||||||||||||||||||||
Income (loss) from investment operations: | ||||||||||||||||||||||||||||||||||||||||||||
Net investment income | 0.03 | 0.17 | B | 0.16 | B | 0.18 | B | 0.17 | B | 0.04 | B | |||||||||||||||||||||||||||||||||
Net gains (losses) on investments (both realized and unrealized) | 0.11 | 0.07 | 0.13 | 0.50 | (0.51 | ) | (0.18 | ) | ||||||||||||||||||||||||||||||||||||
|
|
|
|
|
|
|
|
|
|
|
| |||||||||||||||||||||||||||||||||
Total income (loss) from investment operations | 0.14 | 0.24 | 0.29 | 0.68 | (0.34 | ) | (0.14 | ) | ||||||||||||||||||||||||||||||||||||
|
|
|
|
|
|
|
|
|
|
|
| |||||||||||||||||||||||||||||||||
Less distributions: | ||||||||||||||||||||||||||||||||||||||||||||
Dividends from net investment income | - | (0.15 | ) | (0.15 | ) | (0.10 | ) | (0.27 | ) | (0.05 | ) | |||||||||||||||||||||||||||||||||
Distributions from net realized gains | - | - | - | - | - | (0.17 | ) | |||||||||||||||||||||||||||||||||||||
|
|
|
|
|
|
|
|
|
|
|
| |||||||||||||||||||||||||||||||||
Total distributions | - | (0.15 | ) | (0.15 | ) | (0.10 | ) | (0.27 | ) | (0.22 | ) | |||||||||||||||||||||||||||||||||
|
|
|
|
|
|
|
|
|
|
|
| |||||||||||||||||||||||||||||||||
Net asset value, end of period | $ | 10.27 | $ | 10.13 | $ | 10.04 | $ | 9.90 | $ | 9.32 | $ | 9.93 | ||||||||||||||||||||||||||||||||
|
|
|
|
|
|
|
|
|
|
|
| |||||||||||||||||||||||||||||||||
Total return | 1.38 | %G H | 2.47 | %C | 2.99 | %C | 7.33 | %C | (3.51 | )%C | (1.40 | )%C | ||||||||||||||||||||||||||||||||
|
|
|
|
|
|
|
|
|
|
|
| |||||||||||||||||||||||||||||||||
Ratios and supplemental data: |
| |||||||||||||||||||||||||||||||||||||||||||
Net assets, end of period | $ | 946,784 | $ | 856,300 | $ | 1,256,917 | $ | 4,639,463 | $ | 6,669,496 | $ | 14,719,862 | ||||||||||||||||||||||||||||||||
Ratios to average net assets: | ||||||||||||||||||||||||||||||||||||||||||||
Expenses, before reimbursements | 2.39 | %D | 2.04 | %E | 2.01 | %E | 2.31 | %E | 2.35 | %E | 2.34 | %E | ||||||||||||||||||||||||||||||||
Expenses, net of reimbursements | 1.98 | %D F | 2.04 | %E | 2.01 | %E | 2.31 | %E | 2.34 | %E | 2.36 | %E | ||||||||||||||||||||||||||||||||
Net investment income, before expense reimbursements | 1.62 | %D | 1.74 | % | 1.60 | % | 1.87 | % | 1.79 | % | 0.45 | % | ||||||||||||||||||||||||||||||||
Net investment income, net of reimbursements | 2.04 | %D | 1.74 | % | 1.60 | % | 1.87 | % | 1.80 | % | 0.43 | % | ||||||||||||||||||||||||||||||||
Portfolio turnover rate | 20 | %G | 76 | % | 52 | % | 54 | % | 66 | % | 104 | % | ||||||||||||||||||||||||||||||||
| # | Fiscal year end changed from March 31st to June 30th. |
| A | On May 17, 2019, Class A was re-designated as Investor Class. |
| B | Based on average shares outstanding for the period. |
| C | Total returns would have been lower/higher had expenses not been waived/recovered by the Advisor. Returns shown do not include payment of sales load of 5.75% of offering price which is reduced on sales of $50,000 or more. These returns include Rule12b-1 fees of up to 0.25% and do not reflect the deduction of taxes that a shareholder would pay on Fund distributions or the redemption of Fund shares. |
| D | Annualized. |
| E | If interest expense, dividends on securities sold short and shareholder servicing fees had been excluded, the expense ratios would have been lowered by 0.30%, 0.27%, 0.57%, 0.60%, and 0.62% for the periods ended March 31, respectively. |
| F | Includesnon-operating expenses consisting of prime broker, dividends and interest expense from securities sold short. The Expenses, net of reimbursements, excludingnon-operating expenses is 1.81% for the period ended June 30, 2019. |
| G | Not annualized. |
| H | Based on net asset value, which does not reflect the sales charge, redemption fee, or contingent deferred sales charge, if applicable. May include adjustments in accordance with U.S. GAAP and as such, the net asset value for reporting purposes and the returns based upon those net asset values may differ from the net asset value and returns for shareholder transactions. |
See accompanying notes
64
American Beacon TwentyFour Strategic Income FundSM
Financial Highlights
(For a share outstanding throughout the period)
| Institutional Class | ||||||||||||||||||||
| Year Ended June 30, | April 3, 2017A to June 30, 2017 | |||||||||||||||||||
| 2019 | 2018 | |||||||||||||||||||
|
| |||||||||||||||||||
Net asset value, beginning of period | $ | 10.07 | $ | 10.17 | $ | 10.00 | ||||||||||||||
|
|
|
|
|
| |||||||||||||||
Income (loss) from investment operations: | ||||||||||||||||||||
Net investment income | 0.43 | B | 0.44 | 0.20 | ||||||||||||||||
Net gains (losses) on investments (both realized and unrealized) | 0.27 | (0.09 | ) | 0.06 | ||||||||||||||||
|
|
|
|
|
| |||||||||||||||
Total income (loss) from investment operations | 0.70 | 0.35 | 0.26 | |||||||||||||||||
|
|
|
|
|
| |||||||||||||||
Less distributions: | ||||||||||||||||||||
Dividends from net investment income | (0.52 | ) | (0.45 | ) | - | |||||||||||||||
Distributions from net realized gains | (0.01 | ) | - | - | ||||||||||||||||
Tax return of capitalC | - | - | (0.09 | ) | ||||||||||||||||
|
|
|
|
|
| |||||||||||||||
Total distributions | (0.53 | ) | (0.45 | ) | (0.09 | ) | ||||||||||||||
|
|
|
|
|
| |||||||||||||||
Net asset value, end of period | $ | 10.24 | $ | 10.07 | $ | 10.17 | ||||||||||||||
|
|
|
|
|
| |||||||||||||||
Total returnE | 7.27 | % | 3.49 | % | 2.58 | %D | ||||||||||||||
|
|
|
|
|
| |||||||||||||||
Ratios and supplemental data: | ||||||||||||||||||||
Net assets, end of period | $ | 8,968,940 | $ | 6,460,768 | $ | 102,562 | ||||||||||||||
Ratios to average net assets: | ||||||||||||||||||||
Expenses, before reimbursements | 1.22 | % | 1.74 | % | 9.14 | %F | ||||||||||||||
Expenses, net of reimbursements | 0.72 | % | 0.72 | % | 0.72 | %F | ||||||||||||||
Net investment income (loss), before expense reimbursements | 3.81 | % | 3.22 | % | (3.68 | )%F | ||||||||||||||
Net investment income, net of reimbursements | 4.31 | % | 4.24 | % | 4.74 | %F | ||||||||||||||
Portfolio turnover rate | 198 | % | 135 | % | 27 | %D | ||||||||||||||
| A | Commencement of operations. |
| B | Per share amounts have been calculated using the average shares method. |
| C | Tax return of capital is calculated based on shares outstanding at the time of distribution. |
| D | Not annualized. |
| E | Based on net asset value, which does not reflect the sales charge, redemption fee, or contingent deferred sales charge, if applicable. May include adjustments in accordance with U.S. GAAP and as such, the net asset value for reporting purposes and the returns based upon those net asset values may differ from the net asset value and returns for shareholder transactions. |
| F | Annualized. |
See accompanying notes
65
American Beacon TwentyFour Strategic Income FundSM
Financial Highlights
(For a share outstanding throughout the period)
| Y Class | ||||||||||||||||||||
| Year Ended June 30, | April 3, 2017A to June 30, 2017 | |||||||||||||||||||
| 2019 | 2018 | |||||||||||||||||||
|
| |||||||||||||||||||
Net asset value, beginning of period | $ | 10.06 | $ | 10.16 | $ | 10.00 | ||||||||||||||
|
|
|
|
|
| |||||||||||||||
Income (loss) from investment operations: | ||||||||||||||||||||
Net investment income | 0.42 | 0.46 | 0.11 | |||||||||||||||||
Net gains (losses) on investments (both realized and unrealized) | 0.27 | (0.11 | ) | 0.14 | ||||||||||||||||
|
|
|
|
|
| |||||||||||||||
Total income (loss) from investment operations | 0.69 | 0.35 | 0.25 | |||||||||||||||||
|
|
|
|
|
| |||||||||||||||
Less distributions: | ||||||||||||||||||||
Dividends from net investment income | (0.52 | ) | (0.45 | ) | - | |||||||||||||||
Distributions from net realized gains | (0.01 | ) | - | - | ||||||||||||||||
Tax return of capitalB | - | - | (0.09 | ) | ||||||||||||||||
|
|
|
|
|
| |||||||||||||||
Total distributions | (0.53 | ) | (0.45 | ) | (0.09 | ) | ||||||||||||||
|
|
|
|
|
| |||||||||||||||
Net asset value, end of period | $ | 10.22 | $ | 10.06 | $ | 10.16 | ||||||||||||||
|
|
|
|
|
| |||||||||||||||
Total returnD | 7.18 | % | 3.49 | % | 2.48 | %C | ||||||||||||||
|
|
|
|
|
| |||||||||||||||
Ratios and supplemental data: | ||||||||||||||||||||
Net assets, end of period | $ | 38,664,428 | $ | 22,277,957 | $ | 657,411 | ||||||||||||||
Ratios to average net assets: | ||||||||||||||||||||
Expenses, before reimbursements | 1.42 | % | 1.78 | % | 7.64 | %E | ||||||||||||||
Expenses, net of reimbursements | 0.82 | % | 0.82 | % | 0.82 | %E | ||||||||||||||
Net investment income (loss), before expense reimbursements | 3.60 | % | 3.25 | % | (2.94 | )%E | ||||||||||||||
Net investment income, net of reimbursements | 4.20 | % | 4.21 | % | 3.88 | %E | ||||||||||||||
Portfolio turnover rate | 198 | % | 135 | % | 27 | %C | ||||||||||||||
| A | Commencement of operations. |
| B | Tax return of capital is calculated based on shares outstanding at the time of distribution. |
| C | Not annualized. |
| D | Based on net asset value, which does not reflect the sales charge, redemption fee, or contingent deferred sales charge, if applicable. May include adjustments in accordance with U.S. GAAP and as such, the net asset value for reporting purposes and the returns based upon those net asset values may differ from the net asset value and returns for shareholder transactions. |
| E | Annualized. |
See accompanying notes
66
American Beacon TwentyFour Strategic Income FundSM
Financial Highlights
(For a share outstanding throughout the period)
| Investor Class | ||||||||||||||||||||
| Year Ended June 30, | April 3, 2017A to June 30, 2017 | |||||||||||||||||||
| 2019 | 2018 | |||||||||||||||||||
|
| |||||||||||||||||||
Net asset value, beginning of period | $ | 10.02 | $ | 10.16 | $ | 10.00 | ||||||||||||||
|
|
|
|
|
| |||||||||||||||
Income (loss) from investment operations: | ||||||||||||||||||||
Net investment income | 0.38 | 0.43 | 0.14 | |||||||||||||||||
Net gains (losses) on investments (both realized and unrealized) | 0.27 | (0.12 | ) | 0.11 | ||||||||||||||||
|
|
|
|
|
| |||||||||||||||
Total income (loss) from investment operations | 0.65 | 0.31 | 0.25 | |||||||||||||||||
|
|
|
|
|
| |||||||||||||||
Less distributions: | ||||||||||||||||||||
Dividends from net investment income | (0.51 | ) | (0.45 | ) | - | |||||||||||||||
Distributions from net realized gains | (0.01 | ) | - | - | ||||||||||||||||
Tax return of capitalB | - | - | (0.09 | ) | ||||||||||||||||
|
|
|
|
|
| |||||||||||||||
Total distributions | (0.52 | ) | (0.45 | ) | (0.09 | ) | ||||||||||||||
|
|
|
|
|
| |||||||||||||||
Net asset value, end of period | $ | 10.15 | $ | 10.02 | $ | 10.16 | ||||||||||||||
|
|
|
|
|
| |||||||||||||||
Total returnD | 6.84 | % | 3.09 | % | 2.48 | %C | ||||||||||||||
|
|
|
|
|
| |||||||||||||||
Ratios and supplemental data: | ||||||||||||||||||||
Net assets, end of period | $ | 1,422,906 | $ | 1,271,611 | $ | 240,201 | ||||||||||||||
Ratios to average net assets: | ||||||||||||||||||||
Expenses, before reimbursements | 1.69 | % | 2.16 | % | 10.00 | %E | ||||||||||||||
Expenses, net of reimbursements | 1.09 | % | 1.09 | % | 1.09 | %E | ||||||||||||||
Net investment income (loss), before expense reimbursements | 3.30 | % | 2.89 | % | (4.86 | )%E | ||||||||||||||
Net investment income, net of reimbursements | 3.90 | % | 3.96 | % | 4.06 | %E | ||||||||||||||
Portfolio turnover rate | 198 | % | 135 | % | 27 | %C | ||||||||||||||
| A | Commencement of operations. |
| B | Tax return of capital is calculated based on shares outstanding at the time of distribution. |
| C | Not annualized. |
| D | Based on net asset value, which does not reflect the sales charge, redemption fee, or contingent deferred sales charge, if applicable. May include adjustments in accordance with U.S. GAAP and as such, the net asset value for reporting purposes and the returns based upon those net asset values may differ from the net asset value and returns for shareholder transactions. |
| E | Annualized. |
See accompanying notes
67
American Beacon TwentyFour Strategic Income FundSM
Financial Highlights
(For a share outstanding throughout the period)
| A Class | ||||
| October 29, 2018A to June 30, 2019 | ||||
|
| |||
Net asset value, beginning of period | $ | 9.95 | ||
|
| |||
Income (loss) from investment operations: | ||||
Net investment income | 0.33 | |||
Net gains on investments (both realized and unrealized) | 0.26 | |||
|
| |||
Total income (loss) from investment operations | 0.59 | |||
|
| |||
Less distributions: | ||||
Dividends from net investment income | (0.37 | ) | ||
Distributions from net realized gains | (0.01 | ) | ||
|
| |||
Total distributions | (0.38 | ) | ||
|
| |||
Net asset value, end of period | $ | 10.16 | ||
|
| |||
Total returnC | 6.18 | %B | ||
|
| |||
Ratios and supplemental data: | ||||
Net assets, end of period | $ | 6,270,835 | ||
Ratios to average net assets: | ||||
Expenses, before reimbursements | 1.78 | %D | ||
Expenses, net of reimbursements | 1.12 | %D | ||
Net investment income, before expense reimbursements | 3.30 | %D | ||
Net investment income, net of reimbursements | 3.96 | %D | ||
Portfolio turnover rate | 198 | % | ||
| A | Commencement of operations. |
| B | Not annualized. |
| C | Based on net asset value, which does not reflect the sales charge, redemption fee, or contingent deferred sales charge, if applicable. May include adjustments in accordance with U.S. GAAP and as such, the net asset value for reporting purposes and the returns based upon those net asset values may differ from the net asset value and returns for shareholder transactions. |
| D | Annualized. |
See accompanying notes
68
American Beacon TwentyFour Strategic Income FundSM
Financial Highlights
(For a share outstanding throughout the period)
| C Class | ||||
| October 29, 2018A to June 30, 2019 | ||||
|
| |||
Net asset value, beginning of period | $ | 9.95 | ||
|
| |||
Income (loss) from investment operations: | ||||
Net investment income | 0.24 | |||
Net gains on investments (both realized and unrealized) | 0.30 | |||
|
| |||
Total income (loss) from investment operations | 0.54 | |||
|
| |||
Less distributions: | ||||
Dividends from net investment income | (0.34 | ) | ||
Distributions from net realized gains | (0.01 | ) | ||
|
| |||
Total distributions | (0.35 | ) | ||
|
| |||
Net asset value, end of period | $ | 10.14 | ||
|
| |||
Total returnB | 5.63 | %C | ||
|
| |||
Ratios and supplemental data: | ||||
Net assets, end of period | $ | 1,659,229 | ||
Ratios to average net assets: | ||||
Expenses, before reimbursements | 2.58 | %D | ||
Expenses, net of reimbursements | 1.87 | %D | ||
Net investment income, before expense reimbursements | 2.50 | %D | ||
Net investment income, net of reimbursements | 3.20 | %D | ||
Portfolio turnover rate | 198 | % | ||
| A | Commencement of operations. |
| B | Based on net asset value, which does not reflect the sales charge, redemption fee, or contingent deferred sales charge, if applicable. May include adjustments in accordance with U.S. GAAP and as such, the net asset value for reporting purposes and the returns based upon those net asset values may differ from the net asset value and returns for shareholder transactions. |
| C | Not annualized. |
| D | Annualized. |
See accompanying notes
69
American Beacon TwentyFour Strategic Income FundSM
Financial Highlights
(For a share outstanding throughout the period)
| Ultra | ||||||||||||||||||||
| Year Ended June 30, | April 3, 2017A to June 30, 2017 | |||||||||||||||||||
| 2019 | 2018 | |||||||||||||||||||
|
| |||||||||||||||||||
Net asset value, beginning of period | $ | 10.08 | $ | 10.17 | $ | 10.00 | ||||||||||||||
|
|
|
|
|
| |||||||||||||||
Income from investment operations: | ||||||||||||||||||||
Net investment income | 0.44 | 0.47 | 0.21 | |||||||||||||||||
Net gains (losses) on investments (both realized and unrealized) | 0.26 | (0.11 | ) | 0.05 | ||||||||||||||||
|
|
|
|
|
| |||||||||||||||
Total income (loss) from investment operations | 0.70 | 0.36 | 0.26 | |||||||||||||||||
|
|
|
|
|
| |||||||||||||||
Less distributions: | ||||||||||||||||||||
Dividends from net investment income | (0.52 | ) | (0.45 | ) | - | |||||||||||||||
Distributions from net realized gains | (0.01 | ) | - | - | ||||||||||||||||
Tax return of capitalB | - | - | (0.09 | ) | ||||||||||||||||
|
|
|
|
|
| |||||||||||||||
Total distributions | (0.53 | ) | (0.45 | ) | (0.09 | ) | ||||||||||||||
|
|
|
|
|
| |||||||||||||||
Net asset value, end of period | $ | 10.25 | $ | 10.08 | $ | 10.17 | ||||||||||||||
|
|
|
|
|
| |||||||||||||||
Total returnC | 7.27 | % | 3.59 | % | 2.58 | %D | ||||||||||||||
|
|
|
|
|
| |||||||||||||||
Ratios and supplemental data: | ||||||||||||||||||||
Net assets, end of period | $ | 9,784,614 | $ | 9,114,222 | $ | 15,077,638 | ||||||||||||||
Ratios to average net assets: | ||||||||||||||||||||
Expenses, before reimbursements | 1.32 | % | 1.73 | % | 4.61 | %E | ||||||||||||||
Expenses, net of reimbursements | 0.67 | % | 0.67 | % | 0.69 | %E | ||||||||||||||
Net investment income, before expense reimbursements | 3.69 | % | 3.41 | % | 0.84 | %E | ||||||||||||||
Net investment income, net of reimbursements | 4.33 | % | 4.48 | % | 4.77 | %E | ||||||||||||||
Portfolio turnover rate | 198 | % | 135 | % | 27 | %D | ||||||||||||||
| A | Commencement of operations. |
| B | Return of capital is calculated based on shares outstanding at the time of distribution. |
| C | Based on net asset value, which does not reflect the sales charge, redemption fee, or contingent deferred sales charge, if applicable. May include adjustments in accordance with U.S. GAAP and as such, the net asset value for reporting purposes and the returns based upon those net asset values may differ from the net asset value and returns for shareholder transactions. |
| D | Not annualized. |
| E | Annualized. |
See accompanying notes
70
Federal Tax Information
June 30, 2019 (Unaudited)
Certain tax information regarding the Funds are required to be provided to shareholders based upon the Fund’s income and distributions for the taxable year ended June 30, 2019. The information and distributions reported herein may differ from information and distributions taxable to the shareholders for the calendar year ended December 31, 2018.
The Fund designated the following items with regard to distributions paid during the fiscal year ended June 30, 2019. All designations are based on financial information available as of this annual report and, accordingly, are subject to change. For each item, it is the intention of the Funds to designate the maximum amount permitted under the Internal Revenue Code of 1986, as amended, and the regulations there under.
Corporate Dividends-Received Deduction:
SSI Alternative Income Fund | 32.38 | % | ||
TwentyFour Strategic Income Fund | 0.00 | % |
Qualified Dividend Income:
SSI Alternative Income Fund | 32.50 | % | ||
TwentyFour Strategic Income Fund | 0.00 | % |
Long-Term Capital Gain Distributions:
SSI Alternative Income Fund | - | |||
TwentyFour Strategic Income Fund | $ | 16,331 |
Short-Term Capital Gain Distributions:
SSI Alternative Income Fund | - | |||
TwentyFour Strategic Income Fund | $ | 123,642 |
Shareholders will receive notification in January 2020 of the applicable tax information necessary to prepare their 2019 income tax returns.
71
Disclosure Regarding Approval of the Management and Investment
Advisory Agreements for the SSI Alternative Income Fund(Unaudited)
At its November5-6, 2018, March5-6, 2019, and May 9, 2019 meetings, the Board of Trustees (“Board” or “Trustees”) considered:
(1) the approval of the Management Agreement between American Beacon Advisors, Inc. (“Manager”) and the American Beacon Funds (“Trust”), on behalf of the American Beacon SSI Alternative Income Fund (“Fund”), a newly created series of the Trust;
(2) the approval of a new investment advisory agreement (“Initial Agreement”) among the Manager, the Trust, on behalf of the Fund, and SSI Investment Management, Inc. (“SSI Inc.”);
(3) the approval of a new investment advisory agreement at the March5-6, 2019 meetings (“March Agreement”) among the Manager, the Trust, on behalf of the Fund, and SSI Investment Management, LLC (“SSI LLC”), a newly formed limited liability company that is 99% owned by SSI Inc.; and
(4) the approval of a new investment advisory agreement at the May 9, 2019 meeting (“May Agreement”) among the Manager, the Trust, on behalf of the Fund, and SSI LLC.
Approval of the Management Agreement
Prior to the November5-6, 2018 meetings, information was provided to the Board by the Manager in response to requests from the Board in connection with the Board’s consideration of the Management Agreement for the Fund. The Investment Committee of the Board also met with representatives of the Manager. The Board also considered information that had been provided by the Manager to the Board at the May 18, 2018 and June5-6, 2018 Board meetings in connection with the review of the current Management Agreement between the Manager and the Trust as it related to the existing series of the Trust (“Existing Funds”).
Provided below is an overview of the primary factors the Board considered at its November5-6, 2018 meetings at which the Board considered the approval of the Management Agreement with respect to the Fund. In determining whether to approve the Management Agreement, the Board considered, among other things, the following factors with respect to the Fund: (1) the nature and quality of the services to be provided; (2) the estimated costs to be incurred by the Manager in rendering its services to the Fund and the resulting profits or losses; (3) the extent to which economies of scale, if any, have been taken into account in setting the fee schedule; (4) whether fee levels reflect economies of scale, if any, for the benefit of investors; (5) comparisons of services and fees with contracts entered into by the Manager with the Existing Funds; and (6) any other benefits derived or anticipated to be derived by the Manager from its relationship with the Fund.
The Board did not identify any particular information that was most relevant to its consideration of the Management Agreement, and each Trustee may have afforded different weight to the various factors. Legal counsel to the Independent Trustees provided the Board with a memorandum regarding its responsibilities pertaining to the approval of investment advisory contracts, such as the Management Agreement. The memorandum explained the regulatory requirements surrounding the Trustees’ process for evaluating investment advisors and the terms of investment advisory contracts.
Nature, Extent and Quality of Services.The Board considered that it had reviewed the Management Agreement between the Manager and the Trust as it relates to the Existing Funds at its May 18, 2018 and June5-6, 2018 meetings. At those meetings, the Board received detailed information regarding the Manager, including information with respect to the scope of services provided by the Manager to the Existing Funds and the background and experience of the Manager’s key investment personnel. The Board also considered representations made by the Manager at the Board’s May 18, 2018 and June5-6, 2018 meetings. At those meetings, the Manager described its disciplined investment approach and goal to provide above average long-term performance on behalf of the Existing Funds and detailed the culture of compliance and support that reduces risks to the Existing Funds. The Board considered the Manager’s representation that the advisory, administrative and related services proposed
72
Disclosure Regarding Approval of the Management and Investment
Advisory Agreements for the SSI Alternative Income Fund(Unaudited)
to be provided to the Fund will be consistent with the services provided to the Existing Funds that have a single investment subadvisor. In addition, the Board considered the background and experience of key investment personnel who will have primary responsibility for theday-to-day oversight of the Fund. Based on the foregoing information, the Board concluded that the nature, extent and quality of the services to be provided by the Manager were appropriate for the Fund.
Investment Performance.The Board considered that the Fund is new and, therefore, had no historical performance for the Board to review with respect to the Manager. The Board also considered that it would review the historical investment performance record relevant to the Fund’s investment professionals in connection with its consideration of the Initial Agreement.
Costs of the Services Provided to the Fund and the Profits or Losses to be Realized by the Manager from its Relationship with the Fund.In analyzing the cost of services and profitability of the Manager, the Board considered the estimated revenues to be earned and the expenses to be incurred by the Manager with respect to the Fund. The Board also considered that the Manager will receive certain fees related to securities lending, to the extent the Fund engages in securities lending activities. The Board then considered that, at assumed estimated initial asset levels, the Manager was projected to earn apre-tax profit before and after distribution revenues and expenses from its first year of rendering services to the Fund. The Board also considered the amounts of those projected profits. The Board considered the Manager’s explanation regarding its cost allocation methodology in calculating these projections.
Comparisons of the amounts to be paid to the Manager under the Management Agreement and other funds in the Select Peer Group. In evaluating the Management Agreement, the Board reviewed the Manager’s proposed management fee schedule. The Board considered a comparison of the management fee rate to be charged by the Manager under the Management Agreement versus the fee rates charged by the Manager to comparable funds. The Board considered the Manager’s representation that the management fee rate proposed by the Manager for the Fund is lower than the average advisory fee rate paid by peer group funds in the Fund’s potential Morningstar, Inc. (“Morningstar”) category (the “Select Peer Group”), and that when combined with the proposed advisory fee rate to be paid to SSI Inc., the proposed management fee rate is higher than the average advisory fee rate paid by peer group funds in the Select Peer Group. The Board also considered that the Fund’s total expense ratio is expected to be lower than the median of the Select Peer Group with respect to the Institutional Class, and that expense ratios were not available for the Select Peer Group with respect to the Y Class and Investor Class. The Board considered that the Fund’s total expense ratio is expected to be lower than the total expense ratio of a registered investment company managed by SSI Inc. that the Manager and SSI Inc. are proposing be reorganized into the Fund (the “Prior Fund”) with respect to the Y Class, and slightly higher than the total expense ratio of the Prior Fund with respect to the Investor Class. The Board also considered that the Prior Fund does not have an Institutional Class. The Board considered that the Manager had contractually agreed to limit the Fund’s total expenses through at least October 28, 2020, at competitive market levels, which are above industry averages with respect to the Institutional Class, and lower than the net expense ratios of the Prior Fund with respect to the Y Class and Investor Class. This information assisted the Board in concluding that the management fee rate appeared to be within a reasonable range for the services to be provided to the Fund, in light of all the factors considered.
Economies of Scale.The Board considered the Manager’s representation that the proposed management fee rate for the Fund contains breakpoints, which the Manager believes properly reflect economies of scale for the benefit of the Fund’s shareholders.
Benefits Derived from the Relationship with the Fund.The Board considered the Manager’s representation that it has not identified any material indirect“fall-out” benefits that may accrue to it or its affiliates because of its proposed relationship with the Fund, except that the Manager will benefit from the Fund’s investment of its cash sweep accounts and securities lending collateral in the American Beacon U.S. Government Money Market Select Fund, a series of the American Beacon Select Funds. The Board also considered the Manager’s representation that its parent company is expected to acquire an ownership interest in the Fund’s proposed
73
Disclosure Regarding Approval of the Management and Investment
Advisory Agreements for the SSI Alternative Income Fund(Unaudited)
subadvisor, and that the Manager may benefit to the extent that the subadvisor’s growth contributes to the growth of the Manager’s parent company. Based on the foregoing information, the Board concluded that the potential benefits accruing to the Manager by virtue of its relationship with the Fund appear to be fair and reasonable.
Board’s Conclusion. Based on the various considerations described above, the Board, including a majority of Trustees who are not “interested persons” of the Fund or the Manager, as that term is defined in the Investment Company Act of 1940, as amended (“1940 Act”): (1) concluded that the proposed management fee is fair and reasonable with respect to the Fund; (2) determined that the Fund and its shareholders were expected to benefit from the Manager’s management of the Fund; and (3) approved the Management Agreement on behalf of the Fund.
Approval of the Initial Agreement
Prior to the November5-6, 2018 meetings, information was provided to the Board by SSI Inc. in response to requests from the Board and/or the Manager in connection with the Board’s consideration of the Initial Agreement. The Investment Committee of the Board also met with representatives of SSI Inc..
Provided below is an overview of the primary factors the Board considered at its November5-6, 2018 meetings at which the Board considered the approval of the Initial Agreement. In determining whether to approve the Initial Agreement, the Board considered, among other things, the following factors: (1) the nature and quality of the services to be provided; (2) the prior investment performance of a composite of similar accounts managed by SSI Inc. (the “Composite”), as well as the prior investment performance of the Prior Fund; (3) the extent to which economies of scale, if any, have been taken into account in setting the fee schedule; (4) whether fee levels reflect these economies of scale, if any, for the benefit of investors; (5) comparisons of services and fees with contracts entered into by SSI Inc. with other clients; and (6) any other benefits anticipated to be derived by SSI Inc. from its relationship with the Fund.
The Board did not identify any particular information that was most relevant to its consideration of the Initial Agreement, and each Trustee may have afforded different weight to the various factors. Legal counsel to the Independent Trustees provided the Board with a memorandum regarding its responsibilities pertaining to the approval of investment advisory contracts, such as the Initial Agreement. The memorandum explained the regulatory requirements surrounding the Trustees’ process for evaluating investment advisors and the terms of investment advisory contracts.
Nature, extent and quality of the services to be provided by SSI Inc. The Board considered information regarding SSI Inc.’s principal business activities, financial condition and overall capabilities to perform the services under the Initial Agreement. In addition, the Board considered the background and experience of the personnel who will be assigned responsibility for managing the Fund. The Board also considered SSI Inc.’s investment resources, infrastructure and the adequacy of its compliance program. The Board also took into consideration the Manager’s recommendation of SSI Inc. The Board considered SSI Inc.’s representation regarding the strength of its financial condition and that its current staffing levels were adequate to service the Fund. Based on this information, the Board concluded that the nature, extent and quality of the advisory services to be provided by SSI Inc. were appropriate for the Fund in light of its investment objective, and, thus, supported a decision to approve the Initial Agreement.
Performance of SSI Inc. The Board evaluated the information provided by SSI Inc. and the Manager regarding the performance of the Composite and the Prior Fund relative to the performance of an appropriate benchmark index and the funds included in the Select Peer Group. The Board considered representations made by SSI Inc. and the Manager that, for various periods ended August 31, 2018 and September 30, 2018, the relative performance of the Composite and Prior Fund was favorable. Based on the foregoing information, the Board concluded that the historical investment performance record of SSI Inc. supported approval of the Initial Agreement.
74
Disclosure Regarding Approval of the Management and Investment
Advisory Agreements for the SSI Alternative Income Fund(Unaudited)
Comparisons of the amounts to be paid under the Initial Agreement with those under contracts between SSI Inc. and its other clients. In evaluating the Initial Agreement, the Board reviewed the proposed advisory fee rate for services to be performed by SSI Inc. on behalf of the Fund. The Board considered that SSI Inc.’s investment advisory fee rate under the Initial Agreement would be paid to SSI Inc. by the Fund. The Board considered SSI Inc.’s representation that the advisory fee rate proposed for the Fund is favorable compared to other comparable client accounts. After evaluating this information, the Board concluded that SSI Inc.’s advisory fee rate under the Initial Agreement was reasonable in light of the services to be provided to the Fund.
Costs of the services to be provided and profits to be realized by SSI Inc. and its affiliates from itsrelationship with the Fund. The Board considered SSI Inc.’s representation that, at assumed estimated initial asset levels, SSI Inc. believes that it will earn a profit with respect to the services that it provides to the Fund during the Fund’s first year of operations. The Board also considered the amount of the projected profit.
Economies of Scale. The Board considered SSI Inc.’s representation that it believes that the proposed advisory fee schedule for the Fund, which includes breakpoints, reflects economies of scale for the benefit of the Fund’s investors.
Benefits to be derived by SSI Inc. from its relationship with the Fund. The Board considered SSI Inc.’s representation that it may benefit from soft dollar arrangements that may accrue to it or its affiliates because of SSI Inc.’s relationship with the Fund. Based on the foregoing information, the Board concluded that the potential benefits accruing to SSI Inc. by virtue of its relationship with the Fund appear to be fair and reasonable.
Board’s Conclusion. Based on the various considerations described above, the Board, including a majority of Trustees who are not “interested persons” of the Fund, the Manager or SSI Inc., as that term is defined in the 1940 Act, concluded that the proposed investment advisory fee rate is fair and reasonable and the approval of the Initial Agreement is in the best interests of the Fund and approved the Initial Agreement.
Approval of the March Agreement
At its March5-6, 2019 meetings, the Board considered that, at its November5-6, 2018 meetings, the Board approved: (1) the Initial Agreement and (2) an Agreement and Plan of Reorganization and Termination which provides for the reorganization of a registered investment company for which SSI Inc. serves as subadvisor into the Fund (the “Reorganization”). At those meetings, the Board was advised that, subsequent to the November5-6, 2018 meetings, the Manager’s parent company, Resolute Investment Managers, Inc., entered into an agreement to acquire a majority interest in SSI LLC (“Acquisition”), to which SSI Inc. would transfer its business in an internal restructuring approximately two weeks prior to the Acquisition (“Restructuring”).
At its March5-6, 2019 meetings, the Board was advised that SSI LLC would become the Fund’s subadvisor pursuant to the March Agreement if the Reorganization occurred concurrently with or after the Acquisition. The Board was further advised that, if the Reorganization occurred before the Acquisition, SSI Inc. would become the Fund’s subadvisor pursuant to the Initial Agreement, but that the Acquisition would constitute a change of control of SSI Inc. that would result in the automatic termination of the Initial Agreement.
The Board considered that it had received and reviewed information from the Manager and SSI Inc. at meetings held on November5-6, 2018 in connection with the review of the Initial Agreement. The Board considered the Manager’s representation that, other than certain internal changes at SSI Inc. associated with the Acquisition, there had been no material changes to the information regarding SSI Inc. that the Board reviewed at its prior meetings and that none of the responses provided by and with respect to SSI Inc. in connection with the Board’s review of the Initial Agreement would differ with respect to SSI LLC. In connection with its consideration of the March Agreement, the Board considered that, with the exception of the date and the identity of the subadvisor, (1) the March Agreement would contain the same terms and conditions as the Initial Agreement, and (2) the services provided to the Fund and the fee rate paid by the Fund under the March Agreement would be
75
Disclosure Regarding Approval of the Management and Investment
Advisory Agreements for the SSI Alternative Income Fund(Unaudited)
identical to those under the Initial Agreement. The Board also considered that the individuals who were expected to provide portfolio management services to the Fund under the March Agreement were the same as the individuals who were expected to provide portfolio management services to the Fund under the Initial Agreement.
Based on the foregoing considerations, the Board, including a majority of Trustees who are not “interested persons” of the Fund, the Manager, SSI Inc. or SSI LLC, as that term is defined in the Investment Company Act of 1940, as amended, concluded that the approval of the March Agreement was in the best interests of the Fund and approved the March Agreement.
Approval of the May Agreement
At its May 9, 2019 meeting, the Board was advised that the Acquisition was scheduled to occur after the Reorganization, but that SSI Inc. had already completed the Restructuring. Accordingly, the Board was informed that it would be necessary for the Manager and the Trust, on behalf of the Fund, to enter into the May Agreement with SSI LLC and that, after the Acquisition, the May Agreement would terminate and the Manager and the Trust, on behalf of the Fund, would enter into the March Agreement with SSI LLC.
The Board considered that it had received and reviewed information from the Manager and SSI Inc. at meetings held on November5-6, 2018 in connection with the review of the Initial Agreement, and at meetings held on March5-6, 2019 in connection with the review of the March Agreement. The Board considered the Manager’s representation that, other than certain internal changes at SSI Inc. associated with the Acquisition, there had been no material changes to the information regarding SSI Inc. that the Board reviewed at its prior meetings and that none of the responses provided by and with respect to SSI Inc. in connection with the Board’s review of the Initial Agreement would differ with respect to SSI LLC. In connection with its consideration of the May Agreement, the Board considered that, with the exception of the date and the identity of the subadvisor, (1) the May Agreement would contain the same terms and conditions as the Initial Agreement and March Agreement, and (2) the services provided to the Fund and the fee rate paid by the Fund under the May Agreement would be identical to the Initial Agreement and the March Agreement. The Board also considered that the individuals who were expected to provide portfolio management services to the Fund under the May Agreement were the same as the individuals who were expected to provide portfolio management services to the Fund under the Initial Agreement and March Agreement.
Based on the foregoing considerations, the Board, including a majority of Trustees who are not “interested persons” of the Fund, the Manager, SSI Inc. or SSI LLC, as that term is defined in the Investment Company Act of 1940, as amended, concluded that the approval of the May Agreement was in the best interests of the Fund and approved the May Agreement.
76
Disclosure Regarding Approval of the Management and Investment
Advisory Agreements for the TwentyFour Strategic Income Fund(Unaudited)
Atin-person meetings held on May 9, 2019 and June4-5, 2019 (collectively, the “Meetings”), the Board of Trustees (“Board” or “Trustees”) considered and then, at its June 5, 2019 meeting, approved the renewal of:
(1) the Management Agreement between American Beacon Advisors, Inc. (“Manager”) and the American Beacon Funds (“Trust”), on behalf of the American Beacon TwentyFour Strategic Income Fund (“Fund”); and
(2) the Investment Advisory Agreement among the Manager, TwentyFour Asset Management (US), LP (the “subadvisor”), and the Trust, on behalf of the Fund.
The Management Agreement and the Investment Advisory Agreement are referred to herein individually as an “Agreement” and collectively as the “Agreements.” In preparation for its consideration of the renewal of the Agreements, the Board undertook steps to gather and consider information furnished by the Manager, the subadvisor, Broadridge, Inc. (“Broadridge”) and Morningstar, Inc. (“Morningstar”). The Board, with the assistance of independent legal counsel, requested and received certain relevant information from the Manager and the subadvisor.
In advance of the Meetings, the Board’s Investment Committee and/or the Manager coordinated the production of information from Broadridge and Morningstar regarding the performance, fees and expenses of the Fund as well as information from the Manager and the subadvisor. At the Meetings, the Board considered the information provided in connection with the renewal process, as well as information furnished to the Board throughout the year at regular meetings of the Board and its committees. In connection with the Board’s consideration of the Agreements, the Board received and evaluated such information as they deemed necessary. This information is described below in the section summarizing the factors the Board considered in connection with its renewal and approval of the Agreements, as well as the section describing additional Board considerations with respect to the Fund.
The Board noted that the Manager provides management and administrative services to the Fund pursuant to the Management Agreement. The Board considered that many mutual funds have separate contracts governing each type of service and observed that, with respect to such mutual funds, the actual management fee rates provided by Broadridge for peer group funds reflect the combined advisory and administrative expenses, reduced by any fee waivers and/or reimbursements.
A firm may not have been able to, or opted not to, provide information in response to certain information requests, in which case the Board conducted its evaluation of the firm based on information that was provided. In such cases, the Board determined that the omission of any such information was not material to its considerations. The class of shares used for comparative performance purposes was the share class with the lowest expenses available for purchase by the general public, which was the Institutional Class. The Board also considered that the use of Institutional Class performance generally facilitates a meaningful comparison for expense and performance purposes.
Provided below is an overview of certain factors the Board considered in connection with its renewal and approval of the Agreements. The Board did not identify any particular information that was most relevant to its consideration to renew or approve each Agreement, and each Trustee may have afforded different weight to the various factors. Legal counsel to the independent Trustees provided the Board with a memorandum regarding its responsibilities pertaining to the renewal and approval of investment advisory contracts, such as the Agreements. The memorandum explained the regulatory requirements surrounding the Board’s process for evaluating investment advisors and the terms of investment advisory contracts. Based on its evaluation, the Board unanimously concluded that the terms of each Agreement were reasonable and fair and that the renewal and approval of each Agreement was in the best interests of the Fund and its shareholders.
77
Disclosure Regarding Approval of the Management and Investment
Advisory Agreements for the TwentyFour Strategic Income Fund(Unaudited)
Considerations With Respect to the Renewal of the Management Agreement and the Investment Advisory Agreement
In determining whether to renew the Agreements, the Board considered the Fund’s investment management and subadvisory relationships separately. In each instance, the Board considered, among other things, the following factors: (1) the nature, extent and quality of the services provided; (2) the investment performance of the Fund; (3) the costs incurred by the Manager in rendering services to the Fund and its resulting profits or losses; (4) comparisons of services and fee rates with contracts entered into by the Manager or the subadvisor or their affiliates with other clients (such as pension funds and other institutional clients); (5) the extent to which economies of scale, if any, have been taken into account in setting each fee rate schedule; (6) whether fee rate levels reflect economies of scale, if any, for the benefit of Fund investors; and (7) any other benefits derived or anticipated to be derived by the Manager or the subadvisor from their relationships with the Fund.
Nature, Extent and Quality of Services.With respect to the renewal of the Management Agreement, the Board considered, among other factors: the Fund’s performance since its inception on April 3, 2017; the length of service of key investment personnel at the Manager; the cost structure of the Fund; the Manager’s culture of compliance and support that reduce risks to the Fund; the Manager’s quality of services; the Manager’s active role in monitoring and, as appropriate, recommending additional or replacement subadvisors; and the Manager’s efforts to retain key employees and maintain staffing levels.
With respect to the renewal of the Investment Advisory Agreement, the Board considered the level of staffing and the size of the subadvisor. The Board also considered the adequacy of the resources committed to the Fund by the subadvisor, and whether those resources were commensurate with the needs of the Fund and are sufficient to sustain appropriate levels of performance and compliance needs. In this regard, the Board considered the financial stability of the subadvisor. The Board also considered the subadvisor’s representations regarding its compliance program and code of ethics. Based on the foregoing information, the Board concluded that the nature, extent and quality of the management and advisory services provided by the Manager and the subadvisor were appropriate for the Fund.
Investment Performance.The Board evaluated the comparative information provided by Broadridge and the Manager regarding the performance of the Fund relative to its Broadridge performance universe, Morningstar Category, and/or benchmark index, as well as the Fund’s Morningstar rating. The Board considered the information provided by Broadridge regarding Broadridge’s independent methodology for selecting the Fund’s Broadridge performance universe. The Board also considered that the performance universes selected by Broadridge may not provide appropriate comparisons for the Fund. In addition, the Board considered the performance reports and discussions with management at Board and Committee meetings throughout the year. The Board also evaluated the comparative information provided by the subadvisor regarding the performance of the Fund relative to the performance of a comparable investment account managed by the subadvisor and an appropriate peer group for the Fund. In addition, the Board considered the Manager’s recommendation to continue to retain the subadvisor. A discussion regarding the Board’s considerations with respect to the Fund’s performance appears below under “Additional Considerations and Conclusions with Respect to the Fund.”
Costs of the Services Provided to the Fund and the Profits Realized by the Manager from its Relationship with the Fund.In analyzing the cost of services and profitability of the Manager, the Board considered the revenues earned and the expenses incurred by the Manager, before and after the payment of distribution-related expenses by the Manager. The profits or losses were noted at both an aggregate level for all funds within the group of mutual funds sponsored by the Manager (the “Fund Complex”) and at an individual Fund level, with the Manager sustaining a loss before and after the payment of distribution-related expenses by the Manager for the Fund. The Board also considered comparative information provided by the Manager regarding the Manager’s overall profitability with respect to the Fund Complex relative to the overall profitability of other firms in the mutual fund industry, as disclosed in publicly available sources. Although the Board noted that, in certain cases, the fee rates paid by other clients of the Manager are lower than the fee rates paid by the Fund, the Manager represented that,
78
Disclosure Regarding Approval of the Management and Investment
Advisory Agreements for the TwentyFour Strategic Income Fund(Unaudited)
among other matters, the difference is attributable to the fact that the Manager does not perform administrative services fornon-investment company clients and reflects the greater level of responsibility and regulatory requirements associated with managing the Fund.
The Board also noted that the Manager proposed to continue the expense waivers and reimbursements for the Fund that were in place during the last fiscal year. The Board further considered that, with respect to the Fund, the Management Agreement provides for the Manager to receive a management fee comprised of an annualized fee that is retained by the Manager. The Board also noted that certain share classes of the Fund maintain higher expense ratios in order to compensate third-party financial intermediaries.
In analyzing the fee rates charged by the subadvisor in connection with its investment advisory services to the Fund, the Board considered representations made by the subadvisor that, although the subadvisor does not have a standard fee schedule, the fee rate for the Fund is below the range of advisory fee rates the subadvisor charges to funds with similar mandates. The Board did not request profitability data from the subadvisor because the Board did not view this data as imperative to its deliberations given thearm’s-length nature of the relationship between the Manager and the subadvisor with respect to the negotiation of subadvisory fee rates. In addition, the Board noted that subadvisor may not account for its profits on anaccount-by-account basis and that different firms likely employ different methodologies in connection with these calculations.
Based on the foregoing information, the Board concluded that the profitability levels of the Manager were reasonable in light of the services performed by the Manager. A discussion regarding the Board’s considerations with respect to the Fund’s fee rates is set forth below under “Additional Considerations and Conclusions with Respect to the Fund.”
Economies of Scale.In considering the reasonableness of the management and investment advisory fees rates, the Board considered whether economies of scale will be realized as the Fund grows and whether fee rate levels reflect these economies of scale for the benefit of Fund shareholders. In this regard, the Board considered that the Manager has negotiated breakpoints for the subadvisory fee rate for the Fund.
In addition, the Board noted the Manager’s representation that the Management Agreement contains fee schedule breakpoints at higher asset levels with respect to the Fund. Based on the foregoing information, the Board concluded that the Manager and subadvisor fee rate schedules for the Fund provide for a reasonable sharing of benefits from any economies of scale with the Fund.
Benefits Derived from the Relationship with the Fund.The Board considered the“fall-out” or ancillary benefits that accrue to the Manager and/or the subadvisor as a result of the advisory relationships with the Fund, including greater exposure in the marketplace with respect to the Manager’s or the subadvisor’s investment process and expanding the level of assets under management by the Manager and the subadvisor. The Board also considered that the Manager may invest the Fund’s cash balances and cash collateral provided by the borrowers of the Fund’s securities in the American Beacon U.S. Government Money Market Select Fund, which the Manager manages directly. Based on the foregoing information, the Board concluded that the potential benefits accruing to the Manager and the subadvisor by virtue of their relationships with the Fund appear to be fair and reasonable.
Additional Considerations and Conclusions with Respect to the Fund
The performance comparisons below were made in comparison to the Fund’s Broadridge performance universe and Morningstar Category. With respect to the Broadridge performance universe, the 1st Quintile represents the top 20 percent of the universe based on performance and the 5th Quintile representing the bottom 20 percent of the universe based on performance. References below to the Fund’s Broadridge performance universe are to the universe of mutual funds with a comparable investment classification/objective included in the analysis provided by Broadridge.
79
Disclosure Regarding Approval of the Management and Investment
Advisory Agreements for the TwentyFour Strategic Income Fund(Unaudited)
The expense comparisons below were made in comparison to the Fund’s Broadridge expense universe and Broadridge expense group, with the 1st Quintile representing the lowest 20 percent of the universe or group based on lowest total expense and the 5th Quintile representing the highest 20 percent of the universe or group based on highest total expense. References below to the Fund’s expense group and expense universe are to the respective group or universe of comparable mutual funds included in the analysis by Broadridge. A Broadridge expense group consists of the Fund and a representative sample of funds with similar operating structures and asset sizes, as selected by Broadridge. A Broadridge expense universe includes all funds in the investment classification/objective with a similar operating structure as the share class of the Fund included in the Broadridge comparative information and provides a broader view of expenses across the Fund’s investment classification/objective. The Board also considered the Fund’s Morningstar fee level category. In reviewing expenses, the Board considered the positive impact of fee waivers where applicable and the Manager’s agreement to continue the fee waivers. In addition, information regarding the subadvisor’s use of soft dollars was requested from the Manager and was considered by the Board.
In considering the renewal of the Management Agreement and the Investment Advisory Agreement with the subadvisor for the Fund, the Board considered the following additional factors:
Broadridge Total Expense Analysis Excluding12b-1 Fees and Morningstar Fee Level Ranking
| Compared to Broadridge Expense Group | 4th Quintile | |
| Compared to Broadridge Expense Universe | 4th Quintile | |
| Morningstar Fee Level Ranking – Institutional Class | Average Expense Ratio | |
Broadridge and Morningstar Performance Analysis(one-year period ended December 31, 2018)
| Compared to Broadridge Performance Universe | 2nd Quintile | |
| Compared to Morningstar Category | 2nd Quintile | |
The Board also considered: (1) information provided by the subadvisor regarding fee rates charged for managing assets in the same or a similar strategy as the subadvisor manages the Fund; (2) that the Fund acquired all of the assets of the American Beacon Flexible Bond Fund, a series of the Beacon Trust, on November 16, 2018; and (3) the Manager’s recommendation to continue to retain the subadvisor based upon, among other factors, the relatively brief period that this Fund has been in operation.
Based on these and other considerations, the Board: (1) concluded that the fees paid to the Manager and the subadvisor under the Management and Investment Advisory Agreements are fair and reasonable; and (2) determined that the Fund and its shareholders would benefit from the Manager’s and subadvisor’s continued management of the Fund.
80
Trustees and Officers of the American Beacon FundsSM(Unaudited)
The Trustees and officers of the American Beacon Funds (the “Trust”) are listed below, together with their principal occupations during the past five years. The address of each person listed below is 220 Las Colinas Boulevard East, Suite 1200, Irving, Texas 75039. Each Trustee oversees thirty-seven funds in the fund complex that includes the Trust, the American Beacon Select Funds, the American Beacon Institutional Funds Trust, the American Beacon Sound Point Enhanced Income Fund and the American Beacon Apollo Total Return Fund. The Trust’s Statement of Additional Information contains additional information about the Trustees and is available without charge by calling1-800-658-5811.
Name, Age and Address | Position, Term of | Principal Occupation(s) During Past 5 Years and Current Directorships | ||
| INTERESTED TRUSTEES | Term | |||
| Lifetime of Trust until removal, resignation or retirement* | ||||
| Alan D. Feld** (82) | Trustee since 1996 | Partner in the law firm of Akin, Gump, Strauss, Hauer & Feld, LLP (law firm) (1960-Present); Trustee, American Beacon Select Funds (1999-Present); Trustee, American Beacon Institutional Funds Trust (2017-Present); Trustee, American Beacon Sound Point Enhanced Income Fund (2018-Present); Trustee, American Beacon Apollo Total Return Fund (2018-Present). | ||
| NON-INTERESTED TRUSTEES | Term | |||
| Lifetime of Trust until removal, resignation or retirement* | ||||
| Gilbert G. Alvarado (49) | Trustee since 2015 | Director, Kura MD, Inc. (local telehealth organization) (2015-present); Vice President & CFO, Sierra Health Foundation (health conversion private foundation) (2006-Present); Vice President & CFO, Sierra Health Foundation: Center for Health Program Management (California public benefit corporation) (2012-Present); Director, Innovative North State (2012-2015); Director, Sacramento Regional Technology Alliance (2011-2016); Director, Women’s Empowerment (2009-2014); Director, Valley Healthcare Staffing (2017-present); Trustee, American Beacon Select Funds (2015-Present); Trustee, American Beacon Institutional Funds Trust (2017-Present); Trustee, American Beacon Sound Point Enhanced Income Fund (2018-Present); Trustee, American Beacon Apollo Total Return Fund (2018-Present). | ||
| Joseph B. Armes (57) | Trustee since 2015 | Chairman & CEO, CSW Industrials f/k/a Capital Southwest Corporation (investment company) (2015-Present); Chairman of the Board of Capital Southwest Corporation, predecessor to CSW Industrials, Inc. (2014-2017) (investment company); CEO, Capital Southwest Corporation (2013-2015); President & CEO, JBA Investment Partners (family investment vehicle) (2010-Present); Director and Chair of Audit Committee, RSP Permian (oil and gas producer) (2013-Present); Trustee, American Beacon Select Funds (2015-Present); Trustee, American Beacon Institutional Funds Trust (2017-Present); Trustee, American Beacon Sound Point Enhanced Income Fund (2018-Present); Trustee, American Beacon Apollo Total Return Fund (2018-Present). | ||
| Gerard J. Arpey (60) | Trustee since 2012 | Director, The Home Depot, Inc. (2015-Present); Partner, Emerald Creek Group (private equity firm) (2011-Present); Director, S.C. Johnson & Son, Inc. (privately held company) (2008-present); Trustee, American Beacon Select Funds (2012-Present); Trustee, American Beacon Institutional Funds Trust (2017-Present); Trustee, American Beacon Sound Point Enhanced Income Fund (2018-Present); Trustee, American Beacon Apollo Total Return Fund (2018-Present). | ||
81
Trustees and Officers of the American Beacon FundsSM(Unaudited)
Name, Age and Address | Position, Term of | Principal Occupation(s) During Past 5 Years and Current Directorships | ||
| NON-INTERESTED TRUSTEES (CONT.) | Term | |||
| Lifetime of Trust until removal, resignation or retirement* | ||||
| Brenda A. Cline (58) | Trustee since 2004 Chair since 2019 Vice Chair 2018 | Chief Financial Officer, Treasurer and Secretary, Kimbell Art Foundation (1993-Present); Director, Tyler Technologies, Inc. (public sector software solutions company) (2014-Present); Director, Range Resources Corporation (oil and natural gas company) (2015-Present); Trustee, CushingClosed-End andOpen-End Funds and ETFs (2017-Present); Trustee, American Beacon Select Funds (2004-Present); Trustee, American Beacon Institutional Funds Trust (2017-Present); Trustee, American Beacon Sound Point Enhanced Income Fund (2018-Present); Trustee, American Beacon Apollo Total Return Fund (2018-Present). | ||
| Eugene J. Duffy (64) | Trustee since 2008 | Managing Director, Global Investment Management Distribution, Mesirow Financial (2016-Present); Managing Director, Institutional Services, Intercontinental Real Estate Corporation (2014-Present); Principal and Executive Vice President, Paradigm Asset Management (1994-2014); Trustee, American Beacon Select Funds (2008-Present); Trustee, American Beacon Institutional Funds Trust (2017-Present); Trustee, American Beacon Sound Point Enhanced Income Fund (2018-Present); Trustee, American Beacon Apollo Total Return Fund (2018-Present). | ||
| Claudia A. Holz (61) | Trustee since 2018 | Partner, KPMG LLP (1990-2017); Trustee, American Beacon Select Funds (2018-Present); Trustee, American Beacon Institutional Funds Trust (2018-Present); Trustee, American Beacon Sound Point Enhanced Income Fund (2018-Present); Trustee, American Beacon Apollo Total Return Fund (2018-Present). | ||
| Douglas A. Lindgren (57) | Trustee since 2018 | CEO North America, Carne Global Financial Services (2016-2017); Managing Director, IPS Investment Management and Global Head, Content Management, UBS Wealth Management (2010-2016); Trustee, American Beacon Select Funds (2018-Present); Trustee, American Beacon Institutional Funds Trust (2018-Present); Trustee, American Beacon Sound Point Enhanced Income Fund (2018-Present); Trustee, American Beacon Apollo Total Return Fund (2018-Present). | ||
| Richard A. Massman (75) | Trustee since 2004 Chair 2008-2018 Chair Emeritus since 2019 | Consultant and General Counsel Emeritus, Hunt Consolidated, Inc. (holding company engaged in oil and gas exploration and production, refining, real estate, farming, ranching and venture capital activities) (2009-Present); Trustee, American Beacon Select Funds (2004-Present); Trustee, American Beacon Institutional Funds Trust (2017-Present); Trustee, American Beacon Sound Point Enhanced Income Fund (2018-Present); Trustee, American Beacon Apollo Total Return Fund (2018-Present). | ||
| Barbara J. McKenna, CFA (56) | Trustee since 2012 | President/Managing Principal, Longfellow Investment Management Company (2005-Present); Trustee, American Beacon Select Funds (2012-Present); Trustee, American Beacon Institutional Funds Trust (2017-Present); Trustee, American Beacon Sound Point Enhanced Income Fund (2018-Present); Trustee, American Beacon Apollo Total Return Fund (2018-Present). | ||
| R. Gerald Turner (73) | Trustee since 2001 | President, Southern Methodist University (1995-Present); Director, J.C. Penney Company, Inc. (1996-Present); Director, Kronus Worldwide Inc. (chemical manufacturing) (2003-Present); Trustee, American Beacon Select Funds (2001-Present); Trustee, American Beacon Institutional Funds Trust (2017-Present); Trustee, American Beacon Sound Point Enhanced Income Fund (2018-Present); Trustee, American Beacon Apollo Total Return Fund (2018-Present). | ||
82
Trustees and Officers of the American Beacon FundsSM(Unaudited)
Name, Age and Address | Position, Term of | Principal Occupation(s) During Past 5 Years and Current Directorships | ||
| OFFICERS | Term | |||
| One Year | ||||
| Gene L. Needles, Jr. (64) | President since 2009 | President (2009-2018), CEO and Director (2009-Present), and Chairman (2018-Present), American Beacon Advisors, Inc., President (2015-2018), Director and CEO (2015-Present), and Chairman (2018-Present), Resolute Investment Holdings, LLC; President (2015-2018), Director and CEO (2015-Present), and Chairman (2018-Present), Resolute Topco, Inc.; President (2015-2018); Director, and CEO (2015-Present), and Chairman (2018-Present), Resolute Acquisition, Inc.; President (2015-2018), Director and CEO (2015-Present), Chairman (2018-Present), Resolute Investment Managers, Inc.; Director, Chairman, President and CEO, Resolute Investment Distributors (2017-Present); Director, Chairman, President and CEO; Resolute Investment Services, Inc. (2017-Present); President and CEO, Lighthouse Holdings Parent, Inc. (2009-2015); President, CEO and Director, Lighthouse Holdings, Inc. (2009-2015); Manager, President and CEO, American Private Equity Management, LLC (2012-Present); Director, Chairman, President and CEO, Alpha Quant Advisors, LLC (2016-Present); Director, ARK Investment Management LLC (2016-Present); Director, Shapiro Capital Management LLC (2017-Present); Director, Chairman and CEO, Continuous Capital, LLC (2018-Present); President, American Beacon Cayman Managed Futures Strategy Fund, Ltd. (2014-Present); Director and President, American Beacon Cayman Transformational Innovation Company, LTD., (2017-2018); President, American Beacon Delaware Transformational Innovation Corporation (2017-2018); President American Beacon Cayman TargetRisk Company, Ltd. (2018-Present); Member, Investment Advisory Committee, Employees Retirement System of Texas (2017-Present); Trustee, American Beacon NextShares Trust (2015-Present); President, American Beacon Select Funds (2009-Present); President, American Beacon Institutional Funds Trust (2017-Present); President, American Beacon Sound Point Enhanced Income Fund (2018-Present); President, American Beacon Apollo Total Return Fund (2018-Present); Director, RSW Investments Holdings LLC, (2019-Present); Director, SSI Investment Management, LLC (2019-Present). | ||
| Rosemary K. Behan (60) | VP, Secretary and Chief Legal Officer since 2006 | Vice President, Secretary and General Counsel, American Beacon Advisors, Inc. (2006-Present); Secretary, Resolute Investment Holdings, LLC (2015-Present); Secretary, Resolute Topco, Inc. (2015-Present); Secretary, Resolute Acquisition, Inc. (2015-Present); Vice President, Secretary and General Counsel, Resolute Investment Managers, Inc. (2015-Present); Secretary, Resolute Investment Distributors, Inc. (2017-Present); Vice President, Secretary and General Counsel, Resolute Investment Services, Inc. (2017-Present); Vice President and Secretary, Lighthouse Holdings Parent, Inc. (2008-2015); Vice President and Secretary, Lighthouse Holdings, Inc. (2008-2015); Secretary, American Private Equity Management, LLC (2008-Present); Secretary and General Counsel, Alpha Quant Advisors, LLC (2016-Present); Vice President and Secretary, Continuous Capital, LLC (2018-Present); Secretary, American Beacon Delaware Transformational Innovation Corporation (2017-2018); Secretary, American Beacon Cayman Transformational Innovation Company, Ltd. (2017-2018); Secretary, American Beacon Cayman Managed Futures Strategy Fund, Ltd. (2014-Present); Secretary, American Beacon Cayman TargetRisk Company, Ltd (2018-Present); Chief Legal Officer, Vice President and Secretary, American Beacon Select Funds (2006-Present); Chief Legal Officer, Vice President and Secretary, American Beacon Institutional Funds Trust (2017-Present); Chief Legal Officer, Vice President and Secretary, American Beacon Sound Point Enhanced Income Fund (2018-Present); Chief Legal Officer, Vice President and Secretary American Beacon Apollo Total Return Fund (2018-Present). | ||
83
Trustees and Officers of the American Beacon FundsSM(Unaudited)
Name, Age and Address | Position, Term of | Principal Occupation(s) During Past 5 Years and Current Directorships | ||
| OFFICERS (CONT.) | Term | |||
| One Year | ||||
| Brian E. Brett (59) | VP since 2004 | Senior Vice President, Head of Distribution (2012-Present), Vice President, Director of Sales (2004-2012), American Beacon Advisors, Inc.; Senior Vice President, Resolute Investment Managers, Inc. (2017-Present); Senior Vice President, Resolute Investment Distributors, Inc. (2018-Present), Senior Vice President, Resolute Investment Services, Inc. (2018-Present); Senior Vice President, Lighthouse Holdings Parent, Inc. (2008-2015); Senior Vice President, Lighthouse Holdings, Inc. (2008-2015); Vice President, American Beacon Select Funds (2004-Present); Vice President, American Beacon Institutional Funds Trust (2017-Present); Vice President American Beacon Sound Point Enhanced Income Fund (2018-Present); Vice President American Beacon Apollo Total Return Fund (2018-Present). | ||
| Paul B. Cavazos (50) | VP since 2016 | Chief Investment Officer and Senior Vice President, American Beacon Advisors, Inc. (2016-Present); Chief Investment Officer, DTE Energy (2007-2016); Vice President, American Private Equity Management, L.L.C. (2017-Present); Vice President, American Beacon Select Funds (2016-Present); Vice President, American Beacon Institutional Funds Trust (2017-Present); Vice President American Beacon Sound Point Enhanced Income Fund (2018-Present);Vice President American Beacon Apollo Total Return Fund (2018-Present). | ||
| Erica Duncan (48) | VP Since 2011 | Vice President, American Beacon Advisors, Inc. (2011-Present); Vice President, Resolute Investment Managers (2018-Present); Vice President, Resolute Investment Services, Inc. (2018-Present); Vice President, American Beacon Select Funds (2011-Present); Vice President, American Beacon Institutional Funds Trust (2017-Present); Vice President American Beacon Sound Point Enhanced Income Fund (2018-Present); Vice President American Beacon Apollo Total Return Fund (2018-Present). | ||
| Melinda G. Heika (58) | Treasurer since 2010 | Treasurer and CFO (2010-Present), American Beacon Advisors, Inc.; Treasurer, Resolute Topco, Inc. (2015-Present); Treasurer, Resolute Investment Holdings, LLC. (2015-Present); Treasurer, Resolute Acquisition, Inc. (2015-Present); Treasurer and CFO, Resolute Investment Managers, Inc. (2017-Present); Treasurer, Resolute Investment Distributors, Inc. (2017-2017); Treasurer and CFO, Resolute Investment Services, Inc. (2015-Present); Treasurer, Lighthouse Holdings Parent Inc., (2010-2015); Treasurer, Lighthouse Holdings, Inc. (2010-2015); Treasurer, American Private Equity Management, LLC (2012-Present); Treasurer and CFO, Alpha Quant Advisors, LLC (2016-Present); Treasurer and CFO, Continuous Capital, LLC (2018-Present); Treasurer, American Beacon Cayman Transformational Innovation, Ltd. (2017-2018); Treasurer, American Beacon Delaware Transformational Innovation Corporation (2017-2018); Director and Treasurer, American Beacon Cayman Managed Futures Strategy Fund, Ltd. (2014-Present); Treasurer, American Beacon Cayman TargetRisk Company, Ltd. (2018-Present); Treasurer, American Beacon Select Funds (2010-Present); Treasurer, American Beacon Institutional Funds Trust (2017-Present); Treasurer, American Beacon Sound Point Enhanced Income Fund (2018-Present); Treasurer, American Beacon Apollo Total Return Fund (2018-Present). | ||
| Terri L. McKinney (55) | VP since 2010 | Vice President (2009-Present), Managing Director (2003-2009), American Beacon Advisors, Inc.; Vice President, Resolute Investment Managers, Inc. (2017-Present); Vice President, Resolute Investment Services, Inc (2018-Present); Vice President, Alpha Quant Advisors, LLC (2016-Present); Vice President, Continuous Capital, LLC (2018-Present); Vice President, American Beacon Select Funds (2010-Present); Vice President, American Beacon Institutional Funds Trust (2017-Present); Vice President, American Beacon Sound Point Enhanced Income Fund (2018-Present); Vice President, American Beacon Apollo Total Return Fund (2018-Present). | ||
84
Trustees and Officers of the American Beacon FundsSM(Unaudited)
Name, Age and Address | Position, Term of | Principal Occupation(s) During Past 5 Years and Current Directorships | ||
| OFFICERS (CONT.) | Term | |||
| One Year | ||||
| Jeffrey K. Ringdahl (44) | VP since 2010 | Director (2015-Present), President (2018-Present), Chief Operating Officer (2010-Present), Senior Vice President (2013-2018), Vice President (2010-2013), American Beacon Advisors, Inc.; Director (2015-Present), President (2018-Present), Senior Vice Present (2015-2018), Resolute Investment Holdings, LLC; Director (2015-Present), President (2018-Present), Senior Vice President (2015-2018), Resolute Topco, Inc.; Director (2015-Present), President (2018-Present), Senior Vice President (2015-2018), Resolute Acquisition, Inc.; Director (2015-Present), President & COO (2018-Present), Senior Vice President (2015-2018), Resolute Investment Managers, Inc.; Director and Executive Vice President (2017-Present), Resolute Investment Distributors, Inc.; Director (2017-Present), President & COO (2018-Present), Executive Vice President (2017-2018), Resolute Investment Services, Inc.; Senior Vice President (2017-Present), Vice President (2012-2017), Manager (2015-Present), American Private Equity Management, LLC; Senior Vice President, Lighthouse Holdings Parent, Inc. (2013-2015); Senior Vice President, Lighthouse Holdings, Inc. (2013-2015); Trustee, American Beacon NextShares Trust (2015-Present); Director, Executive Vice President & COO, Alpha Quant Advisors, LLC (2016-Present); Director, Shapiro Capital Management, LLC (2017-Present); Director, Executive Vice President & COO, Continuous Capital, LLC (2018-Present); Director and Vice President, American Beacon Cayman Transformational Innovation Company, Ltd., (2017-Present); Vice President, American Beacon Delaware Transformational Innovation Corporation (2017-2018); Director and Vice President, American Beacon Cayman Managed Futures Strategy Fund, Ltd. (2014-Present); Vice President, American Beacon Cayman TargetRisk Company, Ltd (2018-Present); Vice President, American Beacon Select Funds (2010-2018); Vice President, American Beacon Institutional Funds Trust (2017-Present); Vice President, American Beacon Sound Point Enhanced Income Fund (2018-Present); Vice President, American Beacon Apollo Total Return Fund (2018-Present); Director, RSW Investments Holdings LLC, (2019-Present); Director, SSI Investment Management, LLC (2019-Present). | ||
| Samuel J. Silver (56) | VP Since 2011 | Vice President (2011-Present), Chief Fixed Income Officer (2016-Present), American Beacon Advisors, Inc. (2011-Present); Vice President, American Beacon Select Funds (2011-Present); Vice President, American Beacon Institutional Funds Trust (2017-Present); Vice President, American Beacon Sound Point Enhanced Income Fund (2018-Present); Vice President, American Beacon Apollo Total Return Fund (2018-Present). | ||
| Christina E. Sears (47) | Chief Compliance Officer since 2004 and Asst. Secretary since 1999 | Vice President, American Beacon Advisors, Inc. (2019-Present); Chief Compliance Officer, American Beacon Advisors, Inc. (2004-Present); Vice President, Resolute Investment Managers, Inc. (2017-Present); Vice President, Resolute Investment Distributors (2017-Present); Vice President, Resolute Investment Services, Inc. (2019-Present); Chief Compliance Officer, American Private Equity Management, LLC (2012-Present); Chief Compliance Officer (2016-2019) and Vice President, Alpha Quant Advisors, LLC (2016-Present); Vice President, Continuous Capital, LLC (2018-Present); Chief Compliance Officer (2004-Present) and Assistant Secretary (1999-Present), American Beacon Select Funds; Chief Compliance Officer and Assistant Secretary, American Beacon Institutional Funds Trust (2017-Present); Chief Compliance Officer and Assistant Secretary, American Beacon Sound Point Enhanced Income Fund (2018-Present); Chief Compliance Officer and Assistant Secretary, American Beacon Apollo Total Return Fund (2018-Present). | ||
85
Trustees and Officers of the American Beacon FundsSM(Unaudited)
Name, Age and Address | Position, Term of | Principal Occupation(s) During Past 5 Years and Current Directorships | ||
| OFFICERS (CONT.) | Term | |||
| One Year | ||||
| Sonia L. Bates (62) | Asst. Treasurer since 2011 | Assistant Treasurer, American Beacon Advisors, Inc. (2011-2018); Assistant Treasurer, Lighthouse Holdings Parent Inc. (2011-2015); Assistant Treasurer, Lighthouse Holdings, Inc. (2011-2015); Assistant Treasurer, American Private Equity Management, LLC (2012-Present); Assistant Treasurer, American Beacon Cayman Transformational Innovation Company, Ltd. (2017-Present); Assistant Treasurer, American Beacon Cayman TargetRisk Company, Ltd. (2018-Present); Assistant Treasurer, American Beacon Select Funds (2011-Present); Assistant Treasurer, American Beacon Institutional Funds Trust (2017-Present); Assistant Treasurer, American Beacon Sound Point Enhanced Income Fund (2018-Present); Assistant Treasurer, American Beacon Apollo Total Return Fund (2018-Present). | ||
| Shelley D. Abrahams (44) | Assistant Secretary since 2008 | Assistant Secretary, American Beacon Select Funds (2008-Present); Assistant Secretary, American Beacon Institutional Funds Trust (2017-Present); Assistant Secretary, American Beacon Sound Point Enhanced Income Fund (2018-Present); Assistant Secretary, American Beacon Apollo Total Return Fund (2018-Present). | ||
| Rebecca L. Harris (52) | Assistant Secretary since 2010 | Vice President, American Beacon Advisors, Inc. (2011-Present); Vice President, Resolute Investment Managers, Inc. (2017-Present); Vice President, Resolute Investment Services (2018-Present); Vice President, Alpha Quant Advisors, LLC (2016-Present); Vice President, Continuous Capital, LLC (2018-Present); Assistant Secretary, American Beacon Select Funds (2010-Present); Assistant Secretary, American Beacon Institutional Funds Trust (2017-Present); Assistant Secretary, American Beacon Sound Point Enhanced Income Fund (2018-Present); Assistant Secretary, American Beacon Apollo Total Return Fund (2018-Present). | ||
| Teresa A. Oxford (60) | Assistant Secretary since 2015 | Assistant Secretary, American Beacon Advisors, Inc. (2015-Present); Assistant Secretary, Resolute Investment Distributors (2018-Present); Assistant Secretary, Resolute Investment Services (2018-Present); Assistant Secretary, Alpha Quant Advisors, LLC (2016-Present); Assistant Secretary, American Beacon Select Funds (2015-Present); Assistant Secretary, American Beacon Institutional Funds Trust (2017-Present); Assistant Secretary, American Beacon Sound Point Enhanced Income Fund (2018-Present); Assistant Secretary, American Beacon Apollo Total Return Fund (2018-Present). | ||
* As of 11/12/2014, the Board adopted a retirement plan that requires Trustees, other than Messrs. Feld and Massman to retire no later than the last day of the calendar year in which they reach the age of 75. As of 11/7/17, the Board approved a waiver of the mandatory retirement policy with respect to Mr. Massman, who turned 75 in November 2018, to permit him to continue to serve on the Board as Chair Emeritus through 12/31/19.
** Mr. Feld is deemed to be an “interested person” of the Trusts, as defined by the 1940 Act. Mr. Feld’s law firm of Akin, Gump, Strauss, Hauer & Feld LLP has provided legal services within the past two fiscal years to one or more of the Trust’ssub-advisors
86
Privacy Policy
June 30, 2019 (Unaudited)
The American Beacon Funds recognize and respect the privacy of our shareholders. We are providing this notice to you so you will understand how shareholder information may be collected and used.
We may collect nonpublic personal information about you from one or more of the following sources:
| • | information we receive from you on applications or other forms; |
| • | information about your transactions with us or our service providers; and |
| • | information we receive from third parties. |
We do not disclose any nonpublic personal information about our customers or former customers to anyone, except as permitted by law.
We restrict access to your nonpublic personal information to those employees or service providers who need to know that information to provide products or services to you. To ensure the confidentiality of your nonpublic personal information, we maintain safeguards that comply with federal standards.
87
This page intentionally left blank.
88

Delivery of Documents
eDelivery isNOW AVAILABLE- Stop traditional mail delivery and receive your
shareholder reports and summary prospectuson-line. Sign up at
www.americanbeaconfunds.com
If you invest in the Fund through a financial institution, you may be able to receive the Fund’s regulatory mailings, such as the Prospectus, Annual Report and Semi-Annual Report, bye-mail. If you are interested in this option, please go towww.icsdelivery.com and search for your financial institution’s name or contact your financial institution directly.
To obtain more information about the Fund:
 |  | |
| ByE-mail: | On the Internet: | |
| american_beacon.funds@ambeacon.com | Visit our website atwww.americanbeaconfunds.com | |
By Telephone: Call (800)658-5811 |
By Mail: American Beacon Funds P.O. Box 219643 Kansas City, MO 64121-9643 | |
| Availability of Quarterly Portfolio Schedules | Availability of Proxy Voting Policy and Records | |
In addition to the Schedule of Investments provided in each semi-annual and annual report, the Fund files a complete schedule of its portfolio holdings with the Securities and Exchange Commission (“SEC”) on FormN-PORT as of the first and third fiscal quarters. The Fund’s FormsN-PORT are available on the SEC’s website atwww.sec.gov. The FormsN-PORT may also be reviewed and copied at the SEC’s Public Reference Section, 100 F Street, NE, Washington, D.C. 20549-2736. Information regarding the operation of the SEC’s Public Reference Room may be obtained by calling(800)-SEC-0330. A complete schedule of the Fund’s portfolio holdings is also available atwww.americanbeaconfunds.com approximately sixty days after the end of each calendar quarter. | A description of the policies and procedures the Fund uses to determine how to vote proxies relating to portfolio securities is available in the Fund’s Statement of Additional Information, is available free of charge on the Fund’s websitewww.americanbeaconfunds.com and by calling1-800-967-9009 or by accessing the SEC’s website atwww.sec.gov. The Fund’s proxy voting record for the most recent year ended June 30 is filed annually with the SEC on FormN-PX. The Fund’s FormsN-PX are available on the SEC’s website atwww.sec.gov. The Fund’s proxy voting record may also be obtained by calling1-800-967-9009. | |


Fund Service Providers:
CUSTODIAN State Street Bank and Trust Company Boston, Massachusetts | TRANSFER AGENT DST Asset Manager Solutions, Inc. Quincy, Massachusetts | INDEPENDENT REGISTERED PUBLIC ACCOUNTING FIRM PricewaterhouseCoopers Boston, Massachusetts | DISTRIBUTOR Resolute Investment Distributors, Inc. Irving, Texas |
This report is prepared for shareholders of the American Beacon Funds and may be distributed to others only if preceded or accompanied by a current Prospectus or Summary Prospectus.
American Beacon Funds, American Beacon SSI Alternative Income Fund and American Beacon TwentyFour Strategic Income Fund are service marks of American Beacon Advisors, Inc.
AR 6/19
| ITEM 2. | CODE OF ETHICS. |
The Trust adopted a code of ethics that applies to its principal executive and financial officers (the “Code”). The Trust amended its code August 19, 2019 to disclose the addition of the American Beacon Sound Point Enhanced Income Fund, American Beacon Apollo Total Return Fund and American Beacon Sound Point Alternative Lending Fund and to disclose a change to limit the value of gifts received by the principal officer or financial officer to $100. The Trust did not grant any waivers to the provisions of the Code during the period covered by the shareholder reports presented in Item 1. The Code is filed herewith as Exhibit 99.CODE ETH.
| ITEM 3. | AUDIT COMMITTEE FINANCIAL EXPERT. |
The Trust’s Board of Trustees has determined that Gilbert G. Alvarado, a member of the Trust’s Audit and Compliance Committee, is an “audit committee financial expert” as defined in Form N-CSR. Mr. Gilbert Alvarado is “independent” as defined in Form N-CSR.
| ITEM 4. | PRINCIPAL ACCOUNTANT FEES AND SERVICES. |
| (a) | ||||
Audit Fees | Fiscal Year Ended | |||
$332,188 | 6/30/2018 | |||
$326,537 | 6/30/2019 | |||
| (b) | ||||
Audit-Related Fees | Fiscal Year Ended | |||
$0 | 6/30/2018 | |||
$0 | 6/30/2019 | |||
| (c) | ||||
Tax Fees | Fiscal Year Ended | |||
$69,725 | 6/30/2018 | |||
$117,829 | 6/30/2019 | |||
| (d) | ||||
All Other Fees | Fiscal Year Ended | |||
$0 | 6/30/2018 | |||
$0 | 6/30/2019 | |||
e)(1) Pursuant to its charter, the Trust’s Audit and Compliance Committee shall have the following duties and powers pertaining topre-approval of audit andnon-audit services provided by the Trust’s principal accountant:
| • | to approve, prior to appointment, the engagement of auditors to annually audit and provide their opinion on the Trusts’ financial statements, and, in connection therewith, reviewing and evaluating matters potentially affecting the independence and capabilities of the auditors; |
| • | to approve, prior to appointment, the engagement of the auditors to providenon-audit services to the Trusts, an investment adviser to any series of the Trusts or any entity controlling, controlled by, or under common control with an investment adviser (“adviser affiliate”) that provides ongoing services to the Trusts, if the engagement relates directly to the operations and financial reporting of the Trusts; |
| • | to consider whether thenon-audit services provided by a Trust’s auditor to an investment adviser or any adviser affiliate that provides ongoing services to a series of the Trusts, which services were notpre-approved by the Committee, are compatible with maintaining the auditor’s independence; |
| • | to review the arrangements for and scope of the annual audit and any special audits; and |
| • | to review and approving the fees proposed to be charged to the Trusts by the auditors for each audit andnon-audit service. |
The Audit and Compliance Committee may delegate any portion of its authority, including the authority to grantpre-approvals of audit and permittednon-audit services, to a subcommittee of one or more members. Any decisions of the subcommittee to grantpre-approvals shall be presented to the full audit committee at its next regularly scheduled meeting.
(e)(2) None of the fees disclosed in paragraphs (b) through (d) above were approved by the audit committee pursuant to paragraph (c)(7)(i)(C) of Rule2-01 of RegulationS-X.
(f) Not applicable.
(g) AggregateNon-Audit Fees for Services Rendered to the:
Registrant | Adviser | Adviser’s Affiliates Providing Ongoing Services to Registrant | Fiscal Year Ended | |||||
| $69,725 | N/A | N/A | 6/30/2018 | |||||
| $117,829 | N/A | N/A | 6/30/2019 | |||||
(h) Not applicable.
| ITEM 5. | AUDIT COMMITTEE OF LISTED REGISTRANTS. |
Not applicable.
| ITEM 6. | SCHEDULE OF INVESTMENTS. |
The schedules of investments for each series of the Trust are included in the shareholder reports presented in Item 1.
| ITEM 7. | DISCLOSURE OF PROXY VOTING POLICIES AND PROCEDURES FORCLOSED-END MANAGEMENT INVESTMENT COMPANIES. |
Not applicable.
| ITEM 8. | PORTFOLIO MANAGERS OFCLOSED-END MANAGEMENT INVESTMENT COMPANIES. |
Not applicable.
| ITEM 9. | PURCHASES OF EQUITY SECURITIES BYCLOSED-END MANAGEMENT INVESTMENT COMPANY AND AFFILIATED PURCHASERS. |
Not applicable.
| ITEM 10. | SUBMISSION OF MATTERS TO A VOTE OF SECURITY HOLDERS. |
The Trust has made no material changes to the procedures by which shareholders may recommend nominees to the Trust’s Board of Trustees since the Trust last disclosed such procedures in Schedule 14A.
| ITEM 11. | CONTROLS AND PROCEDURES. |
(a) Based upon an evaluation within 90 days of the filing date of this report, the principal executive and financial officers concluded that the disclosure controls and procedures of the Trust are effective.
(b) There were no changes in the Trust’s internal control over financial reporting during the second fiscal quarter of the period covered by this report that has materially affected, or is reasonably likely to materially affect, the Trust’s internal control over financial reporting.
| ITEM 12. | EXHIBITS. |
(a)(1) | Filed herewith asEX-99.CODE ETH. | |||
(a)(2) | A separate certification for each principal executive officer and principal financial officer of the Trust as required by Rule30a-2(a) under the Investment Company Act of 1940 is attached hereto asEX-99.CERT. | |||
(a)(3) | Not applicable. | |||
(b) | The certifications required by Rule30a-2(b) under the Investment Company Act of 1940 are attached hereto asEX-99.906CERT. | |||
SIGNATURES
Pursuant to the requirements of the Securities Exchange Act of 1934 and the Investment Company Act of 1940, the registrant has duly caused this report to be signed on its behalf by the undersigned, thereunto duly authorized.
(Registrant): American Beacon Funds
By /s/ Gene L. Needles, Jr. | ||
| Gene L. Needles, Jr. | ||
| President | ||
| American Beacon Funds | ||
| Date: September 5, 2019 | ||
Pursuant to the requirements of the Securities Exchange Act of 1934 and the Investment Company Act of 1940, this report has been signed below by the following persons on behalf of the registrant and in the capacities and on the dates indicated.
By /s/ Gene L. Needles, Jr. | ||
| Gene L. Needles, Jr. | ||
| President | ||
| American Beacon Funds | ||
| Date: September 5, 2019 | ||
By /s/ Melinda G. Heika | ||
| Melinda G. Heika | ||
| Treasurer | ||
| American Beacon Funds | ||
| Date: September 5, 2019 | ||